UNITED STATES
SECURITIES AND EXCHANGE COMMISSION
Washington, D.C. 20549
Form N-CSR
CERTIFIED SHAREHOLDER REPORT OF REGISTERED
MANAGEMENT INVESTMENT COMPANIES
Investment Company Act File Number: 811-04015
Eaton Vance Mutual Funds Trust
(Exact Name of Registrant as Specified in Charter)
Two International Place, Boston, Massachusetts 02110
(Address of Principal Executive Offices)
Deidre E. Walsh
Two International Place, Boston, Massachusetts 02110
(Name and Address of Agent for Services)
(617) 482-8260
(Registrant’s Telephone Number)
October 31
Date of Fiscal Year End
October 31, 2023
Date of Reporting Period
Item 1. Reports to Stockholders
Eaton Vance
Global Macro Absolute Return Fund
Annual Report
October 31, 2023
Commodity Futures Trading Commission Registration. The Commodity Futures Trading Commission (“CFTC”) has adopted regulations that subject registered investment companies and advisers to regulation by the CFTC if a fund invests more than a prescribed level of its assets in certain CFTC-regulated instruments (including futures, certain options and swap agreements) or markets itself as providing investment exposure to such instruments. The adviser is registered with the CFTC as a commodity pool operator with respect to its management of the Fund. As the commodity pool operator of the Fund, the adviser has claimed relief under the Commodity Exchange Act from certain reporting and recordkeeping requirements. The adviser is also registered as a commodity trading advisor.
Fund shares are not insured by the FDIC and are not deposits or other obligations of, or guaranteed by, any depository institution. Shares are subject to investment risks, including possible loss of principal invested.
This report must be preceded or accompanied by a current summary prospectus or prospectus. Before investing, investors should consider carefully the investment objective, risks, and charges and expenses of a mutual fund. This and other important information is contained in the summary prospectus and prospectus, which can be obtained from a financial intermediary. Prospective investors should read the prospectus carefully before investing. For further information, please call 1-800-262-1122.
Annual Report October 31, 2023
Eaton Vance
Global Macro Absolute Return Fund
Eaton Vance
Global Macro Absolute Return Fund
October 31, 2023
Management’s Discussion of Fund Performance†
Economic and Market Conditions
The world’s financial markets posted broad gains for the 12-month period ended October 31, 2023. During the period, inflation moderated in many countries, the U.S. economy outperformed expectations, and credit spreads generally tightened. These and other positive dynamics overshadowed concerns about rising global bond yields and heightened geopolitical tensions, including renewed conflict in the Middle East.
The U.S. Federal Reserve (the Fed) raised short-term interest rates during the period, and the cumulative effects of the monetary tightening cycle that began in March 2022 helped reduce U.S. inflation. As a result, the Fed slowed its pace of interest rate increases and signaled that it was nearing the end of its rate hiking campaign. The U.S. economy was resilient in the higher rate environment, posting solid growth as strength in the labor market supported healthy levels of consumer spending.
Inflation also eased in Europe, where the European Central Bank and Bank of England joined the Fed in slowing interest rate increases. However, European economic growth was sluggish amid elevated energy costs, a downturn in global trade, and higher borrowing costs. The prevalence of adjustable-rate mortgages in the U.K. and Southern Europe was particularly challenging for consumers in these regions. While wage gains helped offset the impact of higher household expenses, the U.K. unemployment rate rose and the eurozone labor market showed signs of softening late in the period.
In emerging markets (EM), China ended its zero-COVID policy early in the period, triggering a rebound in economic activity. However, the recovery quickly lost momentum due to several factors, including a drop in consumer confidence and a desire among developed-market (DM) companies to become less dependent on Chinese manufacturing. China’s economy stabilized in the final months of the period, bolstered by various stimulus measures. Nonetheless, the Chinese government seemed more focused on national security interests than economic growth.
During the period, numerous EM countries, including Mexico and several Southeast Asian nations in particular, benefited from DM companies’ efforts to diversify their supply chains beyond China. In addition, because EM central banks were generally ahead of their DM peers in addressing rising inflation risks, many EM central banks were able to cut interest rates during the period -- moves that supported economic growth and asset prices. For the period as a whole, the U.S. dollar broadly weakened, providing another tailwind for EM assets.
Fund Performance
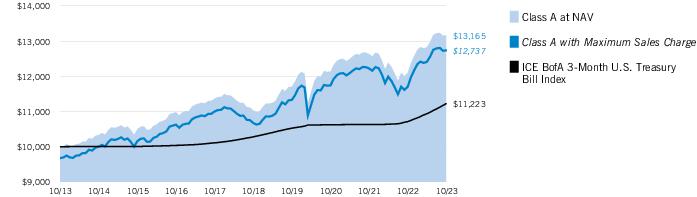
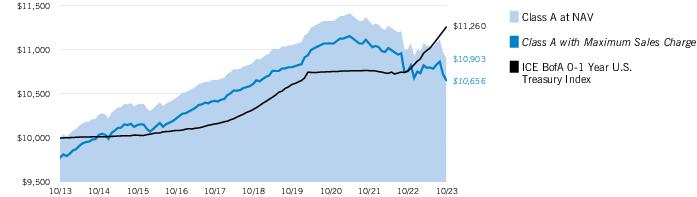
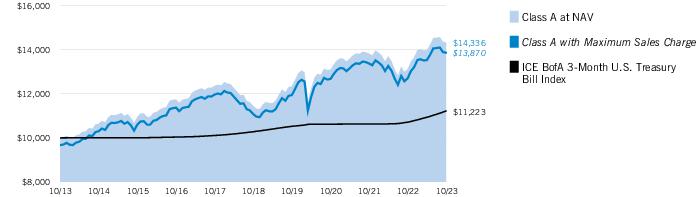
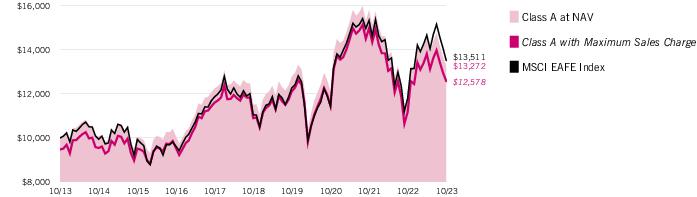
For the 12-month period ended October 31, 2023, Eaton Vance Global Macro Absolute Return Fund (the Fund) returned 8.86% for Class A shares at net asset value (NAV), outperforming its benchmark, the ICE BofA 3-Month U.S. Treasury Bill Index (the Index), which returned 4.77%.
The Fund’s interest rate exposure was the largest contributor to its performance during the period, followed by its currency and sovereign credit exposures. The Fund’s limited allocations to equities and corporate credit also positively impacted returns. Conversely, the Fund’s commodity exposure detracted from performance.
By region, Eastern Europe and Latin America made the largest contributions to returns during the period. In Eastern Europe, the Fund’s long Ukrainian local bond position performed especially well as Western allies provided military aid to the Ukrainian government and liquidity conditions in Ukraine improved. In Latin America, the Fund’s long local bond position in the Dominican Republic was a top contributor to returns, benefiting from solid economic growth and falling inflation in the country.
Investments in Western Europe and the Dollar Bloc -- Canada, New Zealand, and Australia -- also made significant contributions to performance during the period. A long position in Greek equities added significant value in Western Europe, as the Greek stock market surged amid a broad rally in global equities and a market-friendly outcome to the country’s national elections. In the Dollar Bloc, a long position in the Australian dollar versus a short position in the New Zealand dollar was advantageous.
Asia and the Middle East & Africa (MEA) region made solid, yet more modest, contributions to the Fund’s returns, helped by long sovereign credit positions in Sri Lanka and Tanzania alongside the broad tightening in credit spreads during the period. However, gains in Asia and MEA were dampened by other positions that performed poorly, including short sovereign credit positions in Malaysia and South Africa.
The Fund used derivatives extensively to hedge select undesired risk exposures, as well as to gain select desired risk exposures. Some of the notable drivers of performance at the country level involved the use of derivatives. The Fund’s use of derivatives broadly detracted from returns during the period. In particular, currency forwards used to gain long and short exposure to select currencies around the world detracted from returns, as did credit default swaps used to gain long and short exposure to certain sovereign credits, which also acted as hedges to other exposures in certain cases. Additionally, interest rate swaps used to gain select exposures as well as hedge others modestly weighed on Fund performance during the period.
See Endnotes and Additional Disclosures in this report.
Past performance is no guarantee of future results. Returns are historical and are calculated by determining the percentage change in net asset value (NAV) or offering price (as applicable) with all distributions reinvested. Furthermore, returns do not reflect the deduction of taxes that shareholders may have to pay on Fund distributions or upon the redemption of Fund shares. Investment return and principal value will fluctuate so that shares, when redeemed, may be worth more or less than their original cost. Performance for periods less than or equal to one year is cumulative. Performance is for the stated time period only; due to market volatility, current Fund performance may be lower or higher than the quoted return. For performance as of the most recent month-end, please refer to eatonvance.com.
Eaton Vance
Global Macro Absolute Return Fund
October 31, 2023
Performance
Portfolio Manager(s) Patrick Campbell, CFA, Kyle Lee, CFA, Federico Sequeda, CFA each of Eaton Vance Management and Hussein Khattab, CFA of Eaton Vance Advisers International Ltd.
| % Average Annual Total Returns1,2 | Class
Inception Date | Performance
Inception Date | One Year | Five Years | Ten Years |
| Class A at NAV | 06/27/2007 | 10/31/1997 | 8.86% | 3.60% | 2.79% |
| Class A with 3.25% Maximum Sales Charge | — | — | 5.27 | 2.91 | 2.44 |
| Class C at NAV | 10/01/2009 | 10/31/1997 | 8.06 | 2.87 | 2.21 |
| Class C with 1% Maximum Deferred Sales Charge | — | — | 7.06 | 2.87 | 2.21 |
| Class I at NAV | 06/27/2007 | 10/31/1997 | 9.17 | 3.88 | 3.09 |
| Class R at NAV | 04/08/2010 | 10/31/1997 | 8.62 | 3.36 | 2.57 |
| Class R6 at NAV | 05/31/2017 | 10/31/1997 | 9.27 | 3.98 | 3.14 |
|
| ICE BofA 3-Month U.S. Treasury Bill Index | — | — | 4.77% | 1.77% | 1.16% |
| % Total Annual Operating Expense Ratios3 | Class A | Class C | Class I | Class R | Class R6 |
| | 1.09% | 1.84% | 0.84% | 1.33% | 0.77% |
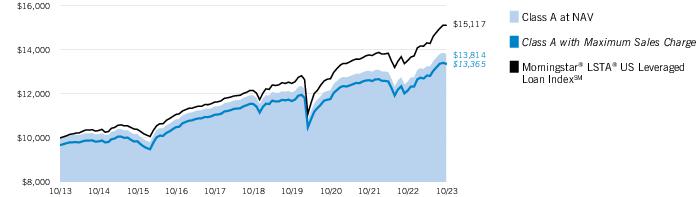
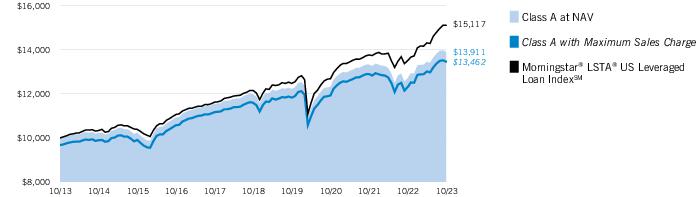
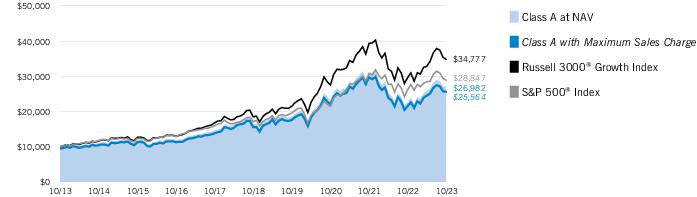
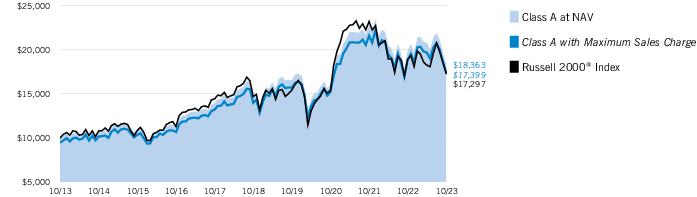
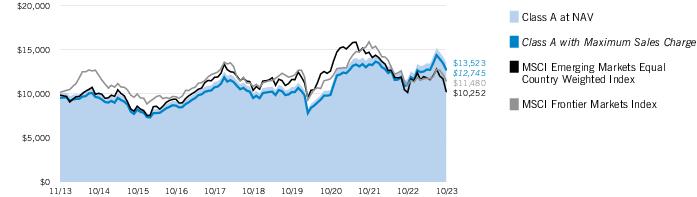
Growth of $10,000
This graph shows the change in value of a hypothetical investment of $10,000 in Class A of the Fund for the period indicated. For comparison, the same investment is shown in the indicated index.
| Growth of Investment2 | Amount Invested | Period Beginning | At NAV | With Maximum Sales Charge |
| Class C | $10,000 | 10/31/2013 | $12,446 | N.A. |
| Class I, at minimum investment | $1,000,000 | 10/31/2013 | $1,356,310 | N.A. |
| Class R | $10,000 | 10/31/2013 | $12,896 | N.A. |
| Class R6, at minimum investment | $5,000,000 | 10/31/2013 | $6,811,219 | N.A. |
See Endnotes and Additional Disclosures in this report.
Past performance is no guarantee of future results. Returns are historical and are calculated by determining the percentage change in net asset value (NAV) or offering price (as applicable) with all distributions reinvested. Furthermore, returns do not reflect the deduction of taxes that shareholders may have to pay on Fund distributions or upon the redemption of Fund shares. Investment return and principal value will fluctuate so that shares, when redeemed, may be worth more or less than their original cost. Performance for periods less than or equal to one year is cumulative. Performance is for the stated time period only; due to market volatility, current Fund performance may be lower or higher than the quoted return. For performance as of the most recent month-end, please refer to eatonvance.com.
Eaton Vance
Global Macro Absolute Return Fund
October 31, 2023
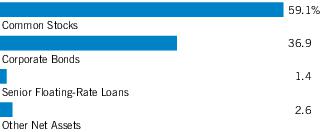
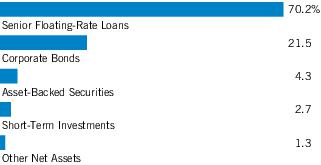
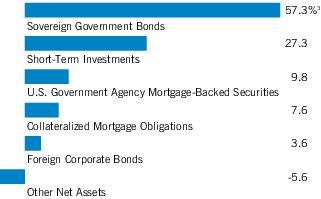
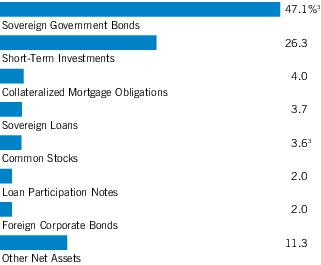
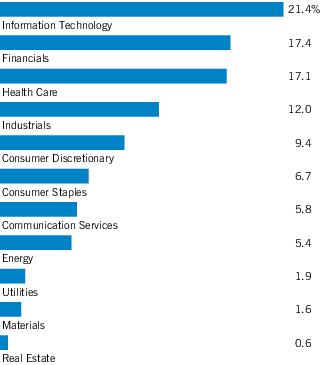
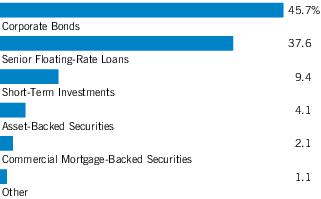
| Asset Allocation (% of net assets)1 |
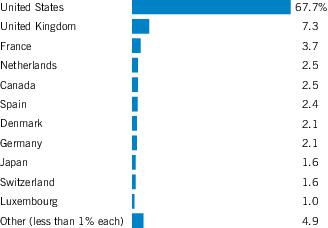
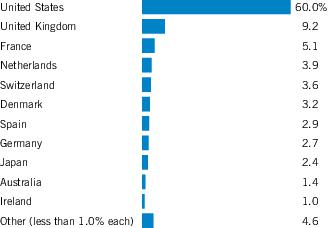
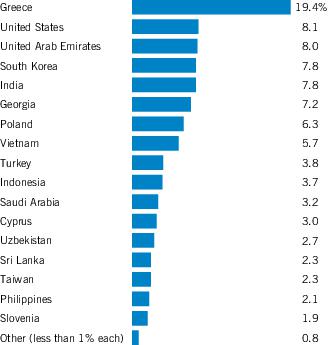
| Foreign Currency Exposures (% of net assets)2 |
| Iceland | 2.6% |
| Dominican Republic | 2.5 |
| Australia | 2.4 |
| Uzbekistan | 2.2 |
| Hungary | 1.9 |
| Serbia | 1.9 |
| Canada | 1.6 |
| India | 1.5 |
| Korea, South | 1.4 |
| Uruguay | 1.2 |
| Armenia | 1.1 |
| Mexico | 1.0 |
| Other | 0.6 4 |
| Saudi Arabia | -1.0 |
| Oman | -1.2 |
| Bahrain | -1.5 |
| Philippines | -2.1 |
| New Zealand | -2.3 |
| China | -3.7 |
| Euro | -6.7 |
| Total Long | 26.2% |
| Total Short | -22.8% |
| Total Net | 3.4% |
Fund invests in an affiliated investment company (Portfolio) with the same objective(s) and policies as the Fund. References to investments are to the Portfolio’s holdings.
Footnotes:
| 1 | Other Net Assets represents other assets less liabilities and includes any investment type that represents less than 1% of net assets. |
2 Currency exposures include all foreign exchange denominated assets, currency derivatives and commodities (including commodity derivatives). Total exposures may exceed 100% due to implicit leverage created by derivatives.
3 Net of securities sold short.
4 Includes amounts each less than 1.0% or –1.0%, as applicable.
Eaton Vance
Global Macro Absolute Return Fund
October 31, 2023
Endnotes and Additional Disclosures
| † | The views expressed in this report are those of the portfolio manager(s) and are current only through the date stated at the top of this page. These views are subject to change at any time based upon market or other conditions, and Eaton Vance and the Fund(s) disclaim any responsibility to update such views. These views may not be relied upon as investment advice and, because investment decisions are based on many factors, may not be relied upon as an indication of trading intent on behalf of any Eaton Vance fund. This commentary may contain statements that are not historical facts, referred to as “forward-looking statements.” The Fund’s actual future results may differ significantly from those stated in any forward-looking statement, depending on factors such as changes in securities or financial markets or general economic conditions, the volume of sales and purchases of Fund shares, the continuation of investment advisory, administrative and service contracts, and other risks discussed from time to time in the Fund’s filings with the Securities and Exchange Commission. |
| | |
| 1 | ICE BofA 3-Month U.S. Treasury Bill Index is an unmanaged index of U.S. Treasury securities maturing in 90 days. ICE® BofA® indices are not for redistribution or other uses; provided “as is”, without warranties, and with no liability. Eaton Vance has prepared this report and ICE Data Indices, LLC does not endorse it, or guarantee, review, or endorse Eaton Vance’s products. BofA® is a licensed registered trademark of Bank of America Corporation in the United States and other countries. Unless otherwise stated, index returns do not reflect the effect of any applicable sales charges, commissions, expenses, taxes or leverage, as applicable. It is not possible to invest directly in an index. |
| 2 | Total Returns at NAV do not include applicable sales charges. If sales charges were deducted, the returns would be lower. Total Returns shown with maximum sales charge reflect the stated maximum sales charge. Unless otherwise stated, performance does not reflect the deduction of taxes on Fund distributions or redemptions of Fund shares.Performance prior to the inception date of a class may be linked to the performance of an older class of the Fund. This linked performance is adjusted for any applicable sales charge, but is not adjusted for class expense differences. If adjusted for such differences, the performance would be different. The performance of Class R6 is linked to Class I. Performance presented in the Financial Highlights included in the financial statements is not linked.Effective November 5, 2020, Class C shares automatically convert to Class A shares eight years after purchase. The average annual total returns listed for Class C reflect conversion to Class A shares after eight years. Prior to November 5, 2020, Class C shares automatically converted to Class A shares ten years after purchase. |
| 3 | Source: Fund prospectus. The expense ratios for the current reporting period can be found in the Financial Highlights section of this report. Performance reflects expenses waived and/or reimbursed, if applicable. Without such waivers and/or reimbursements, performance would have been lower. |
| | Fund profile subject to change due to active management. |
| | Additional Information |
| | A long position is the purchase of an investment with the expectation that it will rise in value. |
| | A short position is the sale of a borrowed investment with the expectation that it will decline in value. |
| | Spread is the difference in yield between a U.S. Treasury bond and another debt security of the same maturity but different credit quality. |
Eaton Vance
Global Macro Absolute Return Fund
October 31, 2023
Example
As a Fund shareholder, you incur two types of costs: (1) transaction costs, including sales charges (loads) on purchases; and (2) ongoing costs, including management fees; distribution and/or service fees; and other Fund expenses. This Example is intended to help you understand your ongoing costs (in dollars) of Fund investing and to compare these costs with the ongoing costs of investing in other mutual funds. The Example is based on an investment of $1,000 invested at the beginning of the period and held for the entire period (May 1, 2023 to October 31, 2023).
Actual Expenses
The first section of the table below provides information about actual account values and actual expenses. You may use the information in this section, together with the amount you invested, to estimate the expenses that you paid over the period. Simply divide your account value by $1,000 (for example, an $8,600 account value divided by $1,000 = 8.6), then multiply the result by the number in the first section under the heading entitled “Expenses Paid During Period” to estimate the expenses you paid on your account during this period.
Hypothetical Example for Comparison Purposes
The second section of the table below provides information about hypothetical account values and hypothetical expenses based on the actual Fund expense ratio and an assumed rate of return of 5% per year (before expenses), which is not the actual Fund return. The hypothetical account values and expenses may not be used to estimate the actual ending account balance or expenses you paid for the period. You may use this information to compare the ongoing costs of investing in your Fund and other funds. To do so, compare this 5% hypothetical example with the 5% hypothetical examples that appear in the shareholder reports of the other funds.
Please note that the expenses shown in the table are meant to highlight your ongoing costs only and do not reflect any transactional costs, such as sales charges (loads). Therefore, the second section of the table is useful in comparing ongoing costs only, and will not help you determine the relative total costs of owning different funds. In addition, if these transactional costs were included, your costs would be higher.
| | Beginning
Account Value
(5/1/23) | Ending
Account Value
(10/31/23) | Expenses Paid
During Period*
(5/1/23 – 10/31/23) | Annualized
Expense
Ratio |
| Actual | | | | |
| Class A | $1,000.00 | $1,026.60 | $ 7.61 | 1.49% |
| Class C | $1,000.00 | $1,021.60 | $11.31 | 2.22% |
| Class I | $1,000.00 | $1,026.70 | $ 6.23 | 1.22% |
| Class R | $1,000.00 | $1,024.10 | $ 8.78 | 1.72% |
| Class R6 | $1,000.00 | $1,028.40 | $ 5.88 | 1.15% |
| |
| Hypothetical | | | | |
| (5% return per year before expenses) | | | | |
| Class A | $1,000.00 | $1,017.69 | $ 7.58 | 1.49% |
| Class C | $1,000.00 | $1,014.01 | $11.27 | 2.22% |
| Class I | $1,000.00 | $1,019.06 | $ 6.21 | 1.22% |
| Class R | $1,000.00 | $1,016.54 | $ 8.74 | 1.72% |
| Class R6 | $1,000.00 | $1,019.41 | $ 5.85 | 1.15% |
| * | Expenses are equal to the Fund's annualized expense ratio for the indicated Class, multiplied by the average account value over the period, multiplied by 184/365 (to reflect the one-half year period). The Example assumes that the $1,000 was invested at the net asset value per share determined at the close of business on April 30, 2023. The Example reflects the expenses of both the Fund and the Portfolio. |
Eaton Vance
Global Macro Absolute Return Fund
October 31, 2023
Statement of Assets and Liabilities
| | October 31, 2023 |
| Assets | |
| Investment in Global Macro Portfolio, at value (identified cost $1,896,357,131) | $ 1,792,136,435 |
| Receivable for Fund shares sold | 11,409,971 |
| Total assets | $1,803,546,406 |
| Liabilities | |
| Payable for Fund shares redeemed | $ 2,873,759 |
| Payable to affiliates: | |
| Distribution and service fees | 50,365 |
| Trustees' fees | 42 |
| Accrued expenses | 478,095 |
| Total liabilities | $ 3,402,261 |
| Net Assets | $1,800,144,145 |
| Sources of Net Assets | |
| Paid-in capital | $ 2,462,941,986 |
| Accumulated loss | (662,797,841) |
| Net Assets | $1,800,144,145 |
| Class A Shares | |
| Net Assets | $ 148,688,732 |
| Shares Outstanding | 18,228,236 |
Net Asset Value and Redemption Price Per Share
(net assets ÷ shares of beneficial interest outstanding) | $ 8.16 |
Maximum Offering Price Per Share
(100 ÷ 96.75 of net asset value per share) | $ 8.43 |
| Class C Shares | |
| Net Assets | $ 21,089,315 |
| Shares Outstanding | 2,574,870 |
Net Asset Value and Offering Price Per Share*
(net assets ÷ shares of beneficial interest outstanding) | $ 8.19 |
| Class I Shares | |
| Net Assets | $ 1,401,232,898 |
| Shares Outstanding | 172,137,853 |
Net Asset Value, Offering Price and Redemption Price Per Share
(net assets ÷ shares of beneficial interest outstanding) | $ 8.14 |
| Class R Shares | |
| Net Assets | $ 1,171,353 |
| Shares Outstanding | 143,334 |
Net Asset Value, Offering Price and Redemption Price Per Share
(net assets ÷ shares of beneficial interest outstanding) | $ 8.17 |
7
See Notes to Financial Statements.
Eaton Vance
Global Macro Absolute Return Fund
October 31, 2023
Statement of Assets and Liabilities — continued
| | October 31, 2023 |
| Class R6 Shares | |
| Net Assets | $227,961,847 |
| Shares Outstanding | 28,024,098 |
Net Asset Value, Offering Price and Redemption Price Per Share
(net assets ÷ shares of beneficial interest outstanding) | $ 8.13 |
| On sales of $100,000 or more, the offering price of Class A shares is reduced. |
| * | Redemption price per share is equal to the net asset value less any applicable contingent deferred sales charge. |
8
See Notes to Financial Statements.
Eaton Vance
Global Macro Absolute Return Fund
October 31, 2023
| | Year Ended |
| | October 31, 2023 |
| Investment Income | |
| Dividend income allocated from Portfolio (net of foreign taxes withheld of $104,156) | $ 10,355,839 |
| Interest and other income allocated from Portfolio (net of foreign taxes withheld of $1,217,757) | 121,389,075 |
| Expenses, excluding interest and dividend expense, allocated from Portfolio | (11,652,370) |
| Interest and dividend expense allocated from Portfolio | (6,652,668) |
| Total investment income from Portfolio | $ 113,439,876 |
| Expenses | |
| Distribution and service fees: | |
| Class A | $ 442,832 |
| Class C | 246,373 |
| Class R | 6,492 |
| Trustees’ fees and expenses | 500 |
| Custodian fee | 63,000 |
| Transfer and dividend disbursing agent fees | 1,435,964 |
| Legal and accounting services | 83,800 |
| Printing and postage | 167,215 |
| Registration fees | 115,836 |
| Miscellaneous | 36,510 |
| Total expenses | $ 2,598,522 |
| Net investment income | $ 110,841,354 |
| Realized and Unrealized Gain (Loss) from Portfolio | |
| Net realized gain (loss): | |
| Investment transactions (net of foreign capital gains taxes of $267,910) | $ (187,450,530) |
| Written options | 920 |
| Securities sold short | (769,825) |
| Futures contracts | 17,099,665 |
| Swap contracts | (12,239,645) |
| Foreign currency transactions | (7,268,536) |
| Forward foreign currency exchange contracts | 3,519,479 |
| Non-deliverable bond forward contracts | 6,414,099 |
| Net realized loss | $(180,694,373) |
| Change in unrealized appreciation (depreciation): | |
| Investments (including net increase in accrued foreign capital gains taxes of $3,047) | $ 285,303,491 |
| Written options | 58,487 |
| Securities sold short | 2,271,798 |
| Futures contracts | (19,741,273) |
| Swap contracts | (18,489,493) |
| Foreign currency | 2,248,951 |
| Forward foreign currency exchange contracts | (20,545,732) |
| Non-deliverable bond forward contracts | (972,046) |
| Net change in unrealized appreciation (depreciation) | $ 230,134,183 |
| Net realized and unrealized gain | $ 49,439,810 |
| Net increase in net assets from operations | $ 160,281,164 |
9
See Notes to Financial Statements.
Eaton Vance
Global Macro Absolute Return Fund
October 31, 2023
Statements of Changes in Net Assets
| | Year Ended October 31, |
| | 2023 | 2022 |
| Increase (Decrease) in Net Assets | | |
| From operations: | | |
| Net investment income | $ 110,841,354 | $ 115,574,082 |
| Net realized gain (loss) | (180,694,373) | 110,827,016 |
| Net change in unrealized appreciation (depreciation) | 230,134,183 | (319,960,670) |
| Net increase (decrease) in net assets from operations | $ 160,281,164 | $ (93,559,572) |
| Distributions to shareholders: | | |
| Class A | $ (7,161,278) | $ (8,063,152) |
| Class C | (976,813) | (1,034,667) |
| Class I | (67,278,432) | (66,924,119) |
| Class R | (58,071) | (49,057) |
| Class R6 | (11,553,886) | (13,033,990) |
| Total distributions to shareholders | $ (87,028,480) | $ (89,104,985) |
| Tax return of capital to shareholders: | | |
| Class A | $ (1,392,886) | $ (1,174,555) |
| Class C | (187,468) | (156,590) |
| Class I | (13,198,515) | (10,455,314) |
| Class R | (11,216) | (7,965) |
| Class R6 | (2,239,903) | (1,997,959) |
| Total tax return of capital to shareholders | $ (17,029,988) | $ (13,792,383) |
| Transactions in shares of beneficial interest: | | |
| Class A | $ (19,774,332) | $ (95,399,484) |
| Class C | (6,429,832) | (7,095,253) |
| Class I | (54,773,375) | (290,445,028) |
| Class R | (134,355) | 114,208 |
| Class R6 | (31,965,995) | (96,685,321) |
| Net decrease in net assets from Fund share transactions | $ (113,077,889) | $ (489,510,878) |
| Net decrease in net assets | $ (56,855,193) | $ (685,967,818) |
| Net Assets | | |
| At beginning of year | $ 1,856,999,338 | $ 2,542,967,156 |
| At end of year | $1,800,144,145 | $1,856,999,338 |
10
See Notes to Financial Statements.
Eaton Vance
Global Macro Absolute Return Fund
October 31, 2023
| | Class A |
| | Year Ended October 31, |
| | 2023 | 2022 | 2021 | 2020 | 2019 |
| Net asset value — Beginning of year | $ 7.910 | $ 8.660 | $ 8.640 | $ 8.740 | $ 8.590 |
| Income (Loss) From Operations | | | | | |
| Net investment income(1) | $ 0.483 | $ 0.418 | $ 0.368 | $ 0.356 | $ 0.438 |
| Net realized and unrealized gain (loss) | 0.220 | (0.792) | (0.016) | (0.046) | 0.078 |
| Total income (loss) from operations | $ 0.703 | $ (0.374) | $ 0.352 | $ 0.310 | $ 0.516 |
| Less Distributions | | | | | |
| From net investment income | $ (0.378) | $ (0.325) | $ (0.332) | $ (0.410) | $ (0.366) |
| Tax return of capital | (0.075) | (0.051) | — | — | — |
| Total distributions | $ (0.453) | $ (0.376) | $ (0.332) | $ (0.410) | $ (0.366) |
| Net asset value — End of year | $ 8.160 | $ 7.910 | $ 8.660 | $ 8.640 | $ 8.740 |
| Total Return(2) | 8.86% | (4.27)% | 4.11% | 3.63% | 6.14% |
| Ratios/Supplemental Data | | | | | |
| Net assets, end of year (000’s omitted) | $148,689 | $163,369 | $276,486 | $398,174 | $366,740 |
| Ratios (as a percentage of average daily net assets):(3) | | | | | |
| Expenses (4) | 1.41% (5) | 1.14% (5) | 1.10% | 1.05% | 1.04% |
| Net investment income | 5.88% | 5.03% | 4.20% | 4.11% | 5.06% |
| Portfolio Turnover of the Portfolio | 96% | 81% | 88% | 81% | 61% |
| (1) | Computed using average shares outstanding. |
| (2) | Returns are historical and are calculated by determining the percentage change in net asset value with all distributions reinvested and do not reflect the effect of sales charges. |
| (3) | Includes the Fund’s share of the Portfolio's allocated expenses. |
| (4) | Includes interest and/or dividend expense, including on securities sold short and/or reverse repurchase agreements if applicable, of 0.37%, 0.08%, 0.06%, 0.01% and 0.01% of average daily net assets for the years ended October 31, 2023, 2022, 2021, 2020 and 2019, respectively. |
| (5) | Includes a reduction by the investment adviser of a portion of the Portfolio’s adviser fee due to the Portfolio’s investment in the Liquidity Fund (equal to 0.01% and less than 0.01% of average daily net assets for the years ended October 31, 2023 and 2022, respectively). |
11
See Notes to Financial Statements.
Eaton Vance
Global Macro Absolute Return Fund
October 31, 2023
Financial Highlights — continued
| | Class C |
| | Year Ended October 31, |
| | 2023 | 2022 | 2021 | 2020 | 2019 |
| Net asset value — Beginning of year | $ 7.950 | $ 8.690 | $ 8.680 | $ 8.770 | $ 8.620 |
| Income (Loss) From Operations | | | | | |
| Net investment income(1) | $ 0.427 | $ 0.365 | $ 0.307 | $ 0.305 | $ 0.374 |
| Net realized and unrealized gain (loss) | 0.208 | (0.786) | (0.026) | (0.044) | 0.082 |
| Total income (loss) from operations | $ 0.635 | $ (0.421) | $ 0.281 | $ 0.261 | $ 0.456 |
| Less Distributions | | | | | |
| From net investment income | $ (0.330) | $ (0.276) | $ (0.271) | $ (0.351) | $ (0.306) |
| Tax return of capital | (0.065) | (0.043) | — | — | — |
| Total distributions | $ (0.395) | $ (0.319) | $ (0.271) | $ (0.351) | $ (0.306) |
| Net asset value — End of year | $ 8.190 | $ 7.950 | $ 8.690 | $ 8.680 | $ 8.770 |
| Total Return(2) | 8.06% | (4.91)% | 3.37% | 2.91% | 5.39% |
| Ratios/Supplemental Data | | | | | |
| Net assets, end of year (000’s omitted) | $21,089 | $26,640 | $36,557 | $54,464 | $106,291 |
| Ratios (as a percentage of average daily net assets):(3) | | | | | |
| Expenses (4) | 2.12% (5) | 1.84% (5) | 1.80% | 1.75% | 1.76% |
| Net investment income | 5.18% | 4.38% | 3.49% | 3.51% | 4.31% |
| Portfolio Turnover of the Portfolio | 96% | 81% | 88% | 81% | 61% |
| (1) | Computed using average shares outstanding. |
| (2) | Returns are historical and are calculated by determining the percentage change in net asset value with all distributions reinvested and do not reflect the effect of sales charges. |
| (3) | Includes the Fund’s share of the Portfolio's allocated expenses. |
| (4) | Includes interest and/or dividend expense, including on securities sold short and/or reverse repurchase agreements if applicable, of 0.37%, 0.08%, 0.06%, 0.01% and 0.01% of average daily net assets for the years ended October 31, 2023, 2022, 2021, 2020 and 2019, respectively. |
| (5) | Includes a reduction by the investment adviser of a portion of the Portfolio’s adviser fee due to the Portfolio’s investment in the Liquidity Fund (equal to 0.01% and less than 0.01% of average daily net assets for the years ended October 31, 2023 and 2022, respectively). |
12
See Notes to Financial Statements.
Eaton Vance
Global Macro Absolute Return Fund
October 31, 2023
Financial Highlights — continued
| | Class I |
| | Year Ended October 31, |
| | 2023 | 2022 | 2021 | 2020 | 2019 |
| Net asset value — Beginning of year | $ 7.900 | $ 8.640 | $ 8.630 | $ 8.720 | $ 8.580 |
| Income (Loss) From Operations | | | | | |
| Net investment income(1) | $ 0.504 | $ 0.446 | $ 0.393 | $ 0.385 | $ 0.458 |
| Net realized and unrealized gain (loss) | 0.211 | (0.786) | (0.024) | (0.039) | 0.074 |
| Total income (loss) from operations | $ 0.715 | $ (0.340) | $ 0.369 | $ 0.346 | $ 0.532 |
| Less Distributions | | | | | |
| From net investment income | $ (0.397) | $ (0.345) | $ (0.359) | $ (0.436) | $ (0.392) |
| Tax return of capital | (0.078) | (0.055) | — | — | — |
| Total distributions | $ (0.475) | $ (0.400) | $ (0.359) | $ (0.436) | $ (0.392) |
| Net asset value — End of year | $ 8.140 | $ 7.900 | $ 8.640 | $ 8.630 | $ 8.720 |
| Total Return(2) | 9.17% | (4.00)% | 4.31% | 4.07% | 6.34% |
| Ratios/Supplemental Data | | | | | |
| Net assets, end of year (000’s omitted) | $1,401,233 | $1,413,454 | $1,851,665 | $2,323,831 | $2,859,484 |
| Ratios (as a percentage of average daily net assets):(3) | | | | | |
| Expenses (4) | 1.13% (5) | 0.84% (5) | 0.80% | 0.75% | 0.75% |
| Net investment income | 6.14% | 5.39% | 4.50% | 4.45% | 5.31% |
| Portfolio Turnover of the Portfolio | 96% | 81% | 88% | 81% | 61% |
| (1) | Computed using average shares outstanding. |
| (2) | Returns are historical and are calculated by determining the percentage change in net asset value with all distributions reinvested. |
| (3) | Includes the Fund’s share of the Portfolio's allocated expenses. |
| (4) | Includes interest and/or dividend expense, including on securities sold short and/or reverse repurchase agreements if applicable, of 0.37%, 0.08%, 0.06%, 0.01% and 0.01% of average daily net assets for the years ended October 31, 2023, 2022, 2021, 2020 and 2019, respectively. |
| (5) | Includes a reduction by the investment adviser of a portion of the Portfolio’s adviser fee due to the Portfolio’s investment in the Liquidity Fund (equal to 0.01% and less than 0.01% of average daily net assets for the years ended October 31, 2023 and 2022, respectively). |
13
See Notes to Financial Statements.
Eaton Vance
Global Macro Absolute Return Fund
October 31, 2023
Financial Highlights — continued
| | Class R |
| | Year Ended October 31, |
| | 2023 | 2022 | 2021 | 2020 | 2019 |
| Net asset value — Beginning of year | $ 7.930 | $ 8.670 | $ 8.660 | $ 8.750 | $ 8.610 |
| Income (Loss) From Operations | | | | | |
| Net investment income(1) | $ 0.465 | $ 0.410 | $ 0.352 | $ 0.338 | $ 0.417 |
| Net realized and unrealized gain (loss) | 0.211 | (0.790) | (0.027) | (0.034) | 0.073 |
| Total income (loss) from operations | $ 0.676 | $(0.380) | $ 0.325 | $ 0.304 | $ 0.490 |
| Less Distributions | | | | | |
| From net investment income | $ (0.364) | $ (0.311) | $ (0.315) | $ (0.394) | $ (0.350) |
| Tax return of capital | (0.072) | (0.049) | — | — | — |
| Total distributions | $(0.436) | $(0.360) | $(0.315) | $(0.394) | $(0.350) |
| Net asset value — End of year | $ 8.170 | $ 7.930 | $ 8.670 | $ 8.660 | $ 8.750 |
| Total Return(2) | 8.62% | (4.45)% | 3.78% | 3.55% | 5.80% |
| Ratios/Supplemental Data | | | | | |
| Net assets, end of year (000’s omitted) | $ 1,171 | $ 1,267 | $ 1,274 | $ 968 | $ 861 |
| Ratios (as a percentage of average daily net assets):(3) | | | | | |
| Expenses (4) | 1.63% (5) | 1.33% (5) | 1.29% | 1.25% | 1.26% |
| Net investment income | 5.65% | 4.95% | 4.02% | 3.89% | 4.82% |
| Portfolio Turnover of the Portfolio | 96% | 81% | 88% | 81% | 61% |
| (1) | Computed using average shares outstanding. |
| (2) | Returns are historical and are calculated by determining the percentage change in net asset value with all distributions reinvested. |
| (3) | Includes the Fund’s share of the Portfolio's allocated expenses. |
| (4) | Includes interest and/or dividend expense, including on securities sold short and/or reverse repurchase agreements if applicable, of 0.37%, 0.08%, 0.06%, 0.01% and 0.01% of average daily net assets for the years ended October 31, 2023, 2022, 2021, 2020 and 2019, respectively. |
| (5) | Includes a reduction by the investment adviser of a portion of the Portfolio’s adviser fee due to the Portfolio’s investment in the Liquidity Fund (equal to 0.01% and less than 0.01% of average daily net assets for the years ended October 31, 2023 and 2022, respectively). |
14
See Notes to Financial Statements.
Eaton Vance
Global Macro Absolute Return Fund
October 31, 2023
Financial Highlights — continued
| | Class R6 |
| | Year Ended October 31, |
| | 2023 | 2022 | 2021 | 2020 | 2019 |
| Net asset value — Beginning of year | $ 7.890 | $ 8.630 | $ 8.620 | $ 8.710 | $ 8.570 |
| Income (Loss) From Operations | | | | | |
| Net investment income(1) | $ 0.510 | $ 0.450 | $ 0.398 | $ 0.391 | $ 0.464 |
| Net realized and unrealized gain (loss) | 0.212 | (0.783) | (0.024) | (0.040) | 0.073 |
| Total income (loss) from operations | $ 0.722 | $ (0.333) | $ 0.374 | $ 0.351 | $ 0.537 |
| Less Distributions | | | | | |
| From net investment income | $ (0.403) | $ (0.351) | $ (0.364) | $ (0.441) | $ (0.397) |
| Tax return of capital | (0.079) | (0.056) | — | — | — |
| Total distributions | $ (0.482) | $ (0.407) | $ (0.364) | $ (0.441) | $ (0.397) |
| Net asset value — End of year | $ 8.130 | $ 7.890 | $ 8.630 | $ 8.620 | $ 8.710 |
| Total Return(2) | 9.27% | (3.80)% | 4.37% | 4.01% | 6.53% |
| Ratios/Supplemental Data | | | | | |
| Net assets, end of year (000’s omitted) | $227,962 | $252,269 | $376,984 | $390,210 | $224,436 |
| Ratios (as a percentage of average daily net assets):(3) | | | | | |
| Expenses (4) | 1.05% (5) | 0.77% (5) | 0.73% | 0.68% | 0.69% |
| Net investment income | 6.23% | 5.44% | 4.56% | 4.51% | 5.37% |
| Portfolio Turnover of the Portfolio | 96% | 81% | 88% | 81% | 61% |
| (1) | Computed using average shares outstanding. |
| (2) | Returns are historical and are calculated by determining the percentage change in net asset value with all distributions reinvested. |
| (3) | Includes the Fund’s share of the Portfolio's allocated expenses. |
| (4) | Includes interest and/or dividend expense, including on securities sold short and/or reverse repurchase agreements if applicable, of 0.37%, 0.08%, 0.06%, 0.01% and 0.01% of average daily net assets for the years ended October 31, 2023, 2022, 2021, 2020 and 2019, respectively. |
| (5) | Includes a reduction by the investment adviser of a portion of the Portfolio’s adviser fee due to the Portfolio’s investment in the Liquidity Fund (equal to 0.01% and less than 0.01% of average daily net assets for the years ended October 31, 2023 and 2022, respectively). |
15
See Notes to Financial Statements.
Eaton Vance
Global Macro Absolute Return Fund
October 31, 2023
Notes to Financial Statements
1 Significant Accounting Policies
Eaton Vance Global Macro Absolute Return Fund (the Fund) is a non-diversified series of Eaton Vance Mutual Funds Trust (the Trust). The Trust is a Massachusetts business trust registered under the Investment Company Act of 1940, as amended (the 1940 Act), as an open-end management investment company. The Fund offers five classes of shares. Class A shares are generally sold subject to a sales charge imposed at time of purchase. Class C shares are sold at net asset value and are generally subject to a contingent deferred sales charge (see Note 5). Effective November 5, 2020, Class C shares automatically convert to Class A shares eight years after their purchase as described in the Fund’s prospectus. Class I, Class R and Class R6 shares are sold at net asset value and are not subject to a sales charge. Each class represents a pro rata interest in the Fund, but votes separately on class-specific matters and (as noted below) is subject to different expenses. Realized and unrealized gains and losses and net investment income and losses, other than class-specific expenses, are allocated daily to each class of shares based on the relative net assets of each class to the total net assets of the Fund. Sub-accounting, recordkeeping and similar administrative fees payable to financial intermediaries, which are a component of transfer and dividend disbursing agent fees on the Statement of Operations, are not allocated to Class R6 shares. Each class of shares differs in its distribution plan and certain other class-specific expenses. The Fund invests its assets in interests in Global Macro Portfolio (the Portfolio), a Massachusetts business trust, having the same investment objective and policies as the Fund. The value of the Fund’s investment in the Portfolio reflects the Fund’s proportionate interest in the net assets of the Portfolio (approximately 100% at October 31, 2023). The performance of the Fund is directly affected by the performance of the Portfolio. The consolidated financial statements of the Portfolio, including the consolidated portfolio of investments, are included elsewhere in this report and should be read in conjunction with the Fund’s financial statements.
The following is a summary of significant accounting policies of the Fund. The policies are in conformity with accounting principles generally accepted in the United States of America (U.S. GAAP). The Fund is an investment company and follows accounting and reporting guidance in the Financial Accounting Standards Board (FASB) Accounting Standards Codification Topic 946.
A Investment Valuation—Valuation of securities by the Portfolio is discussed in Note 1A of the Portfolio's Notes to Consolidated Financial Statements, which are included elsewhere in this report.
B Income—The Fund's net investment income or loss consists of the Fund's pro rata share of the net investment income or loss of the Portfolio, less all actual and accrued expenses of the Fund.
C Federal and Other Taxes—The Fund’s policy is to comply with the provisions of the Internal Revenue Code applicable to regulated investment companies and to distribute to shareholders each year substantially all of its net investment income, and all or substantially all of its net realized capital gains. Accordingly, no provision for federal income or excise tax is necessary.
In addition to the requirements of the Internal Revenue Code, the Fund may also be required to recognize its pro rata share of the capital gains taxes incurred by the Portfolio. In doing so, the daily net asset value would reflect the Fund’s pro rata share of the estimated reserve for such taxes incurred by the Portfolio.
As of October 31, 2023, the Fund had no uncertain tax positions that would require financial statement recognition, de-recognition, or disclosure. The Fund files a U.S. federal income tax return annually after its fiscal year-end, which is subject to examination by the Internal Revenue Service for a period of three years from the date of filing.
D Expenses—The majority of expenses of the Trust are directly identifiable to an individual fund. Expenses which are not readily identifiable to a specific fund are allocated taking into consideration, among other things, the nature and type of expense and the relative size of the funds.
E Use of Estimates—The preparation of the financial statements in conformity with U.S. GAAP requires management to make estimates and assumptions that affect the reported amounts of assets and liabilities at the date of the financial statements and the reported amounts of income and expense during the reporting period. Actual results could differ from those estimates.
F Indemnifications—Under the Trust’s organizational documents, its officers and Trustees may be indemnified against certain liabilities and expenses arising out of the performance of their duties to the Fund. Under Massachusetts law, if certain conditions prevail, shareholders of a Massachusetts business trust (such as the Trust) could be deemed to have personal liability for the obligations of the Trust. However, the Trust’s Declaration of Trust contains an express disclaimer of liability on the part of Fund shareholders and the By-laws provide that the Trust shall assume, upon request by the shareholder, the defense on behalf of any Fund shareholders. Moreover, the By-laws also provide for indemnification out of Fund property of any shareholder held personally liable solely by reason of being or having been a shareholder for all loss or expense arising from such liability. Additionally, in the normal course of business, the Fund enters into agreements with service providers that may contain indemnification clauses. The Fund's maximum exposure under these arrangements is unknown as this would involve future claims that may be made against the Fund that have not yet occurred.
G Other—Investment transactions are accounted for on a trade date basis.
Eaton Vance
Global Macro Absolute Return Fund
October 31, 2023
Notes to Financial Statements — continued
2 Distributions to Shareholders and Income Tax Information
The Fund expects to pay any required income distributions monthly and intends to distribute annually all or substantially all of its net realized capital gains. The Fund may include in its distributions amounts attributable to the imputed interest on foreign currency exposures and certain other derivative positions which, in certain circumstances, may result in a return of capital for federal income tax purposes. Distributions to shareholders are recorded on the ex-dividend date. Distributions are declared separately for each class of shares. Shareholders may reinvest income and capital gain distributions in additional shares of the same class of the Fund at the net asset value as of the ex-dividend date or, at the election of the shareholder, receive distributions in cash. Distributions to shareholders are determined in accordance with income tax regulations, which may differ from U.S. GAAP. As required by U.S. GAAP, only distributions in excess of tax basis earnings and profits are reported in the financial statements as a return of capital. Permanent differences between book and tax accounting relating to distributions are reclassified to paid-in capital. For tax purposes, distributions from short-term capital gains are considered to be from ordinary income.
The tax character of distributions declared for the years ended October 31, 2023 and October 31, 2022 was as follows:
| | Year Ended October 31, |
| | 2023 | 2022 |
| Ordinary income | $87,028,480 | $89,104,985 |
| Tax return of capital | $17,029,988 | $13,792,383 |
As of October 31, 2023, the components of distributable earnings (accumulated loss) on a tax basis were as follows:
| Deferred capital losses | $ (401,170,448) |
| Net unrealized depreciation | (261,627,393) |
| Accumulated loss | $(662,797,841) |
At October 31, 2023, the Fund, for federal income tax purposes, had deferred capital losses of $401,170,448 which would reduce its taxable income arising from future net realized gains on investment transactions, if any, to the extent permitted by the Internal Revenue Code, and thus would reduce the amount of distributions to shareholders, which would otherwise be necessary to relieve the Fund of any liability for federal income or excise tax. The deferred capital losses are treated as arising on the first day of the Fund’s next taxable year and retain the same short-term or long-term character as when originally deferred. Of the deferred capital losses at October 31, 2023, $27,231,590 are short-term and $373,938,858 are long-term.
3 Investment Adviser Fee and Other Transactions with Affiliates
The investment adviser fee is earned by Eaton Vance Management (EVM), an indirect, wholly-owned subsidiary of Morgan Stanley, as compensation for investment advisory services rendered to the Fund. The investment adviser fee is computed at an annual rate as a percentage of the Fund’s average daily net assets that are not invested in other investment companies for which EVM or its affiliates serve as investment adviser or administrator as follows and is payable monthly:
| Average Daily Net Assets | Annual Fee Rate |
| Up to $500 million | 0.615% |
| $500 million but less than $1 billion | 0.595% |
| $1 billion but less than $1.5 billion | 0.575% |
| $1.5 billion but less than $2 billion | 0.555% |
| $2 billion but less than $3 billion | 0.520% |
| $3 billion but less than $5 billion | 0.490% |
| $5 billion but less than $10 billion | 0.475% |
| $10 billion and over | 0.465% |
For the year ended October 31, 2023, the Fund incurred no investment adviser fee on such assets. Pursuant to an investment sub-advisory agreement, EVM has delegated a portion of the investment management of the Fund to Eaton Vance Advisers International Ltd. (EVAIL), an affiliate of EVM and an indirect, wholly-owned subsidiary of Morgan Stanley. EVM pays EVAIL a portion of its investment adviser fee for sub-advisory services provided to the
Eaton Vance
Global Macro Absolute Return Fund
October 31, 2023
Notes to Financial Statements — continued
Fund. To the extent the Fund’s assets are invested in the Portfolio, the Fund is allocated its share of the Portfolio’s investment adviser fee. The Portfolio has engaged Boston Management and Research (BMR) to render investment advisory services. See Note 2 of the Portfolio’s Notes to Consolidated Financial Statements which are included elsewhere in this report. EVM also serves as the administrator of the Fund, but receives no compensation.
EVM provides sub-transfer agency and related services to the Fund pursuant to a Sub-Transfer Agency Support Services Agreement. For the year ended October 31, 2023, EVM earned $78,275 from the Fund pursuant to such agreement, which is included in transfer and dividend disbursing agent fees on the Statement of Operations. The Fund was informed that Eaton Vance Distributors, Inc. (EVD), an affiliate of EVM and the Fund's principal underwriter, received $1,396 as its portion of the sales charge on sales of Class A shares for the year ended October 31, 2023. The Fund was informed that Morgan Stanley affiliated broker-dealers, which may be deemed to be affiliates of EVM, BMR and EVD, also received a portion of the sales charge on sales of Class A shares for the year ended October 31, 2023 in the amount of $762. EVD also received distribution and service fees from Class A, Class C and Class R shares (see Note 4) and contingent deferred sales charges (see Note 5).
Trustees and officers of the Fund who are members of EVM’s or BMR's organizations receive remuneration for their services to the Fund out of the investment adviser fee. Certain officers and Trustees of the Fund and the Portfolio are officers of the above organizations.
4 Distribution Plans
The Fund has in effect a distribution plan for Class A shares (Class A Plan) pursuant to Rule 12b-1 under the 1940 Act. Pursuant to the Class A Plan, the Fund pays EVD a distribution and service fee of 0.25% (0.30% prior to July 1, 2023) per annum of its average daily net assets attributable to Class A shares for distribution services and facilities provided to the Fund by EVD, as well as for personal services and/or the maintenance of shareholder accounts. Distribution and service fees paid or accrued to EVD for the year ended October 31, 2023 amounted to $442,832 for Class A shares.
The Fund also has in effect distribution plans for Class C shares (Class C Plan) and Class R shares (Class R Plan) pursuant to Rule 12b-1 under the 1940 Act. Pursuant to the Class C Plan, the Fund pays EVD amounts equal to 0.75% per annum of its average daily net assets attributable to Class C shares for providing ongoing distribution services and facilities to the Fund. For the year ended October 31, 2023, the Fund paid or accrued to EVD $184,780 for Class C shares. The Class R Plan requires the Fund to pay EVD an amount up to 0.50% per annum of its average daily net assets attributable to Class R shares for providing ongoing distribution services and facilities to the Fund. The Trustees of the Trust have currently limited Class R distribution payments to 0.25% per annum of the average daily net assets attributable to Class R shares. For the year ended October 31, 2023, the Fund paid or accrued to EVD $3,246 for Class R shares.
Pursuant to the Class C and Class R Plans, the Fund also makes payments of service fees to EVD, financial intermediaries and other persons in amounts equal to 0.25% per annum of its average daily net assets attributable to that class. Service fees paid or accrued are for personal services and/or the maintenance of shareholder accounts. They are separate and distinct from the sales commissions and distribution fees payable to EVD. Service fees paid or accrued for the year ended October 31, 2023 amounted to $61,593 and $3,246 for Class C and Class R shares, respectively.
Distribution and service fees are subject to the limitations contained in the Financial Industry Regulatory Authority Rule 2341(d).
5 Contingent Deferred Sales Charges
A contingent deferred sales charge (CDSC) of 1% generally is imposed on redemptions of Class C shares made within 12 months of purchase. Class A shares may be subject to a 0.75% CDSC if redeemed within 12 months of purchase (depending on the circumstances of purchase). Generally, the CDSC is based upon the lower of the net asset value at date of redemption or date of purchase. No charge is levied on shares acquired by reinvestment of dividends or capital gain distributions. For the year ended October 31, 2023, the Fund was informed that EVD received $1,782 of CDSCs paid by Class C shareholders and no CDSCs paid by Class A shareholders.
6 Investment Transactions
For the year ended October 31, 2023, increases and decreases in the Fund's investment in the Portfolio aggregated $98,428,362 and $324,965,141, respectively.
Eaton Vance
Global Macro Absolute Return Fund
October 31, 2023
Notes to Financial Statements — continued
7 Shares of Beneficial Interest
The Fund’s Declaration of Trust permits the Trustees to issue an unlimited number of full and fractional shares of beneficial interest (without par value). Such shares may be issued in a number of different series (such as the Fund) and classes. Transactions in Fund shares, including direct exchanges
pursuant to share class conversions, were as follows:
| | Year Ended
October 31, 2023 | | Year Ended
October 31, 2022 |
| | Shares | Amount | | Shares | Amount |
| Class A | | | | | |
| Sales | 2,582,682 | $ 21,176,228 | | 4,592,167 | $ 38,339,067 |
| Issued to shareholders electing to receive payments of distributions in Fund shares | 961,393 | 7,894,152 | | 1,048,566 | 8,652,844 |
| Redemptions | (5,962,136) | (48,844,712) | | (16,937,765) | (142,391,395) |
| Net decrease | (2,418,061) | $ (19,774,332) | | (11,297,032) | $ (95,399,484) |
| Class C | | | | | |
| Sales | 251,217 | $ 2,070,905 | | 332,112 | $ 2,778,239 |
| Issued to shareholders electing to receive payments of distributions in Fund shares | 137,435 | 1,132,928 | | 142,074 | 1,173,583 |
| Redemptions | (1,166,680) | (9,633,665) | | (1,328,038) | (11,047,075) |
| Net decrease | (778,028) | $ (6,429,832) | | (853,852) | $ (7,095,253) |
| Class I | | | | | |
| Sales | 56,538,440 | $ 462,831,949 | | 71,497,227 | $ 591,643,634 |
| Issued to shareholders electing to receive payments of distributions in Fund shares | 8,312,329 | 68,104,954 | | 8,239,895 | 67,606,194 |
| Redemptions | (71,703,485) | (585,710,278) | | (115,115,585) | (949,694,856) |
| Net decrease | (6,852,716) | $ (54,773,375) | | (35,378,463) | $(290,445,028) |
| Class R | | | | | |
| Sales | 55,567 | $ 454,739 | | 45,748 | $ 382,213 |
| Issued to shareholders electing to receive payments of distributions in Fund shares | 8,421 | 69,287 | | 6,942 | 57,022 |
| Redemptions | (80,439) | (658,381) | | (39,849) | (325,027) |
| Net increase (decrease) | (16,451) | $ (134,355) | | 12,841 | $ 114,208 |
| Class R6 | | | | | |
| Sales | 4,150,302 | $ 34,107,676 | | 3,247,581 | $ 27,190,898 |
| Issued to shareholders electing to receive payments of distributions in Fund shares | 297,034 | 2,432,730 | | 295,011 | 2,422,349 |
| Redemptions | (8,387,320) | (68,506,401) | | (15,238,556) | (126,298,568) |
| Net decrease | (3,939,984) | $ (31,965,995) | | (11,695,964) | $ (96,685,321) |
Eaton Vance
Global Macro Absolute Return Fund
October 31, 2023
Report of Independent Registered Public Accounting Firm
To the Trustees of Eaton Vance Mutual Funds Trust and Shareholders of Eaton Vance Global Macro Absolute Return Fund:
Opinion on the Financial Statements and Financial Highlights
We have audited the accompanying statement of assets and liabilities of Eaton Vance Global Macro Absolute Return Fund (the “Fund") (one of the funds constituting Eaton Vance Mutual Funds Trust), as of October 31, 2023, the related statement of operations for the year then ended, the statements of changes in net assets for each of the two years in the period then ended, the financial highlights for each of the five years in the period then ended, and the related notes. In our opinion, the financial statements and financial highlights present fairly, in all material respects, the financial position of the Fund as of October 31, 2023, and the results of its operations for the year then ended, the changes in its net assets for each of the two years in the period then ended, and the financial highlights for each of the five years in the period then ended, in conformity with accounting principles generally accepted in the United States of America.
Basis for Opinion
These financial statements and financial highlights are the responsibility of the Fund's management. Our responsibility is to express an opinion on the Fund's financial statements and financial highlights based on our audits. We are a public accounting firm registered with the Public Company Accounting Oversight Board (United States) (PCAOB) and are required to be independent with respect to the Fund in accordance with the U.S. federal securities laws and the applicable rules and regulations of the Securities and Exchange Commission and the PCAOB.
We conducted our audits in accordance with the standards of the PCAOB. Those standards require that we plan and perform the audit to obtain reasonable assurance about whether the financial statements and financial highlights are free of material misstatement, whether due to error or fraud. The Fund is not required to have, nor were we engaged to perform, an audit of its internal control over financial reporting. As part of our audits, we are required to obtain an understanding of internal control over financial reporting but not for the purpose of expressing an opinion on the effectiveness of the Fund’s internal control over financial reporting. Accordingly, we express no such opinion.
Our audits included performing procedures to assess the risks of material misstatement of the financial statements and financial highlights, whether due to error or fraud, and performing procedures that respond to those risks. Such procedures included examining, on a test basis, evidence regarding the amounts and disclosures in the financial statements and financial highlights. Our audits also included evaluating the accounting principles used and significant estimates made by management, as well as evaluating the overall presentation of the financial statements and financial highlights. We believe that our audits provide a reasonable basis for our opinion.
/s/ Deloitte & Touche LLP
Boston, Massachusetts
December 22, 2023
We have served as the auditor of one or more Eaton Vance investment companies since 1959.
Eaton Vance
Global Macro Absolute Return Fund
October 31, 2023
Federal Tax Information (Unaudited)
The Form 1099-DIV you receive in February 2024 will show the tax status of all distributions paid to your account in calendar year 2023. Shareholders are advised to consult their own tax adviser with respect to the tax consequences of their investment in the Fund. As required by the Internal Revenue Code and/or regulations, shareholders must be notified regarding the status of qualified dividend income for individuals and 163(j) interest dividends.
Qualified Dividend Income. For the fiscal year ended October 31, 2023, the Fund designates approximately $1,562,190, or up to the maximum amount of such dividends allowable pursuant to the Internal Revenue Code, as qualified dividend income eligible for the reduced tax rate of 15%.
163(j) Interest Dividends. For the fiscal year ended October 31, 2023, the Fund designates 100% of distributions from net investment income as a 163(j) interest dividend.
Global Macro Portfolio
October 31, 2023
Consolidated Portfolio of Investments
| Collateralized Mortgage Obligations — 3.7% |
| Security | Principal
Amount
(000's omitted) | Value |
| Federal Home Loan Mortgage Corp.: | | | |
| Series 1650, Class K, 6.50%, 1/15/24 | $ | 3 | $ 3,493 |
| Series 1817, Class Z, 6.50%, 2/15/26 | | 4 | 4,142 |
| Series 1927, Class ZA, 6.50%, 1/15/27 | | 25 | 24,370 |
| Series 2344, Class ZD, 6.50%, 8/15/31 | | 150 | 149,983 |
| Series 2458, Class ZB, 7.00%, 6/15/32 | | 324 | 328,371 |
Interest Only:(1)
Series 4791, Class JI, 4.00%, 5/15/48 | | 4,024 | 844,753 |
| Federal Home Loan Mortgage Corp. Structured Agency Credit Risk Debt Notes: | | | |
| Series 2020-DNA4, Class B1, 11.435%, (30-day average SOFR + 6.114%), 8/25/50(2)(3) | | 3,671 | 4,089,292 |
| Series 2020-HQA4, Class B1, 10.685%, (30-day average SOFR + 5.364%), 9/25/50(2)(3) | | 1,854 | 2,008,076 |
| Series 2022-HQA1, Class M1B, 8.821%, (30-day average SOFR + 3.50%), 3/25/42(2)(3) | | 1,479 | 1,527,024 |
| Series 2022-HQA1, Class M2, 10.571%, (30-day average SOFR + 5.25%), 3/25/42(2)(3) | | 2,957 | 3,120,484 |
| Federal National Mortgage Association: | | | |
| Series G94-7, Class PJ, 7.50%, 5/17/24 | | 2 | 2,375 |
| Series 1994-42, Class ZQ, 7.00%, 4/25/24 | | 21 | 21,287 |
| Series 1994-79, Class Z, 7.00%, 4/25/24 | | 3 | 2,549 |
| Series 1994-89, Class ZQ, 8.00%, 7/25/24 | | 11 | 11,180 |
| Series 1996-35, Class Z, 7.00%, 7/25/26 | | 7 | 6,819 |
| Series 1998-16, Class H, 7.00%, 4/18/28 | | 61 | 61,733 |
| Series 1998-44, Class ZA, 6.50%, 7/20/28 | | 95 | 95,082 |
| Series 1999-25, Class Z, 6.00%, 6/25/29 | | 100 | 99,029 |
| Series 2000-2, Class ZE, 7.50%, 2/25/30 | | 20 | 20,799 |
| Series 2000-49, Class A, 8.00%, 3/18/27 | | 32 | 32,775 |
| Series 2001-31, Class ZA, 6.00%, 7/25/31 | | 787 | 777,568 |
| Series 2001-74, Class QE, 6.00%, 12/25/31 | | 240 | 240,767 |
| Series 2009-48, Class WA, 5.794%, 7/25/39(4) | | 1,145 | 1,140,461 |
| Series 2011-38, Class SA, 0.00%, (13.157% - 30-day average SOFR x 3, Floor 0.00%), 5/25/41(5) | | 648 | 396,333 |
| Series 2023-54, Class C, 6.50%, 11/25/53 | | 2,610 | 2,558,604 |
| Interest Only:(1) | | | |
| Series 424, Class C8, 3.50%, 2/25/48 | | 5,111 | 945,850 |
| Series 2018-21, Class IO, 3.00%, 4/25/48 | | 4,528 | 805,082 |
| Series 2018-58, Class BI, 4.00%, 8/25/48 | | 700 | 140,780 |
| Government National Mortgage Association: | | | |
| Series 2023-148, Class HL, 6.50%, 10/20/53 | | 2,610 | 2,605,702 |
| Sereis 2023-151, Class GL, 6.50%, 10/20/53 | | 1,890 | 1,886,530 |
| Series 2023-155, Class CH, 6.50%, 10/20/53 | | 7,140 | 7,119,529 |
| PNMAC GMSR Issuer Trust: | | | |
| Series 2018-GT1, Class A, 9.289%, (1 mo. SOFR + 3.85%), 2/25/25(2)(3) | | 9,000 | 9,000,381 |
| Security | Principal
Amount
(000's omitted) | Value |
| PNMAC GMSR Issuer Trust: (continued) | | | |
| Series 2018-GT2, Class A, 8.089%, (1 mo. USD LIBOR + 2.65%), 8/25/25(2)(3) | $ | 8,064 | $ 8,063,082 |
| Unison Trust, Series 2021-1, Class A, 4.50%, 4/25/50(2)(4) | | 22,480 | 17,541,715 |
Total Collateralized Mortgage Obligations
(identified cost $83,143,549) | | | $ 65,676,000 |
| Security | Shares | Value |
| Belgium — 0.0%(6) |
| Cenergy Holdings S.A. | | 19,171 | $ 128,952 |
| | | | $ 128,952 |
| Bulgaria — 0.3% |
| Eurohold Bulgaria AD(7) | | 5,302,921 | $ 4,876,582 |
| | | | $ 4,876,582 |
| Cyprus — 0.4% |
| Bank of Cyprus Holdings PLC | | 2,032,276 | $ 6,266,037 |
| Galaxy Cosmos Mezz PLC(7) | | 23,855 | 12,878 |
| Optima bank S.A.(7) | | 68,150 | 511,978 |
| Sunrisemezz PLC(7) | | 134,028 | 36,970 |
| | | | $ 6,827,863 |
| Georgia — 0.1% |
| Bank of Georgia Group PLC | | 19,303 | $ 781,525 |
| Georgia Capital PLC(7) | | 68,200 | 764,570 |
| TBC Bank Group PLC | | 22,924 | 749,179 |
| | | | $ 2,295,274 |
| Greece — 1.0% |
| Alpha Services and Holdings S.A.(7) | | 740,700 | $ 1,108,778 |
| Eurobank Ergasias Services and Holdings S.A.(7) | | 1,206,500 | 1,972,053 |
| Hellenic Telecommunications Organization S.A. | | 127,496 | 1,787,033 |
| Ideal Holdings S.A.(7) | | 6,439 | 39,662 |
| JUMBO S.A. | | 79,363 | 2,088,085 |
| Motor Oil (Hellas) Corinth Refineries S.A. | | 41,500 | 988,430 |
| Mytilineos S.A. | | 56,975 | 2,110,605 |
| National Bank of Greece S.A.(7) | | 251,300 | 1,439,283 |
| OPAP S.A. | | 92,863 | 1,572,940 |
| Piraeus Financial Holdings S.A.(7) | | 1,035,900 | 3,070,557 |
22
See Notes to Consolidated Financial Statements.
Global Macro Portfolio
October 31, 2023
Consolidated Portfolio of Investments — continued
| Security | Shares | Value |
| Greece (continued) |
| Public Power Corp. S.A.(7) | | 65,900 | $ 672,645 |
| Titan Cement International S.A. | | 3,416 | 63,976 |
| | | | $ 16,914,047 |
| Iceland — 0.2% |
| Arion Banki HF(2) | | 1,015,472 | $ 934,018 |
| Eik Fasteignafelag HF(7) | | 3,253,209 | 266,568 |
| Eimskipafelag Islands HF | | 220,734 | 744,248 |
| Hagar HF | | 921,987 | 451,359 |
| Islandsbanki HF | | 668,258 | 494,113 |
| Reginn HF(7) | | 1,291,872 | 207,661 |
| Reitir Fasteignafelag HF | | 875,641 | 483,667 |
| Siminn HF | | 1,879,514 | 118,694 |
| | | | $ 3,700,328 |
| Indonesia — 0.2% |
| Bank Central Asia Tbk PT | | 2,370,000 | $ 1,305,682 |
| Bank Mandiri Persero Tbk PT | | 2,570,000 | 918,138 |
| Bank Negara Indonesia Persero Tbk PT | | 540,000 | 162,965 |
| Bank Rakyat Indonesia Persero Tbk PT | | 3,500,000 | 1,094,393 |
| | | | $ 3,481,178 |
| Poland — 0.2% |
| Alior Bank S.A.(7) | | 4,493 | $ 70,732 |
| Allegro.eu S.A.(2)(7) | | 25,328 | 181,685 |
| Asseco Poland S.A. | | 2,879 | 52,714 |
| Bank Millennium S.A.(7) | | 31,797 | 55,326 |
| Bank Polska Kasa Opieki S.A. | | 9,589 | 291,383 |
| Budimex S.A. | | 671 | 75,114 |
| CCC S.A.(7) | | 2,124 | 20,103 |
| CD Projekt S.A. | | 3,509 | 87,608 |
| Cyfrowy Polsat S.A.(7) | | 13,477 | 42,021 |
| Dino Polska S.A.(2)(7) | | 2,655 | 251,575 |
| Enea S.A.(7) | | 14,841 | 25,725 |
| Eurocash S.A. | | 4,498 | 14,964 |
| Grupa Azoty S.A.(7) | | 2,748 | 14,378 |
| Grupa Kety S.A. | | 524 | 88,390 |
| Jastrzebska Spolka Weglowa S.A.(7) | | 2,720 | 32,312 |
| KGHM Polska Miedz S.A. | | 7,219 | 192,641 |
| KRUK S.A. | | 921 | 101,885 |
| LPP S.A. | | 60 | 193,288 |
| mBank S.A.(7) | | 790 | 97,662 |
| Orange Polska S.A. | | 33,830 | 62,751 |
| ORLEN S.A. | | 29,591 | 467,950 |
| PGE S.A.(7) | | 48,920 | 84,960 |
| Powszechna Kasa Oszczednosci Bank Polski S.A.(7) | | 45,365 | 469,925 |
| Security | Shares | Value |
| Poland (continued) |
| Powszechny Zaklad Ubezpieczen S.A. | | 32,554 | $ 368,377 |
| Santander Bank Polska S.A.(7) | | 1,888 | 205,050 |
| Tauron Polska Energia S.A.(7) | | 56,565 | 49,747 |
| Text S.A. | | 908 | 24,463 |
| Warsaw Stock Exchange | | 1,386 | 12,872 |
| XTB S.A.(2) | | 2,593 | 20,159 |
| | | | $ 3,655,760 |
| Spain — 0.0%(6) |
| AmRest Holdings SE(7) | | 3,936 | $ 24,965 |
| | | | $ 24,965 |
| United Kingdom — 0.0%(6) |
| Pepco Group N.V.(7)(8) | | 9,358 | $ 37,929 |
| Tesnik Cuatro, Ltd.(9) | | 409,000 | 572,723 |
| | | | $ 610,652 |
| Vietnam — 0.4% |
| Bank for Foreign Trade of Vietnam JSC(7) | | 99,972 | $ 353,542 |
| Binh Minh Plastics JSC | | 14,820 | 47,414 |
| Coteccons Construction JSC(7) | | 48,000 | 99,367 |
| FPT Corp. | | 662,286 | 2,315,811 |
| Hoa Phat Group JSC(7) | | 475,478 | 446,175 |
| KIDO Group Corp. | | 10,295 | 26,618 |
| Military Commercial Joint Stock Bank | | 914,921 | 681,401 |
| Mobile World Investment Corp. | | 1,082,498 | 1,665,844 |
| Phu Nhuan Jewelry JSC | | 348,840 | 1,023,999 |
| Refrigeration Electrical Engineering Corp. | | 287,788 | 659,297 |
| Vietnam Dairy Products JSC | | 90,281 | 250,044 |
| Vingroup JSC(7) | | 78,738 | 129,869 |
| | | | $ 7,699,381 |
Total Common Stocks
(identified cost $43,842,498) | | | $ 50,214,982 |
| Security | Principal
Amount
(000's omitted) | Value |
| India — 0.1% |
| Indiabulls Housing Finance, Ltd., 4.50%, 9/28/26(8) | USD | 2,970 | $ 2,647,072 |
Total Convertible Bonds
(identified cost $2,970,000) | | | $ 2,647,072 |
23
See Notes to Consolidated Financial Statements.
Global Macro Portfolio
October 31, 2023
Consolidated Portfolio of Investments — continued
| Foreign Corporate Bonds — 2.3% |
| Security | Principal
Amount
(000's omitted) | Value |
| Armenia — 0.0%(6) |
| Ardshinbank CJSC Via Dilijan Finance BV, 6.50%, 1/28/25(8) | USD | 953 | $ 941,087 |
| | | | $ 941,087 |
| Brazil — 0.1% |
| Coruripe Netherlands BV: | | | |
| 10.00%, 2/10/27(2) | USD | 903 | $ 639,216 |
| 10.00%, 2/10/27(8) | USD | 1,989 | 1,407,974 |
| | | | $ 2,047,190 |
| China — 0.1% |
| KWG Group Holdings, Ltd., 7.875%, 8/30/24(10) | USD | 1,571 | $ 122,931 |
| Shimao Group Holdings, Ltd., 5.60%, 7/15/26(8)(10) | USD | 5,100 | 127,500 |
| Sunac China Holdings, Ltd.: | | | |
| 6.50%, 7/9/23(8)(10) | USD | 2,000 | 290,000 |
| 8.35%, 4/19/23(8)(10) | USD | 3,270 | 468,428 |
| Times China Holdings, Ltd.: | | | |
| 5.55%, 6/4/24(8)(10) | USD | 3,999 | 138,365 |
| 6.75%, 7/16/23(8)(10) | USD | 2,966 | 74,150 |
| | | | $ 1,221,374 |
| Hungary — 0.1% |
| MBH Bank Nyrt, 8.625% to 10/19/26, 10/19/27(8)(11) | EUR | 1,243 | $ 1,326,917 |
| | | | $ 1,326,917 |
| Iceland — 0.6% |
| Arion Banki HF, 6.00%, 4/12/24(8) | ISK | 1,000,000 | $ 7,073,171 |
| Landsbankinn HF, 5.00%, 11/23/23(8) | ISK | 560,000 | 3,983,070 |
| WOW Air HF: | | | |
| 0.00% (9)(10)(12) | EUR | 79 | 0 |
| 0.00%, (3 mo. EURIBOR + 9.00%)(9)(10)(12) | EUR | 3,600 | 0 |
| | | | $ 11,056,241 |
| India — 0.8% |
| Indian Railway Finance Corp., Ltd., 2.80%, 2/10/31(8) | USD | 15,006 | $ 11,913,256 |
| JSW Steel, Ltd., 5.05%, 4/5/32(8) | USD | 1,466 | 1,131,308 |
| Reliance Communications, Ltd., 6.50%, 11/6/20(8)(10) | USD | 1,800 | 40,500 |
| Vedanta Resources Finance II PLC, 13.875%, 1/21/24(8) | USD | 1,481 | 1,319,954 |
| | | | $ 14,405,018 |
| Security | Principal
Amount
(000's omitted) | Value |
| Mexico — 0.1% |
| Alpha Holding S.A. de CV: | | | |
| 9.00%, 2/10/25(8)(10) | USD | 3,667 | $ 68,760 |
| 10.00%, 12/19/22(8)(10) | USD | 1,741 | 26,117 |
| Grupo Kaltex S.A. de CV, 14.50%, (13.00% cash and 1.50% PIK), 9/30/25(2) | USD | 1,124 | 1,011,600 |
| | | | $ 1,106,477 |
| Moldova — 0.1% |
| Aragvi Finance International DAC, 8.45%, 4/29/26(8) | USD | 2,301 | $ 1,584,814 |
| | | | $ 1,584,814 |
| Nigeria — 0.0%(6) |
| IHS Netherlands Holdco BV, 8.00%, 9/18/27(8) | USD | 354 | $ 289,760 |
| SEPLAT Energy PLC, 7.75%, 4/1/26(8) | USD | 439 | 371,745 |
| | | | $ 661,505 |
| Saint Lucia — 0.1% |
| Digicel International Finance, Ltd./Digicel International Holdings, Ltd., 8.75%, 5/25/24(8) | USD | 1,120 | $ 1,028,754 |
| | | | $ 1,028,754 |
| South Africa — 0.0%(6) |
| Petra Diamonds US Treasury PLC, 9.75% PIK, 3/8/26(8) | USD | 562 | $ 480,189 |
| | | | $ 480,189 |
| Turkey — 0.2% |
| Limak Iskenderun Uluslararasi Liman Isletmeciligi AS, 9.50%, 7/10/36(8) | USD | 4,373 | $ 3,839,532 |
| | | | $ 3,839,532 |
| Uzbekistan — 0.1% |
| International Finance Corp., 16.00%, 2/21/25 | UZS | 16,000,000 | $ 1,313,204 |
| | | | $ 1,313,204 |
Total Foreign Corporate Bonds
(identified cost $63,382,847) | | | $ 41,012,302 |
24
See Notes to Consolidated Financial Statements.
Global Macro Portfolio
October 31, 2023
Consolidated Portfolio of Investments — continued
| Loan Participation Notes — 1.2% |
| Security | Principal
Amount
(000's omitted) | Value |
| Uzbekistan — 1.2% |
| Daryo Finance BV (borrower - Uzbek Industrial and Construction Bank ATB), 18.75%, 6/15/25(8)(9)(13) | UZS | 151,973,440 | $ 12,143,756 |
| Europe Asia Investment Finance BV (borrower - Joint Stock Commercial Bank "Asaka"), 18.70%, 7/21/26(8)(9)(13) | UZS | 125,249,130 | 9,544,508 |
Total Loan Participation Notes
(identified cost $24,959,768) | | | $ 21,688,264 |
| Reinsurance Side Cars — 0.9% |
| Security | Shares | Value |
| Eden Re II, Ltd.: | | | |
| Series 2021A, 0.00%, 3/21/25(2)(9)(14)(15) | | 255,989 | $ 116,731 |
| Series 2022A, 0.00%, 3/20/26(2)(9)(14)(15) | | 193,872 | 143,523 |
| Series 2022B, 0.00%, 3/20/26(2)(9)(14)(15) | | 415,091 | 313,394 |
| Series 2023B, 0.00%, 3/19/27(2)(9)(14)(15) | | 2,800,000 | 3,215,800 |
| Mt. Logan Re, Ltd., Series A-1(7)(9)(15)(16) | | 4,400 | 5,206,235 |
| Sussex Capital, Ltd.: | | | |
| Designated Investment Series 16, 12/21(7)(9)(15)(16) | | 817 | 15,233 |
| Designated Investment Series 16, 11/22(7)(9)(15)(16) | | 793 | 439,382 |
| Series 16, Preference Shares(9)(15)(16) | | 5,500 | 6,031,506 |
Total Reinsurance Side Cars
(identified cost $13,564,952) | | | $ 15,481,804 |
| Senior Floating-Rate Loans — 0.9%(17) |
| Borrower/Description | Principal
Amount
(000's omitted) | Value |
| Argentina — 0.0%(6) |
| Desa, LLC, Term Loan, 2.50%, 6/30/24(9)(18) | $ | 788 | $ 278,045 |
| | | | $ 278,045 |
| Mexico — 0.9% |
| Petroleos Mexicanos, Term Loan, 8.447%, (SOFR + 3.00%), 6/28/24 | $ | 15,931 | $ 15,652,203 |
| | | | $ 15,652,203 |
Total Senior Floating-Rate Loans
(identified cost $16,522,231) | | | $ 15,930,248 |
| Sovereign Government Bonds — 38.7% |
| Security | Principal
Amount
(000's omitted) | Value |
| Albania — 1.1% |
| Albania Government International Bond: | | | |
| 3.50%, 10/9/25(8) | EUR | 2,157 | $ 2,188,119 |
| 3.50%, 6/16/27(8) | EUR | 209 | 206,634 |
| 5.90%, 6/9/28(8) | EUR | 16,495 | 16,901,210 |
| | | | $ 19,295,963 |
| Argentina — 0.5% |
| Republic of Argentina: | | | |
| 0.75% to 7/9/27, 7/9/30(19) | USD | 4,552 | $ 1,275,059 |
| 1.00%, 7/9/29 | USD | 1,102 | 298,852 |
| 3.50% to 7/9/29, 7/9/41(19) | USD | 9,543 | 2,524,842 |
| 3.625% to 7/9/24, 7/9/35(19) | USD | 10,421 | 2,601,153 |
| 4.255% to 7/9/24, 1/9/38(19) | USD | 6,269 | 1,908,755 |
| | | | $ 8,608,661 |
| Armenia — 1.1% |
| Republic of Armenia Treasury Bond: | | | |
| 9.00%, 4/29/26 | AMD | 169,160 | $ 409,003 |
| 9.25%, 4/29/28 | AMD | 2,178,230 | 5,188,837 |
| 9.60%, 10/29/33 | AMD | 4,493,125 | 10,679,715 |
| 9.75%, 10/29/50 | AMD | 571,827 | 1,364,103 |
| 9.75%, 10/29/52 | AMD | 621,020 | 1,479,102 |
| | | | $ 19,120,760 |
| Barbados — 0.7% |
| Government of Barbados, 6.50%, 10/1/29(8) | USD | 13,422 | $ 12,649,952 |
| | | | $ 12,649,952 |
| Benin — 1.0% |
| Benin Government International Bond: | | | |
| 4.875%, 1/19/32(8) | EUR | 8,006 | $ 6,355,651 |
| 4.95%, 1/22/35(8) | EUR | 3,809 | 2,742,823 |
| 6.875%, 1/19/52(8) | EUR | 13,654 | 9,497,367 |
| | | | $ 18,595,841 |
| Cyprus — 0.5% |
| Cyprus Government International Bond: | | | |
| 2.75%, 2/26/34(8) | EUR | 812 | $ 753,195 |
| 4.125%, 4/13/33(8) | EUR | 7,242 | 7,731,351 |
| | | | $ 8,484,546 |
25
See Notes to Consolidated Financial Statements.
Global Macro Portfolio
October 31, 2023
Consolidated Portfolio of Investments — continued
| Security | Principal
Amount
(000's omitted) | Value |
| Dominican Republic — 2.4% |
| Dominican Republic: | | | |
| 8.00%, 1/15/27(8) | DOP | 96,000 | $ 1,570,419 |
| 8.00%, 2/12/27(8) | DOP | 490,340 | 8,108,153 |
| 11.25%, 9/15/35(2) | DOP | 106,250 | 1,856,850 |
| 12.00%, 8/8/25(2) | DOP | 332,200 | 5,912,628 |
| 12.75%, 9/23/29(2) | DOP | 368,500 | 7,187,520 |
| 13.00%, 6/10/34(8) | DOP | 232,600 | 4,752,252 |
| 13.625%, 2/3/33(2) | DOP | 206,150 | 4,134,557 |
| Dominican Republic Central Bank Notes: | | | |
| 8.00%, 3/12/27(8) | DOP | 31,580 | 504,933 |
| 12.00%, 10/3/25(2) | DOP | 138,420 | 2,466,310 |
| 13.00%, 12/5/25(2) | DOP | 216,700 | 3,939,317 |
| 13.00%, 1/30/26(2) | DOP | 161,230 | 2,933,682 |
| | | | $ 43,366,621 |
| Ecuador — 0.0%(6) |
| Republic of Ecuador, 2.50% to 1/31/24, 7/31/40(8)(19) | USD | 2,839 | $ 702,574 |
| | | | $ 702,574 |
| El Salvador — 0.4% |
| Republic of El Salvador: | | | |
| 5.875%, 1/30/25(8) | USD | 554 | $ 510,382 |
| 6.375%, 1/18/27(8) | USD | 623 | 512,496 |
| 7.625%, 2/1/41(8) | USD | 2,863 | 1,927,230 |
| 7.65%, 6/15/35(8) | USD | 196 | 138,152 |
| 8.25%, 4/10/32(8) | USD | 4,537 | 3,582,924 |
| | | | $ 6,671,184 |
| Ethiopia — 0.5% |
| Ethiopia Government International Bond, 6.625%, 12/11/24(8) | USD | 14,706 | $ 9,335,178 |
| | | | $ 9,335,178 |
| Ghana — 0.6% |
| Ghana Government International Bond: | | | |
| 6.375%, 2/11/27(8)(10) | USD | 1,906 | $ 817,979 |
| 7.625%, 5/16/29(8)(10) | USD | 1,830 | 784,212 |
| 7.75%, 4/7/29(8)(10) | USD | 3,667 | 1,577,140 |
| 7.875%, 3/26/27(8)(10) | USD | 718 | 310,460 |
| 7.875%, 2/11/35(8)(10) | USD | 837 | 363,049 |
| 8.125%, 3/26/32(8)(10) | USD | 4,287 | 1,818,074 |
| 8.625%, 4/7/34(8)(10) | USD | 2,842 | 1,216,887 |
| 8.627%, 6/16/49(8)(10) | USD | 2,781 | 1,164,752 |
| 8.75%, 3/11/61(8)(10) | USD | 3,256 | 1,363,482 |
| Security | Principal
Amount
(000's omitted) | Value |
| Ghana (continued) |
| Ghana Government International Bond: (continued) | | | |
| 8.875%, 5/7/42(8)(10) | USD | 1,305 | $ 546,932 |
| 8.95%, 3/26/51(8)(10) | USD | 252 | 105,723 |
| | | | $ 10,068,690 |
| Greece — 0.0%(6) |
| Hellenic Republic Government Bond, 0.00%, GDP-Linked, 10/15/42 | EUR | 85,770 | $ 285,401 |
| | | | $ 285,401 |
| Honduras — 0.4% |
| Honduras Government International Bond, 7.50%, 3/15/24(8) | USD | 7,500 | $ 7,475,250 |
| | | | $ 7,475,250 |
| Hungary — 0.5% |
| Hungary Government Bond: | | | |
| 3.00%, 4/25/41 | HUF | 1,964,450 | $ 3,093,827 |
| 4.00%, 4/28/51 | HUF | 1,143,090 | 1,891,183 |
| 4.75%, 11/24/32 | HUF | 1,945,960 | 4,442,165 |
| | | | $ 9,427,175 |
| Iceland — 1.6% |
| Republic of Iceland: | | | |
| 2.50%, 4/15/24 | ISK | 168,247 | $ 1,169,099 |
| 6.50%, 1/24/31 | ISK | 1,418,285 | 9,597,844 |
| 8.00%, 6/12/25 | ISK | 2,433,368 | 17,363,930 |
| | | | $ 28,130,873 |
| India — 3.7% |
| Export-Import Bank of India: | | | |
| 3.25%, 1/15/30(8) | USD | 10,500 | $ 8,881,216 |
| 5.50%, 1/18/33(2) | USD | 4,490 | 4,237,271 |
| India Government Bond: | | | |
| 7.10%, 4/18/29 | INR | 3,328,920 | 39,482,826 |
| 7.26%, 2/6/33 | INR | 1,102,690 | 13,155,398 |
| | | | $ 65,756,711 |
| Indonesia — 2.0% |
| Indonesia Government Bond: | | | |
| 6.125%, 5/15/28 | IDR | 550,220,000 | $ 33,377,935 |
| 7.125%, 6/15/42 | IDR | 26,112,000 | 1,632,522 |
| 7.125%, 6/15/43 | IDR | 14,081,000 | 884,071 |
26
See Notes to Consolidated Financial Statements.
Global Macro Portfolio
October 31, 2023
Consolidated Portfolio of Investments — continued
| Security | Principal
Amount
(000's omitted) | Value |
| Indonesia (continued) |
| Indonesia Government Bond: (continued) | | | |
| 7.375%, 5/15/48 | IDR | 9,373,000 | $ 601,412 |
| | | | $ 36,495,940 |
| Ivory Coast — 0.9% |
| Ivory Coast Government International Bond: | | | |
| 6.625%, 3/22/48(8) | EUR | 15,634 | $ 11,145,401 |
| 6.875%, 10/17/40(8) | EUR | 7,068 | 5,435,844 |
| | | | $ 16,581,245 |
| Lebanon — 0.1% |
| Lebanese Republic: | | | |
| 5.80%, 4/14/20(8)(10) | USD | 337 | $ 21,680 |
| 6.10%, 10/4/22(8)(10) | USD | 5,758 | 358,798 |
| 6.15%, 6/19/20(10) | USD | 448 | 28,821 |
| 6.375%, 3/9/20(10) | USD | 5,742 | 369,394 |
| 6.40%, 5/26/23(10) | USD | 7,625 | 476,563 |
| 6.65%, 11/3/28(8)(10) | USD | 2,498 | 164,241 |
| 6.85%, 5/25/29(10) | USD | 5,335 | 342,166 |
| 7.00%, 12/3/24(10) | USD | 3,446 | 226,988 |
| 8.20%, 5/17/33(10) | USD | 1,595 | 103,635 |
| 8.25%, 5/17/34(10) | USD | 1,326 | 88,444 |
| | | | $ 2,180,730 |
| Mexico — 1.0% |
| Mexican Bonos: | | | |
| 7.75%, 11/13/42 | MXN | 217,290 | $ 9,629,747 |
| 8.00%, 7/31/53 | MXN | 200,000 | 8,924,289 |
| | | | $ 18,554,036 |
| Nigeria — 0.8% |
| Republic of Nigeria: | | | |
| 7.375%, 9/28/33(8) | USD | 2,384 | $ 1,799,824 |
| 7.625%, 11/28/47(8) | USD | 1,220 | 826,832 |
| 7.696%, 2/23/38(8) | USD | 7,869 | 5,631,017 |
| 8.25%, 9/28/51(8) | USD | 9,301 | 6,571,566 |
| | | | $ 14,829,239 |
| North Macedonia — 1.5% |
| North Macedonia Government International Bond: | | | |
| 1.625%, 3/10/28(8) | EUR | 10,491 | $ 9,050,684 |
| 2.75%, 1/18/25(8) | EUR | 2,570 | 2,613,020 |
| 3.675%, 6/3/26(8) | EUR | 4,477 | 4,456,062 |
| Security | Principal
Amount
(000's omitted) | Value |
| North Macedonia (continued) |
North Macedonia Government International Bond:
(continued) | | | |
| 6.96%, 3/13/27(8) | EUR | 9,573 | $ 10,277,951 |
| | | | $ 26,397,717 |
| Panama — 0.0%(6) |
| Panama Bonos del Tesoro, 6.375%, 7/25/33(2)(8) | USD | 581 | $ 531,202 |
| | | | $ 531,202 |
| Peru — 3.0% |
| Peru Government Bond: | | | |
| 5.94%, 2/12/29 | PEN | 139,340 | $ 34,779,642 |
| 6.15%, 8/12/32 | PEN | 31,156 | 7,419,155 |
| 6.35%, 8/12/28 | PEN | 10,491 | 2,693,663 |
| 6.95%, 8/12/31 | PEN | 3,691 | 937,086 |
| 7.30%, 8/12/33(2)(8) | PEN | 28,573 | 7,292,726 |
| | | | $ 53,122,272 |
| Philippines — 1.0% |
| Republic of the Philippines, 6.25%, 1/14/36 | PHP | 1,024,000 | $ 17,136,349 |
| | | | $ 17,136,349 |
| Romania — 1.8% |
| Romania Government International Bond: | | | |
| 1.75%, 7/13/30(8) | EUR | 858 | $ 693,180 |
| 2.124%, 7/16/31(8) | EUR | 678 | 533,675 |
| 2.125%, 3/7/28(8) | EUR | 4,146 | 3,818,497 |
| 2.625%, 12/2/40(8) | EUR | 894 | 559,430 |
| 2.75%, 4/14/41(8) | EUR | 1,699 | 1,065,123 |
| 3.375%, 1/28/50(8) | EUR | 5,202 | 3,267,388 |
| 4.625%, 4/3/49(8) | EUR | 6,270 | 4,922,145 |
| 5.00%, 9/27/26(8) | EUR | 8,524 | 9,080,353 |
| 6.625%, 9/27/29(8) | EUR | 8,340 | 9,098,947 |
| | | | $ 33,038,738 |
| Serbia — 2.7% |
| Republic of Serbia: | | | |
| 1.00%, 9/23/28(8) | EUR | 9,388 | $ 7,830,038 |
| 1.50%, 6/26/29(8) | EUR | 10,232 | 8,404,381 |
| 1.65%, 3/3/33(8) | EUR | 368 | 258,880 |
| Serbia Treasury Bond: | | | |
| 4.50%, 8/20/32 | RSD | 1,539,040 | 12,243,040 |
| 5.875%, 2/8/28 | RSD | 2,181,570 | 20,158,570 |
| | | | $ 48,894,909 |
27
See Notes to Consolidated Financial Statements.
Global Macro Portfolio
October 31, 2023
Consolidated Portfolio of Investments — continued
| Security | Principal
Amount
(000's omitted) | Value |
| South Africa — 1.8% |
| Republic of South Africa: | | | |
| 8.00%, 1/31/30 | ZAR | 295,900 | $ 13,974,974 |
| 8.25%, 3/31/32 | ZAR | 269,204 | 11,879,625 |
| 10.50%, 12/21/26 | ZAR | 99,181 | 5,489,472 |
| | | | $ 31,344,071 |
| South Korea — 1.3% |
| Korea Treasury Bond, 1.875%, 12/10/24 | KRW | 31,500,000 | $ 22,838,963 |
| | | | $ 22,838,963 |
| Sri Lanka — 1.1% |
| Sri Lanka Government International Bond: | | | |
| 5.75%, 4/18/23(8)(10) | USD | 7,202 | $ 3,780,382 |
| 6.20%, 5/11/27(8)(10) | USD | 5,303 | 2,669,795 |
| 6.35%, 6/28/24(8)(10) | USD | 3,160 | 1,648,108 |
| 6.825%, 7/18/26(8)(10) | USD | 13,209 | 6,884,438 |
| 6.85%, 3/14/24(8)(10) | USD | 2,910 | 1,516,484 |
| 6.85%, 11/3/25(8)(10) | USD | 5,492 | 2,869,330 |
| | | | $ 19,368,537 |
| Suriname — 2.1% |
| Republic of Suriname, 9.25%, 10/26/26(8)(10) | USD | 40,913 | $ 37,333,113 |
| | | | $ 37,333,113 |
| Ukraine — 0.3% |
| Ukraine Government Bond: | | | |
| 10.95%, 11/1/23 | UAH | 51,923 | $ 1,357,689 |
| 11.67%, 11/22/23 | UAH | 36,423 | 850,869 |
| 15.84%, 2/26/25 | UAH | 169,589 | 3,669,101 |
| | | | $ 5,877,659 |
| Uruguay — 1.5% |
| Uruguay Government Bond: | | | |
| 3.875%, 7/2/40(20) | UYU | 436,482 | $ 11,082,702 |
| 9.75%, 7/20/33 | UYU | 539,428 | 13,452,226 |
| Uruguay Monetary Regulation Bill, 0.00%, 7/3/24 | UYU | 88,660 | 2,082,007 |
| | | | $ 26,616,935 |
| Uzbekistan — 0.5% |
| Republic of Uzbekistan: | | | |
| 14.00%, 7/19/24(8) | UZS | 2,500,000 | $ 204,150 |
| 16.25%, 10/12/26(8) | UZS | 112,430,000 | 9,235,325 |
| | | | $ 9,439,475 |
| Security | Principal
Amount
(000's omitted) | Value |
| Zambia — 0.3% |
| Zambia Government Bond: | | | |
| 11.00%, 1/25/26 | ZMW | 115,980 | $ 4,593,845 |
| 11.00%, 6/28/26 | ZMW | 3,150 | 118,630 |
| 12.00%, 6/28/28 | ZMW | 10,500 | 340,682 |
| 12.00%, 8/30/28 | ZMW | 1,000 | 31,990 |
| 12.00%, 11/29/28 | ZMW | 3,500 | 109,844 |
| 13.00%, 1/25/31 | ZMW | 5,245 | 147,741 |
| | | | $ 5,342,732 |
Total Sovereign Government Bonds
(identified cost $739,008,328) | | | $693,899,242 |
| Borrower/Description | Principal
Amount
(000's omitted) | Value |
| Ivory Coast — 0.1% |
| Republic of Ivory Coast, Term Loan, 9.638%, (6 mo. EURIBOR + 5.75%), 1/6/28(3) | EUR | 2,399 | $ 2,736,253 |
| | | | $ 2,736,253 |
| Kenya — 0.2% |
| Government of Kenya, Term Loan, 12.203%, (6 mo. SOFR + 6.45%), 6/29/25(3) | USD | 3,072 | $ 3,137,765 |
| | | | $ 3,137,765 |
| Nigeria — 0.1% |
| Bank of Industry Limited, Term Loan, 11.67%, (3 mo. USD LIBOR + 6.00%), 12/11/23(3)(21) | USD | 1,910 | $ 1,911,371 |
| | | | $ 1,911,371 |
| Tanzania — 2.8% |
| Government of the United Republic of Tanzania, Term Loan, 12.174%, (6 mo. USD LIBOR + 6.30%), 4/28/31(3) | USD | 51,843 | $ 50,605,526 |
| | | | $ 50,605,526 |
Total Sovereign Loans
(identified cost $59,631,070) | | | $ 58,390,915 |
28
See Notes to Consolidated Financial Statements.
Global Macro Portfolio
October 31, 2023
Consolidated Portfolio of Investments — continued
| U.S. Government Agency Mortgage-Backed Securities — 1.7% |
| Security | Principal
Amount
(000's omitted) | Value |
| Federal Home Loan Mortgage Corp.: | | | |
| 4.196%, (COF + 1.254%), with maturity at 2035(22) | $ | 238 | $ 233,185 |
| 4.243%, (COF + 1.254%), with maturity at 2029(22) | | 5 | 4,947 |
| 4.50%, with maturity at 2035 | | 103 | 97,816 |
| 4.616%, (COF + 1.251%), with maturity at 2030(22) | | 101 | 99,697 |
| 5.685%, (1 yr. CMT + 2.318%), with maturity at 2036(22) | | 481 | 481,827 |
| 6.00%, with various maturities to 2035 | | 2,512 | 2,521,683 |
| 6.50%, with various maturities to 2032 | | 2,674 | 2,724,610 |
| 6.60%, with maturity at 2030 | | 279 | 280,912 |
| 7.00%, with various maturities to 2036 | | 3,184 | 3,254,197 |
| 7.50%, with various maturities to 2035 | | 1,082 | 1,110,425 |
| 8.00%, with various maturities to 2030 | | 184 | 183,753 |
| 8.50%, with maturity at 2025 | | 1 | 1,401 |
| 9.00%, with various maturities to 2027 | | 6 | 6,466 |
| 9.50%, with maturity at 2027 | | 4 | 3,965 |
| Federal National Mortgage Association: | | | |
| 4.111%, (COF + 1.296%), with maturity at 2024(22) | | 9 | 8,826 |
| 4.114%, (COF + 1.299%), with maturity at 2033(22) | | 332 | 321,311 |
| 4.186%, (COF + 1.254%), with maturity at 2035(22) | | 187 | 184,942 |
| 4.223%, (COF + 1.254%), with maturity at 2034(22) | | 82 | 79,056 |
| 4.29%, (COF + 1.40%), with maturity at 2025(22) | | 43 | 42,442 |
| 4.319%, (COF + 1.35%), with maturity at 2027(22) | | 20 | 19,838 |
| 4.32%, (1 yr. CMT + 2.15%), with maturity at 2028(22) | | 47 | 47,031 |
| 4.49%, (COF + 1.60%), with maturity at 2024(22) | | 16 | 15,480 |
| 5.05%, (COF + 1.791%), with maturity at 2035(22) | | 728 | 710,490 |
| 6.00%, with various maturities to 2035 | | 8,391 | 8,426,503 |
| 6.334%, (COF + 2.004%), with maturity at 2032(22) | | 157 | 159,908 |
| 6.50%, with various maturities to 2038 | | 2,850 | 2,884,280 |
| 7.00%, with various maturities to 2035 | | 4,928 | 5,044,744 |
| 7.50%, with various maturities to 2027 | | 2 | 2,459 |
| 7.725%, (1 yr. CMT + 2.225%), with maturity at 2025(22) | | 0 (23) | 395 |
| 8.00%, with maturity at 2026 | | 0 (23) | 116 |
| 8.50%, with various maturities to 2037 | | 624 | 651,502 |
| 9.00%, with various maturities to 2032 | | 38 | 38,784 |
| 9.50%, with various maturities to 2031 | | 4 | 4,047 |
| 11.50%, with maturity at 2031 | | 61 | 65,820 |
| Security | Principal
Amount
(000's omitted) | Value |
| Government National Mortgage Association: | | | |
| 3.00%, (1 yr. CMT + 1.50%), with maturity at 2024(22) | $ | 16 | $ 15,463 |
| 6.50%, with various maturities to 2032 | | 125 | 126,154 |
| 7.00%, with various maturities to 2031 | | 196 | 200,350 |
| 7.50%, with maturity at 2028 | | 16 | 15,867 |
| 9.00%, with maturity at 2025 | | 1 | 547 |
Total U.S. Government Agency Mortgage-Backed Securities
(identified cost $33,182,029) | | | $ 30,071,239 |
| U.S. Government Guaranteed Small Business Administration Loans(24)(25)— 0.5% |
| Security | Principal
Amount
(000's omitted) | Value |
| 1.66%, 8/15/42 to 4/15/43 | $ | 6,684 | $ 288,522 |
| 1.91%, 9/15/42 to 2/15/43 | | 6,506 | 322,985 |
| 1.93%, 5/15/42 | | 1,183 | 59,396 |
| 2.16%, 2/15/42 to 4/15/43 | | 8,592 | 493,101 |
| 2.24%, 3/19/36 to 8/25/42(26) | | 7,339 | 507,998 |
| 2.33%, 10/29/39 to 8/17/42(26) | | 18,098 | 958,844 |
| 2.36%, 9/15/42 | | 1,844 | 115,927 |
| 2.39%, 7/15/39 | | 911 | 49,041 |
| 2.41%, 7/15/42 to 4/15/43 | | 15,551 | 1,023,243 |
| 2.46%, 1/15/43 | | 1,404 | 110,729 |
| 2.66%, 4/15/43 | | 4,280 | 317,724 |
| 2.71%, 8/15/27 to 9/15/42 | | 2,433 | 161,730 |
| 2.91%, 10/15/42 to 4/15/43 | | 8,497 | 704,249 |
| 2.93%, 4/15/42 | | 886 | 77,796 |
| 2.96%, 7/15/27 to 12/15/42 | | 4,636 | 314,906 |
| 3.16%, 9/15/42 to 4/15/43 | | 4,037 | 401,819 |
| 3.21%, 6/15/27 to 3/15/43 | | 3,494 | 266,458 |
| 3.41%, 3/15/43 to 4/15/43 | | 5,494 | 499,670 |
| 3.46%, 3/15/27 to 9/15/42 | | 3,948 | 346,378 |
| 3.66%, 1/15/43 to 6/15/43 | | 6,014 | 660,299 |
| 3.71%, 3/15/28 to 10/15/42 | | 7,272 | 586,086 |
| 3.78%, 5/15/27 to 6/15/42 | | 913 | 76,098 |
Total U.S. Government Guaranteed Small Business Administration Loans
(identified cost $17,700,922) | | | $ 8,342,999 |
29
See Notes to Consolidated Financial Statements.
Global Macro Portfolio
October 31, 2023
Consolidated Portfolio of Investments — continued
| U.S. Treasury Obligations — 6.3% |
| Security | Principal
Amount
(000's omitted) | Value |
| U.S. Treasury Inflation-Protected Bond, 0.625%, 7/15/32(27) | $ | 12,471 | $ 10,685,183 |
| U.S. Treasury Inflation-Protected Notes, 1.25%, 4/15/28(27) | | 108,280 | 102,403,484 |
Total U.S. Treasury Obligations
(identified cost $116,720,118) | | | $113,088,667 |
| Security | Shares | Value |
| IRSA Inversiones y Representaciones S.A., Exp. 3/5/26(7) | | 201,760 | $ 76,770 |
Total Warrants
(identified cost $0) | | | $ 76,770 |
| Security | Shares | Value |
| Financial Intermediaries — 0.0% |
| Alpha Holding S.A., Escrow Certificates(7)(9) | | 3,698,000 | $ 0 |
| Alpha Holding S.A., Escrow Certificates(7)(9) | | 7,780,000 | 0 |
Total Miscellaneous
(identified cost $0) | | | $ 0 |
| Short-Term Investments — 36.4% |
| Security | Shares | Value |
| Morgan Stanley Institutional Liquidity Funds - Government Portfolio, Institutional Class, 5.25%(28) | | 283,898,491 | $ 283,898,491 |
Total Affiliated Fund
(identified cost $283,898,491) | | | $283,898,491 |
| Repurchase Agreements — 4.9% |
| Description | Principal
Amount
(000's omitted) | Value |
| Bank of America: | | | |
| Dated 7/27/23 with an interest rate of 4.75%, collateralized by USD 1,500,000 Republic of Colombia, 5.20%, due 5/15/49 and a market value, including accrued interest, of $1,000,796(29) | USD | 1,098 | $ 1,098,450 |
| Description | Principal
Amount
(000's omitted) | Value |
| Bank of America: (continued) | | | |
| Dated 7/27/23 with an interest rate of 4.75%, collateralized by USD 3,176,000 Republic of Colombia, 6.125%, due 1/18/41 and a market value, including accrued interest, of $2,494,719(29) | USD | 2,326 | $ 2,325,785 |
| Dated 7/27/23 with an interest rate of 4.80%, collateralized by USD 7,674,000 Republic of Colombia, 5.20%, due 5/15/49 and a market value, including accrued interest, of $5,120,071(29) | USD | 5,620 | 5,619,670 |
| Dated 7/27/23 with an interest rate of 5.00%, collateralized by USD 3,600,000 Republic of Colombia, 5.20%, due 5/15/49 and a market value, including accrued interest, of $2,401,910(29) | USD | 2,636 | 2,636,280 |
| Dated 8/17/23 with an interest rate of 4.00%, collateralized by USD 1,386,000 Republic of Ecuador, 0.00%, due 7/31/30 and a market value, including accrued interest, of $418,492(29) | USD | 411 | 410,603 |
| Dated 8/21/23 with an interest rate of 3.75%, collateralized by USD 1,925,000 Republic of Ecuador, 0.00%, due 7/31/30 and a market value, including accrued interest, of $581,239(29) | USD | 575 | 575,094 |
| Dated 8/23/23 with an interest rate of 3.60%, collateralized by USD 2,364,000 Republic of Ecuador, 0.00%, due 7/31/30 and a market value, including accrued interest, of $713,792(29) | USD | 694 | 694,425 |
| Dated 10/13/23 with an interest rate of 5.00%, collateralized by USD 953,000 Republic of Ecuador, 6.00%, due 7/31/30 and a market value, including accrued interest, of $506,577(29) | USD | 481 | 481,265 |
| Barclays Bank PLC: | | | |
| Dated 7/27/23 with an interest rate of 4.50%, collateralized by USD 5,500,000 Republic of Ecuador, 0.00%, due 7/31/30 and a market value, including accrued interest, of $1,660,683(29) | USD | 1,660 | 1,660,486 |
| Dated 8/1/23 with an interest rate of 1.75%, collateralized by USD 755,000 Pakistan Government International Bond, 6.00%, due 4/8/26 and a market value, including accrued interest, of $420,032(29) | USD | 444 | 443,726 |
| Dated 8/1/23 with an interest rate of 4.00%, collateralized by USD 2,750,000 Republic of Ecuador, 0.00%, due 7/31/30 and a market value, including accrued interest, of $830,342(29) | USD | 810 | 809,713 |
| Dated 8/17/23 with an interest rate of 3.75%, collateralized by USD 1,375,000 Republic of Ecuador, 0.00%, due 7/31/30 and a market value, including accrued interest, of $415,171(29) | USD | 428 | 427,969 |
| Dated 9/8/23 with an interest rate of 4.00%, collateralized by USD 323,000 Republic of Azerbaijan, 5.125%, due 9/1/29 and a market value, including accrued interest, of $299,825(29) | USD | 320 | 319,770 |
| Dated 9/8/23 with an interest rate of 4.95%, collateralized by USD 1,351,000 Republic of Armenia International Bond, 3.60%, due 2/2/31 and a market value, including accrued interest, of $1,011,132(29) | USD | 1,118 | 1,117,952 |
30
See Notes to Consolidated Financial Statements.
Global Macro Portfolio
October 31, 2023
Consolidated Portfolio of Investments — continued
| Description | Principal
Amount
(000's omitted) | Value |
| Barclays Bank PLC: (continued) | | | |
| Dated 9/11/23 with an interest rate of 4.00%, collateralized by USD 270,000 Republic of Azerbaijan, 5.125%, due 9/1/29 and a market value, including accrued interest, of $250,628(29) | USD | 266 | $ 266,288 |
| Dated 9/12/23 with an interest rate of 4.00%, collateralized by USD 809,000 Republic of Azerbaijan, 5.125%, due 9/1/29 and a market value, including accrued interest, of $750,955(29) | USD | 798 | 797,876 |
| Dated 9/20/23 with an interest rate of 2.50%, collateralized by EUR 2,794,000 Republic of Poland, 1.125%, due 8/7/26 and a market value, including accrued interest, of $2,759,768(29) | EUR | 2,731 | 2,889,815 |
| Dated 9/20/23 with an interest rate of 2.60%, collateralized by EUR 2,000,000 Republic of Poland, 2.75%, due 5/25/32 and a market value, including accrued interest, of $1,949,077(29) | EUR | 1,925 | 2,036,843 |
| Dated 9/20/23 with an interest rate of 2.75%, collateralized by EUR 1,200,000 Republic of Poland, 1.00%, due 3/7/29 and a market value, including accrued interest, of $1,124,830(29) | EUR | 1,109 | 1,172,904 |
| Dated 9/20/23 with an interest rate of 3.10%, collateralized by EUR 4,000,000 Republic of Poland, 1.00%, due 3/7/29 and a market value, including accrued interest, of $3,749,433(29) | EUR | 3,695 | 3,909,681 |
| Dated 10/11/23 with an interest rate of 0.00%, collateralized by USD 3,059,000 Pakistan Government International Bond, 8.25%, due 9/30/25 and a market value, including accrued interest, of $2,214,952(29) | USD | 1,858 | 1,858,342 |
| Dated 10/11/23 with an interest rate of 2.25%, collateralized by USD 1,600,000 Pakistan Government International Bond, 6.00%, due 4/8/26 and a market value, including accrued interest, of $890,133(29) | USD | 836 | 836,000 |
| Dated 10/11/23 with an interest rate of 2.50%, collateralized by USD 2,264,000 Pakistan Government International Bond, 6.875%, due 12/5/27 and a market value, including accrued interest, of $1,271,874(29) | USD | 1,191 | 1,191,430 |
| Dated 10/11/23 with an interest rate of 2.75%, collateralized by USD 5,547,000 Pakistan Government International Bond, 6.00%, due 4/8/26 and a market value, including accrued interest, of $3,085,981(29) | USD | 2,850 | 2,849,771 |
| Dated 10/11/23 with an interest rate of 5.00%, collateralized by USD 11,401,000 Republic of Colombia, 5.20%, due 5/15/49 and a market value, including accrued interest, of $7,606,715(29) | USD | 7,824 | 7,823,936 |
| Dated 10/11/23 with an interest rate of 5.05%, collateralized by USD 7,125,000 Republic of Colombia, 5.20%, due 5/15/49 and a market value, including accrued interest, of $4,753,780(29) | USD | 4,890 | 4,889,531 |
| Dated 10/11/23 with an interest rate of 5.15%, collateralized by MXN 117,587,117 Mexican Udibonos, 4.00%, due 11/3/50 and a market value, including accrued interest, of $5,704,162(29) | USD | 5,747 | 5,747,059 |
| Description | Principal
Amount
(000's omitted) | Value |
| Barclays Bank PLC: (continued) | | | |
| Dated 10/16/23 with an interest rate of 5.15%, collateralized by MXN 152,199,454 Mexican Udibonos, 4.00%, due 11/15/40 and a market value, including accrued interest, of $7,613,904(29) | USD | 7,758 | $ 7,758,243 |
| JPMorgan Chase Bank, N.A.: | | | |
| Dated 7/27/23 with an interest rate of 4.95%, collateralized by USD 3,176,000 Republic of Colombia, 5.20%, due 5/15/49 and a market value, including accrued interest, of $2,119,018(29) | USD | 2,333 | 2,332,913 |
| Dated 7/27/23 with an interest rate of 5.00%, collateralized by USD 3,187,000 Republic of Colombia, 5.20%, due 5/15/49 and a market value, including accrued interest, of $2,126,357(29) | USD | 2,341 | 2,340,993 |
| Dated 10/6/23 with an interest rate of 5.00%, collateralized by USD 2,683,000 Republic of Ecuador, 6.00%, due 7/31/30 and a market value, including accrued interest, of $1,411,367(29) | USD | 1,373 | 1,372,802 |
| Dated 10/13/23 with an interest rate of 5.00%, collateralized by USD 1,341,000 Republic of Ecuador, 6.00%, due 7/31/30 and a market value, including accrued interest, of $705,420(29) | USD | 686 | 686,369 |
| Nomura International PLC: | | | |
| Dated 9/5/23 with an interest rate of 4.85%, collateralized by USD 1,349,000 Republic of Azerbaijan, 3.50%, due 9/1/32 and a market value, including accrued interest, of $1,065,188(29) | USD | 1,183 | 1,182,877 |
| Dated 9/6/23 with an interest rate of 4.85%, collateralized by USD 1,889,000 Republic of Azerbaijan, 3.50%, due 9/1/32 and a market value, including accrued interest, of $1,491,580(29) | USD | 1,655 | 1,655,387 |
| Dated 9/11/23 with an interest rate of 4.85%, collateralized by USD 1,348,000 Republic of Azerbaijan, 3.50%, due 9/1/32 and a market value, including accrued interest, of $1,064,399(29) | USD | 1,171 | 1,170,819 |
| Dated 9/13/23 with an interest rate of 4.85%, collateralized by USD 521,000 Republic of Azerbaijan, 3.50%, due 9/1/32 and a market value, including accrued interest, of $411,389(29) | USD | 448 | 448,089 |
| Dated 9/27/23 with an interest rate of 4.75%, collateralized by USD 1,621,000 Republic of Armenia International Bond, 3.60%, due 2/2/31 and a market value, including accrued interest, of $1,213,208(29) | USD | 1,295 | 1,295,430 |
| Dated 10/11/23 with an interest rate of 3.25%, collateralized by USD 3,066,000 Pakistan Government International Bond, 6.00%, due 4/8/26 and a market value, including accrued interest, of $1,705,718(29) | USD | 1,744 | 1,743,558 |
| Dated 10/11/23 with an interest rate of 3.40%, collateralized by EUR 1,956,000 Republic of Poland, 1.00%, due 3/7/29 and a market value, including accrued interest, of $1,833,473(29) | USD | 1,912 | 1,911,585 |
31
See Notes to Consolidated Financial Statements.
Global Macro Portfolio
October 31, 2023
Consolidated Portfolio of Investments — continued
| Description | Principal
Amount
(000's omitted) | Value |
| Nomura International PLC: (continued) | | | |
| Dated 10/11/23 with an interest rate of 4.90%, collateralized by USD 3,176,000 Republic of Colombia, 5.20%, due 5/15/49 and a market value, including accrued interest, of $2,119,018(29) | USD | 2,196 | $ 2,195,632 |
| Dated 10/11/23 with an interest rate of 5.05%, collateralized by USD 3,125,000 Republic of Colombia, 5.20%, due 5/15/49 and a market value, including accrued interest, of $2,084,991 | USD | 2,160 | 2,160,375 |
| Dated 10/11/23 with an interest rate of 5.05%, collateralized by USD 3,174,000 Republic of Colombia, 5.625%, due 2/26/44 and a market value, including accrued interest, of $2,264,223(29) | USD | 2,389 | 2,388,873 |
| Dated 10/11/23 with an interest rate of 5.05%, collateralized by USD 3,175,000 Republic of Colombia, 5.00%, due 6/15/45 and a market value, including accrued interest, of $2,104,956(29) | USD | 2,219 | 2,219,423 |
Total Repurchase Agreements
(identified cost $87,827,345) | | | $ 87,754,032 |
| Sovereign Government Securities — 4.8% |
| Security | Principal
Amount
(000's omitted) | Value |
| Albania — 0.0%(6) |
| Albania Treasury Bill, 0.00%, 1/18/24 | ALL | 11,000 | $ 109,696 |
| | | | $ 109,696 |
| Brazil — 4.5% |
| Letra do Tesouro Nacional, 0.00%, 1/1/24 | BRL | 411,800 | $ 80,166,670 |
| | | | $ 80,166,670 |
| Sri Lanka — 0.3% |
| Sri Lanka Treasury Bills: | | | |
| 0.00%, 11/17/23 | LKR | 171,000 | $ 518,819 |
| 0.00%, 11/24/23 | LKR | 85,000 | 257,147 |
| 0.00%, 12/8/23 | LKR | 198,000 | 595,486 |
| 0.00%, 1/5/24 | LKR | 435,000 | 1,292,432 |
| 0.00%, 1/12/24 | LKR | 758,000 | 2,245,067 |
| 0.00%, 3/15/24 | LKR | 100,000 | 288,860 |
| 0.00%, 4/19/24 | LKR | 286,000 | 816,285 |
| | | | $ 6,014,096 |
Total Sovereign Government Securities
(identified cost $88,542,457) | | | $ 86,290,462 |
| U.S. Treasury Obligations — 10.8% |
| Security | Principal
Amount
(000's omitted) | Value |
| U.S. Treasury Bills: | | | |
| 0.00%, 11/30/23(30) | $ | 135,000 | $ 134,425,364 |
| 0.00%, 12/12/23(30) | | 30,000 | 29,819,429 |
| 0.00%, 1/9/24 | | 30,000 | 29,696,544 |
Total U.S. Treasury Obligations
(identified cost $193,937,891) | | | $193,941,337 |
Total Short-Term Investments
(identified cost $654,206,184) | | | $651,884,322 |
| | | |
Total Purchased Options — 0.0%(6)
(identified cost $409,827) | | | $ 332,156 |
Total Investments — 98.7%
(identified cost $1,869,244,323) | | | $1,768,736,982 |
Total Written Options — (0.0)%(6)
(premiums received $145,736) | | | $ (87,249) |
| Securities Sold Short — (5.1)% |
| Common Stocks — (0.7)% |
| Security | Shares | Value |
| New Zealand — (0.7)% |
| a2 Milk Co., Ltd. (The)(7) | | (219,100) | $ (533,670) |
| Air New Zealand, Ltd. | | (436,600) | (170,397) |
| Auckland International Airport, Ltd. | | (315,857) | (1,351,006) |
| Chorus, Ltd. | | (86,192) | (360,523) |
| Contact Energy, Ltd. | | (204,200) | (927,571) |
| EBOS Group, Ltd. | | (13,100) | (267,426) |
| Fisher & Paykel Healthcare Corp., Ltd. | | (123,800) | (1,501,644) |
| Fletcher Building, Ltd. | | (235,800) | (594,265) |
| Freightways Group, Ltd. | | (17,382) | (75,486) |
| Goodman Property Trust | | (210,200) | (246,194) |
| Infratil, Ltd. | | (200,700) | (1,149,214) |
| Kiwi Property Group, Ltd. | | (236,899) | (107,009) |
| Mainfreight, Ltd. | | (21,500) | (717,631) |
| Mercury NZ, Ltd. | | (156,285) | (537,611) |
| Meridian Energy, Ltd. | | (323,600) | (911,374) |
| Precinct Properties New Zealand, Ltd. | | (369,107) | (238,934) |
| Ryman Healthcare, Ltd. | | (139,400) | (462,154) |
| SKYCITY Entertainment Group, Ltd. | | (133,500) | (145,514) |
32
See Notes to Consolidated Financial Statements.
Global Macro Portfolio
October 31, 2023
Consolidated Portfolio of Investments — continued
| Security | Shares | Value |
| New Zealand (continued) |
| Spark New Zealand, Ltd. | | (502,600) | $ (1,459,107) |
| Summerset Group Holdings, Ltd. | | (35,300) | (200,469) |
Total Common Stocks
(proceeds $14,187,272) | | | $(11,957,199) |
| Sovereign Government Bonds — (4.4)% |
| Security | Principal
Amount
(000's omitted) | Value |
| Armenia — (0.1)% |
| Republic of Armenia International Bond, 3.60%, 2/2/31(8) | USD | (2,972) | $ (2,197,889) |
| | | | $ (2,197,889) |
| Azerbaijan — (0.3)% |
| Republic of Azerbaijan: | | | |
| 3.50%, 9/1/32(8) | USD | (5,107) | $ (4,002,765) |
| 5.125%, 9/1/29(8) | USD | (1,402) | (1,289,433) |
| | | | $ (5,292,198) |
| Colombia — (1.9)% |
| Republic of Colombia: | | | |
| 5.00%, 6/15/45 | USD | (3,175) | $ (2,044,984) |
| 5.20%, 5/15/49 | USD | (42,853) | (27,563,882) |
| 5.625%, 2/26/44 | USD | (3,174) | (2,231,987) |
| 6.125%, 1/18/41 | USD | (3,176) | (2,439,061) |
| | | | $(34,279,914) |
| Ecuador — (0.4)% |
| Republic of Ecuador: | | | |
| 0.00%, 7/31/30(8) | USD | (15,300) | $ (4,619,719) |
| 6.00% to 7/31/24, 7/31/30(8)(19) | USD | (3,381) | (1,727,265) |
| | | | $ (6,346,984) |
| Mexico — (0.7)% |
| Mexican Udibonos: | | | |
| 4.00%, 11/15/40(20) | MXN | (152,199) | $ (7,476,953) |
| 4.00%, 11/3/50(20) | MXN | (117,587) | (5,598,355) |
| | | | $(13,075,308) |
| Pakistan — (0.5)% |
| Pakistan Government International Bond: | | | |
| 6.00%, 4/8/26(8) | USD | (10,968) | $ (6,059,820) |
| Security | Principal
Amount
(000's omitted) | Value |
| Pakistan (continued) |
| Pakistan Government International Bond: (continued) | | | |
| 6.875%, 12/5/27(8) | USD | (2,264) | $ (1,208,750) |
| 8.25%, 9/30/25(8) | USD | (3,059) | (2,193,220) |
| | | | $ (9,461,790) |
| Poland — (0.5)% |
| Republic of Poland: | | | |
| 1.00%, 3/7/29(8) | EUR | (7,156) | $ (6,658,156) |
| 2.75%, 5/25/32(8) | EUR | (2,000) | (1,923,567) |
| | | | $ (8,581,723) |
Total Sovereign Government Bonds
(proceeds $82,139,399) | | | $(79,235,806) |
Total Securities Sold Short
(proceeds $96,326,671) | | | $(91,193,005) |
| | | |
| Other Assets, Less Liabilities — 6.4% | | | $ 114,679,723 |
| Net Assets — 100.0% | | | $1,792,136,451 |
| The percentage shown for each investment category in the Consolidated Portfolio of Investments is based on net assets. |
| (1) | Interest only security that entitles the holder to receive only interest payments on the underlying mortgages. Principal amount shown is the notional amount of the underlying mortgages on which coupon interest is calculated. |
| (2) | Security exempt from registration under Rule 144A of the Securities Act of 1933, as amended. These securities may be sold in certain transactions in reliance on an exemption from registration (normally to qualified institutional buyers). At October 31, 2023, the aggregate value of these securities is $92,669,818 or 5.2% of the Portfolio's net assets. |
| (3) | Variable rate security. The stated interest rate represents the rate in effect at October 31, 2023. |
| (4) | Weighted average fixed-rate coupon that changes/updates monthly. Rate shown is the rate at October 31, 2023. |
| (5) | Inverse floating-rate security whose coupon varies inversely with changes in the interest rate index. The stated interest rate represents the coupon rate in effect at October 31, 2023. |
| (6) | Amount is less than 0.05% or (0.05)%, as applicable. |
| (7) | Non-income producing security. |
| (8) | Security exempt from registration under Regulation S of the Securities Act of 1933, as amended, which exempts from registration securities offered and sold outside the United States. Security may not be offered or sold in the United States except pursuant to an exemption from, or in a transaction not subject to, the registration requirements of the Securities Act of 1933, as amended. At October 31, 2023, the aggregate value of these securities is $329,364,193 or 18.4% of the Portfolio's net assets. |
33
See Notes to Consolidated Financial Statements.
Global Macro Portfolio
October 31, 2023
Consolidated Portfolio of Investments — continued
| (9) | For fair value measurement disclosure purposes, security is categorized as Level 3 (see Note 10). |
| (10) | Issuer is in default with respect to interest and/or principal payments or has declared bankruptcy. For a variable rate security, interest rate has been adjusted to reflect non-accrual status. |
| (11) | Security converts to variable rate after the indicated fixed-rate coupon period. |
| (12) | Perpetual security with no stated maturity date but may be subject to calls by the issuer. |
| (13) | Limited recourse note whose payments by the issuer are limited to amounts received by the issuer from the borrower pursuant to a loan agreement with the borrower. |
| (14) | Quantity held represents principal in USD. |
| (15) | Security is subject to risk of loss depending on the occurrence, frequency and severity of the loss events that are covered by underlying reinsurance contracts and that may occur during a specified risk period. |
| (16) | Restricted security (see Note 5). |
| (17) | Senior floating-rate loans (Senior Loans) often require prepayments from excess cash flows or permit the borrowers to repay at their election. The degree to which borrowers repay, whether as a contractual requirement or at their election, cannot be predicted with accuracy. As a result, the actual remaining maturity may be substantially less than the stated maturities shown. However, Senior Loans will typically have an expected average life of approximately two to four years. Senior Loans typically have rates of interest which are redetermined periodically by reference to a base lending rate, plus a spread. These base lending rates are primarily the Secured Overnight Financing Rate (“SOFR”) (or the London Interbank Offered Rate (“LIBOR”) for those loans whose rates reset prior to the discontinuance of LIBOR on June 30, 2023) and secondarily, the prime rate offered by one or more major United States banks (the “Prime Rate”). Base lending rates may be subject to a floor, or minimum rate. Rates for SOFR are generally 1 or 3-month tenors and may also be subject to a credit spread adjustment. Senior Loans are generally subject to contractual restrictions that must be satisfied before they can be bought or sold. |
| (18) | Fixed-rate loan. |
| (19) | Step coupon security. Interest rate represents the rate in effect at October 31, 2023. |
| (20) | Inflation-linked security whose principal is adjusted for inflation based on changes in a designated inflation index or inflation rate for the applicable country. Interest is calculated based on the inflation-adjusted principal. |
| (21) | Loan is subject to scheduled mandatory prepayments. Maturity date shown reflects the final maturity date. |
| (22) | Adjustable rate mortgage security whose interest rate generally adjusts monthly based on a weighted average of interest rates on the underlying mortgages. The coupon rate may not reflect the applicable index value as interest rates on the underlying mortgages may adjust on various dates and at various intervals and may be subject to lifetime ceilings and lifetime floors and lookback periods. Rate shown is the coupon rate at October 31, 2023. |
| (23) | Principal amount is less than $500. |
| (24) | Interest only security that entitles the holder to receive only a portion of the interest payments on the underlying loans. Principal amount shown is the notional amount of the underlying loans on which coupon interest is calculated. |
| (25) | Securities comprise a trust that is wholly-owned by the Portfolio and may only be sold on a pro rata basis with all securities in the trust. |
| (26) | The stated interest rate represents the weighted average fixed interest rate at October 31, 2023 of all interest only securities comprising the certificate. |
| (27) | Inflation-linked security whose principal is adjusted for inflation based on changes in the U.S. Consumer Price Index. Interest is calculated based on the inflation-adjusted principal. |
| (28) | May be deemed to be an affiliated investment company. The rate shown is the annualized seven-day yield as of October 31, 2023. |
| (29) | Open repurchase agreement with no specific maturity date. Either party may terminate the agreement upon demand. |
| (30) | Security (or a portion thereof) has been pledged to cover collateral requirements on open derivative contracts. |
| Purchased Currency Options (OTC) — 0.0%(1) |
| Description | Counterparty | Notional Amount | Exercise
Price | Expiration
Date | Value |
| Call USD vs. Put CNH | Barclays Bank PLC | USD | 13,900,000 | CNH | 7.30 | 1/18/24 | $121,180 |
| Call USD vs. Put CNH | Goldman Sachs International | USD | 24,200,000 | CNH | 7.30 | 1/18/24 | 210,976 |
| Total | | | | | | | $332,156 |
| (1) | Amount is less than 0.05%. |
34
See Notes to Consolidated Financial Statements.
Global Macro Portfolio
October 31, 2023
Consolidated Portfolio of Investments — continued
| Written Currency Options (OTC) — (0.0)%(1) |
| Description | Counterparty | Notional Amount | Exercise
Price | Expiration
Date | Value |
| Call USD vs. Put CNH | Barclays Bank PLC | USD | 13,900,000 | CNH | 7.50 | 1/18/24 | $(31,831) |
| Call USD vs. Put CNH | Goldman Sachs International | USD | 24,200,000 | CNH | 7.50 | 1/18/24 | (55,418) |
| Total | | | | | | | $(87,249) |
| (1) | Amount is less than (0.05)%. |
| Forward Foreign Currency Exchange Contracts (Centrally Cleared) |
| Currency Purchased | Currency Sold | Settlement
Date | Value/Unrealized
Appreciation
(Depreciation) |
| CLP | 2,096,089,000 | USD | 2,246,612 | 12/20/23 | $ 88,787 |
| CLP | 1,510,694,000 | USD | 1,607,549 | 12/20/23 | 75,621 |
| CLP | 1,395,882,000 | USD | 1,493,721 | 12/20/23 | 61,529 |
| CLP | 720,603,707 | USD | 767,609 | 12/20/23 | 35,266 |
| CLP | 785,561,000 | USD | 847,688 | 12/20/23 | 27,560 |
| CLP | 701,718,000 | USD | 757,034 | 12/20/23 | 24,798 |
| CLP | 604,278,000 | USD | 651,892 | 12/20/23 | 21,376 |
| CLP | 283,509,280 | USD | 306,755 | 12/20/23 | 9,122 |
| CLP | 574,431,000 | USD | 640,927 | 12/20/23 | (914) |
| CLP | 574,431,000 | USD | 641,299 | 12/20/23 | (1,286) |
| CLP | 1,148,861,000 | USD | 1,281,496 | 12/20/23 | (1,470) |
| CLP | 574,431,000 | USD | 641,643 | 12/20/23 | (1,629) |
| CLP | 574,431,000 | USD | 641,643 | 12/20/23 | (1,629) |
| CLP | 574,431,000 | USD | 642,900 | 12/20/23 | (2,886) |
| COP | 3,378,000,000 | USD | 816,419 | 12/20/23 | (4,436) |
| COP | 29,400,000,000 | USD | 7,105,603 | 12/20/23 | (38,611) |
| EUR | 507,712 | USD | 535,795 | 12/20/23 | 2,613 |
| EUR | 1,941,857 | USD | 2,079,379 | 12/20/23 | (20,120) |
| IDR | 32,124,378,520 | USD | 2,043,363 | 12/20/23 | (28,249) |
| IDR | 226,938,081,331 | USD | 14,432,868 | 12/20/23 | (197,378) |
| KRW | 3,376,000,000 | USD | 2,546,656 | 12/20/23 | (44,690) |
| KRW | 4,101,340,473 | USD | 3,095,001 | 12/20/23 | (55,482) |
| PEN | 13,584,000 | USD | 3,497,695 | 12/20/23 | 31,631 |
| PEN | 8,000,000 | USD | 2,061,540 | 12/20/23 | 16,979 |
| PEN | 5,900,000 | USD | 1,526,955 | 12/20/23 | 5,954 |
| USD | 13,477,177 | CLP | 12,119,350,987 | 12/20/23 | (25,837) |
| USD | 5,021,776 | COP | 20,778,000,000 | 12/20/23 | 27,288 |
| USD | 405,939 | COP | 1,680,980,000 | 12/20/23 | 1,875 |
| USD | 407,481 | COP | 1,697,020,000 | 12/20/23 | (438) |
| USD | 46,354,579 | EUR | 43,288,862 | 12/20/23 | 448,531 |
| USD | 35,446,421 | EUR | 33,102,128 | 12/20/23 | 342,983 |
| USD | 32,461,736 | EUR | 30,314,839 | 12/20/23 | 314,103 |
| USD | 25,920,907 | EUR | 24,206,596 | 12/20/23 | 250,813 |
35
See Notes to Consolidated Financial Statements.
Global Macro Portfolio
October 31, 2023
Consolidated Portfolio of Investments — continued
| Forward Foreign Currency Exchange Contracts (Centrally Cleared) (continued) |
| Currency Purchased | Currency Sold | Settlement
Date | Value/Unrealized
Appreciation
(Depreciation) |
| USD | 19,838,470 | EUR | 18,526,428 | 12/20/23 | $ 191,959 |
| USD | 16,783,023 | EUR | 15,673,057 | 12/20/23 | 162,394 |
| USD | 16,668,830 | EUR | 15,566,416 | 12/20/23 | 161,289 |
| USD | 16,331,238 | EUR | 15,251,151 | 12/20/23 | 158,023 |
| USD | 11,563,411 | EUR | 10,798,651 | 12/20/23 | 111,889 |
| USD | 10,349,071 | EUR | 9,664,623 | 12/20/23 | 100,139 |
| USD | 8,459,605 | EUR | 7,900,119 | 12/20/23 | 81,856 |
| USD | 8,356,320 | EUR | 7,803,664 | 12/20/23 | 80,856 |
| USD | 7,267,390 | EUR | 6,786,752 | 12/20/23 | 70,320 |
| USD | 3,801,037 | EUR | 3,549,651 | 12/20/23 | 36,779 |
| USD | 3,244,473 | EUR | 3,029,896 | 12/20/23 | 31,394 |
| USD | 1,659,771 | EUR | 1,550,000 | 12/20/23 | 16,060 |
| USD | 293,655 | EUR | 274,234 | 12/20/23 | 2,841 |
| USD | 236,413 | EUR | 220,778 | 12/20/23 | 2,288 |
| USD | 1,192,954 | EUR | 1,130,427 | 12/20/23 | (5,817) |
| USD | 3,127,873 | EUR | 2,963,929 | 12/20/23 | (15,251) |
| USD | 8,193,609 | EUR | 7,764,151 | 12/20/23 | (39,952) |
| USD | 34,864,599 | IDR | 548,200,499,631 | 12/20/23 | 476,793 |
| USD | 6,844,411 | IDR | 105,291,000,000 | 12/20/23 | 239,663 |
| USD | 4,414,128 | IDR | 67,814,253,839 | 12/20/23 | 160,241 |
| USD | 3,421,237 | IDR | 52,646,000,000 | 12/20/23 | 118,832 |
| USD | 3,420,950 | IDR | 52,645,000,000 | 12/20/23 | 118,607 |
| USD | 5,146,347 | IDR | 80,919,616,677 | 12/20/23 | 70,379 |
| USD | 346,085 | IDR | 5,324,000,000 | 12/20/23 | 12,118 |
| USD | 271,460 | IDR | 4,176,000,000 | 12/20/23 | 9,505 |
| USD | 223,155 | IDR | 3,428,337,192 | 12/20/23 | 8,101 |
| USD | 175,091 | IDR | 2,689,917,198 | 12/20/23 | 6,356 |
| USD | 172,992 | IDR | 2,662,000,000 | 12/20/23 | 6,009 |
| USD | 172,981 | IDR | 2,662,000,000 | 12/20/23 | 5,997 |
| USD | 135,690 | IDR | 2,088,000,000 | 12/20/23 | 4,713 |
| USD | 135,681 | IDR | 2,088,000,000 | 12/20/23 | 4,704 |
| USD | 1,441,101 | INR | 119,700,000 | 12/20/23 | 5,757 |
| USD | 2,023,467 | INR | 169,000,000 | 12/20/23 | (3,041) |
| USD | 3,399,569 | INR | 284,000,000 | 12/20/23 | (5,925) |
| USD | 5,095,610 | INR | 425,700,000 | 12/20/23 | (9,034) |
| USD | 6,800,766 | INR | 568,000,000 | 12/20/23 | (10,222) |
| USD | 8,739,375 | INR | 730,000,000 | 12/20/23 | (14,184) |
| USD | 26,633,810 | PEN | 99,163,000 | 12/20/23 | 869,780 |
| USD | 15,678,155 | PEN | 58,456,000 | 12/20/23 | 490,412 |
| USD | 2,832,488 | PEN | 10,535,722 | 12/20/23 | 95,150 |
| USD | 735,658 | PEN | 2,739,000 | 12/20/23 | 24,024 |
| USD | 3,732,438 | PEN | 14,283,000 | 12/20/23 | 21,501 |
| USD | 3,627,356 | PEN | 13,912,000 | 12/20/23 | 12,811 |
| USD | 3,548,127 | PEN | 13,639,000 | 12/20/23 | 4,511 |
36
See Notes to Consolidated Financial Statements.
Global Macro Portfolio
October 31, 2023
Consolidated Portfolio of Investments — continued
| Forward Foreign Currency Exchange Contracts (Centrally Cleared) (continued) |
| Currency Purchased | Currency Sold | Settlement
Date | Value/Unrealized
Appreciation
(Depreciation) |
| USD | 5,003,929 | PHP | 284,000,000 | 12/20/23 | $ 2,966 |
| USD | 2,255,292 | PHP | 128,000,000 | 12/20/23 | 1,337 |
| USD | 5,847,078 | PHP | 332,000,000 | 12/20/23 | 881 |
| USD | 2,624,140 | PHP | 149,000,000 | 12/20/23 | 396 |
| USD | 2,781,984 | PHP | 158,000,000 | 12/20/23 | (242) |
| USD | 6,180,230 | PHP | 351,000,000 | 12/20/23 | (538) |
| USD | 4,505,535 | PHP | 256,000,000 | 12/20/23 | (2,375) |
| USD | 10,021,368 | PHP | 569,404,095 | 12/20/23 | (5,283) |
| USD | 2,246,974 | PHP | 128,000,000 | 12/20/23 | (6,981) |
| USD | 2,650,267 | PHP | 151,000,000 | 12/20/23 | (8,696) |
| USD | 5,003,028 | PHP | 285,000,000 | 12/20/23 | (15,544) |
| USD | 5,879,731 | PHP | 335,000,000 | 12/20/23 | (19,293) |
| | | | | | $5,179,027 |
| Forward Foreign Currency Exchange Contracts (OTC) |
| Currency Purchased | Currency Sold | Counterparty | Settlement
Date | Unrealized
Appreciation | Unrealized
(Depreciation) |
| EUR | 7,693,405 | USD | 8,104,161 | Citibank, N.A. | 11/3/23 | $ 36,554 | $ — |
| EUR | 717,469 | USD | 756,451 | HSBC Bank USA, N.A. | 11/3/23 | 2,734 | — |
| USD | 987,203 | EUR | 932,241 | Citibank, N.A. | 11/3/23 | 760 | — |
| USD | 889,539 | EUR | 840,382 | Goldman Sachs International | 11/3/23 | 296 | — |
| USD | 982,088 | EUR | 932,241 | Goldman Sachs International | 11/3/23 | — | (4,355) |
| USD | 1,825,322 | EUR | 1,732,276 | Standard Chartered Bank | 11/3/23 | — | (7,672) |
| USD | 1,320,136 | EUR | 1,243,000 | UBS AG | 11/3/23 | 4,865 | — |
| USD | 1,265,101 | EUR | 1,194,089 | UBS AG | 11/3/23 | 1,586 | — |
| USD | 984,575 | EUR | 930,022 | UBS AG | 11/3/23 | 480 | — |
| USD | 2,532,660 | GBP | 2,086,630 | Citibank, N.A. | 11/3/23 | — | (3,547) |
| ILS | 16,172,159 | USD | 4,372,358 | Bank of America, N.A. | 11/13/23 | — | (369,707) |
| USD | 3,876,134 | ILS | 15,258,788 | Citibank, N.A. | 11/13/23 | 99,544 | — |
| USD | 231,366 | ILS | 913,371 | HSBC Bank USA, N.A. | 11/13/23 | 5,304 | — |
| USD | 9,202,097 | PEN | 35,271,000 | Standard Chartered Bank | 11/13/23 | 24,768 | — |
| USD | 1,301,599 | PKR | 402,194,124 | Standard Chartered Bank | 11/22/23 | — | (127,053) |
| ILS | 33,015,949 | USD | 8,734,378 | HSBC Bank USA, N.A. | 11/24/23 | — | (559,070) |
| USD | 4,165,827 | ILS | 16,399,195 | Standard Chartered Bank | 11/24/23 | 105,109 | — |
| USD | 4,209,011 | ILS | 16,616,754 | UBS AG | 11/24/23 | 94,421 | — |
| USD | 812,102 | PKR | 255,000,000 | Deutsche Bank AG | 11/24/23 | — | (93,682) |
| USD | 811,912 | PKR | 259,000,000 | JPMorgan Chase Bank, N.A. | 11/27/23 | — | (108,059) |
| USD | 771,429 | PKR | 243,000,000 | Standard Chartered Bank | 11/27/23 | — | (91,711) |
| USD | 750,759 | PKR | 240,805,876 | Standard Chartered Bank | 11/27/23 | — | (104,587) |
| UZS | 9,849,953,397 | USD | 836,159 | ICBC Standard Bank plc | 11/27/23 | — | (32,923) |
| ILS | 5,750,101 | USD | 1,529,482 | BNP Paribas | 11/28/23 | — | (105,420) |
| ILS | 18,277,235 | USD | 4,806,339 | BNP Paribas | 11/28/23 | — | (279,826) |
37
See Notes to Consolidated Financial Statements.
Global Macro Portfolio
October 31, 2023
Consolidated Portfolio of Investments — continued
| Forward Foreign Currency Exchange Contracts (OTC) (continued) |
| Currency Purchased | Currency Sold | Counterparty | Settlement
Date | Unrealized
Appreciation | Unrealized
(Depreciation) |
| USD | 2,222,787 | ILS | 8,768,548 | Citibank, N.A. | 11/28/23 | $ 51,182 | $ — |
| USD | 3,871,119 | ILS | 15,258,789 | JPMorgan Chase Bank, N.A. | 11/28/23 | 92,149 | — |
| TRY | 67,603,000 | USD | 2,348,120 | Standard Chartered Bank | 12/8/23 | — | (28,178) |
| USD | 1,227,316 | EUR | 1,159,000 | BNP Paribas | 12/8/23 | — | (884) |
| USD | 1,226,550 | EUR | 1,159,000 | Citibank, N.A. | 12/8/23 | — | (1,649) |
| USD | 3,814,870 | EUR | 3,606,000 | Citibank, N.A. | 12/8/23 | — | (6,430) |
| USD | 2,725,855 | EUR | 2,576,000 | HSBC Bank USA, N.A. | 12/8/23 | — | (3,948) |
| USD | 29,516 | EUR | 27,802 | UBS AG | 12/8/23 | 54 | — |
| USD | 2,356,307 | TRY | 67,603,000 | Standard Chartered Bank | 12/8/23 | 36,366 | — |
| UZS | 20,903,976,000 | USD | 1,672,318 | ICBC Standard Bank plc | 12/18/23 | — | (27,423) |
| AUD | 15,000,000 | USD | 9,586,542 | BNP Paribas | 12/20/23 | — | (55,969) |
| AUD | 15,000,000 | USD | 9,685,185 | Citibank, N.A. | 12/20/23 | — | (154,612) |
| AUD | 23,000,000 | USD | 14,856,850 | Citibank, N.A. | 12/20/23 | — | (243,304) |
| AUD | 14,181,049 | USD | 9,163,727 | Standard Chartered Bank | 12/20/23 | — | (153,492) |
| CAD | 37,250,000 | USD | 27,246,312 | Standard Chartered Bank | 12/20/23 | — | (362,029) |
| CZK | 16,716,882 | EUR | 678,850 | Goldman Sachs International | 12/20/23 | — | (698) |
| CZK | 86,153,734 | EUR | 3,503,723 | Goldman Sachs International | 12/20/23 | — | (9,041) |
| CZK | 16,716,882 | EUR | 679,528 | UBS AG | 12/20/23 | — | (1,417) |
| CZK | 82,552,502 | EUR | 3,354,702 | UBS AG | 12/20/23 | — | (5,943) |
| EUR | 1,152,552 | CZK | 28,552,864 | Bank of America, N.A. | 12/20/23 | — | (6,170) |
| EUR | 453,382 | CZK | 11,228,557 | Citibank, N.A. | 12/20/23 | — | (2,283) |
| EUR | 2,881,799 | CZK | 71,382,160 | Citibank, N.A. | 12/20/23 | — | (14,979) |
| EUR | 2,519,141 | CZK | 62,423,555 | Standard Chartered Bank | 12/20/23 | — | (14,146) |
| EUR | 1,152,937 | CZK | 28,552,864 | UBS AG | 12/20/23 | — | (5,761) |
| EUR | 2,242,353 | HUF | 879,015,985 | BNP Paribas | 12/20/23 | — | (36,962) |
| EUR | 559,471 | HUF | 219,409,283 | Goldman Sachs International | 12/20/23 | — | (9,478) |
| EUR | 793,377 | HUF | 310,240,935 | Goldman Sachs International | 12/20/23 | — | (10,969) |
| EUR | 1,968,291 | HUF | 769,365,592 | Goldman Sachs International | 12/20/23 | — | (26,355) |
| EUR | 559,490 | HUF | 219,409,283 | HSBC Bank USA, N.A. | 12/20/23 | — | (9,458) |
| EUR | 793,234 | HUF | 310,240,935 | Standard Chartered Bank | 12/20/23 | — | (11,121) |
| EUR | 1,983,412 | HUF | 775,602,339 | Standard Chartered Bank | 12/20/23 | — | (27,454) |
| EUR | 2,241,016 | HUF | 879,015,985 | UBS AG | 12/20/23 | — | (38,380) |
| EUR | 1,272,679 | PLN | 5,947,266 | BNP Paribas | 12/20/23 | — | (60,298) |
| EUR | 312,539 | PLN | 1,460,324 | Goldman Sachs International | 12/20/23 | — | (14,765) |
| EUR | 312,812 | PLN | 1,460,324 | UBS AG | 12/20/23 | — | (14,475) |
| EUR | 1,249,929 | PLN | 5,841,295 | UBS AG | 12/20/23 | — | (59,301) |
| HUF | 2,023,645,459 | EUR | 5,162,282 | BNP Paribas | 12/20/23 | 85,092 | — |
| HUF | 1,852,360,459 | EUR | 4,738,949 | Goldman Sachs International | 12/20/23 | 63,455 | — |
| HUF | 745,069,464 | EUR | 1,905,360 | Goldman Sachs International | 12/20/23 | 26,343 | — |
| HUF | 506,452,446 | EUR | 1,291,402 | Goldman Sachs International | 12/20/23 | 21,878 | — |
| HUF | 506,452,446 | EUR | 1,291,446 | HSBC Bank USA, N.A. | 12/20/23 | 21,831 | — |
| HUF | 1,839,677,690 | EUR | 4,704,523 | Standard Chartered Bank | 12/20/23 | 65,120 | — |
| HUF | 745,069,465 | EUR | 1,905,016 | Standard Chartered Bank | 12/20/23 | 26,708 | — |
| HUF | 2,023,645,459 | EUR | 5,159,202 | UBS AG | 12/20/23 | 88,358 | — |
| ILS | 19,130,546 | USD | 5,038,186 | BNP Paribas | 12/20/23 | — | (292,533) |
38
See Notes to Consolidated Financial Statements.
Global Macro Portfolio
October 31, 2023
Consolidated Portfolio of Investments — continued
| Forward Foreign Currency Exchange Contracts (OTC) (continued) |
| Currency Purchased | Currency Sold | Counterparty | Settlement
Date | Unrealized
Appreciation | Unrealized
(Depreciation) |
| JPY | 2,066,966,653 | USD | 14,365,641 | Citibank, N.A. | 12/20/23 | $ — | $ (620,780) |
| JPY | 695,000,000 | USD | 4,826,513 | UBS AG | 12/20/23 | — | (204,920) |
| MXN | 95,551,375 | USD | 5,427,788 | BNP Paribas | 12/20/23 | — | (168,846) |
| MXN | 169,704,000 | USD | 9,781,210 | Citibank, N.A. | 12/20/23 | — | (441,068) |
| MXN | 44,616,000 | USD | 2,447,172 | Goldman Sachs International | 12/20/23 | 8,396 | — |
| MXN | 60,802,000 | USD | 3,339,331 | Goldman Sachs International | 12/20/23 | 7,080 | — |
| MXN | 44,616,000 | USD | 2,453,588 | Goldman Sachs International | 12/20/23 | 1,981 | — |
| MXN | 44,616,000 | USD | 2,453,797 | Goldman Sachs International | 12/20/23 | 1,771 | — |
| MXN | 9,796,434 | USD | 563,427 | Goldman Sachs International | 12/20/23 | — | (24,253) |
| MXN | 16,278,591 | USD | 937,026 | JPMorgan Chase Bank, N.A. | 12/20/23 | — | (41,088) |
| MXN | 133,850,000 | USD | 7,347,912 | Standard Chartered Bank | 12/20/23 | 18,904 | — |
| MXN | 198,220,000 | USD | 11,429,725 | Standard Chartered Bank | 12/20/23 | — | (520,123) |
| MXN | 201,016,000 | USD | 11,544,496 | UBS AG | 12/20/23 | — | (481,009) |
| NZD | 374,830 | USD | 221,936 | Citibank, N.A. | 12/20/23 | — | (3,526) |
| NZD | 14,585,851 | USD | 8,636,253 | Citibank, N.A. | 12/20/23 | — | (137,191) |
| NZD | 1,049,192 | USD | 620,148 | UBS AG | 12/20/23 | — | (8,792) |
| NZD | 7,331,398 | USD | 4,330,957 | UBS AG | 12/20/23 | — | (59,009) |
| USD | 4,383,100 | CNH | 32,000,000 | Citibank, N.A. | 12/20/23 | 10,055 | — |
| USD | 6,178,605 | CNH | 45,000,000 | Goldman Sachs International | 12/20/23 | 29,010 | — |
| USD | 5,519,416 | CNH | 40,307,000 | Goldman Sachs International | 12/20/23 | 11,155 | — |
| USD | 39,297,390 | CNH | 286,163,200 | JPMorgan Chase Bank, N.A. | 12/20/23 | 190,995 | — |
| USD | 4,007,750 | ILS | 15,641,807 | BNP Paribas | 12/20/23 | 127,537 | — |
| USD | 885,727 | ILS | 3,488,739 | HSBC Bank USA, N.A. | 12/20/23 | 20,287 | — |
| USD | 5,187,467 | JPY | 777,341,125 | HSBC Bank USA, N.A. | 12/20/23 | 18,324 | — |
| USD | 4,969,796 | JPY | 744,658,875 | HSBC Bank USA, N.A. | 12/20/23 | 17,983 | — |
| USD | 1,726,615 | MXN | 31,307,000 | State Street Bank and Trust Company | 12/20/23 | 3,545 | — |
| USD | 1,672,827 | MXN | 30,380,000 | State Street Bank and Trust Company | 12/20/23 | 777 | — |
| USD | 1,636,610 | MXN | 29,875,600 | State Street Bank and Trust Company | 12/20/23 | — | (7,679) |
| USD | 873,246 | MXN | 16,054,000 | State Street Bank and Trust Company | 12/20/23 | — | (10,332) |
| USD | 38,833,171 | MXN | 690,566,400 | UBS AG | 12/20/23 | 825,886 | — |
| USD | 27,236,508 | NZD | 46,000,000 | Citibank, N.A. | 12/20/23 | 432,665 | — |
| USD | 17,709,261 | NZD | 30,005,779 | UBS AG | 12/20/23 | 225,126 | — |
| USD | 117,426 | THB | 4,090,000 | Standard Chartered Bank | 12/20/23 | 3,144 | — |
| USD | 3,602,825 | UYU | 140,432,000 | Citibank, N.A. | 12/20/23 | 110,495 | — |
| USD | 1,796,108 | UYU | 70,138,000 | Citibank, N.A. | 12/20/23 | 51,882 | — |
| USD | 789,860 | ZAR | 15,074,703 | Goldman Sachs International | 12/20/23 | — | (15,612) |
| USD | 798,793 | ZAR | 15,245,191 | Goldman Sachs International | 12/20/23 | — | (15,789) |
| USD | 820,912 | ZAR | 15,702,816 | Goldman Sachs International | 12/20/23 | — | (18,122) |
| USD | 830,196 | ZAR | 15,880,407 | Goldman Sachs International | 12/20/23 | — | (18,327) |
| USD | 2,725,636 | ZAR | 52,178,214 | Goldman Sachs International | 12/20/23 | — | (62,354) |
| USD | 2,756,462 | ZAR | 52,768,325 | Goldman Sachs International | 12/20/23 | — | (63,059) |
| USD | 4,928,540 | ZAR | 94,549,610 | Goldman Sachs International | 12/20/23 | — | (123,441) |
| USD | 19,366,166 | ZAR | 371,758,737 | Goldman Sachs International | 12/20/23 | — | (497,673) |
| USD | 789,666 | ZAR | 15,074,704 | HSBC Bank USA, N.A. | 12/20/23 | — | (15,807) |
| USD | 798,596 | ZAR | 15,245,191 | HSBC Bank USA, N.A. | 12/20/23 | — | (15,986) |
39
See Notes to Consolidated Financial Statements.
Global Macro Portfolio
October 31, 2023
Consolidated Portfolio of Investments — continued
| Forward Foreign Currency Exchange Contracts (OTC) (continued) |
| Currency Purchased | Currency Sold | Counterparty | Settlement
Date | Unrealized
Appreciation | Unrealized
(Depreciation) |
| USD | 820,344 | ZAR | 15,702,816 | HSBC Bank USA, N.A. | 12/20/23 | $ — | $ (18,690) |
| USD | 829,622 | ZAR | 15,880,407 | HSBC Bank USA, N.A. | 12/20/23 | — | (18,901) |
| USD | 2,211,792 | ZAR | 42,211,391 | HSBC Bank USA, N.A. | 12/20/23 | — | (43,650) |
| USD | 2,236,807 | ZAR | 42,688,781 | HSBC Bank USA, N.A. | 12/20/23 | — | (44,143) |
| USD | 2,724,569 | ZAR | 52,178,215 | HSBC Bank USA, N.A. | 12/20/23 | — | (63,421) |
| USD | 2,755,382 | ZAR | 52,768,325 | HSBC Bank USA, N.A. | 12/20/23 | — | (64,139) |
| USD | 4,986,256 | ZAR | 95,659,330 | HSBC Bank USA, N.A. | 12/20/23 | — | (125,020) |
| USD | 19,280,855 | ZAR | 369,710,385 | JPMorgan Chase Bank, N.A. | 12/20/23 | — | (473,537) |
| USD | 2,199,332 | ZAR | 41,948,952 | UBS AG | 12/20/23 | — | (42,088) |
| USD | 2,224,205 | ZAR | 42,423,373 | UBS AG | 12/20/23 | — | (42,564) |
| USD | 332,234 | ZMW | 6,960,304 | JPMorgan Chase Bank, N.A. | 12/20/23 | 18,339 | — |
| ZAR | 173,806,466 | USD | 9,151,321 | HSBC Bank USA, N.A. | 12/20/23 | 135,518 | — |
| ZAR | 86,903,234 | USD | 4,608,313 | HSBC Bank USA, N.A. | 12/20/23 | 35,107 | — |
| ZAR | 178,461,620 | USD | 9,413,150 | Standard Chartered Bank | 12/20/23 | 122,424 | — |
| ZAR | 86,903,234 | USD | 4,610,034 | State Street Bank and Trust Company | 12/20/23 | 33,385 | — |
| USD | 3,043,492 | KES | 471,741,325 | Standard Chartered Bank | 12/21/23 | 8,680 | — |
| USD | 1,376,115 | KES | 222,932,331 | Standard Chartered Bank | 12/21/23 | — | (58,057) |
| UZS | 14,880,464,000 | USD | 1,187,113 | ICBC Standard Bank plc | 12/21/23 | 8,625 | — |
| UZS | 7,410,554,000 | USD | 593,557 | ICBC Standard Bank plc | 12/21/23 | 1,928 | — |
| USD | 40,048,383 | BRL | 197,000,000 | BNP Paribas | 1/3/24 | 1,244,412 | — |
| USD | 42,731,812 | BRL | 214,800,000 | BNP Paribas | 1/3/24 | 421,696 | — |
| UZS | 13,783,766,000 | USD | 1,098,308 | JPMorgan Chase Bank, N.A. | 1/10/24 | — | (10,903) |
| HUF | 309,903,511 | EUR | 760,332 | BNP Paribas | 1/11/24 | 41,899 | — |
| HUF | 944,682,626 | EUR | 2,350,191 | UBS AG | 1/11/24 | 93,257 | — |
| HUF | 280,523,130 | EUR | 691,943 | UBS AG | 1/11/24 | 34,005 | — |
| EGP | 14,017,368 | USD | 412,289 | Standard Chartered Bank | 1/22/24 | — | (13,778) |
| USD | 389,263 | EGP | 14,017,368 | Goldman Sachs International | 1/22/24 | — | (9,248) |
| UZS | 7,490,685,000 | USD | 593,557 | ICBC Standard Bank plc | 1/22/24 | 8,802 | — |
| UZS | 1,845,934,481 | USD | 146,271 | ICBC Standard Bank plc | 1/22/24 | 2,169 | — |
| HUF | 1,655,088,317 | EUR | 3,877,901 | Barclays Bank PLC | 1/30/24 | 402,250 | — |
| USD | 771,000 | PKR | 231,300,000 | Citibank, N.A. | 1/31/24 | — | (47,248) |
| USD | 936,093 | PKR | 282,700,000 | JPMorgan Chase Bank, N.A. | 1/31/24 | — | (63,988) |
| USD | 1,337,134 | PKR | 410,500,000 | JPMorgan Chase Bank, N.A. | 2/2/24 | — | (114,705) |
| USD | 576,797 | PKR | 176,500,000 | Standard Chartered Bank | 2/2/24 | — | (47,440) |
| USD | 5,209,600 | UGX | 20,525,823,667 | Deutsche Bank AG | 2/6/24 | — | (141,671) |
| USD | 1,303,523 | KZT | 640,030,000 | ICBC Standard Bank plc | 3/14/24 | — | (9,072) |
| USD | 2,607,049 | KZT | 1,280,713,000 | ICBC Standard Bank plc | 3/14/24 | — | (19,480) |
| USD | 12,438,538 | SAR | 46,800,000 | Standard Chartered Bank | 3/14/24 | — | (25,607) |
| USD | 10,754,098 | BHD | 4,100,000 | Standard Chartered Bank | 3/18/24 | — | (99,354) |
| TRY | 98,212,810 | USD | 3,145,351 | Standard Chartered Bank | 3/20/24 | — | (80,242) |
| USD | 3,047,224 | TRY | 98,212,810 | Standard Chartered Bank | 3/20/24 | — | (17,886) |
| USD | 1,424,623 | EGP | 56,700,000 | HSBC Bank USA, N.A. | 3/25/24 | — | (19,186) |
| OMR | 3,568,000 | USD | 9,252,872 | Standard Chartered Bank | 4/8/24 | 9,047 | — |
| USD | 9,004,416 | OMR | 3,568,000 | BNP Paribas | 4/8/24 | — | (257,503) |
| USD | 1,267,427 | OMR | 500,000 | Standard Chartered Bank | 4/22/24 | — | (30,356) |
40
See Notes to Consolidated Financial Statements.
Global Macro Portfolio
October 31, 2023
Consolidated Portfolio of Investments — continued
| Forward Foreign Currency Exchange Contracts (OTC) (continued) |
| Currency Purchased | Currency Sold | Counterparty | Settlement
Date | Unrealized
Appreciation | Unrealized
(Depreciation) |
| OMR | 6,000,000 | USD | 15,554,519 | Standard Chartered Bank | 5/28/24 | $ 13,766 | $ — |
| USD | 16,212,793 | OMR | 6,400,000 | Standard Chartered Bank | 5/28/24 | — | (393,377) |
| USD | 3,727,097 | EGP | 143,046,000 | Citibank, N.A. | 6/13/24 | 364,663 | — |
| USD | 1,824,935 | KZT | 921,592,000 | ICBC Standard Bank plc | 6/18/24 | — | (15,520) |
| NGN | 194,367,272 | USD | 228,667 | JPMorgan Chase Bank, N.A. | 6/20/24 | — | (43,713) |
| NGN | 1,020,857,426 | USD | 1,237,403 | Societe Generale | 6/21/24 | — | (266,283) |
| TRY | 48,061,285 | USD | 1,421,943 | Standard Chartered Bank | 6/21/24 | — | (52,181) |
| USD | 1,368,866 | TRY | 48,061,285 | Standard Chartered Bank | 6/21/24 | — | (896) |
| NGN | 530,630,105 | USD | 624,276 | Standard Chartered Bank | 6/24/24 | — | (119,967) |
| KZT | 801,667,000 | USD | 1,568,053 | Societe Generale | 6/25/24 | 30,192 | — |
| USD | 1,564,228 | KZT | 801,667,000 | ICBC Standard Bank plc | 6/25/24 | — | (34,016) |
| NGN | 546,549,008 | USD | 624,276 | Standard Chartered Bank | 6/26/24 | — | (105,158) |
| NGN | 515,167,294 | USD | 578,844 | Standard Chartered Bank | 7/3/24 | — | (90,590) |
| NGN | 554,934,742 | USD | 616,594 | Societe Generale | 7/8/24 | — | (91,459) |
| OMR | 3,571,000 | USD | 9,258,491 | Standard Chartered Bank | 7/8/24 | 3,485 | — |
| USD | 9,388,519 | OMR | 3,711,000 | BNP Paribas | 7/8/24 | — | (236,569) |
| USD | 9,916,350 | OMR | 3,912,000 | Standard Chartered Bank | 7/8/24 | — | (230,065) |
| USD | 8,357,531 | OMR | 3,310,000 | BNP Paribas | 7/29/24 | — | (225,720) |
| USD | 322,732 | AMD | 128,705,675 | Citibank, N.A. | 9/6/24 | 20,104 | — |
| USD | 330,137 | EGP | 14,017,368 | Standard Chartered Bank | 9/11/24 | 19,288 | — |
| KZT | 1,359,576,031 | USD | 2,607,049 | Citibank, N.A. | 9/16/24 | 52,861 | — |
| KZT | 870,689,175 | USD | 1,668,786 | Citibank, N.A. | 9/16/24 | 34,653 | — |
| KZT | 680,439,778 | USD | 1,303,524 | Citibank, N.A. | 9/16/24 | 27,706 | — |
| KZT | 679,788,016 | USD | 1,303,524 | Citibank, N.A. | 9/16/24 | 26,431 | — |
| USD | 448,066 | AMD | 182,027,000 | Citibank, N.A. | 9/16/24 | 20,722 | — |
| USD | 2,607,048 | KZT | 1,323,077,000 | Citibank, N.A. | 9/16/24 | 18,546 | — |
| USD | 1,303,525 | KZT | 666,427,000 | Citibank, N.A. | 9/16/24 | — | (291) |
| USD | 3,128,459 | KZT | 1,600,989,000 | Citibank, N.A. | 9/16/24 | — | (3,758) |
| USD | 4,863,288 | EGP | 196,720,000 | Citibank, N.A. | 9/17/24 | 513,760 | — |
| USD | 1,303,524 | KZT | 676,529,000 | Citibank, N.A. | 9/19/24 | — | (19,205) |
| TRY | 238,255,000 | USD | 6,505,113 | Standard Chartered Bank | 9/20/24 | — | (289,886) |
| USD | 6,220,500 | TRY | 238,255,000 | Standard Chartered Bank | 9/20/24 | 5,273 | — |
| TRY | 64,768,000 | USD | 1,744,137 | Standard Chartered Bank | 9/23/24 | — | (59,440) |
| USD | 1,689,161 | TRY | 64,768,000 | Standard Chartered Bank | 9/23/24 | 4,464 | — |
| USD | 1,328,169 | KZT | 691,976,000 | Bank of America, N.A. | 9/30/24 | — | (21,584) |
| USD | 17,699,754 | BHD | 6,766,439 | Standard Chartered Bank | 6/18/25 | — | (96,712) |
| USD | 5,911,596 | SAR | 22,308,000 | Standard Chartered Bank | 6/18/25 | — | (13,452) |
| | | | | | | $6,849,412 | $(11,584,022) |
41
See Notes to Consolidated Financial Statements.
Global Macro Portfolio
October 31, 2023
Consolidated Portfolio of Investments — continued
| Futures Contracts |
| Description | Number of
Contracts | Position | Expiration
Date | Notional
Amount | Value/Unrealized
Appreciation
(Depreciation) |
| Commodity Futures | | | | | |
| Brent Crude Oil | 104 | Long | 11/30/23 | $ 8,842,080 | $ (266,159) |
| Equity Futures | | | | | |
| Hang Seng Index | 20 | Long | 11/29/23 | 2,192,833 | 13,478 |
| Nikkei 225 Index | 47 | Long | 12/7/23 | 7,373,125 | (292,575) |
| Euro Stoxx 50 Index | (380) | Short | 12/15/23 | (16,408,060) | 710,416 |
| IFSC Nifty 50 Index | (354) | Short | 11/30/23 | (13,567,404) | 140,701 |
| SPI 200 Index | (44) | Short | 12/21/23 | (4,752,532) | 330,133 |
| Interest Rate Futures | | | | | |
| Long Gilt | 209 | Long | 12/27/23 | 23,665,333 | (381,327) |
| U.S. Ultra-Long Treasury Bond | 184 | Long | 12/19/23 | 20,711,500 | (2,454,551) |
| Euro-Bobl | (430) | Short | 12/7/23 | (52,909,987) | 299,654 |
| Euro-Bund | (261) | Short | 12/7/23 | (35,622,417) | 588,708 |
| Euro-Buxl | (114) | Short | 12/7/23 | (14,525,474) | 1,226,526 |
| Japan 10-Year Bond | (48) | Short | 12/13/23 | (45,522,019) | 696,685 |
| U.S. 2-Year Treasury Note | (76) | Short | 12/29/23 | (15,384,063) | 75,406 |
| U.S. 5-Year Treasury Note | (752) | Short | 12/29/23 | (78,566,375) | 646,467 |
| U.S. 10-Year Treasury Note | (489) | Short | 12/19/23 | (51,918,047) | 1,764,982 |
| U.S. Long Treasury Bond | (79) | Short | 12/19/23 | (8,645,563) | 725,491 |
| | | | | | $ 3,824,035 |
| Inflation Swaps (Centrally Cleared) |
Notional Amount
(000's omitted) | Portfolio
Pays/Receives
Return on
Reference Index | Reference Index | Portfolio
Pays/Receives
Rate | Annual
Rate | Termination
Date | Value/Unrealized
Appreciation
(Depreciation) |
| EUR | 5,900 | Receives | Eurostat Eurozone HICP ex Tobacco NSA
(pays upon termination) | Pays | 2.20%
(pays upon termination) | 10/15/36 | $ 811,341 |
| EUR | 5,900 | Receives | Eurostat Eurozone HICP ex Tobacco NSA
(pays upon termination) | Pays | 2.20%
(pays upon termination) | 10/15/36 | 811,341 |
| EUR | 5,900 | Receives | Eurostat Eurozone HICP ex Tobacco NSA
(pays upon termination) | Pays | 2.20%
(pays upon termination) | 10/15/36 | 810,645 |
| EUR | 6,070 | Receives | Eurostat Eurozone HICP ex Tobacco NSA
(pays upon termination) | Pays | 2.08%
(pays upon termination) | 1/15/37 | 883,463 |
| EUR | 5,900 | Pays | Eurostat Eurozone HICP ex Tobacco NSA
(pays upon termination) | Receives | 2.29%
(pays upon termination) | 10/15/46 | (952,234) |
| EUR | 5,900 | Pays | Eurostat Eurozone HICP ex Tobacco NSA
(pays upon termination) | Receives | 2.29%
(pays upon termination) | 10/15/46 | (952,234) |
| EUR | 5,900 | Pays | Eurostat Eurozone HICP ex Tobacco NSA
(pays upon termination) | Receives | 2.29%
(pays upon termination) | 10/15/46 | (954,166) |
42
See Notes to Consolidated Financial Statements.
Global Macro Portfolio
October 31, 2023
Consolidated Portfolio of Investments — continued
| Inflation Swaps (Centrally Cleared) (continued) |
Notional Amount
(000's omitted) | Portfolio
Pays/Receives
Return on
Reference Index | Reference Index | Portfolio
Pays/Receives
Rate | Annual
Rate | Termination
Date | Value/Unrealized
Appreciation
(Depreciation) |
| EUR | 6,070 | Pays | Eurostat Eurozone HICP ex Tobacco NSA
(pays upon termination) | Receives | 2.18%
(pays upon termination) | 1/15/47 | $ (1,080,750) |
| EUR | 2,590 | Pays | Eurostat Eurozone HICP ex Tobacco NSA
(pays upon termination) | Receives | 2.64%
(pays upon termination) | 3/13/53 | (42,411) |
| EUR | 10,200 | Pays | Eurostat Eurozone HICP ex Tobacco NSA
(pays upon termination) | Receives | 2.72%
(pays upon termination) | 6/15/53 | 134,200 |
| USD | 28,400 | Pays | Return on CPI-U (NSA)
(pays upon termination) | Receives | 2.75%
(pays upon termination) | 10/29/36 | (1,263,403) |
| USD | 9,970 | Pays | Return on CPI-U (NSA)
(pays upon termination) | Receives | 2.67%
(pays upon termination) | 1/7/37 | (450,836) |
| USD | 19,000 | Receives | Return on CPI-U (NSA)
(pays upon termination) | Pays | 2.62%
(pays upon termination) | 10/29/46 | 1,061,350 |
| USD | 9,450 | Receives | Return on CPI-U (NSA)
(pays upon termination) | Pays | 2.62%
(pays upon termination) | 10/29/46 | 524,684 |
| USD | 9,950 | Receives | Return on CPI-U (NSA)
(pays upon termination) | Pays | 2.54%
(pays upon termination) | 1/7/47 | 622,930 |
| USD | 3,510 | Receives | Return on CPI-U (NSA)
(pays upon termination) | Pays | 2.40%
(pays upon termination) | 3/13/53 | 206,687 |
| | | | | | | | $ 170,607 |
| Interest Rate Swaps (Centrally Cleared) |
Notional Amount
(000's omitted) | Portfolio
Pays/
Receives
Floating
Rate | Floating Rate | Annual
Fixed Rate | Termination
Date | Value | Unamortized
Upfront
Receipts
(Payments) | Unrealized
Appreciation
(Depreciation) |
| BRL | 574,200 | Pays | Brazil CETIP Interbank Deposit Rate
(pays upon termination) | 11.29%
(pays upon termination) | 7/1/24 | $ (347,418) | $ — | $ (347,418) |
| BRL | 96,600 | Pays | Brazil CETIP Interbank Deposit Rate
(pays upon termination) | 10.40%
(pays upon termination) | 1/2/25 | (203,150) | — | (203,150) |
| BRL | 96,600 | Pays | Brazil CETIP Interbank Deposit Rate
(pays upon termination) | 10.50%
(pays upon termination) | 1/2/25 | (180,288) | — | (180,288) |
| BRL | 94,493 | Pays | Brazil CETIP Interbank Deposit Rate
(pays upon termination) | 10.52%
(pays upon termination) | 1/2/25 | (174,262) | — | (174,262) |
| BRL | 98,707 | Pays | Brazil CETIP Interbank Deposit Rate
(pays upon termination) | 10.52%
(pays upon termination) | 1/2/25 | (181,440) | — | (181,440) |
| BRL | 427,200 | Pays | Brazil CETIP Interbank Deposit Rate
(pays upon termination) | 10.96%
(pays upon termination) | 1/2/25 | (243,869) | — | (243,869) |
| CLP | 16,042,220 | Receives | 6-month Sinacofi Chile Interbank Rate
(pays semi-annually) | 4.77%
(pays semi-annually) | 6/6/33 | 663,811 | 5,028 | 668,839 |
43
See Notes to Consolidated Financial Statements.
Global Macro Portfolio
October 31, 2023
Consolidated Portfolio of Investments — continued
| Interest Rate Swaps (Centrally Cleared) (continued) |
Notional Amount
(000's omitted) | Portfolio
Pays/
Receives
Floating
Rate | Floating Rate | Annual
Fixed Rate | Termination
Date | Value | Unamortized
Upfront
Receipts
(Payments) | Unrealized
Appreciation
(Depreciation) |
| CLP | 5,387,780 | Receives | 6-month Sinacofi Chile Interbank Rate
(pays semi-annually) | 4.65%
(pays semi-annually) | 6/14/33 | $ 248,806 | $ — | $ 248,806 |
| CLP | 4,336,000 | Receives | 6-month Sinacofi Chile Interbank Rate
(pays semi-annually) | 5.00%
(pays semi-annually) | 6/22/33 | 465,898 | — | 465,898 |
| CLP | 4,643,000 | Receives | 6-month Sinacofi Chile Interbank Rate
(pays semi-annually) | 5.20%
(pays semi-annually) | 6/22/33 | 416,021 | — | 416,021 |
| CNY | 62,000 | Pays | 7-day China Fixing Repo Rates
(pays quarterly) | 2.41%
(pays quarterly) | 12/20/28 | (1,089) | — | (1,089) |
| CNY | 82,000 | Pays | 7-day China Fixing Repo Rates
(pays quarterly) | 2.41%
(pays quarterly) | 12/20/28 | (1,441) | — | (1,441) |
| CNY | 40,000 | Pays | 7-day China Fixing Repo Rates
(pays quarterly) | 2.42%
(pays quarterly) | 12/20/28 | 135 | — | 135 |
| CNY | 82,000 | Pays | 7-day China Fixing Repo Rates
(pays quarterly) | 2.42%
(pays quarterly) | 12/20/28 | 1,749 | — | 1,749 |
| CNY | 40,000 | Pays | 7-day China Fixing Repo Rates
(pays quarterly) | 2.43%
(pays quarterly) | 12/20/28 | 3,966 | — | 3,966 |
| CNY | 122,100 | Pays | 7-day China Fixing Repo Rates
(pays quarterly) | 2.43%
(pays quarterly) | 12/20/28 | 12,470 | — | 12,470 |
| CNY | 21,000 | Pays | 7-day China Fixing Repo Rates
(pays quarterly) | 2.44%
(pays quarterly) | 12/20/28 | 2,459 | — | 2,459 |
| CNY | 17,000 | Pays | 7-day China Fixing Repo Rates
(pays quarterly) | 2.44%
(pays quarterly) | 12/20/28 | 2,296 | — | 2,296 |
| CNY | 52,000 | Pays | 7-day China Fixing Repo Rates
(pays quarterly) | 2.44%
(pays quarterly) | 12/20/28 | 7,645 | — | 7,645 |
| CNY | 39,300 | Pays | 7-day China Fixing Repo Rates
(pays quarterly) | 2.44%
(pays quarterly) | 12/20/28 | 6,013 | — | 6,013 |
| CNY | 15,000 | Pays | 7-day China Fixing Repo Rates
(pays quarterly) | 2.45%
(pays quarterly) | 12/20/28 | 2,744 | — | 2,744 |
| CNY | 36,000 | Pays | 7-day China Fixing Repo Rates
(pays quarterly) | 2.46%
(pays quarterly) | 12/20/28 | 9,602 | — | 9,602 |
| CNY | 36,000 | Pays | 7-day China Fixing Repo Rates
(pays quarterly) | 2.47%
(pays quarterly) | 12/20/28 | 10,679 | — | 10,679 |
| CNY | 45,000 | Pays | 7-day China Fixing Repo Rates
(pays quarterly) | 2.47%
(pays quarterly) | 12/20/28 | 14,696 | — | 14,696 |
| CNY | 30,000 | Pays | 7-day China Fixing Repo Rates
(pays quarterly) | 2.47%
(pays quarterly) | 12/20/28 | 9,977 | — | 9,977 |
44
See Notes to Consolidated Financial Statements.
Global Macro Portfolio
October 31, 2023
Consolidated Portfolio of Investments — continued
| Interest Rate Swaps (Centrally Cleared) (continued) |
Notional Amount
(000's omitted) | Portfolio
Pays/
Receives
Floating
Rate | Floating Rate | Annual
Fixed Rate | Termination
Date | Value | Unamortized
Upfront
Receipts
(Payments) | Unrealized
Appreciation
(Depreciation) |
| COP | 62,519,600 | Receives | Colombia Overnight Interbank Reference Rate
(pays quarterly) | 3.84%
(pays quarterly) | 5/5/25 | $ 1,679,210 | $ — | $ 1,679,210 |
| COP | 29,306,100 | Pays | Colombia Overnight Interbank Reference Rate
(pays quarterly) | 3.19%
(pays quarterly) | 6/4/25 | (832,102) | — | (832,102) |
| COP | 44,982,400 | Pays | Colombia Overnight Interbank Reference Rate
(pays quarterly) | 3.26%
(pays quarterly) | 6/5/25 | (1,267,302) | — | (1,267,302) |
| COP | 59,477,600 | Pays | Colombia Overnight Interbank Reference Rate
(pays quarterly) | 3.34%
(pays quarterly) | 6/8/25 | (1,651,035) | — | (1,651,035) |
| COP | 29,163,200 | Pays | Colombia Overnight Interbank Reference Rate
(pays quarterly) | 3.44%
(pays quarterly) | 6/9/25 | (793,435) | — | (793,435) |
| COP | 7,412,000 | Receives | Colombia Overnight Interbank Reference Rate
(pays quarterly) | 3.76%
(pays quarterly) | 11/26/25 | 225,390 | — | 225,390 |
| COP | 7,412,000 | Receives | Colombia Overnight Interbank Reference Rate
(pays quarterly) | 3.89%
(pays quarterly) | 11/26/25 | 220,700 | — | 220,700 |
| COP | 2,672,700 | Receives | Colombia Overnight Interbank Reference Rate
(pays quarterly) | 4.02%
(pays quarterly) | 11/26/25 | 77,956 | — | 77,956 |
| COP | 14,824,000 | Receives | Colombia Overnight Interbank Reference Rate
(pays quarterly) | 4.07%
(pays quarterly) | 11/26/25 | 428,409 | — | 428,409 |
| COP | 8,554,300 | Receives | Colombia Overnight Interbank Reference Rate
(pays quarterly) | 4.11%
(pays quarterly) | 11/26/25 | 245,759 | — | 245,759 |
| COP | 2,605,900 | Receives | Colombia Overnight Interbank Reference Rate
(pays quarterly) | 4.21%
(pays quarterly) | 11/26/25 | 73,597 | — | 73,597 |
| COP | 7,973,800 | Receives | Colombia Overnight Interbank Reference Rate
(pays quarterly) | 4.34%
(pays quarterly) | 11/26/25 | 219,812 | — | 219,812 |
| COP | 11,377,600 | Pays | Colombia Overnight Interbank Reference Rate
(pays quarterly) | 5.68%
(pays quarterly) | 11/26/25 | (239,634) | — | (239,634) |
| COP | 32,127,300 | Receives | Colombia Overnight Interbank Reference Rate
(pays quarterly) | 6.25%
(pays quarterly) | 11/26/25 | 503,018 | — | 503,018 |
| COP | 34,340,000 | Receives | Colombia Overnight Interbank Reference Rate
(pays quarterly) | 7.03%
(pays quarterly) | 11/26/25 | 497,580 | — | 497,580 |
| COP | 4,471,000 | Receives | Colombia Overnight Interbank Reference Rate
(pays quarterly) | 10.17%
(pays quarterly) | 11/26/25 | (3,561) | (52) | (3,613) |
| CZK | 223,000 | Pays | 6-month CZK PRIBOR
(pays semi-annually) | 4.18%
(pays annually) | 9/20/28 | (150,776) | — | (150,776) |
| CZK | 60,931 | Pays | 6-month CZK PRIBOR
(pays semi-annually) | 3.94%
(pays annually) | 9/20/33 | (128,393) | — | (128,393) |
| CZK | 121,861 | Pays | 6-month CZK PRIBOR
(pays semi-annually) | 3.96%
(pays annually) | 9/20/33 | (250,727) | — | (250,727) |
45
See Notes to Consolidated Financial Statements.
Global Macro Portfolio
October 31, 2023
Consolidated Portfolio of Investments — continued
| Interest Rate Swaps (Centrally Cleared) (continued) |
Notional Amount
(000's omitted) | Portfolio
Pays/
Receives
Floating
Rate | Floating Rate | Annual
Fixed Rate | Termination
Date | Value | Unamortized
Upfront
Receipts
(Payments) | Unrealized
Appreciation
(Depreciation) |
| CZK | 183,208 | Pays | 6-month CZK PRIBOR
(pays semi-annually) | 3.96%
(pays annually) | 9/20/33 | $ (372,198) | $ — | $ (372,198) |
| CZK | 52,000 | Pays | 6-month CZK PRIBOR
(pays semi-annually) | 4.31%
(pays annually) | 12/20/33 | (26,541) | — | (26,541) |
| EUR | 2,000 | Receives | 1-day Euro Short-Term Rate
(pays annually) | 2.60%
(pays annually) | 1/24/28 | 44,479 | (36) | 44,443 |
| EUR | 3,629 | Pays | 6-month EURIBOR
(pays semi-annually) | 3.03%
(pays annually) | 10/10/29 | (51,254) | — | (51,254) |
| EUR | 1,200 | Pays | 6-month EURIBOR
(pays semi-annually) | 3.17%
(pays annually) | 10/17/29 | (6,866) | — | (6,866) |
| EUR | 1,781 | Pays | 6-month EURIBOR
(pays semi-annually) | 3.01%
(pays annually) | 10/27/29 | (26,040) | — | (26,040) |
| EUR | 400 | Pays | 6-month EURIBOR
(pays semi-annually) | 3.26%
(pays annually) | 10/17/32 | (2,310) | — | (2,310) |
| EUR | 800 | Pays | 6-month EURIBOR
(pays semi-annually) | 3.31%
(pays annually) | 10/18/32 | (889) | — | (889) |
| EUR | 800 | Pays | 6-month EURIBOR
(pays semi-annually) | 3.20%
(pays annually) | 10/19/32 | (8,060) | — | (8,060) |
| GBP | 5,154 | Pays | 1-day Sterling Overnight Index Average
(pays annually) | 4.56%
(pays annually) | 10/2/28 | 8,761 | — | 8,761 |
| GBP | 10,164 | Pays | 1-day Sterling Overnight Index Average
(pays annually) | 4.39%
(pays annually) | 12/20/28 | (43,725) | — | (43,725) |
| GBP | 5,082 | Pays | 1-day Sterling Overnight Index Average
(pays annually) | 4.59%
(pays annually) | 12/20/28 | 31,005 | — | 31,005 |
| INR | 1,123,000 | Pays | 1-day INR FBIL MIBOR
(pays semi-annually) | 6.73%
(pays semi-annually) | 12/20/25 | 18,653 | — | 18,653 |
| INR | 694,000 | Pays | 1-day INR FBIL MIBOR
(pays semi-annually) | 6.73%
(pays semi-annually) | 12/20/25 | 11,906 | — | 11,906 |
| INR | 2,679,000 | Pays | 1-day INR FBIL MIBOR
(pays semi-annually) | 6.75%
(pays semi-annually) | 12/20/25 | 58,832 | — | 58,832 |
| INR | 3,812,000 | Pays | 1-day INR FBIL MIBOR
(pays semi-annually) | 6.75%
(pays semi-annually) | 12/20/25 | 84,963 | — | 84,963 |
| JPY | 2,838,000 | Receives | 1-day Overnight Tokyo Average Rate
(pays annually) | 0.31%
(pays annually) | 12/1/27 | 123,753 | — | 123,753 |
| JPY | 2,405,000 | Receives | 1-day Overnight Tokyo Average Rate
(pays annually) | 0.32%
(pays annually) | 12/1/27 | 99,752 | — | 99,752 |
| JPY | 564,000 | Receives | 1-day Overnight Tokyo Average Rate
(pays annually) | 0.41%
(pays annually) | 9/20/28 | 41,549 | — | 41,549 |
| JPY | 16,000 | Receives | 1-day Overnight Tokyo Average Rate
(pays annually) | 0.80%
(pays annually) | 9/20/33 | 3,094 | — | 3,094 |
| JPY | 21,000 | Receives | 1-day Overnight Tokyo Average Rate
(pays annually) | 0.80%
(pays annually) | 9/20/33 | 4,047 | — | 4,047 |
| JPY | 13,000 | Receives | 1-day Overnight Tokyo Average Rate
(pays annually) | 0.81%
(pays annually) | 9/20/33 | 2,464 | — | 2,464 |
46
See Notes to Consolidated Financial Statements.
Global Macro Portfolio
October 31, 2023
Consolidated Portfolio of Investments — continued
| Interest Rate Swaps (Centrally Cleared) (continued) |
Notional Amount
(000's omitted) | Portfolio
Pays/
Receives
Floating
Rate | Floating Rate | Annual
Fixed Rate | Termination
Date | Value | Unamortized
Upfront
Receipts
(Payments) | Unrealized
Appreciation
(Depreciation) |
| JPY | 2,590,000 | Receives | 1-day Overnight Tokyo Average Rate
(pays annually) | 0.82%
(pays annually) | 9/20/33 | $ 470,385 | $ — | $ 470,385 |
| JPY | 1,054,000 | Receives | 1-day Overnight Tokyo Average Rate
(pays annually) | 0.86%
(pays annually) | 9/20/33 | 160,543 | — | 160,543 |
| JPY | 649,000 | Receives | 1-day Overnight Tokyo Average Rate
(pays annually) | 1.07%
(pays annually) | 12/20/33 | 34,441 | — | 34,441 |
| JPY | 173,000 | Receives | 1-day Overnight Tokyo Average Rate
(pays annually) | 1.28%
(pays annually) | 3/15/53 | 114,822 | — | 114,822 |
| JPY | 155,000 | Receives | 1-day Overnight Tokyo Average Rate
(pays annually) | 1.28%
(pays annually) | 3/15/53 | 101,914 | — | 101,914 |
| JPY | 165,000 | Receives | 1-day Overnight Tokyo Average Rate
(pays annually) | 1.29%
(pays annually) | 3/15/53 | 107,013 | — | 107,013 |
| JPY | 512,600 | Receives | 1-day Overnight Tokyo Average Rate
(pays annually) | 1.29%
(pays annually) | 3/15/53 | 331,228 | — | 331,228 |
| JPY | 474,500 | Receives | 1-day Overnight Tokyo Average Rate
(pays annually) | 1.30%
(pays annually) | 3/15/53 | 302,070 | — | 302,070 |
| JPY | 472,700 | Receives | 1-day Overnight Tokyo Average Rate
(pays annually) | 1.30%
(pays annually) | 3/15/53 | 299,040 | — | 299,040 |
| JPY | 112,000 | Receives | 1-day Overnight Tokyo Average Rate
(pays annually) | 1.33%
(pays annually) | 9/20/53 | 71,491 | — | 71,491 |
| KRW | 5,242,000 | Pays | 3-month KRW Certificate of Deposit Rate
(pays quarterly) | 3.57%
(pays quarterly) | 6/21/28 | (86,715) | — | (86,715) |
| KRW | 5,241,000 | Pays | 3-month KRW Certificate of Deposit Rate
(pays quarterly) | 3.60%
(pays quarterly) | 6/21/28 | (80,735) | — | (80,735) |
| KRW | 5,422,000 | Pays | 3-month KRW Certificate of Deposit Rate
(pays quarterly) | 3.61%
(pays quarterly) | 6/21/28 | (82,642) | — | (82,642) |
| KRW | 1,961,584 | Pays | 3-month KRW Certificate of Deposit Rate
(pays quarterly) | 3.23%
(pays quarterly) | 6/21/33 | (106,783) | — | (106,783) |
| KRW | 11,880,785 | Pays | 3-month KRW Certificate of Deposit Rate
(pays quarterly) | 3.31%
(pays quarterly) | 6/21/33 | (591,339) | — | (591,339) |
| KRW | 2,192,300 | Pays | 3-month KRW Certificate of Deposit Rate
(pays quarterly) | 3.33%
(pays quarterly) | 6/21/33 | (106,560) | — | (106,560) |
| KRW | 2,103,000 | Pays | 3-month KRW Certificate of Deposit Rate
(pays quarterly) | 3.35%
(pays quarterly) | 6/21/33 | (98,864) | — | (98,864) |
| KRW | 3,373,000 | Pays | 3-month KRW Certificate of Deposit Rate
(pays quarterly) | 3.29%
(pays quarterly) | 9/20/33 | (175,447) | — | (175,447) |
47
See Notes to Consolidated Financial Statements.
Global Macro Portfolio
October 31, 2023
Consolidated Portfolio of Investments — continued
| Interest Rate Swaps (Centrally Cleared) (continued) |
Notional Amount
(000's omitted) | Portfolio
Pays/
Receives
Floating
Rate | Floating Rate | Annual
Fixed Rate | Termination
Date | Value | Unamortized
Upfront
Receipts
(Payments) | Unrealized
Appreciation
(Depreciation) |
| KRW | 2,448,000 | Pays | 3-month KRW Certificate of Deposit Rate
(pays quarterly) | 3.31%
(pays quarterly) | 9/20/33 | $ (125,031) | $ — | $ (125,031) |
| KRW | 613,331 | Pays | 3-month KRW Certificate of Deposit Rate
(pays quarterly) | 3.31%
(pays quarterly) | 9/20/33 | (31,133) | — | (31,133) |
| KRW | 3,264,000 | Pays | 3-month KRW Certificate of Deposit Rate
(pays quarterly) | 3.33%
(pays quarterly) | 9/20/33 | (161,181) | — | (161,181) |
| KRW | 3,264,000 | Pays | 3-month KRW Certificate of Deposit Rate
(pays quarterly) | 3.34%
(pays quarterly) | 9/20/33 | (159,543) | — | (159,543) |
| KRW | 2,915,000 | Pays | 3-month KRW Certificate of Deposit Rate
(pays quarterly) | 3.40%
(pays quarterly) | 9/20/33 | (131,059) | — | (131,059) |
| KRW | 2,976,000 | Pays | 3-month KRW Certificate of Deposit Rate
(pays quarterly) | 3.52%
(pays quarterly) | 9/20/33 | (112,340) | — | (112,340) |
| KRW | 6,013,000 | Pays | 3-month KRW Certificate of Deposit Rate
(pays quarterly) | 3.56%
(pays quarterly) | 9/20/33 | (212,843) | — | (212,843) |
| KRW | 2,770,000 | Pays | 3-month KRW Certificate of Deposit Rate
(pays quarterly) | 3.56%
(pays quarterly) | 9/20/33 | (97,876) | — | (97,876) |
| KRW | 2,369,000 | Pays | 3-month KRW Certificate of Deposit Rate
(pays quarterly) | 3.56%
(pays quarterly) | 9/20/33 | (83,113) | — | (83,113) |
| KRW | 2,806,000 | Pays | 3-month KRW Certificate of Deposit Rate
(pays quarterly) | 3.59%
(pays quarterly) | 9/20/33 | (93,166) | — | (93,166) |
| KRW | 2,745,000 | Pays | 3-month KRW Certificate of Deposit Rate
(pays quarterly) | 4.02%
(pays quarterly) | 12/20/33 | (20,021) | — | (20,021) |
| KRW | 5,431,000 | Pays | 3-month KRW Certificate of Deposit Rate
(pays quarterly) | 4.03%
(pays quarterly) | 12/20/33 | (35,594) | — | (35,594) |
| MXN | 1,020,890 | Pays | Mexico Interbank TIIE 28 Day
(pays monthly) | 11.33%
(pays monthly) | 10/7/24 | (57,014) | — | (57,014) |
| MXN | 1,911,130 | Pays | Mexico Interbank TIIE 28 Day
(pays monthly) | 11.24%
(pays monthly) | 10/9/24 | (190,245) | — | (190,245) |
| MXN | 728,980 | Pays | Mexico Interbank TIIE 28 Day
(pays monthly) | 11.25%
(pays monthly) | 10/10/24 | (70,277) | — | (70,277) |
| PLN | 26,040 | Receives | 6-month PLN WIBOR
(pays semi-annually) | 2.49%
(pays annually) | 10/14/26 | 377,741 | — | 377,741 |
| PLN | 82,460 | Receives | 6-month PLN WIBOR
(pays semi-annually) | 2.49%
(pays annually) | 10/15/26 | 1,197,856 | — | 1,197,856 |
| PLN | 31,600 | Receives | 6-month PLN WIBOR
(pays semi-annually) | 3.39%
(pays annually) | 12/15/26 | 263,337 | — | 263,337 |
| PLN | 22,700 | Receives | 6-month PLN WIBOR
(pays semi-annually) | 5.56%
(pays annually) | 12/21/27 | (289,763) | — | (289,763) |
48
See Notes to Consolidated Financial Statements.
Global Macro Portfolio
October 31, 2023
Consolidated Portfolio of Investments — continued
| Interest Rate Swaps (Centrally Cleared) (continued) |
Notional Amount
(000's omitted) | Portfolio
Pays/
Receives
Floating
Rate | Floating Rate | Annual
Fixed Rate | Termination
Date | Value | Unamortized
Upfront
Receipts
(Payments) | Unrealized
Appreciation
(Depreciation) |
| PLN | 26,000 | Receives | 6-month PLN WIBOR
(pays semi-annually) | 6.02%
(pays annually) | 12/21/27 | $ (462,230) | $ — | $ (462,230) |
| USD | 20,300 | Pays | SOFR
(pays annually) | 4.01%
(pays annually) | 8/4/28 | (537,442) | ��� — | (537,442) |
| USD | 20,300 | Pays | SOFR
(pays annually) | 4.01%
(pays annually) | 8/4/28 | (536,533) | — | (536,533) |
| USD | 4,500 | Pays | SOFR
(pays annually) | 4.05%
(pays annually) | 9/20/28 | (103,838) | — | (103,838) |
| USD | 4,500 | Pays | SOFR
(pays annually) | 4.06%
(pays annually) | 9/20/28 | (103,338) | — | (103,338) |
| USD | 12,600 | Pays | SOFR
(pays annually) | 3.76%
(pays annually) | 9/20/33 | (350,722) | — | (350,722) |
| Total | | | | | | $(2,065,655) | $4,940 | $(2,060,715) |
| Credit Default Swaps - Sell Protection (Centrally Cleared) |
| Reference Entity | Notional
Amount*
(000's omitted) | Contract Annual
Fixed Rate** | Current
Market Annual
Fixed Rate*** | Termination
Date | Value | Unamortized
Upfront
Receipts
(Payments) | Unrealized
Appreciation
(Depreciation) |
| Colombia | $ 38,800 | 1.00%
(pays quarterly)(1) | 2.20% | 12/20/28 | $ (1,998,708) | $ 2,171,405 | $ 172,697 |
| Total | $38,800 | | | | $(1,998,708) | $2,171,405 | $172,697 |
| Credit Default Swaps - Buy Protection (Centrally Cleared) | |
| Reference Entity | Notional
Amount
(000's omitted) | Contract
Annual
Fixed Rate** | Termination
Date | Value | Unamortized
Upfront
Receipts
(Payments) | Unrealized
Appreciation
(Depreciation) |
| Austria | | $ 8,750 | 1.00%
(pays quarterly)(1) | 12/20/28 | $ (342,035) | $ 331,093 | $ (10,942) |
| China | | 61,250 | 1.00%
(pays quarterly)(1) | 12/20/28 | (571,508) | 602,456 | 30,948 |
| Finland | | 9,100 | 0.25%
(pays quarterly)(1) | 12/20/28 | (12,651) | 4,159 | (8,492) |
| France | | 41,000 | 0.25%
(pays quarterly)(1) | 12/20/28 | 45,856 | (37,459) | 8,397 |
| Germany | | 40,250 | 0.25%
(pays quarterly)(1) | 12/20/28 | (87,682) | 101,449 | 13,767 |
| Hungary | | 9,250 | 1.00%
(pays quarterly)(1) | 12/20/28 | 231,785 | (242,815) | (11,030) |
| India | | 9,000 | 1.00%
(pays quarterly)(1) | 12/20/28 | (173,678) | 157,949 | (15,729) |
49
See Notes to Consolidated Financial Statements.
Global Macro Portfolio
October 31, 2023
Consolidated Portfolio of Investments — continued
| Credit Default Swaps - Buy Protection (Centrally Cleared) (continued) | |
| Reference Entity | Notional
Amount
(000's omitted) | Contract
Annual
Fixed Rate** | Termination
Date | Value | Unamortized
Upfront
Receipts
(Payments) | Unrealized
Appreciation
(Depreciation) |
| Malaysia | | $134,000 | 1.00%
(pays quarterly)(1) | 12/20/28 | $ (2,339,471) | $ 3,078,618 | $ 739,147 |
| Markit CDX Emerging Markets Index (CDX.EM.31.V3) | | 2,580 | 1.00%
(pays quarterly)(1) | 6/20/24 | (11,743) | (50,312) | (62,055) |
| Markit CDX Emerging Markets Index (CDX.EM.40.V1) | | 42,400 | 1.00%
(pays quarterly)(1) | 12/20/28 | 2,269,104 | (2,342,947) | (73,843) |
| Markit CDX North America High Yield Index (CDX.NA.HY.41.V2) | | 48,600 | 5.00%
(pays quarterly)(1) | 12/20/28 | (47,660) | 156,697 | 109,037 |
| Philippines | | 40,800 | 1.00%
(pays quarterly)(1) | 12/20/28 | (244,674) | 352,696 | 108,022 |
| Poland | | 37,800 | 1.00%
(pays quarterly)(1) | 12/20/28 | (588,995) | 482,676 | (106,319) |
| Qatar | | 12,396 | 1.00%
(pays quarterly)(1) | 12/20/23 | (26,587) | 11,831 | (14,756) |
| Qatar | | 8,300 | 1.00%
(pays quarterly)(1) | 12/20/28 | (164,299) | 234,738 | 70,439 |
| Romania | | 9,820 | 1.00%
(pays quarterly)(1) | 12/20/28 | 280,207 | (299,791) | (19,584) |
| Saudi | | 39,300 | 1.00%
(pays quarterly)(1) | 12/20/28 | (628,001) | 902,860 | 274,859 |
| Saudi | | 28,800 | 1.00%
(pays quarterly)(1) | 12/20/33 | (82,761) | 411,845 | 329,084 |
| South Africa | | 155,820 | 1.00%
(pays quarterly)(1) | 12/20/28 | 11,603,220 | (11,116,951) | 486,269 |
| South Africa | | 23,540 | 1.00%
(pays quarterly)(1) | 6/20/29 | 2,111,395 | (1,936,867) | 174,528 |
| South Africa | | 9,666 | 1.00%
(pays quarterly)(1) | 6/20/31 | 1,355,547 | (1,125,498) | 230,049 |
| Spain | | 56,300 | 1.00%
(pays quarterly)(1) | 12/20/28 | (1,218,845) | 1,235,640 | 16,795 |
| Turkey | | 7,797 | 1.00%
(pays quarterly)(1) | 12/20/28 | 939,131 | (973,757) | (34,626) |
| United Kingdom | | 40,000 | 1.00%
(pays quarterly)(1) | 12/20/28 | (1,289,115) | 1,277,456 | (11,659) |
| Total | | | | | $11,006,540 | $ (8,784,234) | $2,222,306 |
| Credit Default Swaps - Sell Protection (OTC) |
| Reference Entity | Counterparty | Notional
Amount*
(000's omitted) | Contract Annual
Fixed Rate** | Current
Market
Annual
Fixed Rate*** | Termination
Date | Value | Unamortized
Upfront
Receipts
(Payments) | Unrealized
Appreciation
(Depreciation) |
| Petroleos Mexicanos | Bank of America, N.A. | $ 6,500 | 1.00%
(pays quarterly)(1) | 2.34% | 12/20/23 | $ (4,365) | $ 6,601 | $ 2,236 |
| Vietnam | Goldman Sachs International | 9,100 | 1.00%
(pays quarterly)(1) | 0.68 | 6/20/24 | 28,953 | (17,274) | 11,679 |
| Total | | $15,600 | | | | $24,588 | $ (10,673) | $13,915 |
50
See Notes to Consolidated Financial Statements.
Global Macro Portfolio
October 31, 2023
Consolidated Portfolio of Investments — continued
| Credit Default Swaps - Buy Protection (OTC) |
| Reference Entity | Counterparty | Notional
Amount
(000's omitted) | Contract
Annual
Fixed Rate** | Termination
Date | Value | Unamortized
Upfront
Receipts
(Payments) | Unrealized
Appreciation
(Depreciation) |
| Czech Republic | JPMorgan Chase Bank, N.A. | $ 9,250 | 1.00%
(pays quarterly)(1) | 12/20/28 | $ (295,522) | $ 282,993 | $ (12,529) |
| Dubai | Barclays Bank PLC | 3,357 | 1.00%
(pays quarterly)(1) | 12/20/24 | (28,934) | (12,678) | (41,612) |
| Dubai | Barclays Bank PLC | 5,058 | 1.00%
(pays quarterly)(1) | 12/20/24 | (43,595) | (19,119) | (62,714) |
| Qatar | Goldman Sachs International | 3,700 | 1.00%
(pays quarterly)(1) | 12/20/23 | (8,038) | (170) | (8,208) |
| Qatar | Goldman Sachs International | 3,090 | 1.00%
(pays quarterly)(1) | 9/20/24 | (22,839) | 235 | (22,604) |
| Qatar | Nomura International PLC | 9,620 | 1.00%
(pays quarterly)(1) | 9/20/24 | (71,103) | 2,925 | (68,178) |
| Saudi Arabia | Barclays Bank PLC | 14,533 | 1.00%
(pays quarterly)(1) | 6/20/31 | (144,830) | (204,434) | (349,264) |
| South Africa | Goldman Sachs International | 16,600 | 1.00%
(pays quarterly)(1) | 12/20/28 | 1,236,043 | (1,180,673) | 55,370 |
| Sweden | Citibank, N.A. | 19,250 | 0.25%
(pays quarterly)(1) | 12/20/28 | (74,221) | 70,648 | (3,573) |
| Total | | | | | $ 546,961 | $ (1,060,273) | $ (513,312) |
| * | If the Portfolio is the seller of credit protection, the notional amount is the maximum potential amount of future payments the Portfolio could be required to make if a credit event, as defined in the credit default swap agreement, were to occur. At October 31, 2023, such maximum potential amount for all open credit default swaps in which the Portfolio is the seller was $54,400,000. |
| ** | The contract annual fixed rate represents the fixed rate of interest received by the Portfolio (as a seller of protection) or paid by the Portfolio (as a buyer of protection) on the notional amount of the credit default swap contract. |
| *** | Current market annual fixed rates, utilized in determining the net unrealized appreciation or depreciation as of period end, serve as an indicator of the market’s perception of the current status of the payment/performance risk associated with the credit derivative. The current market annual fixed rate of a particular reference entity reflects the cost, as quoted by the pricing vendor, of selling protection against default of that entity as of period end and may include upfront payments required to be made to enter into the agreement. The higher the fixed rate, the greater the market perceived risk of a credit event involving the reference entity. A rate identified as “Defaulted” indicates a credit event has occurred for the reference entity. |
| (1) | Upfront payment is exchanged with the counterparty as a result of the standardized trading coupon. |
| Total Return Swaps (OTC) |
| Counterparty | Notional Amount
(000's omitted) | Portfolio Receives | Portfolio Pays | Termination
Date | Value/Unrealized
Appreciation
(Depreciation) |
| BNP Paribas | USD | 146,000 | Excess Return on Bloomberg Commodity 1 Month Forward Index (pays upon termination) | Excess Return on Bloomberg Commodity Index + 0.13% (pays upon termination) | 2/26/24 | $ (3,541) |
| BNP Paribas | USD | 55,000 | Excess Return on Bloomberg Commodity 3 Month Forward Index (pays upon termination) | Excess Return on Bloomberg Commodity Index + 0.13% (pays upon termination) | 2/26/24 | 23,710 |
51
See Notes to Consolidated Financial Statements.
Global Macro Portfolio
October 31, 2023
Consolidated Portfolio of Investments — continued
| Total Return Swaps (OTC) (continued) |
| Counterparty | Notional Amount
(000's omitted) | Portfolio Receives | Portfolio Pays | Termination
Date | Value/Unrealized
Appreciation
(Depreciation) |
| Citibank, N.A. | KRW | 30,250 | Positive Return on KOSPI 200 Index Futures 12/2023 (pays upon termination) | Negative Return on KOSPI 200 Index Futures 12/2023 (pays upon termination) | 12/14/23 | $ (652,560) |
| | | | | | | $(632,391) |
| Cross-Currency Swaps (OTC) | | |
| Counterparty | Portfolio Receives | Portfolio Pays | Termination
Date | Value/Unrealized
Appreciation
(Depreciation) |
| Barclays Bank PLC | 1-day Indice Camara Promedio Rate on CLP 3,452,164,660 (pays semi-annually)* | 1.41% on CLP equivalent of CLF 98,000 (pays semi-annually)* | 1/13/33 | $ 464,805 |
| Goldman Sachs International | 1-day Indice Camara Promedio Rate on CLP 1,333,595,340 (pays semi-annually)* | 2.10% on CLP equivalent of CLF 42,000 (pays semi-annually)* | 4/8/32 | (102,481) |
| Goldman Sachs International | 1-day Indice Camara Promedio Rate on CLP 4,064,683,520 (pays semi-annually)* | 2.25% on CLP equivalent of CLF 128,000 (pays semi-annually)* | 4/11/32 | (371,144) |
| Goldman Sachs International | 1-day Indice Camara Promedio Rate on CLP 757,813,425 (pays semi-annually)* | 1.85% on CLP equivalent of CLF 23,700 (pays semi-annually)* | 4/20/32 | (35,364) |
| | | | | $ (44,184) |
| * | At the termination date, the Portfolio will either pay or receive the USD equivalent of the difference between the initial CLP notional amount and the CLP equivalent of the CLF notional amount on such date. |
| Abbreviations: |
| CMT | – Constant Maturity Treasury |
| COF | – Cost of Funds 11th District |
| CPI-U (NSA) | – Consumer Price Index All Urban Non-Seasonally Adjusted |
| EURIBOR | – Euro Interbank Offered Rate |
| FBIL | – Financial Benchmarks India Ltd. |
| GDP | – Gross Domestic Product |
| HICP | – Harmonised Indices of Consumer Prices |
| |
| LIBOR | – London Interbank Offered Rate |
| MIBOR | – Mumbai Interbank Offered Rate |
| OTC | – Over-the-counter |
| PIK | – Payment In Kind |
| PRIBOR | – Prague Interbank Offered Rate |
| SOFR | – Secured Overnight Financing Rate |
| WIBOR | – Warsaw Interbank Offered Rate |
| Currency Abbreviations: |
| ALL | – Albanian Lek |
| AMD | – Armenian Dram |
| AUD | – Australian Dollar |
| BHD | – Bahraini Dinar |
| BRL | – Brazilian Real |
| CAD | – Canadian Dollar |
| CLF | – Chilean Unidad de Fomento |
| CLP | – Chilean Peso |
| |
| CNH | – Yuan Renminbi Offshore |
| CNY | – Yuan Renminbi |
| COP | – Colombian Peso |
| CZK | – Czech Koruna |
| DOP | – Dominican Peso |
| EGP | – Egyptian Pound |
| EUR | – Euro |
| GBP | – British Pound Sterling |
52
See Notes to Consolidated Financial Statements.
Global Macro Portfolio
October 31, 2023
Consolidated Portfolio of Investments — continued
| |
| HUF | – Hungarian Forint |
| IDR | – Indonesian Rupiah |
| ILS | – Israeli Shekel |
| INR | – Indian Rupee |
| ISK | – Icelandic Krona |
| JPY | – Japanese Yen |
| KES | – Kenyan Shilling |
| KRW | – South Korean Won |
| KZT | – Kazakhstani Tenge |
| LKR | – Sri Lankan Rupee |
| MXN | – Mexican Peso |
| NGN | – Nigerian Naira |
| NZD | – New Zealand Dollar |
| OMR | – Omani Rial |
| PEN | – Peruvian Sol |
| |
| PHP | – Philippine Peso |
| PKR | – Pakistan Rupee |
| PLN | – Polish Zloty |
| RSD | – Serbian Dinar |
| SAR | – Saudi Riyal |
| THB | – Thai Baht |
| TRY | – Turkish Lira |
| UAH | – Ukrainian Hryvnia |
| UGX | – Ugandan Shilling |
| USD | – United States Dollar |
| UYU | – Uruguayan Peso |
| UZS | – Uzbekistani Som |
| ZAR | – South African Rand |
| ZMW | – Zambian Kwacha |
53
See Notes to Consolidated Financial Statements.
Global Macro Portfolio
October 31, 2023
Consolidated Statement of Assets and Liabilities
| | October 31, 2023 |
| Assets | |
| Unaffiliated investments, at value (identified cost $1,585,345,832) | $ 1,484,838,491 |
| Affiliated investments, at value (identified cost $283,898,491) | 283,898,491 |
| Cash | 6,311,315 |
| Deposits for derivatives collateral: | |
| Futures contracts | 574 |
| Centrally cleared derivatives | 76,260,059 |
| OTC derivatives | 1,320,000 |
| Cash collateral for securities sold short | 17,965,996 |
| Foreign currency, at value (identified cost $26,096,709) | 25,892,803 |
| Interest and dividends receivable | 18,993,566 |
| Dividends receivable from affiliated investments | 1,211,576 |
| Receivable for investments sold | 1,286,876 |
| Receivable for variation margin on open futures contracts | 11,506 |
| Receivable for variation margin on open centrally cleared derivatives | 1,097,668 |
| Receivable for open forward foreign currency exchange contracts | 6,849,412 |
| Receivable for open swap contracts | 557,800 |
| Upfront payments on open non-centrally cleared swap contracts | 1,434,348 |
| Tax reclaims receivable | 21,992 |
| Trustees' deferred compensation plan | 256,315 |
| Total assets | $1,928,208,788 |
| Liabilities | |
| Cash collateral due to brokers | $ 1,320,000 |
| Payable for reverse repurchase agreements, including accrued interest of $59,613 | 18,951,793 |
| Written options outstanding, at value (premiums received $145,736) | 87,249 |
| Payable for investments purchased | 6,140,861 |
| Payable for securities sold short, at value (proceeds $96,326,671) | 91,193,005 |
| Payable for open forward foreign currency exchange contracts | 11,584,022 |
| Payable for open swap contracts | 1,733,772 |
| Payable for closed swap contracts | 1,201,592 |
| Upfront receipts on open non-centrally cleared swap contracts | 363,402 |
| Payable to affiliates: | |
| Investment adviser fee | 863,351 |
| Trustees' fees | 9,223 |
| Trustees' deferred compensation plan | 256,315 |
| Interest payable on securities sold short | 1,727,925 |
| Accrued foreign capital gains taxes | 3,047 |
| Accrued expenses and other liabilities | 636,780 |
| Total liabilities | $ 136,072,337 |
| Net Assets applicable to investors' interest in Portfolio | $1,792,136,451 |
54
See Notes to Consolidated Financial Statements.
Global Macro Portfolio
October 31, 2023
Consolidated Statement of Operations
| | Year Ended |
| | October 31, 2023 |
| Investment Income | |
| Dividend income (net of foreign taxes withheld of $104,156) | $ 1,961,187 |
| Dividend income from affiliated investments | 8,394,652 |
| Interest and other income (net of foreign taxes withheld of $1,217,757) | 121,389,075 |
| Total investment income | $ 131,744,914 |
| Expenses | |
| Investment adviser fee | $ 10,641,313 |
| Trustees’ fees and expenses | 108,500 |
| Custodian fee | 732,730 |
| Legal and accounting services | 328,989 |
| Interest expense and fees | 1,015,430 |
| Interest and dividend expense on securities sold short | 5,637,237 |
| Miscellaneous | 85,930 |
| Total expenses | $ 18,550,129 |
| Deduct: | |
| Waiver and/or reimbursement of expenses by affiliates | $ 245,091 |
| Total expense reductions | $ 245,091 |
| Net expenses | $ 18,305,038 |
| Net investment income | $ 113,439,876 |
| Realized and Unrealized Gain (Loss) | |
| Net realized gain (loss): | |
| Investment transactions (net of foreign capital gains taxes of $267,910) | $ (187,450,530) |
| Written options | 920 |
| Securities sold short | (769,825) |
| Futures contracts | 17,099,665 |
| Swap contracts | (12,239,645) |
| Foreign currency transactions | (7,268,536) |
| Forward foreign currency exchange contracts | 3,519,479 |
| Non-deliverable bond forward contracts | 6,414,099 |
| Net realized loss | $(180,694,373) |
| Change in unrealized appreciation (depreciation): | |
| Investments (including net increase in accrued foreign capital gains taxes of $3,047) | $ 285,303,491 |
| Written options | 58,487 |
| Securities sold short | 2,271,798 |
| Futures contracts | (19,741,273) |
| Swap contracts | (18,489,493) |
| Foreign currency | 2,248,951 |
| Forward foreign currency exchange contracts | (20,545,732) |
| Non-deliverable bond forward contracts | (972,046) |
| Net change in unrealized appreciation (depreciation) | $ 230,134,183 |
| Net realized and unrealized gain | $ 49,439,810 |
| Net increase in net assets from operations | $ 162,879,686 |
55
See Notes to Consolidated Financial Statements.
Global Macro Portfolio
October 31, 2023
Consolidated Statements of Changes in Net Assets
| | Year Ended October 31, |
| | 2023 | 2022 |
| Increase (Decrease) in Net Assets | | |
| From operations: | | |
| Net investment income | $ 113,439,876 | $ 119,196,721 |
| Net realized gain (loss) | (180,694,373) | 111,414,187 |
| Net change in unrealized appreciation (depreciation) | 230,134,183 | (321,533,185) |
| Net increase (decrease) in net assets from operations | $ 162,879,686 | $ (90,922,277) |
| Capital transactions: | | |
| Contributions | $ 98,428,362 | $ 115,421,518 |
| Withdrawals | (324,965,141) | (732,569,582) |
| Net decrease in net assets from capital transactions | $ (226,536,779) | $ (617,148,064) |
| Net decrease in net assets | $ (63,657,093) | $ (708,070,341) |
| Net Assets | | |
| At beginning of year | $ 1,855,793,544 | $ 2,563,863,885 |
| At end of year | $1,792,136,451 | $1,855,793,544 |
56
See Notes to Consolidated Financial Statements.
Global Macro Portfolio
October 31, 2023
Consolidated Financial Highlights
| | Year Ended October 31, |
| Ratios/Supplemental Data | 2023 | 2022 | 2021 | 2020 | 2019 |
| Ratios (as a percentage of average daily net assets): | | | | | |
| Expenses (1) | 1.01% (2) | 0.73% (2) | 0.70% | 0.66% | 0.65% |
| Net investment income | 6.26% | 5.49% | 4.60% | 4.53% | 5.41% |
| Portfolio Turnover | 96% | 81% | 88% | 81% | 61% |
| Total Return | 9.29% | (3.93)% | 4.52% | 4.03% | 6.56% |
| Net assets, end of year (000’s omitted) | $1,792,136 | $1,855,794 | $2,563,864 | $3,165,729 | $3,559,727 |
| (1) | Includes interest and/or dividend expense, including on securities sold short and/or reverse repurchase agreements if applicable, of 0.37%, 0.08%, 0.06%, 0.01% and 0.01% of average daily net assets for the years ended October 31, 2023, 2022, 2021, 2020 and 2019, respectively. |
| (2) | Includes a reduction by the investment adviser of a portion of its adviser fee due to the Portfolio’s investment in the Liquidity Fund (equal to 0.01% and less than 0.01% of average daily net assets for the years ended October 31, 2023 and 2022, respectively). |
Global Macro Portfolio
October 31, 2023
Notes to Consolidated Financial Statements
1 Significant Accounting Policies
Global Macro Portfolio (the Portfolio) is a Massachusetts business trust registered under the Investment Company Act of 1940, as amended (the 1940 Act), as a non-diversified, open-end management investment company. The Portfolio’s investment objective is total return. The Declaration of Trust permits the Trustees to issue interests in the Portfolio. At October 31, 2023, Eaton Vance Global Macro Absolute Return Fund held an interest of approximately 100% in the Portfolio.
The Portfolio seeks to gain exposure to the commodity markets, in whole or in part, through investments in Eaton Vance GMP Commodity Subsidiary, Ltd. (the Subsidiary), a wholly-owned subsidiary of the Portfolio organized under the laws of the Cayman Islands with the same objective and investment policies and restrictions as the Portfolio. The Portfolio may invest up to 25% of its total assets in the Subsidiary. The net assets of the Subsidiary at October 31, 2023 were $12,463,374 or 0.7% of the Portfolio’s consolidated net assets. The accompanying consolidated financial statements include the accounts of the Subsidiary. Intercompany balances and transactions have been eliminated in consolidation.
The following is a summary of significant accounting policies of the Portfolio. The policies are in conformity with accounting principles generally accepted in the United States of America (U.S. GAAP). The Portfolio is an investment company and follows accounting and reporting guidance in the Financial Accounting Standards Board (FASB) Accounting Standards Codification Topic 946.
A Investment Valuation—The following methodologies are used to determine the market value or fair value of investments.
Debt Obligations. Debt obligations are generally valued on the basis of valuations provided by third party pricing services, as derived from such services’ pricing models. Inputs to the models may include, but are not limited to, reported trades, executable bid and ask prices, broker/dealer quotations, prices or yields of securities with similar characteristics, interest rates, anticipated prepayments, benchmark curves or information pertaining to the issuer, as well as industry and economic events. The pricing services may use a matrix approach, which considers information regarding securities with similar characteristics to determine the valuation for a security. Short-term debt obligations purchased with a remaining maturity of sixty days or less for which a valuation from a third party pricing service is not readily available may be valued at amortized cost, which approximates fair value.
Senior Floating-Rate Loans. Interests in senior floating-rate loans (Senior Loans) are valued generally at the average mean of bid and ask quotations obtained from a third party pricing service.
Equity Securities. Equity securities listed on a U.S. securities exchange generally are valued at the last sale or closing price on the day of valuation or, if no sales took place on such date, at the mean between the closing bid and ask prices on the exchange where such securities are principally traded. Equity securities listed on the NASDAQ National Market System are valued at the NASDAQ official closing price. Unlisted or listed securities for which closing sales prices or closing quotations are not available are valued at the mean between the latest available bid and ask prices.
Derivatives. U.S. exchange-traded options are valued at the mean between the bid and ask prices at valuation time as reported by the Options Price Reporting Authority. Non-U.S. exchange-traded options and over-the-counter options (including options on securities, indices and foreign currencies) are valued by a third party pricing service using techniques that consider factors including the value of the underlying instrument, the volatility of the underlying instrument and the period of time until option expiration. Futures contracts are valued at the closing settlement price established by the board of trade or exchange on which they are traded, with adjustments for fair valuation for certain foreign futures contracts as described below. Forward foreign currency exchange contracts are generally valued at the mean of the average bid and average ask prices that are reported by currency dealers to a third party pricing service at the valuation time. Such third party pricing service valuations are supplied for specific settlement periods and the Portfolio’s forward foreign currency exchange contracts are valued at an interpolated rate between the closest preceding and subsequent settlement period reported by the third party pricing service. Swaps and options on credit default swaps ("swaptions") are normally valued using valuations provided by a third party pricing service. Such pricing service valuations are based on the present value of fixed and projected floating rate cash flows over the term of the swap contract, and in the case of credit default swaps, based on credit spread quotations obtained from broker/dealers and expected default recovery rates determined by the pricing service using proprietary models. In the case of total return swaps, pricing service valuations are based on the value of the underlying index or instrument and reference interest rate. Future cash flows on swaps are discounted to their present value using swap rates provided by electronic data services or by broker/dealers.
Foreign Securities, Futures Contracts and Currencies. Foreign securities, futures contracts and currencies are valued in U.S. dollars, based on foreign currency exchange rate quotations supplied by a third party pricing service. The pricing service uses a proprietary model to determine the exchange rate. Inputs to the model include reported trades and implied bid/ask spreads. The daily valuation of exchange-traded foreign securities and certain exchange-traded foreign futures contracts generally is determined as of the close of trading on the principal exchange on which such securities and contracts trade. Events occurring after the close of trading on foreign exchanges may result in adjustments to the valuation of foreign securities and certain foreign futures contracts to more accurately reflect their fair value as of the close of regular trading on the New York Stock Exchange. When valuing foreign equity securities and foreign futures contracts that meet certain criteria, the Portfolio’s Trustees have approved the use of a fair value service that values such securities and foreign futures contracts to reflect market trading that occurs after the close of the applicable foreign markets of comparable securities or other instruments that have a strong correlation to the fair-valued securities and foreign futures contracts.
Other. Investments in management investment companies (including money market funds) that do not trade on an exchange are valued at the net asset value as of the close of each business day.
Global Macro Portfolio
October 31, 2023
Notes to Consolidated Financial Statements — continued
Fair Valuation. In connection with Rule 2a-5 of the 1940 Act, the Trustees have designated the Portfolio’s investment adviser as its valuation designee. Investments for which valuations or market quotations are not readily available or are deemed unreliable are valued by the investment adviser, as valuation designee, at fair value using methods that most fairly reflect the security’s “fair value”, which is the amount that the Portfolio might reasonably expect to receive for the security upon its current sale in the ordinary course. Each such determination is based on a consideration of relevant factors, which are likely to vary from one pricing context to another. These factors may include, but are not limited to, the type of security, the existence of any contractual restrictions on the security’s disposition, the price and extent of public trading in similar securities of the issuer or of comparable companies or entities, quotations or relevant information obtained from broker/dealers or other market participants, information obtained from the issuer, analysts, and/or the appropriate stock exchange (for exchange-traded securities), an analysis of the company’s or entity’s financial statements, and an evaluation of the forces that influence the issuer and the market(s) in which the security is purchased and sold.
B Investment Transactions—Investment transactions for financial statement purposes are accounted for on a trade date basis. Realized gains and losses on investments sold are determined on the basis of identified cost.
C Income—Interest income is recorded on the basis of interest accrued, adjusted for amortization of premium or accretion of discount. Inflation adjustments to the principal amount of inflation-adjusted bonds and notes are reflected as interest income. Deflation adjustments to the principal amount of an inflation-adjusted bond or note are reflected as reductions to interest income to the extent of interest income previously recorded on such bond or note. Dividend income is recorded on the ex-dividend date for dividends received in cash and/or securities. However, if the ex-dividend date has passed, certain dividends from foreign securities are recorded as the Portfolio is informed of the ex-dividend date. Withholding taxes on foreign interest, dividends and capital gains have been provided for in accordance with the Portfolio's understanding of the applicable countries’ tax rules and rates. In consideration of recent decisions rendered by European courts, the Portfolio has filed additional tax reclaims for previously withheld taxes on dividends earned in certain European Union countries. These filings are subject to various administrative and judicial proceedings within these countries. Due to the uncertainty as to the ultimate resolution of these proceedings, the likelihood of receipt of these reclaims, and the potential timing of payment, no amounts are reflected in the Portfolio’s consolidated financial statements for such outstanding reclaims.
D Federal and Other Taxes—The Portfolio has elected to be treated as a partnership for federal tax purposes. No provision is made by the Portfolio for federal or state taxes on any taxable income of the Portfolio because each investor in the Portfolio is ultimately responsible for the payment of any taxes on its share of taxable income. Since at least one of the Portfolio’s investors is a regulated investment company that invests all or substantially all of its assets in the Portfolio, the Portfolio normally must satisfy the applicable source of income and diversification requirements (under the Internal Revenue Code) in order for its investors to satisfy them. The Portfolio will allocate, at least annually among its investors, each investor’s distributive share of the Portfolio’s net investment income, net realized capital gains and losses and any other items of income, gain, loss, deduction or credit.
In addition to the requirements of the Internal Revenue Code, the Portfolio may also be subject to local taxes on the recognition of capital gains in certain countries. In determining the daily net asset value, the Portfolio estimates the accrual for such taxes, if any, based on the unrealized appreciation on certain portfolio securities and the related tax rates. Taxes attributable to unrealized appreciation are included in the change in unrealized appreciation (depreciation) on investments. Capital gains taxes on securities sold are included in net realized gain (loss) on investments.
The Subsidiary is treated as a controlled foreign corporation under the Internal Revenue Code and is not expected to be subject to U.S. federal income tax. The Portfolio is treated as a U.S. shareholder of the Subsidiary. As a result, the Portfolio is required to include in gross income for U.S. federal tax purposes all of the Subsidiary’s income, whether or not such income is distributed by the Subsidiary. If a net loss is realized by the Subsidiary, such loss is not generally available to offset the income earned by the Portfolio.
As of October 31, 2023, the Portfolio had no uncertain tax positions that would require financial statement recognition, de-recognition, or disclosure. The Portfolio files a U.S. federal income tax return annually after its fiscal year-end, which is subject to examination by the Internal Revenue Service for a period of three years from the date of filing.
E Foreign Currency Translation—Investment valuations, other assets, and liabilities initially expressed in foreign currencies are translated each business day into U.S. dollars based upon current exchange rates. Purchases and sales of foreign investment securities and income and expenses denominated in foreign currencies are translated into U.S. dollars based upon currency exchange rates in effect on the respective dates of such transactions. Recognized gains or losses on investment transactions attributable to changes in foreign currency exchange rates are recorded for financial statement purposes as net realized gains and losses on investments. That portion of unrealized gains and losses on investments that results from fluctuations in foreign currency exchange rates is not separately disclosed.
F Unfunded Loan Commitments—The Portfolio may enter into certain loan agreements all or a portion of which may be unfunded. The Portfolio is obligated to fund these commitments at the borrower's discretion. These commitments, if any, are disclosed in the accompanying Consolidated Portfolio of Investments.
G Use of Estimates—The preparation of the consolidated financial statements in conformity with U.S. GAAP requires management to make estimates and assumptions that affect the reported amounts of assets and liabilities at the date of the consolidated financial statements and the reported amounts of income and expense during the reporting period. Actual results could differ from those estimates.
Global Macro Portfolio
October 31, 2023
Notes to Consolidated Financial Statements — continued
H Indemnifications—Under the Portfolio’s organizational documents, its officers and Trustees may be indemnified against certain liabilities and expenses arising out of the performance of their duties to the Portfolio. Under Massachusetts law, if certain conditions prevail, interestholders in the Portfolio could be deemed to have personal liability for the obligations of the Portfolio. However, the Portfolio’s Declaration of Trust contains an express disclaimer of liability on the part of Portfolio interestholders. Additionally, in the normal course of business, the Portfolio enters into agreements with service providers that may contain indemnification clauses. The Portfolio’s maximum exposure under these arrangements is unknown as this would involve future claims that may be made against the Portfolio that have not yet occurred.
I Futures Contracts—Upon entering into a futures contract, the Portfolio is required to deposit with the broker, either in cash or securities, an amount equal to a certain percentage of the contract amount (initial margin). Subsequent payments, known as variation margin, are made or received by the Portfolio each business day, depending on the daily fluctuations in the value of the underlying security, index or commodity, and are recorded as unrealized gains or losses by the Portfolio. Gains (losses) are realized upon the expiration or closing of the futures contracts. Should market conditions change unexpectedly, the Portfolio may not achieve the anticipated benefits of the futures contracts and may realize a loss. Futures contracts have minimal counterparty risk as they are exchange traded and the clearinghouse for the exchange is substituted as the counterparty, guaranteeing counterparty performance.
J Forward Foreign Currency Exchange and Non-Deliverable Bond Forward Contracts—The Portfolio may enter into forward foreign currency exchange contracts for the purchase or sale of a specific foreign currency at a fixed price on a future date. The forward foreign currency exchange contracts are adjusted by the daily exchange rate of the underlying currency and any gains or losses are recorded as unrealized until such time as the contracts have been closed. While forward foreign currency exchange contracts are privately negotiated agreements between the Portfolio and a counterparty, certain contracts may be “centrally cleared”, whereby all payments made or received by the Portfolio pursuant to the contract are with a central clearing party (CCP) rather than the original counterparty. The CCP guarantees the performance of the original parties to the contract. Upon entering into centrally cleared contracts, the Portfolio is required to deposit with the CCP, either in cash or securities, an amount of initial margin determined by the CCP, which is subject to adjustment. For centrally cleared contracts, the daily change in valuation is recorded as a receivable or payable for variation margin and settled in cash with the CCP daily. The Portfolio may also enter into non-deliverable bond forward contracts for the purchase of a bond denominated in a non-deliverable foreign currency at a fixed price on a future date. For non-deliverable bond forward contracts, unrealized gains and losses, based on changes in the value of the contract, and realized gains and losses are accounted for as described above. Risks may arise upon entering these contracts from the potential inability of counterparties to meet the terms of their contracts and from movements in the value of a foreign currency relative to the U.S. dollar. In the case of centrally cleared contracts, counterparty risk is minimal due to protections provided by the CCP.
K Purchased Options—Upon the purchase of a call or put option, the premium paid by the Portfolio is included in the Consolidated Statement of Assets and Liabilities as an investment. The amount of the investment is subsequently marked-to-market to reflect the current market value of the option purchased, in accordance with the Portfolio’s policies on investment valuations discussed above. Premiums paid for purchasing options that expire are treated as realized losses. Premiums paid for purchasing options that are exercised or closed are added to the amounts paid or offset against the proceeds on the underlying investment transaction to determine the realized gain or loss. The risk associated with purchasing options is limited to the premium originally paid. Purchased options traded over-the-counter involve risk that the issuer or counterparty will fail to perform its contractual obligations.
L Written Options—Upon the writing of a call or a put option, the premium received by the Portfolio is included in the Consolidated Statement of Assets and Liabilities as a liability. The amount of the liability is subsequently marked-to-market to reflect the current market value of the option written, in accordance with the Portfolio’s policies on investment valuations discussed above. Premiums received from writing options that expire are treated as realized gains. Premiums received from writing options that are exercised or are closed are added to or offset against the proceeds or amount paid on the transaction to determine the realized gain or loss. The Portfolio, as a writer of an option, may have no control over whether the underlying instruments may be sold (call) or purchased (put) and, as a result, bears the market risk of an unfavorable change in the price of the instruments underlying the written option. The Portfolio may also bear the risk of not being able to enter into a closing transaction if a liquid secondary market does not exist.
M Interest Rate Swaps—Swap contracts are privately negotiated agreements between the Portfolio and a counterparty. Certain swap contracts may be centrally cleared. Pursuant to interest rate swap agreements, the Portfolio either makes floating-rate payments to the counterparty (or CCP in the case of centrally cleared swaps) based on a benchmark interest rate in exchange for fixed-rate payments or the Portfolio makes fixed-rate payments to the counterparty (or CCP in the case of a centrally cleared swap) in exchange for payments on a floating benchmark interest rate. Payments received or made, including amortization of upfront payments/receipts, if any (which are amortized over the life of the swap contract), are recorded as realized gains or losses. During the term of the outstanding swap agreement, changes in the underlying value of the swap are recorded as unrealized gains or losses. For centrally cleared swaps, the daily change in valuation is recorded as a receivable or payable for variation margin and settled in cash with the CCP daily. The value of the swap is determined by changes in the relationship between two rates of interest. The Portfolio is exposed to credit loss in the event of non-performance by the swap counterparty. In the case of centrally cleared swaps, counterparty risk is minimal due to protections provided by the CCP. Risk may also arise from movements in interest rates.
N Inflation Swaps—Pursuant to inflation swap agreements, the Portfolio either makes floating-rate payments to the counterparty (or CCP in the case of centrally cleared swaps) based on a benchmark index in exchange for fixed-rate payments or the Portfolio makes fixed-rate payments to the counterparty (or CCP in the case of centrally cleared swaps) in exchange for floating-rate payments based on the return of a benchmark index. By design, the benchmark index is an inflation index, such as the Consumer Price Index. The accounting policy for payments received or made and changes in the underlying value of
Global Macro Portfolio
October 31, 2023
Notes to Consolidated Financial Statements — continued
the inflation swap are the same as for interest rate swaps as described above. The value of the swap is determined by changes in the relationship between the rate of interest and the benchmark index. The Portfolio is exposed to credit loss in the event of nonperformance by the swap counterparty. In the case of centrally cleared swaps, counterparty risk is minimal due to protections provided by the CCP. Risk may also arise from the unanticipated movements in value of interest rates or the index.
O Cross-Currency Swaps—Cross-currency swaps are interest rate swaps in which interest cash flows are exchanged between two parties based on the notional amounts of two different currencies. The notional amounts are typically determined based on the spot exchange rates at the inception of the trade. Cross-currency swaps also involve the exchange of the notional amounts at the start of the contract at the current spot rate with an agreement to re-exchange such amounts at a later date at either the same exchange rate, a specified rate or the then current spot rate. The entire principal value of a cross-currency swap is subject to the risk that the counterparty to the swap will default on its contractual delivery obligations.
P Credit Default Swaps—When the Portfolio is the buyer of a credit default swap contract, the Portfolio is entitled to receive the par (or other agreed-upon) value of a referenced debt obligation (or basket of debt obligations) from the counterparty (or CCP in the case of a centrally cleared swap) to the contract if a credit event by a third party, such as a U.S. or foreign corporate issuer or sovereign issuer, on the debt obligation occurs. In return, the Portfolio pays the counterparty a periodic stream of payments over the term of the contract provided that no credit event has occurred. If no credit event occurs, the Portfolio would have spent the stream of payments and received no proceeds from the contract. When the Portfolio is the seller of a credit default swap contract, it receives the stream of payments, but is obligated to pay to the buyer of the protection an amount up to the notional amount of the swap and in certain instances take delivery of securities of the reference entity upon the occurrence of a credit event, as defined under the terms of that particular swap agreement. Credit events are contract specific but may include bankruptcy, failure to pay, restructuring, obligation acceleration and repudiation/moratorium. If the Portfolio is a seller of protection and a credit event occurs, the maximum potential amount of future payments that the Portfolio could be required to make would be an amount equal to the notional amount of the agreement. This potential amount would be partially offset by any recovery value of the respective referenced obligation, or net amount received from the settlement of a buy protection credit default swap agreement entered into by the Portfolio for the same referenced obligation. As the seller, the Portfolio may create economic leverage to its portfolio because, in addition to its total net assets, the Portfolio is subject to investment exposure on the notional amount of the swap. The interest fee paid or received on the swap contract, which is based on a specified interest rate on a fixed notional amount, is accrued daily as a component of unrealized appreciation (depreciation) and is recorded as realized gain upon receipt or realized loss upon payment. The Portfolio also records an increase or decrease to unrealized appreciation (depreciation) in an amount equal to the daily valuation. For centrally cleared swaps, the daily change in valuation is recorded as a receivable or payable for variation margin and settled in cash with the CCP daily. All upfront payments and receipts, if any, are amortized over the life of the swap contract as realized gains or losses. Those upfront payments or receipts for non-centrally cleared swaps are recorded as other assets or other liabilities, respectively, net of amortization. For financial reporting purposes, unamortized upfront payments or receipts, if any, are netted with unrealized appreciation or depreciation on swap contracts to determine the market value of swaps as presented in Notes 6 and 10. These transactions involve certain risks, including the risk that the seller may be unable to fulfill the transaction. In the case of centrally cleared swaps, counterparty risk is minimal due to protections provided by the CCP.
Q Total Return Swaps—In a total return swap, the buyer receives a periodic return equal to the total return of a specified security, securities or index for a specified period of time. In return, the buyer pays the counterparty a fixed or variable stream of payments, typically based upon short-term interest rates, possibly plus or minus an agreed upon spread. During the term of the outstanding swap agreement, changes in the underlying value of the swap are recorded as unrealized gains and losses. Periodic payments received or made are recorded as realized gains or losses. The Portfolio is exposed to credit loss in the event of nonperformance by the swap counterparty. Risk may also arise from the unanticipated movements in value of exchange rates, interest rates, securities, or the index.
R Swaptions—A purchased swaption contract grants the Portfolio, in return for payment of the purchase price, the right, but not the obligation, to enter into a new swap agreement or to shorten, extend, cancel or otherwise modify an existing swap agreement, at some designated future time on specified terms. When the Portfolio purchases a swaption, the premium paid to the writer is recorded as an investment and subsequently marked-to-market to reflect the current value of the swaption. A written swaption gives the Portfolio the obligation, if exercised by the purchaser, to enter into a swap contract according to the terms of the underlying agreement. When the Portfolio writes a swaption, the premium received by the Portfolio is recorded as a liability and subsequently marked-to-market to reflect the current value of the swaption. When a swaption is exercised, the cost of the swap is adjusted by the amount of the premium paid or received. When a swaption expires or an unexercised swaption is closed, a gain or loss is recognized in the amount of the premium paid or received, plus the cost to close. The Portfolio’s risk for purchased swaptions is limited to the premium paid. The writer of a swaption bears the risk of unfavorable changes in the preset terms of the underlying swap contract. Purchased swaptions traded over-the-counter involve risk that the issuer or counterparty will fail to perform its contractual obligations.
S Repurchase Agreements—A repurchase agreement is the purchase by the Portfolio of securities from a counterparty in exchange for cash that is coupled with an agreement to resell those securities to the counterparty at a specified date and price. When a repurchase agreement is entered, the Portfolio typically receives securities with a value that equals or exceeds the repurchase price, including any accrued interest earned on the agreement. The value of such securities will be marked-to-market daily, and cash or additional securities will be exchanged between the parties as needed. Except in the case of a repurchase agreement entered to settle a short sale, the value of the securities delivered to the Portfolio will be at least equal to 90% of the repurchase price during the term of the repurchase agreement. The terms of a repurchase agreement entered to settle a short sale may provide that the cash purchase price paid by the Portfolio is more than the value of purchased securities that effectively collateralize the repurchase price payable by the
Global Macro Portfolio
October 31, 2023
Notes to Consolidated Financial Statements — continued
counterparty. In the event of insolvency of the counterparty to a repurchase agreement, recovery of the repurchase price owed to the Portfolio may be delayed. Such an insolvency also may result in a loss to the extent that the value of the purchased securities decreases during the delay or that value has otherwise not been maintained at an amount at least equal to the repurchase price.
T Reverse Repurchase Agreements—Under a reverse repurchase agreement, the Portfolio temporarily transfers possession of a portfolio security to another party, such as a bank or broker/dealer, in return for cash. At the same time, the Portfolio agrees to repurchase the security at an agreed upon time and price, which reflects an interest payment. In periods of increased demand for a security, the Portfolio may receive a payment from the counterparty for the use of the security, which is recorded as interest income. Because the Portfolio retains effective control over the transferred security, the transaction is accounted for as a secured borrowing. The Portfolio may enter into such agreements when it believes it is able to invest the cash acquired at a rate higher than the cost of the agreement, which would increase earned income. When the Portfolio enters into a reverse repurchase agreement, any fluctuations in the market value of either the securities transferred to another party or the securities in which the proceeds may be invested would affect the market value of the Portfolio’s assets. Because reverse repurchase agreements may be considered to be the practical equivalent of borrowing funds (and the counterparty making a loan), they constitute a form of leverage. The Portfolio segregates cash or liquid assets equal to its obligation to repurchase the security. During the term of the agreement, the Portfolio may also be obligated to pledge additional cash and/or securities in the event of a decline in the fair value of the transferred security. In the event the counterparty to a reverse repurchase agreement becomes insolvent, recovery of the security transferred by the Portfolio may be delayed or the Portfolio may incur a loss equal to the amount by which the value of the security transferred by the Portfolio exceeds the repurchase price payable by the Portfolio.
U Securities Sold Short—A short sale is a transaction in which the Portfolio sells a security it does not own in anticipation of a decline in the market value of that security. To complete such a transaction, the Portfolio must borrow the security to make delivery to the buyer with an obligation to replace such borrowed security at a later date. Until the security is replaced, the Portfolio is required to repay the lender any dividends or interest, which accrue during the period of the loan. The proceeds received from a short sale are recorded as a liability and the Portfolio records an unrealized gain or loss to the extent of the difference between the proceeds received and the value of the open short position on the day of determination. A gain, limited to the price at which the Portfolio sold the security short, or a loss, potentially unlimited as there is no upward limit on the price of a security, is recorded when the short position is terminated. Interest and dividends payable on securities sold short are recorded as an expense.
V Stripped Mortgage-Backed Securities—The Portfolio may invest in Interest Only (IO) and Principal Only (PO) securities, forms of stripped mortgage-backed securities, whereby the IO security receives all the interest and the PO security receives all the principal on a pool of mortgage assets. The yield to maturity on an IO security is extremely sensitive to the rate of principal payments (including prepayments) on the related underlying mortgage assets, and a rapid rate of principal payments may have a material adverse effect on the yield to maturity from these securities. If the underlying mortgages experience greater than anticipated prepayments of principal, the Portfolio may fail to recoup its initial investment in an IO security. The market value of IO and PO securities can be unusually volatile due to changes in interest rates.
2 Investment Adviser Fee and Other Transactions with Affiliates
The investment adviser fee is earned by Boston Management and Research (BMR), an indirect, wholly-owned subsidiary of Morgan Stanley, as compensation for investment advisory services rendered to the Portfolio and the Subsidiary. The Portfolio and Subsidiary each pay BMR a fee computed at an annual rate as a percentage of its respective average daily net assets as follows and is payable monthly:
| Average Daily Net Assets | Annual Fee Rate |
| Up to $500 million | 0.615% |
| $500 million but less than $1 billion | 0.595% |
| $1 billion but less than $1.5 billion | 0.575% |
| $1.5 billion but less than $2 billion | 0.555% |
| $2 billion but less than $3 billion | 0.520% |
| $3 billion but less than $5 billion | 0.490% |
| $5 billion but less than $10 billion | 0.475% |
| $10 billion and over | 0.465% |
BMR contractually agreed to reduce its investment advisory fee rate on average daily net assets of $5 billion and over from 0.490% to the rates as stated above. This contractual reduction cannot be terminated or reduced without Trustee and shareholder approval. In determining the investment adviser fee for the Portfolio and Subsidiary, the applicable advisory fee rate is based on the average daily net assets of the Portfolio (inclusive of its interest in the Subsidiary). Such fee rate is then assessed separately on the Portfolio’s average daily net assets (exclusive of its interest in the Subsidiary) and the Subsidiary’s average daily net assets to determine the amount of the investment adviser fee. For the year ended October 31, 2023, the Portfolio’s investment adviser fee amounted to $10,641,313 or 0.59% of the Portfolio’s consolidated average daily net assets.
Global Macro Portfolio
October 31, 2023
Notes to Consolidated Financial Statements — continued
The Portfolio may invest in a money market fund, the Institutional Class of the Morgan Stanley Institutional Liquidity Funds - Government Portfolio (the “Liquidity Fund”), an open-end management investment company managed by Morgan Stanley Investment Management Inc., a wholly-owned subsidiary of Morgan Stanley. The investment adviser fee paid by the Portfolio is reduced by an amount equal to its pro rata share of the advisory and administration fees paid by the Portfolio due to its investment in the Liquidity Fund. For the year ended October 31, 2023, the investment adviser fee paid was reduced by $245,091 relating to the Portfolio’s investment in the Liquidity Fund.
Pursuant to an investment sub-advisory agreement, BMR has delegated a portion of the investment management of the Portfolio to Eaton Vance Advisers International Ltd. (EVAIL), an affiliate of BMR and an indirect, wholly-owned subsidiary of Morgan Stanley. BMR pays EVAIL a portion of its investment adviser fee for sub-advisory services provided to the Portfolio.
Trustees and officers of the Portfolio who are members of BMR’s organization receive remuneration for their services to the Portfolio out of the investment adviser fee. Trustees of the Portfolio who are not affiliated with the investment adviser may elect to defer receipt of all or a percentage of their annual fees in accordance with the terms of the Trustees Deferred Compensation Plan. Certain officers and Trustees of the Portfolio are officers of the above organization.
3 Purchases and Sales of Investments
Purchases and sales of investments, other than short-term obligations and including maturities, paydowns and securities sold short, for the year ended October 31, 2023 were as follows:
| | Purchases | Sales |
| Investments (non-U.S. Government) | $ 1,107,751,761 | $ 1,326,529,017 |
| U.S. Government and Agency Securities | 221,012,931 | 158,390,970 |
| | $1,328,764,692 | $1,484,919,987 |
4 Federal Income Tax Basis of Investments
The cost and unrealized appreciation (depreciation) of investments of the Portfolio, including open derivative contracts and the Portfolio's investment in the Subsidiary at October 31, 2023, as determined on a federal income tax basis, were as follows:
| Aggregate cost | $1,935,429,664 |
| Gross unrealized appreciation | $ 33,614,311 |
| Gross unrealized depreciation | (292,269,435) |
| Net unrealized depreciation | $ (258,655,124) |
Global Macro Portfolio
October 31, 2023
Notes to Consolidated Financial Statements — continued
5 Restricted Securities
At October 31, 2023, the Portfolio owned the following securities (representing 0.7% of net assets) which were restricted as to public resale and not registered under the Securities Act of 1933 (excluding Rule 144A securities). The Portfolio has various registration rights (exercisable under a variety of circumstances) with respect to these securities. The value of these securities is determined based on valuations provided by brokers when available, or if not available, they are valued at fair value using methods determined in good faith by or at the direction of the Trustees’ valuation designee.
| Description | Date(s) of
Acquisition | Shares | Cost | Value |
| Reinsurance Side Cars | | | | |
| Mt. Logan Re, Ltd., Series A-1 | 12/30/20 | 4,400 | $ 4,400,000 | $ 5,206,235 |
| Sussex Capital, Ltd., Designated Investment Series 16, 12/21 | 11/30/22 | 817 | 811,902 | 15,233 |
| Sussex Capital, Ltd., Designated Investment Series 16, 11/22 | 1/24/22 | 793 | 792,084 | 439,382 |
| Sussex Capital, Ltd., Series 16, Preference Shares | 6/1/21 | 5,500 | 3,896,014 | 6,031,506 |
| Total Restricted Securities | | | $9,900,000 | $11,692,356 |
6 Financial Instruments
The Portfolio may trade in financial instruments with off-balance sheet risk in the normal course of its investing activities. These financial instruments may include written options, swaptions, forward foreign currency exchange contracts, non-deliverable bond forward contracts, futures contracts and swap contracts and may involve, to a varying degree, elements of risk in excess of the amounts recognized for financial statement purposes. The notional or contractual amounts of these instruments represent the investment the Portfolio has in particular classes of financial instruments and do not necessarily represent the amounts potentially subject to risk. The measurement of the risks associated with these instruments is meaningful only when all related and offsetting transactions are considered. A summary of obligations under these financial instruments at October 31, 2023 is included in the Consolidated Portfolio of Investments. At October 31, 2023, the Portfolio had sufficient cash and/or securities to cover commitments under these contracts.
In the normal course of pursuing its investment objective, the Portfolio is subject to the following risks:
Commodity Risk: The Portfolio invests in commodities-linked derivative instruments, including commodity futures contracts and total return swap contracts based on commodity indices, that provide exposure to the investment returns of certain commodities. Commodities-linked derivative instruments are used to enhance total return and/or as a substitute for the purchase or sale of commodities and to manage certain investment risks.
Credit Risk: During the year ended October 31, 2023, the Portfolio entered into credit default swap contracts and swaptions to manage certain investment risks and/or to enhance total return or as a substitute for the purchase or sale of securities.
Equity Price Risk: The Portfolio enters into equity index futures contracts and total return swaps to enhance total return and/or to manage certain investment risks.
Foreign Exchange Risk: The Portfolio engages in forward foreign currency exchange contracts, currency options and cross-currency swaps to enhance total return, to seek to hedge against fluctuations in currency exchange rates and/or as a substitute for the purchase or sale of securities or currencies.
Interest Rate Risk: During the year ended October 31, 2023, the Portfolio utilized various interest rate derivatives including non-deliverable bond forward contracts, interest rate futures contracts, interest rate swaps, inflation swaps, cross-currency swaps and option contracts to enhance total return, to seek to hedge against fluctuations in interest rates and/or to change the effective duration of its portfolio.
The Portfolio enters into over-the-counter (OTC) derivatives that may contain provisions whereby the counterparty may terminate the contract under certain conditions, including but not limited to a decline in the Portfolio’s net assets below a certain level over a certain period of time, which would trigger a payment by the Portfolio for those derivatives in a liability position. At October 31, 2023, the fair value of derivatives with credit-related contingent features in a net liability position was $13,529,808. The aggregate fair value of assets pledged as collateral by the Portfolio for such liability was $13,267,172 at October 31, 2023.
The OTC derivatives in which the Portfolio invests (except for written options as the Portfolio, not the counterparty, is obligated to perform) are subject to the risk that the counterparty to the contract fails to perform its obligations under the contract. To mitigate this risk, the Portfolio (and Subsidiary) has entered into an International Swaps and Derivatives Association, Inc. Master Agreement (“ISDA Master Agreement”) or similar agreement with substantially all its derivative counterparties. An ISDA Master Agreement is a bilateral agreement between the Portfolio and a counterparty that governs certain OTC derivatives and typically contains, among other things, set-off provisions in the event of a default and/or termination event as defined under the relevant ISDA Master Agreement. Under an ISDA Master Agreement, the Portfolio (and Subsidiary) may, under certain circumstances, offset with the counterparty certain derivative financial instruments’ payables and/or receivables with collateral held and/or posted and create one single net payment. The provisions of
Global Macro Portfolio
October 31, 2023
Notes to Consolidated Financial Statements — continued
the ISDA Master Agreement typically permit a single net payment in the event of default including the bankruptcy or insolvency of the counterparty. However, bankruptcy or insolvency laws of a particular jurisdiction may impose restrictions on or prohibitions against the right of offset in bankruptcy or insolvency. Certain ISDA Master Agreements allow counterparties to OTC derivatives to terminate derivative contracts prior to maturity in the event the Portfolio’s net assets decline by a stated percentage or the Portfolio fails to meet the terms of its ISDA Master Agreements, which would cause the counterparty to accelerate payment by the Portfolio of any net liability owed to it.
The collateral requirements for derivatives traded under an ISDA Master Agreement are governed by a Credit Support Annex to the ISDA Master Agreement. Collateral requirements are determined at the close of business each day and are typically based on changes in market values for each transaction under an ISDA Master Agreement and netted into one amount for such agreement. Generally, the amount of collateral due from or to a counterparty is subject to a minimum transfer threshold amount before a transfer is required, which may vary by counterparty. Collateral pledged for the benefit of the Portfolio (and Subsidiary) and/or counterparty is held in segregated accounts by the Portfolio’s custodian and cannot be sold, re-pledged, assigned or otherwise used while pledged. The portion of such collateral representing cash, if any, is reflected as deposits for derivatives collateral and, in the case of cash pledged by a counterparty for the benefit of the Portfolio, a corresponding liability on the Consolidated Statement of Assets and Liabilities. Securities pledged by the Portfolio as collateral, if any, are identified as such in the Consolidated Portfolio of Investments. The carrying amount of the liability for cash collateral due to brokers at October 31, 2023 approximated its fair value. If measured at fair value, such liability would have been considered as Level 2 in the fair value hierarchy (see Note 10) at October 31, 2023. Because the Subsidiary is not registered under the 1940 Act, it may not be able to negotiate terms with its counterparties that are equivalent to those a registered portfolio may negotiate. As a result, the Subsidiary may have greater exposure to those counterparties than a registered portfolio.
Global Macro Portfolio
October 31, 2023
Notes to Consolidated Financial Statements — continued
The fair value of open derivative instruments (not considered to be hedging instruments for accounting disclosure purposes) by risk exposure at October 31, 2023 was as follows:
| | Fair Value |
| Consolidated Statement of Assets and Liabilities Caption | Commodity | Credit | Equity
Price | Foreign
Exchange | Interest
Rate | Total |
| Unaffiliated investments, at value | $ — | $ — | $ — | $ 332,156 | $ — | $ 332,156 |
| Not applicable | — | 18,836,245* | 1,194,728* | 5,766,460* | 22,306,097* | 48,103,530 |
| Receivable for open forward foreign currency exchange contracts | — | — | — | 6,849,412 | — | 6,849,412 |
| Receivable/Payable for open swap contracts; Upfront payments/receipts on open non-centrally cleared swap contracts | 23,710 | 1,264,996 | — | — | 464,805 | 1,753,511 |
| Total Asset Derivatives | $ 23,710 | $ 20,101,241 | $1,194,728 | $ 12,948,028 | $ 22,770,902 | $ 57,038,609 |
| Derivatives not subject to master netting or similar agreements | $ — | $ 18,836,245 | $1,194,728 | $ 5,766,460 | $ 22,306,097 | $ 48,103,530 |
| Total Asset Derivatives subject to master netting or similar agreements | $ 23,710 | $ 1,264,996 | $ — | $ 7,181,568 | $ 464,805 | $ 8,935,079 |
| Written options outstanding, at value | $ — | $ — | $ — | $ (87,249) | $ — | $ (87,249) |
| Not applicable | (266,159)* | (9,828,413)* | (292,575)* | (587,433)* | (21,013,104)* | (31,987,684) |
| Payable for open forward foreign currency exchange contracts | — | — | — | (11,584,022) | — | (11,584,022) |
| Payable/Receivable for open swap contracts; Upfront payments/receipts on open non-centrally cleared swap contracts | (3,541) | (693,447) | (652,560) | — | (508,989) | (1,858,537) |
| Total Liability Derivatives | $(269,700) | $(10,521,860) | $ (945,135) | $(12,258,704) | $(21,522,093) | $(45,517,492) |
| Derivatives not subject to master netting or similar agreements | $(266,159) | $ (9,828,413) | $ (292,575) | $ (587,433) | $(21,013,104) | $(31,987,684) |
| Total Liability Derivatives subject to master netting or similar agreements | $ (3,541) | $ (693,447) | $ (652,560) | $(11,671,271) | $ (508,989) | $(13,529,808) |
| * | Only the current day’s variation margin on open futures contracts and centrally cleared derivatives is reported within the Consolidated Statement of Assets and Liabilities as Receivable or Payable for variation margin on open financial futures contracts and centrally cleared derivatives, as applicable. |
The Portfolio's derivative assets and liabilities at fair value by risk, which are reported gross in the Consolidated Statement of Assets and Liabilities, are presented in the table above. The following tables present the Portfolio's derivative assets and liabilities by counterparty, net of amounts available for offset under a master netting agreement and net of the related collateral received by the Portfolio (and Subsidiary) for such assets and pledged by the Portfolio (and Subsidiary) for such liabilities as of October 31, 2023.
| Counterparty | Derivative
Assets Subject to
Master Netting
Agreement | Derivatives
Available
for Offset | Non-cash
Collateral
Received(a) | Cash
Collateral
Received(a) | Net Amount
of Derivative
Assets(b) | Total Cash
Collateral
Received |
| Barclays Bank PLC | $ 988,235 | $ (249,190) | $ — | $ (520,000) | $ 219,045 | $ 520,000 |
| BNP Paribas | 1,944,346 | (1,724,071) | — | (220,275) | — | 270,000 |
| Citibank, N.A. | 1,872,583 | (1,872,583) | — | — | — | — |
| Goldman Sachs International | 1,647,337 | (1,518,823) | — | (128,514) | — | 530,000 |
Global Macro Portfolio
October 31, 2023
Notes to Consolidated Financial Statements — continued
| Counterparty | Derivative
Assets Subject to
Master Netting
Agreement | Derivatives
Available
for Offset | Non-cash
Collateral
Received(a) | Cash
Collateral
Received(a) | Net Amount
of Derivative
Assets(b) | Total Cash
Collateral
Received |
| HSBC Bank USA, N.A. | $ 257,088 | $ (257,088) | $ — | $ — | $ — | $ — |
| ICBC Standard Bank plc | 21,524 | (21,524) | — | — | — | — |
| JPMorgan Chase Bank, N.A. | 301,483 | (301,483) | — | — | — | — |
| Societe Generale | 30,192 | (30,192) | — | — | — | — |
| Standard Chartered Bank | 466,546 | (466,546) | — | — | — | — |
| State Street Bank and Trust Company | 37,707 | (18,011) | — | — | 19,696 | — |
| UBS AG | 1,368,038 | (963,659) | (404,379) | — | — | — |
| | $8,935,079 | $(7,423,170) | $(404,379) | $(868,789) | $238,741 | $1,320,000 |
| Counterparty | Derivative
Liabilities Subject to
Master Netting
Agreement | Derivatives
Available
for Offset | Non-cash
Collateral
Pledged(a) | Cash
Collateral
Pledged(a) | Net Amount
of Derivative
Liabilities(c) | Total Cash
Collateral
Pledged |
| Bank of America, N.A. | $ (401,826) | $ — | $ 392,110 | $ — | $ (9,716) | $ — |
| Barclays Bank PLC | (249,190) | 249,190 | — | — | — | — |
| BNP Paribas | (1,724,071) | 1,724,071 | — | — | — | — |
| Citibank, N.A. | (2,426,652) | 1,872,583 | 554,069 | — | — | — |
| Deutsche Bank AG | (235,353) | — | 198,153 | — | (37,200) | — |
| Goldman Sachs International | (1,518,823) | 1,518,823 | — | — | — | — |
| HSBC Bank USA, N.A. | (1,001,419) | 257,088 | 744,331 | — | — | — |
| ICBC Standard Bank plc | (138,434) | 21,524 | — | — | (116,910) | — |
| JPMorgan Chase Bank, N.A. | (1,151,515) | 301,483 | 630,306 | — | (219,726) | — |
| Nomura International PLC | (71,103) | — | 71,103 | — | — | — |
| Societe Generale | (357,742) | 30,192 | 327,550 | — | — | — |
| Standard Chartered Bank | (3,272,010) | 466,546 | 2,805,464 | — | — | — |
| State Street Bank and Trust Company | (18,011) | 18,011 | — | — | — | — |
| UBS AG | (963,659) | 963,659 | — | — | — | — |
| | $(13,529,808) | $7,423,170 | $5,723,086 | $ — | $(383,552) | $ — |
| Total — Deposits for derivatives collateral — OTC derivatives | | | | $1,320,000 |
| (a) | In some instances, the total collateral received and/or pledged may be more than the amount shown due to overcollateralization. |
| (b) | Net amount represents the net amount due from the counterparty in the event of default. |
| (c) | Net amount represents the net amount payable to the counterparty in the event of default. |
Information with respect to reverse repurchase agreements at October 31, 2023 is included at Note 8.
Global Macro Portfolio
October 31, 2023
Notes to Consolidated Financial Statements — continued
The effect of derivative instruments (not considered to be hedging instruments for accounting disclosure purposes) on the Consolidated Statement of Operations by risk exposure for the year ended October 31, 2023 was as follows:
| Consolidated Statement of Operations Caption | Commodity | Credit | Equity
Price | Foreign
Exchange | Interest
Rate | Total |
| Net realized gain (loss): | | | | | | |
| Investment transactions | $ — | $ — | $ — | $ 1,289,677 | $ (2,099,103) | $ (809,426) |
| Written options | — | — | — | 920 | — | 920 |
| Futures contracts | 1,483,967 | — | (2,008,338) | — | 17,624,036 | 17,099,665 |
| Swap contracts | 797,411 | (21,098,425) | (3,084,061) | 215,214 | 10,930,216 | (12,239,645) |
| Forward foreign currency exchange contracts | — | — | — | 3,519,479 | — | 3,519,479 |
| Non-deliverable bond forward contracts | — | — | — | — | 6,414,099 | 6,414,099 |
| Total | $ 2,281,378 | $(21,098,425) | $(5,092,399) | $ 5,025,290 | $ 32,869,248 | $ 13,985,092 |
| Change in unrealized appreciation (depreciation): | | | | | | |
| Investments | $ — | $ — | $ — | $ (77,671) | $ 1,284,282 | $ 1,206,611 |
| Written options | — | — | — | 58,487 | — | 58,487 |
| Futures contracts | (4,314,200) | — | 1,236,258 | — | (16,663,331) | (19,741,273) |
| Swap contracts | 20,169 | 2,282,027 | (652,560) | — | (20,139,129) | (18,489,493) |
| Forward foreign currency exchange contracts | — | — | — | (20,545,732) | — | (20,545,732) |
| Non-deliverable bond forward contracts | — | — | — | — | (972,046) | (972,046) |
| Total | $(4,294,031) | $ 2,282,027 | $ 583,698 | $(20,564,916) | $(36,490,224) | $(58,483,446) |
The average notional cost of futures contracts and average notional amounts of other derivative contracts outstanding during the year ended October 31, 2023, which are indicative of the volume of these derivative types, were approximately as follows:
Futures
Contracts — Long | Futures
Contracts — Short | Forward
Foreign Currency
Exchange Contracts* | Non-Deliverable
Bond Forward
Contracts | Purchased
Swaptions |
| $51,334,000 | $393,733,000 | $1,711,174,000 | $67,834,000 | $21,538,000 |
Purchased Call
Options | Swap
Contracts |
| $166,277,000 | $2,672,895,000 |
| * | The average notional amount for forward foreign currency exchange contracts is based on the absolute value of notional amounts of currency purchased and currency sold. |
The average principal amount of purchased and written currency options contracts outstanding during the year ended October 31, 2023, which are indicative of the volume of these derivative types, were approximately $46,079,000 and $34,948,000, respectively.
Global Macro Portfolio
October 31, 2023
Notes to Consolidated Financial Statements — continued
7 Line of Credit
The Portfolio participates with other portfolios and funds managed by BMR and its affiliates in a $650 million unsecured revolving line of credit agreement with a group of banks, which is in effect through October 22, 2024. In connection with the renewal of the agreement on October 24, 2023, the borrowing limit was decreased from $725 million. Borrowings are made by the Portfolio solely for temporary purposes related to redemptions and other short-term cash needs. Interest is charged to the Portfolio based on its borrowings at an amount above either the Secured Overnight Financing Rate (SOFR) or Federal Funds rate. In addition, a fee computed at an annual rate of 0.15% on the daily unused portion of the line of credit is allocated among the participating portfolios and funds at the end of each quarter. In connection with the renewal of the agreement in October 2023, an arrangement fee totaling $150,000 was incurred that was allocated to the participating portfolios and funds. Because the line of credit is not available exclusively to the Portfolio, it may be unable to borrow some or all of its requested amounts at any particular time. The Portfolio did not have any significant borrowings or allocated fees during the year ended October 31, 2023.
8 Reverse Repurchase Agreements
Reverse repurchase agreements outstanding as of October 31, 2023 were as follows:
| Counterparty | Trade
Date | Maturity
Date | Interest
Rate Paid
(Received) | Principal
Amount | Value
Including
Accrued
Interest |
| Barclays Bank PLC | 9/29/23 | On Demand(1) | 5.65% | $ 8,948,568 | $ 8,987,892 |
| Barclays Bank PLC | 10/16/23 | On Demand(1) | 5.65 | 9,943,612 | 9,963,901 |
| Total | | | | $18,892,180 | $18,951,793 |
| (1) | Open reverse repurchase agreement with no specific maturity date. Either party may terminate the agreement upon demand. |
At October 31, 2023, the type of securities pledged as collateral for all open reverse repurchase agreements was Sovereign Government Bonds.
For the year ended October 31, 2023, the average borrowings under settled reverse repurchase agreements and the net average interest rate paid (received) were approximately $3,123,000 and (0.12)%, respectively. Based on the short-term nature of the borrowings under the reverse repurchase agreements, the carrying value of the payable for reverse repurchase agreements approximated its fair value at October 31, 2023. If measured at fair value, borrowings under the reverse repurchase agreements would have been considered as Level 2 in the fair value hierarchy (see Note 10) at October 31, 2023.
Reverse repurchase agreements entered into by the Portfolio are subject to Master Repurchase Agreements (MRA), which permit the Portfolio, under certain circumstances, including an event of default (such as bankruptcy or insolvency), to offset payables and/or receivables under the MRA with collateral held and/or posted to the counterparty and create one single net payment due to or from the Portfolio.
The following tables present the Portfolio’s repurchase and reverse repurchase agreements net of amounts available for offset under an MRA and net of the related collateral received and/or pledged by the Portfolio as of October 31, 2023.
| Counterparty | Repurchase
Agreements | Liabilities
Available for
Offset | Securities
Collateral
Received(a) | Net
Amount(b) |
| Bank of America, N.A. | $ 13,841,572 | $ — | $ (13,237,596) | $ 603,976 |
| Barclays Bank PLC | 48,807,335 | (18,951,793) | (29,855,542) | — |
| JPMorgan Chase Bank, N.A. | 6,733,077 | — | (6,362,162) | 370,915 |
| Nomura International PLC | 18,372,048 | — | (17,358,143) | 1,013,905 |
| | $87,754,032 | $(18,951,793) | $(66,813,443) | $1,988,796 |
Global Macro Portfolio
October 31, 2023
Notes to Consolidated Financial Statements — continued
| Counterparty | Reverse
Repurchase
Agreements* | Assets
Available for
Offset | Securities
Collateral
Pledged(a) | Net
Amount(c) |
| Barclays Bank PLC | $(18,951,793) | $18,951,793 | $ — | $ — |
| * | Including accrued interest. |
| (a) | In some instances, the total collateral received and/or pledged may be more than the amount shown due to overcollateralization. |
| (b) | Net amount represents the net amount receivable from the counterparty in the event of default. |
| (c) | Net amount represents the net amount payable to the counterparty in the event of default. |
9 Affiliated Investments
At October 31, 2023, the value of the Portfolio's investment in funds that may be deemed to be affiliated was $283,898,491, which represents 15.9% of the Portfolio's net assets. Transactions in such investments by the Portfolio for the year ended October 31, 2023 were as follows:
| Name | Value,
beginning
of period | Purchases | Sales
proceeds | Net
realized
gain (loss) | Change in
unrealized
appreciation
(depreciation) | Value, end
of period | Dividend
income | Shares,
end of period |
| Short-Term Investments |
| Liquidity Fund | $205,847,417 | $1,364,069,549 | $(1,286,018,475) | $ — | $ — | $283,898,491 | $8,394,652 | 283,898,491 |
10 Fair Value Measurements
Under generally accepted accounting principles for fair value measurements, a three-tier hierarchy to prioritize the assumptions, referred to as inputs, is used in valuation techniques to measure fair value. The three-tier hierarchy of inputs is summarized in the three broad levels listed below.
| • | Level 1 – quoted prices in active markets for identical investments |
| • | Level 2 – other significant observable inputs (including quoted prices for similar investments, interest rates, prepayment speeds, credit risk, etc.) |
| • | Level 3 – significant unobservable inputs (including a fund's own assumptions in determining the fair value of investments) |
In cases where the inputs used to measure fair value fall in different levels of the fair value hierarchy, the level disclosed is determined based on the lowest level input that is significant to the fair value measurement in its entirety. The inputs or methodology used for valuing securities are not necessarily an indication of the risk associated with investing in those securities.
At October 31, 2023, the hierarchy of inputs used in valuing the Portfolio's investments and open derivative instruments, which are carried at fair value, were as follows:
| Asset Description | Level 1 | Level 2 | Level 3 | Total |
| Collateralized Mortgage Obligations | $ — | $ 65,676,000 | $ — | $ 65,676,000 |
| Common Stocks | 511,978 | 49,130,281* | 572,723 | 50,214,982 |
| Convertible Bonds | — | 2,647,072 | — | 2,647,072 |
| Foreign Corporate Bonds | — | 41,012,302 | 0 | 41,012,302 |
| Loan Participation Notes | — | — | 21,688,264 | 21,688,264 |
| Reinsurance Side Cars | — | — | 15,481,804 | 15,481,804 |
| Senior Floating-Rate Loans | — | 15,652,203 | 278,045 | 15,930,248 |
| Sovereign Government Bonds | — | 693,899,242 | — | 693,899,242 |
| Sovereign Loans | — | 58,390,915 | — | 58,390,915 |
| U.S. Government Agency Mortgage-Backed Securities | — | 30,071,239 | — | 30,071,239 |
| U.S. Government Guaranteed Small Business Administration Loans | — | 8,342,999 | — | 8,342,999 |
Global Macro Portfolio
October 31, 2023
Notes to Consolidated Financial Statements — continued
| Asset Description (continued) | Level 1 | Level 2 | Level 3 | Total |
| U.S. Treasury Obligations | $ — | $ 113,088,667 | $ — | $ 113,088,667 |
| Warrants | 76,770 | — | — | 76,770 |
| Miscellaneous | — | — | 0 | 0 |
| Short-Term Investments: | | | | |
| Affiliated Fund | 283,898,491 | — | — | 283,898,491 |
| Repurchase Agreements | — | 87,754,032 | — | 87,754,032 |
| Sovereign Government Securities | — | 86,290,462 | — | 86,290,462 |
| U.S. Treasury Obligations | — | 193,941,337 | — | 193,941,337 |
| Purchased Currency Options | — | 332,156 | — | 332,156 |
| Total Investments | $ 284,487,239 | $ 1,446,228,907 | $ 38,020,836 | $ 1,768,736,982 |
| Forward Foreign Currency Exchange Contracts | $ — | $ 12,615,872 | $ — | $ 12,615,872 |
| Futures Contracts | 6,164,620 | 1,054,027 | — | 7,218,647 |
| Swap Contracts | — | 36,871,934 | — | 36,871,934 |
| Total | $ 290,651,859 | $ 1,496,770,740 | $ 38,020,836 | $ 1,825,443,435 |
| Liability Description | | | | |
| Securities Sold Short | $ — | $ (91,193,005) | $ — | $ (91,193,005) |
| Written Currency Options | — | (87,249) | — | (87,249) |
| Forward Foreign Currency Exchange Contracts | — | (12,171,455) | — | (12,171,455) |
| Futures Contracts | (3,394,612) | — | — | (3,394,612) |
| Swap Contracts | — | (29,864,176) | — | (29,864,176) |
| Total | $ (3,394,612) | $ (133,315,885) | $ — | $ (136,710,497) |
| * | Includes foreign equity securities whose values were adjusted to reflect market trading of comparable securities or other correlated instruments that occurred after the close of trading in their applicable foreign markets. |
Global Macro Portfolio
October 31, 2023
Notes to Consolidated Financial Statements — continued
The following is a reconciliation of Level 3 investments for which significant unobservable inputs were used to determine fair value:
| | Common
Stocks | Foreign
Corporate
Bonds | Loan
Participation
Notes | Reinsurance
Side Cars* | Senior
Floating-Rate
Loans | Sovereign
Government
Bonds | Sovereign
Government
Securities | Total |
| Balance as of October 31, 2022 | $327,036 | $ 0 | $ 41,080,024 | $11,925,129 | $ 425,756 | $ 52,679,548 | $ 4,103,850 | $110,541,343 |
| Realized gains (losses) | — | — | (3,934,929) | — | 43,288 | — | — | (3,891,641) |
| Change in net unrealized appreciation (depreciation) | 245,687 | — | 1,523,089 | 3,774,753 | (144,271) | — | — | 5,399,258 |
| Cost of purchases | — | — | 10,216,259 | 4,403,987 | — | — | — | 14,620,246 |
| Proceeds from sales, including return of capital | — | — | (27,333,227) | (4,622,065) | (92,675) | — | — | (32,047,967) |
| Accrued discount (premium) | — | — | 137,048 | — | 45,947 | — | — | 182,995 |
| Transfers to Level 3 | — | — | — | — | — | — | — | — |
| Transfers from Level 3(1) | — | — | — | — | — | (52,679,548) | (4,103,850) | (56,783,398) |
| Balance as of October 31, 2023 | $572,723 | $ 0 | $ 21,688,264 | $15,481,804 | $ 278,045 | $ — | $ — | $ 38,020,836 |
| Change in net unrealized appreciation (depreciation) on investments still held as of October 31, 2023 | $245,687 | $ — | $ (1,735,609) | $ 3,459,545 | $(181,112) | $ — | $ — | $ 1,788,511 |
| * | The Portfolio’s investments in Reinsurance Side Cars were primarily valued on the basis of broker quotations. |
| (1) | Transferred from Level 3 based on the observability of valuation inputs resulting from new market activity. |
Not included in the table above are investments in securities categorized as Miscellaneous in the Portfolio of Investments which were acquired at $0 cost and valued at $0 at October 31, 2023.
The following is a summary of quantitative information about significant unobservable valuation inputs for Level 3 investments held as of October 31, 2023:
| Type of Investment | Fair Value as of
October 31, 2023 | Valuation Technique | Unobservable Input | Range of Unobservable Input | Impact to
Valuation from an
Increase to Input* |
| Common Stocks | $ 572,723 | Market Approach | EBITDA Multiple Discount Rate | 15% | Decrease |
| Foreign Corporate Bonds | 0 | Estimated Recovery Value | Estimated Recovery Value Percentage | 0% | Increase |
| Loan Participation Notes | 21,688,264 | Matrix Pricing | Adjusted Credit Spread to the Central Bank of Uzbekistan Quoted Policy Rate | 5.46% - 9.79%** | Decrease |
| Senior Floating-Rate Loans | 278,045 | Market Approach | Discount Rate | 10% | Decrease |
| * | Represents the directional change in the fair value of the Level 3 investments that would result from an increase to the corresponding unobservable input. A decrease to the unobservable input would have the opposite effect. |
| ** | The weighted average of the unobservable input is 7.42% based on relative principal amounts. |
Global Macro Portfolio
October 31, 2023
Notes to Consolidated Financial Statements — continued
11 Risks and Uncertainties
Risks Associated with Foreign Investments
Foreign investments can be adversely affected by political, economic and market developments abroad, including the imposition of economic and other sanctions by the United States or another country. There may be less publicly available information about foreign issuers because they may not be subject to reporting practices, requirements or regulations comparable to those to which United States companies are subject. Foreign markets may be smaller, less liquid and more volatile than the major markets in the United States. Trading in foreign markets typically involves higher expense than trading in the United States. The Portfolio may have difficulties enforcing its legal or contractual rights in a foreign country. Securities that trade or are denominated in currencies other than the U.S. dollar may be adversely affected by fluctuations in currency exchange rates.
Emerging market securities often involve greater risks than developed market securities. Investment markets within emerging market countries are typically smaller, less liquid, less developed and more volatile than those in more developed markets like the United States, and may be focused in certain economic sectors. The information available about an emerging market issuer may be less reliable than for comparable issuers in more developed capital markets. Governmental actions can have a significant effect on the economic conditions in emerging market countries. It may be more difficult to make a claim or obtain a judgment in the courts of these countries than it is in the United States. The possibility of fraud, negligence, undue influence being exerted by an issuer or refusal to recognize ownership exists in some emerging markets. Disruptions due to work stoppages and trading improprieties in foreign securities markets have caused such markets to close. Emerging market securities are also subject to speculative trading, which contributes to their volatility.
Economic data as reported by sovereign entities may be delayed, inaccurate or fraudulent. In the event of a default by a sovereign entity, there are typically no assets to be seized or cash flows to be attached. Furthermore, the willingness or ability of a sovereign entity to restructure defaulted debt may be limited. Therefore, losses on sovereign defaults may far exceed the losses from the default of a similarly rated U.S. debt issuer.
On February 24, 2022, Russia launched an invasion of Ukraine, following rising tensions over the buildup of Russian troops along the Ukrainian border and joint military exercises by Russia with Belarus. In response to the invasion, many countries, including the U.S., have imposed economic sanctions on Russian governmental institutions, Russian entities, and Russian individuals. The conflict and sanctions have had a negative impact on the Russian economy, on the Russian currency, and on investments having exposure to Russia, Belarus and Ukraine. The conflict could also have a significant effect on investments outside the region. The duration and extent of the military conflict with Russia and the related sanctions cannot be predicted at this time.
Global Macro Portfolio
October 31, 2023
Report of Independent Registered Public Accounting Firm
To the Trustees and Investors of Global Macro Portfolio:
Opinion on the Financial Statements and Financial Highlights
We have audited the accompanying consolidated statement of assets and liabilities of Global Macro Portfolio and subsidiary (the “Portfolio"), including the consolidated portfolio of investments, as of October 31, 2023, the related consolidated statement of operations for the year then ended, the consolidated statements of changes in net assets for each of the two years in the period then ended, the consolidated financial highlights for each of the five years in the period then ended, and the related notes (collectively referred to as the "financial statements and financial highlights”). In our opinion, the financial statements and financial highlights present fairly, in all material respects, the financial position of the Portfolio as of October 31, 2023, and the results of its operations for the year then ended, the changes in its net assets for each of the two years in the period then ended, and the financial highlights for each of the five years in the period then ended, in conformity with accounting principles generally accepted in the United States of America.
Basis for Opinion
These financial statements and financial highlights are the responsibility of the Portfolio’s management. Our responsibility is to express an opinion on the Portfolio’s financial statements and financial highlights based on our audits. We are a public accounting firm registered with the Public Company Accounting Oversight Board (United States) (PCAOB) and are required to be independent with respect to the Portfolio in accordance with the U.S. federal securities laws and the applicable rules and regulations of the Securities and Exchange Commission and the PCAOB.
We conducted our audits in accordance with the standards of the PCAOB. Those standards require that we plan and perform the audit to obtain reasonable assurance about whether the financial statements and financial highlights are free of material misstatement, whether due to error or fraud. The Portfolio is not required to have, nor were we engaged to perform, an audit of its internal control over financial reporting. As part of our audits, we are required to obtain an understanding of internal control over financial reporting but not for the purpose of expressing an opinion on the effectiveness of the Portfolio’s internal control over financial reporting. Accordingly, we express no such opinion.
Our audits included performing procedures to assess the risks of material misstatement of the financial statements and financial highlights, whether due to error or fraud, and performing procedures that respond to those risks. Such procedures included examining, on a test basis, evidence regarding the amounts and disclosures in the financial statements and financial highlights. Our audits also included evaluating the accounting principles used and significant estimates made by management, as well as evaluating the overall presentation of the financial statements and financial highlights. Our procedures included confirmation of securities and senior loans owned as of October 31, 2023, by correspondence with the custodian, brokers, and agent banks; when replies were not received from brokers and agent banks, we performed other auditing procedures. We believe that our audits provide a reasonable basis for our opinion.
/s/ Deloitte & Touche LLP
Boston, Massachusetts
December 22, 2023
We have served as the auditor of one or more Eaton Vance investment companies since 1959.
Eaton Vance
Global Macro Absolute Return Fund
October 31, 2023
Board of Trustees’ Contract Approval
Overview of the Contract Review Process
The Investment Company Act of 1940, as amended (the “1940 Act”), provides, in substance, that the investment advisory agreement between a fund and its investment adviser will continue in effect from year-to-year only if its continuation is approved on an annual basis by a vote of the fund’s board of trustees, including a majority of the trustees who are not “interested persons” of the fund (“independent trustees”), cast in person at a meeting called for the purpose of considering such approval.
At a meeting held on June 8, 2023, the Boards of Trustees/Directors (collectively, the “Board”) that oversee the registered investment companies advised by Eaton Vance Management or its affiliate, Boston Management and Research (the “Eaton Vance Funds”), including a majority of the independent trustees (the “Independent Trustees”), voted to approve the continuation of existing investment advisory agreements and sub-advisory agreements1 for each of the Eaton Vance Funds for an additional one-year period. The Board relied upon the affirmative recommendation of its Contract Review Committee, which is a committee exclusively comprised of Independent Trustees. Prior to making its recommendation, the Contract Review Committee reviewed information furnished by the adviser and sub-adviser to each of the Eaton Vance Funds (including information specifically requested by the Board) for a series of formal meetings held between April and June 2023, as well as certain additional information provided in response to specific requests from the Independent Trustees as members of the Contract Review Committee. Members of the Contract Review Committee also considered information received at prior meetings of the Board and its committees, to the extent such information was relevant to the Contract Review Committee’s annual evaluation of the investment advisory agreements and sub-advisory agreements.
In connection with its evaluation of the investment advisory agreements and sub-advisory agreements, the Board considered various information relating to the Eaton Vance Funds. This included information applicable to all or groups of Eaton Vance Funds, which is referenced immediately below, and information applicable to the particular Eaton Vance Fund covered by this report (each “Eaton Vance Fund” is referred to below as a “fund”). (For funds that invest through one or more underlying portfolios, references to “each fund” in this section may include information that was considered at the portfolio-level.)
Information about Fees, Performance and Expenses
• A report from an independent data provider comparing advisory and other fees paid by each fund to such fees paid by comparable funds, as identified by the independent data provider (“comparable funds”);
• A report from an independent data provider comparing each fund’s total expense ratio (and its components) to those of comparable funds;
• A report from an independent data provider comparing the investment performance of each fund (including, as relevant, total return data, income data, Sharpe ratios and information ratios) to the investment performance of comparable funds and, as applicable, benchmark indices, over various time periods;
• In certain instances, data regarding investment performance relative to customized groups of peer funds and blended indices identified by the adviser in consultation with the Portfolio Management Committee of the Board (a committee exclusively comprised of Independent Trustees);
• Comparative information concerning the fees charged and services provided by the adviser and sub-adviser to each fund in managing other accounts (which may include other mutual funds, collective investment funds and institutional accounts) using investment strategies and techniques similar to those used in managing such fund(s), if any;
• Profitability analyses with respect to the adviser and sub-adviser to each of the funds;
Information about Portfolio Management and Trading
• Descriptions of the investment management services provided to each fund, as well as each of the funds’ investment strategies and policies;
• The procedures and processes used to determine the value of fund assets, including, when necessary, the determination of “fair value” and actions taken to monitor and test the effectiveness of such procedures and processes;
• Information about the policies and practices of each fund’s adviser and sub-adviser with respect to trading, including their processes for seeking best execution of portfolio transactions;
• Information about the allocation of brokerage transactions and the benefits, if any, received by the adviser and sub-adviser to each fund as a result of brokerage allocation, including, as applicable, information concerning the acquisition of research through client commission arrangements and policies with respect to “soft dollars”;
• Data relating to the portfolio turnover rate of each fund and related information regarding active management in the context of particular strategies;
Information about each Adviser and Sub-adviser
• Reports detailing the financial results and condition of the adviser and sub-adviser to each fund;
• Information regarding the individual investment professionals whose responsibilities include portfolio management and investment research for the funds, and, for portfolio managers and certain other investment professionals, information relating to their responsibilities with respect to managing other mutual funds and investment accounts, as applicable;
1 Not all Eaton Vance Funds have entered into a sub-advisory agreement with a sub-adviser. Accordingly, references to “sub-adviser” or “sub-advisory agreement” in this “Overview” section may not be applicable to the particular Eaton Vance Fund covered by this report.
Eaton Vance
Global Macro Absolute Return Fund
October 31, 2023
Board of Trustees’ Contract Approval — continued
• Information regarding the adviser’s and its parent company’s (Morgan Stanley’s) efforts to retain and attract talented investment professionals, including in the context of a competitive marketplace for talent, as well as the ongoing unique environment presented by hybrid, remote and other alternative work arrangements;
• Information regarding the adviser’s compensation methodology for its investment professionals and the incentives and accountability it creates, along with investment professionals’ investments in the fund(s) they manage;
• The Code of Ethics of the adviser and its affiliates and the sub-adviser of each fund, together with information relating to compliance with, and the administration of, such codes;
• Policies and procedures relating to proxy voting, including regular reporting with respect to fund proxy voting activities;
• Information regarding the handling of corporate actions and class actions, as well as information regarding litigation and other regulatory matters;
• Information concerning the resources devoted to compliance efforts undertaken by the adviser and its affiliates and the sub-adviser of each fund, if any, including descriptions of their various compliance programs and their record of compliance;
• Information concerning the business continuity and disaster recovery plans of the adviser and its affiliates and the sub-adviser of each fund, if any;
• A description of Eaton Vance Management’s and Boston Management and Research’s oversight of sub-advisers, including with respect to regulatory and compliance issues, investment management and other matters;
Other Relevant Information
• Information regarding ongoing initiatives to further integrate and harmonize, where applicable, the investment management and other departments of the adviser and its affiliates with the overall investment management infrastructure of Morgan Stanley, in light of Morgan Stanley’s acquisition of Eaton Vance Corp. on March 1, 2021;
• Information concerning the nature, cost and character of the administrative and other non-investment advisory services provided by Eaton Vance Management and its affiliates;
• Information concerning oversight of the relationship with the custodian, subcustodians, fund accountants, and other third-party service providers by the adviser and/or administrator to each of the funds;
• Information concerning efforts to implement policies and procedures with respect to various recently adopted regulations applicable to the funds, including Rule 12d1-4 (the Fund-of-Funds Rule), Rule 18f-4 (the Derivatives Rule) and Rule 2a-5 (the Fair Valuation Rule);
• For an Eaton Vance Fund structured as an exchange-listed closed-end fund, information concerning the benefits of the closed-end fund structure, as well as, where relevant, the closed-end fund’s market prices (including as compared to the closed-end fund’s net asset value (NAV)), trading volume data, continued use of auction preferred shares (where applicable), distribution rates and other relevant matters;
• The risks which the adviser and/or its affiliates incur in connection with the management and operation of the funds, including, among others, litigation, regulatory, entrepreneurial, and other business risks (and the associated costs of such risks); and
• The terms of each investment advisory agreement and sub-advisory agreement.
During the various meetings of the Board and its committees over the course of the year leading up to the June 8, 2023 meeting, the Board received information from portfolio managers and other investment professionals of the advisers and sub-advisers of the funds regarding investment and performance matters, and considered various investment and trading strategies used in pursuing the funds’ investment objectives. The Board also received information regarding risk management techniques employed in connection with the management of the funds. The Board and its committees evaluated issues pertaining to industry and regulatory developments, compliance procedures, fund governance and other issues with respect to the funds, and received and participated in reports and presentations provided by Eaton Vance Management, Boston Management and Research and fund sub-advisers, with respect to such matters. In addition to the formal meetings of the Board and its committees, the Independent Trustees held regular teleconferences to discuss, among other topics, matters relating to the continuation of investment advisory agreements and sub-advisory agreements.
The Contract Review Committee was advised throughout the contract review process by Goodwin Procter LLP, independent legal counsel for the Independent Trustees. The members of the Contract Review Committee, with the advice of such counsel, exercised their own business judgment in determining the material factors to be considered in evaluating each investment advisory agreement and sub-advisory agreement and the weight to be given to each such factor. The conclusions reached with respect to each investment advisory agreement and sub-advisory agreement were based on a comprehensive evaluation of all the information provided and not any single factor. Moreover, each member of the Contract Review Committee may have placed varying emphasis on particular factors in reaching conclusions with respect to each investment advisory agreement and sub-advisory agreement. In evaluating each investment advisory agreement and sub-advisory agreement, including the fee structures and other terms contained in such agreements, the members of the Contract Review Committee were also informed by multiple years of analysis and discussion with the adviser and sub-adviser to each of the Eaton Vance Funds.
Results of the Contract Review Process
Based on its consideration of the foregoing, and such other information it deemed relevant, including the factors and conclusions described below, the Contract Review Committee concluded that the continuation of the investment advisory agreement between Eaton Vance Global Macro Absolute Return Fund (the “Fund”) and Eaton Vance Management (“EVM”), as well as the investment advisory agreement between Global Macro Portfolio (the “Portfolio”), the portfolio in which the Fund invests, and Boston Management and Research (“BMR”) (EVM, with respect to the Fund, and BMR, with respect to the Portfolio, are each referred to herein as the “Adviser”), and the sub-advisory agreement between EVM and Eaton Vance Advisers International Ltd. (the
Eaton Vance
Global Macro Absolute Return Fund
October 31, 2023
Board of Trustees’ Contract Approval — continued
“Sub-adviser”), an affiliate of the Advisers, with respect to the Fund, and the sub-advisory agreement between BMR and the Sub-adviser, with respect to the Portfolio, including their respective fee structures, are in the interests of shareholders and, therefore, recommended to the Board approval of each agreement. Based on the recommendation of the Contract Review Committee, the Board, including a majority of the Independent Trustees, voted to approve continuation of the investment advisory agreements for the Fund and the Portfolio (together, the “investment advisory agreements”) and the sub-advisory agreements for the Fund and the Portfolio (together, the “sub-advisory agreements”).
Nature, Extent and Quality of Services
In considering whether to approve the investment advisory agreements and sub-advisory agreements for the Fund and the Portfolio, the Board evaluated the nature, extent and quality of services provided to the Fund and to the Portfolio by the applicable Adviser and the Sub-adviser, respectively.
The Board considered each Adviser’s and the Sub-adviser’s management capabilities and investment processes in light of the types of investments held by the Fund and the Portfolio, including the education, experience and number of investment professionals and other personnel who provide portfolio management, investment research, and similar services to the Fund and the Portfolio, including recent changes to such personnel. The Board considered each Adviser’s expertise with respect to global markets and in-house research capabilities. The Board also considered the resources available to the Sub-adviser in fulfilling its duties under the sub-advisory agreements and the abilities and experience of the Sub-adviser’s investment professionals in implementing the investment strategies of the Fund and the Portfolio. In particular, the Board considered the expertise of the Sub-adviser’s investment professionals with respect to global markets and in-house research capabilities. The Board considered the international investment capabilities of the Sub-adviser, which is based in London, and the benefits to the Fund and the Portfolio of having portfolio management services involving investments in international securities provided by investment professionals located abroad. The Board also took into account the resources dedicated to portfolio management and other services, the compensation methods of each Adviser and other factors, including the reputation and resources of each Adviser to recruit and retain highly qualified research, advisory and supervisory investment professionals. In addition, the Board considered the time and attention devoted to the Eaton Vance Funds, including the Fund and the Portfolio, by senior management, as well as the infrastructure, operational capabilities and support staff in place to assist in the portfolio management and operations of the Fund and the Portfolio, including the provision of administrative services. The Board also considered the business-related and other risks to which each Adviser or its affiliates may be subject in managing the Fund and the Portfolio.
The Board noted that, under the terms of the investment advisory agreement of the Fund, EVM may invest assets of the Fund directly in securities, for which it would receive a fee, or in the Portfolio, for which it receives no separate fee but for which BMR receives an advisory fee from the Portfolio. The Board considered the potential benefits to the Fund of the ability to make direct investments, such as an improved ability to manage the Fund’s general market exposures, either by investing in specific securities or through the use of certain derivatives.
The Board considered the compliance programs of each Adviser and relevant affiliates thereof, including the Sub-adviser. The Board considered compliance and reporting matters regarding, among other things, personal trading by investment professionals, disclosure of portfolio holdings, late trading, frequent trading, portfolio valuation, business continuity and the allocation of investment opportunities. The Board also considered the responses of each Adviser and its affiliates to requests in recent years from regulatory authorities, such as the Securities and Exchange Commission and the Financial Industry Regulatory Authority.
The Board considered other administrative services provided or overseen by EVM and its affiliates, including transfer agency and accounting services. The Board evaluated the benefits to shareholders of investing in a fund that is a part of a large fund complex offering exposure to a variety of asset classes and investment disciplines, as well as the ability, in many cases, to exchange an investment among different funds without incurring additional sales charges.
After consideration of the foregoing factors, among others, the Board concluded that the nature, extent and quality of services provided by each Adviser and the Sub-adviser, taken as a whole, are appropriate and consistent with the terms of the applicable investment advisory agreement and the applicable sub-advisory agreement.
Fund Performance
The Board compared the Fund’s investment performance to that of comparable funds identified by an independent data provider (the peer group), as well as an appropriate benchmark index. The Board’s review included comparative performance data with respect to the Fund for the one-, three-, five- and ten-year periods ended December 31, 2022. In this regard, the Board noted that the performance of the Fund was higher than the median performance of the Fund’s peer group for the three-year period. The Board also noted that the performance of the Fund was higher than its benchmark index for the three-year period. The Board concluded that the performance of the Fund was satisfactory.
Management Fees and Expenses
The Board considered contractual fee rates payable by the Portfolio and by the Fund for advisory and administrative services (referred to collectively as “management fees”). As part of its review, the Board considered the Fund’s management fees and total expense ratio for the one-year period ended December 31, 2022, as compared to those of comparable funds, before and after giving effect to any undertaking to waive fees or reimburse expenses. The Board noted that the Portfolio has established a wholly-owned subsidiary to accommodate the Portfolio’s commodity-related investments. The
Eaton Vance
Global Macro Absolute Return Fund
October 31, 2023
Board of Trustees’ Contract Approval — continued
subsidiary is managed by BMR pursuant to a separate investment advisory agreement that is subject to annual approval by the Board. The subsidiary’s fee rates are the same as those charged to the Portfolio, and the Portfolio will not pay any additional management fees with respect to its assets invested in the subsidiary. The Board also considered factors that had an impact on the Fund’s total expense ratio relative to comparable funds.
After considering the foregoing information, and in light of the nature, extent and quality of the services provided by each Adviser and the Sub-adviser, the Board concluded that the management fees charged for advisoryand related services are reasonable.
Profitability and “Fall-Out” Benefits
The Board considered the level of profits realized by each Adviser and relevant affiliates thereof, including the Sub-adviser, in providing investment advisory and administrative services to the Fund, to the Portfolio and to all Eaton Vance Funds as a group. The Board considered the level of profits realized without regard to marketing support or other payments by each Adviser and its affiliates to third parties in respect of distribution or other services.
The Board concluded that, in light of the foregoing factors and the nature, extent and quality of the services rendered, the profits realized by each Adviser and its affiliates, including the Sub-adviser, are deemed not to be excessive.
The Board also considered direct or indirect fall-out benefits received by each Adviser and its affiliates, including the Sub-adviser, in connection with their respective relationships with the Fund and the Portfolio, including the benefits of research services that may be available to each Adviser or the Sub-adviser as a result of securities transactions effected for the Fund and the Portfolio and other investment advisory clients.
Economies of Scale
In reviewing management fees and profitability, the Board also considered the extent to which the applicable Adviser and its affiliates, on the one hand, and the Fund and the Portfolio, on the other hand, can expect to realize benefits from economies of scale as the assets of the Fund and the Portfolio increase. The Board acknowledged the difficulty in accurately measuring the benefits resulting from economies of scale, if any, with respect to the management of any specific fund or group of funds. The Board reviewed data summarizing the increases and decreases in the assets of the Fund and of all Eaton Vance Funds as a group over various time periods, and evaluated the extent to which the total expense ratio of the Fund and the profitability of each Adviser and its affiliates may have been affected by such increases or decreases. Based upon the foregoing, the Board concluded that the Fund currently shares in the benefits from economies of scale, if any, when they are realized by each Adviser. The Board also concluded that the structure of the advisory fees, which include breakpoints at several asset levels, will allow the Fund and the Portfolio to continue to benefit from any economies of scale in the future.
Eaton Vance
Global Macro Absolute Return Fund
October 31, 2023
Liquidity Risk Management Program
The Fund has implemented a written liquidity risk management program (Program) and related procedures to manage its liquidity in accordance with Rule 22e-4 under the Investment Company Act of 1940, as amended (Liquidity Rule). The Liquidity Rule defines “liquidity risk” as the risk that a fund could not meet requests to redeem shares issued by the fund without significant dilution of the remaining investors’ interests in the fund. The Fund’s Board of Trustees/Directors has designated the investment adviser to serve as the administrator of the Program and the related procedures. The administrator has established a Liquidity Risk Management Oversight Committee (Committee) to perform the functions necessary to administer the Program. As part of the Program, the administrator is responsible for identifying illiquid investments and categorizing the relative liquidity of the Fund’s investments in accordance with the Liquidity Rule. Under the Program, the administrator assesses, manages, and periodically reviews the Fund’s liquidity risk, and is responsible for making certain reports to the Fund’s Board of Trustees/Directors and the Securities and Exchange Commission (SEC) regarding the liquidity of the Fund’s investments, and to notify the Board of Trustees/Directors and the SEC of certain liquidity events specified in the Liquidity Rule. The liquidity of the Fund’s portfolio investments is determined based on a number of factors including, but not limited to, relevant market, trading and investment-specific considerations under the Program.
At a meeting of the Fund’s Board of Trustees/Directors on June 7, 2023, the Committee provided a written report to the Fund’s Board of Trustees/
Directors pertaining to the operation, adequacy, and effectiveness of implementation of the Program, as well as the operation of the highly liquid investment minimum (if applicable) for the period January 1, 2022 through December 31, 2022 (Review Period). The Program operated effectively during the Review Period, supporting the administrator’s ability to assess, manage and monitor Fund liquidity risk, including during periods of market volatility and net redemptions. During the Review Period, the Fund met redemption requests on a timely basis.
There can be no assurance that the Program will achieve its objectives in the future. Please refer to the Fund’s prospectus for more information regarding the Fund’s exposure to liquidity risk and other principal risks to which an investment in the Fund may be subject.
Eaton Vance
Global Macro Absolute Return Fund
October 31, 2023
Management and Organization
Fund Management. The Trustees of Eaton Vance Mutual Funds Trust (the Trust) and Global Macro Portfolio (the Portfolio) are responsible for the overall management and supervision of the Trust's and the Portfolio's affairs. The Board members and officers of the Trust and the Portfolio are listed below. Except as indicated, each individual has held the office shown or other offices in the same company for the last five years. Board members hold indefinite terms of office. Each Trustee holds office until his or her successor is elected and qualified, subject to a prior death, resignation, retirement, disqualification or removal. Under the terms of the Fund's and the Portfolio's current Trustee retirement policy, an Independent Trustee must retire and resign as a Trustee on the earlier of: (i) the first day of July following his or her 74th birthday; or (ii), with limited exception, December 31st of the 20th year in which he or she has served as a Trustee. However, if such retirement and resignation would cause the Fund and the Portfolio to be out of compliance with Section 16 of the 1940 Act or any other regulations or guidance of the SEC, then such retirement and resignation will not become effective until such time as action has been taken for the Fund and the Portfolio to be in compliance therewith. The “noninterested Trustees” consist of those Trustees who are not “interested persons” of the Trust and the Portfolio, as that term is defined under the 1940 Act. The business address of each Board member and officer is Two International Place, Boston, Massachusetts 02110. As used below, “BMR” refers to Boston Management and Research, “EV” refers to EV LLC, “EVM” refers to Eaton Vance Management, “MSIM" refers to Morgan Stanley Investment Management Inc. and “EVD” refers to Eaton Vance Distributors, Inc. EV is the trustee of each of EVM and BMR. Each of EVM, BMR, EVD and EV are indirect, wholly owned subsidiaries of Morgan Stanley. Each officer affiliated with EVM may hold a position with other EVM affiliates that is comparable to his or her position with EVM listed below. Each Trustee oversees 127 funds in the Eaton Vance fund complex (including both funds and portfolios in a hub and spoke structure).
| Name and Year of Birth | Trust/Portfolio
Position(s) | Length of Service | Principal Occupation(s) and Other Directorships
During Past Five Years and Other Relevant Experience |
| Interested Trustee |
Anchal Pachnanda(1)
1980 | Trustee | Since 2023 | Co-Head of Strategy of MSIM (since 2019). Formerly, Head of Strategy of MSIM (2017-2019). Ms. Pachnanda is an interested person because of her position with MSIM, which is an affiliate of the Trust.
Other Directorships. None. |
| Noninterested Trustees |
Alan C. Bowser
1962 | Trustee | Since 2022 | Private investor. Formerly, Chief Diversity Officer, Partner and a member of the Operating Committee, and formerly served as Senior Advisor on Diversity and Inclusion for the firm’s chief executive officer, Co-Head of the Americas Region, and Senior Client Advisor of Bridgewater Associates, an asset management firm (2011- 2023).
Other Directorships. Independent Director of Stout Risius Ross (a middle market professional services advisory firm) (since 2021).. |
Mark R. Fetting
1954 | Trustee | Since 2016 | Private investor. Formerly held various positions at Legg Mason, Inc. (investment management firm) (2000-2012), including President, Chief Executive Officer, Director and Chairman (2008-2012), Senior Executive Vice President (2004-2008) and Executive Vice President (2001-2004). Formerly, President of Legg Mason family of funds (2001-2008). Formerly, Division President and Senior Officer of Prudential Financial Group, Inc. and related companies (investment management firm) (1991-2000).
Other Directorships. None. |
Cynthia E. Frost
1961 | Trustee | Since 2014 | Private investor. Formerly, Chief Investment Officer of Brown University (university endowment) (2000-2012). Formerly, Portfolio Strategist for Duke Management Company (university endowment manager) (1995-2000). Formerly, Managing Director, Cambridge Associates (investment consulting company) (1989-1995). Formerly, Consultant, Bain and Company (management consulting firm) (1987- 1989). Formerly, Senior Equity Analyst, BA Investment Management Company (1983-1985).
Other Directorships. None. |
George J. Gorman
1952 | Chairperson of the
Board and Trustee | Since 2021
(Chairperson) and 2014 (Trustee) | Principal at George J. Gorman LLC (consulting firm). Formerly, Senior Partner at Ernst & Young LLP (a registered public accounting firm) (1974-2009).
Other Directorships. None. |
Eaton Vance
Global Macro Absolute Return Fund
October 31, 2023
Management and Organization — continued
| Name and Year of Birth | Trust/Portfolio
Position(s) | Length of Service | Principal Occupation(s) and Other Directorships
During Past Five Years and Other Relevant Experience |
| Noninterested Trustees (continued) |
Valerie A. Mosley
1960 | Trustee | Since 2014 | Chairwoman and Chief Executive Officer of Valmo Ventures (a consulting and investment firm). Founder of Upward Wealth, Inc., dba BrightUp, a fintech platform. Formerly, Partner and Senior Vice President, Portfolio Manager and Investment Strategist at Wellington Management Company, LLP (investment management firm) (1992-2012). Formerly, Chief Investment Officer, PG Corbin Asset Management (1990-1992). Formerly worked in institutional corporate bond sales at Kidder Peabody (1986-1990).
Other Directorships. Director of DraftKings, Inc. (digital sports entertainment and gaming company) (since September 2020). Director of Envestnet, Inc. (provider of intelligent systems for wealth management and financial wellness) (since 2018). Formerly, Director of Dynex Capital, Inc. (mortgage REIT) (2013-2020) and Director of Groupon, Inc. (e-commerce provider) (2020-2022). |
Keith Quinton
1958 | Trustee | Since 2018 | Private investor, researcher and lecturer. Formerly, Independent Investment Committee Member at New Hampshire Retirement System (2017-2021). Formerly, Portfolio Manager and Senior Quantitative Analyst at Fidelity Investments (investment management firm) (2001-2014).
Other Directorships. Formerly, Director (2016-2021) and Chairman (2019-2021) of New Hampshire Municipal Bond Bank. |
Marcus L. Smith
1966 | Trustee | Since 2018 | Private investor and independent corporate director. Formerly, Chief Investment Officer, Canada (2012-2017), Chief Investment Officer, Asia (2010-2012), Director of Asian Research (2004-2010) and portfolio manager (2001-2017) at MFS Investment Management (investment management firm).
Other Directorships. Director of First Industrial Realty Trust, Inc. (an industrial REIT) (since 2021). Director of MSCI Inc. (global provider of investment decision support tools) (since 2017). Formerly, Director of DCT Industrial Trust Inc. (logistics real estate company) (2017-2018). |
Susan J. Sutherland
1957 | Trustee | Since 2015 | Private investor. Director of Ascot Group Limited and certain of its subsidiaries (insurance and reinsurance) (since 2017). Formerly, Director of Hagerty Holding Corp. (insurance) (2015-2018) and Montpelier Re Holdings Ltd. (insurance and reinsurance) (2013-2015). Formerly, Associate, Counsel and Partner at Skadden, Arps, Slate, Meagher & Flom LLP (law firm) (1982-2013).
Other Directorships. Director of Kairos Acquisition Corp. (insurance/InsurTech acquisition company) (2021-2023). |
Scott E. Wennerholm
1959 | Trustee | Since 2016 | Private investor. Formerly, Trustee at Wheelock College (postsecondary institution) (2012-2018). Formerly, Consultant at GF Parish Group (executive recruiting firm) (2016-2017). Formerly, Chief Operating Officer and Executive Vice President at BNY Mellon Asset Management (investment management firm) (2005-2011). Formerly, Chief Operating Officer and Chief Financial Officer at Natixis Global Asset Management (investment management firm) (1997-2004). Formerly, Vice President at Fidelity Investments Institutional Services (investment management firm) (1994-1997).
Other Directorships. None. |
Nancy A. Wiser
1967 | Trustee | Since 2022 | Formerly, Executive Vice President and the Global Head of Operations at Wells Fargo Asset Management (2011-2021).
Other Directorships. None. |
| Name and Year of Birth | Trust/Portfolio
Position(s) | Length of Service | Principal Occupation(s)
During Past Five Years |
| Principal Officers who are not Trustees |
Kenneth A. Topping
1966 | President | Since 2023 | Vice President and Chief Administrative Officer of EVM and BMR and Chief Operating Officer for Public Markets at MSIM. Also Vice President of Calvert Research and Management (“CRM”) since 2021. Formerly, Chief Operating Officer for Goldman Sachs Asset Management 'Classic’ (2009-2020). |
Deidre E. Walsh
1971 | Vice President and Chief
Legal Officer | Since 2009 | Vice President of EVM and BMR. Also Vice President of CRM. |
James F. Kirchner
1967 | Treasurer | Since 2007 | Vice President of EVM and BMR. Also Vice President of CRM. |
Eaton Vance
Global Macro Absolute Return Fund
October 31, 2023
Management and Organization — continued
| Name and Year of Birth | Trust/Portfolio
Position(s) | Length of Service | Principal Occupation(s)
During Past Five Years |
| Principal Officers who are not Trustees (continued) |
Nicholas S. Di Lorenzo
1987 | Secretary | Since 2022 | Formerly, associate (2012-2021) and counsel (2022) at Dechert LLP. |
Richard F. Froio
1968 | Chief Compliance
Officer | Since 2017 | Vice President of EVM and BMR since 2017. Formerly, Deputy Chief Compliance Officer (Adviser/Funds) and Chief Compliance Officer (Distribution) at PIMCO (2012-2017) and Managing Director at BlackRock/Barclays Global Investors (2009-2012). |
(1) Ms. Pachnanda began serving as Trustee effective April 1, 2023.
The SAI for the Fund includes additional information about the Trustees and officers of the Fund and the Portfolio and can be obtained without charge on Eaton Vance’s website at www.eatonvance.com or by calling 1-800-262-1122.
| FACTS | WHAT DOES EATON VANCE DO WITH YOUR
PERSONAL INFORMATION? |
| Why? | Financial companies choose how they share your personal information. Federal law gives consumers the right to limit some but not all sharing. Federal law also requires us to tell you how we collect, share, and protect your personal information. Please read this notice carefully to understand what we do. |
| |
| What? | The types of personal information we collect and share depend on the product or service you have with us. This information can include:■ Social Security number and income
■ investment experience and risk tolerance
■ checking account number and wire transfer instructions |
| |
| How? | All financial companies need to share customers’ personal information to run their everyday business. In the section below, we list the reasons financial companies can share their customers’ personal information; the reasons Eaton Vance chooses to share; and whether you can limit this sharing. |
Reasons we can share your
personal information | Does Eaton Vance
share? | Can you limit
this sharing? |
| For our everyday business purposes — such as to process your transactions, maintain your account(s), respond to court orders and legal investigations, or report to credit bureaus | Yes | No |
| For our marketing purposes — to offer our products and services to you | Yes | No |
| For joint marketing with other financial companies | No | We don’t share |
| For our investment management affiliates’ everyday business purposes — information about your transactions, experiences, and creditworthiness | Yes | Yes |
| For our affiliates’ everyday business purposes — information about your transactions and experiences | Yes | No |
| For our affiliates’ everyday business purposes — information about your creditworthiness | No | We don’t share |
| For our investment management affiliates to market to you | Yes | Yes |
| For our affiliates to market to you | No | We don’t share |
| For nonaffiliates to market to you | No | We don’t share |
To limit our
sharing | Call toll-free 1-800-262-1122 or email: EVPrivacy@eatonvance.comPlease note:If you are a new customer, we can begin sharing your information 30 days from the date we sent this notice. When you are no longer our customer, we continue to share your information as described in this notice. However, you can contact us at any time to limit our sharing. |
| Questions? | Call toll-free 1-800-262-1122 or email: EVPrivacy@eatonvance.com |
| Privacy Notice — continued | April 2021 |
| Who we are |
| Who is providing this notice? | Eaton Vance Management, Eaton Vance Distributors, Inc., Eaton Vance Trust Company, Eaton Vance Management (International) Limited, Eaton Vance Advisers International Ltd., Eaton Vance Global Advisors Limited, Eaton Vance Management’s Real Estate Investment Group, Boston Management and Research, Calvert Research and Management, Eaton Vance and Calvert Fund Families and our investment advisory affiliates (“Eaton Vance”) (see Investment Management Affiliates definition below) |
| What we do |
How does Eaton Vance
protect my personal
information? | To protect your personal information from unauthorized access and use, we use security measures that comply with federal law. These measures include computer safeguards and secured files and buildings. We have policies governing the proper handling of customer information by personnel and requiring third parties that provide support to adhere to appropriate security standards with respect to such information. |
How does Eaton Vance
collect my personal
information? | We collect your personal information, for example, when you■ open an account or make deposits or withdrawals from your account
■ buy securities from us or make a wire transfer
■ give us your contact informationWe also collect your personal information from others, such as credit bureaus, affiliates, or other companies. |
| Why can’t I limit all sharing? | Federal law gives you the right to limit only■ sharing for affiliates’ everyday business purposes — information about your creditworthiness
■ affiliates from using your information to market to you
■ sharing for nonaffiliates to market to youState laws and individual companies may give you additional rights to limit sharing. See below for more on your rights under state law. |
| Definitions |
Investment Management
Affiliates | Eaton Vance Investment Management Affiliates include registered investment advisers, registered broker- dealers, and registered and unregistered funds. Investment Management Affiliates does not include entities associated with Morgan Stanley Wealth Management, such as Morgan Stanley Smith Barney LLC and Morgan Stanley & Co. |
| Affiliates | Companies related by common ownership or control. They can be financial and nonfinancial companies.■ Our affiliates include companies with a Morgan Stanley name and financial companies such as Morgan Stanley Smith Barney LLC and Morgan Stanley & Co. |
| Nonaffiliates | Companies not related by common ownership or control. They can be financial and nonfinancial companies.■ Eaton Vance does not share with nonaffiliates so they can market to you. |
| Joint marketing | A formal agreement between nonaffiliated financial companies that together market financial products or services to you.■ Eaton Vance doesn’t jointly market. |
| Other important information |
| Vermont: Except as permitted by law, we will not share personal information we collect about Vermont residents with Nonaffiliates unless you provide us with your written consent to share such information.California: Except as permitted by law, we will not share personal information we collect about California residents with Nonaffiliates and we will limit sharing such personal information with our Affiliates to comply with California privacy laws that apply to us. |
Delivery of Shareholder Documents. The Securities and Exchange Commission (SEC) permits funds to deliver only one copy of shareholder documents, including prospectuses, proxy statements and shareholder reports, to fund investors with multiple accounts at the same residential or post office box address. This practice is often called “householding” and it helps eliminate duplicate mailings to shareholders. Eaton Vance, or your financial intermediary, may household the mailing of your documents indefinitely unless you instruct Eaton Vance, or your financial intermediary, otherwise. If you would prefer that your Eaton Vance documents not be householded, please contact Eaton Vance at 1-800-262-1122, or contact your financial intermediary. Your instructions that householding not apply to delivery of your Eaton Vance documents will typically be effective within 30 days of receipt by Eaton Vance or your financial intermediary.
Portfolio Holdings. Each Eaton Vance Fund and its underlying Portfolio(s) (if applicable) files a schedule of portfolio holdings on Part F to Form N-PORT with the SEC. Certain information filed on Form N-PORT may be viewed on the Eaton Vance website at www.eatonvance.com, by calling Eaton Vance at 1-800-262-1122 or in the EDGAR database on the SEC’s website at www.sec.gov.
Proxy Voting. From time to time, funds are required to vote proxies related to the securities held by the funds. The Eaton Vance Funds or their underlying Portfolios (if applicable) vote proxies according to a set of policies and procedures approved by the Funds’ and Portfolios’ Boards. You may obtain a description of these policies and procedures and information on how the Funds or Portfolios voted proxies relating to portfolio securities during the most recent 12-month period ended June 30, without charge, upon request, by calling 1-800-262-1122 and by accessing the SEC’s website at www.sec.gov.
Tailored Shareholder Reports. Effective January 24, 2023, the SEC adopted rule and form amendments to require open-end mutual funds and ETFs to transmit concise and visually engaging streamlined annual and semiannual reports to shareholders that highlight key information. Other information, including financial statements, will no longer appear in a streamlined shareholder report but must be available online, delivered free of charge upon request, and filed on a semiannual basis on Form N-CSR. The rule and form amendments have a compliance date of July 24, 2024. At this time, management is evaluating the impact of these amendments on the shareholder reports for the Eaton Vance Funds.
This Page Intentionally Left Blank
This Page Intentionally Left Blank
This Page Intentionally Left Blank
Investment Adviser of Global Macro Portfolio
Boston Management and Research
Two International Place
Boston, MA 02110
Investment Adviser and Administrator of Eaton Vance Global
Macro Absolute Return Fund
Eaton Vance Management
Two International Place
Boston, MA 02110
Investment Sub-Adviser
Eaton Vance Advisers International Ltd.
125 Old Broad Street
London, EC2N 1AR
United Kingdom
Principal Underwriter*
Eaton Vance Distributors, Inc.
Two International Place
Boston, MA 02110
(617) 482-8260
Custodian
State Street Bank and Trust Company
One Congress Street, Suite 1
Boston, MA 02114-2016
Transfer Agent
BNY Mellon Investment Servicing (US) Inc.
Attn: Eaton Vance Funds
P.O. Box 534439
Pittsburgh, PA 15253-4439
(800) 262-1122
Independent Registered Public Accounting Firm
Deloitte & Touche LLP
200 Berkeley Street
Boston, MA 02116-5022
Fund Offices
Two International Place
Boston, MA 02110
* FINRA BrokerCheck. Investors may check the background of their Investment Professional by contacting the Financial Industry Regulatory Authority (FINRA). FINRA BrokerCheck is a free tool to help investors check the professional background of current and former FINRA-registered securities firms and brokers. FINRA BrokerCheck is available by calling 1-800-289-9999 and at www.FINRA.org. The FINRA BrokerCheck brochure describing this program is available to investors at www.FINRA.org.
Eaton Vance
Short Duration Strategic
Income Fund
Annual Report
October 31, 2023
Commodity Futures Trading Commission Registration. The Commodity Futures Trading Commission (“CFTC”) has adopted regulations that subject registered investment companies and advisers to regulation by the CFTC if a fund invests more than a prescribed level of its assets in certain CFTC-regulated instruments (including futures, certain options and swap agreements) or markets itself as providing investment exposure to such instruments. The investment adviser has claimed an exclusion from the definition of “commodity pool operator” under the Commodity Exchange Act with respect to its management of the Fund. Accordingly, neither the Fund nor the adviser with respect to the operation of the Fund is subject to CFTC regulation. Because of its management of other strategies, the Fund's adviser is registered with the CFTC as a commodity pool operator. The adviser is also registered as a commodity trading advisor.
Fund shares are not insured by the FDIC and are not deposits or other obligations of, or guaranteed by, any depository institution. Shares are subject to investment risks, including possible loss of principal invested.
This report must be preceded or accompanied by a current summary prospectus or prospectus. Before investing, investors should consider carefully the investment objective, risks, and charges and expenses of a mutual fund. This and other important information is contained in the summary prospectus and prospectus, which can be obtained from a financial intermediary. Prospective investors should read the prospectus carefully before investing. For further information, please call 1-800-262-1122.
Annual Report October 31, 2023
Eaton Vance
Short Duration Strategic Income Fund
Eaton Vance
Short Duration Strategic Income Fund
October 31, 2023
Management’s Discussion of Fund Performance†
Economic and Market Conditions
The world’s financial markets posted broad gains for the 12-month period ended October 31, 2023. During the period, inflation moderated in many countries, the U.S. economy outperformed expectations, and credit spreads generally tightened. These and other positive dynamics overshadowed concerns about rising global bond yields and heightened geopolitical tensions, including renewed conflict in the Middle East.
The U.S. Federal Reserve (the Fed) raised short-term interest rates during the period, and the cumulative effects of the monetary tightening cycle that began in March 2022 helped reduce U.S. inflation. As a result, the Fed slowed its pace of interest rate increases and signaled that it was nearing the end of its rate hiking campaign. The U.S. economy was resilient in the higher rate environment, posting solid growth as strength in the labor market supported healthy levels of consumer spending.
Inflation also eased in Europe, where the European Central Bank and Bank of England joined the Fed in slowing interest rate increases. However, European economic growth was sluggish amid elevated energy costs, a downturn in global trade, and higher borrowing costs. The prevalence of adjustable-rate mortgages in the U.K. and Southern Europe was particularly challenging for consumers in these regions. While wage gains helped offset the impact of higher household expenses, the U.K. unemployment rate rose and the eurozone labor market showed signs of softening late in the period.
In emerging markets (EM), China ended its zero-COVID policy early in the period, triggering a rebound in economic activity. However, the recovery quickly lost momentum due to several factors, including a drop in consumer confidence and a desire among developed-market (DM) companies to become less dependent on Chinese manufacturing. China’s economy stabilized in the final months of the period, bolstered by various stimulus measures. Nonetheless, the Chinese government seemed more focused on national security interests than economic growth.
During the period, numerous EM countries, including Mexico and several Southeast Asian nations in particular, benefited from DM companies’ efforts to diversify their supply chains beyond China. In addition, because EM central banks were generally ahead of their DM peers in addressing rising inflation risks, many EM central banks were able to cut interest rates during the period -- moves that supported economic growth and asset prices. For the period as a whole, the U.S. dollar broadly weakened, providing another tailwind for EM assets.
Fund Performance
For the 12-month period ended October 31, 2023, Eaton Vance Short Duration Strategic Income Fund (the Fund) returned 5.11% for Class A shares at net asset value (NAV), outperforming its benchmark, the Bloomberg U.S. Aggregate Bond Index (the Index), which returned 0.36%.
The Fund’s asset allocation had a positive impact on performance relative to the Index during the period. Allocations to emerging markets debt (EMD) -- both local and hard currency segments of the market -- produced positive returns relative to the Index. Cooling inflation prompted many global central banks to ease their monetary policies, which boosted returns within the EMD sector. The relatively higher yields offered by EMD securities also helped total returns compared to the Index.
The Fund’s exposure to floating-rate bank loans also contributed to outperformance versus the Index. The short duration nature of floating-rate securities, as well as the high yield potential they offer, led to outperformance versus the Index amid rising interest rates during the period.
In contrast, the Fund’s allocation to U.S. government agency mortgage-backed securities (agency MBS) underperformed the Index during the period. Agency MBS securities were negatively impacted by a rise in U.S. Treasury yields and a challenging technical environment. While higher mortgage rates resulted in lower MBS supply during the period, weaker demand from banks and overseas investors -- coupled with the Fed’s reduction of MBS holdings -- resulted in wider spreads within the sector.
Currency management had a positive impact on performance relative to the Index during the period. Gains from long positions in the Dominican peso, and short positions in the Chinese yuan were more than enough to offset losses from long positions in the Australian dollar.
Duration management detracted from Fund performance relative to the Index during the period. The Fund’s duration was gradually extended over the course of the period, which weighed on returns as interest rates proceeded higher. Meanwhile, select positions outside the U.S. benefited from local interest rate movements, which partially offset negative returns from the Fund’s U.S. duration positioning.
The Fund used derivatives extensively during the period to hedge undesired risk exposures, as well as to gain select desired risk exposures. Overall, the Fund’s use of derivatives -- most notably interest rate derivatives and currency forwards -- detracted from Index-relative performance during the period.
See Endnotes and Additional Disclosures in this report.
Past performance is no guarantee of future results. Returns are historical and are calculated by determining the percentage change in net asset value (NAV) or offering price (as applicable) with all distributions reinvested. Furthermore, returns do not reflect the deduction of taxes that shareholders may have to pay on Fund distributions or upon the redemption of Fund shares. Investment return and principal value will fluctuate so that shares, when redeemed, may be worth more or less than their original cost. Performance for periods less than or equal to one year is cumulative. Performance is for the stated time period only; due to market volatility, current Fund performance may be lower or higher than the quoted return. For performance as of the most recent month-end, please refer to eatonvance.com.
Eaton Vance
Short Duration Strategic Income Fund
October 31, 2023
Performance
Portfolio Manager(s) Andrew Szczurowski, CFA, Justin Bourgette, CFA and Brian Shaw, CFA
| % Average Annual Total Returns1,2 | Class
Inception Date | Performance
Inception Date | One Year | Five Years | Ten Years |
| Class A at NAV | 01/23/1998 | 11/26/1990 | 5.11% | 3.02% | 2.89% |
| Class A with 3.25% Maximum Sales Charge | — | — | 1.66 | 2.35 | 2.56 |
| Class C at NAV | 05/25/1994 | 11/26/1990 | 4.36 | 2.25 | 2.29 |
| Class C with 1% Maximum Deferred Sales Charge | — | — | 3.38 | 2.25 | 2.29 |
| Class I at NAV | 04/03/2009 | 11/26/1990 | 5.37 | 3.28 | 3.15 |
| Class R at NAV | 08/03/2009 | 11/26/1990 | 4.85 | 2.77 | 2.62 |
|
| Bloomberg U.S. Aggregate Bond Index | — | — | 0.36% | (0.06)% | 0.88% |
| % Total Annual Operating Expense Ratios3 | Class A | Class C | Class I | Class R |
| | 1.12% | 1.87% | 0.87% | 1.37% |
Growth of $10,000
This graph shows the change in value of a hypothetical investment of $10,000 in Class A of the Fund for the period indicated. For comparison, the same investment is shown in the indicated index.
| Growth of Investment | Amount Invested | Period Beginning | At NAV | With Maximum Sales Charge |
| Class C | $10,000 | 10/31/2013 | $12,538 | N.A. |
| Class I, at minimum investment | $1,000,000 | 10/31/2013 | $1,363,537 | N.A. |
| Class R | $10,000 | 10/31/2013 | $12,955 | N.A. |
See Endnotes and Additional Disclosures in this report.
Past performance is no guarantee of future results. Returns are historical and are calculated by determining the percentage change in net asset value (NAV) or offering price (as applicable) with all distributions reinvested. Furthermore, returns do not reflect the deduction of taxes that shareholders may have to pay on Fund distributions or upon the redemption of Fund shares. Investment return and principal value will fluctuate so that shares, when redeemed, may be worth more or less than their original cost. Performance for periods less than or equal to one year is cumulative. Performance is for the stated time period only; due to market volatility, current Fund performance may be lower or higher than the quoted return. For performance as of the most recent month-end, please refer to eatonvance.com.
Eaton Vance
Short Duration Strategic Income Fund
October 31, 2023
| Allocation to Portfolios and Funds (% of net assets) |
| Asset Allocation (% of net assets)1 |
Fund primarily invests in one or more affiliated investment companies (Portfolios). Unless otherwise noted, references to investments are to the aggregate holdings of the Fund, including its pro rata share of each Portfolio in which it invests.
Footnotes:
| 1 | Other Net Assets represents other assets less liabilities and includes any investment type that represents less than 1% of net assets. |
2 Net of TBA sale commitments.
3 Net of securities sold short.
4 Net of unfunded loan commitments.
Eaton Vance
Short Duration Strategic Income Fund
October 31, 2023
Endnotes and Additional Disclosures
| † | The views expressed in this report are those of the portfolio manager(s) and are current only through the date stated at the top of this page. These views are subject to change at any time based upon market or other conditions, and Eaton Vance and the Fund(s) disclaim any responsibility to update such views. These views may not be relied upon as investment advice and, because investment decisions are based on many factors, may not be relied upon as an indication of trading intent on behalf of any Eaton Vance fund. This commentary may contain statements that are not historical facts, referred to as “forward-looking statements.” The Fund’s actual future results may differ significantly from those stated in any forward-looking statement, depending on factors such as changes in securities or financial markets or general economic conditions, the volume of sales and purchases of Fund shares, the continuation of investment advisory, administrative and service contracts, and other risks discussed from time to time in the Fund’s filings with the Securities and Exchange Commission. |
| | |
| 1 | Bloomberg U.S. Aggregate Bond Index is an unmanaged index of domestic investment-grade bonds, including corporate, government and mortgage-backed securities. Unless otherwise stated, index returns do not reflect the effect of any applicable sales charges, commissions, expenses, taxes or leverage, as applicable. It is not possible to invest directly in an index. |
| 2 | Total Returns at NAV do not include applicable sales charges. If sales charges were deducted, the returns would be lower. Total Returns shown with maximum sales charge reflect the stated maximum sales charge. Unless otherwise stated, performance does not reflect the deduction of taxes on Fund distributions or redemptions of Fund shares.Effective November 5, 2020, Class C shares automatically convert to Class A shares eight years after purchase. The average annual total returns listed for Class C reflect conversion to Class A shares after eight years. Prior to November 5, 2020, Class C shares automatically converted to Class A shares ten years after purchase. |
| 3 | Source: Fund prospectus. The expense ratios for the current reporting period can be found in the Financial Highlights section of this report. Performance reflects expenses waived and/or reimbursed, if applicable. Without such waivers and/or reimbursements, performance would have been lower. |
| | Fund profile subject to change due to active management. |
| | Additional Information |
| | Spread is the difference in yield between a U.S. Treasury bond and another debt security of the same maturity but different credit quality. |
| | Duration is a measure of the expected change in price of a bond — in percentage terms — given a one percent change in interest rates, all else being constant. Securities with lower durations tend to be less sensitive to interest rate changes. |
| | Important Notice to Shareholders |
| | Effective January 16, 2024, the Fund's name will change to Eaton Vance Strategic Income Fund and there will be certain related changes to its investment strategy. |
Eaton Vance
Short Duration Strategic Income Fund
October 31, 2023
Example
As a Fund shareholder, you incur two types of costs: (1) transaction costs, including sales charges (loads) on purchases; and (2) ongoing costs, including management fees; distribution and/or service fees; and other Fund expenses. This Example is intended to help you understand your ongoing costs (in dollars) of Fund investing and to compare these costs with the ongoing costs of investing in other mutual funds. The Example is based on an investment of $1,000 invested at the beginning of the period and held for the entire period (May 1, 2023 to October 31, 2023).
Actual Expenses
The first section of the table below provides information about actual account values and actual expenses. You may use the information in this section, together with the amount you invested, to estimate the expenses that you paid over the period. Simply divide your account value by $1,000 (for example, an $8,600 account value divided by $1,000 = 8.6), then multiply the result by the number in the first section under the heading entitled “Expenses Paid During Period” to estimate the expenses you paid on your account during this period.
Hypothetical Example for Comparison Purposes
The second section of the table below provides information about hypothetical account values and hypothetical expenses based on the actual Fund expense ratio and an assumed rate of return of 5% per year (before expenses), which is not the actual Fund return. The hypothetical account values and expenses may not be used to estimate the actual ending account balance or expenses you paid for the period. You may use this information to compare the ongoing costs of investing in your Fund and other funds. To do so, compare this 5% hypothetical example with the 5% hypothetical examples that appear in the shareholder reports of the other funds.
Please note that the expenses shown in the table are meant to highlight your ongoing costs only and do not reflect any transactional costs, such as sales charges (loads). Therefore, the second section of the table is useful in comparing ongoing costs only, and will not help you determine the relative total costs of owning different funds. In addition, if these transactional costs were included, your costs would be higher.
| | Beginning
Account Value
(5/1/23) | Ending
Account Value
(10/31/23) | Expenses Paid
During Period*
(5/1/23 – 10/31/23) | Annualized
Expense
Ratio |
| Actual | | | | |
| Class A | $1,000.00 | $ 996.70 | $ 6.34 | 1.26% |
| Class C | $1,000.00 | $ 992.20 | $10.14 | 2.02% |
| Class I | $1,000.00 | $ 997.90 | $ 5.09 | 1.01% |
| Class R | $1,000.00 | $ 994.00 | $ 7.59 | 1.51% |
| |
| Hypothetical | | | | |
| (5% return per year before expenses) | | | | |
| Class A | $1,000.00 | $1,018.85 | $ 6.41 | 1.26% |
| Class C | $1,000.00 | $1,015.02 | $10.26 | 2.02% |
| Class I | $1,000.00 | $1,020.11 | $ 5.14 | 1.01% |
| Class R | $1,000.00 | $1,017.59 | $ 7.68 | 1.51% |
| * | Expenses are equal to the Fund's annualized expense ratio for the indicated Class, multiplied by the average account value over the period, multiplied by 184/365 (to reflect the one-half year period). The Example assumes that the $1,000 was invested at the net asset value per share determined at the close of business on April 30, 2023. The Example reflects the expenses of both the Fund and the Portfolios. |
Eaton Vance
Short Duration Strategic Income Fund
October 31, 2023
| Investments in Affiliated Portfolios (the Portfolios) |
| Description | | Value | % of Net
Assets |
| Emerging Markets Local Income Portfolio | | | |
| (identified cost $118,192,398) | | $ 113,467,516 | 2.8 % |
| Global Macro Absolute Return Advantage Portfolio | | | |
| (identified cost $668,956,248) | | 657,868,398 | 16.1 |
| Global Opportunities Portfolio | | | |
| (identified cost $3,217,028,838) | | 2,952,427,145 | 72.4 |
| High Income Opportunities Portfolio | | | |
| (identified cost $107,669,481) | | 94,521,135 | 2.3 |
| Senior Debt Portfolio | | | |
| (identified cost $105,943,045) | | 105,318,836 | 2.6 |
Total Investments in Affiliated Portfolios
(identified cost $4,217,790,010) | | $3,923,603,030 | 96.2% |
| Investments in Affiliated Investment Funds |
| Security | Shares | Value | % of Net
Assets |
| Fixed Income Funds | | | |
| Eaton Vance Emerging Markets Debt Opportunities Fund, Class R6 | 21,198,007 | $ 154,109,514 | 3.8 % |
Total Investments in Affiliated Investment Funds
(identified cost $178,278,267) | | $ 154,109,514 | 3.8% |
Total Investments
(identified cost $4,396,068,277) | | $4,077,712,544 | 100.0% |
| Other Assets, Less Liabilities | | $ (99,873) | (0.0)% (1) |
| Net Assets | | $4,077,612,671 | 100.0% |
| (1) | Amount is less than (0.05)%. |
7
See Notes to Financial Statements.
Eaton Vance
Short Duration Strategic Income Fund
October 31, 2023
Statement of Assets and Liabilities
| | October 31, 2023 |
| Assets | |
| Affiliated investments, at value (identified cost, $4,396,068,277) | $ 4,077,712,544 |
| Cash | 262 |
| Receivable for Fund shares sold | 13,131,663 |
| Trustees' deferred compensation plan | 8,651 |
| Total assets | $4,090,853,120 |
| Liabilities | |
| Payable for Fund shares redeemed | $ 12,199,036 |
| Payable to affiliates: | |
| Distribution and service fees | 233,405 |
| Trustees' fees | 42 |
| Trustees' deferred compensation plan | 8,651 |
| Accrued expenses | 799,315 |
| Total liabilities | $ 13,240,449 |
| Net Assets | $4,077,612,671 |
| Sources of Net Assets | |
| Paid-in capital | $ 4,616,500,025 |
| Accumulated loss | (538,887,354) |
| Net Assets | $4,077,612,671 |
| Class A Shares | |
| Net Assets | $ 650,558,071 |
| Shares Outstanding | 102,466,568 |
Net Asset Value and Redemption Price Per Share
(net assets ÷ shares of beneficial interest outstanding) | $ 6.35 |
Maximum Offering Price Per Share
(100 ÷ 96.75 of net asset value per share) | $ 6.56 |
| Class C Shares | |
| Net Assets | $ 108,637,838 |
| Shares Outstanding | 18,160,014 |
Net Asset Value and Offering Price Per Share*
(net assets ÷ shares of beneficial interest outstanding) | $ 5.98 |
| Class I Shares | |
| Net Assets | $ 3,315,738,591 |
| Shares Outstanding | 523,029,170 |
Net Asset Value, Offering Price and Redemption Price Per Share
(net assets ÷ shares of beneficial interest outstanding) | $ 6.34 |
| Class R Shares | |
| Net Assets | $ 2,678,171 |
| Shares Outstanding | 421,110 |
Net Asset Value, Offering Price and Redemption Price Per Share
(net assets ÷ shares of beneficial interest outstanding) | $ 6.36 |
| On sales of $100,000 or more, the offering price of Class A shares is reduced. |
| * | Redemption price per share is equal to the net asset value less any applicable contingent deferred sales charge. |
8
See Notes to Financial Statements.
Eaton Vance
Short Duration Strategic Income Fund
October 31, 2023
| | Year Ended |
| | October 31, 2023 |
| Investment Income | |
| Dividends allocated from Portfolios (net of foreign taxes withheld of $83,476) | $ 6,722,714 |
| Dividend income from Affiliated Investment Funds | 11,336,913 |
| Interest income | 6,884 |
| Interest and other income allocated from Portfolios (net of foreign taxes withheld of $561,525) | 228,476,286 |
| Expenses, excluding interest and dividend expense, allocated from Portfolios | (23,059,719) |
| Interest and dividend expense and fees allocated from Portfolios | (7,186,474) |
| Total investment income | $ 216,296,604 |
| Expenses | |
| Distribution and service fees: | |
| Class A | $ 1,634,979 |
| Class C | 1,203,364 |
| Class R | 12,260 |
| Trustees’ fees and expenses | 499 |
| Custodian fee | 68,565 |
| Transfer and dividend disbursing agent fees | 2,382,846 |
| Legal and accounting services | 208,199 |
| Printing and postage | 595,640 |
| Registration fees | 314,397 |
| Miscellaneous | 37,732 |
| Total expenses | $ 6,458,481 |
| Net investment income | $ 209,838,123 |
| Realized and Unrealized Gain (Loss) | |
| Net realized gain (loss) allocated from Portfolios: | |
| Investment transactions (net of foreign capital gains taxes of $83,800) | $ (121,838,910) |
| Written options | 1,588,459 |
| Securities sold short | 1,660,888 |
| TBA sale commitments | (16,257) |
| Futures contracts | 5,608,703 |
| Swap contracts | (13,418,749) |
| Foreign currency transactions | 36,299,577 |
| Forward foreign currency exchange contracts | (33,970,400) |
| Non-deliverable bond forward contracts | 4,045,662 |
| Net realized loss | $(120,041,027) |
| Change in unrealized appreciation (depreciation): | |
| Investments — Affiliated Investment Funds | $ 8,888,651 |
| Change in unrealized appreciation (depreciation) allocated from Portfolios: | |
| Investments (including net increase in accrued foreign capital gains taxes of $29,872) | 133,520,230 |
| Written swaptions | 4,674,079 |
| Securities sold short | 3,205,941 |
| TBA sale commitments | (1,941,220) |
| Futures contracts | (28,452,062) |
| Swap contracts | (24,819,445) |
| Foreign currency | 1,603,112 |
| Forward foreign currency exchange contracts | (26,483,457) |
| Non-deliverable bond forward contracts | (331,983) |
| Net change in unrealized appreciation (depreciation) | $ 69,863,846 |
| Net realized and unrealized loss | $ (50,177,181) |
| Net increase in net assets from operations | $ 159,660,942 |
9
See Notes to Financial Statements.
Eaton Vance
Short Duration Strategic Income Fund
October 31, 2023
Statements of Changes in Net Assets
| | Year Ended October 31, |
| | 2023 | 2022 |
| Increase (Decrease) in Net Assets | | |
| From operations: | | |
| Net investment income | $ 209,838,123 | $ 136,470,028 |
| Net realized gain (loss) | (120,041,027) | 13,661,196 |
| Net change in unrealized appreciation (depreciation) | 69,863,846 | (305,868,037) |
| Net increase (decrease) in net assets from operations | $ 159,660,942 | $ (155,736,813) |
| Distributions to shareholders: | | |
| Class A | $ (37,528,959) | $ (30,618,799) |
| Class C | (6,105,135) | (5,536,045) |
| Class I | (166,471,817) | (106,704,267) |
| Class R | (134,084) | (112,637) |
| Total distributions to shareholders | $ (210,239,995) | $ (142,971,748) |
| Tax return of capital to shareholders: | | |
| Class A | $ (8,294,327) | $ (2,257,703) |
| Class C | (1,313,902) | (404,971) |
| Class I | (37,731,239) | (8,027,547) |
| Class R | (29,370) | (8,152) |
| Total tax return of capital to shareholders | $ (47,368,838) | $ (10,698,373) |
| Transactions in shares of beneficial interest: | | |
| Class A | $ 47,659,414 | $ (13,261,126) |
| Class C | (15,813,159) | (20,128,872) |
| Class I | 1,106,958,884 | 442,427,381 |
| Class R | 486,216 | (204,959) |
| Net increase in net assets from Fund share transactions | $1,139,291,355 | $ 408,832,424 |
| Net increase in net assets | $1,041,343,464 | $ 99,425,490 |
| Net Assets | | |
| At beginning of year | $ 3,036,269,207 | $ 2,936,843,717 |
| At end of year | $4,077,612,671 | $3,036,269,207 |
10
See Notes to Financial Statements.
Eaton Vance
Short Duration Strategic Income Fund
October 31, 2023
| | Class A |
| | Year Ended October 31, |
| | 2023 | 2022 | 2021 | 2020 | 2019 |
| Net asset value — Beginning of year | $ 6.480 | $ 7.180 | $ 7.180 | $ 7.210 | $ 7.180 |
| Income (Loss) From Operations | | | | | |
| Net investment income(1) | $ 0.377 | $ 0.302 | $ 0.298 | $ 0.234 | $ 0.337 |
| Net realized and unrealized gain (loss) | (0.046) | (0.662) | 0.009 (2) | 0.227 | (0.004) |
| Total income (loss) from operations | $ 0.331 | $ (0.360) | $ 0.307 | $ 0.461 | $ 0.333 |
| Less Distributions | | | | | |
| From net investment income | $ (0.378) | $ (0.316) | $ (0.274) | $ (0.491) | $ (0.303) |
| From net realized gain | — | (0.001) | (0.002) | — | — |
| Tax return of capital | (0.083) | (0.023) | (0.031) | — | — |
| Total distributions | $ (0.461) | $ (0.340) | $ (0.307) | $ (0.491) | $ (0.303) |
| Net asset value — End of year | $ 6.350 | $ 6.480 | $ 7.180 | $ 7.180 | $ 7.210 |
| Total Return(3) | 5.11% | (4.99)% | 4.01% | 6.83% | 4.60% |
| Ratios/Supplemental Data | | | | | |
| Net assets, end of year (000’s omitted) | $650,558 | $617,011 | $697,690 | $545,014 | $539,448 |
| Ratios (as a percentage of average daily net assets):(4) | | | | | |
| Expenses (5) | 1.20% (6) | 1.07% (6) | 1.08% | 1.11% | 1.18% |
| Net investment income | 5.74% | 4.40% | 4.08% | 3.30% | 4.70% |
| Portfolio Turnover of the Fund(7) | 14% | 22% | 14% | 18% | 11% |
| (1) | Computed using average shares outstanding. |
| (2) | The per share amount is not in accord with the net realized and unrealized gain (loss) for the period because of the timing of Fund share transactions and the amount of the per share realized and unrealized gains and losses at such time. |
| (3) | Returns are historical and are calculated by determining the percentage change in net asset value with all distributions reinvested and do not reflect the effect of sales charges. |
| (4) | Includes the Fund’s share of the Portfolios' allocated expenses. |
| (5) | Includes interest and/or dividend expense, including on securities sold short and/or reverse repurchase agreements if applicable, of 0.20%, 0.06%, 0.06%, 0.04% and 0.10% of average daily net assets for the years ended October 31, 2023, 2022, 2021, 2020 and 2019, respectively. |
| (6) | Includes a reduction by the investment adviser of a portion of the Portfolios’ adviser fee due to the Portfolios’ investment in the Liquidity Fund (equal to 0.02% and less than 0.01% of average daily net assets for the years ended October 31, 2023 and 2022, respectively). |
| (7) | Percentage includes both the Fund's contributions to and withdrawals from the Portfolios and purchases and sales of securities held directly by the Fund, if any. |
11
See Notes to Financial Statements.
Eaton Vance
Short Duration Strategic Income Fund
October 31, 2023
Financial Highlights — continued
| | Class C |
| | Year Ended October 31, |
| | 2023 | 2022 | 2021 | 2020 | 2019 |
| Net asset value — Beginning of year | $ 6.100 | $ 6.760 | $ 6.770 | $ 6.800 | $ 6.780 |
| Income (Loss) From Operations | | | | | |
| Net investment income(1) | $ 0.309 | $ 0.235 | $ 0.230 | $ 0.172 | $ 0.269 |
| Net realized and unrealized gain (loss) | (0.042) | (0.623) | (0.002) | 0.221 | (0.014) |
| Total income (loss) from operations | $ 0.267 | $ (0.388) | $ 0.228 | $ 0.393 | $ 0.255 |
| Less Distributions | | | | | |
| From net investment income | $ (0.318) | $ (0.252) | $ (0.212) | $ (0.423) | $ (0.235) |
| From net realized gain | — | (0.001) | (0.002) | — | — |
| Tax return of capital | (0.069) | (0.019) | (0.024) | — | — |
| Total distributions | $ (0.387) | $ (0.272) | $ (0.238) | $ (0.423) | $ (0.235) |
| Net asset value — End of year | $ 5.980 | $ 6.100 | $ 6.760 | $ 6.770 | $ 6.800 |
| Total Return(2) | 4.36% | (5.85)% | 3.36% | 6.02% | 3.84% |
| Ratios/Supplemental Data | | | | | |
| Net assets, end of year (000’s omitted) | $108,638 | $126,342 | $160,918 | $201,798 | $251,581 |
| Ratios (as a percentage of average daily net assets):(3) | | | | | |
| Expenses (4) | 1.95% (5) | 1.82% (5) | 1.83% | 1.86% | 1.93% |
| Net investment income | 4.99% | 3.63% | 3.35% | 2.57% | 3.98% |
| Portfolio Turnover of the Fund(6) | 14% | 22% | 14% | 18% | 11% |
| (1) | Computed using average shares outstanding. |
| (2) | Returns are historical and are calculated by determining the percentage change in net asset value with all distributions reinvested and do not reflect the effect of sales charges. |
| (3) | Includes the Fund’s share of the Portfolios' allocated expenses. |
| (4) | Includes interest and/or dividend expense, including on securities sold short and/or reverse repurchase agreements if applicable, of 0.20%, 0.06%, 0.06%, 0.04% and 0.10% of average daily net assets for the years ended October 31, 2023, 2022, 2021, 2020 and 2019, respectively. |
| (5) | Includes a reduction by the investment adviser of a portion of the Portfolios’ adviser fee due to the Portfolios’ investment in the Liquidity Fund (equal to 0.02% and less than 0.01% of average daily net assets for the years ended October 31, 2023 and 2022, respectively). |
| (6) | Percentage includes both the Fund's contributions to and withdrawals from the Portfolios and purchases and sales of securities held directly by the Fund, if any. |
12
See Notes to Financial Statements.
Eaton Vance
Short Duration Strategic Income Fund
October 31, 2023
Financial Highlights — continued
| | Class I |
| | Year Ended October 31, |
| | 2023 | 2022 | 2021 | 2020 | 2019 |
| Net asset value — Beginning of year | $ 6.470 | $ 7.160 | $ 7.170 | $ 7.200 | $ 7.170 |
| Income (Loss) From Operations | | | | | |
| Net investment income(1) | $ 0.393 | $ 0.320 | $ 0.313 | $ 0.252 | $ 0.354 |
| Net realized and unrealized gain (loss) | (0.047) | (0.653) | 0.002 (2) | 0.226 | (0.004) |
| Total income (loss) from operations | $ 0.346 | $ (0.333) | $ 0.315 | $ 0.478 | $ 0.350 |
| Less Distributions | | | | | |
| From net investment income | $ (0.391) | $ (0.331) | $ (0.290) | $ (0.508) | $ (0.320) |
| From net realized gain | — | (0.001) | (0.002) | — | — |
| Tax return of capital | (0.085) | (0.025) | (0.033) | — | — |
| Total distributions | $ (0.476) | $ (0.357) | $ (0.325) | $ (0.508) | $ (0.320) |
| Net asset value — End of year | $ 6.340 | $ 6.470 | $ 7.160 | $ 7.170 | $ 7.200 |
| Total Return(3) | 5.37% | (4.77)% | 4.27% | 7.10% | 4.87% |
| Ratios/Supplemental Data | | | | | |
| Net assets, end of year (000’s omitted) | $3,315,739 | $2,290,663 | $2,075,516 | $967,716 | $919,828 |
| Ratios (as a percentage of average daily net assets):(4) | | | | | |
| Expenses (5) | 0.95% (6) | 0.82% (6) | 0.83% | 0.84% | 0.91% |
| Net investment income | 5.98% | 4.67% | 4.30% | 3.55% | 4.95% |
| Portfolio Turnover of the Fund(7) | 14% | 22% | 14% | 18% | 11% |
| (1) | Computed using average shares outstanding. |
| (2) | The per share amount is not in accord with the net realized and unrealized gain (loss) for the period because of the timing of Fund share transactions and the amount of the per share realized and unrealized gains and losses at such time. |
| (3) | Returns are historical and are calculated by determining the percentage change in net asset value with all distributions reinvested. |
| (4) | Includes the Fund’s share of the Portfolios' allocated expenses. |
| (5) | Includes interest and/or dividend expense, including on securities sold short and/or reverse repurchase agreements if applicable, of 0.20%, 0.06%, 0.06%, 0.04% and 0.10% of average daily net assets for the years ended October 31, 2023, 2022, 2021, 2020 and 2019, respectively. |
| (6) | Includes a reduction by the investment adviser of a portion of the Portfolios’ adviser fee due to the Portfolios’ investment in the Liquidity Fund (equal to 0.02% and less than 0.01% of average daily net assets for the years ended October 31, 2023 and 2022, respectively). |
| (7) | Percentage includes both the Fund's contributions to and withdrawals from the Portfolios and purchases and sales of securities held directly by the Fund, if any. |
13
See Notes to Financial Statements.
Eaton Vance
Short Duration Strategic Income Fund
October 31, 2023
Financial Highlights — continued
| | Class R |
| | Year Ended October 31, |
| | 2023 | 2022 | 2021 | 2020 | 2019 |
| Net asset value — Beginning of year | $ 6.490 | $ 7.190 | $ 7.200 | $ 7.220 | $ 7.190 |
| Income (Loss) From Operations | | | | | |
| Net investment income(1) | $ 0.361 | $ 0.285 | $ 0.261 | $ 0.192 | $ 0.300 |
| Net realized and unrealized gain (loss) | (0.046) | (0.661) | 0.018 (2) | 0.262 | 0.015 |
| Total income (loss) from operations | $ 0.315 | $(0.376) | $ 0.279 | $ 0.454 | $ 0.315 |
| Less Distributions | | | | | |
| From net investment income | $ (0.365) | $ (0.301) | $ (0.258) | $ (0.474) | $ (0.285) |
| From net realized gain | — | (0.001) | (0.002) | — | — |
| Tax return of capital | (0.080) | (0.022) | (0.029) | — | — |
| Total distributions | $(0.445) | $(0.324) | $(0.289) | $(0.474) | $(0.285) |
| Net asset value — End of year | $ 6.360 | $ 6.490 | $ 7.190 | $ 7.200 | $ 7.220 |
| Total Return(3) | 4.85% | (5.21)% | 3.75% | 6.56% | 4.34% |
| Ratios/Supplemental Data | | | | | |
| Net assets, end of year (000’s omitted) | $ 2,678 | $ 2,254 | $ 2,720 | $ 2,528 | $ 1,949 |
| Ratios (as a percentage of average daily net assets):(4) | | | | | |
| Expenses (5) | 1.45% (6) | 1.32% (6) | 1.33% | 1.36% | 1.44% |
| Net investment income | 5.48% | 4.12% | 3.57% | 2.71% | 4.18% |
| Portfolio Turnover of the Fund(7) | 14% | 22% | 14% | 18% | 11% |
| (1) | Computed using average shares outstanding. |
| (2) | The per share amount is not in accord with the net realized and unrealized gain (loss) for the period because of the timing of Fund share transactions and the amount of the per share realized and unrealized gains and losses at such time. |
| (3) | Returns are historical and are calculated by determining the percentage change in net asset value with all distributions reinvested. |
| (4) | Includes the Fund’s share of the Portfolios' allocated expenses. |
| (5) | Includes interest and/or dividend expense, including on securities sold short and/or reverse repurchase agreements if applicable, of 0.20%, 0.06%, 0.06%, 0.04% and 0.10% of average daily net assets for the years ended October 31, 2023, 2022, 2021, 2020 and 2019, respectively. |
| (6) | Includes a reduction by the investment adviser of a portion of the Portfolios’ adviser fee due to the Portfolios’ investment in the Liquidity Fund (equal to 0.02% and less than 0.01% of average daily net assets for the years ended October 31, 2023 and 2022, respectively). |
| (7) | Percentage includes both the Fund's contributions to and withdrawals from the Portfolios and purchases and sales of securities held directly by the Fund, if any. |
14
See Notes to Financial Statements.
Eaton Vance
Short Duration Strategic Income Fund
October 31, 2023
Notes to Financial Statements
1 Significant Accounting Policies
Eaton Vance Short Duration Strategic Income Fund (the Fund) is a diversified series of Eaton Vance Mutual Funds Trust (the Trust). The Trust is a Massachusetts business trust registered under the Investment Company Act of 1940, as amended (the 1940 Act), as an open-end management investment company. The Fund offers four classes of shares. Class A shares are generally sold subject to a sales charge imposed at time of purchase. Class C shares are sold at net asset value and are generally subject to a contingent deferred sales charge (see Note 6). Effective November 5, 2020, Class C shares automatically convert to Class A shares eight years after their purchase as described in the Fund's prospectus. Class I and Class R shares are sold at net asset value and are not subject to a sales charge. Each class represents a pro rata interest in the Fund, but votes separately on class-specific matters and (as noted below) is subject to different expenses. Realized and unrealized gains and losses and net investment income and losses, other than class-specific expenses, are allocated daily to each class of shares based on the relative net assets of each class to the total net assets of the Fund. Each class of shares differs in its distribution plan and certain other class-specific expenses. The Fund’s investment objective is total return. The Fund currently pursues its objective by investing in interests in five portfolios (the Portfolios) managed by an affiliate of Eaton Vance Management (EVM), which are Massachusetts business trusts, and in shares of Eaton Vance Emerging Markets Debt Opportunities Fund, a series of Eaton Vance Series Fund, Inc., a Maryland corporation (the Affiliated Investment Fund). The value of the Fund’s investments in the Portfolios reflects the Fund’s proportionate interest in each Portfolio's net assets. The Portfolios and the Fund’s proportionate interest in each of their net assets at October 31, 2023 were as follows: Emerging Markets Local Income Portfolio (10.6%), Global Macro Absolute Return Advantage Portfolio (26.6%), Global Opportunities Portfolio (98.6%), High Income Opportunities Portfolio (8.7%) and Senior Debt Portfolio (1.8%). The performance of the Fund is directly affected by the performance of the Portfolios and the Affiliated Investment Fund. The financial statements of Global Opportunities Portfolio, including the portfolio of investments, are included elsewhere in this report and should be read in conjunction with the Fund’s financial statements. A copy of each other Portfolio’s financial statements and the Affiliated Investment Fund’s financial statements are available by calling Eaton Vance at 1-800-262-1122 or in the EDGAR database on the Securities and Exchange Commission’s website at www.sec.gov.
The following is a summary of significant accounting policies of the Fund. The policies are in conformity with accounting principles generally accepted in the United States of America (U.S. GAAP). The Fund is an investment company and follows accounting and reporting guidance in the Financial Accounting Standards Board (FASB) Accounting Standards Codification Topic 946.
A Investment Valuation— Valuation of securities by Global Opportunities Portfolio is discussed in Note 1A of such Portfolio’s Notes to Consolidated Financial Statements, which are included elsewhere in this report. Such policies are consistent with those of the other Portfolios in which the Fund invests.
Additional valuation policies for the other Portfolios are as follows:
Senior Floating-Rate Loans. Interests in senior floating-rate loans (Senior Loans) are valued generally at the average mean of bid and ask quotations obtained from a third party pricing service. Senior Loans, for which a valuation is not available or deemed unreliable, are fair valued by the investment adviser utilizing one or more of the valuation techniques described below to assess the likelihood that the borrower will make a full repayment of the loan underlying such Senior Loan. If the investment adviser believes that there is a reasonable likelihood of full repayment, the investment adviser will determine fair value using a matrix pricing approach that considers the yield on the Senior Loan relative to yields on other Senior Loans issued by companies of comparable credit quality. If the investment adviser believes there is not a reasonable likelihood of full repayment, the investment adviser will determine fair value using analyses that include, but are not limited to: (i) a comparison of the value of the borrower’s outstanding equity and debt to that of comparable public companies; (ii) a discounted cash flow analysis; or (iii) when the investment adviser believes it is likely that a borrower will be liquidated or sold, an analysis of the terms of such liquidation or sale. In certain cases, the investment adviser will use a combination of analytical methods to determine fair value, such as when only a portion of a borrower’s assets are likely to be sold. In conducting its assessment and analyses for purposes of determining fair value of a Senior Loan, the investment adviser will use its discretion and judgment in considering and appraising relevant factors. Junior Loans (i.e., subordinated loans and second lien loans) are valued in the same manner as Senior Loans.
Derivatives. U.S. exchange-traded options are valued at the mean between the bid and ask prices at valuation time as reported by the Options Price Reporting Authority. Non-U.S. exchange-traded options and over-the-counter options (including options on securities, indices and foreign currencies) are valued by a third party pricing service using techniques that consider factors including the value of the underlying instrument, the volatility of the underlying instrument and the period of time until option expiration. Total return swaps are valued using valuations provided by a third party pricing service based on the value of the underlying index or instrument and reference interest rate.
The Fund’s investment in the Affiliated Investment Fund is valued at the closing net asset value per share.
B Income—The Fund’s net investment income or loss includes the Fund’s pro rata share of the net investment income or loss of the Portfolios, less all actual and accrued expenses of the Fund. Dividend income on investments in the Affiliated Investment Fund is recorded on the ex-dividend date for dividends received in cash and/or securities. Distributions from the Affiliated Investment Fund are recorded as dividend income, capital gains or return of capital based on the nature of the distribution.
C Federal and Other Taxes—The Fund’s policy is to comply with the provisions of the Internal Revenue Code applicable to regulated investment companies and to distribute to shareholders each year substantially all of its net investment income, and all or substantially all of its net realized capital gains. Accordingly, no provision for federal income or excise tax is necessary.
Eaton Vance
Short Duration Strategic Income Fund
October 31, 2023
Notes to Financial Statements — continued
In addition to the requirements of the Internal Revenue Code, the Fund may also be required to recognize its pro rata share of the capital gains taxes incurred by the Portfolios. In doing so, the daily net asset value would reflect the Fund’s pro rata share of the estimated reserve for such taxes incurred by the Portfolios.
As of October 31, 2023, the Fund had no uncertain tax positions that would require financial statement recognition, de-recognition, or disclosure. The Fund files a U.S. federal income tax return annually after its fiscal year-end, which is subject to examination by the Internal Revenue Service for a period of three years from the date of filing.
D Expenses—The majority of expenses of the Trust are directly identifiable to an individual fund. Expenses which are not readily identifiable to a specific fund are allocated taking into consideration, among other things, the nature and type of expense and the relative size of the funds.
E Use of Estimates—The preparation of the financial statements in conformity with U.S. GAAP requires management to make estimates and assumptions that affect the reported amounts of assets and liabilities at the date of the financial statements and the reported amounts of income and expense during the reporting period. Actual results could differ from those estimates.
F Indemnifications—Under the Trust’s organizational documents, its officers and Trustees may be indemnified against certain liabilities and expenses arising out of the performance of their duties to the Fund. Under Massachusetts law, if certain conditions prevail, shareholders of a Massachusetts business trust (such as the Trust) could be deemed to have personal liability for the obligations of the Trust. However, the Trust’s Declaration of Trust contains an express disclaimer of liability on the part of Fund shareholders and the By-laws provide that the Trust shall assume, upon request by the shareholder, the defense on behalf of any Fund shareholders. Moreover, the By-laws also provide for indemnification out of Fund property of any shareholder held personally liable solely by reason of being or having been a shareholder for all loss or expense arising from such liability. Additionally, in the normal course of business, the Fund enters into agreements with service providers that may contain indemnification clauses. The Fund’s maximum exposure under these arrangements is unknown as this would involve future claims that may be made against the Fund that have not yet occurred.
G Other—Investment transactions are accounted for on a trade date basis. Realized gains and losses on investments sold are determined on the basis of identified cost.
2 Distributions to Shareholders and Income Tax Information
The Fund expects to pay any required income distributions monthly and intends to distribute annually all or substantially all of its net realized capital gains. The Fund may include in its distributions amounts attributable to the imputed interest on foreign currency exposures and certain other derivative positions which, in certain circumstances, may result in a return of capital for federal income tax purposes. Distributions to shareholders are recorded on the ex-dividend date. Distributions are declared separately for each class of shares. Shareholders may reinvest income and capital gain distributions in additional shares of the same class of the Fund at the net asset value as of the ex-dividend date or, at the election of the shareholder, receive distributions in cash. Distributions to shareholders are determined in accordance with income tax regulations, which may differ from U.S. GAAP. As required by U.S. GAAP, only distributions in excess of tax basis earnings and profits are reported in the financial statements as a return of capital. Permanent differences between book and tax accounting relating to distributions are reclassified to paid-in capital. For tax purposes, distributions from short-term capital gains are considered to be from ordinary income.
The tax character of distributions declared for the years ended October 31, 2023 and October 31, 2022 was as follows:
| | Year Ended October 31, |
| | 2023 | 2022 |
| Ordinary income | $210,239,995 | $142,427,149 |
| Long-term capital gains | $ — | $ 544,599 |
| Tax return of capital | $ 47,368,838 | $ 10,698,373 |
During the year ended October 31, 2023, accumulated loss was decreased by $759,422 and paid-in capital was decreased by $759,422 due to differences between book and tax accounting. These reclassifications had no effect on the net assets or net asset value per share of the Fund.
Eaton Vance
Short Duration Strategic Income Fund
October 31, 2023
Notes to Financial Statements — continued
As of October 31, 2023, the components of distributable earnings (accumulated loss) on a tax basis were as follows:
| Deferred capital losses | $ (143,836,476) |
| Net unrealized depreciation | (395,050,878) |
| Accumulated loss | $(538,887,354) |
At October 31, 2023, the Fund, for federal income tax purposes, had deferred capital losses of $143,836,476 which would reduce its taxable income arising from future net realized gains on investment transactions, if any, to the extent permitted by the Internal Revenue Code, and thus would reduce the amount of distributions to shareholders, which would otherwise be necessary to relieve the Fund of any liability for federal income or excise tax. The deferred capital losses are treated as arising on the first day of the Fund’s next taxable year and retain the same short-term or long-term character as when originally deferred. Of the deferred capital losses at October 31, 2023, $45,826,179 are short-term and $98,010,297 are long-term. Utilization of these deferred capital losses may be limited in accordance with certain income tax regulations.
The cost and unrealized appreciation (depreciation) of investments of the Fund, including the Portfolios, at October 31, 2023, as determined on a federal income tax basis, were as follows:
| Aggregate cost | $4,472,756,572 |
| Gross unrealized appreciation | $ — |
| Gross unrealized depreciation | (395,044,028) |
| Net unrealized depreciation | $ (395,044,028) |
3 Investment Adviser Fee and Other Transactions with Affiliates
The investment adviser fee is earned by EVM, an indirect, wholly-owned subsidiary of Morgan Stanley, as compensation for investment advisory services rendered to the Fund. The investment adviser fee is computed at an annual rate as a percentage of the Fund’s average daily net assets that are not invested in other investment companies for which EVM or its affiliates serve as investment adviser or administrator as follows and is payable monthly:
| Average Daily Net Assets | Annual Fee Rate |
| Up to $500 million | 0.615% |
| $500 million but less than $1 billion | 0.595% |
| $1 billion but less than $1.5 billion | 0.575% |
| $1.5 billion but less than $2 billion | 0.555% |
| $2 billion but less than $3 billion | 0.520% |
| $3 billion and over | 0.490% |
For the year ended October 31, 2023, the Fund incurred no investment adviser fee on such assets. To the extent the Fund’s assets are invested in the Portfolios, the Fund is allocated its share of the Portfolios’ investment adviser fees. The Portfolios have engaged Boston Management and Research (BMR), to render investment advisory services. For the year ended October 31, 2023, the Fund’s allocated portion of the investment adviser fees paid by the Portfolios totaled $21,546,819 or 0.61% of the Fund’s average daily net assets. EVM also serves as the administrator of the Fund, but receives no compensation.
The Portfolios may invest in a money market fund, the Institutional Class of the Morgan Stanley Institutional Liquidity Funds - Government Portfolio (the Liquidity Fund), an open-end management investment company managed by Morgan Stanley Investment Management Inc., a wholly-owned subsidiary of Morgan Stanley. The investment adviser fee paid by the Portfolios is reduced by an amount equal to their pro rata share of the advisory and administration fees paid by the Portfolios due to their investments in the Liquidity Fund. For the year ended October 31, 2023, the Fund’s allocated share of the reduction of the investment adviser fee paid by the Portfolios was $626,136 relating to the Portfolios’ investments in the Liquidity Fund.
EVM provides sub-transfer agency and related services to the Fund pursuant to a Sub-Transfer Agency Support Services Agreement. For the year ended October 31, 2023, EVM earned $138,547 from the Fund pursuant to such agreement, which is included in transfer and dividend disbursing agent fees on the Statement of Operations. The Fund was informed that Eaton Vance Distributors, Inc. (EVD), an affiliate of EVM and the Fund’s principal underwriter,
Eaton Vance
Short Duration Strategic Income Fund
October 31, 2023
Notes to Financial Statements — continued
received $47,812 as its portion of the sales charge on sales of Class A shares for the year ended October 31, 2023. The Fund was informed that Morgan Stanley affiliated broker-dealers, which may be deemed to be affiliates of EVM, BMR and EVD, also received a portion of the sales charge on sales of Class A shares for the year ended October 31, 2023 in the amount of $12,918. EVD also received distribution and service fees from Class A, Class C and Class R shares (see Note 5) and contingent deferred sales charges (see Note 6).
Trustees and officers of the Fund and the Portfolios who are members of EVM’s or BMR’s organizations receive remuneration for their services to the Fund out of the investment adviser fee. Certain officers and Trustees of the Fund and the Portfolios are officers of the above organizations.
4 Purchases and Sales of Investments
Purchases and sales of investments, other than short-term obligations and investments in the Portfolios, aggregated $11,336,913 and $0, respectively, for the year ended October 31, 2023.
5 Distribution Plans
The Fund has in effect a distribution plan for Class A shares (Class A Plan) pursuant to Rule 12b-1 under the 1940 Act. Pursuant to the Class A Plan, the Fund pays EVD a distribution and service fee of 0.25% per annum of its average daily net assets attributable to Class A shares for distribution services and facilities provided to the Fund by EVD, as well as for personal services and/or the maintenance of shareholder accounts. Distribution and service fees paid or accrued to EVD for the year ended October 31, 2023 amounted to $1,634,979 for Class A shares.
The Fund also has in effect distribution plans for Class C shares (Class C Plan) and Class R shares (Class R Plan) pursuant to Rule 12b-1 under the 1940 Act. Pursuant to the Class C Plan, the Fund pays EVD amounts equal to 0.75% per annum of its average daily net assets attributable to Class C shares for providing ongoing distribution services and facilities to the Fund. For the year ended October 31, 2023, the Fund paid or accrued to EVD $902,523 for Class C shares.
The Class R Plan requires the Fund to pay EVD an amount up to 0.50% per annum of its average daily net assets attributable to Class R shares for providing ongoing distribution services and facilities to the Fund. The Trustees of the Trust have currently limited Class R distribution payments to 0.25% per annum of the average daily net assets attributable to Class R shares. For the year ended October 31, 2023, the Fund paid or accrued to EVD $6,130 for Class R shares.
Pursuant to the Class C and Class R Plans, the Fund also makes payments of service fees to EVD, financial intermediaries and other persons in amounts equal to 0.25% per annum of its average daily net assets attributable to that class. Service fees paid or accrued are for personal services and/or the maintenance of shareholder accounts. They are separate and distinct from the sales commissions and distribution fees payable to EVD. Service fees paid or accrued for the year ended October 31, 2023 amounted to $300,841 and $6,130 for Class C and Class R shares, respectively.
Distribution and service fees are subject to the limitations contained in the Financial Industry Regulatory Authority Rule 2341(d).
6 Contingent Deferred Sales Charges
A contingent deferred sales charge (CDSC) of 1% generally is imposed on redemptions of Class C shares made within 12 months of purchase. Class A shares may be subject to a 0.75% CDSC if redeemed within 12 months of purchase (depending on the circumstances of purchase). Generally, the CDSC is based upon the lower of the net asset value at date of redemption or date of purchase. No charge is levied on shares acquired by reinvestment of dividends or capital gain distributions. For the year ended October 31, 2023, the Fund was informed that EVD received $13,753 of CDSCs paid by Class C shareholders and no CDSCs paid by Class A shareholders.
7 Investment Transactions
For the year ended October 31, 2023, increases and decreases in the Fund's investments in the Portfolios were as follows:
| Portfolio | Contributions | Withdrawals |
| Emerging Markets Local Income Portfolio | $ 28,000,000 | $ (57,003,564) |
| Global Macro Absolute Return Advantage Portfolio | 208,803,811 | (7,345,215) |
| Global Opportunities Portfolio | 1,059,553,831 | (303,199,767) |
| High Income Opportunities Portfolio | — | — |
| Senior Debt Portfolio | 78,208,000 | (130,815,805) |
Eaton Vance
Short Duration Strategic Income Fund
October 31, 2023
Notes to Financial Statements — continued
8 Shares of Beneficial Interest
The Fund’s Declaration of Trust permits the Trustees to issue an unlimited number of full and fractional shares of beneficial interest (without par value). Such shares may be issued in a number of different series (such as the Fund) and classes. Transactions in Fund shares, including direct exchanges pursuant to share class conversions, were as follows:
| | Year Ended
October 31, 2023 | | Year Ended
October 31, 2022 |
| | Shares | Amount | | Shares | Amount |
| Class A | | | | | |
| Sales | 35,980,990 | $ 237,067,338 | | 20,976,045 | $ 144,750,593 |
| Issued to shareholders electing to receive payments of distributions in Fund shares | 6,513,602 | 42,668,531 | | 4,492,592 | 30,520,580 |
| Redemptions | (35,298,867) | (232,076,455) | | (27,436,307) | (188,532,299) |
| Net increase (decrease) | 7,195,725 | $ 47,659,414 | | (1,967,670) | $ (13,261,126) |
| Class C | | | | | |
| Sales | 6,171,903 | $ 38,197,100 | | 3,383,005 | $ 21,937,948 |
| Issued to shareholders electing to receive payments of distributions in Fund shares | 1,153,290 | 7,122,726 | | 908,474 | 5,817,440 |
| Redemptions | (9,870,547) | (61,132,985) | | (7,392,059) | (47,884,260) |
| Net decrease | (2,545,354) | $ (15,813,159) | | (3,100,580) | $ (20,128,872) |
| Class I | | | | | |
| Sales | 318,604,510 | $ 2,091,777,974 | | 221,544,338 | $ 1,523,518,681 |
| Issued to shareholders electing to receive payments of distributions in Fund shares | 29,362,563 | 191,869,761 | | 15,942,843 | 107,907,814 |
| Redemptions | (179,166,371) | (1,176,688,851) | | (172,975,993) | (1,188,999,114) |
| Net increase | 168,800,702 | $ 1,106,958,884 | | 64,511,188 | $ 442,427,381 |
| Class R | | | | | |
| Sales | 262,726 | $ 1,745,077 | | 85,854 | $ 600,495 |
| Issued to shareholders electing to receive payments of distributions in Fund shares | 24,062 | 157,798 | | 16,741 | 114,035 |
| Redemptions | (213,108) | (1,416,659) | | (133,626) | (919,489) |
| Net increase (decrease) | 73,680 | $ 486,216 | | (31,031) | $ (204,959) |
9 Affiliated Investments
At October 31, 2023, the value of the Fund's investment in affiliated funds was $154,109,514, which represents 3.8% of the Fund's net assets. Transactions in such investments by the Fund for the year ended October 31, 2023 were as follows:
| Name | Value,
beginning
of period | Purchases | Sales
proceeds | Net
realized
gain (loss) | Change in
unrealized
appreciation
(depreciation) | Value, end
of period | Dividend
income | Shares,
end of period |
| Eaton Vance Emerging Markets Debt Opportunities Fund, Class R6 | $133,883,950 | $11,336,913 | $ — | $ — | $8,888,651 | $154,109,514 | $11,336,913 | 21,198,007 |
Eaton Vance
Short Duration Strategic Income Fund
October 31, 2023
Notes to Financial Statements — continued
10 Fair Value Measurements
Under generally accepted accounting principles for fair value measurements, a three-tier hierarchy to prioritize the assumptions, referred to as inputs, is used in valuation techniques to measure fair value. The three-tier hierarchy of inputs is summarized in the three broad levels listed below.
| • | Level 1 – quoted prices in active markets for identical investments |
| • | Level 2 – other significant observable inputs (including quoted prices for similar investments, interest rates, prepayment speeds, credit risk, etc.) |
| • | Level 3 – significant unobservable inputs (including a fund's own assumptions in determining the fair value of investments) |
In cases where the inputs used to measure fair value fall in different levels of the fair value hierarchy, the level disclosed is determined based on the lowest level input that is significant to the fair value measurement in its entirety. The inputs or methodology used for valuing securities are not necessarily an indication of the risk associated with investing in those securities.
At October 31, 2023, the hierarchy of inputs used in valuing the Fund's investments in securities and investments in the Portfolios, which are carried at fair value, were as follows:
| Asset Description | Level 1 | Level 2 | Level 3 | Total |
| Investments in Portfolios | $ 3,923,603,030 | $ — | $ — | $ 3,923,603,030 |
| Investments in Affiliated Investment Funds | 154,109,514 | — | — | 154,109,514 |
| Total Investments | $4,077,712,544 | $ — | $ — | $4,077,712,544 |
Eaton Vance
Short Duration Strategic Income Fund
October 31, 2023
Report of Independent Registered Public Accounting Firm
To the Trustees of Eaton Vance Mutual Funds Trust and Shareholders of Eaton Vance Short Duration Strategic Income Fund:
Opinion on the Financial Statements and Financial Highlights
We have audited the accompanying statement of assets and liabilities of Eaton Vance Short Duration Strategic Income Fund (the “Fund") (one of the funds constituting Eaton Vance Mutual Funds Trust), including the portfolio of investments, as of October 31, 2023, the related statement of operations for the year then ended, the statements of changes in net assets for each of the two years in the period then ended, the financial highlights for each of the five years in the period then ended, and the related notes. In our opinion, the financial statements and financial highlights present fairly, in all material respects, the financial position of the Fund as of October 31, 2023, and the results of its operations for the year then ended, the changes in its net assets for each of the two years in the period then ended, and the financial highlights for each of the five years in the period then ended, in conformity with accounting principles generally accepted in the United States of America.
Basis for Opinion
These financial statements and financial highlights are the responsibility of the Fund's management. Our responsibility is to express an opinion on the Fund's financial statements and financial highlights based on our audits. We are a public accounting firm registered with the Public Company Accounting Oversight Board (United States) (PCAOB) and are required to be independent with respect to the Fund in accordance with the U.S. federal securities laws and the applicable rules and regulations of the Securities and Exchange Commission and the PCAOB.
We conducted our audits in accordance with the standards of the PCAOB. Those standards require that we plan and perform the audit to obtain reasonable assurance about whether the financial statements and financial highlights are free of material misstatement, whether due to error or fraud. The Fund is not required to have, nor were we engaged to perform, an audit of its internal control over financial reporting. As part of our audits, we are required to obtain an understanding of internal control over financial reporting but not for the purpose of expressing an opinion on the effectiveness of the Fund’s internal control over financial reporting. Accordingly, we express no such opinion.
Our audits included performing procedures to assess the risks of material misstatement of the financial statements and financial highlights, whether due to error or fraud, and performing procedures that respond to those risks. Such procedures included examining, on a test basis, evidence regarding the amounts and disclosures in the financial statements and financial highlights. Our audits also included evaluating the accounting principles used and significant estimates made by management, as well as evaluating the overall presentation of the financial statements and financial highlights. Our procedures included confirmation of securities owned as of October 31, 2023, by correspondence with the custodian and transfer agent. We believe that our audits provide a reasonable basis for our opinion.
/s/ Deloitte & Touche LLP
Boston, Massachusetts
December 22, 2023
We have served as the auditor of one or more Eaton Vance investment companies since 1959.
Eaton Vance
Short Duration Strategic Income Fund
October 31, 2023
Federal Tax Information (Unaudited)
The Form 1099-DIV you receive in February 2024 will show the tax status of all distributions paid to your account in calendar year 2023. Shareholders are advised to consult their own tax adviser with respect to the tax consequences of their investment in the Fund. As required by the Internal Revenue Code and/or regulations, shareholders must be notified regarding the status of qualified dividend income for individuals, the dividends received deduction for corporations and 163(j) interest dividends.
Qualified Dividend Income. For the fiscal year ended October 31, 2023, the Fund designates approximately $2,270,309, or up to the maximum amount of such dividends allowable pursuant to the Internal Revenue Code, as qualified dividend income eligible for the reduced tax rate of 15%.
Dividends Received Deduction. Corporate shareholders are generally entitled to take the dividends received deduction on the portion of the Fund’s dividend distribution that qualifies under tax law. For the Fund’s fiscal 2023 ordinary income dividends, 0.54% qualifies for the corporate dividends received deduction.
163(j) Interest Dividends. For the fiscal year ended October 31, 2023, the Fund designates 95.85% of distributions from net investment income as a 163(j) interest dividend.
Global Opportunities Portfolio
October 31, 2023
Consolidated Portfolio of Investments
| Asset-Backed Securities — 8.9% |
| Security | Principal
Amount
(000's omitted) | Value |
| ACHV ABS Trust, Series 2023-1PL, Class B, 6.80%, 3/18/30(1) | $ | 3,000 | $ 2,997,579 |
| Alinea CLO, Ltd., Series 2018-1A, Class E, 11.677%, (3 mo. SOFR + 6.262%), 7/20/31(1)(2) | | 2,000 | 1,747,574 |
| Allegany Park CLO, Ltd., Series 2019-1A, Class ER, 11.816%, (3 mo. SOFR + 6.40%), 1/20/35(1)(2) | | 1,000 | 914,281 |
| AMMC CLO XII, Ltd., Series 2013-12A, Class ER, 11.807%, (3 mo. SOFR + 6.442%), 11/10/30(1)(2) | | 2,000 | 1,707,568 |
| Ares LVlll CLO, Ltd., Series 2020-58A, Class ER, 12.094%, (3 mo. SOFR + 6.70%), 1/15/35(1)(2) | | 2,000 | 1,822,554 |
| Ares XXXIIR CLO, Ltd., Series 2014-32RA, Class D, 11.476%, (3 mo. SOFR + 6.111%), 5/15/30(1)(2) | | 4,000 | 3,427,324 |
| Ares XXXVR CLO, Ltd., Series 2015-35RA, Class E, 11.356%, (3 mo. SOFR + 5.962%), 7/15/30(1)(2) | | 3,000 | 2,664,078 |
| Atlas Senior Loan Fund XX, Ltd., Series 2022-20A, Class B1, 8.547%, (3 mo. SOFR + 3.15%), 10/19/35(1)(2) | | 6,000 | 6,035,088 |
| Bain Capital Credit CLO, Ltd., Series 2018-1A, Class E, 11.024%, (3 mo. SOFR + 5.612%), 4/23/31(1)(2) | | 3,500 | 2,930,063 |
| Barings CLO, Ltd., Series 2018-1A, Class D, 11.156%, (3 mo. SOFR + 5.762%), 4/15/31(1)(2) | | 5,000 | 4,247,075 |
| Battalion CLO XXII, Ltd., Series 2021-22A, Class D, 9.027%, (3 mo. SOFR + 3.612%), 1/20/35(1)(2) | | 2,000 | 1,820,794 |
| Benefit Street Partners CLO VIII, Ltd., Series 2015-8A, Class DR, 11.277%, (3 mo. SOFR + 5.862%), 1/20/31(1)(2) | | 5,000 | 4,207,330 |
| Benefit Street Partners CLO XIV, Ltd., Series 2018-14A, Class E, 11.027%, (3 mo. SOFR + 5.612%), 4/20/31(1)(2) | | 3,000 | 2,692,287 |
| Benefit Street Partners CLO XVI, Ltd.: | | | |
| Series 2018-16A, Class DR, 8.664%, (3 mo. SOFR + 3.262%), 1/17/32(1)(2) | | 2,000 | 1,964,614 |
| Series 2018-16A, Class E, 12.364%, (3 mo. SOFR + 6.962%), 1/17/32(1)(2) | | 2,000 | 1,873,842 |
| Benefit Street Partners CLO XXII, Ltd.: | | | |
| Series 2020-22A, Class DR, 8.766%, (3 mo. SOFR + 3.35%), 4/20/35(1)(2) | | 2,000 | 1,910,952 |
| Series 2020-22A, Class ER, 12.346%, (3 mo. SOFR + 6.93%), 4/20/35(1)(2) | | 2,000 | 1,860,164 |
| Benefit Street Partners CLO XXV, Ltd., Series 2021-25A, Class E, 12.506%, (3 mo. SOFR + 7.112%), 1/15/35(1)(2) | | 1,000 | 948,402 |
| Betony CLO 2, Ltd., Series 2018-1A, Class D, 11.302%, (3 mo. SOFR + 5.912%), 4/30/31(1)(2) | | 3,000 | 2,640,123 |
| BlueMountain CLO XXVI, Ltd., Series 2019-26A, Class D1R, 9.177%, (3 mo. SOFR + 3.762%), 10/20/34(1)(2) | | 3,500 | 3,316,197 |
| BlueMountain CLO XXX, Ltd., Series 2020-30A, Class ER, 12.094%, (3 mo. SOFR + 6.70%), 4/15/35(1)(2) | | 2,000 | 1,779,092 |
| Security | Principal
Amount
(000's omitted) | Value |
| BlueMountain CLO XXXIV, Ltd., Series 2022-34A, Class E, 12.966%, (3 mo. SOFR + 7.55%), 4/20/35(1)(2) | $ | 1,000 | $ 948,380 |
| BlueMountain CLO XXXV, Ltd., Series 2022-35A, Class E, 13.162%, (3 mo. SOFR + 7.75%), 7/22/35(1)(2) | | 2,000 | 1,884,938 |
| BlueMountain CLO, Ltd.: | | | |
| Series 2015-3A, Class A1R, 6.677%, (3 mo. SOFR + 1.262%), 4/20/31(1)(2) | | 3,132 | 3,116,195 |
| Series 2015-3A, Class DR, 11.077%, (3 mo. SOFR + 5.662%), 4/20/31(1)(2) | | 2,000 | 1,673,848 |
| Series 2016-3A, Class ER, 11.576%, (3 mo. SOFR + 6.212%), 11/15/30(1)(2) | | 1,000 | 816,405 |
| Canyon Capital CLO, Ltd.: | | | |
| Series 2016-1A, Class ER, 11.406%, (3 mo. SOFR + 6.012%), 7/15/31(1)(2) | | 4,000 | 3,392,436 |
| Series 2016-2A, Class ER, 11.656%, (3 mo. SOFR + 6.262%), 10/15/31(1)(2) | | 1,000 | 850,250 |
| Series 2017-1A, Class E, 11.906%, (3 mo. SOFR + 6.512%), 7/15/30(1)(2) | | 1,000 | 885,319 |
| Series 2018-1A, Class E, 11.406%, (3 mo. SOFR + 6.012%), 7/15/31(1)(2) | | 2,000 | 1,706,096 |
| Series 2022-1A, Class D, 8.603%, (3 mo. SOFR + 3.20%), 4/15/35(1)(2) | | 1,900 | 1,741,682 |
| Carlyle CLO C17, Ltd., Series C17A, Class DR, 11.652%, (3 mo. SOFR + 6.262%), 4/30/31(1)(2) | | 3,000 | 2,435,412 |
| Carlyle Global Market Strategies CLO, Ltd.: | | | |
| Series 2012-3A, Class DR2, 12.156%, (3 mo. SOFR + 6.761%), 1/14/32(1)(2) | | 1,000 | 834,347 |
| Series 2014-3RA, Class D, 11.049%, (3 mo. SOFR + 5.662%), 7/27/31(1)(2) | | 2,000 | 1,746,154 |
| Series 2019-4A, Class CR, 8.594%, (3 mo. SOFR + 3.20%), 4/15/35(1)(2) | | 1,750 | 1,649,274 |
| Series 2022-AA, Class C, 8.966%, (3 mo. SOFR + 3.55%), 4/20/35(1)(2) | | 3,000 | 2,918,370 |
| Carlyle US CLO, Ltd., Series 2019-4A, Class DR, 11.994%, (3 mo. SOFR + 6.60%), 4/15/35(1)(2) | | 2,000 | 1,772,646 |
| CarVal CLO IV, Ltd., Series 2021-1A, Class E, 12.277%, (3 mo. SOFR + 6.862%), 7/20/34(1)(2) | | 1,000 | 975,659 |
| CFMT, LLC: | | | |
| Series 2023-HB11, Class M3, 4.00%, 2/25/37(1)(3) | | 7,600 | 6,254,734 |
| Series 2023-HB11, Class M4, 4.00%, 2/25/37(1)(3) | | 2,075 | 1,563,928 |
| Series 2023-HB12, Class M4, 4.25%, 4/25/33(1)(3) | | 11,000 | 8,387,038 |
| CIFC Funding 2017-III, Ltd., Series 2017-3A, Class A1, 6.897%, (3 mo. SOFR + 1.482%), 7/20/30(1)(2) | | 923 | 922,929 |
| Crown City CLO III, Series 2021-1A, Class C, 8.977%, (3 mo. SOFR + 3.562%), 7/20/34(1)(2) | | 1,000 | 897,007 |
| Dryden CLO, Ltd.: | | | |
| Series 2018-55A, Class E, 11.056%, (3 mo. SOFR + 5.662%), 4/15/31(1)(2) | | 1,000 | 874,836 |
| Series 2022-112A, Class E, 13.145%, (3 mo. SOFR + 7.78%), 8/15/34(1)(2) | | 1,000 | 986,608 |
23
See Notes to Consolidated Financial Statements.
Global Opportunities Portfolio
October 31, 2023
Consolidated Portfolio of Investments — continued
| Security | Principal
Amount
(000's omitted) | Value |
| Dryden Senior Loan Fund, Series 2016-42A, Class ER, 11.206%, (3 mo. SOFR + 5.812%), 7/15/30(1)(2) | $ | 2,000 | $ 1,687,506 |
| Elmwood CLO 14, Ltd., Series 2022-1A, Class D, 8.566%, (3 mo. SOFR + 3.15%), 4/20/35(1)(2) | | 2,000 | 1,914,986 |
| Elmwood CLO 17, Ltd., Series 2022-4A, Class E, 12.553%, (3 mo. SOFR + 7.15%), 7/17/35(1)(2) | | 2,000 | 1,981,362 |
| Galaxy 31 CLO, Ltd., Series 2023-31A, Class D, 10.644%, (3 mo. SOFR + 5.25%), 4/15/36(1)(2) | | 2,300 | 2,307,079 |
| Galaxy XXI CLO, Ltd.: | | | |
| Series 2015-21A, Class DR, 8.327%, (3 mo. SOFR + 2.912%), 4/20/31(1)(2) | | 5,000 | 4,794,400 |
| Series 2015-21A, Class ER, 10.927%, (3 mo. SOFR + 5.511%), 4/20/31(1)(2) | | 4,000 | 3,608,632 |
| Golub Capital Partners CLO 22B, Ltd., Series 2015-22A, Class ER, 11.677%, (3 mo. SOFR + 6.262%), 1/20/31(1)(2) | | 3,000 | 2,808,669 |
| Golub Capital Partners CLO 37B, Ltd.: | | | |
| Series 2018-37A, Class D, 8.977%, (3 mo. SOFR + 3.562%), 7/20/30(1)(2) | | 1,500 | 1,391,042 |
| Series 2018-37A, Class E, 11.427%, (3 mo. SOFR + 6.012%), 7/20/30(1)(2) | | 3,000 | 2,965,881 |
| Golub Capital Partners CLO 50B-R, Ltd., Series 2020-50A, Class ER, 12.516%, (3 mo. SOFR + 7.10%), 4/20/35(1)(2) | | 2,000 | 1,843,070 |
| Golub Capital Partners CLO 53B, Ltd.: | | | |
| Series 2021-53A, Class D, 8.727%, (3 mo. SOFR + 3.312%), 7/20/34(1)(2) | | 2,000 | 1,877,476 |
| Series 2021-53A, Class E, 12.377%, (3 mo. SOFR + 6.962%), 7/20/34(1)(2) | | 1,000 | 913,382 |
| Golub Capital Partners CLO 60B, Ltd., Series 2022-60A, Class D, 9.148%, (3 mo. SOFR + 3.77%), 10/25/34(1)(2) | | 1,800 | 1,713,379 |
| Golub Capital Partners CLO, Ltd., Series 2020-48A, Class D, 9.464%, (3 mo. SOFR + 4.062%), 4/17/33(1)(2) | | 3,000 | 2,822,502 |
| Halseypoint CLO 5, Ltd., Series 2021-5A, Class D, 9.152%, (3 mo. SOFR + 3.762%), 1/30/35(1)(2) | | 3,500 | 3,239,292 |
| Harriman Park CLO, Ltd., Series 2020-1A, Class ER, 12.077%, (3 mo. SOFR + 6.662%), 4/20/34(1)(2) | | 1,000 | 929,261 |
| Highbridge Loan Management, Series 3A-2014, Class DR, 12.157%, (3 mo. SOFR + 6.762%), 7/18/29(1)(2) | | 2,750 | 2,362,492 |
| ICG US CLO, Ltd., Series 2018-2A, Class E, 11.424%, (3 mo. SOFR + 6.012%), 7/22/31(1)(2) | | 1,000 | 822,964 |
| KKR SFR Warehouse Participation, 8.825%, (30-day average SOFR + 3.50%), 12/13/23(2) | | 12,030 | 12,025,223 |
| Madison Park Funding XVII, Ltd., Series 2015-17A, Class ER, 12.174%, (3 mo. SOFR + 6.762%), 7/21/30(1)(2) | | 2,500 | 2,344,897 |
| Madison Park Funding XXXVI, Ltd.: | | | |
| Series 2019-36A, Class D1R, 8.894%, (3 mo. SOFR + 3.50%), 4/15/35(1)(2) | | 1,000 | 969,875 |
| Security | Principal
Amount
(000's omitted) | Value |
| Madison Park Funding XXXVI, Ltd.: (continued) | | | |
| Series 2019-36A, Class ER, 12.444%, (3 mo. SOFR + 7.05%), 4/15/35(1)(2) | $ | 2,000 | $ 1,971,686 |
| Marble Point CLO XXIV, Ltd., Series 2022-1A, Class D1, 9.656%, (3 mo. SOFR + 4.24%), 4/20/35(1)(2) | | 2,000 | 1,948,968 |
| Mountain View CLO, LLC, Series 2017-2A, Class AR, 6.696%, (3 mo. SOFR + 1.302%), 1/16/31(1)(2) | | 6,062 | 6,043,628 |
| Neuberger Berman CLO XXII, Ltd., Series 2016-22A, Class ER, 11.724%, (3 mo. SOFR + 6.322%), 10/17/30(1)(2) | | 2,000 | 1,819,478 |
| Neuberger Berman Loan Advisers CLO 30, Ltd., Series 2018-30A, Class ER, 11.877%, (3 mo. SOFR + 6.462%), 1/20/31(1)(2) | | 2,000 | 1,889,880 |
| Neuberger Berman Loan Advisers CLO 49, Ltd., Series 2022-49A, Class E, 12.378%, (3 mo. SOFR + 7.00%), 7/25/34(1)(2) | | 2,000 | 1,973,800 |
| NewRez Warehouse Securitization Trust: | | | |
| Series 2021-1, Class E, 8.689%, (1 mo. SOFR + 3.364%), 5/25/55(1)(2) | | 3,813 | 3,818,775 |
| Series 2021-1, Class F, 10.689%, (1 mo. SOFR + 5.364%), 5/25/55(1)(2) | | 1,950 | 1,957,155 |
| Northwoods Capital, Ltd., Series 2018-11B1, Class A1, 6.758%, (3 mo. SOFR + 1.362%), 4/19/31(1)(2) | | 9,717 | 9,647,816 |
| NRZ Excess Spread-Collateralized Notes: | | | |
| Series 2021-FNT1, Class A, 2.981%, 3/25/26(1) | | 673 | 604,594 |
| Series 2021-GNT1, Class A, 3.474%, 11/25/26(1) | | 5,097 | 4,594,188 |
| Pagaya AI Technology in Housing Trust, Series 2023-1, Class F, 3.60%, 10/25/40(1) | | 4,500 | 2,854,642 |
| Palmer Square CLO, Ltd.: | | | |
| Series 2015-1A, Class DR4, 12.141%, (3 mo. SOFR + 6.762%), 5/21/34(1)(2) | | 2,000 | 1,847,830 |
| Series 2018-1A, Class D, 10.807%, (3 mo. SOFR + 5.412%), 4/18/31(1)(2) | | 4,000 | 3,762,596 |
| Series 2021-2A, Class E, 12.006%, (3 mo. SOFR + 6.612%), 7/15/34(1)(2) | | 1,000 | 962,846 |
| Series 2022-1A, Class D, 8.466%, (3 mo. SOFR + 3.05%), 4/20/35(1)(2) | | 2,450 | 2,380,981 |
| PMT Issuer Trust - FMSR, Series 2022-FT1, Class A, 9.511%, (30-day average SOFR + 4.19%), 6/25/27(1)(2) | | 3,000 | 3,011,081 |
| Regatta IX Funding, Ltd., Series 2017-1A, Class E, 11.664%, (3 mo. SOFR + 6.262%), 4/17/30(1)(2) | | 3,000 | 2,781,915 |
| Regatta XIII Funding, Ltd., Series 2018-2A, Class D, 11.606%, (3 mo. SOFR + 6.212%), 7/15/31(1)(2) | | 3,000 | 2,440,221 |
| Retained Vantage Data Centers Issuer, LLC, Series 2023-1A, Class A2B, 5.25%, 9/15/48(1) | | 10,000 | 6,417,884 |
| Sandstone Peak, Ltd., Series 2021-1A, Class D, 9.206%, (3 mo. SOFR + 3.812%), 10/15/34(1)(2) | | 4,000 | 3,714,568 |
| Shackleton CLO, Ltd., Series 2015-7RA, Class AR, 6.806%, (3 mo. SOFR + 1.412%), 7/15/31(1)(2) | | 10,918 | 10,872,105 |
24
See Notes to Consolidated Financial Statements.
Global Opportunities Portfolio
October 31, 2023
Consolidated Portfolio of Investments — continued
| Security | Principal
Amount
(000's omitted) | Value |
| STAR Trust: | | | |
| Series 2021-SFR1, Class G, 8.65%, (1 mo. SOFR + 3.314%), 4/17/38(1)(2) | $ | 2,494 | $ 2,410,037 |
| Series 2021-SFR1, Class H, 9.90%, (1 mo. SOFR + 4.564%), 4/17/38(1)(2) | | 1,600 | 1,566,399 |
| Steele Creek CLO, Ltd., Series 2014-1RA, Class A, 6.744%, (3 mo. SOFR + 1.332%), 4/21/31(1)(2) | | 6,934 | 6,911,269 |
| Vibrant CLO IX, Ltd., Series 2018-9A, Class D, 11.927%, (3 mo. SOFR + 6.512%), 7/20/31(1)(2) | | 2,000 | 1,390,156 |
| Voya CLO, Ltd.: | | | |
| Series 2013-1A, Class DR, 12.136%, (3 mo. SOFR + 6.741%), 10/15/30(1)(2) | | 5,000 | 3,404,580 |
| Series 2014-1A, Class DR2, 11.657%, (3 mo. SOFR + 6.262%), 4/18/31(1)(2) | | 2,000 | 1,608,334 |
| Series 2015-3A, Class DR, 11.877%, (3 mo. SOFR + 6.462%), 10/20/31(1)(2) | | 2,000 | 1,601,934 |
| Series 2017-4A, Class A1, 6.786%, (3 mo. SOFR + 1.392%), 10/15/30(1)(2) | | 3,984 | 3,972,566 |
| Series 2018-2A, Class E, 10.906%, (3 mo. SOFR + 5.512%), 7/15/31(1)(2) | | 1,000 | 851,981 |
| Wellfleet CLO, Ltd.: | | | |
| Series 2016-2A, Class A1R, 6.817%, (3 mo. SOFR + 1.402%), 10/20/28(1)(2) | | 805 | 802,806 |
| Series 2019-1A, Class CR, 9.227%, (3 mo. SOFR + 3.812%), 7/20/32(1)(2) | | 2,500 | 2,326,037 |
| Series 2021-2A, Class E, 12.616%, (3 mo. SOFR + 7.222%), 7/15/34(1)(2) | | 1,000 | 828,887 |
| Series 2022-1A, Class E, 13.254%, (3 mo. SOFR + 7.86%), 4/15/34(1)(2) | | 2,000 | 1,852,368 |
| Series 2022-2A, Class E, 13.955%, (3 mo. SOFR + 8.56%), 10/18/35(1)(2) | | 2,000 | 1,980,678 |
Total Asset-Backed Securities
(identified cost $284,817,846) | | | $266,889,511 |
| Security | Shares | Value |
| iShares iBoxx High Yield Corporate Bond ETF | | 1,140,300 | $ 82,751,571 |
| Nuveen Global High Income Fund | | 83,400 | 892,380 |
| PGIM Global High Yield Fund, Inc. | | 430,326 | 4,462,481 |
| Western Asset High Income Opportunity Fund, Inc. | | 383,997 | 1,409,269 |
Total Closed-End Funds
(identified cost $90,876,613) | | | $ 89,515,701 |
| Collateralized Mortgage Obligations — 25.9% |
| Security | Principal
Amount
(000's omitted) | Value |
| Angel Oak Mortgage Trust I, LLC, Series 2019-1, Class B1, 5.40%, 11/25/48(1)(3) | $ | 3,939 | $ 3,849,075 |
| Security | Principal
Amount
(000's omitted) | Value |
| Brean Asset-Backed Securities Trust, Series 2023-RM6, Class A1, 5.25% to 1/25/28, 1/25/63(1)(4) | $ | 3,881 | $ 3,566,682 |
| Cascade MH Asset Trust, Series 2022-MH1, Class A, 4.25% to 7/25/27, 8/25/54(1)(4) | | 2,827 | 2,474,319 |
| CHNGE Mortgage Trust: | | | |
| Series 2022-4, Class A1, 6.00% to 9/25/24, 10/25/57(1)(3) | | 12,178 | 11,861,734 |
| Series 2022-NQ, Class M1, 5.82%, 6/25/67(1)(3) | | 1,764 | 1,484,880 |
| Deephaven Residential Mortgage Trust, Series 2020-2, Class B2, 5.798%, 5/25/65(1)(3) | | 4,273 | 3,969,490 |
| FARM Mortgage Trust: | | | |
| Series 2022-1, Class B, 2.945%, 1/25/52(1)(3) | | 2,662 | 1,750,905 |
| Series 2023-1, Class B, 3.032%, 3/25/52(1)(3) | | 2,676 | 1,765,981 |
| Federal Home Loan Mortgage Corp.: | | | |
| Series 2182, Class ZC, 7.50%, 9/15/29 | | 35 | 35,860 |
| Series 4273, Class SP, 0.00%, (11.695% - 30-day average SOFR x 2.667, Floor 0.00%), 11/15/43(5) | | 516 | 367,974 |
| Series 5071, Class SP, 0.00%, (3.30% - 30-day average SOFR, Floor 0.00%), 2/25/51(5) | | 4,319 | 1,479,472 |
| Series 5083, Class SK, 0.00%, (3.867% - 30-day average SOFR x 1.333, Floor 0.00%), 3/25/51(5) | | 3,411 | 1,707,365 |
| Series 5139, Class DZ, 2.50%, 9/25/51 | | 2,051 | 1,006,170 |
| Series 5144, Class Z, 2.50%, 9/25/51 | | 7,571 | 3,899,700 |
| Series 5150, Class QZ, 2.50%, 10/25/51 | | 2,642 | 1,353,693 |
| Series 5150, Class ZJ, 2.50%, 10/25/51 | | 4,255 | 2,185,804 |
| Series 5152, Class ZP, 3.00%, 7/25/50 | | 10,158 | 5,141,955 |
| Series 5159, Class ZP, 3.00%, 11/25/51 | | 860 | 461,095 |
| Series 5159, Class ZT, 3.00%, 11/25/51 | | 1,527 | 870,667 |
| Series 5163, Class Z, 3.00%, 11/25/51 | | 1,079 | 546,125 |
| Series 5166, Class ZN, 3.00%, 9/25/50 | | 1,961 | 1,025,100 |
| Series 5168, Class MZ, 3.00%, 10/25/51 | | 2,053 | 1,146,331 |
| Series 5300, Class EY, 6.00%, 12/25/52 | | 10,900 | 10,418,921 |
| Series 5324, Class MZ, 6.00%, 7/25/53 | | 3,392 | 3,013,945 |
| Series 5327, Class B, 6.00%, 8/25/53 | | 20,000 | 19,083,588 |
| Interest Only:(6) | | | |
| Series 380, Class C1, 3.00%, 1/25/50 | | 30,626 | 5,345,097 |
| Series 380, Class C5, 3.50%, 1/25/50 | | 9,538 | 1,807,382 |
| Series 2631, Class DS, 1.665%, (6.986% - 30-day average SOFR), 6/15/33(5) | | 413 | 8,423 |
| Series 2956, Class SL, 1.565%, (6.886% - 30-day average SOFR), 6/15/32(5) | | 457 | 28,501 |
| Series 3114, Class TS, 1.215%, (6.536% - 30-day average SOFR), 9/15/30(5) | | 1,046 | 32,120 |
| Series 3153, Class JI, 1.185%, (6.506% - 30-day average SOFR), 5/15/36(5) | | 1,164 | 65,840 |
| Series 4007, Class JI, 4.00%, 2/15/42 | | 540 | 81,891 |
| Series 4067, Class JI, 3.50%, 6/15/27 | | 1,342 | 52,142 |
| Series 4070, Class S, 0.665%, (5.986% - 30-day average SOFR), 6/15/32(5) | | 4,556 | 220,214 |
25
See Notes to Consolidated Financial Statements.
Global Opportunities Portfolio
October 31, 2023
Consolidated Portfolio of Investments — continued
| Security | Principal
Amount
(000's omitted) | Value |
| Interest Only: (continued) | | | |
| Series 4095, Class HS, 0.665%, (5.986% - 30-day average SOFR), 7/15/32(5) | $ | 889 | $ 26,737 |
| Series 4109, Class ES, 0.715%, (6.036% - 30-day average SOFR), 12/15/41(5) | | 81 | 6,347 |
| Series 4109, Class SA, 0.765%, (6.086% - 30-day average SOFR), 9/15/32(5) | | 2,058 | 92,696 |
| Series 4149, Class S, 0.815%, (6.136% - 30-day average SOFR), 1/15/33(5) | | 1,443 | 75,032 |
| Series 4163, Class GS, 0.765%, (6.086% - 30-day average SOFR), 11/15/32(5) | | 1,285 | 59,748 |
| Series 4169, Class AS, 0.815%, (6.136% - 30-day average SOFR), 2/15/33(5) | | 1,897 | 83,295 |
| Series 4188, Class AI, 3.50%, 4/15/28 | | 1,155 | 39,607 |
| Series 4189, Class SQ, 0.715%, (6.036% - 30-day average SOFR), 12/15/42(5) | | 486 | 38,571 |
| Series 4203, Class QS, 0.815%, (6.136% - 30-day average SOFR), 5/15/43(5) | | 1,300 | 64,325 |
| Series 4332, Class IK, 4.00%, 4/15/44 | | 456 | 73,987 |
| Series 4343, Class PI, 4.00%, 5/15/44 | | 1,423 | 242,988 |
| Series 4370, Class IO, 3.50%, 9/15/41 | | 215 | 5,807 |
| Series 4381, Class SK, 0.715%, (6.036% - 30-day average SOFR), 6/15/44(5) | | 1,303 | 93,352 |
| Series 4388, Class MS, 0.665%, (5.986% - 30-day average SOFR), 9/15/44(5) | | 1,277 | 107,960 |
| Series 4408, Class IP, 3.50%, 4/15/44 | | 1,928 | 261,094 |
| Series 4497, Class CS, 0.765%, (6.086% - 30-day average SOFR), 9/15/44(5) | | 1,053 | 14,462 |
| Series 4507, Class MI, 3.50%, 8/15/44 | | 676 | 31,693 |
| Series 4507, Class SJ, 0.745%, (6.066% - 30-day average SOFR), 9/15/45(5) | | 3,623 | 305,979 |
| Series 4520, Class PI, 4.00%, 8/15/45 | | 8,687 | 1,203,581 |
| Series 4528, Class BS, 0.715%, (6.036% - 30-day average SOFR), 7/15/45(5) | | 1,714 | 132,332 |
| Series 4629, Class QI, 3.50%, 11/15/46 | | 1,776 | 363,777 |
| Series 4637, Class IP, 3.50%, 4/15/44 | | 230 | 8,649 |
| Series 4644, Class TI, 3.50%, 1/15/45 | | 1,606 | 241,670 |
| Series 4744, Class IO, 4.00%, 11/15/47 | | 1,629 | 324,501 |
| Series 4749, Class IL, 4.00%, 12/15/47 | | 1,293 | 258,565 |
| Series 4768, Class IO, 4.00%, 3/15/48 | | 1,583 | 317,267 |
| Series 5051, Class S, 0.00%, (3.60% - 30-day average SOFR, Floor 0.00%), 12/25/50(5) | | 17,968 | 427,642 |
| Series 5070, Class CI, 2.00%, 2/25/51 | | 38,571 | 4,884,281 |
| Series 5156, Class IP, 3.00%, 12/25/49 | | 19,966 | 3,147,599 |
| Series 5236, Class TI, 3.00%, 1/25/51 | | 72,448 | 12,216,169 |
| Principal Only:(7) | | | |
| Series 4417, Class KO, 0.00%, 12/15/43 | | 539 | 326,199 |
| Series 4478, Class PO, 0.00%, 5/15/45 | | 836 | 568,190 |
| Federal Home Loan Mortgage Corp. Structured Agency Credit Risk Debt Notes: | | | |
| Series 2019-HQA3, Class B2, 12.935%, (30-day average SOFR + 7.614%), 9/25/49(1)(2) | | 1,250 | 1,362,430 |
| Security | Principal
Amount
(000's omitted) | Value |
| Federal Home Loan Mortgage Corp. Structured Agency Credit Risk Debt Notes: (continued) | | | |
| Series 2020-DNA6, Class B2, 10.971%, (30-day average SOFR + 5.65%), 12/25/50(1)(2) | $ | 6,900 | $ 7,185,447 |
| Series 2021-DNA3, Class B2, 11.571%, (30-day average SOFR + 6.25%), 10/25/33(1)(2) | | 3,000 | 3,172,278 |
| Series 2021-DNA5, Class B2, 10.821%, (30-day average SOFR + 5.50%), 1/25/34(1)(2) | | 3,500 | 3,411,827 |
| Series 2021-DNA6, Class B2, 12.821%, (30-day average SOFR + 7.50%), 10/25/41(1)(2) | | 13,640 | 13,961,382 |
| Federal National Mortgage Association: | | | |
| Series G94-7, Class PJ, 7.50%, 5/17/24 | | 2 | 2,375 |
| Series 1994-42, Class K, 6.50%, 4/25/24 | | 4 | 3,902 |
| Series 2009-62, Class WA, 5.582%, 8/25/39(3) | | 601 | 596,245 |
| Series 2013-6, Class TA, 1.50%, 1/25/43 | | 516 | 431,736 |
| Series 2021-56, Class GZ, 3.00%, 7/25/51 | | 1,354 | 718,014 |
| Series 2021-56, Class LZ, 2.50%, 9/25/51 | | 5,502 | 2,956,398 |
| Series 2021-61, Class LZ, 2.50%, 9/25/51 | | 3,822 | 1,973,438 |
| Series 2021-61, Class Z, 2.50%, 9/25/51 | | 8,118 | 4,205,728 |
| Series 2021-77, Class WZ, 3.00%, 8/25/50 | | 419 | 204,822 |
| Series 2023-12, Class LW, 6.00%, 4/25/53 | | 11,482 | 10,976,243 |
| Series 2023-14, Class EL, 6.00%, 4/25/53 | | 63,163 | 59,814,044 |
| Interest Only:(6) | | | |
| Series 2004-46, Class SI, 0.565%, (5.886% - 30-day average SOFR), 5/25/34(5) | | 980 | 26,470 |
| Series 2005-17, Class SA, 1.265%, (6.586% - 30-day average SOFR), 3/25/35(5) | | 933 | 66,491 |
| Series 2005-71, Class SA, 1.315%, (6.636% - 30-day average SOFR), 8/25/25(5) | | 31 | 155 |
| Series 2005-105, Class S, 1.265%, (6.586% - 30-day average SOFR), 12/25/35(5) | | 781 | 58,590 |
| Series 2006-44, Class IS, 1.165%, (6.486% - 30-day average SOFR), 6/25/36(5) | | 687 | 45,886 |
| Series 2006-65, Class PS, 1.785%, (7.106% - 30-day average SOFR), 7/25/36(5) | | 677 | 66,316 |
| Series 2006-96, Class SN, 1.765%, (7.086% - 30-day average SOFR), 10/25/36(5) | | 733 | 44,925 |
| Series 2006-104, Class SD, 1.205%, (6.526% - 30-day average SOFR), 11/25/36(5) | | 725 | 50,463 |
| Series 2006-104, Class SE, 1.195%, (6.516% - 30-day average SOFR), 11/25/36(5) | | 484 | 33,415 |
| Series 2007-50, Class LS, 1.015%, (6.336% - 30-day average SOFR), 6/25/37(5) | | 1,041 | 70,503 |
| Series 2008-26, Class SA, 0.765%, (6.086% - 30-day average SOFR), 4/25/38(5) | | 1,125 | 83,208 |
| Series 2008-61, Class S, 0.665%, (5.986% - 30-day average SOFR), 7/25/38(5) | | 2,044 | 100,899 |
| Series 2011-101, Class IC, 3.50%, 10/25/26 | | 585 | 16,362 |
| Series 2011-101, Class IE, 3.50%, 10/25/26 | | 436 | 12,060 |
| Series 2011-104, Class IM, 3.50%, 10/25/26 | | 780 | 22,883 |
| Series 2012-52, Class DI, 3.50%, 5/25/27 | | 1,697 | 66,457 |
| Series 2012-124, Class IO, 1.365%, 11/25/42(3) | | 2,552 | 115,994 |
26
See Notes to Consolidated Financial Statements.
Global Opportunities Portfolio
October 31, 2023
Consolidated Portfolio of Investments — continued
| Security | Principal
Amount
(000's omitted) | Value |
| Interest Only: (continued) | | | |
| Series 2012-139, Class LS, 0.719%, (6.036% - 30-day average SOFR), 12/25/42(5) | $ | 2,513 | $ 267,222 |
| Series 2012-147, Class SA, 0.665%, (5.986% - 30-day average SOFR), 1/25/43(5) | | 2,891 | 216,433 |
| Series 2012-150, Class PS, 0.715%, (6.036% - 30-day average SOFR), 1/25/43(5) | | 3,645 | 272,043 |
| Series 2012-150, Class SK, 0.715%, (6.036% - 30-day average SOFR), 1/25/43(5) | | 4,276 | 334,674 |
| Series 2013-11, Class IO, 4.00%, 1/25/43 | | 9,012 | 1,090,039 |
| Series 2013-12, Class SP, 0.215%, (5.536% - 30-day average SOFR), 11/25/41(5) | | 440 | 4,723 |
| Series 2013-15, Class DS, 0.765%, (6.086% - 30-day average SOFR), 3/25/33(5) | | 3,401 | 144,754 |
| Series 2013-23, Class CS, 0.815%, (6.136% - 30-day average SOFR), 3/25/33(5) | | 1,791 | 77,819 |
| Series 2013-64, Class PS, 0.815%, (6.136% - 30-day average SOFR), 4/25/43(5) | | 1,890 | 98,169 |
| Series 2013-66, Class JI, 3.00%, 7/25/43 | | 3,054 | 478,756 |
| Series 2013-75, Class SC, 0.815%, (6.136% - 30-day average SOFR), 7/25/42(5) | | 2,509 | 43,957 |
| Series 2014-32, Class EI, 4.00%, 6/25/44 | | 718 | 127,374 |
| Series 2014-41, Class SA, 0.615%, (5.936% - 30-day average SOFR), 7/25/44(5) | | 1,220 | 133,781 |
| Series 2014-43, Class PS, 0.665%, (5.986% - 30-day average SOFR), 3/25/42(5) | | 1,089 | 54,451 |
| Series 2014-55, Class IN, 3.50%, 7/25/44 | | 1,826 | 371,443 |
| Series 2014-64, Class BI, 3.50%, 3/25/44 | | 248 | 8,336 |
| Series 2014-67, Class IH, 4.00%, 10/25/44 | | 1,235 | 282,524 |
| Series 2014-80, Class CI, 3.50%, 12/25/44 | | 1,253 | 268,761 |
| Series 2014-89, Class IO, 3.50%, 1/25/45 | | 1,896 | 405,169 |
| Series 2015-6, Class IM, 0.00%, (5.181% - 30-day average SOFR x 1.33, Floor 0.00%), 6/25/43(5) | | 1,960 | 6,040 |
| Series 2015-14, Class KI, 3.00%, 3/25/45 | | 2,234 | 367,352 |
| Series 2015-22, Class GI, 3.50%, 4/25/45 | | 672 | 123,499 |
| Series 2015-31, Class SG, 0.665%, (5.986% - 30-day average SOFR), 5/25/45(5) | | 2,500 | 334,588 |
| Series 2015-36, Class IL, 3.00%, 6/25/45 | | 1,509 | 215,614 |
| Series 2015-52, Class MI, 3.50%, 7/25/45 | | 3,165 | 634,676 |
| Series 2015-93, Class BS, 0.715%, (6.036% - 30-day average SOFR), 8/25/45(5) | | 1,365 | 54,670 |
| Series 2018-21, Class IO, 3.00%, 4/25/48 | | 4,061 | 721,911 |
| Series 2021-94, Class CI, 3.00%, 1/25/52 | | 11,588 | 1,894,268 |
| Federal National Mortgage Association Connecticut Avenue Securities: | | | |
| Series 2019-R04, Class 2B1, 10.685%, (30-day average SOFR + 5.364%), 6/25/39(1)(2) | | 15,996 | 17,093,140 |
| Series 2019-R06, Class 2B1, 9.185%, (30-day average SOFR + 3.864%), 9/25/39(1)(2) | | 923 | 947,147 |
| Series 2021-R01, Class 1B2, 11.321%, (30-day average SOFR + 6.00%), 10/25/41(1)(2) | | 8,500 | 8,509,315 |
| FIGRE Trust, Series 2023-HE2, Class A, 6.512%, 5/25/53(1)(3) | | 5,410 | 5,354,022 |
| Security | Principal
Amount
(000's omitted) | Value |
| Finance of America HECM Buyout, Series 2022-HB2, Class M5, 6.00%, 8/1/32(1)(3) | $ | 1,000 | $ 579,677 |
| Flagstar Mortgage Trust: | | | |
| Series 2023-10IN, Class B4, 3.512%, 10/25/51(1)(3) | | 6,900 | 4,393,123 |
| Series 2023-6INV, Class B4, 3.488%, 8/25/51(1)(3) | | 4,201 | 2,735,433 |
| FREED Mortgage, Series 2022-HE1, Class A, 7.00%, 10/25/37(1)(3) | | 2,939 | 2,907,900 |
| Government National Mortgage Association: | | | |
| Series 2021-136, Class Z, 2.50%, 8/20/51 | | 8,804 | 4,442,821 |
| Series 2021-139, Class ZJ, 2.50%, 8/20/51 | | 1,705 | 983,974 |
| Series 2021-154, Class ZC, 2.50%, 9/20/51 | | 1,773 | 902,508 |
| Series 2021-154, Class ZL, 3.00%, 9/20/51 | | 2,857 | 1,373,081 |
| Series 2021-165, Class MZ, 2.50%, 9/20/51 | | 14,690 | 7,455,877 |
| Series 2022-31, Class ZD, 3.00%, 2/20/52 | | 282 | 91,324 |
| Series 2022-173, Class S, 3.222%, (22.733% - 30-day average SOFR x 3.667), 10/20/52(5) | | 7,688 | 6,829,056 |
| Series 2022-189, Class US, 3.222%, (22.733% - 30-day average SOFR x 3.667), 11/20/52(5) | | 11,195 | 10,143,927 |
| Series 2022-195, Class AS, 3.436%, (23.125% - 30-day average SOFR x 3.70), 11/20/52(5) | | 4,810 | 4,694,756 |
| Series 2022-197, Class SW, 3.549%, (16.32% - 30-day average SOFR x 2.40), 11/20/52(5) | | 8,946 | 8,124,600 |
| Series 2023-53, Class AL, 5.50%, 4/20/53 | | 20,000 | 18,178,388 |
| Series 2023-53, Class SE, 3.039%, (22.55% - 30-day average SOFR x 3.667), 4/20/53(5) | | 19,744 | 18,283,446 |
| Series 2023-56, Class ZE, 6.00%, 4/20/53 | | 16,301 | 14,543,844 |
| Series 2023-63, Class LB, 6.00%, 5/20/53 | | 12,347 | 11,707,892 |
| Series 2023-63, Class S, 3.039%, (22.55% - 30-day average SOFR x 3.667), 5/20/53(5) | | 37,944 | 33,881,883 |
| Series 2023-64, Class LB, 6.00%, 5/20/53 | | 5,036 | 4,777,389 |
| Series 2023-65, Class SB, 3.039%, (22.55% - 30-day average SOFR x 3.667), 5/20/53(5) | | 7,637 | 6,977,660 |
| Series 2023-65, Class SD, 3.039%, (22.55% - 30-day average SOFR x 3.667), 5/20/53(5) | | 15,202 | 14,252,168 |
| Series 2023-66, Class S, 3.039%, (22.55% - 30-day average SOFR x 3.667), 5/20/53(5) | | 6,985 | 6,450,973 |
| Series 2023-66, Class SD, 3.039%, (22.55% - 30-day average SOFR x 3.667), 5/20/53(5) | | 6,235 | 5,568,486 |
| Series 2023-83, Class S, 2.754%, (22.868% - 30-day average SOFR x 3.78), 6/20/53(5) | | 7,883 | 6,889,470 |
| Series 2023-84, Class MW, 6.00%, 6/20/53 | | 5,478 | 5,193,740 |
| Series 2023-84, Class SN, 2.858%, (22.387% - 30-day average SOFR x 3.67), 6/20/53(5) | | 8,302 | 7,339,029 |
| Series 2023-89, Class SD, 2.672%, (22.183% - 30-day average SOFR x 3.667), 6/20/53(5) | | 9,215 | 8,043,148 |
| Series 2023-96, Class BL, 6.00%, 7/20/53 | | 10,000 | 9,510,764 |
| Series 2023-96, Class DB, 6.00%, 7/20/53 | | 8,000 | 7,593,382 |
| Series 2023-97, Class CB, 6.00%, 7/20/53 | | 20,000 | 19,339,203 |
| Series 2023-99, Class AL, 6.00%, 7/20/53 | | 3,000 | 2,848,010 |
| Series 2023-100, Class AY, 6.00%, 7/20/53 | | 13,236 | 12,573,412 |
| Series 2023-100, Class JL, 6.00%, 7/20/53 | | 11,099 | 10,561,389 |
27
See Notes to Consolidated Financial Statements.
Global Opportunities Portfolio
October 31, 2023
Consolidated Portfolio of Investments — continued
| Security | Principal
Amount
(000's omitted) | Value |
| Government National Mortgage Association: (continued) | | | |
| Series 2023-116, Class CY, 6.00%, 8/20/53 | $ | 2,618 | $ 2,488,146 |
| Series 2023-133, Class S, 5.636%, (21.60% - 30-day average SOFR x 3.00), 9/20/53(5) | | 14,939 | 14,383,861 |
| Series 2023-149, Class S, 5.505%, (21.45% - 30-day average SOFR x 3.00), 10/20/53(5) | | 9,250 | 8,966,275 |
| Series 2023-150, Class AS, 7.065%, (27.528% - 30-day average SOFR x 3.85), 10/20/53(5) | | 5,275 | 5,348,238 |
| Series 2023-153, Class SM, 6.731%, (28.00% - 30-day average SOFR x 4.00), 10/20/53(5) | | 15,929 | 16,083,832 |
| Interest Only:(6) | | | |
| Series 2014-68, Class KI, 0.00%, 10/20/42(3) | | 2,478 | 79,411 |
| Series 2017-104, Class SD, 0.746%, (6.086% - 1 mo. SOFR), 7/20/47(5) | | 4,338 | 349,787 |
| Series 2017-121, Class DS, 0.00%, (4.386% - 1 mo. SOFR, Floor 0.00%), 8/20/47(5) | | 2,873 | 81,272 |
| Series 2017-137, Class AS, 0.00%, (4.386% - 1 mo. SOFR, Floor 0.00%), 9/20/47(5) | | 3,961 | 109,383 |
| Series 2020-116, Class MI, 2.00%, 8/20/50 | | 16,923 | 2,204,548 |
| Series 2020-134, Class LI, 2.50%, 9/20/50 | | 7,452 | 1,014,663 |
| Series 2020-146, Class IQ, 2.00%, 10/20/50 | | 17,331 | 1,924,893 |
| Series 2020-146, Class QI, 2.00%, 10/20/50 | | 9,222 | 1,008,773 |
| Series 2020-149, Class NI, 2.50%, 10/20/50 | | 13,601 | 1,846,698 |
| Series 2020-151, Class AI, 2.00%, 10/20/50 | | 51,053 | 6,278,383 |
| Series 2020-151, Class HI, 2.50%, 10/20/50 | | 1,189 | 160,799 |
| Series 2020-154, Class PI, 2.50%, 10/20/50 | | 12,063 | 1,631,231 |
| Series 2020-167, Class KI, 2.00%, 11/20/50 | | 28,273 | 3,142,258 |
| Series 2020-173, Class DI, 2.00%, 11/20/50 | | 21,247 | 2,568,748 |
| Series 2020-176, Class HI, 2.50%, 11/20/50 | | 29,466 | 4,002,589 |
| Series 2020-185, Class BI, 2.00%, 12/20/50 | | 7,299 | 843,379 |
| Series 2020-191, Class AI, 2.00%, 12/20/50 | | 27,235 | 3,146,101 |
| Series 2021-15, Class AI, 2.00%, 1/20/51 | | 31,477 | 3,804,298 |
| Series 2021-23, Class TI, 2.50%, 2/20/51 | | 11,403 | 1,485,033 |
| Series 2021-30, Class AI, 2.00%, 2/20/51 | | 3,841 | 459,946 |
| Series 2021-46, Class IM, 2.50%, 3/20/51 | | 2,562 | 341,184 |
| Series 2021-56, Class SE, 0.00%, (2.30% - 30-day average SOFR, Floor 0.00%), 10/20/50(5) | | 5,327 | 52,072 |
| Series 2021-77, Class SB, 0.00%, (3.636% - 1 mo. SOFR, Floor 0.00%), 5/20/51(5) | | 12,304 | 258,783 |
| Series 2021-97, Class IG, 2.50%, 8/20/49 | | 37,419 | 4,101,449 |
| Series 2021-114, Class MI, 3.00%, 6/20/51 | | 9,335 | 1,449,110 |
| Series 2021-121, Class TI, 3.00%, 7/20/51 | | 34,013 | 4,232,283 |
| Series 2021-122, Class NI, 3.00%, 7/20/51 | | 6,228 | 950,728 |
| Series 2021-125, Class SA, 0.00%, (3.636% - 1 mo. SOFR, Floor 0.00%), 7/20/51(5) | | 16,185 | 340,156 |
| Series 2021-154, Class MI, 3.00%, 9/20/51 | | 46,553 | 6,294,489 |
| Series 2021-160, Class IT, 2.50%, 9/20/51 | | 17,288 | 1,893,967 |
| Series 2021-175, Class AS, 0.00%, (1.686% - 1 mo. SOFR, Floor 0.00%), 10/20/51(5) | | 26,124 | 157,977 |
| Security | Principal
Amount
(000's omitted) | Value |
| Interest Only: (continued) | | | |
| Series 2021-175, Class SB, 0.00%, (1.686% - 1 mo. SOFR, Floor 0.00%), 10/20/51(5) | $ | 13,134 | $ 79,572 |
| Series 2021-193, Class IU, 3.00%, 11/20/49 | | 41,987 | 5,716,381 |
| Series 2021-193, Class YS, 0.00%, (2.45% - 30-day average SOFR, Floor 0.00%), 11/20/51(5) | | 25,290 | 220,462 |
| Series 2021-201, Class PI, 3.00%, 11/20/51 | | 26,341 | 3,066,775 |
| Series 2021-209, Class IW, 3.00%, 11/20/51 | | 18,657 | 2,449,708 |
| Series 2022-104, Class IO, 2.50%, 6/20/51 | | 25,229 | 3,282,694 |
| Series 2022-119, Class CS, 0.00%, (3.00% - 30-day average SOFR, Floor 0.00%), 7/20/52(5) | | 208,493 | 1,577,169 |
| Series 2022-119, Class SC, 0.00%, (3.00% - 30-day average SOFR, Floor 0.00%), 7/20/52(5) | | 23,166 | 175,241 |
| Series 2022-119, Class TA, 0.00%, (3.90% - 30-day average SOFR, Floor 0.00%), 7/20/52(5) | | 46,332 | 269,364 |
| Series 2022-119, Class TI, 0.00%, (3.85% - 30-day average SOFR, Floor 0.00%), 7/20/52(5) | | 463,319 | 2,540,330 |
| Series 2022-126, Class AS, 0.00%, (3.69% - 30-day average SOFR, Floor 0.00%), 7/20/52(5) | | 62,173 | 827,905 |
| Series 2022-126, Class SC, 0.00%, (3.73% - 30-day average SOFR, Floor 0.00%), 7/20/52(5) | | 46,332 | 632,657 |
| Series 2022-135, Class SA, 0.00%, (3.00% - 30-day average SOFR, Floor 0.00%), 6/20/52(5) | | 129,394 | 1,082,500 |
| Series 2023-13, Class SA, 0.079%, (5.40% - 30-day average SOFR), 1/20/53(5) | | 16,512 | 302,339 |
| Series 2023-19, Class SD, 0.979%, (6.30% - 30-day average SOFR), 2/20/53(5) | | 20,536 | 1,081,315 |
| Series 2023-20, Class HS, 0.979%, (6.30% - 30-day average SOFR), 2/20/53(5) | | 14,443 | 774,536 |
| Series 2023-22, Class ES, 0.979%, (6.30% - 30-day average SOFR), 2/20/53(5) | | 19,258 | 1,032,714 |
| Series 2023-22, Class SA, 0.379%, (5.70% - 30-day average SOFR), 2/20/53(5) | | 32,170 | 877,709 |
| Series 2023-24, Class SB, 0.00%, (5.15% - 30-day average SOFR, Floor 0.00%), 2/20/53(5) | | 38,516 | 946,458 |
| Series 2023-24, Class SG, 0.979%, (6.30% - 30-day average SOFR), 2/20/53(5) | | 19,258 | 1,032,714 |
| Series 2023-32, Class SA, 0.979%, (6.30% - 30-day average SOFR), 2/20/53(5) | | 64,996 | 3,485,411 |
| Series 2023-38, Class LS, 0.979%, (6.30% - 30-day average SOFR), 3/20/53(5) | | 62,197 | 3,327,489 |
| Series 2023-38, Class SD, 0.929%, (6.25% - 30-day average SOFR), 3/20/53(5) | | 96,111 | 4,171,772 |
| Series 2023-38, Class SG, 0.879%, (6.20% - 30-day average SOFR), 3/20/53(5) | | 48,284 | 2,453,014 |
| Series 2023-47, Class HS, 0.979%, (6.30% - 30-day average SOFR), 3/20/53(5) | | 20,732 | 1,109,163 |
| Series 2023-47, Class SC, 0.929%, (6.25% - 30-day average SOFR), 3/20/53(5) | | 31,028 | 1,617,562 |
| Series 2023-53, Class SK, 0.879%, (6.20% - 30-day average SOFR), 4/20/53(5) | | 39,139 | 2,033,614 |
| GS Mortgage-Backed Securities Trust, Series 2022-PJ6, Class B4, 3.186%, 1/25/53(1)(3) | | 1,946 | 934,735 |
28
See Notes to Consolidated Financial Statements.
Global Opportunities Portfolio
October 31, 2023
Consolidated Portfolio of Investments — continued
| Security | Principal
Amount
(000's omitted) | Value |
| LHOME Mortgage Trust: | | | |
| Series 2023-RTL2, Class A1, 8.00% to 1/25/26, 6/25/28(1)(4) | $ | 2,775 | $ 2,779,656 |
| Series 2023-RTL3, Class A1, 8.00% to 3/25/26, 8/25/28(1)(4) | | 6,200 | 6,209,491 |
| MFRA Trust, Series 2023-NQM1, Class A2, 5.75% to 1/25/26, 11/25/67(1)(4) | | 913 | 871,775 |
| PNMAC GMSR Issuer Trust: | | | |
| Series 2018-GT1, Class A, 9.289%, (1 mo. SOFR + 3.85%), 2/25/25(1)(2) | | 5,000 | 5,000,211 |
| Series 2018-GT2, Class A, 8.089%, (1 mo. USD LIBOR + 2.65%), 8/25/25(1)(2) | | 4,272 | 4,271,513 |
| Series 2022-GT1, Class A, 9.571%, (30-day average SOFR + 4.25%), 5/25/27(1)(2) | | 6,000 | 6,012,440 |
| Radnor Re, Ltd., Series 2022-1, Class M1A, 9.071%, (30-day average SOFR + 3.75%), 9/25/32(1)(2) | | 7,000 | 7,127,256 |
| Unison Trust, Series 2021-1, Class A, 4.50%, 4/25/50(1)(3) | | 53,952 | 42,100,117 |
Total Collateralized Mortgage Obligations
(identified cost $917,019,547) | | | $776,076,837 |
| Commercial Mortgage-Backed Securities — 0.7% |
| Security | Principal
Amount
(000's omitted) | Value |
| CSMC Trust: | | | |
| Series 2020-TMIC, Class A, 8.95%, (1 mo. SOFR + 3.614%), 12/15/35(1)(2) | $ | 3,000 | $ 2,996,936 |
| Series 2022-NWPT, Class A, 8.478%, (1 mo. SOFR + 3.143%), 9/9/24(1)(2) | | 4,200 | 4,215,752 |
| JPMBB Commercial Mortgage Securities Trust: | | | |
| Series 2014-C22, Class D, 4.559%, 9/15/47(1)(3) | | 3,430 | 2,246,375 |
| Series 2014-C25, Class D, 3.933%, 11/15/47(1)(3) | | 8,045 | 3,415,213 |
| Med Trust, Series 2021-MDLN, Class E, 8.599%, (1 mo. SOFR + 3.264%), 11/15/38(1)(2) | | 5,265 | 5,018,455 |
| WF-RBS Commercial Mortgage Trust, Series 2014-C24, Class D, 3.692%, 11/15/47(1) | | 4,000 | 2,474,204 |
Total Commercial Mortgage-Backed Securities
(identified cost $26,145,833) | | | $ 20,366,935 |
| Security | Shares | Value |
| Bermuda — 0.0%(8) |
| Liberty Latin America, Ltd., Class A(9) | | 105,100 | $ 717,833 |
| | | | $ 717,833 |
| Security | Shares | Value |
| Bulgaria — 0.2% |
| Eurohold Bulgaria AD(9) | | 5,140,100 | $ 4,726,851 |
| | | | $ 4,726,851 |
| Canada — 0.0%(8) |
| Canacol Energy, Ltd. | | 147,000 | $ 727,182 |
| | | | $ 727,182 |
| Iceland — 0.0%(8) |
| Siminn HF | | 2,023,336 | $ 127,776 |
| | | | $ 127,776 |
Total Common Stocks
(identified cost $6,384,866) | | | $ 6,299,642 |
| Security | Principal
Amount
(000's omitted) | Value |
| Bermuda — 0.1% |
| Jazz Investments I, Ltd., 2.00%, 6/15/26 | USD | 920 | $ 933,800 |
| NCL Corp., Ltd., 1.125%, 2/15/27 | USD | 870 | 678,456 |
| | | | $ 1,612,256 |
| Canada — 0.0%(8) |
| Shopify, Inc., 0.125%, 11/1/25 | USD | 300 | $ 265,650 |
| | | | $ 265,650 |
| Cayman Islands — 0.1% |
| Herbalife, Ltd., 2.625%, 3/15/24 | USD | 870 | $ 849,990 |
| Li Auto, Inc., 0.25%, 5/1/28 | USD | 430 | 583,725 |
| Poseidon Finance 1, Ltd., 0.00%, 2/1/25(10) | USD | 660 | 638,547 |
| Sea, Ltd., 2.375%, 12/1/25 | USD | 940 | 893,940 |
| ZTO Express Cayman, Inc., 1.50%, 9/1/27 | USD | 710 | 684,853 |
| | | | $ 3,651,055 |
| China — 0.1% |
| Meituan, 0.00%, 4/27/27(10) | USD | 3,700 | $ 3,313,349 |
| | | | $ 3,313,349 |
| France — 0.0%(8) |
| Veolia Environnement S.A., 0.00%, 1/1/25(10) | EUR | 1,150 | $ 366,938 |
| | | | $ 366,938 |
29
See Notes to Consolidated Financial Statements.
Global Opportunities Portfolio
October 31, 2023
Consolidated Portfolio of Investments — continued
| Security | Principal
Amount
(000's omitted) | Value |
| Germany — 0.0%(8) |
| Deutsche Post AG, 0.05%, 6/30/25(10) | EUR | 500 | $ 497,296 |
| | | | $ 497,296 |
| India — 0.1% |
| Indiabulls Housing Finance, Ltd., 4.50%, 9/28/26(10) | USD | 1,325 | $ 1,180,933 |
| | | | $ 1,180,933 |
| Israel — 0.0%(8) |
| Nice, Ltd., 0.00%, 9/15/25 | USD | 415 | $ 369,350 |
| | | | $ 369,350 |
| Luxembourg — 0.0%(8) |
| Citigroup Global Markets Funding Luxembourg SCA, 0.00%, 7/25/24(10) | HKD | 6,000 | $ 731,862 |
| | | | $ 731,862 |
| Netherlands — 0.0%(8) |
| STMicroelectronics N.V., 0.00%, 8/4/25(10) | USD | 200 | $ 209,196 |
| | | | $ 209,196 |
| South Africa — 0.0%(8) |
| HTA Group, Ltd., 2.875%, 3/18/27(10) | USD | 600 | $ 487,322 |
| | | | $ 487,322 |
| Spain — 0.0%(8) |
| Cellnex Telecom S.A., 0.50%, 7/5/28(10) | EUR | 300 | $ 304,593 |
| | | | $ 304,593 |
| United Arab Emirates — 0.0%(8) |
| Abu Dhabi National Oil Co., 0.70%, 6/4/24(10) | USD | 200 | $ 193,639 |
| | | | $ 193,639 |
| United States — 1.5% |
| Airbnb, Inc., 0.00%, 3/15/26 | USD | 1,070 | $ 927,690 |
| Akamai Technologies, Inc., 1.125%, 2/15/29(1) | USD | 1,200 | 1,185,000 |
| Alnylam Pharmaceuticals, Inc., 1.00%, 9/15/27 | USD | 590 | 513,027 |
| Amphastar Pharmaceuticals, Inc., 2.00%, 3/15/29(1) | USD | 275 | 269,088 |
| Ares Capital Corp., 4.625%, 3/1/24 | USD | 550 | 552,750 |
| Axon Enterprise, Inc., 0.50%, 12/15/27(1) | USD | 670 | 722,595 |
| Bentley Systems, Inc., 0.125%, 1/15/26 | USD | 870 | 828,730 |
| BILL Holdings, Inc., 0.00%, 12/1/25 | USD | 770 | 732,462 |
| BioMarin Pharmaceutical, Inc., 1.25%, 5/15/27 | USD | 815 | 787,651 |
| BlackLine, Inc., 0.00%, 3/15/26 | USD | 540 | 461,363 |
| Blackstone Mortgage Trust, Inc., 5.50%, 3/15/27 | USD | 500 | 427,813 |
| Security | Principal
Amount
(000's omitted) | Value |
| United States (continued) |
| Block, Inc., 0.125%, 3/1/25 | USD | 870 | $ 805,620 |
| Bloom Energy Corp., 3.00%, 6/1/28(1) | USD | 560 | 483,944 |
| Burlington Stores, Inc., 2.25%, 4/15/25 | USD | 780 | 755,176 |
| Cable One, Inc., 0.00%, 3/15/26 | USD | 655 | 537,428 |
| Carnival Corp., 5.75%, 12/1/27(1) | USD | 430 | 511,223 |
| Ceridian HCM Holding, Inc., 0.25%, 3/15/26 | USD | 560 | 490,250 |
| Cloudflare, Inc., 0.00%, 8/15/26 | USD | 725 | 607,912 |
| Confluent, Inc., 0.00%, 1/15/27(1) | USD | 870 | 704,396 |
| CONMED Corp., 2.25%, 6/15/27 | USD | 260 | 243,490 |
| CryoPort, Inc., 0.75%, 12/1/26(1) | USD | 535 | 421,634 |
| Cytokinetics, Inc., 3.50%, 7/1/27 | USD | 300 | 276,600 |
| Datadog, Inc., 0.125%, 6/15/25 | USD | 565 | 624,890 |
| Dexcom, Inc.: | | | |
| 0.25%, 11/15/25 | USD | 970 | 921,500 |
| 0.375%, 5/15/28(1) | USD | 550 | 486,200 |
| DISH Network Corp., 0.00%, 12/15/25 | USD | 440 | 270,609 |
| DraftKings Holdings, Inc., 0.00%, 3/15/28 | USD | 670 | 504,510 |
| Dropbox, Inc., 0.00%, 3/1/26 | USD | 695 | 650,867 |
| Duke Energy Corp., 4.125%, 4/15/26(1) | USD | 900 | 878,553 |
| Enphase Energy, Inc., 0.00%, 3/1/26 | USD | 570 | 487,920 |
| Envestnet, Inc., 0.75%, 8/15/25 | USD | 300 | 273,600 |
| Envista Holdings Corp., 1.75%, 8/15/28(1) | USD | 600 | 519,600 |
| Etsy, Inc., 0.25%, 6/15/28 | USD | 870 | 642,930 |
| Euronet Worldwide, Inc., 0.75%, 3/15/49 | USD | 300 | 277,875 |
| Exact Sciences Corp., 0.375%, 3/1/28 | USD | 1,020 | 847,883 |
| Expedia Group, Inc., 0.00%, 2/15/26 | USD | 870 | 760,336 |
| Five9, Inc., 0.50%, 6/1/25 | USD | 300 | 275,100 |
| Ford Motor Co., 0.00%, 3/15/26 | USD | 1,045 | 958,787 |
| Glencore Funding, LLC, 0.00%, 3/27/25(10) | USD | 400 | 418,352 |
| Halozyme Therapeutics, Inc., 1.00%, 8/15/28 | USD | 625 | 548,437 |
| Insmed, Inc., 0.75%, 6/1/28 | USD | 600 | 580,200 |
| Integra LifeSciences Holdings Corp., 0.50%, 8/15/25 | USD | 300 | 271,500 |
| InterDigital, Inc.: | | | |
| 2.00%, 6/1/24 | USD | 250 | 255,938 |
| 3.50%, 6/1/27 | USD | 455 | 515,167 |
| Ionis Pharmaceuticals, Inc., 0.00%, 4/1/26 | USD | 870 | 843,465 |
| Lantheus Holdings, Inc., 2.625%, 12/15/27(1) | USD | 240 | 266,622 |
| Liberty Broadband Corp., 3.125%, 3/31/53(1) | USD | 440 | 438,639 |
| Live Nation Entertainment, Inc., 2.00%, 2/15/25 | USD | 540 | 545,400 |
| Lumentum Holdings, Inc., 0.50%, 6/15/28 | USD | 435 | 305,290 |
| Marriott Vacations Worldwide Corp., 3.25%, 12/15/27(1) | USD | 635 | 535,623 |
| Match Group Financeco 3, Inc., 2.00%, 1/15/30(1) | USD | 490 | 398,426 |
| MongoDB, Inc., 0.25%, 1/15/26 | USD | 325 | 554,856 |
| NextEra Energy Partners, L.P., 2.50%, 6/15/26(1) | USD | 700 | 606,900 |
30
See Notes to Consolidated Financial Statements.
Global Opportunities Portfolio
October 31, 2023
Consolidated Portfolio of Investments — continued
| Security | Principal
Amount
(000's omitted) | Value |
| United States (continued) |
| NRG Energy, Inc., 2.75%, 6/1/48 | USD | 690 | $ 774,180 |
| NuVasive, Inc., 0.375%, 3/15/25 | USD | 525 | 482,475 |
| Okta, Inc., 0.125%, 9/1/25 | USD | 900 | 805,950 |
| Omnicell, Inc., 0.25%, 9/15/25 | USD | 870 | 775,387 |
| ON Semiconductor Corp., 0.50%, 3/1/29(1) | USD | 915 | 805,200 |
| Palo Alto Networks, Inc., 0.375%, 6/1/25 | USD | 470 | 1,150,090 |
| Post Holdings, Inc., 2.50%, 8/15/27 | USD | 500 | 476,750 |
| PPL Capital Funding, Inc., 2.875%, 3/15/28(1) | USD | 605 | 556,600 |
| Rapid7, Inc., 0.25%, 3/15/27 | USD | 550 | 470,250 |
| Rivian Automotive, Inc., 4.625%, 3/15/29(1) | USD | 545 | 575,792 |
| Sarepta Therapeutics, Inc., 1.25%, 9/15/27 | USD | 645 | 552,492 |
| Shift4 Payments, Inc., 0.50%, 8/1/27 | USD | 550 | 432,264 |
| Shockwave Medical, Inc., 1.00%, 8/15/28(1) | USD | 300 | 291,300 |
| Snap, Inc., 0.00%, 5/1/27 | USD | 1,150 | 863,075 |
| SoFi Technologies, Inc., 0.00%, 10/15/26(1) | USD | 820 | 621,150 |
| Southwest Airlines Co., 1.25%, 5/1/25 | USD | 405 | 385,661 |
| Splunk, Inc., 1.125%, 9/15/25 | USD | 815 | 877,347 |
| Spotify USA, Inc., 0.00%, 3/15/26 | USD | 505 | 433,606 |
| Tyler Technologies, Inc., 0.25%, 3/15/26 | USD | 580 | 553,334 |
| Uber Technologies, Inc., 0.00%, 12/15/25 | USD | 870 | 794,985 |
| Wolfspeed, Inc., 1.875%, 12/1/29(1) | USD | 910 | 546,000 |
| Ziff Davis, Inc., 1.75%, 11/1/26 | USD | 345 | 312,053 |
| Zscaler, Inc., 0.125%, 7/1/25 | USD | 555 | 678,765 |
| | | | $ 43,926,523 |
Total Convertible Bonds
(identified cost $59,578,271) | | | $ 57,109,962 |
| Convertible Preferred Stocks — 0.0%(8) |
| Security | Shares | Value |
| United States — 0.0%(8) |
| Bank of America Corp., Series L, 7.25% | | 625 | $ 658,250 |
| Wells Fargo & Co., Series L, Class A, 7.50% | | 620 | 654,906 |
Total Convertible Preferred Stocks
(identified cost $1,535,710) | | | $ 1,313,156 |
| Foreign Corporate Bonds — 5.6% |
| Security | Principal
Amount
(000's omitted) | Value |
| Argentina — 0.0%(8) |
| IRSA Inversiones y Representaciones S.A., 8.75%, 6/22/28(1) | USD | 151 | $ 146,456 |
| | | | $ 146,456 |
| Armenia — 0.0%(8) |
| Ardshinbank CJSC Via Dilijan Finance BV, 6.50%, 1/28/25(10) | USD | 971 | $ 958,862 |
| | | | $ 958,862 |
| Brazil — 0.8% |
| Braskem Netherlands Finance BV, 8.50% to 10/24/25, 1/23/81(10)(11) | USD | 1,357 | $ 1,326,047 |
| Coruripe Netherlands BV: | | | |
| 10.00%, 2/10/27(1) | USD | 616 | 436,054 |
| 10.00%, 2/10/27(10) | USD | 5,326 | 3,770,171 |
| FORESEA Holding S.A., 7.50%, 6/15/30(10) | USD | 2,250 | 2,103,750 |
| Guara Norte S.a.r.l., 5.198%, 6/15/34(10) | USD | 2,201 | 1,868,824 |
| Hidrovias International Finance S.a.r.l., 4.95%, 2/8/31(10) | USD | 3,401 | 2,624,640 |
| MC Brazil Downstream Trading S.a.r.l.: | | | |
| 7.25%, 6/30/31(1) | USD | 2,342 | 1,667,935 |
| 7.25%, 6/30/31(10) | USD | 1,407 | 1,001,862 |
| Minerva Luxembourg S.A., 8.875%, 9/13/33(1) | USD | 4,035 | 3,967,212 |
| Natura & Co. Luxembourg Holdings S.a.r.l., 6.00%, 4/19/29(10) | USD | 503 | 455,313 |
| Natura Cosmeticos S.A., 4.125%, 5/3/28(10) | USD | 514 | 442,982 |
| Samarco Mineracao S.A., 5.75%, 10/24/23(10)(12) | USD | 3,115 | 2,422,179 |
| Vale S.A., 2.762%(13)(14) | BRL | 14,736 | 923,628 |
| | | | $ 23,010,597 |
| Bulgaria — 0.1% |
| Bulgarian Energy Holding EAD, 2.45%, 7/22/28(10) | EUR | 2,001 | $ 1,745,911 |
| | | | $ 1,745,911 |
| Burkina Faso — 0.1% |
| Endeavour Mining PLC, 5.00%, 10/14/26(10) | USD | 3,661 | $ 3,238,301 |
| | | | $ 3,238,301 |
| Canada — 0.1% |
| Aris Gold Corp., 7.50%, 8/26/27 | USD | 2,317 | $ 2,369,232 |
| | | | $ 2,369,232 |
31
See Notes to Consolidated Financial Statements.
Global Opportunities Portfolio
October 31, 2023
Consolidated Portfolio of Investments — continued
| Security | Principal
Amount
(000's omitted) | Value |
| Chile — 0.2% |
| AES Andes S.A.: | | | |
| 6.35% to 1/7/25, 10/7/79(10)(11) | USD | 490 | $ 454,382 |
| 7.125% to 4/7/24, 3/26/79(10)(11) | USD | 3,288 | 3,100,509 |
| VTR Comunicaciones SpA: | | | |
| 4.375%, 4/15/29(10) | USD | 1,964 | 846,624 |
| 5.125%, 1/15/28(10) | USD | 1,772 | 794,529 |
| | | | $ 5,196,044 |
| China — 0.1%(8) |
| China Oil & Gas Group, Ltd., 4.70%, 6/30/26(10) | USD | 1,800 | $ 1,441,209 |
| Kaisa Group Holdings, Ltd., 9.375%, 6/30/24(10)(12) | USD | 850 | 29,750 |
| KWG Group Holdings, Ltd., 7.875%, 8/30/24(12) | USD | 519 | 40,612 |
| Longfor Group Holdings, Ltd., 3.85%, 1/13/32(10) | USD | 1,332 | 430,167 |
| Shimao Group Holdings, Ltd., 5.60%, 7/15/26(10)(12) | USD | 4,343 | 108,575 |
| Sunac China Holdings, Ltd.: | | | |
| 6.50%, 7/9/23(10)(12) | USD | 400 | 58,000 |
| 8.35%, 4/19/23(10)(12) | USD | 1,864 | 267,018 |
| Times China Holdings, Ltd.: | | | |
| 5.55%, 6/4/24(10)(12) | USD | 2,221 | 76,847 |
| 6.75%, 7/16/23(10)(12) | USD | 1,041 | 26,025 |
| | | | $ 2,478,203 |
| Colombia — 0.4% |
| ABRA Global Finance, 11.50%, (6.00% cash and 5.50% PIK), 3/2/28(1)(15) | USD | 3,749 | $ 2,890,170 |
| Aris Mining Corp., 6.875%, 8/9/26(10) | USD | 1,758 | 1,449,040 |
| Avianca Midco 2 PLC, 9.00%, 12/1/28(10) | USD | 2,046 | 1,683,964 |
| Canacol Energy, Ltd., 5.75%, 11/24/28(10) | USD | 4,357 | 3,147,127 |
| SierraCol Energy Andina, LLC, 6.00%, 6/15/28(10) | USD | 2,982 | 2,311,544 |
| | | | $ 11,481,845 |
| Costa Rica — 0.1% |
| Liberty Costa Rica Senior Secured Finance, 10.875%, 1/15/31(1) | USD | 3,147 | $ 3,055,551 |
| | | | $ 3,055,551 |
| Cyprus — 0.0%(8) |
| Bank of Cyprus PLC: | | | |
| 7.375% to 7/25/27, 7/25/28(10)(11) | EUR | 615 | $ 654,036 |
| 11.875% to 12/21/28(10)(11)(13) | EUR | 213 | 228,080 |
| | | | $ 882,116 |
| Security | Principal
Amount
(000's omitted) | Value |
| Georgia — 0.1% |
| TBC Bank JSC, 8.894% to 11/6/26(10)(11)(13) | USD | 2,674 | $ 2,421,641 |
| | | | $ 2,421,641 |
| Ghana — 0.2% |
| Kosmos Energy, Ltd.: | | | |
| 7.50%, 3/1/28(10) | USD | 2,280 | $ 1,998,967 |
| 7.75%, 5/1/27(10) | USD | 794 | 714,640 |
| Tullow Oil PLC, 10.25%, 5/15/26(10) | USD | 2,525 | 2,170,818 |
| | | | $ 4,884,425 |
| Greece — 0.2% |
| Alpha Bank S.A., 6.875% to 6/27/28, 6/27/29(10)(11) | EUR | 770 | $ 818,525 |
| Alpha Services & Holdings S.A., 5.50% to 3/11/26, 6/11/31(10)(11) | EUR | 840 | 831,439 |
| National Bank of Greece S.A., 8.00% to 10/3/28, 1/3/34(10)(11) | EUR | 1,745 | 1,865,255 |
| Piraeus Financial Holdings S.A.: | | | |
| 5.50% to 2/19/25, 2/19/30(10)(11) | EUR | 810 | 800,851 |
| 8.75% to 6/16/26(10)(11)(13) | EUR | 1,057 | 1,013,494 |
| | | | $ 5,329,564 |
| Honduras — 0.1% |
| Inversiones Atlantida S.A., 7.50%, 5/19/26(10) | USD | 1,935 | $ 1,732,522 |
| | | | $ 1,732,522 |
| Hong Kong — 0.1% |
| Yuexiu REIT MTN Co., Ltd., 2.65%, 2/2/26(10) | USD | 2,664 | $ 2,248,649 |
| | | | $ 2,248,649 |
| Hungary — 0.2% |
| MBH Bank Nyrt, 8.625% to 10/19/26, 10/19/27(10)(11) | EUR | 1,522 | $ 1,624,753 |
| OTP Bank Nyrt, 8.75% to 2/15/28, 5/15/33(10)(11) | USD | 3,938 | 3,902,456 |
| | | | $ 5,527,209 |
| Iceland — 0.1% |
| Arion Banki HF, 6.00%, 4/12/24(10) | ISK | 440,000 | $ 3,112,195 |
| Landsbankinn HF, 5.00%, 11/23/23(10) | ISK | 120,000 | 853,515 |
| WOW Air HF: | | | |
| 0.00% (12)(13)(16) | EUR | 20 | 0 |
| 0.00%, (3 mo. EURIBOR + 9.00%)(12)(13)(16) | EUR | 900 | 0 |
| | | | $ 3,965,710 |
| India — 0.2% |
| JSW Steel, Ltd., 5.05%, 4/5/32(10) | USD | 4,432 | $ 3,420,162 |
32
See Notes to Consolidated Financial Statements.
Global Opportunities Portfolio
October 31, 2023
Consolidated Portfolio of Investments — continued
| Security | Principal
Amount
(000's omitted) | Value |
| India (continued) |
| Vedanta Resources Finance II PLC, 13.875%, 1/21/24(10) | USD | 3,174 | $ 2,828,856 |
| | | | $ 6,249,018 |
| Indonesia — 0.2% |
| Minejesa Capital BV, 4.625%, 8/10/30(10) | USD | 6,066 | $ 5,432,772 |
| | | | $ 5,432,772 |
| Kazakhstan — 0.0%(8) |
| Tengizchevroil Finance Co. International, Ltd., 4.00%, 8/15/26(10) | USD | 200 | $ 178,952 |
| | | | $ 178,952 |
| Mexico — 0.8% |
| Alpha Holding S.A. de CV: | | | |
| 9.00%, 2/10/25(10)(12) | USD | 2,654 | $ 49,759 |
| 10.00%, 12/19/22(10)(12) | USD | 1,440 | 21,597 |
| Banco Mercantil del Norte S.A.: | | | |
| 7.625% to 1/10/28(10)(11)(13) | USD | 563 | 510,594 |
| 8.375% to 10/14/30(10)(11)(13) | USD | 1,314 | 1,199,602 |
| BBVA Bancomer S.A.: | | | |
| 5.125% to 1/17/28, 1/18/33(10)(11) | USD | 1,452 | 1,229,705 |
| 8.45% to 6/29/33, 6/29/38(1)(11) | USD | 1,896 | 1,809,986 |
| Braskem Idesa SAPI: | | | |
| 6.99%, 2/20/32(10) | USD | 3,880 | 2,293,516 |
| 7.45%, 11/15/29(10) | USD | 2,105 | 1,333,427 |
| Cemex SAB de CV: | | | |
| 5.125% to 6/8/26(10)(11)(13) | USD | 1,319 | 1,221,197 |
| 9.125% to 3/14/28(1)(11)(13) | USD | 1,870 | 1,919,340 |
| Grupo Aeromexico SAB de CV, 8.50%, 3/17/27(10) | USD | 1,942 | 1,802,765 |
| Grupo Kaltex S.A. de CV, 14.50%, (13.00% cash and 1.50% PIK), 9/30/25(1)(15) | USD | 2,592 | 2,332,800 |
| Petroleos Mexicanos: | | | |
| 6.35%, 2/12/48 | USD | 152 | 83,919 |
| 6.50%, 3/13/27 | USD | 871 | 769,063 |
| 6.875%, 8/4/26 | USD | 4,416 | 4,080,229 |
| 10.00%, 2/7/33 | USD | 1,597 | 1,413,190 |
| Total Play Telecomunicaciones S.A. de CV: | | | |
| 6.375%, 9/20/28(10) | USD | 2,963 | 1,421,199 |
| 7.50%, 11/12/25(10) | USD | 1,896 | 1,378,176 |
| | | | $ 24,870,064 |
| Security | Principal
Amount
(000's omitted) | Value |
| Moldova — 0.1% |
| Aragvi Finance International DAC, 8.45%, 4/29/26(10) | USD | 2,560 | $ 1,763,200 |
| | | | $ 1,763,200 |
| Mongolia — 0.0%(8) |
| Mongolian Mining Corp./Energy Resources, LLC, 9.25%, 4/15/24(10) | USD | 745 | $ 758,745 |
| | | | $ 758,745 |
| Nigeria — 0.1% |
| IHS Netherlands Holdco BV, 8.00%, 9/18/27(10) | USD | 931 | $ 762,052 |
| SEPLAT Energy PLC, 7.75%, 4/1/26(10) | USD | 2,549 | 2,158,493 |
| | | | $ 2,920,545 |
| Panama — 0.1% |
| C&W Senior Financing DAC, 6.875%, 9/15/27(10) | USD | 4,912 | $ 4,228,102 |
| | | | $ 4,228,102 |
| Paraguay — 0.1% |
| Frigorifico Concepcion S.A.: | | | |
| 7.70%, 7/21/28(1) | USD | 2,421 | $ 1,967,769 |
| 7.70%, 7/21/28(10) | USD | 1,869 | 1,519,108 |
| | | | $ 3,486,877 |
| Peru — 0.3% |
| Auna SAA, 6.50%, 11/20/25(10) | USD | 4,047 | $ 3,706,289 |
| Hunt Oil Co. of Peru, LLC, 8.55%, 9/18/33(1) | USD | 1,142 | 1,145,820 |
| Peru LNG SRL, 5.375%, 3/22/30(10) | USD | 4,049 | 3,105,725 |
| Telefonica del Peru SAA, 7.375%, 4/10/27(10) | PEN | 4,500 | 876,432 |
| | | | $ 8,834,266 |
| Russia — 0.0%(8) |
| Gazprom PJSC Via Gaz Finance PLC, 4.599% to 10/26/25(10)(11)(13) | USD | 555 | $ 299,700 |
| Hacienda Investments, Ltd. Via DME Airport DAC, 5.35%, 2/8/28(10) | USD | 450 | 263,250 |
| Tinkoff Bank JSC Via TCS Finance, Ltd., 6.00% to 12/20/26(10)(11)(13) | USD | 1,226 | 628,325 |
| | | | $ 1,191,275 |
| Saint Lucia — 0.1% |
| Digicel International Finance, Ltd./Digicel International Holdings, Ltd., 8.75%, 5/25/24(10) | USD | 4,217 | $ 3,873,441 |
| | | | $ 3,873,441 |
33
See Notes to Consolidated Financial Statements.
Global Opportunities Portfolio
October 31, 2023
Consolidated Portfolio of Investments — continued
| Security | Principal
Amount
(000's omitted) | Value |
| Singapore — 0.1% |
| APL Realty Holdings Pte., Ltd., 5.95%, 6/2/24(10) | USD | 555 | $ 443,999 |
| Indika Energy Capital IV Pte, Ltd., 8.25%, 10/22/25(10) | USD | 1,811 | 1,801,040 |
| | | | $ 2,245,039 |
| South Africa — 0.2% |
| Petra Diamonds US Treasury PLC, 9.75% PIK, 3/8/26(10)(15) | USD | 385 | $ 329,524 |
| Sasol Financing USA, LLC: | | | |
| 5.50%, 3/18/31 | USD | 4,425 | 3,395,451 |
| 6.50%, 9/27/28 | USD | 1,482 | 1,313,089 |
| | | | $ 5,038,064 |
| Turkey — 0.3% |
| Limak Iskenderun Uluslararasi Liman Isletmeciligi AS, 9.50%, 7/10/36(10) | USD | 3,388 | $ 2,974,544 |
| Ulker Biskuvi Sanayi AS, 6.95%, 10/30/25(10) | USD | 3,309 | 3,098,233 |
| WE Soda Investments Holding PLC, 9.50%, 10/6/28(10) | USD | 3,240 | 3,239,514 |
| | | | $ 9,312,291 |
| United Arab Emirates — 0.0%(8) |
| Shelf Drilling Holdings, Ltd.: | | | |
| 9.625%, 4/15/29(1) | USD | 709 | $ 674,740 |
| 9.625%, 4/15/29(10) | USD | 599 | 570,055 |
| | | | $ 1,244,795 |
| Uzbekistan — 0.0%(8) |
| Ipoteka-Bank ATIB, 16.00%, 4/16/24(10) | UZS | 7,100,000 | $ 572,482 |
| | | | $ 572,482 |
| Vietnam — 0.1% |
| Mong Duong Finance Holdings BV, 5.125%, 5/7/29(10) | USD | 3,980 | $ 3,617,820 |
| | | | $ 3,617,820 |
Total Foreign Corporate Bonds
(identified cost $181,676,347) | | | $166,490,586 |
| Loan Participation Notes — 0.5% |
| Security | Principal
Amount
(000's omitted) | Value |
| Uzbekistan — 0.5% |
| Daryo Finance BV (borrower - Uzbek Industrial and Construction Bank ATB), 18.75%, 6/15/25(10)(16)(17) | UZS | 195,502,870 | $ 15,622,067 |
| Europe Asia Investment Finance BV (borrower - Joint Stock Commercial Bank "Asaka"), 18.70%, 7/21/26(10)(16)(17) | UZS | 3,683,800 | 280,721 |
Total Loan Participation Notes
(identified cost $16,966,005) | | | $ 15,902,788 |
| Reinsurance Side Cars — 2.1% |
| Security | Shares | Value |
| Eden Re II, Ltd.: | | | |
| Series 2020A, 0.00%, 3/22/24(1)(16)(18)(19) | | 818,125 | $ 310,887 |
| Series 2021A, 0.00%, 3/21/25(1)(16)(18)(19) | | 65,826 | 30,017 |
| Series 2021B, 0.00%, 3/21/25(1)(16)(18)(19) | | 592,179 | 270,034 |
| Series 2022A, 0.00%, 3/20/26(1)(16)(18)(19) | | 1,409,976 | 1,043,805 |
| Series 2022B, 0.00%, 3/20/26(1)(16)(18)(19) | | 1,210,683 | 914,066 |
| Series 2023A, 0.00%, 3/19/27(1)(16)(18)(19) | | 15,000,000 | 17,173,500 |
| Series 2023B, 0.00%, 3/19/27(1)(16)(18)(19) | | 11,800,000 | 13,552,300 |
| Mt. Logan Re, Ltd.: | | | |
| Series 13, Preference Shares(16)(19)(20) | | 10,000 | 15,003,196 |
| Series 17, Preference Shares(9)(16)(19)(20) | | 860 | 1,273,313 |
| Sussex Capital, Ltd.: | | | |
| Designated Investment Series 5, 5/19(9)(16)(19)(20) | | 249 | 13,934 |
| Designated Investment Series 5, 12/19(9)(16)(19)(20) | | 791 | 43,067 |
| Designated Investment Series 5, 6/20(9)(16)(19)(20) | | 434 | 40,363 |
| Designated Investment Series 5, 4/21(9)(16)(19)(20) | | 247 | 9,833 |
| Designated Investment Series 5, 12/21(9)(16)(19)(20) | | 958 | 17,860 |
| Designated Investment Series 5, 11/22(9)(16)(19)(20) | | 958 | 530,701 |
| Designated Investment Series 15, 12/21(9)(16)(19)(20) | | 743 | 13,843 |
| Designated Investment Series 15, 11/22(9)(16)(19)(20) | | 721 | 399,431 |
| Series 5, Preference Shares(9)(16)(19)(20) | | 6,000 | 7,276,256 |
| Series 15, Preference Shares(9)(16)(19)(20) | | 5,000 | 5,483,188 |
| Sussex Re, Ltd.: | | | |
| Series 2020A(9)(16)(19)(20) | | 4,081,939 | 154,705 |
| Series 2021A(9)(16)(19)(20) | | 4,154,232 | 316,137 |
Total Reinsurance Side Cars
(identified cost $48,837,955) | | | $ 63,870,436 |
34
See Notes to Consolidated Financial Statements.
Global Opportunities Portfolio
October 31, 2023
Consolidated Portfolio of Investments — continued
| Sovereign Government Bonds — 9.4% |
| Security | Principal
Amount
(000's omitted) | Value |
| Argentina — 0.1% |
| Republic of Argentina: | | | |
| 0.75% to 7/9/27, 7/9/30(4) | USD | 950 | $ 266,099 |
| 1.00%, 7/9/29 | USD | 231 | 62,641 |
| 3.50% to 7/9/29, 7/9/41(4) | USD | 2,004 | 530,122 |
| 3.625% to 7/9/24, 7/9/35(4) | USD | 1,964 | 490,135 |
| 4.255% to 7/9/24, 1/9/38(4) | USD | 1,288 | 392,048 |
| | | | $ 1,741,045 |
| Benin — 0.0%(8) |
| Benin Government International Bond: | | | |
| 4.875%, 1/19/32(10) | EUR | 120 | $ 95,263 |
| 6.875%, 1/19/52(10) | EUR | 1,733 | 1,205,430 |
| | | | $ 1,300,693 |
| Dominican Republic — 1.0% |
| Dominican Republic: | | | |
| 12.00%, 8/8/25(1) | DOP | 450,030 | $ 8,009,813 |
| 12.75%, 9/23/29(1) | DOP | 794,700 | 15,500,468 |
| 13.625%, 2/3/33(1) | DOP | 8,000 | 160,449 |
| Dominican Republic Central Bank Notes: | | | |
| 12.00%, 10/3/25(1) | DOP | 299,010 | 5,327,635 |
| 13.00%, 12/5/25(1) | DOP | 12,940 | 235,232 |
| | | | $ 29,233,597 |
| Hungary — 0.0%(8) |
| Hungary Government International Bond, 6.25%, 9/22/32(10) | USD | 1,000 | $ 963,814 |
| | | | $ 963,814 |
| Iceland — 0.3% |
| Republic of Iceland: | | | |
| 5.00%, 11/15/28 | ISK | 852,032 | $ 5,401,604 |
| 6.50%, 1/24/31 | ISK | 285,839 | 1,934,334 |
| 8.00%, 6/12/25 | ISK | 307,477 | 2,194,085 |
| | | | $ 9,530,023 |
| Mexico — 1.5% |
| Mexican Bonos: | | | |
| 7.75%, 11/13/42(21) | MXN | 511,160 | $ 22,653,328 |
| 8.00%, 7/31/53(21) | MXN | 470,600 | 20,998,851 |
| | | | $ 43,652,179 |
| Security | Principal
Amount
(000's omitted) | Value |
| Peru — 2.5% |
| Peru Government Bond: | | | |
| 5.40%, 8/12/34 | PEN | 41,625 | $ 9,052,325 |
| 5.94%, 2/12/29 | PEN | �� 199,073 | 49,689,161 |
| 6.15%, 8/12/32 | PEN | 65,080 | 15,497,452 |
| 6.714%, 2/12/55 | PEN | 5,641 | 1,295,536 |
| | | | $ 75,534,474 |
| Poland — 0.0%(8) |
| Republic of Poland, 5.75%, 11/16/32 | USD | 1,000 | $ 994,782 |
| | | | $ 994,782 |
| Serbia — 0.9% |
| Serbia Treasury Bond: | | | |
| 4.50%, 8/20/32 | RSD | 3,319,480 | $ 26,406,413 |
| 5.875%, 2/8/28 | RSD | 3,280 | 30,308 |
| | | | $ 26,436,721 |
| South Africa — 2.7% |
| Republic of South Africa, 10.50%, 12/21/26 | ZAR | 1,437,663 | $ 79,571,878 |
| | | | $ 79,571,878 |
| Suriname — 0.4% |
| Republic of Suriname, 9.25%, 10/26/26(10)(12) | USD | 11,370 | $ 10,375,125 |
| | | | $ 10,375,125 |
| Ukraine — 0.0%(8) |
| Ukraine Government Bond: | | | |
| 10.95%, 11/1/23 | UAH | 7,018 | $ 183,508 |
| 11.67%, 11/22/23 | UAH | 1,719 | 40,157 |
| 15.84%, 2/26/25 | UAH | 19,789 | 428,140 |
| | | | $ 651,805 |
| Uzbekistan — 0.0%(8) |
| Republic of Uzbekistan, 16.25%, 10/12/26(10) | UZS | 6,450,000 | $ 529,822 |
| | | | $ 529,822 |
Total Sovereign Government Bonds
(identified cost $330,912,703) | | | $280,515,958 |
35
See Notes to Consolidated Financial Statements.
Global Opportunities Portfolio
October 31, 2023
Consolidated Portfolio of Investments — continued
| Sovereign Loans — 0.0%(8) |
| Borrower/Description | Principal
Amount
(000's omitted) | Value |
| Nigeria — 0.0%(8) |
| Bank of Industry Limited, Term Loan, 11.67%, (3 mo. USD LIBOR + 6.00%), 12/11/23(2)(22) | USD | 228 | $ 228,074 |
Total Sovereign Loans
(identified cost $227,960) | | | $ 228,074 |
| U.S. Department of Agriculture Loans — 1.4% |
| Security | Principal
Amount
(000's omitted) | Value |
| USDA Guaranteed Loans: | | | |
| 8.00%, (USD Prime - 0.50%), 2/16/43(2) | | 2,741 | $ 2,741,293 |
| 8.00%, (USD Prime - 0.50%), 2/16/43(2) | | 3,537 | 3,540,505 |
| 8.00%, (USD Prime - 0.50%), 2/16/43(2) | | 17,000 | 17,003,230 |
| 8.00%, (USD Prime - 0.50%), 2/16/43(2) | | 18,540 | 18,543,337 |
| 8.00%, (USD Prime - 0.50%), 2/16/63(2) | | 116 | 115,745 |
Total U.S. Department of Agriculture Loans
(identified cost $41,933,042) | | | $ 41,944,110 |
| U.S. Government Agency Commercial Mortgage-Backed Securities — 0.5% |
| Security | Principal
Amount
(000's omitted) | Value |
| FRESB Mortgage Trust: | | | |
| Interest Only:(6) | | | |
| Series 2021-SB91, Class X1, 0.572%, 8/25/41(3) | $ | 23,767 | $ 647,185 |
| Series 2021-SB92, Class X1, 0.58%, 8/25/41(3) | | 23,853 | 533,472 |
| Government National Mortgage Association: | | | |
| Interest Only:(6) | | | |
| Series 2021-101, Class IO, 0.679%, 4/16/63(3) | | 27,171 | 1,427,896 |
| Series 2021-132, Class IO, 0.726%, 4/16/63(3) | | 65,574 | 3,587,795 |
| Series 2021-144, Class IO, 0.825%, 4/16/63(3) | | 25,787 | 1,518,791 |
| Series 2021-186, Class IO, 0.765%, 5/16/63(3) | | 47,621 | 2,696,016 |
| Series 2022-3, Class IO, 0.64%, 2/16/61(3) | | 67,789 | 3,152,922 |
Total U.S. Government Agency Commercial Mortgage-Backed Securities
(identified cost $18,150,452) | | | $ 13,564,077 |
| U.S. Government Agency Mortgage-Backed Securities — 32.2% |
| Security | Principal
Amount
(000's omitted) | Value |
| Federal Home Loan Mortgage Corp.: | | | |
| 4.196%, (COF + 1.254%), with maturity at 2035(23) | $ | 71 | $ 69,432 |
| 4.616%, (COF + 1.251%), with maturity at 2030(23) | | 50 | 49,848 |
| 5.00%, with maturity at 2052 | | 7,835 | 7,235,421 |
| 6.00%, with various maturities to 2053 | | 4,714 | 4,596,454 |
| 6.50%, with maturity at 2053 | | 5,905 | 5,897,445 |
| 7.00%, with various maturities to 2036 | | 454 | 462,314 |
| 8.00%, with maturity at 2026 | | 1 | 926 |
| Federal National Mortgage Association: | | | |
| 4.186%, (COF + 1.254%), with maturity at 2035(23) | | 30 | 30,081 |
| 5.00%, 30-Year, TBA(24) | | 8,671 | 7,995,949 |
| 5.05%, (COF + 1.791%), with maturity at 2035(23) | | 310 | 302,510 |
| 5.50%, 30-Year, TBA(24) | | 50,600 | 48,032,445 |
| 5.50%, with various maturities to 2052 | | 78,925 | 75,027,369 |
| 6.00%, with various maturities to 2053 | | 18,209 | 17,753,021 |
| 6.50%, with various maturities to 2053 | | 18,042 | 18,005,327 |
| 7.00%, with maturity at 2037 | | 173 | 176,902 |
| 8.50%, with maturity at 2032 | | 80 | 83,924 |
| 9.50%, with maturity at 2028 | | 10 | 9,765 |
| Government National Mortgage Association: | | | |
| 5.00%, with maturity at 2052 | | 19,156 | 17,787,923 |
| 5.50%, with various maturities to 2063 | | 70,732 | 67,650,362 |
| 6.00%, with various maturities to 2063 | | 164,016 | 161,035,747 |
| 6.00%, 30-Year, TBA(24) | | 55,750 | 54,632,229 |
| 6.50%, with various maturities to 2063 | | 100,815 | 100,930,692 |
| 6.50%, 30-Year, TBA(24) | | ��� 300,600 | 300,042,477 |
| 7.00%, with various maturities to 2063 | | 75,059 | 76,178,702 |
Total U.S. Government Agency Mortgage-Backed Securities
(identified cost $982,568,558) | | | $963,987,265 |
| U.S. Government Guaranteed Small Business Administration Loans(25)(26)— 0.5% |
| Security | Principal
Amount
(000's omitted) | Value |
| 0.66%, 3/15/30 | $ | 2,591 | $ 34,711 |
| 0.73%, 7/15/31 | | 2,447 | 38,778 |
| 0.93%, 5/15/42 | | 1,515 | 35,687 |
| 0.98%, 4/15/32 | | 1,155 | 24,957 |
| 1.31%, 5/15/42 to 7/15/42 | | 4,217 | 147,618 |
| 1.38%, 6/15/41 | | 3,016 | 106,680 |
36
See Notes to Consolidated Financial Statements.
Global Opportunities Portfolio
October 31, 2023
Consolidated Portfolio of Investments — continued
| Security | Principal
Amount
(000's omitted) | Value |
| 1.56%, 7/15/42 | $ | 1,070 | $ 44,088 |
| 1.61%, 12/15/41 to 7/15/42 | | 1,835 | 81,671 |
| 1.63%, 9/15/41 | | 1,827 | 81,839 |
| 1.73%, 10/15/33 to 11/21/41 | | 2,509 | 113,603 |
| 1.86%, 4/15/42 to 6/15/42 | | 6,735 | 322,843 |
| 1.91%, 7/15/42 | | 1,009 | 59,396 |
| 2.06%, 7/15/42 | | 2,817 | 155,003 |
| 2.11%, 4/15/33 to 5/15/42 | | 2,292 | 115,493 |
| 2.16%, 5/15/42 | | 1,942 | 104,467 |
| 2.23%, 1/15/41 | | 1,341 | 82,476 |
| 2.28%, 11/1/29 | | 999 | 43,954 |
| 2.31%, 4/15/42 to 6/15/42 | | 2,954 | 198,000 |
| 2.36%, 1/16/42 to 6/15/42 | | 8,953 | 557,515 |
| 2.38%, 6/15/42 | | 1,275 | 81,854 |
| 2.39%, 7/15/40 | | 1,285 | 74,072 |
| 2.41%, 6/15/41 to 6/15/42 | | 7,222 | 479,747 |
| 2.43%, 3/15/41 | | 1,282 | 86,186 |
| 2.48%, 2/23/41 | | 1,083 | 71,826 |
| 2.56%, 1/15/41 | | 1,002 | 60,340 |
| 2.61%, 2/15/42 to 6/15/42 | | 2,152 | 147,840 |
| 2.66%, 4/15/42 to 6/15/42 | | 1,580 | 112,799 |
| 2.68%, 9/15/41 | | 1,137 | 77,908 |
| 2.71%, 8/15/42 | | 6,688 | 480,322 |
| 2.86%, 5/15/32 to 6/15/42 | | 5,441 | 416,790 |
| 2.88%, 8/16/42(27) | | 18,035 | 1,462,072 |
| 2.89%, 8/15/40 | | 943 | 66,970 |
| 2.90%, 11/2/42(27) | | 8,747 | 660,177 |
| 2.91%, 6/15/42 to 7/15/42 | | 4,375 | 372,518 |
| 2.93%, 4/15/41 to 5/15/41 | | 2,218 | 159,656 |
| 2.96%, 7/15/27 to 1/15/43 | | 8,190 | 614,068 |
| 2.98%, 7/15/42 | | 1,216 | 116,938 |
| 3.03%, 6/15/42 | | 1,712 | 149,091 |
| 3.11%, 5/15/42 to 6/15/42 | | 2,896 | 232,689 |
| 3.16%, 6/15/42 to 1/15/43 | | 11,995 | 1,077,036 |
| 3.21%, 12/15/26 to 7/15/42 | | 4,468 | 326,171 |
| 3.28%, 4/15/27 to 7/15/42 | | 4,035 | 358,313 |
| 3.36%, 3/15/42 | | 1,822 | 166,747 |
| 3.41%, 6/15/42 to 12/15/42 | | 3,387 | 314,014 |
| 3.46%, 4/15/27 to 8/15/42 | | 4,028 | 306,468 |
| 3.53%, 6/15/26 to 8/15/42 | | 1,061 | 69,233 |
| 3.61%, 6/15/32 to 6/15/42 | | 4,244 | 440,255 |
| 3.64%, 12/15/41 | | 1,012 | 111,355 |
| 3.66%, 5/15/42 to 7/15/42 | | 4,890 | 507,811 |
| 3.68%, 2/15/42 to 5/15/42 | | 620 | 64,360 |
| 3.71%, 3/15/24 to 7/15/42 | | 12,343 | 996,738 |
| 3.73%, 1/15/37 | | 1,620 | 142,179 |
| Security | Principal
Amount
(000's omitted) | Value |
| 3.78%, 2/15/27 to 5/15/42 | $ | 2,922 | $ 289,427 |
Total U.S. Government Guaranteed Small Business Administration Loans
(identified cost $36,712,608) | | | $ 13,442,749 |
| U.S. Treasury Obligations — 0.3% |
| Security | Principal
Amount
(000's omitted) | Value |
| U.S. Treasury Inflation-Protected Bond, 0.625%, 7/15/32(28) | $ | 11,657 | $ 9,987,786 |
Total U.S. Treasury Obligations
(identified cost $11,031,459) | | | $ 9,987,786 |
| Security | Shares | Value |
| Financial Intermediaries — 0.0% |
| Alpha Holding S.A., Escrow Certificates(9)(16) | | 3,058,000 | $ 0 |
| Alpha Holding S.A., Escrow Certificates(9)(16) | | 5,630,000 | 0 |
Total Miscellaneous
(identified cost $0) | | | $ 0 |
| Short-Term Investments — 21.4% |
| Security | Shares | Value |
| Morgan Stanley Institutional Liquidity Funds - Government Portfolio, Institutional Class, 5.25%(29) | | 422,234,524 | $ 422,234,524 |
Total Affiliated Fund
(identified cost $422,234,524) | | | $422,234,524 |
| Repurchase Agreements — 1.4% |
| Description | Principal
Amount
(000's omitted) | Value |
| Bank of America: | | | |
| Dated 9/8/23 with an interest rate of 4.95%, collateralized by $1,000,000 Indonesia Government International Bond, 4.85%, due 1/11/33 and a market value, including accrued interest, of $950,819(30) | USD | 980 | $ 980,000 |
| Dated 10/19/23 with an interest rate of 5.00%, collateralized by $1,000,000 Republic of Philippines, 5.00%, due 7/17/33 and a market value, including accrued interest, of $959,717(30) | USD | 948 | 947,500 |
37
See Notes to Consolidated Financial Statements.
Global Opportunities Portfolio
October 31, 2023
Consolidated Portfolio of Investments — continued
| Description | Principal
Amount
(000's omitted) | Value |
| Bank of America: (continued) | | | |
| Dated 10/20/23 with an interest rate of 5.00%, collateralized by $1,000,000 Chile Government International Bond, 3.50%, due 1/31/34 and a market value, including accrued interest, of $814,980(30) | USD | 803 | $ 802,500 |
| Barclays Bank PLC: | | | |
| Dated 9/26/23 with an interest rate of 3.00%, collateralized by $1,000,000 Malaysia Wakala Sukuk Bhd, 2.07%, due 4/28/31 and a market value, including accrued interest, of $799,728(30) | USD | 866 | 866,250 |
| Dated 9/29/23 with an interest rate of 5.15%, collateralized by MXN 276,661,449 Mexican Udibonos, 4.00%, due 11/3/50 and a market value, including accrued interest, of $13,415,757(30) | USD | 13,889 | 13,888,817 |
| Dated 10/16/23 with an interest rate of 5.15%, collateralized by MXN 357,818,634 Mexican Udibonos, 4.00%, due 11/15/40 and a market value, including accrued interest, of $17,839,559(30) | USD | 18,240 | 18,239,526 |
| Dated 10/19/23 with an interest rate of 3.00%, collateralized by $1,000,000 Malaysia Wakala Sukuk Bhd, 2.07%, due 4/28/31 and a market value, including accrued interest, of $799,728(30) | USD | 845 | 845,000 |
| JPMorgan Chase Bank, N.A.: | | | |
| Dated 7/27/23 with an interest rate of 5.05%, collateralized by $1,000,000 Peruvian Government International Bond, 2.783%, due 1/23/31 and a market value, including accrued interest, of $810,618(30) | USD | 849 | 848,887 |
| Dated 10/18/23 with an interest rate of 5.05%, collateralized by $1,000,000 Republic of Turkey, 9.375%, due 1/19/33 and a market value, including accrued interest, of $1,031,788(30) | USD | 1,017 | 1,017,187 |
| Dated 10/20/23 with an interest rate of 5.10%, collateralized by $1,000,000 Mexico Government International Bond, 6.35%, due 2/9/35 and a market value, including accrued interest, of $970,426(30) | USD | 970 | 970,303 |
| Nomura International PLC: | | | |
| Dated 9/5/23 with an interest rate of 5.00%, collateralized by $1,000,000 Chile Government International Bond, 3.50%, due 1/31/34 and a market value, including accrued interest, of $814,980(30) | USD | 900 | 899,850 |
| Dated 9/5/23 with an interest rate of 5.00%, collateralized by $1,000,000 Romanian Government International Bond, 7.125%, due 1/17/33 and a market value, including accrued interest, of $1,017,851(30) | USD | 1,105 | 1,104,705 |
Total Repurchase Agreements
(identified cost $41,410,525) | | | $ 41,410,525 |
| Sovereign Government Securities — 4.0% |
| Security | Principal
Amount
(000's omitted) | Value |
| Brazil — 4.0% |
| Letra do Tesouro Nacional, 0.00%, 1/1/24 | BRL | 621,140 | $ 120,919,683 |
Total Sovereign Government Securities
(identified cost $123,880,488) | | | $120,919,683 |
| U.S. Treasury Obligations — 1.9% |
| Security | Principal
Amount
(000's omitted) | Value |
| U.S. Treasury Bills: | | | |
| 0.00%, 11/30/23(31) | $ | 40,000 | $ 39,829,738 |
| 0.00%, 1/9/24 | | 17,000 | 16,828,041 |
Total U.S. Treasury Obligations
(identified cost $56,656,494) | | | $ 56,657,779 |
Total Short-Term Investments
(identified cost $644,182,031) | | | $641,222,511 |
Total Investments — 114.5%
(identified cost $3,699,557,806) | | | $3,428,728,084 |
38
See Notes to Consolidated Financial Statements.
Global Opportunities Portfolio
October 31, 2023
Consolidated Portfolio of Investments — continued
| TBA Sale Commitments — (1.5)% |
| U.S. Government Agency Mortgage-Backed Securities — (1.5)% |
| Security | Principal
Amount
(000's omitted) | Value |
| Federal National Mortgage Association, 4.50%, 30-Year, TBA(24) | $ | (50,000) | $ (44,687,500) |
Total U.S. Government Agency Mortgage-Backed Securities
(proceeds $45,240,234) | | | $(44,687,500) |
Total TBA Sale Commitments
(proceeds $45,240,234) | | | $(44,687,500) |
| Securities Sold Short — (1.2)% |
| Sovereign Government Bonds — (1.2)% |
| Security | Principal
Amount
(000's omitted) | Value |
| Chile — (0.0)%(8) |
| Chile Government International Bond, 3.50%, 1/31/34 | USD | (1,000) | $ (806,133) |
| | | | $ (806,133) |
| Indonesia — (0.0)%(8) |
| Indonesia Government International Bond, 4.85%, 1/11/33 | USD | (1,000) | $ (936,000) |
| | | | $ (936,000) |
| Malaysia — (0.0)%(8) |
| Malaysia Wakala Sukuk Bhd, 2.07%, 4/28/31(10) | USD | (1,000) | $ (799,555) |
| | | | $ (799,555) |
| Mexico — (1.0)% |
| Mexican Udibonos: | | | |
| 4.00%, 11/15/40(32) | MXN | (357,819) | $ (17,578,215) |
| 4.00%, 11/3/50(32) | MXN | (276,661) | (13,171,936) |
| | | | $(30,750,151) |
| Peru — (0.0)%(8) |
| Peruvian Government International Bond, 2.783%, 1/23/31 | USD | (1,000) | $ (803,041) |
| | | | $ (803,041) |
| Security | Principal
Amount
(000's omitted) | Value |
| Philippines — (0.1)% |
| Republic of Philippines, 5.00%, 7/17/33 | USD | (1,000) | $ (945,273) |
| | | | $ (945,273) |
| Turkey — (0.1)% |
| Republic of Turkey, 9.375%, 1/19/33 | USD | (1,000) | $ (1,005,225) |
| | | | $ (1,005,225) |
Total Sovereign Government Bonds
(proceeds $36,937,339) | | | $(36,045,378) |
Total Securities Sold Short
(proceeds $36,937,339) | | | $(36,045,378) |
| | | |
| Other Assets, Less Liabilities — (11.8)% | | | $ (354,532,572) |
| Net Assets — 100.0% | | | $2,993,462,634 |
| The percentage shown for each investment category in the Consolidated Portfolio of Investments is based on net assets. |
| (1) | Security exempt from registration under Rule 144A of the Securities Act of 1933, as amended. These securities may be sold in certain transactions in reliance on an exemption from registration (normally to qualified institutional buyers). At October 31, 2023, the aggregate value of these securities is $549,241,128 or 18.3% of the Portfolio's net assets. |
| (2) | Variable rate security. The stated interest rate represents the rate in effect at October 31, 2023. |
| (3) | Weighted average fixed-rate coupon that changes/updates monthly. Rate shown is the rate at October 31, 2023. |
| (4) | Step coupon security. Interest rate represents the rate in effect at October 31, 2023. |
| (5) | Inverse floating-rate security whose coupon varies inversely with changes in the interest rate index. The stated interest rate represents the coupon rate in effect at October 31, 2023. |
| (6) | Interest only security that entitles the holder to receive only interest payments on the underlying mortgages. Principal amount shown is the notional amount of the underlying mortgages on which coupon interest is calculated. |
| (7) | Principal only security that entitles the holder to receive only principal payments on the underlying mortgages. |
| (8) | Amount is less than 0.05% or (0.05)%, as applicable. |
| (9) | Non-income producing security. |
| (10) | Security exempt from registration under Regulation S of the Securities Act of 1933, as amended, which exempts from registration securities offered and sold outside the United States. Security may not be offered or sold in the United States except pursuant to an exemption from, or in a transaction not subject to, the registration requirements of the Securities Act of 1933, as amended. At October 31, 2023, the aggregate value of these securities is $166,703,054 or 5.6% of the Portfolio's net assets. |
39
See Notes to Consolidated Financial Statements.
Global Opportunities Portfolio
October 31, 2023
Consolidated Portfolio of Investments — continued
| (11) | Security converts to variable rate after the indicated fixed-rate coupon period. |
| (12) | Issuer is in default with respect to interest and/or principal payments or has declared bankruptcy. For a variable rate security, interest rate has been adjusted to reflect non-accrual status. |
| (13) | Perpetual security with no stated maturity date but may be subject to calls by the issuer. |
| (14) | Variable rate security whose coupon rate is linked to the issuer’s mining activities revenue. The coupon rate shown represents the rate in effect at October 31, 2023. |
| (15) | Represents a payment-in-kind security which may pay interest in additional principal at the issuer’s discretion. |
| (16) | For fair value measurement disclosure purposes, security is categorized as Level 3 (see Note 9). |
| (17) | Limited recourse note whose payments by the issuer are limited to amounts received by the issuer from the borrower pursuant to a loan agreement with the borrower. |
| (18) | Quantity held represents principal in USD. |
| (19) | Security is subject to risk of loss depending on the occurrence, frequency and severity of the loss events that are covered by underlying reinsurance contracts and that may occur during a specified risk period. |
| (20) | Restricted security (see Note 5). |
| (21) | Security (or a portion thereof) has been pledged for the benefit of the counterparty for reverse repurchase agreements. |
| (22) | Loan is subject to scheduled mandatory prepayments. Maturity date shown reflects the final maturity date. |
| (23) | Adjustable rate mortgage security whose interest rate generally adjusts monthly based on a weighted average of interest rates on the underlying mortgages. The coupon rate may not reflect the applicable index value as interest rates on the underlying mortgages may adjust on various dates and at various intervals and may be subject to lifetime ceilings and lifetime floors and lookback periods. Rate shown is the coupon rate at October 31, 2023. |
| (24) | TBA (To Be Announced) securities are purchased on a forward commitment basis with an approximate principal amount and maturity date. The actual principal amount and maturity date are determined upon settlement. |
| (25) | Interest only security that entitles the holder to receive only a portion of the interest payments on the underlying loans. Principal amount shown is the notional amount of the underlying loans on which coupon interest is calculated. |
| (26) | Securities comprise a trust that is wholly-owned by the Portfolio and may only be sold on a pro rata basis with all securities in the trust. |
| (27) | The stated interest rate represents the weighted average fixed interest rate at October 31, 2023 of all interest only securities comprising the certificate. |
| (28) | Inflation-linked security whose principal is adjusted for inflation based on changes in the U.S. Consumer Price Index. Interest is calculated based on the inflation-adjusted principal. |
| (29) | May be deemed to be an affiliated investment company. The rate shown is the annualized seven-day yield as of October 31, 2023. |
| (30) | Open repurchase agreement with no specific maturity date. Either party may terminate the agreement upon demand. |
| (31) | Security (or a portion thereof) has been pledged to cover collateral requirements on open derivative contracts. |
| (32) | Inflation-linked security whose principal is adjusted for inflation based on changes in a designated inflation index or inflation rate for the applicable country. Interest is calculated based on the inflation-adjusted principal. |
| Forward Foreign Currency Exchange Contracts (Centrally Cleared) |
| Currency Purchased | Currency Sold | Settlement
Date | Value/Unrealized
Appreciation
(Depreciation) |
| EUR | 1,084,472 | USD | 1,161,274 | 12/20/23 | $ (11,237) |
| PEN | 45,901,000 | USD | 11,818,884 | 12/20/23 | 106,882 |
| USD | 24,311,451 | EUR | 22,703,583 | 12/20/23 | 235,240 |
| USD | 17,224,271 | EUR | 16,085,123 | 12/20/23 | 166,664 |
| USD | 6,635,967 | EUR | 6,197,089 | 12/20/23 | 64,210 |
| USD | 5,191,031 | EUR | 4,847,716 | 12/20/23 | 50,229 |
| USD | 1,812,822 | EUR | 1,692,929 | 12/20/23 | 17,541 |
| USD | 1,296,435 | EUR | 1,210,694 | 12/20/23 | 12,544 |
| USD | 964,678 | EUR | 900,877 | 12/20/23 | 9,334 |
| USD | 963,738 | EUR | 900,000 | 12/20/23 | 9,325 |
| USD | 174,586 | EUR | 165,435 | 12/20/23 | (851) |
| USD | 662,371 | EUR | 627,654 | 12/20/23 | (3,230) |
| USD | 2,536,122 | EUR | 2,403,195 | 12/20/23 | (12,366) |
40
See Notes to Consolidated Financial Statements.
Global Opportunities Portfolio
October 31, 2023
Consolidated Portfolio of Investments — continued
| Forward Foreign Currency Exchange Contracts (Centrally Cleared) (continued) |
| Currency Purchased | Currency Sold | Settlement
Date | Value/Unrealized
Appreciation
(Depreciation) |
| USD | 24,740,814 | PEN | 92,115,000 | 12/20/23 | $ 807,961 |
| USD | 14,564,034 | PEN | 54,302,000 | 12/20/23 | 455,563 |
| USD | 2,631,159 | PEN | 9,786,858 | 12/20/23 | 88,387 |
| USD | 9,791,412 | PEN | 37,469,000 | 12/20/23 | 56,405 |
| USD | 9,515,814 | PEN | 36,496,000 | 12/20/23 | 33,607 |
| USD | 716,319 | PEN | 2,667,000 | 12/20/23 | 23,393 |
| USD | 683,552 | PEN | 2,545,000 | 12/20/23 | 22,323 |
| USD | 421,617 | PEN | 1,572,000 | 12/20/23 | 13,188 |
| USD | 9,307,492 | PEN | 35,778,000 | 12/20/23 | 11,833 |
| USD | 76,105 | PEN | 283,080 | 12/20/23 | 2,557 |
| USD | 19,875 | PEN | 74,000 | 12/20/23 | 649 |
| | | | | | $2,160,151 |
| Forward Foreign Currency Exchange Contracts (OTC) |
| Currency Purchased | Currency Sold | Counterparty | Settlement
Date | Unrealized
Appreciation | Unrealized
(Depreciation) |
| USD | 236,941 | EUR | 223,547 | Bank of America, N.A. | 11/3/23 | $ 397 | $ ��� — |
| USD | 381,535 | EUR | 360,719 | Goldman Sachs International | 11/3/23 | — | (156) |
| USD | 1,616,449 | EUR | 1,522,000 | UBS AG | 11/3/23 | 5,957 | — |
| USD | 484,158 | EUR | 457,913 | UBS AG | 11/3/23 | — | (378) |
| USD | 1,129,865 | EUR | 1,068,616 | UBS AG | 11/3/23 | — | (883) |
| USD | 554,814 | EUR | 526,271 | UBS AG | 11/3/23 | — | (2,055) |
| USD | 24,139,753 | PEN | 92,526,000 | Standard Chartered Bank | 11/13/23 | 64,973 | — |
| AUD | 18,000,000 | USD | 11,503,850 | BNP Paribas | 12/20/23 | — | (67,163) |
| AUD | 19,000,000 | USD | 12,267,901 | Citibank, N.A. | 12/20/23 | — | (195,842) |
| AUD | 28,000,000 | USD | 18,086,600 | Citibank, N.A. | 12/20/23 | — | (296,197) |
| AUD | 16,745,000 | USD | 10,820,540 | Standard Chartered Bank | 12/20/23 | — | (181,244) |
| MXN | 178,500,144 | USD | 10,139,685 | BNP Paribas | 12/20/23 | — | (315,422) |
| MXN | 334,154,000 | USD | 19,259,597 | Citibank, N.A. | 12/20/23 | — | (868,481) |
| MXN | 16,044,253 | USD | 922,761 | Goldman Sachs International | 12/20/23 | — | (39,720) |
| MXN | 26,660,503 | USD | 1,534,629 | JPMorgan Chase Bank, N.A. | 12/20/23 | — | (67,292) |
| MXN | 390,302,000 | USD | 22,505,521 | Standard Chartered Bank | 12/20/23 | — | (1,024,141) |
| MXN | 375,518,000 | USD | 21,566,274 | UBS AG | 12/20/23 | — | (898,573) |
| USD | 6,606,811 | CAD | 8,888,742 | State Street Bank and Trust Company | 12/20/23 | 191,578 | — |
| USD | 39,409 | CAD | 54,320 | UBS AG | 12/20/23 | 205 | — |
| USD | 8,238,139 | CNH | 60,000,000 | Goldman Sachs International | 12/20/23 | 38,680 | — |
| USD | 52,109,365 | CNH | 379,459,877 | JPMorgan Chase Bank, N.A. | 12/20/23 | 253,265 | — |
| USD | 4,064,029 | MXN | 73,689,000 | State Street Bank and Trust Company | 12/20/23 | 8,345 | — |
| USD | 3,935,769 | MXN | 71,477,000 | State Street Bank and Trust Company | 12/20/23 | 1,829 | — |
| USD | 3,912,933 | MXN | 71,428,900 | State Street Bank and Trust Company | 12/20/23 | — | (18,360) |
| USD | 2,002,906 | MXN | 36,822,000 | State Street Bank and Trust Company | 12/20/23 | — | (23,698) |
| USD | 74,294,907 | MXN | 1,321,178,900 | UBS AG | 12/20/23 | 1,580,070 | — |
41
See Notes to Consolidated Financial Statements.
Global Opportunities Portfolio
October 31, 2023
Consolidated Portfolio of Investments — continued
| Forward Foreign Currency Exchange Contracts (OTC) (continued) |
| Currency Purchased | Currency Sold | Counterparty | Settlement
Date | Unrealized
Appreciation | Unrealized
(Depreciation) |
| USD | 344,941 | NZD | 584,452 | UBS AG | 12/20/23 | $ 4,385 | $ — |
| USD | 2,762,531 | ZAR | 52,996,681 | Goldman Sachs International | 12/20/23 | — | (69,191) |
| USD | 4,632,150 | ZAR | 88,405,846 | Goldman Sachs International | 12/20/23 | — | (91,558) |
| USD | 4,814,253 | ZAR | 92,089,424 | Goldman Sachs International | 12/20/23 | — | (106,276) |
| USD | 10,855,069 | ZAR | 208,377,157 | Goldman Sachs International | 12/20/23 | — | (278,954) |
| USD | 15,984,538 | ZAR | 305,999,999 | Goldman Sachs International | 12/20/23 | — | (365,676) |
| USD | 2,794,882 | ZAR | 53,618,698 | HSBC Bank USA, N.A. | 12/20/23 | — | (70,076) |
| USD | 4,631,007 | ZAR | 88,405,846 | HSBC Bank USA, N.A. | 12/20/23 | — | (92,700) |
| USD | 4,810,923 | ZAR | 92,089,424 | HSBC Bank USA, N.A. | 12/20/23 | — | (109,606) |
| USD | 12,971,092 | ZAR | 247,549,400 | HSBC Bank USA, N.A. | 12/20/23 | — | (255,985) |
| USD | 15,978,278 | ZAR | 306,000,000 | HSBC Bank USA, N.A. | 12/20/23 | — | (371,936) |
| USD | 10,807,250 | ZAR | 207,229,020 | JPMorgan Chase Bank, N.A. | 12/20/23 | — | (265,426) |
| USD | 12,898,017 | ZAR | 246,010,320 | UBS AG | 12/20/23 | — | (246,824) |
| ZAR | 163,058,916 | USD | 8,585,437 | HSBC Bank USA, N.A. | 12/20/23 | 127,138 | — |
| ZAR | 81,529,458 | USD | 4,323,352 | HSBC Bank USA, N.A. | 12/20/23 | 32,936 | — |
| ZAR | 167,426,211 | USD | 8,831,076 | Standard Chartered Bank | 12/20/23 | 114,853 | — |
| ZAR | 81,529,459 | USD | 4,324,967 | State Street Bank and Trust Company | 12/20/23 | 31,321 | — |
| USD | 60,580,803 | BRL | 298,000,000 | BNP Paribas | 1/3/24 | 1,882,411 | — |
| USD | 64,284,720 | BRL | 323,140,000 | BNP Paribas | 1/3/24 | 634,389 | — |
| USD | 548,087 | EUR | 515,477 | State Street Bank and Trust Company | 1/31/24 | 327 | — |
| USD | 619,073 | EUR | 582,777 | State Street Bank and Trust Company | 1/31/24 | — | (202) |
| USD | 732,860 | HKD | 5,725,056 | State Street Bank and Trust Company | 1/31/24 | 165 | — |
| USD | 14,485,050 | SAR | 54,500,000 | Standard Chartered Bank | 3/14/24 | — | (29,821) |
| USD | 7,606,557 | BHD | 2,900,000 | Standard Chartered Bank | 3/18/24 | — | (70,274) |
| OMR | 4,666,500 | USD | 12,101,605 | Standard Chartered Bank | 4/8/24 | 11,833 | — |
| USD | 11,776,656 | OMR | 4,666,500 | BNP Paribas | 4/8/24 | — | (336,781) |
| OMR | 4,664,971 | USD | 12,097,326 | Standard Chartered Bank | 4/22/24 | 10,920 | — |
| USD | 11,825,022 | OMR | 4,664,971 | Standard Chartered Bank | 4/22/24 | — | (283,225) |
| OMR | 2,000,000 | USD | 5,183,496 | Standard Chartered Bank | 7/8/24 | 3,833 | — |
| USD | 8,189,339 | OMR | 3,237,000 | BNP Paribas | 7/8/24 | — | (206,353) |
| USD | 5,155,499 | OMR | 2,039,000 | Standard Chartered Bank | 7/15/24 | — | (132,617) |
| USD | 954,425 | OMR | 378,000 | BNP Paribas | 7/29/24 | — | (25,777) |
| USD | 23,985,158 | OMR | 9,293,625 | BNP Paribas | 7/29/24 | — | (114,393) |
| USD | 4,828,281 | SAR | 18,220,000 | Standard Chartered Bank | 6/18/25 | — | (10,987) |
| | | | | | | $4,999,810 | $(7,534,243) |
| Futures Contracts |
| Description | Number of
Contracts | Position | Expiration
Date | Notional
Amount | Value/Unrealized
Appreciation
(Depreciation) |
| Interest Rate Futures | | | | | |
| U.S. 5-Year Treasury Note | 4,340 | Long | 12/29/23 | $ 453,428,283 | $ (3,058,595) |
| U.S. 10-Year Treasury Note | 38 | Long | 12/19/23 | 4,034,531 | 10,514 |
42
See Notes to Consolidated Financial Statements.
Global Opportunities Portfolio
October 31, 2023
Consolidated Portfolio of Investments — continued
| Futures Contracts (continued) |
| Description | Number of
Contracts | Position | Expiration
Date | Notional
Amount | Value/Unrealized
Appreciation
(Depreciation) |
| Interest Rate Futures (continued) | | | | | |
| U.S. Ultra 10-Year Treasury Note | 212 | Long | 12/19/23 | $ 23,071,563 | $ (1,207,102) |
| U.S. Ultra-Long Treasury Bond | 49 | Long | 12/19/23 | 5,515,562 | (710,524) |
| Euro-Bobl | (42) | Short | 12/7/23 | (5,167,952) | 4,531 |
| Euro-Bund | (18) | Short | 12/7/23 | (2,456,718) | 22,658 |
| Euro-Buxl | (1) | Short | 12/7/23 | (127,416) | 7,617 |
| Japan 10-Year Bond | (193) | Short | 12/13/23 | (183,036,451) | 2,799,566 |
| U.S. 2-Year Treasury Note | (77) | Short | 12/29/23 | (15,586,484) | 41,929 |
| U.S. 10-Year Treasury Note | (174) | Short | 12/19/23 | (18,473,906) | 641,057 |
| U.S. Long Treasury Bond | (1,562) | Short | 12/19/23 | (170,941,375) | 7,280,094 |
| U.S. Ultra-Long Treasury Bond | (370) | Short | 12/19/23 | (41,648,125) | 1,077,312 |
| | | | | | $ 6,909,057 |
| Inflation Swaps (Centrally Cleared) |
Notional Amount
(000's omitted) | Portfolio
Pays/Receives
Return on
Reference Index | Reference Index | Portfolio
Pays/Receives
Rate | Annual
Rate | Termination
Date | Value/Unrealized
Appreciation
(Depreciation) |
| EUR | 5,003 | Receives | Eurostat Eurozone HICP ex Tobacco NSA
(pays upon termination) | Pays | 1.60%
(pays upon termination) | 8/15/32 | $ 943,103 |
| EUR | 19,000 | Receives | Eurostat Eurozone HICP ex Tobacco NSA
(pays upon termination) | Pays | 1.69%
(pays upon termination) | 11/15/32 | 3,414,728 |
| EUR | 5,000 | Receives | Eurostat Eurozone HICP ex Tobacco NSA
(pays upon termination) | Pays | 2.20%
(pays upon termination) | 10/15/36 | 687,577 |
| EUR | 5,000 | Receives | Eurostat Eurozone HICP ex Tobacco NSA
(pays upon termination) | Pays | 2.20%
(pays upon termination) | 10/15/36 | 687,577 |
| EUR | 5,000 | Receives | Eurostat Eurozone HICP ex Tobacco NSA
(pays upon termination) | Pays | 2.20%
(pays upon termination) | 10/15/36 | 686,988 |
| EUR | 5,260 | Receives | Eurostat Eurozone HICP ex Tobacco NSA
(pays upon termination) | Pays | 2.08%
(pays upon termination) | 1/15/37 | 765,571 |
| EUR | 5,003 | Pays | Eurostat Eurozone HICP ex Tobacco NSA
(pays upon termination) | Receives | 1.79%
(pays upon termination) | 8/15/42 | (1,140,523) |
| EUR | 19,000 | Pays | Eurostat Eurozone HICP ex Tobacco NSA
(pays upon termination) | Receives | 1.89%
(pays upon termination) | 11/15/42 | (3,985,629) |
| EUR | 5,000 | Pays | Eurostat Eurozone HICP ex Tobacco NSA
(pays upon termination) | Receives | 2.29%
(pays upon termination) | 10/15/46 | (806,978) |
| EUR | 5,000 | Pays | Eurostat Eurozone HICP ex Tobacco NSA
(pays upon termination) | Receives | 2.29%
(pays upon termination) | 10/15/46 | (806,978) |
43
See Notes to Consolidated Financial Statements.
Global Opportunities Portfolio
October 31, 2023
Consolidated Portfolio of Investments — continued
| Inflation Swaps (Centrally Cleared) (continued) |
Notional Amount
(000's omitted) | Portfolio
Pays/Receives
Return on
Reference Index | Reference Index | Portfolio
Pays/Receives
Rate | Annual
Rate | Termination
Date | Value/Unrealized
Appreciation
(Depreciation) |
| EUR | 5,000 | Pays | Eurostat Eurozone HICP ex Tobacco NSA
(pays upon termination) | Receives | 2.29%
(pays upon termination) | 10/15/46 | $ (808,615) |
| EUR | 5,260 | Pays | Eurostat Eurozone HICP ex Tobacco NSA
(pays upon termination) | Receives | 2.18%
(pays upon termination) | 1/15/47 | (936,531) |
| EUR | 5,870 | Pays | Eurostat Eurozone HICP ex Tobacco NSA
(pays upon termination) | Receives | 2.64%
(pays upon termination) | 3/13/53 | (96,121) |
| EUR | 20,500 | Pays | Eurostat Eurozone HICP ex Tobacco NSA
(pays upon termination) | Receives | 2.72%
(pays upon termination) | 6/15/53 | 269,715 |
| USD | 19,500 | Pays | Return on CPI-U (NSA)
(pays upon termination) | Receives | 2.09%
(pays upon termination) | 4/2/29 | (1,267,550) |
| USD | 25,300 | Pays | Return on CPI-U (NSA)
(pays upon termination) | Receives | 2.22%
(pays upon termination) | 11/14/32 | (3,236,865) |
| USD | 24,200 | Pays | Return on CPI-U (NSA)
(pays upon termination) | Receives | 2.75%
(pays upon termination) | 10/29/36 | (1,076,562) |
| USD | 8,500 | Pays | Return on CPI-U (NSA)
(pays upon termination) | Receives | 2.67%
(pays upon termination) | 1/7/37 | (384,364) |
| USD | 25,300 | Receives | Return on CPI-U (NSA)
(pays upon termination) | Pays | 2.20%
(pays upon termination) | 11/14/42 | 3,647,173 |
| USD | 16,200 | Receives | Return on CPI-U (NSA)
(pays upon termination) | Pays | 2.62%
(pays upon termination) | 10/29/46 | 904,940 |
| USD | 8,000 | Receives | Return on CPI-U (NSA)
(pays upon termination) | Pays | 2.62%
(pays upon termination) | 10/29/46 | 444,177 |
| USD | 8,500 | Receives | Return on CPI-U (NSA)
(pays upon termination) | Pays | 2.54%
(pays upon termination) | 1/7/47 | 532,151 |
| USD | 2,309 | Receives | Return on CPI-U (NSA)
(pays upon termination) | Pays | 2.13%
(pays upon termination) | 8/22/47 | 387,833 |
| USD | 2,295 | Receives | Return on CPI-U (NSA)
(pays upon termination) | Pays | 2.15%
(pays upon termination) | 8/25/47 | 379,565 |
| USD | 4,400 | Receives | Return on CPI-U (NSA)
(pays upon termination) | Pays | 2.42%
(pays upon termination) | 6/8/48 | 468,527 |
| USD | 7,955 | Receives | Return on CPI-U (NSA)
(pays upon termination) | Pays | 2.40%
(pays upon termination) | 3/13/53 | 468,432 |
| | | | | | | | $ 141,341 |
| Inflation Swaps (OTC) |
| Counterparty | Notional
Amount
(000's omitted) | Portfolio
Pays/Receives
Return on
Reference Index | Reference Index | Portfolio
Pays/Receives
Rate | Annual
Rate | Termination
Date | Value/Unrealized
Appreciation
(Depreciation) |
| Bank of America, N.A. | USD | 19,500 | Receives | Return on CPI-U (NSA)
(pays upon termination) | Pays | 2.09%
(pays upon termination) | 4/2/29 | $ 2,527,249 |
| | | | | | | | | $2,527,249 |
44
See Notes to Consolidated Financial Statements.
Global Opportunities Portfolio
October 31, 2023
Consolidated Portfolio of Investments — continued
| Interest Rate Swaps (Centrally Cleared) |
Notional Amount
(000's omitted) | Portfolio
Pays/
Receives
Floating
Rate | Floating Rate | Annual
Fixed Rate | Termination
Date | Value | Unamortized
Upfront
Receipts
(Payments) | Unrealized
Appreciation
(Depreciation) |
| CLP | 15,913,000 | Receives | 6-month Sinacofi Chile Interbank Rate
(pays semi-annually) | 5.51%
(pays semi-annually) | 9/20/28 | $ 545,039 | $ — | $ 545,039 |
| CLP | 15,913,000 | Pays | 6-month Sinacofi Chile Interbank Rate
(pays semi-annually) | 5.68%
(pays semi-annually) | 9/20/28 | (413,462) | — | (413,462) |
| CLP | 65,644,190 | Receives | 6-month Sinacofi Chile Interbank Rate
(pays semi-annually) | 4.77%
(pays semi-annually) | 6/6/33 | 2,716,291 | 20,572 | 2,736,863 |
| CLP | 22,046,810 | Receives | 6-month Sinacofi Chile Interbank Rate
(pays semi-annually) | 4.65%
(pays semi-annually) | 6/14/33 | 1,018,117 | — | 1,018,117 |
| COP | 56,585,800 | Receives | Colombia Overnight Interbank Reference Rate
(pays quarterly) | 8.49%
(pays quarterly) | 9/20/28 | 291,123 | — | 291,123 |
| CZK | 99,886 | Pays | 6-month CZK PRIBOR
(pays semi-annually) | 3.94%
(pays annually) | 9/20/33 | (210,480) | — | (210,480) |
| CZK | 199,772 | Pays | 6-month CZK PRIBOR
(pays semi-annually) | 3.96%
(pays annually) | 9/20/33 | (411,028) | — | (411,028) |
| CZK | 300,341 | Pays | 6-month CZK PRIBOR
(pays semi-annually) | 3.96%
(pays annually) | 9/20/33 | (610,161) | — | (610,161) |
| CZK | 386,000 | Pays | 6-month CZK PRIBOR
(pays semi-annually) | 3.98%
(pays annually) | 9/20/33 | (766,773) | — | (766,773) |
| INR | 2,127,800 | Pays | 1-day INR FBIL MIBOR
(pays semi-annually) | 6.73%
(pays semi-annually) | 12/20/28 | 57,676 | — | 57,676 |
| JPY | 2,585,000 | Receives | 1-day Overnight Tokyo Average Rate
(pays annually) | 1.28%
(pays annually) | 3/15/53 | 1,715,691 | — | 1,715,691 |
| JPY | 2,306,000 | Receives | 1-day Overnight Tokyo Average Rate
(pays annually) | 1.28%
(pays annually) | 3/15/53 | 1,516,214 | — | 1,516,214 |
| JPY | 2,459,000 | Receives | 1-day Overnight Tokyo Average Rate
(pays annually) | 1.29%
(pays annually) | 3/15/53 | 1,594,820 | — | 1,594,820 |
| JPY | 2,700,000 | Receives | 1-day Overnight Tokyo Average Rate
(pays annually) | 1.33%
(pays annually) | 9/20/53 | 1,716,378 | — | 1,716,378 |
| JPY | 2,500,000 | Receives | 1-day Overnight Tokyo Average Rate
(pays annually) | 1.41%
(pays annually) | 9/20/53 | 1,302,258 | — | 1,302,258 |
| PLN | 180,000 | Receives | 6-month PLN WIBOR
(pays semi-annually) | 5.24%
(pays annually) | 6/21/33 | (511,459) | — | (511,459) |
| USD | 10,000 | Pays | SOFR
(pays annually) | 4.01%
(pays annually) | 8/4/28 | (264,750) | — | (264,750) |
| USD | 65,150 | Pays | SOFR
(pays annually) | 4.01%
(pays annually) | 8/4/28 | (1,721,927) | — | (1,721,927) |
| USD | 38,900 | Pays | SOFR
(pays annually) | 4.05%
(pays annually) | 9/20/28 | (897,621) | — | (897,621) |
| USD | 38,900 | Pays | SOFR
(pays annually) | 4.06%
(pays annually) | 9/20/28 | (893,299) | — | (893,299) |
| USD | 44,500 | Pays | SOFR
(pays annually) | 3.09%
(pays annually) | 11/4/32 | (5,641,201) | — | (5,641,201) |
45
See Notes to Consolidated Financial Statements.
Global Opportunities Portfolio
October 31, 2023
Consolidated Portfolio of Investments — continued
| Interest Rate Swaps (Centrally Cleared) (continued) |
Notional Amount
(000's omitted) | Portfolio
Pays/
Receives
Floating
Rate | Floating Rate | Annual
Fixed Rate | Termination
Date | Value | Unamortized
Upfront
Receipts
(Payments) | Unrealized
Appreciation
(Depreciation) |
| USD | 44,000 | Pays | SOFR
(pays annually) | 3.18%
(pays annually) | 2/2/33 | $ (5,267,090) | $ — | $ (5,267,090) |
| USD | 18,760 | Pays | SOFR
(pays annually) | 3.22%
(pays annually) | 6/6/33 | (881,698) | — | (881,698) |
| USD | 26,270 | Pays | SOFR
(pays annually) | 3.25%
(pays annually) | 6/6/33 | (1,213,774) | — | (1,213,774) |
| USD | 25,325 | Pays | SOFR
(pays annually) | 3.26%
(pays annually) | 6/7/33 | (1,159,130) | — | (1,159,130) |
| USD | 23,445 | Pays | SOFR
(pays annually) | 3.26%
(pays annually) | 6/14/33 | (1,068,422) | — | (1,068,422) |
| ZAR | 14,620 | Pays | 3-month ZAR JIBAR
(pays quarterly) | 6.54%
(pays quarterly) | 2/23/27 | (42,325) | — | (42,325) |
| ZAR | 521,034 | Pays | 3-month ZAR JIBAR
(pays quarterly) | 7.67%
(pays quarterly) | 1/19/28 | (795,137) | 235 | (794,902) |
| Total | | | | | | $(10,296,130) | $20,807 | $(10,275,323) |
| Credit Default Swaps - Buy Protection (Centrally Cleared) | |
| Reference Entity | Notional
Amount
(000's omitted) | Contract
Annual
Fixed Rate* | Termination
Date | Value | Unamortized
Upfront
Receipts
(Payments) | Unrealized
Appreciation
(Depreciation) |
| Brazil | | $ 7,651 | 1.00%
(pays quarterly)(1) | 12/20/28 | $ 266,609 | $ (276,617) | $ (10,008) |
| Malaysia | | 20,400 | 1.00%
(pays quarterly)(1) | 12/20/28 | (356,159) | 468,760 | 112,601 |
| Turkey | | 3,201 | 1.00%
(pays quarterly)(1) | 12/20/28 | 385,553 | (399,768) | (14,215) |
| Total | | | | | $ 296,003 | $ (207,625) | $ 88,378 |
| * | The contract annual fixed rate represents the fixed rate of interest paid by the Portfolio (as a buyer of protection) on the notional amount of the credit default swap contract. |
| (1) | Upfront payment is exchanged with the counterparty as a result of the standardized trading coupon. |
46
See Notes to Consolidated Financial Statements.
Global Opportunities Portfolio
October 31, 2023
Consolidated Portfolio of Investments — continued
| Cross-Currency Swaps (OTC) | | |
| Counterparty | Portfolio Receives | Portfolio Pays | Termination
Date | Value/Unrealized
Appreciation
(Depreciation) |
| Barclays Bank PLC | 1-day Indice Camara Promedio Rate on CLP 6,058,901,240 (pays semi-annually)* | 1.41% on CLP equivalent of
CLF 172,000
(pays semi-annually)* | 1/13/33 | $ 815,780 |
| Goldman Sachs International | 1-day Indice Camara Promedio Rate on CLP 952,568,100 (pays semi-annually)* | 2.10% on CLP equivalent of CLF 30,000
(pays semi-annually)* | 4/8/32 | (73,201) |
| Goldman Sachs International | 1-day Indice Camara Promedio Rate on CLP 2,921,491,280 (pays semi-annually)* | 2.25% on CLP equivalent of CLF 92,000
(pays semi-annually)* | 4/11/32 | (266,760) |
| | | | | $ 475,819 |
| * | At the termination date, the Portfolio will either pay or receive the USD equivalent of the difference between the initial CLP notional amount and the CLP equivalent of the CLF notional amount on such date. |
| Abbreviations: |
| COF | – Cost of Funds 11th District |
| CPI-U (NSA) | – Consumer Price Index All Urban Non-Seasonally Adjusted |
| EURIBOR | – Euro Interbank Offered Rate |
| FBIL | – Financial Benchmarks India Ltd. |
| HICP | – Harmonised Indices of Consumer Prices |
| JIBAR | – Johannesburg Interbank Average Rate |
| LIBOR | – London Interbank Offered Rate |
| |
| MIBOR | – Mumbai Interbank Offered Rate |
| OTC | – Over-the-counter |
| PIK | – Payment In Kind |
| PRIBOR | – Prague Interbank Offered Rate |
| SOFR | – Secured Overnight Financing Rate |
| TBA | – To Be Announced |
| WIBOR | – Warsaw Interbank Offered Rate |
| Currency Abbreviations: |
| AUD | – Australian Dollar |
| BHD | – Bahraini Dinar |
| BRL | – Brazilian Real |
| CAD | – Canadian Dollar |
| CLF | – Chilean Unidad de Fomento |
| CLP | – Chilean Peso |
| CNH | – Yuan Renminbi Offshore |
| COP | – Colombian Peso |
| CZK | – Czech Koruna |
| DOP | – Dominican Peso |
| EUR | – Euro |
| HKD | – Hong Kong Dollar |
| INR | – Indian Rupee |
| ISK | – Icelandic Krona |
| |
| JPY | – Japanese Yen |
| MXN | – Mexican Peso |
| NZD | – New Zealand Dollar |
| OMR | – Omani Rial |
| PEN | – Peruvian Sol |
| PLN | – Polish Zloty |
| RSD | – Serbian Dinar |
| SAR | – Saudi Riyal |
| UAH | – Ukrainian Hryvnia |
| USD | – United States Dollar |
| UZS | – Uzbekistani Som |
| ZAR | – South African Rand |
47
See Notes to Consolidated Financial Statements.
Global Opportunities Portfolio
October 31, 2023
Consolidated Statement of Assets and Liabilities
| | October 31, 2023 |
| Assets | |
| Unaffiliated investments, at value (identified cost $3,277,323,282) | $ 3,006,493,560 |
| Affiliated investments, at value (identified cost $422,234,524) | 422,234,524 |
| Cash | 1,742,874 |
| Deposits for forward commitment securities | 2,051,000 |
| Deposits for derivatives collateral: | |
| Futures contracts | 817,641 |
| Centrally cleared derivatives | 20,212,892 |
| OTC derivatives | 4,929,900 |
| Foreign currency, at value (identified cost $1,073,498) | 924,905 |
| Interest and dividends receivable | 23,612,538 |
| Dividends receivable from affiliated investments | 1,784,184 |
| Receivable for investments sold | 16,474,557 |
| Receivable for TBA sale commitments | 45,240,234 |
| Receivable for open forward foreign currency exchange contracts | 4,999,810 |
| Receivable for open swap contracts | 3,343,029 |
| Receivable for closed swap contracts | 56,913 |
| Tax reclaims receivable | 23,675 |
| Trustees' deferred compensation plan | 110,961 |
| Total assets | $3,555,053,197 |
| Liabilities | |
| Cash collateral due to brokers | $ 6,660,900 |
| Payable for reverse repurchase agreements, including accrued interest of $138,334 | 44,585,989 |
| Payable for investments purchased | 7,744,397 |
| Payable for when-issued/delayed delivery/forward commitment securities | 409,921,764 |
| Payable for securities sold short, at value (proceeds $36,937,339) | 36,045,378 |
| TBA sale commitments, at value (proceeds receivable $45,240,234) | 44,687,500 |
| Payable for variation margin on open futures contracts | 22,409 |
| Payable for variation margin on open centrally cleared derivatives | 859,203 |
| Payable for open forward foreign currency exchange contracts | 7,534,243 |
| Payable for open swap contracts | 339,961 |
| Payable for closed swap contracts | 287,616 |
| Payable to affiliates: | |
| Investment adviser fee | 1,333,784 |
| Trustees' fees | 9,223 |
| Trustees' deferred compensation plan | 110,961 |
| Interest payable on securities sold short | 731,478 |
| Accrued expenses | 715,757 |
| Total liabilities | $ 561,590,563 |
| Net Assets applicable to investors' interest in Portfolio | $2,993,462,634 |
48
See Notes to Consolidated Financial Statements.
Global Opportunities Portfolio
October 31, 2023
Consolidated Statement of Operations
| | Year Ended |
| | October 31, 2023 |
| Investment Income | |
| Dividend income (net of foreign taxes withheld of $21,716) | $ 2,174,232 |
| Dividend income from affiliated investments | 16,883,998 |
| Interest and other income | 141,163,563 |
| Total investment income | $160,221,793 |
| Expenses | |
| Investment adviser fee | $ 14,181,631 |
| Trustees’ fees and expenses | 108,500 |
| Custodian fee | 1,066,859 |
| Legal and accounting services | 220,186 |
| Interest expense and fees | 429,096 |
| Interest expense on securities sold short | 222,742 |
| Miscellaneous | 99,918 |
| Total expenses | $ 16,328,932 |
| Deduct: | |
| Waiver and/or reimbursement of expenses by affiliates | $ 529,551 |
| Total expense reductions | $ 529,551 |
| Net expenses | $ 15,799,381 |
| Net investment income | $144,422,412 |
| Realized and Unrealized Gain (Loss) | |
| Net realized gain (loss): | |
| Investment transactions (net of foreign capital gains taxes of $63,202) | $ (45,821,600) |
| Investment transactions - affiliated investments | (4,825,194) |
| Written swaptions | 1,597,840 |
| Securities sold short | 1,846,619 |
| TBA sale commitments | (16,516) |
| Futures contracts | 4,508,428 |
| Swap contracts | (10,065,314) |
| Foreign currency transactions | 36,213,587 |
| Forward foreign currency exchange contracts | (43,092,295) |
| Non-deliverable bond forward contracts | 802,180 |
| Net realized loss | $ (58,852,265) |
| Change in unrealized appreciation (depreciation): | |
| Investments | $ 20,814,092 |
| Investments - affiliated investments | 4,456,489 |
| Written swaptions | 4,716,973 |
| Securities sold short | 891,961 |
| TBA sale commitments | (1,985,696) |
| Futures contracts | (25,360,054) |
| Swap contracts | (12,199,845) |
| Foreign currency | 1,449,938 |
| Forward foreign currency exchange contracts | (19,352,596) |
| Non-deliverable bond forward contracts | (118,298) |
| Net change in unrealized appreciation (depreciation) | $ (26,687,036) |
| Net realized and unrealized loss | $ (85,539,301) |
| Net increase in net assets from operations | $ 58,883,111 |
49
See Notes to Consolidated Financial Statements.
Global Opportunities Portfolio
October 31, 2023
Consolidated Statements of Changes in Net Assets
| | Year Ended October 31, |
| | 2023 | 2022 |
| Increase (Decrease) in Net Assets | | |
| From operations: | | |
| Net investment income | $ 144,422,412 | $ 80,926,073 |
| Net realized gain (loss) | (58,852,265) | 6,800,331 |
| Net change in unrealized appreciation (depreciation) | (26,687,036) | (151,488,276) |
| Net increase (decrease) in net assets from operations | $ 58,883,111 | $ (63,761,872) |
| Capital transactions: | | |
| Contributions | $ 1,068,753,875 | $ 678,901,745 |
| Withdrawals | (317,425,020) | (312,950,240) |
| Net increase in net assets from capital transactions | $ 751,328,855 | $ 365,951,505 |
| Net increase in net assets | $ 810,211,966 | $ 302,189,633 |
| Net Assets | | |
| At beginning of year | $ 2,183,250,668 | $ 1,881,061,035 |
| At end of year | $2,993,462,634 | $2,183,250,668 |
50
See Notes to Consolidated Financial Statements.
Global Opportunities Portfolio
October 31, 2023
Consolidated Financial Highlights
| | Year Ended October 31, |
| Ratios/Supplemental Data | 2023 | 2022 | 2021 | 2020 | 2019 |
| Ratios (as a percentage of average daily net assets): | | | | | |
| Expenses | 0.64% (1)(2) | 0.66% (1)(2) | 0.70% (1) | 0.69% (1) | 0.69% |
| Net investment income | 5.82% | 4.04% | 4.22% | 2.85% | 4.61% |
| Portfolio Turnover | 526% (3) | 400% (3) | 218% (3) | 87% (3) | 39% |
| Total Return | 2.94% | (2.97)% | 3.53% | 7.52% | 3.21% |
| Net assets, end of year (000’s omitted) | $2,993,463 | $2,183,251 | $1,881,061 | $1,359,116 | $1,367,072 |
| (1) | Includes interest and/or dividend expense on securities sold short of 0.01%, 0.02%, 0.03% and 0.01% of average daily net assets for the years ended October 31, 2023, 2022, 2021 and 2020, respectively. |
| (2) | Includes a reduction by the investment adviser of a portion of its adviser fee due to the Portfolio’s investment in the Liquidity Fund (equal to 0.02% and 0.01% of average daily net assets for the years ended October 31, 2023 and 2022, respectively). |
| (3) | Includes the effect of To-Be-Announced (TBA) transactions. |
51
See Notes to Consolidated Financial Statements.
Global Opportunities Portfolio
October 31, 2023
Notes to Consolidated Financial Statements
1 Significant Accounting Policies
Global Opportunities Portfolio (the Portfolio) is a Massachusetts business trust registered under the Investment Company Act of 1940, as amended (the 1940 Act), as a non-diversified, open-end management investment company. The Portfolio’s investment objective is total return. The Declaration of Trust permits the Trustees to issue interests in the Portfolio. At October 31, 2023, Eaton Vance Short Duration Strategic Income Fund and Eaton Vance International (Cayman Islands) Short Duration Strategic Income Fund held an interest of 98.6% and 1.4%, respectively, in the Portfolio.
The Portfolio seeks to gain exposure to the commodity markets, in whole or in part, through investments in Eaton Vance GOP Commodity Subsidiary, Ltd. (the Subsidiary), a wholly-owned subsidiary of the Portfolio organized under the laws of the Cayman Islands with the same objective and investment policies and restrictions as the Portfolio. The net assets of the Subsidiary at October 31, 2023 were $917,734 or less than 0.1% of the Portfolio’s consolidated net assets. The accompanying consolidated financial statements include the accounts of the Subsidiary. Intercompany balances and transactions have been eliminated in consolidation.
The following is a summary of significant accounting policies of the Portfolio. The policies are in conformity with accounting principles generally accepted in the United States of America (U.S. GAAP). The Portfolio is an investment company and follows accounting and reporting guidance in the Financial Accounting Standards Board (FASB) Accounting Standards Codification Topic 946.
A Investment Valuation—The following methodologies are used to determine the market value or fair value of investments.
Debt Obligations. Debt obligations are generally valued on the basis of valuations provided by third party pricing services, as derived from such services’ pricing models. Inputs to the models may include, but are not limited to, reported trades, executable bid and ask prices, broker/dealer quotations, prices or yields of securities with similar characteristics, interest rates, anticipated prepayments, benchmark curves or information pertaining to the issuer, as well as industry and economic events. The pricing services may use a matrix approach, which considers information regarding securities with similar characteristics to determine the valuation for a security. Short-term debt obligations purchased with a remaining maturity of sixty days or less for which a valuation from a third party pricing service is not readily available may be valued at amortized cost, which approximates fair value.
Senior Floating-Rate Loans. Interests in senior floating-rate loans (Senior Loans) for which reliable market quotations are readily available are valued generally at the average mean of bid and ask quotations obtained from a third party pricing service.
Equity Securities. Equity securities listed on a U.S. securities exchange generally are valued at the last sale or closing price on the day of valuation or, if no sales took place on such date, at the mean between the closing bid and ask prices on the exchange where such securities are principally traded. Equity securities listed on the NASDAQ National Market System are valued at the NASDAQ official closing price. Unlisted or listed securities for which closing sales prices or closing quotations are not available are valued at the mean between the latest available bid and ask prices or, in the case of preferred equity securities that are not listed or traded in the over-the-counter market, by a third party pricing service that uses various techniques that consider factors including, but not limited to, prices or yields of securities with similar characteristics, benchmark yields, broker/dealer quotes, quotes of underlying common stock, issuer spreads, as well as industry and economic events.
Derivatives. Futures contracts are valued at the closing settlement price established by the board of trade or exchange on which they are traded. Forward foreign currency exchange contracts are generally valued at the mean of the average bid and average ask prices that are reported by currency dealers to a third party pricing service at the valuation time. Such third party pricing service valuations are supplied for specific settlement periods and the Portfolio’s forward foreign currency exchange contracts are valued at an interpolated rate between the closest preceding and subsequent settlement period reported by the third party pricing service. Swaps and options on swaps (“swaptions”) are normally valued using valuations provided by a third party pricing service. Such pricing service valuations are based on the present value of fixed and projected floating-rate cash flows over the term of the swap contract, and in the case of credit default swaps, based on credit spread quotations obtained from broker/dealers and expected default recovery rates determined by the pricing service using proprietary models. Future cash flows on swaps are discounted to their present value using swap rates provided by electronic data services or by broker/dealers. Alternatively, swaptions may be valued at the valuation provided by a broker/dealer (usually the counterparty to the option), so determined using similar techniques as those employed by the pricing service.
Foreign Securities and Currencies. Foreign securities and currencies are valued in U.S. dollars, based on foreign currency exchange rate quotations supplied by a third party pricing service. The pricing service uses a proprietary model to determine the exchange rate. Inputs to the model include reported trades and implied bid/ask spreads. The daily valuation of exchange-traded foreign securities generally is determined as of the close of trading on the principal exchange on which such securities trade. Events occurring after the close of trading on foreign exchanges may result in adjustments to the valuation of foreign securities to more accurately reflect their fair value as of the close of regular trading on the New York Stock Exchange. When valuing foreign equity securities that meet certain criteria, the Portfolio’s Trustees have approved the use of a fair value service that values such securities to reflect market trading that occurs after the close of the applicable foreign markets of comparable securities or other instruments that have a strong correlation to the fair-valued securities.
Other. Investments in management investment companies (including money market funds) that do not trade on an exchange are valued at the net asset value as of the close of each business day.
Fair Valuation. In connection with Rule 2a-5 of the 1940 Act, the Trustees have designated the Portfolio’s investment adviser as its valuation designee. Investments for which valuations or market quotations are not readily available or are deemed unreliable are valued by the investment adviser, as valuation
Global Opportunities Portfolio
October 31, 2023
Notes to Consolidated Financial Statements — continued
designee, at fair value using methods that most fairly reflect the security’s “fair value”, which is the amount that the Portfolio might reasonably expect to receive for the security upon its current sale in the ordinary course. Each such determination is based on a consideration of relevant factors, which are likely to vary from one pricing context to another. These factors may include, but are not limited to, the type of security, the existence of any contractual restrictions on the security’s disposition, the price and extent of public trading in similar securities of the issuer or of comparable companies or entities, quotations or relevant information obtained from broker/dealers or other market participants, information obtained from the issuer, analysts, and/or the appropriate stock exchange (for exchange-traded securities), an analysis of the company’s or entity’s financial statements, and an evaluation of the forces that influence the issuer and the market(s) in which the security is purchased and sold.
B Investment Transactions—Investment transactions for financial statement purposes are accounted for on a trade date basis. Realized gains and losses on investments sold are determined on the basis of identified cost.
C Income—Interest income is recorded on the basis of interest accrued, adjusted for amortization of premium or accretion of discount. Inflation adjustments to the principal amount of inflation-adjusted bonds and notes are reflected as interest income. Deflation adjustments to the principal amount of an inflation-adjusted bond or note are reflected as reductions to interest income to the extent of interest income previously recorded on such bond or note. Dividend income is recorded on the ex-dividend date for dividends received in cash and/or securities. However, if the ex-dividend date has passed, certain dividends from foreign securities are recorded as the Portfolio is informed of the ex-dividend date. Withholding taxes on foreign interest, dividends and capital gains have been provided for in accordance with the Portfolio’s understanding of the applicable countries’ tax rules and rates. Distributions from investment companies are recorded as dividend income, capital gains or return of capital based on the nature of the distribution.
D Federal and Other Taxes—The Portfolio has elected to be treated as a partnership for federal tax purposes. No provision is made by the Portfolio for federal or state taxes on any taxable income of the Portfolio because each investor in the Portfolio is ultimately responsible for the payment of any taxes on its share of taxable income. If one of the Portfolio's investors is a regulated investment company that invests all or substantially all of its assets in the Portfolio, the Portfolio normally must satisfy the applicable source of income and diversification requirements (under the Internal Revenue Code) in order for its investors to satisfy them. The Portfolio will allocate, at least annually among its investors, each investor's distributive share of the Portfolio's net investment income, net realized capital gains and losses and any other items of income, gain, loss, deduction or credit.
In addition to the requirements of the Internal Revenue Code, the Portfolio may also be subject to local taxes on the recognition of capital gains in certain countries. In determining the daily net asset value, the Portfolio estimates the accrual for such taxes, if any, based on the unrealized appreciation on certain portfolio securities and the related tax rates. Taxes attributable to unrealized appreciation are included in the change in unrealized appreciation (depreciation) on investments. Capital gains taxes on securities sold are included in net realized gain (loss) on investments.
The Subsidiary is treated as a controlled foreign corporation under the Internal Revenue Code and is not expected to be subject to U.S. federal income tax. The Portfolio is treated as a U.S. shareholder of the Subsidiary. As a result, the Portfolio is required to include in gross income for U.S. federal tax purposes all of the Subsidiary's income, whether or not such income is distributed by the Subsidiary. If a net loss is realized by the Subsidiary, such loss is not generally available to offset the income earned by the Portfolio.
As of October 31, 2023, the Portfolio had no uncertain tax positions that would require financial statement recognition, de-recognition, or disclosure. The Portfolio files a U.S. federal income tax return annually after its fiscal year-end, which is subject to examination by the Internal Revenue Service for a period of three years from the date of filing.
E Foreign Currency Translation—Investment valuations, other assets, and liabilities initially expressed in foreign currencies are translated each business day into U.S. dollars based upon current exchange rates. Purchases and sales of foreign investment securities and income and expenses denominated in foreign currencies are translated into U.S. dollars based upon currency exchange rates in effect on the respective dates of such transactions. Recognized gains or losses on investment transactions attributable to changes in foreign currency exchange rates are recorded for financial statement purposes as net realized gains and losses on investments. That portion of unrealized gains and losses on investments that results from fluctuations in foreign currency exchange rates is not separately disclosed.
F Unfunded Loan Commitments—The Portfolio may enter into certain loan agreements all or a portion of which may be unfunded. The Portfolio is obligated to fund these commitments at the borrower's discretion. These commitments, if any, are disclosed in the accompanying Consolidated Portfolio of Investments.
G Use of Estimates—The preparation of the consolidated financial statements in conformity with U.S. GAAP requires management to make estimates and assumptions that affect the reported amounts of assets and liabilities at the date of the consolidated financial statements and the reported amounts of income and expense during the reporting period. Actual results could differ from those estimates.
H Indemnifications—Under the Portfolio’s organizational documents, its officers and Trustees may be indemnified against certain liabilities and expenses arising out of the performance of their duties to the Portfolio. Under Massachusetts law, if certain conditions prevail, interestholders in the Portfolio could be deemed to have personal liability for the obligations of the Portfolio. However, the Portfolio’s Declaration of Trust contains an express disclaimer of liability on the part of Portfolio interestholders. Additionally, in the normal course of business, the Portfolio enters into agreements with service providers
Global Opportunities Portfolio
October 31, 2023
Notes to Consolidated Financial Statements — continued
that may contain indemnification clauses. The Portfolio’s maximum exposure under these arrangements is unknown as this would involve future claims that may be made against the Portfolio that have not yet occurred.
I Futures Contracts—Upon entering into a futures contract, the Portfolio is required to deposit with the broker, either in cash or securities, an amount equal to a certain percentage of the contract amount (initial margin). Subsequent payments, known as variation margin, are made or received by the Portfolio each business day, depending on the daily fluctuations in the value of the underlying security or index, and are recorded as unrealized gains or losses by the Portfolio. Gains (losses) are realized upon the expiration or closing of the futures contracts. Should market conditions change unexpectedly, the Portfolio may not achieve the anticipated benefits of the futures contracts and may realize a loss. Futures contracts have minimal counterparty risk as they are exchange traded and the clearinghouse for the exchange is substituted as the counterparty, guaranteeing counterparty performance.
J Forward Foreign Currency Exchange and Non-Deliverable Bond Forward Contracts—The Portfolio may enter into forward foreign currency exchange contracts for the purchase or sale of a specific foreign currency at a fixed price on a future date. The forward foreign currency exchange contracts are adjusted by the daily exchange rate of the underlying currency and any gains or losses are recorded as unrealized until such time as the contracts have been closed. While forward foreign currency exchange contracts are privately negotiated agreements between the Portfolio and a counterparty, certain contracts may be “centrally cleared”, whereby all payments made or received by the Portfolio pursuant to the contract are with a central clearing party (CCP) rather than the original counterparty. The CCP guarantees the performance of the original parties to the contract. Upon entering into centrally cleared contracts, the Portfolio is required to deposit with the CCP, either in cash or securities, an amount of initial margin determined by the CCP, which is subject to adjustment. For centrally cleared contracts, the daily change in valuation is recorded as a receivable or payable for variation margin and settled in cash with the CCP daily. The Portfolio may also enter into non-deliverable bond forward contracts for the purchase of a bond denominated in a non-deliverable foreign currency at a fixed price on a future date. For non-deliverable bond forward contracts, unrealized gains and losses, based on changes in the value of the contract, and realized gains and losses are accounted for as described above. Risks may arise upon entering these contracts from the potential inability of counterparties to meet the terms of their contracts and, in the case of forward foreign currency exchange contracts, from movements in the value of a foreign currency relative to the U.S. dollar. In the case of centrally cleared contracts, counterparty risk is minimal due to protections provided by the CCP.
K Interest Rate Swaps—Swap contracts are privately negotiated agreements between the Portfolio and a counterparty. Certain swap contracts may be centrally cleared. Pursuant to interest rate swap agreements, the Portfolio either makes floating-rate payments to the counterparty (or CCP in the case of centrally cleared swaps) based on a benchmark interest rate in exchange for fixed-rate payments or the Portfolio makes fixed-rate payments to the counterparty (or CCP in the case of a centrally cleared swap) in exchange for payments on a floating benchmark interest rate. Payments received or made, including amortization of upfront payments/receipts, if any (which are amortized over the life of the swap contract), are recorded as realized gains or losses. During the term of the outstanding swap agreement, changes in the underlying value of the swap are recorded as unrealized gains or losses. For centrally cleared swaps, the daily change in valuation is recorded as a receivable or payable for variation margin and settled in cash with the CCP daily. The value of the swap is determined by changes in the relationship between two rates of interest. The Portfolio is exposed to credit loss in the event of non-performance by the swap counterparty. In the case of centrally cleared swaps, counterparty risk is minimal due to protections provided by the CCP. Risk may also arise from movements in interest rates.
L Inflation Swaps—Pursuant to inflation swap agreements, the Portfolio either makes floating-rate payments to the counterparty (or CCP in the case of centrally cleared swaps) based on a benchmark index in exchange for fixed-rate payments or the Portfolio makes fixed-rate payments to the counterparty (or CCP in the case of centrally cleared swaps) in exchange for floating-rate payments based on the return of a benchmark index. By design, the benchmark index is an inflation index, such as the Consumer Price Index. The accounting policy for payments received or made and changes in the underlying value of the inflation swap are the same as for interest rate swaps as described above. The value of the swap is determined by changes in the relationship between the rate of interest and the benchmark index. The Portfolio is exposed to credit loss in the event of nonperformance by the swap counterparty. In the case of centrally cleared swaps, counterparty risk is minimal due to protections provided by the CCP. Risk may also arise from the unanticipated movements in value of interest rates or the index.
M Cross-Currency Swaps—Cross-currency swaps are interest rate swaps in which interest cash flows are exchanged between two parties based on the notional amounts of two different currencies. The notional amounts are typically determined based on the spot exchange rates at the inception of the trade. Cross-currency swaps also involve the exchange of the notional amounts at the start of the contract at the current spot rate with an agreement to re-exchange such amounts at a later date at either the same exchange rate, a specified rate or the then current spot rate. The entire principal value of a cross-currency swap is subject to the risk that the counterparty to the swap will default on its contractual delivery obligations.
N Credit Default Swaps—When the Portfolio is the buyer of a credit default swap contract, the Portfolio is entitled to receive the par (or other agreed-upon) value of a referenced debt obligation (or basket of debt obligations) from the counterparty (or CCP in the case of a centrally cleared swap) to the contract if a credit event by a third party, such as a U.S. or foreign corporate issuer or sovereign issuer, on the debt obligation occurs. In return, the Portfolio pays the counterparty a periodic stream of payments over the term of the contract provided that no credit event has occurred. If no credit event occurs, the Portfolio would have spent the stream of payments and received no proceeds from the contract. When the Portfolio is the seller of a credit default swap contract, it receives the stream of payments, but is obligated to pay to the buyer of the protection an amount up to the notional amount of the swap and in certain instances take delivery of securities of the reference entity upon the occurrence of a credit event, as defined under the terms of that particular swap agreement. Credit events are contract specific but may include bankruptcy, failure to pay, restructuring, obligation acceleration and repudiation/moratorium. If the Portfolio is a seller of protection and a credit event occurs, the maximum potential amount of future payments that the
Global Opportunities Portfolio
October 31, 2023
Notes to Consolidated Financial Statements — continued
Portfolio could be required to make would be an amount equal to the notional amount of the agreement. This potential amount would be partially offset by any recovery value of the respective referenced obligation, or net amount received from the settlement of a buy protection credit default swap agreement entered into by the Portfolio for the same referenced obligation. As the seller, the Portfolio may create economic leverage to its portfolio because, in addition to its total net assets, the Portfolio is subject to investment exposure on the notional amount of the swap. The interest fee paid or received on the swap contract, which is based on a specified interest rate on a fixed notional amount, is accrued daily as a component of unrealized appreciation (depreciation) and is recorded as realized gain upon receipt or realized loss upon payment. The Portfolio also records an increase or decrease to unrealized appreciation (depreciation) in an amount equal to the daily valuation. For centrally cleared swaps, the daily change in valuation is recorded as a receivable or payable for variation margin and settled in cash with the CCP daily. All upfront payments and receipts, if any, are amortized over the life of the swap contract as realized gains or losses. Those upfront payments or receipts for non-centrally cleared swaps are recorded as other assets or other liabilities, respectively, net of amortization. For financial reporting purposes, unamortized upfront payments or receipts, if any, are netted with unrealized appreciation or depreciation on swap contracts to determine the market value of swaps as presented in Notes 6 and 9. These transactions involve certain risks, including the risk that the seller may be unable to fulfill the transaction. In the case of centrally cleared swaps, counterparty risk is minimal due to protections provided by the CCP.
O Swaptions—A purchased swaption contract grants the Portfolio, in return for payment of the purchase price, the right, but not the obligation, to enter into a new swap agreement or to shorten, extend, cancel or otherwise modify an existing swap agreement, at some designated future time on specified terms. When the Portfolio purchases a swaption, the premium paid to the writer is recorded as an investment and subsequently marked-to-market to reflect the current value of the swaption. A written swaption gives the Portfolio the obligation, if exercised by the purchaser, to enter into a swap contract according to the terms of the underlying agreement. When the Portfolio writes a swaption, the premium received by the Portfolio is recorded as a liability and subsequently marked-to-market to reflect the current value of the swaption. When a swaption is exercised, the cost of the swap is adjusted by the amount of the premium paid or received. When a swaption expires or an unexercised swaption is closed, a gain or loss is recognized in the amount of the premium paid or received, plus the cost to close. The Portfolio’s risk for purchased swaptions is limited to the premium paid. The writer of a swaption bears the risk of unfavorable changes in the preset terms of the underlying swap contract. Purchased swaptions traded over-the-counter involve risk that the issuer or counterparty will fail to perform its contractual obligations.
P When-Issued Securities and Delayed Delivery Transactions—The Portfolio may purchase securities on a delayed delivery, when-issued or forward commitment basis, including TBA (To Be Announced) securities. Payment and delivery may take place after the customary settlement period for that security. At the time the transaction is negotiated, the price of the security that will be delivered is fixed. Securities purchased on a delayed delivery, when-issued or forward commitment basis are marked-to-market daily and begin earning interest on settlement date. Such security purchases are subject to the risk that when delivered they will be worth less than the agreed upon payment price. Losses may also arise if the counterparty does not perform under the contract. A forward purchase commitment may also be closed by entering into an offsetting commitment. If an offsetting commitment is entered into, the Portfolio will realize a gain or loss on investments based on the price established when the Portfolio entered into the commitment.
Q Repurchase Agreements—A repurchase agreement is the purchase by the Portfolio of securities from a counterparty in exchange for cash that is coupled with an agreement to resell those securities to the counterparty at a specified date and price. When a repurchase agreement is entered, the Portfolio typically receives securities with a value that equals or exceeds the repurchase price, including any accrued interest earned on the agreement. The value of such securities will be marked-to-market daily, and cash or additional securities will be exchanged between the parties as needed. Except in the case of a repurchase agreement entered to settle a short sale, the value of the securities delivered to the Portfolio will be at least equal to 90% of the repurchase price during the term of the repurchase agreement. The terms of a repurchase agreement entered to settle a short sale may provide that the cash purchase price paid by the Portfolio is more than the value of purchased securities that effectively collateralize the repurchase price payable by the counterparty. In the event of insolvency of the counterparty to a repurchase agreement, recovery of the repurchase price owed to the Portfolio may be delayed. Such an insolvency also may result in a loss to the extent that the value of the purchased securities decreases during the delay or that value has otherwise not been maintained at an amount at least equal to the repurchase price.
R Reverse Repurchase Agreements—Under a reverse repurchase agreement, the Portfolio temporarily transfers possession of a portfolio security to another party, such as a bank or broker/dealer, in return for cash. At the same time, the Portfolio agrees to repurchase the security at an agreed upon time and price, which reflects an interest payment. In periods of increased demand for a security, the Portfolio may receive a payment from the counterparty for the use of the security, which is recorded as interest income. Because the Portfolio retains effective control over the transferred security, the transaction is accounted for as a secured borrowing. The Portfolio may enter into such agreements when it believes it is able to invest the cash acquired at a rate higher than the cost of the agreement, which would increase earned income. When the Portfolio enters into a reverse repurchase agreement, any fluctuations in the market value of either the securities transferred to another party or the securities in which the proceeds may be invested would affect the market value of the Portfolio’s assets. Because reverse repurchase agreements may be considered to be the practical equivalent of borrowing funds (and the counterparty making a loan), they constitute a form of leverage. The Portfolio segregates cash or liquid assets equal to its obligation to repurchase the security. During the term of the agreement, the Portfolio may also be obligated to pledge additional cash and/or securities in the event of a decline in the fair value of the transferred security. In the event the counterparty to a reverse repurchase agreement becomes insolvent, recovery of the security transferred by the Portfolio may be delayed or the Portfolio may incur a loss equal to the amount by which the value of the security transferred by the Portfolio exceeds the repurchase price payable by the Portfolio.
Global Opportunities Portfolio
October 31, 2023
Notes to Consolidated Financial Statements — continued
S Securities Sold Short—A short sale is a transaction in which the Portfolio sells a security it does not own in anticipation of a decline in the market value of that security. To complete such a transaction, the Portfolio must borrow the security to make delivery to the buyer with an obligation to replace such borrowed security at a later date. Until the security is replaced, the Portfolio is required to repay the lender any dividends or interest, which accrue during the period of the loan. The proceeds received from a short sale are recorded as a liability and the Portfolio records an unrealized gain or loss to the extent of the difference between the proceeds received and the value of the open short position on the day of determination. A gain, limited to the price at which the Portfolio sold the security short, or a loss, potentially unlimited as there is no upward limit on the price of a security, is recorded when the short position is terminated. Interest and dividends payable on securities sold short are recorded as an expense.
T Forward Sale Commitments—The Portfolio may enter into forward sale commitments to sell generic U.S. government agency mortgage-backed securities to hedge its portfolio positions and/or to enhance return. The proceeds to be received from the forward sale commitment are recorded as an asset and a corresponding liability, which is subsequently valued at approximately the current market value of the underlying security in accordance with the Portfolio's policies on investment valuations discussed above. The Portfolio records an unrealized gain or loss on investments to the extent of the difference between the proceeds to be received and the value of the open forward sale commitment on the day of determination. If the forward sale commitment is closed through the acquisition of an offsetting purchase commitment or the delivery of securities, the Portfolio realizes a gain or loss on investments based on the price established when the Portfolio entered into the commitment. If the Portfolio enters into a forward sale commitment for the delivery of a security that it does not own or has the right to obtain, it is subject to the risk of loss if the purchase price to settle the commitment is higher than the price at which it was sold.
U Stripped Mortgage-Backed Securities—The Portfolio may invest in Interest Only (IO) and Principal Only (PO) securities, forms of stripped mortgage-
backed securities, whereby the IO security receives all the interest and the PO security receives all the principal on a pool of mortgage assets. The yield to maturity on an IO security is extremely sensitive to the rate of principal payments (including prepayments) on the related underlying mortgage assets, and a rapid rate of principal payments may have a material adverse effect on the yield to maturity from these securities. If the underlying mortgages experience greater than anticipated prepayments of principal, the Portfolio may fail to recoup its initial investment in an IO security. The market value of IO and PO securities can be unusually volatile due to changes in interest rates.
2 Investment Adviser Fee and Other Transactions with Affiliates
The investment adviser fee is earned by Boston Management and Research (BMR), an indirect, wholly-owned subsidiary of Morgan Stanley, as compensation for investment advisory services rendered to the Portfolio and the Subsidiary. The Portfolio and Subsidiary each pay BMR a fee computed at an annual rate as a percentage of its respective average daily net assets as follows and is payable monthly:
| Average Daily Net Assets | Annual Fee Rate |
| Up to $500 million | 0.615% |
| $500 million but less than $1 billion | 0.595% |
| $1 billion but less than $1.5 billion | 0.575% |
| $1.5 billion but less than $2 billion | 0.555% |
| $2 billion but less than $3 billion | 0.520% |
| $3 billion and over | 0.490% |
In determining the investment adviser fee for the Portfolio and Subsidiary, the applicable advisory fee rate is based on the average daily net assets of the Portfolio (inclusive of its interest in the Subsidiary). Such fee rate is then assessed separately on the Portfolio’s average daily net assets (exclusive of its interest in the Subsidiary) and the Subsidiary’s average daily net assets to determine the amount of the investment adviser fee. For the year ended October 31, 2023, the Portfolio’s investment adviser fee amounted to $14,181,631 or 0.57% of the Portfolio's consolidated average daily net assets.
The Portfolio may invest in a money market fund, the Institutional Class of the Morgan Stanley Institutional Liquidity Funds - Government Portfolio (the “Liquidity Fund”), an open-end management investment company managed by Morgan Stanley Investment Management Inc., a wholly-owned subsidiary of Morgan Stanley. The investment adviser fee paid by the Portfolio is reduced by an amount equal to its pro rata share of the advisory and administration fees paid by the Portfolio due to its investment in the Liquidity Fund. For the year ended October 31, 2023, the investment adviser fee paid was reduced by $529,551 relating to the Portfolio's investment in the Liquidity Fund.
Trustees and officers of the Portfolio who are members of BMR’s organization receive remuneration for their services to the Portfolio out of the investment adviser fee. Trustees of the Portfolio who are not affiliated with the investment adviser may elect to defer receipt of all or a percentage of their annual fees in accordance with the terms of the Trustees Deferred Compensation Plan. Certain officers and Trustees of the Portfolio are officers of the above organization.
Global Opportunities Portfolio
October 31, 2023
Notes to Consolidated Financial Statements — continued
3 Purchases and Sales of Investments
Purchases and sales of investments, other than short-term obligations and including maturities, paydowns, principal repayments on Senior Loans, TBA transactions and securities sold short, for the year ended October 31, 2023 were as follows:
| | Purchases | Sales |
| Investments (non-U.S. Government) | $ 1,021,816,636 | $ 784,344,863 |
| U.S. Government and Agency Securities | 12,520,086,143 | 11,718,824,697 |
| | $13,541,902,779 | $12,503,169,560 |
4 Federal Income Tax Basis of Investments
The cost and unrealized appreciation (depreciation) of investments of the Portfolio, including open derivative contracts and the Portfolio's investment in the Subsidiary at October 31, 2023, as determined on a federal income tax basis, were as follows:
| Aggregate cost | $3,614,172,737 |
| Gross unrealized appreciation | $ 100,559,091 |
| Gross unrealized depreciation | (376,013,022) |
| Net unrealized depreciation | $ (275,453,931) |
5 Restricted Securities
At October 31, 2023, the Portfolio owned the following securities (representing 1.0% of net assets) which were restricted as to public resale and not registered under the Securities Act of 1933 (excluding Rule 144A securities). The Portfolio has various registration rights (exercisable under a variety of circumstances) with respect to these securities. The value of these securities is determined based on valuations provided by brokers when available, or if not available, they are valued at fair value using methods determined in good faith by or at the direction of the Trustees’ valuation designee.
| Description | Date(s) of
Acquisition | Shares | Cost | Value |
| Reinsurance Side Cars | | | | |
| Mt. Logan Re, Ltd., Series 13, Preference Shares | 1/2/18 | 10,000 | $ 6,658,283 | $ 15,003,196 |
| Mt. Logan Re, Ltd., Series 17, Preference Shares | 1/26/21 | 860 | 572,931 | 1,273,313 |
| Sussex Capital, Ltd., Designated Investment Series 5, 5/19 | 5/31/19 | 249 | 212,150 | 13,934 |
| Sussex Capital, Ltd., Designated Investment Series 5, 12/19 | 1/17/20 | 791 | 673,953 | 43,067 |
| Sussex Capital, Ltd., Designated Investment Series 5, 6/20 | 6/30/20 | 434 | 64,320 | 40,363 |
| Sussex Capital, Ltd., Designated Investment Series 5, 4/21 | 4/1/21 | 247 | 195,858 | 9,833 |
| Sussex Capital, Ltd., Designated Investment Series 5, 12/21 | 1/24/22 | 958 | 952,280 | 17,860 |
| Sussex Capital, Ltd., Designated Investment Series 5, 11/22 | 3/11/22 | 958 | 956,716 | 530,701 |
| Sussex Capital, Ltd., Designated Investment Series 15, 12/21 | 1/24/22 | 743 | 738,092 | 13,843 |
| Sussex Capital, Ltd., Designated Investment Series 15, 11/22 | 3/11/22 | 721 | 720,077 | 399,431 |
| Sussex Capital, Ltd., Series 5, Preference Shares | 12/17/18 | 6,000 | 2,654,676 | 7,276,256 |
| Sussex Capital, Ltd., Series 15, Preference Shares | 6/1/21 | 5,000 | 3,541,830 | 5,483,188 |
| Sussex Re, Ltd., Series 2020A | 1/21/20 | 4,081,939 | 0 | 154,705 |
| Sussex Re, Ltd., Series 2021A | 1/14/21 | 4,154,232 | 0 | 316,137 |
| Total Restricted Securities | | | $17,941,166 | $30,575,827 |
Global Opportunities Portfolio
October 31, 2023
Notes to Consolidated Financial Statements — continued
6 Financial Instruments
The Portfolio may trade in financial instruments with off-balance sheet risk in the normal course of its investing activities. These financial instruments may include written swaptions, forward foreign currency exchange contracts, non-deliverable bond forward contracts, futures contracts and swap contracts and may involve, to a varying degree, elements of risk in excess of the amounts recognized for financial statement purposes. The notional or contractual amounts of these instruments represent the investment the Portfolio has in particular classes of financial instruments and do not necessarily represent the amounts potentially subject to risk. The measurement of the risks associated with these instruments is meaningful only when all related and offsetting transactions are considered. A summary of obligations under these financial instruments at October 31, 2023 is included in the Consolidated Portfolio of Investments. At October 31, 2023, the Portfolio had sufficient cash and/or securities to cover commitments under these contracts.
In the normal course of pursuing its investment objective, the Portfolio is subject to the following risks:
Credit Risk: During the year ended October 31, 2023, the Portfolio entered into credit default swaps and swaptions to manage certain investment risks and/or to enhance total return or as a substitute for the purchase or sale of securities.
Foreign Exchange Risk: The Portfolio engages in forward foreign currency exchange contracts and cross-currency swaps to enhance total return, to seek to hedge against fluctuations in currency exchange rates and/or as a substitute for the purchase or sale of securities or currencies.
Interest Rate Risk: During the year ended October 31, 2023, the Portfolio utilized various interest rate derivatives including non-deliverable bond forward contracts, interest rate futures contracts, interest rate swaps and swaptions, inflation swaps and cross-currency swaps to enhance total return, to seek to hedge against fluctuations in interest rates and/or to change the effective duration of its portfolio.
The Portfolio enters into over-the-counter (OTC) derivatives that may contain provisions whereby the counterparty may terminate the contract under certain conditions, including but not limited to a decline in the Portfolio’s net assets below a certain level over a certain period of time, which would trigger a payment by the Portfolio for those derivatives in a liability position. At October 31, 2023, the fair value of derivatives with credit-related contingent features in a net liability position was $7,874,204. The aggregate fair value of assets pledged as collateral by the Portfolio for such liability was $8,273,732 at October 31, 2023.
The OTC derivatives in which the Portfolio invests (except for written swaptions as the Portfolio, not the counterparty, is obligated to perform) are subject to the risk that the counterparty to the contract fails to perform its obligations under the contract. To mitigate this risk, the Portfolio (and Subsidiary) has entered into an International Swaps and Derivatives Association, Inc. Master Agreement (“ISDA Master Agreement”) or similar agreement with substantially all its derivative counterparties. An ISDA Master Agreement is a bilateral agreement between the Portfolio and a counterparty that governs certain OTC derivatives and typically contains, among other things, set-off provisions in the event of a default and/or termination event as defined under the relevant ISDA Master Agreement. Under an ISDA Master Agreement, the Portfolio (and Subsidiary) may, under certain circumstances, offset with the counterparty certain derivative financial instruments’ payables and/or receivables with collateral held and/or posted and create one single net payment. The provisions of the ISDA Master Agreement typically permit a single net payment in the event of default including the bankruptcy or insolvency of the counterparty. However, bankruptcy or insolvency laws of a particular jurisdiction may impose restrictions on or prohibitions against the right of offset in bankruptcy or insolvency. Certain ISDA Master Agreements allow counterparties to OTC derivatives to terminate derivative contracts prior to maturity in the event the Portfolio’s net assets decline by a stated percentage or the Portfolio fails to meet the terms of its ISDA Master Agreements, which would cause the counterparty to accelerate payment by the Portfolio of any net liability owed to it.
The collateral requirements for derivatives traded under an ISDA Master Agreement are governed by a Credit Support Annex to the ISDA Master Agreement. Collateral requirements are determined at the close of business each day and are typically based on changes in market values for each transaction under an ISDA Master Agreement and netted into one amount for such agreement. Generally, the amount of collateral due from or to a counterparty is subject to a minimum transfer threshold amount before a transfer is required, which may vary by counterparty. Collateral pledged for the benefit of the Portfolio (and Subsidiary) and/or counterparty is held in segregated accounts by the Portfolio’s custodian and cannot be sold, re-pledged, assigned or otherwise used while pledged. The portion of such collateral representing cash, if any, is reflected as deposits for derivatives collateral and, in the case of cash pledged by a counterparty for the benefit of the Portfolio, a corresponding liability on the Consolidated Statement of Assets and Liabilities. Securities pledged by the Portfolio as collateral, if any, are identified as such in the Consolidated Portfolio of Investments. The carrying amount of the liability for cash collateral due to brokers at October 31, 2023 approximated its fair value. If measured at fair value, such liability would have been considered as Level 2 in the fair value hierarchy (see Note 10) at October 31, 2023. Because the Subsidiary is not registered under the 1940 Act, it may not be able to negotiate terms with its counterparties that are equivalent to those a registered portfolio may negotiate. As a result, the Subsidiary may have greater exposure to those counterparties than a registered portfolio.
Global Opportunities Portfolio
October 31, 2023
Notes to Consolidated Financial Statements — continued
The fair value of open derivative instruments (not considered to be hedging instruments for accounting disclosure purposes) by risk exposure at October 31, 2023 was as follows:
| | Fair Value |
| Consolidated Statement of Assets and Liabilities Caption | Credit | Foreign
Exchange | Interest
Rate | Total |
| Not applicable | $ 652,162* | $ 2,187,835* | $ 39,046,942* | $ 41,886,939 |
| Receivable for open forward foreign currency exchange contracts | — | 4,999,810 | — | 4,999,810 |
| Receivable/Payable for open swap contracts; Upfront payments/receipts on open non-centrally cleared swap contracts | — | — | 3,343,029 | 3,343,029 |
| Total Asset Derivatives | $ 652,162 | $ 7,187,645 | $ 42,389,971 | $ 50,229,778 |
| Derivatives not subject to master netting or similar agreements | $ 652,162 | $ 2,187,835 | $ 39,046,942 | $ 41,886,939 |
| Total Asset Derivatives subject to master netting or similar agreements | $ — | $ 4,999,810 | $ 3,343,029 | $ 8,342,839 |
| Not applicable | $ (356,159)* | $ (27,684)* | $ (42,292,674)* | $ (42,676,517) |
| Payable for open forward foreign currency exchange contracts | — | (7,534,243) | — | (7,534,243) |
| Payable for open swap contracts | — | — | (339,961) | (339,961) |
| Total Liability Derivatives | $(356,159) | $(7,561,927) | $(42,632,635) | $(50,550,721) |
| Derivatives not subject to master netting or similar agreements | $(356,159) | $ (27,684) | $(42,292,674) | $(42,676,517) |
| Total Liability Derivatives subject to master netting or similar agreements | $ — | $(7,534,243) | $ (339,961) | $ (7,874,204) |
| * | Only the current day’s variation margin on open futures contracts and centrally cleared derivatives is reported within the Consolidated Statement of Assets and Liabilities as Receivable or Payable for variation margin on open futures contracts and centrally cleared derivatives, as applicable. |
The Portfolio's derivative assets and liabilities at fair value by risk, which are reported gross in the Consolidated Statement of Assets and Liabilities, are presented in the table above. The following tables present the Portfolio's derivative assets and liabilities by counterparty, net of amounts available for offset under a master netting agreement and net of the related collateral received by the Portfolio (and Subsidiary) for such assets and pledged by the Portfolio (and Subsidiary) for such liabilities as of October 31, 2023.
| Counterparty | Derivative
Assets Subject to
Master Netting
Agreement | Derivatives
Available
for Offset | Non-cash
Collateral
Received(a) | Cash
Collateral
Received(a) | Net Amount
of Derivative
Assets(b) | Total Cash
Collateral
Received |
| Bank of America, N.A. | $ 2,527,646 | $ — | $ — | $ (2,527,646) | $ — | $ 2,600,000 |
| Barclays Bank PLC | 815,780 | — | — | (810,000) | 5,780 | 810,000 |
| BNP Paribas | 2,516,800 | (1,065,889) | — | (1,450,911) | — | 1,519,900 |
| Goldman Sachs International | 38,680 | (38,680) | — | — | — | — |
| HSBC Bank USA, N.A. | 160,074 | (160,074) | — | — | — | — |
| JPMorgan Chase Bank, N.A. | 253,265 | (253,265) | — | — | — | — |
| Standard Chartered Bank | 206,412 | (206,412) | — | — | — | — |
| State Street Bank and Trust Company | 233,565 | (42,260) | (191,305) | — | — | — |
| UBS AG | 1,590,617 | (1,148,713) | (441,904) | — | — | — |
| | $8,342,839 | $(2,915,293) | $(633,209) | $(4,788,557) | $5,780 | $4,929,900 |
Global Opportunities Portfolio
October 31, 2023
Notes to Consolidated Financial Statements — continued
| Counterparty | Derivative
Liabilities Subject to
Master Netting
Agreement | Derivatives
Available
for Offset | Non-cash
Collateral
Pledged(a) | Cash
Collateral
Pledged(a) | Net Amount
of Derivative
Liabilities(c) | Total Cash
Collateral
Pledged |
| BNP Paribas | $ (1,065,889) | $ 1,065,889 | $ — | $ — | $ — | $ — |
| Citibank, N.A. | (1,360,520) | — | 1,360,520 | — | — | — |
| Goldman Sachs International | (1,291,492) | 38,680 | 870,280 | — | (382,532) | — |
| HSBC Bank USA, N.A. | (900,303) | 160,074 | 393,319 | — | (346,910) | — |
| JPMorgan Chase Bank, N.A. | (332,718) | 253,265 | 79,453 | — | — | — |
| Standard Chartered Bank | (1,732,309) | 206,412 | 1,525,897 | — | — | — |
| State Street Bank and Trust Company | (42,260) | 42,260 | — | — | — | — |
| UBS AG | (1,148,713) | 1,148,713 | — | — | — | — |
| | $(7,874,204) | $2,915,293 | $4,229,469 | $ — | $(729,442) | $ — |
| Total — Deposits for derivatives collateral — OTC derivatives | | | | $4,929,900 |
| (a) | In some instances, the total collateral received and/or pledged may be more than the amount shown due to overcollateralization. |
| (b) | Net amount represents the net amount due from the counterparty in the event of default. |
| (c) | Net amount represents the net amount payable to the counterparty in the event of default. |
The effect of derivative instruments (not considered to be hedging instruments for accounting disclosure purposes) on the Consolidated Statement of Operations by risk exposure for the year ended October 31, 2023 was as follows:
| Consolidated Statement of Operations Caption | Credit | Foreign
Exchange | Interest
Rate | Total |
| Net realized gain (loss): | | | | |
| Investment transactions | $ (2,294,655) | $ — | $ — | $ (2,294,655) |
| Written swaptions | — | — | 1,597,840 | 1,597,840 |
| Futures contracts | — | — | 4,508,428 | 4,508,428 |
| Swap contracts | (3,001,827) | — | (7,063,487) | (10,065,314) |
| Forward foreign currency exchange contracts | — | (43,092,295) | — | (43,092,295) |
| Non-deliverable bond forward contracts | — | — | 802,180 | 802,180 |
| Total | $(5,296,482) | $(43,092,295) | $ (155,039) | $(48,543,816) |
| Change in unrealized appreciation (depreciation): | | | | |
| Written swaptions | $ — | $ — | $ 4,716,973 | $ 4,716,973 |
| Futures contracts | — | — | (25,360,054) | (25,360,054) |
| Swap contracts | 666,954 | — | (12,866,799) | (12,199,845) |
| Forward foreign currency exchange contracts | — | (19,352,596) | — | (19,352,596) |
| Non-deliverable bond forward contracts | — | — | (118,298) | (118,298) |
| Total | $ 666,954 | $(19,352,596) | $(33,628,178) | $(52,313,820) |
Global Opportunities Portfolio
October 31, 2023
Notes to Consolidated Financial Statements — continued
The average notional cost of futures contracts and average notional amounts of other derivative contracts outstanding during the year ended October 31, 2023, which are indicative of the volume of these derivative types, were approximately as follows:
Futures
Contracts — Long | Futures
Contracts — Short | Forward
Foreign Currency
Exchange Contracts* | Non-Deliverable
Bond Forward
Contracts | Purchased
Swaptions |
| $241,520,000 | $451,575,000 | $805,271,000 | $5,767,000 | $58,962,000 |
Written
Swaptions | Swap
Contracts |
| $46,838,000 | $1,039,501,000 |
| * | The average notional amount for forward foreign currency exchange contracts is based on the absolute value of notional amounts of currency purchased and currency sold. |
7 Line of Credit
The Portfolio participates with other portfolios and funds managed by BMR and its affiliates in a $650 million unsecured revolving line of credit agreement with a group of banks, which is in effect through October 22, 2024. In connection with the renewal of the agreement on October 24, 2023, the borrowing limit was decreased from $725 million. Borrowings are made by the Portfolio solely for temporary purposes related to redemptions and other short-term cash needs. Interest is charged to the Portfolio based on its borrowings at an amount above either the Secured Overnight Financing Rate (SOFR) or Federal Funds rate. In addition, a fee computed at an annual rate of 0.15% on the daily unused portion of the line of credit is allocated among the participating portfolios and funds at the end of each quarter. In connection with the renewal of the agreement in October 2023, an arrangement fee totaling $150,000 was incurred that was allocated to the participating portfolios and funds. Because the line of credit is not available exclusively to the Portfolio, it may be unable to borrow some or all of its requested amounts at any particular time. The Portfolio did not have any significant borrowings or allocated fees during the year ended October 31, 2023.
8 Reverse Repurchase Agreements
Reverse repurchase agreements outstanding as of October 31, 2023 were as follows:
| Counterparty | Trade
Date | Maturity
Date | Interest
Rate Paid
(Received) | Principal
Amount | Value
Including
Accrued
Interest |
| Barclays Bank PLC | 9/29/23 | On Demand(1) | 5.65% | $ 21,055,980 | $ 21,147,242 |
| Barclays Bank PLC | 10/16/23 | On Demand(1) | 5.65 | 23,391,675 | 23,438,747 |
| Total | | | | $44,447,655 | $44,585,989 |
| (1) | Open reverse repurchase agreement with no specific maturity date. Either party may terminate the agreement upon demand. |
At October 31, 2023, the type of securities pledged as collateral for all open reverse repurchase agreements was Sovereign Government Bonds.
For the year ended October 31, 2023, the average borrowings under settled reverse repurchase agreements and the average interest rate paid were approximately $2,482,000 and 5.65%, respectively. Based on the short-term nature of the borrowings under the reverse repurchase agreements, the carrying value of the payable for reverse repurchase agreements approximated its fair value at October 31, 2023. If measured at fair value, borrowings under the reverse repurchase agreements would have been considered as Level 2 in the fair value hierarchy (see Note 10) at October 31, 2023.
Reverse repurchase agreements entered into by the Portfolio are subject to Master Repurchase Agreements (MRA), which permit the Portfolio, under certain circumstances, including an event of default (such as bankruptcy or insolvency), to offset payables and/or receivables under the MRA with collateral held and/or posted to the counterparty and create one single net payment due to or from the Portfolio.
Global Opportunities Portfolio
October 31, 2023
Notes to Consolidated Financial Statements — continued
The following tables present the Portfolio’s repurchase and reverse repurchase agreements net of amounts available for offset under an MRA and net of the related collateral received and/or pledged by the Portfolio as of October 31, 2023.
| Counterparty | Repurchase
Agreements | Liabilities
Available for
Offset | Securities
Collateral
Received(a) | Net
Amount(b) |
| Bank of America, N.A. | $ 2,730,000 | $ — | $ (2,725,516) | $ 4,484 |
| Barclays Bank PLC | 33,839,593 | (33,839,593) | — | — |
| JPMorgan Chase Bank, N.A. | 2,836,377 | — | (2,812,832) | 23,545 |
| Nomura International PLC | 2,004,555 | — | (1,832,831) | 171,724 |
| | $41,410,525 | $(33,839,593) | $(7,371,179) | $199,753 |
| Counterparty | Reverse
Repurchase
Agreements* | Assets
Available for
Offset | Securities
Collateral
Pledged(a) | Net
Amount(c) |
| Barclays Bank PLC | $(44,585,989) | $33,839,593 | $10,746,396 | $ — |
| * | Including accrued interest. |
| (a) | In some instances, the total collateral received and/or pledged may be more than the amount shown due to overcollateralization. |
| (b) | Net amount represents the net amount receivable from the counterparty in the event of default. |
| (c) | Net amount represents the net amount payable to the counterparty in the event of default. |
9 Affiliated Investments
At October 31, 2023, the value of the Portfolio's investment in issuers and funds that may be deemed to be affiliated was $422,234,524, which represents 14.1% of the Portfolio's net assets. Transactions in such investments by the Portfolio for the year ended October 31, 2023 were as follows:
| Name | Value,
beginning
of period | Purchases | Sales
proceeds | Net
realized
gain (loss) | Change in
unrealized
appreciation
(depreciation) | Value, end
of period | Interest/
Dividend
income | Principal
amount/
Shares, end
of period |
| Commercial Mortgage-Backed Securities | | | | | | | | |
| Morgan Stanley Bank of America Merrill Lynch Trust, Series 2013-C11, Class D, 4.326%, 8/15/46 | $ 368,705 | $ — | $ — | $ (4,825,194) | $ 4,456,489 | $ — | $ — | $ — |
| Short-Term Investments |
| Liquidity Fund | 459,889,537 | 2,470,443,671 | (2,508,098,684) | — | — | 422,234,524 | 16,883,998 | 422,234,524 |
| Total | | | | $(4,825,194) | $4,456,489 | $422,234,524 | $16,883,998 | |
10 Fair Value Measurements
Under generally accepted accounting principles for fair value measurements, a three-tier hierarchy to prioritize the assumptions, referred to as inputs, is used in valuation techniques to measure fair value. The three-tier hierarchy of inputs is summarized in the three broad levels listed below.
| • | Level 1 – quoted prices in active markets for identical investments |
| • | Level 2 – other significant observable inputs (including quoted prices for similar investments, interest rates, prepayment speeds, credit risk, etc.) |
| • | Level 3 – significant unobservable inputs (including a fund's own assumptions in determining the fair value of investments) |
Global Opportunities Portfolio
October 31, 2023
Notes to Consolidated Financial Statements — continued
In cases where the inputs used to measure fair value fall in different levels of the fair value hierarchy, the level disclosed is determined based on the lowest level input that is significant to the fair value measurement in its entirety. The inputs or methodology used for valuing securities are not necessarily an indication of the risk associated with investing in those securities.
At October 31, 2023, the hierarchy of inputs used in valuing the Portfolio’s investments and open derivative instruments, which are carried at fair value, were as follows:
| Asset Description | Level 1 | Level 2 | Level 3 | Total |
| Asset-Backed Securities | $ — | $ 266,889,511 | $ — | $ 266,889,511 |
| Closed-End Funds | 89,515,701 | — | — | 89,515,701 |
| Collateralized Mortgage Obligations | — | 776,076,837 | — | 776,076,837 |
| Commercial Mortgage-Backed Securities | — | 20,366,935 | — | 20,366,935 |
| Common Stocks | 1,445,015 | 4,854,627* | — | 6,299,642 |
| Convertible Bonds | — | 57,109,962 | — | 57,109,962 |
| Convertible Preferred Stocks | 1,313,156 | — | — | 1,313,156 |
| Foreign Corporate Bonds | — | 166,490,586 | 0 | 166,490,586 |
| Loan Participation Notes | — | — | 15,902,788 | 15,902,788 |
| Reinsurance Side Cars | — | — | 63,870,436 | 63,870,436 |
| Sovereign Government Bonds | — | 280,515,958 | — | 280,515,958 |
| Sovereign Loans | — | 228,074 | — | 228,074 |
| U.S. Department of Agriculture Loans | — | 41,944,110 | — | 41,944,110 |
| U.S. Government Agency Commercial Mortgage-Backed Securities | — | 13,564,077 | — | 13,564,077 |
| U.S. Government Agency Mortgage-Backed Securities | — | 963,987,265 | — | 963,987,265 |
| U.S. Government Guaranteed Small Business Administration Loans | — | 13,442,749 | — | 13,442,749 |
| U.S. Treasury Obligations | — | 9,987,786 | — | 9,987,786 |
| Miscellaneous | — | — | 0 | 0 |
| Short-Term Investments: | | | | |
| Affiliated Fund | 422,234,524 | — | — | 422,234,524 |
| Repurchase Agreements | — | 41,410,525 | — | 41,410,525 |
| Sovereign Government Securities | — | 120,919,683 | — | 120,919,683 |
| U.S. Treasury Obligations | — | 56,657,779 | — | 56,657,779 |
| Total Investments | $ 514,508,396 | $ 2,834,446,464 | $ 79,773,224 | $ 3,428,728,084 |
| Forward Foreign Currency Exchange Contracts | $ — | $ 7,187,645 | $ — | $ 7,187,645 |
| Futures Contracts | 11,885,278 | — | — | 11,885,278 |
| Swap Contracts | — | 31,156,855 | — | 31,156,855 |
| Total | $ 526,393,674 | $ 2,872,790,964 | $ 79,773,224 | $ 3,478,957,862 |
| Liability Description | | | | |
| TBA Sale Commitments | $ — | $ (44,687,500) | $ — | $ (44,687,500) |
| Securities Sold Short | — | (36,045,378) | — | (36,045,378) |
| Forward Foreign Currency Exchange Contracts | — | (7,561,927) | — | (7,561,927) |
| Futures Contracts | (4,976,221) | — | — | (4,976,221) |
| Swap Contracts | — | (38,012,573) | — | (38,012,573) |
| Total | $ (4,976,221) | $ (126,307,378) | $ — | $ (131,283,599) |
| * | Includes foreign equity securities whose values were adjusted to reflect market trading of comparable securities or other correlated instruments that occurred after the close of trading in their applicable foreign markets. |
Global Opportunities Portfolio
October 31, 2023
Notes to Consolidated Financial Statements — continued
The following is a reconciliation of Level 3 investments for which significant unobservable inputs were used to determine fair value:
| | Foreign
Corporate
Bonds | Loan
Participation
Notes | Reinsurance
Side Cars* | Sovereign
Government
Bonds | Sovereign
Government
Securities | Total |
| Balance as of October 31, 2022 | $ 680,180 | $ 410,149 | $ 36,781,743 | $ 4,853,497 | $ 403,306 | $ 43,128,875 |
| Realized gains (losses) | — | (59,437) | (1,607,239) | — | — | (1,666,676) |
| Change in net unrealized appreciation (depreciation) | (11,430) | (1,012,600) | 14,472,178 | — | — | 13,448,148 |
| Cost of purchases | — | 16,856,793 | 30,167,165 | — | — | 47,023,958 |
| Proceeds from sales, including return of capital | (668,750) | (401,329) | (15,943,411) | — | — | (17,013,490) |
| Accrued discount (premium) | — | 109,212 | — | — | — | 109,212 |
| Transfers to Level 3 | — | — | — | — | — | — |
| Transfers from Level 3(1) | — | — | — | (4,853,497) | (403,306) | (5,256,803) |
| Balance as of October 31, 2023 | $ 0 | $15,902,788 | $ 63,870,436 | $ — | $ — | $ 79,773,224 |
| Change in net unrealized appreciation (depreciation) on investments still held as of October 31, 2023 | $ — | $ (1,063,217) | $ 12,321,954 | $ — | $ — | $ 11,258,737 |
| * | The Portfolio’s investments in Reinsurance Side Cars were primarily valued on the basis of broker quotations. |
| (1) | Transferred from Level 3 based on the observability of valuation inputs resulting from new market activity. |
Not included in the table above are investments in securities categorized as Miscellaneous in the Portfolio of Investments which were acquired at $0 cost and valued at $0 at October 31, 2023.
The following is a summary of quantitative information about significant unobservable valuation inputs for Level 3 investments held as of October 31, 2023:
| Type of Investment | Fair Value as of
October 31, 2023 | Valuation Technique | Unobservable Input | Range of Unobservable Input | Impact to
Valuation from an
Increase to Input* |
| Foreign Corporate Bonds | $ 0 | Estimated Recovery Value | Estimated Recovery Value Percentage | 0% | Increase |
| Loan Participation Notes | 15,902,788 | Matrix Pricing | Adjusted Credit Spread to the Central Bank of Uzbekistan Quoted Policy Rate | 5.46% - 9.79%** | Decrease |
| * | Represents the directional change in the fair value of the Level 3 investments that would result from an increase to the corresponding unobservable input. A decrease to the unobservable input would have the opposite effect. |
| ** | The weighted average of the unobservable input is 5.54% based on relative principal amounts. |
11 Risks and Uncertainties
Risks Associated with Foreign Investments
Foreign investments can be adversely affected by political, economic and market developments abroad, including the imposition of economic and other sanctions by the United States or another country. There may be less publicly available information about foreign issuers because they may not be subject to reporting practices, requirements or regulations comparable to those to which United States companies are subject. Foreign markets may be smaller, less liquid and more volatile than the major markets in the United States. Trading in foreign markets typically involves higher expense than trading in the United States. The Portfolio may have difficulties enforcing its legal or contractual rights in a foreign country. Securities that trade or are denominated in currencies other than the U.S. dollar may be adversely affected by fluctuations in currency exchange rates.
Global Opportunities Portfolio
October 31, 2023
Notes to Consolidated Financial Statements — continued
Emerging market securities often involve greater risks than developed market securities. Investment markets within emerging market countries are typically smaller, less liquid, less developed and more volatile than those in more developed markets like the United States, and may be focused in certain economic sectors. The information available about an emerging market issuer may be less reliable than for comparable issuers in more developed capital markets. Governmental actions can have a significant effect on the economic conditions in emerging market countries. It may be more difficult to make a claim or obtain a judgment in the courts of these countries than it is in the United States. The possibility of fraud, negligence, undue influence being exerted by an issuer or refusal to recognize ownership exists in some emerging markets. Disruptions due to work stoppages and trading improprieties in foreign securities markets have caused such markets to close. Emerging market securities are also subject to speculative trading, which contributes to their volatility.
Economic data as reported by sovereign entities may be delayed, inaccurate or fraudulent. In the event of a default by a sovereign entity, there are typically no assets to be seized or cash flows to be attached. Furthermore, the willingness or ability of a sovereign entity to restructure defaulted debt may be limited. Therefore, losses on sovereign defaults may far exceed the losses from the default of a similarly rated U.S. debt issuer.
Global Opportunities Portfolio
October 31, 2023
Report of Independent Registered Public Accounting Firm
To the Trustees and Investors of Global Opportunities Portfolio:
Opinion on the Financial Statements and Financial Highlights
We have audited the accompanying consolidated statement of assets and liabilities of Global Opportunities Portfolio and subsidiary (the “Portfolio”), including the consolidated portfolio of investments, as of October 31, 2023, the related consolidated statement of operations for the year then ended, the consolidated statements of changes in net assets for each of the two years in the period then ended, the consolidated financial highlights for each of the five years in the period then ended, and the related notes (collectively referred to as the "financial statements and financial highlights"). In our opinion, the financial statements and financial highlights present fairly, in all material respects, the financial position of the Portfolio as of October 31, 2023, and the results of its operations for the year then ended, the changes in its net assets for each of the two years in the period then ended, and the financial highlights for each of the five years in the period then ended, in conformity with accounting principles generally accepted in the United States of America.
Basis for Opinion
These financial statements and financial highlights are the responsibility of the Portfolio’s management. Our responsibility is to express an opinion on the Portfolio’s financial statements and financial highlights based on our audits. We are a public accounting firm registered with the Public Company Accounting Oversight Board (United States) (PCAOB) and are required to be independent with respect to the Portfolio in accordance with the U.S. federal securities laws and the applicable rules and regulations of the Securities and Exchange Commission and the PCAOB.
We conducted our audits in accordance with the standards of the PCAOB. Those standards require that we plan and perform the audit to obtain reasonable assurance about whether the financial statements and financial highlights are free of material misstatement, whether due to error or fraud. The Portfolio is not required to have, nor were we engaged to perform, an audit of its internal control over financial reporting. As part of our audits, we are required to obtain an understanding of internal control over financial reporting but not for the purpose of expressing an opinion on the effectiveness of the Portfolio’s internal control over financial reporting. Accordingly, we express no such opinion.
Our audits included performing procedures to assess the risks of material misstatement of the financial statements and financial highlights, whether due to error or fraud, and performing procedures that respond to those risks. Such procedures included examining, on a test basis, evidence regarding the amounts and disclosures in the financial statements and financial highlights. Our audits also included evaluating the accounting principles used and significant estimates made by management, as well as evaluating the overall presentation of the financial statements and financial highlights. Our procedures included confirmation of securities and senior loans owned as of October 31, 2023, by correspondence with the custodian, brokers, and agent banks; when replies were not received from brokers and agent banks, we performed other auditing procedures. We believe that our audits provide a reasonable basis for our opinion.
/s/ Deloitte & Touche LLP
Boston, Massachusetts
December 22, 2023
We have served as the auditor of one or more Eaton Vance investment companies since 1959.
Eaton Vance
Short Duration Strategic Income Fund
October 31, 2023
Board of Trustees’ Contract Approval
Overview of the Contract Review Process
The Investment Company Act of 1940, as amended (the “1940 Act”), provides, in substance, that the investment advisory agreement between a fund and its investment adviser will continue in effect from year-to-year only if its continuation is approved on an annual basis by a vote of the fund’s board of trustees, including a majority of the trustees who are not “interested persons” of the fund (“independent trustees”), cast in person at a meeting called for the purpose of considering such approval.
At a meeting held on June 8, 2023, the Boards of Trustees/Directors (collectively, the “Board”) that oversee the registered investment companies advised by Eaton Vance Management or its affiliate, Boston Management and Research (the “Eaton Vance Funds”), including a majority of the independent trustees (the “Independent Trustees”), voted to approve the continuation of existing investment advisory agreements and sub-advisory agreements1 for each of the Eaton Vance Funds for an additional one-year period. The Board relied upon the affirmative recommendation of its Contract Review Committee, which is a committee exclusively comprised of Independent Trustees. Prior to making its recommendation, the Contract Review Committee reviewed information furnished by the adviser and sub-adviser to each of the Eaton Vance Funds (including information specifically requested by the Board) for a series of formal meetings held between April and June 2023, as well as certain additional information provided in response to specific requests from the Independent Trustees as members of the Contract Review Committee. Members of the Contract Review Committee also considered information received at prior meetings of the Board and its committees, to the extent such information was relevant to the Contract Review Committee’s annual evaluation of the investment advisory agreements and sub-advisory agreements.
In connection with its evaluation of the investment advisory agreements and sub-advisory agreements, the Board considered various information relating to the Eaton Vance Funds. This included information applicable to all or groups of Eaton Vance Funds, which is referenced immediately below, and information applicable to the particular Eaton Vance Fund covered by this report (each “Eaton Vance Fund” is referred to below as a “fund”). (For funds that invest through one or more underlying portfolios, references to “each fund” in this section may include information that was considered at the portfolio-level.)
Information about Fees, Performance and Expenses
• A report from an independent data provider comparing advisory and other fees paid by each fund to such fees paid by comparable funds, as identified by the independent data provider (“comparable funds”);
• A report from an independent data provider comparing each fund’s total expense ratio (and its components) to those of comparable funds;
• A report from an independent data provider comparing the investment performance of each fund (including, as relevant, total return data, income data, Sharpe ratios and information ratios) to the investment performance of comparable funds and, as applicable, benchmark indices, over various time periods;
• In certain instances, data regarding investment performance relative to customized groups of peer funds and blended indices identified by the adviser in consultation with the Portfolio Management Committee of the Board (a committee exclusively comprised of Independent Trustees);
• Comparative information concerning the fees charged and services provided by the adviser and sub-adviser to each fund in managing other accounts (which may include other mutual funds, collective investment funds and institutional accounts) using investment strategies and techniques similar to those used in managing such fund(s), if any;
• Profitability analyses with respect to the adviser and sub-adviser to each of the funds;
Information about Portfolio Management and Trading
• Descriptions of the investment management services provided to each fund, as well as each of the funds’ investment strategies and policies;
• The procedures and processes used to determine the value of fund assets, including, when necessary, the determination of “fair value” and actions taken to monitor and test the effectiveness of such procedures and processes;
• Information about the policies and practices of each fund’s adviser and sub-adviser with respect to trading, including their processes for seeking best execution of portfolio transactions;
• Information about the allocation of brokerage transactions and the benefits, if any, received by the adviser and sub-adviser to each fund as a result of brokerage allocation, including, as applicable, information concerning the acquisition of research through client commission arrangements and policies with respect to “soft dollars”;
• Data relating to the portfolio turnover rate of each fund and related information regarding active management in the context of particular strategies;
Information about each Adviser and Sub-adviser
• Reports detailing the financial results and condition of the adviser and sub-adviser to each fund;
• Information regarding the individual investment professionals whose responsibilities include portfolio management and investment research for the funds, and, for portfolio managers and certain other investment professionals, information relating to their responsibilities with respect to managing other mutual funds and investment accounts, as applicable;
1 Not all Eaton Vance Funds have entered into a sub-advisory agreement with a sub-adviser. Accordingly, references to “sub-adviser” or “sub-advisory agreement” in this “Overview” section may not be applicable to the particular Eaton Vance Fund covered by this report.
Eaton Vance
Short Duration Strategic Income Fund
October 31, 2023
Board of Trustees’ Contract Approval — continued
• Information regarding the adviser’s and its parent company’s (Morgan Stanley’s) efforts to retain and attract talented investment professionals, including in the context of a competitive marketplace for talent, as well as the ongoing unique environment presented by hybrid, remote and other alternative work arrangements;
• Information regarding the adviser’s compensation methodology for its investment professionals and the incentives and accountability it creates, along with investment professionals’ investments in the fund(s) they manage;
• The Code of Ethics of the adviser and its affiliates and the sub-adviser of each fund, together with information relating to compliance with, and the administration of, such codes;
• Policies and procedures relating to proxy voting, including regular reporting with respect to fund proxy voting activities;
• Information regarding the handling of corporate actions and class actions, as well as information regarding litigation and other regulatory matters;
• Information concerning the resources devoted to compliance efforts undertaken by the adviser and its affiliates and the sub-adviser of each fund, if any, including descriptions of their various compliance programs and their record of compliance;
• Information concerning the business continuity and disaster recovery plans of the adviser and its affiliates and the sub-adviser of each fund, if any;
• A description of Eaton Vance Management’s and Boston Management and Research’s oversight of sub-advisers, including with respect to regulatory and compliance issues, investment management and other matters;
Other Relevant Information
• Information regarding ongoing initiatives to further integrate and harmonize, where applicable, the investment management and other departments of the adviser and its affiliates with the overall investment management infrastructure of Morgan Stanley, in light of Morgan Stanley’s acquisition of Eaton Vance Corp. on March 1, 2021;
• Information concerning the nature, cost and character of the administrative and other non-investment advisory services provided by Eaton Vance Management and its affiliates;
• Information concerning oversight of the relationship with the custodian, subcustodians, fund accountants, and other third-party service providers by the adviser and/or administrator to each of the funds;
• Information concerning efforts to implement policies and procedures with respect to various recently adopted regulations applicable to the funds, including Rule 12d1-4 (the Fund-of-Funds Rule), Rule 18f-4 (the Derivatives Rule) and Rule 2a-5 (the Fair Valuation Rule);
• For an Eaton Vance Fund structured as an exchange-listed closed-end fund, information concerning the benefits of the closed-end fund structure, as well as, where relevant, the closed-end fund’s market prices (including as compared to the closed-end fund’s net asset value (NAV)), trading volume data, continued use of auction preferred shares (where applicable), distribution rates and other relevant matters;
• The risks which the adviser and/or its affiliates incur in connection with the management and operation of the funds, including, among others, litigation, regulatory, entrepreneurial, and other business risks (and the associated costs of such risks); and
• The terms of each investment advisory agreement and sub-advisory agreement.
During the various meetings of the Board and its committees over the course of the year leading up to the June 8, 2023 meeting, the Board received information from portfolio managers and other investment professionals of the advisers and sub-advisers of the funds regarding investment and performance matters, and considered various investment and trading strategies used in pursuing the funds’ investment objectives. The Board also received information regarding risk management techniques employed in connection with the management of the funds. The Board and its committees evaluated issues pertaining to industry and regulatory developments, compliance procedures, fund governance and other issues with respect to the funds, and received and participated in reports and presentations provided by Eaton Vance Management, Boston Management and Research and fund sub-advisers, with respect to such matters. In addition to the formal meetings of the Board and its committees, the Independent Trustees held regular teleconferences to discuss, among other topics, matters relating to the continuation of investment advisory agreements and sub-advisory agreements.
The Contract Review Committee was advised throughout the contract review process by Goodwin Procter LLP, independent legal counsel for the Independent Trustees. The members of the Contract Review Committee, with the advice of such counsel, exercised their own business judgment in determining the material factors to be considered in evaluating each investment advisory agreement and sub-advisory agreement and the weight to be given to each such factor. The conclusions reached with respect to each investment advisory agreement and sub-advisory agreement were based on a comprehensive evaluation of all the information provided and not any single factor. Moreover, each member of the Contract Review Committee may have placed varying emphasis on particular factors in reaching conclusions with respect to each investment advisory agreement and sub-advisory agreement. In evaluating each investment advisory agreement and sub-advisory agreement, including the fee structures and other terms contained in such agreements, the members of the Contract Review Committee were also informed by multiple years of analysis and discussion with the adviser and sub-adviser to each of the Eaton Vance Funds.
Results of the Contract Review Process
Based on its consideration of the foregoing, and such other information it deemed relevant, including the factors and conclusions described below, the Contract Review Committee concluded that the continuation of the investment advisory agreement between Eaton Vance Short Duration Strategic Income Fund (the “Fund”) and Eaton Vance Management (“EVM”) as well as the investment advisory agreement between Global Opportunities Portfolio (the “Portfolio”), one of the underlying Funds (as defined below) in which the Fund is authorized to invest, and Boston Management and Research (“BMR”)
Eaton Vance
Short Duration Strategic Income Fund
October 31, 2023
Board of Trustees’ Contract Approval — continued
(EVM, with respect to the Fund, and BMR, with respect to the Portfolio, are each referred to herein as the “Adviser”), including their respective fee structures, are in the interests of shareholders and, therefore, recommended to the Board approval of each agreement. Based on the recommendation of the Contract Review Committee, the Board, including a majority of the Independent Trustees, voted to approve continuation of the investment advisory agreements for the Fund and the Portfolio.
Nature, Extent and Quality of Services
In considering whether to approve the investment advisory agreements for the Fund and the Portfolio, the Board evaluated the nature, extent and quality of services provided to the Fund and the Portfolio by the applicable Adviser. EVM allocates the assets of the Fund among the Portfolio and other funds in the Eaton Vance fund complex (the “underlying Funds”) and is also authorized to invest directly in securities or other instruments.
The Board considered each Adviser’s management capabilities and investment processes in light of the types of investments held by the Fund and the Portfolio, including the education, experience and number of investment professionals and other personnel who provide portfolio management, investment research, and similar services to the Fund and the Portfolio. The Board considered the abilities and experience of each Adviser’s investment professionals in analyzing factors relevant to investment in a broad range of income securities. In regard to the Portfolio, the Board considered BMR’s expertise with respect to global markets and in-house research capabilities. The Board also took into account the resources dedicated to portfolio management and other services, the compensation methods of each Adviser and other factors, including the reputation and resources of the Adviser to recruit and retain highly qualified research, advisory and supervisory investment professionals. In addition, the Board considered the time and attention devoted to the Eaton Vance Funds, including the Fund and the Portfolio, by senior management, as well as the infrastructure, operational capabilities and support staff in place to assist in the portfolio management and operations of the Fund and the Portfolio, including the provision of administrative services. In approving the advisory agreements, the Board noted that EVM would be responsible for periodic rebalancing of assets among the Portfolio and the underlying Funds and, potentially, for investing in other securities or instruments, but would not receive a separate fee from the Fund for the rebalancing. The Board also considered the business-related and other risks to which each Adviser or its affiliates may be subject in managing the Fund and the Portfolio.
The Board noted that, under the terms of the investment advisory agreement of the Fund, EVM may invest assets of the Fund directly in securities, for which it would receive a fee, or in the Portfolio or in the underlying Funds, for which it receives no separate fee but for which the adviser receives an advisory fee from the Portfolio or the underlying Funds. The Board considered the potential benefits to the Fund of the ability to make direct investments, such as an improved ability to: gain exposure to sectors of the market EVM believes may not be represented or underrepresented by the Portfolio or the underlying Funds; to hedge certain exposures; and/or to otherwise manage the exposures of the Fund.
The Board considered the compliance programs of each Adviser and relevant affiliates thereof. The Board considered compliance and reporting matters regarding, among other things, personal trading by investment professionals, disclosure of portfolio holdings, late trading, frequent trading, portfolio valuation, business continuity and the allocation of investment opportunities. The Board also considered the responses of each Adviser and its affiliates to requests in recent years from regulatory authorities, such as the Securities and Exchange Commission and the Financial Industry Regulatory Authority.
The Board considered other administrative services provided or overseen by EVM and its affiliates, including transfer agency and accounting services. The Board evaluated the benefits to shareholders of investing in a fund that is a part of a large fund complex offering exposure to a variety of asset classes and investment disciplines, as well as the ability, in many cases, to exchange an investment among different funds without incurring additional sales charges.
After consideration of the foregoing factors, among others, the Board concluded that the nature, extent and quality of services provided by each Adviser, taken as a whole, are appropriate and consistent with the terms of the applicable investment advisory agreement.
Fund Performance
The Board compared the Fund’s investment performance to that of comparable funds identified by an independent data provider (the peer group), as well as an appropriate benchmark index. The Board’s review included comparative performance data with respect to the Fund for the one-, three-, five- and ten-year periods ended December 31, 2022. In this regard, the Board noted that the performance of the Fund was higher than the median performance of the Fund’s peer group for the three-year period. The Board also noted that the performance of the Fund was higher than its benchmark index for the three-year period. The Board also considered the performance of the underlying Portfolio and the underlying Funds. The Board concluded that the performance of the Fund was satisfactory.
Management Fees and Expenses
The Board considered contractual fee rates payable by the Fund directly or indirectly through its pro rata share of the expenses of the Portfolio and the underlying Funds for advisory and administrative services (referred to collectively as “management fees”). As part of its review, the Board considered the Fund’s management fees and total expense ratio for the one-year period ended December 31, 2022, as compared to those of comparable funds, before and after giving effect to any undertaking to waive fees or reimburse expenses. The Board also considered factors that had an impact on the Fund’s total expense ratio relative to comparable funds.
After considering the foregoing information, and in light of the nature, extent and quality of the services provided by each Adviser, the Board concluded that the management fees charged for advisory and related services are reasonable.
Eaton Vance
Short Duration Strategic Income Fund
October 31, 2023
Board of Trustees’ Contract Approval — continued
Profitability and “Fall-Out” Benefits
The Board considered the level of profits realized by each Adviser and relevant affiliates thereof in providing investment advisory and administrative services to the Fund, to the Portfolio and to all Eaton Vance Funds as a group. The Board considered the level of profits realized without regard to marketing support or other payments by each Adviser and its affiliates to third parties in respect of distribution or other services.
The Board concluded that, in light of the foregoing factors and the nature, extent and quality of the services rendered, the profits realized by each Adviser and its affiliates are deemed not to be excessive.
The Board also considered direct or indirect fall-out benefits received by each Adviser and its affiliates in connection with their respective relationships with the Fund, the Portfolio and the underlying Funds, including the benefits of research services that may be available to each Adviser as a result of securities transactions effected for the Fund, the Portfolio and the underlying Funds and other investment advisory clients.
Economies of Scale
In reviewing management fees and profitability, the Board also considered the extent to which the applicable Adviser and its affiliates, on the one hand, and the Fund and the Portfolio, on the other hand, can expect to realize benefits from economies of scale as the assets of the Fund and the Portfolio increase. The Board acknowledged the difficulty in accurately measuring the benefits resulting from economies of scale, if any, with respect to the management of any specific fund or group of funds. The Board reviewed data summarizing the increases and decreases in the assets of the Fund and of all Eaton Vance Funds as a group over various time periods, and evaluated the extent to which the total expense ratio of the Fund and the profitability of each Adviser and its affiliates may have been affected by such increases or decreases. The Board noted the structure of the advisory fee, which includes breakpoints at several asset levels for assets directly held by the Fund and includes no separate advisory fee for assets invested in the Portfolio or the underlying Funds. The Board noted that for assets invested in the Portfolio and the underlying Funds, the Fund will automatically receive the benefits of such breakpoints as have been established for the Portfolio and the underlying Funds based on their total assets. Based upon the foregoing, the Board concluded that the Fund currently shares in the benefits from economies of scale, if any, when they are realized by the Adviser. The Board also concluded that the structure of the advisory fees, which include breakpoints at several asset levels, will allow the Fund and the Portfolio to continue to benefit from any economies of scale in the future.
Eaton Vance
Short Duration Strategic Income Fund
October 31, 2023
Liquidity Risk Management Program
The Fund has implemented a written liquidity risk management program (Program) and related procedures to manage its liquidity in accordance with Rule 22e-4 under the Investment Company Act of 1940, as amended (Liquidity Rule). The Liquidity Rule defines “liquidity risk” as the risk that a fund could not meet requests to redeem shares issued by the fund without significant dilution of the remaining investors’ interests in the fund. The Fund’s Board of Trustees/Directors has designated the investment adviser to serve as the administrator of the Program and the related procedures. The administrator has established a Liquidity Risk Management Oversight Committee (Committee) to perform the functions necessary to administer the Program. As part of the Program, the administrator is responsible for identifying illiquid investments and categorizing the relative liquidity of the Fund’s investments in accordance with the Liquidity Rule. Under the Program, the administrator assesses, manages, and periodically reviews the Fund’s liquidity risk, and is responsible for making certain reports to the Fund’s Board of Trustees/Directors and the Securities and Exchange Commission (SEC) regarding the liquidity of the Fund’s investments, and to notify the Board of Trustees/Directors and the SEC of certain liquidity events specified in the Liquidity Rule. The liquidity of the Fund’s portfolio investments is determined based on a number of factors including, but not limited to, relevant market, trading and investment-specific considerations under the Program.
At a meeting of the Fund’s Board of Trustees/Directors on June 7, 2023, the Committee provided a written report to the Fund’s Board of Trustees/
Directors pertaining to the operation, adequacy, and effectiveness of implementation of the Program, as well as the operation of the highly liquid investment minimum (if applicable) for the period January 1, 2022 through December 31, 2022 (Review Period). The Program operated effectively during the Review Period, supporting the administrator’s ability to assess, manage and monitor Fund liquidity risk, including during periods of market volatility and net redemptions. During the Review Period, the Fund met redemption requests on a timely basis.
There can be no assurance that the Program will achieve its objectives in the future. Please refer to the Fund’s prospectus for more information regarding the Fund’s exposure to liquidity risk and other principal risks to which an investment in the Fund may be subject.
Eaton Vance
Short Duration Strategic Income Fund
October 31, 2023
Management and Organization
Fund Management. The Trustees of Eaton Vance Mutual Funds Trust (the Trust) are responsible for the overall management and supervision of the Trust's affairs. The Board members and officers of the Trust are listed below. Except as indicated, each individual has held the office shown or other offices in the same company for the last five years. Board members hold indefinite terms of office. Each Trustee holds office until his or her successor is elected and qualified, subject to a prior death, resignation, retirement, disqualification or removal. Under the terms of the Fund’s current Trustee retirement policy, an Independent Trustee must retire and resign as a Trustee on the earlier of: (i) the first day of July following his or her 74th birthday; or (ii), with limited exception, December 31st of the 20th year in which he or she has served as a Trustee. However, if such retirement and resignation would cause the Fund to be out of compliance with Section 16 of the 1940 Act or any other regulations or guidance of the SEC, then such retirement and resignation will not become effective until such time as action has been taken for the Fund to be in compliance therewith. The “noninterested Trustees” consist of those Trustees who are not “interested persons” of the Trust, as that term is defined under the 1940 Act. The business address of each Board member and officer is Two International Place, Boston, Massachusetts 02110. As used below, “BMR” refers to Boston Management and Research, “EV” refers to EV LLC, “EVM” refers to Eaton Vance Management, “MSIM" refers to Morgan Stanley Investment Management Inc. and “EVD” refers to Eaton Vance Distributors, Inc. EV is the trustee of each of EVM and BMR. Each of EVM, BMR, EVD and EV are indirect, wholly owned subsidiaries of Morgan Stanley. Each officer affiliated with EVM may hold a position with other EVM affiliates that is comparable to his or her position with EVM listed below. Each Trustee oversees
127 funds in the Eaton Vance fund complex (including both funds and portfolios in a hub and spoke structure).
| Name and Year of Birth | Trust
Position(s) | Length of Service | Principal Occupation(s) and Other Directorships
During Past Five Years and Other Relevant Experience |
| Interested Trustee |
Anchal Pachnanda(1)
1980 | Trustee | Since 2023 | Co-Head of Strategy of MSIM (since 2019). Formerly, Head of Strategy of MSIM (2017-2019). Ms. Pachnanda is an interested person because of her position with MSIM, which is an affiliate of the Trust.
Other Directorships. None. |
| Noninterested Trustees |
Alan C. Bowser
1962 | Trustee | Since 2022 | Private investor. Formerly, Chief Diversity Officer, Partner and a member of the Operating Committee, and formerly served as Senior Advisor on Diversity and Inclusion for the firm’s chief executive officer, Co-Head of the Americas Region, and Senior Client Advisor of Bridgewater Associates, an asset management firm (2011- 2023).
Other Directorships. Independent Director of Stout Risius Ross (a middle market professional services advisory firm) (since 2021). |
Mark R. Fetting
1954 | Trustee | Since 2016 | Private investor. Formerly held various positions at Legg Mason, Inc. (investment management firm) (2000-2012), including President, Chief Executive Officer, Director and Chairman (2008-2012), Senior Executive Vice President (2004-2008) and Executive Vice President (2001-2004). Formerly, President of Legg Mason family of funds (2001-2008). Formerly, Division President and Senior Officer of Prudential Financial Group, Inc. and related companies (investment management firm) (1991-2000).
Other Directorships. None. |
Cynthia E. Frost
1961 | Trustee | Since 2014 | Private investor. Formerly, Chief Investment Officer of Brown University (university endowment) (2000-2012). Formerly, Portfolio Strategist for Duke Management Company (university endowment manager) (1995-2000). Formerly, Managing Director, Cambridge Associates (investment consulting company) (1989-1995). Formerly, Consultant, Bain and Company (management consulting firm) (1987-1989). Formerly, Senior Equity Analyst, BA Investment Management Company (1983-1985).
Other Directorships. None. |
George J. Gorman
1952 | Chairperson of the
Board and Trustee | Since 2021
(Chairperson) and 2014 (Trustee) | Principal at George J. Gorman LLC (consulting firm). Formerly, Senior Partner at Ernst & Young LLP (a registered public accounting firm) (1974-2009).
Other Directorships. None. |
Eaton Vance
Short Duration Strategic Income Fund
October 31, 2023
Management and Organization — continued
| Name and Year of Birth | Trust
Position(s) | Length of Service | Principal Occupation(s) and Other Directorships
During Past Five Years and Other Relevant Experience |
| Noninterested Trustees (continued) |
Valerie A. Mosley
1960 | Trustee | Since 2014 | Chairwoman and Chief Executive Officer of Valmo Ventures (a consulting and investment firm). Founder of Upward Wealth, Inc., dba BrightUp, a fintech platform. Formerly, Partner and Senior Vice President, Portfolio Manager and Investment Strategist at Wellington Management Company, LLP (investment management firm) (1992-2012). Formerly, Chief Investment Officer, PG Corbin Asset Management (1990-1992). Formerly worked in institutional corporate bond sales at Kidder Peabody (1986-1990).
Other Directorships. Director of DraftKings, Inc. (digital sports entertainment and gaming company) (since September 2020). Director of Envestnet, Inc. (provider of intelligent systems for wealth management and financial wellness) (since 2018). Formerly, Director of Dynex Capital, Inc. (mortgage REIT) (2013-2020) and Director of Groupon, Inc. (e-commerce provider) (2020-2022). |
Keith Quinton
1958 | Trustee | Since 2018 | Private investor, researcher and lecturer. Formerly, Independent Investment Committee Member at New Hampshire Retirement System (2017-2021). Formerly, Portfolio Manager and Senior Quantitative Analyst at Fidelity Investments (investment management firm) (2001-2014).
Other Directorships. Formerly, Director (2016-2021) and Chairman (2019-2021) of New Hampshire Municipal Bond Bank. |
Marcus L. Smith
1966 | Trustee | Since 2018 | Private investor and independent corporate director. Formerly, Chief Investment Officer, Canada (2012-2017), Chief Investment Officer, Asia (2010-2012), Director of Asian Research (2004-2010) and portfolio manager (2001-2017) at MFS Investment Management (investment management firm).
Other Directorships. Director of First Industrial Realty Trust, Inc. (an industrial REIT) (since 2021). Director of MSCI Inc. (global provider of investment decision support tools) (since 2017). Formerly, Director of DCT Industrial Trust Inc. (logistics real estate company) (2017-2018). |
Susan J. Sutherland
1957 | Trustee | Since 2015 | Private investor. Director of Ascot Group Limited and certain of its subsidiaries (insurance and reinsurance) (since 2017). Formerly, Director of Hagerty Holding Corp. (insurance) (2015-2018) and Montpelier Re Holdings Ltd. (insurance and reinsurance) (2013-2015). Formerly, Associate, Counsel and Partner at Skadden, Arps, Slate, Meagher & Flom LLP (law firm) (1982-2013).
Other Directorships. Formerly, Director of Kairos Acquisition Corp. (insurance/InsurTech acquisition company) (2021-2023). |
Scott E. Wennerholm
1959 | Trustee | Since 2016 | Private investor. Formerly, Trustee at Wheelock College (postsecondary institution) (2012-2018). Formerly, Consultant at GF Parish Group (executive recruiting firm) (2016-2017). Formerly, Chief Operating Officer and Executive Vice President at BNY Mellon Asset Management (investment management firm) (2005-2011). Formerly, Chief Operating Officer and Chief Financial Officer at Natixis Global Asset Management (investment management firm) (1997-2004). Formerly, Vice President at Fidelity Investments Institutional Services (investment management firm) (1994-1997).
Other Directorships. None. |
Nancy A. Wiser
1967 | Trustee | Since 2022 | Formerly, Executive Vice President and the Global Head of Operations at Wells Fargo Asset Management (2011-2021).
Other Directorships. None. |
| Name and Year of Birth | Trust
Position(s) | Length of Service | Principal Occupation(s)
During Past Five Years |
| Principal Officers who are not Trustees |
Kenneth A. Topping
1966 | President | Since 2023 | Vice President and Chief Administrative Officer of EVM and BMR and Chief Operating Officer for Public Markets at MSIM. Also Vice President of Calvert Research and Management (“CRM”) since 2021. Formerly, Chief Operating Officer for Goldman Sachs Asset Management ‘Classic’ (2009-2020). |
Deidre E. Walsh
1971 | Vice President and Chief
Legal Officer | Since 2009 | Vice President of EVM and BMR. Also Vice President of CRM. |
James F. Kirchner
1967 | Treasurer | Since 2007 | Vice President of EVM and BMR. Also Vice President of CRM. |
Eaton Vance
Short Duration Strategic Income Fund
October 31, 2023
Management and Organization — continued
| Name and Year of Birth | Trust
Position(s) | Length of Service | Principal Occupation(s)
During Past Five Years |
| Principal Officers who are not Trustees (continued) |
Nicholas S. Di Lorenzo
1987 | Secretary | Since 2022 | Formerly, associate (2012-2021) and counsel (2022) at Dechert LLP. |
Richard F. Froio
1968 | Chief Compliance
Officer | Since 2017 | Vice President of EVM and BMR since 2017. Formerly, Deputy Chief Compliance Officer (Adviser/Funds) and Chief Compliance Officer (Distribution) at PIMCO (2012-2017) and Managing Director at BlackRock/Barclays Global Investors (2009-2012). |
(1) Ms. Pachnanda began serving as Trustee effective April 1, 2023.
The SAI for the Fund includes additional information about the Trustees and officers of the Fund and can be obtained without charge on Eaton Vance’s website at www.eatonvance.com or by calling 1-800-262-1122.
| FACTS | WHAT DOES EATON VANCE DO WITH YOUR
PERSONAL INFORMATION? |
| Why? | Financial companies choose how they share your personal information. Federal law gives consumers the right to limit some but not all sharing. Federal law also requires us to tell you how we collect, share, and protect your personal information. Please read this notice carefully to understand what we do. |
| |
| What? | The types of personal information we collect and share depend on the product or service you have with us. This information can include:■ Social Security number and income
■ investment experience and risk tolerance
■ checking account number and wire transfer instructions |
| |
| How? | All financial companies need to share customers’ personal information to run their everyday business. In the section below, we list the reasons financial companies can share their customers’ personal information; the reasons Eaton Vance chooses to share; and whether you can limit this sharing. |
Reasons we can share your
personal information | Does Eaton Vance
share? | Can you limit
this sharing? |
| For our everyday business purposes — such as to process your transactions, maintain your account(s), respond to court orders and legal investigations, or report to credit bureaus | Yes | No |
| For our marketing purposes — to offer our products and services to you | Yes | No |
| For joint marketing with other financial companies | No | We don’t share |
| For our investment management affiliates’ everyday business purposes — information about your transactions, experiences, and creditworthiness | Yes | Yes |
| For our affiliates’ everyday business purposes — information about your transactions and experiences | Yes | No |
| For our affiliates’ everyday business purposes — information about your creditworthiness | No | We don’t share |
| For our investment management affiliates to market to you | Yes | Yes |
| For our affiliates to market to you | No | We don’t share |
| For nonaffiliates to market to you | No | We don’t share |
To limit our
sharing | Call toll-free 1-800-262-1122 or email: EVPrivacy@eatonvance.comPlease note:If you are a new customer, we can begin sharing your information 30 days from the date we sent this notice. When you are no longer our customer, we continue to share your information as described in this notice. However, you can contact us at any time to limit our sharing. |
| Questions? | Call toll-free 1-800-262-1122 or email: EVPrivacy@eatonvance.com |
| Privacy Notice — continued | April 2021 |
| Who we are |
| Who is providing this notice? | Eaton Vance Management, Eaton Vance Distributors, Inc., Eaton Vance Trust Company, Eaton Vance Management (International) Limited, Eaton Vance Advisers International Ltd., Eaton Vance Global Advisors Limited, Eaton Vance Management’s Real Estate Investment Group, Boston Management and Research, Calvert Research and Management, Eaton Vance and Calvert Fund Families and our investment advisory affiliates (“Eaton Vance”) (see Investment Management Affiliates definition below) |
| What we do |
How does Eaton Vance
protect my personal
information? | To protect your personal information from unauthorized access and use, we use security measures that comply with federal law. These measures include computer safeguards and secured files and buildings. We have policies governing the proper handling of customer information by personnel and requiring third parties that provide support to adhere to appropriate security standards with respect to such information. |
How does Eaton Vance
collect my personal
information? | We collect your personal information, for example, when you■ open an account or make deposits or withdrawals from your account
■ buy securities from us or make a wire transfer
■ give us your contact informationWe also collect your personal information from others, such as credit bureaus, affiliates, or other companies. |
| Why can’t I limit all sharing? | Federal law gives you the right to limit only■ sharing for affiliates’ everyday business purposes — information about your creditworthiness
■ affiliates from using your information to market to you
■ sharing for nonaffiliates to market to youState laws and individual companies may give you additional rights to limit sharing. See below for more on your rights under state law. |
| Definitions |
Investment Management
Affiliates | Eaton Vance Investment Management Affiliates include registered investment advisers, registered broker- dealers, and registered and unregistered funds. Investment Management Affiliates does not include entities associated with Morgan Stanley Wealth Management, such as Morgan Stanley Smith Barney LLC and Morgan Stanley & Co. |
| Affiliates | Companies related by common ownership or control. They can be financial and nonfinancial companies.■ Our affiliates include companies with a Morgan Stanley name and financial companies such as Morgan Stanley Smith Barney LLC and Morgan Stanley & Co. |
| Nonaffiliates | Companies not related by common ownership or control. They can be financial and nonfinancial companies.■ Eaton Vance does not share with nonaffiliates so they can market to you. |
| Joint marketing | A formal agreement between nonaffiliated financial companies that together market financial products or services to you.■ Eaton Vance doesn’t jointly market. |
| Other important information |
| Vermont: Except as permitted by law, we will not share personal information we collect about Vermont residents with Nonaffiliates unless you provide us with your written consent to share such information.California: Except as permitted by law, we will not share personal information we collect about California residents with Nonaffiliates and we will limit sharing such personal information with our Affiliates to comply with California privacy laws that apply to us. |
Delivery of Shareholder Documents. The Securities and Exchange Commission (SEC) permits funds to deliver only one copy of shareholder documents, including prospectuses, proxy statements and shareholder reports, to fund investors with multiple accounts at the same residential or post office box address. This practice is often called “householding” and it helps eliminate duplicate mailings to shareholders. Eaton Vance, or your financial intermediary, may household the mailing of your documents indefinitely unless you instruct Eaton Vance, or your financial intermediary, otherwise. If you would prefer that your Eaton Vance documents not be householded, please contact Eaton Vance at 1-800-262-1122, or contact your financial intermediary. Your instructions that householding not apply to delivery of your Eaton Vance documents will typically be effective within 30 days of receipt by Eaton Vance or your financial intermediary.
Portfolio Holdings. Each Eaton Vance Fund and its underlying Portfolio(s) (if applicable) files a schedule of portfolio holdings on Part F to Form N-PORT with the SEC. Certain information filed on Form N-PORT may be viewed on the Eaton Vance website at www.eatonvance.com, by calling Eaton Vance at 1-800-262-1122 or in the EDGAR database on the SEC’s website at www.sec.gov.
Proxy Voting. From time to time, funds are required to vote proxies related to the securities held by the funds. The Eaton Vance Funds or their underlying Portfolios (if applicable) vote proxies according to a set of policies and procedures approved by the Funds’ and Portfolios’ Boards. You may obtain a description of these policies and procedures and information on how the Funds or Portfolios voted proxies relating to portfolio securities during the most recent 12-month period ended June 30, without charge, upon request, by calling 1-800-262-1122 and by accessing the SEC’s website at www.sec.gov.
Tailored Shareholder Reports. Effective January 24, 2023, the SEC adopted rule and form amendments to require open-end mutual funds and ETFs to transmit concise and visually engaging streamlined annual and semiannual reports to shareholders that highlight key information. Other information, including financial statements, will no longer appear in a streamlined shareholder report but must be available online, delivered free of charge upon request, and filed on a semiannual basis on Form N-CSR. The rule and form amendments have a compliance date of July 24, 2024. At this time, management is evaluating the impact of these amendments on the shareholder reports for the Eaton Vance Funds.
This Page Intentionally Left Blank
This Page Intentionally Left Blank
This Page Intentionally Left Blank
Investment Adviser of Emerging Markets Local Income Portfolio,
Global Macro Absolute Return Advantage Portfolio,
Global Opportunities Portfolio,
High Income Opportunities Portfolio and
Senior Debt Portfolio
Boston Management and Research
Two International Place
Boston, MA 02110
Investment Adviser and Administrator of Eaton Vance
Short Duration Strategic Income Fund
Eaton Vance Management
Two International Place
Boston, MA 02110
Principal Underwriter*
Eaton Vance Distributors, Inc.
Two International Place
Boston, MA 02110
(617) 482-8260
Custodian
State Street Bank and Trust Company
One Congress Street, Suite 1
Boston, MA 02114-2016
Transfer Agent
BNY Mellon Investment Servicing (US) Inc.
Attn: Eaton Vance Funds
P.O. Box 534439
Pittsburgh, PA 15253-4439
(800) 262-1122
Independent Registered Public Accounting Firm
Deloitte & Touche LLP
200 Berkeley Street
Boston, MA 02116-5022
Fund Offices
Two International Place
Boston, MA 02110
* FINRA BrokerCheck. Investors may check the background of their Investment Professional by contacting the Financial Industry Regulatory Authority (FINRA). FINRA BrokerCheck is a free tool to help investors check the professional background of current and former FINRA-registered securities firms and brokers. FINRA BrokerCheck is available by calling 1-800-289-9999 and at www.FINRA.org. The FINRA BrokerCheck brochure describing this program is available to investors at www.FINRA.org.
Eaton Vance
Tax-Managed Equity Asset Allocation Fund
Annual Report
October 31, 2023
Commodity Futures Trading Commission Registration. The Commodity Futures Trading Commission (“CFTC”) has adopted regulations that subject registered investment companies and advisers to regulation by the CFTC if a fund invests more than a prescribed level of its assets in certain CFTC-regulated instruments (including futures, certain options and swap agreements) or markets itself as providing investment exposure to such instruments. The investment adviser has claimed an exclusion from the definition of “commodity pool operator” under the Commodity Exchange Act with respect to its management of the Fund. Accordingly, neither the Fund nor the adviser with respect to the operation of the Fund is subject to CFTC regulation. Because of its management of other strategies, the Fund's adviser is registered with the CFTC as a commodity pool operator. The adviser is also registered as a commodity trading advisor.
Fund shares are not insured by the FDIC and are not deposits or other obligations of, or guaranteed by, any depository institution. Shares are subject to investment risks, including possible loss of principal invested.
This report must be preceded or accompanied by a current summary prospectus or prospectus. Before investing, investors should consider carefully the investment objective, risks, and charges and expenses of a mutual fund. This and other important information is contained in the summary prospectus and prospectus, which can be obtained from a financial intermediary. Prospective investors should read the prospectus carefully before investing. For further information, please call 1-800-262-1122.
Annual Report October 31, 2023
Eaton Vance
Tax-Managed Equity Asset Allocation Fund
Eaton Vance
Tax-Managed Equity Asset Allocation Fund
October 31, 2023
Management’s Discussion of Fund Performance†
Economic and Market Conditions
For global equity investors, the 12-month period ended October 31, 2023, was a roller-coaster ride, driven largely by shifting perceptions of whether the U.S. Federal Reserve (the Fed) could bring the world’s largest economy in for a soft landing, and changing expectations of how long interest rates might remain high.
During the opening month of the period, stocks rallied on strong corporate earnings, attractive valuations, and hope the Fed might slow the pace of its interest rate hikes. But in December 2022, equities lost ground as “higher for longer” interest rate fears returned. A continuing irony throughout the period was that good economic news -- record low unemployment, strong job creation, and robust consumer spending -- was viewed as bad news for inflation and fuel for future rate hikes that could weigh on stock prices.
In January 2023, however, global equities began a rally that lasted through July. The initial tailwind was ChatGPT, an artificial intelligence (AI) application that led investors to perceive AI might become the next big innovation to drive the information technology (IT) sector. As a result, IT -- one of the worst-performing sectors in 2022 -- became the standout sector of the first half of 2023.
Earlier recession fears that had weighed on stock prices receded as many investors came around to the view that the U.S. and global economies were doing surprisingly well. European equities received an additional boost as feared continent-wide energy shortages failed to materialize during the winter.
But in the final three months of the period, the bond market halted the stock market’s momentum. As it became clear the Fed would keep rates higher for longer than investors had anticipated just a few months earlier, longer-term bond interest rates rose sharply. Given the potential for relatively attractive returns with lower risk than stocks, many investors shifted from equity assets to bonds. In the final two days of the period, however, signs of a stock rally emerged as investors began to believe the Fed might have reached the end of its monetary tightening cycle.
For the period as a whole, global equity performance was strong. The MSCI ACWI Index, a broad measure of global equities, returned 10.50%; the MSCI EAFE Index of developed-market international equities returned 14.40%; and the S&P 500® Index, a broad measure of U.S. stocks, returned 10.14%.
Meanwhile, in the world’s second-largest economy, the MSCI Golden Dragon Index, a measure of Chinese large-cap and mid-cap stocks, returned 21.11%. The strong 12-month performance, however, masked the significant decline in Chinese stock prices since early 2023, as Chinese equities were dogged by an ailing real estate sector -- the major investment area for millions of Chinese citizens -- and a failure of many Chinese industries to bounce back after onerous COVID restrictions were lifted.
Fund Performance
For the 12-month period ended October 31, 2023, Eaton Vance Tax-Managed Equity Asset Allocation Fund (the Fund) returned 6.01% for Class A shares at net asset value (NAV). The Fund underperformed its primary benchmark, the Russell 3000® Index (the Index), which returned 8.38%; and underperformed its custom benchmark -- consisting of 80% the Index, 10% MSCI EAFE Index, and 10% ICE BofA Fixed Rate Preferred Securities Index (the Blended Index) -- which returned 8.43% during the period.
The Fund’s performance is a function of the returns of its underlying investment portfolios and allocations among those portfolios, as well as the performance of the Fund’s direct investments. The Fund invests in tax-managed portfolios across multiple equity market capitalizations and investment styles, as well as direct investments, which include preferred stocks and hybrid securities.
The period was marked by a strong rally in certain areas of the equity market -- most notably large-cap growth companies that benefited from investor enthusiasm over artificial intelligence (AI) applications. However, many U.S. small-cap indexes were in negative territory during the period. In general, value stock indexes significantly underperformed their growth stock counterparts, while overseas equity markets modestly outperformed U.S. equity markets. In this environment, the Fund’s U.S. small-cap and U.S. value allocations were the largest drags on Fund performance relative to the Index, which is weighted toward U.S. large-cap stocks.
The Fund’s allocations to Tax-Managed Small-Cap Portfolio and Tax-Managed Value Portfolio underperformed the Index, detracting from Fund performance versus the Index during the period. The Fund’s direct investments in preferred stocks and other hybrid securities also underperformed the Index, detracting modestly from performance versus the Index. In contrast, the Fund’s allocations to Tax-Managed Growth Portfolio, Tax-Managed Multi-Cap Growth Portfolio, and Tax-Managed International Equity Portfolio all outperformed the Index, contributing to returns relative to the Index.
Fund managers made no significant changes to the Fund’s allocation mix during the period. As of period-end, allocations to the Fund’s underlying components were: Tax-Managed Multi-Cap Growth Portfolio (15.8%); Tax-Managed Growth Portfolio (38.6)%; Tax-Managed Value Portfolio (26.7%); Tax-Managed International Equity Portfolio (4.9%); Tax-Managed Small-Cap Portfolio (9.6%); and direct investments in preferred stocks and other hybrid securities (4.4%).
See Endnotes and Additional Disclosures in this report.
Past performance is no guarantee of future results. Returns are historical and are calculated by determining the percentage change in net asset value (NAV) or offering price (as applicable) with all distributions reinvested. Furthermore, returns do not reflect the deduction of taxes that shareholders may have to pay on Fund distributions or upon the redemption of Fund shares. Investment return and principal value will fluctuate so that shares, when redeemed, may be worth more or less than their original cost. Performance for periods less than or equal to one year is cumulative. Performance is for the stated time period only; due to market volatility, current Fund performance may be lower or higher than the quoted return. For performance as of the most recent month-end, please refer to eatonvance.com.
Eaton Vance
Tax-Managed Equity Asset Allocation Fund
October 31, 2023
Performance
Portfolio Manager(s) Douglas R. Rogers, CFA, CMT
| % Average Annual Total Returns1,2 | Class
Inception Date | Performance
Inception Date | One Year | Five Years | Ten Years |
| Class A at NAV | 03/04/2002 | 03/04/2002 | 6.01% | 7.41% | 7.78% |
| Class A with 5.25% Maximum Sales Charge | — | — | 0.45 | 6.26 | 7.20 |
| Class C at NAV | 03/04/2002 | 03/04/2002 | 5.22 | 6.59 | 7.13 |
| Class C with 1% Maximum Deferred Sales Charge | — | — | 4.22 | 6.59 | 7.13 |
| Class I at NAV | 09/11/2015 | 03/04/2002 | 6.26 | 7.67 | 7.99 |
|
| Russell 3000® Index | — | — | 8.38% | 10.23% | 10.52% |
| MSCI EAFE Index | — | — | 14.40 | 4.10 | 3.05 |
| ICE BofA Fixed Rate Preferred Securities Index | — | — | 2.18 | 1.29 | 3.82 |
| Blended Index | — | — | 8.43 | 8.79 | 9.16 |
| % After-Tax Returns with Maximum Sales Charge2 | Class
Inception Date | Performance
Inception Date | One Year | Five Years | Ten Years |
| Class A After Taxes on Distributions | 03/04/2002 | 03/04/2002 | 5.84% | 7.07% | 7.10% |
| Class A After Taxes on Distributions and Sale of Fund Shares | — | — | 3.71 | 5.86 | 6.17 |
| Class C After Taxes on Distributions | 03/04/2002 | 03/04/2002 | 5.17 | 6.37 | 6.55 |
| Class C After Taxes on Distributions and Sale of Fund Shares | — | — | 3.14 | 5.20 | 5.65 |
| Class I After Taxes on Distributions | 09/11/2015 | 03/04/2002 | 6.04 | 7.28 | 7.27 |
| Class I After Taxes on Distributions and Sale of Fund Shares | — | — | 3.92 | 6.07 | 6.34 |
| % Total Annual Operating Expense Ratios3 | Class A | Class C | Class I |
| | 1.21% | 1.96% | 0.96% |
Growth of $10,000
This graph shows the change in value of a hypothetical investment of $10,000 in Class A of the Fund for the period indicated. For comparison, the same investment is shown in the indicated index.
| Growth of Investment2 | Amount Invested | Period Beginning | At NAV | With Maximum Sales Charge |
| Class C | $10,000 | 10/31/2013 | $19,927 | N.A. |
| Class I, at minimum investment | $1,000,000 | 10/31/2013 | $2,157,981 | N.A. |
See Endnotes and Additional Disclosures in this report.
Past performance is no guarantee of future results. Returns are historical and are calculated by determining the percentage change in net asset value (NAV) or offering price (as applicable) with all distributions reinvested. Furthermore, returns do not reflect the deduction of taxes that shareholders may have to pay on Fund distributions or upon the redemption of Fund shares. Investment return and principal value will fluctuate so that shares, when redeemed, may be worth more or less than their original cost. Performance for periods less than or equal to one year is cumulative. Performance is for the stated time period only; due to market volatility, current Fund performance may be lower or higher than the quoted return. For performance as of the most recent month-end, please refer to eatonvance.com.
Eaton Vance
Tax-Managed Equity Asset Allocation Fund
October 31, 2023
| Portfolio Allocation (% of total investments)1 |
Footnotes:
| 1 | Fund primarily invests in one or more affiliated investment companies (Portfolios) and may also invest directly. Unless otherwise noted, references to investments are to the aggregate holdings of the Fund, including its pro rata share of each Portfolio in which it invests. Debt obligations are hybrid instruments, as determined by the investment adviser. These instruments have characteristics of both equity and debt. |
Eaton Vance
Tax-Managed Equity Asset Allocation Fund
October 31, 2023
Endnotes and Additional Disclosures
| † | The views expressed in this report are those of the portfolio manager(s) and are current only through the date stated at the top of this page. These views are subject to change at any time based upon market or other conditions, and Eaton Vance and the Fund(s) disclaim any responsibility to update such views. These views may not be relied upon as investment advice and, because investment decisions are based on many factors, may not be relied upon as an indication of trading intent on behalf of any Eaton Vance fund. This commentary may contain statements that are not historical facts, referred to as “forward-looking statements.” The Fund’s actual future results may differ significantly from those stated in any forward-looking statement, depending on factors such as changes in securities or financial markets or general economic conditions, the volume of sales and purchases of Fund shares, the continuation of investment advisory, administrative and service contracts, and other risks discussed from time to time in the Fund’s filings with the Securities and Exchange Commission. |
| | |
| 1 | Russell 3000® Index is an unmanaged index of the 3,000 largest U.S. stocks. MSCI EAFE Index is an unmanaged index of equities in the developed markets, excluding the U.S. and Canada. MSCI indexes are net of foreign withholding taxes. Source: MSCI. MSCI data may not be reproduced or used for any other purpose. MSCI provides no warranties, has not prepared or approved this report, and has no liability hereunder. ICE BofA Fixed Rate Preferred Securities Index is an unmanaged index of fixed-rate, preferred securities issued in the U.S. ICE® BofA® indices are not for redistribution or other uses; provided “as is”, without warranties, and with no liability. Eaton Vance has prepared this report and ICE Data Indices, LLC does not endorse it, or guarantee, review, or endorse Eaton Vance’s products. BofA® is a licensed registered trademark of Bank of America Corporation in the United States and other countries. The Blended Index consists of 80% Russell 3000® Index, 10% MSCI EAFE Index and 10% ICE BofA Fixed Rate Preferred Securities Index, rebalanced monthly. Unless otherwise stated, index returns do not reflect the effect of any applicable sales charges, commissions, expenses, taxes or leverage, as applicable. It is not possible to invest directly in an index. |
| 2 | Total Returns at NAV do not include applicable sales charges. If sales charges were deducted, the returns would be lower. Total Returns shown with maximum sales charge reflect the stated maximum sales charge. Unless otherwise stated, performance does not reflect the deduction of taxes on Fund distributions or redemptions of Fund shares. After-tax returns are calculated using certain assumptions, including using the highest historical individual federal income tax rates, and do not reflect the impact of state/local taxes. Actual after-tax returns depend on a shareholder’s tax situation and the actual characterization of distributions and may differ from those shown. After-tax returns are not relevant to shareholders who hold shares in tax-deferred accounts or shares held by nontaxable entities. Return After Taxes on Distributions may be the same as Return Before Taxes for the same period because no taxable distributions were made during that period. Return After Taxes on Distributions and Sale of Fund Shares may be greater than or equal to Return After Taxes on Distributions for the same period because of losses realized on the sale of Fund shares. The Fund’s after-tax returns also may reflect foreign tax credits passed by the Fund to its shareholders. |
| | Performance prior to the inception date of a class may be linked to the performance of an older class of the Fund. This linked performance is adjusted for any applicable sales charge, but is not adjusted for class expense differences. If adjusted for such differences, the performance would be different. The performance of Class I is linked to Class A. Performance presented in the Financial Highlights included in the financial statements is not linked.Effective November 5, 2020, Class C shares automatically convert to Class A shares eight years after purchase. The average annual total returns listed for Class C reflect conversion to Class A shares after eight years. Prior to November 5, 2020, Class C shares automatically converted to Class A shares ten years after purchase. |
| 3 | Source: Fund prospectus. The expense ratios for the current reporting period can be found in the Financial Highlights section of this report. Performance reflects expenses waived and/or reimbursed, if applicable. Without such waivers and/or reimbursements, performance would have been lower. |
| | Fund profile subject to change due to active management. |
| | Additional Information |
| | S&P 500® Index is an unmanaged index of large-cap stocks commonly used as a measure of U.S. stock market performance. S&P Dow Jones Indices are a product of S&P Dow Jones Indices LLC (“S&P DJI”) and have been licensed for use. S&P® and S&P 500® are registered trademarks of S&P DJI; Dow Jones® is a registered trademark of Dow Jones Trademark Holdings LLC (“Dow Jones”); S&P DJI, Dow Jones and their respective affiliates do not sponsor, endorse, sell or promote the Fund, will not have any liability with respect thereto and do not have any liability for any errors, omissions, or interruptions of the S&P Dow Jones Indices. MSCI Golden Dragon Index is an unmanaged index of common stocks traded in China, Hong Kong and Taiwan. MSCI ACWI Index is an unmanaged free-float-adjusted, market-capitalization-weighted index designed to measure the equity market performance of developed and emerging markets. |
Eaton Vance
Tax-Managed Equity Asset Allocation Fund
October 31, 2023
Example
As a Fund shareholder, you incur two types of costs: (1) transaction costs, including sales charges (loads) on purchases; and (2) ongoing costs, including management fees; distribution and/or service fees; and other Fund expenses. This Example is intended to help you understand your ongoing costs (in dollars) of Fund investing and to compare these costs with the ongoing costs of investing in other mutual funds. The Example is based on an investment of $1,000 invested at the beginning of the period and held for the entire period (May 1, 2023 to October 31, 2023).
Actual Expenses
The first section of the table below provides information about actual account values and actual expenses. You may use the information in this section, together with the amount you invested, to estimate the expenses that you paid over the period. Simply divide your account value by $1,000 (for example, an $8,600 account value divided by $1,000 = 8.6), then multiply the result by the number in the first section under the heading entitled “Expenses Paid During Period” to estimate the expenses you paid on your account during this period.
Hypothetical Example for Comparison Purposes
The second section of the table below provides information about hypothetical account values and hypothetical expenses based on the actual Fund expense ratio and an assumed rate of return of 5% per year (before expenses), which is not the actual Fund return. The hypothetical account values and expenses may not be used to estimate the actual ending account balance or expenses you paid for the period. You may use this information to compare the ongoing costs of investing in your Fund and other funds. To do so, compare this 5% hypothetical example with the 5% hypothetical examples that appear in the shareholder reports of the other funds.
Please note that the expenses shown in the table are meant to highlight your ongoing costs only and do not reflect any transactional costs, such as sales charges (loads). Therefore, the second section of the table is useful in comparing ongoing costs only, and will not help you determine the relative total costs of owning different funds. In addition, if these transactional costs were included, your costs would be higher.
| | Beginning
Account Value
(5/1/23) | Ending
Account Value
(10/31/23) | Expenses Paid
During Period*
(5/1/23 – 10/31/23) | Annualized
Expense
Ratio |
| Actual | | | | |
| Class A | $1,000.00 | $ 980.70 | $6.04 | 1.21% |
| Class C | $1,000.00 | $ 977.10 | $9.77 | 1.96% |
| Class I | $1,000.00 | $ 982.20 | $4.80 | 0.96% |
| |
| Hypothetical | | | | |
| (5% return per year before expenses) | | | | |
| Class A | $1,000.00 | $1,019.11 | $6.16 | 1.21% |
| Class C | $1,000.00 | $1,015.33 | $9.96 | 1.96% |
| Class I | $1,000.00 | $1,020.37 | $4.89 | 0.96% |
| * | Expenses are equal to the Fund's annualized expense ratio for the indicated Class, multiplied by the average account value over the period, multiplied by 184/365 (to reflect the one-half year period). The Example assumes that the $1,000 was invested at the net asset value per share determined at the close of business on April 30, 2023. The Example reflects the expenses of both the Fund and the Portfolios. |
Eaton Vance
Tax-Managed Equity Asset Allocation Fund
October 31, 2023
| Investments in Affiliated Portfolios — 95.7% |
| Description | | | Value |
Tax-Managed Growth Portfolio
(identified cost, $76,559,526) | | | $ 224,209,992 |
Tax-Managed International Equity Portfolio
(identified cost, $26,939,566) | | | 28,601,923 |
Tax-Managed Multi-Cap Growth Portfolio
(identified cost, $33,690,179) | | | 91,990,603 |
Tax-Managed Small-Cap Portfolio
(identified cost, $54,431,410) | | | 55,786,684 |
Tax-Managed Value Portfolio
(identified cost, $102,898,841) | | | 155,524,594 |
Total Investments in Affiliated Portfolios
(identified cost $294,519,522) | | | $556,113,796 |
| Debt Obligations — 3.7%(1) |
| Security | Principal
Amount
(000's omitted) | Value |
| Banks — 2.2% |
| Banco Davivienda S.A., 6.65% to 4/22/31(2)(3)(4) | $ | 200 | $ 121,000 |
| Banco Mercantil del Norte S.A./Grand Cayman, 8.375% to 10/14/30(2)(3)(4) | | 600 | 547,764 |
| Bank of America Corp., Series TT, 6.125% to 4/27/27(3)(4) | | 950 | 895,584 |
| Bank of Nova Scotia (The), 4.90% to 6/4/25(3)(4) | | 775 | 709,146 |
| Barclays PLC: | | | |
| 6.125% to 12/15/25(3)(4) | | 471 | 421,295 |
| 8.00% to 3/15/29(3)(4) | | 526 | 466,562 |
| BNP Paribas S.A.: | | | |
| 4.625% to 2/25/31(2)(3)(4) | | 203 | 141,283 |
| 7.75% to 8/16/29(2)(3)(4) | | 675 | 627,530 |
| Citigroup, Inc., Series W, 4.00% to 12/10/25(3)(4) | | 1,038 | 893,804 |
| Farm Credit Bank of Texas, Series 3, 6.20% to 6/15/28(2)(3)(4) | | 473 | 428,065 |
| Huntington Bancshares, Inc., Series F, 5.625% to 7/15/30(3)(4) | | 395 | 309,148 |
| ING Groep NV, 6.50% to 4/16/25(3)(4) | | 243 | 227,585 |
| JPMorgan Chase & Co., Series KK, 3.65% to 6/1/26(3)(4) | | 789 | 686,409 |
| KeyCorp, Series D, 5.00% to 9/15/26(3)(4) | | 975 | 651,837 |
| Lloyds Banking Group PLC, 7.50% to 6/27/24(3)(4) | | 600 | 585,265 |
| Natwest Group PLC: | | | |
| 4.60% to 6/28/31(3)(4) | | 200 | 129,516 |
| 6.00% to 12/29/25(3)(4) | | 229 | 210,361 |
| 8.00% to 8/10/25(3)(4) | | 778 | 756,123 |
| PNC Financial Services Group, Inc. (The), Series U, 6.00% to 5/15/27(3)(4) | | 800 | 672,608 |
| Societe Generale S.A.: | | | |
| 5.375% to 11/18/30(2)(3)(4) | | 506 | 364,171 |
| Security | Principal
Amount
(000's omitted) | Value |
| Banks (continued) |
| Societe Generale S.A.: (continued) | | | |
| 9.375% to 11/22/27(2)(3)(4) | $ | 200 | $ 193,575 |
| Standard Chartered PLC, 4.75% to 1/14/31(2)(3)(4) | | 577 | 402,797 |
| Toronto-Dominion Bank (The), 8.125% to 10/31/27, 10/31/82(4) | | 775 | 762,261 |
| Truist Financial Corp.: | | | |
| Series P, 4.95% to 9/1/25(3)(4) | | 125 | 113,680 |
| Series Q, 5.10% to 3/1/30(3)(4) | | 134 | 107,988 |
| UBS Group AG: | | | |
| 4.375% to 2/10/31(2)(3)(4) | | 419 | 291,940 |
| 6.875% to 8/7/25(3)(4)(5) | | 348 | 328,994 |
| Wells Fargo & Co., Series BB, 3.90% to 3/15/26(3)(4) | | 784 | 679,559 |
| | | | $ 12,725,850 |
| Capital Markets — 0.2% |
| Charles Schwab Corp. (The): | | | |
| Series G, 5.375% to 6/1/25(3)(4) | $ | 651 | $ 621,417 |
| Series I, 4.00% to 6/1/26(3)(4) | | 467 | 371,228 |
| | | | $ 992,645 |
| Diversified Financial Services — 0.2% |
| Air Lease Corp., Series B, 4.65% to 6/15/26(3)(4) | $ | 410 | $ 349,993 |
| American AgCredit Corp., Series A, 5.25% to 6/15/26(2)(3)(4) | | 914 | 840,880 |
| Goldman Sachs Group, Inc. (The), Series V, 4.125% to 11/10/26(3)(4) | | 143 | 113,480 |
| | | | $ 1,304,353 |
| Electric Utilities — 0.3% |
| Dominion Energy, Inc., Series C, 4.35% to 1/15/27(3)(4) | $ | 583 | $ 477,273 |
| Edison International, Series B, 5.00% to 12/15/26(3)(4) | | 199 | 177,600 |
| Emera, Inc., Series 16-A, 6.75% to 6/15/26, 6/15/76(4) | | 450 | 424,884 |
| Sempra, 4.125% to 1/1/27, 4/1/52(4) | | 581 | 448,233 |
| Southern California Edison Co., Series E, 9.838%, (3 mo. SOFR + 4.461%)(3)(6) | | 249 | 248,651 |
| | | | $ 1,776,641 |
| Food Products — 0.1% |
| Land O' Lakes, Inc., 8.00%(2)(3) | $ | 824 | $ 733,360 |
| | | | $ 733,360 |
| Independent Power and Renewable Electricity Producers — 0.1% |
| Algonquin Power & Utilities Corp., 4.75% to 1/18/27, 1/18/82(4) | $ | 408 | $ 322,526 |
| | | | $ 322,526 |
Eaton Vance
Tax-Managed Equity Asset Allocation Fund
October 31, 2023
Portfolio of Investments — continued
| Security | Principal
Amount
(000's omitted) | Value |
| Insurance — 0.2% |
| Liberty Mutual Group, Inc., 4.125% to 9/15/26, 12/15/51(2)(4) | $ | 258 | $ 205,278 |
| Lincoln National Corp., Series C, 9.25% to 12/1/27(3)(4) | | 175 | 176,574 |
| QBE Insurance Group, Ltd., 5.875% to 5/12/25(2)(3)(4) | | 1,004 | 962,054 |
| | | | $ 1,343,906 |
| Oil, Gas & Consumable Fuels — 0.2% |
| EnLink Midstream Partners, L.P., Series C, 9.78%, (3 mo. SOFR + 4.372%)(3)(6) | $ | 658 | $ 586,805 |
| Odebrecht Oil & Gas Finance, Ltd., 0.00%(2)(3) | | 550 | 11,351 |
| Plains All American Pipeline, L.P., Series B, 9.736%, (3 mo. SOFR + 4.372%)(3)(6) | | 442 | 417,563 |
| | | | $ 1,015,719 |
| Pipelines — 0.1% |
| Enbridge, Inc., Series NC5, 8.25% to 10/15/28, 1/15/84(4) | $ | 400 | $ 383,572 |
| Energy Transfer, L.P., Series B, 6.625% to 2/15/28(3)(4) | | 359 | 278,674 |
| | | | $ 662,246 |
| Telecommunications — 0.1% |
| Rogers Communications, Inc., 5.25% to 3/15/27, 3/15/82(2)(4) | $ | 450 | $ 396,567 |
| | | | $ 396,567 |
Total Debt Obligations
(identified cost $23,978,344) | | | $ 21,273,813 |
| Security | Shares | Value |
| Capital Markets — 0.1% |
| Stifel Financial Corp., Series D, 4.50% | | 36,350 | $ 563,061 |
| | | | $ 563,061 |
| Electric Utilities — 0.1% |
| Brookfield BRP Holdings Canada, Inc., 4.625% | | 24,000 | $ 328,080 |
| SCE Trust III, Series H, 5.75% to 3/15/24(4) | | 6,321 | 152,589 |
| SCE Trust IV, Series J, 5.375% to 9/15/25(4) | | 2,004 | 39,379 |
| | | | $ 520,048 |
| Insurance — 0.1% |
| American Equity Investment Life Holding Co., Series B, 6.625% to 9/1/25(4) | | 12,251 | $ 280,793 |
| Security | Shares | Value |
| Insurance (continued) |
| Athene Holding, Ltd., Series C, 6.375% to 6/30/25(4) | | 9,631 | $ 233,744 |
| | | | $ 514,537 |
| Oil, Gas & Consumable Fuels — 0.2% |
| NuStar Energy, L.P., Series B, 11.315% (3 mo. SOFR + 5.905%)(6) | | 53,257 | $ 1,336,751 |
| | | | $ 1,336,751 |
| Pipelines — 0.1% |
| Energy Transfer, L.P.: | | | |
| Series C, 10.156%, (3 mo. SOFR + 4.53%) | | 15,000 | $ 375,150 |
| Series E, 7.60% to 5/15/24(4) | | 14,960 | 369,811 |
| | | | $ 744,961 |
| Real Estate Management & Development — 0.1% |
| Brookfield Property Partners, L.P.: | | | |
| Series A, 5.75% | | 2,080 | $ 20,384 |
| Series A-1, 6.50% | | 14,575 | 164,115 |
| Series A2, 6.375% | | 19,390 | 212,708 |
| | | | $ 397,207 |
| Retail REITs — 0.0%(7) |
| SITE Centers Corp., Series A, 6.375% | | 5,457 | $ 108,540 |
| | | | $ 108,540 |
Total Preferred Stocks
(identified cost $5,251,923) | | | $ 4,185,105 |
Total Investments — 100.1%
(identified cost $323,749,789) | | | $581,572,714 |
| Other Assets, Less Liabilities — (0.1)% | | | $ (406,394) |
| Net Assets — 100.0% | | | $581,166,320 |
| The percentage shown for each investment category in the Portfolio of Investments is based on net assets. |
| (1) | Debt obligations are hybrid instruments, as determined by the investment adviser. These instruments have characteristics of both equity and debt. |
| (2) | Security exempt from registration under Rule 144A of the Securities Act of 1933, as amended. These securities may be sold in certain transactions in reliance on an exemption from registration (normally to qualified institutional buyers). At October 31, 2023, the aggregate value of these securities is $6,267,615 or 1.1% of the Fund's net assets. |
| (3) | Perpetual security with no stated maturity date but may be subject to calls by the issuer. |
| (4) | Security converts to variable rate after the indicated fixed-rate coupon period. |
Eaton Vance
Tax-Managed Equity Asset Allocation Fund
October 31, 2023
Portfolio of Investments — continued
| (5) | Security exempt from registration under Regulation S of the Securities Act of 1933, as amended, which exempts from registration securities offered and sold outside the United States. Security may not be offered or sold in the United States except pursuant to an exemption from, or in a transaction not subject to, the registration requirements of the Securities Act of 1933, as amended. At October 31, 2023, the aggregate value of these securities is $328,994 or 0.1% of the Fund's net assets. |
| (6) | Variable rate security. The stated interest rate represents the rate in effect at October 31, 2023. |
| (7) | Amount is less than 0.05%. |
| Abbreviations: |
| REITs | – Real Estate Investment Trusts |
| SOFR | – Secured Overnight Financing Rate |
Eaton Vance
Tax-Managed Equity Asset Allocation Fund
October 31, 2023
Statement of Assets and Liabilities
| | October 31, 2023 |
| Assets | |
| Unaffiliated investments, at value (identified cost $29,230,267) | $ 25,458,918 |
| Affiliated investments, at value (identified cost $294,519,522) | 556,113,796 |
| Interest and dividends receivable | 258,998 |
| Receivable for Fund shares sold | 183,749 |
| Total assets | $582,015,461 |
| Liabilities | |
| Payable for Fund shares redeemed | $ 402,267 |
| Payable to affiliates: | |
| Investment adviser fee | 84,038 |
| Administration fee | 75,684 |
| Distribution and service fees | 116,935 |
| Trustees' fees | 42 |
| Accrued expenses | 170,175 |
| Total liabilities | $ 849,141 |
| Net Assets | $581,166,320 |
| Sources of Net Assets | |
| Paid-in capital | $ 198,385,562 |
| Distributable earnings | 382,780,758 |
| Net Assets | $581,166,320 |
| Class A Shares | |
| Net Assets | $ 406,566,878 |
| Shares Outstanding | 15,058,098 |
Net Asset Value and Redemption Price Per Share
(net assets ÷ shares of beneficial interest outstanding) | $ 27.00 |
Maximum Offering Price Per Share
(100 ÷ 94.75 of net asset value per share) | $ 28.50 |
| Class C Shares | |
| Net Assets | $ 32,698,086 |
| Shares Outstanding | 1,321,531 |
Net Asset Value and Offering Price Per Share*
(net assets ÷ shares of beneficial interest outstanding) | $ 24.74 |
| Class I Shares | |
| Net Assets | $ 141,901,356 |
| Shares Outstanding | 5,256,918 |
Net Asset Value, Offering Price and Redemption Price Per Share
(net assets ÷ shares of beneficial interest outstanding) | $ 26.99 |
| On sales of $50,000 or more, the offering price of Class A shares is reduced. |
| * | Redemption price per share is equal to the net asset value less any applicable contingent deferred sales charge. |
10
See Notes to Financial Statements.
Eaton Vance
Tax-Managed Equity Asset Allocation Fund
October 31, 2023
| | Year Ended |
| | October 31, 2023 |
| Investment Income | |
| Dividend income (net of foreign taxes withheld of $4,464) | $ 754,390 |
| Dividend income allocated from affiliated Portfolios (net of foreign taxes withheld of $201,995) | 8,920,148 |
| Interest income | 1,478,208 |
| Securities lending income allocated from affiliated Portfolios, net | 34,259 |
| Expenses allocated from affiliated Portfolios | (3,340,658) |
| Total investment income | $ 7,846,347 |
| Expenses | |
| Investment adviser fee | $ 1,013,492 |
| Administration fee | 896,487 |
| Distribution and service fees: | |
| Class A | 1,060,703 |
| Class C | 358,106 |
| Trustees’ fees and expenses | 500 |
| Custodian fee | 45,610 |
| Transfer and dividend disbursing agent fees | 315,152 |
| Legal and accounting services | 77,051 |
| Printing and postage | 17,803 |
| Registration fees | 50,084 |
| Miscellaneous | 16,603 |
| Total expenses | $ 3,851,591 |
| Net investment income | $ 3,994,756 |
| Realized and Unrealized Gain (Loss) | |
| Net realized gain (loss): | |
| Investment transactions | $ (3,757,946) |
| Foreign currency transactions | 41 |
| Net realized gain (loss) allocated from affiliated Portfolios: | |
| Investment transactions (net of foreign capital gains taxes of $49) | 16,065,609 (1) |
| Foreign currency transactions | 4,671 |
| Net realized gain | $12,312,375 |
| Change in unrealized appreciation (depreciation): | |
| Investments | $ 3,173,583 |
| Change in unrealized appreciation (depreciation) allocated from affiliated Portfolios: | |
| Investments | 14,338,143 |
| Foreign currency | 10,354 |
| Net change in unrealized appreciation (depreciation) | $17,522,080 |
| Net realized and unrealized gain | $29,834,455 |
| Net increase in net assets from operations | $33,829,211 |
| (1) | Includes $13,930,792 of net realized gains from redemptions in-kind. |
11
See Notes to Financial Statements.
Eaton Vance
Tax-Managed Equity Asset Allocation Fund
October 31, 2023
Statements of Changes in Net Assets
| | Year Ended October 31, |
| | 2023 | 2022 |
| Increase (Decrease) in Net Assets | | |
| From operations: | | |
| Net investment income | $ 3,994,756 | $ 3,553,648 |
| Net realized gain | 12,312,375 (1) | 12,614,643 (2) |
| Net change in unrealized appreciation (depreciation) | 17,522,080 | (133,749,189) |
| Net increase (decrease) in net assets from operations | $ 33,829,211 | $(117,580,898) |
| Distributions to shareholders: | | |
| Class A | $ (3,164,977) | $ (13,091,273) |
| Class C | (86,016) | (955,498) |
| Class I | (1,305,229) | (4,252,703) |
| Total distributions to shareholders | $ (4,556,222) | $ (18,299,474) |
| Transactions in shares of beneficial interest: | | |
| Class A | $ (20,159,478) | $ (10,281,966) |
| Class C | (3,587,785) | (818,985) |
| Class I | 10,104,782 | 5,460,422 |
| Net decrease in net assets from Fund share transactions | $ (13,642,481) | $ (5,640,529) |
| Net increase (decrease) in net assets | $ 15,630,508 | $(141,520,901) |
| Net Assets | | |
| At beginning of year | $ 565,535,812 | $ 707,056,713 |
| At end of year | $581,166,320 | $ 565,535,812 |
| (1) | Includes $13,930,792 of net realized gains from redemptions in-kind. |
| (2) | Includes $12,229,272 of net realized gains from redemptions in-kind. |
12
See Notes to Financial Statements.
Eaton Vance
Tax-Managed Equity Asset Allocation Fund
October 31, 2023
| | Class A |
| | Year Ended October 31, |
| | 2023 | 2022 | 2021 | 2020 | 2019 |
| Net asset value — Beginning of year | $ 25.670 | $ 31.710 | $ 23.070 | $ 22.370 | $ 20.450 |
| Income (Loss) From Operations | | | | | |
| Net investment income(1) | $ 0.180 | $ 0.157 | $ 0.102 | $ 0.165 | $ 0.193 |
| Net realized and unrealized gain (loss) | 1.351 | (5.384) | 8.690 | 0.969 | 2.122 |
| Total income (loss) from operations | $ 1.531 | $ (5.227) | $ 8.792 | $ 1.134 | $ 2.315 |
| Less Distributions | | | | | |
| From net investment income | $ (0.143) | $ (0.104) | $ (0.152) | $ (0.154) | $ (0.163) |
| From net realized gain | (0.058) | (0.709) | — | (0.280) | (0.232) |
| Total distributions | $ (0.201) | $ (0.813) | $ (0.152) | $ (0.434) | $ (0.395) |
| Net asset value — End of year | $ 27.000 | $ 25.670 | $ 31.710 | $ 23.070 | $ 22.370 |
| Total Return(2) | 6.01% | (16.91)% | 38.24% | 5.07% | 11.75% |
| Ratios/Supplemental Data | | | | | |
| Net assets, end of year (000’s omitted) | $406,567 | $405,236 | $513,507 | $373,289 | $379,547 |
| Ratios (as a percentage of average daily net assets):(3) | | | | | |
| Expenses | 1.22% (4) | 1.25% (4) | 1.26% | 1.28% | 1.33% |
| Net investment income | 0.66% | 0.56% | 0.35% | 0.74% | 0.91% |
| Portfolio Turnover of the Fund(5) | 4% | 5% | 6% | 7% | 7% |
| (1) | Computed using average shares outstanding. |
| (2) | Returns are historical and are calculated by determining the percentage change in net asset value with all distributions reinvested and do not reflect the effect of sales charges. |
| (3) | Includes the Fund’s share of the Portfolios’ allocated expenses. |
| (4) | Includes a reduction by the investment adviser of a portion of the Portfolios' adviser fees due to the Portfolios' investments in the Liquidity Fund (equal to less than 0.005% of average daily net assets for the years ended October 31, 2023 and 2022). |
| (5) | Percentage includes both the Fund’s contributions to and withdrawals from the Portfolios and purchases and sales of securities held directly by the Fund, if any. |
13
See Notes to Financial Statements.
Eaton Vance
Tax-Managed Equity Asset Allocation Fund
October 31, 2023
Financial Highlights — continued
| | Class C |
| | Year Ended October 31, |
| | 2023 | 2022 | 2021 | 2020 | 2019 |
| Net asset value — Beginning of year | $ 23.570 | $ 29.230 | $ 21.310 | $ 20.700 | $ 18.930 |
| Income (Loss) From Operations | | | | | |
| Net investment income (loss)(1) | $ (0.022) | $ (0.049) | $ (0.102) | $ 0.001 | $ 0.043 |
| Net realized and unrealized gain (loss) | 1.250 | (4.963) | 8.022 | 0.889 | 1.965 |
| Total income (loss) from operations | $ 1.228 | $ (5.012) | $ 7.920 | $ 0.890 | $ 2.008 |
| Less Distributions | | | | | |
| From net investment income | $ — | $ — | $ — | $ — | $ (0.006) |
| From net realized gain | (0.058) | (0.648) | — | (0.280) | (0.232) |
| Total distributions | $ (0.058) | $ (0.648) | $ — | $ (0.280) | $ (0.238) |
| Net asset value — End of year | $24.740 | $23.570 | $29.230 | $21.310 | $20.700 |
| Total Return(2) | 5.22% | (17.53)% | 37.17% | 4.29% | 10.88% |
| Ratios/Supplemental Data | | | | | |
| Net assets, end of year (000’s omitted) | $ 32,698 | $ 34,490 | $ 43,788 | $ 44,822 | $ 56,979 |
| Ratios (as a percentage of average daily net assets):(3) | | | | | |
| Expenses | 1.97% (4) | 2.00% (4) | 2.01% | 2.03% | 2.08% |
| Net investment income (loss) | (0.09)% | (0.19)% | (0.38)% | 0.00% (5) | 0.23% |
| Portfolio Turnover of the Fund(6) | 4% | 5% | 6% | 7% | 7% |
| (1) | Computed using average shares outstanding. |
| (2) | Returns are historical and are calculated by determining the percentage change in net asset value with all distributions reinvested and do not reflect the effect of sales charges. |
| (3) | Includes the Fund’s share of the Portfolios’ allocated expenses. |
| (4) | Includes a reduction by the investment adviser of a portion of the Portfolios' adviser fees due to the Portfolios' investments in the Liquidity Fund (equal to less than 0.005% of average daily net assets for the years ended October 31, 2023 and 2022). |
| (5) | Amount is less than 0.005%. |
| (6) | Percentage includes both the Fund’s contributions to and withdrawals from the Portfolios and purchases and sales of securities held directly by the Fund, if any. |
14
See Notes to Financial Statements.
Eaton Vance
Tax-Managed Equity Asset Allocation Fund
October 31, 2023
Financial Highlights — continued
| | Class I |
| | Year Ended October 31, |
| | 2023 | 2022 | 2021 | 2020 | 2019 |
| Net asset value — Beginning of year | $ 25.670 | $ 31.700 | $ 23.060 | $ 22.360 | $ 20.450 |
| Income (Loss) From Operations | | | | | |
| Net investment income(1) | $ 0.246 | $ 0.227 | $ 0.172 | $ 0.220 | $ 0.244 |
| Net realized and unrealized gain (loss) | 1.345 | (5.369) | 8.678 | 0.968 | 2.113 |
| Total income (loss) from operations | $ 1.591 | $ (5.142) | $ 8.850 | $ 1.188 | $ 2.357 |
| Less Distributions | | | | | |
| From net investment income | $ (0.213) | $ (0.179) | $ (0.210) | $ (0.208) | $ (0.215) |
| From net realized gain | (0.058) | (0.709) | — | (0.280) | (0.232) |
| Total distributions | $ (0.271) | $ (0.888) | $ (0.210) | $ (0.488) | $ (0.447) |
| Net asset value — End of year | $ 26.990 | $ 25.670 | $ 31.700 | $23.060 | $22.360 |
| Total Return(2) | 6.26% | (16.68)% | 38.56% | 5.31% | 12.02% |
| Ratios/Supplemental Data | | | | | |
| Net assets, end of year (000’s omitted) | $141,901 | $125,810 | $149,762 | $ 97,355 | $ 89,758 |
| Ratios (as a percentage of average daily net assets):(3) | | | | | |
| Expenses | 0.97% (4) | 1.00% (4) | 1.01% | 1.03% | 1.08% |
| Net investment income | 0.90% | 0.81% | 0.60% | 0.99% | 1.16% |
| Portfolio Turnover of the Fund(5) | 4% | 5% | 6% | 7% | 7% |
| (1) | Computed using average shares outstanding. |
| (2) | Returns are historical and are calculated by determining the percentage change in net asset value with all distributions reinvested. |
| (3) | Includes the Fund’s share of the Portfolios’ allocated expenses. |
| (4) | Includes a reduction by the investment adviser of a portion of the Portfolios' adviser fees due to the Portfolios' investments in the Liquidity Fund (equal to less than 0.005% of average daily net assets for the years ended October 31, 2023 and 2022). |
| (5) | Percentage includes both the Fund’s contributions to and withdrawals from the Portfolios and purchases and sales of securities held directly by the Fund, if any. |
15
See Notes to Financial Statements.
Eaton Vance
Tax-Managed Equity Asset Allocation Fund
October 31, 2023
Notes to Financial Statements
1 Significant Accounting Policies
Eaton Vance Tax-Managed Equity Asset Allocation Fund (the Fund) is a diversified series of Eaton Vance Mutual Funds Trust (the Trust). The Trust is a Massachusetts business trust registered under the Investment Company Act of 1940, as amended (the 1940 Act), as an open-end management investment company. The Fund offers three classes of shares. Class A shares are generally sold subject to a sales charge imposed at time of purchase. Class C shares are sold at net asset value and are generally subject to a contingent deferred sales charge (see Note 5). Effective November 5, 2020, Class C shares automatically convert to Class A shares eight years after their purchase as described in the Fund’s prospectus. Class I shares are sold at net asset value and are not subject to a sales charge. Each class represents a pro rata interest in the Fund, but votes separately on class-specific matters and (as noted below) is subject to different expenses. Realized and unrealized gains and losses and net investment income and losses, other than class-specific expenses, are allocated daily to each class of shares based on the relative net assets of each class to the total net assets of the Fund. Each class of shares differs in its distribution plan and certain other class-specific expenses. The Fund’s investment objective is to achieve long-term, after-tax returns for its shareholders. The Fund currently pursues its objective by investing directly in securities and in interests in five tax-managed equity portfolios managed by Eaton Vance Management (EVM) or its affiliates (the Portfolios), which are Massachusetts business trusts. The value of the Fund’s investments in the Portfolios reflects the Fund’s proportionate interest in their net assets. The Portfolios and the Fund’s proportionate interest in each of their net assets at October 31, 2023 were as follows: Tax-Managed Growth Portfolio (5.0%), Tax-Managed Value Portfolio (18.9%), Tax-Managed International Equity Portfolio (45.7%), Tax-Managed Multi-Cap Growth Portfolio (44.3%) and Tax-Managed Small-Cap Portfolio (34.5%). The performance of the Fund is directly affected by the performance of the Portfolios. A copy of each Portfolio’s financial statements is available by calling Eaton Vance at 1-800-262-1122 or in the EDGAR database on the Securities and Exchange Commission’s website at www.sec.gov.
The following is a summary of significant accounting policies of the Fund. The policies are in conformity with accounting principles generally accepted in the United States of America (U.S. GAAP). The Fund is an investment company and follows accounting and reporting guidance in the Financial Accounting Standards Board (FASB) Accounting Standards Codification Topic 946.
A Investment Valuation—The valuation policies common to the Portfolios are as follows:
Equity Securities. Equity securities listed on a U.S. securities exchange generally are valued at the last sale or closing price on the day of valuation or, if no sales took place on such date, at the mean between the closing bid and ask prices on the exchange where such securities are principally traded. Equity securities listed on the NASDAQ National Market System are valued at the NASDAQ official closing price. Unlisted or listed securities for which closing sales prices or closing quotations are not available are valued at the mean between the latest available bid and ask prices.
Foreign Securities and Currencies. Foreign securities and currencies are valued in U.S. dollars, based on foreign currency exchange rate quotations supplied by a third party pricing service. The pricing service uses a proprietary model to determine the exchange rate. Inputs to the model include reported trades and implied bid/ask spreads. The daily valuation of exchange-traded foreign securities generally is determined as of the close of trading on the principal exchange on which such securities trade. Events occurring after the close of trading on foreign exchanges may result in adjustments to the valuation of foreign securities to more accurately reflect their fair value as of the close of regular trading on the New York Stock Exchange. When valuing foreign equity securities that meet certain criteria, the Fund's Trustees have approved the use of a fair value service that values such securities to reflect market trading that occurs after the close of the applicable foreign markets of comparable securities or other instruments that have a strong correlation to the fair-valued securities.
Other. Investments in management investment companies (including money market funds) that do not trade on an exchange are valued at the net asset value as of the close of each business day.
Fair Valuation. In connection with Rule 2a-5 of the 1940 Act, the Trustees have designated the Portfolios' investment adviser as its valuation designee. Investments for which valuations or market quotations are not readily available or are deemed unreliable are valued by the investment adviser, as valuation designee, at fair value using methods that most fairly reflect the security’s “fair value”, which is the amount that the Portfolios might reasonably expect to receive for the security upon its current sale in the ordinary course. Each such determination is based on a consideration of relevant factors, which are likely to vary from one pricing context to another. These factors may include, but are not limited to, the type of security, the existence of any contractual restrictions on the security’s disposition, the price and extent of public trading in similar securities of the issuer or of comparable companies or entities, quotations or relevant information obtained from broker/dealers or other market participants, information obtained from the issuer, analysts, and/or the appropriate stock exchange (for exchange-traded securities), an analysis of the company’s or entity’s financial statements, and an evaluation of the forces that influence the issuer and the market(s) in which the security is purchased and sold.
In addition to investing in the Portfolios, the Fund may invest directly in securities. The valuation policies of the Fund are consistent with the valuation policies of the Portfolios. Additional valuation policies of the Fund are as follows:
Debt Obligations. Debt obligations are generally valued on the basis of valuations provided by third party pricing services, as derived from such services’ pricing models. Inputs to the models may include, but are not limited to, reported trades, executable bid and ask prices, broker/dealer quotations, prices or yields of securities with similar characteristics, interest rates, anticipated prepayments, benchmark curves or information pertaining to the issuer, as well as industry and economic events. The pricing services may use a matrix approach, which considers information regarding securities with similar characteristics to determine the valuation for a security. Short-term debt obligations purchased with a remaining maturity of sixty days or less for which a valuation from a third party pricing service is not readily available may be valued at amortized cost, which approximates fair value.
Eaton Vance
Tax-Managed Equity Asset Allocation Fund
October 31, 2023
Notes to Financial Statements — continued
Preferred Equity Securities. Preferred equity securities that are not listed or traded in the over-the-counter market are valued by a third party pricing service that uses various techniques that consider factors including, but not limited to, prices or yields of securities with similar characteristics, benchmark yields, broker/dealer quotes, quotes of underlying common stock, issuer spreads, as well as industry and economic events.
B Income—The Fund's net investment income or loss includes the Fund's pro rata share of the net investment income or loss of the Portfolios, less all actual and accrued expenses of the Fund. Dividend income is recorded on the ex-dividend date for dividends received in cash and/or securities. However, if the ex-dividend date has passed, certain dividends from foreign securities are recorded as the Fund is informed of the ex-dividend date. Withholding taxes on foreign dividends and capital gains have been provided for in accordance with the Fund’s understanding of the applicable countries’ tax rules and rates. Distributions from investment companies are recorded as dividend income, capital gains or return of capital based on the nature of the distribution. Interest income is recorded on the basis of interest accrued, adjusted for amortization of premium or accretion of discount.
C Federal Taxes—The Fund’s policy is to comply with the provisions of the Internal Revenue Code applicable to regulated investment companies and to distribute to shareholders each year substantially all of its net investment income, and all or substantially all of its net realized capital gains. Accordingly, no provision for federal income or excise tax is necessary.
As of October 31, 2023, the Fund had no uncertain tax positions that would require financial statement recognition, de-recognition, or disclosure. The Fund files a U.S. federal income tax return annually after its fiscal year-end, which is subject to examination by the Internal Revenue Service for a period of three years from the date of filing.
D Foreign Currency Translation—Investment valuations, other assets, and liabilities initially expressed in foreign currencies are translated each business day into U.S. dollars based upon current exchange rates. Purchases and sales of foreign investment securities and income and expenses denominated in foreign currencies are translated into U.S. dollars based upon currency exchange rates in effect on the respective dates of such transactions. Recognized gains or losses on investment transactions attributable to changes in foreign currency exchange rates are recorded for financial statement purposes as net realized gains and losses on investments. That portion of unrealized gains and losses on investments that results from fluctuations in foreign currency exchange rates is not separately disclosed.
E Expenses—The majority of expenses of the Trust are directly identifiable to an individual fund. Expenses which are not readily identifiable to a specific fund are allocated taking into consideration, among other things, the nature and type of expense and the relative size of the funds.
F Use of Estimates—The preparation of the financial statements in conformity with U.S. GAAP requires management to make estimates and assumptions that affect the reported amounts of assets and liabilities at the date of the financial statements and the reported amounts of income and expense during the reporting period. Actual results could differ from those estimates.
G Indemnifications— Under the Trust’s organizational documents, its officers and Trustees may be indemnified against certain liabilities and expenses arising out of the performance of their duties to the Fund. Under Massachusetts law, if certain conditions prevail, shareholders of a Massachusetts business trust (such as the Trust) could be deemed to have personal liability for the obligations of the Trust. However, the Trust’s Declaration of Trust contains an express disclaimer of liability on the part of Fund shareholders and the By-laws provide that the Trust shall assume, upon request by the shareholder, the defense on behalf of any Fund shareholders. Moreover, the By-laws also provide for indemnification out of Fund property of any shareholder held personally liable solely by reason of being or having been a shareholder for all loss or expense arising from such liability. Additionally, in the normal course of business, the Fund enters into agreements with service providers that may contain indemnification clauses. The Fund’s maximum exposure under these arrangements is unknown as this would involve future claims that may be made against the Fund that have not yet occurred.
H Other—Investment transactions are accounted for on a trade date basis. Realized gains and losses on investments sold are determined on the basis of identified cost.
2 Distributions to Shareholders and Income Tax Information
It is the present policy of the Fund to make at least one distribution annually (normally in December) of all or substantially all of its net investment income and to distribute annually all or substantially all of its net realized capital gains. Distributions to shareholders are recorded on the ex-dividend date. Distributions are declared separately for each class of shares. Shareholders may reinvest income and capital gain distributions in additional shares of the same class of the Fund at the net asset value as of the ex-dividend date or, at the election of the shareholder, receive distributions in cash. Distributions to shareholders are determined in accordance with income tax regulations, which may differ from U.S. GAAP. As required by U.S. GAAP, only distributions in excess of tax basis earnings and profits are reported in the financial statements as a return of capital. Permanent differences between book and tax accounting relating to distributions are reclassified to paid-in capital. For tax purposes, distributions from short-term capital gains are considered to be from ordinary income.
Eaton Vance
Tax-Managed Equity Asset Allocation Fund
October 31, 2023
Notes to Financial Statements — continued
The tax character of distributions declared for the years ended October 31, 2023 and October 31, 2022 was as follows:
| | Year Ended October 31, |
| | 2023 | 2022 |
| Ordinary income | $3,277,650 | $ 3,810,323 |
| Long-term capital gains | $1,278,572 | $14,489,151 |
During the year ended October 31, 2023, distributable earnings was decreased by $130,177 and paid-in capital was increased by $130,177 due to the Fund’s use of equalization accounting. Tax equalization accounting allows the Fund to treat as a distribution that portion of redemption proceeds representing a redeeming shareholder’s portion of undistributed taxable income and net capital gains. These reclassifications had no effect on the net assets or net asset value per share of the Fund.
As of October 31, 2023, the components of distributable earnings (accumulated loss) on a tax basis were as follows:
| Undistributed ordinary income | $ 2,751,180 |
| Deferred capital losses | (1,765,695) |
| Net unrealized appreciation | 381,687,043 |
| Other temporary differences | 108,230 |
| Distributable earnings | $382,780,758 |
At October 31, 2023, the Fund, for federal income tax purposes, had deferred capital losses of $1,765,695 which would reduce its taxable income arising from future net realized gains on investment transactions, if any, to the extent permitted by the Internal Revenue Code, and thus would reduce the amount of distributions to shareholders, which would otherwise be necessary to relieve the Fund of any liability for federal income or excise tax. The deferred capital losses are treated as arising on the first day of the Fund’s next taxable year and retain the same short-term or long-term character as when originally deferred. Of the deferred capital losses at October 31, 2023, $1,765,695 are short-term.
The cost and unrealized appreciation (depreciation) of investments of the Fund, including the affiliated Portfolios, at October 31, 2023, as determined on a federal income tax basis, were as follows:
| Aggregate cost | $199,885,675 |
| Gross unrealized appreciation | $ 385,743,338 |
| Gross unrealized depreciation | (4,056,299) |
| Net unrealized appreciation | $381,687,039 |
3 Investment Adviser Fee and Other Transactions with Affiliates
The investment adviser fee is earned by EVM, an indirect, wholly-owned subsidiary of Morgan Stanley, as compensation for investment advisory services rendered to the Fund. The fee is computed at an annual rate as a percentage of the Fund’s average daily net assets as follows and is payable monthly:
| Average Daily Net Assets | Annual Fee Rate |
| Up to $500 million | 0.700% |
| $500 million but less than $1 billion | 0.600% |
| $1 billion but less than $1.5 billion | 0.575% |
| $1.5 billion but less than $2.5 billion | 0.550% |
| $2.5 billion and over | 0.525% |
Eaton Vance
Tax-Managed Equity Asset Allocation Fund
October 31, 2023
Notes to Financial Statements — continued
The investment adviser fee payable by the Fund is reduced by the Fund’s allocable share of any fee paid pursuant to an investment advisory agreement by any investment company advised by EVM or its affiliates in which the Fund invests. The Portfolios may invest in a money market fund, the Institutional Class of the Morgan Stanley Institutional Liquidity Funds - Government Portfolio (the “Liquidity Fund"), an open-end management investment company managed by Morgan Stanley Investment Management Inc., a wholly-owned subsidiary of Morgan Stanley. The investment adviser fee paid by the Portfolios is reduced by an amount equal to their pro rata share of the advisory and administration fees paid by the Portfolios due to their investments in the Liquidity Fund. For the year ended October 31, 2023, the Fund’s allocated share of the reduction of the investment adviser fee paid by the Portfolios was $5,873 relating to the Portfolios’ investments in the Liquidity Fund.
For the year ended October 31, 2023, the Fund’s investment adviser fee totaled $4,085,948, of which $3,072,456 was allocated from the Portfolios and $1,013,492 was paid or accrued directly by the Fund. For the year ended October 31, 2023, the Fund’s investment adviser fee, including the fees allocated from the Portfolios, was 0.68% of the Fund’s average daily net assets. The administration fee is earned by EVM as compensation for administering the business affairs of the Fund and is computed at an annual rate of 0.15% of the Fund’s average daily net assets. For the year ended October 31, 2023, the administration fee amounted to $896,487.
EVM provides sub-transfer agency and related services to the Fund pursuant to a Sub-Transfer Agency Support Services Agreement. For the year ended October 31, 2023, EVM earned $92,374 from the Fund pursuant to such agreement, which is included in transfer and dividend disbursing agent fees on the Statement of Operations. The Fund was informed that Eaton Vance Distributors, Inc. (EVD), an affiliate of EVM and the Fund’s principal underwriter, received $23,897 as its portion of the sales charge on sales of Class A shares for the year ended October 31, 2023. EVD also received distribution and service fees from Class A and Class C shares (see Note 4) and contingent deferred sales charges (see Note 5).
Trustees and officers of the Fund and the Portfolios who are members of EVM’s organization receive remuneration for their services to the Fund out of the investment adviser fee. Certain officers and Trustees of the Fund and the Portfolios are officers of EVM.
4 Distribution Plans
The Fund has in effect a distribution plan for Class A shares (Class A Plan) pursuant to Rule 12b-1 under the 1940 Act. Pursuant to the Class A Plan, the Fund pays EVD a distribution and service fee of 0.25% per annum of its average daily net assets attributable to Class A shares for distribution services and facilities provided to the Fund by EVD, as well as for personal services and/or the maintenance of shareholder accounts. Distribution and service fees paid or accrued to EVD for the year ended October 31, 2023 amounted to $1,060,703 for Class A shares.
The Fund also has in effect a distribution plan for Class C shares (Class C Plan) pursuant to Rule 12b-1 under the 1940 Act. Pursuant to the Class C Plan, the Fund pays EVD amounts equal to 0.75% per annum of its average daily net assets attributable to Class C shares for providing ongoing distribution services and facilities to the Fund. For the year ended October 31, 2023, the Fund paid or accrued to EVD $268,579 for Class C shares.
Pursuant to the Class C Plan, the Fund also makes payments of service fees to EVD, financial intermediaries and other persons in amounts equal to 0.25% per annum of its average daily net assets attributable to that class. Service fees paid or accrued are for personal services and/or the maintenance of shareholder accounts. They are separate and distinct from the sales commissions and distribution fees payable to EVD. Service fees paid or accrued for the year ended October 31, 2023 amounted to $89,527 for Class C shares.
Distribution and service fees are subject to the limitations contained in the Financial Industry Regulatory Authority Rule 2341(d).
5 Contingent Deferred Sales Charges
A contingent deferred sales charge (CDSC) of 1% generally is imposed on redemptions of Class C shares made within 12 months of purchase. Class A shares may be subject to a 1% CDSC if redeemed within 12 months of purchase (depending on the circumstances of purchase). Generally, the CDSC is based upon the lower of the net asset value at date of redemption or date of purchase. No charge is levied on shares acquired by reinvestment of dividends or capital gain distributions. For the year ended October 31, 2023, the Fund was informed that EVD received $4,121 of CDSCs paid by Class C shareholders and no CDSCs paid by Class A shareholders.
Eaton Vance
Tax-Managed Equity Asset Allocation Fund
October 31, 2023
Notes to Financial Statements — continued
6 Investment Transactions
For the year ended October 31, 2023, increases and decreases in the Fund's investments in the Portfolios were as follows:
| Portfolio | Contributions | Withdrawals |
| Tax-Managed Growth Portfolio | $7,063,745 | $9,925,427 |
| Tax-Managed International Equity Portfolio | 1,867,293 | 2,624,799 |
| Tax-Managed Multi-Cap Growth Portfolio | 2,799,912 | 3,936,168 |
| Tax-Managed Small-Cap Portfolio | 2,592,511 | 3,644,601 |
| Tax-Managed Value Portfolio | 6,429,427 | 9,038,609 |
7 Purchases and Sales of Investments
Purchases and sales of investments, other than short-term obligations and investments in the Portfolios, aggregated $4,665,115 and $15,777,641, respectively, for the year ended October 31, 2023.
8 Shares of Beneficial Interest
The Fund’s Declaration of Trust permits the Trustees to issue an unlimited number of full and fractional shares of beneficial interest (without par value). Such shares may be issued in a number of different series (such as the Fund) and classes. Transactions in Fund shares, including direct exchanges pursuant to share class conversions, were as follows:
| | Year Ended
October 31, 2023 | | Year Ended
October 31, 2022 |
| | Shares | Amount | | Shares | Amount |
| Class A | | | | | |
| Sales | 638,605 | $ 17,459,127 | | 622,834 | $ 17,651,843 |
| Issued to shareholders electing to receive payments of distributions in Fund shares | 113,819 | 2,905,787 | | 391,331 | 12,049,069 |
| Redemptions | (1,481,156) | (40,524,392) | | (1,423,673) | (39,982,878) |
| Net decrease | (728,732) | $(20,159,478) | | (409,508) | $(10,281,966) |
| Class C | | | | | |
| Sales | 264,803 | $ 6,591,501 | | 303,090 | $ 7,709,274 |
| Issued to shareholders electing to receive payments of distributions in Fund shares | 3,594 | 84,643 | | 32,978 | 938,540 |
| Redemptions | (409,940) | (10,263,929) | | (370,961) | (9,466,799) |
| Net decrease | (141,543) | $ (3,587,785) | | (34,893) | $ (818,985) |
| Class I | | | | | |
| Sales | 1,016,149 | $ 27,963,225 | | 804,880 | $ 22,384,882 |
| Issued to shareholders electing to receive payments of distributions in Fund shares | 48,921 | 1,246,030 | | 131,671 | 4,046,241 |
| Redemptions | (709,260) | (19,104,473) | | (759,383) | (20,970,701) |
| Net increase | 355,810 | $ 10,104,782 | | 177,168 | $ 5,460,422 |
Eaton Vance
Tax-Managed Equity Asset Allocation Fund
October 31, 2023
Notes to Financial Statements — continued
9 Fair Value Measurements
Under generally accepted accounting principles for fair value measurements, a three-tier hierarchy to prioritize the assumptions, referred to as inputs, is used in valuation techniques to measure fair value. The three-tier hierarchy of inputs is summarized in the three broad levels listed below.
| • | Level 1 – quoted prices in active markets for identical investments |
| • | Level 2 – other significant observable inputs (including quoted prices for similar investments, interest rates, prepayment speeds, credit risk, etc.) |
| • | Level 3 – significant unobservable inputs (including a fund's own assumptions in determining the fair value of investments) |
In cases where the inputs used to measure fair value fall in different levels of the fair value hierarchy, the level disclosed is determined based on the lowest level input that is significant to the fair value measurement in its entirety. The inputs or methodology used for valuing securities are not necessarily an indication of the risk associated with investing in those securities.
At October 31, 2023, the hierarchy of inputs used in valuing the Fund's investments in securities and investments in the Portfolios, which are carried at fair value, were as follows:
| Asset Description | Level 1 | Level 2 | Level 3 | Total |
| Investments in Affiliated Portfolios | $ 556,113,796 | $ — | $ — | $ 556,113,796 |
| Debt Obligations | — | 21,273,813 | — | 21,273,813 |
| Preferred Stocks | 4,185,105 | — | — | 4,185,105 |
| Total Investments | $ 560,298,901 | $ 21,273,813 | $ — | $581,572,714 |
Eaton Vance
Tax-Managed Equity Asset Allocation Fund
October 31, 2023
Report of Independent Registered Public Accounting Firm
To the Trustees of Eaton Vance Mutual Funds Trust and Shareholders of Eaton Vance Tax-Managed Equity Asset Allocation Fund:
Opinion on the Financial Statements and Financial Highlights
We have audited the accompanying statement of assets and liabilities of Eaton Vance Tax-Managed Equity Asset Allocation Fund (the “Fund") (one of the funds constituting Eaton Vance Mutual Funds Trust), including the portfolio of investments, as of October 31, 2023, the related statement of operations for the year then ended, the statements of changes in net assets for each of the two years in the period then ended, the financial highlights for each of the five years in the period then ended, and the related notes. In our opinion, the financial statements and financial highlights present fairly, in all material respects, the financial position of the Fund as of October 31, 2023, and the results of its operations for the year then ended, the changes in its net assets for each of the two years in the period then ended, and the financial highlights for each of the five years in the period then ended, in conformity with accounting principles generally accepted in the United States of America.
Basis for Opinion
These financial statements and financial highlights are the responsibility of the Fund's management. Our responsibility is to express an opinion on the Fund's financial statements and financial highlights based on our audits. We are a public accounting firm registered with the Public Company Accounting Oversight Board (United States) (PCAOB) and are required to be independent with respect to the Fund in accordance with the U.S. federal securities laws and the applicable rules and regulations of the Securities and Exchange Commission and the PCAOB.
We conducted our audits in accordance with the standards of the PCAOB. Those standards require that we plan and perform the audit to obtain reasonable assurance about whether the financial statements and financial highlights are free of material misstatement, whether due to error or fraud. The Fund is not required to have, nor were we engaged to perform, an audit of its internal control over financial reporting. As part of our audits, we are required to obtain an understanding of internal control over financial reporting but not for the purpose of expressing an opinion on the effectiveness of the Fund’s internal control over financial reporting. Accordingly, we express no such opinion.
Our audits included performing procedures to assess the risks of material misstatement of the financial statements and financial highlights, whether due to error or fraud, and performing procedures that respond to those risks. Such procedures included examining, on a test basis, evidence regarding the amounts and disclosures in the financial statements and financial highlights. Our audits also included evaluating the accounting principles used and significant estimates made by management, as well as evaluating the overall presentation of the financial statements and financial highlights. Our procedures included confirmation of securities owned as of October 31, 2023, by correspondence with the custodian and brokers; when replies were not received from brokers, we performed other auditing procedures. We believe that our audits provide a reasonable basis for our opinion.
/s/ Deloitte & Touche LLP
Boston, Massachusetts
December 22, 2023
We have served as the auditor of one or more Eaton Vance investment companies since 1959.
Eaton Vance
Tax-Managed Equity Asset Allocation Fund
October 31, 2023
Federal Tax Information (Unaudited)
The Form 1099-DIV you receive in February 2024 will show the tax status of all distributions paid to your account in calendar year 2023. Shareholders are advised to consult their own tax adviser with respect to the tax consequences of their investment in the Fund. As required by the Internal Revenue Code and/or regulations, shareholders must be notified regarding the status of qualified dividend income for individuals and the dividends received deduction for corporations.
Qualified Dividend Income. For the fiscal year ended October 31, 2023, the Fund designates approximately $8,409,314, or up to the maximum amount of such dividends allowable pursuant to the Internal Revenue Code, as qualified dividend income eligible for the reduced tax rate of 15%.
Dividends Received Deduction. Corporate shareholders are generally entitled to take the dividends received deduction on the portion of the Fund’s dividend distribution that qualifies under tax law. For the Fund’s fiscal 2023 ordinary income dividends, 100% qualifies for the corporate dividends received deduction.
Eaton Vance
Tax-Managed Equity Asset Allocation Fund
October 31, 2023
Board of Trustees’ Contract Approval
Overview of the Contract Review Process
The Investment Company Act of 1940, as amended (the “1940 Act”), provides, in substance, that the investment advisory agreement between a fund and its investment adviser will continue in effect from year-to-year only if its continuation is approved on an annual basis by a vote of the fund’s board of trustees, including a majority of the trustees who are not “interested persons” of the fund (“independent trustees”), cast in person at a meeting called for the purpose of considering such approval.
At a meeting held on June 8, 2023, the Boards of Trustees/Directors (collectively, the “Board”) that oversee the registered investment companies advised by Eaton Vance Management or its affiliate, Boston Management and Research (the “Eaton Vance Funds”), including a majority of the independent trustees (the “Independent Trustees”), voted to approve the continuation of existing investment advisory agreements and sub-advisory agreements1 for each of the Eaton Vance Funds for an additional one-year period. The Board relied upon the affirmative recommendation of its Contract Review Committee, which is a committee exclusively comprised of Independent Trustees. Prior to making its recommendation, the Contract Review Committee reviewed information furnished by the adviser and sub-adviser to each of the Eaton Vance Funds (including information specifically requested by the Board) for a series of formal meetings held between April and June 2023, as well as certain additional information provided in response to specific requests from the Independent Trustees as members of the Contract Review Committee. Members of the Contract Review Committee also considered information received at prior meetings of the Board and its committees, to the extent such information was relevant to the Contract Review Committee’s annual evaluation of the investment advisory agreements and sub-advisory agreements.
In connection with its evaluation of the investment advisory agreements and sub-advisory agreements, the Board considered various information relating to the Eaton Vance Funds. This included information applicable to all or groups of Eaton Vance Funds, which is referenced immediately below, and information applicable to the particular Eaton Vance Fund covered by this report (each “Eaton Vance Fund” is referred to below as a “fund”). (For funds that invest through one or more underlying portfolios, references to “each fund” in this section may include information that was considered at the portfolio-level.)
Information about Fees, Performance and Expenses
• A report from an independent data provider comparing advisory and other fees paid by each fund to such fees paid by comparable funds, as identified by the independent data provider (“comparable funds”);
• A report from an independent data provider comparing each fund’s total expense ratio (and its components) to those of comparable funds;
• A report from an independent data provider comparing the investment performance of each fund (including, as relevant, total return data, income data, Sharpe ratios and information ratios) to the investment performance of comparable funds and, as applicable, benchmark indices, over various time periods;
• In certain instances, data regarding investment performance relative to customized groups of peer funds and blended indices identified by the adviser in consultation with the Portfolio Management Committee of the Board (a committee exclusively comprised of Independent Trustees);
• Comparative information concerning the fees charged and services provided by the adviser and sub-adviser to each fund in managing other accounts (which may include other mutual funds, collective investment funds and institutional accounts) using investment strategies and techniques similar to those used in managing such fund(s), if any;
• Profitability analyses with respect to the adviser and sub-adviser to each of the funds;
Information about Portfolio Management and Trading
• Descriptions of the investment management services provided to each fund, as well as each of the funds’ investment strategies and policies;
• The procedures and processes used to determine the value of fund assets, including, when necessary, the determination of “fair value” and actions taken to monitor and test the effectiveness of such procedures and processes;
• Information about the policies and practices of each fund’s adviser and sub-adviser with respect to trading, including their processes for seeking best execution of portfolio transactions;
• Information about the allocation of brokerage transactions and the benefits, if any, received by the adviser and sub-adviser to each fund as a result of brokerage allocation, including, as applicable, information concerning the acquisition of research through client commission arrangements and policies with respect to “soft dollars”;
• Data relating to the portfolio turnover rate of each fund and related information regarding active management in the context of particular strategies;
Information about each Adviser and Sub-adviser
• Reports detailing the financial results and condition of the adviser and sub-adviser to each fund;
1 Not all Eaton Vance Funds have entered into a sub-advisory agreement with a sub-adviser. Accordingly, references to “sub-adviser” or “sub-advisory agreement” in this “Overview” section may not be applicable to the particular Eaton Vance Fund covered by this report.
Eaton Vance
Tax-Managed Equity Asset Allocation Fund
October 31, 2023
Board of Trustees’ Contract Approval — continued
• Information regarding the individual investment professionals whose responsibilities include portfolio management and investment research for the funds, and, for portfolio managers and certain other investment professionals, information relating to their responsibilities with respect to managing other mutual funds and investment accounts, as applicable;
• Information regarding the adviser’s and its parent company’s (Morgan Stanley’s) efforts to retain and attract talented investment professionals, including in the context of a competitive marketplace for talent, as well as the ongoing unique environment presented by hybrid, remote and other alternative work arrangements;
• Information regarding the adviser’s compensation methodology for its investment professionals and the incentives and accountability it creates, along with investment professionals’ investments in the fund(s) they manage;
• The Code of Ethics of the adviser and its affiliates and the sub-adviser of each fund, together with information relating to compliance with, and the administration of, such codes;
• Policies and procedures relating to proxy voting, including regular reporting with respect to fund proxy voting activities;
• Information regarding the handling of corporate actions and class actions, as well as information regarding litigation and other regulatory matters;
• Information concerning the resources devoted to compliance efforts undertaken by the adviser and its affiliates and the sub-adviser of each fund, if any, including descriptions of their various compliance programs and their record of compliance;
• Information concerning the business continuity and disaster recovery plans of the adviser and its affiliates and the sub-adviser of each fund, if any;
• A description of Eaton Vance Management’s and Boston Management and Research’s oversight of sub-advisers, including with respect to regulatory and compliance issues, investment management and other matters;
Other Relevant Information
• Information regarding ongoing initiatives to further integrate and harmonize, where applicable, the investment management and other departments of the adviser and its affiliates with the overall investment management infrastructure of Morgan Stanley, in light of Morgan Stanley’s acquisition of Eaton Vance Corp. on March 1, 2021;
• Information concerning the nature, cost and character of the administrative and other non-investment advisory services provided by Eaton Vance Management and its affiliates;
• Information concerning oversight of the relationship with the custodian, subcustodians, fund accountants, and other third-party service providers by the adviser and/or administrator to each of the funds;
• Information concerning efforts to implement policies and procedures with respect to various recently adopted regulations applicable to the funds, including Rule 12d1-4 (the Fund-of-Funds Rule), Rule 18f-4 (the Derivatives Rule) and Rule 2a-5 (the Fair Valuation Rule);
• For an Eaton Vance Fund structured as an exchange-listed closed-end fund, information concerning the benefits of the closed-end fund structure, as well as, where relevant, the closed-end fund’s market prices (including as compared to the closed-end fund’s net asset value (NAV)), trading volume data, continued use of auction preferred shares (where applicable), distribution rates and other relevant matters;
• The risks which the adviser and/or its affiliates incur in connection with the management and operation of the funds, including, among others, litigation, regulatory, entrepreneurial, and other business risks (and the associated costs of such risks); and
• The terms of each investment advisory agreement and sub-advisory agreement.
During the various meetings of the Board and its committees over the course of the year leading up to the June 8, 2023 meeting, the Board received information from portfolio managers and other investment professionals of the advisers and sub-advisers of the funds regarding investment and performance matters, and considered various investment and trading strategies used in pursuing the funds’ investment objectives. The Board also received information regarding risk management techniques employed in connection with the management of the funds. The Board and its committees evaluated issues pertaining to industry and regulatory developments, compliance procedures, fund governance and other issues with respect to the funds, and received and participated in reports and presentations provided by Eaton Vance Management, Boston Management and Research and fund sub-advisers, with respect to such matters. In addition to the formal meetings of the Board and its committees, the Independent Trustees held regular teleconferences to discuss, among other topics, matters relating to the continuation of investment advisory agreements and sub-advisory agreements.
The Contract Review Committee was advised throughout the contract review process by Goodwin Procter LLP, independent legal counsel for the Independent Trustees. The members of the Contract Review Committee, with the advice of such counsel, exercised their own business judgment in determining the material factors to be considered in evaluating each investment advisory agreement and sub-advisory agreement and the weight to be given to each such factor. The conclusions reached with respect to each investment advisory agreement and sub-advisory agreement were based on a comprehensive evaluation of all the information provided and not any single factor. Moreover, each member of the Contract Review Committee may have placed varying emphasis on particular factors in reaching conclusions with respect to each investment advisory agreement and sub-advisory agreement. In evaluating each investment advisory agreement and sub-advisory agreement, including the fee structures and other terms contained in such agreements, the members of the Contract Review Committee were also informed by multiple years of analysis and discussion with the adviser and sub-adviser to each of the Eaton Vance Funds.
Eaton Vance
Tax-Managed Equity Asset Allocation Fund
October 31, 2023
Board of Trustees’ Contract Approval — continued
Results of the Contract Review Process
Based on its consideration of the foregoing, and such other information it deemed relevant, including the factors and conclusions described below, the Contract Review Committee concluded that the continuation of the investment advisory agreement between Eaton Vance Tax-Managed Equity Asset Allocation Fund (the “Fund”) and Eaton Vance Management (“EVM”), as well as the investment advisory agreements between each of Tax-Managed Growth Portfolio, Tax-Managed International Equity Portfolio, Tax-Managed Multi-Cap Growth Portfolio, Tax-Managed Small-Cap Portfolio and Tax-Managed Value Portfolio (the “Portfolios”), which are portfolios in which the Fund is authorized to invests, and Boston Management and Research (“BMR”) (EVM, with respect to the Fund, and BMR, with respect to the Portfolios, are each referred to herein as the “Adviser”), including their respective fee structures, is in the interests of shareholders and, therefore, recommended to the Board approval of each agreement. Based on the recommendation of the Contract Review Committee, the Board, including a majority of the Independent Trustees, voted to approve continuation of the investment advisory agreements for the Fund and the Portfolios.
Nature, Extent and Quality of Services
In considering whether to approve the investment advisory agreements for the Fund and the Portfolios, the Board evaluated the nature, extent and quality of services provided to the Fund and to the Portfolios by the applicable Adviser. BMR manages the Portfolios, while EVM allocates the assets of the Fund among the Portfolios.
The Board considered each Adviser’s management capabilities and investment processes in light of the types of investments held by the Fund and the Portfolios, including the education, experience and number of investment professionals and other personnel who provide portfolio management, investment research, and similar services to the Fund and the Portfolios, including recent changes to such personnel, where relevant. The Board specifically noted that each Adviser has devoted extensive resources to in-house equity research and also draws upon independent research available from third-party sources. The Board considered each Adviser’s experience managing funds that seek to maximize after-tax returns. In particular, the Board considered the abilities and experience of each Adviser’s investment professionals in analyzing factors such as special considerations relevant to investing in preferred stocks. The Board also took into account the resources dedicated to portfolio management and other services, the compensation methods of each Adviser and other factors, including the reputation and resources of the Adviser to recruit and retain highly qualified research, advisory and supervisory investment professionals. In addition, the Board considered the time and attention devoted to the Eaton Vance Funds, including the Fund and the Portfolios, by senior management, as well as the infrastructure, operational capabilities and support staff in place to assist in the portfolio management and operations of the Fund and the Portfolios, including the provision of administrative services. The Board also considered the business-related and other risks to which each Adviser or its affiliates may be subject in managing the Fund and the Portfolios.
The Board considered the compliance programs of each Adviser and relevant affiliates thereof. The Board considered compliance and reporting matters regarding, among other things, personal trading by investment professionals, disclosure of portfolio holdings, late trading, frequent trading, portfolio valuation, business continuity and the allocation of investment opportunities. The Board also considered the responses of each Adviser and its affiliates to requests in recent years from regulatory authorities, such as the Securities and Exchange Commission and the Financial Industry Regulatory Authority.
The Board considered other administrative services provided or overseen by Eaton Vance Management and its affiliates, including transfer agency and accounting services. The Board evaluated the benefits to shareholders of investing in a fund that is a part of a large fund complex offering exposure to a variety of asset classes and investment disciplines, as well as the ability, in many cases, to exchange an investment among different funds without incurring additional sales charges.
After consideration of the foregoing factors, among others, the Board concluded that the nature, extent and quality of services provided by each Adviser, taken as a whole, are appropriate and consistent with the terms of the applicable investment advisory agreement.
Fund Performance
The Board compared the Fund’s investment performance to that of comparable funds identified by an independent data provider (the peer group), as well as appropriate benchmark indices. The Board’s review included comparative performance data with respect to the Fund for the one-, three-, five- and ten-year periods ended December 31, 2022. In this regard, the Board noted that the performance of the Fund was higher than the median performance of the Fund’s peer group for the three-year period. The Board also noted that the performance of the Fund was lower than its primary and blended benchmark indexes for the three-year period. The Board also considered the performance of the underlying Portfolios. The Board concluded that the performance of the Fund was satisfactory.
Management Fees and Expenses
The Board considered contractual fee rates payable by the Portfolios and by the Fund for advisory and administrative services (referred to collectively as “management fees”). As part of its review, the Board considered the Fund’s management fees and total expense ratio for the one-year period ended December 31, 2022, as compared to those of comparable funds, before and after giving effect to any undertaking to waive fees or reimburse expenses. The Board also considered certain factors identified by management in response to inquiries from the Contract Review Committee regarding the Fund’s total expense ratio relative to comparable funds.
Eaton Vance
Tax-Managed Equity Asset Allocation Fund
October 31, 2023
Board of Trustees’ Contract Approval — continued
After considering the foregoing information, and in light of the nature, extent and quality of the services provided by each Adviser, the Board concluded that the management fees charged for advisoryand related services are reasonable.
Profitability and “Fall-Out” Benefits
The Board considered the level of profits realized by each Adviser and relevant affiliates thereof in providing investment advisory and administrative services to the Fund, to the Portfolios and to all Eaton Vance Funds as a group. The Board considered the level of profits realized without regard to marketing support or other payments by each Adviser and its affiliates to third parties in respect of distribution or other services.
The Board concluded that, in light of the foregoing factors and the nature, extent and quality of the services rendered, the profits realized by each Adviser and its affiliates are deemed not to be excessive.
The Board also considered direct or indirect fall-out benefits received by each Adviser and its affiliates in connection with their respective relationships with the Fund and the Portfolios, including the benefits of research services that may be available to each Adviser as a result of securities transactions effected for the Fund and the Portfolios and other investment advisory clients.
Economies of Scale
In reviewing management fees and profitability, the Board also considered the extent to which the applicable Adviser and its affiliates, on the one hand, and the Fund and the Portfolios, on the other hand, can expect to realize benefits from economies of scale as the assets of the Fund and the Portfolios increase. The Board acknowledged the difficulty in accurately measuring the benefits resulting from economies of scale, if any, with respect to the management of any specific fund or group of funds. The Board reviewed data summarizing the increases and decreases in the assets of the Fund and of all Eaton Vance Funds as a group over various time periods, and evaluated the extent to which the total expense ratio of the Fund and the profitability of each Adviser and its affiliates may have been affected by such increases or decreases. Based upon the foregoing, the Board concluded that the Fund currently shares in the benefits from economies of scale, if any, when they are realized by the Adviser. The Board also concluded that the structure of the advisory fees, which include breakpoints at several asset levels, will allow the Fund and the Portfolios to continue to benefit from any economies of scale in the future.
Eaton Vance
Tax-Managed Equity Asset Allocation Fund
October 31, 2023
Liquidity Risk Management Program
Each Fund has implemented a written liquidity risk management program (Program) and related procedures to manage its liquidity in accordance with Rule 22e-4 under the Investment Company Act of 1940, as amended (Liquidity Rule). The Liquidity Rule defines “liquidity risk” as the risk that a fund could not meet requests to redeem shares issued by the fund without significant dilution of the remaining investors’ interests in the fund. Each Fund’s Board of Trustees/Directors has designated the investment adviser to serve as the administrator of the Program and the related procedures. The administrator has established a Liquidity Risk Management Oversight Committee (Committee) to perform the functions necessary to administer the Program. As part of the Program, the administrator is responsible for identifying illiquid investments and categorizing the relative liquidity of each Fund’s investments in accordance with the Liquidity Rule. Under the Program, the administrator assesses, manages, and periodically reviews each Fund’s liquidity risk, and is responsible for making certain reports to the Fund’s Board of Trustees/Directors and the Securities and Exchange Commission (SEC) regarding the liquidity of the Fund’s investments, and to notify the Board of Trustees/Directors and the SEC of certain liquidity events specified in the Liquidity Rule. The liquidity of each Fund’s portfolio investments is determined based on a number of factors including, but not limited to, relevant market, trading and investment-specific considerations under the Program.
At a meeting of each Fund’s Board of Trustees/ Directors on June 7, 2023, the Committee provided a written report to the Fund’s Board of Trustees/ Directors pertaining to the operation, adequacy, and effectiveness of implementation of the Program, as well as the operation of the highly liquid investment minimum (if applicable) for the period January 1, 2022 through December 31, 2022 (Review Period). The Program operated effectively during the Review Period, supporting the administrator’s ability to assess, manage and monitor Fund liquidity risk, including during periods of market volatility and net redemptions. During the Review Period, each Fund met redemption requests on a timely basis.
There can be no assurance that the Program will achieve its objectives in the future. Please refer to each Fund’s prospectus for more information regarding the Fund’s exposure to liquidity risk and other principal risks to which an investment in the Fund may be subject.
Eaton Vance
Tax-Managed Equity Asset Allocation Fund
October 31, 2023
Management and Organization
Fund Management. The Trustees of Eaton Vance Mutual Funds Trust (the Trust) are responsible for the overall management and supervision of the Trust's affairs. The Board members and officers of the Trust are listed below. Except as indicated, each individual has held the office shown or other offices in the same company for the last five years. Board members hold indefinite terms of office. Each Trustee holds office until his or her successor is elected and qualified, subject to a prior death, resignation, retirement, disqualification or removal. Under the terms of the Fund’s current Trustee retirement policy, an Independent Trustee must retire and resign as a Trustee on the earlier of: (i) the first day of July following his or her 74th birthday; or (ii), with limited exception, December 31st of the 20th year in which he or she has served as a Trustee. However, if such retirement and resignation would cause the Fund to be out of compliance with Section 16 of the 1940 Act or any other regulations or guidance of the SEC, then such retirement and resignation will not become effective until such time as action has been taken for the Fund to be in compliance therewith. The “noninterested Trustees” consist of those Trustees who are not “interested persons” of the Trust, as that term is defined under the 1940 Act. The business address of each Board member and officer is Two International Place, Boston, Massachusetts 02110. As used below, “BMR” refers to Boston Management and Research, “EV” refers to EV LLC, “EVM” refers to Eaton Vance Management, “MSIM" refers to Morgan Stanley Investment Management Inc. and “EVD” refers to Eaton Vance Distributors, Inc. EV is the trustee of each of EVM and BMR. Each of EVM, BMR, EVD and EV are indirect, wholly owned subsidiaries of Morgan Stanley. Each officer affiliated with EVM may hold a position with other EVM affiliates that is comparable to his or her position with EVM listed below. Each Trustee oversees
127 funds in the Eaton Vance fund complex (including both funds and portfolios in a hub and spoke structure).
| Name and Year of Birth | Trust
Position(s) | Length of Service | Principal Occupation(s) and Other Directorships
During Past Five Years and Other Relevant Experience |
| Interested Trustee |
Anchal Pachnanda(1)
1980 | Trustee | Since 2023 | Co-Head of Strategy of MSIM (since 2019). Formerly, Head of Strategy of MSIM (2017-2019). Ms. Pachnanda is an interested person because of her position with MSIM, which is an affiliate of the Trust.
Other Directorships. None. |
| Noninterested Trustees |
Alan C. Bowser
1962 | Trustee | Since 2022 | Private investor. Formerly, Chief Diversity Officer, Partner and a member of the Operating Committee, and formerly served as Senior Advisor on Diversity and Inclusion for the firm’s chief executive officer, Co-Head of the Americas Region, and Senior Client Advisor of Bridgewater Associates, an asset management firm (2011- 2023).
Other Directorships. Independent Director of Stout Risius Ross (a middle market professional services advisory firm) (since 2021). |
Mark R. Fetting
1954 | Trustee | Since 2016 | Private investor. Formerly held various positions at Legg Mason, Inc. (investment management firm) (2000-2012), including President, Chief Executive Officer, Director and Chairman (2008-2012), Senior Executive Vice President (2004-2008) and Executive Vice President (2001-2004). Formerly, President of Legg Mason family of funds (2001-2008). Formerly, Division President and Senior Officer of Prudential Financial Group, Inc. and related companies (investment management firm) (1991-2000).
Other Directorships. None. |
Cynthia E. Frost
1961 | Trustee | Since 2014 | Private investor. Formerly, Chief Investment Officer of Brown University (university endowment) (2000-2012). Formerly, Portfolio Strategist for Duke Management Company (university endowment manager) (1995-2000). Formerly, Managing Director, Cambridge Associates (investment consulting company) (1989-1995). Formerly, Consultant, Bain and Company (management consulting firm) (1987-1989). Formerly, Senior Equity Analyst, BA Investment Management Company (1983-1985).
Other Directorships. None. |
George J. Gorman
1952 | Chairperson of the
Board and Trustee | Since 2021
(Chairperson) and
2014 (Trustee) | Principal at George J. Gorman LLC (consulting firm). Formerly, Senior Partner at Ernst & Young LLP (a registered public accounting firm) (1974-2009).
Other Directorships. None. |
Eaton Vance
Tax-Managed Equity Asset Allocation Fund
October 31, 2023
Management and Organization — continued
| Name and Year of Birth | Trust
Position(s) | Length of Service | Principal Occupation(s) and Other Directorships
During Past Five Years and Other Relevant Experience |
| Noninterested Trustees (continued) |
Valerie A. Mosley
1960 | Trustee | Since 2014 | Chairwoman and Chief Executive Officer of Valmo Ventures (a consulting and investment firm). Founder of Upward Wealth, Inc., dba BrightUp, a fintech platform. Formerly, Partner and Senior Vice President, Portfolio Manager and Investment Strategist at Wellington Management Company, LLP (investment management firm) (1992-2012). Formerly, Chief Investment Officer, PG Corbin Asset Management (1990-1992). Formerly worked in institutional corporate bond sales at Kidder Peabody (1986-1990).
Other Directorships. Director of DraftKings, Inc. (digital sports entertainment and gaming company) (since September 2020). Director of Envestnet, Inc. (provider of intelligent systems for wealth management and financial wellness) (since 2018). Formerly, Director of Dynex Capital, Inc. (mortgage REIT) (2013-2020) and Director of Groupon, Inc. (e-commerce provider) (2020-2022). |
Keith Quinton
1958 | Trustee | Since 2018 | Private investor, researcher and lecturer. Formerly, Independent Investment Committee Member at New Hampshire Retirement System (2017-2021). Formerly, Portfolio Manager and Senior Quantitative Analyst at Fidelity Investments (investment management firm) (2001-2014).
Other Directorships. Formerly, Director (2016-2021) and Chairman (2019-2021) of New Hampshire Municipal Bond Bank. |
Marcus L. Smith
1966 | Trustee | Since 2018 | Private investor and independent corporate director. Formerly, Chief Investment Officer, Canada (2012-2017), Chief Investment Officer, Asia (2010-2012), Director of Asian Research (2004-2010) and portfolio manager (2001-2017) at MFS Investment Management (investment management firm).
Other Directorships. Director of First Industrial Realty Trust, Inc. (an industrial REIT) (since 2021). Director of MSCI Inc. (global provider of investment decision support tools) (since 2017). Formerly, Director of DCT Industrial Trust Inc. (logistics real estate company) (2017-2018). |
Susan J. Sutherland
1957 | Trustee | Since 2015 | Private investor. Director of Ascot Group Limited and certain of its subsidiaries (insurance and reinsurance) (since 2017). Formerly, Director of Hagerty Holding Corp. (insurance) (2015-2018) and Montpelier Re Holdings Ltd. (insurance and reinsurance) (2013-2015). Formerly, Associate, Counsel and Partner at Skadden, Arps, Slate, Meagher & Flom LLP (law firm) (1982-2013).
Other Directorships. Formerly, Director of Kairos Acquisition Corp. (insurance/InsurTech acquisition company) (2021-2023). |
Scott E. Wennerholm
1959 | Trustee | Since 2016 | Private investor. Formerly, Trustee at Wheelock College (postsecondary institution) (2012-2018). Formerly, Consultant at GF Parish Group (executive recruiting firm) (2016-2017). Formerly, Chief Operating Officer and Executive Vice President at BNY Mellon Asset Management (investment management firm) (2005-2011). Formerly, Chief Operating Officer and Chief Financial Officer at Natixis Global Asset Management (investment management firm) (1997-2004). Formerly, Vice President at Fidelity Investments Institutional Services (investment management firm) (1994-1997).
Other Directorships. None. |
| Nancy A. Wiser | Trustee | Since 2022 | Formerly, Executive Vice President and the Global Head of Operations at Wells Fargo Asset Management (2011-2021).
Other Directorships. None. |
| Name and Year of Birth | Trust
Position(s) | Length of Service | Principal Occupation(s)
During Past Five Years |
| Principal Officers who are not Trustees |
Kenneth A. Topping
1966 | President | Since 2023 | Vice President and Chief Administrative Officer of EVM and BMR and Chief Operating Officer for Public Markets at MSIM. Also Vice President of Calvert Research and Management (“CRM”) since 2021. Formerly, Chief Operating Officer for Goldman Sachs Asset Management ‘Classic’ (2009-2020). |
Deidre E. Walsh
1971 | Vice President and
Chief Legal Officer | Since 2009 | Vice President of EVM and BMR. Also Vice President of CRM. |
James F. Kirchner
1967 | Treasurer | Since 2007 | Vice President of EVM and BMR. Also Vice President of CRM. |
Eaton Vance
Tax-Managed Equity Asset Allocation Fund
October 31, 2023
Management and Organization — continued
| Name and Year of Birth | Trust
Position(s) | Length of Service | Principal Occupation(s)
During Past Five Years |
| Principal Officers who are not Trustees (continued) |
Nicholas S. Di Lorenzo
1987 | Secretary | Since 2022 | Formerly, associate (2012-2021) and counsel (2022) at Dechert LLP. |
Richard F. Froio
1968 | Chief Compliance
Officer | Since 2017 | Vice President of EVM and BMR since 2017. Formerly, Deputy Chief Compliance Officer (Adviser/Funds) and Chief Compliance Officer (Distribution) at PIMCO (2012-2017) and Managing Director at BlackRock/Barclays Global Investors (2009-2012). |
(1) Ms. Pachnanda began serving as Trustee effective April 1, 2023.
The SAI for the Fund includes additional information about the Trustees and officers of the Fund and can be obtained without charge on Eaton Vance’s website at www.eatonvance.com or by calling 1-800-262-1122.
| FACTS | WHAT DOES EATON VANCE DO WITH YOUR
PERSONAL INFORMATION? |
| Why? | Financial companies choose how they share your personal information. Federal law gives consumers the right to limit some but not all sharing. Federal law also requires us to tell you how we collect, share, and protect your personal information. Please read this notice carefully to understand what we do. |
| |
| What? | The types of personal information we collect and share depend on the product or service you have with us. This information can include:■ Social Security number and income
■ investment experience and risk tolerance
■ checking account number and wire transfer instructions |
| |
| How? | All financial companies need to share customers’ personal information to run their everyday business. In the section below, we list the reasons financial companies can share their customers’ personal information; the reasons Eaton Vance chooses to share; and whether you can limit this sharing. |
Reasons we can share your
personal information | Does Eaton Vance
share? | Can you limit
this sharing? |
| For our everyday business purposes — such as to process your transactions, maintain your account(s), respond to court orders and legal investigations, or report to credit bureaus | Yes | No |
| For our marketing purposes — to offer our products and services to you | Yes | No |
| For joint marketing with other financial companies | No | We don’t share |
| For our investment management affiliates’ everyday business purposes — information about your transactions, experiences, and creditworthiness | Yes | Yes |
| For our affiliates’ everyday business purposes — information about your transactions and experiences | Yes | No |
| For our affiliates’ everyday business purposes — information about your creditworthiness | No | We don’t share |
| For our investment management affiliates to market to you | Yes | Yes |
| For our affiliates to market to you | No | We don’t share |
| For nonaffiliates to market to you | No | We don’t share |
To limit our
sharing | Call toll-free 1-800-262-1122 or email: EVPrivacy@eatonvance.comPlease note:If you are a new customer, we can begin sharing your information 30 days from the date we sent this notice. When you are no longer our customer, we continue to share your information as described in this notice. However, you can contact us at any time to limit our sharing. |
| Questions? | Call toll-free 1-800-262-1122 or email: EVPrivacy@eatonvance.com |
| Privacy Notice — continued | April 2021 |
| Who we are |
| Who is providing this notice? | Eaton Vance Management, Eaton Vance Distributors, Inc., Eaton Vance Trust Company, Eaton Vance Management (International) Limited, Eaton Vance Advisers International Ltd., Eaton Vance Global Advisors Limited, Eaton Vance Management’s Real Estate Investment Group, Boston Management and Research, Calvert Research and Management, Eaton Vance and Calvert Fund Families and our investment advisory affiliates (“Eaton Vance”) (see Investment Management Affiliates definition below) |
| What we do |
How does Eaton Vance
protect my personal
information? | To protect your personal information from unauthorized access and use, we use security measures that comply with federal law. These measures include computer safeguards and secured files and buildings. We have policies governing the proper handling of customer information by personnel and requiring third parties that provide support to adhere to appropriate security standards with respect to such information. |
How does Eaton Vance
collect my personal
information? | We collect your personal information, for example, when you■ open an account or make deposits or withdrawals from your account
■ buy securities from us or make a wire transfer
■ give us your contact informationWe also collect your personal information from others, such as credit bureaus, affiliates, or other companies. |
| Why can’t I limit all sharing? | Federal law gives you the right to limit only■ sharing for affiliates’ everyday business purposes — information about your creditworthiness
■ affiliates from using your information to market to you
■ sharing for nonaffiliates to market to youState laws and individual companies may give you additional rights to limit sharing. See below for more on your rights under state law. |
| Definitions |
Investment Management
Affiliates | Eaton Vance Investment Management Affiliates include registered investment advisers, registered broker- dealers, and registered and unregistered funds. Investment Management Affiliates does not include entities associated with Morgan Stanley Wealth Management, such as Morgan Stanley Smith Barney LLC and Morgan Stanley & Co. |
| Affiliates | Companies related by common ownership or control. They can be financial and nonfinancial companies.■ Our affiliates include companies with a Morgan Stanley name and financial companies such as Morgan Stanley Smith Barney LLC and Morgan Stanley & Co. |
| Nonaffiliates | Companies not related by common ownership or control. They can be financial and nonfinancial companies.■ Eaton Vance does not share with nonaffiliates so they can market to you. |
| Joint marketing | A formal agreement between nonaffiliated financial companies that together market financial products or services to you.■ Eaton Vance doesn’t jointly market. |
| Other important information |
| Vermont: Except as permitted by law, we will not share personal information we collect about Vermont residents with Nonaffiliates unless you provide us with your written consent to share such information.California: Except as permitted by law, we will not share personal information we collect about California residents with Nonaffiliates and we will limit sharing such personal information with our Affiliates to comply with California privacy laws that apply to us. |
Delivery of Shareholder Documents. The Securities and Exchange Commission (SEC) permits funds to deliver only one copy of shareholder documents, including prospectuses, proxy statements and shareholder reports, to fund investors with multiple accounts at the same residential or post office box address. This practice is often called “householding” and it helps eliminate duplicate mailings to shareholders. Eaton Vance, or your financial intermediary, may household the mailing of your documents indefinitely unless you instruct Eaton Vance, or your financial intermediary, otherwise. If you would prefer that your Eaton Vance documents not be householded, please contact Eaton Vance at 1-800-262-1122, or contact your financial intermediary. Your instructions that householding not apply to delivery of your Eaton Vance documents will typically be effective within 30 days of receipt by Eaton Vance or your financial intermediary.
Portfolio Holdings. Each Eaton Vance Fund and its underlying Portfolio(s) (if applicable) files a schedule of portfolio holdings on Part F to Form N-PORT with the SEC. Certain information filed on Form N-PORT may be viewed on the Eaton Vance website at www.eatonvance.com, by calling Eaton Vance at 1-800-262-1122 or in the EDGAR database on the SEC’s website at www.sec.gov.
Proxy Voting. From time to time, funds are required to vote proxies related to the securities held by the funds. The Eaton Vance Funds or their underlying Portfolios (if applicable) vote proxies according to a set of policies and procedures approved by the Funds’ and Portfolios’ Boards. You may obtain a description of these policies and procedures and information on how the Funds or Portfolios voted proxies relating to portfolio securities during the most recent 12-month period ended June 30, without charge, upon request, by calling 1-800-262-1122 and by accessing the SEC’s website at www.sec.gov.
Tailored Shareholder Reports. Effective January 24, 2023, the SEC adopted rule and form amendments to require open-end mutual funds and ETFs to transmit concise and visually engaging streamlined annual and semiannual reports to shareholders that highlight key information. Other information, including financial statements, will no longer appear in a streamlined shareholder report but must be available online, delivered free of charge upon request, and filed on a semiannual basis on Form N-CSR. The rule and form amendments have a compliance date of July 24, 2024. At this time, management is evaluating the impact of these amendments on the shareholder reports for the Eaton Vance Funds.
This Page Intentionally Left Blank
This Page Intentionally Left Blank
Investment Adviser and Administrator
Eaton Vance Management
Two International Place
Boston, MA 02110
Principal Underwriter*
Eaton Vance Distributors, Inc.
Two International Place
Boston, MA 02110
(617) 482-8260
Custodian
State Street Bank and Trust Company
One Congress Street, Suite 1
Boston, MA 02114-2016
Transfer Agent
BNY Mellon Investment Servicing (US) Inc.
Attn: Eaton Vance Funds
P.O. Box 534439
Pittsburgh, PA 15253-4439
(800) 262-1122
Independent Registered Public Accounting Firm
Deloitte & Touche LLP
200 Berkeley Street
Boston, MA 02116-5022
Fund Offices
Two International Place
Boston, MA 02110
* FINRA BrokerCheck. Investors may check the background of their Investment Professional by contacting the Financial Industry Regulatory Authority (FINRA). FINRA BrokerCheck is a free tool to help investors check the professional background of current and former FINRA-registered securities firms and brokers. FINRA BrokerCheck is available by calling 1-800-289-9999 and at www.FINRA.org. The FINRA BrokerCheck brochure describing this program is available to investors at www.FINRA.org.
Eaton Vance
Global Income Builder Fund
Annual Report
October 31, 2023
Commodity Futures Trading Commission Registration. The Commodity Futures Trading Commission (“CFTC”) has adopted regulations that subject registered investment companies and advisers to regulation by the CFTC if a fund invests more than a prescribed level of its assets in certain CFTC-regulated instruments (including futures, certain options and swap agreements) or markets itself as providing investment exposure to such instruments. The investment adviser has claimed an exclusion from the definition of “commodity pool operator” under the Commodity Exchange Act with respect to its management of the Fund. Accordingly, neither the Fund nor the adviser with respect to the operation of the Fund is subject to CFTC regulation. Because of its management of other strategies, the Fund's adviser is registered with the CFTC as a commodity pool operator. The adviser is also registered as a commodity trading advisor.
Fund shares are not insured by the FDIC and are not deposits or other obligations of, or guaranteed by, any depository institution. Shares are subject to investment risks, including possible loss of principal invested.
This report must be preceded or accompanied by a current summary prospectus or prospectus. Before investing, investors should consider carefully the investment objective, risks, and charges and expenses of a mutual fund. This and other important information is contained in the summary prospectus and prospectus, which can be obtained from a financial intermediary. Prospective investors should read the prospectus carefully before investing. For further information, please call 1-800-262-1122.
Annual Report October 31, 2023
Eaton Vance
Global Income Builder Fund
Eaton Vance
Global Income Builder Fund
October 31, 2023
Management’s Discussion of Fund Performance†
Economic and Market Conditions
For global equity investors, the 12-month period ended October 31, 2023, was a roller-coaster ride, driven largely by shifting perceptions of whether the U.S. Federal Reserve (the Fed) could bring the world’s largest economy in for a soft landing, and changing expectations of how long interest rates might remain high.
During the opening month of the period, stocks rallied on strong corporate earnings, attractive valuations, and hope the Fed might slow the pace of its interest rate hikes. But in December 2022, equities lost ground as “higher for longer” interest rate fears returned. A continuing irony throughout the period was that good economic news -- record low unemployment, strong job creation, and robust consumer spending -- was viewed as bad news for inflation and fuel for future rate hikes that could weigh on stock prices.
In January 2023, however, global equities began a rally that lasted through July. The initial tailwind was ChatGPT, an artificial intelligence (AI) application that led investors to perceive AI might become the next big innovation to drive the information technology (IT) sector. As a result, IT -- one of the worst-performing sectors in 2022 -- became the standout sector of the first half of 2023.
Earlier recession fears that had weighed on stock prices receded as many investors came around to the view that the U.S. and global economies were doing surprisingly well. European equities received an additional boost as feared continent-wide energy shortages failed to materialize during the winter.
But in the final three months of the period, the bond market halted the stock market’s momentum. As it became clear the Fed would keep rates higher for longer than investors had anticipated just a few months earlier, longer-term bond interest rates rose sharply. Given the potential for relatively attractive returns with lower risk than stocks, many investors shifted from equity assets to bonds. In the final two days of the period, however, signs of a stock rally emerged as investors began to believe the Fed might have reached the end of its monetary tightening cycle.
For the period as a whole, global equity performance was strong. The MSCI ACWI Index, a broad measure of global equities, returned 10.50%; the MSCI EAFE Index of developed-market international equities returned 14.40%; and the S&P 500® Index, a broad measure of U.S. stocks, returned 10.14%.
Meanwhile, in the world’s second-largest economy, the MSCI Golden Dragon Index, a measure of Chinese large-cap and mid-cap stocks, returned 21.11%. The strong 12-month performance, however, masked the significant decline in Chinese stock prices since early 2023, as Chinese equities were dogged by an ailing real estate sector -- the major investment area for millions of Chinese citizens -- and a failure of many Chinese industries to bounce back after onerous COVID restrictions were lifted.
Fund Performance
For the 12-month period ended October 31, 2023, Eaton Vance Global Income Builder Fund (the Fund) returned 9.00% for Class A shares at net asset value (NAV). The Fund underperformed its primary benchmark, the MSCI World Index (the Index), which returned 10.48%; and underperformed its custom benchmark -- consisting of 65% MSCI World Index and 35% ICE BofA Developed Markets High Yield Ex-Subordinated Financial Index (the ICE BofA Index) -- which returned 9.83% during the period.
The Fund’s out-of-Index allocations to high yield bonds and preferred securities detracted from performance versus the Index during the period.
The Fund’s high yield bond allocation underperformed the Index and also underperformed the broad high yield market, as measured by the ICE BofA Index. Within the high yield allocation, detractors from relative returns included security selections in BB-rated bonds, and security selections in the homebuilders & real estate industry, which included overweight positions in two European companies. Contributors to relative returns included security selections in CCC-rated bonds; an underweight position in BB-rated bonds; and security selections in the telecommunications industry and the cable & satellite TV industry.
The Fund’s preferred allocation -- preferred stocks, exchange-traded funds investing primarily in preferred stocks, and corporate bonds and other debt securities with preferred characteristics -- also underperformed the Index, but outperformed the overall preferred market, as measured by the ICE BofA Fixed Rate Preferred Securities Index (the Preferred Index). Outperformance versus the Preferred Index was driven largely by an overweight position in the energy sector, with strong returns coming from natural gas distributors. Exposures to electric utilities and insurance companies also contributed to the preferred allocation’s performance during the period.
In contrast, the Fund’s common stock allocation outperformed the Index, contributing to performance versus the Index during the period. Within the Fund’s common stock allocation, contributors to performance relative to the Index included stock selections in the health care and industrials sectors, along with stock selections and an overweight position in the consumer discretionary sector.
On the negative side, stock selections and underweight positions in the information technology, communication services, and consumer staples sectors detracted from Fund performance versus the Index during the period.
See Endnotes and Additional Disclosures in this report.
Past performance is no guarantee of future results. Returns are historical and are calculated by determining the percentage change in net asset value (NAV) or offering price (as applicable) with all distributions reinvested. Furthermore, returns do not reflect the deduction of taxes that shareholders may have to pay on Fund distributions or upon the redemption of Fund shares. Investment return and principal value will fluctuate so that shares, when redeemed, may be worth more or less than their original cost. Performance for periods less than or equal to one year is cumulative. Performance is for the stated time period only; due to market volatility, current Fund performance may be lower or higher than the quoted return. For performance as of the most recent month-end, please refer to eatonvance.com.
Eaton Vance
Global Income Builder Fund
October 31, 2023
Management’s Discussion of Fund Performance† — continued
The Fund’s use of equity index futures contracts -- a type of derivative -- contributed to performance relative to the Index as well. Within the Fund’s common stock portfolio, the Fund’s strategy of emphasizing dividend-paying stocks resulted in an overweight allocation to European equities and an underweight allocation to U.S. equities. The Fund hedged these overweight and underweight exposures by selling short European index futures contracts and buying U.S. index futures contracts during the period.
See Endnotes and Additional Disclosures in this report.
Past performance is no guarantee of future results. Returns are historical and are calculated by determining the percentage change in net asset value (NAV) or offering price (as applicable) with all distributions reinvested. Furthermore, returns do not reflect the deduction of taxes that shareholders may have to pay on Fund distributions or upon the redemption of Fund shares. Investment return and principal value will fluctuate so that shares, when redeemed, may be worth more or less than their original cost. Performance for periods less than or equal to one year is cumulative. Performance is for the stated time period only; due to market volatility, current Fund performance may be lower or higher than the quoted return. For performance as of the most recent month-end, please refer to eatonvance.com.
Eaton Vance
Global Income Builder Fund
October 31, 2023
Performance
Portfolio Manager(s) Christopher M. Dyer, CFA and Jeffrey D. Mueller, of Eaton Vance Advisers International Ltd.; Derek J.V. DiGregorio of Boston Management and Research
| % Average Annual Total Returns1,2 | Class
Inception Date | Performance
Inception Date | One Year | Five Years | Ten Years |
| Class A at NAV | 11/30/2005 | 11/30/2005 | 9.00% | 5.54% | 5.36% |
| Class A with 5.25% Maximum Sales Charge | — | — | 3.32 | 4.40 | 4.80 |
| Class C at NAV | 11/30/2005 | 11/30/2005 | 8.17 | 4.76 | 4.74 |
| Class C with 1% Maximum Deferred Sales Charge | — | — | 7.17 | 4.76 | 4.74 |
| Class I at NAV | 01/31/2006 | 11/30/2005 | 9.28 | 5.82 | 5.64 |
| Class R at NAV | 01/31/2006 | 11/30/2005 | 8.64 | 5.25 | 5.09 |
|
| MSCI World Index | — | — | 10.48% | 8.26% | 7.53% |
| ICE BofA Developed Markets High Yield Ex-Subordinated Financial Index | — | — | 8.34 | 2.21 | 3.00 |
| Blended Index | — | — | 9.83 | 6.24 | 6.02 |
| % Total Annual Operating Expense Ratios3 | Class A | Class C | Class I | Class R |
| Gross | 1.19% | 1.94% | 0.94% | 1.44% |
| Net | 1.17 | 1.92 | 0.92 | 1.42 |
Growth of $10,000
This graph shows the change in value of a hypothetical investment of $10,000 in Class A of the Fund for the period indicated. For comparison, the same investment is shown in the indicated index.
| Growth of Investment | Amount Invested | Period Beginning | At NAV | With Maximum Sales Charge |
| Class C | $10,000 | 10/31/2013 | $15,893 | N.A. |
| Class I, at minimum investment | $1,000,000 | 10/31/2013 | $1,731,856 | N.A. |
| Class R | $10,000 | 10/31/2013 | $16,438 | N.A. |
See Endnotes and Additional Disclosures in this report.
Past performance is no guarantee of future results. Returns are historical and are calculated by determining the percentage change in net asset value (NAV) or offering price (as applicable) with all distributions reinvested. Furthermore, returns do not reflect the deduction of taxes that shareholders may have to pay on Fund distributions or upon the redemption of Fund shares. Investment return and principal value will fluctuate so that shares, when redeemed, may be worth more or less than their original cost. Performance for periods less than or equal to one year is cumulative. Performance is for the stated time period only; due to market volatility, current Fund performance may be lower or higher than the quoted return. For performance as of the most recent month-end, please refer to eatonvance.com.
Eaton Vance
Global Income Builder Fund
October 31, 2023
| Country Allocation (% of net assets) |
| Asset Allocation (% of net assets)1 |
| Top 10 Holdings (% of net assets)2 |
| Microsoft Corp. | 3.0% |
| Eli Lilly & Co. | 2.7 |
| Alphabet, Inc., Class C | 2.3 |
| Novo Nordisk A/S, Class B | 2.1 |
| Apple, Inc. | 1.8 |
| Amazon.com, Inc. | 1.8 |
| EOG Resources, Inc. | 1.8 |
| Nestle S.A. | 1.2 |
| ConocoPhillips | 1.1 |
| ASML Holding NV | 1.2 |
| Total | 19.0% |
Footnotes:
| 1 | Other Net Assets represents other assets less liabilities and includes any investment type that represents less than 1% of net assets. |
| 2 | Excludes cash and cash equivalents. |
Eaton Vance
Global Income Builder Fund
October 31, 2023
Endnotes and Additional Disclosures
| † | The views expressed in this report are those of the portfolio manager(s) and are current only through the date stated at the top of this page. These views are subject to change at any time based upon market or other conditions, and Eaton Vance and the Fund(s) disclaim any responsibility to update such views. These views may not be relied upon as investment advice and, because investment decisions are based on many factors, may not be relied upon as an indication of trading intent on behalf of any Eaton Vance fund. This commentary may contain statements that are not historical facts, referred to as “forward-looking statements.” The Fund’s actual future results may differ significantly from those stated in any forward-looking statement, depending on factors such as changes in securities or financial markets or general economic conditions, the volume of sales and purchases of Fund shares, the continuation of investment advisory, administrative and service contracts, and other risks discussed from time to time in the Fund’s filings with the Securities and Exchange Commission. |
| | |
| 1 | MSCI World Index is an unmanaged index of equity securities in the developed markets. MSCI indexes are net of foreign withholding taxes. Source: MSCI. MSCI data may not be reproduced or used for any other purpose. MSCI provides no warranties, has not prepared or approved this report, and has no liability hereunder. ICE BofA Developed Markets High Yield Ex-Subordinated Financial Index is an unmanaged index of global developed market, below investment grade corporate bonds. ICE® BofA® indices are not for redistribution or other uses; provided “as is”, without warranties, and with no liability. Eaton Vance has prepared this report and ICE Data Indices, LLC does not endorse it, or guarantee, review, or endorse Eaton Vance’s products. BofA® is a licensed registered trademark of Bank of America Corporation in the United States and other countries. The Blended Index consists of 65% MSCI World Index and 35% ICE BofA Developed Markets High Yield Ex-Subordinated Financial Index, rebalanced monthly. Unless otherwise stated, index returns do not reflect the effect of any applicable sales charges, commissions, expenses, taxes or leverage, as applicable. It is not possible to invest directly in an index. |
| 2 | Total Returns at NAV do not include applicable sales charges. If sales charges were deducted, the returns would be lower. Total Returns shown with maximum sales charge reflect the stated maximum sales charge. Unless otherwise stated, performance does not reflect the deduction of taxes on Fund distributions or redemptions of Fund shares.Effective December 7, 2015, the Fund changed its name and principal investment strategies to invest in common stocks, preferred stocks and other hybrid securities and income instruments of U.S. and foreign issuers. As of such date, the Fund was no longer required to invest at least 80% of its net assets in dividend-paying common and preferred stocks. Performance prior to December 7, 2015 reflects the Fund’s performance under its former principal investment strategies.Effective November 5, 2020, Class C shares automatically convert to Class A shares eight years after purchase. The average annual total returns listed for Class C reflect conversion to Class A shares after eight years. Prior to November 5, 2020, Class C shares automatically converted to Class A shares ten years after purchase. |
| 3 | Source: Fund prospectus. Net expense ratios reflect a contractual expense reimbursement that continues through 2/29/24. The expense ratios for the current reporting period can be found in the Financial Highlights section of this report. Performance reflects expenses waived and/or reimbursed, if applicable. Without such waivers and/or reimbursements, performance would have been lower. |
| | Fund profile subject to change due to active management. |
| | Additional Information |
| | S&P 500® Index is an unmanaged index of large-cap stocks commonly used as a measure of U.S. stock market performance. S&P Dow Jones Indices are a product of S&P Dow Jones Indices LLC (“S&P DJI”) and have been licensed for use. S&P® and S&P 500® are registered trademarks of S&P DJI; Dow Jones® is a registered
trademark of Dow Jones Trademark Holdings LLC (“Dow Jones”); S&P DJI, Dow Jones and their respective affiliates do not sponsor, endorse, sell or promote the Fund, will not have any liability with respect thereto and do not have any liability for any errors, omissions, or interruptions of the S&P Dow Jones Indices. MSCI Golden Dragon Index is an unmanaged index of common stocks traded in China, Hong Kong and Taiwan. MSCI ACWI Index is an unmanaged free-float-adjusted, market-capitalization-weighted index designed to measure the equity market performance of developed and emerging markets. MSCI EAFE Index is an unmanaged index of equities in the developed markets, excluding the U.S. and Canada. ICE BofA Fixed Rate Preferred Securities Index is an unmanaged index of fixed-rate, preferred securities issued in the U.S. |
| | Important Notice to Shareholders |
| | On June 16, 2023, the Fund received its pro rata share of net assets from Global Income Builder Portfolio, the Portfolio the Fund previously invested in, and the Portfolio was terminated. As of June 17, 2023, the Fund invests its assets directly. |
Eaton Vance
Global Income Builder Fund
October 31, 2023
Example
As a Fund shareholder, you incur two types of costs: (1) transaction costs, including sales charges (loads) on purchases; and (2) ongoing costs, including management fees; distribution and/or service fees; and other Fund expenses. This Example is intended to help you understand your ongoing costs (in dollars) of Fund investing and to compare these costs with the ongoing costs of investing in other mutual funds. The Example is based on an investment of $1,000 invested at the beginning of the period and held for the entire period (May 1, 2023 to October 31, 2023).
Actual Expenses
The first section of the table below provides information about actual account values and actual expenses. You may use the information in this section, together with the amount you invested, to estimate the expenses that you paid over the period. Simply divide your account value by $1,000 (for example, an $8,600 account value divided by $1,000 = 8.6), then multiply the result by the number in the first section under the heading entitled “Expenses Paid During Period” to estimate the expenses you paid on your account during this period.
Hypothetical Example for Comparison Purposes
The second section of the table below provides information about hypothetical account values and hypothetical expenses based on the actual Fund expense ratio and an assumed rate of return of 5% per year (before expenses), which is not the actual Fund return. The hypothetical account values and expenses may not be used to estimate the actual ending account balance or expenses you paid for the period. You may use this information to compare the ongoing costs of investing in your Fund and other funds. To do so, compare this 5% hypothetical example with the 5% hypothetical examples that appear in the shareholder reports of the other funds.
Please note that the expenses shown in the table are meant to highlight your ongoing costs only and do not reflect any transactional costs, such as sales charges (loads). Therefore, the second section of the table is useful in comparing ongoing costs only, and will not help you determine the relative total costs of owning different funds. In addition, if these transactional costs were included, your costs would be higher.
| | Beginning
Account Value
(5/1/23) | Ending
Account Value
(10/31/23) | Expenses Paid
During Period*
(5/1/23 – 10/31/23) | Annualized
Expense
Ratio |
| Actual | | | | |
| Class A | $1,000.00 | $ 982.20 | $5.85** | 1.17% |
| Class C | $1,000.00 | $ 978.20 | $9.57** | 1.92% |
| Class I | $1,000.00 | $ 984.30 | $4.60** | 0.92% |
| Class R | $1,000.00 | $ 980.90 | $7.09** | 1.42% |
| |
| Hypothetical | | | | |
| (5% return per year before expenses) | | | | |
| Class A | $1,000.00 | $1,019.31 | $5.96** | 1.17% |
| Class C | $1,000.00 | $1,015.53 | $9.75** | 1.92% |
| Class I | $1,000.00 | $1,020.57 | $4.69** | 0.92% |
| Class R | $1,000.00 | $1,018.05 | $7.22** | 1.42% |
| * | Expenses are equal to the Fund’s annualized expense ratio for the indicated Class, multiplied by the average account value over the period, multiplied by 184/365 (to reflect the one-half year period). The Example assumes that the $1,000 was invested at the net asset value per share determined at the close of business on April 30, 2023. The Example reflects the expenses of both the Fund and the Portfolio for the period when the Fund’s assets were invested in the Portfolio. |
| ** | Absent an allocation of certain expenses to affiliate(s), expenses would be higher. |
Eaton Vance
Global Income Builder Fund
October 31, 2023
| Security | Shares | Value |
| Aerospace & Defense — 0.6% |
| Safran S.A. | | 7,792 | $ 1,217,262 |
| | | | $ 1,217,262 |
| Air Freight & Logistics — 0.7% |
| GXO Logistics, Inc.(1) | | 31,745 | $ 1,603,440 |
| | | | $ 1,603,440 |
| Automobiles — 0.3% |
| Tesla, Inc.(1) | | 2,944 | $ 591,273 |
| | | | $ 591,273 |
| Banks — 3.6% |
| Banco Santander S.A. | | 290,347 | $ 1,067,877 |
| Barclays PLC | | 693,961 | 1,113,839 |
| Citigroup, Inc. | | 27,113 | 1,070,692 |
| HDFC Bank, Ltd. | | 20,527 | 1,160,802 |
| HSBC Holdings PLC | | 112,340 | 811,141 |
| ING Groep NV | | 21,302 | 273,103 |
| KBC Group NV | | 9,095 | 500,542 |
| Toronto-Dominion Bank (The) | | 15,881 | 887,069 |
| Truist Financial Corp. | | 33,223 | 942,204 |
| | | | $ 7,827,269 |
| Beverages — 1.2% |
| Coca-Cola Co. (The) | | 28,687 | $ 1,620,529 |
| Diageo PLC | | 25,220 | 953,719 |
| | | | $ 2,574,248 |
| Biotechnology — 0.5% |
| CSL, Ltd. | | 6,801 | $ 1,005,134 |
| | | | $ 1,005,134 |
| Broadline Retail — 1.8% |
| Amazon.com, Inc.(1) | | 29,102 | $ 3,873,185 |
| | | | $ 3,873,185 |
| Capital Markets — 0.8% |
| Intercontinental Exchange, Inc. | | 8,465 | $ 909,480 |
| Stifel Financial Corp. | | 14,243 | 811,851 |
| | | | $ 1,721,331 |
| Security | Shares | Value |
| Chemicals — 0.3% |
| Sika AG | | 2,412 | $ 577,214 |
| | | | $ 577,214 |
| Commercial Services & Supplies — 0.5% |
| Waste Management, Inc. | | 6,246 | $ 1,026,405 |
| | | | $ 1,026,405 |
| Consumer Staples Distribution & Retail — 0.7% |
| Dollar Tree, Inc.(1) | | 13,788 | $ 1,531,709 |
| | | | $ 1,531,709 |
| Electric Utilities — 1.1% |
| Iberdrola S.A. | | 121,658 | $ 1,353,083 |
| NextEra Energy, Inc. | | 17,114 | 997,746 |
| | | | $ 2,350,829 |
| Electrical Equipment — 1.3% |
| AMETEK, Inc. | | 8,132 | $ 1,144,742 |
| Schneider Electric SE | | 11,379 | 1,750,742 |
| | | | $ 2,895,484 |
| Electronic Equipment, Instruments & Components — 2.1% |
| CDW Corp. | | 10,288 | $ 2,061,715 |
| Halma PLC | | 32,859 | 738,945 |
| Keyence Corp. | | 1,441 | 557,838 |
| Keysight Technologies, Inc.(1) | | 3,906 | 476,727 |
| TE Connectivity, Ltd. | | 5,950 | 701,207 |
| | | | $ 4,536,432 |
| Entertainment — 0.9% |
| Walt Disney Co. (The)(1) | | 23,877 | $ 1,948,124 |
| | | | $ 1,948,124 |
| Financial Services — 1.0% |
| Fidelity National Information Services, Inc. | | 16,581 | $ 814,293 |
| Visa, Inc., Class A | | 6,111 | 1,436,696 |
| | | | $ 2,250,989 |
| Food Products — 1.7% |
| Mondelez International, Inc., Class A | | 17,633 | $ 1,167,481 |
| Nestle S.A. | | 23,016 | 2,482,016 |
| | | | $ 3,649,497 |
8
See Notes to Financial Statements.
Eaton Vance
Global Income Builder Fund
October 31, 2023
Portfolio of Investments — continued
| Security | Shares | Value |
| Ground Transportation — 0.5% |
| Union Pacific Corp. | | 5,593 | $ 1,161,163 |
| | | | $ 1,161,163 |
| Health Care Equipment & Supplies — 2.0% |
| Alcon, Inc. | | 12,334 | $ 882,820 |
| Boston Scientific Corp.(1) | | 37,678 | 1,928,737 |
| Intuitive Surgical, Inc.(1) | | 3,598 | 943,467 |
| Straumann Holding AG | | 5,681 | 671,404 |
| | | | $ 4,426,428 |
| Health Care Providers & Services — 0.5% |
| Elevance Health, Inc. | | 297 | $ 133,676 |
| UnitedHealth Group, Inc. | | 1,971 | 1,055,589 |
| | | | $ 1,189,265 |
| Health Care REITs — 0.3% |
| Healthpeak Properties, Inc. | | 45,280 | $ 704,104 |
| | | | $ 704,104 |
| Hotels, Restaurants & Leisure — 1.9% |
| Amadeus IT Group S.A. | | 15,389 | $ 878,293 |
| Compass Group PLC | | 88,133 | 2,221,953 |
| InterContinental Hotels Group PLC | | 13,654 | 967,557 |
| | | | $ 4,067,803 |
| Industrial Conglomerates — 0.6% |
| Siemens AG | | 9,149 | $ 1,214,062 |
| | | | $ 1,214,062 |
| Insurance — 2.5% |
| AIA Group, Ltd. | | 125,697 | $ 1,091,528 |
| Allstate Corp. (The) | | 8,160 | 1,045,541 |
| Assurant, Inc. | | 7,504 | 1,117,345 |
| AXA S.A. | | 35,341 | 1,047,169 |
| RenaissanceRe Holdings, Ltd. | | 5,247 | 1,152,189 |
| | | | $ 5,453,772 |
| Interactive Media & Services — 2.3% |
| Alphabet, Inc., Class C(1) | | 39,100 | $ 4,899,230 |
| | | | $ 4,899,230 |
| IT Services — 0.6% |
| Accenture PLC, Class A | | 4,592 | $ 1,364,237 |
| | | | $ 1,364,237 |
| Security | Shares | Value |
| Leisure Products — 0.2% |
| Yamaha Corp. | | 18,018 | $ 481,259 |
| | | | $ 481,259 |
| Life Sciences Tools & Services — 0.9% |
| Danaher Corp. | | 6,580 | $ 1,263,491 |
| Lonza Group AG | | 920 | 322,188 |
| Sartorius AG, PFC Shares | | 1,688 | 423,080 |
| | | | $ 2,008,759 |
| Machinery — 0.7% |
| Ingersoll Rand, Inc. | | 23,257 | $ 1,411,235 |
| | | | $ 1,411,235 |
| Media — 0.5% |
| Dentsu Group, Inc. | | 32,268 | $ 937,255 |
| National CineMedia, Inc.(1) | | 23,245 | 90,888 |
| | | | $ 1,028,143 |
| Metals & Mining — 0.8% |
| Anglo American PLC | | 26,945 | $ 686,547 |
| Rio Tinto, Ltd. | | 13,256 | 990,198 |
| | | | $ 1,676,745 |
| Multi-Utilities — 0.2% |
| CMS Energy Corp. | | 8,329 | $ 452,598 |
| | | | $ 452,598 |
| Oil, Gas & Consumable Fuels — 3.3% |
| Chevron Corp. | | 5,756 | $ 838,822 |
| ConocoPhillips | | 20,774 | 2,467,951 |
| EOG Resources, Inc. | | 30,347 | 3,831,309 |
| Phillips 66 | | 868 | 99,013 |
| | | | $ 7,237,095 |
| Personal Care Products — 0.2% |
| Kose Corp. | | 7,521 | $ 498,274 |
| | | | $ 498,274 |
| Pharmaceuticals — 7.0% |
| AstraZeneca PLC | | 11,766 | $ 1,473,146 |
| Eli Lilly & Co. | | 10,732 | 5,944,777 |
| Novo Nordisk A/S, Class B | | 48,268 | 4,656,713 |
| Sanofi S.A. | | 15,044 | 1,366,089 |
| Zoetis, Inc. | | 11,704 | 1,837,528 |
| | | | $ 15,278,253 |
9
See Notes to Financial Statements.
Eaton Vance
Global Income Builder Fund
October 31, 2023
Portfolio of Investments — continued
| Security | Shares | Value |
| Professional Services — 1.4% |
| Recruit Holdings Co., Ltd. | | 37,283 | $ 1,069,004 |
| RELX PLC | | 25,998 | 908,050 |
| Verisk Analytics, Inc. | | 4,558 | 1,036,307 |
| | | | $ 3,013,361 |
| Semiconductors & Semiconductor Equipment — 4.0% |
| ASML Holding NV | | 4,097 | $ 2,462,791 |
| Infineon Technologies AG | | 51,712 | 1,510,518 |
| Micron Technology, Inc. | | 23,558 | 1,575,324 |
| NVIDIA Corp. | | 4,433 | 1,807,777 |
| Taiwan Semiconductor Manufacturing Co., Ltd. ADR | | 15,529 | 1,340,308 |
| | | | $ 8,696,718 |
| Software — 4.8% |
| Adobe, Inc.(1) | | 4,091 | $ 2,176,658 |
| Intuit, Inc. | | 3,746 | 1,854,083 |
| Microsoft Corp. | | 19,085 | 6,452,829 |
| | | | $ 10,483,570 |
| Specialty Retail — 1.4% |
| Lowe's Cos., Inc. | | 6,848 | $ 1,305,023 |
| TJX Cos., Inc. (The) | | 20,379 | 1,794,779 |
| | | | $ 3,099,802 |
| Technology Hardware, Storage & Peripherals — 1.8% |
| Apple, Inc. | | 23,190 | $ 3,960,156 |
| | | | $ 3,960,156 |
| Textiles, Apparel & Luxury Goods — 0.5% |
| LVMH Moet Hennessy Louis Vuitton SE | | 1,625 | $ 1,163,387 |
| | | | $ 1,163,387 |
| Trading Companies & Distributors — 1.1% |
| Ashtead Group PLC | | 18,089 | $ 1,037,448 |
| IMCD NV | | 11,141 | 1,341,327 |
| | | | $ 2,378,775 |
Total Common Stocks
(identified cost $89,874,271) | | | $128,528,019 |
| Security | Principal
Amount
(000's omitted) | Value |
| Electric Utilities — 0.1% |
| NextEra Energy Partners, L.P., 2.50%, 6/15/26(2) | $ | 236 | $ 204,612 |
| | | | $ 204,612 |
| Leisure Products — 0.1% |
| Peloton Interactive, Inc., 0.00%, 2/15/26 | $ | 310 | $ 230,198 |
| | | | $ 230,198 |
| Transportation — 0.1% |
| CryoPort, Inc., 0.75%, 12/1/26(2) | $ | 364 | $ 286,869 |
| | | | $ 286,869 |
Total Convertible Bonds
(identified cost $797,528) | | | $ 721,679 |
| Security | Principal
Amount
(000's omitted)* | Value |
| Advertising — 0.0%(3) |
| Stagwell Global, LLC, 5.625%, 8/15/29(2) | | 75 | $ 62,073 |
| | | | $ 62,073 |
| Aerospace & Defense — 0.9% |
| Moog, Inc., 4.25%, 12/15/27(2) | | 170 | $ 151,539 |
| Rolls-Royce PLC, 5.75%, 10/15/27(2) | | 492 | 466,814 |
| Spirit AeroSystems, Inc.: | | | |
| 4.60%, 6/15/28 | | 69 | 54,655 |
| 9.375%, 11/30/29(2) | | 26 | 26,733 |
| TransDigm, Inc.: | | | |
| 4.625%, 1/15/29 | | 185 | 159,723 |
| 5.50%, 11/15/27 | | 106 | 98,788 |
| 6.25%, 3/15/26(2) | | 419 | 409,742 |
| 6.75%, 8/15/28(2) | | 221 | 214,864 |
| 7.50%, 3/15/27 | | 327 | 326,937 |
| | | | $ 1,909,795 |
| Airlines — 0.1% |
| American Airlines, Inc., 7.25%, 2/15/28(2) | | 57 | $ 53,068 |
| Deutsche Lufthansa AG, 3.50%, 7/14/29(4) | EUR | 200 | 190,136 |
| | | | $ 243,204 |
10
See Notes to Financial Statements.
Eaton Vance
Global Income Builder Fund
October 31, 2023
Portfolio of Investments — continued
| Security | Principal
Amount
(000's omitted)* | Value |
| Auto Components — 0.1% |
| Forvia SE: | | | |
| 2.75%, 2/15/27(4) | EUR | 100 | $ 96,409 |
| 3.75%, 6/15/28(4) | EUR | 100 | 96,650 |
| | | | $ 193,059 |
| Automobile Components — 0.6% |
| Clarios Global, L.P./Clarios US Finance Co.: | | | |
| 4.375%, 5/15/26(4) | EUR | 578 | $ 586,764 |
| 8.50%, 5/15/27(2) | | 194 | 191,371 |
| IHO Verwaltungs GmbH, 6.375%, (6.375% cash or 7.125% PIK), 5/15/29(2)(5) | | 200 | 174,487 |
| Real Hero Merger Sub 2, Inc., 6.25%, 2/1/29(2) | | 111 | 88,410 |
| TI Automotive Finance PLC, 3.75%, 4/15/29(4) | EUR | 200 | 177,008 |
| Wheel Pros, Inc., 6.50%, 5/15/29(2) | | 174 | 52,990 |
| | | | $ 1,271,030 |
| Automobiles — 0.6% |
| Ford Motor Co.: | | | |
| 3.25%, 2/12/32 | | 364 | $ 275,014 |
| 4.75%, 1/15/43 | | 197 | 137,092 |
| 9.625%, 4/22/30 | | 26 | 29,020 |
| Ford Motor Credit Co., LLC: | | | |
| 3.37%, 11/17/23 | | 200 | 199,942 |
| 4.125%, 8/17/27 | | 555 | 504,477 |
| 5.125%, 6/16/25 | | 200 | 194,786 |
| | | | $ 1,340,331 |
| Automotives — 0.1% |
| Dornoch Debt Merger Sub, Inc., 6.625%, 10/15/29(2) | | 213 | $ 167,796 |
| Goodyear Tire & Rubber Co. (The), 5.00%, 7/15/29 | | 184 | 158,522 |
| | | | $ 326,318 |
| Banks — 1.5% |
| Banco Mercantil del Norte S.A./Grand Cayman, 7.625% to 1/10/28(2)(6)(7) | | 200 | $ 181,383 |
| Bank of America Corp., Series TT, 6.125% to 4/27/27(6)(7) | | 89 | 83,902 |
| Bank of Nova Scotia (The), 8.625% to 10/27/27, 10/27/82(7) | | 200 | 196,149 |
| Barclays PLC, 8.00% to 3/15/29(6)(7) | | 200 | 177,400 |
| BNP Paribas S.A., 7.75% to 8/16/29(2)(6)(7) | | 200 | 185,935 |
| Citigroup, Inc., Series W, 4.00% to 12/10/25(6)(7) | | 226 | 194,605 |
| Farm Credit Bank of Texas, Series 3, 6.20% to 6/15/28(2)(6)(7) | | 220 | 199,100 |
| HSBC Holdings PLC, 4.60% to 12/17/30(6)(7) | | 200 | 145,102 |
| Security | Principal
Amount
(000's omitted)* | Value |
| Banks (continued) |
| Huntington Bancshares, Inc., Series F, 5.625% to 7/15/30(6)(7) | | 125 | $ 97,832 |
| JPMorgan Chase & Co.: | | | |
| Series KK, 3.65% to 6/1/26(6)(7) | | 251 | 218,363 |
| Series S, 6.75% to 2/1/24(6)(7) | | 215 | 214,971 |
| Lloyds Banking Group PLC, 7.50% to 9/27/25(6)(7) | | 200 | 186,060 |
| PNC Financial Services Group, Inc. (The), Series V, 6.20% to 9/15/27(6)(7) | | 100 | 89,219 |
| Regions Financial Corp., Series D, 5.75% to 6/15/25(6)(7) | | 75 | 68,985 |
| Societe Generale S.A., 5.375% to 11/18/30(2)(6)(7) | | 200 | 143,941 |
| Toronto-Dominion Bank (The), 8.125% to 10/31/27, 10/31/82(7) | | 200 | 196,712 |
| Truist Financial Corp., Series Q, 5.10% to 3/1/30(6)(7) | | 174 | 140,223 |
| UBS Group AG, 4.375% to 2/10/31(2)(6)(7) | | 200 | 139,351 |
| UniCredit SpA, 7.296% to 4/2/29, 4/2/34(2)(7) | | 200 | 185,652 |
| Wells Fargo & Co., Series BB, 3.90% to 3/15/26(6)(7) | | 217 | 188,092 |
| | | | $ 3,232,977 |
| Biotechnology — 0.4% |
| Grifols Escrow Issuer S.A.: | | | |
| 3.875%, 10/15/28(4) | EUR | 600 | $ 530,289 |
| 4.75%, 10/15/28(2) | | 280 | 235,441 |
| Grifols S.A., 3.20%, 5/1/25(4) | EUR | 100 | 101,632 |
| | | | $ 867,362 |
| Building Products — 0.6% |
| Builders FirstSource, Inc.: | | | |
| 4.25%, 2/1/32(2) | | 204 | $ 162,599 |
| 5.00%, 3/1/30(2) | | 90 | 78,641 |
| Emerald Debt Merger Sub, LLC, 6.625%, 12/15/30(2) | | 47 | 44,767 |
| PGT Innovations, Inc., 4.375%, 10/1/29(2) | | 134 | 125,223 |
| Standard Industries, Inc.: | | | |
| 2.25%, 11/21/26(4) | EUR | 400 | 372,450 |
| 4.375%, 7/15/30(2) | | 275 | 224,945 |
| WASH Multifamily Acquisition, Inc., 5.75%, 4/15/26(2) | | 346 | 320,365 |
| | | | $ 1,328,990 |
| Capital Markets — 0.1% |
| Charles Schwab Corp. (The), Series I, 4.00% to 6/1/26(6)(7) | | 259 | $ 205,885 |
| | | | $ 205,885 |
| Casino & Gaming — 0.1% |
| Cinemark USA, Inc.: | | | |
| 5.875%, 3/15/26(2) | | 67 | $ 63,687 |
11
See Notes to Financial Statements.
Eaton Vance
Global Income Builder Fund
October 31, 2023
Portfolio of Investments — continued
| Security | Principal
Amount
(000's omitted)* | Value |
| Casino & Gaming (continued) |
| Cinemark USA, Inc.: (continued) | | | |
| 8.75%, 5/1/25(2) | | 29 | $ 29,334 |
| Speedway Motorsports, LLC/Speedway Funding II, Inc., 4.875%, 11/1/27(2) | | 250 | 223,384 |
| | | | $ 316,405 |
| Chemicals — 0.5% |
| ASP Unifrax Holdings, Inc., 5.25%, 9/30/28(2) | | 139 | $ 94,048 |
| Avient Corp., 7.125%, 8/1/30(2) | | 102 | 98,243 |
| Herens Holdco S.a.r.l., 4.75%, 5/15/28(2) | | 201 | 155,882 |
| Herens Midco S.a.r.l., 5.25%, 5/15/29(4) | EUR | 100 | 60,268 |
| NOVA Chemicals Corp.: | | | |
| 4.25%, 5/15/29(2) | | 203 | 150,332 |
| 4.875%, 6/1/24(2) | | 106 | 104,285 |
| Nufarm Australia, Ltd./Nufarm Americas, Inc., 5.00%, 1/27/30(2) | | 236 | 204,994 |
| Olympus Water US Holding Corp., 9.75%, 11/15/28(2) | | 237 | 231,774 |
| Valvoline, Inc., 3.625%, 6/15/31(2) | | 128 | 97,464 |
| | | | $ 1,197,290 |
| Commercial Services & Supplies — 2.1% |
| Adtalem Global Education, Inc., 5.50%, 3/1/28(2) | | 290 | $ 264,399 |
| APi Group DE, Inc., 4.75%, 10/15/29(2) | | 55 | 47,153 |
| Clean Harbors, Inc.: | | | |
| 4.875%, 7/15/27(2) | | 101 | 94,262 |
| 5.125%, 7/15/29(2) | | 61 | 54,933 |
| 6.375%, 2/1/31(2) | | 38 | 36,164 |
| Covanta Holding Corp., 4.875%, 12/1/29(2) | | 430 | 336,062 |
| EC Finance PLC, 3.00%, 10/15/26(4) | EUR | 149 | 146,469 |
| Gartner, Inc.: | | | |
| 3.75%, 10/1/30(2) | | 187 | 155,058 |
| 4.50%, 7/1/28(2) | | 151 | 136,086 |
| GFL Environmental, Inc.: | | | |
| 3.50%, 9/1/28(2) | | 265 | 227,209 |
| 3.75%, 8/1/25(2) | | 130 | 123,100 |
| 4.75%, 6/15/29(2) | | 343 | 300,609 |
| HealthEquity, Inc., 4.50%, 10/1/29(2) | | 250 | 214,462 |
| Hertz Corp. (The): | | | |
| 4.625%, 12/1/26(2) | | 29 | 24,319 |
| 5.00%, 12/1/29(2) | | 230 | 165,410 |
| IPD 3 B.V., 8.00%, 6/15/28(4) | EUR | 200 | 213,888 |
| Korn Ferry, 4.625%, 12/15/27(2) | | 233 | 212,173 |
| Madison IAQ, LLC, 5.875%, 6/30/29(2) | | 323 | 250,575 |
| Metis Merger Sub, LLC, 6.50%, 5/15/29(2) | | 439 | 359,182 |
| NESCO Holdings II, Inc., 5.50%, 4/15/29(2) | | 206 | 176,848 |
| Security | Principal
Amount
(000's omitted)* | Value |
| Commercial Services & Supplies (continued) |
| Paprec Holding S.A., 3.50%, 7/1/28(4) | EUR | 352 | $ 330,737 |
| Team Health Holdings, Inc., 6.375%, 2/1/25(2) | | 235 | 186,465 |
| Tervita Corp., 11.00%, 12/1/25(2) | | 123 | 128,413 |
| VT Topco, Inc., 8.50%, 8/15/30(2) | | 293 | 286,128 |
| | | | $ 4,470,104 |
| Construction & Engineering — 0.1% |
| TopBuild Corp., 4.125%, 2/15/32(2) | | 201 | $ 159,277 |
| | | | $ 159,277 |
| Construction Materials — 0.2% |
| Smyrna Ready Mix Concrete, LLC, 6.00%, 11/1/28(2) | | 454 | $ 420,189 |
| | | | $ 420,189 |
| Consumer Finance — 0.2% |
| CPUK Finance, Ltd., 4.875%, 2/28/47(4) | GBP | 278 | $ 316,505 |
| PRA Group, Inc., 7.375%, 9/1/25(2) | | 217 | 203,117 |
| | | | $ 519,622 |
| Containers & Packaging — 1.1% |
| Ardagh Metal Packaging Finance USA, LLC/Ardagh Metal Packaging Finance PLC, 3.00%, 9/1/29(4) | EUR | 400 | $ 313,439 |
| Ardagh Packaging Finance PLC/Ardagh Holdings USA, Inc., 2.125%, 8/15/26(4) | EUR | 430 | 394,531 |
| Ball Corp., 6.875%, 3/15/28 | | 59 | 58,888 |
| Berry Global, Inc., 5.625%, 7/15/27(2) | | 117 | 111,806 |
| Canpack S.A./Canpack US, LLC, 3.875%, 11/15/29(2) | | 312 | 245,332 |
| Fiber Bidco SpA, 9.955%, (3 mo. EURIBOR + 6.00%), 10/25/27(4)(8) | EUR | 400 | 427,737 |
| Kleopatra Finco S.a.r.l., 4.25%, 3/1/26(4) | EUR | 479 | 421,042 |
| LABL, Inc., 5.875%, 11/1/28(2) | | 66 | 55,976 |
| Schoeller Packaging B.V., 6.375%, 11/1/24(4) | EUR | 350 | 364,965 |
| Sealed Air Corp./Sealed Air Corp. US, 6.125%, 2/1/28(2) | | 16 | 15,249 |
| | | | $ 2,408,965 |
| Cosmetics/Personal Care — 0.0%(3) |
| Edgewell Personal Care Co., 4.125%, 4/1/29(2) | | 74 | $ 61,983 |
| | | | $ 61,983 |
| Distributors — 0.9% |
| BCPE Empire Holdings, Inc., 7.625%, 5/1/27(2) | | 346 | $ 317,682 |
| Parts Europe S.A., 7.993%, (3 mo. EURIBOR + 4.00%), 7/20/27(4)(8) | EUR | 350 | 371,203 |
| Performance Food Group, Inc.: | | | |
| 4.25%, 8/1/29(2) | | 315 | 266,120 |
12
See Notes to Financial Statements.
Eaton Vance
Global Income Builder Fund
October 31, 2023
Portfolio of Investments — continued
| Security | Principal
Amount
(000's omitted)* | Value |
| Distributors (continued) |
| Performance Food Group, Inc.: (continued) | | | |
| 5.50%, 10/15/27(2) | | 169 | $ 158,205 |
| Rexel S.A., 5.25%, 9/15/30(4) | EUR | 300 | 313,608 |
| Ritchie Bros Holdings, Inc.: | | | |
| 6.75%, 3/15/28(2) | | 71 | 69,667 |
| 7.75%, 3/15/31(2) | | 132 | 132,495 |
| Windsor Holdings III, LLC, 8.50%, 6/15/30(2) | | 252 | 245,628 |
| | | | $ 1,874,608 |
| Diversified Consumer Services — 0.3% |
| GEMS MENASA Cayman, Ltd./GEMS Education Delaware, LLC, 7.125%, 7/31/26(4) | | 750 | $ 722,715 |
| | | | $ 722,715 |
| Diversified Financial Services — 0.4% |
| Air Lease Corp., Series B, 4.65% to 6/15/26(6)(7) | | 100 | $ 85,364 |
| Ally Financial, Inc., 6.70%, 2/14/33 | | 40 | 33,640 |
| Alpha Holding S.A. de CV, 9.00%, 2/10/25(2)(9) | | 189 | 3,535 |
| American AgCredit Corp., Series A, 5.25% to 6/15/26(2)(6)(7) | | 250 | 230,000 |
| Goldman Sachs Group, Inc. (The), Series W, 7.50% to 2/10/29(6)(7) | | 125 | 122,907 |
| Intrum AB, 4.875%, 8/15/25(4) | EUR | 100 | 95,190 |
| Macquarie Airfinance Holdings, Ltd., 8.125%, 3/30/29(2) | | 95 | 93,670 |
| VistaJet Malta Finance PLC/Vista Management Holding, Inc.: | | | |
| 7.875%, 5/1/27(2) | | 101 | 77,787 |
| 9.50%, 6/1/28(2) | | 117 | 89,769 |
| | | | $ 831,862 |
| Diversified REITs — 0.2% |
| CTR Partnership, L.P./CareTrust Capital Corp., 3.875%, 6/30/28(2) | | 250 | $ 210,323 |
| HAT Holdings I, LLC/HAT Holdings II, LLC, 3.375%, 6/15/26(2) | | 327 | 288,196 |
| | | | $ 498,519 |
| Diversified Telecommunication Services — 0.4% |
| Level 3 Financing, Inc., 4.25%, 7/1/28(2) | | 324 | $ 183,515 |
| Lorca Telecom Bondco S.A., 4.00%, 9/18/27(4) | EUR | 650 | 640,298 |
| | | | $ 823,813 |
| Electric Utilities — 1.3% |
| Dominion Energy, Inc., Series C, 4.35% to 1/15/27(6)(7) | | 93 | $ 76,134 |
| Electricite de France S.A., 7.50% to 9/6/28(4)(6)(7) | EUR | 200 | 214,435 |
| Security | Principal
Amount
(000's omitted)* | Value |
| Electric Utilities (continued) |
| Enviva Partners, L.P./Enviva Partners Finance Corp., 6.50%, 1/15/26(2) | | 435 | $ 306,064 |
| FirstEnergy Corp.: | | | |
| 2.65%, 3/1/30 | | 53 | 42,802 |
| Series B, 4.15%, 7/15/27 | | 257 | 238,092 |
| Imola Merger Corp., 4.75%, 5/15/29(2) | | 370 | 322,883 |
| NextEra Energy Operating Partners, L.P., 4.50%, 9/15/27(2) | | 90 | 80,672 |
| NRG Energy, Inc.: | | | |
| 3.625%, 2/15/31(2) | | 177 | 133,790 |
| 3.875%, 2/15/32(2) | | 95 | 70,742 |
| Pattern Energy Operations, L.P./Pattern Energy Operations, Inc., 4.50%, 8/15/28(2) | | 152 | 132,648 |
| Sempra, 4.125% to 1/1/27, 4/1/52(7) | | 167 | 128,838 |
| Southern California Edison Co., Series E, 9.838%, (3 mo. SOFR + 4.461%)(6)(8) | | 101 | 100,858 |
| Southern Co. (The): | | | |
| Series 21-A, 3.75% to 6/15/26, 9/15/51(7) | | 120 | 102,812 |
| Series B, 4.00% to 10/15/25, 1/15/51(7) | | 56 | 51,183 |
| TerraForm Power Operating, LLC, 5.00%, 1/31/28(2) | | 237 | 217,354 |
| TransAlta Corp., 7.75%, 11/15/29 | | 166 | 165,340 |
| Vistra Operations Co., LLC: | | | |
| 4.375%, 5/1/29(2) | | 173 | 147,138 |
| 5.00%, 7/31/27(2) | | 232 | 212,441 |
| | | | $ 2,744,226 |
| Electronic Equipment, Instruments & Components — 0.3% |
| Coherent Corp., 5.00%, 12/15/29(2) | | 277 | $ 235,429 |
| Energizer Gamma Acquisition B.V., 3.50%, 6/30/29(4) | EUR | 250 | 209,503 |
| Sensata Technologies B.V., 5.00%, 10/1/25(2) | | 57 | 55,482 |
| WESCO Distribution, Inc., 7.25%, 6/15/28(2) | | 153 | 152,192 |
| | | | $ 652,606 |
| Entertainment — 1.4% |
| Allwyn Entertainment Financing UK PLC, 7.25%, 4/30/30(4) | EUR | 400 | $ 422,499 |
| Boyne USA, Inc., 4.75%, 5/15/29(2) | | 276 | 240,563 |
| Caesars Entertainment, Inc.: | | | |
| 6.25%, 7/1/25(2) | | 417 | 410,613 |
| 7.00%, 2/15/30(2) | | 100 | 96,602 |
| 8.125%, 7/1/27(2) | | 56 | 55,534 |
| CDI Escrow Issuer, Inc., 5.75%, 4/1/30(2) | | 233 | 208,406 |
| Cinemark USA, Inc., 5.25%, 7/15/28(2) | | 206 | 178,101 |
| Jacobs Entertainment, Inc., 6.75%, 2/15/29(2) | | 278 | 236,542 |
13
See Notes to Financial Statements.
Eaton Vance
Global Income Builder Fund
October 31, 2023
Portfolio of Investments — continued
| Security | Principal
Amount
(000's omitted)* | Value |
| Entertainment (continued) |
| LHMC Finco 2 S.a.r.l., 7.25%, (7.25% cash or 8.00% PIK), 10/2/25(4)(5) | EUR | 564 | $ 576,515 |
| Light & Wonder International, Inc., 7.00%, 5/15/28(2) | | 216 | 210,759 |
| Resorts World Las Vegas, LLC/RWLV Capital, Inc., 8.45%, 7/27/30(2) | | 200 | 184,604 |
| SeaWorld Parks & Entertainment, Inc., 5.25%, 8/15/29(2) | | 225 | 196,222 |
| | | | $ 3,016,960 |
| Financial Services — 1.6% |
| AG TTMT Escrow Issuer, LLC, 8.625%, 9/30/27(2) | | 145 | $ 145,815 |
| Allied Universal Holdco, LLC/Allied Universal Finance Corp.: | | | |
| 6.625%, 7/15/26(2) | | 485 | 454,603 |
| 9.75%, 7/15/27(2) | | 203 | 176,563 |
| Ally Financial, Inc., Series B, 4.70% to 5/15/26(6)(7) | | 270 | 176,100 |
| Compass Group Diversified Holdings, LLC, 5.25%, 4/15/29(2) | | 254 | 217,164 |
| Encore Capital Group, Inc., 5.375%, 2/15/26(4) | GBP | 180 | 200,283 |
| GTCR W-2 Merger Sub, LLC/GTCR W Dutch Finance Sub B.V., 8.50%, 1/15/31(4) | GBP | 200 | 244,609 |
| Jane Street Group/JSG Finance, Inc., 4.50%, 11/15/29(2) | | 315 | 268,781 |
| Jefferson Capital Holdings, LLC, 6.00%, 8/15/26(2) | | 343 | 299,898 |
| Louvre Bidco S.A.S., 6.50%, 9/30/24(4) | EUR | 258 | 268,762 |
| Oxford Finance, LLC/Oxford Finance Co-Issuer II, Inc., 6.375%, 2/1/27(2) | | 160 | 145,968 |
| Rocket Mortgage, LLC/Rocket Mortgage Co.-Issuer, Inc.: | | | |
| 2.875%, 10/15/26(2) | | 156 | 135,987 |
| 3.625%, 3/1/29(2) | | 202 | 164,429 |
| 4.00%, 10/15/33(2) | | 30 | 22,085 |
| Sherwood Financing PLC, 6.00%, 11/15/26(4) | GBP | 420 | 426,636 |
| VistaJet Malta Finance PLC/Vista Management Holding, Inc., 6.375%, 2/1/30(2) | | 348 | 232,451 |
| | | | $ 3,580,134 |
| Food Products — 0.7% |
| Albertsons Cos., Inc./Safeway, Inc./New Albertsons, L.P./Albertsons, LLC: | | | |
| 4.875%, 2/15/30(2) | | 138 | $ 123,363 |
| 5.875%, 2/15/28(2) | | 181 | 173,556 |
| Chobani, LLC/Chobani Finance Corp., Inc., 7.50%, 4/15/25(2) | | 160 | 157,318 |
| Darling Ingredients, Inc., 6.00%, 6/15/30(2) | | 215 | 201,917 |
| Land O' Lakes, Inc., 8.00%(2)(6) | | 235 | 209,150 |
| Nomad Foods Bondco PLC, 2.50%, 6/24/28(4) | EUR | 433 | 398,316 |
| Pilgrim's Pride Corp., 3.50%, 3/1/32 | | 252 | 192,286 |
| | | | $ 1,455,906 |
| Security | Principal
Amount
(000's omitted)* | Value |
| Health Care Equipment & Supplies — 1.5% |
| Catalent Pharma Solutions, Inc., 2.375%, 3/1/28(4) | EUR | 305 | $ 266,107 |
| Compass Minerals International, Inc., 6.75%, 12/1/27(2) | | 399 | 376,217 |
| LifePoint Health, Inc.: | | | |
| 5.375%, 1/15/29(2) | | 200 | 121,367 |
| 9.875%, 8/15/30(2) | | 105 | 95,025 |
| Medline Borrower, L.P., 5.25%, 10/1/29(2) | | 531 | 452,522 |
| ModivCare Escrow Issuer, Inc., 5.00%, 10/1/29(2) | | 137 | 99,983 |
| Molina Healthcare, Inc.: | | | |
| 3.875%, 11/15/30(2) | | 245 | 200,115 |
| 3.875%, 5/15/32(2) | | 189 | 148,734 |
| RegionalCare Hospital Partners Holdings, Inc./LifePoint Health, Inc., 9.75%, 12/1/26(2) | | 240 | 224,643 |
| Tenet Healthcare Corp.: | | | |
| 4.375%, 1/15/30 | | 17 | 14,395 |
| 4.875%, 1/1/26 | | 290 | 278,204 |
| 5.125%, 11/1/27 | | 138 | 127,524 |
| 6.125%, 10/1/28 | | 289 | 268,302 |
| 6.875%, 11/15/31 | | 133 | 122,772 |
| US Acute Care Solutions, LLC, 6.375%, 3/1/26(2) | | 400 | 340,698 |
| Varex Imaging Corp., 7.875%, 10/15/27(2) | | 202 | 198,223 |
| | | | $ 3,334,831 |
| Health Care Providers & Services — 0.7% |
| AMN Healthcare, Inc., 4.00%, 4/15/29(2) | | 290 | $ 240,521 |
| Cerba Healthcare SACA, 3.50%, 5/31/28(4) | EUR | 500 | 431,394 |
| IQVIA, Inc., 2.875%, 6/15/28(4) | EUR | 150 | 141,557 |
| Legacy LifePoint Health, LLC, 4.375%, 2/15/27(2) | | 173 | 143,215 |
| ModivCare, Inc., 5.875%, 11/15/25(2) | | 207 | 195,834 |
| Verisure Holding AB, 3.25%, 2/15/27(4) | EUR | 335 | 321,233 |
| | | | $ 1,473,754 |
| Healthcare-Services — 0.3% |
| AHP Health Partners, Inc., 5.75%, 7/15/29(2) | | 75 | $ 61,571 |
| Fortrea Holdings, Inc., 7.50%, 7/1/30(2) | | 294 | 284,077 |
| Heartland Dental, LLC/Heartland Dental Finance Corp., 10.50%, 4/30/28(2) | | 374 | 359,930 |
| | | | $ 705,578 |
| Home Builders — 0.0%(3) |
| Ashton Woods USA, LLC/Ashton Woods Finance Co.: | | | |
| 4.625%, 8/1/29(2) | | 48 | $ 38,887 |
| 4.625%, 4/1/30(2) | | 48 | 37,213 |
| | | | $ 76,100 |
14
See Notes to Financial Statements.
Eaton Vance
Global Income Builder Fund
October 31, 2023
Portfolio of Investments — continued
| Security | Principal
Amount
(000's omitted)* | Value |
| Hotels, Restaurants & Leisure — 0.4% |
| 1011778 B.C. Unlimited Liability Company/New Red Finance, Inc.: | | | |
| 3.875%, 1/15/28(2) | | 286 | $ 255,589 |
| 4.375%, 1/15/28(2) | | 182 | 164,037 |
| 5.75%, 4/15/25(2) | | 66 | 65,523 |
| Lithia Motors, Inc., 4.625%, 12/15/27(2) | | 91 | 82,197 |
| Viking Cruises, Ltd., 5.875%, 9/15/27(2) | | 279 | 251,603 |
| | | | $ 818,949 |
| Household Products — 0.2% |
| CD&R Smokey Buyer, Inc., 6.75%, 7/15/25(2) | | 96 | $ 91,842 |
| Spectrum Brands, Inc., 3.875%, 3/15/31(2) | | 105 | 84,154 |
| Tempur Sealy International, Inc., 3.875%, 10/15/31(2) | | 301 | 225,804 |
| | | | $ 401,800 |
| Housewares — 0.1% |
| ProGroup AG, 3.00%, 3/31/26(4) | EUR | 163 | $ 161,256 |
| | | | $ 161,256 |
| Independent Power and Renewable Electricity Producers — 0.3% |
| Algonquin Power & Utilities Corp., 4.75% to 1/18/27, 1/18/82(7) | | 113 | $ 89,327 |
| Calpine Corp.: | | | |
| 5.125%, 3/15/28(2) | | 273 | 244,576 |
| 5.25%, 6/1/26(2) | | 50 | 47,900 |
| NRG Energy, Inc., 10.25% to 3/15/28(2)(6)(7) | | 174 | 168,158 |
| | | | $ 549,961 |
| Industrial Conglomerates — 0.3% |
| Abertis Infraestructuras Finance B.V., 3.248% to 11/24/25(4)(6)(7) | EUR | 200 | $ 196,045 |
| Brundage-Bone Concrete Pumping Holdings, Inc., 6.00%, 2/1/26(2) | | 162 | 153,338 |
| Gatwick Airport Finance PLC, 4.375%, 4/7/26(4) | GBP | 245 | 275,898 |
| Paprec Holding S.A., 4.00%, 3/31/25(4) | EUR | 115 | 120,384 |
| | | | $ 745,665 |
| Insurance — 0.7% |
| Alliant Holdings Intermediate, LLC/Alliant Holdings Co-Issuer, 6.75%, 10/15/27(2) | | 96 | $ 87,756 |
| Corebridge Financial, Inc., 6.875% to 9/15/27, 12/15/52(7) | | 187 | 172,985 |
| Galaxy Finco, Ltd., 9.25%, 7/31/27(4) | GBP | 525 | 572,705 |
| Jones DesLauriers Insurance Management, Inc., 10.50%, 12/15/30(2) | | 243 | 241,407 |
| Security | Principal
Amount
(000's omitted)* | Value |
| Insurance (continued) |
| Liberty Mutual Group, Inc., 4.125% to 9/15/26, 12/15/51(2)(7) | | 216 | $ 171,860 |
| Lincoln National Corp., Series C, 9.25% to 12/1/27(6)(7) | | 38 | 38,342 |
| Prudential Financial, Inc., 5.125% to 11/28/31, 3/1/52(7) | | 60 | 51,128 |
| QBE Insurance Group, Ltd., 5.875% to 5/12/25(2)(6)(7) | | 222 | 212,725 |
| | | | $ 1,548,908 |
| Internet — 0.1% |
| Cars.com, Inc., 6.375%, 11/1/28(2) | | 200 | $ 178,223 |
| | | | $ 178,223 |
| Internet & Direct Marketing Retail — 0.2% |
| Arches Buyer, Inc.: | | | |
| 4.25%, 6/1/28(2) | | 82 | $ 68,005 |
| 6.125%, 12/1/28(2) | | 313 | 253,128 |
| Match Group Holdings II, LLC, 3.625%, 10/1/31(2) | | 273 | 209,770 |
| | | | $ 530,903 |
| Leisure Products — 0.7% |
| Acushnet Co., 7.375%, 10/15/28(2) | | 92 | $ 92,256 |
| Life Time, Inc.: | | | |
| 5.75%, 1/15/26(2) | | 199 | 192,903 |
| 8.00%, 4/15/26(2) | | 278 | 271,281 |
| Lindblad Expeditions Holdings, Inc., 9.00%, 5/15/28(2) | | 91 | 87,615 |
| Lindblad Expeditions, LLC, 6.75%, 2/15/27(2) | | 44 | 40,136 |
| NCL Corp., Ltd.: | | | |
| 3.625%, 12/15/24(2) | | 54 | 51,123 |
| 5.875%, 3/15/26(2) | | 106 | 95,229 |
| 5.875%, 2/15/27(2) | | 67 | 61,739 |
| 7.75%, 2/15/29(2) | | 56 | 48,920 |
| NCL Finance, Ltd., 6.125%, 3/15/28(2) | | 136 | 113,843 |
| Royal Caribbean Cruises, Ltd., 11.625%, 8/15/27(2) | | 201 | 218,194 |
| Viking Cruises, Ltd., 7.00%, 2/15/29(2) | | 104 | 94,208 |
| Viking Ocean Cruises Ship VII, Ltd., 5.625%, 2/15/29(2) | | 66 | 58,565 |
| | | | $ 1,426,012 |
| Life Sciences Tools & Services — 0.1% |
| W.R. Grace Holdings, LLC: | | | |
| 4.875%, 6/15/27(2) | | 245 | $ 220,404 |
| 7.375%, 3/1/31(2) | | 73 | 67,736 |
| | | | $ 288,140 |
| Machinery — 0.4% |
| Chart Industries, Inc., 9.50%, 1/1/31(2) | | 140 | $ 144,365 |
15
See Notes to Financial Statements.
Eaton Vance
Global Income Builder Fund
October 31, 2023
Portfolio of Investments — continued
| Security | Principal
Amount
(000's omitted)* | Value |
| Machinery (continued) |
| IMA Industria Macchine Automatiche SpA, 3.75%, 1/15/28(4) | EUR | 236 | $ 224,800 |
| Renk AG, 5.75%, 7/15/25(4) | EUR | 200 | 209,088 |
| TK Elevator Midco GmbH, 8.715%, (3 mo. EURIBOR + 4.75%), 7/15/27(4)(8) | EUR | 200 | 212,017 |
| | | | $ 790,270 |
| Media — 2.1% |
| Altice Financing S.A., 5.00%, 1/15/28(2) | | 200 | $ 162,816 |
| Altice France S.A., 8.125%, 2/1/27(2) | | 458 | 386,598 |
| Audacy Capital Corp., 6.75%, 3/31/29(2)(9) | | 261 | 4,442 |
| Beasley Mezzanine Holdings, LLC, 8.625%, 2/1/26(2) | | 308 | 203,665 |
| CCO Holdings, LLC/CCO Holdings Capital Corp.: | | | |
| 4.25%, 2/1/31(2) | | 338 | 263,293 |
| 4.50%, 8/15/30(2) | | 343 | 275,486 |
| 4.75%, 3/1/30(2) | | 322 | 266,086 |
| 4.75%, 2/1/32(2) | | 139 | 108,633 |
| 5.375%, 6/1/29(2) | | 110 | 96,430 |
| 6.375%, 9/1/29(2) | | 253 | 231,788 |
| Clear Channel Outdoor Holdings, Inc., 7.75%, 4/15/28(2) | | 237 | 181,428 |
| DISH Network Corp., 11.75%, 11/15/27(2) | | 160 | 158,622 |
| LCPR Senior Secured Financing DAC, 5.125%, 7/15/29(2) | | 205 | 159,904 |
| McGraw-Hill Education, Inc.: | | | |
| 5.75%, 8/1/28(2) | | 57 | 48,102 |
| 8.00%, 8/1/29(2) | | 212 | 174,964 |
| Outfront Media Capital, LLC/Outfront Media Capital Corp.: | | | |
| 4.625%, 3/15/30(2) | | 101 | 81,150 |
| 6.25%, 6/15/25(2) | | 137 | 135,248 |
| Summer (BC) Holdco A S.a.r.l., 9.25%, 10/31/27(4) | EUR | 129 | 109,069 |
| Summer (BC) Holdco B S.a.r.l., 5.75%, 10/31/26(4) | EUR | 400 | 383,570 |
| Townsquare Media, Inc., 6.875%, 2/1/26(2) | | 141 | 130,465 |
| Univision Communications, Inc., 7.375%, 6/30/30(2) | | 142 | 125,172 |
| Virgin Media Vendor Financing Notes III DAC, 4.875%, 7/15/28(4) | GBP | 810 | 827,983 |
| | | | $ 4,514,914 |
| Metals & Mining — 1.4% |
| Allegheny Ludlum, LLC, 6.95%, 12/15/25 | | 200 | $ 199,376 |
| BWX Technologies, Inc.: | | | |
| 4.125%, 6/30/28(2) | | 159 | 140,099 |
| 4.125%, 4/15/29(2) | | 118 | 101,026 |
| Calderys Financing, LLC, 11.25%, 6/1/28(2) | | 173 | 174,730 |
| Cleveland-Cliffs, Inc., 6.75%, 3/15/26(2) | | 460 | 457,871 |
| Eldorado Gold Corp., 6.25%, 9/1/29(2) | | 251 | 215,536 |
| Security | Principal
Amount
(000's omitted)* | Value |
| Metals & Mining (continued) |
| Freeport-McMoRan, Inc., 5.45%, 3/15/43 | | 267 | $ 220,043 |
| Hudbay Minerals, Inc.: | | | |
| 4.50%, 4/1/26(2) | | 204 | 190,077 |
| 6.125%, 4/1/29(2) | | 96 | 86,021 |
| New Gold, Inc., 7.50%, 7/15/27(2) | | 222 | 208,526 |
| Novelis Corp., 3.25%, 11/15/26(2) | | 89 | 79,324 |
| Novelis Sheet Ingot GmbH, 3.375%, 4/15/29(4) | EUR | 400 | 362,882 |
| Permian Resources Operating, LLC, 5.375%, 1/15/26(2) | | 225 | 216,230 |
| Roller Bearing Co. of America, Inc., 4.375%, 10/15/29(2) | | 187 | 158,812 |
| TMS International Corp., 6.25%, 4/15/29(2) | | 196 | 154,839 |
| | | | $ 2,965,392 |
| Oil, Gas & Consumable Fuels — 1.8% |
| Aethon United BR, L.P./Aethon United Finance Corp., 8.25%, 2/15/26(2) | | 555 | $ 551,764 |
| Civitas Resources, Inc., 8.625%, 11/1/30(2) | | 55 | 56,039 |
| CrownRock, L.P./CrownRock Finance, Inc., 5.00%, 5/1/29(2) | | 173 | 163,329 |
| CVR Energy, Inc., 5.75%, 2/15/28(2) | | 439 | 394,839 |
| Endeavor Energy Resources, L.P./EER Finance, Inc., 5.75%, 1/30/28(2) | | 170 | 163,251 |
| EnLink Midstream Partners, L.P., Series C, 9.78%, (3 mo. SOFR + 4.372%)(6)(8) | | 145 | 129,311 |
| Neptune Energy Bondco PLC, 6.625%, 5/15/25(2) | | 200 | 198,185 |
| Odebrecht Oil & Gas Finance, Ltd., 0.00%(2)(6) | | 862 | 17,776 |
| Parkland Corp.: | | | |
| 4.50%, 10/1/29(2) | | 110 | 94,719 |
| 4.625%, 5/1/30(2) | | 202 | 172,426 |
| Permian Resources Operating, LLC: | | | |
| 5.875%, 7/1/29(2) | | 260 | 242,229 |
| 7.00%, 1/15/32(2) | | 147 | 142,643 |
| Plains All American Pipeline, L.P., Series B, 9.736%, (3 mo. SOFR + 4.372%)(6)(8) | | 327 | 308,921 |
| Precision Drilling Corp.: | | | |
| 6.875%, 1/15/29(2) | | 152 | 140,886 |
| 7.125%, 1/15/26(2) | | 99 | 97,641 |
| Southwestern Energy Co., 4.75%, 2/1/32 | | 285 | 245,373 |
| Sunoco, L.P./Sunoco Finance Corp., 4.50%, 4/30/30 | | 226 | 193,268 |
| Transocean Poseidon, Ltd., 6.875%, 2/1/27(2) | | 136 | 133,160 |
| Transocean, Inc., 8.75%, 2/15/30(2) | | 84 | 83,424 |
| Vital Energy, Inc., 9.75%, 10/15/30 | | 125 | 122,623 |
| Wintershall Dea Finance 2 B.V., Series NC5, 2.499% to 4/20/26(4)(6)(7) | EUR | 400 | 372,424 |
| | | | $ 4,024,231 |
16
See Notes to Financial Statements.
Eaton Vance
Global Income Builder Fund
October 31, 2023
Portfolio of Investments — continued
| Security | Principal
Amount
(000's omitted)* | Value |
| Packaging & Containers — 0.3% |
| Owens-Brockway Glass Container, Inc., 7.25%, 5/15/31(2) | | 253 | $ 231,811 |
| Trivium Packaging Finance B.V.: | | | |
| 7.531%, (3 mo. EURIBOR + 3.75%), 8/15/26(4)(8) | EUR | 200 | 206,330 |
| 8.50%, 8/15/27(2) | | 200 | 167,184 |
| | | | $ 605,325 |
| Passenger Airlines — 0.4% |
| Air Canada, 3.875%, 8/15/26(2) | | 101 | $ 91,996 |
| Air France-KLM, 8.125%, 5/31/28(4) | EUR | 300 | 334,138 |
| American Airlines, Inc./AAdvantage Loyalty IP, Ltd., 5.50%, 4/20/26(2) | | 262 | 254,715 |
| United Airlines, Inc., 4.625%, 4/15/29(2) | | 193 | 163,201 |
| | | | $ 844,050 |
| Pharmaceuticals — 0.9% |
| Bayer AG, 5.375% to 6/25/30, 3/25/82(4)(7) | EUR | 200 | $ 193,985 |
| BellRing Brands, Inc., 7.00%, 3/15/30(2) | | 163 | 158,482 |
| Cheplapharm Arzneimittel GmbH, 8.531%, (3 mo. EURIBOR + 4.75%), 5/15/30(4)(8) | EUR | 300 | 319,811 |
| Endo DAC/Endo Finance, LLC/Endo Finco, Inc., 5.875%, 10/15/24(2)(9) | | 200 | 134,500 |
| Endo Luxembourg Finance Co. I S.a.r.l./Endo US, Inc., 6.125%, 4/1/29(2)(9) | | 247 | 163,280 |
| Gruenenthal GmbH, 3.625%, 11/15/26(4) | EUR | 220 | 221,356 |
| Herbalife Nutrition, Ltd./HLF Financing, Inc., 7.875%, 9/1/25(2) | | 217 | 204,412 |
| Option Care Health, Inc., 4.375%, 10/31/29(2) | | 163 | 136,411 |
| P&L Development, LLC/PLD Finance Corp., 7.75%, 11/15/25(2) | | 224 | 150,675 |
| Perrigo Finance Unlimited Co., 4.65%, 6/15/30 | | 400 | 334,483 |
| | | | $ 2,017,395 |
| Pipelines — 1.2% |
| Antero Midstream Partners, L.P./Antero Midstream Finance Corp.: | | | |
| 5.75%, 3/1/27(2) | | 102 | $ 97,586 |
| 7.875%, 5/15/26(2) | | 109 | 109,879 |
| Cheniere Energy Partners, L.P., 4.00%, 3/1/31 | | 138 | 115,679 |
| DT Midstream, Inc., 4.125%, 6/15/29(2) | | 172 | 148,051 |
| Enbridge, Inc., Series NC5, 8.25% to 10/15/28, 1/15/84(7) | | 125 | 119,866 |
| Energy Transfer, L.P.: | | | |
| 5.00%, 5/15/50 | | 136 | 102,063 |
| Series B, 6.625% to 2/15/28(6)(7) | | 147 | 114,109 |
| Security | Principal
Amount
(000's omitted)* | Value |
| Pipelines (continued) |
| EQM Midstream Partners, L.P.: | | | |
| 4.50%, 1/15/29(2) | | 364 | $ 319,572 |
| 6.00%, 7/1/25(2) | | 43 | 42,093 |
| 6.50%, 7/1/27(2) | | 116 | 112,865 |
| 7.50%, 6/1/30(2) | | 126 | 123,756 |
| Kinetik Holdings, L.P., 5.875%, 6/15/30(2) | | 237 | 217,692 |
| New Fortress Energy, Inc., 6.50%, 9/30/26(2) | | 307 | 275,264 |
| Venture Global LNG, Inc.: | | | |
| 8.125%, 6/1/28(2) | | 139 | 135,051 |
| 8.375%, 6/1/31(2) | | 222 | 212,010 |
| 9.50%, 2/1/29(2) | | 131 | 133,170 |
| 9.875%, 2/1/32(2) | | 132 | 133,929 |
| | | | $ 2,512,635 |
| Real Estate Investment Trusts (REITs) — 0.4% |
| Greystar Real Estate Partners, LLC, 7.75%, 9/1/30(2) | | 230 | $ 226,278 |
| HAT Holdings I, LLC/HAT Holdings II, LLC, 3.75%, 9/15/30(2) | | 266 | 191,236 |
| Heimstaden Bostad AB: | | | |
| 3.00% to 10/29/27(4)(6)(7) | EUR | 115 | 50,612 |
| 3.375% to 1/15/26(4)(6)(7) | EUR | 300 | 148,427 |
| VICI Properties, L.P./VICI Note Co., Inc., 5.625%, 5/1/24(2) | | 200 | 198,820 |
| | | | $ 815,373 |
| Real Estate Management & Development — 0.2% |
| Cushman & Wakefield US Borrower, LLC, 8.875%, 9/1/31(2) | | 108 | $ 102,497 |
| Emeria SASU, 7.75%, 3/31/28(4) | EUR | 340 | 331,613 |
| | | | $ 434,110 |
| Retail — 0.1% |
| PEU (Fin) PLC, 7.25%, 7/1/28(4) | EUR | 200 | $ 203,586 |
| | | | $ 203,586 |
| Semiconductors & Semiconductor Equipment — 0.1% |
| ON Semiconductor Corp., 3.875%, 9/1/28(2) | | 185 | $ 159,131 |
| | | | $ 159,131 |
| Software — 0.7% |
| athenahealth Group, Inc., 6.50%, 2/15/30(2) | | 306 | $ 250,330 |
| Central Parent, LLC/CDK Global II, LLC/CDK Financing Co., Inc., 8.00%, 6/15/29(2) | | 134 | 132,492 |
| Clarivate Science Holdings Corp., 4.875%, 7/1/29(2) | | 329 | 277,890 |
| Cloud Software Group, Inc.: | | | |
| 6.50%, 3/31/29(2) | | 122 | 107,227 |
17
See Notes to Financial Statements.
Eaton Vance
Global Income Builder Fund
October 31, 2023
Portfolio of Investments — continued
| Security | Principal
Amount
(000's omitted)* | Value |
| Software (continued) |
| Cloud Software Group, Inc.: (continued) | | | |
| 9.00%, 9/30/29(2) | | 239 | $ 203,749 |
| Fair Isaac Corp., 4.00%, 6/15/28(2) | | 165 | 147,117 |
| Open Text Corp., 3.875%, 2/15/28(2) | | 37 | 32,199 |
| Open Text Holdings, Inc., 4.125%, 2/15/30(2) | | 37 | 30,704 |
| Playtika Holding Corp., 4.25%, 3/15/29(2) | | 303 | 244,691 |
| | | | $ 1,426,399 |
| Specialty Retail — 2.6% |
| Arko Corp., 5.125%, 11/15/29(2) | | 247 | $ 200,534 |
| Asbury Automotive Group, Inc.: | | | |
| 4.625%, 11/15/29(2) | | 27 | 22,873 |
| 4.75%, 3/1/30 | | 228 | 193,772 |
| 5.00%, 2/15/32(2) | | 28 | 22,739 |
| Bath & Body Works, Inc.: | | | |
| 6.625%, 10/1/30(2) | | 45 | 41,719 |
| 6.75%, 7/1/36 | | 80 | 69,086 |
| 6.95%, 3/1/33 | | 168 | 145,442 |
| 7.60%, 7/15/37 | | 17 | 14,431 |
| 9.375%, 7/1/25(2) | | 31 | 31,957 |
| Bausch & Lomb Escrow Corp., 8.375%, 10/1/28(2) | | 210 | ���208,845 |
| Dave & Buster's, Inc., 7.625%, 11/1/25(2) | | 457 | 454,034 |
| Dufry One B.V., 3.375%, 4/15/28(4) | EUR | 479 | 450,229 |
| Evergreen AcqCo 1, L.P./TVI, Inc., 9.75%, 4/26/28(2) | | 273 | 275,723 |
| Ferrellgas, L.P./Ferrellgas Finance Corp., 5.875%, 4/1/29(2) | | 246 | 217,303 |
| Fertitta Entertainment, LLC/Fertitta Entertainment Finance Co., Inc., 4.625%, 1/15/29(2) | | 100 | 84,142 |
| Group 1 Automotive, Inc., 4.00%, 8/15/28(2) | | 203 | 174,949 |
| IRB Holding Corp., 7.00%, 6/15/25(2) | | 98 | 97,358 |
| Ken Garff Automotive, LLC, 4.875%, 9/15/28(2) | | 155 | 131,228 |
| Kohl's Corp., 4.625%, 5/1/31 | | 129 | 88,352 |
| LCM Investments Holdings II, LLC: | | | |
| 4.875%, 5/1/29(2) | | 257 | 215,643 |
| 8.25%, 8/1/31(2) | | 32 | 30,470 |
| Lithia Motors, Inc., 3.875%, 6/1/29(2) | | 86 | 71,242 |
| Midco GB SASU, 7.75%, (7.75% cash or 8.50% PIK), 11/1/27(4)(5) | EUR | 285 | 285,072 |
| Patrick Industries, Inc.: | | | |
| 4.75%, 5/1/29(2) | | 196 | 159,446 |
| 7.50%, 10/15/27(2) | | 30 | 28,608 |
| PetSmart, Inc./PetSmart Finance Corp.: | | | |
| 4.75%, 2/15/28(2) | | 250 | 221,490 |
| 7.75%, 2/15/29(2) | | 264 | 243,304 |
| Punch Finance PLC, 6.125%, 6/30/26(4) | GBP | 340 | 356,596 |
| Security | Principal
Amount
(000's omitted)* | Value |
| Specialty Retail (continued) |
| Sonic Automotive, Inc.: | | | |
| 4.625%, 11/15/29(2) | | 172 | $ 143,413 |
| 4.875%, 11/15/31(2) | | 143 | 114,059 |
| SRS Distribution, Inc., 6.00%, 12/1/29(2) | | 244 | 203,391 |
| Suburban Propane Partners, L.P./Suburban Energy Finance Corp., 5.00%, 6/1/31(2) | | 135 | 111,962 |
| Superior Plus, L.P./Superior General Partner, Inc., 4.50%, 3/15/29(2) | | 254 | 216,907 |
| White Cap Buyer, LLC, 6.875%, 10/15/28(2) | | 230 | 200,959 |
| Yum! Brands, Inc., 3.625%, 3/15/31 | | 147 | 119,524 |
| | | | $ 5,646,802 |
| Technology Hardware, Storage & Peripherals — 0.6% |
| Booz Allen Hamilton, Inc., 4.00%, 7/1/29(2) | | 97 | $ 85,713 |
| McAfee Corp., 7.375%, 2/15/30(2) | | 293 | 234,655 |
| NCR Voyix Corp.: | | | |
| 5.125%, 4/15/29(2) | | 116 | 99,875 |
| 5.25%, 10/1/30(2) | | 104 | 86,243 |
| Presidio Holdings, Inc., 8.25%, 2/1/28(2) | | 296 | 280,400 |
| Science Applications International Corp., 4.875%, 4/1/28(2) | | 260 | 232,281 |
| Seagate HDD Cayman: | | | |
| 4.091%, 6/1/29 | | 52 | 44,887 |
| 9.625%, 12/1/32(2) | | 248 | 265,091 |
| | | | $ 1,329,145 |
| Telecommunications — 0.9% |
| Ciena Corp., 4.00%, 1/31/30(2) | | 117 | $ 97,621 |
| Connect Finco S.a.r.l./Connect US Finco, LLC, 6.75%, 10/1/26(2) | | 421 | 392,914 |
| Rogers Communications, Inc., 5.25% to 3/15/27, 3/15/82(2)(7) | | 125 | 110,157 |
| Telecom Italia Finance S.A., 7.75%, 1/24/33 | EUR | 60 | 66,686 |
| Telecom Italia SpA: | | | |
| 2.75%, 4/15/25(4) | EUR | 140 | 141,354 |
| 6.875%, 2/15/28(4) | EUR | 100 | 105,413 |
| 7.875%, 7/31/28(4) | EUR | 200 | 216,920 |
| Telefonica Europe B.V., 7.125% to 8/23/28(4)(6)(7) | EUR | 200 | 216,767 |
| Vodafone Group PLC: | | | |
| 2.625% to 5/27/26, 8/27/80(4)(7) | EUR | 220 | 213,096 |
| 4.875% to 7/3/25, 10/3/78(4)(7) | GBP | 215 | 247,947 |
| Wp/ap Telecom Holdings III B.V., 5.50%, 1/15/30(4) | EUR | 259 | 230,154 |
| | | | $ 2,039,029 |
18
See Notes to Financial Statements.
Eaton Vance
Global Income Builder Fund
October 31, 2023
Portfolio of Investments — continued
| Security | Principal
Amount
(000's omitted)* | Value |
| Transportation — 0.3% |
| Cargo Aircraft Management, Inc., 4.75%, 2/1/28(2) | | 249 | $ 220,038 |
| Seaspan Corp., 5.50%, 8/1/29(2) | | 213 | 163,622 |
| Watco Cos., LLC/Watco Finance Corp., 6.50%, 6/15/27(2) | | 214 | 199,618 |
| | | | $ 583,278 |
| Wireless Telecommunication Services — 0.1% |
| Iliad Holding SASU, 6.50%, 10/15/26(2) | | 258 | $ 241,321 |
| | | | $ 241,321 |
Total Corporate Bonds
(identified cost $90,906,016) | | | $ 80,128,674 |
| Exchange-Traded Funds — 0.1% |
| Security | Shares | Value |
| Equity Funds — 0.1% |
| iShares Preferred & Income Securities ETF | | 5,587 | $ 159,676 |
Total Exchange-Traded Funds
(identified cost $170,739) | | | $ 159,676 |
| Security | Shares | Value |
| Banks — 0.0%(3) |
| Farm Credit Bank of Texas, 9.681% to 12/15/23(2)(7) | | 669 | $ 66,816 |
| | | | $ 66,816 |
| Capital Markets — 0.1% |
| Affiliated Managers Group, Inc., 4.75% | | 5,486 | $ 89,586 |
| Stifel Financial Corp., Series D, 4.50% | | 4,600 | 71,254 |
| | | | $ 160,840 |
| Electric Utilities — 0.1% |
| Brookfield BRP Holdings Canada, Inc., 4.625% | | 7,000 | $ 95,690 |
| SCE Trust III, Series H, 5.75% to 3/15/24(7) | | 4,892 | 118,093 |
| SCE Trust IV, Series J, 5.375% to 9/15/25(7) | | 651 | 12,792 |
| | | | $ 226,575 |
| Insurance — 0.1% |
| American Equity Investment Life Holding Co., Series B, 6.625% to 9/1/25(7) | | 3,418 | $ 78,341 |
| Security | Shares | Value |
| Insurance (continued) |
| Athene Holding, Ltd., Series C, 6.375% to 6/30/25(7) | | 3,208 | $ 77,858 |
| | | | $ 156,199 |
| Oil, Gas & Consumable Fuels — 0.1% |
| NuStar Energy, L.P., Series B, 11.315% (3 mo. SOFR + 5.905%)(8) | | 11,260 | $ 282,626 |
| | | | $ 282,626 |
| Pipelines — 0.1% |
| Energy Transfer, L.P.: | | | |
| Series C, 10.156%, (3 mo. SOFR + 4.53%)(8) | | 3,000 | $ 75,030 |
| Series E, 7.60% to 5/15/24(7) | | 4,970 | 122,858 |
| | | | $ 197,888 |
| Real Estate Management & Development — 0.1% |
| Brookfield Property Partners, L.P.: | | | |
| Series A, 5.75% | | 6,429 | $ 63,004 |
| Series A2, 6.375% | | 8,191 | 89,856 |
| | | | $ 152,860 |
| Retail REITs — 0.0%(3) |
| SITE Centers Corp., Series A, 6.375% | | 3,978 | $ 79,123 |
| | | | $ 79,123 |
| Trading Companies & Distributors — 0.1% |
| WESCO International, Inc., Series A, 10.625% to 6/22/25(7) | | 8,139 | $ 216,986 |
| | | | $ 216,986 |
| Wireless Telecommunication Services — 0.1% |
| United States Cellular Corp., 5.50% | | 6,991 | $ 103,886 |
| | | | $ 103,886 |
Total Preferred Stocks
(identified cost $2,128,416) | | | $ 1,643,799 |
| Senior Floating-Rate Loans — 1.4%(10) |
| Borrower/Description | Principal
Amount
(000's omitted) | Value |
| Airlines — 0.2% |
| Air Canada, Term Loan, 9.128%, (SOFR + 3.50%), 8/11/28 | $ | 201 | $ 201,396 |
19
See Notes to Financial Statements.
Eaton Vance
Global Income Builder Fund
October 31, 2023
Portfolio of Investments — continued
| Borrower/Description | Principal
Amount
(000's omitted) | Value |
| Airlines (continued) |
| Mileage Plus Holdings, LLC, Term Loan, 10.798%, (SOFR + 5.25%), 6/21/27 | $ | 320 | $ 329,772 |
| | | | $ 531,168 |
| Apparel & Luxury Goods — 0.0%(3) |
| ABG Intermediate Holdings 2, LLC, Term Loan, 8.924%, (SOFR + 3.50%), 12/21/28 | $ | 98 | $ 97,634 |
| | | | $ 97,634 |
| Auto Components — 0.1% |
| Clarios Global, L.P., Term Loan, 9.074%, (SOFR + 3.75%), 5/6/30 | $ | 131 | $ 130,959 |
| DexKo Global, Inc., Term Loan, 9.64%, (SOFR + 4.25%), 10/4/28 | | 93 | 90,065 |
| | | | $ 221,024 |
| Health Care Providers & Services — 0.2% |
| Pearl Intermediate Parent, LLC, Term Loan - Second Lien, 11.674%, (SOFR + 6.25%), 2/13/26 | $ | 51 | $ 50,957 |
| Pluto Acquisition I, Inc., Term Loan, 9.684%, (SOFR + 4.00%), 6/22/26 | | 327 | 277,810 |
| | | | $ 328,767 |
| Health Care Technology — 0.1% |
| Verscend Holding Corp., Term Loan, 9.439%, (SOFR + 4.00%), 8/27/25 | $ | 290 | $ 290,324 |
| | | | $ 290,324 |
| Hotels, Restaurants & Leisure — 0.1% |
| IRB Holding Corp., Term Loan, 12/15/27(11) | $ | 110 | $ 108,624 |
| Spectacle Gary Holdings, LLC, Term Loan, 9.674%, (SOFR + 4.25%), 12/10/28 | | 184 | 179,778 |
| | | | $ 288,402 |
| IT Services — 0.1% |
| Travelport Finance (Luxembourg) S.a.r.l., Term Loan, 12.652%, (SOFR + 7.00%), 2/28/25 | $ | 247 | $ 235,399 |
| | | | $ 235,399 |
| Leisure Products — 0.1% |
| Peloton Interactive, Inc., Term Loan, 12.263%, (SOFR + 6.50%), 5/25/27 | $ | 138 | $ 139,080 |
| | | | $ 139,080 |
| Borrower/Description | Principal
Amount
(000's omitted) | Value |
| Machinery — 0.0%(3) |
| EMRLD Borrower, L.P., Term Loan, 8.38%, (SOFR + 3.00%), 5/31/30 | $ | 55 | $ 55,067 |
| | | | $ 55,067 |
| Professional Services — 0.1% |
| AlixPartners, LLP, Term Loan, 8.189%, (SOFR + 2.75%), 2/4/28 | $ | 109 | $ 108,928 |
| | | | $ 108,928 |
| Software — 0.0%(3) |
| GoTo Group, Inc., Term Loan, 10.283%, (SOFR + 4.75%), 8/31/27 | $ | 0 (12) | $ 61 |
| Riverbed Technology, Inc., Term Loan, 9.89%, (SOFR + 4.50%), 7/1/28 | | 56 | 36,399 |
| | | | $ 36,460 |
| Specialty Retail — 0.3% |
| Mavis Tire Express Services Corp., Term Loan, 9.439%, (SOFR + 4.00%), 5/4/28 | $ | 141 | $ 138,794 |
| Michaels Companies, Inc., Term Loan, 9.902%, (SOFR + 4.25%), 4/15/28 | | 144 | 120,589 |
| PetSmart, Inc., Term Loan, 9.174%, (SOFR + 3.75%), 2/11/28 | | 378 | 374,543 |
| | | | $ 633,926 |
| Trading Companies & Distributors — 0.1% |
| Spin Holdco, Inc., Term Loan, 9.664%, (SOFR + 4.00%), 3/4/28 | $ | 131 | $ 113,007 |
| | | | $ 113,007 |
Total Senior Floating-Rate Loans
(identified cost $3,145,604) | | | $ 3,079,186 |
| Security | Principal
Amount/
Shares | Value |
| Diversified Financial Services — 0.0% |
| Alpha Holding S.A., Escrow Certificates(1)(13) | | 400,000 | $ 0 |
| | | | $ 0 |
| Entertainment — 0.0% |
| National CineMedia, Inc., Escrow Certificates(1)(13) | $ | 189,000 | $ 0 |
| | | | $ 0 |
20
See Notes to Financial Statements.
Eaton Vance
Global Income Builder Fund
October 31, 2023
Portfolio of Investments — continued
| Security | Principal
Amount/
Shares | Value |
| Transportation — 0.0%(3) |
| Hertz Corp., Escrow Certificates(1) | $ | 58,000 | $ 5,220 |
| Hertz Corp., Escrow Certificates(1) | $ | 167,000 | 6,680 |
| Hertz Corp., Escrow Certificates(1) | $ | 110,000 | 4,400 |
| | | | $ 16,300 |
Total Miscellaneous
(identified cost $171,962) | | | $ 16,300 |
| Short-Term Investments — 0.8% |
| Security | Shares | Value |
| Morgan Stanley Institutional Liquidity Funds - Government Portfolio, Institutional Class, 5.25%(14) | | 1,761,122 | $ 1,761,122 |
Total Short-Term Investments
(identified cost $1,761,122) | | | $ 1,761,122 |
Total Investments — 99.4%
(identified cost $188,955,658) | | | $216,038,455 |
| Other Assets, Less Liabilities — 0.6% | | | $ 1,301,277 |
| Net Assets — 100.0% | | | $217,339,732 |
| The percentage shown for each investment category in the Portfolio of Investments is based on net assets. |
| * | In U.S. dollars unless otherwise indicated. |
| (1) | Non-income producing security. |
| (2) | Security exempt from registration under Rule 144A of the Securities Act of 1933, as amended. These securities may be sold in certain transactions in reliance on an exemption from registration (normally to qualified institutional buyers). At October 31, 2023, the aggregate value of these securities is $50,551,688 or 23.3% of the Fund's net assets. |
| (3) | Amount is less than 0.05%. |
| (4) | Security exempt from registration under Regulation S of the Securities Act of 1933, as amended, which exempts from registration securities offered and sold outside the United States. Security may not be offered or sold in the United States except pursuant to an exemption from, or in a transaction not subject to, the registration requirements of the Securities Act of 1933, as amended. At October 31, 2023, the aggregate value of these securities is $19,907,309 or 9.2% of the Fund's net assets. |
| (5) | Represents a payment-in-kind security which may pay interest in additional principal at the issuer’s discretion. |
| (6) | Perpetual security with no stated maturity date but may be subject to calls by the issuer. |
| (7) | Security converts to variable rate after the indicated fixed-rate coupon period. |
| (8) | Variable rate security. The stated interest rate represents the rate in effect at October 31, 2023. |
| (9) | Issuer is in default with respect to interest and/or principal payments or has declared bankruptcy. |
| (10) | Senior floating-rate loans (Senior Loans) often require prepayments from excess cash flows or permit the borrowers to repay at their election. The degree to which borrowers repay, whether as a contractual requirement or at their election, cannot be predicted with accuracy. As a result, the actual remaining maturity may be substantially less than the stated maturities shown. However, Senior Loans will typically have an expected average life of approximately two to four years. Senior Loans typically have rates of interest which are redetermined periodically by reference to a base lending rate, plus a spread. These base lending rates are primarily the Secured Overnight Financing Rate (“SOFR”) (or the London Interbank Offered Rate (“LIBOR”) for those loans whose rates reset prior to the discontinuance of LIBOR on June 30, 2023) and secondarily, the prime rate offered by one or more major United States banks (the “Prime Rate”). Base lending rates may be subject to a floor, or minimum rate. Rates for SOFR are generally 1 or 3-month tenors and may also be subject to a credit spread adjustment. Senior Loans are generally subject to contractual restrictions that must be satisfied before they can be bought or sold. |
| (11) | This Senior Loan will settle after October 31, 2023, at which time the interest rate will be determined. |
| (12) | Principal amount is less than $500. |
| (13) | For fair value measurement disclosure purposes, security is categorized as Level 3 (see Note 11). |
| (14) | May be deemed to be an affiliated investment company. The rate shown is the annualized seven-day yield as of October 31, 2023. |
21
See Notes to Financial Statements.
Eaton Vance
Global Income Builder Fund
October 31, 2023
Portfolio of Investments — continued
| Country Concentration of Portfolio |
| Country | Percentage of
Total Investments | Value |
| United States | 63.7% | $137,657,510 |
| United Kingdom | 7.6 | 16,329,751 |
| France | 5.0 | 10,696,849 |
| Netherlands | 3.2 | 7,004,801 |
| Switzerland | 2.9 | 6,176,207 |
| Canada | 2.5 | 5,369,144 |
| Germany | 2.4 | 5,192,678 |
| Spain | 2.2 | 4,806,913 |
| Denmark | 2.2 | 4,656,713 |
| Japan | 1.6 | 3,543,630 |
| Australia | 1.1 | 2,413,051 |
| Ireland | 1.1 | 2,352,124 |
| Luxembourg | 1.1 | 2,334,527 |
| Taiwan | 0.6 | 1,340,308 |
| Italy | 0.6 | 1,301,876 |
| Hong Kong | 0.6 | 1,255,150 |
| India | 0.5 | 1,160,802 |
| United Arab Emirates | 0.3 | 722,715 |
| Sweden | 0.3 | 615,462 |
| Belgium | 0.2 | 500,542 |
| Poland | 0.1 | 245,332 |
| Mexico | 0.1 | 184,918 |
| Brazil | 0.0 (1) | 17,776 |
| Exchange-Traded Funds | 0.1 | 159,676 |
| Total Investments | 100.0% | $216,038,455 |
| (1) | Amount is less than 0.05%. |
| Abbreviations: |
| ADR | – American Depositary Receipt |
| EURIBOR | – Euro Interbank Offered Rate |
| PFC Shares | – Preference Shares |
| PIK | – Payment In Kind |
| REITs | – Real Estate Investment Trusts |
| SOFR | – Secured Overnight Financing Rate |
| Currency Abbreviations: |
| EUR | – Euro |
| GBP | – British Pound Sterling |
22
See Notes to Financial Statements.
Eaton Vance
Global Income Builder Fund
October 31, 2023
Statement of Assets and Liabilities
| | October 31, 2023 |
| Assets | |
| Unaffiliated investments, at value (identified cost $187,194,536) | $ 214,277,333 |
| Affiliated investments, at value (identified cost $1,761,122) | 1,761,122 |
| Cash | 12,389 |
| Interest and dividends receivable | 1,447,311 |
| Dividends receivable from affiliated investments | 13,230 |
| Receivable for investments sold | 330,307 |
| Receivable for Fund shares sold | 264,310 |
| Tax reclaims receivable | 1,145,509 |
| Receivable from affiliates | 2,683 |
| Trustees' deferred compensation plan | 55,675 |
| Total assets | $219,309,869 |
| Liabilities | |
| Payable for investments purchased | $ 611,212 |
| Payable for Fund shares redeemed | 883,541 |
| Due to custodian — foreign currency, at value (identified cost $6,485) | 6,548 |
| Payable to affiliates: | |
| Investment adviser fee | 103,151 |
| Administration fee | 28,230 |
| Distribution and service fees | 37,816 |
| Trustees' fees | 1,306 |
| Trustees' deferred compensation plan | 55,675 |
| Accrued expenses | 242,658 |
| Total liabilities | $ 1,970,137 |
| Net Assets | $217,339,732 |
| Sources of Net Assets | |
| Paid-in capital | $ 193,357,932 |
| Distributable earnings | 23,981,800 |
| Net Assets | $217,339,732 |
| Class A Shares | |
| Net Assets | $ 119,712,462 |
| Shares Outstanding | 12,735,590 |
Net Asset Value and Redemption Price Per Share
(net assets ÷ shares of beneficial interest outstanding) | $ 9.40 |
Maximum Offering Price Per Share
(100 ÷ 94.75 of net asset value per share) | $ 9.92 |
| Class C Shares | |
| Net Assets | $ 12,723,639 |
| Shares Outstanding | 1,371,043 |
Net Asset Value and Offering Price Per Share*
(net assets ÷ shares of beneficial interest outstanding) | $ 9.28 |
| Class I Shares | |
| Net Assets | $ 83,772,488 |
| Shares Outstanding | 8,923,583 |
Net Asset Value, Offering Price and Redemption Price Per Share
(net assets ÷ shares of beneficial interest outstanding) | $ 9.39 |
23
See Notes to Financial Statements.
Eaton Vance
Global Income Builder Fund
October 31, 2023
Statement of Assets and Liabilities — continued
| | October 31, 2023 |
| Class R Shares | |
| Net Assets | $1,131,143 |
| Shares Outstanding | 120,811 |
Net Asset Value, Offering Price and Redemption Price Per Share
(net assets ÷ shares of beneficial interest outstanding) | $ 9.36 |
| On sales of $50,000 or more, the offering price of Class A shares is reduced. |
| * | Redemption price per share is equal to the net asset value less any applicable contingent deferred sales charge. |
24
See Notes to Financial Statements.
Eaton Vance
Global Income Builder Fund
October 31, 2023
| | Year Ended |
| | October 31, 2023 |
| Investment Income | |
| Dividend income (net of foreign taxes withheld of $28,209) | $ 717,208 |
| Dividend income from affiliated investments | 50,829 |
| Dividend income allocated from Portfolio (net of foreign taxes withheld of $663,228) | 4,513,698 |
| Interest and other income allocated from Portfolio (net of foreign taxes withheld of $9,877) | 3,437,683 |
| Interest and other income (net of foreign taxes withheld of $5,921) | 2,278,644 |
| Expenses allocated from Portfolio | (947,025) |
| Total investment income | $ 10,051,037 |
| Expenses | |
| Investment adviser fee | $ 464,976 |
| Administration fee | 342,463 |
| Distribution and service fees: | |
| Class A | 317,174 |
| Class C | 145,240 |
| Class R | 5,318 |
| Trustees’ fees and expenses | 7,915 |
| Custodian fee | 68,443 |
| Transfer and dividend disbursing agent fees | 154,846 |
| Legal and accounting services | 43,302 |
| Printing and postage | 35,465 |
| Registration fees | 67,657 |
| Miscellaneous | 32,167 |
| Total expenses | $ 1,684,966 |
| Deduct: | |
| Waiver and/or reimbursement of expenses by affiliates | $ 63,377 |
| Total expense reductions | $ 63,377 |
| Net expenses | $ 1,621,589 |
| Net investment income | $ 8,429,448 |
| Realized and Unrealized Gain (Loss) | |
| Net realized gain (loss): | |
| Investment transactions | $ 930,423 |
| Investment transactions allocated from Portfolio (net of foreign capital gains taxes of $49,683) | (2,491,774) |
| Futures contracts | 126,991 |
| Futures contracts allocated from Portfolio | 842,273 |
| Foreign currency transactions | (67,295) |
| Foreign currency transactions allocated from Portfolio | 572 |
| Forward foreign currency exchange contracts | (2,770) |
| Forward foreign currency exchange contracts allocated from Portfolio | 12,776 |
| Net realized loss | $ (648,804) |
| Change in unrealized appreciation (depreciation): | |
| Investments | $(12,688,908) |
| Investments allocated from Portfolio (including net decrease in accrued foreign capital gains taxes of $31,888) | 24,542,823 |
| Futures contracts | (20,366) |
| Futures contracts allocated from Portfolio | 20,366 |
| Foreign currency | (20,112) |
| Foreign currency allocated from Portfolio | 98,986 |
| Net change in unrealized appreciation (depreciation) | $ 11,932,789 |
| Net realized and unrealized gain | $ 11,283,985 |
| Net increase in net assets from operations | $ 19,713,433 |
25
See Notes to Financial Statements.
Eaton Vance
Global Income Builder Fund
October 31, 2023
Statements of Changes in Net Assets
| | Year Ended October 31, |
| | 2023 | 2022 |
| Increase (Decrease) in Net Assets | | |
| From operations: | | |
| Net investment income | $ 8,429,448 | $ 9,031,419 |
| Net realized loss | (648,804) | (4,497,556) |
| Net change in unrealized appreciation (depreciation) | 11,932,789 | (56,389,110) |
| Net increase (decrease) in net assets from operations | $ 19,713,433 | $ (51,855,247) |
| Distributions to shareholders: | | |
| Class A | $ (4,271,637) | $ (6,678,673) |
| Class C | (386,469) | (805,593) |
| Class I | (3,109,444) | (4,716,320) |
| Class R | (33,320) | (36,989) |
| Total distributions to shareholders | $ (7,800,870) | $ (12,237,575) |
| Transactions in shares of beneficial interest: | | |
| Class A | $ (10,618,949) | $ (5,748,298) |
| Class C | (3,179,436) | (4,540,481) |
| Class I | (1,169,662) | (9,706,068) |
| Class R | 154,845 | 311,067 |
| Net decrease in net assets from Fund share transactions | $ (14,813,202) | $ (19,683,780) |
| Other capital: | | |
| Portfolio transaction fee contributed to Portfolio | $ (14,541) | $ (115,958) |
| Portfolio transaction fee allocated from Portfolio | 14,534 | 115,870 |
| Net decrease in net assets from other capital | $ (7) | $ (88) |
| Net decrease in net assets | $ (2,900,646) | $ (83,776,690) |
| Net Assets | | |
| At beginning of year | $ 220,240,378 | $ 304,017,068 |
| At end of year | $217,339,732 | $220,240,378 |
26
See Notes to Financial Statements.
Eaton Vance
Global Income Builder Fund
October 31, 2023
| | Class A |
| | Year Ended October 31, |
| | 2023 | 2022 | 2021 | 2020 | 2019 |
| Net asset value — Beginning of year | $ 8.920 | $ 11.360 | $ 9.070 | $ 9.210 | $ 8.620 |
| Income (Loss) From Operations | | | | | |
| Net investment income(1) | $ 0.351 | $ 0.343 | $ 0.272 | $ 0.330 | $ 0.372 |
| Net realized and unrealized gain (loss) | 0.453 | (2.321) | 2.342 | (0.146) | 0.542 |
| Total income (loss) from operations | $ 0.804 | $ (1.978) | $ 2.614 | $ 0.184 | $ 0.914 |
| Less Distributions | | | | | |
| From net investment income | $ (0.324) | $ (0.324) | $ (0.324) | $ (0.324) | $ (0.324) |
| From net realized gain | — | (0.138) | — | — | — |
| Total distributions | $ (0.324) | $ (0.462) | $ (0.324) | $ (0.324) | $ (0.324) |
| Portfolio transaction fee, net(1) | $ (0.000)(2) | $ (0.000)(2) | $ (0.000)(2) | $ (0.000)(2) | $ (0.000)(2) |
| Net asset value — End of year | $ 9.400 | $ 8.920 | $ 11.360 | $ 9.070 | $ 9.210 |
| Total Return(3)(4) | 9.00% | (17.86)% | 29.08% | 2.12% | 10.97% |
| Ratios/Supplemental Data | | | | | |
| Net assets, end of year (000’s omitted) | $119,712 | $123,589 | $164,778 | $123,152 | $131,104 |
| Ratios (as a percentage of average daily net assets):(5) | | | | | |
| Expenses (4) | 1.17% (6) | 1.17% (6) | 1.17% | 1.17% | 1.24% |
| Net investment income | 3.65% | 3.42% | 2.52% | 3.65% | 4.22% |
| Portfolio Turnover of the Portfolio(7) | 46% | 59% | 60% | 118% | 86% |
| Portfolio Turnover of the Fund | 14% (8) | — | — | — | — |
| (1) | Computed using average shares outstanding. |
| (2) | Amount is less than $(0.0005). |
| (3) | Returns are historical and are calculated by determining the percentage change in net asset value with all distributions reinvested and do not reflect the effect of sales charges. |
| (4) | The investment adviser, sub-adviser and administrator reimbursed certain operating expenses (equal to 0.03%, 0.02%, 0.03% and 0.02% of average daily net assets for the years ended October 31, 2023, 2022, 2020 and 2019, respectively). Absent this reimbursement, total return would be lower. |
| (5) | Includes the Fund’s share of the Portfolio's allocated expenses for the period while the Fund was investing in the Portfolio. |
| (6) | Includes a reduction by the investment adviser of a portion of its adviser fee due to the Fund's and Portfolio’s investment in the Liquidity Fund (equal to less than 0.005% of average daily net assets for the years ended October 31, 2023 and 2022). |
| (7) | Portfolio turnover represents the rate of portfolio activity for the period while the Fund was investing in the Portfolio. |
| (8) | For the period from June 17, 2023 through October 31, 2023 when the Fund was making investments directly in securities. |
| References to Portfolio herein are to Global Income Builder Portfolio, a Massachusetts business trust in which the Fund invested all of its investable assets prior to the close of business on June 16, 2023 and which had the same investment objectives and policies as the Fund during such period. |
27
See Notes to Financial Statements.
Eaton Vance
Global Income Builder Fund
October 31, 2023
Financial Highlights — continued
| | Class C |
| | Year Ended October 31, |
| | 2023 | 2022 | 2021 | 2020 | 2019 |
| Net asset value — Beginning of year | $ 8.810 | $11.230 | $ 8.960 | $ 9.110 | $ 8.530 |
| Income (Loss) From Operations | | | | | |
| Net investment income(1) | $ 0.272 | $ 0.263 | $ 0.187 | $ 0.262 | $ 0.292 |
| Net realized and unrealized gain (loss) | 0.450 | (2.290) | 2.328 | (0.153) | 0.546 |
| Total income (loss) from operations | $ 0.722 | $ (2.027) | $ 2.515 | $ 0.109 | $ 0.838 |
| Less Distributions | | | | | |
| From net investment income | $ (0.252) | $ (0.255) | $ (0.245) | $ (0.259) | $ (0.258) |
| From net realized gain | — | (0.138) | — | — | — |
| Total distributions | $ (0.252) | $ (0.393) | $ (0.245) | $ (0.259) | $ (0.258) |
| Portfolio transaction fee, net(1) | $ (0.000)(2) | $ (0.000)(2) | $ (0.000)(2) | $ (0.000)(2) | $ (0.000)(2) |
| Net asset value — End of year | $ 9.280 | $ 8.810 | $11.230 | $ 8.960 | $ 9.110 |
| Total Return(3)(4) | 8.17% | (18.46)% | 28.26% | 1.29% | 10.13% |
| Ratios/Supplemental Data | | | | | |
| Net assets, end of year (000’s omitted) | $12,724 | $15,093 | $ 24,505 | $37,875 | $56,314 |
| Ratios (as a percentage of average daily net assets):(5) | | | | | |
| Expenses (4) | 1.92% (6) | 1.92% (6) | 1.92% | 1.92% | 2.00% |
| Net investment income | 2.87% | 2.64% | 1.76% | 2.93% | 3.36% |
| Portfolio Turnover of the Portfolio(7) | 46% | 59% | 60% | 118% | 86% |
| Portfolio Turnover of the Fund | 14% (8) | — | — | — | — |
| (1) | Computed using average shares outstanding. |
| (2) | Amount is less than $(0.0005). |
| (3) | Returns are historical and are calculated by determining the percentage change in net asset value with all distributions reinvested and do not reflect the effect of sales charges. |
| (4) | The investment adviser, sub-adviser and administrator reimbursed certain operating expenses (equal to 0.03%, 0.02%, 0.03% and 0.02% of average daily net assets for the years ended October 31, 2023, 2022, 2020 and 2019, respectively). Absent this reimbursement, total return would be lower. |
| (5) | Includes the Fund’s share of the Portfolio's allocated expenses for the period while the Fund was investing in the Portfolio. |
| (6) | Includes a reduction by the investment adviser of a portion of its adviser fee due to the Fund's and Portfolio’s investment in the Liquidity Fund (equal to less than 0.005% of average daily net assets for the years ended October 31, 2023 and 2022). |
| (7) | Portfolio turnover represents the rate of portfolio activity for the period while the Fund was investing in the Portfolio. |
| (8) | For the period from June 17, 2023 through October 31, 2023 when the Fund was making investments directly in securities. |
| References to Portfolio herein are to Global Income Builder Portfolio, a Massachusetts business trust in which the Fund invested all of its investable assets prior to the close of business on June 16, 2023 and which had the same investment objectives and policies as the Fund during such period. |
28
See Notes to Financial Statements.
Eaton Vance
Global Income Builder Fund
October 31, 2023
Financial Highlights — continued
| | Class I |
| | Year Ended October 31, |
| | 2023 | 2022 | 2021 | 2020 | 2019 |
| Net asset value — Beginning of year | $ 8.910 | $11.340 | $ 9.060 | $ 9.190 | $ 8.610 |
| Income (Loss) From Operations | | | | | |
| Net investment income(1) | $ 0.374 | $ 0.368 | $ 0.297 | $ 0.354 | $ 0.386 |
| Net realized and unrealized gain (loss) | 0.454 | (2.311) | 2.333 | (0.136) | 0.542 |
| Total income (loss) from operations | $ 0.828 | $ (1.943) | $ 2.630 | $ 0.218 | $ 0.928 |
| Less Distributions | | | | | |
| From net investment income | $ (0.348) | $ (0.349) | $ (0.350) | $ (0.348) | $ (0.348) |
| From net realized gain | — | (0.138) | — | — | — |
| Total distributions | $ (0.348) | $ (0.487) | $ (0.350) | $ (0.348) | $ (0.348) |
| Portfolio transaction fee, net(1) | $ (0.000)(2) | $ (0.000)(2) | $ (0.000)(2) | $ (0.000)(2) | $ (0.000)(2) |
| Net asset value — End of year | $ 9.390 | $ 8.910 | $ 11.340 | $ 9.060 | $ 9.190 |
| Total Return(3)(4) | 9.28% | (17.60)% | 29.31% | 2.51% | 11.17% |
| Ratios/Supplemental Data | | | | | |
| Net assets, end of year (000’s omitted) | $83,772 | $80,627 | $113,907 | $94,518 | $107,290 |
| Ratios (as a percentage of average daily net assets):(5) | | | | | |
| Expenses (4) | 0.92% (6) | 0.92% (6) | 0.92% | 0.92% | 0.99% |
| Net investment income | 3.90% | 3.66% | 2.76% | 3.92% | 4.39% |
| Portfolio Turnover of the Portfolio(7) | 46% | 59% | 60% | 118% | 86% |
| Portfolio Turnover of the Fund | 14% (8) | — | — | — | — |
| (1) | Computed using average shares outstanding. |
| (2) | Amount is less than $(0.0005). |
| (3) | Returns are historical and are calculated by determining the percentage change in net asset value with all distributions reinvested. |
| (4) | The investment adviser, sub-adviser and administrator reimbursed certain operating expenses (equal to 0.03%, 0.02%, 0.03% and 0.02% of average daily net assets for the years ended October 31, 2023, 2022, 2020 and 2019, respectively). Absent this reimbursement, total return would be lower. |
| (5) | Includes the Fund’s share of the Portfolio's allocated expenses for the period while the Fund was investing in the Portfolio. |
| (6) | Includes a reduction by the investment adviser of a portion of its adviser fee due to the Fund's and Portfolio’s investment in the Liquidity Fund (equal to less than 0.005% of average daily net assets for the years ended October 31, 2023 and 2022). |
| (7) | Portfolio turnover represents the rate of portfolio activity for the period while the Fund was investing in the Portfolio. |
| (8) | For the period from June 17, 2023 through October 31, 2023 when the Fund was making investments directly in securities. |
| References to Portfolio herein are to Global Income Builder Portfolio, a Massachusetts business trust in which the Fund invested all of its investable assets prior to the close of business on June 16, 2023 and which had the same investment objectives and policies as the Fund during such period. |
29
See Notes to Financial Statements.
Eaton Vance
Global Income Builder Fund
October 31, 2023
Financial Highlights — continued
| | Class R |
| | Year Ended October 31, |
| | 2023 | 2022 | 2021 | 2020 | 2019 |
| Net asset value — Beginning of year | $ 8.890 | $11.320 | $ 9.040 | $ 9.180 | $ 8.600 |
| Income (Loss) From Operations | | | | | |
| Net investment income(1) | $ 0.325 | $ 0.309 | $ 0.247 | $ 0.310 | $ 0.345 |
| Net realized and unrealized gain (loss) | 0.445 | (2.300) | 2.332 | (0.149) | 0.536 |
| Total income (loss) from operations | $ 0.770 | $ (1.991) | $ 2.579 | $ 0.161 | $ 0.881 |
| Less Distributions | | | | | |
| From net investment income | $ (0.300) | $ (0.301) | $ (0.299) | $ (0.301) | $ (0.301) |
| From net realized gain | — | (0.138) | — | — | — |
| Total distributions | $(0.300) | $ (0.439) | $ (0.299) | $(0.301) | $(0.301) |
| Portfolio transaction fee, net(1) | $(0.000) (2) | $ (0.000)(2) | $ (0.000)(2) | $(0.000) (2) | $(0.000) (2) |
| Net asset value — End of year | $ 9.360 | $ 8.890 | $11.320 | $ 9.040 | $ 9.180 |
| Total Return(3)(4) | 8.64% | (18.02)% | 28.76% | 1.87% | 10.59% |
| Ratios/Supplemental Data | | | | | |
| Net assets, end of year (000’s omitted) | $ 1,131 | $ 932 | $ 827 | $ 610 | $ 629 |
| Ratios (as a percentage of average daily net assets):(5) | | | | | |
| Expenses (4) | 1.42% (6) | 1.42% (6) | 1.42% | 1.42% | 1.49% |
| Net investment income | 3.39% | 3.13% | 2.29% | 3.44% | 3.92% |
| Portfolio Turnover of the Portfolio(7) | 46% | 59% | 60% | 118% | 86% |
| Portfolio Turnover of the Fund | 14% (8) | — | — | — | — |
| (1) | Computed using average shares outstanding. |
| (2) | Amount is less than $(0.0005). |
| (3) | Returns are historical and are calculated by determining the percentage change in net asset value with all distributions reinvested. |
| (4) | The investment adviser, sub-adviser and administrator reimbursed certain operating expenses (equal to 0.03%, 0.02%, 0.03% and 0.02% of average daily net assets for the years ended October 31, 2023, 2022, 2020 and 2019, respectively). Absent this reimbursement, total return would be lower. |
| (5) | Includes the Fund’s share of the Portfolio's allocated expenses for the period while the Fund was investing in the Portfolio. |
| (6) | Includes a reduction by the investment adviser of a portion of its adviser fee due to the Fund's and Portfolio’s investment in the Liquidity Fund (equal to less than 0.005% of average daily net assets for the years ended October 31, 2023 and 2022). |
| (7) | Portfolio turnover represents the rate of portfolio activity for the period while the Fund was investing in the Portfolio. |
| (8) | For the period from June 17, 2023 through October 31, 2023 when the Fund was making investments directly in securities. |
| References to Portfolio herein are to Global Income Builder Portfolio, a Massachusetts business trust in which the Fund invested all of its investable assets prior to the close of business on June 16, 2023 and which had the same investment objectives and policies as the Fund during such period. |
30
See Notes to Financial Statements.
Eaton Vance
Global Income Builder Fund
October 31, 2023
Notes to Financial Statements
1 Significant Accounting Policies
Eaton Vance Global Income Builder Fund (the Fund) is a diversified series of Eaton Vance Mutual Funds Trust (the Trust). The Trust is a Massachusetts business trust registered under the Investment Company Act of 1940, as amended (the 1940 Act), as an open-end management investment company. The Fund's investment objective is to achieve total return. Prior to the close of business on June 16, 2023, the Fund invested all of its investable assets in interests in Global Income Builder Portfolio (the Portfolio), a Massachusetts business trust, having the same investment objective and policies as the Fund. As of the close of business on June 16, 2023, the Fund received its pro rata share of net assets from the Portfolio as part of the termination of the Portfolio. As of June 17, 2023, the Fund invests its assets directly. The Fund offers four classes of shares. Class A shares are generally sold subject to a sales charge imposed at time of purchase. Class C shares are sold at net asset value and are generally subject to a contingent deferred sales charge (see Note 5). Effective November 5, 2020, Class C shares automatically convert to Class A shares eight years after their purchase as described in the Fund’s prospectus. Class I and Class R shares are sold at net asset value and are not subject to a sales charge. Each class represents a pro rata interest in the Fund, but votes separately on class-specific matters and (as noted below) is subject to different expenses. Realized and unrealized gains and losses and net investment income and losses, other than class-specific expenses, are allocated daily to each class of shares based on the relative net assets of each class to the total net assets of the Fund. Each class of shares differs in its distribution plan and certain other class-specific expenses.
The following is a summary of significant accounting policies of the Fund. The policies are in conformity with accounting principles generally accepted in the United States of America (U.S. GAAP). The Fund is an investment company and follows accounting and reporting guidance in the Financial Accounting Standards Board (FASB) Accounting Standards Codification Topic 946.
A Investment Valuation—The following methodologies are used to determine the market value or fair value of investments.
Equity Securities. Equity securities listed on a U.S. securities exchange generally are valued at the last sale or closing price on the day of valuation or, if no sales took place on such date, at the mean between the closing bid and ask prices on the exchange where such securities are principally traded. Equity securities listed on the NASDAQ National Market System are valued at the NASDAQ official closing price. Unlisted or listed securities for which closing sales prices or closing quotations are not available are valued at the mean between the latest available bid and ask prices or, in the case of preferred equity securities that are not listed or traded in the over-the-counter market, by a third party pricing service that uses various techniques that consider factors including, but not limited to, prices or yields of securities with similar characteristics, benchmark yields, broker/dealer quotes, quotes of underlying common stock, issuer spreads, as well as industry and economic events.
Debt Obligations. Debt obligations are generally valued on the basis of valuations provided by third party pricing services, as derived from such services’ pricing models. Inputs to the models may include, but are not limited to, reported trades, executable bid and ask prices, broker/dealer quotations, prices or yields of securities with similar characteristics, interest rates, anticipated prepayments, benchmark curves or information pertaining to the issuer, as well as industry and economic events. The pricing services may use a matrix approach, which considers information regarding securities with similar characteristics to determine the valuation for a security. Short-term debt obligations purchased with a remaining maturity of sixty days or less for which a valuation from a third party pricing service is not readily available may be valued at amortized cost, which approximates fair value.
Senior Floating-Rate Loans. Interests in senior floating-rate loans (Senior Loans) are valued generally at the average mean of bid and ask quotations obtained from a third party pricing service.
Derivatives. Futures contracts are valued at the closing settlement price established by the board of trade or exchange on which they are traded, with adjustments for fair valuation for certain foreign futures contracts as described below. Forward foreign currency exchange contracts are generally valued at the mean of the average bid and average ask prices that are reported by currency dealers to a third party pricing service at the valuation time. Such third party pricing service valuations are supplied for specific settlement periods and the Fund’s forward foreign currency exchange contracts are valued at an interpolated rate between the closest preceding and subsequent settlement period reported by the third party pricing service.
Foreign Securities, Futures Contracts and Currencies. Foreign securities, futures contracts and currencies are valued in U.S. dollars, based on foreign currency exchange rate quotations supplied by a third party pricing service. The pricing service uses a proprietary model to determine the exchange rate. Inputs to the model include reported trades and implied bid/ask spreads. The daily valuation of exchange-traded foreign securities and certain exchange-traded foreign futures contracts generally is determined as of the close of trading on the principal exchange on which such securities and contracts trade. Events occurring after the close of trading on foreign exchanges may result in adjustments to the valuation of foreign securities and certain foreign futures contracts to more accurately reflect their fair value as of the close of regular trading on the New York Stock Exchange. When valuing foreign equity securities and foreign futures contracts that meet certain criteria, the Fund’s Trustees have approved the use of a fair value service that values such securities and foreign futures contracts to reflect market trading that occurs after the close of the applicable foreign markets of comparable securities or other instruments that have a strong correlation to the fair-valued securities and foreign futures contracts.
Other. Investments in management investment companies (including money market funds) that do not trade on an exchange are valued at the net asset value as of the close of each business day.
Fair Valuation. In connection with Rule 2a-5 of the 1940 Act, the Trustees have designated the Fund’s investment adviser as its valuation designee. Investments for which valuations or market quotations are not readily available or are deemed unreliable are valued by the investment adviser, as valuation designee, at fair value using methods that most fairly reflect the security’s “fair value”, which is the amount that the Fund might reasonably expect to receive for the security upon its current sale in the ordinary course. Each such determination is based on a consideration of relevant factors, which are
Eaton Vance
Global Income Builder Fund
October 31, 2023
Notes to Financial Statements — continued
likely to vary from one pricing context to another. These factors may include, but are not limited to, the type of security, the existence of any contractual restrictions on the security’s disposition, the price and extent of public trading in similar securities of the issuer or of comparable companies or entities, quotations or relevant information obtained from broker/dealers or other market participants, information obtained from the issuer, analysts, and/or the appropriate stock exchange (for exchange-traded securities), an analysis of the company’s or entity’s financial statements, and an evaluation of the forces that influence the issuer and the market(s) in which the security is purchased and sold.
B Investment Transactions—Investment transactions for financial statement purposes are accounted for on a trade date basis. Realized gains and losses on investments sold are determined on the basis of identified cost.
C Income—Dividend income is recorded on the ex-dividend date for dividends received in cash and/or securities. However, if the ex-dividend date has passed, certain dividends from foreign securities are recorded as the Fund is informed of the ex-dividend date. Withholding taxes on foreign dividends, interest and capital gains have been provided for in accordance with the Fund’s understanding of the applicable countries’ tax rules and rates. In consideration of recent decisions rendered by European courts, the Fund and Portfolio have filed additional tax reclaims for previously withheld taxes on dividends earned in certain European Union countries. These filings are subject to various administrative and judicial proceedings within these countries. Due to the uncertainty as to the ultimate resolution of these proceedings, the likelihood of receipt of these reclaims, and the potential timing of payment, no amounts are reflected in the financial statements for such outstanding reclaims. Interest income is recorded on the basis of interest accrued, adjusted for amortization of premium or accretion of discount. Distributions from investment companies are recorded as dividend income, capital gains or return of capital based on the nature of the distribution. Prior to the close of business on June 16, 2023, the net investment income or loss consisted of the Fund’s pro rata share of the net investment income or loss of the Portfolio, less all actual and accrued expenses of the Fund.
D Federal and Other Taxes—The Fund’s policy is to comply with the provisions of the Internal Revenue Code applicable to regulated investment companies and to distribute to shareholders each year substantially all of its net investment income, and all or substantially all of its net realized capital gains. Accordingly, no provision for federal income or excise tax is necessary.
In addition to the requirements of the Internal Revenue Code, the Fund may also be subject to local taxes on the recognition of capital gains in certain countries. In determining the daily net asset value, the Fund estimates the accrual for such taxes, if any, based on the unrealized appreciation on certain portfolio securities and the related tax rates. Taxes attributable to unrealized appreciation are included in the change in unrealized appreciation (depreciation) on investments. Capital gains taxes on securities sold are included in net realized gain (loss) on investments.
As of October 31, 2023, the Fund had no uncertain tax positions that would require financial statement recognition, de-recognition, or disclosure. The Fund files a U.S. federal income tax return annually after its fiscal year-end, which is subject to examination by the Internal Revenue Service for a period of three years from the date of filing.
E Expenses—The majority of expenses of the Trust are directly identifiable to an individual fund. Expenses which are not readily identifiable to a specific fund are allocated taking into consideration, among other things, the nature and type of expense and the relative size of the funds.
F Foreign Currency Translation—Investment valuations, other assets, and liabilities initially expressed in foreign currencies are translated each business day into U.S. dollars based upon current exchange rates. Purchases and sales of foreign investment securities and income and expenses denominated in foreign currencies are translated into U.S. dollars based upon currency exchange rates in effect on the respective dates of such transactions. Recognized gains or losses on investment transactions attributable to changes in foreign currency exchange rates are recorded for financial statement purposes as net realized gains and losses on investments. That portion of unrealized gains and losses on investments that results from fluctuations in foreign currency exchange rates is not separately disclosed.
G Unfunded Loan Commitments—The Fund may enter into certain loan agreements all or a portion of which may be unfunded. The Fund is obligated to fund these commitments at the borrower's discretion. These commitments, if any, are disclosed in the accompanying Portfolio of Investments.
H Use of Estimates—The preparation of the financial statements in conformity with U.S. GAAP requires management to make estimates and assumptions that affect the reported amounts of assets and liabilities at the date of the financial statements and the reported amounts of income and expense during the reporting period. Actual results could differ from those estimates.
I Indemnifications—Under the Trust’s organizational documents, its officers and Trustees may be indemnified against certain liabilities and expenses arising out of the performance of their duties to the Fund. Under Massachusetts law, if certain conditions prevail, shareholders of a Massachusetts business trust (such as the Trust) could be deemed to have personal liability for the obligations of the Trust. However, the Trust’s Declaration of Trust contains an express disclaimer of liability on the part of Fund shareholders and the By-laws provide that the Trust shall assume, upon request by the shareholder, the defense on behalf of any Fund shareholders. Moreover, the By-laws also provide for indemnification out of Fund property of any shareholder held personally liable solely by reason of being or having been a shareholder for all loss or expense arising from such liability. Additionally, in the normal course of business, the Fund enters into agreements with service providers that may contain indemnification clauses. The Fund’s maximum exposure under these arrangements is unknown as this would involve future claims that may be made against the Fund that have not yet occurred.
Eaton Vance
Global Income Builder Fund
October 31, 2023
Notes to Financial Statements — continued
J Futures Contracts—Upon entering into a futures contract, the Fund is required to deposit with the broker, either in cash or securities, an amount equal to a certain percentage of the contract amount (initial margin). Subsequent payments, known as variation margin, are made or received by the Fund each business day, depending on the daily fluctuations in the value of the underlying security, index or currency, and are recorded as unrealized gains or losses by the Fund. Gains (losses) are realized upon the expiration or closing of the futures contracts. Should market conditions change unexpectedly, the Fund may not achieve the anticipated benefits of the futures contracts and may realize a loss. Futures contracts have minimal counterparty risk as they are exchange traded and the clearinghouse for the exchange is substituted as the counterparty, guaranteeing counterparty performance.
K Forward Foreign Currency Exchange Contracts—The Fund may enter into forward foreign currency exchange contracts for the purchase or sale of a specific foreign currency at a fixed price on a future date. The forward foreign currency exchange contracts are adjusted by the daily exchange rate of the underlying currency and any gains or losses are recorded as unrealized until such time as the contracts have been closed. Risks may arise upon entering these contracts from the potential inability of counterparties to meet the terms of their contracts and from movements in the value of a foreign currency relative to the U.S. dollar.
L Capital Transactions—To seek to protect the Portfolio (and, indirectly, other investors in the Portfolio) against the costs of accommodating investor inflows and outflows, prior to December 24, 2022, the Portfolio imposed a fee (“Portfolio transaction fee”) on inflows and outflows by Portfolio investors. The Portfolio transaction fee was sized to cover the estimated cost to the Portfolio of, in connection with issuing interests, converting the cash and/or other instruments it received to the desired composition and, in connection with redeeming its interests, converting Portfolio holdings to cash and/or other instruments to be distributed. Such fee, which may have varied over time, was limited to amounts that had been authorized by the Board of Trustees and determined by Eaton Vance Management (EVM) to be appropriate. The maximum Portfolio transaction fee was 2% of the amount of net contributions or withdrawals. The Portfolio transaction fee was recorded as a component of capital transactions on the Statements of Changes in Net Assets. Effective after the close of business on December 23, 2022, the Portfolio transaction fee was discontinued.
2 Distributions to Shareholders and Income Tax Information
It is the present policy of the Fund to make monthly distributions of all or substantially all of its net investment income and to distribute annually all or substantially all of its net realized capital gains. Distributions to shareholders are recorded on the ex-dividend date. Distributions are declared separately for each class of shares. Shareholders may reinvest income and capital gain distributions in additional shares of the same class of the Fund at the net asset value as of the ex-dividend date or, at the election of the shareholder, receive distributions in cash. Distributions to shareholders are determined in accordance with income tax regulations, which may differ from U.S. GAAP. As required by U.S. GAAP, only distributions in excess of tax basis earnings and profits are reported in the financial statements as a return of capital. Permanent differences between book and tax accounting relating to distributions are reclassified to paid-in capital. For tax purposes, distributions from short-term capital gains are considered to be from ordinary income.
The tax character of distributions declared for the years ended October 31, 2023 and October 31, 2022 was as follows:
| | Year Ended October 31, |
| | 2023 | 2022 |
| Ordinary income | $7,800,870 | $8,539,399 |
| Long-term capital gains | $ — | $3,698,176 |
During the year ended October 31, 2023, distributable earnings was decreased by $2,657,988 and paid-in capital was increased by $2,657,988 due to the Fund’s use of equalization accounting. Tax equalization accounting allows the Fund to treat as a distribution that portion of redemption proceeds representing a redeeming shareholder’s portion of undistributed taxable income and net capital gains. These reclassifications had no effect on the net assets or net asset value per share of the Fund.
As of October 31, 2023, the components of distributable earnings (accumulated loss) on a tax basis were as follows:
| Undistributed ordinary income | $ 777,102 |
| Deferred capital losses | (5,994,945) |
| Net unrealized appreciation | 29,199,643 |
| Distributable earnings | $23,981,800 |
Eaton Vance
Global Income Builder Fund
October 31, 2023
Notes to Financial Statements — continued
At October 31, 2023, the Fund, for federal income tax purposes, had deferred capital losses of $5,994,945 which would reduce its taxable income arising from future net realized gains on investment transactions, if any, to the extent permitted by the Internal Revenue Code, and thus would reduce the amount of distributions to shareholders, which would otherwise be necessary to relieve the Fund of any liability for federal income or excise tax. The deferred
capital losses are treated as arising on the first day of the Fund’s next taxable year and retain the same short-term or long-term character as when originally deferred. Of the deferred capital losses at October 31, 2023, $5,994,945 are short-term.
The cost and unrealized appreciation (depreciation) of investments of the Fund at October 31, 2023, as determined on a federal income tax basis, were as follows:
| Aggregate cost | $ 186,776,119 |
| Gross unrealized appreciation | $ 45,536,237 |
| Gross unrealized depreciation | (16,273,901) |
| Net unrealized appreciation | $ 29,262,336 |
3 Investment Adviser Fee and Other Transactions with Affiliates
The investment adviser fee is earned by Boston Management and Research (BMR), an indirect, wholly-owned subsidiary of Morgan Stanley, as compensation for investment advisory services rendered to the Fund. The investment adviser fee is computed at an annual rate as a percentage of the Fund’s average daily net assets that are not invested in other investment companies for which BMR or its affiliates serve as investment adviser and receive an advisory fee as follows and is payable monthly:
| Average Daily Net Assets | Annual Fee Rate |
| Up to $500 million | 0.550% |
| $500 million but less than $1 billion | 0.525% |
| $1 billion but less than $2.5 billion | 0.500% |
| $2.5 billion and over | 0.475% |
Prior to the close of business on June 16, 2023, when the Fund’s assets were invested in the Portfolio, the Fund was allocated its share of the Portfolio’s investment adviser fee. The Portfolio paid advisory fees to BMR on the same fee schedule as that of the Fund as described above. For the year ended October 31, 2023, the Fund’s allocated portion of the investment adviser fee paid by the Portfolio amounted to $791,475 and the investment adviser fee paid by the Fund amounted to $464,976. For the year ended October 31, 2023, the Fund’s investment adviser fee, including the investment adviser fee allocated from the Portfolio, was 0.55% of the Fund’s average daily net assets. Pursuant to an investment sub-advisory agreement, BMR has delegated a portion of the investment management of the Fund to Eaton Vance Advisers International Ltd. (EVAIL), an affiliate of BMR and an indirect, wholly-owned subsidiary of Morgan Stanley. BMR pays EVAIL a portion of its investment adviser fee for sub-advisory services provided to the Fund. Prior to the close of business on June 16, 2023, the Portfolio had delegated the investment management of the Portfolio to EVAIL and BMR paid EVAIL a portion of its investment adviser fee for sub-advisory services provided to the Portfolio. The administration fee is earned by EVM, an affiliate of BMR and an indirect, wholly-owned subsidiary of Morgan Stanley, for administering the business affairs of the Fund and is computed at an annual rate of 0.15% of the Fund’s average daily net assets. For the year ended October 31, 2023, the administration fee amounted to $342,463.
The Fund (and Portfolio prior to the close of business on June 16, 2023) may invest in a money market fund, the Institutional Class of the Morgan Stanley Institutional Liquidity Funds - Government Portfolio (the “Liquidity Fund”), an open-end management investment company managed by Morgan Stanley Investment Management Inc., a wholly-owned subsidiary of Morgan Stanley. The investment adviser fee paid by the Fund and investment adviser fee paid by the Portfolio prior to the close of business on June 16, 2023, is/was reduced by an amount equal to its pro rata share of the advisory and administration fees paid by the Fund/Portfolio due to its investment in the Liquidity Fund. For the year ended October 31, 2023, the investment adviser fee paid was reduced by $884 relating to the Fund’s investment in the Liquidity Fund, and the investment adviser fee allocated from the Portfolio was reduced by $2,826 relating to the Portfolio’s investment in the Liquidity Fund.
EVM and EVAIL have agreed to reimburse the Fund’s expenses to the extent that total annual operating expenses (relating to ordinary operating expenses only and excluding such expenses as brokerage commissions, acquired fund fees and expenses of unaffiliated funds, borrowing costs, taxes or litigation expenses) exceed 1.17%, 1.92%, 0.92% and 1.42% of the Fund’s average daily net assets for Class A, Class C, Class I and Class R, respectively. This agreement may be changed or terminated after February 29, 2024. Pursuant to this agreement, EVM and EVAIL were allocated $62,493 in total of the Fund's operating expenses for the year ended October 31, 2023.
Eaton Vance
Global Income Builder Fund
October 31, 2023
Notes to Financial Statements — continued
EVM provides sub-transfer agency and related services to the Fund pursuant to a Sub-Transfer Agency Support Services Agreement. For the year ended October 31, 2023, EVM earned $15,935 from the Fund pursuant to such agreement, which is included in transfer and dividend disbursing agent fees on the Statement of Operations. The Fund was informed that Eaton Vance Distributors, Inc. (EVD), an affiliate of EVM and the Fund’s principal underwriter, received $6,167 as its portion of the sales charge on sales of Class A shares for the year ended October 31, 2023. EVD also received distribution and service fees from Class A, Class C and Class R shares (see Note 4) and contingent deferred sales charges (see Note 5).
Trustees and officers of the Fund who are members of EVM’s or BMR’s organizations receive remuneration for their services to the Fund out of the investment adviser fee. Trustees of the Fund who are not affiliated with the investment adviser may elect to defer receipt of all or a percentage of their annual fees in accordance with the terms of the Trustees Deferred Compensation Plan. Certain officers and Trustees of the Fund are officers of the above organizations.
4 Distribution Plans
The Fund has in effect a distribution plan for Class A shares (Class A Plan) pursuant to Rule 12b-1 under the 1940 Act. Pursuant to the Class A Plan, the Fund pays EVD a distribution and service fee of 0.25% per annum of its average daily net assets attributable to Class A shares for distribution services and facilities provided to the Fund by EVD, as well as for personal services and/or the maintenance of shareholder accounts. Distribution and service fees paid or accrued to EVD for the year ended October 31, 2023 amounted to $317,174 for Class A shares.
The Fund also has in effect distribution plans for Class C shares (Class C Plan) and Class R shares (Class R Plan) pursuant to Rule 12b-1 under the 1940 Act. Pursuant to the Class C Plan, the Fund pays EVD amounts equal to 0.75% per annum of its average daily net assets attributable to Class C shares for providing ongoing distribution services and facilities to the Fund. For the year ended October 31, 2023, the Fund paid or accrued to EVD $108,930 for Class C shares.
The Class R Plan requires the Fund to pay EVD an amount up to 0.50% per annum of its average daily net assets attributable to Class R shares for providing ongoing distribution services and facilities to the Fund. The Trustees of the Trust have currently limited Class R distribution payments to 0.25% per annum of the average daily net assets attributable to Class R shares. For the year ended October 31, 2023, the Fund paid or accrued to EVD $2,659 for Class R shares.
Pursuant to the Class C and Class R Plans, the Fund also makes payments of service fees to EVD, financial intermediaries and other persons in amounts equal to 0.25% per annum of its average daily net assets attributable to that class. Service fees paid or accrued are for personal services and/or the maintenance of shareholder accounts. They are separate and distinct from the sales commissions and distribution fees payable to EVD. Service fees paid or accrued for the year ended October 31, 2023 amounted to $36,310 and $2,659 for Class C and Class R shares, respectively.
Distribution and service fees are subject to the limitations contained in the Financial Industry Regulatory Authority Rule 2341(d).
5 Contingent Deferred Sales Charges
A contingent deferred sales charge (CDSC) of 1% generally is imposed on redemptions of Class C shares made within 12 months of purchase. Class A shares may be subject to a 1% CDSC if redeemed within 12 months of purchase (depending on the circumstances of purchase). Generally, the CDSC is based upon the lower of the net asset value at date of redemption or date of purchase. No charge is levied on shares acquired by reinvestment of dividends or capital gain distributions. For the year ended October 31, 2023, the Fund was informed that EVD received $208 and $798 of CDSCs paid by Class A and Class C shareholders, respectively.
6 Purchases and Sales of Investments
Purchases and sales of investments by the Portfolio, other than short-term obligations and investments transferred to the Fund and including maturities and principal repayments on Senior Loans, for the period from November 1, 2022 through June 16, 2023 aggregated $115,129,841 and $124,961,682, respectively. Purchases and sales of investments by the Fund, other than short-term obligations and investments transferred from the Portfolio and including maturities and principal repayments on Senior Loans, for the period from June 17, 2023 through October 31, 2023 aggregated $31,577,184 and $34,808,993, respectively.
Increases and decreases in the Fund’s investment in the Portfolio for the period from November 1, 2022 through June 16, 2023 were $4,754,529 and $255,171,066, respectively. Included in decreases is $235,644,072, representing the Fund’s interest in the Portfolio as of the close of business on June 16, 2023, which was exchanged for the Fund’s pro rata share of net assets of the Portfolio on that date having the same fair value. The Fund’s cost of its investment in the Portfolio on such date of $195,894,590 was carried forward to the net assets acquired from the Portfolio and no gain or loss was recognized on the exchange.
Eaton Vance
Global Income Builder Fund
October 31, 2023
Notes to Financial Statements — continued
7 Shares of Beneficial Interest
The Fund’s Declaration of Trust permits the Trustees to issue an unlimited number of full and fractional shares of beneficial interest (without par value). Such shares may be issued in a number of different series (such as the Fund) and classes. Transactions in Fund shares, including direct exchanges pursuant to share class conversions, were as follows:
| | Year Ended
October 31, 2023 | | Year Ended
October 31, 2022 |
| | Shares | Amount | | Shares | Amount |
| Class A | | | | | |
| Sales | 798,192 | $ 7,668,604 | | 1,227,451 | $ 12,726,234 |
| Issued to shareholders electing to receive payments of distributions in Fund shares | 411,593 | 3,945,474 | | 601,063 | 6,160,367 |
| Redemptions | (2,323,743) | (22,233,027) | | (2,485,542) | (24,634,899) |
| Net decrease | (1,113,958) | $(10,618,949) | | (657,028) | $ (5,748,298) |
| Class C | | | | | |
| Sales | 174,558 | $ 1,683,922 | | 186,743 | $ 1,957,980 |
| Issued to shareholders electing to receive payments of distributions in Fund shares | 40,087 | 379,095 | | 76,915 | 786,222 |
| Redemptions | (556,106) | (5,242,453) | | (733,864) | (7,284,683) |
| Net decrease | (341,461) | $ (3,179,436) | | (470,206) | $ (4,540,481) |
| Class I | | | | | |
| Sales | 1,523,994 | $ 14,648,924 | | 1,597,829 | $ 16,139,353 |
| Issued to shareholders electing to receive payments of distributions in Fund shares | 323,392 | 3,096,760 | | 443,668 | 4,531,038 |
| Redemptions | (1,970,133) | (18,915,346) | | (3,035,715) | (30,376,459) |
| Net decrease | (122,747) | $ (1,169,662) | | (994,218) | $ (9,706,068) |
| Class R | | | | | |
| Sales | 15,784 | $ 153,136 | | 42,144 | $ 425,735 |
| Issued to shareholders electing to receive payments of distributions in Fund shares | 3,486 | 33,319 | | 3,670 | 36,989 |
| Redemptions | (3,269) | (31,610) | | (14,076) | (151,657) |
| Net increase | 16,001 | $ 154,845 | | 31,738 | $ 311,067 |
8 Financial Instruments
The Fund may trade in financial instruments with off-balance sheet risk in the normal course of its investing activities. These financial instruments may include forward foreign currency exchange contracts and futures contracts and may involve, to a varying degree, elements of risk in excess of the amounts recognized for financial statement purposes. The notional or contractual amounts of these instruments represent the investment the Fund has in particular classes of financial instruments and do not necessarily represent the amounts potentially subject to risk. The measurement of the risks associated with these instruments is meaningful only when all related and offsetting transactions are considered. At October 31, 2023, there were no obligations outstanding under these financial instruments.
In the normal course of pursuing its investment objective, the Fund is subject to the following risks:
Equity Price Risk: During the year ended October 31, 2023, the Fund entered into equity futures contracts on securities indices to gain or limit exposure to certain markets, particularly in connection with engaging in the dividend capture trading strategy.
Eaton Vance
Global Income Builder Fund
October 31, 2023
Notes to Financial Statements — continued
Foreign Exchange Risk: Because the Fund holds foreign currency denominated investments, the value of these investments and related receivables and payables may change due to future changes in foreign currency exchange rates. To hedge against this risk, the Fund entered into forward foreign currency exchange contracts during the year ended October 31, 2023.
The Fund enters into forward foreign currency exchange contracts that may contain provisions whereby the counterparty may terminate the contract under certain conditions, including but not limited to a decline in the Fund’s net assets below a certain level over a certain period of time, which would trigger a payment by the Fund for those derivatives in a liability position. At October 31, 2023, the Fund had no open derivatives with credit-related contingent features in a net liability position.
The over-the-counter (OTC) derivatives in which the Fund invests are subject to the risk that the counterparty to the contract fails to perform its obligations under the contract. To mitigate this risk, the Fund has entered into an International Swaps and Derivatives Association, Inc. Master Agreement (“ISDA Master Agreement”) or similar agreement with substantially all its derivative counterparties. An ISDA Master Agreement is a bilateral agreement between the Fund and a counterparty that governs certain OTC derivatives and typically contains, among other things, set-off provisions in the event of a default and/or termination event as defined under the relevant ISDA Master Agreement. Under an ISDA Master Agreement, the Fund may, under certain circumstances, offset with the counterparty certain derivative financial instruments’ payables and/or receivables with collateral held and/or posted and create one single net payment. The provisions of the ISDA Master Agreement typically permit a single net payment in the event of default including the bankruptcy or insolvency of the counterparty. However, bankruptcy or insolvency laws of a particular jurisdiction may impose restrictions on or prohibitions against the right of offset in bankruptcy or insolvency. Certain ISDA Master Agreements allow counterparties to OTC derivatives to terminate derivative contracts prior to maturity in the event the Fund’s net assets decline by a stated percentage or the Fund fails to meet the terms of its ISDA Master Agreements, which would cause the counterparty to accelerate payment by the Fund of any net liability owed to it.
The collateral requirements for derivatives traded under an ISDA Master Agreement are governed by a Credit Support Annex to the ISDA Master Agreement. Collateral requirements are determined at the close of business each day and are typically based on changes in market values for each transaction under an ISDA Master Agreement and netted into one amount for such agreement. Generally, the amount of collateral due from or to a counterparty is subject to a minimum transfer threshold amount before a transfer is required, which may vary by counterparty. Collateral pledged for the benefit of the Fund and/or counterparty is held in segregated accounts by the Fund’s custodian and cannot be sold, re-pledged, assigned or otherwise used while pledged. The portion of such collateral representing cash, if any, is reflected as deposits for derivatives collateral and, in the case of cash pledged by a counterparty for the benefit of the Fund, a corresponding liability on the Statement of Assets and Liabilities. Securities pledged by the Fund as collateral, if any, are identified as such in the Portfolio of Investments.
The effect of derivative instruments (not considered to be hedging instruments for accounting disclosure purposes) on the Statement of Operations by risk exposure for the year ended October 31, 2023 was as follows:
| Risk | Derivative | Realized Gain (Loss)
on Derivatives Recognized
in Income(1) | Change in Unrealized
Appreciation (Depreciation) on
Derivatives Recognized in Income(2) |
| Equity Price | Futures contracts | $ 969,264 | $ — |
| Foreign Exchange | Forward foreign currency exchange contracts | 10,006 | — |
| Total | $979,270 | $ — |
| (1) | Statement of Operations location: Net realized gain (loss): Futures contracts and Futures contracts allocated from Portfolio and Forward foreign currency exchange contracts and Forward foreign currency exchange contracts allocated from Portfolio, respectively. |
| (2) | Statement of Operations location: Change in unrealized appreciation (depreciation): Futures contracts and Futures contracts allocated from Portfolio. |
Eaton Vance
Global Income Builder Fund
October 31, 2023
Notes to Financial Statements — continued
The average notional cost of futures contracts and average notional amounts of other derivative contracts outstanding during the year ended October 31, 2023, including those entered into by the Portfolio during the period when the Fund was investing in the Portfolio, which are indicative of the volume of these derivative types, were approximately as follows:
Futures
Contracts — Long | Futures
Contracts — Short | Forward
Foreign Currency
Exchange Contracts* |
| $4,934,000 | $4,960,000 | $86,000 |
| * | The average notional amount for forward foreign currency exchange contracts is based on the absolute value of notional amounts of currency purchased and currency sold. |
9 Line of Credit
The Fund (and Portfolio prior to June 17, 2023) participates with other portfolios and funds managed by BMR and its affiliates in a $650 million unsecured revolving line of credit agreement with a group of banks, which is in effect through October 22, 2024. In connection with the renewal of the agreement on October 24, 2023, the borrowing limit was decreased from $725 million. Borrowings are made by the Fund solely for temporary purposes related to redemptions and other short-term cash needs. Interest is charged to the Fund based on its borrowings at an amount above either the Secured Overnight Financing Rate (SOFR) or Federal Funds rate. In addition, a fee computed at an annual rate of 0.15% on the daily unused portion of the line of credit is allocated among the participating portfolios and funds at the end of each quarter. In connection with the renewal of the agreement in October 2023, an arrangement fee totaling $150,000 was incurred that was allocated to the participating portfolios and funds. Because the line of credit is not available exclusively to the Fund, it may be unable to borrow some or all of its requested amounts at any particular time. The Fund and Portfolio did not have any significant borrowings or allocated fees during the year ended October 31, 2023.
10 Affiliated Investments
At October 31, 2023, the value of the Fund's investment in funds that may be deemed to be affiliated was $1,761,122, which represents 0.8% of the Fund's net assets. Transactions in such investments by the Portfolio for the period from November 1, 2022 through June 16, 2023 and by the Fund for the period from June 17, 2023 through October 31, 2023 were as follows:
| Name | Value,
beginning
of period | Purchases | Sales
proceeds | Net
realized
gain (loss)(1) | Change in
unrealized
appreciation
(depreciation)(1) | Value, end
of period | Dividend
income(1) | Shares,
end of period |
| Short-Term Investments |
| Liquidity Fund | $1,319,217 | $63,446,668 | $(63,004,763) | $ — | $ — | $1,761,122 | $132,398 | 1,761,122 |
| (1) | Includes amounts allocated from the Portfolio for the period while the Fund was investing in the Portfolio. |
11 Fair Value Measurements
Under generally accepted accounting principles for fair value measurements, a three-tier hierarchy to prioritize the assumptions, referred to as inputs, is used in valuation techniques to measure fair value. The three-tier hierarchy of inputs is summarized in the three broad levels listed below.
| • | Level 1 – quoted prices in active markets for identical investments |
| • | Level 2 – other significant observable inputs (including quoted prices for similar investments, interest rates, prepayment speeds, credit risk, etc.) |
| • | Level 3 – significant unobservable inputs (including a fund's own assumptions in determining the fair value of investments) |
In cases where the inputs used to measure fair value fall in different levels of the fair value hierarchy, the level disclosed is determined based on the lowest level input that is significant to the fair value measurement in its entirety. The inputs or methodology used for valuing securities are not necessarily an indication of the risk associated with investing in those securities.
Eaton Vance
Global Income Builder Fund
October 31, 2023
Notes to Financial Statements — continued
At October 31, 2023, the hierarchy of inputs used in valuing the Fund’s investments, which are carried at fair value, were as follows:
| Asset Description | Level 1 | Level 2 | Level 3* | Total |
| Common Stocks: | | | | |
| Communication Services | $ 6,938,242 | $ 937,255 | $ — | $ 7,875,497 |
| Consumer Discretionary | 7,564,260 | 5,712,449 | — | 13,276,709 |
| Consumer Staples | 4,319,719 | 3,934,009 | — | 8,253,728 |
| Energy | 7,237,095 | — | — | 7,237,095 |
| Financials | 11,348,162 | 5,905,199 | — | 17,253,361 |
| Health Care | 13,107,265 | 10,800,574 | — | 23,907,839 |
| Industrials | 7,383,292 | 8,537,895 | — | 15,921,187 |
| Information Technology | 23,771,021 | 5,270,092 | — | 29,041,113 |
| Materials | — | 2,253,959 | — | 2,253,959 |
| Real Estate | 704,104 | — | — | 704,104 |
| Utilities | 1,450,344 | 1,353,083 | — | 2,803,427 |
| Total Common Stocks | $ 83,823,504 | $ 44,704,515** | $ — | $128,528,019 |
| Convertible Bonds | $ — | $ 721,679 | $ — | $ 721,679 |
| Corporate Bonds | — | 80,128,674 | — | 80,128,674 |
| Exchange-Traded Funds | 159,676 | — | — | 159,676 |
| Preferred Stocks: | | | | |
| Communication Services | 103,886 | — | — | 103,886 |
| Energy | 480,514 | — | — | 480,514 |
| Financials | 317,039 | 66,816 | — | 383,855 |
| Industrials | 216,986 | — | — | 216,986 |
| Real Estate | 231,983 | — | — | 231,983 |
| Utilities | 226,575 | — | — | 226,575 |
| Total Preferred Stocks | $ 1,576,983 | $ 66,816 | $ — | $ 1,643,799 |
| Senior Floating-Rate Loans | $ — | $ 3,079,186 | $ — | $ 3,079,186 |
| Miscellaneous | — | 16,300 | 0 | 16,300 |
| Short-Term Investments | 1,761,122 | — | — | 1,761,122 |
| Total Investments | $ 87,321,285 | $ 128,717,170 | $ 0 | $216,038,455 |
| * | None of the unobservable inputs for Level 3 assets, individually or collectively, had a material impact on the Fund. |
| ** | Includes foreign equity securities whose values were adjusted to reflect market trading of comparable securities or other correlated instruments that occurred after the close of trading in their applicable foreign markets. |
Level 3 investments at the beginning and/or end of the period in relation to net assets were not significant and accordingly, a reconciliation of Level 3 assets for the year ended October 31, 2023 is not presented.
12 Risks and Uncertainties
Risks Associated with Foreign Investments
Foreign investments can be adversely affected by political, economic and market developments abroad, including the imposition of economic and other sanctions by the United States or another country. There may be less publicly available information about foreign issuers because they may not be subject to reporting practices, requirements or regulations comparable to those to which United States companies are subject. Foreign markets may be smaller, less liquid and more volatile than the major markets in the United States. Trading in foreign markets typically involves higher expense than trading in the United States. The Fund may have difficulties enforcing its legal or contractual rights in a foreign country. Securities that trade or are denominated in currencies other than the U.S. dollar may be adversely affected by fluctuations in currency exchange rates.
Eaton Vance
Global Income Builder Fund
October 31, 2023
Report of Independent Registered Public Accounting Firm
To the Trustees of Eaton Vance Mutual Funds Trust and Shareholders of Eaton Vance Global Income Builder Fund:
Opinion on the Financial Statements and Financial Highlights
We have audited the accompanying statement of assets and liabilities of Eaton Vance Global Income Builder Fund (the “Fund") (one of the funds constituting Eaton Vance Mutual Funds Trust), including the portfolio of investments, as of October 31, 2023, the related statement of operations for the year then ended, the statements of changes in net assets for each of the two years in the period then ended, the financial highlights for each of the five years in the period then ended, and the related notes. In our opinion, the financial statements and financial highlights present fairly, in all material respects, the financial position of the Fund as of October 31, 2023, and the results of its operations for the year then ended, the changes in its net assets for each of the two years in the period then ended, and the financial highlights for each of the five years in the period then ended, in conformity with accounting principles generally accepted in the United States of America.
Basis for Opinion
These financial statements and financial highlights are the responsibility of the Fund's management. Our responsibility is to express an opinion on the Fund's financial statements and financial highlights based on our audits. We are a public accounting firm registered with the Public Company Accounting Oversight Board (United States) (PCAOB) and are required to be independent with respect to the Fund in accordance with the U.S. federal securities laws and the applicable rules and regulations of the Securities and Exchange Commission and the PCAOB.
We conducted our audits in accordance with the standards of the PCAOB. Those standards require that we plan and perform the audit to obtain reasonable assurance about whether the financial statements and financial highlights are free of material misstatement, whether due to error or fraud. The Fund is not required to have, nor were we engaged to perform, an audit of its internal control over financial reporting. As part of our audits, we are required to obtain an understanding of internal control over financial reporting but not for the purpose of expressing an opinion on the effectiveness of the Fund’s internal control over financial reporting. Accordingly, we express no such opinion.
Our audits included performing procedures to assess the risks of material misstatement of the financial statements and financial highlights, whether due to error or fraud, and performing procedures that respond to those risks. Such procedures included examining, on a test basis, evidence regarding the amounts and disclosures in the financial statements and financial highlights. Our audits also included evaluating the accounting principles used and significant estimates made by management, as well as evaluating the overall presentation of the financial statements and financial highlights. Our procedures included confirmation of securities and senior loans owned as of October 31, 2023, by correspondence with the custodian, brokers and agent banks; when replies were not received from brokers and agent banks, we performed other auditing procedures. We believe that our audits provide a reasonable basis for our opinion.
/s/ Deloitte & Touche LLP
Boston, Massachusetts
December 22, 2023
We have served as the auditor of one or more Eaton Vance investment companies since 1959.
Eaton Vance
Global Income Builder Fund
October 31, 2023
Federal Tax Information (Unaudited)
The Form 1099-DIV you receive in February 2024 will show the tax status of all distributions paid to your account in calendar year 2023. Shareholders are advised to consult their own tax adviser with respect to the tax consequences of their investment in the Fund. As required by the Internal Revenue Code and/or regulations, shareholders must be notified regarding the status of qualified business income, qualified dividend income for individuals, the dividends received deduction for corporations and 163(j) interest dividends.
Qualified Business Income. For the fiscal year ended October 31, 2023 the Fund designates approximately $24,461, or up to the maximum amount of such dividends allowable pursuant to the Internal Revenue Code, as qualified business income.
Qualified Dividend Income. For the fiscal year ended October 31, 2023, the Fund designates approximately $5,194,496, or up to the maximum amount of such dividends allowable pursuant to the Internal Revenue Code, as qualified dividend income eligible for the reduced tax rate of 15%.
Dividends Received Deduction. Corporate shareholders are generally entitled to take the dividends received deduction on the portion of the Fund’s dividend distribution that qualifies under tax law. For the Fund’s fiscal 2023 ordinary income dividends, 12.65% qualifies for the corporate dividends received deduction.
163(j) Interest Dividends. For the fiscal year ended October 31, 2023, the Fund designates 29.49% of distributions from net investment income as a 163(j) interest dividend.
Eaton Vance
Global Income Builder Fund
October 31, 2023
Board of Trustees’ Contract Approval
Overview of the Contract Review Process
The Investment Company Act of 1940, as amended (the “1940 Act”), provides, in substance, that the investment advisory agreement between a fund and its investment adviser will continue in effect from year-to-year only if its continuation is approved on an annual basis by a vote of the fund’s board of trustees, including a majority of the trustees who are not “interested persons” of the fund (“independent trustees”), cast in person at a meeting called for the purpose of considering such approval.
At a meeting held on June 8, 2023, the Boards of Trustees/Directors (collectively, the “Board”) that oversee the registered investment companies advised by Eaton Vance Management or its affiliate, Boston Management and Research (the “Eaton Vance Funds”), including a majority of the independent trustees (the “Independent Trustees”), voted to approve the continuation of existing investment advisory agreements and sub-advisory agreements1 for each of the Eaton Vance Funds for an additional one-year period. The Board relied upon the affirmative recommendation of its Contract Review Committee, which is a committee exclusively comprised of Independent Trustees. Prior to making its recommendation, the Contract Review Committee reviewed information furnished by the adviser and sub-adviser to each of the Eaton Vance Funds (including information specifically requested by the Board) for a series of formal meetings held between April and June 2023, as well as certain additional information provided in response to specific requests from the Independent Trustees as members of the Contract Review Committee. Members of the Contract Review Committee also considered information received at prior meetings of the Board and its committees, to the extent such information was relevant to the Contract Review Committee’s annual evaluation of the investment advisory agreements and sub-advisory agreements.
In connection with its evaluation of the investment advisory agreements and sub-advisory agreements, the Board considered various information relating to the Eaton Vance Funds. This included information applicable to all or groups of Eaton Vance Funds, which is referenced immediately below, and information applicable to the particular Eaton Vance Fund covered by this report (each “Eaton Vance Fund” is referred to below as a “fund”). (For funds that invest through one or more underlying portfolios, references to “each fund” in this section may include information that was considered at the portfolio-level.)
Information about Fees, Performance and Expenses
• A report from an independent data provider comparing advisory and other fees paid by each fund to such fees paid by comparable funds, as identified by the independent data provider (“comparable funds”);
• A report from an independent data provider comparing each fund’s total expense ratio (and its components) to those of comparable funds;
• A report from an independent data provider comparing the investment performance of each fund (including, as relevant, total return data, income data, Sharpe ratios and information ratios) to the investment performance of comparable funds and, as applicable, benchmark indices, over various time periods;
• In certain instances, data regarding investment performance relative to customized groups of peer funds and blended indices identified by the adviser in consultation with the Portfolio Management Committee of the Board (a committee exclusively comprised of Independent Trustees);
• Comparative information concerning the fees charged and services provided by the adviser and sub-adviser to each fund in managing other accounts (which may include other mutual funds, collective investment funds and institutional accounts) using investment strategies and techniques similar to those used in managing such fund(s), if any;
• Profitability analyses with respect to the adviser and sub-adviser to each of the funds;
Information about Portfolio Management and Trading
• Descriptions of the investment management services provided to each fund, as well as each of the funds’ investment strategies and policies;
• The procedures and processes used to determine the value of fund assets, including, when necessary, the determination of “fair value” and actions taken to monitor and test the effectiveness of such procedures and processes;
• Information about the policies and practices of each fund’s adviser and sub-adviser with respect to trading, including their processes for seeking best execution of portfolio transactions;
• Information about the allocation of brokerage transactions and the benefits, if any, received by the adviser and sub-adviser to each fund as a result of brokerage allocation, including, as applicable, information concerning the acquisition of research through client commission arrangements and policies with respect to “soft dollars”;
• Data relating to the portfolio turnover rate of each fund and related information regarding active management in the context of particular strategies;
Information about each Adviser and Sub-adviser
• Reports detailing the financial results and condition of the adviser and sub-adviser to each fund;
• Information regarding the individual investment professionals whose responsibilities include portfolio management and investment research for the funds, and, for portfolio managers and certain other investment professionals, information relating to their responsibilities with respect to managing other mutual funds and investment accounts, as applicable;
1 Not all Eaton Vance Funds have entered into a sub-advisory agreement with a sub-adviser. Accordingly, references to “sub-adviser” or “sub-advisory agreement” in this “Overview” section may not be applicable to the particular Eaton Vance Fund covered by this report.
Eaton Vance
Global Income Builder Fund
October 31, 2023
Board of Trustees’ Contract Approval — continued
• Information regarding the adviser’s and its parent company’s (Morgan Stanley’s) efforts to retain and attract talented investment professionals, including in the context of a competitive marketplace for talent, as well as the ongoing unique environment presented by hybrid, remote and other alternative work arrangements;
• Information regarding the adviser’s compensation methodology for its investment professionals and the incentives and accountability it creates, along with investment professionals’ investments in the fund(s) they manage;
• The Code of Ethics of the adviser and its affiliates and the sub-adviser of each fund, together with information relating to compliance with, and the administration of, such codes;
• Policies and procedures relating to proxy voting, including regular reporting with respect to fund proxy voting activities;
• Information regarding the handling of corporate actions and class actions, as well as information regarding litigation and other regulatory matters;
• Information concerning the resources devoted to compliance efforts undertaken by the adviser and its affiliates and the sub-adviser of each fund, if any, including descriptions of their various compliance programs and their record of compliance;
• Information concerning the business continuity and disaster recovery plans of the adviser and its affiliates and the sub-adviser of each fund, if any;
• A description of Eaton Vance Management’s and Boston Management and Research’s oversight of sub-advisers, including with respect to regulatory and compliance issues, investment management and other matters;
Other Relevant Information
• Information regarding ongoing initiatives to further integrate and harmonize, where applicable, the investment management and other departments of the adviser and its affiliates with the overall investment management infrastructure of Morgan Stanley, in light of Morgan Stanley’s acquisition of Eaton Vance Corp. on March 1, 2021;
• Information concerning the nature, cost and character of the administrative and other non-investment advisory services provided by Eaton Vance Management and its affiliates;
• Information concerning oversight of the relationship with the custodian, subcustodians, fund accountants, and other third-party service providers by the adviser and/or administrator to each of the funds;
• Information concerning efforts to implement policies and procedures with respect to various recently adopted regulations applicable to the funds, including Rule 12d1-4 (the Fund-of-Funds Rule), Rule 18f-4 (the Derivatives Rule) and Rule 2a-5 (the Fair Valuation Rule);
• For an Eaton Vance Fund structured as an exchange-listed closed-end fund, information concerning the benefits of the closed-end fund structure, as well as, where relevant, the closed-end fund’s market prices (including as compared to the closed-end fund’s net asset value (NAV)), trading volume data, continued use of auction preferred shares (where applicable), distribution rates and other relevant matters;
• The risks which the adviser and/or its affiliates incur in connection with the management and operation of the funds, including, among others, litigation, regulatory, entrepreneurial, and other business risks (and the associated costs of such risks); and
• The terms of each investment advisory agreement and sub-advisory agreement.
During the various meetings of the Board and its committees over the course of the year leading up to the June 8, 2023 meeting, the Board received information from portfolio managers and other investment professionals of the advisers and sub-advisers of the funds regarding investment and performance matters, and considered various investment and trading strategies used in pursuing the funds’ investment objectives. The Board also received information regarding risk management techniques employed in connection with the management of the funds. The Board and its committees evaluated issues pertaining to industry and regulatory developments, compliance procedures, fund governance and other issues with respect to the funds, and received and participated in reports and presentations provided by Eaton Vance Management, Boston Management and Research and fund sub-advisers, with respect to such matters. In addition to the formal meetings of the Board and its committees, the Independent Trustees held regular teleconferences to discuss, among other topics, matters relating to the continuation of investment advisory agreements and sub-advisory agreements.
The Contract Review Committee was advised throughout the contract review process by Goodwin Procter LLP, independent legal counsel for the Independent Trustees. The members of the Contract Review Committee, with the advice of such counsel, exercised their own business judgment in determining the material factors to be considered in evaluating each investment advisory agreement and sub-advisory agreement and the weight to be given to each such factor. The conclusions reached with respect to each investment advisory agreement and sub-advisory agreement were based on a comprehensive evaluation of all the information provided and not any single factor. Moreover, each member of the Contract Review Committee may have placed varying emphasis on particular factors in reaching conclusions with respect to each investment advisory agreement and sub-advisory agreement. In evaluating each investment advisory agreement and sub-advisory agreement, including the fee structures and other terms contained in such agreements, the members of the Contract Review Committee were also informed by multiple years of analysis and discussion with the adviser and sub-adviser to each of the Eaton Vance Funds.
Results of the Contract Review Process
Based on its consideration of the foregoing, and such other information it deemed relevant, including the factors and conclusions described below, the Contract Review Committee concluded that the continuation of the investment advisory agreement between Eaton Vance Global Income Builder Fund (the “Fund”), as well as the investment advisory agreement between Global Income Builder Portfolio (the “Portfolio”), the portfolio in which the Fund invests, and Boston Management and Research (the “Adviser”), and the sub-advisory agreement between the Adviser and Eaton Vance Advisers International Ltd. (the “Sub-adviser”), an affiliate of Eaton Vance Management, with respect to the Fund, as well as the sub-advisory agreement between the Adviser and the
Eaton Vance
Global Income Builder Fund
October 31, 2023
Board of Trustees’ Contract Approval — continued
Sub-adviser with respect to the Portfolio, including their respective fee structures, are in the interests of shareholders and, therefore, recommended to the Board approval of each agreement. Based on the recommendation of the Contract Review Committee, the Board, including a majority of the Independent Trustees, voted to approve continuation of the investment advisory agreements and the sub-advisory agreements for the Fund and the Portfolio (collectively, the “investment advisory agreements”).
Nature, Extent and Quality of Services
In considering whether to approve the investment advisory agreements for the Fund and the Portfolio, the Board evaluated the nature, extent and quality of services provided to the Fund and the Portfolio by the Adviser and the Sub-adviser.
The Board considered the Adviser’s and the Sub-adviser’s management capabilities and investment processes in light of the types of investments held by the Fund and the Portfolio, including the education, experience and number of investment professionals and other personnel who provide portfolio management, investment research, and similar services to the Fund and the Portfolio, including recent changes to such personnel. Regarding the Adviser, the Board considered the Adviser’s responsibilities with respect to oversight of the Sub-adviser and coordinating activities in implementing the investment strategies of the Fund and the Portfolio. The Board also considered the Adviser’s in-house equity research capabilities and experience in managing funds that seek to maximize after-tax returns. With respect to the Sub-adviser, the Board considered the abilities and experience of the Sub-adviser’s investment professionals in investing in equity securities, including investing in both U.S. and foreign common stocks. In particular, the Board considered the abilities and experience of the Adviser’s and the Sub-adviser’s investment professionals in analyzing factors such as special considerations relevant to investing in dividend-paying common and preferred stocks and foreign markets. The Board considered the international investment capabilities of the Sub-adviser, which is based in London, and the benefits to the Fund of having portfolio management services involving investments in international equities provided by investment professionals located abroad. The Board also took into account the resources dedicated to portfolio management and other services, the compensation methods of the Adviser and other factors, including the reputation and resources of the Adviser to recruit and retain highly qualified research, advisory and supervisory investment professionals. In addition, the Board considered the time and attention devoted to the Eaton Vance Funds, including the Fund and the Portfolio, by senior management, as well as the infrastructure, operational capabilities and support staff in place to assist in the portfolio management and operations of the Fund and the Portfolio, including the provision of administrative services. The Board also considered the business-related and other risks to which the Adviser or its affiliates may be subject in managing the Fund and the Portfolio.
The Board noted that under the terms of the investment advisory agreement of the Fund, the Adviser may invest assets of the Fund directly in securities, for which it would receive a fee, or in the Portfolio, for which it receives no separate fee but for which the Adviser receives an advisory fee from the Portfolio. The Board also noted that, consistent with a recommendation by the Adviser, it had voted to liquidate the Portfolio, which was expected to occur in the near future. Accordingly, following the liquidation of the Portfolio, the Adviser will invest the assets of the Fund directly in securities.
The Board considered the compliance programs of the Adviser and relevant affiliates thereof, including the Sub-adviser. The Board considered compliance and reporting matters regarding, among other things, personal trading by investment professionals, disclosure of portfolio holdings, late trading, frequent trading, portfolio valuation, business continuity and the allocation of investment opportunities. The Board also considered the responses of the Adviser and its affiliates to requests in recent years from regulatory authorities, such as the Securities and Exchange Commission and the Financial Industry Regulatory Authority.
The Board considered other administrative services provided or overseen by Eaton Vance Management and its affiliates, including transfer agency and accounting services. The Board evaluated the benefits to shareholders of investing in a fund that is a part of a large fund complex offering exposure to a variety of asset classes and investment disciplines, as well as the ability, in many cases, to exchange an investment among different funds without incurring additional sales charges.
After consideration of the foregoing factors, among others, the Board concluded that the nature, extent and quality of services provided by the Adviser and the Sub-adviser, taken as a whole, are appropriate and consistent with the terms of the applicable investment advisory agreement.
Fund Performance
The Board compared the Fund’s investment performance to that of comparable funds identified by an independent data provider (the peer group), as well as appropriate benchmark indices and a customized peer group of similarly managed funds. The Board’s review included comparative performance data with respect to the Fund for the one-, three-, five- and ten-year periods ended December 31, 2022. In this regard, the Board noted that the performance of the Fund was higher than the median performance of the Fund’s peer group and custom peer group for the three-year period. The Board also noted that the performance of the Fund was lower than its primary benchmark and blended benchmark indexes for the three-year period. The Board concluded that the performance of the Fund was satisfactory.
Management Fees and Expenses
The Board considered contractual fee rates payable by the Portfolio and by the Fund for advisory and administrative services (referred to collectively as “management fees”). As part of its review, the Board considered the Fund’s management fees and total expense ratio for the one-year period ended December 31, 2022, as compared to those of comparable funds, before and after giving effect to any undertaking to waive fees or reimburse expenses. The Board also considered factors that had an impact on the Fund’s total expense ratio relative to comparable funds.
Eaton Vance
Global Income Builder Fund
October 31, 2023
Board of Trustees’ Contract Approval — continued
After considering the foregoing information, and in light of the nature, extent and quality of the services provided by the Adviser and the Sub-adviser, the Board concluded that the management fees charged for advisory and related services are reasonable.
Profitability and “Fall-Out” Benefits
The Board considered the level of profits realized by the Adviser and relevant affiliates thereof, including the Sub-adviser, in providing investment advisory and administrative services to the Fund, to the Portfolio and to all Eaton Vance Funds as a group. The Board considered the level of profits realized without regard to marketing support or other payments by the Adviser and its affiliates to third parties in respect of distribution or other services.
The Board concluded that, in light of the foregoing factors and the nature, extent and quality of the services rendered, the profits realized by the Adviser and its affiliates, including the Sub-adviser, are deemed not to be excessive.
The Board also considered direct or indirect fall-out benefits received by the Adviser and its affiliates, including the Sub-adviser, in connection with their respective relationships with the Fund and the Portfolio, including the benefits of research services that may be available to the Adviser or the Sub-adviser as a result of securities transactions effected for the Fund and the Portfolio and other investment advisory clients.
Economies of Scale
In reviewing management fees and profitability, the Board also considered the extent to which the Adviser and its affiliates, on the one hand, and the Fund and the Portfolio, on the other hand, can expect to realize benefits from economies of scale as the assets of the Fund and the Portfolio increase. The Board acknowledged the difficulty in accurately measuring the benefits resulting from economies of scale, if any, with respect to the management of any specific fund or group of funds. The Board reviewed data summarizing the increases and decreases in the assets of the Fund and of all Eaton Vance Funds as a group over various time periods, and evaluated the extent to which the total expense ratio of the Fund and the profitability of the Adviser and its affiliates may have been affected by such increases or decreases. Based upon the foregoing, the Board concluded that the Fund and the Portfolio currently share in the benefits from economies of scale, if any, when they are realized by the Adviser. The Board also concluded that the structure of the advisory fees, which include breakpoints at several asset levels, will allow the Fund and the Portfolio to continue to benefit from any economies of scale in the future.
Eaton Vance
Global Income Builder Fund
October 31, 2023
Liquidity Risk Management Program
The Fund has implemented a written liquidity risk management program (Program) and related procedures to manage its liquidity in accordance with Rule 22e-4 under the Investment Company Act of 1940, as amended (Liquidity Rule). The Liquidity Rule defines “liquidity risk” as the risk that a fund could not meet requests to redeem shares issued by the fund without significant dilution of the remaining investors’ interests in the fund. The Fund's Board of Trustees/Directors has designated the investment adviser to serve as the administrator of the Program and the related procedures. The administrator has established a Liquidity Risk Management Oversight Committee (Committee) to perform the functions necessary to administer the Program. As part of the Program, the administrator is responsible for identifying illiquid investments and categorizing the relative liquidity of the Fund's investments in accordance with the Liquidity Rule. Under the Program, the administrator assesses, manages, and periodically reviews the Fund's liquidity risk, and is responsible for making certain reports to the Fund's Board of Trustees/Directors and the Securities and Exchange Commission (SEC) regarding the liquidity of the Fund’s investments, and to notify the Board of Trustees/Directors and the SEC of certain liquidity events specified in the Liquidity Rule. The liquidity of the Fund's portfolio investments is determined based on a number of factors including, but not limited to, relevant market, trading and investment-specific considerations under the Program.
At a meeting of the Fund's Board of Trustees/Directors on June 7, 2023, the Committee provided a written report to the Fund's Board of Trustees/Directors pertaining to the operation, adequacy, and effectiveness of implementation of the Program, as well as the operation of the highly liquid investment minimum (if applicable) for the period January 1, 2022 through December 31, 2022 (Review Period). The Program operated effectively during the Review Period, supporting the administrator’s ability to assess, manage and monitor Fund liquidity risk, including during periods of market volatility and net redemptions. During the Review Period, the Fund met redemption requests on a timely basis.
There can be no assurance that the Program will achieve its objectives in the future. Please refer to the Fund's prospectus for more information regarding the Fund's exposure to liquidity risk and other principal risks to which an investment in the Fund may be subject.
Eaton Vance
Global Income Builder Fund
October 31, 2023
Management and Organization
Fund Management. The Trustees of Eaton Vance Mutual Funds Trust (the Trust) are responsible for the overall management and supervision of the Trust's affairs. The Board members and officers of the Trust are listed below. Except as indicated, each individual has held the office shown or other offices in the same company for the last five years. Board members hold indefinite terms of office. Each Trustee holds office until his or her successor is elected and qualified, subject to a prior death, resignation, retirement, disqualification or removal. Under the terms of the Fund’s current Trustee retirement policy, an Independent Trustee must retire and resign as a Trustee on the earlier of: (i) the first day of July following his or her 74th birthday; or (ii), with limited exception, December 31st of the 20th year in which he or she has served as a Trustee. However, if such retirement and resignation would cause the Fund to be out of compliance with Section 16 of the 1940 Act or any other regulations or guidance of the SEC, then such retirement and resignation will not become effective until such time as action has been taken for the Fund to be in compliance therewith. The “noninterested Trustees” consist of those Trustees who are not “interested persons” of the Trust, as that term is defined under the 1940 Act. The business address of each Board member and officer is Two International Place, Boston, Massachusetts 02110. As used below, “BMR” refers to Boston Management and Research, “EV” refers to EV LLC, “EVM” refers to Eaton Vance Management, “MSIM” refers to Morgan Stanley Investment Management Inc. and “EVD” refers to Eaton Vance Distributors, Inc. EV is the trustee of each of EVM and BMR. Each of EVM, BMR, EVD and EV are indirect, wholly owned subsidiaries of Morgan Stanley. Each officer affiliated with EVM may hold a position with other EVM affiliates that is comparable to his or her position with EVM listed below. Each Trustee oversees 127 funds in the Eaton Vance fund complex (including both funds and portfolios in a hub and spoke structure).
| Name and Year of Birth | Trust
Position(s) | Length of Service | Principal Occupation(s) and Other Directorships
During Past Five Years and Other Relevant Experience |
| Interested Trustee |
Anchal Pachnanda(1)
1980 | Trustee | Since 2023 | Co-Head of Strategy of MSIM (since 2019). Formerly, Head of Strategy of MSIM (2017-2019). Ms. Pachnanda is an interested person because of her position with MSIM, which is an affiliate of the Trust.
Other Directorships. None. |
| Noninterested Trustees |
Alan C. Bowser
1962 | Trustee | Since 2022 | Private investor. Formerly, Chief Diversity Officer, Partner and a member of the Operating Committee, and formerly served as Senior Advisor on Diversity and Inclusion for the firm’s chief executive officer, Co-Head of the Americas Region, and Senior Client Advisor of Bridgewater Associates, an asset management firm (2011- 2023).
Other Directorships. Independent Director of Stout Risius Ross (a middle market professional services advisory firm) (since 2021). |
Mark R. Fetting
1954 | Trustee | Since 2016 | Private investor. Formerly held various positions at Legg Mason, Inc. (investment management firm) (2000-2012), including President, Chief Executive Officer, Director and Chairman (2008-2012), Senior Executive Vice President (2004-2008) and Executive Vice President (2001-2004). Formerly, President of Legg Mason family of funds (2001-2008). Formerly, Division President and Senior Officer of Prudential Financial Group, Inc. and related companies (investment management firm) (1991-2000).
Other Directorships. None. |
Cynthia E. Frost
1961 | Trustee | Since 2014 | Private investor. Formerly, Chief Investment Officer of Brown University (university endowment) (2000-2012). Formerly, Portfolio Strategist for Duke Management Company (university endowment manager) (1995-2000). Formerly, Managing Director, Cambridge Associates (investment consulting company) (1989-1995). Formerly, Consultant, Bain and Company (management consulting firm) (1987-1989). Formerly, Senior Equity Analyst, BA Investment Management Company (1983-1985).
Other Directorships. None. |
George J. Gorman
1952 | Chairperson of the Board and Trustee | Since 2021
(Chairperson) and 2014 (Trustee) | Principal at George J. Gorman LLC (consulting firm). Formerly, Senior Partner at Ernst & Young LLP (a registered public accounting firm) (1974-2009).
Other Directorships. None. |
Eaton Vance
Global Income Builder Fund
October 31, 2023
Management and Organization — continued
| Name and Year of Birth | Trust
Position(s) | Length of Service | Principal Occupation(s) and Other Directorships
During Past Five Years and Other Relevant Experience |
| Noninterested Trustees (continued) |
Valerie A. Mosley
1960 | Trustee | Since 2014 | Chairwoman and Chief Executive Officer of Valmo Ventures (a consulting and investment firm). Founder of Upward Wealth, Inc., dba BrightUp, a fintech platform. Formerly, Partner and Senior Vice President, Portfolio Manager and Investment Strategist at Wellington Management Company, LLP (investment management firm) (1992-2012). Formerly, Chief Investment Officer, PG Corbin Asset Management (1990-1992). Formerly worked in institutional corporate bond sales at Kidder Peabody (1986-1990).
Other Directorships. Director of DraftKings, Inc. (digital sports entertainment and gaming company) (since September 2020). Director of Envestnet, Inc. (provider of intelligent systems for wealth management and financial wellness) (since 2018). Formerly, Director of Dynex Capital, Inc. (mortgage REIT) (2013-2020) and Director of Groupon, Inc. (e-commerce provider) (2020-2022). |
Keith Quinton
1958 | Trustee | Since 2018 | Private investor, researcher and lecturer. Formerly, Independent Investment Committee Member at New Hampshire Retirement System (2017-2021). Formerly, Portfolio Manager and Senior Quantitative Analyst at Fidelity Investments (investment management firm) (2001-2014).
Other Directorships. Formerly, Director (2016-2021) and Chairman (2019-2021) of New Hampshire Municipal Bond Bank. |
Marcus L. Smith
1966 | Trustee | Since 2018 | Private investor and independent corporate director. Formerly, Chief Investment Officer, Canada (2012-2017), Chief Investment Officer, Asia (2010-2012), Director of Asian Research (2004-2010) and portfolio manager (2001-2017) at MFS Investment Management (investment management firm).
Other Directorships. Director of First Industrial Realty Trust, Inc. (an industrial REIT) (since 2021). Director of MSCI Inc. (global provider of investment decision support tools) (since 2017). Formerly, Director of DCT Industrial Trust Inc. (logistics real estate company) (2017-2018). |
Susan J. Sutherland
1957 | Trustee | Since 2015 | Private investor. Director of Ascot Group Limited and certain of its subsidiaries (insurance and reinsurance) (since 2017). Formerly, Director of Hagerty Holding Corp. (insurance) (2015-2018) and Montpelier Re Holdings Ltd. (insurance and reinsurance) (2013-2015). Formerly, Associate, Counsel and Partner at Skadden, Arps, Slate, Meagher & Flom LLP (law firm) (1982-2013).
Other Directorships. Director of Kairos Acquisition Corp. (insurance/InsurTech acquisition company) (2021-2023). |
Scott E. Wennerholm
1959 | Trustee | Since 2016 | Private investor. Formerly, Trustee at Wheelock College (postsecondary institution) (2012-2018). Formerly, Consultant at GF Parish Group (executive recruiting firm) (2016-2017). Formerly, Chief Operating Officer and Executive Vice President at BNY Mellon Asset Management (investment management firm) (2005-2011). Formerly, Chief Operating Officer and Chief Financial Officer at Natixis Global Asset Management (investment management firm) (1997-2004). Formerly, Vice President at Fidelity Investments Institutional Services (investment management firm) (1994-1997).
Other Directorships. None. |
Nancy A. Wiser
1967 | Trustee | Since 2022 | Formerly, Executive Vice President and the Global Head of Operations at Wells Fargo Asset Management (2011-2021).
Other Directorships. None. |
| Name and Year of Birth | Trust
Position(s) | Length of Service | Principal Occupation(s)
During Past Five Years |
| Principal Officers who are not Trustees |
Kenneth A. Topping
1966 | President | Since 2023 | Vice President and Chief Administrative Officer of EVM and BMR and Chief Operating Officer for Public Markets at MSIM. Also Vice President of Calvert Research and Management (“CRM”) since 2021. Formerly, Chief Operating Officer for Goldman Sachs Asset Management `Classic' (2009-2020). |
Deidre E. Walsh
1971 | Vice President and Chief Legal Officer | Since 2009 | Vice President of EVM and BMR. Also Vice President of CRM. |
James F. Kirchner
1967 | Treasurer | Since 2007 | Vice President of EVM and BMR. Also Vice President of CRM. |
Eaton Vance
Global Income Builder Fund
October 31, 2023
Management and Organization — continued
| Name and Year of Birth | Trust
Position(s) | Length of Service | Principal Occupation(s)
During Past Five Years |
| Principal Officers who are not Trustees (continued) |
Nicholas S. Di Lorenzo
1987 | Secretary | Since 2022 | Formerly, associate (2012-2021) and counsel (2022) at Dechert LLP. |
Richard F. Froio
1968 | Chief Compliance
Officer | Since 2017 | Vice President of EVM and BMR since 2017. Formerly, Deputy Chief Compliance Officer (Adviser/Funds) and Chief Compliance Officer (Distribution) at PIMCO (2012-2017) and Managing Director at BlackRock/Barclays Global Investors (2009-2012). |
(1) Ms. Pachnanda began serving as Trustee effective April 1, 2023.
The SAI for the Fund includes additional information about the Trustees and officers of the Fund and can be obtained without charge on Eaton Vance’s website at www.eatonvance.com or by calling 1-800-262-1122.
| FACTS | WHAT DOES EATON VANCE DO WITH YOUR
PERSONAL INFORMATION? |
| Why? | Financial companies choose how they share your personal information. Federal law gives consumers the right to limit some but not all sharing. Federal law also requires us to tell you how we collect, share, and protect your personal information. Please read this notice carefully to understand what we do. |
| |
| What? | The types of personal information we collect and share depend on the product or service you have with us. This information can include:■ Social Security number and income
■ investment experience and risk tolerance
■ checking account number and wire transfer instructions |
| |
| How? | All financial companies need to share customers’ personal information to run their everyday business. In the section below, we list the reasons financial companies can share their customers’ personal information; the reasons Eaton Vance chooses to share; and whether you can limit this sharing. |
Reasons we can share your
personal information | Does Eaton Vance
share? | Can you limit
this sharing? |
| For our everyday business purposes — such as to process your transactions, maintain your account(s), respond to court orders and legal investigations, or report to credit bureaus | Yes | No |
| For our marketing purposes — to offer our products and services to you | Yes | No |
| For joint marketing with other financial companies | No | We don’t share |
| For our investment management affiliates’ everyday business purposes — information about your transactions, experiences, and creditworthiness | Yes | Yes |
| For our affiliates’ everyday business purposes — information about your transactions and experiences | Yes | No |
| For our affiliates’ everyday business purposes — information about your creditworthiness | No | We don’t share |
| For our investment management affiliates to market to you | Yes | Yes |
| For our affiliates to market to you | No | We don’t share |
| For nonaffiliates to market to you | No | We don’t share |
To limit our
sharing | Call toll-free 1-800-262-1122 or email: EVPrivacy@eatonvance.comPlease note:If you are a new customer, we can begin sharing your information 30 days from the date we sent this notice. When you are no longer our customer, we continue to share your information as described in this notice. However, you can contact us at any time to limit our sharing. |
| Questions? | Call toll-free 1-800-262-1122 or email: EVPrivacy@eatonvance.com |
| Privacy Notice — continued | April 2021 |
| Who we are |
| Who is providing this notice? | Eaton Vance Management, Eaton Vance Distributors, Inc., Eaton Vance Trust Company, Eaton Vance Management (International) Limited, Eaton Vance Advisers International Ltd., Eaton Vance Global Advisors Limited, Eaton Vance Management’s Real Estate Investment Group, Boston Management and Research, Calvert Research and Management, Eaton Vance and Calvert Fund Families and our investment advisory affiliates (“Eaton Vance”) (see Investment Management Affiliates definition below) |
| What we do |
How does Eaton Vance
protect my personal
information? | To protect your personal information from unauthorized access and use, we use security measures that comply with federal law. These measures include computer safeguards and secured files and buildings. We have policies governing the proper handling of customer information by personnel and requiring third parties that provide support to adhere to appropriate security standards with respect to such information. |
How does Eaton Vance
collect my personal
information? | We collect your personal information, for example, when you■ open an account or make deposits or withdrawals from your account
■ buy securities from us or make a wire transfer
■ give us your contact informationWe also collect your personal information from others, such as credit bureaus, affiliates, or other companies. |
| Why can’t I limit all sharing? | Federal law gives you the right to limit only■ sharing for affiliates’ everyday business purposes — information about your creditworthiness
■ affiliates from using your information to market to you
■ sharing for nonaffiliates to market to youState laws and individual companies may give you additional rights to limit sharing. See below for more on your rights under state law. |
| Definitions |
Investment Management
Affiliates | Eaton Vance Investment Management Affiliates include registered investment advisers, registered broker- dealers, and registered and unregistered funds. Investment Management Affiliates does not include entities associated with Morgan Stanley Wealth Management, such as Morgan Stanley Smith Barney LLC and Morgan Stanley & Co. |
| Affiliates | Companies related by common ownership or control. They can be financial and nonfinancial companies.■ Our affiliates include companies with a Morgan Stanley name and financial companies such as Morgan Stanley Smith Barney LLC and Morgan Stanley & Co. |
| Nonaffiliates | Companies not related by common ownership or control. They can be financial and nonfinancial companies.■ Eaton Vance does not share with nonaffiliates so they can market to you. |
| Joint marketing | A formal agreement between nonaffiliated financial companies that together market financial products or services to you.■ Eaton Vance doesn’t jointly market. |
| Other important information |
| Vermont: Except as permitted by law, we will not share personal information we collect about Vermont residents with Nonaffiliates unless you provide us with your written consent to share such information.California: Except as permitted by law, we will not share personal information we collect about California residents with Nonaffiliates and we will limit sharing such personal information with our Affiliates to comply with California privacy laws that apply to us. |
Delivery of Shareholder Documents. The Securities and Exchange Commission (SEC) permits funds to deliver only one copy of shareholder documents, including prospectuses, proxy statements and shareholder reports, to fund investors with multiple accounts at the same residential or post office box address. This practice is often called “householding” and it helps eliminate duplicate mailings to shareholders. Eaton Vance, or your financial intermediary, may household the mailing of your documents indefinitely unless you instruct Eaton Vance, or your financial intermediary, otherwise. If you would prefer that your Eaton Vance documents not be householded, please contact Eaton Vance at 1-800-262-1122, or contact your financial intermediary. Your instructions that householding not apply to delivery of your Eaton Vance documents will typically be effective within 30 days of receipt by Eaton Vance or your financial intermediary.
Portfolio Holdings. Each Eaton Vance Fund and its underlying Portfolio(s) (if applicable) files a schedule of portfolio holdings on Part F to Form N-PORT with the SEC. Certain information filed on Form N-PORT may be viewed on the Eaton Vance website at www.eatonvance.com, by calling Eaton Vance at 1-800-262-1122 or in the EDGAR database on the SEC’s website at www.sec.gov.
Proxy Voting. From time to time, funds are required to vote proxies related to the securities held by the funds. The Eaton Vance Funds or their underlying Portfolios (if applicable) vote proxies according to a set of policies and procedures approved by the Funds’ and Portfolios’ Boards. You may obtain a description of these policies and procedures and information on how the Funds or Portfolios voted proxies relating to portfolio securities during the most recent 12-month period ended June 30, without charge, upon request, by calling 1-800-262-1122 and by accessing the SEC’s website at www.sec.gov.
Tailored Shareholder Reports. Effective January 24, 2023, the SEC adopted rule and form amendments to require open-end mutual funds and ETFs to transmit concise and visually engaging streamlined annual and semiannual reports to shareholders that highlight key information. Other information, including financial statements, will no longer appear in a streamlined shareholder report but must be available online, delivered free of charge upon request, and filed on a semiannual basis on Form N-CSR. The rule and form amendments have a compliance date of July 24, 2024. At this time, management is evaluating the impact of these amendments on the shareholder reports for the Eaton Vance Funds.
Investment Adviser
Boston Management and Research
Two International Place
Boston, MA 02110
Administrator
Eaton Vance Management
Two International Place
Boston, MA 02110
Investment Sub-Adviser
Eaton Vance Advisers International Ltd.
125 Old Broad St.
London, EC2N 1AR
United Kingdom
Principal Underwriter*
Eaton Vance Distributors, Inc.
Two International Place
Boston, MA 02110
(617) 482-8260
Custodian
State Street Bank and Trust Company
One Congress Street, Suite 1
Boston, MA 02114-2016
Transfer Agent
BNY Mellon Investment Servicing (US) Inc.
Attn: Eaton Vance Funds
P.O. Box 534439
Pittsburgh, PA 15253-4439
(800) 262-1122
Fund Offices
Two International Place
Boston, MA 02110
*FINRA BrokerCheck. Investors may check the background of their Investment Professional by contacting the Financial Industry Regulatory Authority (FINRA). FINRA BrokerCheck is a free tool to help investors check the professional background of current and former FINRA-registered securities firms and brokers. FINRA BrokerCheck is available by calling 1-800-289-9999 and at www.FINRA.org. The FINRA BrokerCheck brochure describing this program is available to investors at www.FINRA.org.
Eaton Vance
Emerging Markets Local Income Fund
Annual Report
October 31, 2023
Commodity Futures Trading Commission Registration. The Commodity Futures Trading Commission (“CFTC”) has adopted regulations that subject registered investment companies and advisers to regulation by the CFTC if a fund invests more than a prescribed level of its assets in certain CFTC-regulated instruments (including futures, certain options and swap agreements) or markets itself as providing investment exposure to such instruments. The adviser is registered with the CFTC as a commodity pool operator with respect to its management of the Fund. As the commodity pool operator of the Fund, the adviser has claimed relief under the Commodity Exchange Act from certain reporting and recordkeeping requirements. The adviser is also registered as a commodity trading advisor.
Fund shares are not insured by the FDIC and are not deposits or other obligations of, or guaranteed by, any depository institution. Shares are subject to investment risks, including possible loss of principal invested.
This report must be preceded or accompanied by a current summary prospectus or prospectus. Before investing, investors should consider carefully the investment objective, risks, and charges and expenses of a mutual fund. This and other important information is contained in the summary prospectus and prospectus, which can be obtained from a financial intermediary. Prospective investors should read the prospectus carefully before investing. For further information, please call 1-800-262-1122.
Annual Report October 31, 2023
Eaton Vance
Emerging Markets Local Income Fund
Eaton Vance
Emerging Markets Local Income Fund
October 31, 2023
Management’s Discussion of Fund Performance†
Economic and Market Conditions
The world’s financial markets posted broad gains for the 12-month period ended October 31, 2023. During the period, inflation moderated in many countries, the U.S. economy outperformed expectations, and credit spreads generally tightened. These and other positive dynamics overshadowed concerns about rising global bond yields and heightened geopolitical tensions, including renewed conflict in the Middle East.
The U.S. Federal Reserve (the Fed) raised short-term interest rates during the period, and the cumulative effects of the monetary tightening cycle that began in March 2022 helped reduce U.S. inflation. As a result, the Fed slowed its pace of interest rate increases and signaled that it was nearing the end of its rate hiking campaign. The U.S. economy was resilient in the higher rate environment, posting solid growth as strength in the labor market supported healthy levels of consumer spending.
Inflation also eased in Europe, where the European Central Bank and Bank of England joined the Fed in slowing interest rate increases. However, European economic growth was sluggish amid elevated energy costs, a downturn in global trade, and higher borrowing costs. The prevalence of adjustable-rate mortgages in the U.K. and Southern Europe was particularly challenging for consumers in these regions. While wage gains helped offset the impact of higher household expenses, the U.K. unemployment rate rose and the eurozone labor market showed signs of softening late in the period.
In emerging markets (EM), China ended its zero-COVID policy early in the period, triggering a rebound in economic activity. However, the recovery quickly lost momentum due to several factors, including a drop in consumer confidence and a desire among developed-market (DM) companies to become less dependent on Chinese manufacturing. China’s economy stabilized in the final months of the period, bolstered by various stimulus measures. Nonetheless, the Chinese government seemed more focused on national security interests than economic growth.
During the period, numerous EM countries, including Mexico and several Southeast Asian nations in particular, benefited from DM companies’ efforts to diversify their supply chains beyond China. In addition, because EM central banks were generally ahead of their DM peers in addressing rising inflation risks, many EM central banks were able to cut interest rates during the period -- moves that supported economic growth and asset prices. For the period as a whole, the U.S. dollar broadly weakened, providing another tailwind for EM assets.
Fund Performance
For the 12-month period ended October 31, 2023, Eaton Vance Emerging Markets Local Income Fund (the Fund) returned 14.53% for Class A shares at net asset value (NAV), outperforming its benchmark, the J.P. Morgan Government Bond Index: Emerging Market (JPM GBI-EM) Global Diversified (Unhedged) (the Index), which returned 13.50%.
The Fund’s interest rate exposure made the largest contribution to performance relative to the Index during the period. Positioning in sovereign credit also contributed to Index-relative returns. Corporate credit exposure had minimal impact on performance relative to the Index, while the Fund’s currency allocation detracted.
By region, positioning in Eastern Europe was a key driver of the Fund’s outperformance of the Index during the period. An out-of-Index holding in Ukrainian local bonds performed especially well as Western allies provided military aid to the Ukrainian government and liquidity conditions in the country improved. An underweight position in local Turkish interest rates further aided relative performance. Turkey’s central bank aggressively raised rates during the second half of the period to control surging inflation.
Holdings in Latin America made a modest contribution to performance relative to the Index. An overweight position in Dominican Republic local bonds was a notable contributor during the period, benefiting from solid economic growth and falling inflation in the country.
In contrast, investments in Asia detracted from Index-relative returns, mainly due to currency exposures. Overweight exposure to the Malaysian ringgit was particularly unfavorable, as the ringgit weakened amid the fading economic rebound in China, Malaysia’s largest trading partner. An underweight position in the Thai baht also dampened Index-relative returns during the period.
Fund holdings in the Middle East & Africa region had a slightly negative impact on performance relative to the Index. Out-of-Index exposure to the Israeli shekel was a significant detractor from Index-relative returns given concerns about judicial reforms in Israel and, late in the period, the conflict with Hamas.
The Fund used derivatives extensively to both hedge select undesired risk exposures as well as gain select desired risk exposures. Some of the notable drivers of performance at the country level involved the use of derivatives. The Fund’s use of derivatives broadly contributed to returns versus the Index during the period. In particular, currency forwards used to gain and hedge desired exposures added value. Total return swaps used to gain exposure to certain securities or markets also contributed to Index-relative performance. Conversely, interest rate swaps used to gain and hedge desired exposures modestly detracted from Index-relative returns during the period.
See Endnotes and Additional Disclosures in this report.
Past performance is no guarantee of future results. Returns are historical and are calculated by determining the percentage change in net asset value (NAV) or offering price (as applicable) with all distributions reinvested. Furthermore, returns do not reflect the deduction of taxes that shareholders may have to pay on Fund distributions or upon the redemption of Fund shares. Investment return and principal value will fluctuate so that shares, when redeemed, may be worth more or less than their original cost. Performance for periods less than or equal to one year is cumulative. Performance is for the stated time period only; due to market volatility, current Fund performance may be lower or higher than the quoted return. For performance as of the most recent month-end, please refer to eatonvance.com.
Eaton Vance
Emerging Markets Local Income Fund
October 31, 2023
Performance
Portfolio Manager(s) Brian Shaw, CFA and Patrick Campbell, CFA
| % Average Annual Total Returns1,2 | Class
Inception Date | Performance
Inception Date | One Year | Five Years | Ten Years |
| Class A at NAV | 06/27/2007 | 06/27/2007 | 14.53% | 2.39% | 0.44% |
| Class A with 3.25% Maximum Sales Charge | — | — | 10.75 | 1.73 | 0.11 |
| Class C at NAV | 08/03/2010 | 06/27/2007 | 13.69 | 1.65 | (0.10) |
| Class C with 1% Maximum Deferred Sales Charge | — | — | 12.69 | 1.65 | (0.10) |
| Class I at NAV | 11/30/2009 | 06/27/2007 | 15.22 | 2.70 | 0.74 |
|
| J.P. Morgan Government Bond Index: Emerging Markets (JPM GBI-EM) Global Diversified (Unhedged) | — | — | 13.50% | 0.29% | (1.16)% |
| % Total Annual Operating Expense Ratios3 | Class A | Class C | Class I |
| | 1.14% | 1.89% | 0.89% |
Growth of $10,000
This graph shows the change in value of a hypothetical investment of $10,000 in Class A of the Fund for the period indicated. For comparison, the same investment is shown in the indicated index.
| Growth of Investment | Amount Invested | Period Beginning | At NAV | With Maximum Sales Charge |
| Class C | $10,000 | 10/31/2013 | $9,902 | N.A. |
| Class I, at minimum investment | $1,000,000 | 10/31/2013 | $1,076,508 | N.A. |
See Endnotes and Additional Disclosures in this report.
Past performance is no guarantee of future results. Returns are historical and are calculated by determining the percentage change in net asset value (NAV) or offering price (as applicable) with all distributions reinvested. Furthermore, returns do not reflect the deduction of taxes that shareholders may have to pay on Fund distributions or upon the redemption of Fund shares. Investment return and principal value will fluctuate so that shares, when redeemed, may be worth more or less than their original cost. Performance for periods less than or equal to one year is cumulative. Performance is for the stated time period only; due to market volatility, current Fund performance may be lower or higher than the quoted return. For performance as of the most recent month-end, please refer to eatonvance.com.
Eaton Vance
Emerging Markets Local Income Fund
October 31, 2023
| Asset Allocation (% of net assets)1 |
| Foreign Currency Exposures (% of net assets)2 |
| Mexico | 11.7% |
| Thailand | 10.2 |
| Brazil | 10.0 |
| Malaysia | 10.0 |
| Indonesia | 9.7 |
| Hungary | 7.7 |
| Poland | 7.6 |
| Czech Republic | 6.4 |
| South Africa | 6.4 |
| Dominican Republic | 5.3 |
| Colombia | 4.7 |
| Uzbekistan | 4.5 |
| Romania | 3.9 |
| South Korea | 3.0 |
| China | 2.6 |
| Armenia | 2.3 |
| Peru | 2.3 |
| Serbia | 2.2 |
| Chile | 2.0 |
| India | 1.5 |
| Uruguay | 1.2 |
| Other | 3.2 4 |
| Euro | -6.6 |
| Total Long | 119.1% |
| Total Short | -7.3% |
| Total Net | 111.8% |
Fund invests in an affiliated investment company (Portfolio) with the same objective(s) and policies as the Fund. References to investments are to the Portfolio’s holdings.
Footnotes:
| 1 | Other Net Assets represents other assets less liabilities and includes any investment type that represents less than 1% of net assets. |
2 Currency exposures include all foreign exchange denominated assets and currency derivatives. Total exposures may exceed 100% due to implicit leverage created by derivatives.
3 Net of securities sold short.
4 Includes amounts each less than 1.0% or –1.0%, as applicable.
Eaton Vance
Emerging Markets Local Income Fund
October 31, 2023
Endnotes and Additional Disclosures
| † | The views expressed in this report are those of the portfolio manager(s) and are current only through the date stated at the top of this page. These views are subject to change at any time based upon market or other conditions, and Eaton Vance and the Fund(s) disclaim any responsibility to update such views. These views may not be relied upon as investment advice and, because investment decisions are based on many factors, may not be relied upon as an indication of trading intent on behalf of any Eaton Vance fund. This commentary may contain statements that are not historical facts, referred to as “forward-looking statements.” The Fund’s actual future results may differ significantly from those stated in any forward-looking statement, depending on factors such as changes in securities or financial markets or general economic conditions, the volume of sales and purchases of Fund shares, the continuation of investment advisory, administrative and service contracts, and other risks discussed from time to time in the Fund’s filings with the Securities and Exchange Commission. |
| | |
| 1 | J.P. Morgan Government Bond Index: Emerging Markets (JPM GBI-EM) Global Diversified (Unhedged) is an unmanaged index of local-currency bonds with maturities of more than one year issued by emerging markets governments. Information has been obtained from sources believed to be reliable but J.P. Morgan does not warrant its completeness or accuracy. The Index is used with permission. The Index may not be copied, used, or distributed without J.P. Morgan’s prior written approval. Copyright 2021, J.P. Morgan Chase & Co. All rights reserved. Unless otherwise stated, index returns do not reflect the effect of any applicable sales charges, commissions, expenses, taxes or leverage, as applicable. It is not possible to invest directly in an index. |
| 2 | Total Returns at NAV do not include applicable sales charges. If sales charges were deducted, the returns would be lower. Total Returns shown with maximum sales charge reflect the stated maximum sales charge. Unless otherwise stated, performance does not reflect the deduction of taxes on Fund distributions or redemptions of Fund shares.Effective November 5, 2020, Class C shares automatically convert to Class A shares eight years after purchase. The average annual total returns listed for Class C reflect conversion to Class A shares after eight years. Prior to November 5, 2020, Class C shares automatically converted to Class A shares ten years after purchase. |
| 3 | Source: Fund prospectus. The expense ratios for the current reporting period can be found in the Financial Highlights section of this report. Performance reflects expenses waived and/or reimbursed, if applicable. Without such waivers and/or reimbursements, performance would have been lower. |
| | Fund profile subject to change due to active management. |
| | Additional Information |
| | Spread is the difference in yield between a U.S. Treasury bond and another debt security of the same maturity but different credit quality. |
Eaton Vance
Emerging Markets Local Income Fund
October 31, 2023
Example
As a Fund shareholder, you incur two types of costs: (1) transaction costs, including sales charges (loads) on purchases; and (2) ongoing costs, including management fees; distribution and/or service fees; and other Fund expenses. This Example is intended to help you understand your ongoing costs (in dollars) of Fund investing and to compare these costs with the ongoing costs of investing in other mutual funds. The Example is based on an investment of $1,000 invested at the beginning of the period and held for the entire period (May 1, 2023 to October 31, 2023).
Actual Expenses
The first section of the table below provides information about actual account values and actual expenses. You may use the information in this section, together with the amount you invested, to estimate the expenses that you paid over the period. Simply divide your account value by $1,000 (for example, an $8,600 account value divided by $1,000 = 8.6), then multiply the result by the number in the first section under the heading entitled “Expenses Paid During Period” to estimate the expenses you paid on your account during this period.
Hypothetical Example for Comparison Purposes
The second section of the table below provides information about hypothetical account values and hypothetical expenses based on the actual Fund expense ratio and an assumed rate of return of 5% per year (before expenses), which is not the actual Fund return. The hypothetical account values and expenses may not be used to estimate the actual ending account balance or expenses you paid for the period. You may use this information to compare the ongoing costs of investing in your Fund and other funds. To do so, compare this 5% hypothetical example with the 5% hypothetical examples that appear in the shareholder reports of the other funds.
Please note that the expenses shown in the table are meant to highlight your ongoing costs only and do not reflect any transactional costs, such as sales charges (loads). Therefore, the second section of the table is useful in comparing ongoing costs only, and will not help you determine the relative total costs of owning different funds. In addition, if these transactional costs were included, your costs would be higher.
| | Beginning
Account Value
(5/1/23) | Ending
Account Value
(10/31/23) | Expenses Paid
During Period*
(5/1/23 – 10/31/23) | Annualized
Expense
Ratio |
| Actual | | | | |
| Class A | $1,000.00 | $ 964.70 | $5.55 | 1.12% |
| Class C | $1,000.00 | $ 959.30 | $9.14 | 1.85% |
| Class I | $1,000.00 | $ 966.10 | $4.21 | 0.85% |
| |
| Hypothetical | | | | |
| (5% return per year before expenses) | | | | |
| Class A | $1,000.00 | $1,019.56 | $5.70 | 1.12% |
| Class C | $1,000.00 | $1,015.88 | $9.40 | 1.85% |
| Class I | $1,000.00 | $1,020.92 | $4.33 | 0.85% |
| * | Expenses are equal to the Fund's annualized expense ratio for the indicated Class, multiplied by the average account value over the period, multiplied by 184/365 (to reflect the one-half year period). The Example assumes that the $1,000 was invested at the net asset value per share determined at the close of business on April 30, 2023. The Example reflects the expenses of both the Fund and the Portfolio. |
Eaton Vance
Emerging Markets Local Income Fund
October 31, 2023
Statement of Assets and Liabilities
| | October 31, 2023 |
| Assets | |
| Investment in Emerging Markets Local Income Portfolio, at value (identified cost $1,091,234,745) | $ 953,299,643 |
| Receivable for Fund shares sold | 2,581,868 |
| Total assets | $ 955,881,511 |
| Liabilities | |
| Payable for Fund shares redeemed | $ 3,213,444 |
| Payable to affiliates: | |
| Distribution and service fees | 50,781 |
| Trustees' fees | 43 |
| Accrued expenses | 355,384 |
| Total liabilities | $ 3,619,652 |
| Net Assets | $ 952,261,859 |
| Sources of Net Assets | |
| Paid-in capital | $1,085,683,903 |
| Accumulated loss | (133,422,044) |
| Net Assets | $ 952,261,859 |
| Class A Shares | |
| Net Assets | $ 95,333,435 |
| Shares Outstanding | 29,085,894 |
Net Asset Value and Redemption Price Per Share
(net assets ÷ shares of beneficial interest outstanding) | $ 3.28 |
Maximum Offering Price Per Share
(100 ÷ 96.75 of net asset value per share) | $ 3.39 |
| Class C Shares | |
| Net Assets | $ 35,270,566 |
| Shares Outstanding | 10,642,364 |
Net Asset Value and Offering Price Per Share*
(net assets ÷ shares of beneficial interest outstanding) | $ 3.31 |
| Class I Shares | |
| Net Assets | $ 821,657,858 |
| Shares Outstanding | 250,780,298 |
Net Asset Value, Offering Price and Redemption Price Per Share
(net assets ÷ shares of beneficial interest outstanding) | $ 3.28 |
| On sales of $100,000 or more, the offering price of Class A shares is reduced. |
| * | Redemption price per share is equal to the net asset value less any applicable contingent deferred sales charge. |
7
See Notes to Financial Statements.
Eaton Vance
Emerging Markets Local Income Fund
October 31, 2023
| | Year Ended |
| | October 31, 2023 |
| Investment Income | |
| Dividend income allocated from Portfolio | $ 3,613,176 |
| Interest income allocated from Portfolio (net of foreign taxes withheld of $1,251,354) | 64,938,499 |
| Expenses allocated from Portfolio | (6,924,717) |
| Total investment income from Portfolio | $ 61,626,958 |
| Expenses | |
| Distribution and service fees: | |
| Class A | $ 295,911 |
| Class C | 375,385 |
| Trustees’ fees and expenses | 500 |
| Custodian fee | 59,752 |
| Transfer and dividend disbursing agent fees | 743,215 |
| Legal and accounting services | 52,208 |
| Printing and postage | 272,265 |
| Registration fees | 84,121 |
| Miscellaneous | 22,605 |
| Total expenses | $ 1,905,962 |
| Net investment income | $ 59,720,996 |
| Realized and Unrealized Gain (Loss) from Portfolio | |
| Net realized gain (loss): | |
| Investment transactions (net of foreign capital gains taxes of $124,405) | $ (90,493,260) |
| Written options | 13,532 |
| Securities sold short | 68,052 |
| Futures contracts | 376,209 |
| Swap contracts | (18,571,832) |
| Foreign currency transactions | 9,492,814 |
| Forward foreign currency exchange contracts | 38,196,896 |
| Non-deliverable bond forward contracts | 4,481,833 |
| Net realized loss | $ (56,435,756) |
| Change in unrealized appreciation (depreciation): | |
| Investments (including net increase in accrued foreign capital gains taxes of $80,454) | $ 111,755,324 |
| Written options | 66,429 |
| Securities sold short | 188,206 |
| Futures contracts | (72,120) |
| Swap contracts | 11,876,260 |
| Foreign currency | 873,869 |
| Forward foreign currency exchange contracts | (14,001,372) |
| Non-deliverable bond forward contracts | 1,009,273 |
| Net change in unrealized appreciation (depreciation) | $111,695,869 |
| Net realized and unrealized gain | $ 55,260,113 |
| Net increase in net assets from operations | $114,981,109 |
8
See Notes to Financial Statements.
Eaton Vance
Emerging Markets Local Income Fund
October 31, 2023
Statements of Changes in Net Assets
| | Year Ended October 31, |
| | 2023 | 2022 |
| Increase (Decrease) in Net Assets | | |
| From operations: | | |
| Net investment income | $ 59,720,996 | $ 67,348,981 |
| Net realized loss | (56,435,756) | (151,462,363) |
| Net change in unrealized appreciation (depreciation) | 111,695,869 | (164,327,604) |
| Net increase (decrease) in net assets from operations | $114,981,109 | $ (248,440,986) |
| Distributions to shareholders: | | |
| Class A | $ (9,847,402) | $ — |
| Class C | (3,317,933) | — |
| Class I | (79,078,812) | — |
| Total distributions to shareholders | $ (92,244,147) | $ — |
| Tax return of capital to shareholders: | | |
| Class A | $ (2,439,355) | $ (13,947,887) |
| Class C | (806,050) | (5,086,599) |
| Class I | (19,424,563) | (114,849,166) |
| Total tax return of capital to shareholders | $ (22,669,968) | $ (133,883,652) |
| Transactions in shares of beneficial interest: | | |
| Class A | $ 7,000,865 | $ (17,218,330) |
| Class C | 860,554 | (9,079,577) |
| Class I | 114,542,250 | (183,103,782) |
| Net increase (decrease) in net assets from Fund share transactions | $122,403,669 | $ (209,401,689) |
| Net increase (decrease) in net assets | $122,470,663 | $ (591,726,327) |
| Net Assets | | |
| At beginning of year | $ 829,791,196 | $1,421,517,523 |
| At end of year | $952,261,859 | $ 829,791,196 |
9
See Notes to Financial Statements.
Eaton Vance
Emerging Markets Local Income Fund
October 31, 2023
| | Class A |
| | Year Ended October 31, |
| | 2023 | 2022 | 2021 | 2020 | 2019 |
| Net asset value — Beginning of year | $ 3.220 | $ 4.590 | $ 5.030 | $ 5.760 | $ 5.190 |
| Income (Loss) From Operations | | | | | |
| Net investment income(1) | $ 0.211 | $ 0.234 | $ 0.228 | $ 0.286 | $ 0.363 |
| Net realized and unrealized gain (loss) | 0.262 | (1.125) | (0.168) | (0.293) | 0.759 |
| Total income (loss) from operations | $ 0.473 | $ (0.891) | $ 0.060 | $ (0.007) | $ 1.122 |
| Less Distributions | | | | | |
| From net investment income | $ (0.333) | $ — | $ (0.123) | $ (0.198) | $ (0.552) |
| Tax return of capital | (0.080) | (0.479) | (0.377) | (0.525) | — |
| Total distributions | $ (0.413) | $ (0.479) | $ (0.500) | $ (0.723) | $ (0.552) |
| Net asset value — End of year | $ 3.280 | $ 3.220 | $ 4.590 | $ 5.030 | $ 5.760 |
| Total Return(2) | 14.53% | (20.47)% | 1.06% | (0.31)% (3) | 22.64% (3) |
| Ratios/Supplemental Data | | | | | |
| Net assets, end of year (000’s omitted) | $95,333 | $87,883 | $145,043 | $129,954 | $152,308 |
| Ratios (as a percentage of average daily net assets):(4) | | | | | |
| Expenses | 1.13% (5) | 1.19% (5) | 1.16% | 1.20% (3) | 1.20% (3) |
| Net investment income | 6.00% | 5.99% | 4.53% | 5.40% | 6.57% |
| Portfolio Turnover of the Portfolio | 67% | 33% | 56% | 56% | 46% |
| (1) | Computed using average shares outstanding. |
| (2) | Returns are historical and are calculated by determining the percentage change in net asset value with all distributions reinvested and do not reflect the effect of sales charges. |
| (3) | The investment adviser reimbursed certain operating expenses (equal to 0.02% of average daily net assets for the years ended October 31, 2020 and 2019). Absent this reimbursement, total return would be lower. |
| (4) | Includes the Fund’s share of the Portfolio’s allocated expenses. |
| (5) | Includes a reduction by the investment adviser of a portion of the Portfolio's adviser fee due to the Portfolio’s investment in the Liquidity Fund (equal to 0.01% and less than 0.005% of average daily net assets for the years ended October 31, 2023 and 2022, respectively). |
10
See Notes to Financial Statements.
Eaton Vance
Emerging Markets Local Income Fund
October 31, 2023
Financial Highlights — continued
| | Class C |
| | Year Ended October 31, |
| | 2023 | 2022 | 2021 | 2020 | 2019 |
| Net asset value — Beginning of year | $ 3.260 | $ 4.650 | $ 5.080 | $ 5.820 | $ 5.240 |
| Income (Loss) From Operations | | | | | |
| Net investment income(1) | $ 0.188 | $ 0.209 | $ 0.194 | $ 0.250 | $ 0.328 |
| Net realized and unrealized gain (loss) | 0.254 | (1.142) | (0.154) | (0.298) | 0.770 |
| Total income (loss) from operations | $ 0.442 | $ (0.933) | $ 0.040 | $ (0.048) | $ 1.098 |
| Less Distributions | | | | | |
| From net investment income | $ (0.316) | $ — | $ (0.115) | $ (0.190) | $ (0.518) |
| Tax return of capital | (0.076) | (0.457) | (0.355) | (0.502) | — |
| Total distributions | $ (0.392) | $ (0.457) | $ (0.470) | $ (0.692) | $ (0.518) |
| Net asset value — End of year | $ 3.310 | $ 3.260 | $ 4.650 | $ 5.080 | $ 5.820 |
| Total Return(2) | 13.69% | (21.31)% | 0.46% | (0.90)% (3) | 21.87% (3) |
| Ratios/Supplemental Data | | | | | |
| Net assets, end of year (000’s omitted) | $35,271 | $33,976 | $58,639 | $59,169 | $62,869 |
| Ratios (as a percentage of average daily net assets):(4) | | | | | |
| Expenses | 1.85% (5) | 1.89% (5) | 1.86% | 1.90% (3) | 1.90% (3) |
| Net investment income | 5.29% | 5.28% | 3.82% | 4.68% | 5.88% |
| Portfolio Turnover of the Portfolio | 67% | 33% | 56% | 56% | 46% |
| (1) | Computed using average shares outstanding. |
| (2) | Returns are historical and are calculated by determining the percentage change in net asset value with all distributions reinvested and do not reflect the effect of sales charges. |
| (3) | The investment adviser reimbursed certain operating expenses (equal to 0.02% of average daily net assets for the years ended October 31, 2020 and 2019). Absent this reimbursement, total return would be lower. |
| (4) | Includes the Fund’s share of the Portfolio’s allocated expenses. |
| (5) | Includes a reduction by the investment adviser of a portion of the Portfolio's adviser fee due to the Portfolio’s investment in the Liquidity Fund (equal to 0.01% and less than 0.005% of average daily net assets for the years ended October 31, 2023 and 2022, respectively). |
11
See Notes to Financial Statements.
Eaton Vance
Emerging Markets Local Income Fund
October 31, 2023
Financial Highlights — continued
| | Class I |
| | Year Ended October 31, |
| | 2023 | 2022 | 2021 | 2020 | 2019 |
| Net asset value — Beginning of year | $ 3.220 | $ 4.590 | $ 5.020 | $ 5.760 | $ 5.190 |
| Income (Loss) From Operations | | | | | |
| Net investment income(1) | $ 0.221 | $ 0.246 | $ 0.243 | $ 0.301 | $ 0.381 |
| Net realized and unrealized gain (loss) | 0.262 | (1.126) | (0.158) | (0.302) | 0.757 |
| Total income (loss) from operations | $ 0.483 | $ (0.880) | $ 0.085 | $ (0.001) | $ 1.138 |
| Less Distributions | | | | | |
| From net investment income | $ (0.341) | $ — | $ (0.127) | $ (0.202) | $ (0.568) |
| Tax return of capital | (0.082) | (0.490) | (0.388) | (0.537) | — |
| Total distributions | $ (0.423) | $ (0.490) | $ (0.515) | $ (0.739) | $ (0.568) |
| Net asset value — End of year | $ 3.280 | $ 3.220 | $ 4.590 | $ 5.020 | $ 5.760 |
| Total Return(2) | 15.22% | (20.48)% | 1.36% | (0.01)% (3) | 23.00% (3) |
| Ratios/Supplemental Data | | | | | |
| Net assets, end of year (000’s omitted) | $821,658 | $707,932 | $1,217,836 | $983,273 | $938,608 |
| Ratios (as a percentage of average daily net assets):(4) | | | | | |
| Expenses | 0.85% (5) | 0.89% (5) | 0.86% | 0.90% (3) | 0.90% (3) |
| Net investment income | 6.28% | 6.28% | 4.86% | 5.68% | 6.90% |
| Portfolio Turnover of the Portfolio | 67% | 33% | 56% | 56% | 46% |
| (1) | Computed using average shares outstanding. |
| (2) | Returns are historical and are calculated by determining the percentage change in net asset value with all distributions reinvested. |
| (3) | The investment adviser reimbursed certain operating expenses (equal to 0.02% of average daily net assets for the years ended October 31, 2020 and 2019). Absent this reimbursement, total return would be lower. |
| (4) | Includes the Fund’s share of the Portfolio’s allocated expenses. |
| (5) | Includes a reduction by the investment adviser of a portion of the Portfolio's adviser fee due to the Portfolio’s investment in the Liquidity Fund (equal to 0.01% and less than 0.005% of average daily net assets for the years ended October 31, 2023 and 2022, respectively). |
12
See Notes to Financial Statements.
Eaton Vance
Emerging Markets Local Income Fund
October 31, 2023
Notes to Financial Statements
1 Significant Accounting Policies
Eaton Vance Emerging Markets Local Income Fund (the Fund) is a non-diversified series of Eaton Vance Mutual Funds Trust (the Trust). The Trust is a Massachusetts business trust registered under the Investment Company Act of 1940, as amended (the 1940 Act), as an open-end management investment company. The Fund offers three classes of shares. Class A shares are generally sold subject to a sales charge imposed at time of purchase. Class C shares are sold at net asset value and are generally subject to a contingent deferred sales charge (see Note 5). Effective November 5, 2020, Class C shares automatically convert to Class A shares eight years after their purchase as described in the Fund’s prospectus. Class I shares are sold at net asset value and are not subject to a sales charge. Each class represents a pro rata interest in the Fund, but votes separately on class-specific matters and (as noted below) is subject to different expenses. Realized and unrealized gains and losses and net investment income and losses, other than class-specific expenses, are allocated daily to each class of shares based on the relative net assets of each class to the total net assets of the Fund. Each class of shares differs in its distribution plan and certain other class-specific expenses. The Fund invests its assets in interests in Emerging Markets Local Income Portfolio (the Portfolio), a Massachusetts business trust, having the same investment objective and policies as the Fund. The value of the Fund’s investment in the Portfolio reflects the Fund’s proportionate interest in the net assets of the Portfolio (89.1% at October 31, 2023). The performance of the Fund is directly affected by the performance of the Portfolio. The financial statements of the Portfolio, including the portfolio of investments, are included elsewhere in this report and should be read in conjunction with the Fund’s financial statements.
The following is a summary of significant accounting policies of the Fund. The policies are in conformity with accounting principles generally accepted in the United States of America (U.S. GAAP). The Fund is an investment company and follows accounting and reporting guidance in the Financial Accounting Standards Board (FASB) Accounting Standards Codification Topic 946.
A Investment Valuation—Valuation of securities by the Portfolio is discussed in Note 1A of the Portfolio's Notes to Financial Statements, which are included elsewhere in this report.
B Income—The Fund's net investment income or loss consists of the Fund's pro rata share of the net investment income or loss of the Portfolio, less all actual and accrued expenses of the Fund.
C Federal and Other Taxes—The Fund’s policy is to comply with the provisions of the Internal Revenue Code applicable to regulated investment companies and to distribute to shareholders each year substantially all of its net investment income, and all or substantially all of its net realized capital gains. Accordingly, no provision for federal income or excise tax is necessary.
In addition to the requirements of the Internal Revenue Code, the Fund may also be required to recognize its pro rata share of the capital gains taxes incurred by the Portfolio. In doing so, the daily net asset value would reflect the Fund’s pro-rata share of the estimated reserve for such taxes incurred by the Portfolio.
As of October 31, 2023, the Fund had no uncertain tax positions that would require financial statement recognition, de-recognition, or disclosure. The Fund files a U.S. federal income tax return annually after its fiscal year-end, which is subject to examination by the Internal Revenue Service for a period of three years from the date of filing.
D Expenses—The majority of expenses of the Trust are directly identifiable to an individual fund. Expenses which are not readily identifiable to a specific fund are allocated taking into consideration, among other things, the nature and type of expense and the relative size of the funds.
E Use of Estimates—The preparation of the financial statements in conformity with U.S. GAAP requires management to make estimates and assumptions that affect the reported amounts of assets and liabilities at the date of the financial statements and the reported amounts of income and expense during the reporting period. Actual results could differ from those estimates.
F Indemnifications—Under the Trust’s organizational documents, its officers and Trustees may be indemnified against certain liabilities and expenses arising out of the performance of their duties to the Fund. Under Massachusetts law, if certain conditions prevail, shareholders of a Massachusetts business trust (such as the Trust) could be deemed to have personal liability for the obligations of the Trust. However, the Trust’s Declaration of Trust contains an express disclaimer of liability on the part of Fund shareholders and the By-laws provide that the Trust shall assume, upon request by the shareholder, the defense on behalf of any Fund shareholders. Moreover, the By-laws also provide for indemnification out of Fund property of any shareholder held personally liable solely by reason of being or having been a shareholder for all loss or expense arising from such liability. Additionally, in the normal course of business, the Fund enters into agreements with service providers that may contain indemnification clauses. The Fund's maximum exposure under these arrangements is unknown as this would involve future claims that may be made against the Fund that have not yet occurred.
G Other—Investment transactions are accounted for on a trade date basis.
Eaton Vance
Emerging Markets Local Income Fund
October 31, 2023
Notes to Financial Statements — continued
2 Distributions to Shareholders and Income Tax Information
The Fund expects to pay any required income distributions monthly and intends to distribute annually all or substantially all of its net realized capital gains. The Fund may include in its distributions amounts attributable to the imputed interest on foreign currency exposures and certain other derivative positions which, in certain circumstances, may result in a return of capital for federal income tax purposes. Distributions to shareholders are recorded on the ex-dividend date. Distributions are declared separately for each class of shares. Shareholders may reinvest income and capital gain distributions in additional shares of the same class of the Fund at the net asset value as of the ex-dividend date or, at the election of the shareholder, receive distributions in cash. Distributions to shareholders are determined in accordance with income tax regulations, which may differ from U.S. GAAP. As required by U.S. GAAP, only distributions in excess of tax basis earnings and profits are reported in the financial statements as a return of capital. Permanent differences between book and tax accounting relating to distributions are reclassified to paid-in capital. For tax purposes, distributions from short-term capital gains are considered to be from ordinary income.
The tax character of distributions declared for the years ended October 31, 2023 and October 31, 2022 was as follows:
| | Year Ended October 31, |
| | 2023 | 2022 |
| Ordinary income | $92,244,147 | $ — |
| Tax return of capital | $22,669,968 | $133,883,652 |
During the year ended October 31, 2023, accumulated loss was decreased by $1,169,686 and paid-in capital was decreased by $1,169,686 due to differences between book and tax accounting. These reclassifications had no effect on the net assets or net asset value per share of the Fund.
As of October 31, 2023, the components of distributable earnings (accumulated loss) on a tax basis were as follows:
| Deferred capital losses | $ (87,712,000) |
| Net unrealized depreciation | (45,710,044) |
| Accumulated loss | $(133,422,044) |
At October 31, 2023, the Fund, for federal income tax purposes, had deferred capital losses of $87,712,000 which would reduce its taxable income arising from future net realized gains on investment transactions, if any, to the extent permitted by the Internal Revenue Code, and thus would reduce the amount of distributions to shareholders, which would otherwise be necessary to relieve the Fund of any liability for federal income or excise tax. The deferred capital losses are treated as arising on the first day of the Fund’s next taxable year and retain the same short-term or long-term character as when originally deferred. Of the deferred capital losses at October 31, 2023, $49,301,701 are short-term and $38,410,299 are long-term.
3 Investment Adviser Fee and Other Transactions with Affiliates
The investment adviser fee is earned by Eaton Vance Management (EVM), an indirect, wholly-owned subsidiary of Morgan Stanley, as compensation for investment advisory services rendered to the Fund. The investment adviser fee is computed at an annual rate as a percentage of the Fund’s average daily net assets that are not invested in other investment companies for which EVM or its affiliates serve as investment adviser or administrator as follows and is payable monthly:
| Average Daily Net Assets | Annual Fee Rate |
| Up to $1 billion | 0.650% |
| $1 billion but less than $2 billion | 0.625% |
| $2 billion but less than $5 billion | 0.600% |
| $5 billion and over | 0.575% |
For the year ended October 31, 2023, the Fund incurred no investment adviser fee on such assets. To the extent the Fund’s assets are invested in the Portfolio, the Fund is allocated its share of the Portfolio’s investment adviser fee. The Portfolio has engaged Boston Management and Research (BMR) to render investment advisory services. See Note 2 of the Portfolio’s Notes to Financial Statements which are included elsewhere in this report. EVM also serves as the administrator of the Fund, but receives no compensation. EVM has agreed to reimburse the Fund’s expenses to the extent that total annual operating expenses (relating to ordinary operating expenses only and excluding such expenses as brokerage commissions, acquired fund fees of unaffiliated
Eaton Vance
Emerging Markets Local Income Fund
October 31, 2023
Notes to Financial Statements — continued
funds, borrowing costs, taxes or litigation expenses) exceed 1.15% (1.20% prior to July 1, 2023), 1.90% and 0.90% of the Fund’s average daily net assets for Class A, Class C and Class I, respectively. This agreement may be changed or terminated after February 29, 2024. Pursuant to this agreement, no operating expenses were allocated to EVM for the year ended October 31, 2023.
EVM provides sub-transfer agency and related services to the Fund pursuant to a Sub-Transfer Agency Support Services Agreement. For the year ended October 31, 2023, EVM earned $49,155 from the Fund pursuant to such agreement, which is included in transfer and dividend disbursing agent fees on the Statement of Operations. The Fund was informed that Eaton Vance Distributors, Inc. (EVD), an affiliate of EVM and the Fund's principal underwriter, received $40,703 as its portion of the sales charge on sales of Class A shares for the year ended October 31, 2023. The Fund was informed that Morgan Stanley affiliated broker-dealers, which may be deemed to be affiliates of EVM, BMR and EVD, also received a portion of the sales charge on sales of Class A shares for the year ended October 31, 2023 in the amount of $30,348. EVD also received distribution and service fees from Class A and Class C shares (see Note 4) and contingent deferred sales charges (see Note 5).
Trustees and officers of the Fund who are members of EVM’s or BMR's organizations receive remuneration for their services to the Fund out of the investment adviser fee. Certain officers and Trustees of the Fund and the Portfolio are officers of the above organizations.
4 Distribution Plans
The Fund has in effect a distribution plan for Class A shares (Class A Plan) pursuant to Rule 12b-1 under the 1940 Act. Pursuant to the Class A Plan, the Fund pays EVD a distribution and service fee of 0.25% (0.30% prior to July 1, 2023) per annum of its average daily net assets attributable to Class A shares for distribution services and facilities provided to the Fund by EVD, as well as for personal services and/or the maintenance of shareholder accounts. Distribution and service fees paid or accrued to EVD for the year ended October 31, 2023 amounted to $295,911 for Class A shares.
The Fund also has in effect a distribution plan for Class C shares (Class C Plan) pursuant to Rule 12b-1 under the 1940 Act. Pursuant to the Class C Plan, the Fund pays EVD amounts equal to 0.75% per annum of its average daily net assets attributable to Class C shares for providing ongoing distribution services and facilities to the Fund. For the year ended October 31, 2023, the Fund paid or accrued to EVD $281,539 for Class C shares.
Pursuant to the Class C Plan, the Fund also makes payments of service fees to EVD, financial intermediaries and other persons in amounts equal to 0.25% per annum of its average daily net assets attributable to that class. Service fees paid or accrued are for personal services and/or the maintenance of shareholder accounts. They are separate and distinct from the sales commissions and distribution fees payable to EVD. Service fees paid or accrued for the year ended October 31, 2023 amounted to $93,846 for Class C shares.
Distribution and service fees are subject to the limitations contained in the Financial Industry Regulatory Authority Rule 2341(d).
5 Contingent Deferred Sales Charges
A contingent deferred sales charge (CDSC) of 1% generally is imposed on redemptions of Class C shares made within 12 months of purchase. Class A shares may be subject to a 0.75% CDSC if redeemed within 12 months of purchase (depending on the circumstances of purchase). Generally, the CDSC is based upon the lower of the net asset value at date of redemption or date of purchase. No charge is levied on shares acquired by reinvestment of dividends or capital gain distributions. For the year ended October 31, 2023, the Fund was informed that EVD received $2,507 of CDSCs paid by Class C shareholders and no CDSCs paid by Class A shareholders.
6 Investment Transactions
For the year ended October 31, 2023, increases and decreases in the Fund's investment in the Portfolio aggregated $299,529,582 and $294,547,247, respectively.
Eaton Vance
Emerging Markets Local Income Fund
October 31, 2023
Notes to Financial Statements — continued
7 Shares of Beneficial Interest
The Fund’s Declaration of Trust permits the Trustees to issue an unlimited number of full and fractional shares of beneficial interest (without par value). Such shares may be issued in a number of different series (such as the Fund) and classes. Transactions in Fund shares, including direct exchanges pursuant to share class conversions, were as follows:
| | Year Ended
October 31, 2023 | | Year Ended
October 31, 2022 |
| | Shares | Amount | | Shares | Amount |
| Class A | | | | | |
| Sales | 12,408,000 | $ 44,242,529 | | 8,744,229 | $ 34,415,385 |
| Issued to shareholders electing to receive payments of distributions in Fund shares | 3,193,417 | 11,204,993 | | 3,336,364 | 12,695,340 |
| Redemptions | (13,805,396) | (48,446,657) | | (16,356,773) | (64,329,055) |
| Net increase (decrease) | 1,796,021 | $ 7,000,865 | | (4,276,180) | $ (17,218,330) |
| Class C | | | | | |
| Sales | 1,902,700 | $ 6,835,469 | | 1,633,628 | $ 6,788,155 |
| Issued to shareholders electing to receive payments of distributions in Fund shares | 1,121,803 | 3,976,048 | | 1,277,313 | 4,922,131 |
| Redemptions | (2,818,064) | (9,950,963) | | (5,096,503) | (20,789,863) |
| Net increase (decrease) | 206,439 | $ 860,554 | | (2,185,562) | $ (9,079,577) |
| Class I | | | | | |
| Sales | 152,980,912 | $ 543,646,223 | | 103,149,612 | $ 411,448,840 |
| Issued to shareholders electing to receive payments of distributions in Fund shares | 25,700,360 | 90,021,581 | | 27,991,737 | 106,732,653 |
| Redemptions | (147,868,299) | (519,125,554) | | (176,382,555) | (701,285,275) |
| Net increase (decrease) | 30,812,973 | $ 114,542,250 | | (45,241,206) | $(183,103,782) |
Eaton Vance
Emerging Markets Local Income Fund
October 31, 2023
Report of Independent Registered Public Accounting Firm
To the Trustees of Eaton Vance Mutual Funds Trust and Shareholders of Eaton Vance Emerging Markets Local Income Fund:
Opinion on the Financial Statements and Financial Highlights
We have audited the accompanying statement of assets and liabilities of Eaton Vance Emerging Markets Local Income Fund (the “Fund”) (one of the funds constituting Eaton Vance Mutual Funds Trust), as of October 31, 2023, the related statement of operations for the year then ended, the statements of changes in net assets for each of the two years in the period then ended, the financial highlights for each of the five years in the period then ended, and the related notes. In our opinion, the financial statements and financial highlights present fairly, in all material respects, the financial position of the Fund as of October 31, 2023, and the results of its operations for the year then ended, the changes in its net assets for each of the two years in the period then ended, and the financial highlights for each of the five years in the period then ended, in conformity with accounting principles generally accepted in the United States of America.
Basis for Opinion
These financial statements and financial highlights are the responsibility of the Fund's management. Our responsibility is to express an opinion on the Fund's financial statements and financial highlights based on our audits. We are a public accounting firm registered with the Public Company Accounting Oversight Board (United States) (PCAOB) and are required to be independent with respect to the Fund in accordance with the U.S. federal securities laws and the applicable rules and regulations of the Securities and Exchange Commission and the PCAOB.
We conducted our audits in accordance with the standards of the PCAOB. Those standards require that we plan and perform the audit to obtain reasonable assurance about whether the financial statements and financial highlights are free of material misstatement, whether due to error or fraud. The Fund is not required to have, nor were we engaged to perform, an audit of its internal control over financial reporting. As part of our audits, we are required to obtain an understanding of internal control over financial reporting but not for the purpose of expressing an opinion on the effectiveness of the Fund’s internal control over financial reporting. Accordingly, we express no such opinion.
Our audits included performing procedures to assess the risks of material misstatement of the financial statements and financial highlights, whether due to error or fraud, and performing procedures that respond to those risks. Such procedures included examining, on a test basis, evidence regarding the amounts and disclosures in the financial statements and financial highlights. Our audits also included evaluating the accounting principles used and significant estimates made by management, as well as evaluating the overall presentation of the financial statements and financial highlights. We believe that our audits provide a reasonable basis for our opinion.
/s/ Deloitte & Touche LLP
Boston, Massachusetts
December 22, 2023
We have served as the auditor of one or more Eaton Vance investment companies since 1959.
Eaton Vance
Emerging Markets Local Income Fund
October 31, 2023
Federal Tax Information (Unaudited)
The Form 1099-DIV you receive in February 2024 will show the tax status of all distributions paid to your account in calendar year 2023. Shareholders are advised to consult their own tax adviser with respect to the tax consequences of their investment in the Fund. As required by the Internal Revenue Code and/or regulations, shareholders must be notified regarding the status of the foreign tax credit and 163(j) interest dividends.
Foreign Tax Credit. For the fiscal year ended October 31, 2023, the Fund paid foreign taxes of $1,251,355 and recognized foreign source income of $69,803,029.
163(j) Interest Dividends. For the fiscal year ended October 31, 2023, the Fund designates 71.77% of distributions from net investment income as a 163(j) interest dividend.
Emerging Markets Local Income Portfolio
October 31, 2023
| Foreign Corporate Bonds — 2.4% |
| Security | Principal
Amount
(000's omitted) | Value |
| Brazil — 0.8% |
| Simpar Finance S.a.r.l., 10.75%, 2/12/28(1) | BRL | 53,195 | $ 8,441,775 |
| | | | $ 8,441,775 |
| Colombia — 0.3% |
| Patrimonio Autonomo Union del Sur, 6.66%, 2/28/41(2) | COP | 18,185,000 | $ 3,667,043 |
| | | | $ 3,667,043 |
| Mexico — 0.1% |
| Petroleos Mexicanos, 7.19%, 9/12/24(2) | MXN | 10,630 | $ 556,246 |
| | | | $ 556,246 |
| Peru — 1.0% |
| Alicorp SAA, 6.875%, 4/17/27(1) | PEN | 25,530 | $ 6,349,936 |
| Telefonica del Peru SAA, 7.375%, 4/10/27(2) | PEN | 24,500 | 4,771,684 |
| | | | $ 11,121,620 |
| Uzbekistan — 0.2% |
| International Finance Corp., 16.00%, 2/21/25 | UZS | 27,000,000 | $ 2,216,031 |
| | | | $ 2,216,031 |
Total Foreign Corporate Bonds
(identified cost $23,040,707) | | | $ 26,002,715 |
| Loan Participation Notes — 2.4% |
| Security | Principal
Amount
(000's omitted) | Value |
| Uzbekistan — 2.4% |
| Daryo Finance BV (borrower - Uzbek Industrial and Construction Bank ATB), 18.75%, 6/15/25(1)(3)(4) | UZS | 159,404,590 | $ 12,737,558 |
| Europe Asia Investment Finance BV (borrower - Joint Stock Commercial Bank "Asaka"), 18.70%, 7/21/26(1)(3)(4) | UZS | 168,226,770 | 12,819,584 |
Total Loan Participation Notes
(identified cost $28,312,513) | | | $ 25,557,142 |
| Sovereign Government Bonds — 74.3% |
| Security | Principal
Amount
(000's omitted) | Value |
| Armenia — 2.4% |
| Republic of Armenia Treasury Bond: | | | |
| 9.00%, 4/29/26 | AMD | 212,760 | $ 514,421 |
| 9.25%, 4/29/28 | AMD | 3,148,100 | 7,499,198 |
| 9.60%, 10/29/33 | AMD | 5,743,604 | 13,651,980 |
| 9.75%, 10/29/50 | AMD | 719,503 | 1,716,387 |
| 9.75%, 10/29/52 | AMD | 781,610 | 1,861,584 |
| | | | $ 25,243,570 |
| Azerbaijan — 0.3% |
| Republic of Azerbaijan, 4.75%, 3/18/24(1) | USD | 3,142 | $ 3,111,051 |
| | | | $ 3,111,051 |
| Bahrain — 0.2% |
| CBB International Sukuk Programme Co. WLL, 6.25%, 11/14/24(1) | USD | 2,624 | $ 2,600,762 |
| | | | $ 2,600,762 |
| Benin — 0.0%(5) |
| Benin Government International Bond, 5.75%, 3/26/26(1) | EUR | 316 | $ 326,853 |
| | | | $ 326,853 |
| Bosnia and Herzegovina — 0.1% |
| Republic of Srpska: | | | |
| 1.50%, 12/15/23 | BAM | 5 | $ 2,590 |
| 1.50%, 5/31/25 | BAM | 1,112 | 594,438 |
| 1.50%, 6/9/25 | BAM | 107 | 57,290 |
| 1.50%, 12/24/25 | BAM | 174 | 93,598 |
| 1.50%, 9/25/26 | BAM | 108 | 58,347 |
| 1.50%, 9/26/27 | BAM | 44 | 23,292 |
| | | | $ 829,555 |
| Brazil — 0.4% |
| Nota do Tesouro Nacional, 10.00%, 1/1/27 | BRL | 22,375 | $ 4,301,621 |
| | | | $ 4,301,621 |
| Chile — 0.5% |
| Bonos de la Tesoreria de la Republica en pesos, 5.30%, 11/1/37(1)(2) | CLP | 5,355,000 | $ 5,302,158 |
| | | | $ 5,302,158 |
19
See Notes to Financial Statements.
Emerging Markets Local Income Portfolio
October 31, 2023
Portfolio of Investments — continued
| Security | Principal
Amount
(000's omitted) | Value |
| Colombia — 0.1% |
| Titulos De Tesoreria B, 10.00%, 7/24/24 | COP | 3,528,300 | $ 856,560 |
| | | | $ 856,560 |
| Czech Republic — 3.3% |
| Czech Republic Government Bond: | | | |
| 0.95%, 5/15/30(1) | CZK | 140,000 | $ 4,828,461 |
| 2.00%, 10/13/33 | CZK | 308,750 | 10,546,940 |
| 2.50%, 8/25/28(1) | CZK | 509,740 | 20,113,594 |
| | | | $ 35,488,995 |
| Dominican Republic — 5.2% |
| Dominican Republic: | | | |
| 8.00%, 1/15/27(1) | DOP | 111,360 | $ 1,821,686 |
| 8.00%, 2/12/27(1) | DOP | 568,540 | 9,401,250 |
| 11.25%, 9/15/35(2) | DOP | 140,600 | 2,457,159 |
| 12.00%, 8/8/25(2) | DOP | 616,460 | 10,972,001 |
| 12.75%, 9/23/29(2) | DOP | 377,800 | 7,368,915 |
| 13.00%, 6/10/34(1) | DOP | 35,400 | 723,258 |
| 13.625%, 2/3/33(2) | DOP | 467,800 | 9,382,225 |
| Dominican Republic Central Bank Notes: | | | |
| 8.00%, 3/12/27(1) | DOP | 36,140 | 577,843 |
| 12.00%, 10/3/25(2) | DOP | 221,270 | 3,942,496 |
| 13.00%, 12/5/25(2) | DOP | 383,340 | 6,968,610 |
| 13.00%, 1/30/26(2) | DOP | 105,090 | 1,912,179 |
| | | | $ 55,527,622 |
| Hungary — 2.0% |
| Hungary Government Bond: | | | |
| 2.25%, 4/20/33 | HUF | 1,715,000 | $ 3,184,697 |
| 3.00%, 4/25/41 | HUF | 4,910,850 | 7,734,134 |
| 3.25%, 10/22/31 | HUF | 2,700,000 | 5,715,856 |
| 4.00%, 4/28/51 | HUF | 524,540 | 867,824 |
| 4.75%, 11/24/32 | HUF | 1,572,100 | 3,588,731 |
| | | | $ 21,091,242 |
| India — 3.3% |
| India Government Bond: | | | |
| 7.10%, 4/18/29 | INR | 2,259,990 | $ 26,804,727 |
| 7.26%, 2/6/33 | INR | 693,050 | 8,268,279 |
| | | | $ 35,073,006 |
| Indonesia — 7.4% |
| Indonesia Government Bond: | | | |
| 6.375%, 4/15/32 | IDR | 46,500,000 | $ 2,797,874 |
| Security | Principal
Amount
(000's omitted) | Value |
| Indonesia (continued) |
| Indonesia Government Bond: (continued) | | | |
| 6.50%, 2/15/31 | IDR | 335,135,000 | $ 20,301,987 |
| 7.00%, 2/15/33 | IDR | 27,742,000 | 1,733,050 |
| 7.125%, 6/15/38 | IDR | 37,641,000 | 2,359,831 |
| 7.125%, 6/15/42 | IDR | 60,101,000 | 3,757,514 |
| 7.125%, 6/15/43 | IDR | 162,709,000 | 10,215,636 |
| 7.375%, 5/15/48 | IDR | 16,622,000 | 1,066,539 |
| 7.50%, 5/15/38 | IDR | 232,589,000 | 15,000,782 |
| 7.50%, 4/15/40 | IDR | 45,427,000 | 2,926,374 |
| 8.25%, 6/15/32 | IDR | 11,609,000 | 776,915 |
| 8.25%, 5/15/36 | IDR | 242,576,000 | 16,454,090 |
| 8.375%, 4/15/39 | IDR | 22,764,000 | 1,573,346 |
| 9.50%, 5/15/41 | IDR | 5,702,000 | 442,071 |
| | | | $ 79,406,009 |
| Ivory Coast — 0.2% |
| Ivory Coast Government International Bond, 5.125%, 6/15/25(1) | EUR | 1,726 | $ 1,799,617 |
| | | | $ 1,799,617 |
| Jordan — 0.4% |
| Kingdom of Jordan, 4.95%, 7/7/25(1) | USD | 4,503 | $ 4,208,742 |
| | | | $ 4,208,742 |
| Malaysia — 5.8% |
| Malaysia Government Bond: | | | |
| 3.582%, 7/15/32 | MYR | 29,072 | $ 5,848,938 |
| 3.733%, 6/15/28 | MYR | 7,900 | 1,643,919 |
| 3.757%, 5/22/40 | MYR | 17,415 | 3,358,018 |
| 3.828%, 7/5/34 | MYR | 130,100 | 26,409,692 |
| 4.065%, 6/15/50 | MYR | 25,800 | 4,996,896 |
| 4.254%, 5/31/35 | MYR | 27,750 | 5,840,165 |
| 4.642%, 11/7/33 | MYR | 25,940 | 5,693,935 |
| 4.696%, 10/15/42 | MYR | 36,069 | 7,831,552 |
| | | | $ 61,623,115 |
| Mexico — 6.2% |
| Mexican Bonos: | | | |
| 7.50%, 6/3/27 | MXN | 148,017 | $ 7,520,818 |
| 7.75%, 5/29/31 | MXN | 149,400 | 7,224,218 |
| 7.75%, 11/13/42(6) | MXN | 361,250 | 16,009,693 |
| 8.00%, 7/31/53(6) | MXN | 120,800 | 5,390,270 |
| 8.50%, 5/31/29 | MXN | 178,520 | 9,209,692 |
| 8.50%, 11/18/38 | MXN | 410,469 | 19,890,964 |
20
See Notes to Financial Statements.
Emerging Markets Local Income Portfolio
October 31, 2023
Portfolio of Investments — continued
| Security | Principal
Amount
(000's omitted) | Value |
| Mexico (continued) |
| Mexican Bonos: (continued) | | | |
| 10.00%, 11/20/36 | MXN | 22,074 | $ 1,213,278 |
| | | | $ 66,458,933 |
| North Macedonia — 0.1% |
| North Macedonia Government International Bond: | | | |
| 2.75%, 1/18/25(1) | EUR | 913 | $ 928,283 |
| 3.675%, 6/3/26(1) | EUR | 600 | 597,194 |
| | | | $ 1,525,477 |
| Oman — 0.3% |
| Oman Government International Bond, 4.875%, 2/1/25(1) | USD | 3,173 | $ 3,114,696 |
| | | | $ 3,114,696 |
| Panama — 0.0%(5) |
| Panama Bonos del Tesoro, 6.375%, 7/25/33(1)(2) | USD | 395 | $ 361,145 |
| | | | $ 361,145 |
| Paraguay — 0.2% |
| Republic of Paraguay, 5.00%, 4/15/26(1) | USD | 2,174 | $ 2,119,085 |
| | | | $ 2,119,085 |
| Peru — 4.7% |
| Peru Government Bond: | | | |
| 5.40%, 8/12/34 | PEN | 7,309 | $ 1,589,512 |
| 5.94%, 2/12/29 | PEN | 100,914 | 25,188,408 |
| 6.15%, 8/12/32 | PEN | 15,223 | 3,625,042 |
| 6.35%, 8/12/28 | PEN | 8,808 | 2,261,537 |
| 6.85%, 2/12/42 | PEN | 19,284 | 4,597,275 |
| 6.90%, 8/12/37 | PEN | 8,763 | 2,121,034 |
| 6.95%, 8/12/31 | PEN | 3,863 | 980,754 |
| 7.30%, 8/12/33(1)(2) | PEN | 40,795 | 10,412,163 |
| | | | $ 50,775,725 |
| Romania — 5.0% |
| Romania Government International Bond: | | | |
| 2.75%, 2/26/26(1) | EUR | 2,755 | $ 2,794,674 |
| 3.624%, 5/26/30(1) | EUR | 2,755 | 2,524,290 |
| Romanian Government Bond: | | | |
| 2.50%, 10/25/27 | RON | 70,650 | 13,013,678 |
| 3.25%, 6/24/26 | RON | 57,650 | 11,437,786 |
| 4.15%, 1/26/28 | RON | 48,045 | 9,368,411 |
| 4.25%, 4/28/36 | RON | 20,630 | 3,384,732 |
| Security | Principal
Amount
(000's omitted) | Value |
| Romania (continued) |
| Romanian Government Bond: (continued) | | | |
| 4.85%, 4/22/26 | RON | 32,030 | $ 6,604,830 |
| 5.80%, 7/26/27 | RON | 16,020 | 3,325,502 |
| 8.75%, 10/30/28 | RON | 6,025 | 1,389,715 |
| | | | $ 53,843,618 |
| Serbia — 2.2% |
| Serbia Treasury Bond: | | | |
| 4.50%, 8/20/32 | RSD | 2,566,470 | $ 20,416,230 |
| 5.875%, 2/8/28 | RSD | 296,460 | 2,739,407 |
| | | | $ 23,155,637 |
| Seychelles — 0.0%(5) |
| Republic of Seychelles, 8.00%, 1/1/26(1) | USD | 491 | $ 496,040 |
| | | | $ 496,040 |
| South Africa — 14.2% |
| Republic of South Africa: | | | |
| 8.00%, 1/31/30 | ZAR | 361,300 | $ 17,063,731 |
| 8.25%, 3/31/32 | ZAR | 181,004 | 7,987,499 |
| 8.50%, 1/31/37 | ZAR | 369,200 | 14,677,922 |
| 8.75%, 1/31/44 | ZAR | 284,087 | 10,747,672 |
| 8.75%, 2/28/48 | ZAR | 69,430 | 2,611,425 |
| 9.00%, 1/31/40 | ZAR | 334,480 | 13,343,307 |
| 10.50%, 12/21/26 | ZAR | 831,768 | 46,036,766 |
| 10.50%, 12/21/26 | ZAR | 710,195 | 39,307,909 |
| | | | $151,776,231 |
| Suriname — 0.9% |
| Republic of Suriname: | | | |
| 9.25%, 10/26/26(1)(7) | USD | 8,268 | $ 7,544,550 |
| 12.875%, 12/30/23(1)(7) | USD | 1,698 | 1,555,368 |
| 12.875%, 12/30/23(2)(7) | USD | 1,055 | 966,380 |
| | | | $ 10,066,298 |
| Thailand — 4.5% |
| Thailand Government Bond: | | | |
| 1.585%, 12/17/35 | THB | 378,694 | $ 8,669,452 |
| 1.60%, 12/17/29 | THB | 200,000 | 5,140,018 |
| 3.30%, 6/17/38 | THB | 594,751 | 15,976,260 |
| 3.40%, 6/17/36 | THB | 205,000 | 5,645,362 |
| 3.65%, 6/20/31 | THB | 264,884 | 7,627,451 |
| 4.875%, 6/22/29 | THB | 183,489 | 5,614,269 |
| | | | $ 48,672,812 |
21
See Notes to Financial Statements.
Emerging Markets Local Income Portfolio
October 31, 2023
Portfolio of Investments — continued
| Security | Principal
Amount
(000's omitted) | Value |
| Ukraine — 0.5% |
| Ukraine Government Bond: | | | |
| 10.95%, 11/1/23 | UAH | 31,964 | $ 835,799 |
| 11.67%, 11/22/23 | UAH | 17,516 | 409,187 |
| 15.84%, 2/26/25 | UAH | 187,405 | 4,054,555 |
| | | | $ 5,299,541 |
| United Arab Emirates — 0.3% |
| Sharjah Sukuk, Ltd., 3.764%, 9/17/24(1) | USD | 2,747 | $ 2,685,341 |
| | | | $ 2,685,341 |
| Uruguay — 1.5% |
| Uruguay Government Bond: | | | |
| 3.875%, 7/2/40(8) | UYU | 259,753 | $ 6,595,380 |
| 9.75%, 7/20/33 | UYU | 323,861 | 8,076,428 |
| Uruguay Monetary Regulation Bill, 0.00%, 7/3/24 | UYU | 38,225 | 897,640 |
| | | | $ 15,569,448 |
| Uzbekistan — 1.3% |
| Republic of Uzbekistan: | | | |
| 4.75%, 2/20/24(1) | USD | 3,100 | $ 3,080,141 |
| 14.00%, 7/19/24(1) | UZS | 10,590,000 | 864,780 |
| 16.25%, 10/12/26(1) | UZS | 117,030,000 | 9,613,182 |
| | | | $ 13,558,103 |
| Vietnam — 0.3% |
| Vietnam Government International Bond, 4.80%, 11/19/24(1) | USD | 3,124 | $ 3,069,174 |
| | | | $ 3,069,174 |
| Zambia — 0.5% |
| Zambia Government Bond: | | | |
| 11.00%, 1/25/26 | ZMW | 100,560 | $ 3,983,076 |
| 11.00%, 6/28/26 | ZMW | 4,262 | 160,508 |
| 11.00%, 12/27/26 | ZMW | 21,670 | 769,794 |
| 12.00%, 6/28/28 | ZMW | 14,500 | 470,466 |
| 12.00%, 8/30/28 | ZMW | 1,500 | 47,984 |
| 12.00%, 11/29/28 | ZMW | 4,500 | 141,229 |
| 13.00%, 1/25/31 | ZMW | 7,100 | 199,993 |
| | | | $ 5,773,050 |
Total Sovereign Government Bonds
(identified cost $918,487,957) | | | $795,110,832 |
| Short-Term Investments — 15.8% |
| Security | Shares | Value |
| Morgan Stanley Institutional Liquidity Funds - Government Portfolio, Institutional Class, 5.25%(9) | | 97,178,009 | $ 97,178,009 |
Total Affiliated Fund
(identified cost $97,178,009) | | | $ 97,178,009 |
| Repurchase Agreements — 0.8% |
| Description | Principal
Amount
(000's omitted) | Value |
| Barclays Bank PLC: | | | |
| Dated 9/29/23 with an interest rate of 5.15%, collateralized by MXN 71,042,171 Mexican Udibonos, 4.00%, due 11/3/50 and a market value, including accrued interest, of $3,444,949(10) | USD | 3,566 | $ 3,566,423 |
| Dated 10/16/23 with an interest rate of 5.15%, collateralized by MXN 91,904,389 Mexican Udibonos, 4.00%, due 11/15/40 and a market value, including accrued interest, of $4,595,894(10) | USD | 4,685 | 4,684,754 |
Total Repurchase Agreements
(identified cost $8,251,177) | | | $ 8,251,177 |
| Sovereign Government Securities — 3.1% |
| Security | Principal
Amount
(000's omitted) | Value |
| Brazil — 2.3% |
| Letra do Tesouro Nacional, 0.00%, 1/1/24 | BRL | 130,000 | $ 25,307,594 |
| | | | $ 25,307,594 |
| Sri Lanka — 0.8% |
| Sri Lanka Treasury Bills: | | | |
| 0.00%, 11/17/23 | LKR | 639,000 | $ 1,938,744 |
| 0.00%, 11/24/23 | LKR | 97,000 | 293,450 |
| 0.00%, 12/8/23 | LKR | 101,000 | 303,758 |
| 0.00%, 1/5/24 | LKR | 70,000 | 207,977 |
| 0.00%, 1/12/24 | LKR | 1,847,000 | 5,470,501 |
| | | | $ 8,214,430 |
Total Sovereign Government Securities
(identified cost $34,642,396) | | | $ 33,522,024 |
22
See Notes to Financial Statements.
Emerging Markets Local Income Portfolio
October 31, 2023
Portfolio of Investments — continued
| U.S. Treasury Obligations — 2.8% |
| Security | Principal
Amount
(000's omitted) | Value |
| U.S. Treasury Bills: | | | |
| 0.00%, 11/30/23(11) | $ | 20,000 | $ 19,914,869 |
| 0.00%, 1/9/24 | | 10,000 | 9,898,848 |
Total U.S. Treasury Obligations
(identified cost $29,813,076) | | | $ 29,813,717 |
Total Short-Term Investments
(identified cost $169,884,658) | | | $168,764,927 |
| | | |
Total Purchased Options — 0.0%(5)
(identified cost $505,336) | | | $ 412,361 |
Total Investments — 94.9%
(identified cost $1,140,231,171) | | | $1,015,847,977 |
Total Written Options — (0.0)%(5)
(premiums received $180,858) | | | $ (108,317) |
| Securities Sold Short — (0.7)% |
| Sovereign Government Bonds — (0.7)% |
| Security | Principal
Amount
(000's omitted) | Value |
| Mexico — (0.7)% |
| Mexican Udibonos: | | | |
| 4.00%, 11/15/40(8) | MXN | (91,904) | $ (4,514,899) |
| 4.00%, 11/3/50(8) | MXN | (71,042) | (3,382,340) |
Total Sovereign Government Bonds
(proceeds $8,108,487) | | | $ (7,897,239) |
Total Securities Sold Short
(proceeds $8,108,487) | | | $ (7,897,239) |
| | | Value |
| Other Assets, Less Liabilities — 5.8% | | | $ 62,171,742 |
| Net Assets — 100.0% | | | $1,070,014,163 |
| The percentage shown for each investment category in the Portfolio of Investments is based on net assets. |
| (1) | Security exempt from registration under Regulation S of the Securities Act of 1933, as amended, which exempts from registration securities offered and sold outside the United States. Security may not be offered or sold in the United States except pursuant to an exemption from, or in a transaction not subject to, the registration requirements of the Securities Act of 1933, as amended. At October 31, 2023, the aggregate value of these securities is $146,924,234 or 13.7% of the Portfolio's net assets. |
| (2) | Security exempt from registration under Rule 144A of the Securities Act of 1933, as amended. These securities may be sold in certain transactions in reliance on an exemption from registration (normally to qualified institutional buyers). At October 31, 2023, the aggregate value of these securities is $69,040,404 or 6.5% of the Portfolio's net assets. |
| (3) | For fair value measurement disclosure purposes, security is categorized as Level 3 (see Note 9). |
| (4) | Limited recourse note whose payments by the issuer are limited to amounts received by the issuer from the borrower pursuant to a loan agreement with the borrower. |
| (5) | Amount is less than 0.05% or (0.05)%, as applicable. |
| (6) | Security (or a portion thereof) has been pledged for the benefit of the counterparty for reverse repurchase agreements. |
| (7) | Issuer is in default with respect to interest and/or principal payments. For a variable rate security, interest rate has been adjusted to reflect non-accrual status. |
| (8) | Inflation-linked security whose principal is adjusted for inflation based on changes in a designated inflation index or inflation rate for the applicable country. Interest is calculated based on the inflation-adjusted principal. |
| (9) | May be deemed to be an affiliated investment company. The rate shown is the annualized seven-day yield as of October 31, 2023. |
| (10) | Open repurchase agreement with no specific maturity date. Either party may terminate the agreement upon demand. |
| (11) | Security (or a portion thereof) has been pledged to cover collateral requirements on open derivative contracts. |
| Purchased Currency Options (OTC) — 0.0%(1) |
| Description | Counterparty | Notional Amount | Exercise
Price | Expiration
Date | Value |
| Call USD vs. Put CNH | Barclays Bank PLC | USD | 25,800,000 | CNH | 7.30 | 1/18/24 | $224,924 |
| Call USD vs. Put CNH | Goldman Sachs International | USD | 21,500,000 | CNH | 7.30 | 1/18/24 | 187,437 |
| Total | | | | | | | $412,361 |
| (1) | Amount is less than 0.05%. |
23
See Notes to Financial Statements.
Emerging Markets Local Income Portfolio
October 31, 2023
Portfolio of Investments — continued
| Written Currency Options (OTC) — (0.0)%(1) |
| Description | Counterparty | Notional Amount | Exercise
Price | Expiration
Date | Value |
| Call USD vs. Put CNH | Barclays Bank PLC | USD | 25,800,000 | CNH | 7.50 | 1/18/24 | $ (59,082) |
| Call USD vs. Put CNH | Goldman Sachs International | USD | 21,500,000 | CNH | 7.50 | 1/18/24 | (49,235) |
| Total | | | | | | | $(108,317) |
| (1) | Amount is less than (0.05)%. |
| Forward Foreign Currency Exchange Contracts (Centrally Cleared) |
| Currency Purchased | Currency Sold | Settlement
Date | Value/Unrealized
Appreciation
(Depreciation) |
| BRL | 134,571,000 | USD | 26,984,343 | 11/3/23 | $ (293,016) |
| BRL | 140,344,000 | USD | 28,136,327 | 11/3/23 | (299,961) |
| USD | 29,186,251 | BRL | 146,048,000 | 11/3/23 | 218,531 |
| USD | 25,686,067 | BRL | 128,867,000 | 11/3/23 | 126,093 |
| BRL | 511,000 | USD | 101,916 | 12/4/23 | (945) |
| BRL | 7,016,000 | USD | 1,399,960 | 12/4/23 | (13,632) |
| BRL | 15,300,000 | USD | 3,059,523 | 12/4/23 | (36,315) |
| BRL | 114,634,018 | USD | 23,221,719 | 12/4/23 | (570,580) |
| BRL | 166,539,000 | USD | 33,745,137 | 12/4/23 | (837,819) |
| USD | 10,775,855 | BRL | 53,195,005 | 12/4/23 | 264,773 |
| USD | 4,589,695 | BRL | 22,800,000 | 12/4/23 | 84,523 |
| USD | 1,262,069 | BRL | 6,400,000 | 12/4/23 | (2,541) |
| USD | 2,825,551 | BRL | 14,387,000 | 12/4/23 | (17,252) |
| USD | 2,532,453 | BRL | 13,100,000 | 12/4/23 | (56,045) |
| CLP | 24,220,766,480 | USD | 26,934,408 | 12/20/23 | 51,636 |
| CLP | 388,498,000 | USD | 433,471 | 12/20/23 | (618) |
| CLP | 388,498,000 | USD | 433,722 | 12/20/23 | (870) |
| CLP | 776,996,000 | USD | 866,699 | 12/20/23 | (994) |
| CLP | 388,498,000 | USD | 433,955 | 12/20/23 | (1,102) |
| CLP | 388,498,000 | USD | 433,955 | 12/20/23 | (1,102) |
| CLP | 388,498,000 | USD | 434,805 | 12/20/23 | (1,952) |
| COP | 11,180,000,000 | USD | 2,674,533 | 12/20/23 | 12,847 |
| COP | 246,540,445,850 | USD | 59,585,663 | 12/20/23 | (323,785) |
| EUR | 10,518,605 | USD | 11,263,533 | 12/20/23 | (108,987) |
| EUR | 204,326,386 | USD | 218,796,781 | 12/20/23 | (2,117,097) |
| IDR | 5,348,958,600 | USD | 340,184 | 12/20/23 | (4,652) |
| IDR | 51,781,800,000 | USD | 3,370,443 | 12/20/23 | (122,247) |
| IDR | 67,024,020,864 | USD | 4,362,776 | 12/20/23 | (158,459) |
| IDR | 1,211,703,462,139 | USD | 77,062,235 | 12/20/23 | (1,053,870) |
| KRW | 2,077,000,000 | USD | 1,566,767 | 12/20/23 | (27,494) |
| KRW | 2,524,400,000 | USD | 1,904,992 | 12/20/23 | (34,149) |
| KRW | 20,895,000,000 | USD | 15,761,960 | 12/20/23 | (276,596) |
| KRW | 25,386,400,000 | USD | 19,157,378 | 12/20/23 | (343,420) |
24
See Notes to Financial Statements.
Emerging Markets Local Income Portfolio
October 31, 2023
Portfolio of Investments — continued
| Forward Foreign Currency Exchange Contracts (Centrally Cleared) (continued) |
| Currency Purchased | Currency Sold | Settlement
Date | Value/Unrealized
Appreciation
(Depreciation) |
| PEN | 31,080,000 | USD | 8,002,678 | 12/20/23 | $ 72,371 |
| PEN | 22,000,000 | USD | 5,668,642 | 12/20/23 | 47,287 |
| PEN | 4,400,000 | USD | 1,134,708 | 12/20/23 | 8,478 |
| PEN | 12,722,200 | USD | 3,313,677 | 12/20/23 | (8,259) |
| PEN | 14,000,000 | USD | 3,665,401 | 12/20/23 | (27,992) |
| PEN | 46,088,218 | USD | 12,390,638 | 12/20/23 | (416,231) |
| USD | 9,114,867 | CLP | 8,196,543,685 | 12/20/23 | (17,474) |
| USD | 2,399,352 | CLP | 2,193,200,000 | 12/20/23 | (44,245) |
| USD | 4,418,767 | COP | 18,283,000,000 | 12/20/23 | 24,011 |
| USD | 2,706,205 | COP | 11,197,140,625 | 12/20/23 | 14,705 |
| USD | 312,575 | COP | 1,293,302,166 | 12/20/23 | 1,699 |
| USD | 8,845,257 | COP | 36,884,900,000 | 12/20/23 | (20,908) |
| USD | 48,488,062 | EUR | 45,281,244 | 12/20/23 | 469,175 |
| USD | 47,762,895 | EUR | 44,604,037 | 12/20/23 | 462,158 |
| USD | 37,382,736 | EUR | 34,910,383 | 12/20/23 | 361,719 |
| USD | 21,652,581 | EUR | 20,220,561 | 12/20/23 | 209,512 |
| USD | 7,086,873 | EUR | 6,618,174 | 12/20/23 | 68,573 |
| USD | 5,893,758 | EUR | 5,503,967 | 12/20/23 | 57,029 |
| USD | 1,930,776 | EUR | 1,803,082 | 12/20/23 | 18,682 |
| USD | 1,229,668 | EUR | 1,148,342 | 12/20/23 | 11,898 |
| USD | 753,189 | EUR | 703,376 | 12/20/23 | 7,288 |
| USD | 10,682,290 | IDR | 164,331,000,000 | 12/20/23 | 374,049 |
| USD | 18,370,028 | IDR | 288,844,814,013 | 12/20/23 | 251,221 |
| USD | 6,889,305 | IDR | 105,840,397,540 | 12/20/23 | 250,094 |
| USD | 5,339,550 | IDR | 82,165,000,000 | 12/20/23 | 185,461 |
| USD | 5,339,268 | IDR | 82,166,000,000 | 12/20/23 | 185,117 |
| USD | 9,764,321 | IDR | 153,531,259,462 | 12/20/23 | 133,533 |
| USD | 2,811,839 | IDR | 43,339,611,579 | 12/20/23 | 93,210 |
| USD | 2,653,144 | IDR | 40,862,100,000 | 12/20/23 | 89,925 |
| USD | 2,253,655 | IDR | 34,946,300,000 | 12/20/23 | 61,525 |
| USD | 825,172 | INR | 68,540,000 | 12/20/23 | 3,297 |
| USD | 1,508,621 | INR | 126,000,000 | 12/20/23 | (2,267) |
| USD | 2,525,736 | INR | 211,000,000 | 12/20/23 | (4,402) |
| USD | 3,787,294 | INR | 316,400,000 | 12/20/23 | (6,714) |
| USD | 5,052,682 | INR | 422,000,000 | 12/20/23 | (7,594) |
| USD | 6,500,658 | INR | 543,000,000 | 12/20/23 | (10,550) |
| USD | 794,407 | KRW | 1,050,000,000 | 12/20/23 | 16,248 |
| USD | 2,459,266 | KRW | 3,316,000,000 | 12/20/23 | 1,765 |
| USD | 22,085,840 | PEN | 82,230,000 | 12/20/23 | 721,257 |
| USD | 13,001,207 | PEN | 48,475,000 | 12/20/23 | 406,678 |
| USD | 6,381,339 | PEN | 23,759,000 | 12/20/23 | 208,395 |
| USD | 3,756,470 | PEN | 14,006,000 | 12/20/23 | 117,502 |
| USD | 2,348,701 | PEN | 8,736,229 | 12/20/23 | 78,898 |
| USD | 5,733,735 | PEN | 21,900,000 | 12/20/23 | 43,788 |
25
See Notes to Financial Statements.
Emerging Markets Local Income Portfolio
October 31, 2023
Portfolio of Investments — continued
| Forward Foreign Currency Exchange Contracts (Centrally Cleared) (continued) |
| Currency Purchased | Currency Sold | Settlement
Date | Value/Unrealized
Appreciation
(Depreciation) |
| USD | 678,765 | PEN | 2,524,734 | 12/20/23 | $ 22,801 |
| USD | 610,228 | PEN | 2,272,000 | 12/20/23 | 19,928 |
| USD | 2,127,670 | PEN | 8,142,000 | 12/20/23 | 12,257 |
| USD | 2,067,635 | PEN | 7,930,000 | 12/20/23 | 7,302 |
| USD | 176,193 | PEN | 656,000 | 12/20/23 | 5,754 |
| USD | 5,596,151 | PEN | 21,520,000 | 12/20/23 | 4,934 |
| USD | 2,022,633 | PEN | 7,775,000 | 12/20/23 | 2,571 |
| USD | 16,204 | PEN | 62,690 | 12/20/23 | (84) |
| USD | 3,264,948 | PEN | 12,659,510 | 12/20/23 | (24,182) |
| BRL | 128,867,000 | USD | 25,508,621 | 1/3/24 | (125,111) |
| BRL | 146,048,000 | USD | 28,984,104 | 1/3/24 | (216,376) |
| | | | | | $ (1,747,391) |
| Forward Foreign Currency Exchange Contracts (OTC) |
| Currency Purchased | Currency Sold | Counterparty | Settlement
Date | Unrealized
Appreciation | Unrealized
(Depreciation) |
| EUR | 8,931,620 | USD | 9,461,033 | Goldman Sachs International | 11/3/23 | $ — | $ (10,111) |
| EUR | 2,865,394 | USD | 3,030,660 | Standard Chartered Bank | 11/3/23 | 1,334 | — |
| EUR | 2,768,618 | USD | 2,930,352 | Standard Chartered Bank | 11/3/23 | — | (761) |
| EUR | 6,780,736 | USD | 7,145,621 | UBS AG | 11/3/23 | 29,361 | — |
| USD | 219,729 | UZS | 2,692,778,443 | JPMorgan Chase Bank, N.A. | 11/6/23 | 145 | — |
| UZS | 2,692,778,443 | USD | 216,810 | JPMorgan Chase Bank, N.A. | 11/7/23 | 2,155 | — |
| ILS | 15,206,967 | USD | 4,015,781 | Goldman Sachs International | 11/13/23 | — | (252,017) |
| USD | 3,862,970 | ILS | 15,206,967 | Citibank, N.A. | 11/13/23 | 99,206 | — |
| USD | 5,245,855 | PEN | 20,107,000 | Standard Chartered Bank | 11/13/23 | 14,119 | — |
| MYR | 15,000,000 | USD | 3,252,456 | Barclays Bank PLC | 11/15/23 | — | (101,673) |
| MYR | 48,967,000 | USD | 10,845,404 | Goldman Sachs International | 11/15/23 | — | (559,779) |
| MYR | 97,050,000 | USD | 20,970,182 | State Street Bank and Trust Company | 11/15/23 | — | (584,618) |
| USD | 8,630,565 | MYR | 38,967,000 | Goldman Sachs International | 11/15/23 | 445,462 | — |
| ILS | 34,199,026 | USD | 9,047,361 | HSBC Bank USA, N.A. | 11/24/23 | — | (579,103) |
| USD | 5,222,891 | ILS | 20,560,434 | Standard Chartered Bank | 11/24/23 | 131,780 | — |
| USD | 3,454,645 | ILS | 13,638,592 | UBS AG | 11/24/23 | 77,498 | — |
| UZS | 11,828,431,118 | USD | 1,004,111 | ICBC Standard Bank plc | 11/27/23 | — | (39,536) |
| ILS | 30,166,667 | USD | 8,024,095 | BNP Paribas | 11/28/23 | — | (553,063) |
| USD | 2,797,463 | ILS | 11,035,552 | Citibank, N.A. | 11/28/23 | 64,414 | — |
| USD | 4,853,519 | ILS | 19,131,115 | JPMorgan Chase Bank, N.A. | 11/28/23 | 115,535 | — |
| TRY | 49,720,000 | USD | 1,726,972 | Standard Chartered Bank | 12/8/23 | — | (20,724) |
| TRY | 182,048,945 | USD | 6,345,431 | Standard Chartered Bank | 12/8/23 | — | (98,031) |
| UZS | 25,102,783,000 | USD | 2,008,223 | ICBC Standard Bank plc | 12/18/23 | — | (32,931) |
| CNH | 20,000,000 | USD | 2,746,502 | JPMorgan Chase Bank, N.A. | 12/20/23 | — | (13,349) |
| CNH | 427,813,617 | USD | 58,749,547 | JPMorgan Chase Bank, N.A. | 12/20/23 | — | (285,538) |
| CNH | 661,171,267 | USD | 90,795,410 | JPMorgan Chase Bank, N.A. | 12/20/23 | — | (441,289) |
26
See Notes to Financial Statements.
Emerging Markets Local Income Portfolio
October 31, 2023
Portfolio of Investments — continued
| Forward Foreign Currency Exchange Contracts (OTC) (continued) |
| Currency Purchased | Currency Sold | Counterparty | Settlement
Date | Unrealized
Appreciation | Unrealized
(Depreciation) |
| CZK | 178,846,941 | EUR | 7,262,734 | Goldman Sachs International | 12/20/23 | $ — | $ (7,464) |
| CZK | 921,722,851 | EUR | 37,484,865 | Goldman Sachs International | 12/20/23 | — | (96,727) |
| CZK | 33,300,000 | EUR | 1,353,204 | JPMorgan Chase Bank, N.A. | 12/20/23 | — | (2,382) |
| CZK | 22,100,000 | EUR | 907,178 | UBS AG | 12/20/23 | — | (11,237) |
| CZK | 178,846,940 | EUR | 7,269,988 | UBS AG | 12/20/23 | — | (15,157) |
| CZK | 883,194,768 | EUR | 35,890,555 | UBS AG | 12/20/23 | — | (63,584) |
| EUR | 1,595,349 | CZK | 39,522,565 | Bank of America, N.A. | 12/20/23 | — | (8,540) |
| EUR | 3,475,011 | CZK | 85,500,000 | Barclays Bank PLC | 12/20/23 | 6,719 | — |
| EUR | 627,566 | CZK | 15,542,447 | Citibank, N.A. | 12/20/23 | — | (3,160) |
| EUR | 3,988,955 | CZK | 98,806,413 | Citibank, N.A. | 12/20/23 | — | (20,734) |
| EUR | 16,809,818 | CZK | 413,339,966 | Goldman Sachs International | 12/20/23 | 43,377 | — |
| EUR | 3,257,410 | CZK | 80,214,663 | Goldman Sachs International | 12/20/23 | 3,348 | — |
| EUR | 1,272,920 | CZK | 31,300,091 | Goldman Sachs International | 12/20/23 | 3,285 | — |
| EUR | 246,667 | CZK | 6,074,240 | Goldman Sachs International | 12/20/23 | 254 | — |
| EUR | 3,486,968 | CZK | 86,406,010 | Standard Chartered Bank | 12/20/23 | — | (19,580) |
| EUR | 16,007,449 | CZK | 393,911,293 | UBS AG | 12/20/23 | 28,359 | — |
| EUR | 3,260,663 | CZK | 80,214,663 | UBS AG | 12/20/23 | 6,798 | — |
| EUR | 1,212,161 | CZK | 29,828,859 | UBS AG | 12/20/23 | 2,147 | — |
| EUR | 246,913 | CZK | 6,074,240 | UBS AG | 12/20/23 | 515 | — |
| EUR | 1,595,883 | CZK | 39,522,565 | UBS AG | 12/20/23 | — | (7,974) |
| EUR | 4,352,488 | HUF | 1,706,201,500 | BNP Paribas | 12/20/23 | — | (71,744) |
| EUR | 1,085,954 | HUF | 425,881,276 | Goldman Sachs International | 12/20/23 | — | (18,397) |
| EUR | 1,539,973 | HUF | 602,188,766 | Goldman Sachs International | 12/20/23 | — | (21,291) |
| EUR | 3,820,523 | HUF | 1,493,366,162 | Goldman Sachs International | 12/20/23 | — | (51,157) |
| EUR | 1,085,991 | HUF | 425,881,276 | HSBC Bank USA, N.A. | 12/20/23 | — | (18,358) |
| EUR | 1,539,695 | HUF | 602,188,766 | Standard Chartered Bank | 12/20/23 | — | (21,586) |
| EUR | 3,849,874 | HUF | 1,505,471,911 | Standard Chartered Bank | 12/20/23 | — | (53,290) |
| EUR | 4,349,892 | HUF | 1,706,201,500 | UBS AG | 12/20/23 | — | (74,498) |
| EUR | 2,152,045 | PLN | 10,000,000 | HSBC Bank USA, N.A. | 12/20/23 | — | (88,551) |
| EUR | 2,829,091 | PLN | 13,130,000 | JPMorgan Chase Bank, N.A. | 12/20/23 | — | (112,603) |
| EUR | 1,739,834 | RON | 8,700,000 | Citibank, N.A. | 12/20/23 | — | (7,321) |
| EUR | 2,197,698 | RON | 10,980,000 | JPMorgan Chase Bank, N.A. | 12/20/23 | — | (7,217) |
| EUR | 45,236,812 | RON | 226,190,134 | JPMorgan Chase Bank, N.A. | 12/20/23 | — | (187,069) |
| HUF | 5,237,431,926 | EUR | 13,360,591 | BNP Paribas | 12/20/23 | 220,229 | — |
| HUF | 4,794,126,245 | EUR | 12,264,957 | Goldman Sachs International | 12/20/23 | 164,228 | — |
| HUF | 1,928,327,208 | EUR | 4,931,296 | Goldman Sachs International | 12/20/23 | 68,179 | — |
| HUF | 1,310,758,364 | EUR | 3,342,300 | Goldman Sachs International | 12/20/23 | 56,622 | — |
| HUF | 1,310,758,364 | EUR | 3,342,414 | HSBC Bank USA, N.A. | 12/20/23 | 56,501 | — |
| HUF | 4,761,301,751 | EUR | 12,175,857 | Standard Chartered Bank | 12/20/23 | 168,538 | — |
| HUF | 1,928,327,208 | EUR | 4,930,406 | Standard Chartered Bank | 12/20/23 | 69,123 | — |
| HUF | 5,237,431,924 | EUR | 13,352,621 | UBS AG | 12/20/23 | 228,681 | — |
| ILS | 31,921,320 | USD | 8,406,741 | BNP Paribas | 12/20/23 | — | (488,122) |
| MXN | 63,908,825 | USD | 3,630,335 | BNP Paribas | 12/20/23 | — | (112,931) |
| MXN | 81,000,000 | USD | 4,650,310 | Citibank, N.A. | 12/20/23 | — | (192,245) |
| MXN | 113,506,000 | USD | 6,542,133 | Citibank, N.A. | 12/20/23 | — | (295,007) |
27
See Notes to Financial Statements.
Emerging Markets Local Income Portfolio
October 31, 2023
Portfolio of Investments — continued
| Forward Foreign Currency Exchange Contracts (OTC) (continued) |
| Currency Purchased | Currency Sold | Counterparty | Settlement
Date | Unrealized
Appreciation | Unrealized
(Depreciation) |
| MXN | 53,200,000 | USD | 2,918,002 | Goldman Sachs International | 12/20/23 | $ 10,012 | $ — |
| MXN | 72,500,000 | USD | 3,981,801 | Goldman Sachs International | 12/20/23 | 8,442 | — |
| MXN | 53,200,000 | USD | 2,925,652 | Goldman Sachs International | 12/20/23 | 2,362 | — |
| MXN | 53,200,000 | USD | 2,925,902 | Goldman Sachs International | 12/20/23 | 2,112 | — |
| MXN | 6,111,945 | USD | 351,519 | Goldman Sachs International | 12/20/23 | — | (15,131) |
| MXN | 10,156,130 | USD | 584,606 | JPMorgan Chase Bank, N.A. | 12/20/23 | — | (25,635) |
| MXN | 159,600,000 | USD | 8,761,499 | Standard Chartered Bank | 12/20/23 | 22,540 | — |
| MXN | 132,578,000 | USD | 7,644,688 | Standard Chartered Bank | 12/20/23 | — | (347,881) |
| MXN | 134,448,000 | USD | 7,721,447 | UBS AG | 12/20/23 | — | (321,719) |
| MXN | 2,019,366,844 | USD | 113,556,666 | UBS AG | 12/20/23 | — | (2,415,071) |
| MYR | 162,578,714 | USD | 34,933,114 | Barclays Bank PLC | 12/20/23 | — | (703,929) |
| MYR | 71,522,058 | USD | 15,381,088 | Goldman Sachs International | 12/20/23 | — | (322,894) |
| PLN | 148,632,682 | EUR | 31,806,504 | BNP Paribas | 12/20/23 | 1,506,952 | — |
| PLN | 6,467,391 | EUR | 1,383,983 | BNP Paribas | 12/20/23 | 65,571 | — |
| PLN | 2,607,451 | EUR | 557,979 | BNP Paribas | 12/20/23 | 26,436 | — |
| PLN | 36,754,327 | EUR | 7,866,170 | Goldman Sachs International | 12/20/23 | 371,621 | — |
| PLN | 10,800,000 | EUR | 2,396,413 | Goldman Sachs International | 12/20/23 | 19,065 | — |
| PLN | 1,599,276 | EUR | 342,277 | Goldman Sachs International | 12/20/23 | 16,170 | — |
| PLN | 644,778 | EUR | 137,996 | Goldman Sachs International | 12/20/23 | 6,519 | — |
| PLN | 148,378,583 | EUR | 31,750,280 | UBS AG | 12/20/23 | 1,506,336 | — |
| PLN | 36,754,328 | EUR | 7,873,054 | UBS AG | 12/20/23 | 364,321 | — |
| PLN | 6,456,335 | EUR | ��� 1,381,537 | UBS AG | 12/20/23 | 65,545 | — |
| PLN | 2,602,993 | EUR | 556,992 | UBS AG | 12/20/23 | 26,425 | — |
| PLN | 1,599,275 | EUR | 342,577 | UBS AG | 12/20/23 | 15,853 | — |
| PLN | 644,778 | EUR | 138,116 | UBS AG | 12/20/23 | 6,391 | — |
| RON | 8,600,000 | EUR | 1,720,229 | Goldman Sachs International | 12/20/23 | 6,820 | — |
| RON | 197,871,000 | EUR | 39,573,137 | JPMorgan Chase Bank, N.A. | 12/20/23 | 163,648 | — |
| THB | 120,400,000 | USD | 3,261,228 | Standard Chartered Bank | 12/20/23 | 102,961 | — |
| THB | 840,563,013 | USD | 23,702,725 | Standard Chartered Bank | 12/20/23 | — | (215,902) |
| THB | 765,594,000 | USD | 21,801,546 | Standard Chartered Bank | 12/20/23 | — | (409,491) |
| THB | 1,374,000,000 | USD | 39,448,185 | Standard Chartered Bank | 12/20/23 | — | (1,056,186) |
| USD | 10,135,919 | CNH | 74,000,000 | Citibank, N.A. | 12/20/23 | 23,251 | — |
| USD | 1,779,269 | CNH | 12,850,000 | Citibank, N.A. | 12/20/23 | 23,218 | — |
| USD | 6,453,209 | CNH | 47,000,000 | Goldman Sachs International | 12/20/23 | 30,299 | — |
| USD | 12,741,337 | CNH | 93,047,000 | Goldman Sachs International | 12/20/23 | 25,751 | — |
| USD | 3,844,465 | CNH | 28,000,000 | Goldman Sachs International | 12/20/23 | 18,050 | — |
| USD | 961,116 | CNH | 7,000,000 | Goldman Sachs International | 12/20/23 | 4,513 | — |
| USD | 40,633,881 | CNH | 295,895,515 | JPMorgan Chase Bank, N.A. | 12/20/23 | 197,491 | — |
| USD | 24,473,013 | CNH | 178,212,234 | JPMorgan Chase Bank, N.A. | 12/20/23 | 118,945 | — |
| USD | 5,837,179 | CNH | 42,506,280 | JPMorgan Chase Bank, N.A. | 12/20/23 | 28,370 | — |
| USD | 3,213,703 | CNH | 23,400,000 | Standard Chartered Bank | 12/20/23 | 15,914 | — |
| USD | 2,306,254 | CNH | 16,800,000 | Standard Chartered Bank | 12/20/23 | 10,405 | — |
| USD | 5,024,703 | ILS | 19,610,862 | BNP Paribas | 12/20/23 | 159,899 | — |
| USD | 3,125,400 | ILS | 12,310,458 | HSBC Bank USA, N.A. | 12/20/23 | 71,584 | — |
| USD | 1,903,973 | MXN | 34,920,000 | Goldman Sachs International | 12/20/23 | — | (17,948) |
28
See Notes to Financial Statements.
Emerging Markets Local Income Portfolio
October 31, 2023
Portfolio of Investments — continued
| Forward Foreign Currency Exchange Contracts (OTC) (continued) |
| Currency Purchased | Currency Sold | Counterparty | Settlement
Date | Unrealized
Appreciation | Unrealized
(Depreciation) |
| USD | 1,903,973 | MXN | 34,920,000 | Goldman Sachs International | 12/20/23 | $ — | $ (17,948) |
| USD | 4,238,362 | MXN | 73,900,000 | State Street Bank and Trust Company | 12/20/23 | 171,066 | — |
| USD | 1,044,286 | MXN | 18,935,000 | State Street Bank and Trust Company | 12/20/23 | 2,144 | — |
| USD | 1,007,991 | MXN | 18,306,000 | State Street Bank and Trust Company | 12/20/23 | 468 | — |
| USD | 961,195 | MXN | 17,546,200 | State Street Bank and Trust Company | 12/20/23 | — | (4,510) |
| USD | 555,964 | MXN | 10,221,000 | State Street Bank and Trust Company | 12/20/23 | — | (6,578) |
| USD | 56,948,142 | MXN | 1,012,703,123 | UBS AG | 12/20/23 | 1,211,147 | — |
| USD | 25,907,411 | MXN | 460,708,900 | UBS AG | 12/20/23 | 550,987 | — |
| USD | 1,208,557 | MXN | 21,491,654 | UBS AG | 12/20/23 | 25,703 | — |
| USD | 24,873,968 | MYR | 115,763,447 | Barclays Bank PLC | 12/20/23 | 501,230 | — |
| USD | 2,546,149 | MYR | 12,000,000 | Barclays Bank PLC | 12/20/23 | 19,679 | — |
| USD | 3,451,233 | MYR | 16,100,000 | Goldman Sachs International | 12/20/23 | 61,552 | — |
| USD | 22,343,679 | THB | 778,241,524 | Standard Chartered Bank | 12/20/23 | 598,230 | — |
| USD | 980,795 | THB | 35,100,000 | Standard Chartered Bank | 12/20/23 | 39 | — |
| USD | 2,080,736 | THB | 75,600,000 | Standard Chartered Bank | 12/20/23 | — | (31,662) |
| USD | 2,437,305 | UYU | 95,002,000 | Citibank, N.A. | 12/20/23 | 74,750 | — |
| USD | 1,215,058 | UYU | 47,448,000 | Citibank, N.A. | 12/20/23 | 35,098 | — |
| USD | 3,868,309 | ZAR | 73,400,000 | Citibank, N.A. | 12/20/23 | — | (53,605) |
| USD | 1,772,739 | ZAR | 33,833,202 | Goldman Sachs International | 12/20/23 | — | (35,039) |
| USD | 1,842,430 | ZAR | 35,242,918 | Goldman Sachs International | 12/20/23 | — | (40,672) |
| USD | 1,643,629 | ZAR | 31,531,548 | Goldman Sachs International | 12/20/23 | — | (41,167) |
| USD | 4,396,497 | ZAR | 83,908,346 | Goldman Sachs International | 12/20/23 | — | (86,900) |
| USD | 4,569,336 | ZAR | 87,404,527 | Goldman Sachs International | 12/20/23 | — | (100,869) |
| USD | 4,866,030 | ZAR | 93,350,418 | Goldman Sachs International | 12/20/23 | — | (121,876) |
| USD | 6,117,334 | ZAR | 117,107,183 | Goldman Sachs International | 12/20/23 | — | (139,945) |
| USD | 6,458,463 | ZAR | 123,978,601 | Goldman Sachs International | 12/20/23 | — | (165,970) |
| USD | 15,171,351 | ZAR | 290,432,756 | Goldman Sachs International | 12/20/23 | — | (347,073) |
| USD | 19,120,541 | ZAR | 367,043,650 | Goldman Sachs International | 12/20/23 | — | (491,361) |
| USD | 1,772,301 | ZAR | 33,833,202 | HSBC Bank USA, N.A. | 12/20/23 | — | (35,477) |
| USD | 1,662,877 | ZAR | 31,901,631 | HSBC Bank USA, N.A. | 12/20/23 | — | (41,693) |
| USD | 1,841,156 | ZAR | 35,242,918 | HSBC Bank USA, N.A. | 12/20/23 | — | (41,947) |
| USD | 4,395,413 | ZAR | 83,908,345 | HSBC Bank USA, N.A. | 12/20/23 | — | (87,984) |
| USD | 4,964,079 | ZAR | 94,737,950 | HSBC Bank USA, N.A. | 12/20/23 | — | (97,966) |
| USD | 4,566,175 | ZAR | 87,404,527 | HSBC Bank USA, N.A. | 12/20/23 | — | (104,030) |
| USD | 4,923,014 | ZAR | 94,446,064 | HSBC Bank USA, N.A. | 12/20/23 | — | (123,434) |
| USD | 6,114,938 | ZAR | 117,107,183 | HSBC Bank USA, N.A. | 12/20/23 | — | (142,341) |
| USD | 12,311,209 | ZAR | 234,955,732 | HSBC Bank USA, N.A. | 12/20/23 | — | (242,962) |
| USD | 15,165,409 | ZAR | 290,432,755 | HSBC Bank USA, N.A. | 12/20/23 | — | (353,014) |
| USD | 6,430,013 | ZAR | 123,295,492 | JPMorgan Chase Bank, N.A. | 12/20/23 | — | (157,921) |
| USD | 19,036,312 | ZAR | 365,021,275 | JPMorgan Chase Bank, N.A. | 12/20/23 | — | (467,531) |
| USD | 4,936,112 | ZAR | 94,148,939 | UBS AG | 12/20/23 | — | (94,460) |
| USD | 12,241,851 | ZAR | 233,494,950 | UBS AG | 12/20/23 | — | (234,267) |
| USD | 285,754 | ZMW | 5,986,547 | JPMorgan Chase Bank, N.A. | 12/20/23 | 15,774 | — |
| ZAR | 222,509,928 | USD | 11,591,292 | Goldman Sachs International | 12/20/23 | 297,874 | — |
| ZAR | 130,570,951 | USD | 6,820,642 | Goldman Sachs International | 12/20/23 | 156,035 | — |
29
See Notes to Financial Statements.
Emerging Markets Local Income Portfolio
October 31, 2023
Portfolio of Investments — continued
| Forward Foreign Currency Exchange Contracts (OTC) (continued) |
| Currency Purchased | Currency Sold | Counterparty | Settlement
Date | Unrealized
Appreciation | Unrealized
(Depreciation) |
| ZAR | 55,595,885 | USD | 2,898,019 | Goldman Sachs International | 12/20/23 | $ 72,584 | $ — |
| ZAR | 39,093,099 | USD | 2,043,710 | Goldman Sachs International | 12/20/23 | 45,115 | — |
| ZAR | 32,915,534 | USD | 1,719,410 | Goldman Sachs International | 12/20/23 | 39,335 | — |
| ZAR | 33,620,065 | USD | 1,761,571 | Goldman Sachs International | 12/20/23 | 34,819 | — |
| ZAR | 22,100,000 | USD | 1,157,615 | Goldman Sachs International | 12/20/23 | 23,233 | — |
| ZAR | 9,854,950 | USD | 515,197 | Goldman Sachs International | 12/20/23 | 11,373 | — |
| ZAR | 8,475,257 | USD | 444,073 | Goldman Sachs International | 12/20/23 | 8,777 | — |
| ZAR | 168,000,000 | USD | 8,746,294 | HSBC Bank USA, N.A. | 12/20/23 | 230,294 | — |
| ZAR | 130,570,950 | USD | 6,817,970 | HSBC Bank USA, N.A. | 12/20/23 | 158,706 | — |
| ZAR | 93,326,610 | USD | 4,890,127 | HSBC Bank USA, N.A. | 12/20/23 | 96,507 | — |
| ZAR | 55,595,884 | USD | 2,897,943 | HSBC Bank USA, N.A. | 12/20/23 | 72,660 | — |
| ZAR | 39,093,099 | USD | 2,042,296 | HSBC Bank USA, N.A. | 12/20/23 | 46,529 | — |
| ZAR | 32,915,534 | USD | 1,718,737 | HSBC Bank USA, N.A. | 12/20/23 | 40,008 | — |
| ZAR | 33,620,065 | USD | 1,761,137 | HSBC Bank USA, N.A. | 12/20/23 | 35,253 | — |
| ZAR | 37,523,059 | USD | 1,975,678 | HSBC Bank USA, N.A. | 12/20/23 | 29,257 | — |
| ZAR | 23,526,637 | USD | 1,232,749 | HSBC Bank USA, N.A. | 12/20/23 | 24,328 | — |
| ZAR | 9,854,950 | USD | 514,841 | HSBC Bank USA, N.A. | 12/20/23 | 11,729 | — |
| ZAR | 8,475,257 | USD | 443,964 | HSBC Bank USA, N.A. | 12/20/23 | 8,887 | — |
| ZAR | 18,761,530 | USD | 994,888 | HSBC Bank USA, N.A. | 12/20/23 | 7,579 | — |
| ZAR | 219,457,439 | USD | 11,444,977 | JPMorgan Chase Bank, N.A. | 12/20/23 | 281,088 | — |
| ZAR | 38,528,059 | USD | 2,032,204 | Standard Chartered Bank | 12/20/23 | 26,430 | — |
| ZAR | 18,761,529 | USD | 995,260 | State Street Bank and Trust Company | 12/20/23 | 7,208 | — |
| ZAR | 93,823,437 | USD | 4,919,047 | UBS AG | 12/20/23 | 94,134 | — |
| ZAR | 23,651,881 | USD | 1,240,039 | UBS AG | 12/20/23 | 23,730 | — |
| UZS | 15,485,095,000 | USD | 1,235,349 | ICBC Standard Bank plc | 12/21/23 | 8,975 | — |
| UZS | 7,711,664,000 | USD | 617,674 | ICBC Standard Bank plc | 12/21/23 | 2,006 | — |
| USD | 26,427,867 | BRL | 130,000,000 | BNP Paribas | 1/3/24 | 821,186 | — |
| UZS | 14,343,835,000 | USD | 1,142,935 | JPMorgan Chase Bank, N.A. | 1/10/24 | — | (11,346) |
| HUF | 438,538,871 | EUR | 1,075,932 | BNP Paribas | 1/11/24 | 59,290 | — |
| HUF | 1,336,803,348 | EUR | 3,325,712 | UBS AG | 1/11/24 | 131,967 | — |
| HUF | 396,963,222 | EUR | 979,156 | UBS AG | 1/11/24 | 48,120 | — |
| UZS | 7,795,050,000 | USD | 617,674 | ICBC Standard Bank plc | 1/22/24 | 9,160 | — |
| UZS | 6,864,495,463 | USD | 543,938 | ICBC Standard Bank plc | 1/22/24 | 8,066 | — |
| HUF | 2,149,534,827 | EUR | 5,036,398 | Barclays Bank PLC | 1/30/24 | 522,420 | — |
| TRY | 64,681,680 | USD | 2,071,488 | Standard Chartered Bank | 3/20/24 | — | (52,846) |
| USD | 2,006,862 | TRY | 64,681,680 | Standard Chartered Bank | 3/20/24 | — | (11,779) |
| UZS | 8,143,221,557 | USD | 632,483 | JPMorgan Chase Bank, N.A. | 4/19/24 | — | (22,413) |
| NGN | 250,679,285 | USD | 294,917 | JPMorgan Chase Bank, N.A. | 6/20/24 | — | (56,377) |
| NGN | 1,316,619,858 | USD | 1,595,903 | Societe Generale | 6/21/24 | — | (343,430) |
| TRY | 31,652,538 | USD | 936,473 | Standard Chartered Bank | 6/21/24 | — | (34,366) |
| USD | 901,518 | TRY | 31,652,538 | Standard Chartered Bank | 6/21/24 | — | (590) |
| NGN | 684,364,061 | USD | 805,141 | Standard Chartered Bank | 6/24/24 | — | (154,723) |
| NGN | 704,894,982 | USD | 805,141 | Standard Chartered Bank | 6/26/24 | — | (135,625) |
| NGN | 664,421,370 | USD | 746,547 | Standard Chartered Bank | 7/3/24 | — | (116,835) |
| NGN | 715,710,229 | USD | 795,234 | Societe Generale | 7/8/24 | — | (117,957) |
30
See Notes to Financial Statements.
Emerging Markets Local Income Portfolio
October 31, 2023
Portfolio of Investments — continued
| Forward Foreign Currency Exchange Contracts (OTC) (continued) |
| Currency Purchased | Currency Sold | Counterparty | Settlement
Date | Unrealized
Appreciation | Unrealized
(Depreciation) |
| USD | 425,197 | AMD | 169,568,504 | Citibank, N.A. | 9/6/24 | $ 26,486 | $ — |
| USD | 1,260,027 | AMD | 511,886,000 | Citibank, N.A. | 9/16/24 | 58,272 | — |
| EUR | 2,509,535 | PLN | 11,900,000 | Goldman Sachs International | 9/20/24 | — | (112,352) |
| TRY | 156,911,000 | USD | 4,284,165 | Standard Chartered Bank | 9/20/24 | — | (190,914) |
| USD | 4,096,723 | TRY | 156,911,000 | Standard Chartered Bank | 9/20/24 | 3,472 | — |
| TRY | 42,655,000 | USD | 1,148,656 | Standard Chartered Bank | 9/23/24 | — | (39,146) |
| USD | 1,112,450 | TRY | 42,655,000 | Standard Chartered Bank | 9/23/24 | 2,940 | — |
| UZS | 2,692,778,443 | USD | 197,273 | JPMorgan Chase Bank, N.A. | 11/1/24 | — | (2,026) |
| | | | | | | $14,005,403 | $(16,815,163) |
| Non-Deliverable Bond Forward Contracts* |
| Settlement Date | Notional Amount
(000's omitted) | Reference Entity | Counterparty | Aggregate Cost | Unrealized
Appreciation
(Depreciation) |
| 11/10/23 | COP | 18,000,000 | Republic of Colombia,
6.00%, 4/28/28 | Goldman Sachs International | $ 4,373,178 | $ (130,732) |
| 12/14/23 | COP | 18,000,000 | Republic of Colombia,
7.25%, 10/18/34 | Goldman Sachs International | 4,373,178 | 55,365 |
| 1/2/24 | COP | 67,000,000 | Republic of Colombia,
6.00%, 4/28/28 | Bank of America, N.A. | 16,277,940 | 183,566 |
| 1/2/24 | COP | 56,900,000 | Republic of Colombia,
6.00%, 4/28/28 | Bank of America, N.A. | 13,824,101 | 40,657 |
| 1/2/24 | COP | 72,000,000 | Republic of Colombia,
7.50%, 8/26/26 | Bank of America, N.A. | 17,492,711 | 23,545 |
| 1/2/24 | COP | 73,500,000 | Republic of Colombia,
10.00%, 7/24/24 | Bank of America, N.A. | 17,857,143 | (130,643) |
| | | | | | | $ 41,758 |
| * | Represents a short-term forward contract to purchase the reference entity denominated in a non-deliverable foreign currency. |
| Futures Contracts |
| Description | Number of
Contracts | Position | Expiration
Date | Notional
Amount | Value/Unrealized
Appreciation
(Depreciation) |
| Interest Rate Futures | | | | | |
| Euro-Bobl | (23) | Short | 12/7/23 | $ (2,830,069) | $ 16,305 |
| Euro-Bund | (15) | Short | 12/7/23 | (2,047,265) | 39,837 |
| U.S. 5-Year Treasury Note | (128) | Short | 12/29/23 | (13,373,000) | 66,224 |
| U.S. 10-Year Treasury Note | (4) | Short | 12/19/23 | (424,688) | 15,816 |
| | | | | | $138,182 |
31
See Notes to Financial Statements.
Emerging Markets Local Income Portfolio
October 31, 2023
Portfolio of Investments — continued
| Interest Rate Swaps (Centrally Cleared) |
Notional Amount
(000's omitted) | Portfolio
Pays/
Receives
Floating
Rate | Floating Rate | Annual
Fixed Rate | Termination
Date | Value | Unamortized
Upfront
Receipts
(Payments) | Unrealized
Appreciation
(Depreciation) |
| BRL | 195,900 | Pays | Brazil CETIP Interbank Deposit Rate
(pays upon termination) | 13.66%
(pays upon termination) | 1/2/24 | $ 170,133 | $ — | $ 170,133 |
| BRL | 716,538 | Pays | Brazil CETIP Interbank Deposit Rate
(pays upon termination) | 13.69%
(pays upon termination) | 1/2/24 | 662,923 | — | 662,923 |
| BRL | 27,758 | Pays | Brazil CETIP Interbank Deposit Rate
(pays upon termination) | 14.07%
(pays upon termination) | 1/2/24 | 49,601 | — | 49,601 |
| BRL | 383,000 | Pays | Brazil CETIP Interbank Deposit Rate
(pays upon termination) | 11.29%
(pays upon termination) | 7/1/24 | (231,733) | — | (231,733) |
| BRL | 72,000 | Receives | Brazil CETIP Interbank Deposit Rate
(pays upon termination) | 6.36%
(pays upon termination) | 1/2/25 | 2,555,356 | — | 2,555,356 |
| BRL | 95,450 | Pays | Brazil CETIP Interbank Deposit Rate
(pays upon termination) | 10.40%
(pays upon termination) | 1/2/25 | (200,731) | — | (200,731) |
| BRL | 95,450 | Pays | Brazil CETIP Interbank Deposit Rate
(pays upon termination) | 10.50%
(pays upon termination) | 1/2/25 | (178,142) | — | (178,142) |
| BRL | 93,368 | Pays | Brazil CETIP Interbank Deposit Rate
(pays upon termination) | 10.52%
(pays upon termination) | 1/2/25 | (172,188) | — | (172,188) |
| BRL | 97,532 | Pays | Brazil CETIP Interbank Deposit Rate
(pays upon termination) | 10.52%
(pays upon termination) | 1/2/25 | (179,281) | — | (179,281) |
| BRL | 78,730 | Pays | Brazil CETIP Interbank Deposit Rate
(pays upon termination) | 10.60%
(pays upon termination) | 1/2/25 | (179,695) | — | (179,695) |
| BRL | 183,700 | Pays | Brazil CETIP Interbank Deposit Rate
(pays upon termination) | 10.96%
(pays upon termination) | 1/2/25 | (104,866) | — | (104,866) |
| BRL | 94,990 | Pays | Brazil CETIP Interbank Deposit Rate
(pays upon termination) | 11.07%
(pays upon termination) | 1/2/25 | (16,945) | — | (16,945) |
| BRL | 51,700 | Pays | Brazil CETIP Interbank Deposit Rate
(pays upon termination) | 11.45%
(pays upon termination) | 1/2/25 | (32,480) | — | (32,480) |
| BRL | 57,316 | Pays | Brazil CETIP Interbank Deposit Rate
(pays upon termination) | 11.48%
(pays upon termination) | 1/2/25 | (195,314) | — | (195,314) |
| BRL | 57,254 | Pays | Brazil CETIP Interbank Deposit Rate
(pays upon termination) | 11.49%
(pays upon termination) | 1/2/25 | (192,520) | — | (192,520) |
| BRL | 37,730 | Pays | Brazil CETIP Interbank Deposit Rate
(pays upon termination) | 11.51%
(pays upon termination) | 1/2/25 | (123,465) | — | (123,465) |
| BRL | 88,800 | Pays | Brazil CETIP Interbank Deposit Rate
(pays upon termination) | 10.02%
(pays upon termination) | 1/4/27 | (804,703) | — | (804,703) |
| BRL | 34,300 | Pays | Brazil CETIP Interbank Deposit Rate
(pays upon termination) | 10.44%
(pays upon termination) | 1/4/27 | (224,973) | — | (224,973) |
32
See Notes to Financial Statements.
Emerging Markets Local Income Portfolio
October 31, 2023
Portfolio of Investments — continued
| Interest Rate Swaps (Centrally Cleared) (continued) |
Notional Amount
(000's omitted) | Portfolio
Pays/
Receives
Floating
Rate | Floating Rate | Annual
Fixed Rate | Termination
Date | Value | Unamortized
Upfront
Receipts
(Payments) | Unrealized
Appreciation
(Depreciation) |
| BRL | 19,090 | Pays | Brazil CETIP Interbank Deposit Rate
(pays upon termination) | 13.17%
(pays upon termination) | 1/2/29 | $ 354,307 | $ — | $ 354,307 |
| BRL | 15,200 | Pays | Brazil CETIP Interbank Deposit Rate
(pays upon termination) | 13.07%
(pays upon termination) | 1/2/31 | 354,992 | — | 354,992 |
| CLP | 5,000,000 | Pays | 6-month Sinacofi Chile Interbank Rate
(pays semi-annually) | 3.68%
(pays semi-annually) | 2/11/24 | (159,452) | — | (159,452) |
| CLP | 1,140,000 | Pays | 6-month Sinacofi Chile Interbank Rate
(pays semi-annually) | 3.49%
(pays semi-annually) | 4/26/24 | (31,557) | — | (31,557) |
| CLP | 2,650,000 | Pays | 6-month Sinacofi Chile Interbank Rate
(pays semi-annually) | 1.38%
(pays semi-annually) | 6/17/25 | (361,071) | — | (361,071) |
| CLP | 3,700,000 | Pays | 6-month Sinacofi Chile Interbank Rate
(pays semi-annually) | 1.33%
(pays semi-annually) | 9/11/25 | (452,194) | — | (452,194) |
| CLP | 5,200,000 | Pays | 6-month Sinacofi Chile Interbank Rate
(pays semi-annually) | 1.48%
(pays semi-annually) | 12/23/25 | (800,813) | — | (800,813) |
| CLP | 2,500,000 | Pays | 6-month Sinacofi Chile Interbank Rate
(pays semi-annually) | 1.59%
(pays semi-annually) | 1/27/26 | (360,726) | — | (360,726) |
| CLP | 2,500,000 | Pays | 6-month Sinacofi Chile Interbank Rate
(pays semi-annually) | 1.92%
(pays semi-annually) | 2/23/26 | (327,410) | — | (327,410) |
| CLP | 584,900 | Pays | 6-month Sinacofi Chile Interbank Rate
(pays semi-annually) | 2.87%
(pays semi-annually) | 5/31/26 | (78,991) | — | (78,991) |
| CLP | 4,854,200 | Receives | 6-month Sinacofi Chile Interbank Rate
(pays semi-annually) | 5.51%
(pays semi-annually) | 9/20/28 | 166,262 | — | 166,262 |
| CLP | 4,854,200 | Pays | 6-month Sinacofi Chile Interbank Rate
(pays semi-annually) | 5.68%
(pays semi-annually) | 9/20/28 | (126,125) | — | (126,125) |
| CLP | 3,362,600 | Pays | 6-month Sinacofi Chile Interbank Rate
(pays semi-annually) | 4.08%
(pays semi-annually) | 7/1/31 | (526,737) | — | (526,737) |
| CLP | 4 | Pays | 6-month Sinacofi Chile Interbank Rate
(pays semi-annually) | 4.18%
(pays semi-annually) | 7/2/31 | (1) | — | (1) |
| CLP | 25,304,700 | Receives | 6-month Sinacofi Chile Interbank Rate
(pays semi-annually) | 5.23%
(pays semi-annually) | 9/20/33 | 635,343 | — | 635,343 |
| CLP | 6,236,900 | Receives | 6-month Sinacofi Chile Interbank Rate
(pays semi-annually) | 5.56%
(pays semi-annually) | 12/20/33 | 85,751 | — | 85,751 |
| CNY | 507,400 | Pays | 7-day China Fixing Repo Rates
(pays quarterly) | 2.40%
(pays quarterly) | 12/21/27 | 154,173 | — | 154,173 |
| CNY | 68,700 | Pays | 7-day China Fixing Repo Rates
(pays quarterly) | 2.40%
(pays quarterly) | 12/21/27 | 22,684 | — | 22,684 |
33
See Notes to Financial Statements.
Emerging Markets Local Income Portfolio
October 31, 2023
Portfolio of Investments — continued
| Interest Rate Swaps (Centrally Cleared) (continued) |
Notional Amount
(000's omitted) | Portfolio
Pays/
Receives
Floating
Rate | Floating Rate | Annual
Fixed Rate | Termination
Date | Value | Unamortized
Upfront
Receipts
(Payments) | Unrealized
Appreciation
(Depreciation) |
| CNY | 215,650 | Pays | 7-day China Fixing Repo Rates
(pays quarterly) | 2.47%
(pays quarterly) | 12/21/27 | $ 142,183 | $ — | $ 142,183 |
| CNY | 22,000 | Pays | 7-day China Fixing Repo Rates
(pays quarterly) | 2.82%
(pays quarterly) | 6/21/28 | 55,872 | — | 55,872 |
| CNY | 41,300 | Pays | 7-day China Fixing Repo Rates
(pays quarterly) | 2.87%
(pays quarterly) | 6/21/28 | 116,993 | — | 116,993 |
| CNY | 45,000 | Pays | 7-day China Fixing Repo Rates
(pays quarterly) | 2.28%
(pays quarterly) | 9/20/28 | (29,839) | — | (29,839) |
| CNY | 108,000 | Pays | 7-day China Fixing Repo Rates
(pays quarterly) | 2.29%
(pays quarterly) | 9/20/28 | (69,319) | — | (69,319) |
| CNY | 45,000 | Pays | 7-day China Fixing Repo Rates
(pays quarterly) | 2.29%
(pays quarterly) | 9/20/28 | (28,474) | — | (28,474) |
| CNY | 18,990 | Pays | 7-day China Fixing Repo Rates
(pays quarterly) | 2.41%
(pays quarterly) | 9/20/28 | 1,695 | — | 1,695 |
| CNY | 51,620 | Pays | 7-day China Fixing Repo Rates
(pays quarterly) | 2.47%
(pays quarterly) | 9/20/28 | 24,181 | — | 24,181 |
| CNY | 114,500 | Pays | 7-day China Fixing Repo Rates
(pays quarterly) | 2.48%
(pays quarterly) | 9/20/28 | 58,847 | — | 58,847 |
| CNY | 62,400 | Pays | 7-day China Fixing Repo Rates
(pays quarterly) | 2.49%
(pays quarterly) | 9/20/28 | 38,885 | — | 38,885 |
| CNY | 13,000 | Pays | 7-day China Fixing Repo Rates
(pays quarterly) | 2.44%
(pays quarterly) | 12/20/28 | 1,522 | — | 1,522 |
| CNY | 10,000 | Pays | 7-day China Fixing Repo Rates
(pays quarterly) | 2.44%
(pays quarterly) | 12/20/28 | 1,350 | — | 1,350 |
| CNY | 30,000 | Pays | 7-day China Fixing Repo Rates
(pays quarterly) | 2.44%
(pays quarterly) | 12/20/28 | 4,411 | — | 4,411 |
| CNY | 24,000 | Pays | 7-day China Fixing Repo Rates
(pays quarterly) | 2.44%
(pays quarterly) | 12/20/28 | 3,672 | — | 3,672 |
| CNY | 9,000 | Pays | 7-day China Fixing Repo Rates
(pays quarterly) | 2.45%
(pays quarterly) | 12/20/28 | 1,646 | — | 1,646 |
| CNY | 21,000 | Pays | 7-day China Fixing Repo Rates
(pays quarterly) | 2.46%
(pays quarterly) | 12/20/28 | 5,601 | — | 5,601 |
| CNY | 21,000 | Pays | 7-day China Fixing Repo Rates
(pays quarterly) | 2.47%
(pays quarterly) | 12/20/28 | 6,230 | — | 6,230 |
| CNY | 27,000 | Pays | 7-day China Fixing Repo Rates
(pays quarterly) | 2.47%
(pays quarterly) | 12/20/28 | 8,817 | — | 8,817 |
34
See Notes to Financial Statements.
Emerging Markets Local Income Portfolio
October 31, 2023
Portfolio of Investments — continued
| Interest Rate Swaps (Centrally Cleared) (continued) |
Notional Amount
(000's omitted) | Portfolio
Pays/
Receives
Floating
Rate | Floating Rate | Annual
Fixed Rate | Termination
Date | Value | Unamortized
Upfront
Receipts
(Payments) | Unrealized
Appreciation
(Depreciation) |
| CNY | 18,000 | Pays | 7-day China Fixing Repo Rates
(pays quarterly) | 2.47%
(pays quarterly) | 12/20/28 | $ 5,986 | $ — | $ 5,986 |
| COP | 6,031,600 | Receives | Colombia Overnight Interbank Reference Rate
(pays quarterly) | 3.76%
(pays quarterly) | 11/26/25 | 183,414 | — | 183,414 |
| COP | 6,488,700 | Receives | Colombia Overnight Interbank Reference Rate
(pays quarterly) | 4.34%
(pays quarterly) | 11/26/25 | 178,872 | — | 178,872 |
| COP | 5,979,100 | Receives | Colombia Overnight Interbank Reference Rate
(pays quarterly) | 4.73%
(pays quarterly) | 11/26/25 | 153,583 | — | 153,583 |
| COP | 20,568,100 | Pays | Colombia Overnight Interbank Reference Rate
(pays quarterly) | 5.68%
(pays quarterly) | 11/26/25 | (433,203) | — | (433,203) |
| COP | 3,792,000 | Receives | Colombia Overnight Interbank Reference Rate
(pays quarterly) | 9.42%
(pays quarterly) | 11/26/25 | 10,918 | — | 10,918 |
| COP | 17,453,100 | Receives | Colombia Overnight Interbank Reference Rate
(pays quarterly) | 8.49%
(pays quarterly) | 9/20/28 | 89,793 | — | 89,793 |
| CZK | 200,800 | Pays | 6-month CZK PRIBOR
(pays semi-annually) | 1.40%
(pays annually) | 3/6/25 | (475,022) | — | (475,022) |
| CZK | 258,400 | Receives | 6-month CZK PRIBOR
(pays semi-annually) | 1.37%
(pays annually) | 3/17/25 | 607,620 | — | 607,620 |
| CZK | 300,000 | Pays | 6-month CZK PRIBOR
(pays semi-annually) | 1.46%
(pays annually) | 3/15/26 | (963,456) | — | (963,456) |
| CZK | 110,000 | Pays | 6-month CZK PRIBOR
(pays semi-annually) | 5.39%
(pays annually) | 3/15/28 | 296,518 | — | 296,518 |
| CZK | 53,900 | Pays | 6-month CZK PRIBOR
(pays semi-annually) | 4.61%
(pays annually) | 6/21/28 | (8,275) | — | (8,275) |
| CZK | 230,500 | Pays | 6-month CZK PRIBOR
(pays semi-annually) | 4.15%
(pays annually) | 9/20/28 | (169,257) | — | (169,257) |
| CZK | 51,941 | Pays | 6-month CZK PRIBOR
(pays semi-annually) | 3.94%
(pays annually) | 9/20/33 | (109,450) | — | (109,450) |
| CZK | 103,882 | Pays | 6-month CZK PRIBOR
(pays semi-annually) | 3.96%
(pays annually) | 9/20/33 | (213,735) | — | (213,735) |
| CZK | 125,800 | Pays | 6-month CZK PRIBOR
(pays semi-annually) | 3.96%
(pays annually) | 9/20/33 | (256,598) | — | (256,598) |
| CZK | 156,178 | Pays | 6-month CZK PRIBOR
(pays semi-annually) | 3.96%
(pays annually) | 9/20/33 | (317,284) | — | (317,284) |
| CZK | 61,000 | Pays | 6-month CZK PRIBOR
(pays semi-annually) | 4.31%
(pays annually) | 12/20/33 | (31,134) | — | (31,134) |
| HUF | 480,000 | Pays | 6-month HUF BUBOR
(pays semi-annually) | 0.79%
(pays annually) | 8/6/24 | (140,962) | — | (140,962) |
| HUF | 3,500,000 | Pays | 6-month HUF BUBOR
(pays semi-annually) | 0.71%
(pays annually) | 11/22/24 | (1,522,180) | — | (1,522,180) |
| HUF | 6,619,000 | Receives | 6-month HUF BUBOR
(pays semi-annually) | 1.30%
(pays annually) | 3/16/25 | 2,045,241 | — | 2,045,241 |
| HUF | 1,000,000 | Pays | 6-month HUF BUBOR
(pays semi-annually) | 1.20%
(pays annually) | 11/4/25 | (555,823) | — | (555,823) |
| INR | 841,000 | Pays | 1-day INR FBIL MIBOR
(pays semi-annually) | 6.73%
(pays semi-annually) | 12/20/25 | 13,969 | — | 13,969 |
35
See Notes to Financial Statements.
Emerging Markets Local Income Portfolio
October 31, 2023
Portfolio of Investments — continued
| Interest Rate Swaps (Centrally Cleared) (continued) |
Notional Amount
(000's omitted) | Portfolio
Pays/
Receives
Floating
Rate | Floating Rate | Annual
Fixed Rate | Termination
Date | Value | Unamortized
Upfront
Receipts
(Payments) | Unrealized
Appreciation
(Depreciation) |
| INR | 1,743,000 | Pays | 1-day INR FBIL MIBOR
(pays semi-annually) | 6.75%
(pays semi-annually) | 12/20/25 | $ 38,277 | $ — | $ 38,277 |
| INR | 2,479,000 | Pays | 1-day INR FBIL MIBOR
(pays semi-annually) | 6.75%
(pays semi-annually) | 12/20/25 | 55,253 | — | 55,253 |
| INR | 536,600 | Pays | 1-day INR FBIL MIBOR
(pays semi-annually) | 6.73%
(pays semi-annually) | 12/20/28 | 14,545 | — | 14,545 |
| KRW | 3,290,000 | Pays | 3-month KRW Certificate of Deposit Rate
(pays quarterly) | 3.11%
(pays quarterly) | 6/21/28 | (103,092) | — | (103,092) |
| KRW | 3,303,000 | Pays | 3-month KRW Certificate of Deposit Rate
(pays quarterly) | 3.57%
(pays quarterly) | 6/21/28 | (54,640) | — | (54,640) |
| KRW | 3,303,000 | Pays | 3-month KRW Certificate of Deposit Rate
(pays quarterly) | 3.60%
(pays quarterly) | 6/21/28 | (50,881) | — | (50,881) |
| KRW | 3,417,000 | Pays | 3-month KRW Certificate of Deposit Rate
(pays quarterly) | 3.61%
(pays quarterly) | 6/21/28 | (52,082) | — | (52,082) |
| KRW | 11,700,000 | Pays | 3-month KRW Certificate of Deposit Rate
(pays quarterly) | 2.07%
(pays quarterly) | 11/24/31 | (1,257,473) | — | (1,257,473) |
| KRW | 944,071 | Pays | 3-month KRW Certificate of Deposit Rate
(pays quarterly) | 3.23%
(pays quarterly) | 6/21/33 | (51,393) | — | (51,393) |
| KRW | 2,086,473 | Pays | 3-month KRW Certificate of Deposit Rate
(pays quarterly) | 3.31%
(pays quarterly) | 6/21/33 | (103,849) | — | (103,849) |
| KRW | 1,055,244 | Pays | 3-month KRW Certificate of Deposit Rate
(pays quarterly) | 3.33%
(pays quarterly) | 6/21/33 | (51,292) | — | (51,292) |
| KRW | 658,000 | Pays | 3-month KRW Certificate of Deposit Rate
(pays quarterly) | 3.35%
(pays quarterly) | 6/21/33 | (30,933) | — | (30,933) |
| KRW | 1,056,000 | Pays | 3-month KRW Certificate of Deposit Rate
(pays quarterly) | 3.29%
(pays quarterly) | 9/20/33 | (54,928) | — | (54,928) |
| KRW | 766,000 | Pays | 3-month KRW Certificate of Deposit Rate
(pays quarterly) | 3.31%
(pays quarterly) | 9/20/33 | (39,123) | — | (39,123) |
| KRW | 191,712 | Pays | 3-month KRW Certificate of Deposit Rate
(pays quarterly) | 3.31%
(pays quarterly) | 9/20/33 | (9,731) | — | (9,731) |
| KRW | 1,021,000 | Pays | 3-month KRW Certificate of Deposit Rate
(pays quarterly) | 3.33%
(pays quarterly) | 9/20/33 | (50,418) | — | (50,418) |
| KRW | 1,021,500 | Pays | 3-month KRW Certificate of Deposit Rate
(pays quarterly) | 3.34%
(pays quarterly) | 9/20/33 | (49,931) | — | (49,931) |
| KRW | 2,183,000 | Pays | 3-month KRW Certificate of Deposit Rate
(pays quarterly) | 3.40%
(pays quarterly) | 9/20/33 | (98,149) | — | (98,149) |
| KRW | 2,228,000 | Pays | 3-month KRW Certificate of Deposit Rate
(pays quarterly) | 3.52%
(pays quarterly) | 9/20/33 | (84,104) | — | (84,104) |
36
See Notes to Financial Statements.
Emerging Markets Local Income Portfolio
October 31, 2023
Portfolio of Investments — continued
| Interest Rate Swaps (Centrally Cleared) (continued) |
Notional Amount
(000's omitted) | Portfolio
Pays/
Receives
Floating
Rate | Floating Rate | Annual
Fixed Rate | Termination
Date | Value | Unamortized
Upfront
Receipts
(Payments) | Unrealized
Appreciation
(Depreciation) |
| KRW | 4,502,000 | Pays | 3-month KRW Certificate of Deposit Rate
(pays quarterly) | 3.56%
(pays quarterly) | 9/20/33 | $ (159,358) | $ — | $ (159,358) |
| KRW | 2,073,000 | Pays | 3-month KRW Certificate of Deposit Rate
(pays quarterly) | 3.56%
(pays quarterly) | 9/20/33 | (73,248) | — | (73,248) |
| KRW | 1,773,000 | Pays | 3-month KRW Certificate of Deposit Rate
(pays quarterly) | 3.56%
(pays quarterly) | 9/20/33 | (62,203) | — | (62,203) |
| KRW | 2,101,000 | Pays | 3-month KRW Certificate of Deposit Rate
(pays quarterly) | 3.59%
(pays quarterly) | 9/20/33 | (69,758) | — | (69,758) |
| KRW | 543,000 | Pays | 3-month KRW Certificate of Deposit Rate
(pays quarterly) | 4.02%
(pays quarterly) | 12/20/33 | (3,960) | — | (3,960) |
| KRW | 1,075,000 | Pays | 3-month KRW Certificate of Deposit Rate
(pays quarterly) | 4.03%
(pays quarterly) | 12/20/33 | (7,045) | — | (7,045) |
| MXN | 350,500 | Pays | Mexico Interbank TIIE 28 Day
(pays monthly) | 8.98%
(pays monthly) | 11/29/23 | (77,035) | 314 | (76,721) |
| MXN | 185,000 | Pays | Mexico Interbank TIIE 28 Day
(pays monthly) | 8.13%
(pays monthly) | 2/2/24 | (108,004) | — | (108,004) |
| MXN | 600,760 | Receives | Mexico Interbank TIIE 28 Day
(pays monthly) | 6.76%
(pays monthly) | 3/7/24 | 610,455 | — | 610,455 |
| MXN | 166,961 | Receives | Mexico Interbank TIIE 28 Day
(pays monthly) | 6.79%
(pays monthly) | 3/7/24 | 168,593 | — | 168,593 |
| MXN | 408,300 | Receives | Mexico Interbank TIIE 28 Day
(pays monthly) | 7.35%
(pays monthly) | 3/14/24 | 363,124 | — | 363,124 |
| MXN | 67,771 | Pays | Mexico Interbank TIIE 28 Day
(pays monthly) | 6.08%
(pays monthly) | 6/27/24 | (138,111) | — | (138,111) |
| MXN | 224,000 | Pays | Mexico Interbank TIIE 28 Day
(pays monthly) | 7.19%
(pays monthly) | 6/27/24 | (363,874) | — | (363,874) |
| MXN | 130,204 | Receives | Mexico Interbank TIIE 28 Day
(pays monthly) | 6.66%
(pays monthly) | 11/7/24 | 350,891 | — | 350,891 |
| MXN | 391,500 | Pays | Mexico Interbank TIIE 28 Day
(pays monthly) | 4.65%
(pays monthly) | 2/6/25 | (1,750,538) | — | (1,750,538) |
| MXN | 144,000 | Receives | Mexico Interbank TIIE 28 Day
(pays monthly) | 7.40%
(pays monthly) | 3/11/25 | 385,982 | — | 385,982 |
| MXN | 222,000 | Pays | Mexico Interbank TIIE 28 Day
(pays monthly) | 4.71%
(pays monthly) | 12/12/25 | (1,410,279) | — | (1,410,279) |
| MXN | 111,000 | Pays | Mexico Interbank TIIE 28 Day
(pays monthly) | 6.07%
(pays monthly) | 4/28/26 | (601,052) | — | (601,052) |
37
See Notes to Financial Statements.
Emerging Markets Local Income Portfolio
October 31, 2023
Portfolio of Investments — continued
| Interest Rate Swaps (Centrally Cleared) (continued) |
Notional Amount
(000's omitted) | Portfolio
Pays/
Receives
Floating
Rate | Floating Rate | Annual
Fixed Rate | Termination
Date | Value | Unamortized
Upfront
Receipts
(Payments) | Unrealized
Appreciation
(Depreciation) |
| MXN | 165,000 | Pays | Mexico Interbank TIIE 28 Day
(pays monthly) | 6.11%
(pays monthly) | 6/8/26 | $ (887,688) | $ — | $ (887,688) |
| MXN | 130,000 | Pays | Mexico Interbank TIIE 28 Day
(pays monthly) | 6.21%
(pays monthly) | 6/29/26 | (698,637) | — | (698,637) |
| MXN | 160,000 | Pays | Mexico Interbank TIIE 28 Day
(pays monthly) | 6.54%
(pays monthly) | 9/4/26 | (841,301) | — | (841,301) |
| MXN | 23,000 | Pays | Mexico Interbank TIIE 28 Day
(pays monthly) | 8.71%
(pays monthly) | 4/17/28 | (52,675) | — | (52,675) |
| PLN | 20,000 | Pays | 6-month PLN WIBOR
(pays semi-annually) | 2.04%
(pays annually) | 1/31/24 | (58,326) | — | (58,326) |
| PLN | 16,000 | Pays | 6-month PLN WIBOR
(pays semi-annually) | 2.01%
(pays annually) | 2/11/24 | (48,202) | — | (48,202) |
| PLN | 13,000 | Pays | 6-month PLN WIBOR
(pays semi-annually) | 2.05%
(pays annually) | 2/28/24 | (35,093) | — | (35,093) |
| PLN | 15,522 | Pays | 6-month PLN WIBOR
(pays semi-annually) | 2.01%
(pays annually) | 3/13/24 | (30,070) | — | (30,070) |
| PLN | 18,000 | Pays | 6-month PLN WIBOR
(pays semi-annually) | 2.00%
(pays annually) | 5/30/24 | (178,984) | — | (178,984) |
| PLN | 37,000 | Pays | 6-month PLN WIBOR
(pays semi-annually) | 1.79%
(pays annually) | 7/5/24 | (377,077) | — | (377,077) |
| PLN | 27,850 | Pays | 6-month PLN WIBOR
(pays semi-annually) | 1.77%
(pays annually) | 8/6/24 | (267,612) | — | (267,612) |
| PLN | 12,200 | Pays | 6-month PLN WIBOR
(pays semi-annually) | 1.66%
(pays annually) | 10/2/24 | (102,881) | — | (102,881) |
| PLN | 11,400 | Pays | 6-month PLN WIBOR
(pays semi-annually) | 2.44%
(pays annually) | 10/28/24 | (74,172) | — | (74,172) |
| PLN | 50,000 | Pays | 6-month PLN WIBOR
(pays semi-annually) | 1.97%
(pays annually) | 1/20/25 | (505,219) | — | (505,219) |
| PLN | 10,800 | Pays | 6-month PLN WIBOR
(pays semi-annually) | 0.48%
(pays annually) | 8/7/25 | (230,144) | — | (230,144) |
| PLN | 11,000 | Pays | 6-month PLN WIBOR
(pays semi-annually) | 0.69%
(pays annually) | 8/26/25 | (221,371) | — | (221,371) |
| PLN | 42,000 | Pays | 6-month PLN WIBOR
(pays semi-annually) | 0.64%
(pays annually) | 1/25/26 | (1,006,514) | — | (1,006,514) |
| PLN | 48,000 | Receives | 6-month PLN WIBOR
(pays semi-annually) | 1.69%
(pays annually) | 9/20/26 | 956,853 | — | 956,853 |
| PLN | 102,370 | Receives | 6-month PLN WIBOR
(pays semi-annually) | 2.19%
(pays annually) | 10/8/26 | 1,696,351 | — | 1,696,351 |
| PLN | 13,250 | Pays | 6-month PLN WIBOR
(pays semi-annually) | 3.87%
(pays annually) | 3/3/27 | (35,069) | — | (35,069) |
| PLN | 99,138 | Pays | 6-month PLN WIBOR
(pays semi-annually) | 3.91%
(pays annually) | 3/3/27 | (227,648) | — | (227,648) |
| PLN | 24,350 | Receives | 6-month PLN WIBOR
(pays semi-annually) | 6.02%
(pays annually) | 12/21/27 | (432,896) | — | (432,896) |
| PLN | 75,000 | Pays | 6-month PLN WIBOR
(pays semi-annually) | 2.84%
(pays annually) | 1/10/28 | (1,229,022) | — | (1,229,022) |
| PLN | 20,000 | Pays | 6-month PLN WIBOR
(pays semi-annually) | 5.29%
(pays annually) | 3/15/28 | 238,352 | — | 238,352 |
38
See Notes to Financial Statements.
Emerging Markets Local Income Portfolio
October 31, 2023
Portfolio of Investments — continued
| Interest Rate Swaps (Centrally Cleared) (continued) |
Notional Amount
(000's omitted) | Portfolio
Pays/
Receives
Floating
Rate | Floating Rate | Annual
Fixed Rate | Termination
Date | Value | Unamortized
Upfront
Receipts
(Payments) | Unrealized
Appreciation
(Depreciation) |
| PLN | 26,700 | Pays | 6-month PLN WIBOR
(pays semi-annually) | 1.74%
(pays annually) | 7/2/31 | $ (1,377,149) | $ — | $ (1,377,149) |
| PLN | 20,500 | Pays | 6-month PLN WIBOR
(pays semi-annually) | 5.19%
(pays annually) | 9/21/32 | 86,630 | — | 86,630 |
| PLN | 8,000 | Receives | 6-month PLN WIBOR
(pays semi-annually) | 5.85%
(pays annually) | 12/21/32 | (169,682) | — | (169,682) |
| PLN | 46,000 | Receives | 6-month PLN WIBOR
(pays semi-annually) | 5.24%
(pays annually) | 6/21/33 | (130,784) | — | (130,784) |
| THB | 200,000 | Pays | 6-month THB Fixing Rate
(pays semi-annually) | 1.87%
(pays semi-annually) | 11/4/23 | (52,564) | — | (52,564) |
| THB | 200,000 | Receives | Thai Overnight Repurchase Rate
(pays semi-annually) | 2.24%
(pays semi-annually) | 11/4/23 | 118,702 | — | 118,702 |
| THB | 120,000 | Pays | 6-month THB Fixing Rate
(pays semi-annually) | 2.01%
(pays semi-annually) | 11/18/23 | (34,461) | — | (34,461) |
| THB | 120,000 | Receives | Thai Overnight Repurchase Rate
(pays semi-annually) | 2.24%
(pays semi-annually) | 11/18/23 | 36,608 | — | 36,608 |
| THB | 175,000 | Pays | 6-month THB Fixing Rate
(pays semi-annually) | 1.94%
(pays semi-annually) | 11/25/23 | (48,370) | — | (48,370) |
| THB | 175,000 | Receives | Thai Overnight Repurchase Rate
(pays semi-annually) | 2.24%
(pays semi-annually) | 11/25/23 | 101,944 | — | 101,944 |
| THB | 175,000 | Pays | Thai Overnight Repurchase Rate
(pays semi-annually) | 1.29%
(pays semi-annually) | 11/25/24 | (103,915) | — | (103,915) |
| THB | 233,000 | Receives | Thai Overnight Repurchase Rate
(pays semi-annually) | 1.02%
(pays semi-annually) | 3/17/25 | 157,442 | — | 157,442 |
| THB | 291,000 | Pays | Thai Overnight Repurchase Rate
(pays semi-annually) | 0.90%
(pays semi-annually) | 2/23/26 | (357,530) | — | (357,530) |
| THB | 120,000 | Pays | Thai Overnight Repurchase Rate
(pays semi-annually) | 1.30%
(pays semi-annually) | 11/18/26 | (148,642) | — | (148,642) |
| THB | 514,900 | Pays | Thai Overnight Repurchase Rate
(pays semi-annually) | 2.94%
(pays semi-annually) | 12/20/28 | 42,176 | — | 42,176 |
| THB | 177,200 | Pays | Thai Overnight Repurchase Rate
(pays semi-annually) | 2.95%
(pays semi-annually) | 12/20/28 | 16,601 | — | 16,601 |
| THB | 204,600 | Pays | Thai Overnight Repurchase Rate
(pays semi-annually) | 1.72%
(pays semi-annually) | 10/29/31 | (592,160) | — | (592,160) |
| THB | 200,000 | Pays | Thai Overnight Repurchase Rate
(pays semi-annually) | 1.69%
(pays semi-annually) | 11/4/31 | (615,881) | — | (615,881) |
| ZAR | 244,000 | Receives | 3-month ZAR JIBAR
(pays quarterly) | 7.04%
(pays quarterly) | 3/12/25 | 231,399 | — | 231,399 |
| ZAR | 65,700 | Receives | 3-month ZAR JIBAR
(pays quarterly) | 6.91%
(pays quarterly) | 3/13/25 | 69,085 | — | 69,085 |
39
See Notes to Financial Statements.
Emerging Markets Local Income Portfolio
October 31, 2023
Portfolio of Investments — continued
| Interest Rate Swaps (Centrally Cleared) (continued) |
Notional Amount
(000's omitted) | Portfolio
Pays/
Receives
Floating
Rate | Floating Rate | Annual
Fixed Rate | Termination
Date | Value | Unamortized
Upfront
Receipts
(Payments) | Unrealized
Appreciation
(Depreciation) |
| ZAR | 132,000 | Receives | 3-month ZAR JIBAR
(pays quarterly) | 6.64%
(pays quarterly) | 10/18/26 | $ 300,475 | $ (472) | $ 300,003 |
| Total | | | | | | $(14,215,265) | $(158) | $ (14,215,423) |
| Interest Rate Swaps (OTC) |
| Counterparty | Notional Amount
(000's omitted) | Portfolio
Pays/Receives
Floating Rate | Floating Rate | Annual
Fixed Rate | Termination
Date | Value/Unrealized
Appreciation
(Depreciation) |
| BNP Paribas | MYR | 17,413 | Pays | 3-month MYR KLIBOR
(pays quarterly) | 2.95%
(pays quarterly) | 3/16/27 | $ (109,235) |
| Citibank, N.A. | THB | 87,340 | Pays | 6-month THB Fixing Rate
(pays semi-annually) | 1.96%
(pays semi-annually) | 3/18/24 | (7,768) |
| Deutsche Bank AG | THB | 324,320 | Pays | 6-month THB Fixing Rate
(pays semi-annually) | 2.13%
(pays semi-annually) | 11/19/23 | 8,008 |
| JPMorgan Chase Bank, N.A. | MYR | 88,787 | Pays | 3-month MYR KLIBOR
(pays quarterly) | 2.95%
(pays quarterly) | 3/16/27 | (557,615) |
| Total | | | | | | | $(666,610) |
| Credit Default Swaps - Buy Protection (Centrally Cleared) | |
| Reference Entity | Notional
Amount
(000's omitted) | Contract
Annual
Fixed Rate* | Termination
Date | Value | Unamortized
Upfront
Receipts
(Payments) | Unrealized
Appreciation
(Depreciation) |
| Markit CDX Emerging Markets Index (CDX.EM.31.V3) | | $86 | 1.00%
(pays quarterly)(1) | 6/20/24 | $ (391) | $ (1,677) | $ (2,068) |
| Total | | | | | $(391) | $(1,677) | $(2,068) |
| * | The contract annual fixed rate represents the fixed rate of interest paid by the Portfolio (as a buyer of protection) on the notional amount of the credit default swap contract. |
| (1) | Upfront payment is exchanged with the counterparty as a result of the standardized trading coupon. |
| Abbreviations: |
| BUBOR | – Budapest Interbank Offered Rate |
| FBIL | – Financial Benchmarks India Ltd. |
| JIBAR | – Johannesburg Interbank Average Rate |
| KLIBOR | – Kuala Lumpur Interbank Offered Rate |
| MIBOR | – Mumbai Interbank Offered Rate |
| OTC | – Over-the-counter |
| PRIBOR | – Prague Interbank Offered Rate |
| WIBOR | – Warsaw Interbank Offered Rate |
40
See Notes to Financial Statements.
Emerging Markets Local Income Portfolio
October 31, 2023
Portfolio of Investments — continued
| Currency Abbreviations: |
| AMD | – Armenian Dram |
| BAM | – Bosnia-Herzegovina Convertible Mark |
| BRL | – Brazilian Real |
| CLP | – Chilean Peso |
| CNH | – Yuan Renminbi Offshore |
| CNY | – Yuan Renminbi |
| COP | – Colombian Peso |
| CZK | – Czech Koruna |
| DOP | – Dominican Peso |
| EUR | – Euro |
| HUF | – Hungarian Forint |
| IDR | – Indonesian Rupiah |
| ILS | – Israeli Shekel |
| INR | – Indian Rupee |
| KRW | – South Korean Won |
| LKR | – Sri Lankan Rupee |
| |
| MXN | – Mexican Peso |
| MYR | – Malaysian Ringgit |
| NGN | – Nigerian Naira |
| PEN | – Peruvian Sol |
| PLN | – Polish Zloty |
| RON | – Romanian Leu |
| RSD | – Serbian Dinar |
| THB | – Thai Baht |
| TRY | – Turkish Lira |
| UAH | – Ukrainian Hryvnia |
| USD | – United States Dollar |
| UYU | – Uruguayan Peso |
| UZS | – Uzbekistani Som |
| ZAR | – South African Rand |
| ZMW | – Zambian Kwacha |
41
See Notes to Financial Statements.
Emerging Markets Local Income Portfolio
October 31, 2023
Statement of Assets and Liabilities
| | October 31, 2023 |
| Assets | |
| Unaffiliated investments, at value (identified cost $1,043,053,162) | $ 918,669,968 |
| Affiliated investments, at value (identified cost $97,178,009) | 97,178,009 |
| Cash | 244,397 |
| Deposits for derivatives collateral: | |
| Futures contracts | 427,600 |
| Centrally cleared derivatives | 31,137,406 |
| OTC derivatives | 1,944,000 |
| Foreign currency, at value (identified cost $27,055,536) | 26,902,809 |
| Interest receivable | 19,713,635 |
| Dividends receivable from affiliated investments | 309,717 |
| Receivable for investments sold | 258,346 |
| Receivable for variation margin on open centrally cleared derivatives | 115,861 |
| Receivable for open forward foreign currency exchange contracts | 14,005,403 |
| Receivable for open swap contracts | 8,009 |
| Receivable for open non-deliverable bond forward contracts | 303,133 |
| Trustees' deferred compensation plan | 76,997 |
| Total assets | $1,111,295,290 |
| Liabilities | |
| Cash collateral due to brokers | $ 1,944,000 |
| Payable for reverse repurchase agreements, including accrued interest of $36,006 | 11,447,196 |
| Written options outstanding, at value (premiums received $180,858) | 108,317 |
| Payable for investments purchased | 215,738 |
| Payable for securities sold short, at value (proceeds $8,108,487) | 7,897,239 |
| Payable for variation margin on open futures contracts | 617 |
| Payable for open forward foreign currency exchange contracts | 16,815,163 |
| Payable for open swap contracts | 674,618 |
| Payable for closed swap contracts | 72,097 |
| Payable for open non-deliverable bond forward contracts | 261,375 |
| Payable to affiliates: | |
| Investment adviser fee | 581,161 |
| Trustees' fees | 6,387 |
| Trustees' deferred compensation plan | 76,997 |
| Interest payable on securities sold short | 402,881 |
| Accrued foreign capital gains taxes | 354,305 |
| Accrued expenses | 423,036 |
| Total liabilities | $ 41,281,127 |
| Net Assets applicable to investors' interest in Portfolio | $1,070,014,163 |
42
See Notes to Financial Statements.
Emerging Markets Local Income Portfolio
October 31, 2023
| | Year Ended |
| | October 31, 2023 |
| Investment Income | |
| Dividend income from affiliated investments | $ 4,233,631 |
| Interest income (net of foreign taxes withheld of $1,465,277) | 76,327,546 |
| Total investment income | $ 80,561,177 |
| Expenses | |
| Investment adviser fee | $ 7,293,177 |
| Trustees’ fees and expenses | 72,550 |
| Custodian fee | 687,836 |
| Legal and accounting services | 167,742 |
| Miscellaneous | 42,579 |
| Total expenses | $ 8,263,884 |
| Deduct: | |
| Waiver and/or reimbursement of expenses by affiliates | $ 139,990 |
| Total expense reductions | $ 139,990 |
| Net expenses | $ 8,123,894 |
| Net investment income | $ 72,437,283 |
| Realized and Unrealized Gain (Loss) | |
| Net realized gain (loss): | |
| Investment transactions (net of foreign capital gains taxes of $147,122) | $(105,948,046) |
| Written options | 15,859 |
| Securities sold short | 79,751 |
| Futures contracts | 439,343 |
| Swap contracts | (19,955,113) |
| Foreign currency transactions | 11,329,290 |
| Forward foreign currency exchange contracts | 45,468,483 |
| Non-deliverable bond forward contracts | 4,851,325 |
| Net realized loss | $ (63,719,108) |
| Change in unrealized appreciation (depreciation): | |
| Investments (including net increase in accrued foreign capital gains taxes of $108,306) | $ 131,646,403 |
| Written options | 72,541 |
| Securities sold short | 211,248 |
| Futures contracts | (83,986) |
| Swap contracts | 13,218,974 |
| Foreign currency | 962,591 |
| Forward foreign currency exchange contracts | (16,417,746) |
| Non-deliverable bond forward contracts | 1,162,661 |
| Net change in unrealized appreciation (depreciation) | $ 130,772,686 |
| Net realized and unrealized gain | $ 67,053,578 |
| Net increase in net assets from operations | $ 139,490,861 |
43
See Notes to Financial Statements.
Emerging Markets Local Income Portfolio
October 31, 2023
Statements of Changes in Net Assets
| | Year Ended October 31, |
| | 2023 | 2022 |
| Increase (Decrease) in Net Assets | | |
| From operations: | | |
| Net investment income | $ 72,437,283 | $ 79,020,018 |
| Net realized loss | (63,719,108) | (174,403,398) |
| Net change in unrealized appreciation (depreciation) | 130,772,686 | (183,608,590) |
| Net increase (decrease) in net assets from operations | $ 139,490,861 | $ (278,991,970) |
| Capital transactions: | | |
| Contributions | $ 327,529,582 | $ 154,343,479 |
| Withdrawals | (355,736,811) | (478,241,966) |
| Net decrease in net assets from capital transactions | $ (28,207,229) | $ (323,898,487) |
| Net increase (decrease) in net assets | $ 111,283,632 | $ (602,890,457) |
| Net Assets | | |
| At beginning of year | $ 958,730,531 | $1,561,620,988 |
| At end of year | $1,070,014,163 | $ 958,730,531 |
44
See Notes to Financial Statements.
Emerging Markets Local Income Portfolio
October 31, 2023
| | Year Ended October 31, |
| Ratios/Supplemental Data | 2023 | 2022 | 2021 | 2020 | 2019 |
| Ratios (as a percentage of average daily net assets): | | | | | |
| Expenses | 0.72% (1) | 0.76% (1) | 0.75% | 0.79% | 0.78% |
| Net investment income | 6.43% | 6.43% | 4.98% | 5.79% | 7.01% |
| Portfolio Turnover | 67% | 33% | 56% | 56% | 46% |
| Total Return | 15.00% | (20.12)% | 1.48% | 0.08% | 23.15% |
| Net assets, end of year (000’s omitted) | $1,070,014 | $958,731 | $1,561,621 | $1,253,935 | $1,238,490 |
| (1) | Includes a reduction by the investment adviser of a portion of its adviser fee due to the Portfolio’s investment in the Liquidity Fund (equal to 0.01% and less than 0.005% of average daily net assets for the years ended October 31, 2023 and 2022, respectively). |
Emerging Markets Local Income Portfolio
October 31, 2023
Notes to Financial Statements
1 Significant Accounting Policies
Emerging Markets Local Income Portfolio (the Portfolio) is a Massachusetts business trust registered under the Investment Company Act of 1940, as amended (the 1940 Act), as a non-diversified, open-end management investment company. The Portfolio’s investment objective is total return. The Declaration of Trust permits the Trustees to issue interests in the Portfolio. At October 31, 2023, Eaton Vance Emerging Markets Local Income Fund, Eaton Vance Short Duration Strategic Income Fund and Eaton Vance International (Cayman Islands) Short Duration Strategic Income Fund held an interest of 89.1%, 10.6% and 0.3%, respectively, in the Portfolio.
The following is a summary of significant accounting policies of the Portfolio. The policies are in conformity with accounting principles generally accepted in the United States of America (U.S. GAAP). The Portfolio is an investment company and follows accounting and reporting guidance in the Financial Accounting Standards Board (FASB) Accounting Standards Codification Topic 946.
A Investment Valuation—The following methodologies are used to determine the market value or fair value of investments.
Debt Obligations. Debt obligations are generally valued on the basis of valuations provided by third party pricing services, as derived from such services’ pricing models. Inputs to the models may include, but are not limited to, reported trades, executable bid and ask prices, broker/dealer quotations, prices or yields of securities with similar characteristics, interest rates, anticipated prepayments, benchmark curves or information pertaining to the issuer, as well as industry and economic events. The pricing services may use a matrix approach, which considers information regarding securities with similar characteristics to determine the valuation for a security. Short-term debt obligations purchased with a remaining maturity of sixty days or less for which a valuation from a third party pricing service is not readily available may be valued at amortized cost, which approximates fair value.
Derivatives. U.S. exchange-traded options are valued at the mean between the bid and ask prices at valuation time as reported by the Options Price Reporting Authority. Non U.S. exchange-traded options and over-the-counter options (including options on securities, indices and foreign currencies) are valued by a third party pricing service using techniques that consider factors including the value of the underlying instrument, the volatility of the underlying instrument and the period of time until option expiration. Futures contracts are valued at the closing settlement price established by the board of trade or exchange on which they are traded. Forward foreign currency exchange contracts are generally valued at the mean of the average bid and average ask prices that are reported by currency dealers to a third party pricing service at the valuation time. Such third party pricing service valuations are supplied for specific settlement periods and the Portfolio’s forward foreign currency exchange contracts are valued at an interpolated rate between the closest preceding and subsequent settlement period reported by the third party pricing service. Non-deliverable bond forward contracts are generally valued based on the current price of the underlying bond as provided by a third party pricing service and current interest rates. Swaps are normally valued using valuations provided by a third party pricing service. Such pricing service valuations are based on the present value of fixed and projected floating rate cash flows over the term of the swap contract, and in the case of credit default swaps, based on credit spread quotations obtained from broker/dealers and expected default recovery rates determined by the pricing service using proprietary models. Future cash flows on swaps are discounted to their present value using swap rates provided by electronic data services or by broker/dealers.
Foreign Securities and Currencies. Foreign securities and currencies are valued in U.S. dollars, based on foreign currency exchange rate quotations supplied by a third party pricing service. The pricing service uses a proprietary model to determine the exchange rate. Inputs to the model include reported trades and implied bid/ask spreads.
Other. Investments in management investment companies (including money market funds) that do not trade on an exchange are valued at the net asset value as of the close of each business day.
Fair Valuation. In connection with Rule 2a-5 of the 1940 Act, the Trustees have designated the Portfolio’s investment adviser as its valuation designee. Investments for which valuations or market quotations are not readily available or are deemed unreliable are valued by the investment adviser, as valuation designee, at fair value using methods that most fairly reflect the security’s “fair value”, which is the amount that the Portfolio might reasonably expect to receive for the security upon its current sale in the ordinary course. Each such determination is based on a consideration of relevant factors, which are likely to vary from one pricing context to another. These factors may include, but are not limited to, the type of security, the existence of any contractual restrictions on the security’s disposition, the price and extent of public trading in similar securities of the issuer or of comparable companies or entities, quotations or relevant information obtained from broker/dealers or other market participants, information obtained from the issuer, analysts, and/or the appropriate stock exchange (for exchange-traded securities), an analysis of the company’s or entity’s financial statements, and an evaluation of the forces that influence the issuer and the market(s) in which the security is purchased and sold.
B Investment Transactions—Investment transactions for financial statement purposes are accounted for on a trade date basis. Realized gains and losses on investments sold are determined on the basis of identified cost.
C Income—Interest income is recorded on the basis of interest accrued, adjusted for amortization of premium or accretion of discount. Inflation adjustments to the principal amount of inflation-adjusted bonds and notes are reflected as interest income. Deflation adjustments to the principal amount of an inflation-adjusted bond or note are reflected as reductions to interest income to the extent of interest income previously recorded on such bond or note. Dividend income is recorded on the ex-dividend date for dividends received in cash and/or securities. Withholding taxes on foreign interest and capital gains have been provided for in accordance with the Portfolio's understanding of the applicable countries’ tax rules and rates.
Emerging Markets Local Income Portfolio
October 31, 2023
Notes to Financial Statements — continued
D Federal and Other Taxes—The Portfolio has elected to be treated as a partnership for federal tax purposes. No provision is made by the Portfolio for federal or state taxes on any taxable income of the Portfolio because each investor in the Portfolio is ultimately responsible for the payment of any taxes on its share of taxable income. Since at least one of the Portfolio’s investors is a regulated investment company that invests all or substantially all of its assets in the Portfolio, the Portfolio normally must satisfy the applicable source of income and diversification requirements (under the Internal Revenue Code) in order for its investors to satisfy them. The Portfolio will allocate, at least annually among its investors, each investor’s distributive share of the Portfolio’s net investment income, net realized capital gains and losses and any other items of income, gain, loss, deduction or credit.
In addition to the requirements of the Internal Revenue Code, the Portfolio may also be subject to local taxes on the recognition of capital gains in certain countries. In determining the daily net asset value, the Portfolio estimates the accrual for such taxes, if any, based on the unrealized appreciation on certain portfolio securities and the related tax rates. Taxes attributable to unrealized appreciation are included in the change in unrealized appreciation (depreciation) on investments. Capital gains taxes on securities sold are included in net realized gain (loss) on investments.
As of October 31, 2023, the Portfolio had no uncertain tax positions that would require financial statement recognition, de-recognition, or disclosure. The Portfolio files a U.S. federal income tax return annually after its fiscal year-end, which is subject to examination by the Internal Revenue Service for a period of three years from the date of filing.
E Foreign Currency Translation—Investment valuations, other assets, and liabilities initially expressed in foreign currencies are translated each business day into U.S. dollars based upon current exchange rates. Purchases and sales of foreign investment securities and income and expenses denominated in foreign currencies are translated into U.S. dollars based upon currency exchange rates in effect on the respective dates of such transactions. Recognized gains or losses on investment transactions attributable to changes in foreign currency exchange rates are recorded for financial statement purposes as net realized gains and losses on investments. That portion of unrealized gains and losses on investments that results from fluctuations in foreign currency exchange rates is not separately disclosed.
F Use of Estimates—The preparation of the financial statements in conformity with U.S. GAAP requires management to make estimates and assumptions that affect the reported amounts of assets and liabilities at the date of the financial statements and the reported amounts of income and expense during the reporting period. Actual results could differ from those estimates.
G Indemnifications—Under the Portfolio’s organizational documents, its officers and Trustees may be indemnified against certain liabilities and expenses arising out of the performance of their duties to the Portfolio. Under Massachusetts law, if certain conditions prevail, interestholders in the Portfolio could be deemed to have personal liability for the obligations of the Portfolio. However, the Portfolio’s Declaration of Trust contains an express disclaimer of liability on the part of Portfolio interestholders. Additionally, in the normal course of business, the Portfolio enters into agreements with service providers that may contain indemnification clauses. The Portfolio’s maximum exposure under these arrangements is unknown as this would involve future claims that may be made against the Portfolio that have not yet occurred.
H Futures Contracts—Upon entering into a futures contract, the Portfolio is required to deposit with the broker, either in cash or securities, an amount equal to a certain percentage of the contract amount (initial margin). Subsequent payments, known as variation margin, are made or received by the Portfolio each business day, depending on the daily fluctuations in the value of the underlying security, and are recorded as unrealized gains or losses by the Portfolio. Gains (losses) are realized upon the expiration or closing of the futures contracts. Should market conditions change unexpectedly, the Portfolio may not achieve the anticipated benefits of the futures contracts and may realize a loss. Futures contracts have minimal counterparty risk as they are exchange traded and the clearinghouse for the exchange is substituted as the counterparty, guaranteeing counterparty performance.
I Forward Foreign Currency Exchange and Non-Deliverable Bond Forward Contracts—The Portfolio may enter into forward foreign currency exchange contracts for the purchase or sale of a specific foreign currency at a fixed price on a future date. The forward foreign currency exchange contracts are adjusted by the daily exchange rate of the underlying currency and any gains or losses are recorded as unrealized until such time as the contracts have been closed. While forward foreign currency exchange contracts are privately negotiated agreements between the Portfolio and a counterparty, certain contracts may be “centrally cleared”, whereby all payments made or received by the Portfolio pursuant to the contract are with a central clearing party (CCP) rather than the original counterparty. The CCP guarantees the performance of the original parties to the contract. Upon entering into centrally cleared contracts, the Portfolio is required to deposit with the CCP, either in cash or securities, an amount of initial margin determined by the CCP, which is subject to adjustment. For centrally cleared contracts, the daily change in valuation is recorded as a receivable or payable for variation margin and settled in cash with the CCP daily. The Portfolio may also enter into non-deliverable bond forward contracts for the purchase of a bond denominated in a non-deliverable foreign currency at a fixed price on a future date. For non-deliverable bond forward contracts, unrealized gains and losses, based on changes in the value of the contract, and realized gains and losses are accounted for as described above. Risks may arise upon entering these contracts from the potential inability of counterparties to meet the terms of their contracts and from movements in the value of a foreign currency relative to the U.S. dollar. In the case of centrally cleared contracts, counterparty risk is minimal due to protections provided by the CCP.
J Purchased Options���Upon the purchase of a call or put option, the premium paid by the Portfolio is included in the Statement of Assets and Liabilities as an investment. The amount of the investment is subsequently marked-to-market to reflect the current market value of the option purchased, in accordance with the Portfolio’s policies on investment valuations discussed above. Premiums paid for purchasing options that expire are treated as realized losses. Premiums paid for purchasing options that are exercised or closed are added to the amounts paid or offset against the proceeds on the underlying
Emerging Markets Local Income Portfolio
October 31, 2023
Notes to Financial Statements — continued
investment transaction to determine the realized gain or loss. The risk associated with purchasing options is limited to the premium originally paid. Purchased options traded over-the-counter involve risk that the issuer or counterparty will fail to perform its contractual obligations.
K Written Options—Upon the writing of a call or a put option, the premium received by the Portfolio is included in the Statement of Assets and Liabilities as a liability. The amount of the liability is subsequently marked-to-market to reflect the current market value of the option written, in accordance with the Portfolio’s policies on investment valuations discussed above. Premiums received from writing options that expire are treated as realized gains. Premiums received from writing options that are exercised or are closed are added to or offset against the proceeds or amount paid on the transaction to determine the realized gain or loss. The Portfolio, as a writer of an option, may have no control over whether the underlying instrument may be sold (call) or purchased (put) and, as a result, bears the market risk of an unfavorable change in the price of the instrument underlying the written option. The Portfolio may also bear the risk of not being able to enter into a closing transaction if a liquid secondary market does not exist.
L Interest Rate Swaps—Swap contracts are privately negotiated agreements between the Portfolio and a counterparty. Certain swap contracts may be centrally cleared. Pursuant to interest rate swap agreements, the Portfolio either makes floating-rate payments to the counterparty (or CCP in the case of centrally cleared swaps) based on a benchmark interest rate in exchange for fixed-rate payments or the Portfolio makes fixed-rate payments to the counterparty (or CCP in the case of a centrally cleared swap) in exchange for payments on a floating benchmark interest rate. Payments received or made, including amortization of upfront payments/receipts, if any (which are amortized over the life of the swap contract), are recorded as realized gains or losses. During the term of the outstanding swap agreement, changes in the underlying value of the swap are recorded as unrealized gains or losses. For centrally cleared swaps, the daily change in valuation is recorded as a receivable or payable for variation margin and settled in cash with the CCP daily. The value of the swap is determined by changes in the relationship between two rates of interest. The Portfolio is exposed to credit loss in the event of non-performance by the swap counterparty. In the case of centrally cleared swaps, counterparty risk is minimal due to protections provided by the CCP. Risk may also arise from movements in interest rates.
M Cross-Currency Swaps—Cross-currency swaps are interest rate swaps in which interest cash flows are exchanged between two parties based on the notional amounts of two different currencies. The notional amounts are typically determined based on the spot exchange rates at the inception of the trade. Cross-currency swaps also involve the exchange of the notional amounts at the start of the contract at the current spot rate with an agreement to re-exchange such amounts at a later date at either the same exchange rate, a specified rate or the then current spot rate. The entire principal value of a cross-currency swap is subject to the risk that the counterparty to the swap will default on its contractual delivery obligations.
N Credit Default Swaps—When the Portfolio is the buyer of a credit default swap contract, the Portfolio is entitled to receive the par (or other agreed-upon) value of a referenced debt obligation (or basket of debt obligations) from the counterparty (or CCP in the case of a centrally cleared swap) to the contract if a credit event by a third party, such as a U.S. or foreign corporate issuer or sovereign issuer, on the debt obligation occurs. In return, the Portfolio pays the counterparty a periodic stream of payments over the term of the contract provided that no credit event has occurred. If no credit event occurs, the Portfolio would have spent the stream of payments and received no proceeds from the contract. When the Portfolio is the seller of a credit default swap contract, it receives the stream of payments, but is obligated to pay to the buyer of the protection an amount up to the notional amount of the swap and in certain instances take delivery of securities of the reference entity upon the occurrence of a credit event, as defined under the terms of that particular swap agreement. Credit events are contract specific but may include bankruptcy, failure to pay, restructuring, obligation acceleration and repudiation/moratorium. If the Portfolio is a seller of protection and a credit event occurs, the maximum potential amount of future payments that the Portfolio could be required to make would be an amount equal to the notional amount of the agreement. This potential amount would be partially offset by any recovery value of the respective referenced obligation, or net amount received from the settlement of a buy protection credit default swap agreement entered into by the Portfolio for the same referenced obligation. As the seller, the Portfolio may create economic leverage to its portfolio because, in addition to its total net assets, the Portfolio is subject to investment exposure on the notional amount of the swap. The interest fee paid or received on the swap contract, which is based on a specified interest rate on a fixed notional amount, is accrued daily as a component of unrealized appreciation (depreciation) and is recorded as realized gain upon receipt or realized loss upon payment. The Portfolio also records an increase or decrease to unrealized appreciation (depreciation) in an amount equal to the daily valuation. For centrally cleared swaps, the daily change in valuation is recorded as a receivable or payable for variation margin and settled in cash with the CCP daily. All upfront payments and receipts, if any, are amortized over the life of the swap contract as realized gains or losses. Those upfront payments or receipts for non-centrally cleared swaps are recorded as other assets or other liabilities, respectively, net of amortization. For financial reporting purposes, unamortized upfront payments or receipts, if any, are netted with unrealized appreciation or depreciation on swap contracts to determine the market value of swaps as presented in Notes 5 and 9. These transactions involve certain risks, including the risk that the seller may be unable to fulfill the transaction. In the case of centrally cleared swaps, counterparty risk is minimal due to protections provided by the CCP.
O Repurchase Agreements—A repurchase agreement is the purchase by the Portfolio of securities from a counterparty in exchange for cash that is coupled with an agreement to resell those securities to the counterparty at a specified date and price. When a repurchase agreement is entered, the Portfolio typically receives securities with a value that equals or exceeds the repurchase price, including any accrued interest earned on the agreement. The value of such securities will be marked-to-market daily, and cash or additional securities will be exchanged between the parties as needed. Except in the case of a repurchase agreement entered to settle a short sale, the value of the securities delivered to the Portfolio will be at least equal to 90% of the repurchase price during the term of the repurchase agreement. The terms of a repurchase agreement entered to settle a short sale may provide that the cash purchase price paid by the Portfolio is more than the value of purchased securities that effectively collateralize the repurchase price payable by the counterparty. In the event of insolvency of the counterparty to a repurchase agreement, recovery of the repurchase price owed to the Portfolio may be
Emerging Markets Local Income Portfolio
October 31, 2023
Notes to Financial Statements — continued
delayed. Such an insolvency also may result in a loss to the extent that the value of the purchased securities decreases during the delay or that value has otherwise not been maintained at an amount at least equal to the repurchase price.
P Reverse Repurchase Agreements—Under a reverse repurchase agreement, the Portfolio temporarily transfers possession of a portfolio security to another party, such as a bank or broker/dealer, in return for cash. At the same time, the Portfolio agrees to repurchase the security at an agreed upon time and price, which reflects an interest payment. In periods of increased demand for a security, the Portfolio may receive a payment from the counterparty for the use of the security, which is recorded as interest income. Because the Portfolio retains effective control over the transferred security, the transaction is accounted for as a secured borrowing. The Portfolio may enter into such agreements when it believes it is able to invest the cash acquired at a rate higher than the cost of the agreement, which would increase earned income. When the Portfolio enters into a reverse repurchase agreement, any fluctuations in the market value of either the securities transferred to another party or the securities in which the proceeds may be invested would affect the market value of the Portfolio’s assets. Because reverse repurchase agreements may be considered to be the practical equivalent of borrowing funds (and the counterparty making a loan), they constitute a form of leverage. The Portfolio segregates cash or liquid assets equal to its obligation to repurchase the security. During the term of the agreement, the Portfolio may also be obligated to pledge additional cash and/or securities in the event of a decline in the fair value of the transferred security. In the event the counterparty to a reverse repurchase agreement becomes insolvent, recovery of the security transferred by the Portfolio may be delayed or the Portfolio may incur a loss equal to the amount by which the value of the security transferred by the Portfolio exceeds the repurchase price payable by the Portfolio.
Q Securities Sold Short—A short sale is a transaction in which the Portfolio sells a security it does not own in anticipation of a decline in the market value of that security. To complete such a transaction, the Portfolio must borrow the security to make delivery to the buyer with an obligation to replace such borrowed security at a later date. Until the security is replaced, the Portfolio is required to repay the lender any dividends or interest, which accrue during the period of the loan. The proceeds received from a short sale are recorded as a liability and the Portfolio records an unrealized gain or loss to the extent of the difference between the proceeds received and the value of the open short position on the day of determination. A gain, limited to the price at which the Portfolio sold the security short, or a loss, potentially unlimited as there is no upward limit on the price of a security, is recorded when the short position is terminated. Interest and dividends payable on securities sold short are recorded as an expense.
2 Investment Adviser Fee and Other Transactions with Affiliates
The investment adviser fee is earned by Boston Management and Research (BMR), an indirect, wholly-owned subsidiary of Morgan Stanley, as compensation for investment advisory services rendered to the Portfolio. The investment adviser fee is computed at an annual rate as a percentage of the Portfolio’s average daily net assets as follows and is payable monthly:
| Average Daily Net Assets | Annual Fee Rate |
| Up to $1 billion | 0.650% |
| $1 billion but less than $2 billion | 0.625% |
| $2 billion but less than $5 billion | 0.600% |
| $5 billion and over | 0.575% |
For the year ended October 31, 2023, the Portfolio’s investment adviser fee amounted to $7,293,177 or 0.65% of the Portfolio’s average daily net assets.
The Portfolio may invest in a money market fund, the Institutional Class of the Morgan Stanley Institutional Liquidity Funds - Government Portfolio (the “Liquidity Fund”), an open-end management investment company managed by Morgan Stanley Investment Management Inc., a wholly-owned subsidiary of Morgan Stanley. The investment adviser fee paid by the Portfolio is reduced by an amount equal to its pro rata share of the advisory and administration fees paid by the Portfolio due to its investment in the Liquidity Fund. For the year ended October 31, 2023, the investment adviser fee paid was reduced by $139,990 relating to the Portfolio's investment in the Liquidity Fund.
During the year ended October 31, 2023, BMR reimbursed the Portfolio $27,496 for a net realized loss due to a trading error. The amount of the reimbursement had an impact on total return of less than 0.01%.
Trustees and officers of the Portfolio who are members of BMR’s organization receive remuneration for their services to the Portfolio out of the investment adviser fee. Trustees of the Portfolio who are not affiliated with the investment adviser may elect to defer receipt of all or a percentage of their annual fees in accordance with the terms of the Trustees Deferred Compensation Plan. Certain officers and Trustees of the Portfolio are officers of the above organization.
3 Purchases and Sales of Investments
Purchases and sales of investments, other than short-term obligations and including maturities, paydowns and securities sold short, aggregated $747,388,313 and $577,292,592, respectively, for the year ended October 31, 2023.
Emerging Markets Local Income Portfolio
October 31, 2023
Notes to Financial Statements — continued
4 Federal Income Tax Basis of Investments
The cost and unrealized appreciation (depreciation) of investments, including open derivative contracts, of the Portfolio at October 31, 2023, as determined on a federal income tax basis, were as follows:
| Aggregate cost | $1,063,376,993 |
| Gross unrealized appreciation | $ 88,272,436 |
| Gross unrealized depreciation | (143,735,525) |
| Net unrealized depreciation | $ (55,463,089) |
5 Financial Instruments
The Portfolio may trade in financial instruments with off-balance sheet risk in the normal course of its investing activities. These financial instruments may include written options, forward foreign currency exchange contracts, non-deliverable bond forward contracts, futures contracts and swap contracts and may involve, to a varying degree, elements of risk in excess of the amounts recognized for financial statement purposes. The notional or contractual amounts of these instruments represent the investment the Portfolio has in particular classes of financial instruments and do not necessarily represent the amounts potentially subject to risk. The measurement of the risks associated with these instruments is meaningful only when all related and offsetting transactions are considered. A summary of obligations under these financial instruments at October 31, 2023 is included in the Portfolio of Investments. At October 31, 2023, the Portfolio had sufficient cash and/or securities to cover commitments under these contracts.
In the normal course of pursuing its investment objective, the Portfolio is subject to the following risks:
Credit Risk: The Portfolio enters into credit default swap contracts to enhance total return and/or as a substitute for the purchase or sale of securities.
Foreign Exchange Risk: The Portfolio engages in forward foreign currency exchange contracts, currency options and cross-currency swaps to enhance total return, to seek to hedge against fluctuations in currency exchange rates and/or as a substitute for the purchase or sale of securities or currencies.
Interest Rate Risk: The Portfolio utilizes various interest rate derivatives including non-deliverable bond forward contracts, interest rate futures contracts, interest rate swaps and cross-currency swaps to enhance total return, to seek to hedge against fluctuations in interest rates and/or to change the effective duration of its portfolio.
The Portfolio enters into over-the-counter (OTC) derivatives that may contain provisions whereby the counterparty may terminate the contract under certain conditions, including but not limited to a decline in the Portfolio’s net assets below a certain level over a certain period of time, which would trigger a payment by the Portfolio for those derivatives in a liability position. At October 31, 2023, the fair value of derivatives with credit-related contingent features in a net liability position was $17,859,473. The aggregate fair value of assets pledged as collateral by the Portfolio for such liability was $15,213,466 at October 31, 2023.
The OTC derivatives in which the Portfolio invests (except for written options as the Portfolio, not the counterparty, is obligated to perform) are subject to the risk that the counterparty to the contract fails to perform its obligations under the contract. To mitigate this risk, the Portfolio has entered into an International Swaps and Derivatives Association, Inc. Master Agreement (“ISDA Master Agreement”) or similar agreement with substantially all its derivative counterparties. An ISDA Master Agreement is a bilateral agreement between the Portfolio and a counterparty that governs certain OTC derivatives and typically contains, among other things, set-off provisions in the event of a default and/or termination event as defined under the relevant ISDA Master Agreement. Under an ISDA Master Agreement, the Portfolio may, under certain circumstances, offset with the counterparty certain derivative financial instruments’ payables and/or receivables with collateral held and/or posted and create one single net payment. The provisions of the ISDA Master Agreement typically permit a single net payment in the event of default including the bankruptcy or insolvency of the counterparty. However, bankruptcy or insolvency laws of a particular jurisdiction may impose restrictions on or prohibitions against the right of offset in bankruptcy or insolvency. Certain ISDA Master Agreements allow counterparties to OTC derivatives to terminate derivative contracts prior to maturity in the event the Portfolio’s net assets decline by a stated percentage or the Portfolio fails to meet the terms of its ISDA Master Agreements, which would cause the counterparty to accelerate payment by the Portfolio of any net liability owed to it.
The collateral requirements for derivatives traded under an ISDA Master Agreement are governed by a Credit Support Annex to the ISDA Master Agreement. Collateral requirements are determined at the close of business each day and are typically based on changes in market values for each transaction under an ISDA Master Agreement and netted into one amount for such agreement. Generally, the amount of collateral due from or to a counterparty is subject to a minimum transfer threshold amount before a transfer is required, which may vary by counterparty. Collateral pledged for the benefit of the Portfolio and/or counterparty is held in segregated accounts by the Portfolio’s custodian and cannot be sold, re-pledged, assigned or otherwise used while pledged. The portion of such collateral representing cash, if any, is reflected as deposits for derivatives collateral and, in the case of cash pledged by a counterparty for
Emerging Markets Local Income Portfolio
October 31, 2023
Notes to Financial Statements — continued
the benefit of the Portfolio, a corresponding liability on the Statement of Assets and Liabilities. Securities pledged by the Portfolio as collateral, if any, are identified as such in the Portfolio of Investments. The carrying amount of the liability for cash collateral due to brokers at October 31, 2023 approximated its fair value. If measured at fair value, such liability would have been considered as Level 2 in the fair value hierarchy (see Note 9) at October 31, 2023.
The fair value of open derivative instruments (not considered to be hedging instruments for accounting disclosure purposes) by risk exposure at October 31, 2023 was as follows:
| | Fair Value |
| Statement of Assets and Liabilities Caption | Credit | Foreign
Exchange | Interest
Rate | Total |
| Unaffiliated investments, at value | $ — | $ 412,361 | $ — | $ 412,361 |
| Not applicable | — | 5,890,498* | 15,447,264* | 21,337,762 |
| Receivable for open forward foreign currency exchange contracts | — | 14,005,403 | — | 14,005,403 |
| Receivable for open swap contracts | — | — | 8,008 | 8,008 |
| Receivable for open non-deliverable bond forward contracts | — | — | 303,133 | 303,133 |
| Total Asset Derivatives | $ — | $ 20,308,262 | $ 15,758,405 | $ 36,066,667 |
| Derivatives not subject to master netting or similar agreements | $ — | $ 5,890,498 | $ 15,447,264 | $ 21,337,762 |
| Total Asset Derivatives subject to master netting or similar agreements | $ — | $ 14,417,764 | $ 311,141 | $ 14,728,905 |
| Written options outstanding, at value | $ — | $ (108,317) | $ — | $ (108,317) |
| Not applicable | (391)* | (7,637,889)* | (29,524,347)* | (37,162,627) |
| Payable for open forward foreign currency exchange contracts | — | (16,815,163) | — | (16,815,163) |
| Payable for open swap contracts | — | — | (674,618) | (674,618) |
| Payable for open non-deliverable bond forward contracts | — | — | (261,375) | (261,375) |
| Total Liability Derivatives | $(391) | $(24,561,369) | $(30,460,340) | $(55,022,100) |
| Derivatives not subject to master netting or similar agreements | $(391) | $ (7,637,889) | $(29,524,347) | $(37,162,627) |
| Total Liability Derivatives subject to master netting or similar agreements | $ — | $(16,923,480) | $ (935,993) | $(17,859,473) |
| * | Only the current day’s variation margin on open futures contracts and centrally cleared derivatives is reported within the Statement of Assets and Liabilities as Receivable or Payable for variation margin on open futures contracts and centrally cleared derivatives, as applicable. |
The Portfolio's derivative assets and liabilities at fair value by risk, which are reported gross in the Statement of Assets and Liabilities, are presented in the table above. The following tables present the Portfolio's derivative assets and liabilities by counterparty, net of amounts available for offset under a master netting agreement and net of the related collateral received by the Portfolio for such assets and pledged by the Portfolio for such liabilities as of October 31, 2023.
| Counterparty | Derivative
Assets Subject to
Master Netting
Agreement | Derivatives
Available
for Offset | Non-cash
Collateral
Received(a) | Cash
Collateral
Received(a) | Net Amount
of Derivative
Assets(b) | Total Cash
Collateral
Received |
| Bank of America, N.A. | $ 247,768 | $ (139,183) | $ (52,550) | $ — | $ 56,035 | $ — |
| Barclays Bank PLC | 1,274,972 | (864,684) | — | (370,000) | 40,288 | 370,000 |
| BNP Paribas | 2,859,563 | (1,335,095) | — | (1,524,468) | — | 1,530,000 |
| Citibank, N.A. | 404,695 | (404,695) | — | — | — | — |
| Deutsche Bank AG | 8,008 | — | — | (8,008) | — | 44,000 |
| Goldman Sachs International | 2,299,990 | (2,299,990) | — | — | — | — |
| HSBC Bank USA, N.A. | 889,822 | (889,822) | — | — | — | — |
Emerging Markets Local Income Portfolio
October 31, 2023
Notes to Financial Statements — continued
| Counterparty | Derivative
Assets Subject to
Master Netting
Agreement | Derivatives
Available
for Offset | Non-cash
Collateral
Received(a) | Cash
Collateral
Received(a) | Net Amount
of Derivative
Assets(b) | Total Cash
Collateral
Received |
| ICBC Standard Bank plc | $ 28,207 | $ (28,207) | $ — | $ — | $ — | $ — |
| JPMorgan Chase Bank, N.A. | 923,151 | (923,151) | — | — | — | — |
| Standard Chartered Bank | 1,167,825 | (1,167,825) | — | — | — | — |
| State Street Bank and Trust Company | 180,886 | (180,886) | — | — | — | — |
| UBS AG | 4,444,018 | (3,237,967) | (1,206,051) | — | — | — |
| | $14,728,905 | $(11,471,505) | $(1,258,601) | $(1,902,476) | $96,323 | $1,944,000 |
| Counterparty | Derivative
Liabilities Subject to
Master Netting
Agreement | Derivatives
Available
for Offset | Non-cash
Collateral
Pledged(a) | Cash
Collateral
Pledged(a) | Net Amount
of Derivative
Liabilities(c) | Total Cash
Collateral
Pledged |
| Bank of America, N.A. | $ (139,183) | $ 139,183 | $ — | $ — | $ — | $ — |
| Barclays Bank PLC | (864,684) | 864,684 | — | — | — | — |
| BNP Paribas | (1,335,095) | 1,335,095 | — | — | — | — |
| Citibank, N.A. | (579,840) | 404,695 | 175,145 | — | — | — |
| Goldman Sachs International | (3,254,055) | 2,299,990 | 708,969 | — | (245,096) | — |
| HSBC Bank USA, N.A. | (1,956,860) | 889,822 | 869,284 | — | (197,754) | — |
| ICBC Standard Bank plc | (72,467) | 28,207 | — | — | (44,260) | — |
| JPMorgan Chase Bank, N.A. | (2,350,311) | 923,151 | 1,124,194 | — | (302,966) | — |
| Societe Generale | (461,387) | — | 461,387 | — | — | — |
| Standard Chartered Bank | (3,011,918) | 1,167,825 | 1,844,093 | — | — | — |
| State Street Bank and Trust Company | (595,706) | 180,886 | 291,753 | — | (123,067) | — |
| UBS AG | (3,237,967) | 3,237,967 | — | — | — | — |
| | $(17,859,473) | $11,471,505 | $5,474,825 | $ — | $(913,143) | $ — |
| Total — Deposits for derivatives collateral — OTC derivatives | | | | $1,944,000 |
| (a) | In some instances, the total collateral received and/or pledged may be more than the amount shown due to overcollateralization. |
| (b) | Net amount represents the net amount due from the counterparty in the event of default. |
| (c) | Net amount represents the net amount payable to the counterparty in the event of default. |
Emerging Markets Local Income Portfolio
October 31, 2023
Notes to Financial Statements — continued
The effect of derivative instruments (not considered to be hedging instruments for accounting disclosure purposes) on the Statement of Operations by risk exposure for the year ended October 31, 2023 was as follows:
| Statement of Operations Caption | Credit | Foreign
Exchange | Interest
Rate | Total |
| Net realized gain (loss): | | | | |
| Investment transactions | $ — | $ 797,239 | $ — | $ 797,239 |
| Written options | — | 15,859 | — | 15,859 |
| Futures contracts | — | — | 439,343 | 439,343 |
| Swap contracts | 18,074 | 60,233 | (20,033,420) | (19,955,113) |
| Forward foreign currency exchange contracts | — | 45,468,483 | — | 45,468,483 |
| Non-deliverable bond forward contracts | — | — | 4,851,325 | 4,851,325 |
| Total | $18,074 | $ 46,341,814 | $(14,742,752) | $ 31,617,136 |
| Change in unrealized appreciation (depreciation): | | | | |
| Investments | $ — | $ (92,975) | $ — | $ (92,975) |
| Written options | — | 72,541 | — | 72,541 |
| Futures contracts | — | — | (83,986) | (83,986) |
| Swap contracts | 1,489 | — | 13,217,485 | 13,218,974 |
| Forward foreign currency exchange contracts | — | (16,417,746) | — | (16,417,746) |
| Non-deliverable bond forward contracts | — | — | 1,162,661 | 1,162,661 |
| Total | $ 1,489 | $(16,438,180) | $ 14,296,160 | $ (2,140,531) |
The average notional cost of futures contracts and average notional amounts of other derivative contracts outstanding during the year ended October 31, 2023, which are indicative of the volume of these derivative types, were approximately as follows:
Futures
Contracts — Short | Forward
Foreign Currency
Exchange Contracts* | Non-Deliverable
Bond Forward
Contracts | Swap
Contracts |
| $7,986,000 | $2,671,129,000 | $101,005,000 | $1,502,100,000 |
| * | The average notional amount for forward foreign currency exchange contracts is based on the absolute value of notional amounts of currency purchased and currency sold. |
The average principal amount of purchased and written currency options contracts outstanding during the year ended October 31, 2023, which are indicative of the volume of these derivative types, were approximately $59,621,000 and $45,462,000, respectively.
6 Line of Credit
The Portfolio participates with other portfolios and funds managed by BMR and its affiliates in a $650 million unsecured revolving line of credit agreement with a group of banks, which is in effect through October 22, 2024. In connection with the renewal of the agreement on October 24, 2023, the borrowing limit was decreased from $725 million. Borrowings are made by the Portfolio solely for temporary purposes related to redemptions and other short-term cash needs. Interest is charged to the Portfolio based on its borrowings at an amount above either the Secured Overnight Financing Rate (SOFR) or Federal Funds rate. In addition, a fee computed at an annual rate of 0.15% on the daily unused portion of the line of credit is allocated among the participating portfolios and funds at the end of each quarter. In connection with the renewal of the agreement in October 2023, an arrangement fee totaling $150,000 was incurred that was allocated to the participating portfolios and funds. Because the line of credit is not available exclusively to the Portfolio, it may be unable to borrow some or all of its requested amounts at any particular time. The Portfolio did not have any significant borrowings or allocated fees during the year ended October 31, 2023.
Emerging Markets Local Income Portfolio
October 31, 2023
Notes to Financial Statements — continued
7 Reverse Repurchase Agreements
Reverse repurchase agreements outstanding as of October 31, 2023 were as follows:
| Counterparty | Trade
Date | Maturity
Date | Interest
Rate Paid
(Received) | Principal
Amount | Value
Including
Accrued
Interest |
| Barclays Bank PLC | 9/29/23 | On Demand(1) | 5.65% | $ 5,404,935 | $ 5,428,687 |
| Barclays Bank PLC | 10/16/23 | On Demand(1) | 5.65 | 6,006,255 | 6,018,509 |
| Total | | | | $11,411,190 | $11,447,196 |
| (1) | Open repurchase agreement with no specific maturity date. Either party may terminate the agreement upon demand. |
At October 31, 2023, the type of securities pledged as collateral for all open reverse repurchase agreements was Sovereign Government Bonds.
For the year ended October 31, 2023, the average borrowings under settled reverse repurchase agreements and the average interest rate paid were approximately $637,300 and 5.65%, respectively. Based on the short-term nature of the borrowings under the reverse repurchase agreements, the carrying value of the payable for reverse repurchase agreements approximated its fair value at October 31, 2023. If measured at fair value, borrowings under the reverse repurchase agreements would have been considered as Level 2 in the fair value hierarchy (see Note 9) at October 31, 2023.
Reverse repurchase agreements entered into by the Portfolio are subject to Master Repurchase Agreements (MRA), which permit the Portfolio, under certain circumstances, including an event of default (such as bankruptcy or insolvency), to offset payables and/or receivables under the MRA with collateral held and/or posted to the counterparty and create one single net payment due to or from the Portfolio.
The following tables present the Portfolio’s repurchase and reverse repurchase agreements net of amounts available for offset under an MRA and net of the related collateral received and/or pledged by the Portfolio as of October 31, 2023.
| Counterparty | Repurchase
Agreements | Liabilities
Available for
Offset | Securities
Collateral
Received(a) | Net
Amount(b) |
| Barclays Bank PLC | $8,251,177 | $(8,251,177) | $ — | $ — |
| Counterparty | Reverse
Repurchase
Agreements* | Assets
Available for
Offset | Securities
Collateral
Pledged(a) | Net
Amount(c) |
| Barclays Bank PLC | $(11,447,196) | $8,251,177 | $3,196,019 | $ — |
| * | Including accrued interest. |
| (a) | In some instances, the total collateral received and/or pledged may be more than the amount shown due to overcollateralization. |
| (b) | Net amount represents the net amount receivable from the counterparty in the event of default. |
| (c) | Net amount represents the net amount payable to the counterparty in the event of default. |
Emerging Markets Local Income Portfolio
October 31, 2023
Notes to Financial Statements — continued
8 Affiliated Investments
At October 31, 2023, the value of the Portfolio's investment in funds that may be deemed to be affiliated was $97,178,009, which represents 9.1% of the Portfolio's net assets. Transactions in such investments by the Portfolio for the year ended October 31, 2023 were as follows:
| Name | Value,
beginning
of period | Purchases | Sales
proceeds | Net
realized
gain (loss) | Change in
unrealized
appreciation
(depreciation) | Value, end
of period | Dividend
income | Shares,
end of period |
| Short-Term Investments |
| Liquidity Fund | $34,198,985 | $1,077,538,470 | $(1,014,559,446) | $ — | $ — | $97,178,009 | $4,233,631 | 97,178,009 |
9 Fair Value Measurements
Under generally accepted accounting principles for fair value measurements, a three-tier hierarchy to prioritize the assumptions, referred to as inputs, is used in valuation techniques to measure fair value. The three-tier hierarchy of inputs is summarized in the three broad levels listed below.
| • | Level 1 – quoted prices in active markets for identical investments |
| • | Level 2 – other significant observable inputs (including quoted prices for similar investments, interest rates, prepayment speeds, credit risk, etc.) |
| • | Level 3 – significant unobservable inputs (including a fund's own assumptions in determining the fair value of investments) |
In cases where the inputs used to measure fair value fall in different levels of the fair value hierarchy, the level disclosed is determined based on the lowest level input that is significant to the fair value measurement in its entirety. The inputs or methodology used for valuing securities are not necessarily an indication of the risk associated with investing in those securities.
At October 31, 2023, the hierarchy of inputs used in valuing the Portfolio's investments and open derivative instruments, which are carried at fair value, were as follows:
| Asset Description | Level 1 | Level 2 | Level 3 | Total |
| Foreign Corporate Bonds | $ — | $ 26,002,715 | $ — | $ 26,002,715 |
| Loan Participation Notes | — | — | 25,557,142 | 25,557,142 |
| Sovereign Government Bonds | — | 795,110,832 | — | 795,110,832 |
| Short-Term Investments: | | | | |
| Affiliated Fund | 97,178,009 | — | — | 97,178,009 |
| Repurchase Agreements | — | 8,251,177 | — | 8,251,177 |
| Sovereign Government Securities | — | 33,522,024 | — | 33,522,024 |
| U.S. Treasury Obligations | — | 29,813,717 | — | 29,813,717 |
| Purchased Currency Options | — | 412,361 | — | 412,361 |
| Total Investments | $ 97,178,009 | $ 893,112,826 | $ 25,557,142 | $ 1,015,847,977 |
| Forward Foreign Currency Exchange Contracts | $ — | $ 19,895,901 | $ — | $ 19,895,901 |
| Non-Deliverable Bond Forward Contracts | — | 303,133 | — | 303,133 |
| Futures Contracts | 138,182 | — | — | 138,182 |
| Swap Contracts | — | 15,317,090 | — | 15,317,090 |
| Total | $ 97,316,191 | $ 928,628,950 | $ 25,557,142 | $ 1,051,502,283 |
| Liability Description | | | | |
| Securities Sold Short | $ — | $ (7,897,239) | $ — | $ (7,897,239) |
| Written Currency Options | — | (108,317) | — | (108,317) |
| Forward Foreign Currency Exchange Contracts | — | (24,453,052) | — | (24,453,052) |
Emerging Markets Local Income Portfolio
October 31, 2023
Notes to Financial Statements — continued
| Liability Description (continued) | Level 1 | Level 2 | Level 3 | Total |
| Non-Deliverable Bond Forward Contracts | $ — | $ (261,375) | $ — | $ (261,375) |
| Swap Contracts | — | (30,199,356) | — | (30,199,356) |
| Total | $ — | $ (62,919,339) | $ — | $ (62,919,339) |
The following is a reconciliation of Level 3 investments for which significant unobservable inputs were used to determine fair value:
| | Loan
Participation Notes | Sovereign
Government
Bonds | Sovereign
Government
Securities | Total |
| Balance as of October 31, 2022 | $ 29,380,678 | $ 39,170,230 | $ 2,887,584 | $ 71,438,492 |
| Realized gains (losses) | (3,219,071) | — | — | (3,219,071) |
| Change in net unrealized appreciation (depreciation) | 745,339 | — | — | 745,339 |
| Cost of purchases | 20,217,220 | — | — | 20,217,220 |
| Proceeds from sales, including return of capital | (21,726,478) | — | — | (21,726,478) |
| Accrued discount (premium) | 159,454 | — | — | 159,454 |
| Transfers to Level 3 | — | — | — | — |
| Transfers from Level 3(1) | — | (39,170,230) | (2,887,584) | (42,057,814) |
| Balance as of October 31, 2023 | $ 25,557,142 | $ — | $ — | $ 25,557,142 |
| Change in net unrealized appreciation (depreciation) on investments still held as of October 31, 2023 | $ (1,916,974) | $ — | $ — | $ (1,916,974) |
| (1) | Transferred from Level 3 based on the observability of valuation inputs resulting from new market activity. |
The following is a summary of quantitative information about significant unobservable valuation inputs for Level 3 investments held as of October 31, 2023:
| Type of Investment | Fair Value as of
October 31, 2023 | Valuation Technique | Unobservable Input | Range of Unobservable Input | Impact to
Valuation from an
Increase to Input* |
| Loan Participation Notes | $25,557,142 | Matrix Pricing | Adjusted Credit Spread to the Central Bank of Uzbekistan Quoted Policy Rate | 5.46%-9.79%** | Decrease |
| * | Represents the directional change in the fair value of the Level 3 investments that would result from an increase to the corresponding unobservable input. A decrease to the unobservable input would have the opposite effect. |
| ** | The weighted average of the unobservable input is 7.68% based on relative principal amounts. |
10 Risks and Uncertainties
Risks Associated with Foreign Investments
Foreign investments can be adversely affected by political, economic and market developments abroad, including the imposition of economic and other sanctions by the United States or another country. There may be less publicly available information about foreign issuers because they may not be subject to reporting practices, requirements or regulations comparable to those to which United States companies are subject. Foreign markets may be smaller, less liquid and more volatile than the major markets in the United States. Trading in foreign markets typically involves higher expense than trading in the United States. The Portfolio may have difficulties enforcing its legal or contractual rights in a foreign country. Securities that trade or are denominated in currencies other than the U.S. dollar may be adversely affected by fluctuations in currency exchange rates.
Emerging Markets Local Income Portfolio
October 31, 2023
Notes to Financial Statements — continued
Emerging market securities often involve greater risks than developed market securities. Investment markets within emerging market countries are typically smaller, less liquid, less developed and more volatile than those in more developed markets like the United States, and may be focused in certain economic sectors. The information available about an emerging market issuer may be less reliable than for comparable issuers in more developed capital markets. Governmental actions can have a significant effect on the economic conditions in emerging market countries. It may be more difficult to make a claim or obtain a judgment in the courts of these countries than it is in the United States. The possibility of fraud, negligence, undue influence being exerted by an issuer or refusal to recognize ownership exists in some emerging markets. Disruptions due to work stoppages and trading improprieties in foreign securities markets have caused such markets to close. Emerging market securities are also subject to speculative trading, which contributes to their volatility.
Economic data as reported by sovereign entities may be delayed, inaccurate or fraudulent. In the event of a default by a sovereign entity, there are typically no assets to be seized or cash flows to be attached. Furthermore, the willingness or ability of a sovereign entity to restructure defaulted debt may be limited. Therefore, losses on sovereign defaults may far exceed the losses from the default of a similarly rated U.S. debt issuer.
On February 24, 2022, Russia launched an invasion of Ukraine, following rising tensions over the buildup of Russian troops along the Ukrainian border and joint military exercises by Russia with Belarus. In response to the invasion, many countries, including the U.S., have imposed economic sanctions on Russian governmental institutions, Russian entities, and Russian individuals. The conflict and sanctions have had a negative impact on the Russian economy, on the Russian currency, and on investments having exposure to Russia, Belarus and Ukraine. The conflict could also have a significant effect on investments outside the region. The duration and extent of the military conflict with Russia and the related sanctions cannot be predicted at this time.
Emerging Markets Local Income Portfolio
October 31, 2023
Report of Independent Registered Public Accounting Firm
To the Trustees and Investors of Emerging Markets Local Income Portfolio:
Opinion on the Financial Statements and Financial Highlights
We have audited the accompanying statement of assets and liabilities of Emerging Markets Local Income Portfolio (the “Portfolio"), including the portfolio of investments, as of October 31, 2023, the related statement of operations for the year then ended, the statements of changes in net assets for each of the two years in the period then ended, the financial highlights for each of the five years in the period then ended, and the related notes. In our opinion, the financial statements and financial highlights present fairly, in all material respects, the financial position of the Portfolio as of October 31, 2023, and the results of its operations for the year then ended, the changes in its net assets for each of the two years in the period then ended, and the financial highlights for each of the five years in the period then ended, in conformity with accounting principles generally accepted in the United States of America.
Basis for Opinion
These financial statements and financial highlights are the responsibility of the Portfolio’s management. Our responsibility is to express an opinion on the Portfolio’s financial statements and financial highlights based on our audits. We are a public accounting firm registered with the Public Company Accounting Oversight Board (United States) (PCAOB) and are required to be independent with respect to the Portfolio in accordance with the U.S. federal securities laws and the applicable rules and regulations of the Securities and Exchange Commission and the PCAOB.
We conducted our audits in accordance with the standards of the PCAOB. Those standards require that we plan and perform the audit to obtain reasonable assurance about whether the financial statements and financial highlights are free of material misstatement, whether due to error or fraud. The Portfolio is not required to have, nor were we engaged to perform, an audit of its internal control over financial reporting. As part of our audits, we are required to obtain an understanding of internal control over financial reporting but not for the purpose of expressing an opinion on the effectiveness of the Portfolio’s internal control over financial reporting. Accordingly, we express no such opinion.
Our audits included performing procedures to assess the risks of material misstatement of the financial statements and financial highlights, whether due to error or fraud, and performing procedures that respond to those risks. Such procedures included examining, on a test basis, evidence regarding the amounts and disclosures in the financial statements and financial highlights. Our audits also included evaluating the accounting principles used and significant estimates made by management, as well as evaluating the overall presentation of the financial statements and financial highlights. Our procedures included confirmation of securities owned as of October 31, 2023, by correspondence with the custodian and brokers; when replies were not received from brokers, we performed other auditing procedures. We believe that our audits provide a reasonable basis for our opinion.
/s/ Deloitte & Touche LLP
Boston, Massachusetts
December 22, 2023
We have served as the auditor of one or more Eaton Vance investment companies since 1959.
Eaton Vance
Emerging Markets Local Income Fund
October 31, 2023
Board of Trustees’ Contract Approval
Overview of the Contract Review Process
The Investment Company Act of 1940, as amended (the “1940 Act”), provides, in substance, that the investment advisory agreement between a fund and its investment adviser will continue in effect from year-to-year only if its continuation is approved on an annual basis by a vote of the fund’s board of trustees, including a majority of the trustees who are not “interested persons” of the fund (“independent trustees”), cast in person at a meeting called for the purpose of considering such approval.
At a meeting held on June 8, 2023, the Boards of Trustees/Directors (collectively, the “Board”) that oversee the registered investment companies advised by Eaton Vance Management or its affiliate, Boston Management and Research (the “Eaton Vance Funds”), including a majority of the independent trustees (the “Independent Trustees”), voted to approve the continuation of existing investment advisory agreements and sub-advisory agreements1 for each of the Eaton Vance Funds for an additional one-year period. The Board relied upon the affirmative recommendation of its Contract Review Committee, which is a committee exclusively comprised of Independent Trustees. Prior to making its recommendation, the Contract Review Committee reviewed information furnished by the adviser and sub-adviser to each of the Eaton Vance Funds (including information specifically requested by the Board) for a series of formal meetings held between April and June 2023, as well as certain additional information provided in response to specific requests from the Independent Trustees as members of the Contract Review Committee. Members of the Contract Review Committee also considered information received at prior meetings of the Board and its committees, to the extent such information was relevant to the Contract Review Committee’s annual evaluation of the investment advisory agreements and sub-advisory agreements.
In connection with its evaluation of the investment advisory agreements and sub-advisory agreements, the Board considered various information relating to the Eaton Vance Funds. This included information applicable to all or groups of Eaton Vance Funds, which is referenced immediately below, and information applicable to the particular Eaton Vance Fund covered by this report (each “Eaton Vance Fund” is referred to below as a “fund”). (For funds that invest through one or more underlying portfolios, references to “each fund” in this section may include information that was considered at the portfolio-level.)
Information about Fees, Performance and Expenses
• A report from an independent data provider comparing advisory and other fees paid by each fund to such fees paid by comparable funds, as identified by the independent data provider (“comparable funds”);
• A report from an independent data provider comparing each fund’s total expense ratio (and its components) to those of comparable funds;
• A report from an independent data provider comparing the investment performance of each fund (including, as relevant, total return data, income data, Sharpe ratios and information ratios) to the investment performance of comparable funds and, as applicable, benchmark indices, over various time periods;
• In certain instances, data regarding investment performance relative to customized groups of peer funds and blended indices identified by the adviser in consultation with the Portfolio Management Committee of the Board (a committee exclusively comprised of Independent Trustees);
• Comparative information concerning the fees charged and services provided by the adviser and sub-adviser to each fund in managing other accounts (which may include other mutual funds, collective investment funds and institutional accounts) using investment strategies and techniques similar to those used in managing such fund(s), if any;
• Profitability analyses with respect to the adviser and sub-adviser to each of the funds;
Information about Portfolio Management and Trading
• Descriptions of the investment management services provided to each fund, as well as each of the funds’ investment strategies and policies;
• The procedures and processes used to determine the value of fund assets, including, when necessary, the determination of “fair value” and actions taken to monitor and test the effectiveness of such procedures and processes;
• Information about the policies and practices of each fund’s adviser and sub-adviser with respect to trading, including their processes for seeking best execution of portfolio transactions;
• Information about the allocation of brokerage transactions and the benefits, if any, received by the adviser and sub-adviser to each fund as a result of brokerage allocation, including, as applicable, information concerning the acquisition of research through client commission arrangements and policies with respect to “soft dollars”;
• Data relating to the portfolio turnover rate of each fund and related information regarding active management in the context of particular strategies;
Information about each Adviser and Sub-adviser
• Reports detailing the financial results and condition of the adviser and sub-adviser to each fund;
• Information regarding the individual investment professionals whose responsibilities include portfolio management and investment research for the funds, and, for portfolio managers and certain other investment professionals, information relating to their responsibilities with respect to managing other mutual funds and investment accounts, as applicable;
1 Not all Eaton Vance Funds have entered into a sub-advisory agreement with a sub-adviser. Accordingly, references to “sub-adviser” or “sub-advisory agreement” in this “Overview” section may not be applicable to the particular Eaton Vance Fund covered by this report.
Eaton Vance
Emerging Markets Local Income Fund
October 31, 2023
Board of Trustees’ Contract Approval — continued
• Information regarding the adviser’s and its parent company’s (Morgan Stanley’s) efforts to retain and attract talented investment professionals, including in the context of a competitive marketplace for talent, as well as the ongoing unique environment presented by hybrid, remote and other alternative work arrangements;
• Information regarding the adviser’s compensation methodology for its investment professionals and the incentives and accountability it creates, along with investment professionals’ investments in the fund(s) they manage;
• The Code of Ethics of the adviser and its affiliates and the sub-adviser of each fund, together with information relating to compliance with, and the administration of, such codes;
• Policies and procedures relating to proxy voting, including regular reporting with respect to fund proxy voting activities;
• Information regarding the handling of corporate actions and class actions, as well as information regarding litigation and other regulatory matters;
• Information concerning the resources devoted to compliance efforts undertaken by the adviser and its affiliates and the sub-adviser of each fund, if any, including descriptions of their various compliance programs and their record of compliance;
• Information concerning the business continuity and disaster recovery plans of the adviser and its affiliates and the sub-adviser of each fund, if any;
• A description of Eaton Vance Management’s and Boston Management and Research’s oversight of sub-advisers, including with respect to regulatory and compliance issues, investment management and other matters;
Other Relevant Information
• Information regarding ongoing initiatives to further integrate and harmonize, where applicable, the investment management and other departments of the adviser and its affiliates with the overall investment management infrastructure of Morgan Stanley, in light of Morgan Stanley’s acquisition of Eaton Vance Corp. on March 1, 2021;
• Information concerning the nature, cost and character of the administrative and other non-investment advisory services provided by Eaton Vance Management and its affiliates;
• Information concerning oversight of the relationship with the custodian, subcustodians, fund accountants, and other third-party service providers by the adviser and/or administrator to each of the funds;
• Information concerning efforts to implement policies and procedures with respect to various recently adopted regulations applicable to the funds, including Rule 12d1-4 (the Fund-of-Funds Rule), Rule 18f-4 (the Derivatives Rule) and Rule 2a-5 (the Fair Valuation Rule);
• For an Eaton Vance Fund structured as an exchange-listed closed-end fund, information concerning the benefits of the closed-end fund structure, as well as, where relevant, the closed-end fund’s market prices (including as compared to the closed-end fund’s net asset value (NAV)), trading volume data, continued use of auction preferred shares (where applicable), distribution rates and other relevant matters;
• The risks which the adviser and/or its affiliates incur in connection with the management and operation of the funds, including, among others, litigation, regulatory, entrepreneurial, and other business risks (and the associated costs of such risks); and
• The terms of each investment advisory agreement and sub-advisory agreement.
During the various meetings of the Board and its committees over the course of the year leading up to the June 8, 2023 meeting, the Board received information from portfolio managers and other investment professionals of the advisers and sub-advisers of the funds regarding investment and performance matters, and considered various investment and trading strategies used in pursuing the funds’ investment objectives. The Board also received information regarding risk management techniques employed in connection with the management of the funds. The Board and its committees evaluated issues pertaining to industry and regulatory developments, compliance procedures, fund governance and other issues with respect to the funds, and received and participated in reports and presentations provided by Eaton Vance Management, Boston Management and Research and fund sub-advisers, with respect to such matters. In addition to the formal meetings of the Board and its committees, the Independent Trustees held regular teleconferences to discuss, among other topics, matters relating to the continuation of investment advisory agreements and sub-advisory agreements.
The Contract Review Committee was advised throughout the contract review process by Goodwin Procter LLP, independent legal counsel for the Independent Trustees. The members of the Contract Review Committee, with the advice of such counsel, exercised their own business judgment in determining the material factors to be considered in evaluating each investment advisory agreement and sub-advisory agreement and the weight to be given to each such factor. The conclusions reached with respect to each investment advisory agreement and sub-advisory agreement were based on a comprehensive evaluation of all the information provided and not any single factor. Moreover, each member of the Contract Review Committee may have placed varying emphasis on particular factors in reaching conclusions with respect to each investment advisory agreement and sub-advisory agreement. In evaluating each investment advisory agreement and sub-advisory agreement, including the fee structures and other terms contained in such agreements, the members of the Contract Review Committee were also informed by multiple years of analysis and discussion with the adviser and sub-adviser to each of the Eaton Vance Funds.
Results of the Contract Review Process
Based on its consideration of the foregoing, and such other information it deemed relevant, including the factors and conclusions described below, the Contract Review Committee concluded that the continuation of the investment advisory agreement between Eaton Vance Emerging Markets Local Income Fund (the “Fund”) and Eaton Vance Management (“EVM”), as well as the investment advisory agreement between Emerging Markets Local Income Portfolio (the “Portfolio”), the portfolio in which the Fund invests, and Boston Management and Research (“BMR”) (EVM, with respect to the Fund, and BMR, with
Eaton Vance
Emerging Markets Local Income Fund
October 31, 2023
Board of Trustees’ Contract Approval — continued
respect to the Portfolio, are each referred to herein as the “Adviser”), including their respective fee structures, are in the interests of shareholders and, therefore, recommended to the Board approval of each agreement. Based on the recommendation of the Contract Review Committee, the Board, including a majority of the Independent Trustees, voted to approve continuation of the investment advisory agreements for the Fund and the Portfolio.
Nature, Extent and Quality of Services
In considering whether to approve the investment advisory agreements for the Fund and the Portfolio, the Board evaluated the nature, extent and quality of services provided to the Fund and the Portfolio by the applicable Adviser.
The Board considered each Adviser’s management capabilities and investment processes in light of the types of investments held by the Fund and the Portfolio, including the education, experience and number of investment professionals and other personnel who provide portfolio management, investment research, and similar services to the Fund and the Portfolio, including recent changes to such personnel. The Board considered each Adviser’s expertise with respect to emerging markets and in-house research capabilities. The Board also took into account the resources dedicated to portfolio management and other services, the compensation methods of each Adviser and other factors, including the reputation and resources of the Adviser to recruit and retain highly qualified research, advisory and supervisory investment professionals. In addition, the Board considered the time and attention devoted to the Eaton Vance Funds, including the Fund and the Portfolio, by senior management, as well as the infrastructure, operational capabilities and support staff in place to assist in the portfolio management and operations of the Fund and the Portfolio, including the provision of administrative services. The Board also considered the business-related and other risks to which each Adviser or its affiliates may be subject in managing the Fund and the Portfolio.
The Board noted that under the terms of the investment advisory agreement of the Fund, EVM may invest assets of the Fund directly in securities, for which it would receive a fee, or in the Portfolio, for which it receives no separate fee but for which BMR receives an advisory fee from the Portfolio. The Trustees considered the potential benefits to the Fund of the ability to make direct investments, such as an improved ability to: gain exposure to sectors of the market EVM believes may not be represented or underrepresented by the Portfolio; to hedge certain Portfolio exposures; and/or to otherwise manage the exposures of the Fund.
The Board considered the compliance programs of each Adviser and relevant affiliates thereof. The Board considered compliance and reporting matters regarding, among other things, personal trading by investment professionals, disclosure of portfolio holdings, late trading, frequent trading, portfolio valuation, business continuity and the allocation of investment opportunities. The Board also considered the responses of each Adviser and its affiliates to requests in recent years from regulatory authorities, such as the Securities and Exchange Commission and the Financial Industry Regulatory Authority.
The Board considered other administrative services provided or overseen by Eaton Vance Management and its affiliates, including transfer agency and accounting services. The Board evaluated the benefits to shareholders of investing in a fund that is a part of a large fund complex offering exposure to a variety of asset classes and investment disciplines, as well as the ability, in many cases, to exchange an investment among different funds without incurring additional sales charges.
After consideration of the foregoing factors, among others, the Board concluded that the nature, extent and quality of services provided by each Adviser, taken as a whole, are appropriate and consistent with the terms of the applicable investment advisory agreement.
Fund Performance
The Board compared the Fund’s investment performance to that of comparable funds identified by an independent data provider (the peer group), as well as an appropriate benchmark index. The Board’s review included comparative performance data with respect to the Fund for the one-, three-, five- and ten-year periods ended December 31, 2022. In this regard, the Board noted that the performance of the Fund was higher than the median performance of the Fund’s peer group for the three-year period. The Board also noted that the performance of the Fund was lower than its benchmark index for the three-year period. The Board concluded that the performance of the Fund was satisfactory.
Management Fees and Expenses
The Board considered contractual fee rates payable by the Portfolio and by the Fund for advisory and administrative services (referred to collectively as “management fees”). As part of its review, the Board considered the Fund’s management fees and total expense ratio for the one-year period ended December 31, 2022, as compared to those of comparable funds, before and after giving effect to any undertaking to waive fees or reimburse expenses. The Board also received and considered information about the services offered and the fee rates charged by the Adviser to other types of accounts with investment objectives and strategies that are substantially similar to and/or managed in a similar investment style as the Portfolio. In this regard, the Board received information about the differences in the nature and scope of services the Adviser provides to the Portfolio as compared to other types of accounts and the material differences in compliance, reporting and other legal burdens and risks to the Adviser as between the Portfolio and other types of accounts. The Board also considered factors that had an impact on the Fund’s total expense ratio relative to comparable funds.
After considering the foregoing information, and in light of the nature, extent and quality of the services provided by each Adviser, the Board concluded that the management fees charged for advisoryand related services are reasonable.
Eaton Vance
Emerging Markets Local Income Fund
October 31, 2023
Board of Trustees’ Contract Approval — continued
Profitability and “Fall-Out” Benefits
The Board considered the level of profits realized by each Adviser and relevant affiliates thereof in providing investment advisory and administrative services to the Fund, to the Portfolio and to all Eaton Vance Funds as a group. The Board considered the level of profits realized without regard to marketing support or other payments by each Adviser and its affiliates to third parties in respect of distribution or other services.
The Board concluded that, in light of the foregoing factors and the nature, extent and quality of the services rendered, the profits realized by each Adviser and its affiliates are deemed not to be excessive.
The Board also considered direct or indirect fall-out benefits received by each Adviser and its affiliates in connection with their respective relationships with the Fund and the Portfolio, including the benefits of research services that may be available to each Adviser as a result of securities transactions effected for the Fund and the Portfolio and other investment advisory clients.
Economies of Scale
In reviewing management fees and profitability, the Board also considered the extent to which the applicable Adviser and its affiliates, on the one hand, and the Fund and the Portfolio , on the other hand, can expect to realize benefits from economies of scale as the assets of the Fund and the Portfolio increase. The Board acknowledged the difficulty in accurately measuring the benefits resulting from economies of scale, if any, with respect to the management of any specific fund or group of funds. The Board reviewed data summarizing the increases and decreases in the assets of the Fund and of all Eaton Vance Funds as a group over various time periods, and evaluated the extent to which the total expense ratio of the Fund and the profitability of each Adviser and its affiliates may have been affected by such increases or decreases. Based upon the foregoing, the Board concluded that the Fund currently shares in the benefits from economies of scale, if any, when they are realized by the Adviser. The Board also concluded that the structure of the advisory fees, which include breakpoints at several asset levels, will allow the Fund and the Portfolio to continue to benefit from any economies of scale in the future.
Eaton Vance
Emerging Markets Local Income Fund
October 31, 2023
Liquidity Risk Management Program
The Fund has implemented a written liquidity risk management program (Program) and related procedures to manage its liquidity in accordance with Rule 22e-4 under the Investment Company Act of 1940, as amended (Liquidity Rule). The Liquidity Rule defines “liquidity risk” as the risk that a fund could not meet requests to redeem shares issued by the fund without significant dilution of the remaining investors’ interests in the fund. The Fund’s Board of Trustees/Directors has designated the investment adviser to serve as the administrator of the Program and the related procedures. The administrator has established a Liquidity Risk Management Oversight Committee (Committee) to perform the functions necessary to administer the Program. As part of the Program, the administrator is responsible for identifying illiquid investments and categorizing the relative liquidity of the Fund’s investments in accordance with the Liquidity Rule. Under the Program, the administrator assesses, manages, and periodically reviews the Fund’s liquidity risk, and is responsible for making certain reports to the Fund’s Board of Trustees/Directors and the Securities and Exchange Commission (SEC) regarding the liquidity of the Fund’s investments, and to notify the Board of Trustees/Directors and the SEC of certain liquidity events specified in the Liquidity Rule. The liquidity of the Fund’s portfolio investments is determined based on a number of factors including, but not limited to, relevant market, trading and investment-specific considerations under the Program.
At a meeting of the Fund’s Board of Trustees/Directors on June 7, 2023, the Committee provided a written report to the Fund’s Board of Trustees/
Directors pertaining to the operation, adequacy, and effectiveness of implementation of the Program, as well as the operation of the highly liquid investment minimum (if applicable) for the period January 1, 2022 through December 31, 2022 (Review Period). The Program operated effectively during the Review Period, supporting the administrator’s ability to assess, manage and monitor Fund liquidity risk, including during periods of market volatility and net redemptions. During the Review Period, the Fund met redemption requests on a timely basis.
There can be no assurance that the Program will achieve its objectives in the future. Please refer to the Fund’s prospectus for more information regarding the Fund’s exposure to liquidity risk and other principal risks to which an investment in the Fund may be subject.
Eaton Vance
Emerging Markets Local Income Fund
October 31, 2023
Management and Organization
Fund Management. The Trustees of Eaton Vance Mutual Funds Trust (the Trust) and Emerging Markets Local Income Portfolio (the Portfolio) are responsible for the overall management and supervision of the Trust's and the Portfolio's affairs. The Board members and officers of the Trust and the Portfolio are listed below. Except as indicated, each individual has held the office shown or other offices in the same company for the last five years. Board members hold indefinite terms of office. Each Trustee holds office until his or her successor is elected and qualified, subject to a prior death, resignation, retirement, disqualification or removal. Under the terms of the Fund's and the Portfolio's current Trustee retirement policy, an Independent Trustee must retire and resign as a Trustee on the earlier of: (i) the first day of July following his or her 74th birthday; or (ii), with limited exception, December 31st of the 20th year in which he or she has served as a Trustee. However, if such retirement and resignation would cause the Fund and the Portfolio to be out of compliance with Section 16 of the 1940 Act or any other regulations or guidance of the SEC, then such retirement and resignation will not become effective until such time as action has been taken for the Fund and the Portfolio to be in compliance therewith. The “noninterested Trustees” consist of those Trustees who are not “interested persons” of the Trust and the Portfolio, as that term is defined under the 1940 Act. The business address of each Board member and officer is Two International Place, Boston, Massachusetts 02110. As used below, “BMR” refers to Boston Management and Research, “EV” refers to EV LLC, “EVM” refers to Eaton Vance Management, "MSIM" refers to Morgan Stanley Investment Management Inc. and “EVD” refers to Eaton Vance Distributors, Inc. EV is the trustee of each of EVM and BMR. Each of EVM, BMR, EVD and EV are indirect, wholly owned subsidiaries of Morgan Stanley. Each officer affiliated with EVM may hold a position with other EVM affiliates that is comparable to his or her position with EVM listed below. Each Trustee oversees 127 funds in the Eaton Vance fund complex (including both funds and portfolios in a hub and spoke structure).
| Name and Year of Birth | Trust/Portfolio
Position(s) | Length of Service | Principal Occupation(s) and Other Directorships
During Past Five Years and Other Relevant Experience |
| Interested Trustee |
Anchal Pachnanda(1)
1980 | Trustee | Since 2023 | Co-Head of Strategy of MSIM (since 2019). Formerly, Head of Strategy of MSIM (2017-2019). Ms. Pachnanda is an interested person because of her position with MSIM, which is an affiliate of the Trust.
Other Directorships. None. |
| Noninterested Trustees |
Alan C. Bowser
1962 | Trustee | Since 2022 | Private investor. Formerly, Chief Diversity Officer, Partner and a member of the Operating Committee, and formerly served as Senior Advisor on Diversity and Inclusion for the firm’s chief executive officer, Co-Head of the Americas Region, and Senior Client Advisor of Bridgewater Associates, an asset management firm (2011- 2023).
Other Directorships. Independent Director of Stout Risius Ross (a middle market professional services advisory firm) (since 2021). |
Mark R. Fetting
1954 | Trustee | Since 2016 | Private investor. Formerly held various positions at Legg Mason, Inc. (investment management firm) (2000-2012), including President, Chief Executive Officer, Director and Chairman (2008-2012), Senior Executive Vice President (2004-2008) and Executive Vice President (2001-2004). Formerly, President of Legg Mason family of funds (2001-2008). Formerly, Division President and Senior Officer of Prudential Financial Group, Inc. and related companies (investment management firm) (1991-2000).
Other Directorships. None. |
Cynthia E. Frost
1961 | Trustee | Since 2014 | Private investor. Formerly, Chief Investment Officer of Brown University (university endowment) (2000-2012). Formerly, Portfolio Strategist for Duke Management Company (university endowment manager) (1995-2000). Formerly, Managing Director, Cambridge Associates (investment consulting company) (1989-1995). Formerly, Consultant, Bain and Company (management consulting firm) (1987-1989). Formerly, Senior Equity Analyst, BA Investment Management Company (1983-1985).
Other Directorships. None. |
George J. Gorman
1952 | Chairperson of
the Board and
Trustee | Since 2021
(Chairperson) and
2014 (Trustee) | Principal at George J. Gorman LLC (consulting firm). Formerly, Senior Partner at Ernst & Young LLP (a registered public accounting firm) (1974-2009).
Other Directorships. None. |
Eaton Vance
Emerging Markets Local Income Fund
October 31, 2023
Management and Organization — continued
| Name and Year of Birth | Trust/Portfolio
Position(s) | Length of Service | Principal Occupation(s) and Other Directorships
During Past Five Years and Other Relevant Experience |
| Noninterested Trustees (continued) |
Valerie A. Mosley
1960 | Trustee | Since 2014 | Chairwoman and Chief Executive Officer of Valmo Ventures (a consulting and investment firm). Founder of Upward Wealth, Inc., dba BrightUp, a fintech platform. Formerly, Partner and Senior Vice President, Portfolio Manager and Investment Strategist at Wellington Management Company, LLP (investment management firm) (1992-2012). Formerly, Chief Investment Officer, PG Corbin Asset Management (1990-1992). Formerly worked in institutional corporate bond sales at Kidder Peabody (1986-1990).
Other Directorships. Director of DraftKings, Inc. (digital sports entertainment and gaming company) (since September 2020). Director of Envestnet, Inc. (provider of intelligent systems for wealth management and financial wellness) (since 2018). Formerly, Director of Dynex Capital, Inc. (mortgage REIT) (2013-2020) and Director of Groupon, Inc. (e-commerce provider) (2020-2022). |
Keith Quinton
1958 | Trustee | Since 2018 | Private investor, researcher and lecturer. Formerly, Independent Investment Committee Member at New Hampshire Retirement System (2017-2021). Formerly, Portfolio Manager and Senior Quantitative Analyst at Fidelity Investments (investment management firm) (2001-2014).
Other Directorships. Formerly, Director (2016-2021) and Chairman (2019-2021) of New Hampshire Municipal Bond Bank. |
Marcus L. Smith
1966 | Trustee | Since 2018 | Private investor and independent corporate director. Formerly, Chief Investment Officer, Canada (2012-2017), Chief Investment Officer, Asia (2010-2012), Director of Asian Research (2004-2010) and portfolio manager (2001-2017) at MFS Investment Management (investment management firm).
Other Directorships. Director of First Industrial Realty Trust, Inc. (an industrial REIT) (since 2021). Director of MSCI Inc. (global provider of investment decision support tools) (since 2017). Formerly, Director of DCT Industrial Trust Inc. (logistics real estate company) (2017-2018). |
Susan J. Sutherland
1957 | Trustee | Since 2015 | Private investor. Director of Ascot Group Limited and certain of its subsidiaries (insurance and reinsurance) (since 2017). Formerly, Director of Hagerty Holding Corp. (insurance) (2015-2018) and Montpelier Re Holdings Ltd. (insurance and reinsurance) (2013-2015). Formerly, Associate, Counsel and Partner at Skadden, Arps, Slate, Meagher & Flom LLP (law firm) (1982-2013).
Other Directorships. Formerly, Director of Kairos Acquisition Corp. (insurance/InsurTech acquisition company) (2021-2023). |
Scott E. Wennerholm
1959 | Trustee | Since 2016 | Private investor. Formerly, Trustee at Wheelock College (postsecondary institution) (2012-2018). Formerly, Consultant at GF Parish Group (executive recruiting firm) (2016-2017). Formerly, Chief Operating Officer and Executive Vice President at BNY Mellon Asset Management (investment management firm) (2005-2011). Formerly, Chief Operating Officer and Chief Financial Officer at Natixis Global Asset Management (investment management firm) (1997-2004). Formerly, Vice President at Fidelity Investments Institutional Services (investment management firm) (1994-1997).
Other Directorships. None. |
Nancy A. Wiser
1967 | Trustee | Since 2022 | Formerly, Executive Vice President and the Global Head of Operations at Wells Fargo Asset Management (2011-2021).
Other Directorships. None. |
| Name and Year of Birth | Trust/Portfolio
Position(s) | Length of Service | Principal Occupation(s)
During Past Five Years |
| Principal Officers who are not Trustees |
Kenneth A. Topping
1966 | President | Since 2023 | Vice President and Chief Administrative Officer of EVM and BMR and Chief Operating Officer for Public Markets at MSIM. Also Vice President of Calvert Research and Management (“CRM”) since 2021. Formerly, Chief Operating Officer for Goldman Sachs Asset Management `Classic' (2009-2020). |
Deidre E. Walsh
1971 | Vice President and
Chief Legal Officer | Since 2009 | Vice President of EVM and BMR. Also Vice President of CRM. |
James F. Kirchner
1967 | Treasurer | Since 2007 | Vice President of EVM and BMR. Also Vice President of CRM. |
Eaton Vance
Emerging Markets Local Income Fund
October 31, 2023
Management and Organization — continued
| Name and Year of Birth | Trust/Portfolio
Position(s) | Length of Service | Principal Occupation(s)
During Past Five Years |
| Principal Officers who are not Trustees (continued) |
Nicholas S. Di Lorenzo
1987 | Secretary | Since 2022 | Formerly, associate (2012-2021) and counsel (2022) at Dechert LLP. |
Richard F. Froio
1968 | Chief Compliance
Officer | Since 2017 | Vice President of EVM and BMR since 2017. Formerly, Deputy Chief Compliance Officer (Adviser/Funds) and Chief Compliance Officer (Distribution) at PIMCO (2012-2017) and Managing Director at BlackRock/Barclays Global Investors (2009-2012). |
(1) Ms. Pachnanda began serving as Trustee effective April 1, 2023.
The SAI for the Fund includes additional information about the Trustees and officers of the Fund and the Portfolio and can be obtained without charge on Eaton Vance’s website at www.eatonvance.com or by calling 1-800-262-1122.
| FACTS | WHAT DOES EATON VANCE DO WITH YOUR
PERSONAL INFORMATION? |
| Why? | Financial companies choose how they share your personal information. Federal law gives consumers the right to limit some but not all sharing. Federal law also requires us to tell you how we collect, share, and protect your personal information. Please read this notice carefully to understand what we do. |
| |
| What? | The types of personal information we collect and share depend on the product or service you have with us. This information can include:■ Social Security number and income
■ investment experience and risk tolerance
■ checking account number and wire transfer instructions |
| |
| How? | All financial companies need to share customers’ personal information to run their everyday business. In the section below, we list the reasons financial companies can share their customers’ personal information; the reasons Eaton Vance chooses to share; and whether you can limit this sharing. |
Reasons we can share your
personal information | Does Eaton Vance
share? | Can you limit
this sharing? |
| For our everyday business purposes — such as to process your transactions, maintain your account(s), respond to court orders and legal investigations, or report to credit bureaus | Yes | No |
| For our marketing purposes — to offer our products and services to you | Yes | No |
| For joint marketing with other financial companies | No | We don’t share |
| For our investment management affiliates’ everyday business purposes — information about your transactions, experiences, and creditworthiness | Yes | Yes |
| For our affiliates’ everyday business purposes — information about your transactions and experiences | Yes | No |
| For our affiliates’ everyday business purposes — information about your creditworthiness | No | We don’t share |
| For our investment management affiliates to market to you | Yes | Yes |
| For our affiliates to market to you | No | We don’t share |
| For nonaffiliates to market to you | No | We don’t share |
To limit our
sharing | Call toll-free 1-800-262-1122 or email: EVPrivacy@eatonvance.comPlease note:If you are a new customer, we can begin sharing your information 30 days from the date we sent this notice. When you are no longer our customer, we continue to share your information as described in this notice. However, you can contact us at any time to limit our sharing. |
| Questions? | Call toll-free 1-800-262-1122 or email: EVPrivacy@eatonvance.com |
| Privacy Notice — continued | April 2021 |
| Who we are |
| Who is providing this notice? | Eaton Vance Management, Eaton Vance Distributors, Inc., Eaton Vance Trust Company, Eaton Vance Management (International) Limited, Eaton Vance Advisers International Ltd., Eaton Vance Global Advisors Limited, Eaton Vance Management’s Real Estate Investment Group, Boston Management and Research, Calvert Research and Management, Eaton Vance and Calvert Fund Families and our investment advisory affiliates (“Eaton Vance”) (see Investment Management Affiliates definition below) |
| What we do |
How does Eaton Vance
protect my personal
information? | To protect your personal information from unauthorized access and use, we use security measures that comply with federal law. These measures include computer safeguards and secured files and buildings. We have policies governing the proper handling of customer information by personnel and requiring third parties that provide support to adhere to appropriate security standards with respect to such information. |
How does Eaton Vance
collect my personal
information? | We collect your personal information, for example, when you■ open an account or make deposits or withdrawals from your account
■ buy securities from us or make a wire transfer
■ give us your contact informationWe also collect your personal information from others, such as credit bureaus, affiliates, or other companies. |
| Why can’t I limit all sharing? | Federal law gives you the right to limit only■ sharing for affiliates’ everyday business purposes — information about your creditworthiness
■ affiliates from using your information to market to you
■ sharing for nonaffiliates to market to youState laws and individual companies may give you additional rights to limit sharing. See below for more on your rights under state law. |
| Definitions |
Investment Management
Affiliates | Eaton Vance Investment Management Affiliates include registered investment advisers, registered broker- dealers, and registered and unregistered funds. Investment Management Affiliates does not include entities associated with Morgan Stanley Wealth Management, such as Morgan Stanley Smith Barney LLC and Morgan Stanley & Co. |
| Affiliates | Companies related by common ownership or control. They can be financial and nonfinancial companies.■ Our affiliates include companies with a Morgan Stanley name and financial companies such as Morgan Stanley Smith Barney LLC and Morgan Stanley & Co. |
| Nonaffiliates | Companies not related by common ownership or control. They can be financial and nonfinancial companies.■ Eaton Vance does not share with nonaffiliates so they can market to you. |
| Joint marketing | A formal agreement between nonaffiliated financial companies that together market financial products or services to you.■ Eaton Vance doesn’t jointly market. |
| Other important information |
| Vermont: Except as permitted by law, we will not share personal information we collect about Vermont residents with Nonaffiliates unless you provide us with your written consent to share such information.California: Except as permitted by law, we will not share personal information we collect about California residents with Nonaffiliates and we will limit sharing such personal information with our Affiliates to comply with California privacy laws that apply to us. |
Delivery of Shareholder Documents. The Securities and Exchange Commission (SEC) permits funds to deliver only one copy of shareholder documents, including prospectuses, proxy statements and shareholder reports, to fund investors with multiple accounts at the same residential or post office box address. This practice is often called “householding” and it helps eliminate duplicate mailings to shareholders. Eaton Vance, or your financial intermediary, may household the mailing of your documents indefinitely unless you instruct Eaton Vance, or your financial intermediary, otherwise. If you would prefer that your Eaton Vance documents not be householded, please contact Eaton Vance at 1-800-262-1122, or contact your financial intermediary. Your instructions that householding not apply to delivery of your Eaton Vance documents will typically be effective within 30 days of receipt by Eaton Vance or your financial intermediary.
Portfolio Holdings. Each Eaton Vance Fund and its underlying Portfolio(s) (if applicable) files a schedule of portfolio holdings on Part F to Form N-PORT with the SEC. Certain information filed on Form N-PORT may be viewed on the Eaton Vance website at www.eatonvance.com, by calling Eaton Vance at 1-800-262-1122 or in the EDGAR database on the SEC’s website at www.sec.gov.
Proxy Voting. From time to time, funds are required to vote proxies related to the securities held by the funds. The Eaton Vance Funds or their underlying Portfolios (if applicable) vote proxies according to a set of policies and procedures approved by the Funds’ and Portfolios’ Boards. You may obtain a description of these policies and procedures and information on how the Funds or Portfolios voted proxies relating to portfolio securities during the most recent 12-month period ended June 30, without charge, upon request, by calling 1-800-262-1122 and by accessing the SEC’s website at www.sec.gov.
Tailored Shareholder Reports. Effective January 24, 2023, the SEC adopted rule and form amendments to require open-end mutual funds and ETFs to transmit concise and visually engaging streamlined annual and semiannual reports to shareholders that highlight key information. Other information, including financial statements, will no longer appear in a streamlined shareholder report but must be available online, delivered free of charge upon request, and filed on a semiannual basis on Form N-CSR. The rule and form amendments have a compliance date of July 24, 2024. At this time, management is evaluating the impact of these amendments on the shareholder reports for the Eaton Vance Funds.
This Page Intentionally Left Blank
This Page Intentionally Left Blank
This Page Intentionally Left Blank
Investment Adviser of Emerging Markets Local Income Portfolio
Boston Management and Research
Two International Place
Boston, MA 02110
Investment Adviser and Administrator of Eaton Vance Emerging Markets Local Income Fund
Eaton Vance Management
Two International Place
Boston, MA 02110
Principal Underwriter*
Eaton Vance Distributors, Inc.
Two International Place
Boston, MA 02110
(617) 482-8260
Custodian
State Street Bank and Trust Company
One Congress Street, Suite 1
Boston, MA 02114-2016
Transfer Agent
BNY Mellon Investment Servicing (US) Inc.
Attn: Eaton Vance Funds
P.O. Box 534439
Pittsburgh, PA 15253-4439
(800) 262-1122
Independent Registered Public Accounting Firm
Deloitte & Touche LLP
200 Berkeley Street
Boston, MA 02116-5022
Fund Offices
Two International Place
Boston, MA 02110
* FINRA BrokerCheck. Investors may check the background of their Investment Professional by contacting the Financial Industry Regulatory Authority (FINRA). FINRA BrokerCheck is a free tool to help investors check the professional background of current and former FINRA-registered securities firms and brokers. FINRA BrokerCheck is available by calling 1-800-289-9999 and at www.FINRA.org. The FINRA BrokerCheck brochure describing this program is available to investors at www.FINRA.org.
Eaton Vance
Floating-Rate Fund
Annual Report
October 31, 2023
Commodity Futures Trading Commission Registration. The Commodity Futures Trading Commission (“CFTC”) has adopted regulations that subject registered investment companies and advisers to regulation by the CFTC if a fund invests more than a prescribed level of its assets in certain CFTC-regulated instruments (including futures, certain options and swap agreements) or markets itself as providing investment exposure to such instruments. The investment adviser has claimed an exclusion from the definition of “commodity pool operator” under the Commodity Exchange Act with respect to its management of the Fund. Accordingly, neither the Fund nor the adviser with respect to the operation of the Fund is subject to CFTC regulation. Because of its management of other strategies, the Fund's adviser is registered with the CFTC as a commodity pool operator. The adviser is also registered as a commodity trading advisor.
Fund shares are not insured by the FDIC and are not deposits or other obligations of, or guaranteed by, any depository institution. Shares are subject to investment risks, including possible loss of principal invested.
This report must be preceded or accompanied by a current summary prospectus or prospectus. Before investing, investors should consider carefully the investment objective, risks, and charges and expenses of a mutual fund. This and other important information is contained in the summary prospectus and prospectus, which can be obtained from a financial intermediary. Prospective investors should read the prospectus carefully before investing. For further information, please call 1-800-262-1122.
Annual Report October 31, 2023
Eaton Vance
Floating-Rate Fund
Eaton Vance
Floating-Rate Fund
October 31, 2023
Management’s Discussion of Fund Performance†
Economic and Market Conditions
Amid global concerns about inflation, rising interest rates, and the Russia-Ukraine war, senior loans displayed their value as a portfolio diversifier by outperforming most U.S. fixed-income asset classes during the 12-month period ended October 31, 2023.
With senior loans among the few asset classes to benefit from rising interest rates, the Morningstar® LSTA® US Leveraged Loan IndexSM (the Index), a broad measure of the asset class, returned 11.92% during the period. Senior loans generally outperformed investment-grade corporate bonds, corporate high yield bonds, municipal bonds, and U.S. government bonds.
As the period began in November 2022, the U.S. Federal Reserve’s (the Fed’s) campaign of interest rate hikes was generally viewed as a positive environment for floating-rate loans, and the asset class rallied during the closing months of 2022.
The senior loan rally continued into 2023, with the Index returning 2.73% in January -- its best monthly performance since May 2020 -- and posting positive performance in February 2023 as well. But in mid-March, the unexpected collapse of Silicon Valley Bank and Signature Bank triggered fears of contagion in the regional banking sector and put a damper on asset performance across capital markets. As a result, the Index return was virtually flat in March 2023.
Senior loans rallied again in April 2023, but gave back some of those gains in May amid recession concerns. From June through September 2023, senior loans rallied once more as recession fears receded. In the rising-rate environment, coupon interest accounted for nearly three-quarters of the Index’s performance in 2023 through September.
However, in October 2023, amid volatility that rattled capital markets, loan prices slipped modestly and the Index return was virtually flat for the month -- although senior loans continued to outperform virtually all other U.S. fixed-income asset classes during the closing month of the period.
Asset class technical factors were generally supportive throughout the period, contributing to the overall performance of senior loans. For example, the supply of new loans was limited during the period, which supported floating-rate prices in secondary markets.
In addition, new capital formation in structured products provided a tailwind for the asset class, reflecting continued institutional interest in senior loans during the period.
While issuer fundamentals deteriorated for the period as a whole, they improved during the period’s closing months. The trailing 12-month default rate rose from 0.83% at the start of the period to 1.71% as of June 30, 2023, and then declined to 1.36% at period-end -- about half the market’s 2.70% long-term average. Despite fluctuating default rates, loan prices improved from $92.20 at the start of the period to $94.80 at period-end.
For the period as a whole, BBB-, BB-, B-, CCC- and D-rated (defaulted) loans within the Index returned 8.71%, 9.82%, 13.27%, 12.40%, and -30.85%, respectively.
Fund Performance
For the 12-month period ended October 31, 2023, Eaton Vance Floating-Rate Fund (the Fund) returned 10.04% for Class A shares at net asset value (NAV), underperforming its benchmark, the Morningstar® LSTA® US Leveraged Loan Index (the Index), which returned 11.92%.
The Index is unmanaged, and returns do not reflect any applicable sales charges, commissions, or expenses.
The Fund’s out-of-Index allocation to secured high yield bonds detracted from Fund returns versus the Index, as floating-rate loans outperformed their fixed-rate counterparts in the bond market during the period.
On an industry basis, loan selections in the media; information technology services; aerospace & defense; and diversified telecommunication services industries also detracted from returns versus the Index. On an individual loan basis, the top detractors from relative returns were an out-of-Index position in a global logistics provider, and an overweight position in a digital infrastructure provider.
In contrast, the Fund’s modest out-of-Index allocation to collateralized loan obligation debt investments, which performed strongly during the period, contributed to Fund returns versus the Index.
On an industry basis, loan selections in the health care equipment & supplies industry, and in the energy equipment & services industry contributed to Fund returns versus the Index during the period. On an individual loan basis, the top contributors to relative returns were an out-of-Index position in a steel forgings manufacturer, and an overweight position in a home health care provider.
See Endnotes and Additional Disclosures in this report.
Past performance is no guarantee of future results. Returns are historical and are calculated by determining the percentage change in net asset value (NAV) or offering price (as applicable) with all distributions reinvested. Furthermore, returns do not reflect the deduction of taxes that shareholders may have to pay on Fund distributions or upon the redemption of Fund shares. Investment return and principal value will fluctuate so that shares, when redeemed, may be worth more or less than their original cost. Performance for periods less than or equal to one year is cumulative. Performance is for the stated time period only; due to market volatility, current Fund performance may be lower or higher than the quoted return. For performance as of the most recent month-end, please refer to eatonvance.com.
Eaton Vance
Floating-Rate Fund
October 31, 2023
Performance
Portfolio Manager(s) Andrew N. Sveen, CFA, Ralph H. Hinckley, Jr., CFA and Jake T. Lemle, CFA
| % Average Annual Total Returns1,2 | Class
Inception Date | Performance
Inception Date | One Year | Five Years | Ten Years |
| Advisers Class at NAV | 02/07/2001 | 02/07/2001 | 10.11% | 2.99% | 3.28% |
| Class A at NAV | 05/05/2003 | 02/07/2001 | 10.04 | 2.98 | 3.28 |
| Class A with 3.25% Maximum Sales Charge | — | — | 6.50 | 2.31 | 2.94 |
| Class C at NAV | 02/01/2001 | 02/07/2001 | 9.29 | 2.22 | 2.65 |
| Class C with 1% Maximum Deferred Sales Charge | — | — | 8.29 | 2.22 | 2.65 |
| Class I at NAV | 01/30/2001 | 02/07/2001 | 10.38 | 3.23 | 3.54 |
| Class R6 at NAV | 12/01/2016 | 02/07/2001 | 10.44 | 3.31 | 3.59 |
|
| Morningstar® LSTA® US Leveraged Loan IndexSM | — | — | 11.92% | 4.46% | 4.22% |
| % Total Annual Operating Expense Ratios3 | Advisers Class | Class A | Class C | Class I | Class R6 |
| | 1.02% | 1.02% | 1.77% | 0.77% | 0.72% |
Growth of $10,000
This graph shows the change in value of a hypothetical investment of $10,000 in Class A of the Fund for the period indicated. For comparison, the same investment is shown in the indicated index.
| Growth of Investment2 | Amount Invested | Period Beginning | At NAV | With Maximum Sales Charge |
| Advisers Class | $10,000 | 10/31/2013 | $13,816 | N.A. |
| Class C | $10,000 | 10/31/2013 | $12,995 | N.A. |
| Class I, at minimum investment | $1,000,000 | 10/31/2013 | $1,416,449 | N.A. |
| Class R6, at minimum investment | $5,000,000 | 10/31/2013 | $7,116,844 | N.A. |
See Endnotes and Additional Disclosures in this report.
Past performance is no guarantee of future results. Returns are historical and are calculated by determining the percentage change in net asset value (NAV) or offering price (as applicable) with all distributions reinvested. Furthermore, returns do not reflect the deduction of taxes that shareholders may have to pay on Fund distributions or upon the redemption of Fund shares. Investment return and principal value will fluctuate so that shares, when redeemed, may be worth more or less than their original cost. Performance for periods less than or equal to one year is cumulative. Performance is for the stated time period only; due to market volatility, current Fund performance may be lower or higher than the quoted return. For performance as of the most recent month-end, please refer to eatonvance.com.
Eaton Vance
Floating-Rate Fund
October 31, 2023
| Top 10 Issuers (% of total investments)1 | |
| Carnival Corporation | 1.3% |
| TransDigm, Inc. | 1.1 |
| Uber Technologies, Inc. | 1.0 |
| ICON Luxembourg S.a.r.l. | 0.9 |
| American Airlines, Inc. | 0.9 |
| Ultimate Software Group, Inc. (The) | 0.8 |
| Select Medical Corporation | 0.8 |
| Go Daddy Operating Company, LLC | 0.8 |
| Applied Systems, Inc. | 0.8 |
| INEOS Quattro Holdings UK, Ltd | 0.8 |
| Total | 9.2% |
| Top 10 Sectors (% of total investments)1 |
| Software | 11.5% |
| Hotels, Restaurants & Leisure | 5.3 |
| Chemicals | 4.9 |
| Capital Markets | 4.8 |
| IT Services | 4.5 |
| Machinery | 4.4 |
| Health Care Providers & Services | 4.4 |
| Professional Services | 3.1 |
| Commercial Services & Supplies | 3.0 |
| Trading Companies & Distributors | 2.8 |
| Total | 48.7% |
| Credit Quality (% of bonds, loans and asset-backed securities)2 |
Fund invests in an affiliated investment company (Portfolio) with the same objective(s) and policies as the Fund. References to investments are to the Portfolio’s holdings.
Footnotes:
| 1 | Excludes cash and cash equivalents. |
| 2 | Credit ratings are categorized using S&P Global Ratings (“S&P”). Ratings, which are subject to change, apply to the creditworthiness of the issuers of the underlying securities and not to the Fund or its shares. Credit ratings measure the quality of a bond based on the issuer’s creditworthiness, with ratings ranging from AAA, being the highest, to D, being the lowest based on S&P’s measures. Ratings of BBB or higher by S&P are considered to be investment-grade quality. Credit ratings are based largely on the ratings agency’s analysis at the time of rating. The rating assigned to any particular security is not necessarily a reflection of the issuer’s current financial condition and does not necessarily reflect its assessment of the volatility of a security’s market value or of the liquidity of an investment in the security. Holdings designated as “Not Rated” (if any) are not rated by S&P. |
Eaton Vance
Floating-Rate Fund
October 31, 2023
Endnotes and Additional Disclosures
| † | The views expressed in this report are those of the portfolio manager(s) and are current only through the date stated at the top of this page. These views are subject to change at any time based upon market or other conditions, and Eaton Vance and the Fund(s) disclaim any responsibility to update such views. These views may not be relied upon as investment advice and, because investment decisions are based on many factors, may not be relied upon as an indication of trading intent on behalf of any Eaton Vance fund. This commentary may contain statements that are not historical facts, referred to as “forward-looking statements.” The Fund’s actual future results may differ significantly from those stated in any forward-looking statement, depending on factors such as changes in securities or financial markets or general economic conditions, the volume of sales and purchases of Fund shares, the continuation of investment advisory, administrative and service contracts, and other risks discussed from time to time in the Fund’s filings with the Securities and Exchange Commission. |
| | |
| 1 | Morningstar® LSTA® US Leveraged Loan IndexSM is an unmanaged index of the institutional leveraged loan market. Morningstar® LSTA® Leveraged Loan indices are a product of Morningstar, Inc. (“Morningstar”) and have been licensed for use. Morningstar® is a registered trademark of Morningstar licensed for certain use. Loan Syndications and Trading Association® and LSTA® are trademarks of the LSTA licensed for certain use by Morningstar, and further sublicensed by Morningstar for certain use. Neither Morningstar nor LSTA guarantees the accuracy and/or completeness of the Morningstar® LSTA® US Leveraged Loan IndexSM or any data included therein, and shall have no liability for any errors, omissions, or interruptions therein. Unless otherwise stated, index returns do not reflect the effect of any applicable sales charges, commissions, expenses, taxes or leverage, as applicable. It is not possible to invest directly in an index. |
| 2 | Total Returns at NAV do not include applicable sales charges. If sales charges were deducted, the returns would be lower. Total Returns shown with maximum sales charge reflect the stated maximum sales charge. Unless otherwise stated, performance does not reflect the deduction of taxes on Fund distributions or redemptions of Fund shares.Effective November 5, 2020, Class C shares automatically convert to Class A shares eight years after purchase. The average annual total returns listed for Class C reflect conversion to Class A shares after eight years. Prior to November 5, 2020, Class C shares automatically converted to Class A shares ten years after purchase.Performance prior to the inception date of a class may be linked to the performance of an older class of the Fund. This linked performance is adjusted for any applicable sales charge, but is not adjusted for class expense differences. If adjusted for such differences, the performance would be different. The performance of Class R6 is linked to Class I. Performance presented in the Financial Highlights included in the financial statements is not linked. |
| 3 | Source: Fund prospectus. The expense ratios for the current reporting period can be found in the Financial Highlights section of this report. Performance reflects expenses waived and/or reimbursed, if applicable. Without such waivers and/or reimbursements, performance would have been lower. |
| | Fund profile subject to change due to active management. |
Eaton Vance
Floating-Rate Fund
October 31, 2023
Example
As a Fund shareholder, you incur two types of costs: (1) transaction costs, including sales charges (loads) on purchases; and (2) ongoing costs, including management fees; distribution and/or service fees; and other Fund expenses. This Example is intended to help you understand your ongoing costs (in dollars) of Fund investing and to compare these costs with the ongoing costs of investing in other mutual funds. The Example is based on an investment of $1,000 invested at the beginning of the period and held for the entire period (May 1, 2023 to October 31, 2023).
Actual Expenses
The first section of the table below provides information about actual account values and actual expenses. You may use the information in this section, together with the amount you invested, to estimate the expenses that you paid over the period. Simply divide your account value by $1,000 (for example, an $8,600 account value divided by $1,000 = 8.6), then multiply the result by the number in the first section under the heading entitled “Expenses Paid During Period” to estimate the expenses you paid on your account during this period.
Hypothetical Example for Comparison Purposes
The second section of the table below provides information about hypothetical account values and hypothetical expenses based on the actual Fund expense ratio and an assumed rate of return of 5% per year (before expenses), which is not the actual Fund return. The hypothetical account values and expenses may not be used to estimate the actual ending account balance or expenses you paid for the period. You may use this information to compare the ongoing costs of investing in your Fund and other funds. To do so, compare this 5% hypothetical example with the 5% hypothetical examples that appear in the shareholder reports of the other funds.
Please note that the expenses shown in the table are meant to highlight your ongoing costs only and do not reflect any transactional costs, such as sales charges (loads). Therefore, the second section of the table is useful in comparing ongoing costs only, and will not help you determine the relative total costs of owning different funds. In addition, if these transactional costs were included, your costs would be higher.
| | Beginning
Account Value
(5/1/23) | Ending
Account Value
(10/31/23) | Expenses Paid
During Period*
(5/1/23 – 10/31/23) | Annualized
Expense
Ratio |
| Actual | | | | |
| Advisers Class | $1,000.00 | $1,043.30 | $5.41 | 1.05% |
| Class A | $1,000.00 | $1,042.00 | $5.46 | 1.06% |
| Class C | $1,000.00 | $1,039.30 | $9.30 | 1.81% |
| Class I | $1,000.00 | $1,043.30 | $4.12 | 0.80% |
| Class R6 | $1,000.00 | $1,043.60 | $3.86 | 0.75% |
| |
| Hypothetical | | | | |
| (5% return per year before expenses) | | | | |
| Advisers Class | $1,000.00 | $1,019.91 | $5.35 | 1.05% |
| Class A | $1,000.00 | $1,019.86 | $5.40 | 1.06% |
| Class C | $1,000.00 | $1,016.08 | $9.20 | 1.81% |
| Class I | $1,000.00 | $1,021.17 | $4.08 | 0.80% |
| Class R6 | $1,000.00 | $1,021.43 | $3.82 | 0.75% |
| * | Expenses are equal to the Fund's annualized expense ratio for the indicated Class, multiplied by the average account value over the period, multiplied by 184/365 (to reflect the one-half year period). The Example assumes that the $1,000 was invested at the net asset value per share determined at the close of business on April 30, 2023. The Example reflects the expenses of both the Fund and the Portfolio. |
Eaton Vance
Floating-Rate Fund
October 31, 2023
Statement of Assets and Liabilities
| | October 31, 2023 |
| Assets | |
| Investment in Eaton Vance Floating Rate Portfolio, at value (identified cost $5,301,608,824) | $ 4,955,197,645 |
| Receivable for Fund shares sold | 18,590,565 |
| Total assets | $ 4,973,788,210 |
| Liabilities | |
| Payable for Fund shares redeemed | $ 32,233,105 |
| Distributions payable | 6,536,211 |
| Payable to affiliates: | |
| Administration fee | 633,402 |
| Distribution and service fees | 231,893 |
| Trustees' fees | 42 |
| Accrued expenses | 905,564 |
| Total liabilities | $ 40,540,217 |
| Net Assets | $ 4,933,247,993 |
| Sources of Net Assets | |
| Paid-in capital | $ 6,109,708,267 |
| Accumulated loss | (1,176,460,274) |
| Net Assets | $ 4,933,247,993 |
| Advisers Class Shares | |
| Net Assets | $ 123,631,589 |
| Shares Outstanding | 14,904,785 |
Net Asset Value, Offering Price and Redemption Price Per Share
(net assets ÷ shares of beneficial interest outstanding) | $ 8.29 |
| Class A Shares | |
| Net Assets | $ 606,135,868 |
| Shares Outstanding | 70,628,193 |
Net Asset Value and Redemption Price Per Share
(net assets ÷ shares of beneficial interest outstanding) | $ 8.58 |
Maximum Offering Price Per Share
(100 ÷ 96.75 of net asset value per share) | $ 8.87 |
| Class C Shares | |
| Net Assets | $ 88,376,988 |
| Shares Outstanding | 10,666,201 |
Net Asset Value and Offering Price Per Share*
(net assets ÷ shares of beneficial interest outstanding) | $ 8.29 |
| Class I Shares | |
| Net Assets | $ 3,343,187,568 |
| Shares Outstanding | 402,772,126 |
Net Asset Value, Offering Price and Redemption Price Per Share
(net assets ÷ shares of beneficial interest outstanding) | $ 8.30 |
7
See Notes to Financial Statements.
Eaton Vance
Floating-Rate Fund
October 31, 2023
Statement of Assets and Liabilities — continued
| | October 31, 2023 |
| Class R6 Shares | |
| Net Assets | $771,915,980 |
| Shares Outstanding | 92,911,746 |
Net Asset Value, Offering Price and Redemption Price Per Share
(net assets ÷ shares of beneficial interest outstanding) | $ 8.31 |
| On sales of $100,000 or more, the offering price of Class A shares is reduced. |
| * | Redemption price per share is equal to the net asset value less any applicable contingent deferred sales charge. |
8
See Notes to Financial Statements.
Eaton Vance
Floating-Rate Fund
October 31, 2023
| | Year Ended |
| | October 31, 2023 |
| Investment Income | |
| Dividend income allocated from Portfolio | $ 9,452,073 |
| Interest and other income allocated from Portfolio | 479,465,528 |
| Expenses allocated from Portfolio | (31,990,814) |
| Total investment income from Portfolio | $ 456,926,787 |
| Expenses | |
| Administration fee | $ 8,320,781 |
| Distribution and service fees: | |
| Advisers Class | 210,041 |
| Class A | 1,619,157 |
| Class C | 1,021,874 |
| Trustees’ fees and expenses | 500 |
| Custodian fee | 62,000 |
| Transfer and dividend disbursing agent fees | 3,225,076 |
| Legal and accounting services | 181,762 |
| Printing and postage | 243,033 |
| Registration fees | 193,158 |
| Miscellaneous | 59,054 |
| Total expenses | $ 15,136,436 |
| Net investment income | $ 441,790,351 |
| Realized and Unrealized Gain (Loss) from Portfolio | |
| Net realized gain (loss): | |
| Investment transactions | $ (232,878,242) |
| Foreign currency transactions | 1,741,885 |
| Forward foreign currency exchange contracts | (53,776,452) |
| Net realized loss | $(284,912,809) |
| Change in unrealized appreciation (depreciation): | |
| Investments | $ 388,869,325 |
| Foreign currency | 816,610 |
| Forward foreign currency exchange contracts | 9,871,157 |
| Net change in unrealized appreciation (depreciation) | $ 399,557,092 |
| Net realized and unrealized gain | $ 114,644,283 |
| Net increase in net assets from operations | $ 556,434,634 |
9
See Notes to Financial Statements.
Eaton Vance
Floating-Rate Fund
October 31, 2023
Statements of Changes in Net Assets
| | Year Ended October 31, |
| | 2023 | 2022 |
| Increase (Decrease) in Net Assets | | |
| From operations: | | |
| Net investment income | $ 441,790,351 | $ 334,300,856 |
| Net realized gain (loss) | (284,912,809) | 51,017,745 |
| Net change in unrealized appreciation (depreciation) | 399,557,092 | (705,877,234) |
| Net increase (decrease) in net assets from operations | $ 556,434,634 | $ (320,558,633) |
| Distributions to shareholders: | | |
| Advisers Class | $ (6,652,329) | $ (4,757,274) |
| Class A | (50,592,690) | (30,066,757) |
| Class C | (7,196,866) | (4,158,164) |
| Class I | (322,989,148) | (264,847,517) |
| Class R6 | (55,794,960) | (32,476,524) |
| Total distributions to shareholders | $ (443,225,993) | $ (336,306,236) |
| Transactions in shares of beneficial interest: | | |
| Advisers Class | $ 45,758,267 | $ (70,541,874) |
| Class A | (113,678,147) | 15,620,342 |
| Class C | (31,000,899) | (7,659,273) |
| Class I | (2,014,176,168) | (205,000,386) |
| Class R6 | 135,361,177 | (28,806,651) |
| Net decrease in net assets from Fund share transactions | $(1,977,735,770) | $ (296,387,842) |
| Net decrease in net assets | $(1,864,527,129) | $ (953,252,711) |
| Net Assets | | |
| At beginning of year | $ 6,797,775,122 | $ 7,751,027,833 |
| At end of year | $ 4,933,247,993 | $6,797,775,122 |
10
See Notes to Financial Statements.
Eaton Vance
Floating-Rate Fund
October 31, 2023
| | Advisers Class |
| | Year Ended October 31, |
| | 2023 | 2022 | 2021 | 2020 | 2019 |
| Net asset value — Beginning of year | $ 8.150 | $ 8.810 | $ 8.470 | $ 8.740 | $ 9.050 |
| Income (Loss) From Operations | | | | | |
| Net investment income(1) | $ 0.656 | $ 0.318 | $ 0.268 | $ 0.321 | $ 0.411 |
| Net realized and unrealized gain (loss) | 0.134 | (0.639) | 0.345 | (0.267) | (0.310) |
| Total income (loss) from operations | $ 0.790 | $ (0.321) | $ 0.613 | $ 0.054 | $ 0.101 |
| Less Distributions | | | | | |
| From net investment income | $ (0.650) | $ (0.339) | $ (0.273) | $ (0.324) | $ (0.411) |
| Total distributions | $ (0.650) | $ (0.339) | $ (0.273) | $ (0.324) | $ (0.411) |
| Net asset value — End of year | $ 8.290 | $ 8.150 | $ 8.810 | $ 8.470 | $ 8.740 |
| Total Return(2) | 10.11% | (3.70)% | 7.30% | 0.70% | 1.16% |
| Ratios/Supplemental Data | | | | | |
| Net assets, end of year (000’s omitted) | $123,632 | $77,084 | $157,768 | $94,411 | $364,983 |
| Ratios (as a percentage of average daily net assets):(3) | | | | | |
| Expenses | 1.05% (4) | 1.01% (4) | 1.03% | 1.08% | 1.03% |
| Net investment income | 7.89% | 3.70% | 3.05% | 3.78% | 4.63% |
| Portfolio Turnover of the Portfolio | 19% | 27% | 26% | 28% | 16% |
| (1) | Computed using average shares outstanding. |
| (2) | Returns are historical and are calculated by determining the percentage change in net asset value with all distributions reinvested. |
| (3) | Includes the Fund’s share of the Portfolio’s allocated expenses. |
| (4) | Includes a reduction by the investment adviser of a portion of the Portfolio’s adviser fee due to the Portfolio’s investment in the Liquidity Fund (equal to less than 0.005% of average daily net assets for the years ended October 31, 2023 and 2022). |
11
See Notes to Financial Statements.
Eaton Vance
Floating-Rate Fund
October 31, 2023
Financial Highlights — continued
| | Class A |
| | Year Ended October 31, |
| | 2023 | 2022 | 2021 | 2020 | 2019 |
| Net asset value — Beginning of year | $ 8.430 | $ 9.120 | $ 8.770 | $ 9.050 | $ 9.360 |
| Income (Loss) From Operations | | | | | |
| Net investment income(1) | $ 0.669 | $ 0.349 | $ 0.278 | $ 0.322 | $ 0.425 |
| Net realized and unrealized gain (loss) | 0.154 | (0.688) | 0.354 | (0.268) | (0.310) |
| Total income (loss) from operations | $ 0.823 | $ (0.339) | $ 0.632 | $ 0.054 | $ 0.115 |
| Less Distributions | | | | | |
| From net investment income | $ (0.673) | $ (0.351) | $ (0.282) | $ (0.334) | $ (0.425) |
| Total distributions | $ (0.673) | $ (0.351) | $ (0.282) | $ (0.334) | $ (0.425) |
| Net asset value — End of year | $ 8.580 | $ 8.430 | $ 9.120 | $ 8.770 | $ 9.050 |
| Total Return(2) | 10.04% | (3.78)% | 7.27% | 0.79% | 1.17% |
| Ratios/Supplemental Data | | | | | |
| Net assets, end of year (000’s omitted) | $606,136 | $707,666 | $751,136 | $658,206 | $788,125 |
| Ratios (as a percentage of average daily net assets):(3) | | | | | |
| Expenses | 1.06% (4) | 1.01% (4) | 1.03% | 1.07% | 1.02% |
| Net investment income | 7.79% | 3.96% | 3.06% | 3.68% | 4.63% |
| Portfolio Turnover of the Portfolio | 19% | 27% | 26% | 28% | 16% |
| (1) | Computed using average shares outstanding. |
| (2) | Returns are historical and are calculated by determining the percentage change in net asset value with all distributions reinvested and do not reflect the effect of sales charges. |
| (3) | Includes the Fund’s share of the Portfolio’s allocated expenses. |
| (4) | Includes a reduction by the investment adviser of a portion of the Portfolio’s adviser fee due to the Portfolio’s investment in the Liquidity Fund (equal to less than 0.005% of average daily net assets for the years ended October 31, 2023 and 2022). |
12
See Notes to Financial Statements.
Eaton Vance
Floating-Rate Fund
October 31, 2023
Financial Highlights — continued
| | Class C |
| | Year Ended October 31, |
| | 2023 | 2022 | 2021 | 2020 | 2019 |
| Net asset value — Beginning of year | $ 8.140 | $ 8.800 | $ 8.470 | $ 8.730 | $ 9.040 |
| Income (Loss) From Operations | | | | | |
| Net investment income(1) | $ 0.582 | $ 0.271 | $ 0.203 | $ 0.251 | $ 0.343 |
| Net realized and unrealized gain (loss) | 0.155 | (0.656) | 0.334 | (0.251) | (0.308) |
| Total income (loss) from operations | $ 0.737 | $ (0.385) | $ 0.537 | $ — | $ 0.035 |
| Less Distributions | | | | | |
| From net investment income | $ (0.587) | $ (0.275) | $ (0.207) | $ (0.260) | $ (0.345) |
| Total distributions | $ (0.587) | $ (0.275) | $ (0.207) | $ (0.260) | $ (0.345) |
| Net asset value — End of year | $ 8.290 | $ 8.140 | $ 8.800 | $ 8.470 | $ 8.730 |
| Total Return(2) | 9.29% | (4.43)% | 6.38% | 0.06% | 0.40% |
| Ratios/Supplemental Data | | | | | |
| Net assets, end of year (000’s omitted) | $88,377 | $117,294 | $135,213 | $189,138 | $328,577 |
| Ratios (as a percentage of average daily net assets):(3) | | | | | |
| Expenses | 1.81% (4) | 1.76% (4) | 1.79% | 1.82% | 1.78% |
| Net investment income | 7.03% | 3.18% | 2.32% | 2.97% | 3.86% |
| Portfolio Turnover of the Portfolio | 19% | 27% | 26% | 28% | 16% |
| (1) | Computed using average shares outstanding. |
| (2) | Returns are historical and are calculated by determining the percentage change in net asset value with all distributions reinvested and do not reflect the effect of sales charges. |
| (3) | Includes the Fund’s share of the Portfolio’s allocated expenses. |
| (4) | Includes a reduction by the investment adviser of a portion of the Portfolio’s adviser fee due to the Portfolio’s investment in the Liquidity Fund (equal to less than 0.005% of average daily net assets for the years ended October 31, 2023 and 2022). |
13
See Notes to Financial Statements.
Eaton Vance
Floating-Rate Fund
October 31, 2023
Financial Highlights — continued
| | Class I |
| | Year Ended October 31, |
| | 2023 | 2022 | 2021 | 2020 | 2019 |
| Net asset value — Beginning of year | $ 8.150 | $ 8.820 | $ 8.480 | $ 8.750 | $ 9.060 |
| Income (Loss) From Operations | | | | | |
| Net investment income(1) | $ 0.664 | $ 0.356 | $ 0.289 | $ 0.335 | $ 0.433 |
| Net realized and unrealized gain (loss) | 0.158 | (0.665) | 0.346 | (0.260) | (0.309) |
| Total income (loss) from operations | $ 0.822 | $ (0.309) | $ 0.635 | $ 0.075 | $ 0.124 |
| Less Distributions | | | | | |
| From net investment income | $ (0.672) | $ (0.361) | $ (0.295) | $ (0.345) | $ (0.434) |
| Total distributions | $ (0.672) | $ (0.361) | $ (0.295) | $ (0.345) | $ (0.434) |
| Net asset value — End of year | $ 8.300 | $ 8.150 | $ 8.820 | $ 8.480 | $ 8.750 |
| Total Return(2) | 10.38% | (3.57)% | 7.56% | 0.95% | 1.41% |
| Ratios/Supplemental Data | | | | | |
| Net assets, end of year (000’s omitted) | $3,343,188 | $5,269,963 | $5,988,270 | $3,565,898 | $4,985,629 |
| Ratios (as a percentage of average daily net assets):(3) | | | | | |
| Expenses | 0.81% (4) | 0.76% (4) | 0.78% | 0.82% | 0.77% |
| Net investment income | 8.00% | 4.18% | 3.29% | 3.95% | 4.88% |
| Portfolio Turnover of the Portfolio | 19% | 27% | 26% | 28% | 16% |
| (1) | Computed using average shares outstanding. |
| (2) | Returns are historical and are calculated by determining the percentage change in net asset value with all distributions reinvested. |
| (3) | Includes the Fund’s share of the Portfolio’s allocated expenses. |
| (4) | Includes a reduction by the investment adviser of a portion of the Portfolio’s adviser fee due to the Portfolio’s investment in the Liquidity Fund (equal to less than 0.005% of average daily net assets for the years ended October 31, 2023 and 2022). |
14
See Notes to Financial Statements.
Eaton Vance
Floating-Rate Fund
October 31, 2023
Financial Highlights — continued
| | Class R6 |
| | Year Ended October 31, |
| | 2023 | 2022 | 2021 | 2020 | 2019 |
| Net asset value — Beginning of year | $ 8.160 | $ 8.830 | $ 8.490 | $ 8.760 | $ 9.060 |
| Income (Loss) From Operations | | | | | |
| Net investment income(1) | $ 0.680 | $ 0.358 | $ 0.293 | $ 0.335 | $ 0.437 |
| Net realized and unrealized gain (loss) | 0.147 | (0.662) | 0.347 | (0.254) | (0.299) |
| Total income (loss) from operations | $ 0.827 | $ (0.304) | $ 0.640 | $ 0.081 | $ 0.138 |
| Less Distributions | | | | | |
| From net investment income | $ (0.677) | $ (0.366) | $ (0.300) | $ (0.351) | $ (0.438) |
| Total distributions | $ (0.677) | $ (0.366) | $ (0.300) | $ (0.351) | $ (0.438) |
| Net asset value — End of year | $ 8.310 | $ 8.160 | $ 8.830 | $ 8.490 | $ 8.760 |
| Total Return(2) | 10.44% | (3.51)% | 7.61% | 1.01% | 1.57% |
| Ratios/Supplemental Data | | | | | |
| Net assets, end of year (000’s omitted) | $771,916 | $625,769 | $718,642 | $386,940 | $399,233 |
| Ratios (as a percentage of average daily net assets):(3) | | | | | |
| Expenses | 0.75% (4) | 0.71% (4) | 0.73% | 0.76% | 0.72% |
| Net investment income | 8.17% | 4.19% | 3.34% | 3.97% | 4.92% |
| Portfolio Turnover of the Portfolio | 19% | 27% | 26% | 28% | 16% |
| (1) | Computed using average shares outstanding. |
| (2) | Returns are historical and are calculated by determining the percentage change in net asset value with all distributions reinvested. |
| (3) | Includes the Fund’s share of the Portfolio’s allocated expenses. |
| (4) | Includes a reduction by the investment adviser of a portion of the Portfolio’s adviser fee due to the Portfolio’s investment in the Liquidity Fund (equal to less than 0.005% of average daily net assets for the years ended October 31, 2023 and 2022). |
15
See Notes to Financial Statements.
Eaton Vance
Floating-Rate Fund
October 31, 2023
Notes to Financial Statements
1 Significant Accounting Policies
Eaton Vance Floating-Rate Fund (the Fund) is a diversified series of Eaton Vance Mutual Funds Trust (the Trust). The Trust is a Massachusetts business trust registered under the Investment Company Act of 1940, as amended (the 1940 Act), as an open-end management investment company. The Fund offers five classes of shares. Class A shares are generally sold subject to a sales charge imposed at time of purchase. Class C shares are sold at net asset value and are generally subject to a contingent deferred sales charge (see Note 5). Effective November 5, 2020, Class C shares automatically convert to Class A shares eight years after their purchase as described in the Fund’s prospectus. Advisers Class, Class I and Class R6 shares are sold at net asset value and are not subject to a sales charge. Each class represents a pro rata interest in the Fund, but votes separately on class-specific matters and (as noted below) is subject to different expenses. Realized and unrealized gains and losses are allocated daily to each class of shares based on the relative net assets of each class to the total net assets of the Fund. Net investment income, other than class-specific expenses, is allocated daily to each class of shares based upon the ratio of the value of each class’s paid shares to the total value of all paid shares. Sub-accounting, recordkeeping and similar administrative fees payable to financial intermediaries, which are a component of transfer and dividend disbursing agent fees on the Statement of Operations, are not allocated to Class R6 shares. Each class of shares differs in its distribution plan and certain other class-specific expenses. The Fund invests its assets in interests in Eaton Vance Floating Rate Portfolio (the Portfolio), a Massachusetts business trust, having the same investment objective and policies as the Fund. The value of the Fund’s investment in the Portfolio reflects the Fund’s proportionate interest in the net assets of the Portfolio (86.0% at October 31, 2023). The performance of the Fund is directly affected by the performance of the Portfolio. The financial statements of the Portfolio, including the portfolio of investments, are included elsewhere in this report and should be read in conjunction with the Fund’s financial statements.
The following is a summary of significant accounting policies of the Fund. The policies are in conformity with accounting principles generally accepted in the United States of America (U.S. GAAP). The Fund is an investment company and follows accounting and reporting guidance in the Financial Accounting Standards Board (FASB) Accounting Standards Codification Topic 946.
A Investment Valuation—Valuation of securities by the Portfolio is discussed in Note 1A of the Portfolio's Notes to Financial Statements, which are included elsewhere in this report.
B Income—The Fund's net investment income or loss consists of the Fund's pro rata share of the net investment income or loss of the Portfolio, less all actual and accrued expenses of the Fund.
C Federal Taxes—The Fund's policy is to comply with the provisions of the Internal Revenue Code applicable to regulated investment companies and to distribute to shareholders each year substantially all of its net investment income, and all or substantially all of its net realized capital gains. Accordingly, no provision for federal income or excise tax is necessary.
As of October 31, 2023, the Fund had no uncertain tax positions that would require financial statement recognition, de-recognition, or disclosure. The Fund files a U.S. federal income tax return annually after its fiscal year-end, which is subject to examination by the Internal Revenue Service for a period of three years from the date of filing.
D Expenses—The majority of expenses of the Trust are directly identifiable to an individual fund. Expenses which are not readily identifiable to a specific fund are allocated taking into consideration, among other things, the nature and type of expense and the relative size of the funds.
E Use of Estimates—The preparation of the financial statements in conformity with U.S. GAAP requires management to make estimates and assumptions that affect the reported amounts of assets and liabilities at the date of the financial statements and the reported amounts of income and expense during the reporting period. Actual results could differ from those estimates.
F Indemnifications—Under the Trust’s organizational documents, its officers and Trustees may be indemnified against certain liabilities and expenses arising out of the performance of their duties to the Fund. Under Massachusetts law, if certain conditions prevail, shareholders of a Massachusetts business trust (such as the Trust) could be deemed to have personal liability for the obligations of the Trust. However, the Trust’s Declaration of Trust contains an express disclaimer of liability on the part of Fund shareholders and the By-laws provide that the Trust shall assume, upon request by the shareholder, the defense on behalf of any Fund shareholders. Moreover, the By-laws also provide for indemnification out of Fund property of any shareholder held personally liable solely by reason of being or having been a shareholder for all loss or expense arising from such liability. Additionally, in the normal course of business, the Fund enters into agreements with service providers that may contain indemnification clauses. The Fund’s maximum exposure under these arrangements is unknown as this would involve future claims that may be made against the Fund that have not yet occurred.
G Other—Investment transactions are accounted for on a trade date basis.
Eaton Vance
Floating-Rate Fund
October 31, 2023
Notes to Financial Statements — continued
2 Distributions to Shareholders and Income Tax Information
The Fund declares dividends daily to shareholders of record at the time of declaration. Distributions are generally paid monthly. Distributions of realized capital gains are made at least annually. Distributions are declared separately for each class of shares. Shareholders may reinvest income and capital gain distributions in additional shares of the same class of the Fund at the net asset value as of the reinvestment date or, at the election of the shareholder, receive distributions in cash. Distributions to shareholders are determined in accordance with income tax regulations, which may differ from U.S. GAAP. As required by U.S. GAAP, only distributions in excess of tax basis earnings and profits are reported in the financial statements as a return of capital. Permanent differences between book and tax accounting relating to distributions are reclassified to paid-in capital. For tax purposes, distributions from short-term capital gains are considered to be from ordinary income.
The tax character of distributions declared for the years ended October 31, 2023 and October 31, 2022 was as follows:
| | Year Ended October 31, |
| | 2023 | 2022 |
| Ordinary income | $443,225,993 | $336,306,236 |
During the year ended October 31, 2023, accumulated loss was increased by $1,845,644 and paid-in capital was increased by $1,845,644 due to the Fund’s use of equalization accounting. Tax equalization accounting allows the Fund to treat as a distribution that portion of redemption proceeds representing a redeeming shareholder’s portion of undistributed taxable income and net capital gains. These reclassifications had no effect on the net assets or net asset value per share of the Fund.
As of October 31, 2023, the components of distributable earnings (accumulated loss) on a tax basis were as follows:
| Undistributed ordinary income | $ 21,687,215 |
| Deferred capital losses | (737,114,128) |
| Net unrealized depreciation | (454,497,150) |
| Distributions payable | (6,536,211) |
| Accumulated loss | $(1,176,460,274) |
At October 31, 2023, the Fund, for federal income tax purposes, had deferred capital losses of $737,114,128 which would reduce its taxable income arising from future net realized gains on investment transactions, if any, to the extent permitted by the Internal Revenue Code, and thus would reduce the amount of distributions to shareholders, which would otherwise be necessary to relieve the Fund of any liability for federal income or excise tax. The deferred capital losses are treated as arising on the first day of the Fund’s next taxable year and retain the same short-term or long-term character as when originally deferred. Of the deferred capital losses at October 31, 2023, $74,968,901 are short-term and $662,145,227 are long-term.
3 Investment Adviser Fee and Other Transactions with Affiliates
The investment adviser fee is earned by Eaton Vance Management (EVM), an indirect, wholly-owned subsidiary of Morgan Stanley, as compensation for investment advisory services rendered to the Fund. The fee is computed at an annual rate as a percentage of the Fund’s average daily net assets that are not invested in other investment companies for which EVM or its affiliates serve as investment adviser and receive an advisory fee as follows and is payable monthly:
| Average Daily Net Assets | Annual Fee Rate |
| Up to $1 billion | 0.5750% |
| $1 billion but less than $2 billion | 0.5250% |
| $2 billion but less than $5 billion | 0.4900% |
| $5 billion but less than $10 billion | 0.4600% |
| $10 billion but less than $15 billion | 0.4350% |
| $15 billion but less than $20 billion | 0.4150% |
| $20 billion but less than $25 billion | 0.4000% |
| $25 billion and over | 0.3900% |
Eaton Vance
Floating-Rate Fund
October 31, 2023
Notes to Financial Statements — continued
For the year ended October 31, 2023, the Fund incurred no investment adviser fee on such assets. To the extent that the Fund’s assets are invested in the Portfolio, the Fund is allocated its share of the Portfolio’s investment adviser fee. The Portfolio has engaged Boston Management and Research (BMR) to render investment advisory services. See Note 2 of the Portfolio’s Notes to Financial Statements which are included elsewhere in this report. The administration fee is earned by EVM as compensation for administrative services rendered to the Fund. The fee is computed at an annual rate of 0.15% of the Fund’s average daily net assets. For year ended October 31, 2023, the administration fee amounted to $8,320,781. EVM provides sub-transfer agency and related services to the Fund pursuant to a Sub-Transfer Agency Support Services Agreement. For the year ended October 31, 2023, EVM earned $223,850 from the Fund pursuant to such agreement, which is included in transfer and dividend disbursing agent fees on the Statement of Operations. The Fund was informed that Eaton Vance Distributors, Inc. (EVD), an affiliate of EVM and the Fund's principal underwriter, received $36,563 as its portion of the sales charge on sales of Class A shares for the year ended October 31, 2023. The Fund was informed that Morgan Stanley affiliated broker-dealers, which may be deemed to be affiliates of EVM, BMR and EVD, also received a portion of the sales charge on sales of Class A shares for the year ended October 31, 2023 in the amount of $6,677. EVD also received distribution and service fees from Advisers Class, Class A and Class C shares (see Note 4) and contingent deferred sales charges (see Note 5).
Trustees and officers of the Fund who are members of EVM’s or BMR's organizations receive remuneration for their services to the Fund out of the investment adviser fee. Certain officers and Trustees of the Fund and the Portfolio are officers of the above organizations.
4 Distribution Plans
The Fund has in effect distribution plans for Advisers Class shares and Class A shares (Advisers/Class A Plan) pursuant to Rule 12b-1 under the 1940 Act. Pursuant to the Advisers/Class A Plan, the Fund pays EVD a distribution and service fee of 0.25% per annum of its average daily net assets attributable to Advisers Class and Class A shares for distribution services and facilities provided to the Fund by EVD, as well as for personal services and/or the maintenance of shareholder accounts. Distribution and service fees paid or accrued to EVD for the year ended October 31, 2023 amounted to $210,041 for Advisers Class shares and $1,619,157 for Class A shares.
The Fund also has in effect a distribution plan for Class C shares (Class C Plan) pursuant to Rule 12b-1 under the 1940 Act. Pursuant to the Class C Plan, the Fund pays EVD amounts equal to 0.75% per annum of its average daily net assets attributable to Class C shares for providing ongoing distribution services and facilities to the Fund. For the year ended October 31, 2023, the Fund paid or accrued to EVD $766,405 for Class C shares.
Pursuant to the Class C Plan, the Fund also makes payments of service fees to EVD, financial intermediaries and other persons in amounts equal to 0.25% per annum of its average daily net assets attributable to Class C shares. Service fees paid or accrued are for personal services and/or the maintenance of shareholder accounts. They are separate and distinct from the sales commissions and distribution fees payable to EVD. Service fees paid or accrued for the year ended October 31, 2023 amounted to $255,469 for Class C shares.
Distribution and service fees are subject to the limitations contained in the Financial Industry Regulatory Authority Rule 2341(d).
5 Contingent Deferred Sales Charges
A contingent deferred sales charge (CDSC) of 1% generally is imposed on redemptions of Class C shares made within 12 months of purchase. Class A shares may be subject to a 0.75% CDSC if redeemed within 12 months of purchase (depending on the circumstances of purchase). Generally, the CDSC is based upon the lower of the net asset value at date of redemption or date of purchase. No charge is levied on shares acquired by reinvestment of dividends or capital gain distributions. For the year ended October 31, 2023, the Fund was informed that EVD received $14,143 of CDSCs paid by Class C shareholders and no CDSCs paid by Class A shareholders.
6 Investment Transactions
For the year ended October 31, 2023, increases and decreases in the Fund's investment in the Portfolio aggregated $282,861,050 and $2,732,176,996, respectively.
Eaton Vance
Floating-Rate Fund
October 31, 2023
Notes to Financial Statements — continued
7 Shares of Beneficial Interest
The Fund’s Declaration of Trust permits the Trustees to issue an unlimited number of full and fractional shares of beneficial interest (without par value). Such shares may be issued in a number of different series (such as the Fund) and classes. Transactions in Fund shares, including direct exchanges pursuant to share class conversions, were as follows:
| | Year Ended
October 31, 2023 | | Year Ended
October 31, 2022 |
| | Shares | Amount | | Shares | Amount |
| Advisers Class | | | | | |
| Sales | 8,641,662 | $ 72,212,163 | | 3,644,668 | $ 31,551,820 |
| Issued to shareholders electing to receive payments of distributions in Fund shares | 791,416 | 6,582,749 | | 554,744 | 4,711,807 |
| Redemptions | (3,989,668) | (33,036,645) | | (12,641,510) | (106,805,501) |
| Net increase (decrease) | 5,443,410 | $ 45,758,267 | | (8,442,098) | $ (70,541,874) |
| Class A | | | | | |
| Sales | 12,432,666 | $ 106,676,323 | | 25,542,048 | $ 226,746,300 |
| Issued to shareholders electing to receive payments of distributions in Fund shares | 5,050,433 | 43,391,112 | | 2,944,032 | 25,655,161 |
| Redemptions | (30,796,059) | (263,745,582) | | (26,921,633) | (236,781,119) |
| Net increase (decrease) | (13,312,960) | $ (113,678,147) | | 1,564,447 | $ 15,620,342 |
| Class C | | | | | |
| Sales | 1,292,224 | $ 10,703,034 | | 4,108,247 | $ 35,372,450 |
| Issued to shareholders electing to receive payments of distributions in Fund shares | 747,519 | 6,198,897 | | 419,546 | 3,528,094 |
| Redemptions | (5,784,216) | (47,902,830) | | (5,477,117) | (46,559,817) |
| Net decrease | (3,744,473) | $ (31,000,899) | | (949,324) | $ (7,659,273) |
| Class I | | | | | |
| Sales | 126,577,358 | $ 1,049,625,183 | | 382,492,826 | $ 3,292,754,189 |
| Issued to shareholders electing to receive payments of distributions in Fund shares | 32,389,436 | 269,072,260 | | 24,345,368 | 205,385,574 |
| Redemptions | (402,538,193) | (3,332,873,611) | | (439,558,448) | (3,703,140,149) |
| Net decrease | (243,571,399) | $(2,014,176,168) | | (32,720,254) | $ (205,000,386) |
| Class R6 | | | | | |
| Sales | 51,948,178 | $ 431,460,935 | | 53,221,812 | $ 460,319,638 |
| Issued to shareholders electing to receive payments of distributions in Fund shares | 3,650,917 | 30,368,362 | | 2,148,153 | 18,135,563 |
| Redemptions | (39,367,783) | (326,468,120) | | (60,111,113) | (507,261,852) |
| Net increase (decrease) | 16,231,312 | $ 135,361,177 | | (4,741,148) | $ (28,806,651) |
Eaton Vance
Floating-Rate Fund
October 31, 2023
Report of Independent Registered Public Accounting Firm
To the Trustees of Eaton Vance Mutual Funds Trust and Shareholders of Eaton Vance Floating-Rate Fund:
Opinion on the Financial Statements and Financial Highlights
We have audited the accompanying statement of assets and liabilities of Eaton Vance Floating-Rate Fund (the “Fund”) (one of the funds constituting Eaton Vance Mutual Funds Trust), as of October 31, 2023, the related statement of operations for the year then ended, the statements of changes in net assets for each of the two years in the period then ended, the financial highlights for each of the five years in the period then ended, and the related notes. In our opinion, the financial statements and financial highlights present fairly, in all material respects, the financial position of the Fund as of October 31, 2023, and the results of its operations for the year then ended, the changes in its net assets for each of the two years in the period then ended, and the financial highlights for each of the five years in the period then ended, in conformity with accounting principles generally accepted in the United States of America.
Basis for Opinion
These financial statements and financial highlights are the responsibility of the Fund's management. Our responsibility is to express an opinion on the Fund's financial statements and financial highlights based on our audits. We are a public accounting firm registered with the Public Company Accounting Oversight Board (United States) (PCAOB) and are required to be independent with respect to the Fund in accordance with the U.S. federal securities laws and the applicable rules and regulations of the Securities and Exchange Commission and the PCAOB.
We conducted our audits in accordance with the standards of the PCAOB. Those standards require that we plan and perform the audit to obtain reasonable assurance about whether the financial statements and financial highlights are free of material misstatement, whether due to error or fraud. The Fund is not required to have, nor were we engaged to perform, an audit of its internal control over financial reporting. As part of our audits, we are required to obtain an understanding of internal control over financial reporting but not for the purpose of expressing an opinion on the effectiveness of the Fund’s internal control over financial reporting. Accordingly, we express no such opinion.
Our audits included performing procedures to assess the risks of material misstatement of the financial statements and financial highlights, whether due to error or fraud, and performing procedures that respond to those risks. Such procedures included examining, on a test basis, evidence regarding the amounts and disclosures in the financial statements and financial highlights. Our audits also included evaluating the accounting principles used and significant estimates made by management, as well as evaluating the overall presentation of the financial statements and financial highlights. We believe that our audits provide a reasonable basis for our opinion.
/s/ Deloitte & Touche LLP
Boston, Massachusetts
December 19, 2023
We have served as the auditor of one or more Eaton Vance investment companies since 1959.
Eaton Vance
Floating-Rate Fund
October 31, 2023
Federal Tax Information (Unaudited)
The Form 1099-DIV you receive in February 2024 will show the tax status of all distributions paid to your account in calendar year 2023. Shareholders are advised to consult their own tax adviser with respect to the tax consequences of their investment in the Fund. As required by the Internal Revenue Code and/or regulations, shareholders must be notified regarding the status of qualified dividend income for individuals, the dividends received deduction for corporations and 163(j) interest dividends.
Qualified Dividend Income. For the fiscal year ended October 31, 2023, the Fund designates approximately $1,071,244, or up to the maximum amount of such dividends allowable pursuant to the Internal Revenue Code, as qualified dividend income eligible for the reduced tax rate of 15%.
Dividends Received Deduction. Corporate shareholders are generally entitled to take the dividends received deduction on the portion of the Fund’s dividend distribution that qualifies under tax law. For the Fund’s fiscal 2023 ordinary income dividends, 0.49% qualifies for the corporate dividends received deduction.
163(j) Interest Dividends. For the fiscal year ended October 31, 2023, the Fund designates 94.19% of distributions from net investment income as a 163(j) interest dividend.
Eaton Vance
Floating Rate Portfolio
October 31, 2023
| Asset-Backed Securities — 4.7% |
| Security | Principal
Amount
(000's omitted) | Value |
| Alinea CLO, Ltd.: | | | |
| Series 2018-1A, Class D, 8.777%, (3 mo. SOFR + 3.362%), 7/20/31(1)(2) | $ | 2,500 | $ 2,403,450 |
| Series 2018-1A, Class E, 11.677%, (3 mo. SOFR + 6.262%), 7/20/31(1)(2) | | 3,000 | 2,621,361 |
| AMMC CLO 15, Ltd., Series 2014-15A, Class ERR, 12.566%, (3 mo. SOFR + 7.172%), 1/15/32(1)(2) | | 4,000 | 3,515,388 |
| AMMC CLO XII, Ltd., Series 2013-12A, Class ER, 11.807%, (3 mo. SOFR + 6.442%), 11/10/30(1)(2) | | 3,525 | 3,009,589 |
| Apidos CLO XX, Series 2015-20A, Class DR, 11.356%, (3 mo. SOFR + 5.962%), 7/16/31(1)(2) | | 2,375 | 2,135,332 |
| Ares Loan Funding II, Ltd., Series 2022-ALF2A, Class ER, 13.656%, (3 mo. SOFR + 8.24%), 10/20/36(1)(2) | | 1,325 | 1,298,898 |
| Ares LVlll CLO, Ltd., Series 2020-58A, Class ER, 12.094%, (3 mo. SOFR + 6.70%), 1/15/35(1)(2) | | 3,000 | 2,733,831 |
| Ares XLIX CLO, Ltd., Series 2018-49A, Class D, 8.674%, (3 mo. SOFR + 3.262%), 7/22/30(1)(2) | | 2,500 | 2,395,640 |
| Ares XXXIIR CLO, Ltd., Series 2014-32RA, Class C, 8.526%, (3 mo. SOFR + 3.162%), 5/15/30(1)(2) | | 5,000 | 4,754,640 |
| Ares XXXVR CLO, Ltd., Series 2015-35RA, Class E, 11.356%, (3 mo. SOFR + 5.962%), 7/15/30(1)(2) | | 4,000 | 3,552,104 |
| Babson CLO, Ltd.: | | | |
| Series 2015-1A, Class DR, 8.277%, (3 mo. SOFR + 2.862%), 1/20/31(1)(2) | | 2,500 | 2,362,727 |
| Series 2018-1A, Class C, 8.256%, (3 mo. SOFR + 2.862%), 4/15/31(1)(2) | | 3,500 | 3,276,546 |
| Bain Capital Credit CLO, Ltd.: | | | |
| Series 2018-1A, Class D, 8.374%, (3 mo. SOFR + 2.962%), 4/23/31(1)(2) | | 5,000 | 4,651,770 |
| Series 2018-1A, Class E, 11.024%, (3 mo. SOFR + 5.612%), 4/23/31(1)(2) | | 3,000 | 2,511,483 |
| Battalion CLO XXII, Ltd., Series 2021-22A, Class E, 12.627%, (3 mo. SOFR + 7.212%), 1/20/35(1)(2) | | 1,750 | 1,482,668 |
| Battalion CLO XXIII, Ltd., Series 2022-23A, Class D, 9.344%, (3 mo. SOFR + 3.95%), 5/19/36(1)(2) | | 3,500 | 3,230,965 |
| Benefit Street Partners CLO V-B, Ltd., Series 2018-5BA, Class D, 11.627%, (3 mo. SOFR + 6.212%), 4/20/31(1)(2) | | 3,500 | 3,250,653 |
| Benefit Street Partners CLO VIII, Ltd., Series 2015-8A, Class DR, 11.277%, (3 mo. SOFR + 5.862%), 1/20/31(1)(2) | | 5,401 | 4,544,758 |
| Benefit Street Partners CLO XIV, Ltd., Series 2018-14A, Class D, 8.277%, (3 mo. SOFR + 2.862%), 4/20/31(1)(2) | | 1,500 | 1,419,594 |
| Benefit Street Partners CLO XVI, Ltd., Series 2018-16A, Class E, 12.364%, (3 mo. SOFR + 6.962%), 1/17/32(1)(2) | | 2,250 | 2,108,072 |
| Security | Principal
Amount
(000's omitted) | Value |
| Benefit Street Partners CLO XVII, Ltd., Series 2019-17A, Class ER, 12.006%, (3 mo. SOFR + 6.612%), 7/15/32(1)(2) | $ | 1,750 | $ 1,677,869 |
| Benefit Street Partners CLO XXII, Ltd., Series 2020-22A, Class ER, 12.346%, (3 mo. SOFR + 6.93%), 4/20/35(1)(2) | | 1,000 | 930,082 |
| Benefit Street Partners CLO XXV, Ltd., Series 2021-25A, Class E, 12.506%, (3 mo. SOFR + 7.112%), 1/15/35(1)(2) | | 3,000 | 2,845,206 |
| Betony CLO 2, Ltd.: | | | |
| Series 2018-1A, Class C, 8.552%, (3 mo. SOFR + 3.162%), 4/30/31(1)(2) | | 2,500 | 2,387,102 |
| Series 2018-1A, Class D, 11.302%, (3 mo. SOFR + 5.912%), 4/30/31(1)(2) | | 2,475 | 2,178,101 |
| BlueMountain CLO XXIV, Ltd., Series 2019-24A, Class ER, 12.517%, (3 mo. SOFR + 7.102%), 4/20/34(1)(2) | | 1,000 | 880,092 |
| BlueMountain CLO XXVI, Ltd., Series 2019-26A, Class ER, 12.807%, (3 mo. SOFR + 7.392%), 10/20/34(1)(2) | | 3,000 | 2,781,324 |
| BlueMountain CLO XXX, Ltd., Series 2020-30A, Class ER, 12.094%, (3 mo. SOFR + 6.70%), 4/15/35(1)(2) | | 2,000 | 1,779,092 |
| BlueMountain CLO XXXIII, Ltd., Series 2021-33A, Class E, 12.471%, (3 mo. SOFR + 7.092%), 11/20/34(1)(2) | | 2,500 | 2,322,227 |
| BlueMountain CLO XXXV, Ltd., Series 2022-35A, Class E, 13.162%, (3 mo. SOFR + 7.75%), 7/22/35(1)(2) | | 2,000 | 1,884,938 |
| BlueMountain CLO, Ltd.: | | | |
| Series 2016-3A, Class DR, 8.726%, (3 mo. SOFR + 3.362%), 11/15/30(1)(2) | | 1,500 | 1,375,377 |
| Series 2016-3A, Class ER, 11.576%, (3 mo. SOFR + 6.212%), 11/15/30(1)(2) | | 1,500 | 1,224,608 |
| Series 2018-1A, Class D, 8.702%, (3 mo. SOFR + 3.312%), 7/30/30(1)(2) | | 2,500 | 2,266,958 |
| Series 2018-1A, Class E, 11.602%, (3 mo. SOFR + 6.212%), 7/30/30(1)(2) | | 2,000 | 1,534,322 |
| Bryant Park Funding, Ltd.: | | | |
| Series 2023-20A, Class D, 11.449%, (3 mo. SOFR + 6.09%), 7/15/36(1)(2) | | 3,500 | 3,410,771 |
| Series 2023-21A, Class D, 10.935%, (3 mo. SOFR + 5.45%), 10/18/36(1)(2) | | 3,525 | 3,501,841 |
| Canyon Capital CLO, Ltd.: | | | |
| Series 2012-1RA, Class E, 11.356%, (3 mo. SOFR + 5.962%), 7/15/30(1)(2) | | 4,875 | 4,244,814 |
| Series 2016-1A, Class ER, 11.406%, (3 mo. SOFR + 6.012%), 7/15/31(1)(2) | | 4,000 | 3,392,436 |
| Series 2016-2A, Class ER, 11.656%, (3 mo. SOFR + 6.262%), 10/15/31(1)(2) | | 4,500 | 3,826,125 |
| Series 2017-1A, Class E, 11.906%, (3 mo. SOFR + 6.512%), 7/15/30(1)(2) | | 3,250 | 2,877,287 |
22
See Notes to Financial Statements.
Eaton Vance
Floating Rate Portfolio
October 31, 2023
Portfolio of Investments — continued
| Security | Principal
Amount
(000's omitted) | Value |
| Canyon Capital CLO, Ltd.: (continued) | | | |
| Series 2018-1A, Class D, 8.556%, (3 mo. SOFR + 3.162%), 7/15/31(1)(2) | $ | 3,000 | $ 2,848,887 |
| Series 2018-1A, Class E, 11.406%, (3 mo. SOFR + 6.012%), 7/15/31(1)(2) | | 2,750 | 2,345,882 |
| Series 2019-2A, Class ER, 12.406%, (3 mo. SOFR + 7.011%), 10/15/34(1)(2) | | 1,500 | 1,360,722 |
| Carlyle CLO C17, Ltd.: | | | |
| Series C17A, Class CR, 8.452%, (3 mo. SOFR + 3.062%), 4/30/31(1)(2) | | 5,000 | 4,680,700 |
| Series C17A, Class DR, 11.652%, (3 mo. SOFR + 6.262%), 4/30/31(1)(2) | | 3,500 | 2,841,314 |
| Carlyle Global Market Strategies CLO, Ltd.: | | | |
| Series 2012-3A, Class CR2, 9.156%, (3 mo. SOFR + 3.762%), 1/14/32(1)(2) | | 2,500 | 2,408,155 |
| Series 2012-3A, Class DR2, 12.156%, (3 mo. SOFR + 6.761%), 1/14/32(1)(2) | | 1,500 | 1,251,521 |
| Series 2014-3RA, Class C, 8.599%, (3 mo. SOFR + 3.212%), 7/27/31(1)(2) | | 1,000 | 924,119 |
| Series 2014-3RA, Class D, 11.049%, (3 mo. SOFR + 5.662%), 7/27/31(1)(2) | | 2,150 | 1,877,116 |
| Series 2014-4RA, Class C, 8.556%, (3 mo. SOFR + 3.162%), 7/15/30(1)(2) | | 2,000 | 1,848,728 |
| Series 2014-4RA, Class D, 11.306%, (3 mo. SOFR + 5.912%), 7/15/30(1)(2) | | 1,500 | 1,206,492 |
| Carlyle US CLO, Ltd.: | | | |
| Series 2019-4A, Class DR, 11.994%, (3 mo. SOFR + 6.60%), 4/15/35(1)(2) | | 3,000 | 2,658,969 |
| Series 2022-6A, Class DR, 10.13%, (3 mo. SOFR + 4.75%), 10/25/36(1)(2) | | 2,200 | 2,207,482 |
| CarVal CLO IV, Ltd., Series 2021-1A, Class E, 12.277%, (3 mo. SOFR + 6.862%), 7/20/34(1)(2) | | 1,000 | 975,659 |
| CIFC Funding, Ltd., Series 2022-4A, Class D, 8.944%, (3 mo. SOFR + 3.55%), 7/16/35(1)(2) | | 1,750 | 1,725,726 |
| Dryden CLO, Ltd.: | | | |
| Series 2018-55A, Class D, 8.506%, (3 mo. SOFR + 3.112%), 4/15/31(1)(2) | | 1,500 | 1,399,137 |
| Series 2018-55A, Class E, 11.056%, (3 mo. SOFR + 5.662%), 4/15/31(1)(2) | | 2,000 | 1,749,672 |
| Series 2022-112A, Class E, 13.145%, (3 mo. SOFR + 7.78%), 8/15/34(1)(2) | | 2,000 | 1,973,216 |
| Dryden Senior Loan Fund: | | | |
| Series 2015-41A, Class DR, 8.256%, (3 mo. SOFR + 2.862%), 4/15/31(1)(2) | | 5,000 | 4,641,865 |
| Series 2015-41A, Class ER, 10.956%, (3 mo. SOFR + 5.562%), 4/15/31(1)(2) | | 1,268 | 989,947 |
| Series 2016-42A, Class DR, 8.586%, (3 mo. SOFR + 3.192%), 7/15/30(1)(2) | | 2,500 | 2,348,357 |
| Series 2016-42A, Class ER, 11.206%, (3 mo. SOFR + 5.812%), 7/15/30(1)(2) | | 3,500 | 2,953,135 |
| Elmwood CLO 14, Ltd., Series 2022-1A, Class E, 11.766%, (3 mo. SOFR + 6.35%), 4/20/35(1)(2) | | 1,950 | 1,875,321 |
| Elmwood CLO 17, Ltd., Series 2022-4A, Class E, 12.553%, (3 mo. SOFR + 7.15%), 7/17/35(1)(2) | | 2,250 | 2,229,032 |
| Security | Principal
Amount
(000's omitted) | Value |
| Galaxy XXV CLO, Ltd.: | | | |
| Series 2018-25A, Class D, 8.74%, (3 mo. SOFR + 3.362%), 10/25/31(1)(2) | $ | 2,500 | $ 2,438,492 |
| Series 2018-25A, Class E, 11.59%, (3 mo. SOFR + 6.211%), 10/25/31(1)(2) | | 3,500 | 3,098,378 |
| Golub Capital Partners CLO 22B, Ltd., Series 2015-22A, Class ER, 11.677%, (3 mo. SOFR + 6.262%), 1/20/31(1)(2) | | 2,500 | 2,340,557 |
| Golub Capital Partners CLO 37B, Ltd.: | | | |
| Series 2018-37A, Class D, 8.977%, (3 mo. SOFR + 3.562%), 7/20/30(1)(2) | | 4,000 | 3,709,444 |
| Series 2018-37A, Class E, 11.427%, (3 mo. SOFR + 6.012%), 7/20/30(1)(2) | | 4,750 | 4,695,978 |
| Golub Capital Partners CLO 53B, Ltd., Series 2021-53A, Class E, 12.377%, (3 mo. SOFR + 6.962%), 7/20/34(1)(2) | | 1,250 | 1,141,728 |
| Golub Capital Partners CLO 58B, Ltd., Series 2021-58A, Class E, 12.45%, (3 mo. SOFR + 7.072%), 1/25/35(1)(2) | | 2,500 | 2,306,540 |
| Halseypoint CLO 5, Ltd., Series 2021-5A, Class E, 12.592%, (3 mo. SOFR + 7.202%), 1/30/35(1)(2) | | 2,000 | 1,821,042 |
| Harriman Park CLO, Ltd., Series 2020-1A, Class ER, 12.077%, (3 mo. SOFR + 6.662%), 4/20/34(1)(2) | | 1,000 | 929,261 |
| ICG US CLO, Ltd.: | | | |
| Series 2018-2A, Class D, 8.774%, (3 mo. SOFR + 3.362%), 7/22/31(1)(2) | | 2,000 | 1,844,714 |
| Series 2018-2A, Class E, 11.424%, (3 mo. SOFR + 6.012%), 7/22/31(1)(2) | | 3,000 | 2,468,892 |
| Madison Park Funding LIX, Ltd., Series 2021-59A, Class E, 12.257%, (3 mo. SOFR + 6.862%), 1/18/34(1)(2) | | 1,450 | 1,354,316 |
| Madison Park Funding XXV, Ltd., Series 2017-25A, Class D, 11.74%, (3 mo. SOFR + 6.362%), 4/25/29(1)(2) | | 1,500 | 1,399,364 |
| Madison Park Funding XXXVI, Ltd., Series 2019-36A, Class ER, 12.444%, (3 mo. SOFR + 7.05%), 4/15/35(1)(2) | | 2,500 | 2,464,607 |
| Marble Point CLO XXIV, Ltd., Series 2022-1A, Class D1, 9.656%, (3 mo. SOFR + 4.24%), 4/20/35(1)(2) | | 2,000 | 1,948,968 |
| Neuberger Berman CLO XXII, Ltd.: | | | |
| Series 2016-22A, Class DR, 8.764%, (3 mo. SOFR + 3.362%), 10/17/30(1)(2) | | 2,500 | 2,405,505 |
| Series 2016-22A, Class ER, 11.724%, (3 mo. SOFR + 6.322%), 10/17/30(1)(2) | | 3,000 | 2,729,217 |
| Neuberger Berman Loan Advisers CLO 28, Ltd., Series 2018-28A, Class E, 11.277%, (3 mo. SOFR + 5.862%), 4/20/30(1)(2) | | 1,950 | 1,712,176 |
| Neuberger Berman Loan Advisers CLO 30, Ltd., Series 2018-30A, Class ER, 11.877%, (3 mo. SOFR + 6.462%), 1/20/31(1)(2) | | 1,000 | 944,940 |
23
See Notes to Financial Statements.
Eaton Vance
Floating Rate Portfolio
October 31, 2023
Portfolio of Investments — continued
| Security | Principal
Amount
(000's omitted) | Value |
| Neuberger Berman Loan Advisers CLO 48, Ltd., Series 2022-48A, Class E, 11.878%, (3 mo. SOFR + 6.50%), 4/25/36(1)(2) | $ | 3,200 | $ 3,044,691 |
| OCP CLO, Ltd.: | | | |
| Series 2022-24A, Class D, 9.216%, (3 mo. SOFR + 3.80%), 7/20/35(1)(2) | | 500 | 472,812 |
| Series 2022-24A, Class E, 12.836%, (3 mo. SOFR + 7.42%), 7/20/35(1)(2) | | 1,000 | 966,488 |
| Palmer Square CLO, Ltd.: | | | |
| Series 2013-2A, Class DRR, 11.514%, (3 mo. SOFR + 6.111%), 10/17/31(1)(2) | | 1,325 | 1,241,293 |
| Series 2015-1A, Class DR4, 12.141%, (3 mo. SOFR + 6.762%), 5/21/34(1)(2) | | 2,000 | 1,847,830 |
| Series 2018-1A, Class D, 10.807%, (3 mo. SOFR + 5.412%), 4/18/31(1)(2) | | 2,000 | 1,881,298 |
| Series 2018-2A, Class D, 11.256%, (3 mo. SOFR + 5.862%), 7/16/31(1)(2) | | 2,000 | 1,928,870 |
| Series 2021-2A, Class E, 12.006%, (3 mo. SOFR + 6.612%), 7/15/34(1)(2) | | 1,000 | 962,846 |
| Series 2022-1A, Class E, 11.766%, (3 mo. SOFR + 6.35%), 4/20/35(1)(2) | | 2,000 | 1,929,592 |
| RAD CLO 5, Ltd., Series 2019-5A, Class E, 12.36%, (3 mo. SOFR + 6.962%), 7/24/32(1)(2) | | 1,250 | 1,169,161 |
| RAD CLO 14, Ltd., Series 2021-14A, Class E, 12.156%, (3 mo. SOFR + 6.762%), 1/15/35(1)(2) | | 950 | 890,045 |
| Regatta XIII Funding, Ltd.: | | | |
| Series 2018-2A, Class C, 8.756%, (3 mo. SOFR + 3.362%), 7/15/31(1)(2) | | 2,500 | 2,432,925 |
| Series 2018-2A, Class D, 11.606%, (3 mo. SOFR + 6.212%), 7/15/31(1)(2) | | 5,000 | 4,067,035 |
| Regatta XIV Funding, Ltd.: | | | |
| Series 2018-3A, Class D, 8.84%, (3 mo. SOFR + 3.462%), 10/25/31(1)(2) | | 2,500 | 2,442,735 |
| Series 2018-3A, Class E, 11.59%, (3 mo. SOFR + 6.211%), 10/25/31(1)(2) | | 2,000 | 1,801,678 |
| Regatta XV Funding, Ltd., Series 2018-4A, Class D, 12.14%, (3 mo. SOFR + 6.762%), 10/25/31(1)(2) | | 2,875 | 2,543,044 |
| Symphony CLO, Ltd., Series 2022-37A, Class D1, 10.846%, (3 mo. SOFR + 5.43%), 10/20/34(1)(2) | | 2,500 | 2,518,007 |
| Upland CLO, Ltd.: | | | |
| Series 2016-1A, Class CR, 8.577%, (3 mo. SOFR + 3.162%), 4/20/31(1)(2) | | 4,500 | 4,239,504 |
| Series 2016-1A, Class DR, 11.577%, (3 mo. SOFR + 6.162%), 4/20/31(1)(2) | | 2,125 | 1,920,182 |
| Vibrant CLO IX, Ltd.: | | | |
| Series 2018-9A, Class C, 8.877%, (3 mo. SOFR + 3.462%), 7/20/31(1)(2) | | 2,500 | 2,231,463 |
| Series 2018-9A, Class D, 11.927%, (3 mo. SOFR + 6.512%), 7/20/31(1)(2) | | 3,500 | 2,432,773 |
| Vibrant CLO X, Ltd.: | | | |
| Series 2018-10A, Class C, 8.927%, (3 mo. SOFR + 3.512%), 10/20/31(1)(2) | | 5,000 | 4,605,920 |
| Security | Principal
Amount
(000's omitted) | Value |
| Vibrant CLO X, Ltd.: (continued) | | | |
| Series 2018-10A, Class D, 11.867%, (3 mo. SOFR + 6.452%), 10/20/31(1)(2) | $ | 5,000 | $ 3,719,755 |
| Voya CLO, Ltd.: | | | |
| Series 2015-3A, Class CR, 8.827%, (3 mo. SOFR + 3.412%), 10/20/31(1)(2) | | 2,500 | 2,177,888 |
| Series 2015-3A, Class DR, 11.877%, (3 mo. SOFR + 6.462%), 10/20/31(1)(2) | | 5,500 | 4,405,318 |
| Series 2016-3A, Class CR, 8.907%, (3 mo. SOFR + 3.512%), 10/18/31(1)(2) | | 2,000 | 1,813,576 |
| Series 2016-3A, Class DR, 11.737%, (3 mo. SOFR + 6.342%), 10/18/31(1)(2) | | 2,375 | 1,880,140 |
| Series 2018-2A, Class E, 10.906%, (3 mo. SOFR + 5.512%), 7/15/31(1)(2) | | 2,500 | 2,129,953 |
| Webster Park CLO, Ltd.: | | | |
| Series 2015-1A, Class CR, 8.577%, (3 mo. SOFR + 3.162%), 7/20/30(1)(2) | | 2,000 | 1,925,990 |
| Series 2015-1A, Class DR, 11.177%, (3 mo. SOFR + 5.762%), 7/20/30(1)(2) | | 2,500 | 2,130,353 |
| Wellfleet CLO, Ltd.: | | | |
| Series 2021-1A, Class D, 9.177%, (3 mo. SOFR + 3.762%), 4/20/34(1)(2) | | 1,200 | 1,078,579 |
| Series 2021-3A, Class E, 12.756%, (3 mo. SOFR + 7.362%), 1/15/35(1)(2) | | 950 | 800,259 |
| Series 2022-1A, Class D, 9.534%, (3 mo. SOFR + 4.14%), 4/15/34(1)(2) | | 1,000 | 945,569 |
| Series 2022-1A, Class E, 13.254%, (3 mo. SOFR + 7.86%), 4/15/34(1)(2) | | 2,000 | 1,852,368 |
Total Asset-Backed Securities
(identified cost $297,460,747) | | | $ 270,085,254 |
| Security | Shares | Value |
| Aerospace and Defense — 0.0% |
| IAP Global Services, LLC(3)(4)(5)(6) | | 950 | $ 0 |
| IAP Global Services, LLC(3)(4)(5) | | 1,627 | 0 |
| | | | $ 0 |
| Chemicals — 0.0% |
| Flint Campfire Topco, Ltd., Class A(4)(5)(6) | | 3,812,783 | $ 0 |
| | | | $ 0 |
| Commercial Services & Supplies — 0.1% |
| Monitronics International, Inc.(5)(6) | | 223,950 | $ 4,702,950 |
| Phoenix Services International, LLC(5)(6) | | 168,954 | 1,605,063 |
| Phoenix Services International, LLC(5)(6) | | 15,415 | 146,442 |
| | | | $ 6,454,455 |
24
See Notes to Financial Statements.
Eaton Vance
Floating Rate Portfolio
October 31, 2023
Portfolio of Investments — continued
| Security | Shares | Value |
| Containers and Glass Products — 0.0%(7) |
| LG Newco Holdco, Inc.(5)(6) | | 250,979 | $ 1,443,129 |
| | | | $ 1,443,129 |
| Electronics/Electrical — 0.0%(7) |
| Skillsoft Corp.(5)(6) | | 44,676 | $ 839,909 |
| | | | $ 839,909 |
| Entertainment — 0.1% |
| New Cineworld, Ltd.(5)(6) | | 80,602 | $ 1,722,868 |
| | | | $ 1,722,868 |
| Health Care — 0.0% |
| Akorn Holding Company, LLC(4)(5)(6) | | 705,631 | $ 0 |
| | | | $ 0 |
| Household Durables — 0.3% |
| Serta Simmons Bedding, Inc.(5)(6) | | 1,348,933 | $ 18,885,062 |
| Serta SSB Equipment Co.(4)(5)(6) | | 1,348,933 | 0 |
| | | | $ 18,885,062 |
| Investment Companies — 0.0%(7) |
| Aegletes B.V.(5)(6) | | 116,244 | $ 280,439 |
| Jubilee Topco, Ltd., Class A(4)(5)(6) | | 2,897,167 | 0 |
| | | | $ 280,439 |
| Nonferrous Metals/Minerals — 0.1% |
| ACNR Holdings, Inc., Class A(5)(6) | | 36,829 | $ 3,148,879 |
| | | | $ 3,148,879 |
| Oil and Gas — 0.0%(7) |
| AFG Holdings, Inc.(4)(5)(6) | | 498,342 | $ 986,717 |
| McDermott International, Ltd.(5)(6) | | 1,013,850 | 273,740 |
| | | | $ 1,260,457 |
| Pharmaceuticals — 0.0%(7) |
| Covis Midco 1 S.a.r.l., Class A(5)(6) | | 8,008 | $ 4,084 |
| Covis Midco 1 S.a.r.l., Class B(5)(6) | | 8,008 | 4,084 |
| Covis Midco 1 S.a.r.l., Class C(5)(6) | | 8,008 | 4,084 |
| Covis Midco 1 S.a.r.l., Class D(5)(6) | | 8,008 | 4,084 |
| Covis Midco 1 S.a.r.l., Class E(5)(6) | | 8,008 | 4,084 |
| | | | $ 20,420 |
| Retailers (Except Food and Drug) — 0.0%(7) |
| Phillips Pet Holding Corp.(4)(5)(6) | | 2,590 | $ 102,897 |
| | | | $ 102,897 |
| Security | Shares | Value |
| Telecommunications — 0.0% |
| Global Eagle Entertainment(4)(5)(6) | | 364,650 | $ 0 |
| | | | $ 0 |
| Utilities — 0.0%(7) |
| Longview Intermediate Holdings, LLC, Class A(6) | | 149,459 | $ 1,206,134 |
| | | | $ 1,206,134 |
Total Common Stocks
(identified cost $80,724,650) | | | $ 35,364,649 |
| Security | Principal
Amount*
(000's omitted) | Value |
| Aerospace and Defense — 0.4% |
| TransDigm, Inc.: | | | |
| 6.25%, 3/15/26(1) | | 1,500 | $ 1,466,857 |
| 6.75%, 8/15/28(1) | | 3,175 | 3,086,841 |
| 6.875%, 12/15/30(1) | | 19,500 | 18,847,335 |
| | | | $ 23,401,033 |
| Air Transport — 0.6% |
| American Airlines, Inc./AAdvantage Loyalty IP, Ltd.: | | | |
| 5.50%, 4/20/26(1) | | 14,313 | $ 13,932,268 |
| 5.75%, 4/20/29(1) | | 12,875 | 11,626,509 |
| United Airlines, Inc.: | | | |
| 4.375%, 4/15/26(1) | | 4,625 | 4,294,819 |
| 4.625%, 4/15/29(1) | | 4,625 | 3,910,915 |
| | | | $ 33,764,511 |
| Automotive — 0.1% |
| Adient Global Holdings, Ltd., 7.00%, 4/15/28(1) | | 2,175 | $ 2,143,235 |
| Clarios Global, L.P., 6.75%, 5/15/25(1) | | 1,890 | 1,876,813 |
| Clarios Global, L.P./Clarios US Finance Co., 6.25%, 5/15/26(1) | | 3,893 | 3,809,775 |
| | | | $ 7,829,823 |
| Building and Development — 0.1% |
| Cushman & Wakefield U.S. Borrower, LLC, 6.75%, 5/15/28(1) | | 7,018 | $ 6,406,346 |
| Winnebago Industries, Inc., 6.25%, 7/15/28(1) | | 900 | 847,274 |
| | | | $ 7,253,620 |
25
See Notes to Financial Statements.
Eaton Vance
Floating Rate Portfolio
October 31, 2023
Portfolio of Investments — continued
| Security | Principal
Amount*
(000's omitted) | Value |
| Business Equipment and Services — 0.8% |
| Allied Universal Holdco, LLC/Allied Universal Finance Corp., 6.625%, 7/15/26(1) | | 2,075 | $ 1,944,949 |
| Allied Universal Holdco, LLC/Allied Universal Finance Corp./Atlas Luxco 4 S.a.r.l.: | | | |
| 4.625%, 6/1/28(1) | | 12,475 | 10,177,694 |
| 4.625%, 6/1/28(1) | | 23,725 | 19,429,703 |
| Prime Security Services Borrower, LLC/Prime Finance, Inc., 5.75%, 4/15/26(1) | | 15,225 | 14,784,812 |
| | | | $ 46,337,158 |
| Chemicals — 0.4% |
| Cheever Escrow Issuer, LLC, 7.125%, 10/1/27(1) | | 925 | $ 852,570 |
| INEOS Finance PLC, 3.375%, 3/31/26(1) | EUR | 1,250 | 1,253,188 |
| INEOS Quattro Finance 2 PLC, 3.375%, 1/15/26(1) | | 3,050 | 2,916,014 |
| Olympus Water US Holding Corp.: | | | |
| 4.25%, 10/1/28(1) | | 9,350 | 7,470,369 |
| 9.75%, 11/15/28(1) | | 8,600 | 8,410,378 |
| | | | $ 20,902,519 |
| Commercial Services — 0.2% |
| Neptune Bidco U.S., Inc., 9.29%, 4/15/29(1) | | 15,300 | $ 13,517,376 |
| | | | $ 13,517,376 |
| Containers & Packaging — 0.2% |
| Pactiv Evergreen Group Issuer, Inc./Pactiv Evergreen Group Issuer, LLC: | | | |
| 4.00%, 10/15/27(1) | | 5,150 | $ 4,499,291 |
| 4.375%, 10/15/28(1) | | 9,125 | 7,772,883 |
| | | | $ 12,272,174 |
| Diversified Financial Services — 0.3% |
| AG Issuer, LLC, 6.25%, 3/1/28(1) | | 8,075 | $ 7,447,716 |
| AG TTMT Escrow Issuer, LLC, 8.625%, 9/30/27(1) | | 2,925 | 2,941,439 |
| Aretec Escrow Issuer 2, Inc., 10.00%, 8/15/30(1)(8) | | 4,225 | 4,277,812 |
| | | | $ 14,666,967 |
| Diversified Telecommunication Services — 0.9% |
| Altice France S.A.: | | | |
| 5.125%, 1/15/29(1) | | 1,300 | $ 898,591 |
| 5.125%, 7/15/29(1) | | 42,825 | 29,349,960 |
| 5.50%, 10/15/29(1) | | 6,455 | 4,445,207 |
| Level 3 Financing, Inc., 3.875%, 11/15/29(1) | | 11,225 | 10,012,671 |
| Virgin Media Secured Finance PLC, 4.50%, 8/15/30(1) | | 6,500 | 5,367,635 |
| | | | $ 50,074,064 |
| Security | Principal
Amount*
(000's omitted) | Value |
| Drugs — 0.1% |
| Jazz Securities DAC, 4.375%, 1/15/29(1) | | 9,150 | $ 7,965,382 |
| | | | $ 7,965,382 |
| Ecological Services and Equipment — 0.1% |
| GFL Environmental, Inc., 4.25%, 6/1/25(1) | | 5,300 | $ 5,100,552 |
| | | | $ 5,100,552 |
| Electronics/Electrical — 0.4% |
| GoTo Group, Inc., 5.50%, 9/1/27(1) | | 10,760 | $ 5,623,288 |
| Imola Merger Corp., 4.75%, 5/15/29(1) | | 18,175 | 15,860,561 |
| | | | $ 21,483,849 |
| Entertainment — 0.1% |
| Live Nation Entertainment, Inc., 3.75%, 1/15/28(1) | | 2,075 | $ 1,818,737 |
| Six Flags Theme Parks, Inc., 7.00%, 7/1/25(1) | | 1,070 | 1,063,634 |
| | | | $ 2,882,371 |
| Health Care — 0.6% |
| Medline Borrower, L.P., 3.875%, 4/1/29(1) | | 22,800 | $ 19,272,855 |
| Tenet Healthcare Corp., 4.25%, 6/1/29 | | 15,950 | 13,666,951 |
| | | | $ 32,939,806 |
| Hotels, Restaurants & Leisure — 0.6% |
| Carnival Corp., 4.00%, 8/1/28(1) | | 34,575 | $ 30,102,544 |
| SeaWorld Parks & Entertainment, Inc., 8.75%, 5/1/25(1) | | 2,125 | 2,155,781 |
| | | | $ 32,258,325 |
| Household Products — 0.2% |
| Kronos Acquisition Holdings, Inc./KIK Custom Products, Inc., 5.00%, 12/31/26(1) | | 14,212 | $ 12,869,817 |
| | | | $ 12,869,817 |
| Insurance — 0.3% |
| Alliant Holdings Intermediate, LLC/Alliant Holdings Co., 4.25%, 10/15/27(1) | | 700 | $ 616,143 |
| NFP Corp.: | | | |
| 4.875%, 8/15/28(1) | | 5,520 | 4,838,766 |
| 7.50%, 10/1/30(1) | | 2,925 | 2,773,221 |
| 8.50%, 10/1/31(1) | | 8,300 | 8,168,583 |
| | | | $ 16,396,713 |
26
See Notes to Financial Statements.
Eaton Vance
Floating Rate Portfolio
October 31, 2023
Portfolio of Investments — continued
| Security | Principal
Amount*
(000's omitted) | Value |
| Internet Software & Services — 0.2% |
| Central Parent, Inc./CDK Global, Inc., 7.25%, 6/15/29(1) | | 13,700 | $ 13,175,673 |
| | | | $ 13,175,673 |
| Leisure Goods/Activities/Movies — 0.4% |
| Lindblad Expeditions, LLC, 6.75%, 2/15/27(1) | | 3,300 | $ 3,010,194 |
| NCL Corp., Ltd., 5.875%, 2/15/27(1) | | 22,000 | 20,272,430 |
| | | | $ 23,282,624 |
| Machinery — 0.3% |
| Madison IAQ, LLC, 4.125%, 6/30/28(1) | | 13,400 | $ 11,206,897 |
| TK Elevator U.S. Newco, Inc., 5.25%, 7/15/27(1) | | 7,150 | 6,516,919 |
| | | | $ 17,723,816 |
| Media — 0.4% |
| iHeartCommunications, Inc.: | | | |
| 4.75%, 1/15/28(1) | | 2,550 | $ 1,806,845 |
| 5.25%, 8/15/27(1) | | 2,125 | 1,559,329 |
| 6.375%, 5/1/26 | | 2,896 | 2,363,200 |
| 8.375%, 5/1/27 | | 5,248 | 3,222,327 |
| Univision Communications, Inc.: | | | |
| 4.50%, 5/1/29(1) | | 9,125 | 7,263,536 |
| 7.375%, 6/30/30(1) | | 9,150 | 8,065,665 |
| | | | $ 24,280,902 |
| Oil, Gas & Consumable Fuels — 0.2% |
| CITGO Petroleum Corporation, 7.00%, 6/15/25(1) | | 10,525 | $ 10,352,865 |
| | | | $ 10,352,865 |
| Professional Services — 0.1% |
| CoreLogic, Inc., 4.50%, 5/1/28(1) | | 5,525 | $ 4,384,419 |
| | | | $ 4,384,419 |
| Real Estate Investment Trusts (REITs) — 0.1% |
| Park Intermediate Holdings, LLC/PK Domestic Property, LLC/PK Finance Co-Issuer, 5.875%, 10/1/28(1) | | 6,425 | $ 5,793,101 |
| | | | $ 5,793,101 |
| Retail — 0.2% |
| Fertitta Entertainment, LLC/Fertitta Entertainment Finance Co., Inc., 4.625%, 1/15/29(1) | | 15,580 | $ 13,109,246 |
| | | | $ 13,109,246 |
| Security | Principal
Amount*
(000's omitted) | Value |
| Retailers (Except Food and Drug) — 0.0%(7) |
| PetSmart, Inc./PetSmart Finance Corp., 4.75%, 2/15/28(1) | | 1,300 | $ 1,151,746 |
| | | | $ 1,151,746 |
| Software — 0.3% |
| Boxer Parent Co., Inc., 7.125%, 10/2/25(1) | | 4,225 | $ 4,172,187 |
| Cloud Software Group, Inc., 9.00%, 9/30/29(1) | | 13,600 | 11,594,068 |
| Veritas US, Inc./Veritas Bermuda, Ltd., 7.50%, 9/1/25(1) | | 2,750 | 2,253,426 |
| | | | $ 18,019,681 |
| Technology — 0.2% |
| Clarivate Science Holdings Corp., 3.875%, 7/1/28(1) | | 11,400 | $ 9,802,152 |
| | | | $ 9,802,152 |
| Telecommunications — 0.2% |
| LCPR Senior Secured Financing DAC, 5.125%, 7/15/29(1) | | 9,325 | $ 7,273,692 |
| VMED O2 UK Financing I PLC, 4.25%, 1/31/31(1) | | 5,550 | 4,370,746 |
| | | | $ 11,644,438 |
| Trading Companies & Distributors — 0.0%(7) |
| American Builders & Contractors Supply Co., Inc., 4.00%, 1/15/28(1) | | 2,975 | $ 2,673,667 |
| | | | $ 2,673,667 |
| Utilities — 0.0%(7) |
| Calpine Corp., 5.25%, 6/1/26(1) | | 1,109 | $ 1,062,411 |
| | | | $ 1,062,411 |
| Wireless Telecommunication Services — 0.1% |
| Digicel International Finance, Ltd./Digicel International Holdings, Ltd., 8.75%, 5/25/24(1) | | 6,325 | $ 5,809,702 |
| | | | $ 5,809,702 |
Total Corporate Bonds
(identified cost $598,447,001) | | | $ 524,182,503 |
| Exchange-Traded Funds — 0.3% |
| Security | Shares | Value |
| SPDR Blackstone Senior Loan ETF | | 426,000 | $ 17,700,300 |
Total Exchange-Traded Funds
(identified cost $19,593,027) | | | $ 17,700,300 |
27
See Notes to Financial Statements.
Eaton Vance
Floating Rate Portfolio
October 31, 2023
Portfolio of Investments — continued
| Security | Shares | Value |
| Nonferrous Metals/Minerals — 0.2% |
| ACNR Holdings, Inc., 15.00% (PIK)(5)(6) | | 17,394 | $ 8,946,313 |
Total Preferred Stocks
(identified cost $0) | | | $ 8,946,313 |
| Senior Floating-Rate Loans — 81.4%(9) |
| Borrower/Description | Principal
Amount*
(000's omitted) | Value |
| Aerospace and Defense — 2.0% |
| Aernnova Aerospace S.A.U.: | | | |
| Term Loan, 6.783%, (3 mo. EURIBOR + 3.00%), 2/26/27 | EUR | 4,656 | $ 4,760,370 |
| Term Loan, 6.934%, (3 mo. EURIBOR + 3.00%), 2/26/27 | EUR | 1,194 | 1,220,608 |
| AI Convoy (Luxembourg) S.a.r.l., Term Loan, 7.722%, (3 mo. EURIBOR + 3.50%), 1/18/27 | EUR | 3,850 | 3,965,481 |
| Dynasty Acquisition Co., Inc.: | | | |
| Term Loan, 9.324%, (SOFR + 4.00%), 8/24/28 | | 23,402 | 23,171,462 |
| Term Loan, 9.324%, (SOFR + 4.00%), 8/24/28 | | 10,029 | 9,930,627 |
| IAP Worldwide Services, Inc., Term Loan - Second Lien, 12.152%, (3 mo. USD LIBOR + 6.50%), 7/18/23(4) | | 6,709 | 5,122,000 |
| TransDigm, Inc.: | | | |
| Term Loan, 8.64%, (SOFR + 3.25%), 2/22/27 | | 27,544 | 27,555,452 |
| Term Loan, 8.64%, (SOFR + 3.25%), 8/24/28 | | 16,042 | 16,039,386 |
| WP CPP Holdings, LLC, Term Loan, 9.29%, (SOFR + 3.75%), 4/30/25 | | 27,103 | 26,127,160 |
| | | | $ 117,892,546 |
| Airlines — 0.4% |
| American Airlines, Inc., Term Loan, 10.427%, (SOFR + 4.75%), 4/20/28 | | 24,863 | $ 25,246,750 |
| | | | $ 25,246,750 |
| Apparel & Luxury Goods — 0.1% |
| Hanesbrands, Inc., Term Loan, 9.074%, (SOFR + 3.75%), 3/8/30 | | 4,552 | $ 4,500,914 |
| | | | $ 4,500,914 |
| Auto Components — 1.8% |
| Adient US, LLC, Term Loan, 8.689%, (SOFR + 3.25%), 4/10/28 | | 5,523 | $ 5,529,734 |
| Borrower/Description | Principal
Amount*
(000's omitted) | Value |
| Auto Components (continued) |
| Autokiniton US Holdings, Inc., Term Loan, 9.939%, (SOFR + 4.50%), 4/6/28 | | 20,578 | $ 20,209,276 |
| Clarios Global, L.P., Term Loan, 7.118%, (1 mo. EURIBOR + 3.25%), 4/30/26 | EUR | 16,490 | 17,399,074 |
| DexKo Global, Inc.: | | | |
| Term Loan, 7.972%, (3 mo. EURIBOR + 4.00%), 10/4/28 | EUR | 3,272 | 3,271,262 |
| Term Loan, 7.972%, (3 mo. EURIBOR + 4.00%), 10/4/28 | EUR | 7,303 | 7,302,731 |
| Term Loan, 9.402%, (SOFR + 3.75%), 10/4/28 | | 13,371 | 12,834,434 |
| Garrett Motion, Inc., Term Loan, 9.883%, (SOFR + 4.50%), 4/30/28 | | 8,393 | 8,413,839 |
| LSF12 Badger Bidco, LLC, Term Loan, 11.324%, (SOFR + 6.00%), 8/30/30 | | 3,100 | 3,096,125 |
| LTI Holdings, Inc., Term Loan, 10.189%, (SOFR + 4.75%), 7/24/26 | | 7,044 | 6,755,899 |
| RealTruck Group, Inc.: | | | |
| Term Loan, 9.189%, (SOFR + 3.75%), 1/31/28 | | 11,509 | 10,997,334 |
| Term Loan, 10.406%, (SOFR + 5.00%), 1/31/28 | | 7,125 | 6,833,317 |
| | | | $ 102,643,025 |
| Automobiles — 0.9% |
| Bombardier Recreational Products, Inc., Term Loan, 7.424%, (SOFR + 2.00%), 5/24/27 | | 38,161 | $ 37,874,967 |
| MajorDrive Holdings IV, LLC: | | | |
| Term Loan, 9.652%, (SOFR + 4.00%), 6/1/28 | | 14,893 | 14,508,379 |
| Term Loan, 11.04%, (SOFR + 5.50%), 6/1/29 | | 2,140 | 2,121,672 |
| | | | $ 54,505,018 |
| Beverages — 0.4% |
| City Brewing Company, LLC, Term Loan, 9.164%, (SOFR + 3.50%), 4/5/28 | | 7,885 | $ 5,847,062 |
| Triton Water Holdings, Inc., Term Loan, 8.902%, (SOFR + 3.25%), 3/31/28 | | 21,157 | 20,105,663 |
| | | | $ 25,952,725 |
| Biotechnology — 0.5% |
| Alkermes, Inc., Term Loan, 7.949%, (SOFR + 2.50%), 3/12/26 | | 18,178 | $ 18,041,169 |
| Alltech, Inc., Term Loan, 9.439%, (SOFR + 4.00%), 10/13/28 | | 4,736 | 4,635,615 |
| Grifols Worldwide Operations USA, Inc., Term Loan, 7.424%, (SOFR + 2.00%), 11/15/27 | | 4,440 | 4,324,991 |
| | | | $ 27,001,775 |
28
See Notes to Financial Statements.
Eaton Vance
Floating Rate Portfolio
October 31, 2023
Portfolio of Investments — continued
| Borrower/Description | Principal
Amount*
(000's omitted) | Value |
| Building Products — 0.8% |
| Cornerstone Building Brands, Inc., Term Loan, 8.685%, (SOFR + 3.25%), 4/12/28 | | 11,056 | $ 10,542,540 |
| CPG International, Inc., Term Loan, 7.924%, (SOFR + 2.50%), 4/28/29 | | 13,637 | 13,635,545 |
| LHS Borrower, LLC, Term Loan, 10.174%, (SOFR + 4.75%), 2/16/29 | | 5,827 | 5,113,227 |
| MI Windows and Doors, LLC, Term Loan, 8.924%, (SOFR + 3.50%), 12/18/27 | | 6,545 | 6,552,979 |
| Oscar AcquisitionCo, LLC, Term Loan, 9.99%, (SOFR + 4.50%), 4/29/29 | | 1,598 | 1,558,974 |
| Standard Industries, Inc., Term Loan, 7.953%, (SOFR + 2.50%), 9/22/28 | | 8,819 | 8,842,854 |
| | | | $ 46,246,119 |
| Capital Markets — 4.5% |
| Advisor Group, Inc., Term Loan, 9.824%, (SOFR + 4.50%), 8/17/28 | | 22,225 | $ 22,167,154 |
| AllSpring Buyer, LLC, Term Loan, 8.949%, (SOFR + 3.25%), 11/1/28 | | 6,220 | 6,066,244 |
| Aretec Group, Inc.: | | | |
| Term Loan, 9.674%, (SOFR + 4.25%), 10/1/25 | | 18,275 | 18,285,118 |
| Term Loan, 9.924%, (SOFR + 4.50%), 8/9/30 | | 8,853 | 8,620,426 |
| CeramTec AcquiCo GmbH, Term Loan, 7.283%, (3 mo. EURIBOR + 3.50%), 3/16/29 | EUR | 12,779 | 13,217,332 |
| Citadel Securities, L.P., Term Loan, 7.939%, (SOFR + 2.50%), 7/29/30 | | 7,606 | 7,594,529 |
| Citco Funding, LLC, Term Loan, 4/27/28(10) | | 8,175 | 8,190,328 |
| Clipper Acquisitions Corp., Term Loan, 7.192%, (SOFR + 1.75%), 3/3/28 | | 7,191 | 7,161,189 |
| Edelman Financial Center, LLC, Term Loan, 8.939%, (SOFR + 3.50%), 4/7/28 | | 18,913 | 18,620,831 |
| EIG Management Company, LLC, Term Loan, 9.177%, (SOFR + 3.75%), 2/22/25 | | 2,859 | 2,858,625 |
| FinCo I, LLC, Term Loan, 8.383%, (SOFR + 3.00%), 6/27/29 | | 12,818 | 12,824,284 |
| Focus Financial Partners, LLC: | | | |
| Term Loan, 7.824%, (SOFR + 2.50%), 6/30/28 | | 9,877 | 9,799,190 |
| Term Loan, 8.574%, (SOFR + 3.25%), 6/30/28 | | 17,301 | 17,255,707 |
| Term Loan, 8.824%, (SOFR + 3.50%), 6/30/28 | | 6,400 | 6,393,331 |
| Franklin Square Holdings, L.P., Term Loan, 7.674%, (SOFR + 2.25%), 8/1/25 | | 6,199 | 6,206,462 |
| Guggenheim Partners, LLC, Term Loan, 8.64%, (SOFR + 3.25%), 12/12/29 | | 19,230 | 19,238,323 |
| Hudson River Trading, LLC, Term Loan, 8.439%, (SOFR + 3.00%), 3/20/28 | | 25,572 | 25,241,936 |
| LPL Holdings, Inc., Term Loan, 7.165%, (SOFR + 1.75%), 11/12/26 | | 15,785 | 15,821,179 |
| Borrower/Description | Principal
Amount*
(000's omitted) | Value |
| Capital Markets (continued) |
| Mariner Wealth Advisors, LLC, Term Loan, 8.901%, (SOFR + 3.25%), 8/18/28 | | 13,446 | $ 13,244,742 |
| Victory Capital Holdings, Inc.: | | | |
| Term Loan, 7.772%, (SOFR + 2.25%), 7/1/26 | | 13,437 | 13,430,354 |
| Term Loan, 7.772%, (SOFR + 2.25%), 12/29/28 | | 6,979 | 6,952,588 |
| | | | $ 259,189,872 |
| Chemicals — 4.9% |
| Axalta Coating Systems U.S. Holdings, Inc., Term Loan, 7.89%, (SOFR + 2.50%), 12/20/29 | | 18,151 | $ 18,203,296 |
| CPC Acquisition Corp., Term Loan, 9.402%, (SOFR + 3.75%), 12/29/27 | | 14,714 | 11,646,946 |
| Flint Group Midco Limited, Term Loan, 10.674%, (SOFR + 5.00%), 9.924% cash, 0.75% PIK, 12/31/26 | | 4,982 | 4,633,281 |
| Flint Group Packaging INKS North America Holdings, LLC: | | | |
| Term Loan, 9.002%, (3 mo. EURIBOR + 5.00%), 8.252% cash, 0.75% PIK, 12/31/26 | EUR | 1,546 | 1,521,387 |
| Term Loan, 11.002%, (3 mo. EURIBOR + 7.00%), 4.102% cash, 6.90% PIK, 12/31/27 | EUR | 750 | 581,570 |
| Term Loan - Second Lien, 11.002%, (3 mo. EURIBOR + 7.00%), 4.102% cash, 6.90% PIK, 12/31/27 | EUR | 999 | 191,158 |
| Flint Group Topco Limited: | | | |
| Term Loan, 12.674%, (SOFR + 7.00%), 5.774% cash, 6.90% PIK, 12/31/27 | | 2,429 | 1,779,470 |
| Term Loan - Second Lien, 12.674%, (SOFR + 7.00%), 5.774% cash, 6.90% PIK, 12/31/27 | | 3,240 | 585,830 |
| Gemini HDPE, LLC, Term Loan, 8.645%, (SOFR + 3.00%), 12/31/27 | | 4,686 | 4,678,800 |
| GEON Performance Solutions, LLC, Term Loan, 10.402%, (SOFR + 4.75%), 8/18/28 | | 5,660 | 5,547,017 |
| Groupe Solmax, Inc., Term Loan, 10.303%, (SOFR + 4.75%), 5/29/28(11) | | 9,392 | 8,797,699 |
| INEOS Enterprises Holdings II Limited, Term Loan, 7.783%, (3 mo. EURIBOR + 4.00%), 7/7/30 | EUR | 1,945 | 2,028,995 |
| INEOS Enterprises Holdings US Finco, LLC, Term Loan, 9.273%, (SOFR + 3.75%), 7/8/30 | | 10,925 | 10,697,399 |
| INEOS Finance PLC: | | | |
| Term Loan, 6.618%, (1 mo. EURIBOR + 2.75%), 11/8/28 | EUR | 8,900 | 9,043,347 |
| Term Loan, 7.868%, (1 mo. EURIBOR + 4.00%), 11/8/27 | EUR | 6,200 | 6,481,194 |
| INEOS Quattro Holdings UK, Ltd.: | | | |
| Term Loan, 6.622%, (1 week EURIBOR + 2.75%), 1/29/26 | EUR | 23,150 | 24,185,160 |
| Term Loan, 7.872%, (1 week EURIBOR + 4.00%), 3/14/30 | EUR | 3,300 | 3,382,614 |
| Term Loan, 9.174%, (SOFR + 3.75%), 3/14/30 | | 4,988 | 4,903,336 |
29
See Notes to Financial Statements.
Eaton Vance
Floating Rate Portfolio
October 31, 2023
Portfolio of Investments — continued
| Borrower/Description | Principal
Amount*
(000's omitted) | Value |
| Chemicals (continued) |
| INEOS Styrolution US Holding, LLC, Term Loan, 8.189%, (SOFR + 2.75%), 1/29/26 | | 8,272 | $ 8,140,905 |
| INEOS US Finance, LLC: | | | |
| Term Loan, 7.825%, (SOFR + 2.50%), 11/8/28 | | 6,152 | 6,021,201 |
| Term Loan, 8.924%, (SOFR + 3.50%), 2/18/30 | | 20,653 | 20,310,542 |
| Term Loan, 9.174%, (SOFR + 3.75%), 11/8/27 | | 2,637 | 2,608,186 |
| Kraton Corporation, Term Loan, 8.921%, (SOFR + 3.25%), 3/15/29 | | 5,615 | 5,354,829 |
| Kraton Polymers Holdings B.V., Term Loan, 7.217%, (EURIBOR + 3.25%), 3/15/29(11) | EUR | 4,250 | 4,332,037 |
| Lonza Group AG: | | | |
| Term Loan, 7.897%, (3 mo. EURIBOR + 3.93%), 7/3/28 | EUR | 4,600 | 4,206,531 |
| Term Loan, 9.415%, (SOFR + 3.93%), 7/3/28 | | 10,766 | 9,145,318 |
| Messer Industries GmbH: | | | |
| Term Loan, 6.368%, (1 mo. EURIBOR + 2.50%), 3/2/26 | EUR | 1,554 | 1,645,247 |
| Term Loan, 8.152%, (SOFR + 2.50%), 3/2/26 | | 9,372 | 9,374,156 |
| Momentive Performance Materials, Inc., Term Loan, 9.824%, (SOFR + 4.50%), 3/29/28 | | 21,585 | 20,614,013 |
| Olympus Water US Holding Corporation: | | | |
| Term Loan, 9.402%, (SOFR + 3.75%), 11/9/28 | | 3,947 | 3,856,354 |
| Term Loan, 9.99%, (SOFR + 4.50%), 11/9/28 | | 5,344 | 5,259,019 |
| Orion Engineered Carbons GmbH: | | | |
| Term Loan, 6.372%, (3 mo. EURIBOR + 2.40%), 9/24/28 | EUR | 1,250 | 1,325,932 |
| Term Loan, 7.64%, (SOFR + 2.15%), 9/24/28 | | 4,435 | 4,379,069 |
| PQ Corporation, Term Loan, 7.983%, (SOFR + 2.50%), 6/9/28 | | 8,668 | 8,627,116 |
| Rohm Holding GmbH: | | | |
| Term Loan, 8.472%, (6 mo. EURIBOR + 4.50%), 7/31/26 | EUR | 1,000 | 950,968 |
| Term Loan, 10.881%, (SOFR + 5.00%), 7/31/26 | | 13,783 | 12,738,220 |
| Term Loan, 7/31/26(10) | EUR | 10,800 | 10,270,450 |
| SCUR-Alpha 1503 GmbH, Term Loan, 10.883%, (SOFR + 5.50%), 3/29/30 | | 5,522 | 5,094,308 |
| Tronox Finance, LLC: | | | |
| Term Loan, 8.116%, (SOFR + 2.50%), 3/10/28(11) | | 11,570 | 11,367,412 |
| Term Loan, 8.64%, (SOFR + 3.25%), 4/4/29 | | 3,620 | 3,571,611 |
| Term Loan, 8.824%, (SOFR + 3.50%), 8/16/28 | | 5,075 | 5,011,562 |
| | | | $ 283,093,485 |
| Commercial Services & Supplies — 1.7% |
| Asplundh Tree Expert, LLC, Term Loan, 7.174%, (SOFR + 1.75%), 9/7/27 | | 8,197 | $ 8,211,229 |
| Borrower/Description | Principal
Amount*
(000's omitted) | Value |
| Commercial Services & Supplies (continued) |
| Belfor Holdings, Inc.: | | | |
| Term Loan, 9.574%, (SOFR + 4.25%), 4/6/26 | | 2,587 | $ 2,592,222 |
| Term Loan, 10/25/30(10) | | 6,575 | 6,575,000 |
| EnergySolutions, LLC, Term Loan, 9.382%, (SOFR + 4.00%), 9/20/30 | | 16,309 | 16,237,217 |
| Foundever Group, Term Loan, 7.62%, (1 mo. EURIBOR + 3.75%), 8/28/28 | EUR | 6,425 | 6,541,659 |
| GFL Environmental, Inc., Term Loan, 7.912%, (SOFR + 2.50%), 5/31/27 | | 4,280 | 4,288,789 |
| Harsco Corporation, Term Loan, 7.689%, (SOFR + 2.25%), 3/10/28 | | 885 | 865,183 |
| JFL-Tiger Acquisition Co., Inc., Term Loan, 10.403%, (SOFR + 5.00%), 10/17/30 | | 7,325 | 7,242,594 |
| Monitronics International, Inc., Term Loan, 13.145%, (SOFR + 7.50%), 6/30/28 | | 12,343 | 12,482,058 |
| Phoenix Services International, LLC, Term Loan, 11.427%, (SOFR + 6.10%), 6/30/28 | | 2,031 | 1,894,228 |
| SITEL Worldwide Corporation, Term Loan, 9.189%, (SOFR + 3.75%), 8/28/28 | | 13,950 | 13,475,451 |
| Tempo Acquisition, LLC, Term Loan, 8.074%, (SOFR + 2.75%), 8/31/28 | | 2,463 | 2,463,160 |
| TMF Group Holding B.V., Term Loan, 10.414%, (SOFR + 5.00%), 5/3/28 | | 4,650 | 4,652,906 |
| TruGreen Limited Partnership, Term Loan, 9.424%, (SOFR + 4.00%), 11/2/27 | | 8,399 | 7,899,375 |
| | | | $ 95,421,071 |
| Communications Equipment — 0.1% |
| Digi International, Inc., Term Loan, 10.439%, (SOFR + 5.00%), 11/1/28 | | 4,181 | $ 4,182,690 |
| | | | $ 4,182,690 |
| Construction Materials — 0.4% |
| Quikrete Holdings, Inc.: | | | |
| Term Loan, 8.064%, (SOFR + 2.63%), 2/1/27 | | 2,734 | $ 2,732,538 |
| Term Loan, 8.189%, (SOFR + 2.75%), 3/19/29 | | 19,014 | 19,027,854 |
| | | | $ 21,760,392 |
| Consumer Staples Distribution & Retail — 0.4% |
| Cardenas Markets, Inc., Term Loan, 12.24%, (SOFR + 6.75%), 8/1/29 | | 4,154 | $ 4,154,539 |
| Peer Holding III B.V.: | | | |
| Term Loan, 7.722%, (3 mo. EURIBOR + 3.75%), 9/29/28 | EUR | 5,725 | 6,045,951 |
| Term Loan, 10/19/30(10) | | 11,475 | 11,431,969 |
| | | | $ 21,632,459 |
30
See Notes to Financial Statements.
Eaton Vance
Floating Rate Portfolio
October 31, 2023
Portfolio of Investments — continued
| Borrower/Description | Principal
Amount*
(000's omitted) | Value |
| Containers & Packaging — 1.1% |
| Berlin Packaging, LLC, Term Loan, 9.189%, (SOFR + 3.75%), 3/11/28(11) | | 2,901 | $ 2,839,458 |
| Kouti B.V., Term Loan, 7.458%, (3 mo. EURIBOR + 3.68%), 8/31/28 | EUR | 29,250 | 29,858,775 |
| Pregis TopCo Corporation: | | | |
| Term Loan, 9.074%, (SOFR + 3.75%), 7/31/26 | | 1,964 | 1,947,866 |
| Term Loan, 9.189%, (SOFR + 3.75%), 7/31/26 | | 1,348 | 1,340,763 |
| Pretium Packaging, LLC, Term Loan - Second Lien, 9.995%, (SOFR + 4.60%), 10/2/28 | | 6,598 | 5,031,184 |
| Pretium PKG Holdings, Inc., Term Loan - Second Lien, 12.20%, (SOFR + 6.75%), 10/1/29(11) | | 6,675 | 2,962,031 |
| Proampac PG Borrower, LLC, Term Loan, 10.585%, (SOFR + 4.50%), 9/15/28 | | 11,825 | 11,701,819 |
| Trident TPI Holdings, Inc., Term Loan, 9.652%, (SOFR + 4.00%), 9/15/28 | | 5,662 | 5,600,726 |
| | | | $ 61,282,622 |
| Distributors — 0.0%(7) |
| Phillips Feed Service, Inc., Term Loan, 12.427%, (SOFR + 7.00%), 11/13/24(4) | | 471 | $ 376,498 |
| Winterfell Financing S.a.r.l., Term Loan, 8.765%, (3 mo. EURIBOR + 5.00%), 5/4/28 | EUR | 2,000 | 2,076,522 |
| | | | $ 2,453,020 |
| Diversified Consumer Services — 0.8% |
| Ascend Learning, LLC, Term Loan, 8.924%, (SOFR + 3.50%), 12/11/28 | | 11,292 | $ 10,540,720 |
| Belron Finance US, LLC, Term Loan, 8.057%, (SOFR + 2.43%), 4/13/28 | | 7,629 | 7,637,958 |
| FrontDoor, Inc., Term Loan, 7.689%, (SOFR + 2.25%), 6/17/28 | | 855 | 852,908 |
| KUEHG Corp., Term Loan, 10.39%, (SOFR + 5.00%), 6/12/30 | | 13,725 | 13,731,121 |
| Sotheby's, Term Loan, 10.156%, (SOFR + 4.50%), 1/15/27 | | 10,792 | 10,481,854 |
| Spring Education Group, Inc., Term Loan, 9.914%, (SOFR + 4.50%), 10/4/30 | | 3,725 | 3,689,303 |
| | | | $ 46,933,864 |
| Diversified Financial Services — 0.2% |
| Concorde Midco, Ltd., Term Loan, 7.892%, (6 mo. EURIBOR + 4.00%), 3/1/28 | EUR | 8,730 | $ 9,102,509 |
| | | | $ 9,102,509 |
| Diversified Telecommunication Services — 0.8% |
| CenturyLink, Inc., Term Loan, 7.689%, (SOFR + 2.25%), 3/15/27 | | 22,800 | $ 17,189,155 |
| Borrower/Description | Principal
Amount*
(000's omitted) | Value |
| Diversified Telecommunication Services (continued) |
| GEE Holdings 2, LLC: | | | |
| Term Loan, 13.50%, (SOFR + 8.25%), 3/24/25 | | 9,639 | $ 8,771,597 |
| Term Loan - Second Lien, 13.75%, (SOFR + 8.25%), 7.00% cash, 6.75% PIK, 3/23/26 | | 7,100 | 4,260,076 |
| Level 3 Financing, Inc., Term Loan, 7.189%, (SOFR + 1.75%), 3/1/27 | | 12,351 | 11,616,585 |
| Telenet Financing USD, LLC, Term Loan, 7.449%, (SOFR + 2.00%), 4/30/28 | | 2,825 | 2,750,844 |
| Virgin Media Bristol, LLC, Term Loan, 7.949%, (SOFR + 2.50%), 1/31/28 | | 2,563 | 2,494,345 |
| | | | $ 47,082,602 |
| Electrical Equipment — 0.0%(7) |
| Brookfield WEC Holdings, Inc., Term Loan, 8.189%, (SOFR + 2.75%), 8/1/25 | | 1,521 | $ 1,520,586 |
| | | | $ 1,520,586 |
| Electronic Equipment, Instruments & Components — 1.0% |
| Creation Technologies, Inc., Term Loan, 11.176%, (SOFR + 5.50%), 10/5/28 | | 12,816 | $ 12,143,316 |
| II-VI Incorporated, Term Loan, 8.189%, (SOFR + 2.75%), 7/2/29 | | 400 | 399,629 |
| Minimax Viking GmbH, Term Loan, 7.133%, (EURIBOR + 3.25%), 7/31/28(11) | EUR | 3,487 | 3,689,305 |
| Mirion Technologies, Inc., Term Loan, 8.402%, (SOFR + 2.75%), 10/20/28 | | 1,722 | 1,719,430 |
| Robertshaw US Holding Corp.: | | | |
| Term Loan, 13.49%, (SOFR + 8.00%), 8.49% cash, 5.00% PIK, 2/28/27 | | 3,981 | 4,020,463 |
| Term Loan - Second Lien, 12.49%, (SOFR + 7.00%), 2/28/27 | | 16,811 | 14,205,651 |
| TTM Technologies, Inc., Term Loan, 8.065%, (SOFR + 2.75%), 5/30/30 | | 5,212 | 5,215,195 |
| Verifone Systems, Inc., Term Loan, 9.653%, (SOFR + 4.00%), 8/20/25 | | 14,617 | 13,618,601 |
| | | | $ 55,011,590 |
| Energy Equipment & Services — 0.6% |
| Ameriforge Group, Inc.: | | | |
| Term Loan, 16.735%, (SOFR + 13.00%), 12/29/23(4)(12) | | 3,225 | $ 2,572,594 |
| Term Loan, 18.456%, (SOFR + 13.00%), 13.456 cash, 5.00% PIK, 12/29/23(4)(11) | | 25,247 | 20,142,290 |
| GIP Pilot Acquisition Partners L.P., Term Loan, 8.388%, (SOFR + 3.00%), 10/4/30 | | 4,875 | 4,875,000 |
| Lealand Finance Company B.V.: | | | |
| Letter of Credit, 3.638%, 6/28/24(12) | | 9,039 | 6,734,330 |
31
See Notes to Financial Statements.
Eaton Vance
Floating Rate Portfolio
October 31, 2023
Portfolio of Investments — continued
| Borrower/Description | Principal
Amount*
(000's omitted) | Value |
| Energy Equipment & Services (continued) |
| Lealand Finance Company B.V.: (continued) | | | |
| Term Loan, 12.439%, (SOFR + 7.00%), 9.439% cash, 3.00% PIK, 6/30/25 | | 2,518 | $ 1,403,859 |
| | | | $ 35,728,073 |
| Engineering & Construction — 0.7% |
| Aegion Corporation, Term Loan, 10.395%, (SOFR + 4.75%), 5/17/28 | | 15,762 | $ 15,672,849 |
| American Residential Services, LLC, Term Loan, 9.152%, (SOFR + 3.50%), 10/15/27 | | 497 | 496,463 |
| APi Group DE, Inc., Term Loan, 7.689%, (SOFR + 2.25%), 10/1/26 | | 10,603 | 10,619,166 |
| Centuri Group, Inc., Term Loan, 7.939%, (SOFR + 2.50%), 8/27/28 | | 3,256 | 3,253,840 |
| Northstar Group Services, Inc.: | | | |
| Term Loan, 10.939%, (SOFR + 5.50%), 11/12/26 | | 10,818 | 10,818,422 |
| Term Loan, 10.949%, (SOFR + 5.50%), 11/12/26 | | 1,963 | 1,957,594 |
| | | | $ 42,818,334 |
| Entertainment — 1.0% |
| City Football Group Limited, Term Loan, 8.453%, (SOFR + 3.00%), 7/21/28 | | 8,228 | $ 8,166,306 |
| Crown Finance US, Inc., Term Loan, 7.381%, (SOFR + 1.50%), 7/31/28 | | 1,747 | 1,786,829 |
| Delta 2 (LUX) S.a.r.l., Term Loan, 7.574%, (SOFR + 2.25%), 1/15/30 | | 2,500 | 2,493,750 |
| Live Nation Entertainment, Inc., Term Loan, 7.189%, (SOFR + 1.75%), 10/19/26 | | 5,571 | 5,559,092 |
| Playtika Holding Corp., Term Loan, 8.189%, (SOFR + 2.75%), 3/13/28 | | 20,527 | 19,947,078 |
| Renaissance Holding Corp.: | | | |
| Term Loan, 10.074%, (SOFR + 4.75%), 4/5/30 | | 11,025 | 10,889,481 |
| Term Loan - Second Lien, 12.424%, (SOFR + 7.00%), 5/29/26 | | 143 | 142,251 |
| UFC Holdings, LLC, Term Loan, 8.399%, (SOFR + 2.75%), 4/29/26 | | 7,202 | 7,203,954 |
| Vue International Bidco PLC: | | | |
| Term Loan, 12.13%, (6 mo. EURIBOR + 8.00%), 6/30/27 | EUR | 434 | 449,569 |
| Term Loan, 12.63%, (6 mo. EURIBOR + 8.50%), 6.13% cash, 6.50% PIK, 12/31/27 | EUR | 3,031 | 1,431,038 |
| | | | $ 58,069,348 |
| Equity Real Estate Investment Trusts (REITs) — 0.1% |
| Iron Mountain, Inc., Term Loan, 7.189%, (1 mo. USD LIBOR + 1.75%), 1/2/26 | | 3,634 | $ 3,630,883 |
| | | | $ 3,630,883 |
| Borrower/Description | Principal
Amount*
(000's omitted) | Value |
| Financial Services — 1.0% |
| Ditech Holding Corporation, Term Loan, 0.00%, 3/28/24(13) | | 18,244 | $ 2,006,820 |
| GTCR W Merger Sub, LLC, Term Loan, 9/20/30(10) | | 30,700 | 30,513,620 |
| NCR Atleos, LLC, Term Loan, 10.176%, (SOFR + 4.75%), 3/27/29 | | 13,700 | 13,154,850 |
| Walker & Dunlop, Inc., Term Loan, 7.674%, (SOFR + 2.25%), 12/16/28 | | 12,822 | 12,800,251 |
| | | | $ 58,475,541 |
| Food Products — 0.9% |
| 8th Avenue Food & Provisions, Inc., Term Loan, 10.189%, (SOFR + 4.75%), 10/1/25 | | 6,542 | $ 6,195,343 |
| Badger Buyer Corp., Term Loan, 8.939%, (SOFR + 3.50%), 9/30/24 | | 4,775 | 4,088,785 |
| Del Monte Foods, Inc., Term Loan, 9.682%, (SOFR + 4.25%), 5/16/29 | | 6,262 | 6,075,463 |
| Froneri International, Ltd.: | | | |
| Term Loan, 6.097%, (6 mo. EURIBOR + 2.13%), 1/29/27 | EUR | 1,500 | 1,544,637 |
| Term Loan, 7.674%, (SOFR + 2.25%), 1/29/27 | | 4,691 | 4,665,428 |
| Nomad Foods US, LLC, Term Loan, 8.469%, (SOFR + 3.00%), 11/13/29 | | 7,953 | 7,960,987 |
| United Petfood Group B.V., Term Loan, 6.852%, (6 mo. EURIBOR + 2.75%), 4/23/28 | EUR | 8,400 | 8,680,658 |
| Valeo F1 Company Limited (Ireland): | | | |
| Term Loan, 8.136%, (6 mo. EURIBOR + 4.00%), 9/29/28 | EUR | 8,550 | 8,145,311 |
| Term Loan, 10.186%, (SONIA + 5.00%), 6/28/28 | GBP | 2,500 | 2,616,255 |
| | | | $ 49,972,867 |
| Gas Utilities — 0.4% |
| CQP Holdco, L.P., Term Loan, 8.99%, (SOFR + 3.50%), 6/5/28 | | 22,130 | $ 22,136,475 |
| | | | $ 22,136,475 |
| Health Care Equipment & Supplies — 1.1% |
| Artivion, Inc., Term Loan, 8.939%, (SOFR + 3.50%), 6/1/27 | | 6,643 | $ 6,446,107 |
| Bayou Intermediate II, LLC, Term Loan, 10.128%, (SOFR + 4.50%), 8/2/28 | | 6,661 | 6,394,706 |
| Gloves Buyer, Inc., Term Loan, 9.439%, (SOFR + 4.00%), 12/29/27 | | 12,122 | 11,697,546 |
| ICU Medical, Inc., Term Loan, 8.04%, (SOFR + 2.50%), 1/8/29 | | 7,363 | 7,348,304 |
32
See Notes to Financial Statements.
Eaton Vance
Floating Rate Portfolio
October 31, 2023
Portfolio of Investments — continued
| Borrower/Description | Principal
Amount*
(000's omitted) | Value |
| Health Care Equipment & Supplies (continued) |
| Journey Personal Care Corp., Term Loan, 9.981%, (6 mo. USD LIBOR + 4.25%), 3/1/28 | | 23,757 | $ 22,843,643 |
| Medline Borrower, L.P., Term Loan, 8.689%, (SOFR + 3.25%), 10/23/28 | | 8,613 | 8,564,073 |
| | | | $ 63,294,379 |
| Health Care Providers & Services — 4.2% |
| AEA International Holdings (Lux) S.a.r.l., Term Loan, 9.402%, (SOFR + 3.75%), 9/7/28 | | 13,681 | $ 13,646,802 |
| BW NHHC Holdco, Inc., Term Loan - Second Lien, 13.39%, (SOFR + 8.00%), 1/15/26 | | 14,558 | 12,447,089 |
| Cano Health, LLC, Term Loan, 9.533%, (SOFR + 4.00%), 11/23/27(11) | | 7,227 | 4,263,748 |
| CCRR Parent, Inc., Term Loan, 9.189%, (SOFR + 3.75%), 3/6/28 | | 4,709 | 4,485,234 |
| Cerba Healthcare S.A.S.: | | | |
| Term Loan, 7.583%, (1 mo. EURIBOR + 3.70%), 6/30/28 | EUR | 18,925 | 18,629,978 |
| Term Loan, 7.883%, (1 mo. EURIBOR + 4.00%), 2/16/29 | EUR | 8,225 | 8,209,709 |
| CHG Healthcare Services, Inc., Term Loan, 9.145%, (SOFR + 3.75%), 9/29/28 | | 4,200 | 4,167,626 |
| Covis Finco S.a.r.l., Term Loan, 12.04%, (SOFR + 6.50%), 2/18/27 | | 9,853 | 7,094,203 |
| Dedalus Finance GmbH, Term Loan, 7.712%, (6 mo. EURIBOR + 3.75%), 7/17/27 | EUR | 3,350 | 3,383,227 |
| Elsan S.A.S., Term Loan, 7.39%, (6 mo. EURIBOR + 3.35%), 6/16/28 | EUR | 4,100 | 4,207,796 |
| Ensemble RCM, LLC, Term Loan, 9.233%, (SOFR + 3.75%), 8/3/26 | | 4,254 | 4,257,723 |
| Envision Healthcare Corporation: | | | |
| Term Loan, 0.00%, 3/31/27(13) | | 5,436 | 6,468,771 |
| Term Loan - Second Lien, 0.00%, 3/31/27(13) | | 38,369 | 6,714,637 |
| IVC Acquisition, Ltd., Term Loan, 7.687%, (6 mo. EURIBOR + 4.00%), 2/13/26 | EUR | 4,100 | 4,298,443 |
| Medical Solutions Holdings, Inc.: | | | |
| Term Loan, 8.773%, (SOFR + 3.25%), 11/1/28 | | 13,745 | 12,845,421 |
| Term Loan - Second Lien, 12.523%, (SOFR + 7.00%), 11/1/29 | | 9,500 | 8,478,750 |
| Mehilainen Yhtiot Oy, Term Loan, 7.497%, (3 mo. EURIBOR + 3.53%), 8/8/25 | EUR | 6,025 | 6,372,064 |
| Midwest Physician Administrative Services, LLC, Term Loan, 8.902%, (SOFR + 3.25%), 3/12/28 | | 1,409 | 1,324,257 |
| National Mentor Holdings, Inc.: | | | |
| Term Loan, 9.187%, (SOFR + 3.75%), 3/2/28(11) | | 12,252 | 10,730,277 |
| Term Loan, 9.24%, (SOFR + 3.75%), 3/2/28 | | 334 | 292,283 |
| Term Loan - Second Lien, 12.74%, (SOFR + 7.25%), 3/2/29 | | 5,525 | 3,853,688 |
| Borrower/Description | Principal
Amount*
(000's omitted) | Value |
| Health Care Providers & Services (continued) |
| Phoenix Guarantor, Inc.: | | | |
| Term Loan, 8.689%, (SOFR + 3.25%), 3/5/26 | | 16,235 | $ 16,095,060 |
| Term Loan, 8.939%, (SOFR + 3.50%), 3/5/26 | | 5,361 | 5,315,194 |
| Radiology Partners, Inc., Term Loan, 10.179%, (SOFR + 4.25%), 7/9/25 | | 13,101 | 9,817,760 |
| Ramsay Generale de Sante S.A., Term Loan, 6.952%, (3 mo. EURIBOR + 2.95%), 4/22/27 | EUR | 6,600 | 6,979,970 |
| Select Medical Corporation, Term Loan, 8.324%, (SOFR + 3.00%), 3/6/27 | | 45,035 | 44,971,401 |
| Sound Inpatient Physicians: | | | |
| Term Loan, 8.645%, (SOFR + 3.00%), 6/27/25 | | 198 | 66,028 |
| Term Loan, 8.645%, (SOFR + 3.00%), 6/27/25 | | 2,322 | 774,531 |
| Synlab Bondco PLC, Term Loan, 6.392%, (6 mo. EURIBOR + 2.50%), 7/1/27 | EUR | 2,125 | 2,226,680 |
| TTF Holdings, LLC, Term Loan, 9.439%, (SOFR + 4.00%), 3/31/28 | | 5,083 | 5,088,947 |
| U.S. Anesthesia Partners, Inc., Term Loan, 9.679%, (SOFR + 4.25%), 10/1/28 | | 5,018 | 4,376,587 |
| | | | $ 241,883,884 |
| Health Care Technology — 1.0% |
| Certara, L.P., Term Loan, 9.184%, (SOFR + 3.50%), 8/15/26 | | 1,808 | $ 1,810,635 |
| Imprivata, Inc.: | | | |
| Term Loan, 9.189%, (SOFR + 3.75%), 12/1/27 | | 11,204 | 11,176,174 |
| Term Loan, 9.574%, (SOFR + 4.25%), 12/1/27 | | 3,259 | 3,260,109 |
| MedAssets Software Intermediate Holdings, Inc.: | | | |
| Term Loan, 9.439%, (SOFR + 4.00%), 12/18/28 | | 16,228 | 12,880,876 |
| Term Loan - Second Lien, 12.189%, (SOFR + 6.75%), 12/17/29 | | 8,775 | 5,333,006 |
| Symplr Software, Inc., Term Loan, 9.983%, (SOFR + 4.50%), 12/22/27 | | 12,927 | 11,367,734 |
| Verscend Holding Corp., Term Loan, 9.439%, (SOFR + 4.00%), 8/27/25 | | 9,949 | 9,956,104 |
| | | | $ 55,784,638 |
| Hotels, Restaurants & Leisure — 3.9% |
| 1011778 B.C. Unlimited Liability Company, Term Loan, 7.574%, (SOFR + 2.25%), 9/20/30 | | 32,566 | $ 32,378,688 |
| Carnival Corporation: | | | |
| Term Loan, 7.618%, (1 mo. EURIBOR + 3.75%), 6/30/25 | EUR | 8,790 | 9,314,571 |
| Term Loan, 8.689%, (SOFR + 3.25%), 10/18/28 | | 34,412 | 33,838,517 |
| ClubCorp Holdings, Inc., Term Loan, 8.19%, (1 mo. USD LIBOR + 2.75%), 9/18/26 | | 19,976 | 19,584,953 |
| GVC Holdings (Gibraltar) Limited, Term Loan, 7.722%, (3 mo. EURIBOR + 3.75%), 6/30/28 | EUR | 21,225 | 22,444,142 |
33
See Notes to Financial Statements.
Eaton Vance
Floating Rate Portfolio
October 31, 2023
Portfolio of Investments — continued
| Borrower/Description | Principal
Amount*
(000's omitted) | Value |
| Hotels, Restaurants & Leisure (continued) |
| Ontario Gaming GTA L.P., Term Loan, 9.64%, (SOFR + 4.25%), 8/1/30 | | 14,925 | $ 14,931,656 |
| Oravel Stays Singapore Pte., Ltd., Term Loan, 13.908%, (SOFR + 8.25%), 6/23/26 | | 5,352 | 4,736,354 |
| Playa Resorts Holding B.V., Term Loan, 9.585%, (SOFR + 4.25%), 1/5/29 | | 25,396 | 25,348,164 |
| Scientific Games International, Inc., Term Loan, 8.435%, (SOFR + 3.00%), 4/14/29 | | 7,406 | 7,407,576 |
| SeaWorld Parks & Entertainment, Inc., Term Loan, 8.439%, (SOFR + 3.00%), 8/25/28 | | 14,823 | 14,816,814 |
| Stars Group Holdings B.V. (The): | | | |
| Term Loan, 6.358%, (3 mo. EURIBOR + 2.50%), 7/21/26 | EUR | 11,225 | 11,889,896 |
| Term Loan, 7.902%, (SOFR + 2.25%), 7/21/26 | | 30,681 | 30,698,086 |
| | | | $ 227,389,417 |
| Household Durables — 1.1% |
| ACProducts, Inc., Term Loan, 9.902%, (SOFR + 4.25%), 5/17/28 | | 18,572 | $ 14,811,569 |
| Libbey Glass, Inc., Term Loan, 11.939%, (SOFR + 6.50%), 11/22/27 | | 14,581 | 13,888,706 |
| Serta Simmons Bedding, LLC, Term Loan, 12.90%, (SOFR + 7.50%), 6/29/28 | | 19,908 | 19,716,731 |
| Solis IV B.V., Term Loan, 8.891%, (SOFR + 3.50%), 2/26/29 | | 13,718 | 12,980,501 |
| | | | $ 61,397,507 |
| Household Products — 0.5% |
| Energizer Holdings, Inc., Term Loan, 7.703%, (SOFR + 2.25%), 12/22/27 | | 6,034 | $ 6,030,729 |
| Kronos Acquisition Holdings, Inc.: | | | |
| Term Loan, 9.402%, (SOFR + 3.75%), 12/22/26 | | 7,986 | 7,840,408 |
| Term Loan, 11.567%, (SOFR + 6.00%), 12/22/26 | | 5,060 | 5,059,875 |
| Nobel Bidco B.V., Term Loan, 7.27%, (6 mo. EURIBOR + 3.50%), 9/1/28 | EUR | 7,950 | 7,757,637 |
| | | | $ 26,688,649 |
| Independent Power and Renewable Electricity Producers — 0.1% |
| Calpine Corporation: | | | |
| Term Loan, 7.439%, (SOFR + 2.00%), 4/5/26 | | 2,301 | $ 2,302,122 |
| Term Loan, 7.939%, (SOFR + 2.50%), 12/16/27 | | 4,411 | 4,412,408 |
| | | | $ 6,714,530 |
| Industrial Conglomerates — 0.4% |
| Ammeraal Beltech Holding B.V., Term Loan, 8.972%, (3 mo. EURIBOR + 5.00%), 12/30/28 | EUR | 8,225 | $ 8,683,293 |
| Borrower/Description | Principal
Amount*
(000's omitted) | Value |
| Industrial Conglomerates (continued) |
| Rain Carbon GmbH, Term Loan, 8.787%, (3 mo. EURIBOR + 5.00%), 10/31/28 | EUR | 15,625 | $ 16,450,153 |
| | | | $ 25,133,446 |
| Insurance — 1.3% |
| Alliant Holdings Intermediate, LLC: | | | |
| Term Loan, 8.835%, (SOFR + 3.50%), 11/5/27 | | 3,759 | $ 3,751,580 |
| Term Loan, 8.939%, (1 mo. USD LIBOR + 3.50%), 11/5/27 | | 13,165 | 13,139,057 |
| AmWINS Group, Inc., Term Loan, 8.189%, (SOFR + 2.75%), 2/19/28 | | 4,987 | 4,983,073 |
| AssuredPartners, Inc.: | | | |
| Term Loan, 8.824%, (SOFR + 3.50%), 2/12/27 | | 5,294 | 5,254,006 |
| Term Loan, 8.939%, (SOFR + 3.50%), 2/12/27 | | 9,810 | 9,741,455 |
| Financiere CEP S.A.S., Term Loan, 7.722%, (3 mo. EURIBOR + 3.75%), 6/18/27 | EUR | 4,125 | 4,299,194 |
| HUB International Limited, Term Loan, 9.662%, (SOFR + 4.25%), 6/20/30 | | 11,372 | 11,382,003 |
| NFP Corp., Term Loan, 8.689%, (SOFR + 3.25%), 2/16/27 | | 17,123 | 16,825,951 |
| USI, Inc., Term Loan, 9/27/30(10) | | 4,500 | 4,484,061 |
| | | | $ 73,860,380 |
| Interactive Media & Services — 0.7% |
| Adevinta ASA: | | | |
| Term Loan, 6.472%, (3 mo. EURIBOR + 2.50%), 6/26/28 | EUR | 5,518 | $ 5,841,755 |
| Term Loan, 8.322%, (SOFR + 2.75%), 6/26/28 | | 1,218 | 1,219,885 |
| Buzz Finco, LLC: | | | |
| Term Loan, 8.174%, (SOFR + 2.75%), 1/29/27 | | 1,961 | 1,962,604 |
| Term Loan, 8.674%, (SOFR + 3.25%), 1/29/27 | | 435 | 435,601 |
| Foundational Education Group, Inc., Term Loan, 9.895%, (SOFR + 4.25%), 8/31/28 | | 5,136 | 4,802,131 |
| Getty Images, Inc.: | | | |
| Term Loan, 9.00%, (3 mo. EURIBOR + 5.00%), 2/19/26 | EUR | 2,224 | 2,348,783 |
| Term Loan, 9.99%, (SOFR + 4.50%), 2/19/26 | | 16,459 | 16,515,205 |
| Match Group, Inc., Term Loan, 7.298%, (SOFR + 1.75%), 2/13/27 | | 6,450 | 6,431,863 |
| | | | $ 39,557,827 |
| IT Services — 4.5% |
| Asurion, LLC: | | | |
| Term Loan, 8.689%, (SOFR + 3.25%), 12/23/26 | | 543 | $ 526,048 |
| Term Loan, 8.689%, (SOFR + 3.25%), 7/31/27 | | 8,930 | 8,539,127 |
| Term Loan, 9.424%, (SOFR + 4.00%), 8/19/28 | | 9,059 | 8,663,771 |
| Term Loan, 9.674%, (SOFR + 4.25%), 8/19/28 | | 7,100 | 6,794,716 |
34
See Notes to Financial Statements.
Eaton Vance
Floating Rate Portfolio
October 31, 2023
Portfolio of Investments — continued
| Borrower/Description | Principal
Amount*
(000's omitted) | Value |
| IT Services (continued) |
| Asurion, LLC: (continued) | | | |
| Term Loan - Second Lien, 10.689%, (SOFR + 5.25%), 1/31/28 | | 15,790 | $ 13,783,359 |
| Term Loan - Second Lien, 10.689%, (SOFR + 5.25%), 1/20/29 | | 2,375 | 2,040,460 |
| Cyxtera DC Holdings, Inc.: | | | |
| DIP Loan, 13.951%, (SOFR + 8.50%), 12/7/23 | | 10,226 | 10,296,718 |
| Term Loan, 0.00%, 5/1/24(13) | | 27,147 | 15,881,174 |
| Term Loan, 0.00%, 5/1/24(13) | | 9,711 | 5,705,269 |
| Endure Digital, Inc., Term Loan, 9.422%, (SOFR + 3.50%), 2/10/28 | | 29,774 | 27,712,931 |
| Gainwell Acquisition Corp., Term Loan, 9.49%, (SOFR + 4.00%), 10/1/27 | | 37,722 | 36,150,006 |
| Go Daddy Operating Company, LLC, Term Loan, 7.824%, (SOFR + 2.50%), 11/9/29 | | 44,728 | 44,818,898 |
| Informatica, LLC, Term Loan, 8.189%, (SOFR + 2.75%), 10/27/28 | | 31,594 | 31,569,200 |
| NAB Holdings, LLC, Term Loan, 8.54%, (SOFR + 3.00%), 11/23/28 | | 14,352 | 14,281,708 |
| Rackspace Technology Global, Inc., Term Loan, 8.206%, (SOFR + 2.75%), 2/15/28 | | 16,263 | 7,330,724 |
| Sedgwick Claims Management Services, Inc., Term Loan, 9.074%, (SOFR + 3.75%), 2/24/28 | | 12,918 | 12,889,655 |
| team.blue Finco S.a.r.l., Term Loan, 7.105%, (1 mo. EURIBOR + 3.20%), 3/30/28 | EUR | 11,150 | 11,351,719 |
| WEX, Inc., Term Loan, 7.689%, (SOFR + 2.25%), 3/31/28 | | 3,900 | 3,902,707 |
| | | | $ 262,238,190 |
| Leisure Products — 0.5% |
| Amer Sports Oyj, Term Loan, 7.948%, (3 mo. EURIBOR + 4.00%), 3/30/26 | EUR | 11,925 | $ 12,531,098 |
| Fender Musical Instruments Corporation, Term Loan, 9.439%, (SOFR + 4.00%), 12/1/28 | | 2,262 | 2,186,802 |
| Hayward Industries, Inc., Term Loan, 8.189%, (SOFR + 2.75%), 5/30/28 | | 9,055 | 8,918,980 |
| Recess Holdings, Inc., Term Loan, 9.383%, (SOFR + 4.00%), 3/29/27 | | 6,200 | 6,188,375 |
| SRAM, LLC, Term Loan, 8.189%, (SOFR + 2.75%), 5/18/28 | | 1,891 | 1,886,635 |
| | | | $ 31,711,890 |
| Life Sciences Tools & Services — 2.4% |
| Avantor Funding, Inc., Term Loan, 6.368%, (1 mo. EURIBOR + 2.50%), 6/12/28 | EUR | 19,257 | $ 20,283,883 |
| Cambrex Corporation, Term Loan, 8.924%, (SOFR + 3.50%), 12/4/26 | | 324 | 321,652 |
| Borrower/Description | Principal
Amount*
(000's omitted) | Value |
| Life Sciences Tools & Services (continued) |
| Catalent Pharma Solutions, Inc., Term Loan, 7.453%, (SOFR + 2.00%), 2/22/28 | | 1,024 | $ 998,156 |
| Curia Global, Inc., Term Loan, 9.233%, (SOFR + 3.75%), 8/30/26(11) | | 17,267 | 13,904,367 |
| ICON Luxembourg S.a.r.l., Term Loan, 7.902%, (SOFR + 2.25%), 7/3/28 | | 42,949 | 43,014,785 |
| IQVIA, Inc., Term Loan, 7.402%, (SOFR + 1.75%), 1/17/25 | | 12,472 | 12,515,174 |
| LGC Group Holdings, Ltd., Term Loan, 7.118%, (1 mo. EURIBOR + 3.25%), 4/21/27 | EUR | 5,775 | 5,989,412 |
| Loire Finco Luxembourg S.a.r.l., Term Loan, 8.924%, (SOFR + 3.50%), 4/21/27 | | �� 1,122 | 1,095,741 |
| PRA Health Sciences, Inc., Term Loan, 7.902%, (SOFR + 2.25%), 7/3/28 | | 10,701 | 10,717,311 |
| Sotera Health Holdings, LLC, Term Loan, 8.395%, (SOFR + 2.75%), 12/11/26 | | 17,828 | 17,756,828 |
| Star Parent, Inc., Term Loan, 9.386%, (3 mo. USD LIBOR + 4.00%), 9/27/30 | | 14,400 | 13,780,498 |
| | | | $ 140,377,807 |
| Machinery — 4.1% |
| AI Aqua Merger Sub, Inc., Term Loan, 9.082%, (SOFR + 3.75%), 7/31/28 | | 21,985 | $ 21,581,519 |
| Albion Financing 3 S.a.r.l.: | | | |
| Term Loan, 10.883%, (SOFR + 5.50%), 8/17/26 | | 3,507 | 3,505,183 |
| Term Loan, 10.924%, (SOFR + 5.25%), 8/17/26 | | 3,462 | 3,461,824 |
| Ali Group North America Corporation, Term Loan, 7.439%, (SOFR + 2.00%), 7/30/29 | | 15,103 | 15,106,586 |
| American Trailer World Corp., Term Loan, 9.174%, (SOFR + 3.75%), 3/3/28 | | 13,302 | 12,515,345 |
| Apex Tool Group, LLC, Term Loan, 10.689%, (SOFR + 5.25%), 2/8/29 | | 20,424 | 17,424,445 |
| Barnes Group, Inc., Term Loan, 8.424%, (SOFR + 3.00%), 9/3/30 | | 17,375 | 17,260,985 |
| Clark Equipment Company, Term Loan, 7.99%, (SOFR + 2.50%), 4/20/29 | | 10,061 | 10,083,932 |
| Conair Holdings, LLC, Term Loan, 9.189%, (SOFR + 3.75%), 5/17/28 | | 24,206 | 22,496,451 |
| CPM Holdings, Inc., Term Loan, 9.827%, (SOFR + 4.50%), 9/28/28 | | 4,000 | 4,003,752 |
| Delachaux Group S.A., Term Loan, 9.88%, (SOFR + 4.50%), 4/16/26 | | 3,570 | 3,570,000 |
| Delachaux Group SA, Term Loan, 4/16/29(10) | EUR | 6,600 | 6,893,054 |
| EMRLD Borrower, L.P., Term Loan, 8.38%, (SOFR + 3.00%), 5/31/30 | | 11,275 | 11,267,953 |
| Engineered Machinery Holdings, Inc.: | | | |
| Term Loan, 7.722%, (3 mo. EURIBOR + 3.75%), 5/21/28 | EUR | 10,658 | 11,128,697 |
35
See Notes to Financial Statements.
Eaton Vance
Floating Rate Portfolio
October 31, 2023
Portfolio of Investments — continued
| Borrower/Description | Principal
Amount*
(000's omitted) | Value |
| Machinery (continued) |
| Engineered Machinery Holdings, Inc.: (continued) | | | |
| Term Loan, 9.152%, (SOFR + 3.50%), 5/19/28 | | 9,975 | $ 9,888,897 |
| Term Loan - Second Lien, 11.652%, (SOFR + 6.00%), 5/21/29 | | 2,000 | 1,960,000 |
| Icebox Holdco III, Inc., Term Loan, 9.402%, (SOFR + 3.75%), 12/22/28 | | 4,148 | 4,068,701 |
| INNIO Group Holding GmbH, Term Loan, 6.871%, (1 mo. EURIBOR + 3.00%), 10/31/25 | EUR | 6,125 | 6,444,409 |
| Madison IAQ, LLC, Term Loan, 8.703%, (SOFR + 3.25%), 6/21/28 | | 11,581 | 11,183,982 |
| Pro Mach Group, Inc., Term Loan, 9.439%, (SOFR + 4.00%), 8/31/28 | | 2,798 | 2,794,266 |
| Roper Industrial Products Investment Company, LLC: | | | |
| Term Loan, 8.972%, (3 mo. EURIBOR + 5.25%), 11/22/29 | EUR | 995 | 1,050,836 |
| Term Loan, 9.89%, (SOFR + 4.50%), 11/22/29 | | 6,431 | 6,425,376 |
| SPX Flow, Inc., Term Loan, 9.924%, (SOFR + 4.50%), 4/5/29 | | 12,331 | 12,240,525 |
| TK Elevator Topco GmbH, Term Loan, 7.597%, (6 mo. EURIBOR + 3.63%), 7/30/27 | EUR | 9,725 | 10,127,638 |
| Zephyr German BidCo GmbH, Term Loan, 7.833%, (3 mo. EURIBOR + 3.85%), 3/10/28 | EUR | 11,775 | 11,766,951 |
| | | | $ 238,251,307 |
| Media — 1.3% |
| CSC Holdings, LLC: | | | |
| Term Loan, 7.699%, (1 mo. USD LIBOR + 2.25%), 7/17/25 | | 15,119 | $ 14,705,074 |
| Term Loan, 7.699%, (1 mo. USD LIBOR + 2.25%), 1/15/26 | | 4 | 3,944 |
| Gray Television, Inc., Term Loan, 8.429%, (SOFR + 3.00%), 12/1/28 | | 1,032 | 992,481 |
| Hubbard Radio, LLC, Term Loan, 9.69%, (1 mo. USD LIBOR + 4.25%), 3/28/25 | | 5,892 | 4,988,913 |
| iHeartCommunications, Inc., Term Loan, 8.439%, (SOFR + 3.00%), 5/1/26 | | 2,365 | 2,025,846 |
| Mission Broadcasting, Inc., Term Loan, 7.939%, (SOFR + 2.50%), 6/2/28 | | 3,617 | 3,622,967 |
| Nexstar Broadcasting, Inc., Term Loan, 7.939%, (SOFR + 2.50%), 9/18/26 | | 3,623 | 3,625,360 |
| Recorded Books, Inc., Term Loan, 9.324%, (SOFR + 4.00%), 8/29/25 | | 5,674 | 5,672,558 |
| Sinclair Television Group, Inc.: | | | |
| Term Loan, 7.939%, (SOFR + 2.50%), 9/30/26 | | 6,168 | 5,207,773 |
| Term Loan, 8.439%, (SOFR + 3.00%), 4/1/28 | | 22,672 | 16,370,540 |
| Univision Communications, Inc., Term Loan, 8.689%, (SOFR + 3.25%), 3/15/26 | | 18,188 | 18,081,151 |
| | | | $ 75,296,607 |
| Borrower/Description | Principal
Amount*
(000's omitted) | Value |
| Metals/Mining — 1.2% |
| Arsenal AIC Parent, LLC, Term Loan, 9.879%, (SOFR + 4.50%), 8/18/30 | | 17,850 | $ 17,838,844 |
| Dynacast International, LLC: | | | |
| Term Loan, 10.017%, (SOFR + 4.50%), 7/22/25 | | 15,181 | 14,232,560 |
| Term Loan, 14.517%, (SOFR + 9.00%), 10/22/25 | | 3,034 | 2,290,521 |
| PMHC II, Inc., Term Loan, 9.807%, (SOFR + 4.25%), 4/23/29 | | 16,314 | 14,882,901 |
| WireCo WorldGroup, Inc., Term Loan, 9.699%, (SOFR + 4.25%), 11/13/28 | | 5,923 | 5,900,550 |
| Zekelman Industries, Inc., Term Loan, 7.449%, (SOFR + 2.00%), 1/24/27 | | 15,337 | 15,324,169 |
| | | | $ 70,469,545 |
| Oil, Gas & Consumable Fuels — 1.1% |
| GIP II Blue Holding, L.P., Term Loan, 9.939%, (SOFR + 4.50%), 9/29/28 | | 13,586 | $ 13,621,775 |
| ITT Holdings, LLC, Term Loan, 10/5/30(10) | | 8,575 | 8,459,769 |
| Matador Bidco S.a.r.l., Term Loan, 9.924%, (SOFR + 4.50%), 10/15/26 | | 29,032 | 29,099,437 |
| Oxbow Carbon, LLC, Term Loan, 9.457%, (SOFR + 4.00%), 5/10/30(11) | | 5,661 | 5,657,274 |
| QuarterNorth Energy Holding, Inc., Term Loan - Second Lien, 13.439%, (SOFR + 8.00%), 8/27/26 | | 5,729 | 5,725,574 |
| | | | $ 62,563,829 |
| Pharmaceuticals — 1.8% |
| Aenova Holding GmbH, Term Loan, 8.487%, (3 mo. EURIBOR + 4.50%), 3/6/26 | EUR | 925 | $ 974,664 |
| AI Sirona (Luxembourg) Acquisition S.a.r.l., Term Loan, 8.868%, (1 mo. EURIBOR + 5.00%), 9/30/28 | EUR | 13,000 | 13,764,932 |
| Bausch Health Companies, Inc., Term Loan, 10.689%, (SOFR + 5.25%), 2/1/27 | | 16,920 | 13,276,381 |
| Ceva Sante Animale: | | | |
| Term Loan, 11/1/30(10) | EUR | 10,300 | 10,854,600 |
| Term Loan, 11/1/30(10) | | 4,175 | 4,180,219 |
| Elanco Animal Health Incorporated, Term Loan, 7.165%, (SOFR + 1.75%), 8/1/27 | | 4,882 | 4,775,261 |
| Jazz Financing Lux S.a.r.l., Term Loan, 8.939%, (SOFR + 3.50%), 5/5/28 | | 6,996 | 7,003,664 |
| Mallinckrodt International Finance S.A.: | | | |
| DIP Loan, 13.439%, (SOFR + 8.00%), 8/28/24 | | 1,458 | 1,517,117 |
| DIP Loan, 13.451%, (SOFR + 8.00%), 8/28/24 | | 2,755 | 2,875,334 |
| Term Loan, 12.703%, (SOFR + 7.25%), 9/30/27 | | 31,218 | 23,774,810 |
| Term Loan, 12.953%, (SOFR + 7.50%), 9/30/27 | | 9,889 | 7,559,108 |
36
See Notes to Financial Statements.
Eaton Vance
Floating Rate Portfolio
October 31, 2023
Portfolio of Investments — continued
| Borrower/Description | Principal
Amount*
(000's omitted) | Value |
| Pharmaceuticals (continued) |
| PharmaZell GmbH, Term Loan, 7.972%, (3 mo. EURIBOR + 4.00%), 5/12/27 | EUR | 1,800 | $ 1,838,873 |
| Recipharm AB, Term Loan, 6.737%, (3 mo. EURIBOR + 2.95%), 2/17/28 | EUR | 13,725 | 13,881,886 |
| | | | $ 106,276,849 |
| Professional Services — 2.5% |
| APFS Staffing Holdings, Inc., Term Loan, 9.324%, (SOFR + 4.00%), 12/29/28 | | 3,669 | $ 3,609,502 |
| Apleona Holding GmbH, Term Loan, 6.898%, (3 mo. EURIBOR + 2.95%), 4/28/28 | EUR | 7,525 | 7,773,102 |
| ASGN Incorporated, Term Loan, 7.574%, (SOFR + 2.25%), 8/30/30 | | 3,850 | 3,868,649 |
| CoreLogic, Inc., Term Loan, 8.939%, (SOFR + 3.50%), 6/2/28 | | 14,099 | 12,865,523 |
| Corporation Service Company, Term Loan, 8.674%, (SOFR + 3.25%), 11/2/29 | | 4,389 | 4,394,584 |
| Deerfield Dakota Holding, LLC, Term Loan, 9.14%, (SOFR + 3.75%), 4/9/27 | | 9,909 | 9,589,141 |
| EAB Global, Inc., Term Loan, 8.939%, (SOFR + 3.50%), 8/16/28 | | 14,394 | 14,172,323 |
| Employbridge Holding Company, Term Loan, 10.407%, (SOFR + 4.75%), 7/19/28 | | 20,600 | 17,966,724 |
| First Advantage Holdings, LLC, Term Loan, 8.189%, (SOFR + 2.75%), 1/31/27 | | 5,857 | 5,865,952 |
| Genuine Financial Holdings, LLC, Term Loan, 9.40%, (SOFR + 4.00%), 9/27/30 | | 4,100 | 4,062,846 |
| Neptune Bidco US, Inc., Term Loan, 10.507%, (SOFR + 5.00%), 4/11/29 | | 8,010 | 7,047,331 |
| Rockwood Service Corporation, Term Loan, 9.439%, (SOFR + 4.00%), 1/23/27 | | 9,403 | 9,423,472 |
| Trans Union, LLC: | | | |
| Term Loan, 7.174%, (SOFR + 1.75%), 11/16/26 | | 2,471 | 2,469,157 |
| Term Loan, 7.689%, (SOFR + 2.25%), 12/1/28 | | 32,301 | 32,293,109 |
| Vaco Holdings, LLC, Term Loan, 10.393%, (SOFR + 5.00%), 1/21/29 | | 9,136 | 8,667,313 |
| | | | $ 144,068,728 |
| Real Estate Management & Development — 0.8% |
| Cushman & Wakefield U.S. Borrower, LLC: | | | |
| Term Loan, 8.189%, (SOFR + 2.75%), 8/21/25 | | 734 | $ 733,059 |
| Term Loan, 8.674%, (SOFR + 3.25%), 1/31/30 | | 6,661 | 6,377,944 |
| Term Loan, 9.324%, (SOFR + 4.00%), 1/31/30 | | 6,376 | 6,088,794 |
| Greystar Real Estate Partners, LLC, Term Loan, 9.147%, (SOFR + 3.75%), 8/21/30 | | 6,300 | 6,300,000 |
| Borrower/Description | Principal
Amount*
(000's omitted) | Value |
| Real Estate Management & Development (continued) |
| Homeserve USA Holding Corp., Term Loan, 8.416%, (SOFR + 3.00%), 10/21/30 | | 9,500 | $ 9,476,250 |
| RE/MAX International, Inc., Term Loan, 7.939%, (SOFR + 2.50%), 7/21/28 | | 16,251 | 15,686,217 |
| | | | $ 44,662,264 |
| Road & Rail — 2.2% |
| Avis Budget Car Rental, LLC: | | | |
| Term Loan, 7.189%, (SOFR + 1.75%), 8/6/27 | | 30,242 | $ 30,122,459 |
| Term Loan, 8.924%, (SOFR + 3.50%), 3/16/29 | | 4,104 | 4,112,375 |
| Grab Holdings, Inc., Term Loan, 9.939%, (SOFR + 4.50%), 1/29/26 | | 15,163 | 15,224,180 |
| Hertz Corporation (The): | | | |
| Term Loan, 8.691%, (SOFR + 3.25%), 6/30/28 | | 17,106 | 16,991,353 |
| Term Loan, 8.691%, (SOFR + 3.25%), 6/30/28 | | 3,298 | 3,275,925 |
| Uber Technologies, Inc., Term Loan, 8.159%, (SOFR + 2.75%), 3/3/30 | | 58,172 | 58,215,364 |
| | | | $ 127,941,656 |
| Semiconductors & Semiconductor Equipment — 0.8% |
| Altar Bidco, Inc.: | | | |
| Term Loan, 8.142%, (SOFR + 3.10%), 2/1/29(11) | | 10,662 | $ 10,581,092 |
| Term Loan - Second Lien, 10.493%, (SOFR + 5.60%), 2/1/30 | | 6,650 | 6,467,125 |
| Bright Bidco B.V., Term Loan, 14.378%, (SOFR + 9.00%), 6.378% cash, 8.00% PIK, 10/31/27 | | 3,671 | 1,436,387 |
| Entegris, Inc., Term Loan, 7.89%, (SOFR + 2.50%), 7/6/29 | | 1,261 | 1,263,364 |
| MaxLinear, Inc., Term Loan, 7.689%, (SOFR + 2.25%), 6/23/28 | | 2,955 | 2,911,027 |
| MKS Instruments, Inc., Term Loan, 7.819%, (SOFR + 2.50%), 8/17/29 | | 17,769 | 17,662,384 |
| Synaptics Incorporated, Term Loan, 7.914%, (SOFR + 2.25%), 12/2/28 | | 2,756 | 2,745,164 |
| Ultra Clean Holdings, Inc., Term Loan, 9.191%, (SOFR + 3.75%), 8/27/25 | | 1,915 | 1,919,671 |
| | | | $ 44,986,214 |
| Software — 11.2% |
| Applied Systems, Inc., Term Loan, 9.89%, (SOFR + 4.50%), 9/18/26 | | 43,660 | $ 43,808,392 |
| Aptean, Inc.: | | | |
| Term Loan, 9.674%, (SOFR + 4.25%), 4/23/26 | | 10,206 | 10,197,728 |
| Term Loan - Second Lien, 12.424%, (SOFR + 7.00%), 4/23/27 | | 6,550 | 6,116,062 |
| Astra Acquisition Corp.: | | | |
| Term Loan, 10.902%, (SOFR + 5.25%), 10/25/28 | | 5,017 | 3,441,044 |
37
See Notes to Financial Statements.
Eaton Vance
Floating Rate Portfolio
October 31, 2023
Portfolio of Investments — continued
| Borrower/Description | Principal
Amount*
(000's omitted) | Value |
| Software (continued) |
| Astra Acquisition Corp.: (continued) | | | |
| Term Loan - Second Lien, 14.527%, (SOFR + 8.88%), 10/25/29 | | 20,170 | $ 10,589,329 |
| Banff Merger Sub, Inc.: | | | |
| Term Loan, 7.868%, (1 mo. EURIBOR + 4.00%), 10/2/25 | EUR | 1,911 | 2,019,684 |
| Term Loan, 9.189%, (SOFR + 3.75%), 10/2/25 | | 678 | 678,486 |
| Term Loan - Second Lien, 10.939%, (SOFR + 5.50%), 2/27/26 | | 3,191 | 3,178,557 |
| Cegid Group SAS, Term Loan, 7/10/28(10) | EUR | 6,150 | 6,468,000 |
| Central Parent, Inc., Term Loan, 9.406%, (SOFR + 4.00%), 7/6/29 | | 19,825 | 19,742,953 |
| CentralSquare Technologies, LLC, Term Loan, 9.29%, (SOFR + 3.75%), 8/29/25 | | 18,359 | 17,370,091 |
| Cloud Software Group, Inc.: | | | |
| Term Loan, 9.99%, (SOFR + 4.50%), 9/29/28 | | 9,480 | 9,006,300 |
| Term Loan, 9.99%, (SOFR + 4.50%), 3/30/29 | | 4,489 | 4,273,824 |
| Cloudera, Inc.: | | | |
| Term Loan, 9.174%, (SOFR + 3.75%), 10/8/28 | | 17,558 | 16,935,979 |
| Term Loan - Second Lien, 11.424%, (SOFR + 6.00%), 10/8/29 | | 2,950 | 2,660,531 |
| Constant Contact, Inc., Term Loan, 9.687%, (SOFR + 4.00%), 2/10/28 | | 5,036 | 4,682,310 |
| Cornerstone OnDemand, Inc., Term Loan, 9.189%, (SOFR + 3.75%), 10/16/28 | | 15,465 | 14,638,108 |
| Delta TopCo, Inc., Term Loan, 9.069%, (SOFR + 3.75%), 12/1/27 | | 10,916 | 10,762,710 |
| E2open, LLC, Term Loan, 8.939%, (SOFR + 3.50%), 2/4/28 | | 16,175 | 15,982,547 |
| ECI Macola Max Holding, LLC, Term Loan, 9.402%, (SOFR + 3.75%), 11/9/27 | | 14,207 | 14,155,479 |
| Epicor Software Corporation: | | | |
| Term Loan, 8.689%, (SOFR + 3.25%), 7/30/27 | | 34,598 | 34,470,475 |
| Term Loan, 9.074%, (SOFR + 3.75%), 7/30/27 | | 8,650 | 8,674,869 |
| Fiserv Investment Solutions, Inc., Term Loan, 9.383%, (SOFR + 4.00%), 2/18/27 | | 12,441 | 11,690,527 |
| Gen Digital, Inc., Term Loan, 7.424%, (SOFR + 2.00%), 9/12/29 | | 1,473 | 1,462,022 |
| GoTo Group, Inc., Term Loan, 10.283%, (SOFR + 4.75%), 8/31/27 | | 24,160 | 15,295,988 |
| IGT Holding IV AB: | | | |
| Term Loan, 7.122%, (3 mo. EURIBOR + 3.15%), 3/31/28 | EUR | 6,205 | 6,406,403 |
| Term Loan, 8.962%, (SOFR + 3.40%), 3/31/28 | | 4,015 | 3,997,521 |
| iSolved, Inc., Term Loan, 9.484%, (SOFR + 4.00%), 10/14/30 | | 5,175 | 5,184,703 |
| Ivanti Software, Inc., Term Loan, 9.907%, (SOFR + 4.25%), 12/1/27 | | 3,769 | 3,359,901 |
| Borrower/Description | Principal
Amount*
(000's omitted) | Value |
| Software (continued) |
| Magenta Buyer, LLC: | | | |
| Term Loan, 10.645%, (SOFR + 5.00%), 7/27/28 | | 14,734 | $ 10,313,763 |
| Term Loan - Second Lien, 13.895%, (SOFR + 8.25%), 7/27/29 | | 7,100 | 3,074,300 |
| Marcel LUX IV S.a.r.l.: | | | |
| Term Loan, 7.455%, (3 mo. EURIBOR + 3.50%), 3/16/26 | EUR | 8,650 | 9,146,847 |
| Term Loan, 8.689%, (SOFR + 3.25%), 3/15/26 | | 15,741 | 15,740,846 |
| Term Loan, 9.436%, (SOFR + 4.00%), 12/31/27 | | 3,076 | 3,075,586 |
| Maverick Bidco, Inc., Term Loan, 9.283%, (SOFR + 3.75%), 5/18/28 | | 10,958 | 10,727,767 |
| McAfee, LLC, Term Loan, 9.165%, (SOFR + 3.75%), 3/1/29 | | 19,753 | 18,917,874 |
| Mosel Bidco SE: | | | |
| Term Loan, 8.691%, (3 mo. EURIBOR + 4.75%), 9/16/30 | EUR | 1,825 | 1,918,987 |
| Term Loan, 10.164%, (SOFR + 4.75%), 9/16/30 | | 2,575 | 2,571,781 |
| N-Able International Holdings II, LLC, Term Loan, 8.434%, (SOFR + 2.75%), 7/19/28 | | 1,264 | 1,262,453 |
| Open Text Corporation, Term Loan, 8.174%, (SOFR + 2.75%), 1/31/30 | | 24,532 | 24,558,657 |
| Polaris Newco, LLC: | | | |
| Term Loan, 7.868%, (1 mo. EURIBOR + 4.00%), 6/2/28 | EUR | 8,477 | 8,459,375 |
| Term Loan, 9.439%, (SOFR + 4.00%), 6/2/28 | | 2,942 | 2,784,596 |
| Proofpoint, Inc., Term Loan, 8.689%, (SOFR + 3.25%), 8/31/28 | | 10,903 | 10,736,428 |
| Quest Software US Holdings, Inc., Term Loan, 9.783%, (SOFR + 4.25%), 2/1/29 | | 17,582 | 13,996,447 |
| RealPage, Inc., Term Loan, 8.439%, (SOFR + 3.00%), 4/24/28 | | 10,718 | 10,483,087 |
| Red Planet Borrower, LLC, Term Loan, 9.174%, (SOFR + 3.75%), 10/2/28 | | 15,190 | 14,224,912 |
| Redstone Holdco 2, L.P., Term Loan, 10.189%, (SOFR + 4.75%), 4/27/28 | | 11,692 | 9,397,300 |
| Sabre GLBL, Inc.: | | | |
| Term Loan, 8.939%, (SOFR + 3.50%), 12/17/27 | | 5,850 | 5,009,009 |
| Term Loan, 8.939%, (SOFR + 3.50%), 12/17/27 | | 3,744 | 3,205,508 |
| Term Loan, 9.674%, (SOFR + 4.25%), 6/30/28 | | 3,513 | 3,009,183 |
| Term Loan, 10.424%, (SOFR + 5.00%), 6/30/28 | | 1,000 | 858,333 |
| Skillsoft Corporation, Term Loan, 10.699%, (SOFR + 5.25%), 7/14/28 | | 10,339 | 9,489,232 |
| SolarWinds Holdings, Inc., Term Loan, 9.074%, (SOFR + 3.75%), 2/5/27 | | 17,189 | 17,204,748 |
| Sophia, L.P., Term Loan, 8.924%, (SOFR + 3.50%), 10/7/27 | | 23,191 | 22,918,428 |
| Turing Midco, LLC, Term Loan, 7.939%, (SOFR + 2.50%), 3/24/28 | | 466 | 465,408 |
38
See Notes to Financial Statements.
Eaton Vance
Floating Rate Portfolio
October 31, 2023
Portfolio of Investments — continued
| Borrower/Description | Principal
Amount*
(000's omitted) | Value |
| Software (continued) |
| Ultimate Software Group, Inc. (The), Term Loan, 8.764%, (SOFR + 3.25%), 5/4/26 | | 45,569 | $ 45,389,490 |
| Veritas US, Inc., Term Loan, 10.439%, (SOFR + 5.11%), 9/1/25 | | 14,896 | 12,647,834 |
| Vision Solutions, Inc.: | | | |
| Term Loan, 9.64%, (SOFR + 4.00%), 4/24/28 | | 33,319 | 31,840,455 |
| Term Loan - Second Lien, 12.791%, (SOFR + 7.25%), 4/23/29 | | 1,500 | 1,332,188 |
| VS Buyer, LLC, Term Loan, 8.674%, (SOFR + 3.25%), 2/28/27 | | 11,035 | 10,966,337 |
| | | | $ 642,977,682 |
| Specialty Retail — 2.0% |
| Belron Luxembourg S.a.r.l., Term Loan, 6.147%, (3 mo. EURIBOR + 2.43%), 4/13/28 | EUR | 3,575 | $ 3,781,358 |
| Boels Topholding B.V., Term Loan, 7.049%, (EURIBOR + 3.25%), 2/6/27(11) | EUR | 6,681 | 7,070,675 |
| Etraveli Holding AB, Term Loan, 7.972%, (3 mo. EURIBOR + 4.00%), 8/2/24 | EUR | 7,844 | 8,289,399 |
| Great Outdoors Group, LLC, Term Loan, 9.402%, (SOFR + 3.75%), 3/6/28 | | 27,320 | 27,158,016 |
| Harbor Freight Tools USA, Inc., Term Loan, 8.189%, (SOFR + 2.75%), 10/19/27 | | 17,787 | 17,588,354 |
| Hoya Midco, LLC, Term Loan, 8.633%, (SOFR + 3.25%), 2/3/29 | | 2,640 | 2,640,737 |
| Les Schwab Tire Centers, Term Loan, 8.692%, (SOFR + 3.25%), 11/2/27 | | 13,866 | 13,836,792 |
| LIDS Holdings, Inc., Term Loan, 11.06%, (SOFR + 5.50%), 12/14/26 | | 5,020 | 4,856,396 |
| Mattress Firm, Inc., Term Loan, 9.95%, (6 mo. USD LIBOR + 4.25%), 9/25/28 | | 15,867 | 15,703,325 |
| PetSmart, Inc., Term Loan, 9.174%, (SOFR + 3.75%), 2/11/28 | | 12,226 | 12,104,978 |
| | | | $ 113,030,030 |
| Trading Companies & Distributors — 2.8% |
| American Builders & Contractors Supply Co., Inc., Term Loan, 7.424%, (SOFR + 2.00%), 1/15/27 | | 13,482 | $ 13,476,022 |
| Avolon TLB Borrower 1 (US), LLC: | | | |
| Term Loan, 7.689%, (SOFR + 2.25%), 12/1/27 | | 14,812 | 14,831,679 |
| Term Loan, 7.839%, (SOFR + 2.50%), 6/22/28 | | 26,017 | 26,049,069 |
| DXP Enterprises, Inc., Term Loan, 10.291%, (SOFR + 4.75%), 10/11/30 | | 7,225 | 7,188,875 |
| Electro Rent Corporation, Term Loan, 11.002%, (SOFR + 5.50%), 11/1/24 | | 15,594 | 14,657,896 |
| Park River Holdings, Inc., Term Loan, 8.907%, (SOFR + 3.25%), 12/28/27 | | 6,056 | 5,739,875 |
| Borrower/Description | Principal
Amount*
(000's omitted) | Value |
| Trading Companies & Distributors (continued) |
| Patagonia Bidco Limited, Term Loan, 10.181%, (SONIA + 5.25%), 11/1/28 | GBP | 20,400 | $ 20,781,449 |
| PEARLS (Netherlands) Bidco B.V., Term Loan, 7.448%, (3 mo. EURIBOR + 3.50%), 2/26/29 | EUR | 6,000 | 6,199,143 |
| Spin Holdco, Inc., Term Loan, 9.664%, (SOFR + 4.00%), 3/4/28 | | 38,506 | 33,100,161 |
| SRS Distribution, Inc.: | | | |
| Term Loan, 8.825%, (SOFR + 3.50%), 6/2/28 | | 4,986 | 4,885,217 |
| Term Loan, 8.939%, (SOFR + 3.50%), 6/2/28 | | 4,256 | 4,167,106 |
| Windsor Holdings III, LLC, Term Loan, 9.815%, (SOFR + 4.50%), 8/1/30 | | 10,600 | 10,580,602 |
| | | | $ 161,657,094 |
| Wireless Telecommunication Services — 0.4% |
| CCI Buyer, Inc., Term Loan, 9.39%, (SOFR + 4.00%), 12/17/27 | | 8,517 | $ 8,351,070 |
| Digicel International Finance Limited, Term Loan, 8.902%, (3 mo. USD LIBOR + 3.25%), 5/28/24 | | 13,909 | 12,807,977 |
| | | | $ 21,159,047 |
Total Senior Floating-Rate Loans
(identified cost $4,984,582,462) | | | $4,692,860,551 |
| Short-Term Investments — 2.5% |
| Security | Shares | Value |
| Morgan Stanley Institutional Liquidity Funds - Government Portfolio, Institutional Class, 5.25%(14) | | 143,913,942 | $ 143,913,942 |
Total Short-Term Investments
(identified cost $143,913,942) | | | $ 143,913,942 |
Total Investments — 98.8%
(identified cost $6,124,721,829) | | | $5,693,053,512 |
| Less Unfunded Loan Commitments — (0.2)% | | | $ (9,340,092) |
Net Investments — 98.6%
(identified cost $6,115,381,737) | | | $5,683,713,420 |
| Other Assets, Less Liabilities — 1.4% | | | $ 78,060,673 |
| Net Assets — 100.0% | | | $5,761,774,093 |
39
See Notes to Financial Statements.
Eaton Vance
Floating Rate Portfolio
October 31, 2023
Portfolio of Investments — continued
| The percentage shown for each investment category in the Portfolio of Investments is based on net assets. |
| * | In U.S. dollars unless otherwise indicated. |
| (1) | Security exempt from registration under Rule 144A of the Securities Act of 1933, as amended. These securities may be sold in certain transactions in reliance on an exemption from registration (normally to qualified institutional buyers). At October 31, 2023, the aggregate value of these securities is $775,015,279 or 13.5% of the Portfolio's net assets. |
| (2) | Variable rate security. The stated interest rate represents the rate in effect at October 31, 2023. |
| (3) | Affiliated company (see Note 7). |
| (4) | For fair value measurement disclosure purposes, security is categorized as Level 3 (see Note 8). |
| (5) | Non-income producing security. |
| (6) | Security was acquired in connection with a restructuring of a Senior Loan and may be subject to restrictions on resale. |
| (7) | Amount is less than 0.05%. |
| (8) | When-issued security. |
| (9) | Senior floating-rate loans (Senior Loans) often require prepayments from excess cash flows or permit the borrowers to repay at their election. The degree to which borrowers repay, whether as a contractual requirement or at their election, cannot be predicted with accuracy. As a result, the actual remaining maturity may be substantially less than the stated maturities shown. However, Senior Loans will typically have an expected average life of approximately two to four years. Senior Loans typically have rates of interest which are redetermined periodically by reference to a base lending rate, plus a spread. These base lending rates are primarily the Secured Overnight Financing Rate (“SOFR”) (or the London Interbank Offered Rate (“LIBOR”) for those loans whose rates reset prior to the discontinuance of LIBOR on June 30, 2023) and secondarily, the prime rate offered by one or more major United States banks (the “Prime Rate”). Base lending rates may be subject to a floor, or minimum rate. Rates for SOFR are generally 1 or 3-month tenors and may also be subject to a credit spread adjustment. Senior Loans are generally subject to contractual restrictions that must be satisfied before they can be bought or sold. |
| (10) | This Senior Loan will settle after October 31, 2023, at which time the interest rate will be determined. |
| (11) | The stated interest rate represents the weighted average interest rate at October 31, 2023 of contracts within the senior loan facility. Interest rates on contracts are primarily redetermined either monthly or quarterly by reference to the indicated base lending rate and spread and the reset period. |
| (12) | Unfunded or partially unfunded loan commitments. The stated interest rate reflects the weighted average of the reference rate and spread for the funded portion, if any, and the commitment fees on the portion of the loan that is unfunded. At October 31, 2023, the total value of unfunded loan commitments is $6,974,244. See Note 1F for description. |
| (13) | Issuer is in default with respect to interest and/or principal payments or has declared bankruptcy. For a variable rate security, interest rate has been adjusted to reflect non-accrual status. |
| (14) | May be deemed to be an affiliated investment company. The rate shown is the annualized seven-day yield as of October 31, 2023. |
| Forward Foreign Currency Exchange Contracts (OTC) |
| Currency Purchased | Currency Sold | Counterparty | Settlement
Date | Unrealized
Appreciation | Unrealized
(Depreciation) |
| USD | 287,023,615 | EUR | 270,766,698 | Standard Chartered Bank | 11/2/23 | $ 525,294 | $ — |
| EUR | 14,000,000 | USD | 15,040,448 | Citibank, N.A. | 11/30/23 | — | (210,457) |
| EUR | 18,000,000 | USD | 19,047,411 | Standard Chartered Bank | 11/30/23 | 19,720 | — |
| GBP | 3,000,000 | USD | 3,636,540 | Bank of America, N.A. | 11/30/23 | 10,400 | — |
| GBP | 2,500,000 | USD | 3,120,889 | Standard Chartered Bank | 11/30/23 | — | (81,773) |
| USD | 110,019,993 | EUR | 100,710,607 | Bank of America, N.A. | 11/30/23 | 3,338,752 | — |
| USD | 59,582,046 | EUR | 54,562,394 | Bank of America, N.A. | 11/30/23 | 1,784,918 | — |
| USD | 68,691,808 | EUR | 62,922,760 | State Street Bank and Trust Company | 11/30/23 | 2,038,668 | — |
| USD | 2,567,506 | EUR | 2,352,067 | The Toronto-Dominion Bank | 11/30/23 | 75,997 | — |
| USD | 761,273 | GBP | 613,244 | Standard Chartered Bank | 11/30/23 | 15,785 | — |
| USD | 34,684,407 | GBP | 27,484,305 | State Street Bank and Trust Company | 11/30/23 | 1,273,207 | — |
40
See Notes to Financial Statements.
Eaton Vance
Floating Rate Portfolio
October 31, 2023
Portfolio of Investments — continued
| Forward Foreign Currency Exchange Contracts (OTC) (continued) |
| Currency Purchased | Currency Sold | Counterparty | Settlement
Date | Unrealized
Appreciation | Unrealized
(Depreciation) |
| USD | 286,561,635 | EUR | 270,766,698 | Standard Chartered Bank | 12/4/23 | $ — | $ (303,574) |
| EUR | 12,000,000 | USD | 12,742,056 | Standard Chartered Bank | 12/29/23 | — | (9,769) |
| GBP | 3,000,000 | USD | 3,658,724 | State Street Bank and Trust Company | 12/29/23 | — | (10,604) |
| USD | 5,724,145 | EUR | 5,423,311 | Australia and New Zealand Banking Group Limited | 12/29/23 | — | (30,118) |
| USD | 11,599,841 | EUR | 11,000,000 | Australia and New Zealand Banking Group Limited | 12/29/23 | — | (71,422) |
| USD | 11,604,846 | EUR | 11,000,000 | Goldman Sachs International | 12/29/23 | — | (66,417) |
| USD | 11,599,744 | EUR | 11,000,000 | State Street Bank and Trust Company | 12/29/23 | — | (71,519) |
| USD | 11,791,232 | EUR | 11,184,306 | State Street Bank and Trust Company | 12/29/23 | — | (75,584) |
| USD | 11,790,441 | EUR | 11,184,306 | State Street Bank and Trust Company | 12/29/23 | — | (76,375) |
| | | | | | | $9,082,741 | $(1,007,612) |
| Abbreviations: |
| DIP | – Debtor In Possession |
| EURIBOR | – Euro Interbank Offered Rate |
| LIBOR | – London Interbank Offered Rate |
| OTC | – Over-the-counter |
| PIK | – Payment In Kind |
| SOFR | – Secured Overnight Financing Rate |
| SONIA | – Sterling Overnight Interbank Average |
| Currency Abbreviations: |
| EUR | – Euro |
| GBP | – British Pound Sterling |
| USD | – United States Dollar |
41
See Notes to Financial Statements.
Eaton Vance
Floating Rate Portfolio
October 31, 2023
Statement of Assets and Liabilities
| | October 31, 2023 |
| Assets | |
| Unaffiliated investments, at value (identified cost $5,969,122,387) | $ 5,539,799,478 |
| Affiliated investments, at value (identified cost $146,259,350) | 143,913,942 |
| Cash | 35,661,964 |
| Deposits for derivatives collateral — forward foreign currency exchange contracts | 5,450,000 |
| Foreign currency, at value (identified cost $21,705,939) | 21,724,435 |
| Interest receivable | 38,025,559 |
| Dividends receivable from affiliated investments | 852,108 |
| Receivable for investments sold | 98,080,389 |
| Receivable for open forward foreign currency exchange contracts | 9,082,741 |
| Prepaid upfront fees on notes payable | 397,460 |
| Trustees' deferred compensation plan | 272,714 |
| Other receivables | 2,084,589 |
| Prepaid expenses | 94,315 |
| Total assets | $5,895,439,694 |
| Liabilities | |
| Cash collateral due to broker | $ 4,680,000 |
| Payable for investments purchased | 119,375,202 |
| Payable for when-issued securities | 4,225,000 |
| Payable for open forward foreign currency exchange contracts | 1,007,612 |
| Payable to affiliates: | |
| Investment adviser fee | 2,476,271 |
| Trustees' fees | 9,042 |
| Trustees' deferred compensation plan | 272,714 |
| Accrued expenses | 1,619,760 |
| Total liabilities | $ 133,665,601 |
| Net Assets applicable to investors' interest in Portfolio | $5,761,774,093 |
42
See Notes to Financial Statements.
Eaton Vance
Floating Rate Portfolio
October 31, 2023
| | Year Ended |
| | October 31, 2023 |
| Investment Income | |
| Dividend income | $ 3,060,356 |
| Dividend income from affiliated investments | 8,065,316 |
| Interest and other income | 563,764,152 |
| Total investment income | $ 574,889,824 |
| Expenses | |
| Investment adviser fee | $ 32,834,212 |
| Trustees’ fees and expenses | 108,500 |
| Custodian fee | 1,248,549 |
| Legal and accounting services | 883,742 |
| Interest expense and fees | 2,410,276 |
| Miscellaneous | 383,591 |
| Total expenses | $ 37,868,870 |
| Deduct: | |
| Waiver and/or reimbursement of expenses by affiliates | $ 248,686 |
| Total expense reductions | $ 248,686 |
| Net expenses | $ 37,620,184 |
| Net investment income | $ 537,269,640 |
| Realized and Unrealized Gain (Loss) | |
| Net realized gain (loss): | |
| Investment transactions | $ (273,795,704) |
| Foreign currency transactions | 2,065,689 |
| Forward foreign currency exchange contracts | (63,594,397) |
| Net realized loss | $(335,324,412) |
| Change in unrealized appreciation (depreciation): | |
| Investments | $ 467,648,252 |
| Investments - affiliated investments | (8,685,164) |
| Foreign currency | 1,036,077 |
| Forward foreign currency exchange contracts | 11,089,934 |
| Net change in unrealized appreciation (depreciation) | $ 471,089,099 |
| Net realized and unrealized gain | $ 135,764,687 |
| Net increase in net assets from operations | $ 673,034,327 |
43
See Notes to Financial Statements.
Eaton Vance
Floating Rate Portfolio
October 31, 2023
Statements of Changes in Net Assets
| | Year Ended October 31, |
| | 2023 | 2022 |
| Increase (Decrease) in Net Assets | | |
| From operations: | | |
| Net investment income | $ 537,269,640 | $ 418,622,273 |
| Net realized gain (loss) | (335,324,412) | 59,718,560 |
| Net change in unrealized appreciation (depreciation) | 471,089,099 | (831,891,859) |
| Net increase (decrease) in net assets from operations | $ 673,034,327 | $ (353,551,026) |
| Capital transactions: | | |
| Contributions | $ 308,512,496 | $ 2,094,290,768 |
| Withdrawals | (3,320,903,248) | (2,626,390,995) |
| Net decrease in net assets from capital transactions | $(3,012,390,752) | $ (532,100,227) |
| Net decrease in net assets | $(2,339,356,425) | $ (885,651,253) |
| Net Assets | | |
| At beginning of year | $ 8,101,130,518 | $ 8,986,781,771 |
| At end of year | $ 5,761,774,093 | $ 8,101,130,518 |
44
See Notes to Financial Statements.
Eaton Vance
Floating Rate Portfolio
October 31, 2023
| | Year Ended October 31, |
| Ratios/Supplemental Data | 2023 | 2022 | 2021 | 2020 | 2019 |
| Ratios (as a percentage of average daily net assets): | | | | | |
| Expenses | 0.58% (1) | 0.54% (1) | 0.56% | 0.59% | 0.55% |
| Net investment income | 8.21% | 4.39% | 3.51% | 4.17% | 5.09% |
| Portfolio Turnover | 19% | 27% | 26% | 28% | 16% |
| Total Return | 10.63% | (3.32)% | 7.80% | 1.18% | 1.64% |
| Net assets, end of year (000’s omitted) | $5,761,774 | $8,101,131 | $8,986,782 | $5,649,501 | $7,966,641 |
| (1) | Includes a reduction by the investment adviser of a portion of its adviser fee due to the Portfolio's investment in the Liquidity Fund (equal to less than 0.005% of average daily net assets for the years ended October 31, 2023 and 2022). |
Eaton Vance
Floating Rate Portfolio
October 31, 2023
Notes to Financial Statements
1 Significant Accounting Policies
Eaton Vance Floating Rate Portfolio (the Portfolio) is a Massachusetts business trust registered under the Investment Company Act of 1940, as amended (the 1940 Act), as a diversified, open-end management investment company. The Portfolio’s investment objective is to provide a high level of current income. The Declaration of Trust permits the Trustees to issue interests in the Portfolio. At October 31, 2023, Eaton Vance Floating-Rate Fund and Eaton Vance Floating-Rate & High Income Fund held an interest of 86.0% and 14.0%, respectively, in the Portfolio.
The following is a summary of significant accounting policies of the Portfolio. The policies are in conformity with accounting principles generally accepted in the United States of America (U.S. GAAP). The Portfolio is an investment company and follows accounting and reporting guidance in the Financial Accounting Standards Board (FASB) Accounting Standards Codification Topic 946.
A Investment Valuation—The following methodologies are used to determine the market value or fair value of investments.
Senior Floating-Rate Loans. Interests in senior floating-rate loans (Senior Loans) are valued generally at the average mean of bid and ask quotations obtained from a third party pricing service. Senior Loans, for which a valuation is not available or deemed unreliable, are fair valued by the investment adviser utilizing one or more of the valuation techniques described below to assess the likelihood that the borrower will make a full repayment of the loan underlying such Senior Loan. If the investment adviser believes that there is a reasonable likelihood of full repayment, the investment adviser will determine fair value using a matrix pricing approach that considers the yield on the Senior Loan relative to yields on other Senior Loans issued by companies of comparable credit quality. If the investment adviser believes there is not a reasonable likelihood of full repayment, the investment adviser will determine fair value using analyses that include, but are not limited to: (i) a comparison of the value of the borrower’s outstanding equity and debt to that of comparable public companies; (ii) a discounted cash flow analysis; or (iii) when the investment adviser believes it is likely that a borrower will be liquidated or sold, an analysis of the terms of such liquidation or sale. In certain cases, the investment adviser will use a combination of analytical methods to determine fair value, such as when only a portion of a borrower’s assets are likely to be sold. In conducting its assessment and analyses for purposes of determining fair value of a Senior Loan, the investment adviser will use its discretion and judgment in considering and appraising relevant factors. Junior Loans (i.e., subordinated loans and second lien loans) are valued in the same manner as Senior Loans.
Debt Obligations. Debt obligations are generally valued on the basis of valuations provided by third party pricing services, as derived from such services’ pricing models. Inputs to the models may include, but are not limited to, reported trades, executable bid and ask prices, broker/dealer quotations, prices or yields of securities with similar characteristics, interest rates, anticipated prepayments, benchmark curves or information pertaining to the issuer, as well as industry and economic events. The pricing services may use a matrix approach, which considers information regarding securities with similar characteristics to determine the valuation for a security. Short-term debt obligations purchased with a remaining maturity of sixty days or less for which a valuation from a third party pricing service is not readily available may be valued at amortized cost, which approximates fair value.
Equity Securities. Equity securities listed on a U.S. securities exchange generally are valued at the last sale or closing price on the day of valuation or, if no sales took place on such date, at the mean between the closing bid and ask prices on the exchange where such securities are principally traded. Equity securities listed on the NASDAQ National Market System are valued at the NASDAQ official closing price. Unlisted or listed securities for which closing sales prices or closing quotations are not available are valued at the mean between the latest available bid and ask prices or, in the case of preferred equity securities that are not listed or traded in the over-the-counter market, by a third party pricing service that uses various techniques that consider factors including, but not limited to, prices or yields of securities with similar characteristics, benchmark yields, broker/dealer quotes, quotes of underlying common stock, issuer spreads, as well as industry and economic events.
Derivatives. Forward foreign currency exchange contracts are generally valued at the mean of the average bid and average asked prices that are reported by currency dealers to a third party pricing service at the valuation time. Such third party pricing service valuations are supplied for specific settlement periods and the Portfolio’s forward foreign currency exchange contracts are valued at an interpolated rate between the closest preceding and subsequent settlement period reported by the third party pricing service.
Foreign Securities and Currencies. Foreign securities and currencies are valued in U.S. dollars, based on foreign currency exchange rate quotations supplied by a third party pricing service. The pricing service uses a proprietary model to determine the exchange rate. Inputs to the model include reported trades and implied bid/ask spreads.
Other. Investments in management investment companies (including money market funds) that do not trade on an exchange are valued at the net asset value as of the close of each business day.
Fair Valuation. In connection with Rule 2a-5 of the 1940 Act, the Trustees have designated the Portfolio’s investment adviser as its valuation designee. Investments for which valuations or market quotations are not readily available or are deemed unreliable are valued by the investment adviser, as valuation designee, at fair value using methods that most fairly reflect the security’s “fair value”, which is the amount that the Portfolio might reasonably expect to receive for the security upon its current sale in the ordinary course. Each such determination is based on a consideration of relevant factors, which are likely to vary from one pricing context to another. These factors may include, but are not limited to, the type of security, the existence of any contractual restrictions on the security’s disposition, the price and extent of public trading in similar securities of the issuer or of comparable companies or entities, quotations or relevant information obtained from broker/dealers or other market participants, information obtained from the issuer, analysts, and/or the appropriate stock exchange (for exchange-traded securities), an analysis of the company’s or entity’s financial statements, and an evaluation of the forces that influence the issuer and the market(s) in which the security is purchased and sold.
Eaton Vance
Floating Rate Portfolio
October 31, 2023
Notes to Financial Statements — continued
B Investment Transactions—Investment transactions for financial statement purposes are accounted for on a trade date basis. Realized gains and losses on investments sold are determined on the basis of identified cost.
C Income—Interest income is recorded on the basis of interest accrued, adjusted for amortization of premium or accretion of discount. Fees associated with loan amendments are recognized immediately. Dividend income is recorded on the ex-dividend date for dividends received in cash and/or securities. Distributions from investment companies are recorded as dividend income, capital gains or return of capital based on the nature of the distribution.
D Federal Taxes—The Portfolio has elected to be treated as a partnership for federal tax purposes. No provision is made by the Portfolio for federal or state taxes on any taxable income of the Portfolio because each investor in the Portfolio is ultimately responsible for the payment of any taxes on its share of taxable income. Since at least one of the Portfolio's investors is a regulated investment company that invests all or substantially all of its assets in the Portfolio, the Portfolio normally must satisfy the applicable source of income and diversification requirements (under the Internal Revenue Code) in order for its investors to satisfy them. The Portfolio will allocate, at least annually among its investors, each investor's distributive share of the Portfolio's net investment income, net realized capital gains and losses and any other items of income, gain, loss, deduction or credit.
As of October 31, 2023, the Portfolio had no uncertain tax positions that would require financial statement recognition, de-recognition, or disclosure. The Portfolio files a U.S. federal income tax return annually after its fiscal year-end, which is subject to examination by the Internal Revenue Service for a period of three years from the date of filing.
E Foreign Currency Translation—Investment valuations, other assets, and liabilities initially expressed in foreign currencies are translated each business day into U.S. dollars based upon current exchange rates. Purchases and sales of foreign investment securities and income and expenses denominated in foreign currencies are translated into U.S. dollars based upon currency exchange rates in effect on the respective dates of such transactions. Recognized gains or losses on investment transactions attributable to changes in foreign currency exchange rates are recorded for financial statement purposes as net realized gains and losses on investments. That portion of unrealized gains and losses on investments that results from fluctuations in foreign currency exchange rates is not separately disclosed.
F Unfunded Loan Commitments—The Portfolio may enter into certain loan agreements all or a portion of which may be unfunded. The Portfolio is obligated to fund these commitments at the borrower's discretion. These commitments are disclosed in the accompanying Portfolio of Investments. At October 31, 2023, the Portfolio had sufficient cash and/or securities to cover these commitments.
G Use of Estimates—The preparation of the financial statements in conformity with U.S. GAAP requires management to make estimates and assumptions that affect the reported amounts of assets and liabilities at the date of the financial statements and the reported amounts of income and expense during the reporting period. Actual results could differ from those estimates.
H Indemnifications—Under the Portfolio’s organizational documents, its officers and Trustees may be indemnified against certain liabilities and expenses arising out of the performance of their duties to the Portfolio. Under Massachusetts law, if certain conditions prevail, interestholders in the Portfolio could be deemed to have personal liability for the obligations of the Portfolio. However, the Portfolio’s Declaration of Trust contains an express disclaimer of liability on the part of Portfolio interestholders. Additionally, in the normal course of business, the Portfolio enters into agreements with service providers that may contain indemnification clauses. The Portfolio’s maximum exposure under these arrangements is unknown as this would involve future claims that may be made against the Portfolio that have not yet occurred.
I Forward Foreign Currency Exchange Contracts—The Portfolio may enter into forward foreign currency exchange contracts for the purchase or sale of a specific foreign currency at a fixed price on a future date. The forward foreign currency exchange contracts are adjusted by the daily exchange rate of the underlying currency and any gains or losses are recorded as unrealized until such time as the contracts have been closed. Risks may arise upon entering these contracts from the potential inability of counterparties to meet the terms of their contracts and from movements in the value of a foreign currency relative to the U.S. dollar.
J When-Issued Securities and Delayed Delivery Transactions—The Portfolio may purchase securities on a delayed delivery or when-issued basis. Payment and delivery may take place after the customary settlement period for that security. At the time the transaction is negotiated, the price of the security that will be delivered is fixed. The Portfolio maintains cash and/or security positions for these commitments such that sufficient liquid assets will be available to make payments upon settlement. Securities purchased on a delayed delivery or when-issued basis are marked-to-market daily and begin earning interest on settlement date. Such security purchases are subject to the risk that when delivered they will be worth less than the agreed upon payment price. Losses may also arise if the counterparty does not perform under the contract.
Eaton Vance
Floating Rate Portfolio
October 31, 2023
Notes to Financial Statements — continued
2 Investment Adviser Fee and Other Transactions with Affiliates
The investment adviser fee is earned by Boston Management and Research (BMR), an indirect, wholly-owned subsidiary of Morgan Stanley, as compensation for investment advisory services rendered to the Portfolio. The investment adviser fee is computed at an annual rate as a percentage of the Portfolio's average daily net assets as follows and is payable monthly:
| Average Daily Net Assets | Annual Fee Rate |
| Up to $1 billion | 0.5750% |
| $1 billion but less than $2 billion | 0.5250% |
| $2 billion but less than $5 billion | 0.4900% |
| $5 billion but less than $10 billion | 0.4600% |
| $10 billion but less than $15 billion | 0.4350% |
| $15 billion but less than $20 billion | 0.4150% |
| $20 billion but less than $25 billion | 0.4000% |
| $25 billion and over | 0.3900% |
For the year ended October 31, 2023, the Portfolio’s investment adviser fee amounted to $32,834,212 or 0.50% of the Portfolio's average daily net assets. The Portfolio may invest in a money market fund, the Institutional Class of the Morgan Stanley Institutional Liquidity Funds - Government Portfolio (the "Liquidity Fund"), an open-end management investment company managed by Morgan Stanley Investment Management Inc., a wholly-owned subsidiary of Morgan Stanley. The investment adviser fee paid by the Portfolio is reduced by an amount equal to its pro rata share of the advisory and administration fees paid by the Portfolio due to its investment in the Liquidity Fund. For the year ended October 31, 2023, the investment adviser fee paid was reduced by $248,686 relating to the Portfolio's investment in the Liquidity Fund.
Trustees and officers of the Portfolio who are members of BMR’s organization receive remuneration for their services to the Portfolio out of the investment adviser fee. Trustees of the Portfolio who are not affiliated with the investment adviser may elect to defer receipt of all or a percentage of their annual fees in accordance with the terms of the Trustees Deferred Compensation Plan. Certain officers and Trustees of the Portfolio are officers of the above organization.
3 Purchases and Sales of Investments
Purchases and sales of investments, other than short-term obligations and including maturities, paydowns and principal repayments on Senior Loans, aggregated $1,183,936,744 and $3,587,117,176, respectively, for the year ended October 31, 2023.
4 Federal Income Tax Basis of Investments
The cost and unrealized appreciation (depreciation) of investments, including open derivative contracts, of the Portfolio at October 31, 2023, as determined on a federal income tax basis, were as follows:
| Aggregate cost | $6,067,145,036 |
| Gross unrealized appreciation | $ 29,989,140 |
| Gross unrealized depreciation | (413,420,756) |
| Net unrealized depreciation | $ (383,431,616) |
5 Financial Instruments
The Portfolio may trade in financial instruments with off-balance sheet risk in the normal course of its investing activities. These financial instruments may include forward foreign currency exchange contracts and may involve, to a varying degree, elements of risk in excess of the amounts recognized for financial statement purposes. The notional or contractual amounts of these instruments represent the investment the Portfolio has in particular classes of financial instruments and do not necessarily represent the amounts potentially subject to risk. The measurement of the risks associated with these instruments is meaningful only when all related and offsetting transactions are considered. A summary of obligations under these financial instruments at October 31, 2023 is included in the Portfolio of Investments. At October 31, 2023, the Portfolio had sufficient cash and/or securities to cover commitments under these contracts.
Eaton Vance
Floating Rate Portfolio
October 31, 2023
Notes to Financial Statements — continued
The Portfolio is subject to foreign exchange risk in the normal course of pursuing its investment objective. Because the Portfolio holds foreign currency denominated investments, the value of these investments and related receivables and payables may change due to future changes in foreign currency exchange rates. To hedge against this risk, the Portfolio enters into forward foreign currency exchange contracts.
The Portfolio enters into forward foreign currency exchange contracts that may contain provisions whereby the counterparty may terminate the contract under certain conditions, including but not limited to a decline in the Portfolio's net assets below a certain level over a certain period of time, which would trigger a payment by the Portfolio for those derivatives in a liability position. At October 31, 2023, the fair value of derivatives with credit related contingent features in a net liability position was $1,007,612. The aggregate fair value of assets pledged as collateral by the Portfolio for such liability was $770,000 at October 31, 2023.
The over-the-counter (OTC) derivatives in which the Portfolio invests are subject to the risk that the counterparty to the contract fails to perform its obligations under the contract. To mitigate this risk, the Portfolio has entered into an International Swaps and Derivatives Association, Inc. Master Agreement (“ISDA Master Agreement”) or similar agreement with substantially all its derivative counterparties. An ISDA Master Agreement is a bilateral agreement between the Portfolio and a counterparty that governs certain OTC derivatives and typically contains, among other things, set-off provisions in the event of a default and/or termination event as defined under the relevant ISDA Master Agreement. Under an ISDA Master Agreement, the Portfolio may, under certain circumstances, offset with the counterparty certain derivative financial instruments’ payables and/or receivables with collateral held and/or posted and create one single net payment. The provisions of the ISDA Master Agreement typically permit a single net payment in the event of default including the bankruptcy or insolvency of the counterparty. However, bankruptcy or insolvency laws of a particular jurisdiction may impose restrictions on or prohibitions against the right of offset in bankruptcy or insolvency. Certain ISDA Master Agreements allow counterparties to OTC derivatives to terminate derivative contracts prior to maturity in the event the Portfolio’s net assets decline by a stated percentage or the Portfolio fails to meet the terms of its ISDA Master Agreements, which would cause the counterparty to accelerate payment by the Portfolio of any net liability owed to it.
The collateral requirements for derivatives traded under an ISDA Master Agreement are governed by a Credit Support Annex to the ISDA Master Agreement. Collateral requirements are determined at the close of business each day and are typically based on changes in market values for each transaction under an ISDA Master Agreement and netted into one amount for such agreement. Generally, the amount of collateral due from or to a counterparty is subject to a minimum transfer threshold amount before a transfer is required, which may vary by counterparty. Collateral pledged for the benefit of the Portfolio and/or counterparty is held in segregated accounts by the Portfolio’s custodian and cannot be sold, re-pledged, assigned or otherwise used while pledged. The portion of such collateral representing cash, if any, is reflected as deposits for derivatives collateral and, in the case of cash pledged by a counterparty for the benefit of the Portfolio, a corresponding liability on the Statement of Assets and Liabilities. Securities pledged by the Portfolio as collateral, if any, are identified as such in the Portfolio of Investments.
The fair value of open derivative instruments (not considered to be hedging instruments for accounting disclosure purposes) and whose primary underlying risk exposure is foreign exchange risk at October 31, 2023 was as follows:
| | Fair Value |
| Derivative | Asset Derivative(1) | Liability Derivative(2) |
| Forward foreign currency exchange contracts | $9,082,741 | $(1,007,612) |
| (1) | Statement of Assets and Liabilities location: Receivable for open forward foreign currency exchange contracts. |
| (2) | Statement of Assets and Liabilities location: Payable for open forward foreign currency exchange contracts. |
Eaton Vance
Floating Rate Portfolio
October 31, 2023
Notes to Financial Statements — continued
The Portfolio's derivative assets and liabilities at fair value by risk, which are reported gross in the Statement of Assets and Liabilities, are presented in the table above. The following tables present the Portfolio's derivative assets and liabilities by counterparty, net of amounts available for offset under a master netting agreement and net of the related collateral received by the Portfolio for such assets and pledged by the Portfolio for such liabilities as of October 31, 2023.
| Counterparty | Derivative
Assets Subject to
Master Netting
Agreement | Derivatives
Available
for Offset | Non-cash
Collateral
Received(a) | Cash
Collateral
Received(a) | Net Amount
of Derivative
Assets(b) |
| Bank of America, N.A. | $ 5,134,070 | $ — | $ — | $ (4,680,000) | $ 454,070 |
| Standard Chartered Bank | 560,799 | (395,116) | — | — | 165,683 |
| State Street Bank and Trust Company | 3,311,875 | (234,082) | (2,058,264) | — | 1,019,529 |
| The Toronto-Dominion Bank | 75,997 | — | — | — | 75,997 |
| | $9,082,741 | $(629,198) | $(2,058,264) | $(4,680,000) | $1,715,279 |
| Counterparty | Derivative
Liabilities Subject to
Master Netting
Agreement | Derivatives
Available
for Offset | Non-cash
Collateral
Pledged(a) | Cash
Collateral
Pledged(a) | Net Amount
of Derivative
Liabilities(c) |
| Australia and New Zealand Banking Group Limited | $ (101,540) | $ — | $ — | $ — | $ (101,540) |
| Citibank, N.A. | (210,457) | — | — | 210,457 | — |
| Goldman Sachs International | (66,417) | — | — | 60,000 | (6,417) |
| Standard Chartered Bank | (395,116) | 395,116 | — | — | — |
| State Street Bank and Trust Company | (234,082) | 234,082 | — | — | — |
| | $(1,007,612) | $629,198 | $ — | $270,457 | $(107,957) |
| (a) | In some instances, the total collateral received and/or pledged may be more than the amount shown due to overcollateralization. |
| (b) | Net amount represents the net amount due from the counterparty in the event of default. |
| (c) | Net amount represents the net amount payable to the counterparty in the event of default. |
The effect of derivative instruments (not considered to be hedging instruments for accounting disclosure purposes) on the Statement of Operations and whose primary underlying risk exposure is foreign exchange risk for the year ended October 31, 2023 was as follows:
| Derivative | Realized Gain (Loss)
on Derivatives Recognized
in Income(1) | Change in Unrealized
Appreciation (Depreciation) on
Derivatives Recognized in Income(2) |
| Forward foreign currency exchange contracts | $(63,594,397) | $11,089,934 |
| (1) | Statement of Operations location: Net realized gain (loss): Forward foreign currency exchange contracts. |
| (2) | Statement of Operations location: Change in unrealized appreciation (depreciation): Forward foreign currency exchange contracts. |
The average notional amount of forward foreign currency exchange contracts (based on the absolute value of notional amounts of currency purchased and currency sold) outstanding during the year ended October 31, 2023, which is indicative of the volume of this derivative type, was approximately $1,209,633,000.
Eaton Vance
Floating Rate Portfolio
October 31, 2023
Notes to Financial Statements — continued
6 Credit Facility
The Portfolio participates with another portfolio and fund managed by BMR and its affiliates in a $600 million ($700 million prior to March 6, 2023) unsecured credit facility agreement (Agreement) with a group of banks, which is in effect through March 4, 2024. Borrowings are made by the Portfolio solely to facilitate the handling of unusual and/or unanticipated short-term cash requirements. At the Portfolio’s option, any loan under the Credit Facility that is made to it will bear interest at a rate equal to (i) the Benchmark Rate (defined below) plus a margin or, (ii) the Base Rate, or (iii) the Overnight Rate plus a margin. Base Rate is the highest of (a) administrative agent’s prime rate, (b) 50 basis points above the Federal Funds rate, (c) the Benchmark Rate plus a margin and (d) 1.00%, in each case as in effect from time to time. The “Overnight Rate” is the greatest of the Benchmark Rate, the Federal Funds rate and 0.00%. “Benchmark Rate” means Term SOFR (defined as the forward-looking Secured Overnight Financing Rate term rate published two U.S. government securities business days prior to the commencement of the applicable interest period plus the Term SOFR Adjustment) for an interest period of one-month’s duration. To the extent that, at any time, the Benchmark Rate is less than 0.00%, the Benchmark Rate shall be deemed to be 0.00% for purposes of the Credit Facility. “Term SOFR Adjustment” means 0.10%. In addition, a fee computed at an annual rate of 0.15% on the daily unused portion of each lender’s commitment amount is allocated among the participating portfolios and fund at the end of each quarter. Also included in interest expense and fees on the Statement of Operations is approximately $1,167,000 of amortization of upfront fees paid by the Portfolio in connection with the annual renewal of the Agreement. The unamortized balance of upfront fees at October 31, 2023 is $397,460 and is included in prepaid upfront fees on notes payable in the Statement of Assets and Liabilities. Because the credit facility is not available exclusively to the Portfolio and the maximum amount is capped, it may be unable to borrow some or all of a requested amount at any particular time. The Portfolio did not have any significant borrowings during the year ended October 31, 2023.
7 Affiliated Investments
An affiliated company is a company in which a fund has a direct or indirect ownership of, control of, or voting power of 5 percent or more of the outstanding voting shares, or a company that is under common ownership or control with a fund. At October 31, 2023, the value of the Portfolio's investment in affiliated companies and in funds that may be deemed to be affiliated was $143,913,942, which represents 2.5% of the Portfolio's net assets. Transactions in such investments by the Portfolio for the year ended October 31, 2023 were as follows:
| Name | Value,
beginning
of period | Purchases | Sales
proceeds | Net
realized
gain (loss) | Change in
unrealized
appreciation
(depreciation) | Value, end
of period | Dividend
income | Shares,
end of period |
| Common Stocks* |
| IAP Global Services, LLC(1)(2)(3) | $ 8,685,164 | $ — | $ — | $ — | $ (8,685,164) | $ 0 | $ — | 2,577 |
| Short-Term Investments |
| Liquidity Fund | 156,771,808 | 2,181,162,967 | (2,194,020,833) | — | — | 143,913,942 | 8,065,316 | 143,913,942 |
| Total | | | | $ — | $(8,685,164) | $143,913,942 | $8,065,316 | |
| * | The related industry is the same as the presentation in the Portfolio of Investments. |
| (1) | For fair value measurement disclosure purposes, security is categorized as Level 3 (see Note 8). |
| (2) | Non-income producing security. |
| (3) | A portion of the shares were acquired in connection with a restructuring of a Senior Loan and may be subject to restrictions on resale. |
8 Fair Value Measurements
Under generally accepted accounting principles for fair value measurements, a three-tier hierarchy to prioritize the assumptions, referred to as inputs, is used in valuation techniques to measure fair value. The three-tier hierarchy of inputs is summarized in the three broad levels listed below.
| • | Level 1 – quoted prices in active markets for identical investments |
| • | Level 2 – other significant observable inputs (including quoted prices for similar investments, interest rates, prepayment speeds, credit risk, etc.) |
| • | Level 3 – significant unobservable inputs (including a fund's own assumptions in determining the fair value of investments) |
In cases where the inputs used to measure fair value fall in different levels of the fair value hierarchy, the level disclosed is determined based on the lowest level input that is significant to the fair value measurement in its entirety. The inputs or methodology used for valuing securities are not necessarily an indication of the risk associated with investing in those securities.
Eaton Vance
Floating Rate Portfolio
October 31, 2023
Notes to Financial Statements — continued
At October 31, 2023, the hierarchy of inputs used in valuing the Portfolio’s investments and open derivative instruments, which are carried at fair value, were as follows:
| Asset Description | Level 1 | Level 2 | Level 3* | Total |
| Asset-Backed Securities | $ — | $ 270,085,254 | $ — | $ 270,085,254 |
| Common Stocks | 839,909 | 33,435,126 | 1,089,614 | 35,364,649 |
| Corporate Bonds | — | 524,182,503 | — | 524,182,503 |
| Exchange-Traded Funds | 17,700,300 | — | — | 17,700,300 |
| Preferred Stocks | — | 8,946,313 | — | 8,946,313 |
| Senior Floating-Rate Loans (Less Unfunded Loan Commitments) | — | 4,655,307,077 | 28,213,382 | 4,683,520,459 |
| Short-Term Investments | 143,913,942 | — | — | 143,913,942 |
| Total Investments | $ 162,454,151 | $ 5,491,956,273 | $ 29,302,996 | $ 5,683,713,420 |
| Forward Foreign Currency Exchange Contracts | $ — | $ 9,082,741 | $ — | $ 9,082,741 |
| Total | $ 162,454,151 | $ 5,501,039,014 | $ 29,302,996 | $ 5,692,796,161 |
| Liability Description | | | | |
| Forward Foreign Currency Exchange Contracts | $ — | $ (1,007,612) | $ — | $ (1,007,612) |
| Total | $ — | $ (1,007,612) | $ — | $ (1,007,612) |
| * | None of the unobservable inputs for Level 3 assets, individually or collectively, had a material impact on the Portfolio. |
Level 3 investments at the beginning and/or end of the period in relation to net assets were not significant and accordingly, a reconciliation of Level 3 assets for the year ended October 31, 2023 is not presented.
9 Risks and Uncertainties
Risks Associated with Foreign Investments
Foreign investments can be adversely affected by political, economic and market developments abroad, including the imposition of economic and other sanctions by the United States or another country. There may be less publicly available information about foreign issuers because they may not be subject to reporting practices, requirements or regulations comparable to those to which United States companies are subject. Foreign markets may be smaller, less liquid and more volatile than the major markets in the United States. Trading in foreign markets typically involves higher expense than trading in the United States. The Portfolio may have difficulties enforcing its legal or contractual rights in a foreign country. Securities that trade or are denominated in currencies other than the U.S. dollar may be adversely affected by fluctuations in currency exchange rates.
Credit Risk
The Portfolio invests primarily in below investment grade floating-rate loans, which are considered speculative because of the credit risk of their issuers. Changes in economic conditions or other circumstances are more likely to reduce the capacity of issuers of these securities to make principal and interest payments. Such companies are more likely to default on their payments of interest and principal owed than issuers of investment grade bonds. An economic downturn generally leads to a higher non-payment rate, and a loan or other debt obligation may lose significant value before a default occurs. Lower rated investments also may be subject to greater price volatility than higher rated investments. Moreover, the specific collateral used to secure a loan may decline in value or become illiquid, which would adversely affect the loan’s value.
Eaton Vance
Floating Rate Portfolio
October 31, 2023
Report of Independent Registered Public Accounting Firm
To the Trustees and Investors of Eaton Vance Floating Rate Portfolio:
Opinion on the Financial Statements and Financial Highlights
We have audited the accompanying statement of assets and liabilities of Eaton Vance Floating Rate Portfolio (the “Portfolio”), including the portfolio of investments, as of October 31, 2023, the related statement of operations for the year then ended, the statements of changes in net assets for each of the two years in the period then ended, the financial highlights for each of the five years in the period then ended, and the related notes. In our opinion, the financial statements and financial highlights present fairly, in all material respects, the financial position of the Portfolio as of October 31, 2023, and the results of its operations for the year then ended, the changes in its net assets for each of the two years in the period then ended, and the financial highlights for each of the five years in the period then ended, in conformity with accounting principles generally accepted in the United States of America.
Basis for Opinion
These financial statements and financial highlights are the responsibility of the Portfolio’s management. Our responsibility is to express an opinion on the Portfolio’s financial statements and financial highlights based on our audits. We are a public accounting firm registered with the Public Company Accounting Oversight Board (United States) (PCAOB) and are required to be independent with respect to the Portfolio in accordance with the U.S. federal securities laws and the applicable rules and regulations of the Securities and Exchange Commission and the PCAOB.
We conducted our audits in accordance with the standards of the PCAOB. Those standards require that we plan and perform the audit to obtain reasonable assurance about whether the financial statements and financial highlights are free of material misstatement, whether due to error or fraud. The Portfolio is not required to have, nor were we engaged to perform, an audit of its internal control over financial reporting. As part of our audits, we are required to obtain an understanding of internal control over financial reporting but not for the purpose of expressing an opinion on the effectiveness of the Portfolio’s internal control over financial reporting. Accordingly, we express no such opinion.
Our audits included performing procedures to assess the risks of material misstatement of the financial statements and financial highlights, whether due to error or fraud, and performing procedures that respond to those risks. Such procedures included examining, on a test basis, evidence regarding the amounts and disclosures in the financial statements and financial highlights. Our audits also included evaluating the accounting principles used and significant estimates made by management, as well as evaluating the overall presentation of the financial statements and financial highlights. Our procedures included confirmation of securities and senior loans owned as of October 31, 2023, by correspondence with the custodian, brokers and agent banks; when replies were not received from brokers and agent banks, we performed other auditing procedures. We believe that our audits provide a reasonable basis for our opinion.
/s/ Deloitte & Touche LLP
Boston, Massachusetts
December 19, 2023
We have served as the auditor of one or more Eaton Vance investment companies since 1959.
Eaton Vance
Floating-Rate Fund
October 31, 2023
Board of Trustees’ Contract Approval
Overview of the Contract Review Process
The Investment Company Act of 1940, as amended (the “1940 Act”), provides, in substance, that the investment advisory agreement between a fund and its investment adviser will continue in effect from year-to-year only if its continuation is approved on an annual basis by a vote of the fund’s board of trustees, including a majority of the trustees who are not “interested persons” of the fund (“independent trustees”), cast in person at a meeting called for the purpose of considering such approval.
At a meeting held on June 8, 2023, the Boards of Trustees/Directors (collectively, the “Board”) that oversee the registered investment companies advised by Eaton Vance Management or its affiliate, Boston Management and Research (the “Eaton Vance Funds”), including a majority of the independent trustees (the “Independent Trustees”), voted to approve the continuation of existing investment advisory agreements and sub-advisory agreements 1 for each of the Eaton Vance Funds for an additional one-year period. The Board relied upon the affirmative recommendation of its Contract Review Committee, which is a committee exclusively comprised of Independent Trustees. Prior to making its recommendation, the Contract Review Committee reviewed information furnished by the adviser and sub-adviser to each of the Eaton Vance Funds (including information specifically requested by the Board) for a series of formal meetings held between April and June 2023, as well as certain additional information provided in response to specific requests from the Independent Trustees as members of the Contract Review Committee. Members of the Contract Review Committee also considered information received at prior meetings of the Board and its committees, to the extent such information was relevant to the Contract Review Committee’s annual evaluation of the investment advisory agreements and sub-advisory agreements.
In connection with its evaluation of the investment advisory agreements and sub-advisory agreements, the Board considered various information relating to the Eaton Vance Funds. This included information applicable to all or groups of Eaton Vance Funds, which is referenced immediately below, and information applicable to the particular Eaton Vance Fund covered by this report (each “Eaton Vance Fund” is referred to below as a “fund”). (For funds that invest through one or more underlying portfolios, references to “each fund” in this section may include information that was considered at the portfolio-level.)
Information about Fees, Performance and Expenses
• A report from an independent data provider comparing advisory and other fees paid by each fund to such fees paid by comparable funds, as identified by the independent data provider (“comparable funds”);
• A report from an independent data provider comparing each fund’s total expense ratio (and its components) to those of comparable funds;
• A report from an independent data provider comparing the investment performance of each fund (including, as relevant, total return data, income data, Sharpe ratios and information ratios) to the investment performance of comparable funds and, as applicable, benchmark indices, over various time periods;
• In certain instances, data regarding investment performance relative to customized groups of peer funds and blended indices identified by the adviser in consultation with the Portfolio Management Committee of the Board (a committee exclusively comprised of Independent Trustees);
• Comparative information concerning the fees charged and services provided by the adviser and sub-adviser to each fund in managing other accounts (which may include other mutual funds, collective investment funds and institutional accounts) using investment strategies and techniques similar to those used in managing such fund(s), if any;
• Profitability analyses with respect to the adviser and sub-adviser to each of the funds;
Information about Portfolio Management and Trading
• Descriptions of the investment management services provided to each fund, as well as each of the funds’ investment strategies and policies;
• The procedures and processes used to determine the value of fund assets, including, when necessary, the determination of “fair value” and actions taken to monitor and test the effectiveness of such procedures and processes;
• Information about the policies and practices of each fund’s adviser and sub-adviser with respect to trading, including their processes for seeking best execution of portfolio transactions;
• Information about the allocation of brokerage transactions and the benefits, if any, received by the adviser and sub-adviser to each fund as a result of brokerage allocation, including, as applicable, information concerning the acquisition of research through client commission arrangements and policies with respect to “soft dollars”;
• Data relating to the portfolio turnover rate of each fund and related information regarding active management in the context of particular strategies;
Information about each Adviser and Sub-adviser
• Reports detailing the financial results and condition of the adviser and sub-adviser to each fund;
• Information regarding the individual investment professionals whose responsibilities include portfolio management and investment research for the funds, and, for portfolio managers and certain other investment professionals, information relating to their responsibilities with respect to managing other mutual funds and investment accounts, as applicable;
1 Not all Eaton Vance Funds have entered into a sub-advisory agreement with a sub-adviser. Accordingly, references to “sub-adviser” or “sub-advisory agreement” in this “Overview” section may not be applicable to the particular Eaton Vance Fund covered by this report.
Eaton Vance
Floating-Rate Fund
October 31, 2023
Board of Trustees’ Contract Approval — continued
• Information regarding the adviser’s and its parent company’s (Morgan Stanley’s) efforts to retain and attract talented investment professionals, including in the context of a competitive marketplace for talent, as well as the ongoing unique environment presented by hybrid, remote and other alternative work arrangements;
• Information regarding the adviser’s compensation methodology for its investment professionals and the incentives and accountability it creates, along with investment professionals’ investments in the fund(s) they manage;
• The Code of Ethics of the adviser and its affiliates and the sub-adviser of each fund, together with information relating to compliance with, and the administration of, such codes;
• Policies and procedures relating to proxy voting, including regular reporting with respect to fund proxy voting activities;
• Information regarding the handling of corporate actions and class actions, as well as information regarding litigation and other regulatory matters;
• Information concerning the resources devoted to compliance efforts undertaken by the adviser and its affiliates and the sub-adviser of each fund, if any, including descriptions of their various compliance programs and their record of compliance;
• Information concerning the business continuity and disaster recovery plans of the adviser and its affiliates and the sub-adviser of each fund, if any;
• A description of Eaton Vance Management’s and Boston Management and Research’s oversight of sub-advisers, including with respect to regulatory and compliance issues, investment management and other matters;
Other Relevant Information
• Information regarding ongoing initiatives to further integrate and harmonize, where applicable, the investment management and other departments of the adviser and its affiliates with the overall investment management infrastructure of Morgan Stanley, in light of Morgan Stanley’s acquisition of Eaton Vance Corp. on March 1, 2021;
• Information concerning the nature, cost and character of the administrative and other non-investment advisory services provided by Eaton Vance Management and its affiliates;
• Information concerning oversight of the relationship with the custodian, subcustodians, fund accountants, and other third-party service providers by the adviser and/or administrator to each of the funds;
• Information concerning efforts to implement policies and procedures with respect to various recently adopted regulations applicable to the funds, including Rule 12d1-4 (the Fund-of-Funds Rule), Rule 18f-4 (the Derivatives Rule) and Rule 2a-5 (the Fair Valuation Rule);
• For an Eaton Vance Fund structured as an exchange-listed closed-end fund, information concerning the benefits of the closed-end fund structure, as well as, where relevant, the closed-end fund’s market prices (including as compared to the closed-end fund’s net asset value (NAV)), trading volume data, continued use of auction preferred shares (where applicable), distribution rates and other relevant matters;
• The risks which the adviser and/or its affiliates incur in connection with the management and operation of the funds, including, among others, litigation, regulatory, entrepreneurial, and other business risks (and the associated costs of such risks); and
• The terms of each investment advisory agreement and sub-advisory agreement.
During the various meetings of the Board and its committees over the course of the year leading up to the June 8, 2023 meeting, the Board received information from portfolio managers and other investment professionals of the advisers and sub-advisers of the funds regarding investment and performance matters, and considered various investment and trading strategies used in pursuing the funds’ investment objectives. The Board also received information regarding risk management techniques employed in connection with the management of the funds. The Board and its committees evaluated issues pertaining to industry and regulatory developments, compliance procedures, fund governance and other issues with respect to the funds, and received and participated in reports and presentations provided by Eaton Vance Management, Boston Management and Research and fund sub-advisers, with respect to such matters. In addition to the formal meetings of the Board and its committees, the Independent Trustees held regular teleconferences to discuss, among other topics, matters relating to the continuation of investment advisory agreements and sub-advisory agreements.
The Contract Review Committee was advised throughout the contract review process by Goodwin Procter LLP, independent legal counsel for the Independent Trustees. The members of the Contract Review Committee, with the advice of such counsel, exercised their own business judgment in determining the material factors to be considered in evaluating each investment advisory agreement and sub-advisory agreement and the weight to be given to each such factor. The conclusions reached with respect to each investment advisory agreement and sub-advisory agreement were based on a comprehensive evaluation of all the information provided and not any single factor. Moreover, each member of the Contract Review Committee may have placed varying emphasis on particular factors in reaching conclusions with respect to each investment advisory agreement and sub-advisory agreement. In evaluating each investment advisory agreement and sub-advisory agreement, including the fee structures and other terms contained in such agreements, the members of the Contract Review Committee were also informed by multiple years of analysis and discussion with the adviser and sub-adviser to each of the Eaton Vance Funds.
Results of the Contract Review Process
Based on its consideration of the foregoing, and such other information it deemed relevant, including the factors and conclusions described below, the Contract Review Committee concluded that the continuation of the investment advisory agreement between Eaton Vance Floating-Rate Fund (the “Fund”) and Eaton Vance Management (“EVM”), as well as the investment advisory agreement between Eaton Vance Floating Rate Portfolio (the “Portfolio”), the portfolio in which the Fund invests, and Boston Management and Research (“BMR”) (EVM, with respect to the Fund, and BMR, with respect to the
Eaton Vance
Floating-Rate Fund
October 31, 2023
Board of Trustees’ Contract Approval — continued
Portfolio, are each referred to herein as the “Adviser”), including their respective fee structures, are in the interests of shareholders and, therefore, recommended to the Board approval of each agreement. Based on the recommendation of the Contract Review Committee, the Board, including a majority of the Independent Trustees, voted to approve continuation of the investment advisory agreements for the Fund and the Portfolio (together, the “investment advisory agreements”).
Nature, Extent and Quality of Services
In considering whether to approve the investment advisory agreements for the Fund and the Portfolio, the Board evaluated the nature, extent and quality of services provided to the Fund and to the Portfolio by the applicable Adviser.
The Board considered each Adviser’s management capabilities and investment processes in light of the types of investments held by the Fund and the Portfolio, including the education, experience and number of investment professionals and other personnel who provide portfolio management, investment research, and similar services to the Portfolio, including recent changes to such personnel. In particular, the Board considered the abilities and experience of each Adviser’s investment professionals in analyzing special considerations relevant to investing in senior floating rate loans. The Board considered each Adviser’s large group of bank loan investment professionals and other personnel who provide services to the Fund and to the Portfolio, including portfolio managers and analysts. The Board also took into account the resources dedicated to portfolio management and other services, the compensation methods of each Adviser and other factors, including the reputation and resources of each Adviser to recruit and retain highly qualified research, advisory and supervisory investment professionals. In addition, the Board considered the time and attention devoted to the Eaton Vance Funds, including the Fund and the Portfolio, by senior management, as well as the infrastructure, operational capabilities and support staff in place to assist in the portfolio management and operations of the Fund and the Portfolio, including the provision of administrative services. The Board also considered the business-related and other risks to which each Adviser or its affiliates may be subject in managing the Fund and the Portfolio.
The Board noted that, under the terms of the investment advisory agreement of the Fund, EVM may invest assets of the Fund directly in securities, for which it would receive a fee, or in the Portfolio, for which it receives no separate fee but for which BMR receives an advisory fee from the Portfolio.
The Board considered the compliance programs of each Adviser and relevant affiliates thereof. The Board considered compliance and reporting matters regarding, among other things, personal trading by investment professionals, disclosure of portfolio holdings, late trading, frequent trading, portfolio valuation, business continuity and the allocation of investment opportunities. The Board also considered the responses of each Adviser and its affiliates to requests in recent years from regulatory authorities, such as the Securities and Exchange Commission and the Financial Industry Regulatory Authority.
The Board considered other administrative services provided or overseen by EVM and its affiliates, including transfer agency and accounting services. The Board evaluated the benefits to shareholders of investing in a fund that is a part of a large fund complex offering exposure to a variety of asset classes and investment disciplines, as well as the ability, in many cases, to exchange an investment among different funds without incurring additional sales charges.
After consideration of the foregoing factors, among others, the Board concluded that the nature, extent and quality of services provided by each Adviser, taken as a whole, are appropriate and consistent with the terms of the applicable investment advisory agreement.
Fund Performance
The Board compared the Fund’s investment performance to that of comparable funds identified by an independent data provider (the peer group), as well as an appropriate benchmark index. The Board’s review included comparative performance data with respect to the Fund for the one-, three-, five- and ten-year periods ended December 31, 2022. In this regard, the Board noted that the performance of the Fund was consistent with the median performance of the Fund’s peer group for the three-year period. The Board also noted that the performance of the Fund was lower than its benchmark index for the three-year period. The Board concluded that the performance of the Fund was satisfactory.
Management Fees and Expenses
The Board considered contractual fee rates payable by the Portfolio and by the Fund for advisory and administrative services (referred to collectively as “management fees”). As part of its review, the Board considered the Fund’s management fees and total expense ratio for the one-year period ended December 31, 2022, as compared to those of comparable funds, before and after giving effect to any undertaking to waive fees or reimburse expenses. The Board also considered certain factors identified by management in response to inquiries from the Contract Review Committee regarding the Fund’s total expense ratio relative to comparable funds.
After considering the foregoing information, and in light of the nature, extent and quality of the services provided by each Adviser, the Board concluded that the management fees charged for advisory and related services are reasonable.
Profitability and “Fall-Out” Benefits
The Board considered the level of profits realized by each Adviser and relevant affiliates thereof in providing investment advisory and administrative services to the Fund, to the Portfolio and to all Eaton Vance Funds as a group. The Board considered the level of profits realized without regard to marketing support or other payments by each Adviser and its affiliates to third parties in respect of distribution or other services.
Eaton Vance
Floating-Rate Fund
October 31, 2023
Board of Trustees’ Contract Approval — continued
The Board concluded that, in light of the foregoing factors and the nature, extent and quality of the services rendered, the profits realized by each Adviser and its affiliates are deemed not to be excessive.
The Board also considered direct or indirect fall-out benefits received by each Adviser and its affiliates in connection with their respective relationships with the Fund and the Portfolio, including the benefits of research services that may be available to each Adviser as a result of securities transactions effected for the Fund and the Portfolio and other investment advisory clients.
Economies of Scale
In reviewing management fees and profitability, the Board also considered the extent to which the applicable Adviser and its affiliates, on the one hand, and the Fund and the Portfolio, on the other hand, can expect to realize benefits from economies of scale as the assets of the Fund and the Portfolio increase. The Board acknowledged the difficulty in accurately measuring the benefits resulting from economies of scale, if any, with respect to the management of any specific fund or group of funds. The Board reviewed data summarizing the increases and decreases in the assets of the Fund and of all Eaton Vance Funds as a group over various time periods, and evaluated the extent to which the total expense ratio of the Fund and the profitability of each Adviser and its affiliates may have been affected by such increases or decreases. Based upon the foregoing, the Board concluded that the Fund currently shares in the benefits from economies of scale, if any, when they are realized by each Adviser. The Board also concluded that the structure of the advisory fees, which include breakpoints at several asset levels, will allow the Fund and the Portfolio to continue to benefit from any economies of scale in the future.
Eaton Vance
Floating-Rate Fund
October 31, 2023
Liquidity Risk Management Program
The Fund has implemented a written liquidity risk management program (Program) and related procedures to manage its liquidity in accordance with Rule 22e-4 under the Investment Company Act of 1940, as amended (Liquidity Rule). The Liquidity Rule defines “liquidity risk” as the risk that a fund could not meet requests to redeem shares issued by the fund without significant dilution of the remaining investors’ interests in the fund. The Fund’s Board of Trustees/Directors has designated the investment adviser to serve as the administrator of the Program and the related procedures. The administrator has established a Liquidity Risk Management Oversight Committee (Committee) to perform the functions necessary to administer the Program. As part of the Program, the administrator is responsible for identifying illiquid investments and categorizing the relative liquidity of the Fund’s investments in accordance with the Liquidity Rule. Under the Program, the administrator assesses, manages, and periodically reviews the Fund’s liquidity risk, and is responsible for making certain reports to the Fund’s Board of Trustees/Directors and the Securities and Exchange Commission (SEC) regarding the liquidity of the Fund’s investments, and to notify the Board of Trustees/Directors and the SEC of certain liquidity events specified in the Liquidity Rule. The liquidity of the Fund’s portfolio investments is determined based on a number of factors including, but not limited to, relevant market, trading and investment-specific considerations under the Program.
At a meeting of the Fund’s Board of Trustees/Directors on June 7, 2023, the Committee provided a written report to the Fund’s Board of Trustees/
Directors pertaining to the operation, adequacy, and effectiveness of implementation of the Program, as well as the operation of the highly liquid investment minimum (if applicable) for the period January 1, 2022 through December 31, 2022 (Review Period). The Program operated effectively during the Review Period, supporting the administrator’s ability to assess, manage and monitor Fund liquidity risk, including during periods of market volatility and net redemptions. During the Review Period, the Fund met redemption requests on a timely basis.
There can be no assurance that the Program will achieve its objectives in the future. Please refer to the Fund’s prospectus for more information regarding the Fund’s exposure to liquidity risk and other principal risks to which an investment in the Fund may be subject.
Eaton Vance
Floating-Rate Fund
October 31, 2023
Management and Organization
Fund Management. The Trustees of Eaton Vance Mutual Funds Trust (the Trust) and Eaton Vance Floating Rate Portfolio (the Portfolio) are responsible for the overall management and supervision of the Trust's and the Portfolio's affairs. The Board members and officers of the Trust and the Portfolio are listed below. Except as indicated, each individual has held the office shown or other offices in the same company for the last five years. Board members hold indefinite terms of office. Each Trustee holds office until his or her successor is elected and qualified, subject to a prior death, resignation, retirement, disqualification or removal. Under the terms of the Fund's and the Portfolio's current Trustee retirement policy, an Independent Trustee must retire and resign as a Trustee on the earlier of: (i) the first day of July following his or her 74th birthday; or (ii), with limited exception, December 31st of the 20th year in which he or she has served as a Trustee. However, if such retirement and resignation would cause the Fund and the Portfolio to be out of compliance with Section 16 of the 1940 Act or any other regulations or guidance of the SEC, then such retirement and resignation will not become effective until such time as action has been taken for the Fund and the Portfolio to be in compliance therewith. The “noninterested Trustees” consist of those Trustees who are not “interested persons” of the Trust and the Portfolio, as that term is defined under the 1940 Act. The business address of each Board member and officer is Two International Place, Boston, Massachusetts 02110. As used below, “BMR” refers to Boston Management and Research, “EV” refers to EV LLC, “EVM” refers to Eaton Vance Management, "MSIM" refers to Morgan Stanley Investment Management Inc. and “EVD” refers to Eaton Vance Distributors, Inc. EV is the trustee of each of EVM and BMR. Each of EVM, BMR, EVD and EV are indirect, wholly owned subsidiaries of Morgan Stanley. Each officer affiliated with EVM may hold a position with other EVM affiliates that is comparable to his or her position with EVM listed below. Each Trustee oversees 127 funds in the Eaton Vance fund complex (including both funds and portfolios in a hub and spoke structure).
| Name and Year of Birth | Trust/Portfolio
Position(s) | Length of Service | Principal Occupation(s) and Other Directorships
During Past Five Years and Other Relevant Experience |
| Interested Trustee |
Anchal Pachnanda(1)
1980 | Trustee | Since 2023 | Co-Head of Strategy of MSIM (since 2019). Formerly, Head of Strategy of MSIM (2017-2019). Ms. Pachnanda is an interested person because of her position with MSIM, which is an affiliate of the Trust.
Other Directorships. None. |
| Noninterested Trustees |
Alan C. Bowser
1962 | Trustee | Since 2022 | Private investor. Formerly, Chief Diversity Officer, Partner and a member of the Operating Committee, and formerly served as Senior Advisor on Diversity and Inclusion for the firm’s chief executive officer, Co-Head of the Americas Region, and Senior Client Advisor of Bridgewater Associates, an asset management firm (2011- present).
Other Directorships. None. |
Mark R. Fetting
1954 | Trustee | Since 2016 | Private investor. Formerly held various positions at Legg Mason, Inc. (investment management firm) (2000-2012), including President, Chief Executive Officer, Director and Chairman (2008-2012), Senior Executive Vice President (2004-2008) and Executive Vice President (2001-2004). Formerly, President of Legg Mason family of funds (2001-2008). Formerly, Division President and Senior Officer of Prudential Financial Group, Inc. and related companies (investment management firm) (1991-2000).
Other Directorships. None. |
Cynthia E. Frost
1961 | Trustee | Since 2014 | Private investor. Formerly, Chief Investment Officer of Brown University (university endowment) (2000-2012). Formerly, Portfolio Strategist for Duke Management Company (university endowment manager) (1995-2000). Formerly, Managing Director, Cambridge Associates (investment consulting company) (1989-1995). Formerly, Consultant, Bain and Company (management consulting firm) (1987-1989). Formerly, Senior Equity Analyst, BA Investment Management Company (1983-1985).
Other Directorships. None. |
George J. Gorman
1952 | Chairperson
of the Board
and Trustee | Since 2021
(Chairperson) and
2014 (Trustee) | Principal at George J. Gorman LLC (consulting firm). Formerly, Senior Partner at Ernst & Young LLP (a registered public accounting firm) (1974-2009).
Other Directorships. None. |
Eaton Vance
Floating-Rate Fund
October 31, 2023
Management and Organization — continued
| Name and Year of Birth | Trust/Portfolio
Position(s) | Length of Service | Principal Occupation(s) and Other Directorships
During Past Five Years and Other Relevant Experience |
| Noninterested Trustees (continued) |
Valerie A. Mosley
1960 | Trustee | Since 2014 | Chairwoman and Chief Executive Officer of Valmo Ventures (a consulting and investment firm). Founder of Upward Wealth, Inc., dba BrightUp, a fintech platform. Formerly, Partner and Senior Vice President, Portfolio Manager and Investment Strategist at Wellington Management Company, LLP (investment management firm) (1992-2012). Formerly, Chief Investment Officer, PG Corbin Asset Management (1990-1992). Formerly worked in institutional corporate bond sales at Kidder Peabody (1986-1990).
Other Directorships. Director of DraftKings, Inc. (digital sports entertainment and gaming company) (since September 2020). Director of Envestnet, Inc. (provider of intelligent systems for wealth management and financial wellness) (since 2018). Formerly, Director of Dynex Capital, Inc. (mortgage REIT) (2013-2020) and Director of Groupon, Inc. (ecommerce provider) (2020-2022). |
Keith Quinton
1958 | Trustee | Since 2018 | Private investor, researcher and lecturer. Formerly, Independent Investment Committee Member at New Hampshire Retirement System (2017-2021). Formerly, Portfolio Manager and Senior Quantitative Analyst at Fidelity Investments (investment management firm) (2001-2014).
Other Directorships. Formerly, Director (2016-2021) and Chairman (2019-2021) of New Hampshire Municipal Bond Bank. |
Marcus L. Smith
1966 | Trustee | Since 2018 | Private investor and independent corporate director. Formerly, Chief Investment Officer, Canada (2012-2017), Chief Investment Officer, Asia (2010-2012), Director of Asian Research (2004-2010) and portfolio manager (2001-2017) at MFS Investment Management (investment management firm).
Other Directorships. Director of First Industrial Realty Trust, Inc. (an industrial REIT) (since 2021). Director of MSCI Inc. (global provider of investment decision support tools) (since 2017). Formerly, Director of DCT Industrial Trust Inc. (logistics real estate company) (2017-2018). |
Susan J. Sutherland
1957 | Trustee | Since 2015 | Private investor. Director of Ascot Group Limited and certain of its subsidiaries (insurance and reinsurance) (since 2017). Formerly, Director of Hagerty Holding Corp. (insurance) (2015-2018) and Montpelier Re Holdings Ltd. (insurance and reinsurance) (2013-2015). Formerly, Associate, Counsel and Partner at Skadden, Arps, Slate, Meagher & Flom LLP (law firm) (1982-2013).
Other Directorships. Director of Kairos Acquisition Corp. (insurance/InsurTech acquisition company) (2021-2023). |
Scott E. Wennerholm
1959 | Trustee | Since 2016 | Private investor. Formerly, Trustee at Wheelock College (postsecondary institution) (2012-2018). Formerly, Consultant at GF Parish Group (executive recruiting firm) (2016-2017). Formerly, Chief Operating Officer and Executive Vice President at BNY Mellon Asset Management (investment management firm) (2005-2011). Formerly, Chief Operating Officer and Chief Financial Officer at Natixis Global Asset Management (investment management firm) (1997-2004). Formerly, Vice President at Fidelity Investments Institutional Services (investment management firm) (1994-1997).
Other Directorships. None. |
Nancy A. Wiser
1967 | Trustee | Since 2022 | Formerly, Executive Vice President and the Global Head of Operations at Wells Fargo Asset Management (2011-2021).
Other Directorships. None. |
| Name and Year of Birth | Trust/Portfolio
Position(s) | Length of Service | Principal Occupation(s)
During Past Five Years |
| Principal Officers who are not Trustees |
Kenneth A. Topping
1966 | President | Since 2023 | Vice President and Chief Administrative Officer of EVM and BMR and Chief Operating Officer for Public Markets at MSIM. Also Vice President of Calvert Research and Management (“CRM”) since 2021. Formerly, Chief Operating Officer for Goldman Sachs Asset Management ‘Classic’ (2009-2020). |
Deidre E. Walsh
1971 | Vice President and
Chief Legal Officer | Since 2009 | Vice President of EVM and BMR. Also Vice President of CRM. |
James F. Kirchner
1967 | Treasurer | Since 2007 | Vice President of EVM and BMR. Also Vice President of CRM. |
Eaton Vance
Floating-Rate Fund
October 31, 2023
Management and Organization — continued
| Name and Year of Birth | Trust/Portfolio
Position(s) | Length of Service | Principal Occupation(s)
During Past Five Years |
| Principal Officers who are not Trustees (continued) |
Nicholas S. Di Lorenzo
1987 | Secretary | Since 2022 | Formerly, associate (2012-2021) and counsel (2022) at Dechert LLP. |
Richard F. Froio
1968 | Chief Compliance
Officer | Since 2017 | Vice President of EVM and BMR since 2017. Formerly, Deputy Chief Compliance Officer (Adviser/Funds) and Chief Compliance Officer (Distribution) at PIMCO (2012-2017) and Managing Director at BlackRock/Barclays Global Investors (2009-2012). |
(1) Ms. Pachnanda began serving as Trustee effective April 1, 2023.
The SAI for the Fund includes additional information about the Trustees and officers of the Fund and the Portfolio and can be obtained without charge on Eaton Vance’s website at www.eatonvance.com or by calling 1-800-262-1122.
| FACTS | WHAT DOES EATON VANCE DO WITH YOUR
PERSONAL INFORMATION? |
| Why? | Financial companies choose how they share your personal information. Federal law gives consumers the right to limit some but not all sharing. Federal law also requires us to tell you how we collect, share, and protect your personal information. Please read this notice carefully to understand what we do. |
| |
| What? | The types of personal information we collect and share depend on the product or service you have with us. This information can include:■ Social Security number and income
■ investment experience and risk tolerance
■ checking account number and wire transfer instructions |
| |
| How? | All financial companies need to share customers’ personal information to run their everyday business. In the section below, we list the reasons financial companies can share their customers’ personal information; the reasons Eaton Vance chooses to share; and whether you can limit this sharing. |
Reasons we can share your
personal information | Does Eaton Vance
share? | Can you limit
this sharing? |
| For our everyday business purposes — such as to process your transactions, maintain your account(s), respond to court orders and legal investigations, or report to credit bureaus | Yes | No |
| For our marketing purposes — to offer our products and services to you | Yes | No |
| For joint marketing with other financial companies | No | We don’t share |
| For our investment management affiliates’ everyday business purposes — information about your transactions, experiences, and creditworthiness | Yes | Yes |
| For our affiliates’ everyday business purposes — information about your transactions and experiences | Yes | No |
| For our affiliates’ everyday business purposes — information about your creditworthiness | No | We don’t share |
| For our investment management affiliates to market to you | Yes | Yes |
| For our affiliates to market to you | No | We don’t share |
| For nonaffiliates to market to you | No | We don’t share |
To limit our
sharing | Call toll-free 1-800-262-1122 or email: EVPrivacy@eatonvance.comPlease note:If you are a new customer, we can begin sharing your information 30 days from the date we sent this notice. When you are no longer our customer, we continue to share your information as described in this notice. However, you can contact us at any time to limit our sharing. |
| Questions? | Call toll-free 1-800-262-1122 or email: EVPrivacy@eatonvance.com |
| Privacy Notice — continued | April 2021 |
| Who we are |
| Who is providing this notice? | Eaton Vance Management, Eaton Vance Distributors, Inc., Eaton Vance Trust Company, Eaton Vance Management (International) Limited, Eaton Vance Advisers International Ltd., Eaton Vance Global Advisors Limited, Eaton Vance Management’s Real Estate Investment Group, Boston Management and Research, Calvert Research and Management, Eaton Vance and Calvert Fund Families and our investment advisory affiliates (“Eaton Vance”) (see Investment Management Affiliates definition below) |
| What we do |
How does Eaton Vance
protect my personal
information? | To protect your personal information from unauthorized access and use, we use security measures that comply with federal law. These measures include computer safeguards and secured files and buildings. We have policies governing the proper handling of customer information by personnel and requiring third parties that provide support to adhere to appropriate security standards with respect to such information. |
How does Eaton Vance
collect my personal
information? | We collect your personal information, for example, when you■ open an account or make deposits or withdrawals from your account
■ buy securities from us or make a wire transfer
■ give us your contact informationWe also collect your personal information from others, such as credit bureaus, affiliates, or other companies. |
| Why can’t I limit all sharing? | Federal law gives you the right to limit only■ sharing for affiliates’ everyday business purposes — information about your creditworthiness
■ affiliates from using your information to market to you
■ sharing for nonaffiliates to market to youState laws and individual companies may give you additional rights to limit sharing. See below for more on your rights under state law. |
| Definitions |
Investment Management
Affiliates | Eaton Vance Investment Management Affiliates include registered investment advisers, registered broker- dealers, and registered and unregistered funds. Investment Management Affiliates does not include entities associated with Morgan Stanley Wealth Management, such as Morgan Stanley Smith Barney LLC and Morgan Stanley & Co. |
| Affiliates | Companies related by common ownership or control. They can be financial and nonfinancial companies.■ Our affiliates include companies with a Morgan Stanley name and financial companies such as Morgan Stanley Smith Barney LLC and Morgan Stanley & Co. |
| Nonaffiliates | Companies not related by common ownership or control. They can be financial and nonfinancial companies.■ Eaton Vance does not share with nonaffiliates so they can market to you. |
| Joint marketing | A formal agreement between nonaffiliated financial companies that together market financial products or services to you.■ Eaton Vance doesn’t jointly market. |
| Other important information |
| Vermont: Except as permitted by law, we will not share personal information we collect about Vermont residents with Nonaffiliates unless you provide us with your written consent to share such information.California: Except as permitted by law, we will not share personal information we collect about California residents with Nonaffiliates and we will limit sharing such personal information with our Affiliates to comply with California privacy laws that apply to us. |
Delivery of Shareholder Documents. The Securities and Exchange Commission (SEC) permits funds to deliver only one copy of shareholder documents, including prospectuses, proxy statements and shareholder reports, to fund investors with multiple accounts at the same residential or post office box address. This practice is often called “householding” and it helps eliminate duplicate mailings to shareholders. Eaton Vance, or your financial intermediary, may household the mailing of your documents indefinitely unless you instruct Eaton Vance, or your financial intermediary, otherwise. If you would prefer that your Eaton Vance documents not be householded, please contact Eaton Vance at 1-800-262-1122, or contact your financial intermediary. Your instructions that householding not apply to delivery of your Eaton Vance documents will typically be effective within 30 days of receipt by Eaton Vance or your financial intermediary.
Portfolio Holdings. Each Eaton Vance Fund and its underlying Portfolio(s) (if applicable) files a schedule of portfolio holdings on Part F to Form N-PORT with the SEC. Certain information filed on Form N-PORT may be viewed on the Eaton Vance website at www.eatonvance.com, by calling Eaton Vance at 1-800-262-1122 or in the EDGAR database on the SEC’s website at www.sec.gov.
Proxy Voting. From time to time, funds are required to vote proxies related to the securities held by the funds. The Eaton Vance Funds or their underlying Portfolios (if applicable) vote proxies according to a set of policies and procedures approved by the Funds’ and Portfolios’ Boards. You may obtain a description of these policies and procedures and information on how the Funds or Portfolios voted proxies relating to portfolio securities during the most recent 12-month period ended June 30, without charge, upon request, by calling 1-800-262-1122 and by accessing the SEC’s website at www.sec.gov.
Tailored Shareholder Reports. Effective January 24, 2023, the SEC adopted rule and form amendments to require open-end mutual funds and ETFs to transmit concise and visually engaging streamlined annual and semiannual reports to shareholders that highlight key information. Other information, including financial statements, will no longer appear in a streamlined shareholder report but must be available online, delivered free of charge upon request, and filed on a semiannual basis on Form N-CSR. The rule and form amendments have a compliance date of July 24, 2024. At this time, management is evaluating the impact of these amendments on the shareholder reports for the Eaton Vance Funds.
Investment Adviser of Eaton Vance Floating Rate Portfolio
Boston Management and Research
Two International Place
Boston, MA 02110
Investment Adviser and Administrator of
Eaton Vance Floating-Rate Fund
Eaton Vance Management
Two International Place
Boston, MA 02110
Principal Underwriter*
Eaton Vance Distributors, Inc.
Two International Place
Boston, MA 02110
(617) 482-8260
Custodian
State Street Bank and Trust Company
One Congress Street, Suite 1
Boston, MA 02114-2016
Transfer Agent
BNY Mellon Investment Servicing (US) Inc.
Attn: Eaton Vance Funds
P.O. Box 534439
Pittsburgh, PA 15253-4439
(800) 262-1122
Independent Registered Public Accounting Firm
Deloitte & Touche LLP
200 Berkeley Street
Boston, MA 02116-5022
Fund Offices
Two International Place
Boston, MA 02110
* FINRA BrokerCheck. Investors may check the background of their Investment Professional by contacting the Financial Industry Regulatory Authority (FINRA). FINRA BrokerCheck is a free tool to help investors check the professional background of current and former FINRA-registered securities firms and brokers. FINRA BrokerCheck is available by calling 1-800-289-9999 and at www.FINRA.org. The FINRA BrokerCheck brochure describing this program is available to investors at www.FINRA.org.
Eaton Vance
Floating-Rate & High Income Fund
Annual Report
October 31, 2023
Commodity Futures Trading Commission Registration. The Commodity Futures Trading Commission (“CFTC”) has adopted regulations that subject registered investment companies and advisers to regulation by the CFTC if a fund invests more than a prescribed level of its assets in certain CFTC-regulated instruments (including futures, certain options and swap agreements) or markets itself as providing investment exposure to such instruments. The investment adviser has claimed an exclusion from the definition of “commodity pool operator” under the Commodity Exchange Act with respect to its management of the Fund. Accordingly, neither the Fund nor the adviser with respect to the operation of the Fund is subject to CFTC regulation. Because of its management of other strategies, the Fund's adviser is registered with the CFTC as a commodity pool operator. The adviser is also registered as a commodity trading advisor.
Fund shares are not insured by the FDIC and are not deposits or other obligations of, or guaranteed by, any depository institution. Shares are subject to investment risks, including possible loss of principal invested.
This report must be preceded or accompanied by a current summary prospectus or prospectus. Before investing, investors should consider carefully the investment objective, risks, and charges and expenses of a mutual fund. This and other important information is contained in the summary prospectus and prospectus, which can be obtained from a financial intermediary. Prospective investors should read the prospectus carefully before investing. For further information, please call 1-800-262-1122.
Annual Report October 31, 2023
Eaton Vance
Floating-Rate & High Income Fund
Eaton Vance
Floating-Rate & High Income Fund
October 31, 2023
Management’s Discussion of Fund Performance†
Economic and Market Conditions
Amid global concerns about inflation, rising interest rates, and the Russia-Ukraine war, senior loans displayed their value as a portfolio diversifier by outperforming most U.S. fixed-income asset classes during the 12-month period ended October 31, 2023.
With senior loans among the few asset classes to benefit from rising interest rates, the Morningstar® LSTA® US Leveraged Loan IndexSM (the Index), a broad measure of the asset class, returned 11.92% during the period. Senior loans generally outperformed investment-grade corporate bonds, corporate high yield bonds, municipal bonds, and U.S. government bonds.
As the period began in November 2022, the U.S. Federal Reserve’s (the Fed’s) campaign of interest rate hikes was generally viewed as a positive environment for floating-rate loans, and the asset class rallied during the closing months of 2022.
The senior loan rally continued into 2023, with the Index returning 2.73% in January -- its best monthly performance since May 2020 -- and posting positive performance in February 2023 as well. But in mid-March, the unexpected collapse of Silicon Valley Bank and Signature Bank triggered fears of contagion in the regional banking sector and put a damper on asset performance across capital markets. As a result, the Index return was virtually flat in March 2023.
Senior loans rallied again in April 2023, but gave back some of those gains in May amid recession concerns. From June through September 2023, senior loans rallied once more as recession fears receded. In the rising-rate environment, coupon interest accounted for nearly three-quarters of the Index’s performance in 2023 through September.
However, in October 2023, amid volatility that rattled capital markets, loan prices slipped modestly and the Index return was virtually flat for the month -- although senior loans continued to outperform virtually all other U.S. fixed-income asset classes during the closing month of the period.
Asset class technical factors were generally supportive throughout the period, contributing to the overall performance of senior loans. For example, the supply of new loans was limited during the period, which supported floating-rate prices in secondary markets.
In addition, new capital formation in structured products provided a tailwind for the asset class, reflecting continued institutional interest in senior loans during the period.
While issuer fundamentals deteriorated for the period as a whole, they improved during the period’s closing months. The trailing 12-month default rate rose from 0.83% at the start of the period to 1.71% as of June 30, 2023, and then declined to 1.36% at period-end -- about half the market’s 2.70% long-term average. Despite fluctuating default rates, loan prices improved from $92.20 at the start of the period to $94.80 at period-end.
For the period as a whole, BBB-, BB-, B-, CCC- and D-rated (defaulted) loans within the Index returned 8.71%, 9.82%, 13.27%, 12.40%, and -30.85%, respectively.
Fund Performance
For the 12-month period ended October 31, 2023, Eaton Vance Floating-Rate & High Income Fund (the Fund) returned 9.38% for Class A shares at net asset value (NAV), underperforming its benchmark, the Morningstar® LSTA® US Leveraged Loan IndexSM (the Index), which returned 11.92%.
The Index is unmanaged, and returns do not reflect any applicable sales charges, commissions, or expenses.
The Fund’s out-of-Index allocation to secured high yield bonds was the principal detractor from Fund returns versus the Index, as floating-rate loans outperformed their fixed-rate counterparts in the bond market during the period.
On an industry basis, loan selections in the media; information technology services; aerospace & defense; and diversified telecommunication services industries also detracted from returns versus the Index. On an individual loan basis, the top detractors from relative returns were an out-of-Index position in a global logistics provider, and an overweight position in a digital infrastructure provider.
In contrast, the Fund’s modest out-of-Index allocation to collateralized loan obligation debt investments, which performed strongly during the period, contributed to returns versus the Index.
On an industry basis, loan selections in the health care equipment & supplies industry, and in the energy equipment & services industry contributed to returns versus the Index during the period. On an individual loan basis, the top contributors to relative returns were an out-of-Index position in a steel forgings manufacturer, and an overweight position in a home health care provider.
See Endnotes and Additional Disclosures in this report.
Past performance is no guarantee of future results. Returns are historical and are calculated by determining the percentage change in net asset value (NAV) or offering price (as applicable) with all distributions reinvested. Furthermore, returns do not reflect the deduction of taxes that shareholders may have to pay on Fund distributions or upon the redemption of Fund shares. Investment return and principal value will fluctuate so that shares, when redeemed, may be worth more or less than their original cost. Performance for periods less than or equal to one year is cumulative. Performance is for the stated time period only; due to market volatility, current Fund performance may be lower or higher than the quoted return. For performance as of the most recent month-end, please refer to eatonvance.com.
Eaton Vance
Floating-Rate & High Income Fund
October 31, 2023
Performance
Portfolio Manager(s) Kelley Gerrity, Stephen C. Concannon, CFA, Andrew N. Sveen, CFA, Jeffrey D. Mueller, Ralph Hinckley, CFA and Jake Lemle, CFA
| % Average Annual Total Returns1,2 | Class
Inception Date | Performance
Inception Date | One Year | Five Years | Ten Years |
| Advisers Class at NAV | 09/07/2000 | 09/07/2000 | 9.35% | 3.02% | 3.35% |
| Class A at NAV | 05/07/2003 | 09/07/2000 | 9.38 | 3.03 | 3.35 |
| Class A with 3.25% Maximum Sales Charge | — | — | 5.77 | 2.34 | 3.02 |
| Class C at NAV | 09/05/2000 | 09/05/2000 | 8.68 | 2.27 | 2.75 |
| Class C with 1% Maximum Deferred Sales Charge | — | — | 7.68 | 2.27 | 2.75 |
| Class I at NAV | 09/15/2000 | 09/15/2000 | 9.76 | 3.30 | 3.61 |
| Class R6 at NAV | 06/27/2016 | 09/15/2000 | 9.83 | 3.36 | 3.66 |
|
| Morningstar® LSTA® US Leveraged Loan IndexSM | — | — | 11.92% | 4.46% | 4.22% |
| % Total Annual Operating Expense Ratios3 | Advisers Class | Class A | Class C | Class I | Class R6 |
| | 1.02% | 1.02% | 1.77% | 0.77% | 0.71% |
Growth of $10,000
This graph shows the change in value of a hypothetical investment of $10,000 in Class A of the Fund for the period indicated. For comparison, the same investment is shown in the indicated index.
| Growth of Investment2 | Amount Invested | Period Beginning | At NAV | With Maximum Sales Charge |
| Advisers Class | $10,000 | 10/31/2013 | $13,910 | N.A. |
| Class C | $10,000 | 10/31/2013 | $13,115 | N.A. |
| Class I, at minimum investment | $1,000,000 | 10/31/2013 | $1,426,384 | N.A. |
| Class R6, at minimum investment | $5,000,000 | 10/31/2013 | $7,161,751 | N.A. |
See Endnotes and Additional Disclosures in this report.
Past performance is no guarantee of future results. Returns are historical and are calculated by determining the percentage change in net asset value (NAV) or offering price (as applicable) with all distributions reinvested. Furthermore, returns do not reflect the deduction of taxes that shareholders may have to pay on Fund distributions or upon the redemption of Fund shares. Investment return and principal value will fluctuate so that shares, when redeemed, may be worth more or less than their original cost. Performance for periods less than or equal to one year is cumulative. Performance is for the stated time period only; due to market volatility, current Fund performance may be lower or higher than the quoted return. For performance as of the most recent month-end, please refer to eatonvance.com.
Eaton Vance
Floating-Rate & High Income Fund
October 31, 2023
| Asset Allocation (% of net assets)1,2 |
| Credit Quality (% of bonds, loans and asset-backed securities)3 |
Footnotes:
Fund invests in one or more affiliated investment companies (Portfolios). Unless otherwise noted, references to investments are to the aggregate holdings of the Fund, including its pro rata share of each Portfolio or Fund in which it invests.
| 1 | Net of unfunded loan commitments. |
| 2 | Other Net Assets represents other assets less liabilities and includes any investment type that represents less than 1% of net assets. |
| 3 | For Eaton Vance Floating Rate Portfolio’s investments, credit ratings are categorized using S&P Global Ratings (“S&P”). For High Income Opportunities Portfolio’s investments, ratings are based on Moody’s Investors Service, Inc. (“Moody’s”), S&P Global Ratings (“S&P”) or Fitch Ratings (“Fitch”), as applicable and the breakdown assigns a numeric equivalent to the ratings from the aforementioned agencies and the mean is rounded to the nearest integer and converted to an equivalent S&P major rating category. Ratings, which are subject to change, apply to the creditworthiness of the issuers of the underlying securities and not to the Fund or its shares. Credit ratings measure the quality of a bond based on the issuer’s creditworthiness, with ratings ranging from AAA, being the highest, to D, being the lowest based on S&P’s measures. Ratings of BBB or higher by S&P or Fitch (Baa or higher by Moody’s) are considered to be investment-grade quality. Credit ratings are based largely on the ratings agency’s analysis at the time of rating. The rating assigned to any particular security is not necessarily a reflection of the issuer’s current financial condition and does not necessarily reflect its assessment of the volatility of a security’s market value or of the liquidity of an investment in the security. Holdings designated as “Not Rated” (if any) are not rated by the national ratings agencies stated above. |
Eaton Vance
Floating-Rate & High Income Fund
October 31, 2023
Endnotes and Additional Disclosures
| † | The views expressed in this report are those of the portfolio manager(s) and are current only through the date stated at the top of this page. These views are subject to change at any time based upon market or other conditions, and Eaton Vance and the Fund(s) disclaim any responsibility to update such views. These views may not be relied upon as investment advice and, because investment decisions are based on many factors, may not be relied upon as an indication of trading intent on behalf of any Eaton Vance fund. This commentary may contain statements that are not historical facts, referred to as “forward-looking statements.” The Fund’s actual future results may differ significantly from those stated in any forward-looking statement, depending on factors such as changes in securities or financial markets or general economic conditions, the volume of sales and purchases of Fund shares, the continuation of investment advisory, administrative and service contracts, and other risks discussed from time to time in the Fund’s filings with the Securities and Exchange Commission. |
| | |
| 1 | Morningstar® LSTA® US Leveraged Loan IndexSM is an unmanaged index of the institutional leveraged loan market. Morningstar® LSTA® Leveraged Loan indices are a product of Morningstar, Inc. (“Morningstar”) and have been licensed for use. Morningstar® is a registered trademark of Morningstar licensed for certain use. Loan Syndications and Trading Association® and LSTA® are trademarks of the LSTA licensed for certain use by Morningstar, and further sublicensed by Morningstar for certain use. Neither Morningstar nor LSTA guarantees the accuracy and/or completeness of the Morningstar® LSTA® US Leveraged Loan IndexSM or any data included therein, and shall have no liability for any errors, omissions, or interruptions therein. Unless otherwise stated, index returns do not reflect the effect of any applicable sales charges, commissions, expenses, taxes or leverage, as applicable. It is not possible to invest directly in an index. |
| 2 | Total Returns at NAV do not include applicable sales charges. If sales charges were deducted, the returns would be lower. Total Returns shown with maximum sales charge reflect the stated maximum sales charge. Unless otherwise stated, performance does not reflect the deduction of taxes on Fund distributions or redemptions of Fund shares.Performance prior to the inception date of a class may be linked to the performance of an older class of the Fund. This linked performance is adjusted for any applicable sales charge, but is not adjusted for class expense differences. If adjusted for such differences, the performance would be different. The performance of Class R6 is linked to Class I. Performance presented in the Financial Highlights included in the financial statements is not linked.Effective November 5, 2020, Class C shares automatically convert to Class A shares eight years after purchase. The average annual total returns listed for Class C reflect conversion to Class A shares after eight years. Prior to November 5, 2020, Class C shares automatically converted to Class A shares ten years after purchase. |
| 3 | Source: Fund prospectus. The expense ratios for the current reporting period can be found in the Financial Highlights section of this report. Performance reflects expenses waived and/or reimbursed, if applicable. Without such waivers and/or reimbursements, performance would have been lower. |
| | Fund profile subject to change due to active management. |
Eaton Vance
Floating-Rate & High Income Fund
October 31, 2023
Example
As a Fund shareholder, you incur two types of costs: (1) transaction costs, including sales charges (loads) on purchases; and (2) ongoing costs, including management fees; distribution and/or service fees; and other Fund expenses. This Example is intended to help you understand your ongoing costs (in dollars) of Fund investing and to compare these costs with the ongoing costs of investing in other mutual funds. The Example is based on an investment of $1,000 invested at the beginning of the period and held for the entire period (May 1, 2023 to October 31, 2023).
Actual Expenses
The first section of the table below provides information about actual account values and actual expenses. You may use the information in this section, together with the amount you invested, to estimate the expenses that you paid over the period. Simply divide your account value by $1,000 (for example, an $8,600 account value divided by $1,000 = 8.6), then multiply the result by the number in the first section under the heading entitled “Expenses Paid During Period” to estimate the expenses you paid on your account during this period.
Hypothetical Example for Comparison Purposes
The second section of the table below provides information about hypothetical account values and hypothetical expenses based on the actual Fund expense ratio and an assumed rate of return of 5% per year (before expenses), which is not the actual Fund return. The hypothetical account values and expenses may not be used to estimate the actual ending account balance or expenses you paid for the period. You may use this information to compare the ongoing costs of investing in your Fund and other funds. To do so, compare this 5% hypothetical example with the 5% hypothetical examples that appear in the shareholder reports of the other funds.
Please note that the expenses shown in the table are meant to highlight your ongoing costs only and do not reflect any transactional costs, such as sales charges (loads). Therefore, the second section of the table is useful in comparing ongoing costs only, and will not help you determine the relative total costs of owning different funds. In addition, if these transactional costs were included, your costs would be higher.
| | Beginning
Account Value
(5/1/23) | Ending
Account Value
(10/31/23) | Expenses Paid
During Period*
(5/1/23 – 10/31/23) | Annualized
Expense
Ratio |
| Actual | | | | |
| Advisers Class | $1,000.00 | $1,033.60 | $5.59 | 1.09% |
| Class A | $1,000.00 | $1,034.00 | $5.59 | 1.09% |
| Class C | $1,000.00 | $1,031.00 | $9.42 | 1.84% |
| Class I | $1,000.00 | $1,036.20 | $4.31 | 0.84% |
| Class R6 | $1,000.00 | $1,036.50 | $3.95 | 0.77% |
| |
| Hypothetical | | | | |
| (5% return per year before expenses) | | | | |
| Advisers Class | $1,000.00 | $1,019.71 | $5.55 | 1.09% |
| Class A | $1,000.00 | $1,019.71 | $5.55 | 1.09% |
| Class C | $1,000.00 | $1,015.93 | $9.35 | 1.84% |
| Class I | $1,000.00 | $1,020.97 | $4.28 | 0.84% |
| Class R6 | $1,000.00 | $1,021.32 | $3.92 | 0.77% |
| * | Expenses are equal to the Fund's annualized expense ratio for the indicated Class, multiplied by the average account value over the period, multiplied by 184/365 (to reflect the one-half year period). The Example assumes that the $1,000 was invested at the net asset value per share determined at the close of business on April 30, 2023. The Example reflects the expenses of both the Fund and the Portfolios. |
Eaton Vance
Floating-Rate & High Income Fund
October 31, 2023
Statement of Assets and Liabilities
| | October 31, 2023 |
| Assets | |
Investment in Eaton Vance Floating Rate Portfolio, at value
(identified cost $899,002,552) | $ 806,565,606 |
Investment in High Income Opportunities Portfolio, at value
(identified cost $196,262,192) | 151,383,812 |
| Receivable for Fund shares sold | 2,273,987 |
| Total assets | $ 960,223,405 |
| Liabilities | |
| Payable for Fund shares redeemed | $ 14,034,142 |
| Distributions payable | 525,084 |
| Payable to affiliates: | |
| Administration fee | 123,305 |
| Distribution and service fees | 48,810 |
| Trustees' fees | 42 |
| Accrued expenses | 340,419 |
| Total liabilities | $ 15,071,802 |
| Net Assets | $ 945,151,603 |
| Sources of Net Assets | |
| Paid-in capital | $1,227,472,984 |
| Accumulated loss | (282,321,381) |
| Net Assets | $ 945,151,603 |
| Advisers Class Shares | |
| Net Assets | $ 39,715,265 |
| Shares Outstanding | 4,896,703 |
Net Asset Value, Offering Price and Redemption Price Per Share
(net assets ÷ shares of beneficial interest outstanding) | $ 8.11 |
| Class A Shares | |
| Net Assets | $ 116,469,157 |
| Shares Outstanding | 13,499,884 |
Net Asset Value and Redemption Price Per Share
(net assets ÷ shares of beneficial interest outstanding) | $ 8.63 |
Maximum Offering Price Per Share
(100 ÷ 96.75 of net asset value per share) | $ 8.92 |
| Class C Shares | |
| Net Assets | $ 16,355,259 |
| Shares Outstanding | 2,020,384 |
Net Asset Value and Offering Price Per Share*
(net assets ÷ shares of beneficial interest outstanding) | $ 8.10 |
| Class I Shares | |
| Net Assets | $ 742,105,004 |
| Shares Outstanding | 91,442,678 |
Net Asset Value, Offering Price and Redemption Price Per Share
(net assets ÷ shares of beneficial interest outstanding) | $ 8.12 |
7
See Notes to Financial Statements.
Eaton Vance
Floating-Rate & High Income Fund
October 31, 2023
Statement of Assets and Liabilities — continued
| | October 31, 2023 |
| Class R6 Shares | |
| Net Assets | $30,506,918 |
| Shares Outstanding | 3,758,891 |
Net Asset Value, Offering Price and Redemption Price Per Share
(net assets ÷ shares of beneficial interest outstanding) | $ 8.12 |
| On sales of $100,000 or more, the offering price of Class A shares is reduced. |
| * | Redemption price per share is equal to the net asset value less any applicable contingent deferred sales charge. |
8
See Notes to Financial Statements.
Eaton Vance
Floating-Rate & High Income Fund
October 31, 2023
| | Year Ended |
| | October 31, 2023 |
| Investment Income | |
| Dividend income allocated from Portfolios (net of foreign taxes withheld of $255) | $ 2,206,158 |
| Interest income allocated from Portfolios | 96,351,256 |
| Expenses allocated from Portfolios | (6,630,158) |
| Total investment income from Portfolios | $ 91,927,256 |
| Expenses | |
| Administration fee | $ 1,750,607 |
| Distribution and service fees: | |
| Advisers Class | 103,679 |
| Class A | 381,333 |
| Class C | 189,036 |
| Trustees’ fees and expenses | 500 |
| Custodian fee | 61,904 |
| Transfer and dividend disbursing agent fees | 894,623 |
| Legal and accounting services | 77,804 |
| Printing and postage | 113,899 |
| Registration fees | 97,798 |
| Miscellaneous | 22,134 |
| Total expenses | $ 3,693,317 |
| Net investment income | $ 88,233,939 |
| Realized and Unrealized Gain (Loss) from Portfolios | |
| Net realized gain (loss): | |
| Investment transactions | $ (36,414,046) |
| Securities sold short | (92,730) |
| Foreign currency transactions | 334,688 |
| Forward foreign currency exchange contracts | (9,990,517) |
| Net realized loss | $ (46,162,605) |
| Change in unrealized appreciation (depreciation): | |
| Investments | $ 68,662,770 |
| Foreign currency | 205,992 |
| Forward foreign currency exchange contracts | 1,172,150 |
| Net change in unrealized appreciation (depreciation) | $ 70,040,912 |
| Net realized and unrealized gain | $ 23,878,307 |
| Net increase in net assets from operations | $112,112,246 |
9
See Notes to Financial Statements.
Eaton Vance
Floating-Rate & High Income Fund
October 31, 2023
Statements of Changes in Net Assets
| | Year Ended October 31, |
| | 2023 | 2022 |
| Increase (Decrease) in Net Assets | | |
| From operations: | | |
| Net investment income | $ 88,233,939 | $ 72,027,950 |
| Net realized gain (loss) | (46,162,605) | 7,117,431 |
| Net change in unrealized appreciation (depreciation) | 70,040,912 | (163,552,579) |
| Net increase (decrease) in net assets from operations | $ 112,112,246 | $ (84,407,198) |
| Distributions to shareholders: | | |
| Advisers Class | $ (3,095,059) | $ (1,879,317) |
| Class A | (11,350,770) | (7,357,901) |
| Class C | (1,264,508) | (798,333) |
| Class I | (70,780,649) | (60,562,506) |
| Class R6 | (2,375,670) | (1,910,333) |
| Total distributions to shareholders | $ (88,866,656) | $ (72,508,390) |
| Transactions in shares of beneficial interest: | | |
| Advisers Class | $ (4,445,412) | $ (309,593) |
| Class A | (58,644,353) | 921,645 |
| Class C | (5,709,390) | (1,881,811) |
| Class I | (504,295,092) | 171,096,234 |
| Class R6 | (12,187,963) | 8,512,004 |
| Net increase (decrease) in net assets from Fund share transactions | $ (585,282,210) | $ 178,338,479 |
| Net increase (decrease) in net assets | $ (562,036,620) | $ 21,422,891 |
| Net Assets | | |
| At beginning of year | $1,507,188,223 | $ 1,485,765,332 |
| At end of year | $ 945,151,603 | $1,507,188,223 |
10
See Notes to Financial Statements.
Eaton Vance
Floating-Rate & High Income Fund
October 31, 2023
| | Advisers Class |
| | Year Ended October 31, |
| | 2023 | 2022 | 2021 | 2020 | 2019 |
| Net asset value — Beginning of year | $ 7.990 | $ 8.720 | $ 8.330 | $ 8.620 | $ 8.850 |
| Income (Loss) From Operations | | | | | |
| Net investment income(1) | $ 0.604 | $ 0.336 | $ 0.282 | $ 0.324 | $ 0.408 |
| Net realized and unrealized gain (loss) | 0.125 | (0.727) | 0.395 | (0.277) | (0.228) |
| Total income (loss) from operations | $ 0.729 | $ (0.391) | $ 0.677 | $ 0.047 | $ 0.180 |
| Less Distributions | | | | | |
| From net investment income | $ (0.609) | $ (0.339) | $ (0.287) | $ (0.337) | $ (0.410) |
| Total distributions | $ (0.609) | $ (0.339) | $ (0.287) | $ (0.337) | $ (0.410) |
| Net asset value — End of year | $ 8.110 | $ 7.990 | $ 8.720 | $ 8.330 | $ 8.620 |
| Total Return(2) | 9.35% | (4.56)% | 8.20% | 0.75% | 1.98% |
| Ratios/Supplemental Data | | | | | |
| Net assets, end of year (000’s omitted) | $39,715 | $43,533 | $47,953 | $42,806 | $84,179 |
| Ratios (as a percentage of average daily net assets):(3) | | | | | |
| Expenses | 1.08% (4) | 1.02% (4) | 1.04% | 1.08% | 1.04% |
| Net investment income | 7.42% | 4.01% | 3.25% | 3.89% | 4.68% |
| Portfolio Turnover of the Fund(5) | 3% | 24% | 9% | 8% | 5% |
| (1) | Computed using average shares outstanding. |
| (2) | Returns are historical and are calculated by determining the percentage change in net asset value with all distributions reinvested. |
| (3) | Includes the Fund’s share of the Portfolios’ allocated expenses. |
| (4) | Includes a reduction by the investment adviser of a portion of the Portfolios' adviser fees due to the Portfolios' investment in the Liquidity Fund (equal to less than 0.005% of average daily net assets for the years ended October 31, 2023 and 2022). |
| (5) | Percentage is based on the Fund’s contributions to and withdrawals from the Portfolios and excludes the investment activity of the Portfolios. |
11
See Notes to Financial Statements.
Eaton Vance
Floating-Rate & High Income Fund
October 31, 2023
Financial Highlights — continued
| | Class A |
| | Year Ended October 31, |
| | 2023 | 2022 | 2021 | 2020 | 2019 |
| Net asset value — Beginning of year | $ 8.500 | $ 9.280 | $ 8.870 | $ 9.160 | $ 9.410 |
| Income (Loss) From Operations | | | | | |
| Net investment income(1) | $ 0.641 | $ 0.357 | $ 0.300 | $ 0.340 | $ 0.434 |
| Net realized and unrealized gain (loss) | 0.137 | (0.777) | 0.415 | (0.272) | (0.248) |
| Total income (loss) from operations | $ 0.778 | $ (0.420) | $ 0.715 | $ 0.068 | $ 0.186 |
| Less Distributions | | | | | |
| From net investment income | $ (0.648) | $ (0.360) | $ (0.305) | $ (0.358) | $ (0.436) |
| Total distributions | $ (0.648) | $ (0.360) | $ (0.305) | $ (0.358) | $ (0.436) |
| Net asset value — End of year | $ 8.630 | $ 8.500 | $ 9.280 | $ 8.870 | $ 9.160 |
| Total Return(2) | 9.38% | (4.60)% | 8.14% | 0.83% | 2.04% |
| Ratios/Supplemental Data | | | | | |
| Net assets, end of year (000’s omitted) | $116,469 | $172,307 | $187,279 | $181,561 | $195,385 |
| Ratios (as a percentage of average daily net assets):(3) | | | | | |
| Expenses | 1.08% (4) | 1.02% (4) | 1.04% | 1.08% | 1.04% |
| Net investment income | 7.40% | 4.01% | 3.25% | 3.84% | 4.69% |
| Portfolio Turnover of the Fund(5) | 3% | 24% | 9% | 8% | 5% |
| (1) | Computed using average shares outstanding. |
| (2) | Returns are historical and are calculated by determining the percentage change in net asset value with all distributions reinvested and do not reflect the effect of sales charges. |
| (3) | Includes the Fund’s share of the Portfolios’ allocated expenses. |
| (4) | Includes a reduction by the investment adviser of a portion of the Portfolios' adviser fees due to the Portfolios' investment in the Liquidity Fund (equal to less than 0.005% of average daily net assets for the years ended October 31, 2023 and 2022). |
| (5) | Percentage is based on the Fund’s contributions to and withdrawals from the Portfolios and excludes the investment activity of the Portfolios. |
12
See Notes to Financial Statements.
Eaton Vance
Floating-Rate & High Income Fund
October 31, 2023
Financial Highlights — continued
| | Class C |
| | Year Ended October 31, |
| | 2023 | 2022 | 2021 | 2020 | 2019 |
| Net asset value — Beginning of year | $ 7.980 | $ 8.710 | $ 8.320 | $ 8.600 | $ 8.830 |
| Income (Loss) From Operations | | | | | |
| Net investment income(1) | $ 0.540 | $ 0.271 | $ 0.218 | $ 0.259 | $ 0.341 |
| Net realized and unrealized gain (loss) | 0.127 | (0.726) | 0.394 | (0.264) | (0.227) |
| Total income (loss) from operations | $ 0.667 | $ (0.455) | $ 0.612 | $ (0.005) | $ 0.114 |
| Less Distributions | | | | | |
| From net investment income | $ (0.547) | $ (0.275) | $ (0.222) | $ (0.275) | $ (0.344) |
| Total distributions | $ (0.547) | $ (0.275) | $ (0.222) | $ (0.275) | $ (0.344) |
| Net asset value — End of year | $ 8.100 | $ 7.980 | $ 8.710 | $ 8.320 | $ 8.600 |
| Total Return(2) | 8.68% | (5.40)% | 7.40% | (0.00)% (3) | 1.33% |
| Ratios/Supplemental Data | | | | | |
| Net assets, end of year (000’s omitted) | $16,355 | $21,726 | $25,764 | $37,683 | $59,716 |
| Ratios (as a percentage of average daily net assets):(4) | | | | | |
| Expenses | 1.83% (5) | 1.77% (5) | 1.79% | 1.83% | 1.79% |
| Net investment income | 6.64% | 3.23% | 2.52% | 3.12% | 3.93% |
| Portfolio Turnover of the Fund(6) | 3% | 24% | 9% | 8% | 5% |
| (1) | Computed using average shares outstanding. |
| (2) | Returns are historical and are calculated by determining the percentage change in net asset value with all distributions reinvested and do not reflect the effect of sales charges. |
| (3) | Amount is less than (0.005)%. |
| (4) | Includes the Fund’s share of the Portfolios’ allocated expenses. |
| (5) | Includes a reduction by the investment adviser of a portion of the Portfolios' adviser fees due to the Portfolios' investment in the Liquidity Fund (equal to less than 0.005% of average daily net assets for the years ended October 31, 2023 and 2022). |
| (6) | Percentage is based on the Fund’s contributions to and withdrawals from the Portfolios and excludes the investment activity of the Portfolios. |
13
See Notes to Financial Statements.
Eaton Vance
Floating-Rate & High Income Fund
October 31, 2023
Financial Highlights — continued
| | Class I |
| | Year Ended October 31, |
| | 2023 | 2022 | 2021 | 2020 | 2019 |
| Net asset value — Beginning of year | $ 8.000 | $ 8.730 | $ 8.340 | $ 8.620 | $ 8.850 |
| Income (Loss) From Operations | | | | | |
| Net investment income(1) | $ 0.621 | $ 0.358 | $ 0.301 | $ 0.344 | $ 0.430 |
| Net realized and unrealized gain (loss) | 0.129 | (0.728) | 0.398 | (0.265) | (0.228) |
| Total income (loss) from operations | $ 0.750 | $ (0.370) | $ 0.699 | $ 0.079 | $ 0.202 |
| Less Distributions | | | | | |
| From net investment income | $ (0.630) | $ (0.360) | $ (0.309) | $ (0.359) | $ (0.432) |
| Total distributions | $ (0.630) | $ (0.360) | $ (0.309) | $ (0.359) | $ (0.432) |
| Net asset value — End of year | $ 8.120 | $ 8.000 | $ 8.730 | $ 8.340 | $ 8.620 |
| Total Return(2) | 9.76% | (4.43)% | 8.47% | 1.01% | 2.35% |
| Ratios/Supplemental Data | | | | | |
| Net assets, end of year (000’s omitted) | $742,105 | $1,227,499 | $1,187,123 | $546,479 | $808,175 |
| Ratios (as a percentage of average daily net assets):(3) | | | | | |
| Expenses | 0.83% (4) | 0.77% (4) | 0.78% | 0.83% | 0.79% |
| Net investment income | 7.63% | 4.27% | 3.47% | 4.12% | 4.94% |
| Portfolio Turnover of the Fund(5) | 3% | 24% | 9% | 8% | 5% |
| (1) | Computed using average shares outstanding. |
| (2) | Returns are historical and are calculated by determining the percentage change in net asset value with all distributions reinvested. |
| (3) | Includes the Fund’s share of the Portfolios’ allocated expenses. |
| (4) | Includes a reduction by the investment adviser of a portion of the Portfolios' adviser fees due to the Portfolios' investment in the Liquidity Fund (equal to less than 0.005% of average daily net assets for the years ended October 31, 2023 and 2022). |
| (5) | Percentage is based on the Fund’s contributions to and withdrawals from the Portfolios and excludes the investment activity of the Portfolios. |
14
See Notes to Financial Statements.
Eaton Vance
Floating-Rate & High Income Fund
October 31, 2023
Financial Highlights — continued
| | Class R6 |
| | Year Ended October 31, |
| | 2023 | 2022 | 2021 | 2020 | 2019 |
| Net asset value — Beginning of year | $ 8.000 | $ 8.730 | $ 8.340 | $ 8.620 | $ 8.850 |
| Income (Loss) From Operations | | | | | |
| Net investment income(1) | $ 0.630 | $ 0.364 | $ 0.312 | $ 0.349 | $ 0.435 |
| Net realized and unrealized gain (loss) | 0.125 | (0.730) | 0.393 | (0.267) | (0.228) |
| Total income (loss) from operations | $ 0.755 | $ (0.366) | $ 0.705 | $ 0.082 | $ 0.207 |
| Less Distributions | | | | | |
| From net investment income | $ (0.635) | $ (0.364) | $ (0.315) | $ (0.362) | $ (0.437) |
| Total distributions | $ (0.635) | $ (0.364) | $ (0.315) | $ (0.362) | $ (0.437) |
| Net asset value — End of year | $ 8.120 | $ 8.000 | $ 8.730 | $ 8.340 | $ 8.620 |
| Total Return(2) | 9.83% | (4.38)% | 8.54% | 1.05% | 2.41% |
| Ratios/Supplemental Data | | | | | |
| Net assets, end of year (000’s omitted) | $30,507 | $42,124 | $37,646 | $77,338 | $130,492 |
| Ratios (as a percentage of average daily net assets):(3) | | | | | |
| Expenses | 0.77% (4) | 0.71% (4) | 0.74% | 0.79% | 0.73% |
| Net investment income | 7.72% | 4.35% | 3.61% | 4.19% | 4.99% |
| Portfolio Turnover of the Fund(5) | 3% | 24% | 9% | 8% | 5% |
| (1) | Computed using average shares outstanding. |
| (2) | Returns are historical and are calculated by determining the percentage change in net asset value with all distributions reinvested. |
| (3) | Includes the Fund’s share of the Portfolios’ allocated expenses. |
| (4) | Includes a reduction by the investment adviser of a portion of the Portfolios' adviser fees due to the Portfolios' investment in the Liquidity Fund (equal to less than 0.005% of average daily net assets for the years ended October 31, 2023 and 2022). |
| (5) | Percentage is based on the Fund’s contributions to and withdrawals from the Portfolios and excludes the investment activity of the Portfolios. |
15
See Notes to Financial Statements.
Eaton Vance
Floating-Rate & High Income Fund
October 31, 2023
Notes to Financial Statements
1 Significant Accounting Policies
Eaton Vance Floating-Rate & High Income Fund (the Fund) is a diversified series of Eaton Vance Mutual Funds Trust (the Trust). The Trust is a Massachusetts business trust registered under the Investment Company Act of 1940, as amended (the 1940 Act), as an open-end management investment company. The Fund offers five classes of shares. Class A shares are generally sold subject to a sales charge imposed at time of purchase. Class C shares are sold at net asset value and are generally subject to a contingent deferred sales charge (see Note 5). Effective November 5, 2020, Class C shares automatically convert to Class A shares eight years after their purchase as described in the Fund’s prospectus. Advisers Class, Class I and Class R6 shares are sold at net asset value and are not subject to a sales charge. Each class represents a pro rata interest in the Fund, but votes separately on class-specific matters and (as noted below) is subject to different expenses. Realized and unrealized gains and losses are allocated daily to each class of shares based on the relative net assets of each class to the total net assets of the Fund. Net investment income, other than class-specific expenses, is allocated daily to each class of shares based upon the ratio of the value of each class’s paid shares to the total value of all paid shares. Sub-accounting, recordkeeping and similar administrative fees payable to financial intermediaries, which are a component of transfer and dividend disbursing agent fees on the Statement of Operations, are not allocated to Class R6 shares. Each class of shares differs in its distribution plan and certain other class-specific expenses. The Fund’s investment objective is to provide a high level of current income. The Fund currently pursues its objective by investing all of its investable assets in interests in two portfolios managed by Eaton Vance Management (EVM) or its affiliates (the Portfolios), which are Massachusetts business trusts. The value of the Fund’s investments in the Portfolios reflects the Fund’s proportionate interest in their net assets. The Portfolios and the Fund’s proportionate interest in each of their net assets at October 31, 2023 were as follows: Eaton Vance Floating Rate Portfolio (14.0%) and High Income Opportunities Portfolio (13.9%). The performance of the Fund is directly affected by the performance of the Portfolios. The financial statements of Eaton Vance Floating Rate Portfolio, including the portfolio of investments, are included elsewhere in this report and should be read in conjunction with the Fund’s financial statements. A copy of High Income Opportunities Portfolio’s financial statements is available by calling Eaton Vance at 1-800-262-1122 or in the EDGAR database on the Securities and Exchange Commission’s website at www.sec.gov.
The following is a summary of significant accounting policies of the Fund. The policies are in conformity with accounting principles generally accepted in the United States of America (U.S. GAAP). The Fund is an investment company and follows accounting and reporting guidance in the Financial Accounting Standards Board (FASB) Accounting Standards Codification Topic 946.
A Investment Valuation— Valuation of securities by Eaton Vance Floating Rate Portfolio is discussed in Note 1A of the Portfolio's Notes to Financial Statements, which are included elsewhere in this report. Such policies are consistent with those of High Income Opportunities Portfolio.
B Income—The Fund's net investment income or loss consists of the Fund's pro rata share of the net investment income or loss of the Portfolios, less all actual and accrued expenses of the Fund.
C Federal Taxes—The Fund's policy is to comply with the provisions of the Internal Revenue Code applicable to regulated investment companies and to distribute to shareholders each year substantially all of its net investment income, and all or substantially all of its net realized capital gains. Accordingly, no provision for federal income or excise tax is necessary.
As of October 31, 2023, the Fund had no uncertain tax positions that would require financial statement recognition, de-recognition, or disclosure. The Fund files a U.S. federal income tax return annually after its fiscal year-end, which is subject to examination by the Internal Revenue Service for a period of three years from the date of filing.
D Expenses—The majority of expenses of the Trust are directly identifiable to an individual fund. Expenses which are not readily identifiable to a specific fund are allocated taking into consideration, among other things, the nature and type of expense and the relative size of the funds.
E Use of Estimates—The preparation of the financial statements in conformity with U.S. GAAP requires management to make estimates and assumptions that affect the reported amounts of assets and liabilities at the date of the financial statements and the reported amounts of income and expense during the reporting period. Actual results could differ from those estimates.
F Indemnifications—Under the Trust’s organizational documents, its officers and Trustees may be indemnified against certain liabilities and expenses arising out of the performance of their duties to the Fund. Under Massachusetts law, if certain conditions prevail, shareholders of a Massachusetts business trust (such as the Trust) could be deemed to have personal liability for the obligations of the Trust. However, the Trust’s Declaration of Trust contains an express disclaimer of liability on the part of Fund shareholders and the By-laws provide that the Trust shall assume, upon request by the shareholder, the defense on behalf of any Fund shareholders. Moreover, the By-laws also provide for indemnification out of Fund property of any shareholder held personally liable solely by reason of being or having been a shareholder for all loss or expense arising from such liability. Additionally, in the normal course of business, the Fund enters into agreements with service providers that may contain indemnification clauses. The Fund’s maximum exposure under these arrangements is unknown as this would involve future claims that may be made against the Fund that have not yet occurred.
G Other—Investment transactions are accounted for on a trade date basis.
Eaton Vance
Floating-Rate & High Income Fund
October 31, 2023
Notes to Financial Statements — continued
2 Distributions to Shareholders and Income Tax Information
The Fund declares dividends daily to shareholders of record at the time of declaration. Distributions are generally paid monthly. Distributions of realized capital gains are made at least annually. Distributions are declared separately for each class of shares. Shareholders may reinvest income and capital gain distributions in additional shares of the same class of the Fund at the net asset value as of the reinvestment date or, at the election of the shareholder, receive distributions in cash. Distributions to shareholders are determined in accordance with income tax regulations, which may differ from U.S. GAAP. As required by U.S. GAAP, only distributions in excess of tax basis earnings and profits are reported in the financial statements as a return of capital. Permanent differences between book and tax accounting relating to distributions are reclassified to paid-in capital. For tax purposes, distributions from short-term capital gains are considered to be from ordinary income.
The tax character of distributions declared for the years ended October 31, 2023 and October 31, 2022 was as follows:
| | Year Ended October 31, |
| | 2023 | 2022 |
| Ordinary income | $88,866,656 | $72,508,390 |
As of October 31, 2023, the components of distributable earnings (accumulated loss) on a tax basis were as follows:
| Undistributed ordinary income | $ 510,170 |
| Deferred capital losses | (190,111,294) |
| Net unrealized depreciation | (92,195,173) |
| Distributions payable | (525,084) |
| Accumulated loss | $(282,321,381) |
At October 31, 2023, the Fund, for federal income tax purposes, had deferred capital losses of $190,111,294 which would reduce its taxable income arising from future net realized gains on investment transactions, if any, to the extent permitted by the Internal Revenue Code, and thus would reduce the amount of distributions to shareholders, which would otherwise be necessary to relieve the Fund of any liability for federal income or excise tax. The deferred capital losses are treated as arising on the first day of the Fund’s next taxable year and retain the same short-term or long-term character as when originally deferred. Of the deferred capital losses at October 31, 2023, $19,196,107 are short-term and $170,915,187 are long-term.
3 Investment Adviser Fee and Other Transactions with Affiliates
The investment adviser fee is earned by EVM, an indirect, wholly-owned subsidiary of Morgan Stanley, as compensation for investment advisory services rendered to the Fund. For bank loans and bank loan related assets, the investment adviser fee is computed based on the Fund’s daily net assets that are not invested in other investment companies for which EVM or its affiliates serve as investment adviser and receive an advisory fee at the following annual rates and is payable monthly:
| Average Daily Net Assets | Annual Fee Rate |
| Up to $1 billion | 0.575% |
| $1 billion but less than $2 billion | 0.525% |
| $2 billion but less than $5 billion | 0.490% |
| $5 billion but less than $10 billion | 0.460% |
| $10 billion but less than $15 billion | 0.435% |
| $15 billion but less than $20 billion | 0.415% |
| $20 billion but less than $25 billion | 0.400% |
| $25 billion and over | 0.390% |
Eaton Vance
Floating-Rate & High Income Fund
October 31, 2023
Notes to Financial Statements — continued
For high yield bonds and other instruments that are not bank loan related, the fee is an aggregate of a daily asset-based fee and a daily income-based fee at the following rates:
| Total Daily Net Assets | Annual Asset
Rate | Daily Income
Rate |
| Up to $500 million | 0.300% | 3.000% |
| $500 million but less than $1 billion | 0.275% | 2.750% |
| $1 billion but less than $1.5 billion | 0.250% | 2.500% |
| $1.5 billion but less than $2 billion | 0.225% | 2.250% |
| $2 billion but less than $3 billion | 0.200% | 2.000% |
| $3 billion and over | 0.175% | 1.750% |
For the year ended October 31, 2023, the Fund incurred no investment adviser fee on such assets. To the extent the Fund’s assets are invested in the Portfolios, the Fund is allocated its share of the Portfolios’ investment adviser fees. The Portfolios have engaged Boston Management and Research (BMR), an affiliate of EVM, to render investment advisory services. See Note 2 of the Portfolios’ Notes to Financial Statements. For the year ended October 31, 2023, the Fund’s allocated portion of investment adviser fees paid by the Portfolios amounted to $5,826,427 or 0.50% of the Fund’s average daily net assets. The administration fee is earned by EVM as compensation for administrative services rendered to the Fund. The fee is computed at an annual rate of 0.15% of the Fund’s average daily net assets. For the year ended October 31, 2023, the administration fee amounted to $1,750,607.
The Portfolios may invest in a money market fund, the Institutional Class of the Morgan Stanley Institutional Liquidity Funds - Government Portfolio (the "Liquidity Fund"), an open-end management investment company managed by Morgan Stanley Investment Management Inc., a wholly-owned subsidiary of Morgan Stanley. The investment adviser fee paid by the Portfolios is reduced by an amount equal to their pro rata share of the advisory and administration fees paid by the Portfolios due to their investments in the Liquidity Fund. For the year ended October 31, 2023, the Fund’s allocated share of the reduction of the investment adviser fee paid by the Portfolios was $48,620 relating to the Portfolios’ investments in the Liquidity Fund.
EVM provides sub-transfer agency and related services to the Fund pursuant to a Sub-Transfer Agency Support Services Agreement. For the year ended October 31, 2023, EVM earned $125,896 from the Fund pursuant to such agreement, which is included in transfer and dividend disbursing agent fees on the Statement of Operations. The Fund was informed that Eaton Vance Distributors, Inc. (EVD), an affiliate of EVM and the Fund's principal underwriter, received $5,110 as its portion of the sales charge on sales of Class A shares for the year ended October 31, 2023. The Fund was informed that Morgan Stanley affiliated broker-dealers, which may be deemed to be affiliates of EVM, BMR and EVD, also received a portion of the sales charge on sales of Class A shares for the year ended October 31, 2023 in the amount of $309. EVD also received distribution and service fees from Class A and Class C shares (see Note 4) and contingent deferred sales charges (see Note 5).
Trustees and officers of the Fund who are members of EVM’s or BMR's organizations receive remuneration for their services to the Fund out of the investment adviser fee. Certain officers and Trustees of the Fund and the Portfolios are officers of the above organizations.
4 Distribution Plans
The Fund has in effect distribution plans for the Advisers Class shares and Class A shares (Advisers/Class A Plan) pursuant to Rule 12b-1 under the 1940 Act. Pursuant to the Advisers/Class A Plan, the Fund pays EVD a distribution and service fee of 0.25% per annum of its average daily net assets attributable to Advisers Class shares and Class A shares for distribution services and facilities provided to the Fund by EVD, as well as for personal services and/or the maintenance of shareholder accounts. Distribution and service fees paid or accrued to EVD for the year ended October 31, 2023 amounted to $103,679 for Advisers Class shares and $381,333 for Class A shares. The Fund also has in effect a distribution plan for Class C shares (Class C Plan) pursuant to Rule 12b-1 under the 1940 Act. Pursuant to the Class C Plan, the Fund pays EVD amounts equal to 0.75% per annum of its average daily net assets attributable to Class C shares for providing ongoing distribution services and facilities to the Fund. For the year ended October 31, 2023, the Fund paid or accrued to EVD $141,777 for Class C shares.
Pursuant to the Class C Plan, the Fund also makes payments of service fees to EVD, financial intermediaries and other persons in amounts equal to 0.25% per annum of its average daily net assets attributable to Class C shares. Service fees paid or accrued are for personal services and/or the maintenance of shareholder accounts. They are separate and distinct from the sales commissions and distribution fees payable to EVD. Service fees paid or accrued for the year ended October 31, 2023 amounted to $47,259 for Class C shares.
Distribution and service fees are subject to the limitations contained in the Financial Industry Regulatory Authority Rule 2341(d).
Eaton Vance
Floating-Rate & High Income Fund
October 31, 2023
Notes to Financial Statements — continued
5 Contingent Deferred Sales Charges
A contingent deferred sales charge (CDSC) of 1% generally is imposed on redemptions of Class C shares made within 12 months of purchase. Class A shares may be subject to a 0.75% CDSC if redeemed within 12 months of purchase (depending on the circumstances of purchase). Generally, the CDSC is based upon the lower of the net asset value at date of redemption or date of purchase. No charge is levied on shares acquired by reinvestment of dividends or capital gain distributions. For the year ended October 31, 2023, the Fund was informed that EVD received $2,271 and $1,877 of CDSCs paid by Class A and Class C shareholders, respectively.
6 Investment Transactions
For the year ended October 31, 2023, increases and decreases in the Fund's investments in the Portfolios were as follows:
| Portfolio | Contributions | Withdrawals |
| Eaton Vance Floating Rate Portfolio | $25,651,446 | $588,726,253 |
| High Income Opportunities Portfolio | 4,885,990 | 112,138,334 |
7 Shares of Beneficial Interest
The Fund’s Declaration of Trust permits the Trustees to issue an unlimited number of full and fractional shares of beneficial interest (without par value). Such shares may be issued in a number of different series (such as the Fund) and classes. Transactions in Fund shares, including direct exchanges pursuant to share class conversions, were as follows:
| | Year Ended
October 31, 2023 | | Year Ended
October 31, 2022 |
| | Shares | Amount | | Shares | Amount |
| Advisers Class | | | | | |
| Sales | 781,101 | $ 6,371,241 | | 861,467 | $ 7,333,346 |
| Issued to shareholders electing to receive payments of distributions in Fund shares | 377,850 | 3,081,066 | | 225,567 | 1,870,304 |
| Redemptions | (1,710,463) | (13,897,719) | | (1,136,776) | (9,513,243) |
| Net decrease | (551,512) | $ (4,445,412) | | (49,742) | $ (309,593) |
| Class A | | | | | |
| Sales | 2,841,220 | $ 24,588,771 | | 5,626,007 | $ 50,747,562 |
| Issued to shareholders electing to receive payments of distributions in Fund shares | 1,178,505 | 10,220,124 | | 754,617 | 6,655,370 |
| Redemptions | (10,791,599) | (93,453,248) | | (6,294,093) | (56,481,287) |
| Net increase (decrease) | (6,771,874) | $ (58,644,353) | | 86,531 | $ 921,645 |
| Class C | | | | | |
| Sales | 295,896 | $ 2,411,871 | | 545,540 | $ 4,647,106 |
| Issued to shareholders electing to receive payments of distributions in Fund shares | 145,386 | 1,182,941 | | 90,568 | 748,915 |
| Redemptions | (1,144,960) | (9,304,202) | | (871,319) | (7,277,832) |
| Net decrease | (703,678) | $ (5,709,390) | | (235,211) | $ (1,881,811) |
Eaton Vance
Floating-Rate & High Income Fund
October 31, 2023
Notes to Financial Statements — continued
| | Year Ended
October 31, 2023 | | Year Ended
October 31, 2022 |
| | Shares | Amount | | Shares | Amount |
| Class I | | | | | |
| Sales | 25,825,099 | $ 210,646,813 | | 104,576,939 | $ 890,758,907 |
| Issued to shareholders electing to receive payments of distributions in Fund shares | 8,135,594 | 66,333,136 | | 6,909,643 | 57,277,380 |
| Redemptions | (96,043,686) | (781,275,041) | | (93,980,289) | (776,940,053) |
| Net increase (decrease) | (62,082,993) | $(504,295,092) | | 17,506,293 | $ 171,096,234 |
| Class R6 | | | | | |
| Sales | 948,220 | $ 7,745,894 | | 3,056,181 | $ 26,069,554 |
| Issued to shareholders electing to receive payments of distributions in Fund shares | 289,289 | 2,359,388 | | 229,501 | 1,901,527 |
| Redemptions | (2,746,908) | (22,293,245) | | (2,330,840) | (19,459,077) |
| Net increase (decrease) | (1,509,399) | $ (12,187,963) | | 954,842 | $ 8,512,004 |
8 Fair Value Measurements
Under generally accepted accounting principles for fair value measurements, a three-tier hierarchy to prioritize the assumptions, referred to as inputs, is used in valuation techniques to measure fair value. The three-tier hierarchy of inputs is summarized in the three broad levels listed below.
| • | Level 1 – quoted prices in active markets for identical investments |
| • | Level 2 – other significant observable inputs (including quoted prices for similar investments, interest rates, prepayment speeds, credit risk, etc.) |
| • | Level 3 – significant unobservable inputs (including a fund's own assumptions in determining the fair value of investments) |
In cases where the inputs used to measure fair value fall in different levels of the fair value hierarchy, the level disclosed is determined based on the lowest level input that is significant to the fair value measurement in its entirety. The inputs or methodology used for valuing securities are not necessarily an indication of the risk associated with investing in those securities.
At October 31, 2023 and October 31, 2022, the Fund's investment in High Income Opportunities Portfolio, whose financial statements are not included but are available elsewhere as discussed in Note 1, and in Eaton Vance Floating Rate Portfolio were valued based on Level 1 inputs.
Eaton Vance
Floating-Rate & High Income Fund
October 31, 2023
Report of Independent Registered Public Accounting Firm
To the Trustees of Eaton Vance Mutual Funds Trust and Shareholders of Eaton Vance Floating-Rate & High Income Fund:
Opinion on the Financial Statements and Financial Highlights
We have audited the accompanying statement of assets and liabilities of Eaton Vance Floating-Rate & High Income Fund (the “Fund") (one of the funds constituting Eaton Vance Mutual Funds Trust), as of October 31, 2023, the related statement of operations for the year then ended, the statements of changes in net assets for each of the two years in the period then ended, the financial highlights for each of the five years in the period then ended, and the related notes. In our opinion, the financial statements and financial highlights present fairly, in all material respects, the financial position of the Fund as of October 31, 2023, and the results of its operations for the year then ended, the changes in its net assets for each of the two years in the period then ended, and the financial highlights for each of the five years in the period then ended, in conformity with accounting principles generally accepted in the United States of America.
Basis for Opinion
These financial statements and financial highlights are the responsibility of the Fund's management. Our responsibility is to express an opinion on the Fund's financial statements and financial highlights based on our audits. We are a public accounting firm registered with the Public Company Accounting Oversight Board (United States) (PCAOB) and are required to be independent with respect to the Fund in accordance with the U.S. federal securities laws and the applicable rules and regulations of the Securities and Exchange Commission and the PCAOB.
We conducted our audits in accordance with the standards of the PCAOB. Those standards require that we plan and perform the audit to obtain reasonable assurance about whether the financial statements and financial highlights are free of material misstatement, whether due to error or fraud. The Fund is not required to have, nor were we engaged to perform, an audit of its internal control over financial reporting. As part of our audits, we are required to obtain an understanding of internal control over financial reporting but not for the purpose of expressing an opinion on the effectiveness of the Fund’s internal control over financial reporting. Accordingly, we express no such opinion.
Our audits included performing procedures to assess the risks of material misstatement of the financial statements and financial highlights, whether due to error or fraud, and performing procedures that respond to those risks. Such procedures included examining, on a test basis, evidence regarding the amounts and disclosures in the financial statements and financial highlights. Our audits also included evaluating the accounting principles used and significant estimates made by management, as well as evaluating the overall presentation of the financial statements and financial highlights. We believe that our audits provide a reasonable basis for our opinion.
/s/ Deloitte & Touche LLP
Boston, Massachusetts
December 22, 2023
We have served as the auditor of one or more Eaton Vance investment companies since 1959.
Eaton Vance
Floating-Rate & High Income Fund
October 31, 2023
Federal Tax Information (Unaudited)
The Form 1099-DIV you receive in February 2024 will show the tax status of all distributions paid to your account in calendar year 2023. Shareholders are advised to consult their own tax adviser with respect to the tax consequences of their investment in the Fund. As required by the Internal Revenue Code and/or regulations, shareholders must be notified regarding the status of qualified dividend income for individuals and 163(j) interest dividends.
Qualified Dividend Income. For the fiscal year ended October 31, 2023, the Fund designates approximately $75,964, or up to the maximum amount of such dividends allowable pursuant to the Internal Revenue Code, as qualified dividend income eligible for the reduced tax rate of 15%.
163(j) Interest Dividends. For the fiscal year ended October 31, 2023, the Fund designates 97.10% of distributions from net investment income as a 163(j) interest dividend.
Eaton Vance
Floating Rate Portfolio
October 31, 2023
| Asset-Backed Securities — 4.7% |
| Security | Principal
Amount
(000's omitted) | Value |
| Alinea CLO, Ltd.: | | | |
| Series 2018-1A, Class D, 8.777%, (3 mo. SOFR + 3.362%), 7/20/31(1)(2) | $ | 2,500 | $ 2,403,450 |
| Series 2018-1A, Class E, 11.677%, (3 mo. SOFR + 6.262%), 7/20/31(1)(2) | | 3,000 | 2,621,361 |
| AMMC CLO 15, Ltd., Series 2014-15A, Class ERR, 12.566%, (3 mo. SOFR + 7.172%), 1/15/32(1)(2) | | 4,000 | 3,515,388 |
| AMMC CLO XII, Ltd., Series 2013-12A, Class ER, 11.807%, (3 mo. SOFR + 6.442%), 11/10/30(1)(2) | | 3,525 | 3,009,589 |
| Apidos CLO XX, Series 2015-20A, Class DR, 11.356%, (3 mo. SOFR + 5.962%), 7/16/31(1)(2) | | 2,375 | 2,135,332 |
| Ares Loan Funding II, Ltd., Series 2022-ALF2A, Class ER, 13.656%, (3 mo. SOFR + 8.24%), 10/20/36(1)(2) | | 1,325 | 1,298,898 |
| Ares LVlll CLO, Ltd., Series 2020-58A, Class ER, 12.094%, (3 mo. SOFR + 6.70%), 1/15/35(1)(2) | | 3,000 | 2,733,831 |
| Ares XLIX CLO, Ltd., Series 2018-49A, Class D, 8.674%, (3 mo. SOFR + 3.262%), 7/22/30(1)(2) | | 2,500 | 2,395,640 |
| Ares XXXIIR CLO, Ltd., Series 2014-32RA, Class C, 8.526%, (3 mo. SOFR + 3.162%), 5/15/30(1)(2) | | 5,000 | 4,754,640 |
| Ares XXXVR CLO, Ltd., Series 2015-35RA, Class E, 11.356%, (3 mo. SOFR + 5.962%), 7/15/30(1)(2) | | 4,000 | 3,552,104 |
| Babson CLO, Ltd.: | | | |
| Series 2015-1A, Class DR, 8.277%, (3 mo. SOFR + 2.862%), 1/20/31(1)(2) | | 2,500 | 2,362,727 |
| Series 2018-1A, Class C, 8.256%, (3 mo. SOFR + 2.862%), 4/15/31(1)(2) | | 3,500 | 3,276,546 |
| Bain Capital Credit CLO, Ltd.: | | | |
| Series 2018-1A, Class D, 8.374%, (3 mo. SOFR + 2.962%), 4/23/31(1)(2) | | 5,000 | 4,651,770 |
| Series 2018-1A, Class E, 11.024%, (3 mo. SOFR + 5.612%), 4/23/31(1)(2) | | 3,000 | 2,511,483 |
| Battalion CLO XXII, Ltd., Series 2021-22A, Class E, 12.627%, (3 mo. SOFR + 7.212%), 1/20/35(1)(2) | | 1,750 | 1,482,668 |
| Battalion CLO XXIII, Ltd., Series 2022-23A, Class D, 9.344%, (3 mo. SOFR + 3.95%), 5/19/36(1)(2) | | 3,500 | 3,230,965 |
| Benefit Street Partners CLO V-B, Ltd., Series 2018-5BA, Class D, 11.627%, (3 mo. SOFR + 6.212%), 4/20/31(1)(2) | | 3,500 | 3,250,653 |
| Benefit Street Partners CLO VIII, Ltd., Series 2015-8A, Class DR, 11.277%, (3 mo. SOFR + 5.862%), 1/20/31(1)(2) | | 5,401 | 4,544,758 |
| Benefit Street Partners CLO XIV, Ltd., Series 2018-14A, Class D, 8.277%, (3 mo. SOFR + 2.862%), 4/20/31(1)(2) | | 1,500 | 1,419,594 |
| Benefit Street Partners CLO XVI, Ltd., Series 2018-16A, Class E, 12.364%, (3 mo. SOFR + 6.962%), 1/17/32(1)(2) | | 2,250 | 2,108,072 |
| Security | Principal
Amount
(000's omitted) | Value |
| Benefit Street Partners CLO XVII, Ltd., Series 2019-17A, Class ER, 12.006%, (3 mo. SOFR + 6.612%), 7/15/32(1)(2) | $ | 1,750 | $ 1,677,869 |
| Benefit Street Partners CLO XXII, Ltd., Series 2020-22A, Class ER, 12.346%, (3 mo. SOFR + 6.93%), 4/20/35(1)(2) | | 1,000 | 930,082 |
| Benefit Street Partners CLO XXV, Ltd., Series 2021-25A, Class E, 12.506%, (3 mo. SOFR + 7.112%), 1/15/35(1)(2) | | 3,000 | 2,845,206 |
| Betony CLO 2, Ltd.: | | | |
| Series 2018-1A, Class C, 8.552%, (3 mo. SOFR + 3.162%), 4/30/31(1)(2) | | 2,500 | 2,387,102 |
| Series 2018-1A, Class D, 11.302%, (3 mo. SOFR + 5.912%), 4/30/31(1)(2) | | 2,475 | 2,178,101 |
| BlueMountain CLO XXIV, Ltd., Series 2019-24A, Class ER, 12.517%, (3 mo. SOFR + 7.102%), 4/20/34(1)(2) | | 1,000 | 880,092 |
| BlueMountain CLO XXVI, Ltd., Series 2019-26A, Class ER, 12.807%, (3 mo. SOFR + 7.392%), 10/20/34(1)(2) | | 3,000 | 2,781,324 |
| BlueMountain CLO XXX, Ltd., Series 2020-30A, Class ER, 12.094%, (3 mo. SOFR + 6.70%), 4/15/35(1)(2) | | 2,000 | 1,779,092 |
| BlueMountain CLO XXXIII, Ltd., Series 2021-33A, Class E, 12.471%, (3 mo. SOFR + 7.092%), 11/20/34(1)(2) | | 2,500 | 2,322,227 |
| BlueMountain CLO XXXV, Ltd., Series 2022-35A, Class E, 13.162%, (3 mo. SOFR + 7.75%), 7/22/35(1)(2) | | 2,000 | 1,884,938 |
| BlueMountain CLO, Ltd.: | | | |
| Series 2016-3A, Class DR, 8.726%, (3 mo. SOFR + 3.362%), 11/15/30(1)(2) | | 1,500 | 1,375,377 |
| Series 2016-3A, Class ER, 11.576%, (3 mo. SOFR + 6.212%), 11/15/30(1)(2) | | 1,500 | 1,224,608 |
| Series 2018-1A, Class D, 8.702%, (3 mo. SOFR + 3.312%), 7/30/30(1)(2) | | 2,500 | 2,266,958 |
| Series 2018-1A, Class E, 11.602%, (3 mo. SOFR + 6.212%), 7/30/30(1)(2) | | 2,000 | 1,534,322 |
| Bryant Park Funding, Ltd.: | | | |
| Series 2023-20A, Class D, 11.449%, (3 mo. SOFR + 6.09%), 7/15/36(1)(2) | | 3,500 | 3,410,771 |
| Series 2023-21A, Class D, 10.935%, (3 mo. SOFR + 5.45%), 10/18/36(1)(2) | | 3,525 | 3,501,841 |
| Canyon Capital CLO, Ltd.: | | | |
| Series 2012-1RA, Class E, 11.356%, (3 mo. SOFR + 5.962%), 7/15/30(1)(2) | | 4,875 | 4,244,814 |
| Series 2016-1A, Class ER, 11.406%, (3 mo. SOFR + 6.012%), 7/15/31(1)(2) | | 4,000 | 3,392,436 |
| Series 2016-2A, Class ER, 11.656%, (3 mo. SOFR + 6.262%), 10/15/31(1)(2) | | 4,500 | 3,826,125 |
| Series 2017-1A, Class E, 11.906%, (3 mo. SOFR + 6.512%), 7/15/30(1)(2) | | 3,250 | 2,877,287 |
23
See Notes to Financial Statements.
Eaton Vance
Floating Rate Portfolio
October 31, 2023
Portfolio of Investments — continued
| Security | Principal
Amount
(000's omitted) | Value |
| Canyon Capital CLO, Ltd.: (continued) | | | |
| Series 2018-1A, Class D, 8.556%, (3 mo. SOFR + 3.162%), 7/15/31(1)(2) | $ | 3,000 | $ 2,848,887 |
| Series 2018-1A, Class E, 11.406%, (3 mo. SOFR + 6.012%), 7/15/31(1)(2) | | 2,750 | 2,345,882 |
| Series 2019-2A, Class ER, 12.406%, (3 mo. SOFR + 7.011%), 10/15/34(1)(2) | | 1,500 | 1,360,722 |
| Carlyle CLO C17, Ltd.: | | | |
| Series C17A, Class CR, 8.452%, (3 mo. SOFR + 3.062%), 4/30/31(1)(2) | | 5,000 | 4,680,700 |
| Series C17A, Class DR, 11.652%, (3 mo. SOFR + 6.262%), 4/30/31(1)(2) | | 3,500 | 2,841,314 |
| Carlyle Global Market Strategies CLO, Ltd.: | | | |
| Series 2012-3A, Class CR2, 9.156%, (3 mo. SOFR + 3.762%), 1/14/32(1)(2) | | 2,500 | 2,408,155 |
| Series 2012-3A, Class DR2, 12.156%, (3 mo. SOFR + 6.761%), 1/14/32(1)(2) | | 1,500 | 1,251,521 |
| Series 2014-3RA, Class C, 8.599%, (3 mo. SOFR + 3.212%), 7/27/31(1)(2) | | 1,000 | 924,119 |
| Series 2014-3RA, Class D, 11.049%, (3 mo. SOFR + 5.662%), 7/27/31(1)(2) | | 2,150 | 1,877,116 |
| Series 2014-4RA, Class C, 8.556%, (3 mo. SOFR + 3.162%), 7/15/30(1)(2) | | 2,000 | 1,848,728 |
| Series 2014-4RA, Class D, 11.306%, (3 mo. SOFR + 5.912%), 7/15/30(1)(2) | | 1,500 | 1,206,492 |
| Carlyle US CLO, Ltd.: | | | |
| Series 2019-4A, Class DR, 11.994%, (3 mo. SOFR + 6.60%), 4/15/35(1)(2) | | 3,000 | 2,658,969 |
| Series 2022-6A, Class DR, 10.13%, (3 mo. SOFR + 4.75%), 10/25/36(1)(2) | | 2,200 | 2,207,482 |
| CarVal CLO IV, Ltd., Series 2021-1A, Class E, 12.277%, (3 mo. SOFR + 6.862%), 7/20/34(1)(2) | | 1,000 | 975,659 |
| CIFC Funding, Ltd., Series 2022-4A, Class D, 8.944%, (3 mo. SOFR + 3.55%), 7/16/35(1)(2) | | 1,750 | 1,725,726 |
| Dryden CLO, Ltd.: | | | |
| Series 2018-55A, Class D, 8.506%, (3 mo. SOFR + 3.112%), 4/15/31(1)(2) | | 1,500 | 1,399,137 |
| Series 2018-55A, Class E, 11.056%, (3 mo. SOFR + 5.662%), 4/15/31(1)(2) | | 2,000 | 1,749,672 |
| Series 2022-112A, Class E, 13.145%, (3 mo. SOFR + 7.78%), 8/15/34(1)(2) | | 2,000 | 1,973,216 |
| Dryden Senior Loan Fund: | | | |
| Series 2015-41A, Class DR, 8.256%, (3 mo. SOFR + 2.862%), 4/15/31(1)(2) | | 5,000 | 4,641,865 |
| Series 2015-41A, Class ER, 10.956%, (3 mo. SOFR + 5.562%), 4/15/31(1)(2) | | 1,268 | 989,947 |
| Series 2016-42A, Class DR, 8.586%, (3 mo. SOFR + 3.192%), 7/15/30(1)(2) | | 2,500 | 2,348,357 |
| Series 2016-42A, Class ER, 11.206%, (3 mo. SOFR + 5.812%), 7/15/30(1)(2) | | 3,500 | 2,953,135 |
| Elmwood CLO 14, Ltd., Series 2022-1A, Class E, 11.766%, (3 mo. SOFR + 6.35%), 4/20/35(1)(2) | | 1,950 | 1,875,321 |
| Elmwood CLO 17, Ltd., Series 2022-4A, Class E, 12.553%, (3 mo. SOFR + 7.15%), 7/17/35(1)(2) | | 2,250 | 2,229,032 |
| Security | Principal
Amount
(000's omitted) | Value |
| Galaxy XXV CLO, Ltd.: | | | |
| Series 2018-25A, Class D, 8.74%, (3 mo. SOFR + 3.362%), 10/25/31(1)(2) | $ | 2,500 | $ 2,438,492 |
| Series 2018-25A, Class E, 11.59%, (3 mo. SOFR + 6.211%), 10/25/31(1)(2) | | 3,500 | 3,098,378 |
| Golub Capital Partners CLO 22B, Ltd., Series 2015-22A, Class ER, 11.677%, (3 mo. SOFR + 6.262%), 1/20/31(1)(2) | | 2,500 | 2,340,557 |
| Golub Capital Partners CLO 37B, Ltd.: | | | |
| Series 2018-37A, Class D, 8.977%, (3 mo. SOFR + 3.562%), 7/20/30(1)(2) | | 4,000 | 3,709,444 |
| Series 2018-37A, Class E, 11.427%, (3 mo. SOFR + 6.012%), 7/20/30(1)(2) | | 4,750 | 4,695,978 |
| Golub Capital Partners CLO 53B, Ltd., Series 2021-53A, Class E, 12.377%, (3 mo. SOFR + 6.962%), 7/20/34(1)(2) | | 1,250 | 1,141,728 |
| Golub Capital Partners CLO 58B, Ltd., Series 2021-58A, Class E, 12.45%, (3 mo. SOFR + 7.072%), 1/25/35(1)(2) | | 2,500 | 2,306,540 |
| Halseypoint CLO 5, Ltd., Series 2021-5A, Class E, 12.592%, (3 mo. SOFR + 7.202%), 1/30/35(1)(2) | | 2,000 | 1,821,042 |
| Harriman Park CLO, Ltd., Series 2020-1A, Class ER, 12.077%, (3 mo. SOFR + 6.662%), 4/20/34(1)(2) | | 1,000 | 929,261 |
| ICG US CLO, Ltd.: | | | |
| Series 2018-2A, Class D, 8.774%, (3 mo. SOFR + 3.362%), 7/22/31(1)(2) | | 2,000 | 1,844,714 |
| Series 2018-2A, Class E, 11.424%, (3 mo. SOFR + 6.012%), 7/22/31(1)(2) | | 3,000 | 2,468,892 |
| Madison Park Funding LIX, Ltd., Series 2021-59A, Class E, 12.257%, (3 mo. SOFR + 6.862%), 1/18/34(1)(2) | | 1,450 | 1,354,316 |
| Madison Park Funding XXV, Ltd., Series 2017-25A, Class D, 11.74%, (3 mo. SOFR + 6.362%), 4/25/29(1)(2) | | 1,500 | 1,399,364 |
| Madison Park Funding XXXVI, Ltd., Series 2019-36A, Class ER, 12.444%, (3 mo. SOFR + 7.05%), 4/15/35(1)(2) | | 2,500 | 2,464,607 |
| Marble Point CLO XXIV, Ltd., Series 2022-1A, Class D1, 9.656%, (3 mo. SOFR + 4.24%), 4/20/35(1)(2) | | 2,000 | 1,948,968 |
| Neuberger Berman CLO XXII, Ltd.: | | | |
| Series 2016-22A, Class DR, 8.764%, (3 mo. SOFR + 3.362%), 10/17/30(1)(2) | | 2,500 | 2,405,505 |
| Series 2016-22A, Class ER, 11.724%, (3 mo. SOFR + 6.322%), 10/17/30(1)(2) | | 3,000 | 2,729,217 |
| Neuberger Berman Loan Advisers CLO 28, Ltd., Series 2018-28A, Class E, 11.277%, (3 mo. SOFR + 5.862%), 4/20/30(1)(2) | | 1,950 | 1,712,176 |
| Neuberger Berman Loan Advisers CLO 30, Ltd., Series 2018-30A, Class ER, 11.877%, (3 mo. SOFR + 6.462%), 1/20/31(1)(2) | | 1,000 | 944,940 |
24
See Notes to Financial Statements.
Eaton Vance
Floating Rate Portfolio
October 31, 2023
Portfolio of Investments — continued
| Security | Principal
Amount
(000's omitted) | Value |
| Neuberger Berman Loan Advisers CLO 48, Ltd., Series 2022-48A, Class E, 11.878%, (3 mo. SOFR + 6.50%), 4/25/36(1)(2) | $ | 3,200 | $ 3,044,691 |
| OCP CLO, Ltd.: | | | |
| Series 2022-24A, Class D, 9.216%, (3 mo. SOFR + 3.80%), 7/20/35(1)(2) | | 500 | 472,812 |
| Series 2022-24A, Class E, 12.836%, (3 mo. SOFR + 7.42%), 7/20/35(1)(2) | | 1,000 | 966,488 |
| Palmer Square CLO, Ltd.: | | | |
| Series 2013-2A, Class DRR, 11.514%, (3 mo. SOFR + 6.111%), 10/17/31(1)(2) | | 1,325 | 1,241,293 |
| Series 2015-1A, Class DR4, 12.141%, (3 mo. SOFR + 6.762%), 5/21/34(1)(2) | | 2,000 | 1,847,830 |
| Series 2018-1A, Class D, 10.807%, (3 mo. SOFR + 5.412%), 4/18/31(1)(2) | | 2,000 | 1,881,298 |
| Series 2018-2A, Class D, 11.256%, (3 mo. SOFR + 5.862%), 7/16/31(1)(2) | | 2,000 | 1,928,870 |
| Series 2021-2A, Class E, 12.006%, (3 mo. SOFR + 6.612%), 7/15/34(1)(2) | | 1,000 | 962,846 |
| Series 2022-1A, Class E, 11.766%, (3 mo. SOFR + 6.35%), 4/20/35(1)(2) | | 2,000 | 1,929,592 |
| RAD CLO 5, Ltd., Series 2019-5A, Class E, 12.36%, (3 mo. SOFR + 6.962%), 7/24/32(1)(2) | | 1,250 | 1,169,161 |
| RAD CLO 14, Ltd., Series 2021-14A, Class E, 12.156%, (3 mo. SOFR + 6.762%), 1/15/35(1)(2) | | 950 | 890,045 |
| Regatta XIII Funding, Ltd.: | | | |
| Series 2018-2A, Class C, 8.756%, (3 mo. SOFR + 3.362%), 7/15/31(1)(2) | | 2,500 | 2,432,925 |
| Series 2018-2A, Class D, 11.606%, (3 mo. SOFR + 6.212%), 7/15/31(1)(2) | | 5,000 | 4,067,035 |
| Regatta XIV Funding, Ltd.: | | | |
| Series 2018-3A, Class D, 8.84%, (3 mo. SOFR + 3.462%), 10/25/31(1)(2) | | 2,500 | 2,442,735 |
| Series 2018-3A, Class E, 11.59%, (3 mo. SOFR + 6.211%), 10/25/31(1)(2) | | 2,000 | 1,801,678 |
| Regatta XV Funding, Ltd., Series 2018-4A, Class D, 12.14%, (3 mo. SOFR + 6.762%), 10/25/31(1)(2) | | 2,875 | 2,543,044 |
| Symphony CLO, Ltd., Series 2022-37A, Class D1, 10.846%, (3 mo. SOFR + 5.43%), 10/20/34(1)(2) | | 2,500 | 2,518,007 |
| Upland CLO, Ltd.: | | | |
| Series 2016-1A, Class CR, 8.577%, (3 mo. SOFR + 3.162%), 4/20/31(1)(2) | | 4,500 | 4,239,504 |
| Series 2016-1A, Class DR, 11.577%, (3 mo. SOFR + 6.162%), 4/20/31(1)(2) | | 2,125 | 1,920,182 |
| Vibrant CLO IX, Ltd.: | | | |
| Series 2018-9A, Class C, 8.877%, (3 mo. SOFR + 3.462%), 7/20/31(1)(2) | | 2,500 | 2,231,463 |
| Series 2018-9A, Class D, 11.927%, (3 mo. SOFR + 6.512%), 7/20/31(1)(2) | | 3,500 | 2,432,773 |
| Vibrant CLO X, Ltd.: | | | |
| Series 2018-10A, Class C, 8.927%, (3 mo. SOFR + 3.512%), 10/20/31(1)(2) | | 5,000 | 4,605,920 |
| Security | Principal
Amount
(000's omitted) | Value |
| Vibrant CLO X, Ltd.: (continued) | | | |
| Series 2018-10A, Class D, 11.867%, (3 mo. SOFR + 6.452%), 10/20/31(1)(2) | $ | 5,000 | $ 3,719,755 |
| Voya CLO, Ltd.: | | | |
| Series 2015-3A, Class CR, 8.827%, (3 mo. SOFR + 3.412%), 10/20/31(1)(2) | | 2,500 | 2,177,888 |
| Series 2015-3A, Class DR, 11.877%, (3 mo. SOFR + 6.462%), 10/20/31(1)(2) | | 5,500 | 4,405,318 |
| Series 2016-3A, Class CR, 8.907%, (3 mo. SOFR + 3.512%), 10/18/31(1)(2) | | 2,000 | 1,813,576 |
| Series 2016-3A, Class DR, 11.737%, (3 mo. SOFR + 6.342%), 10/18/31(1)(2) | | 2,375 | 1,880,140 |
| Series 2018-2A, Class E, 10.906%, (3 mo. SOFR + 5.512%), 7/15/31(1)(2) | | 2,500 | 2,129,953 |
| Webster Park CLO, Ltd.: | | | |
| Series 2015-1A, Class CR, 8.577%, (3 mo. SOFR + 3.162%), 7/20/30(1)(2) | | 2,000 | 1,925,990 |
| Series 2015-1A, Class DR, 11.177%, (3 mo. SOFR + 5.762%), 7/20/30(1)(2) | | 2,500 | 2,130,353 |
| Wellfleet CLO, Ltd.: | | | |
| Series 2021-1A, Class D, 9.177%, (3 mo. SOFR + 3.762%), 4/20/34(1)(2) | | 1,200 | 1,078,579 |
| Series 2021-3A, Class E, 12.756%, (3 mo. SOFR + 7.362%), 1/15/35(1)(2) | | 950 | 800,259 |
| Series 2022-1A, Class D, 9.534%, (3 mo. SOFR + 4.14%), 4/15/34(1)(2) | | 1,000 | 945,569 |
| Series 2022-1A, Class E, 13.254%, (3 mo. SOFR + 7.86%), 4/15/34(1)(2) | | 2,000 | 1,852,368 |
Total Asset-Backed Securities
(identified cost $297,460,747) | | | $ 270,085,254 |
| Security | Shares | Value |
| Aerospace and Defense — 0.0% |
| IAP Global Services, LLC(3)(4)(5)(6) | | 950 | $ 0 |
| IAP Global Services, LLC(3)(4)(5) | | 1,627 | 0 |
| | | | $ 0 |
| Chemicals — 0.0% |
| Flint Campfire Topco, Ltd., Class A(4)(5)(6) | | 3,812,783 | $ 0 |
| | | | $ 0 |
| Commercial Services & Supplies — 0.1% |
| Monitronics International, Inc.(5)(6) | | 223,950 | $ 4,702,950 |
| Phoenix Services International, LLC(5)(6) | | 168,954 | 1,605,063 |
| Phoenix Services International, LLC(5)(6) | | 15,415 | 146,442 |
| | | | $ 6,454,455 |
25
See Notes to Financial Statements.
Eaton Vance
Floating Rate Portfolio
October 31, 2023
Portfolio of Investments — continued
| Security | Shares | Value |
| Containers and Glass Products — 0.0%(7) |
| LG Newco Holdco, Inc.(5)(6) | | 250,979 | $ 1,443,129 |
| | | | $ 1,443,129 |
| Electronics/Electrical — 0.0%(7) |
| Skillsoft Corp.(5)(6) | | 44,676 | $ 839,909 |
| | | | $ 839,909 |
| Entertainment — 0.1% |
| New Cineworld, Ltd.(5)(6) | | 80,602 | $ 1,722,868 |
| | | | $ 1,722,868 |
| Health Care — 0.0% |
| Akorn Holding Company, LLC(4)(5)(6) | | 705,631 | $ 0 |
| | | | $ 0 |
| Household Durables — 0.3% |
| Serta Simmons Bedding, Inc.(5)(6) | | 1,348,933 | $ 18,885,062 |
| Serta SSB Equipment Co.(4)(5)(6) | | 1,348,933 | 0 |
| | | | $ 18,885,062 |
| Investment Companies — 0.0%(7) |
| Aegletes B.V.(5)(6) | | 116,244 | $ 280,439 |
| Jubilee Topco, Ltd., Class A(4)(5)(6) | | 2,897,167 | 0 |
| | | | $ 280,439 |
| Nonferrous Metals/Minerals — 0.1% |
| ACNR Holdings, Inc., Class A(5)(6) | | 36,829 | $ 3,148,879 |
| | | | $ 3,148,879 |
| Oil and Gas — 0.0%(7) |
| AFG Holdings, Inc.(4)(5)(6) | | 498,342 | $ 986,717 |
| McDermott International, Ltd.(5)(6) | | 1,013,850 | 273,740 |
| | | | $ 1,260,457 |
| Pharmaceuticals — 0.0%(7) |
| Covis Midco 1 S.a.r.l., Class A(5)(6) | | 8,008 | $ 4,084 |
| Covis Midco 1 S.a.r.l., Class B(5)(6) | | 8,008 | 4,084 |
| Covis Midco 1 S.a.r.l., Class C(5)(6) | | 8,008 | 4,084 |
| Covis Midco 1 S.a.r.l., Class D(5)(6) | | 8,008 | 4,084 |
| Covis Midco 1 S.a.r.l., Class E(5)(6) | | 8,008 | 4,084 |
| | | | $ 20,420 |
| Retailers (Except Food and Drug) — 0.0%(7) |
| Phillips Pet Holding Corp.(4)(5)(6) | | 2,590 | $ 102,897 |
| | | | $ 102,897 |
| Security | Shares | Value |
| Telecommunications — 0.0% |
| Global Eagle Entertainment(4)(5)(6) | | 364,650 | $ 0 |
| | | | $ 0 |
| Utilities — 0.0%(7) |
| Longview Intermediate Holdings, LLC, Class A(6) | | 149,459 | $ 1,206,134 |
| | | | $ 1,206,134 |
Total Common Stocks
(identified cost $80,724,650) | | | $ 35,364,649 |
| Security | Principal
Amount*
(000's omitted) | Value |
| Aerospace and Defense — 0.4% |
| TransDigm, Inc.: | | | |
| 6.25%, 3/15/26(1) | | 1,500 | $ 1,466,857 |
| 6.75%, 8/15/28(1) | | 3,175 | 3,086,841 |
| 6.875%, 12/15/30(1) | | 19,500 | 18,847,335 |
| | | | $ 23,401,033 |
| Air Transport — 0.6% |
| American Airlines, Inc./AAdvantage Loyalty IP, Ltd.: | | | |
| 5.50%, 4/20/26(1) | | 14,313 | $ 13,932,268 |
| 5.75%, 4/20/29(1) | | 12,875 | 11,626,509 |
| United Airlines, Inc.: | | | |
| 4.375%, 4/15/26(1) | | 4,625 | 4,294,819 |
| 4.625%, 4/15/29(1) | | 4,625 | 3,910,915 |
| | | | $ 33,764,511 |
| Automotive — 0.1% |
| Adient Global Holdings, Ltd., 7.00%, 4/15/28(1) | | 2,175 | $ 2,143,235 |
| Clarios Global, L.P., 6.75%, 5/15/25(1) | | 1,890 | 1,876,813 |
| Clarios Global, L.P./Clarios US Finance Co., 6.25%, 5/15/26(1) | | 3,893 | 3,809,775 |
| | | | $ 7,829,823 |
| Building and Development — 0.1% |
| Cushman & Wakefield U.S. Borrower, LLC, 6.75%, 5/15/28(1) | | 7,018 | $ 6,406,346 |
| Winnebago Industries, Inc., 6.25%, 7/15/28(1) | | 900 | 847,274 |
| | | | $ 7,253,620 |
26
See Notes to Financial Statements.
Eaton Vance
Floating Rate Portfolio
October 31, 2023
Portfolio of Investments — continued
| Security | Principal
Amount*
(000's omitted) | Value |
| Business Equipment and Services — 0.8% |
| Allied Universal Holdco, LLC/Allied Universal Finance Corp., 6.625%, 7/15/26(1) | | 2,075 | $ 1,944,949 |
| Allied Universal Holdco, LLC/Allied Universal Finance Corp./Atlas Luxco 4 S.a.r.l.: | | | |
| 4.625%, 6/1/28(1) | | 12,475 | 10,177,694 |
| 4.625%, 6/1/28(1) | | 23,725 | 19,429,703 |
| Prime Security Services Borrower, LLC/Prime Finance, Inc., 5.75%, 4/15/26(1) | | 15,225 | 14,784,812 |
| | | | $ 46,337,158 |
| Chemicals — 0.4% |
| Cheever Escrow Issuer, LLC, 7.125%, 10/1/27(1) | | 925 | $ 852,570 |
| INEOS Finance PLC, 3.375%, 3/31/26(1) | EUR | 1,250 | 1,253,188 |
| INEOS Quattro Finance 2 PLC, 3.375%, 1/15/26(1) | | 3,050 | 2,916,014 |
| Olympus Water US Holding Corp.: | | | |
| 4.25%, 10/1/28(1) | | 9,350 | 7,470,369 |
| 9.75%, 11/15/28(1) | | 8,600 | 8,410,378 |
| | | | $ 20,902,519 |
| Commercial Services — 0.2% |
| Neptune Bidco U.S., Inc., 9.29%, 4/15/29(1) | | 15,300 | $ 13,517,376 |
| | | | $ 13,517,376 |
| Containers & Packaging — 0.2% |
| Pactiv Evergreen Group Issuer, Inc./Pactiv Evergreen Group Issuer, LLC: | | | |
| 4.00%, 10/15/27(1) | | 5,150 | $ 4,499,291 |
| 4.375%, 10/15/28(1) | | 9,125 | 7,772,883 |
| | | | $ 12,272,174 |
| Diversified Financial Services — 0.3% |
| AG Issuer, LLC, 6.25%, 3/1/28(1) | | 8,075 | $ 7,447,716 |
| AG TTMT Escrow Issuer, LLC, 8.625%, 9/30/27(1) | | 2,925 | 2,941,439 |
| Aretec Escrow Issuer 2, Inc., 10.00%, 8/15/30(1)(8) | | 4,225 | 4,277,812 |
| | | | $ 14,666,967 |
| Diversified Telecommunication Services — 0.9% |
| Altice France S.A.: | | | |
| 5.125%, 1/15/29(1) | | 1,300 | $ 898,591 |
| 5.125%, 7/15/29(1) | | 42,825 | 29,349,960 |
| 5.50%, 10/15/29(1) | | 6,455 | 4,445,207 |
| Level 3 Financing, Inc., 3.875%, 11/15/29(1) | | 11,225 | 10,012,671 |
| Virgin Media Secured Finance PLC, 4.50%, 8/15/30(1) | | 6,500 | 5,367,635 |
| | | | $ 50,074,064 |
| Security | Principal
Amount*
(000's omitted) | Value |
| Drugs — 0.1% |
| Jazz Securities DAC, 4.375%, 1/15/29(1) | | 9,150 | $ 7,965,382 |
| | | | $ 7,965,382 |
| Ecological Services and Equipment — 0.1% |
| GFL Environmental, Inc., 4.25%, 6/1/25(1) | | 5,300 | $ 5,100,552 |
| | | | $ 5,100,552 |
| Electronics/Electrical — 0.4% |
| GoTo Group, Inc., 5.50%, 9/1/27(1) | | 10,760 | $ 5,623,288 |
| Imola Merger Corp., 4.75%, 5/15/29(1) | | 18,175 | 15,860,561 |
| | | | $ 21,483,849 |
| Entertainment — 0.1% |
| Live Nation Entertainment, Inc., 3.75%, 1/15/28(1) | | 2,075 | $ 1,818,737 |
| Six Flags Theme Parks, Inc., 7.00%, 7/1/25(1) | | 1,070 | 1,063,634 |
| | | | $ 2,882,371 |
| Health Care — 0.6% |
| Medline Borrower, L.P., 3.875%, 4/1/29(1) | | 22,800 | $ 19,272,855 |
| Tenet Healthcare Corp., 4.25%, 6/1/29 | | 15,950 | 13,666,951 |
| | | | $ 32,939,806 |
| Hotels, Restaurants & Leisure — 0.6% |
| Carnival Corp., 4.00%, 8/1/28(1) | | 34,575 | $ 30,102,544 |
| SeaWorld Parks & Entertainment, Inc., 8.75%, 5/1/25(1) | | 2,125 | 2,155,781 |
| | | | $ 32,258,325 |
| Household Products — 0.2% |
| Kronos Acquisition Holdings, Inc./KIK Custom Products, Inc., 5.00%, 12/31/26(1) | | 14,212 | $ 12,869,817 |
| | | | $ 12,869,817 |
| Insurance — 0.3% |
| Alliant Holdings Intermediate, LLC/Alliant Holdings Co., 4.25%, 10/15/27(1) | | 700 | $ 616,143 |
| NFP Corp.: | | | |
| 4.875%, 8/15/28(1) | | 5,520 | 4,838,766 |
| 7.50%, 10/1/30(1) | | 2,925 | 2,773,221 |
| 8.50%, 10/1/31(1) | | 8,300 | 8,168,583 |
| | | | $ 16,396,713 |
27
See Notes to Financial Statements.
Eaton Vance
Floating Rate Portfolio
October 31, 2023
Portfolio of Investments — continued
| Security | Principal
Amount*
(000's omitted) | Value |
| Internet Software & Services — 0.2% |
| Central Parent, Inc./CDK Global, Inc., 7.25%, 6/15/29(1) | | 13,700 | $ 13,175,673 |
| | | | $ 13,175,673 |
| Leisure Goods/Activities/Movies — 0.4% |
| Lindblad Expeditions, LLC, 6.75%, 2/15/27(1) | | 3,300 | $ 3,010,194 |
| NCL Corp., Ltd., 5.875%, 2/15/27(1) | | 22,000 | 20,272,430 |
| | | | $ 23,282,624 |
| Machinery — 0.3% |
| Madison IAQ, LLC, 4.125%, 6/30/28(1) | | 13,400 | $ 11,206,897 |
| TK Elevator U.S. Newco, Inc., 5.25%, 7/15/27(1) | | 7,150 | 6,516,919 |
| | | | $ 17,723,816 |
| Media — 0.4% |
| iHeartCommunications, Inc.: | | | |
| 4.75%, 1/15/28(1) | | 2,550 | $ 1,806,845 |
| 5.25%, 8/15/27(1) | | 2,125 | 1,559,329 |
| 6.375%, 5/1/26 | | 2,896 | 2,363,200 |
| 8.375%, 5/1/27 | | 5,248 | 3,222,327 |
| Univision Communications, Inc.: | | | |
| 4.50%, 5/1/29(1) | | 9,125 | 7,263,536 |
| 7.375%, 6/30/30(1) | | 9,150 | 8,065,665 |
| | | | $ 24,280,902 |
| Oil, Gas & Consumable Fuels — 0.2% |
| CITGO Petroleum Corporation, 7.00%, 6/15/25(1) | | 10,525 | $ 10,352,865 |
| | | | $ 10,352,865 |
| Professional Services — 0.1% |
| CoreLogic, Inc., 4.50%, 5/1/28(1) | | 5,525 | $ 4,384,419 |
| | | | $ 4,384,419 |
| Real Estate Investment Trusts (REITs) — 0.1% |
| Park Intermediate Holdings, LLC/PK Domestic Property, LLC/PK Finance Co-Issuer, 5.875%, 10/1/28(1) | | 6,425 | $ 5,793,101 |
| | | | $ 5,793,101 |
| Retail — 0.2% |
| Fertitta Entertainment, LLC/Fertitta Entertainment Finance Co., Inc., 4.625%, 1/15/29(1) | | 15,580 | $ 13,109,246 |
| | | | $ 13,109,246 |
| Security | Principal
Amount*
(000's omitted) | Value |
| Retailers (Except Food and Drug) — 0.0%(7) |
| PetSmart, Inc./PetSmart Finance Corp., 4.75%, 2/15/28(1) | | 1,300 | $ 1,151,746 |
| | | | $ 1,151,746 |
| Software — 0.3% |
| Boxer Parent Co., Inc., 7.125%, 10/2/25(1) | | 4,225 | $ 4,172,187 |
| Cloud Software Group, Inc., 9.00%, 9/30/29(1) | | 13,600 | 11,594,068 |
| Veritas US, Inc./Veritas Bermuda, Ltd., 7.50%, 9/1/25(1) | | 2,750 | 2,253,426 |
| | | | $ 18,019,681 |
| Technology — 0.2% |
| Clarivate Science Holdings Corp., 3.875%, 7/1/28(1) | | 11,400 | $ 9,802,152 |
| | | | $ 9,802,152 |
| Telecommunications — 0.2% |
| LCPR Senior Secured Financing DAC, 5.125%, 7/15/29(1) | | 9,325 | $ 7,273,692 |
| VMED O2 UK Financing I PLC, 4.25%, 1/31/31(1) | | 5,550 | 4,370,746 |
| | | | $ 11,644,438 |
| Trading Companies & Distributors — 0.0%(7) |
| American Builders & Contractors Supply Co., Inc., 4.00%, 1/15/28(1) | | 2,975 | $ 2,673,667 |
| | | | $ 2,673,667 |
| Utilities — 0.0%(7) |
| Calpine Corp., 5.25%, 6/1/26(1) | | 1,109 | $ 1,062,411 |
| | | | $ 1,062,411 |
| Wireless Telecommunication Services — 0.1% |
| Digicel International Finance, Ltd./Digicel International Holdings, Ltd., 8.75%, 5/25/24(1) | | 6,325 | $ 5,809,702 |
| | | | $ 5,809,702 |
Total Corporate Bonds
(identified cost $598,447,001) | | | $ 524,182,503 |
| Exchange-Traded Funds — 0.3% |
| Security | Shares | Value |
| SPDR Blackstone Senior Loan ETF | | 426,000 | $ 17,700,300 |
Total Exchange-Traded Funds
(identified cost $19,593,027) | | | $ 17,700,300 |
28
See Notes to Financial Statements.
Eaton Vance
Floating Rate Portfolio
October 31, 2023
Portfolio of Investments — continued
| Security | Shares | Value |
| Nonferrous Metals/Minerals — 0.2% |
| ACNR Holdings, Inc., 15.00% (PIK)(5)(6) | | 17,394 | $ 8,946,313 |
Total Preferred Stocks
(identified cost $0) | | | $ 8,946,313 |
| Senior Floating-Rate Loans — 81.4%(9) |
| Borrower/Description | Principal
Amount*
(000's omitted) | Value |
| Aerospace and Defense — 2.0% |
| Aernnova Aerospace S.A.U.: | | | |
| Term Loan, 6.783%, (3 mo. EURIBOR + 3.00%), 2/26/27 | EUR | 4,656 | $ 4,760,370 |
| Term Loan, 6.934%, (3 mo. EURIBOR + 3.00%), 2/26/27 | EUR | 1,194 | 1,220,608 |
| AI Convoy (Luxembourg) S.a.r.l., Term Loan, 7.722%, (3 mo. EURIBOR + 3.50%), 1/18/27 | EUR | 3,850 | 3,965,481 |
| Dynasty Acquisition Co., Inc.: | | | |
| Term Loan, 9.324%, (SOFR + 4.00%), 8/24/28 | | 23,402 | 23,171,462 |
| Term Loan, 9.324%, (SOFR + 4.00%), 8/24/28 | | 10,029 | 9,930,627 |
| IAP Worldwide Services, Inc., Term Loan - Second Lien, 12.152%, (3 mo. USD LIBOR + 6.50%), 7/18/23(4) | | 6,709 | 5,122,000 |
| TransDigm, Inc.: | | | |
| Term Loan, 8.64%, (SOFR + 3.25%), 2/22/27 | | 27,544 | 27,555,452 |
| Term Loan, 8.64%, (SOFR + 3.25%), 8/24/28 | | 16,042 | 16,039,386 |
| WP CPP Holdings, LLC, Term Loan, 9.29%, (SOFR + 3.75%), 4/30/25 | | 27,103 | 26,127,160 |
| | | | $ 117,892,546 |
| Airlines — 0.4% |
| American Airlines, Inc., Term Loan, 10.427%, (SOFR + 4.75%), 4/20/28 | | 24,863 | $ 25,246,750 |
| | | | $ 25,246,750 |
| Apparel & Luxury Goods — 0.1% |
| Hanesbrands, Inc., Term Loan, 9.074%, (SOFR + 3.75%), 3/8/30 | | 4,552 | $ 4,500,914 |
| | | | $ 4,500,914 |
| Auto Components — 1.8% |
| Adient US, LLC, Term Loan, 8.689%, (SOFR + 3.25%), 4/10/28 | | 5,523 | $ 5,529,734 |
| Borrower/Description | Principal
Amount*
(000's omitted) | Value |
| Auto Components (continued) |
| Autokiniton US Holdings, Inc., Term Loan, 9.939%, (SOFR + 4.50%), 4/6/28 | | 20,578 | $ 20,209,276 |
| Clarios Global, L.P., Term Loan, 7.118%, (1 mo. EURIBOR + 3.25%), 4/30/26 | EUR | 16,490 | 17,399,074 |
| DexKo Global, Inc.: | | | |
| Term Loan, 7.972%, (3 mo. EURIBOR + 4.00%), 10/4/28 | EUR | 3,272 | 3,271,262 |
| Term Loan, 7.972%, (3 mo. EURIBOR + 4.00%), 10/4/28 | EUR | 7,303 | 7,302,731 |
| Term Loan, 9.402%, (SOFR + 3.75%), 10/4/28 | | 13,371 | 12,834,434 |
| Garrett Motion, Inc., Term Loan, 9.883%, (SOFR + 4.50%), 4/30/28 | | 8,393 | 8,413,839 |
| LSF12 Badger Bidco, LLC, Term Loan, 11.324%, (SOFR + 6.00%), 8/30/30 | | 3,100 | 3,096,125 |
| LTI Holdings, Inc., Term Loan, 10.189%, (SOFR + 4.75%), 7/24/26 | | 7,044 | 6,755,899 |
| RealTruck Group, Inc.: | | | |
| Term Loan, 9.189%, (SOFR + 3.75%), 1/31/28 | | 11,509 | 10,997,334 |
| Term Loan, 10.406%, (SOFR + 5.00%), 1/31/28 | | 7,125 | 6,833,317 |
| | | | $ 102,643,025 |
| Automobiles — 0.9% |
| Bombardier Recreational Products, Inc., Term Loan, 7.424%, (SOFR + 2.00%), 5/24/27 | | 38,161 | $ 37,874,967 |
| MajorDrive Holdings IV, LLC: | | | |
| Term Loan, 9.652%, (SOFR + 4.00%), 6/1/28 | | 14,893 | 14,508,379 |
| Term Loan, 11.04%, (SOFR + 5.50%), 6/1/29 | | 2,140 | 2,121,672 |
| | | | $ 54,505,018 |
| Beverages — 0.4% |
| City Brewing Company, LLC, Term Loan, 9.164%, (SOFR + 3.50%), 4/5/28 | | 7,885 | $ 5,847,062 |
| Triton Water Holdings, Inc., Term Loan, 8.902%, (SOFR + 3.25%), 3/31/28 | | 21,157 | 20,105,663 |
| | | | $ 25,952,725 |
| Biotechnology — 0.5% |
| Alkermes, Inc., Term Loan, 7.949%, (SOFR + 2.50%), 3/12/26 | | 18,178 | $ 18,041,169 |
| Alltech, Inc., Term Loan, 9.439%, (SOFR + 4.00%), 10/13/28 | | 4,736 | 4,635,615 |
| Grifols Worldwide Operations USA, Inc., Term Loan, 7.424%, (SOFR + 2.00%), 11/15/27 | | 4,440 | 4,324,991 |
| | | | $ 27,001,775 |
29
See Notes to Financial Statements.
Eaton Vance
Floating Rate Portfolio
October 31, 2023
Portfolio of Investments — continued
| Borrower/Description | Principal
Amount*
(000's omitted) | Value |
| Building Products — 0.8% |
| Cornerstone Building Brands, Inc., Term Loan, 8.685%, (SOFR + 3.25%), 4/12/28 | | 11,056 | $ 10,542,540 |
| CPG International, Inc., Term Loan, 7.924%, (SOFR + 2.50%), 4/28/29 | | 13,637 | 13,635,545 |
| LHS Borrower, LLC, Term Loan, 10.174%, (SOFR + 4.75%), 2/16/29 | | 5,827 | 5,113,227 |
| MI Windows and Doors, LLC, Term Loan, 8.924%, (SOFR + 3.50%), 12/18/27 | | 6,545 | 6,552,979 |
| Oscar AcquisitionCo, LLC, Term Loan, 9.99%, (SOFR + 4.50%), 4/29/29 | | 1,598 | 1,558,974 |
| Standard Industries, Inc., Term Loan, 7.953%, (SOFR + 2.50%), 9/22/28 | | 8,819 | 8,842,854 |
| | | | $ 46,246,119 |
| Capital Markets — 4.5% |
| Advisor Group, Inc., Term Loan, 9.824%, (SOFR + 4.50%), 8/17/28 | | 22,225 | $ 22,167,154 |
| AllSpring Buyer, LLC, Term Loan, 8.949%, (SOFR + 3.25%), 11/1/28 | | 6,220 | 6,066,244 |
| Aretec Group, Inc.: | | | |
| Term Loan, 9.674%, (SOFR + 4.25%), 10/1/25 | | 18,275 | 18,285,118 |
| Term Loan, 9.924%, (SOFR + 4.50%), 8/9/30 | | 8,853 | 8,620,426 |
| CeramTec AcquiCo GmbH, Term Loan, 7.283%, (3 mo. EURIBOR + 3.50%), 3/16/29 | EUR | 12,779 | 13,217,332 |
| Citadel Securities, L.P., Term Loan, 7.939%, (SOFR + 2.50%), 7/29/30 | | 7,606 | 7,594,529 |
| Citco Funding, LLC, Term Loan, 4/27/28(10) | | 8,175 | 8,190,328 |
| Clipper Acquisitions Corp., Term Loan, 7.192%, (SOFR + 1.75%), 3/3/28 | | 7,191 | 7,161,189 |
| Edelman Financial Center, LLC, Term Loan, 8.939%, (SOFR + 3.50%), 4/7/28 | | 18,913 | 18,620,831 |
| EIG Management Company, LLC, Term Loan, 9.177%, (SOFR + 3.75%), 2/22/25 | | 2,859 | 2,858,625 |
| FinCo I, LLC, Term Loan, 8.383%, (SOFR + 3.00%), 6/27/29 | | 12,818 | 12,824,284 |
| Focus Financial Partners, LLC: | | | |
| Term Loan, 7.824%, (SOFR + 2.50%), 6/30/28 | | 9,877 | 9,799,190 |
| Term Loan, 8.574%, (SOFR + 3.25%), 6/30/28 | | 17,301 | 17,255,707 |
| Term Loan, 8.824%, (SOFR + 3.50%), 6/30/28 | | 6,400 | 6,393,331 |
| Franklin Square Holdings, L.P., Term Loan, 7.674%, (SOFR + 2.25%), 8/1/25 | | 6,199 | 6,206,462 |
| Guggenheim Partners, LLC, Term Loan, 8.64%, (SOFR + 3.25%), 12/12/29 | | 19,230 | 19,238,323 |
| Hudson River Trading, LLC, Term Loan, 8.439%, (SOFR + 3.00%), 3/20/28 | | 25,572 | 25,241,936 |
| LPL Holdings, Inc., Term Loan, 7.165%, (SOFR + 1.75%), 11/12/26 | | 15,785 | 15,821,179 |
| Borrower/Description | Principal
Amount*
(000's omitted) | Value |
| Capital Markets (continued) |
| Mariner Wealth Advisors, LLC, Term Loan, 8.901%, (SOFR + 3.25%), 8/18/28 | | 13,446 | $ 13,244,742 |
| Victory Capital Holdings, Inc.: | | | |
| Term Loan, 7.772%, (SOFR + 2.25%), 7/1/26 | | 13,437 | 13,430,354 |
| Term Loan, 7.772%, (SOFR + 2.25%), 12/29/28 | | 6,979 | 6,952,588 |
| | | | $ 259,189,872 |
| Chemicals — 4.9% |
| Axalta Coating Systems U.S. Holdings, Inc., Term Loan, 7.89%, (SOFR + 2.50%), 12/20/29 | | 18,151 | $ 18,203,296 |
| CPC Acquisition Corp., Term Loan, 9.402%, (SOFR + 3.75%), 12/29/27 | | 14,714 | 11,646,946 |
| Flint Group Midco Limited, Term Loan, 10.674%, (SOFR + 5.00%), 9.924% cash, 0.75% PIK, 12/31/26 | | 4,982 | 4,633,281 |
| Flint Group Packaging INKS North America Holdings, LLC: | | | |
| Term Loan, 9.002%, (3 mo. EURIBOR + 5.00%), 8.252% cash, 0.75% PIK, 12/31/26 | EUR | 1,546 | 1,521,387 |
| Term Loan, 11.002%, (3 mo. EURIBOR + 7.00%), 4.102% cash, 6.90% PIK, 12/31/27 | EUR | 750 | 581,570 |
| Term Loan - Second Lien, 11.002%, (3 mo. EURIBOR + 7.00%), 4.102% cash, 6.90% PIK, 12/31/27 | EUR | 999 | 191,158 |
| Flint Group Topco Limited: | | | |
| Term Loan, 12.674%, (SOFR + 7.00%), 5.774% cash, 6.90% PIK, 12/31/27 | | 2,429 | 1,779,470 |
| Term Loan - Second Lien, 12.674%, (SOFR + 7.00%), 5.774% cash, 6.90% PIK, 12/31/27 | | 3,240 | 585,830 |
| Gemini HDPE, LLC, Term Loan, 8.645%, (SOFR + 3.00%), 12/31/27 | | 4,686 | 4,678,800 |
| GEON Performance Solutions, LLC, Term Loan, 10.402%, (SOFR + 4.75%), 8/18/28 | | 5,660 | 5,547,017 |
| Groupe Solmax, Inc., Term Loan, 10.303%, (SOFR + 4.75%), 5/29/28(11) | | 9,392 | 8,797,699 |
| INEOS Enterprises Holdings II Limited, Term Loan, 7.783%, (3 mo. EURIBOR + 4.00%), 7/7/30 | EUR | 1,945 | �� 2,028,995 |
| INEOS Enterprises Holdings US Finco, LLC, Term Loan, 9.273%, (SOFR + 3.75%), 7/8/30 | | 10,925 | 10,697,399 |
| INEOS Finance PLC: | | | |
| Term Loan, 6.618%, (1 mo. EURIBOR + 2.75%), 11/8/28 | EUR | 8,900 | 9,043,347 |
| Term Loan, 7.868%, (1 mo. EURIBOR + 4.00%), 11/8/27 | EUR | 6,200 | 6,481,194 |
| INEOS Quattro Holdings UK, Ltd.: | | | |
| Term Loan, 6.622%, (1 week EURIBOR + 2.75%), 1/29/26 | EUR | 23,150 | 24,185,160 |
| Term Loan, 7.872%, (1 week EURIBOR + 4.00%), 3/14/30 | EUR | 3,300 | 3,382,614 |
| Term Loan, 9.174%, (SOFR + 3.75%), 3/14/30 | | 4,988 | 4,903,336 |
30
See Notes to Financial Statements.
Eaton Vance
Floating Rate Portfolio
October 31, 2023
Portfolio of Investments — continued
| Borrower/Description | Principal
Amount*
(000's omitted) | Value |
| Chemicals (continued) |
| INEOS Styrolution US Holding, LLC, Term Loan, 8.189%, (SOFR + 2.75%), 1/29/26 | | 8,272 | $ 8,140,905 |
| INEOS US Finance, LLC: | | | |
| Term Loan, 7.825%, (SOFR + 2.50%), 11/8/28 | | 6,152 | 6,021,201 |
| Term Loan, 8.924%, (SOFR + 3.50%), 2/18/30 | | 20,653 | 20,310,542 |
| Term Loan, 9.174%, (SOFR + 3.75%), 11/8/27 | | 2,637 | 2,608,186 |
| Kraton Corporation, Term Loan, 8.921%, (SOFR + 3.25%), 3/15/29 | | 5,615 | 5,354,829 |
| Kraton Polymers Holdings B.V., Term Loan, 7.217%, (EURIBOR + 3.25%), 3/15/29(11) | EUR | 4,250 | 4,332,037 |
| Lonza Group AG: | | | |
| Term Loan, 7.897%, (3 mo. EURIBOR + 3.93%), 7/3/28 | EUR | 4,600 | 4,206,531 |
| Term Loan, 9.415%, (SOFR + 3.93%), 7/3/28 | | 10,766 | 9,145,318 |
| Messer Industries GmbH: | | | |
| Term Loan, 6.368%, (1 mo. EURIBOR + 2.50%), 3/2/26 | EUR | 1,554 | 1,645,247 |
| Term Loan, 8.152%, (SOFR + 2.50%), 3/2/26 | | 9,372 | 9,374,156 |
| Momentive Performance Materials, Inc., Term Loan, 9.824%, (SOFR + 4.50%), 3/29/28 | | 21,585 | 20,614,013 |
| Olympus Water US Holding Corporation: | | | |
| Term Loan, 9.402%, (SOFR + 3.75%), 11/9/28 | | 3,947 | 3,856,354 |
| Term Loan, 9.99%, (SOFR + 4.50%), 11/9/28 | | 5,344 | 5,259,019 |
| Orion Engineered Carbons GmbH: | | | |
| Term Loan, 6.372%, (3 mo. EURIBOR + 2.40%), 9/24/28 | EUR | 1,250 | 1,325,932 |
| Term Loan, 7.64%, (SOFR + 2.15%), 9/24/28 | | 4,435 | 4,379,069 |
| PQ Corporation, Term Loan, 7.983%, (SOFR + 2.50%), 6/9/28 | | 8,668 | 8,627,116 |
| Rohm Holding GmbH: | | | |
| Term Loan, 8.472%, (6 mo. EURIBOR + 4.50%), 7/31/26 | EUR | 1,000 | 950,968 |
| Term Loan, 10.881%, (SOFR + 5.00%), 7/31/26 | | 13,783 | 12,738,220 |
| Term Loan, 7/31/26(10) | EUR | 10,800 | 10,270,450 |
| SCUR-Alpha 1503 GmbH, Term Loan, 10.883%, (SOFR + 5.50%), 3/29/30 | | 5,522 | 5,094,308 |
| Tronox Finance, LLC: | | | |
| Term Loan, 8.116%, (SOFR + 2.50%), 3/10/28(11) | | 11,570 | 11,367,412 |
| Term Loan, 8.64%, (SOFR + 3.25%), 4/4/29 | | 3,620 | 3,571,611 |
| Term Loan, 8.824%, (SOFR + 3.50%), 8/16/28 | | 5,075 | 5,011,562 |
| | | | $ 283,093,485 |
| Commercial Services & Supplies — 1.7% |
| Asplundh Tree Expert, LLC, Term Loan, 7.174%, (SOFR + 1.75%), 9/7/27 | | 8,197 | $ 8,211,229 |
| Borrower/Description | Principal
Amount*
(000's omitted) | Value |
| Commercial Services & Supplies (continued) |
| Belfor Holdings, Inc.: | | | |
| Term Loan, 9.574%, (SOFR + 4.25%), 4/6/26 | | 2,587 | $ 2,592,222 |
| Term Loan, 10/25/30(10) | | 6,575 | 6,575,000 |
| EnergySolutions, LLC, Term Loan, 9.382%, (SOFR + 4.00%), 9/20/30 | | 16,309 | 16,237,217 |
| Foundever Group, Term Loan, 7.62%, (1 mo. EURIBOR + 3.75%), 8/28/28 | EUR | 6,425 | 6,541,659 |
| GFL Environmental, Inc., Term Loan, 7.912%, (SOFR + 2.50%), 5/31/27 | | 4,280 | 4,288,789 |
| Harsco Corporation, Term Loan, 7.689%, (SOFR + 2.25%), 3/10/28 | | 885 | 865,183 |
| JFL-Tiger Acquisition Co., Inc., Term Loan, 10.403%, (SOFR + 5.00%), 10/17/30 | | 7,325 | 7,242,594 |
| Monitronics International, Inc., Term Loan, 13.145%, (SOFR + 7.50%), 6/30/28 | | 12,343 | 12,482,058 |
| Phoenix Services International, LLC, Term Loan, 11.427%, (SOFR + 6.10%), 6/30/28 | | 2,031 | 1,894,228 |
| SITEL Worldwide Corporation, Term Loan, 9.189%, (SOFR + 3.75%), 8/28/28 | | 13,950 | 13,475,451 |
| Tempo Acquisition, LLC, Term Loan, 8.074%, (SOFR + 2.75%), 8/31/28 | | 2,463 | 2,463,160 |
| TMF Group Holding B.V., Term Loan, 10.414%, (SOFR + 5.00%), 5/3/28 | | 4,650 | 4,652,906 |
| TruGreen Limited Partnership, Term Loan, 9.424%, (SOFR + 4.00%), 11/2/27 | | 8,399 | 7,899,375 |
| | | | $ 95,421,071 |
| Communications Equipment — 0.1% |
| Digi International, Inc., Term Loan, 10.439%, (SOFR + 5.00%), 11/1/28 | | 4,181 | $ 4,182,690 |
| | | | $ 4,182,690 |
| Construction Materials — 0.4% |
| Quikrete Holdings, Inc.: | | | |
| Term Loan, 8.064%, (SOFR + 2.63%), 2/1/27 | | 2,734 | $ 2,732,538 |
| Term Loan, 8.189%, (SOFR + 2.75%), 3/19/29 | | 19,014 | 19,027,854 |
| | | | $ 21,760,392 |
| Consumer Staples Distribution & Retail — 0.4% |
| Cardenas Markets, Inc., Term Loan, 12.24%, (SOFR + 6.75%), 8/1/29 | | 4,154 | $ 4,154,539 |
| Peer Holding III B.V.: | | | |
| Term Loan, 7.722%, (3 mo. EURIBOR + 3.75%), 9/29/28 | EUR | 5,725 | 6,045,951 |
| Term Loan, 10/19/30(10) | | 11,475 | 11,431,969 |
| | | | $ 21,632,459 |
31
See Notes to Financial Statements.
Eaton Vance
Floating Rate Portfolio
October 31, 2023
Portfolio of Investments — continued
| Borrower/Description | Principal
Amount*
(000's omitted) | Value |
| Containers & Packaging — 1.1% |
| Berlin Packaging, LLC, Term Loan, 9.189%, (SOFR + 3.75%), 3/11/28(11) | | 2,901 | $ 2,839,458 |
| Kouti B.V., Term Loan, 7.458%, (3 mo. EURIBOR + 3.68%), 8/31/28 | EUR | 29,250 | 29,858,775 |
| Pregis TopCo Corporation: | | | |
| Term Loan, 9.074%, (SOFR + 3.75%), 7/31/26 | | 1,964 | 1,947,866 |
| Term Loan, 9.189%, (SOFR + 3.75%), 7/31/26 | | 1,348 | 1,340,763 |
| Pretium Packaging, LLC, Term Loan - Second Lien, 9.995%, (SOFR + 4.60%), 10/2/28 | | 6,598 | 5,031,184 |
| Pretium PKG Holdings, Inc., Term Loan - Second Lien, 12.20%, (SOFR + 6.75%), 10/1/29(11) | | 6,675 | 2,962,031 |
| Proampac PG Borrower, LLC, Term Loan, 10.585%, (SOFR + 4.50%), 9/15/28 | | 11,825 | 11,701,819 |
| Trident TPI Holdings, Inc., Term Loan, 9.652%, (SOFR + 4.00%), 9/15/28 | | 5,662 | 5,600,726 |
| | | | $ 61,282,622 |
| Distributors — 0.0%(7) |
| Phillips Feed Service, Inc., Term Loan, 12.427%, (SOFR + 7.00%), 11/13/24(4) | | 471 | $ 376,498 |
| Winterfell Financing S.a.r.l., Term Loan, 8.765%, (3 mo. EURIBOR + 5.00%), 5/4/28 | EUR | 2,000 | 2,076,522 |
| | | | $ 2,453,020 |
| Diversified Consumer Services — 0.8% |
| Ascend Learning, LLC, Term Loan, 8.924%, (SOFR + 3.50%), 12/11/28 | | 11,292 | $ 10,540,720 |
| Belron Finance US, LLC, Term Loan, 8.057%, (SOFR + 2.43%), 4/13/28 | | 7,629 | 7,637,958 |
| FrontDoor, Inc., Term Loan, 7.689%, (SOFR + 2.25%), 6/17/28 | | 855 | 852,908 |
| KUEHG Corp., Term Loan, 10.39%, (SOFR + 5.00%), 6/12/30 | | 13,725 | 13,731,121 |
| Sotheby's, Term Loan, 10.156%, (SOFR + 4.50%), 1/15/27 | | 10,792 | 10,481,854 |
| Spring Education Group, Inc., Term Loan, 9.914%, (SOFR + 4.50%), 10/4/30 | | 3,725 | 3,689,303 |
| | | | $ 46,933,864 |
| Diversified Financial Services — 0.2% |
| Concorde Midco, Ltd., Term Loan, 7.892%, (6 mo. EURIBOR + 4.00%), 3/1/28 | EUR | 8,730 | $ 9,102,509 |
| | | | $ 9,102,509 |
| Diversified Telecommunication Services — 0.8% |
| CenturyLink, Inc., Term Loan, 7.689%, (SOFR + 2.25%), 3/15/27 | | 22,800 | $ 17,189,155 |
| Borrower/Description | Principal
Amount*
(000's omitted) | Value |
| Diversified Telecommunication Services (continued) |
| GEE Holdings 2, LLC: | | | |
| Term Loan, 13.50%, (SOFR + 8.25%), 3/24/25 | | 9,639 | $ 8,771,597 |
| Term Loan - Second Lien, 13.75%, (SOFR + 8.25%), 7.00% cash, 6.75% PIK, 3/23/26 | | 7,100 | 4,260,076 |
| Level 3 Financing, Inc., Term Loan, 7.189%, (SOFR + 1.75%), 3/1/27 | | 12,351 | 11,616,585 |
| Telenet Financing USD, LLC, Term Loan, 7.449%, (SOFR + 2.00%), 4/30/28 | | 2,825 | 2,750,844 |
| Virgin Media Bristol, LLC, Term Loan, 7.949%, (SOFR + 2.50%), 1/31/28 | | 2,563 | 2,494,345 |
| | | | $ 47,082,602 |
| Electrical Equipment — 0.0%(7) |
| Brookfield WEC Holdings, Inc., Term Loan, 8.189%, (SOFR + 2.75%), 8/1/25 | | 1,521 | $ 1,520,586 |
| | | | $ 1,520,586 |
| Electronic Equipment, Instruments & Components — 1.0% |
| Creation Technologies, Inc., Term Loan, 11.176%, (SOFR + 5.50%), 10/5/28 | | 12,816 | $ 12,143,316 |
| II-VI Incorporated, Term Loan, 8.189%, (SOFR + 2.75%), 7/2/29 | | 400 | 399,629 |
| Minimax Viking GmbH, Term Loan, 7.133%, (EURIBOR + 3.25%), 7/31/28(11) | EUR | 3,487 | 3,689,305 |
| Mirion Technologies, Inc., Term Loan, 8.402%, (SOFR + 2.75%), 10/20/28 | | 1,722 | 1,719,430 |
| Robertshaw US Holding Corp.: | | | |
| Term Loan, 13.49%, (SOFR + 8.00%), 8.49% cash, 5.00% PIK, 2/28/27 | | 3,981 | 4,020,463 |
| Term Loan - Second Lien, 12.49%, (SOFR + 7.00%), 2/28/27 | | 16,811 | 14,205,651 |
| TTM Technologies, Inc., Term Loan, 8.065%, (SOFR + 2.75%), 5/30/30 | | 5,212 | 5,215,195 |
| Verifone Systems, Inc., Term Loan, 9.653%, (SOFR + 4.00%), 8/20/25 | | 14,617 | 13,618,601 |
| | | | $ 55,011,590 |
| Energy Equipment & Services — 0.6% |
| Ameriforge Group, Inc.: | | | |
| Term Loan, 16.735%, (SOFR + 13.00%), 12/29/23(4)(12) | | 3,225 | $ 2,572,594 |
| Term Loan, 18.456%, (SOFR + 13.00%), 13.456 cash, 5.00% PIK, 12/29/23(4)(11) | | 25,247 | 20,142,290 |
| GIP Pilot Acquisition Partners L.P., Term Loan, 8.388%, (SOFR + 3.00%), 10/4/30 | | 4,875 | 4,875,000 |
| Lealand Finance Company B.V.: | | | |
| Letter of Credit, 3.638%, 6/28/24(12) | | 9,039 | 6,734,330 |
32
See Notes to Financial Statements.
Eaton Vance
Floating Rate Portfolio
October 31, 2023
Portfolio of Investments — continued
| Borrower/Description | Principal
Amount*
(000's omitted) | Value |
| Energy Equipment & Services (continued) |
| Lealand Finance Company B.V.: (continued) | | | |
| Term Loan, 12.439%, (SOFR + 7.00%), 9.439% cash, 3.00% PIK, 6/30/25 | | 2,518 | $ 1,403,859 |
| | | | $ 35,728,073 |
| Engineering & Construction — 0.7% |
| Aegion Corporation, Term Loan, 10.395%, (SOFR + 4.75%), 5/17/28 | | 15,762 | $ 15,672,849 |
| American Residential Services, LLC, Term Loan, 9.152%, (SOFR + 3.50%), 10/15/27 | | 497 | 496,463 |
| APi Group DE, Inc., Term Loan, 7.689%, (SOFR + 2.25%), 10/1/26 | | 10,603 | 10,619,166 |
| Centuri Group, Inc., Term Loan, 7.939%, (SOFR + 2.50%), 8/27/28 | | 3,256 | 3,253,840 |
| Northstar Group Services, Inc.: | | | |
| Term Loan, 10.939%, (SOFR + 5.50%), 11/12/26 | | 10,818 | 10,818,422 |
| Term Loan, 10.949%, (SOFR + 5.50%), 11/12/26 | | 1,963 | 1,957,594 |
| | | | $ 42,818,334 |
| Entertainment — 1.0% |
| City Football Group Limited, Term Loan, 8.453%, (SOFR + 3.00%), 7/21/28 | | 8,228 | $ 8,166,306 |
| Crown Finance US, Inc., Term Loan, 7.381%, (SOFR + 1.50%), 7/31/28 | | 1,747 | 1,786,829 |
| Delta 2 (LUX) S.a.r.l., Term Loan, 7.574%, (SOFR + 2.25%), 1/15/30 | | 2,500 | 2,493,750 |
| Live Nation Entertainment, Inc., Term Loan, 7.189%, (SOFR + 1.75%), 10/19/26 | | 5,571 | 5,559,092 |
| Playtika Holding Corp., Term Loan, 8.189%, (SOFR + 2.75%), 3/13/28 | | 20,527 | 19,947,078 |
| Renaissance Holding Corp.: | | | |
| Term Loan, 10.074%, (SOFR + 4.75%), 4/5/30 | | 11,025 | 10,889,481 |
| Term Loan - Second Lien, 12.424%, (SOFR + 7.00%), 5/29/26 | | 143 | 142,251 |
| UFC Holdings, LLC, Term Loan, 8.399%, (SOFR + 2.75%), 4/29/26 | | 7,202 | 7,203,954 |
| Vue International Bidco PLC: | | | |
| Term Loan, 12.13%, (6 mo. EURIBOR + 8.00%), 6/30/27 | EUR | 434 | 449,569 |
| Term Loan, 12.63%, (6 mo. EURIBOR + 8.50%), 6.13% cash, 6.50% PIK, 12/31/27 | EUR | 3,031 | 1,431,038 |
| | | | $ 58,069,348 |
| Equity Real Estate Investment Trusts (REITs) — 0.1% |
| Iron Mountain, Inc., Term Loan, 7.189%, (1 mo. USD LIBOR + 1.75%), 1/2/26 | | 3,634 | $ 3,630,883 |
| | | | $ 3,630,883 |
| Borrower/Description | Principal
Amount*
(000's omitted) | Value |
| Financial Services — 1.0% |
| Ditech Holding Corporation, Term Loan, 0.00%, 3/28/24(13) | | 18,244 | $ 2,006,820 |
| GTCR W Merger Sub, LLC, Term Loan, 9/20/30(10) | | 30,700 | 30,513,620 |
| NCR Atleos, LLC, Term Loan, 10.176%, (SOFR + 4.75%), 3/27/29 | | 13,700 | 13,154,850 |
| Walker & Dunlop, Inc., Term Loan, 7.674%, (SOFR + 2.25%), 12/16/28 | | 12,822 | 12,800,251 |
| | | | $ 58,475,541 |
| Food Products — 0.9% |
| 8th Avenue Food & Provisions, Inc., Term Loan, 10.189%, (SOFR + 4.75%), 10/1/25 | | 6,542 | $ 6,195,343 |
| Badger Buyer Corp., Term Loan, 8.939%, (SOFR + 3.50%), 9/30/24 | | 4,775 | 4,088,785 |
| Del Monte Foods, Inc., Term Loan, 9.682%, (SOFR + 4.25%), 5/16/29 | | 6,262 | 6,075,463 |
| Froneri International, Ltd.: | | | |
| Term Loan, 6.097%, (6 mo. EURIBOR + 2.13%), 1/29/27 | EUR | 1,500 | 1,544,637 |
| Term Loan, 7.674%, (SOFR + 2.25%), 1/29/27 | | 4,691 | 4,665,428 |
| Nomad Foods US, LLC, Term Loan, 8.469%, (SOFR + 3.00%), 11/13/29 | | 7,953 | 7,960,987 |
| United Petfood Group B.V., Term Loan, 6.852%, (6 mo. EURIBOR + 2.75%), 4/23/28 | EUR | 8,400 | 8,680,658 |
| Valeo F1 Company Limited (Ireland): | | | |
| Term Loan, 8.136%, (6 mo. EURIBOR + 4.00%), 9/29/28 | EUR | 8,550 | 8,145,311 |
| Term Loan, 10.186%, (SONIA + 5.00%), 6/28/28 | GBP | 2,500 | 2,616,255 |
| | | | $ 49,972,867 |
| Gas Utilities — 0.4% |
| CQP Holdco, L.P., Term Loan, 8.99%, (SOFR + 3.50%), 6/5/28 | | 22,130 | $ 22,136,475 |
| | | | $ 22,136,475 |
| Health Care Equipment & Supplies — 1.1% |
| Artivion, Inc., Term Loan, 8.939%, (SOFR + 3.50%), 6/1/27 | | 6,643 | $ 6,446,107 |
| Bayou Intermediate II, LLC, Term Loan, 10.128%, (SOFR + 4.50%), 8/2/28 | | 6,661 | 6,394,706 |
| Gloves Buyer, Inc., Term Loan, 9.439%, (SOFR + 4.00%), 12/29/27 | | 12,122 | 11,697,546 |
| ICU Medical, Inc., Term Loan, 8.04%, (SOFR + 2.50%), 1/8/29 | | 7,363 | 7,348,304 |
33
See Notes to Financial Statements.
Eaton Vance
Floating Rate Portfolio
October 31, 2023
Portfolio of Investments — continued
| Borrower/Description | Principal
Amount*
(000's omitted) | Value |
| Health Care Equipment & Supplies (continued) |
| Journey Personal Care Corp., Term Loan, 9.981%, (6 mo. USD LIBOR + 4.25%), 3/1/28 | | 23,757 | $ 22,843,643 |
| Medline Borrower, L.P., Term Loan, 8.689%, (SOFR + 3.25%), 10/23/28 | | 8,613 | 8,564,073 |
| | | | $ 63,294,379 |
| Health Care Providers & Services — 4.2% |
| AEA International Holdings (Lux) S.a.r.l., Term Loan, 9.402%, (SOFR + 3.75%), 9/7/28 | | 13,681 | $ 13,646,802 |
| BW NHHC Holdco, Inc., Term Loan - Second Lien, 13.39%, (SOFR + 8.00%), 1/15/26 | | 14,558 | 12,447,089 |
| Cano Health, LLC, Term Loan, 9.533%, (SOFR + 4.00%), 11/23/27(11) | | 7,227 | 4,263,748 |
| CCRR Parent, Inc., Term Loan, 9.189%, (SOFR + 3.75%), 3/6/28 | | 4,709 | 4,485,234 |
| Cerba Healthcare S.A.S.: | | | |
| Term Loan, 7.583%, (1 mo. EURIBOR + 3.70%), 6/30/28 | EUR | 18,925 | 18,629,978 |
| Term Loan, 7.883%, (1 mo. EURIBOR + 4.00%), 2/16/29 | EUR | 8,225 | 8,209,709 |
| CHG Healthcare Services, Inc., Term Loan, 9.145%, (SOFR + 3.75%), 9/29/28 | | 4,200 | 4,167,626 |
| Covis Finco S.a.r.l., Term Loan, 12.04%, (SOFR + 6.50%), 2/18/27 | | 9,853 | 7,094,203 |
| Dedalus Finance GmbH, Term Loan, 7.712%, (6 mo. EURIBOR + 3.75%), 7/17/27 | EUR | 3,350 | 3,383,227 |
| Elsan S.A.S., Term Loan, 7.39%, (6 mo. EURIBOR + 3.35%), 6/16/28 | EUR | 4,100 | 4,207,796 |
| Ensemble RCM, LLC, Term Loan, 9.233%, (SOFR + 3.75%), 8/3/26 | | 4,254 | 4,257,723 |
| Envision Healthcare Corporation: | | | |
| Term Loan, 0.00%, 3/31/27(13) | | 5,436 | 6,468,771 |
| Term Loan - Second Lien, 0.00%, 3/31/27(13) | | 38,369 | 6,714,637 |
| IVC Acquisition, Ltd., Term Loan, 7.687%, (6 mo. EURIBOR + 4.00%), 2/13/26 | EUR | 4,100 | 4,298,443 |
| Medical Solutions Holdings, Inc.: | | | |
| Term Loan, 8.773%, (SOFR + 3.25%), 11/1/28 | | 13,745 | 12,845,421 |
| Term Loan - Second Lien, 12.523%, (SOFR + 7.00%), 11/1/29 | | 9,500 | 8,478,750 |
| Mehilainen Yhtiot Oy, Term Loan, 7.497%, (3 mo. EURIBOR + 3.53%), 8/8/25 | EUR | 6,025 | 6,372,064 |
| Midwest Physician Administrative Services, LLC, Term Loan, 8.902%, (SOFR + 3.25%), 3/12/28 | | 1,409 | 1,324,257 |
| National Mentor Holdings, Inc.: | | | |
| Term Loan, 9.187%, (SOFR + 3.75%), 3/2/28(11) | | 12,252 | 10,730,277 |
| Term Loan, 9.24%, (SOFR + 3.75%), 3/2/28 | | 334 | 292,283 |
| Term Loan - Second Lien, 12.74%, (SOFR + 7.25%), 3/2/29 | | 5,525 | 3,853,688 |
| Borrower/Description | Principal
Amount*
(000's omitted) | Value |
| Health Care Providers & Services (continued) |
| Phoenix Guarantor, Inc.: | | | |
| Term Loan, 8.689%, (SOFR + 3.25%), 3/5/26 | | 16,235 | $ 16,095,060 |
| Term Loan, 8.939%, (SOFR + 3.50%), 3/5/26 | | 5,361 | 5,315,194 |
| Radiology Partners, Inc., Term Loan, 10.179%, (SOFR + 4.25%), 7/9/25 | | 13,101 | 9,817,760 |
| Ramsay Generale de Sante S.A., Term Loan, 6.952%, (3 mo. EURIBOR + 2.95%), 4/22/27 | EUR | 6,600 | 6,979,970 |
| Select Medical Corporation, Term Loan, 8.324%, (SOFR + 3.00%), 3/6/27 | | 45,035 | 44,971,401 |
| Sound Inpatient Physicians: | | | |
| Term Loan, 8.645%, (SOFR + 3.00%), 6/27/25 | | 198 | 66,028 |
| Term Loan, 8.645%, (SOFR + 3.00%), 6/27/25 | | 2,322 | 774,531 |
| Synlab Bondco PLC, Term Loan, 6.392%, (6 mo. EURIBOR + 2.50%), 7/1/27 | EUR | 2,125 | 2,226,680 |
| TTF Holdings, LLC, Term Loan, 9.439%, (SOFR + 4.00%), 3/31/28 | | 5,083 | 5,088,947 |
| U.S. Anesthesia Partners, Inc., Term Loan, 9.679%, (SOFR + 4.25%), 10/1/28 | | 5,018 | 4,376,587 |
| | | | $ 241,883,884 |
| Health Care Technology — 1.0% |
| Certara, L.P., Term Loan, 9.184%, (SOFR + 3.50%), 8/15/26 | | 1,808 | $ 1,810,635 |
| Imprivata, Inc.: | | | |
| Term Loan, 9.189%, (SOFR + 3.75%), 12/1/27 | | 11,204 | 11,176,174 |
| Term Loan, 9.574%, (SOFR + 4.25%), 12/1/27 | | 3,259 | 3,260,109 |
| MedAssets Software Intermediate Holdings, Inc.: | | | |
| Term Loan, 9.439%, (SOFR + 4.00%), 12/18/28 | | 16,228 | 12,880,876 |
| Term Loan - Second Lien, 12.189%, (SOFR + 6.75%), 12/17/29 | | 8,775 | 5,333,006 |
| Symplr Software, Inc., Term Loan, 9.983%, (SOFR + 4.50%), 12/22/27 | | 12,927 | 11,367,734 |
| Verscend Holding Corp., Term Loan, 9.439%, (SOFR + 4.00%), 8/27/25 | | 9,949 | 9,956,104 |
| | | | $ 55,784,638 |
| Hotels, Restaurants & Leisure — 3.9% |
| 1011778 B.C. Unlimited Liability Company, Term Loan, 7.574%, (SOFR + 2.25%), 9/20/30 | | 32,566 | $ 32,378,688 |
| Carnival Corporation: | | | |
| Term Loan, 7.618%, (1 mo. EURIBOR + 3.75%), 6/30/25 | EUR | 8,790 | 9,314,571 |
| Term Loan, 8.689%, (SOFR + 3.25%), 10/18/28 | | 34,412 | 33,838,517 |
| ClubCorp Holdings, Inc., Term Loan, 8.19%, (1 mo. USD LIBOR + 2.75%), 9/18/26 | | 19,976 | 19,584,953 |
| GVC Holdings (Gibraltar) Limited, Term Loan, 7.722%, (3 mo. EURIBOR + 3.75%), 6/30/28 | EUR | 21,225 | 22,444,142 |
34
See Notes to Financial Statements.
Eaton Vance
Floating Rate Portfolio
October 31, 2023
Portfolio of Investments — continued
| Borrower/Description | Principal
Amount*
(000's omitted) | Value |
| Hotels, Restaurants & Leisure (continued) |
| Ontario Gaming GTA L.P., Term Loan, 9.64%, (SOFR + 4.25%), 8/1/30 | | 14,925 | $ 14,931,656 |
| Oravel Stays Singapore Pte., Ltd., Term Loan, 13.908%, (SOFR + 8.25%), 6/23/26 | | 5,352 | 4,736,354 |
| Playa Resorts Holding B.V., Term Loan, 9.585%, (SOFR + 4.25%), 1/5/29 | | 25,396 | 25,348,164 |
| Scientific Games International, Inc., Term Loan, 8.435%, (SOFR + 3.00%), 4/14/29 | | 7,406 | 7,407,576 |
| SeaWorld Parks & Entertainment, Inc., Term Loan, 8.439%, (SOFR + 3.00%), 8/25/28 | | 14,823 | 14,816,814 |
| Stars Group Holdings B.V. (The): | | | |
| Term Loan, 6.358%, (3 mo. EURIBOR + 2.50%), 7/21/26 | EUR | 11,225 | 11,889,896 |
| Term Loan, 7.902%, (SOFR + 2.25%), 7/21/26 | | 30,681 | 30,698,086 |
| | | | $ 227,389,417 |
| Household Durables — 1.1% |
| ACProducts, Inc., Term Loan, 9.902%, (SOFR + 4.25%), 5/17/28 | | 18,572 | $ 14,811,569 |
| Libbey Glass, Inc., Term Loan, 11.939%, (SOFR + 6.50%), 11/22/27 | | 14,581 | 13,888,706 |
| Serta Simmons Bedding, LLC, Term Loan, 12.90%, (SOFR + 7.50%), 6/29/28 | | 19,908 | 19,716,731 |
| Solis IV B.V., Term Loan, 8.891%, (SOFR + 3.50%), 2/26/29 | | 13,718 | 12,980,501 |
| | | | $ 61,397,507 |
| Household Products — 0.5% |
| Energizer Holdings, Inc., Term Loan, 7.703%, (SOFR + 2.25%), 12/22/27 | | 6,034 | $ 6,030,729 |
| Kronos Acquisition Holdings, Inc.: | | | |
| Term Loan, 9.402%, (SOFR + 3.75%), 12/22/26 | | 7,986 | 7,840,408 |
| Term Loan, 11.567%, (SOFR + 6.00%), 12/22/26 | | 5,060 | 5,059,875 |
| Nobel Bidco B.V., Term Loan, 7.27%, (6 mo. EURIBOR + 3.50%), 9/1/28 | EUR | 7,950 | 7,757,637 |
| | | | $ 26,688,649 |
| Independent Power and Renewable Electricity Producers — 0.1% |
| Calpine Corporation: | | | |
| Term Loan, 7.439%, (SOFR + 2.00%), 4/5/26 | | 2,301 | $ 2,302,122 |
| Term Loan, 7.939%, (SOFR + 2.50%), 12/16/27 | | 4,411 | 4,412,408 |
| | | | $ 6,714,530 |
| Industrial Conglomerates — 0.4% |
| Ammeraal Beltech Holding B.V., Term Loan, 8.972%, (3 mo. EURIBOR + 5.00%), 12/30/28 | EUR | 8,225 | $ 8,683,293 |
| Borrower/Description | Principal
Amount*
(000's omitted) | Value |
| Industrial Conglomerates (continued) |
| Rain Carbon GmbH, Term Loan, 8.787%, (3 mo. EURIBOR + 5.00%), 10/31/28 | EUR | 15,625 | $ 16,450,153 |
| | | | $ 25,133,446 |
| Insurance — 1.3% |
| Alliant Holdings Intermediate, LLC: | | | |
| Term Loan, 8.835%, (SOFR + 3.50%), 11/5/27 | | 3,759 | $ 3,751,580 |
| Term Loan, 8.939%, (1 mo. USD LIBOR + 3.50%), 11/5/27 | | 13,165 | 13,139,057 |
| AmWINS Group, Inc., Term Loan, 8.189%, (SOFR + 2.75%), 2/19/28 | | 4,987 | 4,983,073 |
| AssuredPartners, Inc.: | | | |
| Term Loan, 8.824%, (SOFR + 3.50%), 2/12/27 | | 5,294 | 5,254,006 |
| Term Loan, 8.939%, (SOFR + 3.50%), 2/12/27 | | 9,810 | 9,741,455 |
| Financiere CEP S.A.S., Term Loan, 7.722%, (3 mo. EURIBOR + 3.75%), 6/18/27 | EUR | 4,125 | 4,299,194 |
| HUB International Limited, Term Loan, 9.662%, (SOFR + 4.25%), 6/20/30 | | 11,372 | 11,382,003 |
| NFP Corp., Term Loan, 8.689%, (SOFR + 3.25%), 2/16/27 | | 17,123 | 16,825,951 |
| USI, Inc., Term Loan, 9/27/30(10) | | 4,500 | 4,484,061 |
| | | | $ 73,860,380 |
| Interactive Media & Services — 0.7% |
| Adevinta ASA: | | | |
| Term Loan, 6.472%, (3 mo. EURIBOR + 2.50%), 6/26/28 | EUR | 5,518 | $ 5,841,755 |
| Term Loan, 8.322%, (SOFR + 2.75%), 6/26/28 | | 1,218 | 1,219,885 |
| Buzz Finco, LLC: | | | |
| Term Loan, 8.174%, (SOFR + 2.75%), 1/29/27 | | 1,961 | 1,962,604 |
| Term Loan, 8.674%, (SOFR + 3.25%), 1/29/27 | | 435 | 435,601 |
| Foundational Education Group, Inc., Term Loan, 9.895%, (SOFR + 4.25%), 8/31/28 | | 5,136 | 4,802,131 |
| Getty Images, Inc.: | | | |
| Term Loan, 9.00%, (3 mo. EURIBOR + 5.00%), 2/19/26 | EUR | 2,224 | 2,348,783 |
| Term Loan, 9.99%, (SOFR + 4.50%), 2/19/26 | | 16,459 | 16,515,205 |
| Match Group, Inc., Term Loan, 7.298%, (SOFR + 1.75%), 2/13/27 | | 6,450 | 6,431,863 |
| | | | $ 39,557,827 |
| IT Services — 4.5% |
| Asurion, LLC: | | | |
| Term Loan, 8.689%, (SOFR + 3.25%), 12/23/26 | | 543 | $ 526,048 |
| Term Loan, 8.689%, (SOFR + 3.25%), 7/31/27 | | 8,930 | 8,539,127 |
| Term Loan, 9.424%, (SOFR + 4.00%), 8/19/28 | | 9,059 | 8,663,771 |
| Term Loan, 9.674%, (SOFR + 4.25%), 8/19/28 | | 7,100 | 6,794,716 |
35
See Notes to Financial Statements.
Eaton Vance
Floating Rate Portfolio
October 31, 2023
Portfolio of Investments — continued
| Borrower/Description | Principal
Amount*
(000's omitted) | Value |
| IT Services (continued) |
| Asurion, LLC: (continued) | | | |
| Term Loan - Second Lien, 10.689%, (SOFR + 5.25%), 1/31/28 | | 15,790 | $ 13,783,359 |
| Term Loan - Second Lien, 10.689%, (SOFR + 5.25%), 1/20/29 | | 2,375 | 2,040,460 |
| Cyxtera DC Holdings, Inc.: | | | |
| DIP Loan, 13.951%, (SOFR + 8.50%), 12/7/23 | | 10,226 | 10,296,718 |
| Term Loan, 0.00%, 5/1/24(13) | | 27,147 | 15,881,174 |
| Term Loan, 0.00%, 5/1/24(13) | | 9,711 | 5,705,269 |
| Endure Digital, Inc., Term Loan, 9.422%, (SOFR + 3.50%), 2/10/28 | | 29,774 | 27,712,931 |
| Gainwell Acquisition Corp., Term Loan, 9.49%, (SOFR + 4.00%), 10/1/27 | | 37,722 | 36,150,006 |
| Go Daddy Operating Company, LLC, Term Loan, 7.824%, (SOFR + 2.50%), 11/9/29 | | 44,728 | 44,818,898 |
| Informatica, LLC, Term Loan, 8.189%, (SOFR + 2.75%), 10/27/28 | | 31,594 | 31,569,200 |
| NAB Holdings, LLC, Term Loan, 8.54%, (SOFR + 3.00%), 11/23/28 | | 14,352 | 14,281,708 |
| Rackspace Technology Global, Inc., Term Loan, 8.206%, (SOFR + 2.75%), 2/15/28 | | 16,263 | 7,330,724 |
| Sedgwick Claims Management Services, Inc., Term Loan, 9.074%, (SOFR + 3.75%), 2/24/28 | | 12,918 | 12,889,655 |
| team.blue Finco S.a.r.l., Term Loan, 7.105%, (1 mo. EURIBOR + 3.20%), 3/30/28 | EUR | 11,150 | 11,351,719 |
| WEX, Inc., Term Loan, 7.689%, (SOFR + 2.25%), 3/31/28 | | 3,900 | 3,902,707 |
| | | | $ 262,238,190 |
| Leisure Products — 0.5% |
| Amer Sports Oyj, Term Loan, 7.948%, (3 mo. EURIBOR + 4.00%), 3/30/26 | EUR | 11,925 | $ 12,531,098 |
| Fender Musical Instruments Corporation, Term Loan, 9.439%, (SOFR + 4.00%), 12/1/28 | | 2,262 | 2,186,802 |
| Hayward Industries, Inc., Term Loan, 8.189%, (SOFR + 2.75%), 5/30/28 | | 9,055 | 8,918,980 |
| Recess Holdings, Inc., Term Loan, 9.383%, (SOFR + 4.00%), 3/29/27 | | 6,200 | 6,188,375 |
| SRAM, LLC, Term Loan, 8.189%, (SOFR + 2.75%), 5/18/28 | | 1,891 | 1,886,635 |
| | | | $ 31,711,890 |
| Life Sciences Tools & Services — 2.4% |
| Avantor Funding, Inc., Term Loan, 6.368%, (1 mo. EURIBOR + 2.50%), 6/12/28 | EUR | 19,257 | $ 20,283,883 |
| Cambrex Corporation, Term Loan, 8.924%, (SOFR + 3.50%), 12/4/26 | | 324 | 321,652 |
| Borrower/Description | Principal
Amount*
(000's omitted) | Value |
| Life Sciences Tools & Services (continued) |
| Catalent Pharma Solutions, Inc., Term Loan, 7.453%, (SOFR + 2.00%), 2/22/28 | | 1,024 | $ 998,156 |
| Curia Global, Inc., Term Loan, 9.233%, (SOFR + 3.75%), 8/30/26(11) | | 17,267 | 13,904,367 |
| ICON Luxembourg S.a.r.l., Term Loan, 7.902%, (SOFR + 2.25%), 7/3/28 | | 42,949 | 43,014,785 |
| IQVIA, Inc., Term Loan, 7.402%, (SOFR + 1.75%), 1/17/25 | | 12,472 | 12,515,174 |
| LGC Group Holdings, Ltd., Term Loan, 7.118%, (1 mo. EURIBOR + 3.25%), 4/21/27 | EUR | 5,775 | 5,989,412 |
| Loire Finco Luxembourg S.a.r.l., Term Loan, 8.924%, (SOFR + 3.50%), 4/21/27 | | 1,122 | 1,095,741 |
| PRA Health Sciences, Inc., Term Loan, 7.902%, (SOFR + 2.25%), 7/3/28 | | 10,701 | 10,717,311 |
| Sotera Health Holdings, LLC, Term Loan, 8.395%, (SOFR + 2.75%), 12/11/26 | | 17,828 | 17,756,828 |
| Star Parent, Inc., Term Loan, 9.386%, (3 mo. USD LIBOR + 4.00%), 9/27/30 | | 14,400 | 13,780,498 |
| | | | $ 140,377,807 |
| Machinery — 4.1% |
| AI Aqua Merger Sub, Inc., Term Loan, 9.082%, (SOFR + 3.75%), 7/31/28 | | 21,985 | $ 21,581,519 |
| Albion Financing 3 S.a.r.l.: | | | |
| Term Loan, 10.883%, (SOFR + 5.50%), 8/17/26 | | 3,507 | 3,505,183 |
| Term Loan, 10.924%, (SOFR + 5.25%), 8/17/26 | | 3,462 | 3,461,824 |
| Ali Group North America Corporation, Term Loan, 7.439%, (SOFR + 2.00%), 7/30/29 | | 15,103 | 15,106,586 |
| American Trailer World Corp., Term Loan, 9.174%, (SOFR + 3.75%), 3/3/28 | | 13,302 | 12,515,345 |
| Apex Tool Group, LLC, Term Loan, 10.689%, (SOFR + 5.25%), 2/8/29 | | 20,424 | 17,424,445 |
| Barnes Group, Inc., Term Loan, 8.424%, (SOFR + 3.00%), 9/3/30 | | 17,375 | 17,260,985 |
| Clark Equipment Company, Term Loan, 7.99%, (SOFR + 2.50%), 4/20/29 | | 10,061 | 10,083,932 |
| Conair Holdings, LLC, Term Loan, 9.189%, (SOFR + 3.75%), 5/17/28 | | 24,206 | 22,496,451 |
| CPM Holdings, Inc., Term Loan, 9.827%, (SOFR + 4.50%), 9/28/28 | | 4,000 | 4,003,752 |
| Delachaux Group S.A., Term Loan, 9.88%, (SOFR + 4.50%), 4/16/26 | | 3,570 | 3,570,000 |
| Delachaux Group SA, Term Loan, 4/16/29(10) | EUR | 6,600 | 6,893,054 |
| EMRLD Borrower, L.P., Term Loan, 8.38%, (SOFR + 3.00%), 5/31/30 | | 11,275 | 11,267,953 |
| Engineered Machinery Holdings, Inc.: | | | |
| Term Loan, 7.722%, (3 mo. EURIBOR + 3.75%), 5/21/28 | EUR | 10,658 | 11,128,697 |
36
See Notes to Financial Statements.
Eaton Vance
Floating Rate Portfolio
October 31, 2023
Portfolio of Investments — continued
| Borrower/Description | Principal
Amount*
(000's omitted) | Value |
| Machinery (continued) |
| Engineered Machinery Holdings, Inc.: (continued) | | | |
| Term Loan, 9.152%, (SOFR + 3.50%), 5/19/28 | | 9,975 | $ 9,888,897 |
| Term Loan - Second Lien, 11.652%, (SOFR + 6.00%), 5/21/29 | | 2,000 | 1,960,000 |
| Icebox Holdco III, Inc., Term Loan, 9.402%, (SOFR + 3.75%), 12/22/28 | | 4,148 | 4,068,701 |
| INNIO Group Holding GmbH, Term Loan, 6.871%, (1 mo. EURIBOR + 3.00%), 10/31/25 | EUR | 6,125 | 6,444,409 |
| Madison IAQ, LLC, Term Loan, 8.703%, (SOFR + 3.25%), 6/21/28 | | 11,581 | 11,183,982 |
| Pro Mach Group, Inc., Term Loan, 9.439%, (SOFR + 4.00%), 8/31/28 | | 2,798 | 2,794,266 |
| Roper Industrial Products Investment Company, LLC: | | | |
| Term Loan, 8.972%, (3 mo. EURIBOR + 5.25%), 11/22/29 | EUR | 995 | 1,050,836 |
| Term Loan, 9.89%, (SOFR + 4.50%), 11/22/29 | | 6,431 | 6,425,376 |
| SPX Flow, Inc., Term Loan, 9.924%, (SOFR + 4.50%), 4/5/29 | | 12,331 | 12,240,525 |
| TK Elevator Topco GmbH, Term Loan, 7.597%, (6 mo. EURIBOR + 3.63%), 7/30/27 | EUR | 9,725 | 10,127,638 |
| Zephyr German BidCo GmbH, Term Loan, 7.833%, (3 mo. EURIBOR + 3.85%), 3/10/28 | EUR | 11,775 | 11,766,951 |
| | | | $ 238,251,307 |
| Media — 1.3% |
| CSC Holdings, LLC: | | | |
| Term Loan, 7.699%, (1 mo. USD LIBOR + 2.25%), 7/17/25 | | 15,119 | $ 14,705,074 |
| Term Loan, 7.699%, (1 mo. USD LIBOR + 2.25%), 1/15/26 | | 4 | 3,944 |
| Gray Television, Inc., Term Loan, 8.429%, (SOFR + 3.00%), 12/1/28 | | 1,032 | 992,481 |
| Hubbard Radio, LLC, Term Loan, 9.69%, (1 mo. USD LIBOR + 4.25%), 3/28/25 | | 5,892 | 4,988,913 |
| iHeartCommunications, Inc., Term Loan, 8.439%, (SOFR + 3.00%), 5/1/26 | | 2,365 | 2,025,846 |
| Mission Broadcasting, Inc., Term Loan, 7.939%, (SOFR + 2.50%), 6/2/28 | | 3,617 | 3,622,967 |
| Nexstar Broadcasting, Inc., Term Loan, 7.939%, (SOFR + 2.50%), 9/18/26 | | 3,623 | 3,625,360 |
| Recorded Books, Inc., Term Loan, 9.324%, (SOFR + 4.00%), 8/29/25 | | 5,674 | 5,672,558 |
| Sinclair Television Group, Inc.: | | | |
| Term Loan, 7.939%, (SOFR + 2.50%), 9/30/26 | | 6,168 | 5,207,773 |
| Term Loan, 8.439%, (SOFR + 3.00%), 4/1/28 | | 22,672 | 16,370,540 |
| Univision Communications, Inc., Term Loan, 8.689%, (SOFR + 3.25%), 3/15/26 | | 18,188 | 18,081,151 |
| | | | $ 75,296,607 |
| Borrower/Description | Principal
Amount*
(000's omitted) | Value |
| Metals/Mining — 1.2% |
| Arsenal AIC Parent, LLC, Term Loan, 9.879%, (SOFR + 4.50%), 8/18/30 | | 17,850 | $ 17,838,844 |
| Dynacast International, LLC: | | | |
| Term Loan, 10.017%, (SOFR + 4.50%), 7/22/25 | | 15,181 | 14,232,560 |
| Term Loan, 14.517%, (SOFR + 9.00%), 10/22/25 | | 3,034 | 2,290,521 |
| PMHC II, Inc., Term Loan, 9.807%, (SOFR + 4.25%), 4/23/29 | | 16,314 | 14,882,901 |
| WireCo WorldGroup, Inc., Term Loan, 9.699%, (SOFR + 4.25%), 11/13/28 | | 5,923 | 5,900,550 |
| Zekelman Industries, Inc., Term Loan, 7.449%, (SOFR + 2.00%), 1/24/27 | | 15,337 | 15,324,169 |
| | | | $ 70,469,545 |
| Oil, Gas & Consumable Fuels — 1.1% |
| GIP II Blue Holding, L.P., Term Loan, 9.939%, (SOFR + 4.50%), 9/29/28 | | 13,586 | $ 13,621,775 |
| ITT Holdings, LLC, Term Loan, 10/5/30(10) | | 8,575 | ��8,459,769 |
| Matador Bidco S.a.r.l., Term Loan, 9.924%, (SOFR + 4.50%), 10/15/26 | | 29,032 | 29,099,437 |
| Oxbow Carbon, LLC, Term Loan, 9.457%, (SOFR + 4.00%), 5/10/30(11) | | 5,661 | 5,657,274 |
| QuarterNorth Energy Holding, Inc., Term Loan - Second Lien, 13.439%, (SOFR + 8.00%), 8/27/26 | | 5,729 | 5,725,574 |
| | | | $ 62,563,829 |
| Pharmaceuticals — 1.8% |
| Aenova Holding GmbH, Term Loan, 8.487%, (3 mo. EURIBOR + 4.50%), 3/6/26 | EUR | 925 | $ 974,664 |
| AI Sirona (Luxembourg) Acquisition S.a.r.l., Term Loan, 8.868%, (1 mo. EURIBOR + 5.00%), 9/30/28 | EUR | 13,000 | 13,764,932 |
| Bausch Health Companies, Inc., Term Loan, 10.689%, (SOFR + 5.25%), 2/1/27 | | 16,920 | 13,276,381 |
| Ceva Sante Animale: | | | |
| Term Loan, 11/1/30(10) | EUR | 10,300 | 10,854,600 |
| Term Loan, 11/1/30(10) | | 4,175 | 4,180,219 |
| Elanco Animal Health Incorporated, Term Loan, 7.165%, (SOFR + 1.75%), 8/1/27 | | 4,882 | 4,775,261 |
| Jazz Financing Lux S.a.r.l., Term Loan, 8.939%, (SOFR + 3.50%), 5/5/28 | | 6,996 | 7,003,664 |
| Mallinckrodt International Finance S.A.: | | | |
| DIP Loan, 13.439%, (SOFR + 8.00%), 8/28/24 | | 1,458 | 1,517,117 |
| DIP Loan, 13.451%, (SOFR + 8.00%), 8/28/24 | | 2,755 | 2,875,334 |
| Term Loan, 12.703%, (SOFR + 7.25%), 9/30/27 | | 31,218 | 23,774,810 |
| Term Loan, 12.953%, (SOFR + 7.50%), 9/30/27 | | 9,889 | 7,559,108 |
37
See Notes to Financial Statements.
Eaton Vance
Floating Rate Portfolio
October 31, 2023
Portfolio of Investments — continued
| Borrower/Description | Principal
Amount*
(000's omitted) | Value |
| Pharmaceuticals (continued) |
| PharmaZell GmbH, Term Loan, 7.972%, (3 mo. EURIBOR + 4.00%), 5/12/27 | EUR | 1,800 | $ 1,838,873 |
| Recipharm AB, Term Loan, 6.737%, (3 mo. EURIBOR + 2.95%), 2/17/28 | EUR | 13,725 | 13,881,886 |
| | | | $ 106,276,849 |
| Professional Services — 2.5% |
| APFS Staffing Holdings, Inc., Term Loan, 9.324%, (SOFR + 4.00%), 12/29/28 | | 3,669 | $ 3,609,502 |
| Apleona Holding GmbH, Term Loan, 6.898%, (3 mo. EURIBOR + 2.95%), 4/28/28 | EUR | 7,525 | 7,773,102 |
| ASGN Incorporated, Term Loan, 7.574%, (SOFR + 2.25%), 8/30/30 | | 3,850 | 3,868,649 |
| CoreLogic, Inc., Term Loan, 8.939%, (SOFR + 3.50%), 6/2/28 | | 14,099 | 12,865,523 |
| Corporation Service Company, Term Loan, 8.674%, (SOFR + 3.25%), 11/2/29 | | 4,389 | 4,394,584 |
| Deerfield Dakota Holding, LLC, Term Loan, 9.14%, (SOFR + 3.75%), 4/9/27 | | 9,909 | 9,589,141 |
| EAB Global, Inc., Term Loan, 8.939%, (SOFR + 3.50%), 8/16/28 | | 14,394 | 14,172,323 |
| Employbridge Holding Company, Term Loan, 10.407%, (SOFR + 4.75%), 7/19/28 | | 20,600 | 17,966,724 |
| First Advantage Holdings, LLC, Term Loan, 8.189%, (SOFR + 2.75%), 1/31/27 | | 5,857 | 5,865,952 |
| Genuine Financial Holdings, LLC, Term Loan, 9.40%, (SOFR + 4.00%), 9/27/30 | | 4,100 | 4,062,846 |
| Neptune Bidco US, Inc., Term Loan, 10.507%, (SOFR + 5.00%), 4/11/29 | | 8,010 | 7,047,331 |
| Rockwood Service Corporation, Term Loan, 9.439%, (SOFR + 4.00%), 1/23/27 | | 9,403 | 9,423,472 |
| Trans Union, LLC: | | | |
| Term Loan, 7.174%, (SOFR + 1.75%), 11/16/26 | | 2,471 | 2,469,157 |
| Term Loan, 7.689%, (SOFR + 2.25%), 12/1/28 | | 32,301 | 32,293,109 |
| Vaco Holdings, LLC, Term Loan, 10.393%, (SOFR + 5.00%), 1/21/29 | | 9,136 | 8,667,313 |
| | | | $ 144,068,728 |
| Real Estate Management & Development — 0.8% |
| Cushman & Wakefield U.S. Borrower, LLC: | | | |
| Term Loan, 8.189%, (SOFR + 2.75%), 8/21/25 | | 734 | $ 733,059 |
| Term Loan, 8.674%, (SOFR + 3.25%), 1/31/30 | | 6,661 | 6,377,944 |
| Term Loan, 9.324%, (SOFR + 4.00%), 1/31/30 | | 6,376 | 6,088,794 |
| Greystar Real Estate Partners, LLC, Term Loan, 9.147%, (SOFR + 3.75%), 8/21/30 | | 6,300 | 6,300,000 |
| Borrower/Description | Principal
Amount*
(000's omitted) | Value |
| Real Estate Management & Development (continued) |
| Homeserve USA Holding Corp., Term Loan, 8.416%, (SOFR + 3.00%), 10/21/30 | | 9,500 | $ 9,476,250 |
| RE/MAX International, Inc., Term Loan, 7.939%, (SOFR + 2.50%), 7/21/28 | | 16,251 | 15,686,217 |
| | | | $ 44,662,264 |
| Road & Rail — 2.2% |
| Avis Budget Car Rental, LLC: | | | |
| Term Loan, 7.189%, (SOFR + 1.75%), 8/6/27 | | 30,242 | $ 30,122,459 |
| Term Loan, 8.924%, (SOFR + 3.50%), 3/16/29 | | 4,104 | 4,112,375 |
| Grab Holdings, Inc., Term Loan, 9.939%, (SOFR + 4.50%), 1/29/26 | | 15,163 | 15,224,180 |
| Hertz Corporation (The): | | | |
| Term Loan, 8.691%, (SOFR + 3.25%), 6/30/28 | | 17,106 | 16,991,353 |
| Term Loan, 8.691%, (SOFR + 3.25%), 6/30/28 | | 3,298 | 3,275,925 |
| Uber Technologies, Inc., Term Loan, 8.159%, (SOFR + 2.75%), 3/3/30 | | 58,172 | 58,215,364 |
| | | | $ 127,941,656 |
| Semiconductors & Semiconductor Equipment — 0.8% |
| Altar Bidco, Inc.: | | | |
| Term Loan, 8.142%, (SOFR + 3.10%), 2/1/29(11) | | 10,662 | $ 10,581,092 |
| Term Loan - Second Lien, 10.493%, (SOFR + 5.60%), 2/1/30 | | 6,650 | 6,467,125 |
| Bright Bidco B.V., Term Loan, 14.378%, (SOFR + 9.00%), 6.378% cash, 8.00% PIK, 10/31/27 | | 3,671 | 1,436,387 |
| Entegris, Inc., Term Loan, 7.89%, (SOFR + 2.50%), 7/6/29 | | 1,261 | 1,263,364 |
| MaxLinear, Inc., Term Loan, 7.689%, (SOFR + 2.25%), 6/23/28 | | 2,955 | 2,911,027 |
| MKS Instruments, Inc., Term Loan, 7.819%, (SOFR + 2.50%), 8/17/29 | | 17,769 | 17,662,384 |
| Synaptics Incorporated, Term Loan, 7.914%, (SOFR + 2.25%), 12/2/28 | | 2,756 | 2,745,164 |
| Ultra Clean Holdings, Inc., Term Loan, 9.191%, (SOFR + 3.75%), 8/27/25 | | 1,915 | 1,919,671 |
| | | | $ 44,986,214 |
| Software — 11.2% |
| Applied Systems, Inc., Term Loan, 9.89%, (SOFR + 4.50%), 9/18/26 | | 43,660 | $ 43,808,392 |
| Aptean, Inc.: | | | |
| Term Loan, 9.674%, (SOFR + 4.25%), 4/23/26 | | 10,206 | 10,197,728 |
| Term Loan - Second Lien, 12.424%, (SOFR + 7.00%), 4/23/27 | | 6,550 | 6,116,062 |
| Astra Acquisition Corp.: | | | |
| Term Loan, 10.902%, (SOFR + 5.25%), 10/25/28 | | 5,017 | 3,441,044 |
38
See Notes to Financial Statements.
Eaton Vance
Floating Rate Portfolio
October 31, 2023
Portfolio of Investments — continued
| Borrower/Description | Principal
Amount*
(000's omitted) | Value |
| Software (continued) |
| Astra Acquisition Corp.: (continued) | | | |
| Term Loan - Second Lien, 14.527%, (SOFR + 8.88%), 10/25/29 | | 20,170 | $ 10,589,329 |
| Banff Merger Sub, Inc.: | | | |
| Term Loan, 7.868%, (1 mo. EURIBOR + 4.00%), 10/2/25 | EUR | 1,911 | 2,019,684 |
| Term Loan, 9.189%, (SOFR + 3.75%), 10/2/25 | | 678 | 678,486 |
| Term Loan - Second Lien, 10.939%, (SOFR + 5.50%), 2/27/26 | | 3,191 | 3,178,557 |
| Cegid Group SAS, Term Loan, 7/10/28(10) | EUR | 6,150 | 6,468,000 |
| Central Parent, Inc., Term Loan, 9.406%, (SOFR + 4.00%), 7/6/29 | | 19,825 | 19,742,953 |
| CentralSquare Technologies, LLC, Term Loan, 9.29%, (SOFR + 3.75%), 8/29/25 | | 18,359 | 17,370,091 |
| Cloud Software Group, Inc.: | | | |
| Term Loan, 9.99%, (SOFR + 4.50%), 9/29/28 | | 9,480 | 9,006,300 |
| Term Loan, 9.99%, (SOFR + 4.50%), 3/30/29 | | 4,489 | 4,273,824 |
| Cloudera, Inc.: | | | |
| Term Loan, 9.174%, (SOFR + 3.75%), 10/8/28 | | 17,558 | 16,935,979 |
| Term Loan - Second Lien, 11.424%, (SOFR + 6.00%), 10/8/29 | | 2,950 | 2,660,531 |
| Constant Contact, Inc., Term Loan, 9.687%, (SOFR + 4.00%), 2/10/28 | | 5,036 | 4,682,310 |
| Cornerstone OnDemand, Inc., Term Loan, 9.189%, (SOFR + 3.75%), 10/16/28 | | 15,465 | 14,638,108 |
| Delta TopCo, Inc., Term Loan, 9.069%, (SOFR + 3.75%), 12/1/27 | | 10,916 | 10,762,710 |
| E2open, LLC, Term Loan, 8.939%, (SOFR + 3.50%), 2/4/28 | | 16,175 | 15,982,547 |
| ECI Macola Max Holding, LLC, Term Loan, 9.402%, (SOFR + 3.75%), 11/9/27 | | 14,207 | 14,155,479 |
| Epicor Software Corporation: | | | |
| Term Loan, 8.689%, (SOFR + 3.25%), 7/30/27 | | 34,598 | 34,470,475 |
| Term Loan, 9.074%, (SOFR + 3.75%), 7/30/27 | | 8,650 | 8,674,869 |
| Fiserv Investment Solutions, Inc., Term Loan, 9.383%, (SOFR + 4.00%), 2/18/27 | | 12,441 | 11,690,527 |
| Gen Digital, Inc., Term Loan, 7.424%, (SOFR + 2.00%), 9/12/29 | | 1,473 | 1,462,022 |
| GoTo Group, Inc., Term Loan, 10.283%, (SOFR + 4.75%), 8/31/27 | | 24,160 | 15,295,988 |
| IGT Holding IV AB: | | | |
| Term Loan, 7.122%, (3 mo. EURIBOR + 3.15%), 3/31/28 | EUR | 6,205 | 6,406,403 |
| Term Loan, 8.962%, (SOFR + 3.40%), 3/31/28 | | 4,015 | 3,997,521 |
| iSolved, Inc., Term Loan, 9.484%, (SOFR + 4.00%), 10/14/30 | | 5,175 | 5,184,703 |
| Ivanti Software, Inc., Term Loan, 9.907%, (SOFR + 4.25%), 12/1/27 | | 3,769 | 3,359,901 |
| Borrower/Description | Principal
Amount*
(000's omitted) | Value |
| Software (continued) |
| Magenta Buyer, LLC: | | | |
| Term Loan, 10.645%, (SOFR + 5.00%), 7/27/28 | | 14,734 | $ 10,313,763 |
| Term Loan - Second Lien, 13.895%, (SOFR + 8.25%), 7/27/29 | | 7,100 | 3,074,300 |
| Marcel LUX IV S.a.r.l.: | | | |
| Term Loan, 7.455%, (3 mo. EURIBOR + 3.50%), 3/16/26 | EUR | 8,650 | 9,146,847 |
| Term Loan, 8.689%, (SOFR + 3.25%), 3/15/26 | | 15,741 | 15,740,846 |
| Term Loan, 9.436%, (SOFR + 4.00%), 12/31/27 | | 3,076 | 3,075,586 |
| Maverick Bidco, Inc., Term Loan, 9.283%, (SOFR + 3.75%), 5/18/28 | | 10,958 | 10,727,767 |
| McAfee, LLC, Term Loan, 9.165%, (SOFR + 3.75%), 3/1/29 | | 19,753 | 18,917,874 |
| Mosel Bidco SE: | | | |
| Term Loan, 8.691%, (3 mo. EURIBOR + 4.75%), 9/16/30 | EUR | 1,825 | 1,918,987 |
| Term Loan, 10.164%, (SOFR + 4.75%), 9/16/30 | | 2,575 | 2,571,781 |
| N-Able International Holdings II, LLC, Term Loan, 8.434%, (SOFR + 2.75%), 7/19/28 | | 1,264 | 1,262,453 |
| Open Text Corporation, Term Loan, 8.174%, (SOFR + 2.75%), 1/31/30 | | 24,532 | 24,558,657 |
| Polaris Newco, LLC: | | | |
| Term Loan, 7.868%, (1 mo. EURIBOR + 4.00%), 6/2/28 | EUR | 8,477 | 8,459,375 |
| Term Loan, 9.439%, (SOFR + 4.00%), 6/2/28 | | 2,942 | 2,784,596 |
| Proofpoint, Inc., Term Loan, 8.689%, (SOFR + 3.25%), 8/31/28 | | 10,903 | 10,736,428 |
| Quest Software US Holdings, Inc., Term Loan, 9.783%, (SOFR + 4.25%), 2/1/29 | | 17,582 | 13,996,447 |
| RealPage, Inc., Term Loan, 8.439%, (SOFR + 3.00%), 4/24/28 | | 10,718 | 10,483,087 |
| Red Planet Borrower, LLC, Term Loan, 9.174%, (SOFR + 3.75%), 10/2/28 | | 15,190 | 14,224,912 |
| Redstone Holdco 2, L.P., Term Loan, 10.189%, (SOFR + 4.75%), 4/27/28 | | 11,692 | 9,397,300 |
| Sabre GLBL, Inc.: | | | |
| Term Loan, 8.939%, (SOFR + 3.50%), 12/17/27 | | 5,850 | 5,009,009 |
| Term Loan, 8.939%, (SOFR + 3.50%), 12/17/27 | | 3,744 | 3,205,508 |
| Term Loan, 9.674%, (SOFR + 4.25%), 6/30/28 | | 3,513 | 3,009,183 |
| Term Loan, 10.424%, (SOFR + 5.00%), 6/30/28 | | 1,000 | 858,333 |
| Skillsoft Corporation, Term Loan, 10.699%, (SOFR + 5.25%), 7/14/28 | | 10,339 | 9,489,232 |
| SolarWinds Holdings, Inc., Term Loan, 9.074%, (SOFR + 3.75%), 2/5/27 | | 17,189 | 17,204,748 |
| Sophia, L.P., Term Loan, 8.924%, (SOFR + 3.50%), 10/7/27 | | 23,191 | 22,918,428 |
| Turing Midco, LLC, Term Loan, 7.939%, (SOFR + 2.50%), 3/24/28 | | 466 | 465,408 |
39
See Notes to Financial Statements.
Eaton Vance
Floating Rate Portfolio
October 31, 2023
Portfolio of Investments — continued
| Borrower/Description | Principal
Amount*
(000's omitted) | Value |
| Software (continued) |
| Ultimate Software Group, Inc. (The), Term Loan, 8.764%, (SOFR + 3.25%), 5/4/26 | | 45,569 | $ 45,389,490 |
| Veritas US, Inc., Term Loan, 10.439%, (SOFR + 5.11%), 9/1/25 | | 14,896 | 12,647,834 |
| Vision Solutions, Inc.: | | | |
| Term Loan, 9.64%, (SOFR + 4.00%), 4/24/28 | | 33,319 | 31,840,455 |
| Term Loan - Second Lien, 12.791%, (SOFR + 7.25%), 4/23/29 | | 1,500 | 1,332,188 |
| VS Buyer, LLC, Term Loan, 8.674%, (SOFR + 3.25%), 2/28/27 | | 11,035 | 10,966,337 |
| | | | $ 642,977,682 |
| Specialty Retail — 2.0% |
| Belron Luxembourg S.a.r.l., Term Loan, 6.147%, (3 mo. EURIBOR + 2.43%), 4/13/28 | EUR | 3,575 | $ 3,781,358 |
| Boels Topholding B.V., Term Loan, 7.049%, (EURIBOR + 3.25%), 2/6/27(11) | EUR | 6,681 | 7,070,675 |
| Etraveli Holding AB, Term Loan, 7.972%, (3 mo. EURIBOR + 4.00%), 8/2/24 | EUR | 7,844 | 8,289,399 |
| Great Outdoors Group, LLC, Term Loan, 9.402%, (SOFR + 3.75%), 3/6/28 | | 27,320 | 27,158,016 |
| Harbor Freight Tools USA, Inc., Term Loan, 8.189%, (SOFR + 2.75%), 10/19/27 | | 17,787 | 17,588,354 |
| Hoya Midco, LLC, Term Loan, 8.633%, (SOFR + 3.25%), 2/3/29 | | 2,640 | 2,640,737 |
| Les Schwab Tire Centers, Term Loan, 8.692%, (SOFR + 3.25%), 11/2/27 | | 13,866 | 13,836,792 |
| LIDS Holdings, Inc., Term Loan, 11.06%, (SOFR + 5.50%), 12/14/26 | | 5,020 | 4,856,396 |
| Mattress Firm, Inc., Term Loan, 9.95%, (6 mo. USD LIBOR + 4.25%), 9/25/28 | | 15,867 | 15,703,325 |
| PetSmart, Inc., Term Loan, 9.174%, (SOFR + 3.75%), 2/11/28 | | 12,226 | 12,104,978 |
| | | | $ 113,030,030 |
| Trading Companies & Distributors — 2.8% |
| American Builders & Contractors Supply Co., Inc., Term Loan, 7.424%, (SOFR + 2.00%), 1/15/27 | | 13,482 | $ 13,476,022 |
| Avolon TLB Borrower 1 (US), LLC: | | | |
| Term Loan, 7.689%, (SOFR + 2.25%), 12/1/27 | | 14,812 | 14,831,679 |
| Term Loan, 7.839%, (SOFR + 2.50%), 6/22/28 | | 26,017 | 26,049,069 |
| DXP Enterprises, Inc., Term Loan, 10.291%, (SOFR + 4.75%), 10/11/30 | | 7,225 | 7,188,875 |
| Electro Rent Corporation, Term Loan, 11.002%, (SOFR + 5.50%), 11/1/24 | | 15,594 | 14,657,896 |
| Park River Holdings, Inc., Term Loan, 8.907%, (SOFR + 3.25%), 12/28/27 | | 6,056 | 5,739,875 |
| Borrower/Description | Principal
Amount*
(000's omitted) | Value |
| Trading Companies & Distributors (continued) |
| Patagonia Bidco Limited, Term Loan, 10.181%, (SONIA + 5.25%), 11/1/28 | GBP | 20,400 | $ 20,781,449 |
| PEARLS (Netherlands) Bidco B.V., Term Loan, 7.448%, (3 mo. EURIBOR + 3.50%), 2/26/29 | EUR | 6,000 | 6,199,143 |
| Spin Holdco, Inc., Term Loan, 9.664%, (SOFR + 4.00%), 3/4/28 | | 38,506 | 33,100,161 |
| SRS Distribution, Inc.: | | | |
| Term Loan, 8.825%, (SOFR + 3.50%), 6/2/28 | | 4,986 | 4,885,217 |
| Term Loan, 8.939%, (SOFR + 3.50%), 6/2/28 | | 4,256 | 4,167,106 |
| Windsor Holdings III, LLC, Term Loan, 9.815%, (SOFR + 4.50%), 8/1/30 | | 10,600 | 10,580,602 |
| | | | $ 161,657,094 |
| Wireless Telecommunication Services — 0.4% |
| CCI Buyer, Inc., Term Loan, 9.39%, (SOFR + 4.00%), 12/17/27 | | 8,517 | $ 8,351,070 |
| Digicel International Finance Limited, Term Loan, 8.902%, (3 mo. USD LIBOR + 3.25%), 5/28/24 | | 13,909 | 12,807,977 |
| | | | $ 21,159,047 |
Total Senior Floating-Rate Loans
(identified cost $4,984,582,462) | | | $4,692,860,551 |
| Short-Term Investments — 2.5% |
| Security | Shares | Value |
| Morgan Stanley Institutional Liquidity Funds - Government Portfolio, Institutional Class, 5.25%(14) | | 143,913,942 | $ 143,913,942 |
Total Short-Term Investments
(identified cost $143,913,942) | | | $ 143,913,942 |
Total Investments — 98.8%
(identified cost $6,124,721,829) | | | $5,693,053,512 |
| Less Unfunded Loan Commitments — (0.2)% | | | $ (9,340,092) |
Net Investments — 98.6%
(identified cost $6,115,381,737) | | | $5,683,713,420 |
| Other Assets, Less Liabilities — 1.4% | | | $ 78,060,673 |
| Net Assets — 100.0% | | | $5,761,774,093 |
40
See Notes to Financial Statements.
Eaton Vance
Floating Rate Portfolio
October 31, 2023
Portfolio of Investments — continued
| The percentage shown for each investment category in the Portfolio of Investments is based on net assets. |
| * | In U.S. dollars unless otherwise indicated. |
| (1) | Security exempt from registration under Rule 144A of the Securities Act of 1933, as amended. These securities may be sold in certain transactions in reliance on an exemption from registration (normally to qualified institutional buyers). At October 31, 2023, the aggregate value of these securities is $775,015,279 or 13.5% of the Portfolio's net assets. |
| (2) | Variable rate security. The stated interest rate represents the rate in effect at October 31, 2023. |
| (3) | Affiliated company (see Note 7). |
| (4) | For fair value measurement disclosure purposes, security is categorized as Level 3 (see Note 8). |
| (5) | Non-income producing security. |
| (6) | Security was acquired in connection with a restructuring of a Senior Loan and may be subject to restrictions on resale. |
| (7) | Amount is less than 0.05%. |
| (8) | When-issued security. |
| (9) | Senior floating-rate loans (Senior Loans) often require prepayments from excess cash flows or permit the borrowers to repay at their election. The degree to which borrowers repay, whether as a contractual requirement or at their election, cannot be predicted with accuracy. As a result, the actual remaining maturity may be substantially less than the stated maturities shown. However, Senior Loans will typically have an expected average life of approximately two to four years. Senior Loans typically have rates of interest which are redetermined periodically by reference to a base lending rate, plus a spread. These base lending rates are primarily the Secured Overnight Financing Rate (“SOFR”) (or the London Interbank Offered Rate (“LIBOR”) for those loans whose rates reset prior to the discontinuance of LIBOR on June 30, 2023) and secondarily, the prime rate offered by one or more major United States banks (the “Prime Rate”). Base lending rates may be subject to a floor, or minimum rate. Rates for SOFR are generally 1 or 3-month tenors and may also be subject to a credit spread adjustment. Senior Loans are generally subject to contractual restrictions that must be satisfied before they can be bought or sold. |
| (10) | This Senior Loan will settle after October 31, 2023, at which time the interest rate will be determined. |
| (11) | The stated interest rate represents the weighted average interest rate at October 31, 2023 of contracts within the senior loan facility. Interest rates on contracts are primarily redetermined either monthly or quarterly by reference to the indicated base lending rate and spread and the reset period. |
| (12) | Unfunded or partially unfunded loan commitments. The stated interest rate reflects the weighted average of the reference rate and spread for the funded portion, if any, and the commitment fees on the portion of the loan that is unfunded. At October 31, 2023, the total value of unfunded loan commitments is $6,974,244. See Note 1F for description. |
| (13) | Issuer is in default with respect to interest and/or principal payments or has declared bankruptcy. For a variable rate security, interest rate has been adjusted to reflect non-accrual status. |
| (14) | May be deemed to be an affiliated investment company. The rate shown is the annualized seven-day yield as of October 31, 2023. |
| Forward Foreign Currency Exchange Contracts (OTC) |
| Currency Purchased | Currency Sold | Counterparty | Settlement
Date | Unrealized
Appreciation | Unrealized
(Depreciation) |
| USD | 287,023,615 | EUR | 270,766,698 | Standard Chartered Bank | 11/2/23 | $ 525,294 | $ — |
| EUR | 14,000,000 | USD | 15,040,448 | Citibank, N.A. | 11/30/23 | — | (210,457) |
| EUR | 18,000,000 | USD | 19,047,411 | Standard Chartered Bank | 11/30/23 | 19,720 | — |
| GBP | 3,000,000 | USD | 3,636,540 | Bank of America, N.A. | 11/30/23 | 10,400 | — |
| GBP | 2,500,000 | USD | 3,120,889 | Standard Chartered Bank | 11/30/23 | — | (81,773) |
| USD | 110,019,993 | EUR | 100,710,607 | Bank of America, N.A. | 11/30/23 | 3,338,752 | — |
| USD | 59,582,046 | EUR | 54,562,394 | Bank of America, N.A. | 11/30/23 | 1,784,918 | — |
| USD | 68,691,808 | EUR | 62,922,760 | State Street Bank and Trust Company | 11/30/23 | 2,038,668 | — |
| USD | 2,567,506 | EUR | 2,352,067 | The Toronto-Dominion Bank | 11/30/23 | 75,997 | — |
| USD | 761,273 | GBP | 613,244 | Standard Chartered Bank | 11/30/23 | 15,785 | — |
| USD | 34,684,407 | GBP | 27,484,305 | State Street Bank and Trust Company | 11/30/23 | 1,273,207 | — |
41
See Notes to Financial Statements.
Eaton Vance
Floating Rate Portfolio
October 31, 2023
Portfolio of Investments — continued
| Forward Foreign Currency Exchange Contracts (OTC) (continued) |
| Currency Purchased | Currency Sold | Counterparty | Settlement
Date | Unrealized
Appreciation | Unrealized
(Depreciation) |
| USD | 286,561,635 | EUR | 270,766,698 | Standard Chartered Bank | 12/4/23 | $ — | $ (303,574) |
| EUR | 12,000,000 | USD | 12,742,056 | Standard Chartered Bank | 12/29/23 | — | (9,769) |
| GBP | 3,000,000 | USD | 3,658,724 | State Street Bank and Trust Company | 12/29/23 | — | (10,604) |
| USD | 5,724,145 | EUR | 5,423,311 | Australia and New Zealand Banking Group Limited | 12/29/23 | — | (30,118) |
| USD | 11,599,841 | EUR | 11,000,000 | Australia and New Zealand Banking Group Limited | 12/29/23 | — | (71,422) |
| USD | 11,604,846 | EUR | 11,000,000 | Goldman Sachs International | 12/29/23 | — | (66,417) |
| USD | 11,599,744 | EUR | 11,000,000 | State Street Bank and Trust Company | 12/29/23 | — | (71,519) |
| USD | 11,791,232 | EUR | 11,184,306 | State Street Bank and Trust Company | 12/29/23 | — | (75,584) |
| USD | 11,790,441 | EUR | 11,184,306 | State Street Bank and Trust Company | 12/29/23 | — | (76,375) |
| | | | | | | $9,082,741 | $(1,007,612) |
| Abbreviations: |
| DIP | – Debtor In Possession |
| EURIBOR | – Euro Interbank Offered Rate |
| LIBOR | – London Interbank Offered Rate |
| OTC | – Over-the-counter |
| PIK | – Payment In Kind |
| SOFR | – Secured Overnight Financing Rate |
| SONIA | – Sterling Overnight Interbank Average |
| Currency Abbreviations: |
| EUR | – Euro |
| GBP | – British Pound Sterling |
| USD | – United States Dollar |
42
See Notes to Financial Statements.
Eaton Vance
Floating Rate Portfolio
October 31, 2023
Statement of Assets and Liabilities
| | October 31, 2023 |
| Assets | |
| Unaffiliated investments, at value (identified cost $5,969,122,387) | $ 5,539,799,478 |
| Affiliated investments, at value (identified cost $146,259,350) | 143,913,942 |
| Cash | 35,661,964 |
| Deposits for derivatives collateral — forward foreign currency exchange contracts | 5,450,000 |
| Foreign currency, at value (identified cost $21,705,939) | 21,724,435 |
| Interest receivable | 38,025,559 |
| Dividends receivable from affiliated investments | 852,108 |
| Receivable for investments sold | 98,080,389 |
| Receivable for open forward foreign currency exchange contracts | 9,082,741 |
| Prepaid upfront fees on notes payable | 397,460 |
| Trustees' deferred compensation plan | 272,714 |
| Other receivables | 2,084,589 |
| Prepaid expenses | 94,315 |
| Total assets | $5,895,439,694 |
| Liabilities | |
| Cash collateral due to broker | $ 4,680,000 |
| Payable for investments purchased | 119,375,202 |
| Payable for when-issued securities | 4,225,000 |
| Payable for open forward foreign currency exchange contracts | 1,007,612 |
| Payable to affiliates: | |
| Investment adviser fee | 2,476,271 |
| Trustees' fees | 9,042 |
| Trustees' deferred compensation plan | 272,714 |
| Accrued expenses | 1,619,760 |
| Total liabilities | $ 133,665,601 |
| Net Assets applicable to investors' interest in Portfolio | $5,761,774,093 |
43
See Notes to Financial Statements.
Eaton Vance
Floating Rate Portfolio
October 31, 2023
| | Year Ended |
| | October 31, 2023 |
| Investment Income | |
| Dividend income | $ 3,060,356 |
| Dividend income from affiliated investments | 8,065,316 |
| Interest and other income | 563,764,152 |
| Total investment income | $ 574,889,824 |
| Expenses | |
| Investment adviser fee | $ 32,834,212 |
| Trustees’ fees and expenses | 108,500 |
| Custodian fee | 1,248,549 |
| Legal and accounting services | 883,742 |
| Interest expense and fees | 2,410,276 |
| Miscellaneous | 383,591 |
| Total expenses | $ 37,868,870 |
| Deduct: | |
| Waiver and/or reimbursement of expenses by affiliates | $ 248,686 |
| Total expense reductions | $ 248,686 |
| Net expenses | $ 37,620,184 |
| Net investment income | $ 537,269,640 |
| Realized and Unrealized Gain (Loss) | |
| Net realized gain (loss): | |
| Investment transactions | $ (273,795,704) |
| Foreign currency transactions | 2,065,689 |
| Forward foreign currency exchange contracts | (63,594,397) |
| Net realized loss | $(335,324,412) |
| Change in unrealized appreciation (depreciation): | |
| Investments | $ 467,648,252 |
| Investments - affiliated investments | (8,685,164) |
| Foreign currency | 1,036,077 |
| Forward foreign currency exchange contracts | 11,089,934 |
| Net change in unrealized appreciation (depreciation) | $ 471,089,099 |
| Net realized and unrealized gain | $ 135,764,687 |
| Net increase in net assets from operations | $ 673,034,327 |
44
See Notes to Financial Statements.
Eaton Vance
Floating Rate Portfolio
October 31, 2023
Statements of Changes in Net Assets
| | Year Ended October 31, |
| | 2023 | 2022 |
| Increase (Decrease) in Net Assets | | |
| From operations: | | |
| Net investment income | $ 537,269,640 | $ 418,622,273 |
| Net realized gain (loss) | (335,324,412) | 59,718,560 |
| Net change in unrealized appreciation (depreciation) | 471,089,099 | (831,891,859) |
| Net increase (decrease) in net assets from operations | $ 673,034,327 | $ (353,551,026) |
| Capital transactions: | | |
| Contributions | $ 308,512,496 | $ 2,094,290,768 |
| Withdrawals | (3,320,903,248) | (2,626,390,995) |
| Net decrease in net assets from capital transactions | $(3,012,390,752) | $ (532,100,227) |
| Net decrease in net assets | $(2,339,356,425) | $ (885,651,253) |
| Net Assets | | |
| At beginning of year | $ 8,101,130,518 | $ 8,986,781,771 |
| At end of year | $ 5,761,774,093 | $ 8,101,130,518 |
45
See Notes to Financial Statements.
Eaton Vance
Floating Rate Portfolio
October 31, 2023
| | Year Ended October 31, |
| Ratios/Supplemental Data | 2023 | 2022 | 2021 | 2020 | 2019 |
| Ratios (as a percentage of average daily net assets): | | | | | |
| Expenses | 0.58% (1) | 0.54% (1) | 0.56% | 0.59% | 0.55% |
| Net investment income | 8.21% | 4.39% | 3.51% | 4.17% | 5.09% |
| Portfolio Turnover | 19% | 27% | 26% | 28% | 16% |
| Total Return | 10.63% | (3.32)% | 7.80% | 1.18% | 1.64% |
| Net assets, end of year (000’s omitted) | $5,761,774 | $8,101,131 | $8,986,782 | $5,649,501 | $7,966,641 |
| (1) | Includes a reduction by the investment adviser of a portion of its adviser fee due to the Portfolio's investment in the Liquidity Fund (equal to less than 0.005% of average daily net assets for the years ended October 31, 2023 and 2022). |
Eaton Vance
Floating Rate Portfolio
October 31, 2023
Notes to Financial Statements
1 Significant Accounting Policies
Eaton Vance Floating Rate Portfolio (the Portfolio) is a Massachusetts business trust registered under the Investment Company Act of 1940, as amended (the 1940 Act), as a diversified, open-end management investment company. The Portfolio’s investment objective is to provide a high level of current income. The Declaration of Trust permits the Trustees to issue interests in the Portfolio. At October 31, 2023, Eaton Vance Floating-Rate Fund and Eaton Vance Floating-Rate & High Income Fund held an interest of 86.0% and 14.0%, respectively, in the Portfolio.
The following is a summary of significant accounting policies of the Portfolio. The policies are in conformity with accounting principles generally accepted in the United States of America (U.S. GAAP). The Portfolio is an investment company and follows accounting and reporting guidance in the Financial Accounting Standards Board (FASB) Accounting Standards Codification Topic 946.
A Investment Valuation—The following methodologies are used to determine the market value or fair value of investments.
Senior Floating-Rate Loans. Interests in senior floating-rate loans (Senior Loans) are valued generally at the average mean of bid and ask quotations obtained from a third party pricing service. Senior Loans, for which a valuation is not available or deemed unreliable, are fair valued by the investment adviser utilizing one or more of the valuation techniques described below to assess the likelihood that the borrower will make a full repayment of the loan underlying such Senior Loan. If the investment adviser believes that there is a reasonable likelihood of full repayment, the investment adviser will determine fair value using a matrix pricing approach that considers the yield on the Senior Loan relative to yields on other Senior Loans issued by companies of comparable credit quality. If the investment adviser believes there is not a reasonable likelihood of full repayment, the investment adviser will determine fair value using analyses that include, but are not limited to: (i) a comparison of the value of the borrower’s outstanding equity and debt to that of comparable public companies; (ii) a discounted cash flow analysis; or (iii) when the investment adviser believes it is likely that a borrower will be liquidated or sold, an analysis of the terms of such liquidation or sale. In certain cases, the investment adviser will use a combination of analytical methods to determine fair value, such as when only a portion of a borrower’s assets are likely to be sold. In conducting its assessment and analyses for purposes of determining fair value of a Senior Loan, the investment adviser will use its discretion and judgment in considering and appraising relevant factors. Junior Loans (i.e., subordinated loans and second lien loans) are valued in the same manner as Senior Loans.
Debt Obligations. Debt obligations are generally valued on the basis of valuations provided by third party pricing services, as derived from such services’ pricing models. Inputs to the models may include, but are not limited to, reported trades, executable bid and ask prices, broker/dealer quotations, prices or yields of securities with similar characteristics, interest rates, anticipated prepayments, benchmark curves or information pertaining to the issuer, as well as industry and economic events. The pricing services may use a matrix approach, which considers information regarding securities with similar characteristics to determine the valuation for a security. Short-term debt obligations purchased with a remaining maturity of sixty days or less for which a valuation from a third party pricing service is not readily available may be valued at amortized cost, which approximates fair value.
Equity Securities. Equity securities listed on a U.S. securities exchange generally are valued at the last sale or closing price on the day of valuation or, if no sales took place on such date, at the mean between the closing bid and ask prices on the exchange where such securities are principally traded. Equity securities listed on the NASDAQ National Market System are valued at the NASDAQ official closing price. Unlisted or listed securities for which closing sales prices or closing quotations are not available are valued at the mean between the latest available bid and ask prices or, in the case of preferred equity securities that are not listed or traded in the over-the-counter market, by a third party pricing service that uses various techniques that consider factors including, but not limited to, prices or yields of securities with similar characteristics, benchmark yields, broker/dealer quotes, quotes of underlying common stock, issuer spreads, as well as industry and economic events.
Derivatives. Forward foreign currency exchange contracts are generally valued at the mean of the average bid and average asked prices that are reported by currency dealers to a third party pricing service at the valuation time. Such third party pricing service valuations are supplied for specific settlement periods and the Portfolio’s forward foreign currency exchange contracts are valued at an interpolated rate between the closest preceding and subsequent settlement period reported by the third party pricing service.
Foreign Securities and Currencies. Foreign securities and currencies are valued in U.S. dollars, based on foreign currency exchange rate quotations supplied by a third party pricing service. The pricing service uses a proprietary model to determine the exchange rate. Inputs to the model include reported trades and implied bid/ask spreads.
Other. Investments in management investment companies (including money market funds) that do not trade on an exchange are valued at the net asset value as of the close of each business day.
Fair Valuation. In connection with Rule 2a-5 of the 1940 Act, the Trustees have designated the Portfolio’s investment adviser as its valuation designee. Investments for which valuations or market quotations are not readily available or are deemed unreliable are valued by the investment adviser, as valuation designee, at fair value using methods that most fairly reflect the security’s “fair value”, which is the amount that the Portfolio might reasonably expect to receive for the security upon its current sale in the ordinary course. Each such determination is based on a consideration of relevant factors, which are likely to vary from one pricing context to another. These factors may include, but are not limited to, the type of security, the existence of any contractual restrictions on the security’s disposition, the price and extent of public trading in similar securities of the issuer or of comparable companies or entities, quotations or relevant information obtained from broker/dealers or other market participants, information obtained from the issuer, analysts, and/or the appropriate stock exchange (for exchange-traded securities), an analysis of the company’s or entity’s financial statements, and an evaluation of the forces that influence the issuer and the market(s) in which the security is purchased and sold.
Eaton Vance
Floating Rate Portfolio
October 31, 2023
Notes to Financial Statements — continued
B Investment Transactions—Investment transactions for financial statement purposes are accounted for on a trade date basis. Realized gains and losses on investments sold are determined on the basis of identified cost.
C Income—Interest income is recorded on the basis of interest accrued, adjusted for amortization of premium or accretion of discount. Fees associated with loan amendments are recognized immediately. Dividend income is recorded on the ex-dividend date for dividends received in cash and/or securities. Distributions from investment companies are recorded as dividend income, capital gains or return of capital based on the nature of the distribution.
D Federal Taxes—The Portfolio has elected to be treated as a partnership for federal tax purposes. No provision is made by the Portfolio for federal or state taxes on any taxable income of the Portfolio because each investor in the Portfolio is ultimately responsible for the payment of any taxes on its share of taxable income. Since at least one of the Portfolio's investors is a regulated investment company that invests all or substantially all of its assets in the Portfolio, the Portfolio normally must satisfy the applicable source of income and diversification requirements (under the Internal Revenue Code) in order for its investors to satisfy them. The Portfolio will allocate, at least annually among its investors, each investor's distributive share of the Portfolio's net investment income, net realized capital gains and losses and any other items of income, gain, loss, deduction or credit.
As of October 31, 2023, the Portfolio had no uncertain tax positions that would require financial statement recognition, de-recognition, or disclosure. The Portfolio files a U.S. federal income tax return annually after its fiscal year-end, which is subject to examination by the Internal Revenue Service for a period of three years from the date of filing.
E Foreign Currency Translation—Investment valuations, other assets, and liabilities initially expressed in foreign currencies are translated each business day into U.S. dollars based upon current exchange rates. Purchases and sales of foreign investment securities and income and expenses denominated in foreign currencies are translated into U.S. dollars based upon currency exchange rates in effect on the respective dates of such transactions. Recognized gains or losses on investment transactions attributable to changes in foreign currency exchange rates are recorded for financial statement purposes as net realized gains and losses on investments. That portion of unrealized gains and losses on investments that results from fluctuations in foreign currency exchange rates is not separately disclosed.
F Unfunded Loan Commitments—The Portfolio may enter into certain loan agreements all or a portion of which may be unfunded. The Portfolio is obligated to fund these commitments at the borrower's discretion. These commitments are disclosed in the accompanying Portfolio of Investments. At October 31, 2023, the Portfolio had sufficient cash and/or securities to cover these commitments.
G Use of Estimates—The preparation of the financial statements in conformity with U.S. GAAP requires management to make estimates and assumptions that affect the reported amounts of assets and liabilities at the date of the financial statements and the reported amounts of income and expense during the reporting period. Actual results could differ from those estimates.
H Indemnifications—Under the Portfolio’s organizational documents, its officers and Trustees may be indemnified against certain liabilities and expenses arising out of the performance of their duties to the Portfolio. Under Massachusetts law, if certain conditions prevail, interestholders in the Portfolio could be deemed to have personal liability for the obligations of the Portfolio. However, the Portfolio’s Declaration of Trust contains an express disclaimer of liability on the part of Portfolio interestholders. Additionally, in the normal course of business, the Portfolio enters into agreements with service providers that may contain indemnification clauses. The Portfolio’s maximum exposure under these arrangements is unknown as this would involve future claims that may be made against the Portfolio that have not yet occurred.
I Forward Foreign Currency Exchange Contracts—The Portfolio may enter into forward foreign currency exchange contracts for the purchase or sale of a specific foreign currency at a fixed price on a future date. The forward foreign currency exchange contracts are adjusted by the daily exchange rate of the underlying currency and any gains or losses are recorded as unrealized until such time as the contracts have been closed. Risks may arise upon entering these contracts from the potential inability of counterparties to meet the terms of their contracts and from movements in the value of a foreign currency relative to the U.S. dollar.
J When-Issued Securities and Delayed Delivery Transactions—The Portfolio may purchase securities on a delayed delivery or when-issued basis. Payment and delivery may take place after the customary settlement period for that security. At the time the transaction is negotiated, the price of the security that will be delivered is fixed. The Portfolio maintains cash and/or security positions for these commitments such that sufficient liquid assets will be available to make payments upon settlement. Securities purchased on a delayed delivery or when-issued basis are marked-to-market daily and begin earning interest on settlement date. Such security purchases are subject to the risk that when delivered they will be worth less than the agreed upon payment price. Losses may also arise if the counterparty does not perform under the contract.
Eaton Vance
Floating Rate Portfolio
October 31, 2023
Notes to Financial Statements — continued
2 Investment Adviser Fee and Other Transactions with Affiliates
The investment adviser fee is earned by Boston Management and Research (BMR), an indirect, wholly-owned subsidiary of Morgan Stanley, as compensation for investment advisory services rendered to the Portfolio. The investment adviser fee is computed at an annual rate as a percentage of the Portfolio's average daily net assets as follows and is payable monthly:
| Average Daily Net Assets | Annual Fee Rate |
| Up to $1 billion | 0.5750% |
| $1 billion but less than $2 billion | 0.5250% |
| $2 billion but less than $5 billion | 0.4900% |
| $5 billion but less than $10 billion | 0.4600% |
| $10 billion but less than $15 billion | 0.4350% |
| $15 billion but less than $20 billion | 0.4150% |
| $20 billion but less than $25 billion | 0.4000% |
| $25 billion and over | 0.3900% |
For the year ended October 31, 2023, the Portfolio’s investment adviser fee amounted to $32,834,212 or 0.50% of the Portfolio's average daily net assets. The Portfolio may invest in a money market fund, the Institutional Class of the Morgan Stanley Institutional Liquidity Funds - Government Portfolio (the "Liquidity Fund"), an open-end management investment company managed by Morgan Stanley Investment Management Inc., a wholly-owned subsidiary of Morgan Stanley. The investment adviser fee paid by the Portfolio is reduced by an amount equal to its pro rata share of the advisory and administration fees paid by the Portfolio due to its investment in the Liquidity Fund. For the year ended October 31, 2023, the investment adviser fee paid was reduced by $248,686 relating to the Portfolio's investment in the Liquidity Fund.
Trustees and officers of the Portfolio who are members of BMR’s organization receive remuneration for their services to the Portfolio out of the investment adviser fee. Trustees of the Portfolio who are not affiliated with the investment adviser may elect to defer receipt of all or a percentage of their annual fees in accordance with the terms of the Trustees Deferred Compensation Plan. Certain officers and Trustees of the Portfolio are officers of the above organization.
3 Purchases and Sales of Investments
Purchases and sales of investments, other than short-term obligations and including maturities, paydowns and principal repayments on Senior Loans, aggregated $1,183,936,744 and $3,587,117,176, respectively, for the year ended October 31, 2023.
4 Federal Income Tax Basis of Investments
The cost and unrealized appreciation (depreciation) of investments, including open derivative contracts, of the Portfolio at October 31, 2023, as determined on a federal income tax basis, were as follows:
| Aggregate cost | $6,067,145,036 |
| Gross unrealized appreciation | $ 29,989,140 |
| Gross unrealized depreciation | (413,420,756) |
| Net unrealized depreciation | $ (383,431,616) |
5 Financial Instruments
The Portfolio may trade in financial instruments with off-balance sheet risk in the normal course of its investing activities. These financial instruments may include forward foreign currency exchange contracts and may involve, to a varying degree, elements of risk in excess of the amounts recognized for financial statement purposes. The notional or contractual amounts of these instruments represent the investment the Portfolio has in particular classes of financial instruments and do not necessarily represent the amounts potentially subject to risk. The measurement of the risks associated with these instruments is meaningful only when all related and offsetting transactions are considered. A summary of obligations under these financial instruments at October 31, 2023 is included in the Portfolio of Investments. At October 31, 2023, the Portfolio had sufficient cash and/or securities to cover commitments under these contracts.
Eaton Vance
Floating Rate Portfolio
October 31, 2023
Notes to Financial Statements — continued
The Portfolio is subject to foreign exchange risk in the normal course of pursuing its investment objective. Because the Portfolio holds foreign currency denominated investments, the value of these investments and related receivables and payables may change due to future changes in foreign currency exchange rates. To hedge against this risk, the Portfolio enters into forward foreign currency exchange contracts.
The Portfolio enters into forward foreign currency exchange contracts that may contain provisions whereby the counterparty may terminate the contract under certain conditions, including but not limited to a decline in the Portfolio's net assets below a certain level over a certain period of time, which would trigger a payment by the Portfolio for those derivatives in a liability position. At October 31, 2023, the fair value of derivatives with credit related contingent features in a net liability position was $1,007,612. The aggregate fair value of assets pledged as collateral by the Portfolio for such liability was $770,000 at October 31, 2023.
The over-the-counter (OTC) derivatives in which the Portfolio invests are subject to the risk that the counterparty to the contract fails to perform its obligations under the contract. To mitigate this risk, the Portfolio has entered into an International Swaps and Derivatives Association, Inc. Master Agreement (“ISDA Master Agreement”) or similar agreement with substantially all its derivative counterparties. An ISDA Master Agreement is a bilateral agreement between the Portfolio and a counterparty that governs certain OTC derivatives and typically contains, among other things, set-off provisions in the event of a default and/or termination event as defined under the relevant ISDA Master Agreement. Under an ISDA Master Agreement, the Portfolio may, under certain circumstances, offset with the counterparty certain derivative financial instruments’ payables and/or receivables with collateral held and/or posted and create one single net payment. The provisions of the ISDA Master Agreement typically permit a single net payment in the event of default including the bankruptcy or insolvency of the counterparty. However, bankruptcy or insolvency laws of a particular jurisdiction may impose restrictions on or prohibitions against the right of offset in bankruptcy or insolvency. Certain ISDA Master Agreements allow counterparties to OTC derivatives to terminate derivative contracts prior to maturity in the event the Portfolio’s net assets decline by a stated percentage or the Portfolio fails to meet the terms of its ISDA Master Agreements, which would cause the counterparty to accelerate payment by the Portfolio of any net liability owed to it.
The collateral requirements for derivatives traded under an ISDA Master Agreement are governed by a Credit Support Annex to the ISDA Master Agreement. Collateral requirements are determined at the close of business each day and are typically based on changes in market values for each transaction under an ISDA Master Agreement and netted into one amount for such agreement. Generally, the amount of collateral due from or to a counterparty is subject to a minimum transfer threshold amount before a transfer is required, which may vary by counterparty. Collateral pledged for the benefit of the Portfolio and/or counterparty is held in segregated accounts by the Portfolio’s custodian and cannot be sold, re-pledged, assigned or otherwise used while pledged. The portion of such collateral representing cash, if any, is reflected as deposits for derivatives collateral and, in the case of cash pledged by a counterparty for the benefit of the Portfolio, a corresponding liability on the Statement of Assets and Liabilities. Securities pledged by the Portfolio as collateral, if any, are identified as such in the Portfolio of Investments.
The fair value of open derivative instruments (not considered to be hedging instruments for accounting disclosure purposes) and whose primary underlying risk exposure is foreign exchange risk at October 31, 2023 was as follows:
| | Fair Value |
| Derivative | Asset Derivative(1) | Liability Derivative(2) |
| Forward foreign currency exchange contracts | $9,082,741 | $(1,007,612) |
| (1) | Statement of Assets and Liabilities location: Receivable for open forward foreign currency exchange contracts. |
| (2) | Statement of Assets and Liabilities location: Payable for open forward foreign currency exchange contracts. |
Eaton Vance
Floating Rate Portfolio
October 31, 2023
Notes to Financial Statements — continued
The Portfolio's derivative assets and liabilities at fair value by risk, which are reported gross in the Statement of Assets and Liabilities, are presented in the table above. The following tables present the Portfolio's derivative assets and liabilities by counterparty, net of amounts available for offset under a master netting agreement and net of the related collateral received by the Portfolio for such assets and pledged by the Portfolio for such liabilities as of October 31, 2023.
| Counterparty | Derivative
Assets Subject to
Master Netting
Agreement | Derivatives
Available
for Offset | Non-cash
Collateral
Received(a) | Cash
Collateral
Received(a) | Net Amount
of Derivative
Assets(b) |
| Bank of America, N.A. | $ 5,134,070 | $ — | $ — | $ (4,680,000) | $ 454,070 |
| Standard Chartered Bank | 560,799 | (395,116) | — | — | 165,683 |
| State Street Bank and Trust Company | 3,311,875 | (234,082) | (2,058,264) | — | 1,019,529 |
| The Toronto-Dominion Bank | 75,997 | — | — | — | 75,997 |
| | $9,082,741 | $(629,198) | $(2,058,264) | $(4,680,000) | $1,715,279 |
| Counterparty | Derivative
Liabilities Subject to
Master Netting
Agreement | Derivatives
Available
for Offset | Non-cash
Collateral
Pledged(a) | Cash
Collateral
Pledged(a) | Net Amount
of Derivative
Liabilities(c) |
| Australia and New Zealand Banking Group Limited | $ (101,540) | $ — | $ — | $ — | $ (101,540) |
| Citibank, N.A. | (210,457) | — | — | 210,457 | — |
| Goldman Sachs International | (66,417) | — | — | 60,000 | (6,417) |
| Standard Chartered Bank | (395,116) | 395,116 | — | — | — |
| State Street Bank and Trust Company | (234,082) | 234,082 | — | — | — |
| | $(1,007,612) | $629,198 | $ — | $270,457 | $(107,957) |
| (a) | In some instances, the total collateral received and/or pledged may be more than the amount shown due to overcollateralization. |
| (b) | Net amount represents the net amount due from the counterparty in the event of default. |
| (c) | Net amount represents the net amount payable to the counterparty in the event of default. |
The effect of derivative instruments (not considered to be hedging instruments for accounting disclosure purposes) on the Statement of Operations and whose primary underlying risk exposure is foreign exchange risk for the year ended October 31, 2023 was as follows:
| Derivative | Realized Gain (Loss)
on Derivatives Recognized
in Income(1) | Change in Unrealized
Appreciation (Depreciation) on
Derivatives Recognized in Income(2) |
| Forward foreign currency exchange contracts | $(63,594,397) | $11,089,934 |
| (1) | Statement of Operations location: Net realized gain (loss): Forward foreign currency exchange contracts. |
| (2) | Statement of Operations location: Change in unrealized appreciation (depreciation): Forward foreign currency exchange contracts. |
The average notional amount of forward foreign currency exchange contracts (based on the absolute value of notional amounts of currency purchased and currency sold) outstanding during the year ended October 31, 2023, which is indicative of the volume of this derivative type, was approximately $1,209,633,000.
Eaton Vance
Floating Rate Portfolio
October 31, 2023
Notes to Financial Statements — continued
6 Credit Facility
The Portfolio participates with another portfolio and fund managed by BMR and its affiliates in a $600 million ($700 million prior to March 6, 2023) unsecured credit facility agreement (Agreement) with a group of banks, which is in effect through March 4, 2024. Borrowings are made by the Portfolio solely to facilitate the handling of unusual and/or unanticipated short-term cash requirements. At the Portfolio’s option, any loan under the Credit Facility that is made to it will bear interest at a rate equal to (i) the Benchmark Rate (defined below) plus a margin or, (ii) the Base Rate, or (iii) the Overnight Rate plus a margin. Base Rate is the highest of (a) administrative agent’s prime rate, (b) 50 basis points above the Federal Funds rate, (c) the Benchmark Rate plus a margin and (d) 1.00%, in each case as in effect from time to time. The “Overnight Rate” is the greatest of the Benchmark Rate, the Federal Funds rate and 0.00%. “Benchmark Rate” means Term SOFR (defined as the forward-looking Secured Overnight Financing Rate term rate published two U.S. government securities business days prior to the commencement of the applicable interest period plus the Term SOFR Adjustment) for an interest period of one-month’s duration. To the extent that, at any time, the Benchmark Rate is less than 0.00%, the Benchmark Rate shall be deemed to be 0.00% for purposes of the Credit Facility. “Term SOFR Adjustment” means 0.10%. In addition, a fee computed at an annual rate of 0.15% on the daily unused portion of each lender’s commitment amount is allocated among the participating portfolios and fund at the end of each quarter. Also included in interest expense and fees on the Statement of Operations is approximately $1,167,000 of amortization of upfront fees paid by the Portfolio in connection with the annual renewal of the Agreement. The unamortized balance of upfront fees at October 31, 2023 is $397,460 and is included in prepaid upfront fees on notes payable in the Statement of Assets and Liabilities. Because the credit facility is not available exclusively to the Portfolio and the maximum amount is capped, it may be unable to borrow some or all of a requested amount at any particular time. The Portfolio did not have any significant borrowings during the year ended October 31, 2023.
7 Affiliated Investments
An affiliated company is a company in which a fund has a direct or indirect ownership of, control of, or voting power of 5 percent or more of the outstanding voting shares, or a company that is under common ownership or control with a fund. At October 31, 2023, the value of the Portfolio's investment in affiliated companies and in funds that may be deemed to be affiliated was $143,913,942, which represents 2.5% of the Portfolio's net assets. Transactions in such investments by the Portfolio for the year ended October 31, 2023 were as follows:
| Name | Value,
beginning
of period | Purchases | Sales
proceeds | Net
realized
gain (loss) | Change in
unrealized
appreciation
(depreciation) | Value, end
of period | Dividend
income | Shares,
end of period |
| Common Stocks* |
| IAP Global Services, LLC(1)(2)(3) | $ 8,685,164 | $ — | $ — | $ — | $ (8,685,164) | $ 0 | $ — | 2,577 |
| Short-Term Investments |
| Liquidity Fund | 156,771,808 | 2,181,162,967 | (2,194,020,833) | — | — | 143,913,942 | 8,065,316 | 143,913,942 |
| Total | | | | $ — | $(8,685,164) | $143,913,942 | $8,065,316 | |
| * | The related industry is the same as the presentation in the Portfolio of Investments. |
| (1) | For fair value measurement disclosure purposes, security is categorized as Level 3 (see Note 8). |
| (2) | Non-income producing security. |
| (3) | A portion of the shares were acquired in connection with a restructuring of a Senior Loan and may be subject to restrictions on resale. |
8 Fair Value Measurements
Under generally accepted accounting principles for fair value measurements, a three-tier hierarchy to prioritize the assumptions, referred to as inputs, is used in valuation techniques to measure fair value. The three-tier hierarchy of inputs is summarized in the three broad levels listed below.
| • | Level 1 – quoted prices in active markets for identical investments |
| • | Level 2 – other significant observable inputs (including quoted prices for similar investments, interest rates, prepayment speeds, credit risk, etc.) |
| • | Level 3 – significant unobservable inputs (including a fund's own assumptions in determining the fair value of investments) |
In cases where the inputs used to measure fair value fall in different levels of the fair value hierarchy, the level disclosed is determined based on the lowest level input that is significant to the fair value measurement in its entirety. The inputs or methodology used for valuing securities are not necessarily an indication of the risk associated with investing in those securities.
Eaton Vance
Floating Rate Portfolio
October 31, 2023
Notes to Financial Statements — continued
At October 31, 2023, the hierarchy of inputs used in valuing the Portfolio’s investments and open derivative instruments, which are carried at fair value, were as follows:
| Asset Description | Level 1 | Level 2 | Level 3* | Total |
| Asset-Backed Securities | $ — | $ 270,085,254 | $ — | $ 270,085,254 |
| Common Stocks | 839,909 | 33,435,126 | 1,089,614 | 35,364,649 |
| Corporate Bonds | — | 524,182,503 | — | 524,182,503 |
| Exchange-Traded Funds | 17,700,300 | — | — | 17,700,300 |
| Preferred Stocks | — | 8,946,313 | — | 8,946,313 |
| Senior Floating-Rate Loans (Less Unfunded Loan Commitments) | — | 4,655,307,077 | 28,213,382 | 4,683,520,459 |
| Short-Term Investments | 143,913,942 | — | — | 143,913,942 |
| Total Investments | $ 162,454,151 | $ 5,491,956,273 | $ 29,302,996 | $ 5,683,713,420 |
| Forward Foreign Currency Exchange Contracts | $ — | $ 9,082,741 | $ — | $ 9,082,741 |
| Total | $ 162,454,151 | $ 5,501,039,014 | $ 29,302,996 | $ 5,692,796,161 |
| Liability Description | | | | |
| Forward Foreign Currency Exchange Contracts | $ — | $ (1,007,612) | $ — | $ (1,007,612) |
| Total | $ — | $ (1,007,612) | $ — | $ (1,007,612) |
| * | None of the unobservable inputs for Level 3 assets, individually or collectively, had a material impact on the Portfolio. |
Level 3 investments at the beginning and/or end of the period in relation to net assets were not significant and accordingly, a reconciliation of Level 3 assets for the year ended October 31, 2023 is not presented.
9 Risks and Uncertainties
Risks Associated with Foreign Investments
Foreign investments can be adversely affected by political, economic and market developments abroad, including the imposition of economic and other sanctions by the United States or another country. There may be less publicly available information about foreign issuers because they may not be subject to reporting practices, requirements or regulations comparable to those to which United States companies are subject. Foreign markets may be smaller, less liquid and more volatile than the major markets in the United States. Trading in foreign markets typically involves higher expense than trading in the United States. The Portfolio may have difficulties enforcing its legal or contractual rights in a foreign country. Securities that trade or are denominated in currencies other than the U.S. dollar may be adversely affected by fluctuations in currency exchange rates.
Credit Risk
The Portfolio invests primarily in below investment grade floating-rate loans, which are considered speculative because of the credit risk of their issuers. Changes in economic conditions or other circumstances are more likely to reduce the capacity of issuers of these securities to make principal and interest payments. Such companies are more likely to default on their payments of interest and principal owed than issuers of investment grade bonds. An economic downturn generally leads to a higher non-payment rate, and a loan or other debt obligation may lose significant value before a default occurs. Lower rated investments also may be subject to greater price volatility than higher rated investments. Moreover, the specific collateral used to secure a loan may decline in value or become illiquid, which would adversely affect the loan’s value.
Eaton Vance
Floating Rate Portfolio
October 31, 2023
Report of Independent Registered Public Accounting Firm
To the Trustees and Investors of Eaton Vance Floating Rate Portfolio:
Opinion on the Financial Statements and Financial Highlights
We have audited the accompanying statement of assets and liabilities of Eaton Vance Floating Rate Portfolio (the “Portfolio”), including the portfolio of investments, as of October 31, 2023, the related statement of operations for the year then ended, the statements of changes in net assets for each of the two years in the period then ended, the financial highlights for each of the five years in the period then ended, and the related notes. In our opinion, the financial statements and financial highlights present fairly, in all material respects, the financial position of the Portfolio as of October 31, 2023, and the results of its operations for the year then ended, the changes in its net assets for each of the two years in the period then ended, and the financial highlights for each of the five years in the period then ended, in conformity with accounting principles generally accepted in the United States of America.
Basis for Opinion
These financial statements and financial highlights are the responsibility of the Portfolio’s management. Our responsibility is to express an opinion on the Portfolio’s financial statements and financial highlights based on our audits. We are a public accounting firm registered with the Public Company Accounting Oversight Board (United States) (PCAOB) and are required to be independent with respect to the Portfolio in accordance with the U.S. federal securities laws and the applicable rules and regulations of the Securities and Exchange Commission and the PCAOB.
We conducted our audits in accordance with the standards of the PCAOB. Those standards require that we plan and perform the audit to obtain reasonable assurance about whether the financial statements and financial highlights are free of material misstatement, whether due to error or fraud. The Portfolio is not required to have, nor were we engaged to perform, an audit of its internal control over financial reporting. As part of our audits, we are required to obtain an understanding of internal control over financial reporting but not for the purpose of expressing an opinion on the effectiveness of the Portfolio’s internal control over financial reporting. Accordingly, we express no such opinion.
Our audits included performing procedures to assess the risks of material misstatement of the financial statements and financial highlights, whether due to error or fraud, and performing procedures that respond to those risks. Such procedures included examining, on a test basis, evidence regarding the amounts and disclosures in the financial statements and financial highlights. Our audits also included evaluating the accounting principles used and significant estimates made by management, as well as evaluating the overall presentation of the financial statements and financial highlights. Our procedures included confirmation of securities and senior loans owned as of October 31, 2023, by correspondence with the custodian, brokers and agent banks; when replies were not received from brokers and agent banks, we performed other auditing procedures. We believe that our audits provide a reasonable basis for our opinion.
/s/ Deloitte & Touche LLP
Boston, Massachusetts
December 19, 2023
We have served as the auditor of one or more Eaton Vance investment companies since 1959.
Eaton Vance
Floating-Rate & High Income Fund
October 31, 2023
Board of Trustees’ Contract Approval
Overview of the Contract Review Process
The Investment Company Act of 1940, as amended (the “1940 Act”), provides, in substance, that the investment advisory agreement between a fund and its investment adviser will continue in effect from year-to-year only if its continuation is approved on an annual basis by a vote of the fund’s board of trustees, including a majority of the trustees who are not “interested persons” of the fund (“independent trustees”), cast in person at a meeting called for the purpose of considering such approval.
At a meeting held on June 8, 2023, the Boards of Trustees/Directors (collectively, the “Board”) that oversee the registered investment companies advised by Eaton Vance Management or its affiliate, Boston Management and Research (the “Eaton Vance Funds”), including a majority of the independent trustees (the “Independent Trustees”), voted to approve the continuation of existing investment advisory agreements and sub-advisory agreements1 for each of the Eaton Vance Funds for an additional one-year period. The Board relied upon the affirmative recommendation of its Contract Review Committee, which is a committee exclusively comprised of Independent Trustees. Prior to making its recommendation, the Contract Review Committee reviewed information furnished by the adviser and sub-adviser to each of the Eaton Vance Funds (including information specifically requested by the Board) for a series of formal meetings held between April and June 2023, as well as certain additional information provided in response to specific requests from the Independent Trustees as members of the Contract Review Committee. Members of the Contract Review Committee also considered information received at prior meetings of the Board and its committees, to the extent such information was relevant to the Contract Review Committee’s annual evaluation of the investment advisory agreements and sub-advisory agreements.
In connection with its evaluation of the investment advisory agreements and sub-advisory agreements, the Board considered various information relating to the Eaton Vance Funds. This included information applicable to all or groups of Eaton Vance Funds, which is referenced immediately below, and information applicable to the particular Eaton Vance Fund covered by this report (each “Eaton Vance Fund” is referred to below as a “fund”). (For funds that invest through one or more underlying portfolios, references to “each fund” in this section may include information that was considered at the portfolio-level.)
Information about Fees, Performance and Expenses
• A report from an independent data provider comparing advisory and other fees paid by each fund to such fees paid by comparable funds, as identified by the independent data provider (“comparable funds”);
• A report from an independent data provider comparing each fund’s total expense ratio (and its components) to those of comparable funds;
• A report from an independent data provider comparing the investment performance of each fund (including, as relevant, total return data, income data, Sharpe ratios and information ratios) to the investment performance of comparable funds and, as applicable, benchmark indices, over various time periods;
• In certain instances, data regarding investment performance relative to customized groups of peer funds and blended indices identified by the adviser in consultation with the Portfolio Management Committee of the Board (a committee exclusively comprised of Independent Trustees);
• Comparative information concerning the fees charged and services provided by the adviser and sub-adviser to each fund in managing other accounts (which may include other mutual funds, collective investment funds and institutional accounts) using investment strategies and techniques similar to those used in managing such fund(s), if any;
• Profitability analyses with respect to the adviser and sub-adviser to each of the funds;
Information about Portfolio Management and Trading
• Descriptions of the investment management services provided to each fund, as well as each of the funds’ investment strategies and policies;
• The procedures and processes used to determine the value of fund assets, including, when necessary, the determination of “fair value” and actions taken to monitor and test the effectiveness of such procedures and processes;
• Information about the policies and practices of each fund’s adviser and sub-adviser with respect to trading, including their processes for seeking best execution of portfolio transactions;
• Information about the allocation of brokerage transactions and the benefits, if any, received by the adviser and sub-adviser to each fund as a result of brokerage allocation, including, as applicable, information concerning the acquisition of research through client commission arrangements and policies with respect to “soft dollars”;
• Data relating to the portfolio turnover rate of each fund and related information regarding active management in the context of particular strategies;
Information about each Adviser and Sub-adviser
• Reports detailing the financial results and condition of the adviser and sub-adviser to each fund;
1 Not all Eaton Vance Funds have entered into a sub-advisory agreement with a sub-adviser. Accordingly, references to “sub-adviser” or “sub-advisory agreement” in this “Overview” section may not be applicable to the particular Eaton Vance Fund covered by this report.
Eaton Vance
Floating-Rate & High Income Fund
October 31, 2023
Board of Trustees’ Contract Approval — continued
• Information regarding the individual investment professionals whose responsibilities include portfolio management and investment research for the funds, and, for portfolio managers and certain other investment professionals, information relating to their responsibilities with respect to managing other mutual funds and investment accounts, as applicable;
• Information regarding the adviser’s and its parent company’s (Morgan Stanley’s) efforts to retain and attract talented investment professionals, including in the context of a competitive marketplace for talent, as well as the ongoing unique environment presented by hybrid, remote and other alternative work arrangements;
• Information regarding the adviser’s compensation methodology for its investment professionals and the incentives and accountability it creates, along with investment professionals’ investments in the fund(s) they manage;
• The Code of Ethics of the adviser and its affiliates and the sub-adviser of each fund, together with information relating to compliance with, and the administration of, such codes;
• Policies and procedures relating to proxy voting, including regular reporting with respect to fund proxy voting activities;
• Information regarding the handling of corporate actions and class actions, as well as information regarding litigation and other regulatory matters;
• Information concerning the resources devoted to compliance efforts undertaken by the adviser and its affiliates and the sub-adviser of each fund, if any, including descriptions of their various compliance programs and their record of compliance;
• Information concerning the business continuity and disaster recovery plans of the adviser and its affiliates and the sub-adviser of each fund, if any;
• A description of Eaton Vance Management’s and Boston Management and Research’s oversight of sub-advisers, including with respect to regulatory and compliance issues, investment management and other matters;
Other Relevant Information
• Information regarding ongoing initiatives to further integrate and harmonize, where applicable, the investment management and other departments of the adviser and its affiliates with the overall investment management infrastructure of Morgan Stanley, in light of Morgan Stanley’s acquisition of Eaton Vance Corp. on March 1, 2021;
• Information concerning the nature, cost and character of the administrative and other non-investment advisory services provided by Eaton Vance Management and its affiliates;
• Information concerning oversight of the relationship with the custodian, subcustodians, fund accountants, and other third-party service providers by the adviser and/or administrator to each of the funds;
• Information concerning efforts to implement policies and procedures with respect to various recently adopted regulations applicable to the funds, including Rule 12d1-4 (the Fund-of-Funds Rule), Rule 18f-4 (the Derivatives Rule) and Rule 2a-5 (the Fair Valuation Rule);
• For an Eaton Vance Fund structured as an exchange-listed closed-end fund, information concerning the benefits of the closed-end fund structure, as well as, where relevant, the closed-end fund’s market prices (including as compared to the closed-end fund’s net asset value (NAV)), trading volume data, continued use of auction preferred shares (where applicable), distribution rates and other relevant matters;
• The risks which the adviser and/or its affiliates incur in connection with the management and operation of the funds, including, among others, litigation, regulatory, entrepreneurial, and other business risks (and the associated costs of such risks); and
• The terms of each investment advisory agreement and sub-advisory agreement.
During the various meetings of the Board and its committees over the course of the year leading up to the June 8, 2023 meeting, the Board received information from portfolio managers and other investment professionals of the advisers and sub-advisers of the funds regarding investment and performance matters, and considered various investment and trading strategies used in pursuing the funds’ investment objectives. The Board also received information regarding risk management techniques employed in connection with the management of the funds. The Board and its committees evaluated issues pertaining to industry and regulatory developments, compliance procedures, fund governance and other issues with respect to the funds, and received and participated in reports and presentations provided by Eaton Vance Management, Boston Management and Research and fund sub-advisers, with respect to such matters. In addition to the formal meetings of the Board and its committees, the Independent Trustees held regular teleconferences to discuss, among other topics, matters relating to the continuation of investment advisory agreements and sub-advisory agreements.
The Contract Review Committee was advised throughout the contract review process by Goodwin Procter LLP, independent legal counsel for the Independent Trustees. The members of the Contract Review Committee, with the advice of such counsel, exercised their own business judgment in determining the material factors to be considered in evaluating each investment advisory agreement and sub-advisory agreement and the weight to be given to each such factor. The conclusions reached with respect to each investment advisory agreement and sub-advisory agreement were based on a comprehensive evaluation of all the information provided and not any single factor. Moreover, each member of the Contract Review Committee may have placed varying emphasis on particular factors in reaching conclusions with respect to each investment advisory agreement and sub-advisory agreement. In evaluating each investment advisory agreement and sub-advisory agreement, including the fee structures and other terms contained in such agreements, the members of the Contract Review Committee were also informed by multiple years of analysis and discussion with the adviser and sub-adviser to each of the Eaton Vance Funds.
Eaton Vance
Floating-Rate & High Income Fund
October 31, 2023
Board of Trustees’ Contract Approval — continued
Results of the Contract Review Process
Based on its consideration of the foregoing, and such other information it deemed relevant, including the factors and conclusions described below, the Contract Review Committee concluded that the continuation of the investment advisory agreement between Eaton Vance Floating-Rate & High Income Fund (the “Fund”) and Eaton Vance Management (“EVM”), as well as the investment advisory agreements between each of Eaton Vance Floating Rate Portfolio and High Income Opportunities Portfolio (the “Portfolios”), which are portfolios in which the Fund is authorized to invest, and Boston Management and Research (“BMR”) (EVM, with respect to the Fund, and BMR, with respect to the Portfolios, are each referred to herein as the “Adviser”), including their respective fee structures, are in the interests of shareholders and, therefore, recommended to the Board approval of each agreement. Based on the recommendation of the Contract Review Committee, the Board, including a majority of the Independent Trustees, voted to approve continuation of the investment advisory agreements for the Fund and the Portfolios.
Nature, Extent and Quality of Services
In considering whether to approve the investment advisory agreements for the Fund and the Portfolios, the Board evaluated the nature, extent and quality of services provided to the Fund and to the Portfolios by the applicable Adviser.
The Board considered each Adviser’s management capabilities and investment processes in light of the types of investments held by the Fund and the Portfolios, including the education, experience and number of investment professionals and other personnel who provide portfolio management, investment research, and similar services to the Fund and the Portfolios, including, as applicable, recent changes to such personnel. In particular, the Board considered the abilities and experience of each Adviser’s investment professionals in analyzing special considerations relevant to investing in senior floating rate loans and high yield debt. The Board considered the Adviser’s large group of bank loan investment professionals and other personnel, which includes portfolio managers and analysts, who provide services to the Portfolios. The Board also took into account the resources dedicated to portfolio management and other services, the compensation methods of each Adviser and other factors, including the reputation and resources of the Adviser to recruit and retain highly qualified research, advisory and supervisory investment professionals. In addition, the Board considered the time and attention devoted to the Eaton Vance Funds, including the Fund and the Portfolios, by senior management, as well as the infrastructure, operational capabilities and support staff in place to assist in the portfolio management and operations of the Fund and the Portfolios, including the provision of administrative services. The Board also considered the business-related and other risks to which each Adviser or its affiliates may be subject in managing the Fund and the Portfolios.
The Board considered the compliance programs of each Adviser and relevant affiliates thereof. The Board considered compliance and reporting matters regarding, among other things, personal trading by investment professionals, disclosure of portfolio holdings, late trading, frequent trading, portfolio valuation, business continuity and the allocation of investment opportunities. The Board also considered the responses of each Adviser and its affiliates to requests in recent years from regulatory authorities, such as the Securities and Exchange Commission and the Financial Industry Regulatory Authority.
The Board considered other administrative services provided or overseen by Eaton Vance Management and its affiliates, including transfer agency and accounting services. The Board evaluated the benefits to shareholders of investing in a fund that is a part of a large fund complex offering exposure to a variety of asset classes and investment disciplines, as well as the ability, in many cases, to exchange an investment among different funds without incurring additional sales charges.
After consideration of the foregoing factors, among others, the Board concluded that the nature, extent and quality of services provided by each Adviser, taken as a whole, are appropriate and consistent with the terms of the applicable investment advisory agreement.
Fund Performance
The Board compared the Fund’s investment performance to that of comparable funds identified by an independent data provider (the peer group), as well as an appropriate benchmark index. The Board’s review included comparative performance data with respect to the Fund for the one-, three-, five- and ten-year periods ended December 31, 2022. In this regard, the Board noted that the performance of the Fund was consistent with the median performance of the Fund’s peer group for the three-year period. The Board also noted that the performance of the Fund was lower than its benchmark index for the three-year period. The Board also considered the performance of the underlying Portfolios. The Board concluded that the performance of the Fund was satisfactory.
Management Fees and Expenses
The Board considered contractual fee rates payable by the Portfolios and by the Fund for advisory and administrative services (referred to collectively as “management fees”). As part of its review, the Board considered the Fund’s management fees and total expense ratio for the one-year period ended December 31, 2022, as compared to those of comparable funds, before and after giving effect to any undertaking to waive fees or reimburse expenses. The Board also considered certain factors identified by management in response to inquiries from the Contract Review Committee regarding the Fund’s total expense ratio relative to comparable funds.
After considering the foregoing information, and in light of the nature, extent and quality of the services provided by each Adviser, the Board concluded that the management fees charged for advisory and related services are reasonable.
Eaton Vance
Floating-Rate & High Income Fund
October 31, 2023
Board of Trustees’ Contract Approval — continued
Profitability and “Fall-Out” Benefits
The Board considered the level of profits realized by each Adviser and relevant affiliates thereof in providing investment advisory and administrative services to the Fund, to the Portfolios and to all Eaton Vance Funds as a group. The Board considered the level of profits realized without regard to marketing support or other payments by the Adviser and its affiliates to third parties in respect of distribution or other services.
The Board concluded that, in light of the foregoing factors and the nature, extent and quality of the services rendered, the profits realized by each Adviser and its affiliates are deemed not to be excessive.
The Board also considered direct or indirect fall-out benefits received by each Adviser and its affiliates in connection with their respective relationships with the Fund and the Portfolios, including the benefits of research services that may be available to each Adviser as a result of securities transactions effected for the Fund and the Portfolios and other investment advisory clients.
Economies of Scale
In reviewing management fees and profitability, the Board also considered the extent to which the applicable Adviser and its affiliates, on the one hand, and the Fund and the Portfolios, on the other hand, can expect to realize benefits from economies of scale as the assets of the Fund and the Portfolios increase. The Board acknowledged the difficulty in accurately measuring the benefits resulting from economies of scale, if any, with respect to the management of any specific fund or group of funds. The Board reviewed data summarizing the increases and decreases in the assets of the Fund and of all Eaton Vance Funds as a group over various time periods, and evaluated the extent to which the total expense ratio of the Fund and the profitability of each Adviser and its affiliates may have been affected by such increases or decreases. Based upon the foregoing, the Board concluded that the Fund currently shares in the benefits from economies of scale, if any, when they are realized by the Adviser. The Board also concluded that the structure of the advisory fees, which include breakpoints at several asset levels, will allow the Fund and the Portfolios to continue to benefit from any economies of scale in the future.
Eaton Vance
Floating-Rate & High Income Fund
October 31, 2023
Liquidity Risk Management Program
The Fund has implemented a written liquidity risk management program (Program) and related procedures to manage its liquidity in accordance with Rule 22e-4 under the Investment Company Act of 1940, as amended (Liquidity Rule). The Liquidity Rule defines “liquidity risk” as the risk that a fund could not meet requests to redeem shares issued by the fund without significant dilution of the remaining investors’ interests in the fund. The Fund’s Board of Trustees/Directors has designated the investment adviser to serve as the administrator of the Program and the related procedures. The administrator has established a Liquidity Risk Management Oversight Committee (Committee) to perform the functions necessary to administer the Program. As part of the Program, the administrator is responsible for identifying illiquid investments and categorizing the relative liquidity of the Fund’s investments in accordance with the Liquidity Rule. Under the Program, the administrator assesses, manages, and periodically reviews the Fund’s liquidity risk, and is responsible for making certain reports to the Fund’s Board of Trustees/Directors and the Securities and Exchange Commission (SEC) regarding the liquidity of the Fund’s investments, and to notify the Board of Trustees/Directors and the SEC of certain liquidity events specified in the Liquidity Rule. The liquidity of the Fund’s portfolio investments is determined based on a number of factors including, but not limited to, relevant market, trading and investment-specific considerations under the Program.
At a meeting of the Fund’s Board of Trustees/Directors on June 7, 2023, the Committee provided a written report to the Fund’s Board of Trustees/
Directors pertaining to the operation, adequacy, and effectiveness of implementation of the Program, as well as the operation of the highly liquid investment minimum (if applicable) for the period January 1, 2022 through December 31, 2022 (Review Period). The Program operated effectively during the Review Period, supporting the administrator’s ability to assess, manage and monitor Fund liquidity risk, including during periods of market volatility and net redemptions. During the Review Period, the Fund met redemption requests on a timely basis.
There can be no assurance that the Program will achieve its objectives in the future. Please refer to the Fund’s prospectus for more information regarding the Fund’s exposure to liquidity risk and other principal risks to which an investment in the Fund may be subject.
Eaton Vance
Floating-Rate & High Income Fund
October 31, 2023
Management and Organization
Fund Management. The Trustees of Eaton Vance Mutual Funds Trust (the Trust), Eaton Vance Floating Rate Portfolio and High Income Opportunities Portfolio (collectively, the Portfolios) are responsible for the overall management and supervision of the Trust's and the Portfolios' affairs. The Board members and officers of the Trust and the Portfolios are listed below. Except as indicated, each individual has held the office shown or other offices in the same company for the last five years. Board members hold indefinite terms of office. Each Trustee holds office until his or her successor is elected and qualified, subject to a prior death, resignation, retirement, disqualification or removal. Under the terms of the Fund's and the Portfolios' current Trustee retirement policy, an Independent Trustee must retire and resign as a Trustee on the earlier of: (i) the first day of July following his or her 74th birthday; or (ii), with limited exception, December 31st of the 20th year in which he or she has served as a Trustee. However, if such retirement and resignation would cause the Fund and each Portfolio to be out of compliance with Section 16 of the 1940 Act or any other regulations or guidance of the SEC, then such retirement and resignation will not become effective until such time as action has been taken for the Fund and each Portfolio to be in compliance therewith. The “noninterested Trustees” consist of those Trustees who are not “interested persons” of the Trust and the Portfolios, as that term is defined under the 1940 Act. The business address of each Board member and officer is Two International Place, Boston, Massachusetts 02110. As used below, “BMR” refers to Boston Management and Research, “EV” refers to EV LLC, “EVM” refers to Eaton Vance Management, “MSIM" refers to Morgan Stanley Investment Management Inc. and “EVD” refers to Eaton Vance Distributors, Inc. EV is the trustee of each of EVM and BMR. Each of EVM, BMR, EVD and EV are indirect, wholly owned subsidiaries of Morgan Stanley. Each officer affiliated with EVM may hold a position with other EVM affiliates that is comparable to his or her position with EVM listed below. Each Trustee oversees 127 funds in the Eaton Vance fund complex (including both funds and portfolios in a hub and spoke structure).
| Name and Year of Birth | Trust/Portfolios
Position(s) | Length of Service | Principal Occupation(s) and Other Directorships
During Past Five Years and Other Relevant Experience |
| Interested Trustee |
Anchal Pachnanda(1)
1980 | Trustee | Since 2023 | Co-Head of Strategy of MSIM (since 2019). Formerly, Head of Strategy of MSIM (2017-2019). Ms. Pachnanda is an interested person because of her position with MSIM, which is an affiliate of the Trust.
Other Directorships. None. |
| Noninterested Trustees |
Alan C. Bowser
1962 | Trustee | Since 2022 | Private investor. Formerly, Chief Diversity Officer, Partner and a member of the Operating Committee, and formerly served as Senior Advisor on Diversity and Inclusion for the firm’s chief executive officer, Co-Head of the Americas Region, and Senior Client Advisor of Bridgewater Associates, an asset management firm (2011- 2023).
Other Directorships. Independent Director of Stout Risius Ross (a middle market professional services advisory firm) (since 2021). |
Mark R. Fetting
1954 | Trustee | Since 2016 | Private investor. Formerly held various positions at Legg Mason, Inc. (investment management firm) (2000-2012), including President, Chief Executive Officer, Director and Chairman (2008-2012), Senior Executive Vice President (2004-2008) and Executive Vice President (2001-2004). Formerly, President of Legg Mason family of funds (2001-2008). Formerly, Division President and Senior Officer of Prudential Financial Group, Inc. and related companies (investment management firm) (1991-2000).
Other Directorships. None. |
Cynthia E. Frost
1961 | Trustee | Since 2014 | Private investor. Formerly, Chief Investment Officer of Brown University (university endowment) (2000-2012). Formerly, Portfolio Strategist for Duke Management Company (university endowment manager) (1995-2000). Formerly, Managing Director, Cambridge Associates (investment consulting company) (1989-1995). Formerly, Consultant, Bain and Company (management consulting firm) (1987-1989). Formerly, Senior Equity Analyst, BA Investment Management Company (1983-1985).
Other Directorships. None. |
George J. Gorman
1952 | Chairperson
of the Board
and Trustee | Since 2021
(Chairperson) and
2014 (Trustee) | Principal at George J. Gorman LLC (consulting firm). Formerly, Senior Partner at Ernst & Young LLP (a registered public accounting firm) (1974-2009).
Other Directorships. None. |
Eaton Vance
Floating-Rate & High Income Fund
October 31, 2023
Management and Organization — continued
| Name and Year of Birth | Trust/Portfolios
Position(s) | Length of Service | Principal Occupation(s) and Other Directorships
During Past Five Years and Other Relevant Experience |
| Noninterested Trustees (continued) |
Valerie A. Mosley
1960 | Trustee | Since 2014 | Chairwoman and Chief Executive Officer of Valmo Ventures (a consulting and investment firm). Founder of Upward Wealth, Inc., dba BrightUp, a fintech platform. Formerly, Partner and Senior Vice President, Portfolio Manager and Investment Strategist at Wellington Management Company, LLP (investment management firm) (1992-2012). Formerly, Chief Investment Officer, PG Corbin Asset Management (1990-1992). Formerly worked in institutional corporate bond sales at Kidder Peabody (1986-1990).
Other Directorships. Director of DraftKings, Inc. (digital sports entertainment and gaming company) (since September 2020). Director of Envestnet, Inc. (provider of intelligent systems for wealth management and financial wellness) (since 2018). Formerly, Director of Dynex Capital, Inc. (mortgage REIT) (2013-2020) and Director of Groupon, Inc. (e-commerce provider) (2020-2022). |
Keith Quinton
1958 | Trustee | Since 2018 | Private investor, researcher and lecturer. Formerly, Independent Investment Committee Member at New Hampshire Retirement System (2017-2021). Formerly, Portfolio Manager and Senior Quantitative Analyst at Fidelity Investments (investment management firm) (2001-2014).
Other Directorships. Formerly, Director (2016-2021) and Chairman (2019-2021) of New Hampshire Municipal Bond Bank. |
Marcus L. Smith
1966 | Trustee | Since 2018 | Private investor and independent corporate director. Formerly, Chief Investment Officer, Canada (2012-2017), Chief Investment Officer, Asia (2010-2012), Director of Asian Research (2004-2010) and portfolio manager (2001-2017) at MFS Investment Management (investment management firm).
Other Directorships. Director of First Industrial Realty Trust, Inc. (an industrial REIT) (since 2021). Director of MSCI Inc. (global provider of investment decision support tools) (since 2017). Formerly, Director of DCT Industrial Trust Inc. (logistics real estate company) (2017-2018). |
Susan J. Sutherland
1957 | Trustee | Since 2015 | Private investor. Director of Ascot Group Limited and certain of its subsidiaries (insurance and reinsurance) (since 2017). Formerly, Director of Hagerty Holding Corp. (insurance) (2015-2018) and Montpelier Re Holdings Ltd. (insurance and reinsurance) (2013-2015). Formerly, Associate, Counsel and Partner at Skadden, Arps, Slate, Meagher & Flom LLP (law firm) (1982-2013).
Other Directorships. Formerly, Director of Kairos Acquisition Corp. (insurance/InsurTech acquisition company) (2021-2023). |
Scott E. Wennerholm
1959 | Trustee | Since 2016 | Private investor. Formerly, Trustee at Wheelock College (postsecondary institution) (2012-2018). Formerly, Consultant at GF Parish Group (executive recruiting firm) (2016-2017). Formerly, Chief Operating Officer and Executive Vice President at BNY Mellon Asset Management (investment management firm) (2005-2011). Formerly, Chief Operating Officer and Chief Financial Officer at Natixis Global Asset Management (investment management firm) (1997-2004). Formerly, Vice President at Fidelity Investments Institutional Services (investment management firm) (1994-1997).
Other Directorships. None. |
Nancy A. Wiser
1967 | Trustee | Since 2022 | Formerly, Executive Vice President and the Global Head of Operations at Wells Fargo Asset Management (2011-2021).
Other Directorships. None. |
| Name and Year of Birth | Trust/Portfolios
Position(s) | Length of Service | Principal Occupation(s)
During Past Five Years |
| Principal Officers who are not Trustees |
Kenneth A. Topping
1966 | President | Since 2023 | Vice President and Chief Administrative Officer of EVM and BMR and Chief Operating Officer for Public Markets at MSIM. Also Vice President of Calvert Research and Management (“CRM”) since 2021. Formerly, Chief Operating Officer for Goldman Sachs Asset Management `Classic' (2009-2020). |
Deidre E. Walsh
1971 | Vice President and
Chief Legal Officer | Since 2009 | Vice President of EVM and BMR. Also Vice President of CRM. |
James F. Kirchner
1967 | Treasurer | Since 2007 | Vice President of EVM and BMR. Also Vice President of CRM. |
Eaton Vance
Floating-Rate & High Income Fund
October 31, 2023
Management and Organization — continued
| Name and Year of Birth | Trust/Portfolios
Position(s) | Length of Service | Principal Occupation(s)
During Past Five Years |
| Principal Officers who are not Trustees (continued) |
Nicholas S. Di Lorenzo
1987 | Secretary | Since 2022 | Formerly, associate (2012-2021) and counsel (2022) at Dechert LLP. |
Richard F. Froio
1968 | Chief Compliance
Officer | Since 2017 | Vice President of EVM and BMR since 2017. Formerly, Deputy Chief Compliance Officer (Adviser/Funds) and Chief Compliance Officer (Distribution) at PIMCO (2012-2017) and Managing Director at BlackRock/Barclays Global Investors (2009-2012). |
(1) Ms. Pachnanda began serving as Trustee effective April 1, 2023.
The SAI for the Fund includes additional information about the Trustees and officers of the Fund and each Portfolio and can be obtained without charge on Eaton Vance’s website at www.eatonvance.com or by calling 1-800-262-1122.
| FACTS | WHAT DOES EATON VANCE DO WITH YOUR
PERSONAL INFORMATION? |
| Why? | Financial companies choose how they share your personal information. Federal law gives consumers the right to limit some but not all sharing. Federal law also requires us to tell you how we collect, share, and protect your personal information. Please read this notice carefully to understand what we do. |
| |
| What? | The types of personal information we collect and share depend on the product or service you have with us. This information can include:■ Social Security number and income
■ investment experience and risk tolerance
■ checking account number and wire transfer instructions |
| |
| How? | All financial companies need to share customers’ personal information to run their everyday business. In the section below, we list the reasons financial companies can share their customers’ personal information; the reasons Eaton Vance chooses to share; and whether you can limit this sharing. |
Reasons we can share your
personal information | Does Eaton Vance
share? | Can you limit
this sharing? |
| For our everyday business purposes — such as to process your transactions, maintain your account(s), respond to court orders and legal investigations, or report to credit bureaus | Yes | No |
| For our marketing purposes — to offer our products and services to you | Yes | No |
| For joint marketing with other financial companies | No | We don’t share |
| For our investment management affiliates’ everyday business purposes — information about your transactions, experiences, and creditworthiness | Yes | Yes |
| For our affiliates’ everyday business purposes — information about your transactions and experiences | Yes | No |
| For our affiliates’ everyday business purposes — information about your creditworthiness | No | We don’t share |
| For our investment management affiliates to market to you | Yes | Yes |
| For our affiliates to market to you | No | We don’t share |
| For nonaffiliates to market to you | No | We don’t share |
To limit our
sharing | Call toll-free 1-800-262-1122 or email: EVPrivacy@eatonvance.comPlease note:If you are a new customer, we can begin sharing your information 30 days from the date we sent this notice. When you are no longer our customer, we continue to share your information as described in this notice. However, you can contact us at any time to limit our sharing. |
| Questions? | Call toll-free 1-800-262-1122 or email: EVPrivacy@eatonvance.com |
| Privacy Notice — continued | April 2021 |
| Who we are |
| Who is providing this notice? | Eaton Vance Management, Eaton Vance Distributors, Inc., Eaton Vance Trust Company, Eaton Vance Management (International) Limited, Eaton Vance Advisers International Ltd., Eaton Vance Global Advisors Limited, Eaton Vance Management’s Real Estate Investment Group, Boston Management and Research, Calvert Research and Management, Eaton Vance and Calvert Fund Families and our investment advisory affiliates (“Eaton Vance”) (see Investment Management Affiliates definition below) |
| What we do |
How does Eaton Vance
protect my personal
information? | To protect your personal information from unauthorized access and use, we use security measures that comply with federal law. These measures include computer safeguards and secured files and buildings. We have policies governing the proper handling of customer information by personnel and requiring third parties that provide support to adhere to appropriate security standards with respect to such information. |
How does Eaton Vance
collect my personal
information? | We collect your personal information, for example, when you■ open an account or make deposits or withdrawals from your account
■ buy securities from us or make a wire transfer
■ give us your contact informationWe also collect your personal information from others, such as credit bureaus, affiliates, or other companies. |
| Why can’t I limit all sharing? | Federal law gives you the right to limit only■ sharing for affiliates’ everyday business purposes — information about your creditworthiness
■ affiliates from using your information to market to you
■ sharing for nonaffiliates to market to youState laws and individual companies may give you additional rights to limit sharing. See below for more on your rights under state law. |
| Definitions |
Investment Management
Affiliates | Eaton Vance Investment Management Affiliates include registered investment advisers, registered broker- dealers, and registered and unregistered funds. Investment Management Affiliates does not include entities associated with Morgan Stanley Wealth Management, such as Morgan Stanley Smith Barney LLC and Morgan Stanley & Co. |
| Affiliates | Companies related by common ownership or control. They can be financial and nonfinancial companies.■ Our affiliates include companies with a Morgan Stanley name and financial companies such as Morgan Stanley Smith Barney LLC and Morgan Stanley & Co. |
| Nonaffiliates | Companies not related by common ownership or control. They can be financial and nonfinancial companies.■ Eaton Vance does not share with nonaffiliates so they can market to you. |
| Joint marketing | A formal agreement between nonaffiliated financial companies that together market financial products or services to you.■ Eaton Vance doesn’t jointly market. |
| Other important information |
| Vermont: Except as permitted by law, we will not share personal information we collect about Vermont residents with Nonaffiliates unless you provide us with your written consent to share such information.California: Except as permitted by law, we will not share personal information we collect about California residents with Nonaffiliates and we will limit sharing such personal information with our Affiliates to comply with California privacy laws that apply to us. |
Delivery of Shareholder Documents. The Securities and Exchange Commission (SEC) permits funds to deliver only one copy of shareholder documents, including prospectuses, proxy statements and shareholder reports, to fund investors with multiple accounts at the same residential or post office box address. This practice is often called “householding” and it helps eliminate duplicate mailings to shareholders. Eaton Vance, or your financial intermediary, may household the mailing of your documents indefinitely unless you instruct Eaton Vance, or your financial intermediary, otherwise. If you would prefer that your Eaton Vance documents not be householded, please contact Eaton Vance at 1-800-262-1122, or contact your financial intermediary. Your instructions that householding not apply to delivery of your Eaton Vance documents will typically be effective within 30 days of receipt by Eaton Vance or your financial intermediary.
Portfolio Holdings. Each Eaton Vance Fund and its underlying Portfolio(s) (if applicable) files a schedule of portfolio holdings on Part F to Form N-PORT with the SEC. Certain information filed on Form N-PORT may be viewed on the Eaton Vance website at www.eatonvance.com, by calling Eaton Vance at 1-800-262-1122 or in the EDGAR database on the SEC’s website at www.sec.gov.
Proxy Voting. From time to time, funds are required to vote proxies related to the securities held by the funds. The Eaton Vance Funds or their underlying Portfolios (if applicable) vote proxies according to a set of policies and procedures approved by the Funds’ and Portfolios’ Boards. You may obtain a description of these policies and procedures and information on how the Funds or Portfolios voted proxies relating to portfolio securities during the most recent 12-month period ended June 30, without charge, upon request, by calling 1-800-262-1122 and by accessing the SEC’s website at www.sec.gov.
Tailored Shareholder Reports. Effective January 24, 2023, the SEC adopted rule and form amendments to require open-end mutual funds and ETFs to transmit concise and visually engaging streamlined annual and semiannual reports to shareholders that highlight key information. Other information, including financial statements, will no longer appear in a streamlined shareholder report but must be available online, delivered free of charge upon request, and filed on a semiannual basis on Form N-CSR. The rule and form amendments have a compliance date of July 24, 2024. At this time, management is evaluating the impact of these amendments on the shareholder reports for the Eaton Vance Funds.
This Page Intentionally Left Blank
This Page Intentionally Left Blank
This Page Intentionally Left Blank
Investment Adviser of Eaton Vance Floating Rate Portfolio
Boston Management and Research
Two International Place
Boston, MA 02110
Investment Adviser and Administrator of Eaton Vance
Floating-Rate & High Income Fund
Eaton Vance Management
Two International Place
Boston, MA 02110
Principal Underwriter*
Eaton Vance Distributors, Inc.
Two International Place
Boston, MA 02110
(617) 482-8260
Custodian
State Street Bank and Trust Company
One Congress Street, Suite 1
Boston, MA 02114-2016
Transfer Agent
BNY Mellon Investment Servicing (US) Inc.
Attn: Eaton Vance Funds
P.O. Box 534439
Pittsburgh, PA 15253-4439
(800) 262-1122
Independent Registered Public Accounting Firm
Deloitte & Touche LLP
200 Berkeley Street
Boston, MA 02116-5022
Fund Offices
Two International Place
Boston, MA 02110
* FINRA BrokerCheck. Investors may check the background of their Investment Professional by contacting the Financial Industry Regulatory Authority (FINRA). FINRA BrokerCheck is a free tool to help investors check the professional background of current and former FINRA-registered securities firms and brokers. FINRA BrokerCheck is available by calling 1-800-289-9999 and at www.FINRA.org. The FINRA BrokerCheck brochure describing this program is available to investors at www.FINRA.org.
Eaton Vance
Government Opportunities Fund
Annual Report
October 31, 2023
Commodity Futures Trading Commission Registration. The Commodity Futures Trading Commission (“CFTC”) has adopted regulations that subject registered investment companies and advisers to regulation by the CFTC if a fund invests more than a prescribed level of its assets in certain CFTC-regulated instruments (including futures, certain options and swap agreements) or markets itself as providing investment exposure to such instruments. The investment adviser has claimed an exclusion from the definition of “commodity pool operator” under the Commodity Exchange Act with respect to its management of the Fund. Accordingly, neither the Fund nor the adviser with respect to the operation of the Fund is subject to CFTC regulation. Because of its management of other strategies, the Fund's adviser is registered with the CFTC as a commodity pool operator. The adviser is also registered as a commodity trading advisor.
Fund shares are not insured by the FDIC and are not deposits or other obligations of, or guaranteed by, any depository institution. Shares are subject to investment risks, including possible loss of principal invested.
This report must be preceded or accompanied by a current summary prospectus or prospectus. Before investing, investors should consider carefully the investment objective, risks, and charges and expenses of a mutual fund. This and other important information is contained in the summary prospectus and prospectus, which can be obtained from a financial intermediary. Prospective investors should read the prospectus carefully before investing. For further information, please call 1-800-262-1122.
Annual Report October 31, 2023
Eaton Vance
Government Opportunities Fund
Eaton Vance
Government Opportunities Fund
October 31, 2023
Management’s Discussion of Fund Performance†
Economic and Market Conditions
For fixed-income investors, the dominant event during the 12-month period ended October 31, 2023, was the series of U.S. Federal Reserve (Fed) interest rate hikes -- six during the period, and 11 in total -- that brought the federal funds rate to its highest level in 22 years.
But while the Fed’s campaign to tamp down inflation led to negative performance for government bonds, corporate bond returns were positive during the period -- buoyed by the very factors that were fueling inflation: record low unemployment, strong job creation, and robust consumer spending.
By the summer of 2023, many economists and market observers came around to the view that Jerome Powell’s Fed might be able to accomplish what had seldom, if ever, been done before: raise rates significantly to lower inflation and still bring the U.S. economy in for a soft landing without a recession.
One persistent cloud over fixed-income markets during the period, however, was fear that even after it finished raising rates, the Fed would leave rates higher for longer than investors had previously anticipated. During the final three months of the period -- and especially after the Fed’s September 2023 meeting -- longer-term interest rates rose dramatically, as investor expectations of how high rates would go -- and how long they would stay there -- seemed to get higher and longer. As a result, shorter-duration bonds generally outperformed longer-duration bonds for the period as a whole.
Against the backdrop of aggressive monetary tightening, U.S. Treasurys were one of the worst-performing major fixed-income asset classes during the 12-month period, with the Bloomberg U.S. Treasury Index returning -0.63%.
In contrast, the strong U.S. economy and increasing confidence in a soft-landing scenario served as tailwinds for investment-grade corporate bonds. Even in a rising-rate environment, the Bloomberg U.S. Corporate Bond Index returned 2.77% during the period.
High yield bonds were the standout performer among major fixed-income asset classes, with the Bloomberg U.S. Corporate High Yield Index returning 6.23% during the period. With a strong U.S. economy helping keep bond defaults low, and a recession looking increasingly remote, investors gravitated toward riskier investments with greater yields.
Asset-backed securities -- including bonds backed by automobile and consumer loans -- benefited from strong consumer balance sheets and spending during the period, with the Bloomberg U.S. Asset-Backed Securities Index returning 3.51%.
Mortgage-backed securities (MBS), however, were dogged by two technical factors that depressed prices, causing the Bloomberg U.S. Mortgage-Backed Securities Index to return -0.82% during the period. As part of its quantitative tightening program, the Fed gradually reduced its MBS holdings by allowing up to $35 billion to roll off its balance sheet each month. And several regional banks that had been significant buyers of MBS were forced by the regional banking crisis of March 2023 to liquidate their assets. The resulting release of a significant amount of MBS into the market led MBS prices to fall and the asset class to deliver negative returns during the period.
Fund Performance
For the 12-month period ended October 31, 2023, Eaton Vance Government Opportunities Fund (the Fund) returned -1.89% for Class A shares at net asset value (NAV), underperforming its benchmark, the ICE BofA 1-3 Year U.S. Treasury Index (the Index), which returned 2.92%.
The main detractor from Fund performance relative to the Index during the period was exposure to lower coupon collateralized mortgage obligations (CMOs). Because CMOs generally carry longer durations, this sector was negatively impacted by a sharp rise in interest rates during the period, as well as the spread widening experienced by the agency MBS market.
In contrast, strong performance by the Fund’s interest-only securities helped offset some market headwinds as interest-only MBS prices reacted positively to rising rates during the period. A small allocation to non-agency MBS also contributed to Fund returns relative to the Index during the period, as the higher levels of income offered by these securities more than offset modest price declines.
The Fund used derivatives during the period to reduce the impact of interest rate fluctuations on its bond holdings. Its exposure to interest rate swaps, in particular, had a positive impact on relative performance during the period, as they benefited from a rise in U.S. Treasury yields.
See Endnotes and Additional Disclosures in this report.
Past performance is no guarantee of future results. Returns are historical and are calculated by determining the percentage change in net asset value (NAV) or offering price (as applicable) with all distributions reinvested. Furthermore, returns do not reflect the deduction of taxes that shareholders may have to pay on Fund distributions or upon the redemption of Fund shares. Investment return and principal value will fluctuate so that shares, when redeemed, may be worth more or less than their original cost. Performance for periods less than or equal to one year is cumulative. Performance is for the stated time period only; due to market volatility, current Fund performance may be lower or higher than the quoted return. For performance as of the most recent month-end, please refer to eatonvance.com.
Eaton Vance
Government Opportunities Fund
October 31, 2023
Performance
Portfolio Manager(s) Andrew Szczurowski, CFA and Alexander Payne, CFA
| % Average Annual Total Returns1,2 | Class
Inception Date | Performance
Inception Date | One Year | Five Years | Ten Years |
| Class A at NAV | 08/24/1984 | 08/24/1984 | (1.89)% | (0.49)% | 0.27% |
| Class A with 3.25% Maximum Sales Charge | — | — | (5.16) | (1.13) | (0.06) |
| Class C at NAV | 11/01/1993 | 08/24/1984 | (2.64) | (1.24) | (0.33) |
| Class C with 1% Maximum Deferred Sales Charge | — | — | (3.57) | (1.24) | (0.33) |
| Class I at NAV | 04/03/2009 | 08/24/1984 | (1.63) | (0.24) | 0.53 |
| Class R at NAV | 08/12/2005 | 08/24/1984 | (2.17) | (0.72) | 0.02 |
|
| ICE BofA 1-3 Year U.S. Treasury Index | — | — | 2.92% | 1.10% | 0.83% |
| % Total Annual Operating Expense Ratios3 | Class A | Class C | Class I | Class R |
| Gross | 1.10% | 1.85% | 0.85% | 1.35% |
| Net | 1.05 | 1.80 | 0.80 | 1.30 |
Growth of $10,000
This graph shows the change in value of a hypothetical investment of $10,000 in Class A of the Fund for the period indicated. For comparison, the same investment is shown in the indicated index.
| Growth of Investment | Amount Invested | Period Beginning | At NAV | With Maximum Sales Charge |
| Class C | $10,000 | 10/31/2013 | $9,672 | N.A. |
| Class I, at minimum investment | $1,000,000 | 10/31/2013 | $1,054,606 | N.A. |
| Class R | $10,000 | 10/31/2013 | $10,021 | N.A. |
See Endnotes and Additional Disclosures in this report.
Past performance is no guarantee of future results. Returns are historical and are calculated by determining the percentage change in net asset value (NAV) or offering price (as applicable) with all distributions reinvested. Furthermore, returns do not reflect the deduction of taxes that shareholders may have to pay on Fund distributions or upon the redemption of Fund shares. Investment return and principal value will fluctuate so that shares, when redeemed, may be worth more or less than their original cost. Performance for periods less than or equal to one year is cumulative. Performance is for the stated time period only; due to market volatility, current Fund performance may be lower or higher than the quoted return. For performance as of the most recent month-end, please refer to eatonvance.com.
Eaton Vance
Government Opportunities Fund
October 31, 2023
| Asset Allocation (% of total investments)1 |
Footnotes:
| 1 | Other represents any investment type less than 1% of total investments. |
Eaton Vance
Government Opportunities Fund
October 31, 2023
Endnotes and Additional Disclosures
| † | The views expressed in this report are those of the portfolio manager(s) and are current only through the date stated at the top of this page. These views are subject to change at any time based upon market or other conditions, and Eaton Vance and the Fund(s) disclaim any responsibility to update such views. These views may not be relied upon as investment advice and, because investment decisions are based on many factors, may not be relied upon as an indication of trading intent on behalf of any Eaton Vance fund. This commentary may contain statements that are not historical facts, referred to as “forward-looking statements.” The Fund’s actual future results may differ significantly from those stated in any forward-looking statement, depending on factors such as changes in securities or financial markets or general economic conditions, the volume of sales and purchases of Fund shares, the continuation of investment advisory, administrative and service contracts, and other risks discussed from time to time in the Fund’s filings with the Securities and Exchange Commission. |
| | |
| 1 | ICE BofA 1-3 Year U.S. Treasury Index is an unmanaged index of short-term U.S. Treasury securities. ICE® BofA® indices are not for redistribution or other uses; provided “as is”, without warranties, and with no liability. Eaton Vance has prepared this report and ICE Data Indices, LLC does not endorse it, or guarantee, review, or endorse Eaton Vance’s products. BofA® is a licensed registered trademark of Bank of America Corporation in the United States and other countries. Bloomberg U.S. Intermediate Government Bond Index is an unmanaged index of U.S. government bonds with maturities from one year up to (but not including) 10 years. Unless otherwise stated, index returns do not reflect the effect of any applicable sales charges, commissions, expenses, taxes or leverage, as applicable. It is not possible to invest directly in an index. |
| 2 | Total Returns at NAV do not include applicable sales charges. If sales charges were deducted, the returns would be lower. Total Returns shown with maximum sales charge reflect the stated maximum sales charge. Unless otherwise stated, performance does not reflect the deduction of taxes on Fund distributions or redemptions of Fund shares.Effective November 5, 2020, Class C shares automatically convert to Class A shares eight years after purchase. The average annual total returns listed for Class C reflect conversion to Class A shares after eight years. Prior to November 5, 2020, Class C shares automatically converted to Class A shares ten years after purchase. |
| 3 | Source: Fund prospectus. Net expense ratios reflect a contractual expense reimbursement that continues through 2/29/24. The expense ratios for the current reporting period can be found in the Financial Highlights section of this report. Performance reflects expenses waived and/or reimbursed, if applicable. Without such waivers and/or reimbursements, performance would have been lower. |
| | Fund profile subject to change due to active management. |
| | Additional Information |
| | Bloomberg U.S. Treasury Index measures the performance of U.S. Treasuries with a maturity of one year or more. Bloomberg U.S. Corporate Bond Index measures the performance of investment-grade U.S. corporate securities with a maturity of one year or more. Bloomberg U.S. Corporate High Yield Index measures USD-denominated, non-investment grade corporate securities. Bloomberg U.S. Asset-Backed Securities Index tracks the performance of U.S. dollar denominated investment grade, fixed rate asset-backed securities publicly issued in the U.S. domestic market. Bloomberg U.S. Mortgage-Backed Securities Index measures agency mortgage-backed pass-through securities issued by Ginnie Mae (GNMA), Fannie Mae (FNMA), and Freddie Mac (FHLMC). |
| | Duration is a measure of the expected change in price of a bond — in percentage terms — given a one percent change in interest rates, all else being constant. Securities with lower durations tend to be less sensitive to interest rate changes. |
| | Spread is the difference in yield between a U.S. Treasury bond and another debt security of the same maturity but different credit quality. |
| | Important Notice to Shareholders |
| | Effective December 31, 2023, the Fund's benchmark will change to the ICE BofA U.S. Mortgage-Backed Securities Index (the “New Benchmark”). The Fund's investment adviser believes the New Benchmark is more appropriate since the Fund does not have a duration limitation by prospectus and invests primarily in agency mortgage-backed securities. |
Eaton Vance
Government Opportunities Fund
October 31, 2023
Example
As a Fund shareholder, you incur two types of costs: (1) transaction costs, including sales charges (loads) on purchases; and (2) ongoing costs, including management fees; distribution and/or service fees; and other Fund expenses. This Example is intended to help you understand your ongoing costs (in dollars) of Fund investing and to compare these costs with the ongoing costs of investing in other mutual funds. The Example is based on an investment of $1,000 invested at the beginning of the period and held for the entire period (May 1, 2023 to October 31, 2023).
Actual Expenses
The first section of the table below provides information about actual account values and actual expenses. You may use the information in this section, together with the amount you invested, to estimate the expenses that you paid over the period. Simply divide your account value by $1,000 (for example, an $8,600 account value divided by $1,000 = 8.6), then multiply the result by the number in the first section under the heading entitled “Expenses Paid During Period” to estimate the expenses you paid on your account during this period.
Hypothetical Example for Comparison Purposes
The second section of the table below provides information about hypothetical account values and hypothetical expenses based on the actual Fund expense ratio and an assumed rate of return of 5% per year (before expenses), which is not the actual Fund return. The hypothetical account values and expenses may not be used to estimate the actual ending account balance or expenses you paid for the period. You may use this information to compare the ongoing costs of investing in your Fund and other funds. To do so, compare this 5% hypothetical example with the 5% hypothetical examples that appear in the shareholder reports of the other funds.
Please note that the expenses shown in the table are meant to highlight your ongoing costs only and do not reflect any transactional costs, such as sales charges (loads). Therefore, the second section of the table is useful in comparing ongoing costs only, and will not help you determine the relative total costs of owning different funds. In addition, if these transactional costs were included, your costs would be higher.
| | Beginning
Account Value
(5/1/23) | Ending
Account Value
(10/31/23) | Expenses Paid
During Period*
(5/1/23 – 10/31/23) | Annualized
Expense
Ratio |
| Actual | | | | |
| Class A | $1,000.00 | $ 966.50 | $ 7.19** | 1.45% |
| Class C | $1,000.00 | $ 962.60 | $10.93** | 2.21% |
| Class I | $1,000.00 | $ 967.80 | $ 6.00** | 1.21% |
| Class R | $1,000.00 | $ 965.00 | $ 8.37** | 1.69% |
| |
| Hypothetical | | | | |
| (5% return per year before expenses) | | | | |
| Class A | $1,000.00 | $1,017.90 | $ 7.38** | 1.45% |
| Class C | $1,000.00 | $1,014.07 | $11.22** | 2.21% |
| Class I | $1,000.00 | $1,019.11 | $ 6.16** | 1.21% |
| Class R | $1,000.00 | $1,016.69 | $ 8.59** | 1.69% |
| * | Expenses are equal to the Fund's annualized expense ratio for the indicated Class, multiplied by the average account value over the period, multiplied by 184/365 (to reflect the one-half year period). The Example assumes that the $1,000 was invested at the net asset value per share determined at the close of business on April 30, 2023. |
| ** | Absent an allocation of certain expenses to affiliate(s), expenses would be higher. |
Eaton Vance
Government Opportunities Fund
October 31, 2023
| Asset-Backed Securities — 3.5% |
| Security | Principal
Amount
(000's omitted) | Value |
| ACHV ABS Trust, Series 2023-1PL, Class B, 6.80%, 3/18/30(1) | $ | 1,000 | $ 999,193 |
| CFMT, LLC, Series 2023-HB12, Class M4, 4.25%, 4/25/33(1)(2) | | 3,490 | 2,660,978 |
| KKR SFR Warehouse Participation, 8.825%, (30-day average SOFR + 3.50%), 12/13/23(3) | | 3,008 | 3,006,306 |
| NewRez Warehouse Securitization Trust, Series 2021-1, Class E, 8.689%, (1 mo. SOFR + 3.364%), 5/25/55(1)(3) | | 3,813 | 3,818,775 |
| NRZ Excess Spread-Collateralized Notes: | | | |
| Series 2021-FNT1, Class A, 2.981%, 3/25/26(1) | | 220 | 197,618 |
| Series 2021-GNT1, Class A, 3.474%, 11/25/26(1) | | 2,548 | 2,297,094 |
| Pagaya AI Technology in Housing Trust, Series 2023-1, Class F, 3.60%, 10/25/40(1) | | 1,000 | 634,365 |
| STAR Trust, Series 2021-SFR1, Class H, 9.90%, (1 mo. SOFR + 4.564%), 4/17/38(1)(3) | | 500 | 489,499 |
Total Asset-Backed Securities
(identified cost $14,373,595) | | | $ 14,103,828 |
| Collateralized Mortgage Obligations — 44.8% |
| Security | Principal
Amount
(000's omitted) | Value |
| Angel Oak Mortgage Trust I, LLC, Series 2019-1, Class B1, 5.40%, 11/25/48(1)(2) | $ | 1,000 | $ 977,170 |
| Brean Asset-Backed Securities Trust, Series 2023-RM6, Class A1, 5.25% to 1/25/28, 1/25/63(1)(4) | | 3,881 | 3,566,682 |
| Cascade MH Asset Trust, Series 2022-MH1, Class A, 4.25% to 7/25/27, 8/25/54(1)(4) | | 1,414 | 1,237,159 |
| CFMT, LLC, Series 2023-HB11, Class M2, 4.00%, 2/25/37(1)(2) | | 2,000 | 1,708,170 |
| CHNGE Mortgage Trust: | | | |
| Series 2022-4, Class A1, 6.00% to 9/25/24, 10/25/57(1)(4) | | 3,248 | 3,163,129 |
| Series 2023-1, Class A1, 7.065% to 2/25/26, 3/25/58(1)(2) | | 894 | 884,864 |
| Series 2023-2, Class A3, 7.436% to 5/25/26, 6/25/58(1)(4) | | 2,907 | 2,845,402 |
| COLT Mortgage Loan Trust, Series 2020-2, Class A1, 1.853%, 3/25/65(1)(2) | | 52 | 51,898 |
| Deephaven Residential Mortgage Trust, Series 2020-2, Class B2, 5.798%, 5/25/65(1)(2) | | 500 | 464,485 |
| Ellington Financial Mortgage Trust, Series 2022-4, Class A3, 5.90% to 12/25/25, 9/25/67(1)(4) | | 635 | 606,172 |
| FARM Mortgage Trust, Series 2023-1, Class B, 3.032%, 3/25/52(1)(2) | | 3,163 | 2,087,068 |
| Security | Principal
Amount
(000's omitted) | Value |
| Federal Home Loan Mortgage Corp.: | | | |
| Series 30, Class I, 7.50%, 4/25/24 | $ | 0 (5) | $ 109 |
| Series 1822, Class Z, 6.90%, 3/15/26 | | 43 | 43,082 |
| Series 1829, Class ZB, 6.50%, 3/15/26 | | 1 | 914 |
| Series 1896, Class Z, 6.00%, 9/15/26 | | 13 | 12,609 |
| Series 2075, Class PH, 6.50%, 8/15/28 | | 18 | 18,563 |
| Series 2091, Class ZC, 6.00%, 11/15/28 | | 55 | 54,835 |
| Series 2102, Class Z, 6.00%, 12/15/28 | | 14 | 13,867 |
| Series 2115, Class K, 6.00%, 1/15/29 | | 103 | 102,982 |
| Series 2142, Class Z, 6.50%, 4/15/29 | | 34 | 34,089 |
| Series 4107, Class SA, 0.00%, (2.506% - 30-day average SOFR, Floor 0.00%), 9/15/42(6) | | 419 | 254,600 |
| Series 4107, Class SB, 0.00%, (2.506% - 30-day average SOFR, Floor 0.00%), 9/15/42(6) | | 208 | 126,569 |
| Series 4107, Class SC, 0.00%, (2.506% - 30-day average SOFR, Floor 0.00%), 9/15/42(6) | | 500 | 303,512 |
| Series 4107, Class SD, 0.00%, (2.506% - 30-day average SOFR, Floor 0.00%), 9/15/42(6) | | 373 | 172,749 |
| Series 4204, Class AF, 5.00%, (30-day average SOFR + 1.114%), 5/15/43(3) | | 540 | 460,211 |
| Series 4212, Class NS, 0.00%, (5.263% - 30-day average SOFR x 1.20, Floor 0.00%), 6/15/43(6) | | 287 | 219,056 |
| Series 4259, Class UE, 2.50%, 5/15/43 | | 265 | 235,836 |
| Series 4623, Class SK, 0.00%, (3.490% - 30-day average SOFR, Floor 0.00%), 10/15/46(6) | | 259 | 125,854 |
| Series 4938, Class KZ, 2.50%, 12/25/49 | | 650 | 303,338 |
| Series 5009, Class ZN, 3.50%, 7/25/50 | | 864 | 602,574 |
| Series 5028, Class AZ, 2.00%, 10/25/50 | | 219 | 75,271 |
| Series 5028, Class TZ, 2.00%, 10/25/50 | | 1,085 | 492,815 |
| Series 5031, Class Z, 2.50%, 10/25/50 | | 1 | 277 |
| Series 5035, Class AZ, 2.00%, 11/25/50 | | 1,106 | 446,762 |
| Series 5035, Class ZK, 2.50%, 11/25/50 | | 1,231 | 625,703 |
| Series 5035, Class ZT, 2.00%, 10/25/50 | | 773 | 302,638 |
| Series 5039, Class ZJ, 2.00%, 11/25/50 | | 100 | 34,766 |
| Series 5040, Class TZ, 2.50%, 11/25/50 | | 183 | 81,717 |
| Series 5042, Class PZ, 2.00%, 11/25/50 | | 2,073 | 781,694 |
| Series 5058, Class ZH, 3.00%, 5/25/50 | | 155 | 78,388 |
| Series 5071, Class CS, 0.00%, (3.30% - 30-day average SOFR, Floor 0.00%), 2/25/51(6) | | 1,266 | 572,706 |
| Series 5072, Class ZU, 2.50%, 2/25/51 | | 339 | 154,167 |
| Series 5083, Class ZW, 2.50%, 3/25/51 | | 497 | 223,300 |
| Series 5090, Class PZ, 2.50%, 3/25/51 | | 242 | 102,795 |
| Series 5093, Class Z, 3.00%, 1/25/51 | | 0 (5) | 31 |
| Series 5101, Class EZ, 2.00%, 3/25/51 | | 547 | 245,793 |
| Series 5104, Class WZ, 3.00%, 4/25/51 | | 129 | 70,984 |
| Series 5114, Class ZH, 3.00%, 5/25/51 | | 57 | 31,623 |
| Series 5123, Class JZ, 2.00%, 7/25/51 | | 110 | 49,541 |
| Series 5129, Class HZ, 1.25%, 4/25/50 | | 167 | 64,060 |
| Series 5129, Class TZ, 2.50%, 8/25/51 | | 446 | 186,348 |
7
See Notes to Financial Statements.
Eaton Vance
Government Opportunities Fund
October 31, 2023
Portfolio of Investments — continued
| Security | Principal
Amount
(000's omitted) | Value |
| Federal Home Loan Mortgage Corp.: (continued) | | | |
| Series 5131, Class QZ, 3.00%, 7/25/51 | $ | 273 | $ 145,901 |
| Series 5132, Class LZ, 2.50%, 8/25/51 | | 1,003 | 474,534 |
| Series 5135, Class MZ, 2.50%, 8/25/51 | | 1,942 | 980,686 |
| Series 5136, Class ZJ, 2.50%, 8/25/51 | | 2,082 | 1,020,863 |
| Series 5139, Class DZ, 2.50%, 9/25/51 | | 1,368 | 670,780 |
| Series 5141, Class ZJ, 2.50%, 9/25/51 | | 1,792 | 879,189 |
| Series 5144, Class Z, 2.50%, 9/25/51 | | 4,164 | 2,144,835 |
| Series 5148, Class AZ, 2.50%, 10/25/51 | | 3,109 | 1,610,210 |
| Series 5150, Class ZJ, 2.50%, 10/25/51 | | 1,702 | 874,322 |
| Series 5150, Class ZN, 2.50%, 10/25/51 | | 187 | 85,793 |
| Series 5159, Class ZP, 3.00%, 11/25/51 | | 430 | 230,548 |
| Series 5159, Class ZT, 3.00%, 11/25/51 | | 763 | 435,334 |
| Series 5163, Class Z, 3.00%, 11/25/51 | | 540 | 273,063 |
| Series 5166, Class ZN, 3.00%, 9/25/50 | | 980 | 512,550 |
| Series 5168, Class MZ, 3.00%, 10/25/51 | | 1,027 | 573,165 |
| Series 5300, Class EY, 6.00%, 12/25/52 | | 2,000 | 1,911,729 |
| Series 5324, Class MZ, 6.00%, 7/25/53 | | 3,392 | 3,013,945 |
| Series 5327, Class B, 6.00%, 8/25/53 | | 2,350 | 2,242,322 |
| Interest Only:(7) | | | |
| Series 362, Class C12, 4.00%, 12/15/47 | | 2,122 | 436,771 |
| Series 4749, Class IL, 4.00%, 12/15/47 | | 763 | 152,674 |
| Series 4756, Class KI, 4.00%, 1/15/48 | | 841 | 164,955 |
| Series 4768, Class IO, 4.00%, 3/15/48 | | 601 | 120,540 |
| Series 4772, Class PI, 4.00%, 1/15/48 | | 892 | 178,704 |
| Series 4791, Class JI, 4.00%, 5/15/48 | | 1,220 | 256,145 |
| Series 4966, Class SY, 0.615%, (5.936% - 30-day average SOFR), 4/25/50(6) | | 2,149 | 200,064 |
| Series 5008, Class IE, 2.00%, 9/25/50 | | 4,470 | 524,133 |
| Series 5010, Class I, 2.00%, 9/25/50 | | 3,353 | 395,341 |
| Series 5010, Class IN, 2.00%, 9/25/50 | | 2,441 | 288,338 |
| Series 5010, Class NI, 2.00%, 9/25/50 | | 2,782 | 348,698 |
| Series 5016, Class UI, 2.00%, 9/25/50 | | 2,721 | 319,010 |
| Series 5017, Class DI, 2.00%, 9/25/50 | | 4,761 | 558,267 |
| Series 5024, Class CI, 2.00%, 10/25/50 | | 5,255 | 622,759 |
| Series 5025, Class GI, 2.00%, 10/25/50 | | 1,145 | 135,233 |
| Series 5028, Class TI, 2.00%, 10/25/50 | | 1,471 | 140,241 |
| Series 5038, Class DI, 2.00%, 11/25/50 | | 7,368 | 870,577 |
| Series 5051, Class S, 0.00%, (3.60% - 30-day average SOFR, Floor 0.00%), 12/25/50(6) | | 4,312 | 102,634 |
| Series 5070, Class CI, 2.00%, 2/25/51 | | 8,100 | 1,025,699 |
| Principal Only:(8) | | | |
| Series 246, Class PO, 0.00%, 5/15/37 | | 1,241 | 951,031 |
| Series 3435, Class PO, 0.00%, 4/15/38 | | 1,174 | 896,998 |
| Series 4239, Class OU, 0.00%, 7/15/43 | | 319 | 153,065 |
| Security | Principal
Amount
(000's omitted) | Value |
| Federal Home Loan Mortgage Corp. Structured Agency Credit Risk Debt Notes, Series 2019-HQA3, Class B2, 12.935%, (30-day average SOFR + 7.614%), 9/25/49(1)(3) | $ | 1,000 | $ 1,089,944 |
| Federal National Mortgage Association: | | | |
| Series 1994-40, Class Z, 6.50%, 3/25/24 | | 4 | 3,846 |
| Series 1994-42, Class K, 6.50%, 4/25/24 | | 17 | 17,217 |
| Series 1994-82, Class Z, 8.00%, 5/25/24 | | 8 | 8,488 |
| Series 2000-49, Class A, 8.00%, 3/18/27 | | 30 | 30,482 |
| Series 2001-81, Class HE, 6.50%, 1/25/32 | | 170 | 172,193 |
| Series 2012-133, Class WS, 0.00%, (3.696% - 30-day average SOFR, Floor 0.00%), 12/25/42(6) | | 305 | 226,545 |
| Series 2012-134, Class ZT, 2.00%, 12/25/42 | | 1,309 | 994,907 |
| Series 2013-6, Class TY, 1.50%, 2/25/43 | | 795 | 469,817 |
| Series 2013-58, Class SC, 0.00%, (5.828% - 30-day average SOFR x 1.50, Floor 0.00%), 6/25/43(6) | | 323 | 206,774 |
| Series 2020-45, Class MA, 0.00%, (3.108% - 30-day average SOFR x 0.80, Floor 0.00%), 6/25/43(6) | | 199 | 134,973 |
| Series 2020-63, Class ZN, 3.00%, 9/25/50 | | 94 | 45,806 |
| Series 2021-3, Class ZH, 2.50%, 2/25/51 | | 189 | 81,369 |
| Series 2021-14, Class GZ, 2.50%, 3/25/51 | | 133 | 54,512 |
| Series 2021-42, Class ZD, 3.00%, 11/25/50 | | 696 | 381,889 |
| Series 2021-52, Class JZ, 2.50%, 8/25/51 | | 1,630 | 824,560 |
| Series 2021-56, Class LZ, 2.50%, 9/25/51 | | 3,144 | 1,689,370 |
| Series 2021-66, Class JZ, 2.50%, 10/25/51 | | 1,376 | 694,172 |
| Series 2021-77, Class WZ, 3.00%, 8/25/50 | | 38 | 18,620 |
| Series 2021-95, Class ZC, 3.00%, 8/25/51 | | 533 | 297,183 |
| Series 2023-12, Class LW, 6.00%, 4/25/53 | | 2,000 | 1,911,828 |
| Series 2023-13, Class LY, 6.00%, 4/25/53 | | 2,000 | 1,897,598 |
| Series 2023-14, Class EL, 6.00%, 4/25/53 | | 7,000 | 6,628,833 |
| Interest Only:(7) | | | |
| Series 2017-66, Class TI, 0.05%, (5.936% - 30-day average SOFR), 10/25/42(6) | | 12,028 | 35,017 |
| Series 2018-21, Class IO, 3.00%, 4/25/48 | | 2,441 | 433,885 |
| Series 2019-1, Class SA, 0.00%, (5.286% - 30-day average SOFR, Floor 0.00%), 2/25/49(6) | | 1,351 | 47,609 |
| Series 2020-23, Class SP, 0.615%, (5.936% - 30-day average SOFR), 2/25/50(6) | | 2,117 | 199,428 |
| Series 2020-45, Class HI, 2.50%, 7/25/50 | | 3,258 | 465,550 |
| Series 2020-45, Class IJ, 2.50%, 7/25/50 | | 5,210 | 719,984 |
| Series 2020-73, Class NI, 2.00%, 10/25/50 | | 722 | 85,528 |
| Series 2021-3, Class KI, 2.50%, 2/25/51 | | 6,920 | 975,003 |
| Series 2021-3, Class LI, 2.50%, 2/25/51 | | 6,884 | 952,063 |
| Series 2021-4, Class AI, 2.00%, 12/25/49 | | 9,319 | 1,071,002 |
| Series 2021-10, Class EI, 2.00%, 3/25/51 | | 3,743 | 477,293 |
| Principal Only:(8) | | | |
| Series 379, Class 1, 0.00%, 5/25/37 | | 789 | 593,985 |
| Series 2014-9, Class DO, 0.00%, 2/25/43 | | 473 | 327,987 |
| Series 2014-17, Class PO, 0.00%, 4/25/44 | | 1,077 | 724,491 |
8
See Notes to Financial Statements.
Eaton Vance
Government Opportunities Fund
October 31, 2023
Portfolio of Investments — continued
| Security | Principal
Amount
(000's omitted) | Value |
| FIGRE Trust, Series 2023-HE2, Class A, 6.512%, 5/25/53(1)(2) | $ | 1,332 | $ 1,318,292 |
| Finance of America HECM Buyout, Series 2022-HB2, Class M5, 6.00%, 8/1/32(1)(2) | | 1,000 | 579,677 |
| Flagstar Mortgage Trust, Series 2021-6INV, Class B3, 3.488%, 8/25/51(1)(2) | | 3,131 | 2,183,877 |
| FREED Mortgage, Series 2022-HE1, Class A, 7.00%, 10/25/37(1) | | 1,469 | 1,453,950 |
| Government National Mortgage Association: | | | |
| Series 2016-168, Class JS, 0.00%, (4.336% - 1 mo. SOFR x 1.12), 11/20/46(6) | | 32 | 9,442 |
| Series 2017-137, Class AF, 5.00%, (1 mo. SOFR + 0.614%), 9/20/47(3) | | 932 | 870,939 |
| Series 2020-84, Class BZ, 2.50%, 6/20/50 | | 682 | 304,404 |
| Series 2021-1, Class ZD, 3.00%, 1/20/51 | | 135 | 85,840 |
| Series 2021-24, Class EZ, 2.50%, 1/20/51 | | 391 | 177,283 |
| Series 2021-24, Class KZ, 2.50%, 2/20/51 | | 394 | 204,560 |
| Series 2021-25, Class JZ, 2.50%, 2/20/51 | | 222 | 89,711 |
| Series 2021-49, Class VZ, 2.50%, 3/20/51 | | 2 | 877 |
| Series 2021-77, Class ZG, 3.00%, 7/20/50 | | 47 | 22,311 |
| Series 2021-97, Class MZ, 3.00%, 8/20/50 | | 278 | 148,977 |
| Series 2021-97, Class ZC, 3.00%, 8/20/50 | | 594 | 323,755 |
| Series 2021-105, Class MZ, 3.00%, 6/20/51 | | 463 | 244,495 |
| Series 2021-114, Class JZ, 3.00%, 6/20/51 | | 183 | 93,578 |
| Series 2021-118, Class EZ, 2.50%, 7/20/51 | | 1,167 | 607,229 |
| Series 2021-121, Class ZE, 2.50%, 7/20/51 | | 36 | 15,978 |
| Series 2021-122, Class ZL, 2.50%, 7/20/51 | | 1,405 | 698,678 |
| Series 2021-131, Class ZN, 3.00%, 7/20/51 | | 301 | 170,545 |
| Series 2021-136, Class WZ, 3.00%, 8/20/51 | | 767 | 406,216 |
| Series 2021-136, Class Z, 2.50%, 8/20/51 | | 1,914 | 965,831 |
| Series 2021-137, Class GZ, 2.50%, 8/20/51 | | 2,082 | 1,186,561 |
| Series 2021-138, Class Z, 2.50%, 8/20/51 | | 1,239 | 663,143 |
| Series 2021-139, Class ZJ, 2.50%, 8/20/51 | | 1,705 | 983,974 |
| Series 2021-154, Class ZC, 2.50%, 9/20/51 | | 886 | 451,254 |
| Series 2021-154, Class ZL, 3.00%, 9/20/51 | | 476 | 228,847 |
| Series 2021-156, Class GZ, 3.00%, 9/20/51 | | 1,673 | 1,051,342 |
| Series 2021-159, Class ZJ, 2.50%, 9/20/51 | | 1,301 | 680,550 |
| Series 2021-159, Class ZP, 2.00%, 9/20/51 | | 1,160 | 664,526 |
| Series 2021-160, Class NZ, 3.00%, 9/20/51 | | 607 | 294,276 |
| Series 2021-175, Class DZ, 3.00%, 10/20/51 | | 459 | 221,336 |
| Series 2021-177, Class JZ, 3.00%, 10/20/51 | | 496 | 286,300 |
| Series 2021-214, Class LZ, 3.00%, 12/20/51 | | 1,056 | 649,799 |
| Series 2022-173, Class S, 3.222%, (22.733% - 30-day average SOFR x 3.667), 10/20/52(6) | | 1,591 | 1,413,595 |
| Series 2022-189, Class US, 3.222%, (22.733% - 30-day average SOFR x 3.667), 11/20/52(6) | | 1,866 | 1,690,654 |
| Series 2022-195, Class AS, 3.436%, (23.125% - 30-day average SOFR x 3.70), 11/20/52(6) | | 962 | 938,951 |
| Security | Principal
Amount
(000's omitted) | Value |
| Government National Mortgage Association: (continued) | | | |
| Series 2022-197, Class SW, 3.549%, (16.32% - 30-day average SOFR x 2.40), 11/20/52(6) | $ | 1,789 | $ 1,624,920 |
| Series 2023-53, Class AL, 5.50%, 4/20/53 | | 4,000 | 3,635,678 |
| Series 2023-53, Class SE, 3.039%, (22.55% - 30-day average SOFR x 3.667), 4/20/53(6) | | 2,935 | 2,718,247 |
| Series 2023-63, Class LB, 6.00%, 5/20/53 | | 3,000 | 2,844,736 |
| Series 2023-63, Class S, 3.039%, (22.55% - 30-day average SOFR x 3.667), 5/20/53(6) | | 1,967 | 1,756,838 |
| Series 2023-64, Class LB, 6.00%, 5/20/53 | | 1,224 | 1,160,791 |
| Series 2023-65, Class G, 3.039%, (22.55% - 30-day average SOFR x 3.667), 5/20/53(6) | | 1,990 | 1,732,612 |
| Series 2023-65, Class SB, 3.039%, (22.55% - 30-day average SOFR x 3.667), 5/20/53(6) | | 1,885 | 1,721,760 |
| Series 2023-66, Class S, 3.039%, (22.55% - 30-day average SOFR x 3.667), 5/20/53(6) | | 985 | 909,198 |
| Series 2023-82, Class AL, 6.00%, 6/20/53 | | 6,000 | 5,685,933 |
| Series 2023-84, Class MW, 6.00%, 6/20/53 | | 3,500 | 3,318,491 |
| Series 2023-84, Class SN, 2.858%, (22.387% - 30-day average SOFR x 3.67), 6/20/53(6) | | 1,973 | 1,743,928 |
| Series 2023-96, Class BL, 6.00%, 7/20/53 | | 2,500 | 2,377,691 |
| Series 2023-96, Class DB, 6.00%, 7/20/53 | | 2,500 | 2,372,932 |
| Series 2023-97, Class CB, 6.00%, 7/20/53 | | 3,000 | 2,900,880 |
| Series 2023-98, Class BW, 6.00%, 7/20/53 | | 1,500 | 1,424,576 |
| Series 2023-98, Class JB, 6.00%, 7/20/53 | | 3,000 | 2,850,502 |
| Series 2023-99, Class AL, 6.00%, 7/20/53 | | 4,000 | 3,797,346 |
| Series 2023-117, Class JB, 6.00%, 8/20/53 | | 2,000 | 1,900,208 |
| Series 2023-150, Class AS, 7.065%, (27.528% - 30-day average SOFR x 3.85), 10/20/53(6) | | 3,000 | 3,041,652 |
| Interest Only:(7) | | | |
| Series 2013-66, Class IE, 0.05%, (0.05% - 1 mo. SOFR x 1.00), 7/20/42(6) | | 6,622 | 14,673 |
| Series 2014-94, Class IC, 0.10%, (0.10% - 1 mo. SOFR x 1.00), 9/20/35(6) | | 9,517 | 35,840 |
| Series 2014-100, Class VI, 0.15%, (0.15% - 1 mo. SOFR x 1.00), 5/20/40(6) | | 3,906 | 17,481 |
| Series 2014-139, Class BI, 0.25%, (0.25% - 1 mo. SOFR x 1.00), 11/20/37(6) | | 3,993 | 25,950 |
| Series 2018-127, Class SG, 0.796%, (6.136% - 1 mo. SOFR), 9/20/48(6) | | 2,982 | 203,988 |
| Series 2019-27, Class SA, 0.596%, (5.936% - 1 mo. SOFR), 2/20/49(6) | | 2,097 | 166,136 |
| Series 2019-38, Class SQ, 0.596%, (5.936% - 1 mo. SOFR), 3/20/49(6) | | 2,584 | 191,671 |
| Series 2019-43, Class BS, 0.596%, (5.936% - 1 mo. SOFR), 4/20/49(6) | | 3,493 | 280,805 |
| Series 2020-32, Class KI, 3.50%, 3/20/50 | | 3,567 | 616,214 |
| Series 2020-65, Class MI, 2.50%, 12/20/49 | | 2,862 | 343,313 |
| Series 2020-97, Class MI, 2.50%, 3/20/50 | | 1,807 | 227,996 |
| Series 2020-146, Class IQ, 2.00%, 10/20/50 | | 10,399 | 1,154,936 |
| Series 2020-146, Class QI, 2.00%, 10/20/50 | | 5,533 | 605,263 |
| Series 2020-149, Class NI, 2.50%, 10/20/50 | | 10,913 | 1,481,780 |
9
See Notes to Financial Statements.
Eaton Vance
Government Opportunities Fund
October 31, 2023
Portfolio of Investments — continued
| Security | Principal
Amount
(000's omitted) | Value |
| Interest Only: (continued) | | | |
| Series 2020-165, Class UI, 2.00%, 11/20/50 | $ | 4,496 | $ 516,800 |
| Series 2020-167, Class KI, 2.00%, 11/20/50 | | 7,068 | 785,564 |
| Series 2020-167, Class YI, 2.00%, 11/20/50 | | 5,710 | 678,067 |
| Series 2020-173, Class DI, 2.00%, 11/20/50 | | 8,499 | 1,027,499 |
| Series 2020-181, Class TI, 2.00%, 12/20/50 | | 14,594 | 1,682,227 |
| Series 2021-23, Class TI, 2.50%, 2/20/51 | | 7,017 | 913,866 |
| Series 2021-56, Class SD, 0.00%, (2.30% - 30-day average SOFR, Floor 0.00%), 9/20/50(6) | | 4,426 | 42,776 |
| Series 2021-114, Class MI, 3.00%, 6/20/51 | | 4,979 | 772,859 |
| Series 2021-122, Class NI, 3.00%, 7/20/51 | | 3,422 | 522,378 |
| Series 2021-125, Class SA, 0.00%, (3.636% - 1 mo. SOFR, Floor 0.00%), 7/20/51(6) | | 4,046 | 85,039 |
| Series 2021-131, Class QI, 3.00%, 7/20/51 | | 6,602 | 836,354 |
| Series 2021-140, Class YS, 0.00%, (1.586% - 1 mo. SOFR, Floor 0.00%), 8/20/51(6) | | 3,380 | 19,455 |
| Series 2021-175, Class AS, 0.00%, (1.686% - 1 mo. SOFR, Floor 0.00%), 10/20/51(6) | | 17,416 | 105,318 |
| Series 2021-175, Class SB, 0.00%, (1.686% - 1 mo. SOFR, Floor 0.00%), 10/20/51(6) | | 8,756 | 53,048 |
| Series 2021-193, Class IU, 3.00%, 11/20/49 | | 13,996 | 1,905,460 |
| Series 2021-193, Class YS, 0.00%, (2.45% - 30-day average SOFR, Floor 0.00%), 11/20/51(6) | | 8,430 | 73,487 |
| Series 2021-196, Class GI, 3.00%, 11/20/51 | | 6,446 | 919,030 |
| Series 2022-119, Class CS, 0.00%, (3.00% - 30-day average SOFR, Floor 0.00%), 7/20/52(6) | | 46,332 | 350,482 |
| Series 2022-126, Class AS, 0.00%, (3.69% - 30-day average SOFR, Floor 0.00%), 7/20/52(6) | | 13,816 | 183,979 |
| Series 2022-135, Class SA, 0.00%, (3.00% - 30-day average SOFR, Floor 0.00%), 6/20/52(6) | | 18,618 | 155,755 |
| Series 2023-13, Class SA, 0.079%, (5.40% - 30-day average SOFR), 1/20/53(6) | | 7,339 | 134,373 |
| Series 2023-19, Class SD, 0.979%, (6.30% - 30-day average SOFR), 2/20/53(6) | | 4,776 | 251,469 |
| Series 2023-20, Class HS, 0.979%, (6.30% - 30-day average SOFR), 2/20/53(6) | | 5,098 | 273,366 |
| Series 2023-22, Class ES, 0.979%, (6.30% - 30-day average SOFR), 2/20/53(6) | | 7,703 | 413,086 |
| Series 2023-22, Class SA, 0.379%, (5.70% - 30-day average SOFR), 2/20/53(6) | | 4,596 | 125,387 |
| Series 2023-24, Class SB, 0.00%, (5.15% - 30-day average SOFR, Floor 0.00%), 2/20/53(6) | | 15,406 | 378,583 |
| Series 2023-24, Class SG, 0.979%, (6.30% - 30-day average SOFR), 2/20/53(6) | | 7,703 | 413,086 |
| Series 2023-32, Class SA, 0.979%, (6.30% - 30-day average SOFR), 2/20/53(6) | | 14,443 | 774,536 |
| Series 2023-38, Class LS, 0.979%, (6.30% - 30-day average SOFR), 3/20/53(6) | | 4,859 | 259,960 |
| Series 2023-47, Class HS, 0.979%, (6.30% - 30-day average SOFR), 3/20/53(6) | | 1,604 | 85,787 |
| Series 2023-47, Class SC, 0.929%, (6.25% - 30-day average SOFR), 3/20/53(6) | | 2,424 | 126,372 |
| Security | Principal
Amount
(000's omitted) | Value |
| Interest Only: (continued) | | | |
| Series 2023-89, Class SE, 0.729%, (6.05% - 30-day average SOFR), 6/20/53(6) | $ | 30,600 | $ 1,576,526 |
| LHOME Mortgage Trust, Series 2023-RTL2, Class A1, 8.00% to 1/25/26, 6/25/28(1)(4) | | 1,050 | 1,051,762 |
| MFRA Trust, Series 2023-NQM1, Class A2, 5.75% to 1/25/26, 11/25/67(1)(4) | | 571 | 544,859 |
| PNMAC GMSR Issuer Trust, Series 2022-GT1, Class A, 9.571%, (30-day average SOFR + 4.25%), 5/25/27(1)(3) | | 500 | 501,037 |
| Radnor Re, Ltd., Series 2022-1, Class M1A, 9.071%, (30-day average SOFR + 3.75%), 9/25/32(1)(3) | | 3,000 | 3,054,538 |
| Unison Trust, Series 2021-1, Class A, 4.50%, 4/25/50(1)(2) | | 8,992 | 7,016,686 |
Total Collateralized Mortgage Obligations
(identified cost $232,730,317) | | | $183,087,698 |
| Commercial Mortgage-Backed Securities — 0.4% |
| Security | Principal
Amount
(000's omitted) | Value |
| CSMC Trust, Series 2022-NWPT, Class A, 8.478%, (1 mo. SOFR + 3.143%), 9/9/24(1)(3) | $ | 1,520 | $ 1,525,701 |
Total Commercial Mortgage-Backed Securities
(identified cost $1,518,346) | | | $ 1,525,701 |
| U.S. Department of Agriculture Loans — 5.3% |
| Security | Principal
Amount
(000's omitted) | Value |
| USDA Guaranteed Loans: | | | |
| 8.00%, (USD Prime - 0.50%), 2/16/43(3) | $ | 8,385 | $ 8,392,787 |
| 8.00%, (USD Prime - 0.50%), 2/16/43(3) | | 2,503 | 2,505,120 |
| 8.00%, (USD Prime - 0.50%), 2/16/43(3) | | 10,817 | 10,828,173 |
Total U.S. Department of Agriculture Loans
(identified cost $21,705,799) | | | $ 21,726,080 |
| U.S. Government Agency Commercial Mortgage-Backed Securities — 0.6% |
| Security | Principal
Amount
(000's omitted) | Value |
| FRESB Mortgage Trust: | | | |
Interest Only:(7)
Series 2021-SB91, Class X1, 0.572%, 8/25/41(2) | $ | 4,754 | $ 129,437 |
10
See Notes to Financial Statements.
Eaton Vance
Government Opportunities Fund
October 31, 2023
Portfolio of Investments — continued
| Security | Principal
Amount
(000's omitted) | Value |
| Government National Mortgage Association: | | | |
| Interest Only:(7) | | | |
| Series 2021-101, Class IO, 0.679%, 4/16/63(2) | $ | 9,057 | $ 475,965 |
| Series 2021-132, Class IO, 0.726%, 4/16/63(2) | | 8,743 | 478,373 |
| Series 2021-144, Class IO, 0.825%, 4/16/63(2) | | 8,596 | 506,264 |
| Series 2021-186, Class IO, 0.765%, 5/16/63(2) | | 9,524 | 539,203 |
| Series 2022-3, Class IO, 0.64%, 2/16/61(2) | | 9,677 | 450,102 |
Total U.S. Government Agency Commercial Mortgage-Backed Securities
(identified cost $3,387,533) | | | $ 2,579,344 |
| U.S. Government Agency Mortgage-Backed Securities — 74.1% |
| Security | Principal
Amount
(000's omitted) | Value |
| Federal Home Loan Mortgage Corp.: | | | |
| 4.144%, (COF + 1.254%), with maturity at 2034(9) | $ | 94 | $ 90,866 |
| 4.196%, (COF + 1.254%), with maturity at 2035(9) | | 398 | 389,728 |
| 4.50%, with maturity at 2035 | | 613 | 585,182 |
| 4.834%, (1 yr. CMT + 2.249%), with maturity at 2038(9) | | 358 | 358,794 |
| 4.88%, (1 yr. CMT + 2.238%), with maturity at 2036(9) | | 400 | 400,468 |
| 5.00%, with maturity at 2052(10) | | 4,926 | 4,460,154 |
| 5.50%, with various maturities to 2053 | | 3,550 | 3,382,908 |
| 6.00%, with various maturities to 2053(10) | | 4,943 | 4,821,609 |
| 6.50%, with various maturities to 2053 | | 1,343 | 1,345,587 |
| 7.00%, with various maturities to 2025 | | 15 | 14,697 |
| 7.50%, with maturity at 2024 | | 1 | 996 |
| 8.50%, with maturity at 2025 | | 1 | 753 |
| 9.00%, with maturity at 2027 | | 1 | 1,228 |
| 9.50%, with maturity at 2025 | | 0 (5) | 86 |
| Federal National Mortgage Association: | | | |
| 4.087%, (COF + 1.272%), with maturity at 2033(9) | | 183 | 177,434 |
| 4.114%, (COF + 1.299%), with maturity at 2033(9) | | 99 | 95,871 |
| 4.14%, (COF + 1.25%), with maturity at 2025(9) | | 22 | 21,691 |
| 4.141%, (COF + 1.296%), with maturity at 2035(9) | | 105 | 101,676 |
| 4.146%, (COF + 1.254%), with maturity at 2034(9) | | 29 | 28,037 |
| 4.186%, (COF + 1.254%), with maturity at 2035(9) | | 117 | 115,646 |
| 4.219%, (COF + 1.25%), with maturity at 2026(9) | | 66 | 65,388 |
| 4.223%, (COF + 1.254%), with maturity at 2034(9) | | 148 | 142,737 |
| 4.406%, (COF + 1.26%), with maturity at 2036(9) | | 100 | 96,994 |
| 4.465%, (COF + 1.311%), with maturity at 2036(9) | | 168 | 162,340 |
| 4.50%, with various maturities to 2052 | | 777 | 698,345 |
| 4.594%, (COF + 1.258%), with maturity at 2036(9) | | 26 | 25,808 |
| 4.848%, (COF + 2.352%), with maturity at 2027(9) | | 61 | 60,728 |
| 4.924%, (COF + 1.736%), with maturity at 2035(9) | | 392 | 384,041 |
| Security | Principal
Amount
(000's omitted) | Value |
| Federal National Mortgage Association: (continued) | | | |
| 4.951%, (COF + 1.859%), with maturity at 2034(9) | $ | 196 | $ 193,037 |
| 5.00%, with maturity at 2027 | | 21 | 21,018 |
| 5.192%, (COF + 1.811%), with maturity at 2036(9) | | 1,890 | 1,847,836 |
| 5.286%, (1 yr. CMT + 2.095%), with maturity at 2040(9) | | 180 | 180,823 |
| 5.50%, with various maturities to 2052(10) | | 13,800 | 13,121,556 |
| 5.50%, 30-Year, TBA(11) | | 19,500 | 18,510,527 |
| 5.967%, (12 mo. MTA + 1.167%), with maturity at 2044(9) | | 159 | 156,855 |
| 6.00%, with various maturities to 2053(10) | | 7,758 | 7,585,021 |
| 6.50%, with various maturities to 2053 | | 6,510 | 6,486,953 |
| 6.50%, 30-Year, TBA(11) | | 23,400 | 23,259,235 |
| 6.51%, with maturity at 2025 | | 7 | 6,991 |
| 7.50%, with maturity at 2026 | | 1 | 926 |
| 8.049%, with maturity at 2030 | | 1 | 655 |
| 8.50%, with maturity at 2037 | | 52 | 53,334 |
| 9.00%, with maturity at 2025 | | 8 | 7,780 |
| 9.50%, with various maturities to 2030 | | 3 | 2,621 |
| Government National Mortgage Association: | | | |
| 2.75%, (1 yr. CMT + 1.50%), with maturity at 2027(9) | | 38 | 36,307 |
| 3.00%, (1 yr. CMT + 1.50%), with maturity at 2026(9) | | 28 | 26,872 |
| 3.50%, with maturity at 2050 | | 453 | 386,399 |
| 4.00%, with various maturities to 2049 | | 1,158 | 1,023,147 |
| 4.50%, with various maturities to 2049 | | 443 | 402,118 |
| 5.00%, with various maturities to 2052(10) | | 10,271 | 9,540,926 |
| 5.50%, with various maturities to 2063(10) | | 43,923 | 42,009,210 |
| 6.00%, with various maturities to 2063(10) | | 55,392 | 54,496,924 |
| 6.50%, with various maturities to 2063(10) | | 35,259 | 35,268,903 |
| 6.50%, 30-Year, TBA(11) | | 50,862 | 50,767,666 |
| 7.00%, with various maturities to 2063(10) | | 17,145 | 17,442,054 |
| 7.50%, with various maturities to 2053 | | 2,358 | 2,389,733 |
| 9.50%, with maturity at 2025 | | 1 | 1,399 |
Total U.S. Government Agency Mortgage-Backed Securities
(identified cost $312,710,956) | | | $303,256,618 |
| U.S. Government Guaranteed Small Business Administration Loans — 0.3%(12)(13) |
| Security | Principal
Amount
(000's omitted) | Value |
| 0.16%, 7/15/37 to 5/15/42 | $ | 524 | $ 2,238 |
| 0.23%, 4/15/37 to 12/15/37 | | 1,334 | 7,386 |
| 0.41%, 6/15/42 to 7/15/42 | | 211 | 2,564 |
| 0.48%, 3/15/37 to 12/15/37 | | 2,290 | 26,762 |
| 0.66%, 7/15/42 | | 51 | 994 |
11
See Notes to Financial Statements.
Eaton Vance
Government Opportunities Fund
October 31, 2023
Portfolio of Investments — continued
| Security | Principal
Amount
(000's omitted) | Value |
| 0.73%, 3/15/37 to 10/15/42 | $ | 1,293 | $ 23,563 |
| 0.91%, 5/15/42 | | 447 | 12,132 |
| 0.98%, 9/15/37 to 11/15/37 | | 807 | 19,078 |
| 1.23%, 8/15/37 to 12/15/37 | | 872 | 25,885 |
| 1.86%, 9/15/42 to 1/15/43 | | 3,357 | 184,721 |
| 1.89%, 11/15/42 | | 61 | 3,384 |
| 2.11%, 10/15/42 | | 3,286 | 205,528 |
| 2.36%, 12/15/42 | | 484 | 33,890 |
| 2.86%, 12/15/42 to 2/15/43 | | 5,241 | 447,294 |
| 3.11%, 12/15/42 | | 2,755 | 256,028 |
Total U.S. Government Guaranteed Small Business Administration Loans
(identified cost $4,811,924) | | | $ 1,251,447 |
| Short-Term Investments — 1.0% |
| Security | Shares | Value |
| Morgan Stanley Institutional Liquidity Funds - Government Portfolio, Institutional Class, 5.25%(14) | | 4,120,946 | $ 4,120,946 |
Total Short-Term Investments
(identified cost $4,120,946) | | | $ 4,120,946 |
Total Purchased Swaptions — 0.3%
(identified cost $381,014) | | | $ 1,466,235 |
Total Investments — 130.3%
(identified cost $595,740,430) | | | $533,117,897 |
Total Written Swaptions — (0.0)%(15)
(premiums received $361,610) | | | $ (20,933) |
| TBA Sale Commitments — (16.8)% |
| U.S. Government Agency Mortgage-Backed Securities — (16.8)% |
| Security | Principal
Amount
(000's omitted) | Value |
| Government National Mortgage Association, 6.00%, 30-Year, TBA(11) | | $ (70,000) | $ (68,596,521) |
Total U.S. Government Agency Mortgage-Backed Securities
(proceeds $68,537,500) | | | $ (68,596,521) |
Total TBA Sale Commitments
(proceeds $68,537,500) | | | $ (68,596,521) |
| Other Assets, Less Liabilities — (13.5)% | | | $ (55,510,415) |
| Net Assets — 100.0% | | | $408,990,028 |
| The percentage shown for each investment category in the Portfolio of Investments is based on net assets. |
| (1) | Security exempt from registration under Rule 144A of the Securities Act of 1933, as amended. These securities may be sold in certain transactions in reliance on an exemption from registration (normally to qualified institutional buyers). At October 31, 2023, the aggregate value of these securities is $49,010,044 or 12.0% of the Fund's net assets. |
| (2) | Weighted average fixed-rate coupon that changes/updates monthly. Rate shown is the rate at October 31, 2023. |
| (3) | Variable rate security. The stated interest rate represents the rate in effect at October 31, 2023. |
| (4) | Step coupon security. Interest rate represents the rate in effect at October 31, 2023. |
| (5) | Principal amount is less than $500. |
| (6) | Inverse floating-rate security whose coupon varies inversely with changes in the interest rate index. The stated interest rate represents the coupon rate in effect at October 31, 2023. |
| (7) | Interest only security that entitles the holder to receive only interest payments on the underlying mortgages. Principal amount shown is the notional amount of the underlying mortgages on which coupon interest is calculated. |
| (8) | Principal only security that entitles the holder to receive only principal payments on the underlying mortgages. |
| (9) | Adjustable rate mortgage security whose interest rate generally adjusts monthly based on a weighted average of interest rates on the underlying mortgages. The coupon rate may not reflect the applicable index value as interest rates on the underlying mortgages may adjust on various dates and at various intervals and may be subject to lifetime ceilings and lifetime floors and lookback periods. Rate shown is the coupon rate at October 31, 2023. |
| (10) | Security (or a portion thereof) has been pledged for the benefit of the counterparty for reverse repurchase agreements. |
12
See Notes to Financial Statements.
Eaton Vance
Government Opportunities Fund
October 31, 2023
Portfolio of Investments — continued
| (11) | TBA (To Be Announced) securities are purchased or sold on a forward commitment basis with an approximate principal amount and maturity date. The actual principal amount and maturity date are determined upon settlement. |
| (12) | Interest only security that entitles the holder to receive only a portion of the interest payments on the underlying loans. Principal amount shown is the notional amount of the underlying loans on which coupon interest is calculated. |
| (13) | Securities comprise a trust that is wholly-owned by the Fund and may only be sold on a pro rata basis with all securities in the trust. |
| (14) | May be deemed to be an affiliated investment company. The rate shown is the annualized seven-day yield as of October 31, 2023. |
| (15) | Amount is less than (0.05)%. |
| Purchased Interest Rate Swaptions (OTC) — 0.3% |
| Description | Counterparty | Notional Amount | Expiration
Date | Value |
| Option to enter into interest rate swap expiring 5/10/29 to pay 3.93% and receive SOFR | Bank of America, N.A. | USD | 48,508,668 | 5/8/24 | $ 1,466,235 |
| Total | | | | | $1,466,235 |
| Written Interest Rate Swaptions (OTC) — (0.0)%(1) |
| Description | Counterparty | Notional
Amount | Expiration
Date | Value |
| Option to enter into interest rate swap expiring 5/10/29 to receive 1.93% and pay SOFR | Bank of America, N.A. | USD | (48,508,668) | 5/8/24 | $ (20,933) |
| Total | | | | | $(20,933) |
| (1) | Amount is less than (0.05)%. |
| Futures Contracts |
| Description | Number of
Contracts | Position | Expiration
Date | Notional
Amount | Value/Unrealized
Appreciation
(Depreciation) |
| Interest Rate Futures | | | | | |
| U.S. 5-Year Treasury Note | 4,058 | Long | 12/29/23 | $423,965,893 | $ (3,754,826) |
| U.S. 10-Year Treasury Note | 107 | Long | 12/19/23 | 11,360,390 | (442,295) |
| U.S. Long Treasury Bond | (545) | Short | 12/19/23 | (59,643,438) | 2,664,811 |
| U.S. Ultra-Long Treasury Bond | (107) | Short | 12/19/23 | (12,044,187) | 849,078 |
| | | | | | $ (683,232) |
13
See Notes to Financial Statements.
Eaton Vance
Government Opportunities Fund
October 31, 2023
Portfolio of Investments — continued
| Interest Rate Swaps (Centrally Cleared) |
Notional Amount
(000's omitted) | Fund
Pays/
Receives
Floating
Rate | Floating Rate | Annual
Fixed Rate | Termination
Date | Value | Unamortized
Upfront
Receipts
(Payments) | Unrealized
Appreciation
(Depreciation) |
| USD | 50,000 | Receives | SOFR
(pays annually) | 3.07%
(pays annually) | 10/14/32 | $ 5,408,250 | $ — | $ 5,408,250 |
| USD | 6,000 | Receives | SOFR
(pays annually) | 3.16%
(pays annually) | 1/5/33 | 728,761 | — | 728,761 |
| USD | 25,000 | Receives | SOFR
(pays annually) | 1.92%
(pays annually) | 4/8/52 | 10,403,576 | — | 10,403,576 |
| USD | 10,000 | Receives | SOFR
(pays annually) | 1.89%
(pays annually) | 8/3/52 | 4,079,092 | (96) | 4,078,996 |
| Total | | | | | | $20,619,679 | $ (96) | $20,619,583 |
| Abbreviations: |
| CMT | – Constant Maturity Treasury |
| COF | – Cost of Funds 11th District |
| MTA | – Monthly Treasury Average |
| OTC | – Over-the-counter |
| SOFR | – Secured Overnight Financing Rate |
| TBA | – To Be Announced |
| Currency Abbreviations: |
| USD | – United States Dollar |
14
See Notes to Financial Statements.
Eaton Vance
Government Opportunities Fund
October 31, 2023
Statement of Assets and Liabilities
| | October 31, 2023 |
| Assets | |
| Unaffiliated investments, at value (identified cost $591,619,484) | $ 528,996,951 |
| Affiliated investments, at value (identified cost $4,120,946) | 4,120,946 |
| Deposits for reverse repurchase agreements | 2,858,000 |
| Deposits for forward commitment securities | 549,000 |
| Deposits for derivatives collateral: | |
| Futures contracts | 3,791,975 |
| Centrally cleared swap contracts | 4,477,476 |
| OTC options and swaptions | 1,420,000 |
| Interest receivable | 2,835,423 |
| Dividends receivable from affiliated investments | 44,210 |
| Receivable for investments sold | 17,658,337 |
| Receivable for TBA sale commitments | 68,537,500 |
| Receivable for Fund shares sold | 959,618 |
| Receivable for variation margin on open centrally cleared swap contracts | 472,009 |
| Trustees' deferred compensation plan | 147,420 |
| Total assets | $ 636,868,865 |
| Liabilities | |
| Cash collateral due to brokers | $ 1,699,000 |
| Payable for reverse repurchase agreements, including accrued interest of $673,580 | 46,505,034 |
| Written swaptions outstanding, at value (premiums received $361,610) | 20,933 |
| Payable for forward commitment securities | 106,832,701 |
| TBA sale commitments, at value (proceeds receivable $68,537,500) | 68,596,521 |
| Payable for Fund shares redeemed | 1,542,697 |
| Payable for variation margin on open futures contracts | 1,409,092 |
| Distributions payable | 88,916 |
| Due to custodian | 457,792 |
| Payable to affiliates: | |
| Investment adviser fee | 229,761 |
| Distribution and service fees | 43,545 |
| Trustees' fees | 2,426 |
| Trustees' deferred compensation plan | 147,420 |
| Other | 8,492 |
| Accrued expenses | 294,507 |
| Total liabilities | $ 227,878,837 |
| Net Assets | $ 408,990,028 |
| Sources of Net Assets | |
| Paid-in capital | $ 545,679,661 |
| Accumulated loss | (136,689,633) |
| Net Assets | $ 408,990,028 |
| Class A Shares | |
| Net Assets | $ 107,555,843 |
| Shares Outstanding | 21,020,443 |
Net Asset Value and Redemption Price Per Share
(net assets ÷ shares of beneficial interest outstanding) | $ 5.12 |
Maximum Offering Price Per Share
(100 ÷ 96.75 of net asset value per share) | $ 5.29 |
| Class C Shares | |
| Net Assets | $ 5,941,563 |
| Shares Outstanding | 1,162,968 |
Net Asset Value and Offering Price Per Share*
(net assets ÷ shares of beneficial interest outstanding) | $ 5.11 |
15
See Notes to Financial Statements.
Eaton Vance
Government Opportunities Fund
October 31, 2023
Statement of Assets and Liabilities — continued
| | October 31, 2023 |
| Class I Shares | |
| Net Assets | $263,007,959 |
| Shares Outstanding | 51,414,827 |
Net Asset Value, Offering Price and Redemption Price Per Share
(net assets ÷ shares of beneficial interest outstanding) | $ 5.12 |
| Class R Shares | |
| Net Assets | $ 32,484,663 |
| Shares Outstanding | 6,372,926 |
Net Asset Value, Offering Price and Redemption Price Per Share
(net assets ÷ shares of beneficial interest outstanding) | $ 5.10 |
| On sales of $100,000 or more, the offering price of Class A shares is reduced. |
| * | Redemption price per share is equal to the net asset value less any applicable contingent deferred sales charge. |
16
See Notes to Financial Statements.
Eaton Vance
Government Opportunities Fund
October 31, 2023
| | Year Ended |
| | October 31, 2023 |
| Investment Income | |
| Dividend income from affiliated investments | $ 934,472 |
| Interest income | 22,719,922 |
| Total investment income | $ 23,654,394 |
| Expenses | |
| Investment adviser fee | $ 2,754,110 |
| Distribution and service fees: | |
| Class A | 317,408 |
| Class C | 65,181 |
| Class R | 199,504 |
| Trustees’ fees and expenses | 27,618 |
| Custodian fee | 190,909 |
| Transfer and dividend disbursing agent fees | 370,910 |
| Legal and accounting services | 93,260 |
| Printing and postage | 88,701 |
| Registration fees | 72,300 |
| Interest expense and fees | 1,481,720 |
| Miscellaneous | 24,684 |
| Total expenses | $ 5,686,305 |
| Deduct: | |
| Waiver and/or reimbursement of expenses by affiliates | $ 267,713 |
| Total expense reductions | $ 267,713 |
| Net expenses | $ 5,418,592 |
| Net investment income | $ 18,235,802 |
| Realized and Unrealized Gain (Loss) | |
| Net realized gain (loss): | |
| Investment transactions | $ (15,191,210) |
| Written options and swaptions | 1,543,183 |
| Futures contracts | (4,656,393) |
| Swap contracts | 5,963,327 |
| Net realized loss | $(12,341,093) |
| Change in unrealized appreciation (depreciation): | |
| Investments | $ (20,275,165) |
| Written options and swaptions | 577,555 |
| TBA sale commitments | (568,391) |
| Futures contracts | (451,653) |
| Swap contracts | 6,222,753 |
| Net change in unrealized appreciation (depreciation) | $(14,494,901) |
| Net realized and unrealized loss | $(26,835,994) |
| Net decrease in net assets from operations | $ (8,600,192) |
17
See Notes to Financial Statements.
Eaton Vance
Government Opportunities Fund
October 31, 2023
Statements of Changes in Net Assets
| | Year Ended October 31, |
| | 2023 | 2022 |
| Increase (Decrease) in Net Assets | | |
| From operations: | | |
| Net investment income | $ 18,235,802 | $ 8,869,977 |
| Net realized loss | (12,341,093) | (22,103,148) |
| Net change in unrealized appreciation (depreciation) | (14,494,901) | (14,726,254) |
| Net decrease in net assets from operations | $ (8,600,192) | $ (27,959,425) |
| Distributions to shareholders: | | |
| Class A | $ (6,458,487) | $ (3,116,489) |
| Class C | (285,558) | (127,983) |
| Class I | (13,382,177) | (4,531,585) |
| Class R | (1,930,264) | (889,252) |
| Total distributions to shareholders | $ (22,056,486) | $ (8,665,309) |
| Tax return of capital to shareholders: | | |
| Class A | $ (421,962) | $ (162,425) |
| Class C | (18,768) | (6,766) |
| Class I | (898,156) | (232,529) |
| Class R | (124,804) | (46,695) |
| Total tax return of capital to shareholders | $ (1,463,690) | $ (448,415) |
| Transactions in shares of beneficial interest: | | |
| Class A | $ (19,573,857) | $ (13,221,173) |
| Class C | (570,960) | (3,928,416) |
| Class I | 50,888,858 | 27,652,623 |
| Class R | (11,035,743) | (1,802,206) |
| Net increase in net assets from Fund share transactions | $ 19,708,298 | $ 8,700,828 |
| Net decrease in net assets | $ (12,412,070) | $ (28,372,321) |
| Net Assets | | |
| At beginning of year | $ 421,402,098 | $ 449,774,419 |
| At end of year | $408,990,028 | $421,402,098 |
18
See Notes to Financial Statements.
Eaton Vance
Government Opportunities Fund
October 31, 2023
| | Class A |
| | Year Ended October 31, |
| | 2023 | 2022 | 2021 | 2020 | 2019 |
| Net asset value — Beginning of year | $ 5.510 | $ 6.030 | $ 6.180 | $ 6.070 | $ 6.100 |
| Income (Loss) From Operations | | | | | |
| Net investment income(1) | $ 0.226 | $ 0.121 | $ 0.118 | $ 0.073 | $ 0.134 |
| Net realized and unrealized gain (loss) | (0.323) | (0.516) | (0.158) | 0.191 | 0.029 |
| Total income (loss) from operations | $ (0.097) | $ (0.395) | $ (0.040) | $ 0.264 | $ 0.163 |
| Less Distributions | | | | | |
| From net investment income | $ (0.276) | $ (0.119) | $ (0.110) | $ (0.154) | $ (0.193) |
| Tax return of capital | (0.017) | (0.006) | — | — | — |
| Total distributions | $ (0.293) | $ (0.125) | $ (0.110) | $ (0.154) | $ (0.193) |
| Net asset value — End of year | $ 5.120 | $ 5.510 | $ 6.030 | $ 6.180 | $ 6.070 |
| Total Return(2) | (1.89)% (3) | (6.63)% (3) | (0.66)% (3) | 4.40% (3) | 2.71% |
| Ratios/Supplemental Data | | | | | |
| Net assets, end of year (000’s omitted) | $107,556 | $136,321 | $163,208 | $158,552 | $138,956 |
| Ratios (as a percentage of average daily net assets): | | | | | |
| Expenses | 1.38% (3)(4)(5) | 1.05% (3)(4) | 1.05% (3) | 1.11% (3)(5) | 1.26% (5) |
| Net investment income | 4.18% | 2.06% | 1.91% | 1.20% | 2.21% |
| Portfolio Turnover | 604% (6) | 796% (6) | 335% (6) | 180% (6) | 90% |
| (1) | Computed using average shares outstanding. |
| (2) | Returns are historical and are calculated by determining the percentage change in net asset value with all distributions reinvested and do not reflect the effect of sales charges. |
| (3) | The investment adviser reimbursed certain operating expenses (equal to 0.05%, 0.05%, 0.02% and 0.03% of average daily net assets for the years ended October 31, 2023, 2022, 2021 and 2020, respectively). Absent this reimbursement, total return would be lower. |
| (4) | Includes a reduction by the investment adviser of a portion of its adviser fee due to the Fund’s investment in the Liquidity Fund (equal to less than 0.01% and less than 0.005% of average daily net assets for the years ended October 31, 2023 and 2022, respectively). |
| (5) | Includes interest expense, including on reverse repurchase agreements, of 0.33%, 0.03% and 0.07% of average daily net assets for the years ended October 31, 2023, 2020 and 2019, respectively. |
| (6) | Includes the effect of To-Be-Announced (TBA) transactions. |
19
See Notes to Financial Statements.
Eaton Vance
Government Opportunities Fund
October 31, 2023
Financial Highlights — continued
| | Class C |
| | Year Ended October 31, |
| | 2023 | 2022 | 2021 | 2020 | 2019 |
| Net asset value — Beginning of year | $ 5.500 | $ 6.020 | $ 6.170 | $ 6.060 | $ 6.090 |
| Income (Loss) From Operations | | | | | |
| Net investment income(1) | $ 0.185 | $ 0.073 | $ 0.072 | $ 0.030 | $ 0.090 |
| Net realized and unrealized gain (loss) | (0.323) | (0.512) | (0.158) | 0.188 | 0.027 |
| Total income (loss) from operations | $(0.138) | $(0.439) | $ (0.086) | $ 0.218 | $ 0.117 |
| Less Distributions | | | | | |
| From net investment income | $ (0.236) | $ (0.077) | $ (0.064) | $ (0.108) | $ (0.147) |
| Tax return of capital | (0.016) | (0.004) | — | — | — |
| Total distributions | $(0.252) | $(0.081) | $ (0.064) | $ (0.108) | $ (0.147) |
| Net asset value — End of year | $ 5.110 | $ 5.500 | $ 6.020 | $ 6.170 | $ 6.060 |
| Total Return(2) | (2.64)% (3) | (7.34)% (3) | (1.41)% (3) | 3.63% (3) | 1.95% |
| Ratios/Supplemental Data | | | | | |
| Net assets, end of year (000’s omitted) | $ 5,942 | $ 6,980 | $11,756 | $24,969 | $29,940 |
| Ratios (as a percentage of average daily net assets): | | | | | |
| Expenses | 2.14% (3)(4)(5) | 1.80% (3)(4) | 1.80% (3) | 1.86% (3)(5) | 1.99% (5) |
| Net investment income | 3.43% | 1.25% | 1.17% | 0.49% | 1.47% |
| Portfolio Turnover | 604% (6) | 796% (6) | 335% (6) | 180% (6) | 90% |
| (1) | Computed using average shares outstanding. |
| (2) | Returns are historical and are calculated by determining the percentage change in net asset value with all distributions reinvested and do not reflect the effect of sales charges. |
| (3) | The investment adviser reimbursed certain operating expenses (equal to 0.05%, 0.05%, 0.02% and 0.03% of average daily net assets for the years ended October 31, 2023, 2022, 2021 and 2020, respectively). Absent this reimbursement, total return would be lower. |
| (4) | Includes a reduction by the investment adviser of a portion of its adviser fee due to the Fund’s investment in the Liquidity Fund (equal to less than 0.01% and less than 0.005% of average daily net assets for the years ended October 31, 2023 and 2022, respectively). |
| (5) | Includes interest expense, including on reverse repurchase agreements, of 0.33%, 0.03% and 0.07% of average daily net assets for the years ended October 31, 2023, 2020 and 2019, respectively. |
| (6) | Includes the effect of To-Be-Announced (TBA) transactions. |
20
See Notes to Financial Statements.
Eaton Vance
Government Opportunities Fund
October 31, 2023
Financial Highlights — continued
| | Class I |
| | Year Ended October 31, |
| | 2023 | 2022 | 2021 | 2020 | 2019 |
| Net asset value — Beginning of year | $ 5.510 | $ 6.030 | $ 6.170 | $ 6.060 | $ 6.100 |
| Income (Loss) From Operations | | | | | |
| Net investment income(1) | $ 0.240 | $ 0.133 | $ 0.133 | $ 0.085 | $ 0.149 |
| Net realized and unrealized gain (loss) | (0.323) | (0.514) | (0.148) | 0.194 | 0.019 |
| Total income (loss) from operations | $ (0.083) | $ (0.381) | $ (0.015) | $ 0.279 | $ 0.168 |
| Less Distributions | | | | | |
| From net investment income | $ (0.288) | $ (0.132) | $ (0.125) | $ (0.169) | $ (0.208) |
| Tax return of capital | (0.019) | (0.007) | — | — | — |
| Total distributions | $ (0.307) | $ (0.139) | $ (0.125) | $ (0.169) | $ (0.208) |
| Net asset value — End of year | $ 5.120 | $ 5.510 | $ 6.030 | $ 6.170 | $ 6.060 |
| Total Return(2) | (1.63)% (3) | (6.40)% (3) | (0.25)% (3) | 4.66% (3) | 2.80% |
| Ratios/Supplemental Data | | | | | |
| Net assets, end of year (000’s omitted) | $263,008 | $231,855 | $222,307 | $213,869 | $118,479 |
| Ratios (as a percentage of average daily net assets): | | | | | |
| Expenses | 1.15% (3)(4)(5) | 0.80% (3)(4) | 0.80% (3) | 0.85% (3)(5) | 1.01% (5) |
| Net investment income | 4.45% | 2.28% | 2.17% | 1.39% | 2.44% |
| Portfolio Turnover | 604% (6) | 796% (6) | 335% (6) | 180% (6) | 90% |
| (1) | Computed using average shares outstanding. |
| (2) | Returns are historical and are calculated by determining the percentage change in net asset value with all distributions reinvested. |
| (3) | The investment adviser reimbursed certain operating expenses (equal to 0.05%, 0.05%, 0.02% and 0.03% of average daily net assets for the years ended October 31, 2023, 2022, 2021 and 2020, respectively). Absent this reimbursement, total return would be lower. |
| (4) | Includes a reduction by the investment adviser of a portion of its adviser fee due to the Fund’s investment in the Liquidity Fund (equal to less than 0.01% and less than 0.005% of average daily net assets for the years ended October 31, 2023 and 2022, respectively). |
| (5) | Includes interest expense, including on reverse repurchase agreements, of 0.33%, 0.03% and 0.07% of average daily net assets for the years ended October 31, 2023, 2020 and 2019, respectively. |
| (6) | Includes the effect of To-Be-Announced (TBA) transactions. |
21
See Notes to Financial Statements.
Eaton Vance
Government Opportunities Fund
October 31, 2023
Financial Highlights — continued
| | Class R |
| | Year Ended October 31, |
| | 2023 | 2022 | 2021 | 2020 | 2019 |
| Net asset value — Beginning of year | $ 5.490 | $ 6.010 | $ 6.150 | $ 6.040 | $ 6.080 |
| Income (Loss) From Operations | | | | | |
| Net investment income(1) | $ 0.211 | $ 0.107 | $ 0.102 | $ 0.052 | $ 0.118 |
| Net realized and unrealized gain (loss) | (0.323) | (0.517) | (0.148) | 0.196 | 0.019 |
| Total income (loss) from operations | $ (0.112) | $ (0.410) | $ (0.046) | $ 0.248 | $ 0.137 |
| Less Distributions | | | | | |
| From net investment income | $ (0.261) | $ (0.105) | $ (0.094) | $ (0.138) | $ (0.177) |
| Tax return of capital | (0.017) | (0.005) | — | — | — |
| Total distributions | $ (0.278) | $ (0.110) | $ (0.094) | $ (0.138) | $ (0.177) |
| Net asset value — End of year | $ 5.100 | $ 5.490 | $ 6.010 | $ 6.150 | $ 6.040 |
| Total Return(2) | (2.17)% (3) | (6.90)% (3) | (0.75)% (3) | 4.15% (3) | 2.46% |
| Ratios/Supplemental Data | | | | | |
| Net assets, end of year (000’s omitted) | $32,485 | $46,245 | $52,503 | $55,623 | $28,673 |
| Ratios (as a percentage of average daily net assets): | | | | | |
| Expenses | 1.63% (3)(4)(5) | 1.30% (3)(4) | 1.30% (3) | 1.34% (3)(5) | 1.51% (5) |
| Net investment income | 3.91% | 1.83% | 1.66% | 0.85% | 1.95% |
| Portfolio Turnover | 604% (6) | 796% (6) | 335% (6) | 180% (6) | 90% |
| (1) | Computed using average shares outstanding. |
| (2) | Returns are historical and are calculated by determining the percentage change in net asset value with all distributions reinvested. |
| (3) | The investment adviser reimbursed certain operating expenses (equal to 0.05%, 0.05%, 0.02% and 0.03% of average daily net assets for the years ended October 31, 2023, 2022, 2021 and 2020, respectively). Absent this reimbursement, total return would be lower. |
| (4) | Includes a reduction by the investment adviser of a portion of its adviser fee due to the Fund’s investment in the Liquidity Fund (equal to less than 0.01% and less than 0.005% of average daily net assets for the years ended October 31, 2023 and 2022, respectively). |
| (5) | Includes interest expense, including on reverse repurchase agreements, of 0.33%, 0.03% and 0.07% of average daily net assets for the years ended October 31, 2023, 2020 and 2019, respectively. |
| (6) | Includes the effect of To-Be-Announced (TBA) transactions. |
22
See Notes to Financial Statements.
Eaton Vance
Government Opportunities Fund
October 31, 2023
Notes to Financial Statements
1 Significant Accounting Policies
Eaton Vance Government Opportunities Fund (the Fund) is a diversified series of Eaton Vance Mutual Funds Trust (the Trust). The Trust is a Massachusetts business trust registered under the Investment Company Act of 1940, as amended (the 1940 Act), as an open-end management investment company. The Fund’s investment objective is to provide a high current return. The Fund offers four classes of shares. Class A shares are generally sold subject to a sales charge imposed at time of purchase. Class C shares are sold at net asset value and are generally subject to a contingent deferred sales charge (see Note 5). Effective November 5, 2020, Class C shares automatically convert to Class A shares eight years after their purchase as described in the Fund’s prospectus. Class I and Class R shares are sold at net asset value and are not subject to a sales charge. Each class represents a pro rata interest in the Fund, but votes separately on class-specific matters and (as noted below) is subject to different expenses. Realized and unrealized gains and losses are allocated daily to each class of shares based on the relative net assets of each class to the total net assets of the Fund. Net investment income, other than class-specific expenses, is allocated daily to each class of shares based upon the ratio of the value of each class’s paid shares to the total value of all paid shares. Each class of shares differs in its distribution plan and certain other class-specific expenses.
The following is a summary of significant accounting policies of the Fund. The policies are in conformity with accounting principles generally accepted in the United States of America (U.S. GAAP). The Fund is an investment company and follows accounting and reporting guidance in the Financial Accounting Standards Board (FASB) Accounting Standards Codification Topic 946.
A Investment Valuation—The following methodologies are used to determine the market value or fair value of investments.
Debt Obligations. Debt obligations are generally valued on the basis of valuations provided by third party pricing services, as derived from such services’ pricing models. Inputs to the models may include, but are not limited to, reported trades, executable bid and ask prices, broker/dealer quotations, prices or yields of securities with similar characteristics, interest rates, anticipated prepayments, benchmark curves or information pertaining to the issuer, as well as industry and economic events. The pricing services may use a matrix approach, which considers information regarding securities with similar characteristics to determine the valuation for a security. Short-term debt obligations purchased with a remaining maturity of sixty days or less for which a valuation from a third party pricing service is not readily available may be valued at amortized cost, which approximates fair value.
Derivatives. U.S. exchange-traded options are valued at the mean between the bid and ask prices at valuation time as reported by the Options Price Reporting Authority. Non-U.S. exchange-traded options and over-the-counter options are valued by a third party pricing service using techniques that consider factors including the value of the underlying instrument, the volatility of the underlying instrument and the period of time until option expiration. Futures contracts are valued at the closing settlement price established by the board of trade or exchange on which they are traded. Swaps and options on interest rate swaps (“swaptions”) are normally valued using valuations provided by a third party pricing service. Such pricing service valuations are based on the present value of fixed and projected floating rate cash flows over the term of the swap contract, and in the case of credit default swaps, based on credit spread quotations obtained from broker/dealers and expected default recovery rates determined by the pricing service using proprietary models. Future cash flows on swaps are discounted to their present value using swap rates provided by electronic data services or by broker/dealers. Alternatively, swaptions may be valued at the valuation provided by a broker/dealer (usually the counterparty to the option), so determined using similar techniques as those employed by the pricing service.
Other. Investments in management investment companies (including money market funds) that do not trade on an exchange are valued at the net asset value as of the close of each business day.
Fair Valuation. In connection with Rule 2a-5 of the 1940 Act, the Trustees have designated the Fund’s investment adviser as its valuation designee. Investments for which valuations or market quotations are not readily available or are deemed unreliable are valued by the investment adviser, as valuation designee, at fair value using methods that most fairly reflect the security’s “fair value”, which is the amount that the Fund might reasonably expect to receive for the security upon its current sale in the ordinary course. Each such determination is based on a consideration of relevant factors, which are likely to vary from one pricing context to another. These factors may include, but are not limited to, the type of security, the existence of any contractual restrictions on the security’s disposition, the price and extent of public trading in similar securities of the issuer or of comparable companies or entities, quotations or relevant information obtained from broker/dealers or other market participants, information obtained from the issuer, analysts, and/or the appropriate stock exchange (for exchange-traded securities), an analysis of the company’s or entity’s financial statements, and an evaluation of the forces that influence the issuer and the market(s) in which the security is purchased and sold.
B Investment Transactions—Investment transactions for financial statement purposes are accounted for on a trade date basis. Realized gains and losses on investments sold are determined on the basis of identified cost.
C Income—Interest income is recorded on the basis of interest accrued, adjusted for amortization of premium or accretion of discount. Dividend income is recorded on the ex-dividend date for dividends received in cash and/or securities.
D Federal Taxes—The Fund's policy is to comply with the provisions of the Internal Revenue Code applicable to regulated investment companies and to distribute to shareholders each year substantially all of its net investment income, and all or substantially all of its net realized capital gains. Accordingly, no provision for federal income or excise tax is necessary.
Eaton Vance
Government Opportunities Fund
October 31, 2023
Notes to Financial Statements — continued
As of October 31, 2023, the Fund had no uncertain tax positions that would require financial statement recognition, de-recognition, or disclosure. The Fund files a U.S. federal income tax return annually after its fiscal year-end, which is subject to examination by the Internal Revenue Service for a period of three years from the date of filing.
E Expenses—The majority of expenses of the Trust are directly identifiable to an individual fund. Expenses which are not readily identifiable to a specific fund are allocated taking into consideration, among other things, the nature and type of expense and the relative size of the funds.
F Use of Estimates—The preparation of the financial statements in conformity with U.S. GAAP requires management to make estimates and assumptions that affect the reported amounts of assets and liabilities at the date of the financial statements and the reported amounts of income and expense during the reporting period. Actual results could differ from those estimates.
G Indemnifications—Under the Trust’s organizational documents, its officers and Trustees may be indemnified against certain liabilities and expenses arising out of the performance of their duties to the Fund. Under Massachusetts law, if certain conditions prevail, shareholders of a Massachusetts business trust (such as the Trust) could be deemed to have personal liability for the obligations of the Trust. However, the Trust’s Declaration of Trust contains an express disclaimer of liability on the part of Fund shareholders and the By-laws provide that the Trust shall assume, upon request by the shareholder, the defense on behalf of any Fund shareholders. Moreover, the By-laws also provide for indemnification out of Fund property of any shareholder held personally liable solely by reason of being or having been a shareholder for all loss or expense arising from such liability. Additionally, in the normal course of business, the Fund enters into agreements with service providers that may contain indemnification clauses. The Fund’s maximum exposure under these arrangements is unknown as this would involve future claims that may be made against the Fund that have not yet occurred.
H Futures Contracts—Upon entering into a futures contract, the Fund is required to deposit with the broker, either in cash or securities, an amount equal to a certain percentage of the contract amount (initial margin). Subsequent payments, known as variation margin, are made or received by the Fund each business day, depending on the daily fluctuations in the value of the underlying security, and are recorded as unrealized gains or losses by the Fund. Gains (losses) are realized upon the expiration or closing of the futures contracts. Should market conditions change unexpectedly, the Fund may not achieve the anticipated benefits of the futures contracts and may realize a loss. Futures contracts have minimal counterparty risk as they are exchange traded and the clearinghouse for the exchange is substituted as the counterparty, guaranteeing counterparty performance.
I Interest Rate Swaps—Swap contracts are privately negotiated agreements between the Fund and a counterparty. Certain swap contracts may be centrally cleared (“centrally cleared swaps”), whereby all payments made or received by the Fund pursuant to the contract are with a central clearing party (CCP) rather than the original counterparty. The CCP guarantees the performance of the original parties to the contract. Upon entering into centrally cleared swaps, the Fund is required to deposit with the CCP, either in cash or securities, an amount of initial margin determined by the CCP, which is subject to adjustment. Pursuant to interest rate swap agreements, the Fund either makes floating-rate payments to the counterparty (or CCP in the case of centrally cleared swaps) based on a benchmark interest rate in exchange for fixed-rate payments or the Fund makes fixed-rate payments to the counterparty
(or CCP in the case of a centrally cleared swap) in exchange for payments on a floating benchmark interest rate. Payments received or made, including amortization of upfront payments/receipts, if any (which are amortized over the life of the swap contract), are recorded as realized gains or losses. During the term of the outstanding swap agreement, changes in the underlying value of the swap are recorded as unrealized gains or losses. For centrally cleared swaps, the daily change in valuation is recorded as a receivable or payable for variation margin and settled in cash with the CCP daily. The value of the swap is determined by changes in the relationship between two rates of interest. The Fund is exposed to credit loss in the event of non-performance by the swap counterparty. In the case of centrally cleared swaps, counterparty risk is minimal due to protections provided by the CCP. Risk may also arise from movements in interest rates.
J Credit Default Swaps—When the Fund is the buyer of a credit default swap contract, the Fund is entitled to receive the par (or other agreed-upon) value of a referenced debt obligation (or basket of debt obligations) from the counterparty (or CCP in the case of a centrally cleared swap) to the contract if a credit event by a third party, such as a U.S. or foreign corporate issuer or sovereign issuer, on the debt obligation occurs. In return, the Fund pays the counterparty a periodic stream of payments over the term of the contract provided that no credit event has occurred. If no credit event occurs, the Fund would have spent the stream of payments and received no proceeds from the contract. When the Fund is the seller of a credit default swap contract, it receives the stream of payments, but is obligated to pay to the buyer of the protection an amount up to the notional amount of the swap and in certain instances take delivery of securities of the reference entity upon the occurrence of a credit event, as defined under the terms of that particular swap agreement. Credit events are contract specific but may include bankruptcy, failure to pay, restructuring, obligation acceleration and repudiation/moratorium. If the Fund is a seller of protection and a credit event occurs, the maximum potential amount of future payments that the Fund could be required to make would be an amount equal to the notional amount of the agreement. This potential amount would be partially offset by any recovery value of the respective referenced obligation, or net amount received from the settlement of a buy protection credit default swap agreement entered into by the Fund for the same referenced obligation. As the seller, the Fund may create economic leverage to its portfolio because, in addition to its total net assets, the Fund is subject to investment exposure on the notional amount of the swap. The interest fee paid or received on the swap contract, which is based on a specified interest rate on a fixed notional amount, is accrued daily as a component of unrealized appreciation (depreciation) and is recorded as realized gain upon receipt or realized loss upon payment. The Fund also records an increase or decrease to unrealized appreciation (depreciation) in an amount equal to the daily valuation. For centrally cleared swaps, the daily change in valuation is recorded as a receivable or payable for variation margin and settled in cash with the CCP daily. All upfront payments and receipts, if any, are amortized over the life of the swap contract as realized gains or losses. Those upfront payments or receipts for non-centrally cleared swaps are recorded as other assets or other liabilities, respectively, net of amortization. For financial reporting
Eaton Vance
Government Opportunities Fund
October 31, 2023
Notes to Financial Statements — continued
purposes, unamortized upfront payments or receipts, if any, are netted with unrealized appreciation or depreciation on swap contracts to determine the market value of swaps as presented in Notes 8 and 12. These transactions involve certain risks, including the risk that the seller may be unable to fulfill the transaction. In the case of centrally cleared swaps, counterparty risk is minimal due to protections provided by the CCP.
K Written Options—Upon the writing of a call or a put option, the premium received by the Fund is included in the Statement of Assets and Liabilities as a liability. The amount of the liability is subsequently marked-to-market to reflect the current market value of the option written, in accordance with the Fund’s policies on investment valuations discussed above. Premiums received from writing options which expire are treated as realized gains. Premiums received from writing options which are exercised or are closed are added to or offset against the proceeds or amount paid on the transaction to determine the realized gain or loss. When an index option is exercised, the Fund is required to deliver an amount of cash determined by the excess of the exercise price of the option over the value of the index (in the case of a put) or the excess of the value of the index over the exercise price of the option (in the case of a call) at contract termination. If a put option on a security is exercised, the premium reduces the cost basis of the securities purchased by the Fund. The Fund, as a writer of an option, may have no control over whether the underlying securities or other assets may be sold (call) or purchased (put) and, as a result, bears the market risk of an unfavorable change in the price of the securities or other assets underlying the written option. The Fund may also bear the risk of not being able to enter into a closing transaction if a liquid secondary market does not exist.
L Purchased Options—Upon the purchase of a call or put option, the premium paid by the Fund is included in the Statement of Assets and Liabilities as an investment. The amount of the investment is subsequently marked-to-market to reflect the current market value of the option purchased, in accordance with the Fund’s policies on investment valuations discussed above. Premiums paid for purchasing options that expire are treated as realized losses. Premiums paid for purchasing options that are exercised or closed are added to the amounts paid or offset against the proceeds on the underlying investment transaction to determine the realized gain or loss. The risk associated with purchasing options is limited to the premium originally paid. Purchased options traded over-the-counter involve risk that the issuer or counterparty will fail to perform its contractual obligations.
M Swaptions—A purchased swaption contract grants the Fund, in return for payment of the purchase price, the right, but not the obligation, to enter into a new swap agreement or to shorten, extend, cancel or otherwise modify an existing swap agreement, at some designated future time on specified terms. When the Fund purchases a swaption, the premium paid to the writer is recorded as an investment and subsequently marked-to-market to reflect the current value of the swaption. A written swaption gives the Fund the obligation, if exercised by the purchaser, to enter into a swap contract according to the terms of the underlying agreement. When the Fund writes a swaption, the premium received by the Fund is recorded as a liability and subsequently marked-to-market to reflect the current value of the swaption. When a swaption is exercised, the cost of the swap is adjusted by the amount of the premium paid or received. When a swaption expires or an unexercised swaption is closed, a gain or loss is recognized in the amount of the premium paid or received, plus the cost to close. The Fund’s risk for purchased swaptions is limited to the premium paid. The writer of a swaption bears the risk of unfavorable changes in the preset terms of the underlying swap contract. Purchased swaptions traded over-the-counter involve risk that the issuer or counterparty will fail to perform its contractual obligations.
N When-Issued Securities and Delayed Delivery Transactions—The Fund may purchase securities on a delayed delivery, when-issued or forward commitment basis, including TBA (To Be Announced) securities. Payment and delivery may take place after the customary settlement period for that security. At the time the transaction is negotiated, the price of the security that will be delivered is fixed. Securities purchased on a delayed delivery, when-issued or forward commitment basis are marked-to-market daily and begin earning interest on settlement date. Such security purchases are subject to the risk that when delivered they will be worth less than the agreed upon payment price. Losses may also arise if the counterparty does not perform under the contract. A forward purchase commitment may also be closed by entering into an offsetting commitment. If an offsetting commitment is entered into, the Fund will realize a gain or loss on investments based on the price established when the Fund entered into the commitment.
O Forward Sale Commitments—The Fund may enter into forward sale commitments to sell generic U.S. government agency mortgage-backed securities to hedge its portfolio positions and/or to enhance return. The proceeds to be received from the forward sale commitment are recorded as an asset and a corresponding liability, which is subsequently valued at approximately the current market value of the underlying security in accordance with the Fund's policies on investment valuations discussed above. The Fund records an unrealized gain or loss on investments to the extent of the difference between the proceeds to be received and the value of the open forward sale commitment on the day of determination. If the forward sale commitment is closed through the acquisition of an offsetting purchase commitment or the delivery of securities, the Fund realizes a gain or loss on investments based on the price established when the Fund entered into the commitment. If the Fund enters into a forward sale commitment for the delivery of a security that it does not own or has the right to obtain, it is subject to the risk of loss if the purchase price to settle the commitment is higher than the price at which it was sold.
P Reverse Repurchase Agreements—Under a reverse repurchase agreement, the Fund temporarily transfers possession of a portfolio security to another party, such as a bank or broker/dealer, in return for cash. At the same time, the Fund agrees to repurchase the security at an agreed upon time and price, which reflects an interest payment. In periods of increased demand for a security, the Fund may receive a payment from the counterparty for the use of the security, which is recorded as interest income. Because the Fund retains effective control over the transferred security, the transaction is accounted for as a secured borrowing. The Fund may enter into such agreements when it believes it is able to invest the cash acquired at a rate higher than the cost of the agreement, which would increase earned income. When the Fund enters into a reverse repurchase agreement, any fluctuations in the market value of either the securities transferred to another party or the securities in which the proceeds may be invested would affect the market value of the Fund’s assets. Because reverse repurchase agreements may be considered to be the practical equivalent of borrowing funds (and the counterparty making a loan), they constitute a form of leverage. The Fund segregates cash or liquid assets equal to its obligation to repurchase the security. During the term of the agreement,
Eaton Vance
Government Opportunities Fund
October 31, 2023
Notes to Financial Statements — continued
the Fund may also be obligated to pledge additional cash and/or securities in the event of a decline in the fair value of the transferred security. In the event the counterparty to a reverse repurchase agreement becomes insolvent, recovery of the security transferred by the Fund may be delayed or the Fund may incur a loss equal to the amount by which the value of the security transferred by the Fund exceeds the repurchase price payable by the Fund.
Q Stripped Mortgage-Backed Securities—The Fund may invest in Interest Only (IO) and Principal Only (PO) securities, a form of stripped mortgage-
backed securities, whereby the IO security receives all the interest and the PO security receives all the principal on a pool of mortgage assets. The yield to maturity on an IO security is extremely sensitive to the rate of principal payments (including prepayments) on the related underlying mortgage assets, and a rapid rate of principal payments may have a material adverse effect on the yield to maturity from these securities. If the underlying mortgages experience greater than anticipated prepayments of principal, the Fund may fail to recoup its initial investment in an IO security. The market value of IO and PO securities can be unusually volatile due to changes in interest rates.
2 Distributions to Shareholders and Income Tax Information
The Fund declares dividends daily to shareholders of record at the time of declaration. Distributions are generally paid monthly. Distributions of realized capital gains are made at least annually. Distributions are declared separately for each class of shares. Shareholders may reinvest income and capital gain distributions in additional shares of the same class of the Fund at the net asset value as of the reinvestment date or, at the election of the shareholder, receive distributions in cash. Distributions to shareholders are determined in accordance with income tax regulations, which may differ from U.S. GAAP. As required by U.S. GAAP, only distributions in excess of tax basis earnings and profits are reported in the financial statements as a return of capital. Permanent differences between book and tax accounting relating to distributions are reclassified to paid-in capital. For tax purposes, distributions from short-term capital gains are considered to be from ordinary income.
The tax character of distributions declared for the years ended October 31, 2023 and October 31, 2022 was as follows:
| | Year Ended October 31, |
| | 2023 | 2022 |
| Ordinary income | $22,056,486 | $8,665,309 |
| Tax return of capital | $ 1,463,690 | $ 448,415 |
As of October 31, 2023, the components of distributable earnings (accumulated loss) on a tax basis were as follows:
| Deferred capital losses | $ (93,280,751) |
| Net unrealized depreciation | (43,319,966) |
| Distributions payable | (88,916) |
| Accumulated loss | $(136,689,633) |
At October 31, 2023, the Fund, for federal income tax purposes, had deferred capital losses of $93,280,751 which would reduce its taxable income arising from future net realized gains on investment transactions, if any, to the extent permitted by the Internal Revenue Code, and thus would reduce the amount of distributions to shareholders, which would otherwise be necessary to relieve the Fund of any liability for federal income or excise tax. The deferred capital losses are treated as arising on the first day of the Fund’s next taxable year and retain the same short-term or long-term character as when originally deferred. Of the deferred capital losses at October 31, 2023, $26,576,054 are short-term and $66,704,697 are long-term.
The cost and unrealized appreciation (depreciation) of investments, including open derivative contracts and TBA sale commitments, of the Fund at October 31, 2023, as determined on a federal income tax basis, were as follows:
| Aggregate cost | $ 481,341,510 |
| Gross unrealized appreciation | $ 27,467,158 |
| Gross unrealized depreciation | (70,787,124) |
| Net unrealized depreciation | $ (43,319,966) |
Eaton Vance
Government Opportunities Fund
October 31, 2023
Notes to Financial Statements — continued
3 Investment Adviser Fee and Other Transactions with Affiliates
The investment adviser fee is earned by Boston Management and Research (BMR), an indirect, wholly-owned subsidiary of Morgan Stanley, as compensation for investment advisory services rendered to the Fund. The investment adviser fee is computed at an annual rate as a percentage of the Fund’s average daily net assets as follows and is payable monthly:
| Average Daily Net Assets | Annual Fee Rate |
| Up to $500 million | 0.6500% |
| $500 million but less than $1 billion | 0.6250% |
| $1 billion but less than $1.5 billion | 0.6000% |
| $1.5 billion but less than $2 billion | 0.5625% |
| $2 billion but less than $2.5 billion | 0.5000% |
| $2.5 billion and over | 0.4375% |
For the year ended October 31, 2023, the Fund’s investment adviser fee amounted to $2,754,110 or 0.65% of the Fund’s average daily net assets. The Fund may invest in a money market fund, the Institutional Class of the Morgan Stanley Institutional Liquidity Funds - Government Portfolio (the Liquidity Fund), an open-end management investment company managed by Morgan Stanley Investment Management Inc., a wholly-owned subsidiary of Morgan Stanley. The investment adviser fee paid by the Fund is reduced by an amount equal to its pro rata share of the advisory and administration fees paid by the Fund due to its investment in the Liquidity Fund. For the year ended October 31, 2023, the investment adviser fee paid was reduced by $34,895 relating to the Fund’s investment in the Liquidity Fund.
Eaton Vance Management (EVM) has agreed to reimburse the Fund’s expenses to the extent that total annual operating expenses (relating to ordinary operating expenses only and excluding such expenses as brokerage commissions, acquired fund fees and expenses of unaffiliated funds, borrowing costs, taxes or litigation expenses) exceed 1.05%, 1.80%, 0.80% and 1.30% of the Fund’s average daily net assets for Class A, Class C, Class I and Class R, respectively. This agreement may be changed or terminated after February 29, 2024. Pursuant to this agreement, EVM was allocated $232,818 of the Fund’s operating expenses for the year ended October 31, 2023.
EVM, an affiliate of BMR, serves as administrator of the Fund, but receives no compensation. EVM provides sub-transfer agency and related services to the Fund pursuant to a Sub-Transfer Agency Support Services Agreement. For the year ended October 31, 2023, EVM earned $51,269 from the Fund pursuant to such agreement, which is included in transfer and dividend disbursing agent fees on the Statement of Operations. The Fund was informed that Eaton Vance Distributors, Inc. (EVD), an affiliate of EVM and the Fund’s principal underwriter, received $7,463 as its portion of the sales charge on sales of Class A shares for the year ended October 31, 2023. EVD also received distribution and service fees from Class A and Class C shares (see Note 4) and contingent deferred sales charges (see Note 5). The Fund was informed that Morgan Stanley affiliated broker-dealers, which may be deemed to be affiliates of EVM, BMR and EVD, also received a portion of the sales charge on sales of Class A shares for the year ended October 31, 2023 in the amount of $12,360.
Trustees and officers of the Fund who are members of EVM’s or BMR's organizations receive remuneration for their services to the Fund out of the investment adviser fee. Trustees of the Fund who are not affiliated with the investment adviser may elect to defer receipt of all or a percentage of their annual fees in accordance with the terms of the Trustees Deferred Compensation Plan. Certain officers and Trustees of the Fund are officers of the above organizations.
4 Distribution Plans
The Fund has in effect a distribution plan for Class A shares (Class A Plan) pursuant to Rule 12b-1 under the 1940 Act. Pursuant to the Class A Plan, the Fund pays EVD a distribution and service fee of 0.25% per annum of its average daily net assets attributable to Class A shares for distribution services and facilities provided to the Fund by EVD, as well as for personal services and/or the maintenance of shareholder accounts. Distribution and service fees paid or accrued to EVD for the year ended October 31, 2023 amounted to $317,408 for Class A shares.
The Fund also has in effect distribution plans for Class C shares (Class C Plan) and Class R shares (Class R Plan) pursuant to Rule 12b-1 under the 1940 Act. Pursuant to the Class C Plan, the Fund pays EVD amounts equal to 0.75% per annum of its average daily net assets attributable to Class C shares for providing ongoing distribution services and facilities to the Fund. For the year ended October 31, 2023, the Fund paid or accrued to EVD $48,886 for Class C shares. The Class R Plan requires the Fund to pay EVD an amount up to 0.50% per annum of its average daily net assets attributable to Class R shares for providing ongoing distribution services and facilities to the Fund. The Trustees of the Trust have currently limited Class R distribution payments to 0.25% per annum of the average daily net assets attributable to Class R shares. For the year ended October 31, 2023, the Fund paid or accrued to EVD $99,752 for Class R shares.
Eaton Vance
Government Opportunities Fund
October 31, 2023
Notes to Financial Statements — continued
Pursuant to the Class C and Class R Plans, the Fund also makes payments of service fees to EVD, financial intermediaries and other persons in amounts equal to 0.25% per annum of its average daily net assets attributable to that class. Service fees paid or accrued are for personal services and/or the maintenance of shareholder accounts. They are separate and distinct from the sales commissions and distribution fees payable to EVD. Service fees paid or accrued for the year ended October 31, 2023 amounted to $16,295 and $99,752 for Class C and Class R shares, respectively.
Distribution and service fees are subject to the limitations contained in the Financial Industry Regulatory Authority Rule 2341(d).
5 Contingent Deferred Sales Charges
A contingent deferred sales charge (CDSC) of 1% generally is imposed on redemptions of Class C shares made within 12 months of purchase. Class A shares may be subject to a 0.75% CDSC if redeemed within 12 months of purchase (depending on the circumstances of purchase). Generally, the CDSC is based upon the lower of the net asset value at date of redemption or date of purchase. No charge is levied on shares acquired by reinvestment of dividends or capital gain distributions. For the year ended October 31, 2023, the Fund was informed that EVD received $795 of CDSCs paid by Class C shareholders and no CDSCs paid by Class A shareholders.
6 Purchases and Sales of Investments
Purchases and sales of investments, other than short-term obligations, and including maturities, paydowns and TBA transactions, for the year ended October 31, 2023 were as follows:
| | Purchases | Sales |
| Investments (non-U.S. Government) | $ 58,131,840 | $ 20,235,395 |
| U.S. Government and Agency Securities | 3,164,847,061 | 3,031,931,114 |
| | $3,222,978,901 | $3,052,166,509 |
7 Shares of Beneficial Interest
The Fund’s Declaration of Trust permits the Trustees to issue an unlimited number of full and fractional shares of beneficial interest (without par value). Such shares may be issued in a number of different series (such as the Fund) and classes. Transactions in Fund shares, including direct exchanges pursuant to share class conversions, were as follows:
| | Year Ended
October 31, 2023 | | Year Ended
October 31, 2022 |
| | Shares | Amount | | Shares | Amount |
| Class A | | | | | |
| Sales | 2,707,482 | $ 14,657,019 | | 7,105,348 | $ 42,429,186 |
| Issued to shareholders electing to receive payments of distributions in Fund shares | 1,176,684 | 6,325,743 | | 521,328 | 3,018,284 |
| Redemptions | (7,595,272) | (40,556,619) | | (9,947,575) | (58,668,643) |
| Net decrease | (3,711,106) | $ (19,573,857) | | (2,320,899) | $ (13,221,173) |
| Class C | | | | | |
| Sales | 469,207 | $ 2,541,072 | | 523,893 | $ 3,108,916 |
| Issued to shareholders electing to receive payments of distributions in Fund shares | 55,781 | 299,324 | | 22,768 | 131,577 |
| Redemptions | (630,489) | (3,411,356) | | (1,229,831) | (7,168,909) |
| Net decrease | (105,501) | $ (570,960) | | (683,170) | $ (3,928,416) |
Eaton Vance
Government Opportunities Fund
October 31, 2023
Notes to Financial Statements — continued
| | Year Ended
October 31, 2023 | | Year Ended
October 31, 2022 |
| | Shares | Amount | | Shares | Amount |
| Class I | | | | | |
| Sales | 23,828,866 | $ 129,362,534 | | 43,065,146 | $ 248,866,727 |
| Issued to shareholders electing to receive payments of distributions in Fund shares | 2,555,562 | 13,701,978 | | 750,078 | 4,345,848 |
| Redemptions | (17,043,620) | (92,175,654) | | (38,614,717) | (225,559,952) |
| Net increase | 9,340,808 | $ 50,888,858 | | 5,200,507 | $ 27,652,623 |
| Class R | | | | | |
| Sales | 1,495,399 | $ 8,011,009 | | 6,749,117 | $ 39,539,347 |
| Issued to shareholders electing to receive payments of distributions in Fund shares | 382,788 | 2,052,268 | | 162,498 | 935,762 |
| Redemptions | (3,928,294) | (21,099,020) | | (7,224,766) | (42,277,315) |
| Net decrease | (2,050,107) | $ (11,035,743) | | (313,151) | $ (1,802,206) |
8 Financial Instruments
The Fund may trade in financial instruments with off-balance sheet risk in the normal course of its investing activities. These financial instruments may include futures contracts, written swaptions and swap contracts and may involve, to a varying degree, elements of risk in excess of the amounts recognized for financial statement purposes. The notional or contractual amounts of these instruments represent the investment the Fund has in particular classes of financial instruments and do not necessarily represent the amounts potentially subject to risk. The measurement of the risks associated with these instruments is meaningful only when all related and offsetting transactions are considered. A summary of obligations under these financial instruments at October 31, 2023 is included in the Portfolio of Investments. At October 31, 2023, the Fund had sufficient cash and/or securities to cover commitments under these contracts.
In the normal course of pursuing its investment objective, the Fund is subject to the following risks:
Interest Rate Risk: Because the Fund holds fixed-rate bonds, the value of these bonds may decrease if interest rates rise. The Fund utilizes futures contracts and interest rate swaps and swaptions to enhance total return, to change the overall duration of the Fund and/or to hedge against fluctuations in securities prices due to changes in interest rates.
Credit Risk: The Fund enters into credit default swap contracts to manage certain investment risks and/or to enhance total return.
The Fund enters into over-the-counter (OTC) derivatives that may contain provisions whereby the counterparty may terminate the contract under certain conditions, including but not limited to a decline in the Fund’s net assets below a certain level over a certain period of time, which would trigger a payment by the Fund for those derivatives in a liability position. At October 31, 2023, the Fund had no open derivatives with credit-related contingent features in a net liability position.
The OTC derivatives in which the Fund invests (except for written options and swaptions as the Fund, not the counterparty, is obligated to perform) are subject to the risk that the counterparty to the contract fails to perform its obligations under the contract. To mitigate this risk, the Fund has entered into an International Swaps and Derivatives Association, Inc. Master Agreement (“ISDA Master Agreement”) or similar agreement with substantially all its derivative counterparties. An ISDA Master Agreement is a bilateral agreement between the Fund and a counterparty that governs certain OTC derivatives and typically contains, among other things, set-off provisions in the event of a default and/or termination event as defined under the relevant ISDA Master Agreement. Under an ISDA Master Agreement, the Fund may, under certain circumstances, offset with the counterparty certain derivative financial instruments’ payables and/or receivables with collateral held and/or posted and create one single net payment. The provisions of the ISDA Master Agreement typically permit a single net payment in the event of default including the bankruptcy or insolvency of the counterparty. However, bankruptcy or insolvency laws of a particular jurisdiction may impose restrictions on or prohibitions against the right of offset in bankruptcy or insolvency. Certain ISDA Master Agreements allow counterparties to OTC derivatives to terminate derivative contracts prior to maturity in the event the Fund’s net assets decline by a stated percentage or the Fund fails to meet the terms of its ISDA Master Agreements, which would cause the counterparty to accelerate payment by the Fund of any net liability owed to it.
The collateral requirements for derivatives traded under an ISDA Master Agreement are governed by a Credit Support Annex to the ISDA Master Agreement. Collateral requirements are determined at the close of business each day and are typically based on changes in market values for each transaction under an ISDA Master Agreement and netted into one amount for such agreement. Generally, the amount of collateral due from or to a counterparty is subject to a
Eaton Vance
Government Opportunities Fund
October 31, 2023
Notes to Financial Statements — continued
minimum transfer threshold amount before a transfer is required, which may vary by counterparty. Collateral pledged for the benefit of the Fund and/or counterparty is held in segregated accounts by the Fund’s custodian and cannot be sold, re-pledged, assigned or otherwise used while pledged. The portion of such collateral representing cash, if any, is reflected as deposits for derivatives collateral and, in the case of cash pledged by a counterparty for the benefit of the Fund, a corresponding liability on the Statement of Assets and Liabilities. Securities pledged by the Fund as collateral, if any, are identified as such in the Portfolio of Investments. The carrying amount of the liability for cash collateral due to brokers at October 31, 2023 approximated its fair value. If measured at fair value, such liability would have been considered as Level 2 in the fair value hierarchy (see Note 12) at October 31, 2023.
The fair value of open derivative instruments (not considered to be hedging instruments for accounting disclosure purposes) and whose primary underlying risk exposure is interest rate risk at October 31, 2023 was as follows:
| | Fair Value |
| Derivative | Asset Derivative | Liability Derivative |
| Purchased options | $ 1,466,235(1) | $ — |
| Written swaptions | — | (20,933) (2) |
| Futures contracts | 3,513,889 (3) | (4,197,121) (3) |
| Swap contracts (centrally cleared) | 20,619,679 (3) | — |
| Total | $25,599,803 | $(4,218,054) |
| Derivatives not subject to master netting or similar agreements | $24,133,568 | $(4,197,121) |
| Total Derivatives subject to master netting or similar agreements | $ 1,466,235 | $ (20,933) |
| (1) | Statement of Asset and Liabilities location: Unaffiliated investments, at value. |
| (2) | Statement of Assets and Liabilities location: Written swaptions outstanding, at value. |
| (3) | Only the current day’s variation margin on open futures contracts and centrally cleared swap contracts is reported within the Statement of Assets and Liabilities as Receivable or Payable for variation margin on open futures contracts and centrally cleared swap contracts, as applicable. |
The Fund's derivative assets and liabilities at fair value by risk, which are reported gross in the Statement of Assets and Liabilities, are presented in the table above. The following tables present the Fund's derivative assets and liabilities by counterparty, net of amounts available for offset under a master netting agreement and net of the related collateral received by the Fund for such assets and pledged by the Fund for such liabilities as of October 31, 2023.
| Counterparty | Derivative
Assets Subject to
Master Netting
Agreement | Derivatives
Available
for Offset | Non-cash
Collateral
Received(a) | Cash
Collateral
Received(a) | Net Amount
of Derivative
Assets(b) |
| Bank of America, N.A. | $1,466,235 | $(20,933) | $ — | $(1,420,000) | $25,302 |
| Counterparty | Derivative
Liabilities Subject to
Master Netting
Agreement | Derivatives
Available
for Offset | Non-cash
Collateral
Pledged(a) | Cash
Collateral
Pledged(a) | Net Amount
of Derivative
Liabilities(c) |
| Bank of America, N.A. | $(20,933) | $20,933 | $ — | $ — | $ — |
| (a) | In some instances, the total collateral received and/or pledged may be more than the amount shown due to overcollateralization. |
| (b) | Net amount represents the net amount due from the counterparty in the event of default. |
| (c) | Net amount represents the net amount payable to the counterparty in the event of default. |
Eaton Vance
Government Opportunities Fund
October 31, 2023
Notes to Financial Statements — continued
The effect of derivative instruments (not considered to be hedging instruments for accounting disclosure purposes) on the Statement of Operations by risk exposure for the year ended October 31, 2023 was as follows:
| Risk | Derivative | Realized Gain (Loss)
on Derivatives Recognized
in Income | Change in Unrealized
Appreciation (Depreciation) on
Derivatives Recognized in Income |
| Credit | Swap contracts | $ (1,074,021)(1) | $ 696,181(2) |
| Interest Rate | Purchased swaptions | (602,754) (3) | (3,419,547) (4) |
| Interest Rate | Written options and swaptions | 1,543,183 (5) | 577,555 (6) |
| Interest Rate | Futures contracts | (4,656,393) (7) | (451,653) (8) |
| Interest Rate | Swap contracts | 7,037,348 (1) | 5,526,572 (2) |
| Total | $ 2,247,363 | $ 2,929,108 |
| (1) | Statement of Operations location: Net realized gain (loss): Swap contracts. |
| (2) | Statement of Operations location: Change in unrealized appreciation (depreciation): Swap contracts. |
| (3) | Statement of Operations location: Net realized gain (loss): Investment transactions. |
| (4) | Statement of Operations location: Change in unrealized appreciation (depreciation): Investments. |
| (5) | Statement of Operations location: Net realized gain (loss): Written options and swaptions. |
| (6) | Statement of Operations location: Change in unrealized appreciation (depreciation): Written options and swaptions. |
| (7) | Statement of Operations location: Net realized gain (loss): Futures contracts. |
| (8) | Statement of Operations location: Change in unrealized appreciation (depreciation): Futures contracts. |
The average notional cost of futures contracts and average notional amounts of other derivative contracts outstanding during the year ended October 31, 2023, which are indicative of the volume of these derivative types, were approximately as follows:
Futures
Contracts — Long | Futures
Contracts — Short | Purchased
Swaptions | Written Options
and Swaptions | Swap
Contracts |
| $144,394,000 | $12,080,000 | $59,542,000 | $76,466,000 | $113,654,000 |
9 Line of Credit
The Fund participates with other portfolios and funds managed by BMR and its affiliates in a $650 million unsecured revolving line of credit agreement with a group of banks, which is in effect through October 22, 2024. In connection with the renewal of the agreement on October 24, 2023, the borrowing limit was decreased from $725 million. Borrowings are made by the Fund solely for temporary purposes related to redemptions and other short-term cash needs. Interest is charged to the Fund based on its borrowings at an amount above either the Secured Overnight Financing Rate (SOFR) or Federal Funds rate. In addition, a fee computed at an annual rate of 0.15% on the daily unused portion of the line of credit is allocated among the participating portfolios and funds at the end of each quarter. In connection with the renewal of the agreement in October 2023, an arrangement fee totaling $150,000 was incurred that was allocated to the participating portfolios and funds. Because the line of credit is not available exclusively to the Fund, it may be unable to borrow some or all of its requested amounts at any particular time. The Fund did not have any significant borrowings or allocated fees during the year ended October 31, 2023.
Eaton Vance
Government Opportunities Fund
October 31, 2023
Notes to Financial Statements — continued
10 Reverse Repurchase Agreements
Reverse repurchase agreements outstanding as of October 31, 2023 were as follows:
| Counterparty | Trade
Date | Maturity
Date | Interest
Rate Paid
(Received) | Principal
Amount | Value
Including
Accrued
Interest |
| BMO Capital Markets Corp. | 7/26/23 | On Demand(1) | 5.50% | $ 7,242,050 | $ 7,349,373 |
| MUFG Securities Americas, Inc. | 7/26/23 | On Demand(1) | 5.45 | 4,536,557 | 4,603,175 |
| MUFG Securities Americas, Inc. | 7/26/23 | On Demand(1) | 5.45 | 4,518,148 | 4,584,497 |
| MUFG Securities Americas, Inc. | 7/26/23 | On Demand(1) | 5.45 | 3,435,191 | 3,485,636 |
| MUFG Securities Americas, Inc. | 7/26/23 | On Demand(1) | 5.45 | 1,945,954 | 1,974,530 |
| MUFG Securities Americas, Inc. | 7/26/23 | On Demand(1) | 5.45 | 950,902 | 964,866 |
| MUFG Securities Americas, Inc. | 7/28/23 | On Demand(1) | 5.50 | 3,474,968 | 3,525,934 |
| MUFG Securities Americas, Inc. | 7/28/23 | On Demand(1) | 5.50 | 3,340,573 | 3,389,568 |
| MUFG Securities Americas, Inc. | 7/28/23 | On Demand(1) | 5.50 | 3,175,881 | 3,222,461 |
| MUFG Securities Americas, Inc. | 7/28/23 | On Demand(1) | 5.50 | 2,811,698 | 2,852,936 |
| MUFG Securities Americas, Inc. | 7/28/23 | On Demand(1) | 5.50 | 2,749,550 | 2,789,877 |
| MUFG Securities Americas, Inc. | 7/28/23 | On Demand(1) | 5.50 | 2,717,046 | 2,756,896 |
| MUFG Securities Americas, Inc. | 7/28/23 | On Demand(1) | 5.50 | 2,498,110 | 2,534,749 |
| MUFG Securities Americas, Inc. | 7/28/23 | On Demand(1) | 5.50 | 2,434,825 | 2,470,536 |
| Total | | | | $45,831,453 | $46,505,034 |
| (1) | Open reverse repurchase agreement with no specific maturity date. Either party may terminate the agreement upon demand. |
At October 31, 2023, the type of securities pledged as collateral for all open reverse repurchase agreements was U.S. Government Agency Mortgage-Backed Securities.
The Fund also pledged cash of $280,000 to BMO Capital Markets Corp. and $2,578,000 to MUFG Securities America, Inc. as additional collateral for its reverse repurchase obligations.
For the year ended October 31, 2023, the average borrowings under settled reverse repurchase agreements and the average interest rate paid were approximately $25,308,000 and 5.18%, respectively. Based on the short-term nature of the borrowings under the reverse repurchase agreements, the carrying value of the payable for reverse repurchase agreements approximated its fair value at October 31, 2023. If measured at fair value, borrowings under the reverse repurchase agreements would have been considered as Level 2 in the fair value hierarchy (see Note 12) at October 31, 2023.
Reverse repurchase agreements entered into by the Fund are subject to Master Repurchase Agreements (MRA), which permit the Fund, under certain circumstances, including an event of default (such as bankruptcy or insolvency), to offset payables and/or receivables under the MRA with collateral held and/or posted to the counterparty and create one single net payment due to or from the Fund.
The following table presents the Fund’s reverse repurchase agreements net of amounts available for offset under an MRA and net of the related collateral pledged by the Fund as of October 31, 2023.
| Counterparty | Reverse
Repurchase
Agreements* | Assets
Available for
Offset | Securities
Collateral
Pledged(a) | Net
Amount(b) |
| MUFG Securities Americas, Inc. | $ (39,155,661) | $ — | $ 39,155,661 | $ — |
| BMO Capital Markets Corp. | (7,349,373) | — | 7,349,373 | — |
| | $(46,505,034) | $ — | $46,505,034 | $ — |
| * | Including accrued interest. |
| (a) | In some instances, the total collateral pledged may be more than the amount shown due to overcollateralization. |
| (b) | Net amount represents the net amount payable to the counterparty in the event of default. |
Eaton Vance
Government Opportunities Fund
October 31, 2023
Notes to Financial Statements — continued
11 Affiliated Investments
At October 31, 2023, the value of the Fund's investment in funds that may be deemed to be affiliated was $4,120,946, which represents 1.0% of the Fund's net assets. Transactions in such investments by the Fund for the year ended October 31, 2023 were as follows:
| Name | Value,
beginning
of period | Purchases | Sales
proceeds | Net
realized
gain (loss) | Change in
unrealized
appreciation
(depreciation) | Value, end
of period | Dividend
income | Shares,
end of period |
| Short-Term Investments |
| Liquidity Fund | $83,859,312 | $286,442,724 | $(366,181,090) | $ — | $ — | $4,120,946 | $934,472 | 4,120,946 |
12 Fair Value Measurements
Under generally accepted accounting principles for fair value measurements, a three-tier hierarchy to prioritize the assumptions, referred to as inputs, is used in valuation techniques to measure fair value. The three-tier hierarchy of inputs is summarized in the three broad levels listed below.
| • | Level 1 – quoted prices in active markets for identical investments |
| • | Level 2 – other significant observable inputs (including quoted prices for similar investments, interest rates, prepayment speeds, credit risk, etc.) |
| • | Level 3 – significant unobservable inputs (including a fund's own assumptions in determining the fair value of investments) |
In cases where the inputs used to measure fair value fall in different levels of the fair value hierarchy, the level disclosed is determined based on the lowest level input that is significant to the fair value measurement in its entirety. The inputs or methodology used for valuing securities are not necessarily an indication of the risk associated with investing in those securities.
At October 31, 2023, the hierarchy of inputs used in valuing the Fund’s investments and open derivative instruments, which are carried at fair value, were as follows:
| Asset Description | Level 1 | Level 2 | Level 3 | Total |
| Asset-Backed Securities | $ — | $ 14,103,828 | $ — | $ 14,103,828 |
| Collateralized Mortgage Obligations | — | 183,087,698 | — | 183,087,698 |
| Commercial Mortgage-Backed Securities | — | 1,525,701 | — | 1,525,701 |
| U.S. Department of Agriculture Loans | — | 21,726,080 | — | 21,726,080 |
| U.S. Government Agency Commercial Mortgage-Backed Securities | — | 2,579,344 | — | 2,579,344 |
| U.S. Government Agency Mortgage-Backed Securities | — | 303,256,618 | — | 303,256,618 |
| U.S. Government Guaranteed Small Business Administration Loans | — | 1,251,447 | — | 1,251,447 |
| Short-Term Investments | 4,120,946 | — | — | 4,120,946 |
| Purchased Interest Rate Swaptions | — | 1,466,235 | — | 1,466,235 |
| Total Investments | $ 4,120,946 | $ 528,996,951 | $ — | $ 533,117,897 |
| Futures Contracts | $ 3,513,889 | $ — | $ — | $ 3,513,889 |
| Swap Contracts | — | 20,619,679 | — | 20,619,679 |
| Total | $ 7,634,835 | $ 549,616,630 | $ — | $ 557,251,465 |
| Liability Description | | | | |
| TBA Sale Commitments | $ — | $ (68,596,521) | $ — | $ (68,596,521) |
| Written Interest Rate Swaptions | — | (20,933) | — | (20,933) |
| Futures Contracts | (4,197,121) | — | — | (4,197,121) |
| Total | $ (4,197,121) | $ (68,617,454) | $ — | $ (72,814,575) |
Eaton Vance
Government Opportunities Fund
October 31, 2023
Report of Independent Registered Public Accounting Firm
To the Trustees of Eaton Vance Mutual Funds Trust and Shareholders of Eaton Vance Government Opportunities Fund:
Opinion on the Financial Statements and Financial Highlights
We have audited the accompanying statement of assets and liabilities of Eaton Vance Government Opportunities Fund (the “Fund") (one of the funds constituting Eaton Vance Mutual Funds Trust), including the portfolio of investments, as of October 31, 2023, the related statement of operations for the year then ended, the statements of changes in net assets for each of the two years in the period then ended, the financial highlights for each of the five years in the period then ended, and the related notes. In our opinion, the financial statements and financial highlights present fairly, in all material respects, the financial position of the Fund as of October 31, 2023, and the results of its operations for the year then ended, the changes in its net assets for each of the two years in the period then ended, and the financial highlights for each of the five years in the period then ended, in conformity with accounting principles generally accepted in the United States of America.
Basis for Opinion
These financial statements and financial highlights are the responsibility of the Fund's management. Our responsibility is to express an opinion on the Fund's financial statements and financial highlights based on our audits. We are a public accounting firm registered with the Public Company Accounting Oversight Board (United States) (PCAOB) and are required to be independent with respect to the Fund in accordance with the U.S. federal securities laws and the applicable rules and regulations of the Securities and Exchange Commission and the PCAOB.
We conducted our audits in accordance with the standards of the PCAOB. Those standards require that we plan and perform the audit to obtain reasonable assurance about whether the financial statements and financial highlights are free of material misstatement, whether due to error or fraud. The Fund is not required to have, nor were we engaged to perform, an audit of its internal control over financial reporting. As part of our audits, we are required to obtain an understanding of internal control over financial reporting but not for the purpose of expressing an opinion on the effectiveness of the Fund’s internal control over financial reporting. Accordingly, we express no such opinion.
Our audits included performing procedures to assess the risks of material misstatement of the financial statements and financial highlights, whether due to error or fraud, and performing procedures that respond to those risks. Such procedures included examining, on a test basis, evidence regarding the amounts and disclosures in the financial statements and financial highlights. Our audits also included evaluating the accounting principles used and significant estimates made by management, as well as evaluating the overall presentation of the financial statements and financial highlights. Our procedures included confirmation of securities owned as of October 31, 2023, by correspondence with the custodian and brokers; when replies were not received from brokers, we performed other auditing procedures. We believe that our audits provide a reasonable basis for our opinion.
/s/ Deloitte & Touche LLP
Boston, Massachusetts
December 22, 2023
We have served as the auditor of one or more Eaton Vance investment companies since 1959.
Eaton Vance
Government Opportunities Fund
October 31, 2023
Federal Tax Information (Unaudited)
The Form 1099-DIV you receive in February 2024 will show the tax status of all distributions paid to your account in calendar year 2023. Shareholders are advised to consult their own tax adviser with respect to the tax consequences of their investment in the Fund. As required by the Internal Revenue Code and/or regulations, shareholders must be notified regarding 163(j) interest dividends.
163(j) Interest Dividends. For the fiscal year ended October 31, 2023, the Fund designates 89.64% of distributions from net investment income as a 163(j) interest dividend.
Eaton Vance
Government Opportunities Fund
October 31, 2023
Board of Trustees’ Contract Approval
Overview of the Contract Review Process
The Investment Company Act of 1940, as amended (the “1940 Act”), provides, in substance, that the investment advisory agreement between a fund and its investment adviser will continue in effect from year-to-year only if its continuation is approved on an annual basis by a vote of the fund’s board of trustees, including a majority of the trustees who are not “interested persons” of the fund (“independent trustees”), cast in person at a meeting called for the purpose of considering such approval.
At a meeting held on June 8, 2023, the Boards of Trustees/Directors (collectively, the “Board”) that oversee the registered investment companies advised by Eaton Vance Management or its affiliate, Boston Management and Research (the “Eaton Vance Funds”), including a majority of the independent trustees (the “Independent Trustees”), voted to approve the continuation of existing investment advisory agreements and sub-advisory agreements1 for each of the Eaton Vance Funds for an additional one-year period. The Board relied upon the affirmative recommendation of its Contract Review Committee, which is a committee exclusively comprised of Independent Trustees. Prior to making its recommendation, the Contract Review Committee reviewed information furnished by the adviser and sub-adviser to each of the Eaton Vance Funds (including information specifically requested by the Board) for a series of formal meetings held between April and June 2023, as well as certain additional information provided in response to specific requests from the Independent Trustees as members of the Contract Review Committee. Members of the Contract Review Committee also considered information received at prior meetings of the Board and its committees, to the extent such information was relevant to the Contract Review Committee’s annual evaluation of the investment advisory agreements and sub-advisory agreements.
In connection with its evaluation of the investment advisory agreements and sub-advisory agreements, the Board considered various information relating to the Eaton Vance Funds. This included information applicable to all or groups of Eaton Vance Funds, which is referenced immediately below, and information applicable to the particular Eaton Vance Fund covered by this report (each “Eaton Vance Fund” is referred to below as a “fund”). (For funds that invest through one or more underlying portfolios, references to “each fund” in this section may include information that was considered at the portfolio-level.)
Information about Fees, Performance and Expenses
• A report from an independent data provider comparing advisory and other fees paid by each fund to such fees paid by comparable funds, as identified by the independent data provider (“comparable funds”);
• A report from an independent data provider comparing each fund’s total expense ratio (and its components) to those of comparable funds;
• A report from an independent data provider comparing the investment performance of each fund (including, as relevant, total return data, income data, Sharpe ratios and information ratios) to the investment performance of comparable funds and, as applicable, benchmark indices, over various time periods;
• In certain instances, data regarding investment performance relative to customized groups of peer funds and blended indices identified by the adviser in consultation with the Portfolio Management Committee of the Board (a committee exclusively comprised of Independent Trustees);
• Comparative information concerning the fees charged and services provided by the adviser and sub-adviser to each fund in managing other accounts (which may include other mutual funds, collective investment funds and institutional accounts) using investment strategies and techniques similar to those used in managing such fund(s), if any;
• Profitability analyses with respect to the adviser and sub-adviser to each of the funds;
Information about Portfolio Management and Trading
• Descriptions of the investment management services provided to each fund, as well as each of the funds’ investment strategies and policies;
• The procedures and processes used to determine the value of fund assets, including, when necessary, the determination of “fair value” and actions taken to monitor and test the effectiveness of such procedures and processes;
• Information about the policies and practices of each fund’s adviser and sub-adviser with respect to trading, including their processes for seeking best execution of portfolio transactions;
• Information about the allocation of brokerage transactions and the benefits, if any, received by the adviser and sub-adviser to each fund as a result of brokerage allocation, including, as applicable, information concerning the acquisition of research through client commission arrangements and policies with respect to “soft dollars”;
• Data relating to the portfolio turnover rate of each fund and related information regarding active management in the context of particular strategies;
Information about each Adviser and Sub-adviser
• Reports detailing the financial results and condition of the adviser and sub-adviser to each fund;
• Information regarding the individual investment professionals whose responsibilities include portfolio management and investment research for the funds, and, for portfolio managers and certain other investment professionals, information relating to their responsibilities with respect to managing other mutual funds and investment accounts, as applicable;
1 Not all Eaton Vance Funds have entered into a sub-advisory agreement with a sub-adviser. Accordingly, references to “sub-adviser” or “sub-advisory agreement” in this “Overview” section may not be applicable to the particular Eaton Vance Fund covered by this report.
Eaton Vance
Government Opportunities Fund
October 31, 2023
Board of Trustees’ Contract Approval — continued
• Information regarding the adviser’s and its parent company’s (Morgan Stanley’s) efforts to retain and attract talented investment professionals, including in the context of a competitive marketplace for talent, as well as the ongoing unique environment presented by hybrid, remote and other alternative work arrangements;
• Information regarding the adviser’s compensation methodology for its investment professionals and the incentives and accountability it creates, along with investment professionals’ investments in the fund(s) they manage;
• The Code of Ethics of the adviser and its affiliates and the sub-adviser of each fund, together with information relating to compliance with, and the administration of, such codes;
• Policies and procedures relating to proxy voting, including regular reporting with respect to fund proxy voting activities;
• Information regarding the handling of corporate actions and class actions, as well as information regarding litigation and other regulatory matters;
• Information concerning the resources devoted to compliance efforts undertaken by the adviser and its affiliates and the sub-adviser of each fund, if any, including descriptions of their various compliance programs and their record of compliance;
• Information concerning the business continuity and disaster recovery plans of the adviser and its affiliates and the sub-adviser of each fund, if any;
• A description of Eaton Vance Management’s and Boston Management and Research’s oversight of sub-advisers, including with respect to regulatory and compliance issues, investment management and other matters;
Other Relevant Information
• Information regarding ongoing initiatives to further integrate and harmonize, where applicable, the investment management and other departments of the adviser and its affiliates with the overall investment management infrastructure of Morgan Stanley, in light of Morgan Stanley’s acquisition of Eaton Vance Corp. on March 1, 2021;
• Information concerning the nature, cost and character of the administrative and other non-investment advisory services provided by Eaton Vance Management and its affiliates;
• Information concerning oversight of the relationship with the custodian, subcustodians, fund accountants, and other third-party service providers by the adviser and/or administrator to each of the funds;
• Information concerning efforts to implement policies and procedures with respect to various recently adopted regulations applicable to the funds, including Rule 12d1-4 (the Fund-of-Funds Rule), Rule 18f-4 (the Derivatives Rule) and Rule 2a-5 (the Fair Valuation Rule);
• For an Eaton Vance Fund structured as an exchange-listed closed-end fund, information concerning the benefits of the closed-end fund structure, as well as, where relevant, the closed-end fund’s market prices (including as compared to the closed-end fund’s net asset value (NAV)), trading volume data, continued use of auction preferred shares (where applicable), distribution rates and other relevant matters;
• The risks which the adviser and/or its affiliates incur in connection with the management and operation of the funds, including, among others, litigation, regulatory, entrepreneurial, and other business risks (and the associated costs of such risks); and
• The terms of each investment advisory agreement and sub-advisory agreement.
During the various meetings of the Board and its committees over the course of the year leading up to the June 8, 2023 meeting, the Board received information from portfolio managers and other investment professionals of the advisers and sub-advisers of the funds regarding investment and performance matters, and considered various investment and trading strategies used in pursuing the funds’ investment objectives. The Board also received information regarding risk management techniques employed in connection with the management of the funds. The Board and its committees evaluated issues pertaining to industry and regulatory developments, compliance procedures, fund governance and other issues with respect to the funds, and received and participated in reports and presentations provided by Eaton Vance Management, Boston Management and Research and fund sub-advisers, with respect to such matters. In addition to the formal meetings of the Board and its committees, the Independent Trustees held regular teleconferences to discuss, among other topics, matters relating to the continuation of investment advisory agreements and sub-advisory agreements.
The Contract Review Committee was advised throughout the contract review process by Goodwin Procter LLP, independent legal counsel for the Independent Trustees. The members of the Contract Review Committee, with the advice of such counsel, exercised their own business judgment in determining the material factors to be considered in evaluating each investment advisory agreement and sub-advisory agreement and the weight to be given to each such factor. The conclusions reached with respect to each investment advisory agreement and sub-advisory agreement were based on a comprehensive evaluation of all the information provided and not any single factor. Moreover, each member of the Contract Review Committee may have placed varying emphasis on particular factors in reaching conclusions with respect to each investment advisory agreement and sub-advisory agreement. In evaluating each investment advisory agreement and sub-advisory agreement, including the fee structures and other terms contained in such agreements, the members of the Contract Review Committee were also informed by multiple years of analysis and discussion with the adviser and sub-adviser to each of the Eaton Vance Funds.
Results of the Contract Review Process
Based on its consideration of the foregoing, and such other information it deemed relevant, including the factors and conclusions described below, the Contract Review Committee concluded that the continuation of the investment advisory agreement between Eaton Vance Government Opportunities Fund (the “Fund”) and Boston Management and Research (the “Adviser”), including its fee structure, is in the interests of shareholders and, therefore, recommended to the Board approval of the agreement. Based on the recommendation of the Contract Review Committee, the Board, including a majority of the Independent Trustees, voted to approve continuation of the investment advisory agreement for the Fund.
Eaton Vance
Government Opportunities Fund
October 31, 2023
Board of Trustees’ Contract Approval — continued
Nature, Extent and Quality of Services
In considering whether to approve the investment advisory agreement for the Fund, the Board evaluated the nature, extent and quality of services provided to the Fund by the Adviser.
The Board considered the Adviser’s management capabilities and investment processes in light of the types of investments held by the Fund, including the education, experience and number of investment professionals and other personnel who provide portfolio management, investment research, and similar services to the Fund. The Board specifically noted the Adviser’s experience in investing in collateralized mortgage obligations and mortgage-backed securities, including seasoned mortgage-backed securities, as well as the Adviser’s process for determining the extent to which the Fund will invest in seasoned mortgage-backed securities instead of other government securities. The Board also noted the Adviser’s experience in investing in instruments other than government securities, including privately issued residential and commercial mortgage-backed securities, mortgage-related loans, asset-backed securities, non-US mortgage-related instruments and other income instruments. The Board also took into account the resources dedicated to portfolio management and other services, the compensation methods of the Adviser and other factors, including the reputation and resources of the Adviser to recruit and retain highly qualified research, advisory and supervisory investment professionals. In addition, the Board considered the time and attention devoted to the Eaton Vance Funds, including the Fund, by senior management, as well as the infrastructure, operational capabilities and support staff in place to assist in the portfolio management and operations of the Fund, including the provision of administrative services. The Board also considered the business-related and other risks to which the Adviser or its affiliates may be subject in managing the Fund.
The Board considered the compliance programs of the Adviser and relevant affiliates thereof. The Board considered compliance and reporting matters regarding, among other things, personal trading by investment professionals, disclosure of portfolio holdings, late trading, frequent trading, portfolio valuation, business continuity and the allocation of investment opportunities. The Board also considered the responses of the Adviser and its affiliates to requests in recent years from regulatory authorities, such as the Securities and Exchange Commission and the Financial Industry Regulatory Authority.
The Board considered other administrative services provided or overseen by Eaton Vance Management and its affiliates, including transfer agency and accounting services. The Board evaluated the benefits to shareholders of investing in a fund that is a part of a large fund complex offering exposure to a variety of asset classes and investment disciplines, as well as the ability, in many cases, to exchange an investment among different funds without incurring additional sales charges.
After consideration of the foregoing factors, among others, the Board concluded that the nature, extent and quality of services provided by the Adviser, taken as a whole, are appropriate and consistent with the terms of the investment advisory agreement.
Fund Performance
The Board compared the Fund’s investment performance to that of comparable funds identified by an independent data provider (the peer group), as well as appropriate benchmark indices. The Board’s review included comparative performance data with respect to the Fund for the one-, three-, five- and ten-year periods ended December 31, 2022. In this regard, the Board noted that the performance of the Fund was higher than the median performance of the Fund’s peer group for the three-year period. The Board also noted that the performance of the Fund was higher than its secondary benchmark index and lower than its primary benchmark index for the three-year period. The Board concluded that the performance of the Fund was satisfactory.
Management Fees and Expenses
The Board considered contractual fee rates payable by the Fund for advisory and administrative services (referred to collectively as “management fees”). As part of its review, the Board considered the Fund’s management fees and total expense ratio for the one-year period ended December 31, 2022, as compared to those of comparable funds, before and after giving effect to any undertaking to waive fees or reimburse expenses. The Board also considered certain Fund specific factors that had an impact on the Fund’s total expense ratio relative to comparable funds, as identified by management in response to inquiries from the Contract Review Committee.
After considering the foregoing information, and in light of the nature, extent and quality of the services provided by the Adviser, the Board concluded that the management fees charged for advisory and related services are reasonable.
Profitability and “Fall-Out” Benefits
The Board considered the level of profits realized by the Adviser and relevant affiliates thereof in providing investment advisory and administrative services to the Fund and to all Eaton Vance Funds as a group. The Board considered the level of profits realized without regard to marketing support or other payments by the Adviser and its affiliates to third parties in respect of distribution and other services.
The Board concluded that, in light of the foregoing factors and the nature, extent and quality of the services rendered, the profits realized by the Adviser and its affiliates are deemed not to be excessive.
The Board also considered direct or indirect fall-out benefits received by the Adviser and its affiliates in connection with their respective relationships with the Fund, including the benefits of research services that may be available to the Adviser as a result of securities transactions effected for the Fund and other investment advisory clients.
Eaton Vance
Government Opportunities Fund
October 31, 2023
Board of Trustees’ Contract Approval — continued
Economies of Scale
In reviewing management fees and profitability, the Board also considered the extent to which the Adviser and its affiliates, on the one hand, and the Fund, on the other hand, can expect to realize benefits from economies of scale as the assets of the Fund increase. The Board acknowledged the difficulty in accurately measuring the benefits resulting from economies of scale, if any, with respect to the management of any specific fund or group of funds. The Board reviewed data summarizing the increases and decreases in the assets of the Fund and of all Eaton Vance Funds as a group over various time periods, and evaluated the extent to which the total expense ratio of the Fund and the profitability of the Adviser and its affiliates may have been affected by such increases or decreases. Based upon the foregoing, the Board concluded that the Fund currently shares in the benefits from economies of scale, if any, when they are realized by the Adviser. The Board also concluded that the structure of the advisory fees, which include breakpoints at several asset levels, will allow the Fund to continue to benefit from any economies of scale in the future.
Eaton Vance
Government Opportunities Fund
October 31, 2023
Liquidity Risk Management Program
The Fund has implemented a written liquidity risk management program (Program) and related procedures to manage its liquidity in accordance with Rule 22e-4 under the Investment Company Act of 1940, as amended (Liquidity Rule). The Liquidity Rule defines “liquidity risk” as the risk that a fund could not meet requests to redeem shares issued by the fund without significant dilution of the remaining investors’ interests in the fund. The Fund’s Board of Trustees/Directors has designated the investment adviser to serve as the administrator of the Program and the related procedures. The administrator has established a Liquidity Risk Management Oversight Committee (Committee) to perform the functions necessary to administer the Program. As part of the Program, the administrator is responsible for identifying illiquid investments and categorizing the relative liquidity of the Fund’s investments in accordance with the Liquidity Rule. Under the Program, the administrator assesses, manages, and periodically reviews the Fund’s liquidity risk, and is responsible for making certain reports to the Fund’s Board of Trustees/Directors and the Securities and Exchange Commission (SEC) regarding the liquidity of the Fund’s investments, and to notify the Board of Trustees/Directors and the SEC of certain liquidity events specified in the Liquidity Rule. The liquidity of the Fund’s portfolio investments is determined based on a number of factors including, but not limited to, relevant market, trading and investment-specific considerations under the Program.
At a meeting of the Fund’s Board of Trustees/Directors on June 7, 2023, the Committee provided a written report to the Fund’s Board of Trustees/
Directors pertaining to the operation, adequacy, and effectiveness of implementation of the Program, as well as the operation of the highly liquid investment minimum (if applicable) for the period January 1, 2022 through December 31, 2022 (Review Period). The Program operated effectively during the Review Period, supporting the administrator’s ability to assess, manage and monitor Fund liquidity risk, including during periods of market volatility and net redemptions. During the Review Period, the Fund met redemption requests on a timely basis.
There can be no assurance that the Program will achieve its objectives in the future. Please refer to the Fund’s prospectus for more information regarding the Fund’s exposure to liquidity risk and other principal risks to which an investment in the Fund may be subject.
Eaton Vance
Government Opportunities Fund
October 31, 2023
Management and Organization
Fund Management. The Trustees of Eaton Vance Mutual Funds Trust (the Trust) are responsible for the overall management and supervision of the Trust's affairs. The Board members and officers of the Trust are listed below. Except as indicated, each individual has held the office shown or other offices in the same company for the last five years. Board members hold indefinite terms of office. Each Trustee holds office until his or her successor is elected and qualified, subject to a prior death, resignation, retirement, disqualification or removal. Under the terms of the Fund’s current Trustee retirement policy, an Independent Trustee must retire and resign as a Trustee on the earlier of: (i) the first day of July following his or her 74th birthday; or (ii), with limited exception, December 31st of the 20th year in which he or she has served as a Trustee. However, if such retirement and resignation would cause the Fund to be out of compliance with Section 16 of the 1940 Act or any other regulations or guidance of the SEC, then such retirement and resignation will not become effective until such time as action has been taken for the Fund to be in compliance therewith. The “noninterested Trustees” consist of those Trustees who are not “interested persons” of the Trust, as that term is defined under the 1940 Act. The business address of each Board member and officer is Two International Place, Boston, Massachusetts 02110. As used below, “BMR” refers to Boston Management and Research, “EV” refers to EV LLC, “EVM” refers to Eaton Vance Management, “MSIM" refers to Morgan Stanley Investment Management Inc. and “EVD” refers to Eaton Vance Distributors, Inc. EV is the trustee of each of EVM and BMR. Each of EVM, BMR, EVD and EV are indirect, wholly owned subsidiaries of Morgan Stanley. Each officer affiliated with EVM may hold a position with other EVM affiliates that is comparable to his or her position with EVM listed below. Each Trustee oversees
127 funds in the Eaton Vance fund complex (including both funds and portfolios in a hub and spoke structure).
| Name and Year of Birth | Trust
Position(s) | Length of Service | Principal Occupation(s) and Other Directorships
During Past Five Years and Other Relevant Experience |
| Interested Trustee |
Anchal Pachnanda(1)
1980 | Trustee | Since 2023 | Co-Head of Strategy of MSIM (since 2019). Formerly, Head of Strategy of MSIM (2017-2019). Ms. Pachnanda is an interested person because of her position with MSIM, which is an affiliate of the Trust.
Other Directorships. None. |
| Noninterested Trustees |
Alan C. Bowser
1962 | Trustee | Since 2022 | Private investor. Formerly, Chief Diversity Officer, Partner and a member of the Operating Committee, and formerly served as Senior Advisor on Diversity and Inclusion for the firm’s chief executive officer, Co-Head of the Americas Region, and Senior Client Advisor of Bridgewater Associates, an asset management firm (2011- 2023).
Other Directorships. Independent Director of Stout Risius Ross (a middle market professional services advisory firm) (since 2021). |
Mark R. Fetting
1954 | Trustee | Since 2016 | Private investor. Formerly held various positions at Legg Mason, Inc. (investment management firm) (2000-2012), including President, Chief Executive Officer, Director and Chairman (2008-2012), Senior Executive Vice President (2004-2008) and Executive Vice President (2001-2004). Formerly, President of Legg Mason family of funds (2001-2008). Formerly, Division President and Senior Officer of Prudential Financial Group, Inc. and related companies (investment management firm) (1991-2000).
Other Directorships. None. |
Cynthia E. Frost
1961 | Trustee | Since 2014 | Private investor. Formerly, Chief Investment Officer of Brown University (university endowment) (2000-2012). Formerly, Portfolio Strategist for Duke Management Company (university endowment manager) (1995-2000). Formerly, Managing Director, Cambridge Associates (investment consulting company) (1989-1995). Formerly, Consultant, Bain and Company (management consulting firm) (1987-1989). Formerly, Senior Equity Analyst, BA Investment Management Company (1983-1985).
Other Directorships. None. |
George J. Gorman
1952 | Chairperson of the
Board and Trustee | Since 2021
(Chairperson) and 2014 (Trustee) | Principal at George J. Gorman LLC (consulting firm). Formerly, Senior Partner at Ernst & Young LLP (a registered public accounting firm) (1974-2009).
Other Directorships. None. |
Eaton Vance
Government Opportunities Fund
October 31, 2023
Management and Organization — continued
| Name and Year of Birth | Trust
Position(s) | Length of Service | Principal Occupation(s) and Other Directorships
During Past Five Years and Other Relevant Experience |
| Noninterested Trustees (continued) |
Valerie A. Mosley
1960 | Trustee | Since 2014 | Chairwoman and Chief Executive Officer of Valmo Ventures (a consulting and investment firm). Founder of Upward Wealth, Inc., dba BrightUp, a fintech platform. Formerly, Partner and Senior Vice President, Portfolio Manager and Investment Strategist at Wellington Management Company, LLP (investment management firm) (1992-2012). Formerly, Chief Investment Officer, PG Corbin Asset Management (1990-1992). Formerly worked in institutional corporate bond sales at Kidder Peabody (1986-1990).
Other Directorships. Director of DraftKings, Inc. (digital sports entertainment and gaming company) (since September 2020). Director of Envestnet, Inc. (provider of intelligent systems for wealth management and financial wellness) (since 2018). Formerly, Director of Dynex Capital, Inc. (mortgage REIT) (2013-2020) and Director of Groupon, Inc. (e-commerce provider) (2020-2022). |
Keith Quinton
1958 | Trustee | Since 2018 | Private investor, researcher and lecturer. Formerly, Independent Investment Committee Member at New Hampshire Retirement System (2017-2021). Formerly, Portfolio Manager and Senior Quantitative Analyst at Fidelity Investments (investment management firm) (2001-2014).
Other Directorships. Formerly, Director (2016-2021) and Chairman (2019-2021) of New Hampshire Municipal Bond Bank. |
Marcus L. Smith
1966 | Trustee | Since 2018 | Private investor and independent corporate director. Formerly, Chief Investment Officer, Canada (2012-2017), Chief Investment Officer, Asia (2010-2012), Director of Asian Research (2004-2010) and portfolio manager (2001-2017) at MFS Investment Management (investment management firm).
Other Directorships. Director of First Industrial Realty Trust, Inc. (an industrial REIT) (since 2021). Director of MSCI Inc. (global provider of investment decision support tools) (since 2017). Formerly, Director of DCT Industrial Trust Inc. (logistics real estate company) (2017-2018). |
Susan J. Sutherland
1957 | Trustee | Since 2015 | Private investor. Director of Ascot Group Limited and certain of its subsidiaries (insurance and reinsurance) (since 2017). Formerly, Director of Hagerty Holding Corp. (insurance) (2015-2018) and Montpelier Re Holdings Ltd. (insurance and reinsurance) (2013-2015). Formerly, Associate, Counsel and Partner at Skadden, Arps, Slate, Meagher & Flom LLP (law firm) (1982-2013).
Other Directorships. Formerly, Director of Kairos Acquisition Corp. (insurance/InsurTech acquisition company) (2021-2023). |
Scott E. Wennerholm
1959 | Trustee | Since 2016 | Private investor. Formerly, Trustee at Wheelock College (postsecondary institution) (2012-2018). Formerly, Consultant at GF Parish Group (executive recruiting firm) (2016-2017). Formerly, Chief Operating Officer and Executive Vice President at BNY Mellon Asset Management (investment management firm) (2005-2011). Formerly, Chief Operating Officer and Chief Financial Officer at Natixis Global Asset Management (investment management firm) (1997-2004). Formerly, Vice President at Fidelity Investments Institutional Services (investment management firm) (1994-1997).
Other Directorships. None. |
Nancy A. Wiser
1967 | Trustee | Since 2022 | Formerly, Executive Vice President and the Global Head of Operations at Wells Fargo Asset Management (2011-2021).
Other Directorships. None. |
| Name and Year of Birth | Trust
Position(s) | Length of Service | Principal Occupation(s)
During Past Five Years |
| Principal Officers who are not Trustees |
Kenneth A. Topping
1966 | President | Since 2023 | Vice President and Chief Administrative Officer of EVM and BMR and Chief Operating Officer for Public Markets at MSIM. Also Vice President of Calvert Research and Management (“CRM”) since 2021. Formerly, Chief Operating Officer for Goldman Sachs Asset Management ‘Classic’ (2009-2020). |
Deidre E. Walsh
1971 | Vice President and Chief
Legal Officer | Since 2009 | Vice President of EVM and BMR. Also Vice President of CRM. |
James F. Kirchner
1967 | Treasurer | Since 2007 | Vice President of EVM and BMR. Also Vice President of CRM. |
Eaton Vance
Government Opportunities Fund
October 31, 2023
Management and Organization — continued
| Name and Year of Birth | Trust
Position(s) | Length of Service | Principal Occupation(s)
During Past Five Years |
| Principal Officers who are not Trustees (continued) |
Nicholas S. Di Lorenzo
1987 | Secretary | Since 2022 | Formerly, associate (2012-2021) and counsel (2022) at Dechert LLP. |
Richard F. Froio
1968 | Chief Compliance
Officer | Since 2017 | Vice President of EVM and BMR since 2017. Formerly, Deputy Chief Compliance Officer (Adviser/Funds) and Chief Compliance Officer (Distribution) at PIMCO (2012-2017) and Managing Director at BlackRock/Barclays Global Investors (2009-2012). |
(1) Ms. Pachnanda began serving as Trustee effective April 1, 2023.
The SAI for the Fund includes additional information about the Trustees and officers of the Fund and can be obtained without charge on Eaton Vance’s website at www.eatonvance.com or by calling 1-800-262-1122.
| FACTS | WHAT DOES EATON VANCE DO WITH YOUR
PERSONAL INFORMATION? |
| Why? | Financial companies choose how they share your personal information. Federal law gives consumers the right to limit some but not all sharing. Federal law also requires us to tell you how we collect, share, and protect your personal information. Please read this notice carefully to understand what we do. |
| |
| What? | The types of personal information we collect and share depend on the product or service you have with us. This information can include:■ Social Security number and income
■ investment experience and risk tolerance
■ checking account number and wire transfer instructions |
| |
| How? | All financial companies need to share customers’ personal information to run their everyday business. In the section below, we list the reasons financial companies can share their customers’ personal information; the reasons Eaton Vance chooses to share; and whether you can limit this sharing. |
Reasons we can share your
personal information | Does Eaton Vance
share? | Can you limit
this sharing? |
| For our everyday business purposes — such as to process your transactions, maintain your account(s), respond to court orders and legal investigations, or report to credit bureaus | Yes | No |
| For our marketing purposes — to offer our products and services to you | Yes | No |
| For joint marketing with other financial companies | No | We don’t share |
| For our investment management affiliates’ everyday business purposes — information about your transactions, experiences, and creditworthiness | Yes | Yes |
| For our affiliates’ everyday business purposes — information about your transactions and experiences | Yes | No |
| For our affiliates’ everyday business purposes — information about your creditworthiness | No | We don’t share |
| For our investment management affiliates to market to you | Yes | Yes |
| For our affiliates to market to you | No | We don’t share |
| For nonaffiliates to market to you | No | We don’t share |
To limit our
sharing | Call toll-free 1-800-262-1122 or email: EVPrivacy@eatonvance.comPlease note:If you are a new customer, we can begin sharing your information 30 days from the date we sent this notice. When you are no longer our customer, we continue to share your information as described in this notice. However, you can contact us at any time to limit our sharing. |
| Questions? | Call toll-free 1-800-262-1122 or email: EVPrivacy@eatonvance.com |
| Privacy Notice — continued | April 2021 |
| Who we are |
| Who is providing this notice? | Eaton Vance Management, Eaton Vance Distributors, Inc., Eaton Vance Trust Company, Eaton Vance Management (International) Limited, Eaton Vance Advisers International Ltd., Eaton Vance Global Advisors Limited, Eaton Vance Management’s Real Estate Investment Group, Boston Management and Research, Calvert Research and Management, Eaton Vance and Calvert Fund Families and our investment advisory affiliates (“Eaton Vance”) (see Investment Management Affiliates definition below) |
| What we do |
How does Eaton Vance
protect my personal
information? | To protect your personal information from unauthorized access and use, we use security measures that comply with federal law. These measures include computer safeguards and secured files and buildings. We have policies governing the proper handling of customer information by personnel and requiring third parties that provide support to adhere to appropriate security standards with respect to such information. |
How does Eaton Vance
collect my personal
information? | We collect your personal information, for example, when you■ open an account or make deposits or withdrawals from your account
■ buy securities from us or make a wire transfer
■ give us your contact informationWe also collect your personal information from others, such as credit bureaus, affiliates, or other companies. |
| Why can’t I limit all sharing? | Federal law gives you the right to limit only■ sharing for affiliates’ everyday business purposes — information about your creditworthiness
■ affiliates from using your information to market to you
■ sharing for nonaffiliates to market to youState laws and individual companies may give you additional rights to limit sharing. See below for more on your rights under state law. |
| Definitions |
Investment Management
Affiliates | Eaton Vance Investment Management Affiliates include registered investment advisers, registered broker- dealers, and registered and unregistered funds. Investment Management Affiliates does not include entities associated with Morgan Stanley Wealth Management, such as Morgan Stanley Smith Barney LLC and Morgan Stanley & Co. |
| Affiliates | Companies related by common ownership or control. They can be financial and nonfinancial companies.■ Our affiliates include companies with a Morgan Stanley name and financial companies such as Morgan Stanley Smith Barney LLC and Morgan Stanley & Co. |
| Nonaffiliates | Companies not related by common ownership or control. They can be financial and nonfinancial companies.■ Eaton Vance does not share with nonaffiliates so they can market to you. |
| Joint marketing | A formal agreement between nonaffiliated financial companies that together market financial products or services to you.■ Eaton Vance doesn’t jointly market. |
| Other important information |
| Vermont: Except as permitted by law, we will not share personal information we collect about Vermont residents with Nonaffiliates unless you provide us with your written consent to share such information.California: Except as permitted by law, we will not share personal information we collect about California residents with Nonaffiliates and we will limit sharing such personal information with our Affiliates to comply with California privacy laws that apply to us. |
Delivery of Shareholder Documents. The Securities and Exchange Commission (SEC) permits funds to deliver only one copy of shareholder documents, including prospectuses, proxy statements and shareholder reports, to fund investors with multiple accounts at the same residential or post office box address. This practice is often called “householding” and it helps eliminate duplicate mailings to shareholders. Eaton Vance, or your financial intermediary, may household the mailing of your documents indefinitely unless you instruct Eaton Vance, or your financial intermediary, otherwise. If you would prefer that your Eaton Vance documents not be householded, please contact Eaton Vance at 1-800-262-1122, or contact your financial intermediary. Your instructions that householding not apply to delivery of your Eaton Vance documents will typically be effective within 30 days of receipt by Eaton Vance or your financial intermediary.
Portfolio Holdings. Each Eaton Vance Fund and its underlying Portfolio(s) (if applicable) files a schedule of portfolio holdings on Part F to Form N-PORT with the SEC. Certain information filed on Form N-PORT may be viewed on the Eaton Vance website at www.eatonvance.com, by calling Eaton Vance at 1-800-262-1122 or in the EDGAR database on the SEC’s website at www.sec.gov.
Proxy Voting. From time to time, funds are required to vote proxies related to the securities held by the funds. The Eaton Vance Funds or their underlying Portfolios (if applicable) vote proxies according to a set of policies and procedures approved by the Funds’ and Portfolios’ Boards. You may obtain a description of these policies and procedures and information on how the Funds or Portfolios voted proxies relating to portfolio securities during the most recent 12-month period ended June 30, without charge, upon request, by calling 1-800-262-1122 and by accessing the SEC’s website at www.sec.gov.
Tailored Shareholder Reports. Effective January 24, 2023, the SEC adopted rule and form amendments to require open-end mutual funds and ETFs to transmit concise and visually engaging streamlined annual and semiannual reports to shareholders that highlight key information. Other information, including financial statements, will no longer appear in a streamlined shareholder report but must be available online, delivered free of charge upon request, and filed on a semiannual basis on Form N-CSR. The rule and form amendments have a compliance date of July 24, 2024. At this time, management is evaluating the impact of these amendments on the shareholder reports for the Eaton Vance Funds.
This Page Intentionally Left Blank
This Page Intentionally Left Blank
Investment Adviser
Boston Management and Research
Two International Place
Boston, MA 02110
Administrator
Eaton Vance Management
Two International Place
Boston, MA 02110
Principal Underwriter*
Eaton Vance Distributors, Inc.
Two International Place
Boston, MA 02110
(617) 482-8260
Custodian
State Street Bank and Trust Company
One Congress Street, Suite 1
Boston, MA 02114-2016
Transfer Agent
BNY Mellon Investment Servicing (US) Inc.
Attn: Eaton Vance Funds
P.O. Box 534439
Pittsburgh, PA 15253-4439
(800) 262-1122
Independent Registered Public Accounting Firm
Deloitte & Touche LLP
200 Berkeley Street
Boston, MA 02116-5022
Fund Offices
Two International Place
Boston, MA 02110
* FINRA BrokerCheck. Investors may check the background of their Investment Professional by contacting the Financial Industry Regulatory Authority (FINRA). FINRA BrokerCheck is a free tool to help investors check the professional background of current and former FINRA-registered securities firms and brokers. FINRA BrokerCheck is available by calling 1-800-289-9999 and at www.FINRA.org. The FINRA BrokerCheck brochure describing this program is available to investors at www.FINRA.org.
Eaton Vance
High Income Opportunities Fund
Annual Report
October 31, 2023
Commodity Futures Trading Commission Registration. The Commodity Futures Trading Commission (“CFTC”) has adopted regulations that subject registered investment companies and advisers to regulation by the CFTC if a fund invests more than a prescribed level of its assets in certain CFTC-regulated instruments (including futures, certain options and swap agreements) or markets itself as providing investment exposure to such instruments. The investment adviser has claimed an exclusion from the definition of “commodity pool operator” under the Commodity Exchange Act with respect to its management of the Fund. Accordingly, neither the Fund nor the adviser with respect to the operation of the Fund is subject to CFTC regulation. Because of its management of other strategies, the Fund's adviser is registered with the CFTC as a commodity pool operator. The adviser is also registered as a commodity trading advisor.
Fund shares are not insured by the FDIC and are not deposits or other obligations of, or guaranteed by, any depository institution. Shares are subject to investment risks, including possible loss of principal invested.
This report must be preceded or accompanied by a current summary prospectus or prospectus. Before investing, investors should consider carefully the investment objective, risks, and charges and expenses of a mutual fund. This and other important information is contained in the summary prospectus and prospectus, which can be obtained from a financial intermediary. Prospective investors should read the prospectus carefully before investing. For further information, please call 1-800-262-1122.
Annual Report October 31, 2023
Eaton Vance
High Income Opportunities Fund
Eaton Vance
High Income Opportunities Fund
October 31, 2023
Management’s Discussion of Fund Performance†
Economic and Market Conditions
U.S. and global high yield bond markets got off to a strong start during the 12-month period ended October 31, 2023. At the outset, investors hoped inflation would subside and the U.S. Federal Reserve (the Fed) would ease off federal funds rate hikes to pursue a soft economic landing.
However, bond markets weakened toward the end of 2022 as the Fed indicated its long-term interest rate target was higher than investors expected. For the remainder of the period, the high yield market rose and fell as prospects for a soft landing alternately brightened and dimmed.
In the first few months of 2023, returns remained healthy, but were dampened by concerns over the failures of Silicon Valley Bank and Signature Bank, as well as the general health of regional U.S. banks. Returns softened further during the second quarter of 2023 over concerns that the U.S. Congress might not pass legislation to meet the country’s looming debt ceiling, and fears of a resurgence in inflation fueled by persistently strong consumer spending and jobs growth data.
Toward the end of the period, the high yield bond market cooled as global interest rates moved sharply higher in response to hawkish monetary policy rhetoric by the Fed and the European Central Bank.
For the period as a whole, the ICE BofA U.S. High Yield Index returned 5.82%, while the Bloomberg U.S. Aggregate Bond Index returned 0.36%.
High yield issuance totaled $157.6 billion (source: J.P. Morgan) during the period, up from $139 billion in the prior one-year period. Refinancing accounted for approximately 60% of new issuances, and acquisition financing accounted for about 20%. According to preliminary Lipper estimates, U.S. high yield retail funds experienced a net outflow of $22.8 billion during the period.
The trailing 12-month par-weighted default rate increased to 1.76%, up from 0.84% at the end of the prior one-year period.
Fund Performance
For the 12-month period ended October 31, 2023, Eaton Vance High Income Opportunities Fund (the Fund) returned 5.94% for Class A shares at net asset value (NAV), outperforming its benchmark, the ICE BofA U.S. High Yield Index, (the Index), which returned 5.82%.
Security selections and allocations by sector overall contributed to performance relative to the Index during the period. Underweight exposures to the cable & satellite TV, and telecommunications sectors; and selections in the gaming sector were particularly beneficial. Selections in the banks & thrifts, diversified financial services, and utilities sectors detracted from Index-relative returns.
Security selections by credit-rating categories contributed to relative performance. Selections in BB-rated securities were particularly beneficial. An out-of-Index allocation to nonrated securities also contributed, although allocations by credit-rating quality slightly detracted overall. An underweight exposure to C-rated bonds weighed on returns relative to the Index. Security selections in B- and CCC-rated bonds also detracted from Index-relative returns during the period.
Selections by duration category contributed to Index-relative returns. Selections in securities with durations of less than 5 years were generally positive. Although allocations by duration overall enhanced relative returns, an overweight allocation to securities with durations of 0-2 years had a slightly negative impact on Index-relative returns during the period.
See Endnotes and Additional Disclosures in this report.
Past performance is no guarantee of future results. Returns are historical and are calculated by determining the percentage change in net asset value (NAV) or offering price (as applicable) with all distributions reinvested. Furthermore, returns do not reflect the deduction of taxes that shareholders may have to pay on Fund distributions or upon the redemption of Fund shares. Investment return and principal value will fluctuate so that shares, when redeemed, may be worth more or less than their original cost. Performance for periods less than or equal to one year is cumulative. Performance is for the stated time period only; due to market volatility, current Fund performance may be lower or higher than the quoted return. For performance as of the most recent month-end, please refer to eatonvance.com.
Eaton Vance
High Income Opportunities Fund
October 31, 2023
Performance
Portfolio Manager(s) Kelley Gerrity, Stephen C. Concannon, CFA and Jeffrey D. Mueller
| % Average Annual Total Returns1,2 | Class
Inception Date | Performance
Inception Date | One Year | Five Years | Ten Years |
| Class A at NAV | 03/11/2004 | 08/19/1986 | 5.94% | 3.51% | 3.94% |
| Class A with 3.25% Maximum Sales Charge | — | — | 2.54 | 2.81 | 3.59 |
| Class C at NAV | 06/08/1994 | 08/19/1986 | 5.38 | 2.76 | 3.31 |
| Class C with 1% Maximum Deferred Sales Charge | — | — | 4.38 | 2.76 | 3.31 |
| Class I at NAV | 10/01/2009 | 08/19/1986 | 6.48 | 3.77 | 4.20 |
| Class R6 at NAV | 06/30/2023 | 08/19/1986 | 6.52 | 3.78 | 4.21 |
|
| ICE BofA U.S. High Yield Index | — | — | 5.82% | 2.88% | 3.78% |
| ICE BofA U.S. High Yield Constrained Index | — | — | 5.81 | 2.86 | 3.77 |
| % Total Annual Operating Expense Ratios3 | Class A | Class C | Class I | Class R6 |
| | 0.91% | 1.66% | 0.66% | 0.56% |
Growth of $10,000
This graph shows the change in value of a hypothetical investment of $10,000 in Class A of the Fund for the period indicated. For comparison, the same investment is shown in the indicated index.
| Growth of Investment2 | Amount Invested | Period Beginning | At NAV | With Maximum Sales Charge |
| Class C | $10,000 | 10/31/2013 | $13,855 | N.A. |
| Class I, at minimum investment | $1,000,000 | 10/31/2013 | $1,509,678 | N.A. |
| Class R6, at minimum investment | $5,000,000 | 10/31/2013 | $7,551,012 | N.A. |
See Endnotes and Additional Disclosures in this report.
Past performance is no guarantee of future results. Returns are historical and are calculated by determining the percentage change in net asset value (NAV) or offering price (as applicable) with all distributions reinvested. Furthermore, returns do not reflect the deduction of taxes that shareholders may have to pay on Fund distributions or upon the redemption of Fund shares. Investment return and principal value will fluctuate so that shares, when redeemed, may be worth more or less than their original cost. Performance for periods less than or equal to one year is cumulative. Performance is for the stated time period only; due to market volatility, current Fund performance may be lower or higher than the quoted return. For performance as of the most recent month-end, please refer to eatonvance.com.
Eaton Vance
High Income Opportunities Fund
October 31, 2023
| Credit Quality (% of total investments)1 |
Fund invests in an affiliated investment company (Portfolio) with the same objective(s) and policies as the Fund. References to investments are to the Portfolio’s holdings.
Footnotes:
| 1 | Ratings are based on Moody’s Investors Service, Inc. (“Moody’s”), S&P Global Ratings (“S&P”) or Fitch Ratings (“Fitch”), as applicable. The breakdown assigns a numeric equivalent to the ratings from the aforementioned agencies and the mean is rounded to the nearest integer and converted to an equivalent S&P major rating category. Ratings, which are subject to change, apply to the creditworthiness of the issuers of the underlying securities and not to the Fund or its shares. Credit ratings measure the quality of a bond based on the issuer’s creditworthiness, with ratings ranging from AAA, being the highest, to D, being the lowest based on S&P’s measures. Ratings of BBB or higher by S&P or Fitch (Baa or higher by Moody’s) are considered to be investment-grade quality. Credit ratings are based largely on the ratings agency’s analysis at the time of rating. The rating assigned to any particular security is not necessarily a reflection of the issuer’s current financial condition and does not necessarily reflect its assessment of the volatility of a security’s market value or of the liquidity of an investment in the security. Holdings designated as “Not Rated” (if any) are not rated by the national ratings agencies stated above. |
Eaton Vance
High Income Opportunities Fund
October 31, 2023
Endnotes and Additional Disclosures
| † | The views expressed in this report are those of the portfolio manager(s) and are current only through the date stated at the top of this page. These views are subject to change at any time based upon market or other conditions, and Eaton Vance and the Fund(s) disclaim any responsibility to update such views. These views may not be relied upon as investment advice and, because investment decisions are based on many factors, may not be relied upon as an indication of trading intent on behalf of any Eaton Vance fund. This commentary may contain statements that are not historical facts, referred to as “forward-looking statements.” The Fund’s actual future results may differ significantly from those stated in any forward-looking statement, depending on factors such as changes in securities or financial markets or general economic conditions, the volume of sales and purchases of Fund shares, the continuation of investment advisory, administrative and service contracts, and other risks discussed from time to time in the Fund’s filings with the Securities and Exchange Commission. |
| | |
| 1 | ICE BofA U.S. High Yield Index is an unmanaged index of below-investment grade U.S. corporate bonds. ICE BofA U.S. High Yield Constrained Index is an unmanaged index of below-investment grade U.S. corporate bonds, with issuer exposure capped at 2%. ICE® BofA® indices are not for redistribution or other uses; provided “as is”, without warranties, and with no liability. Eaton Vance has prepared this report and ICE Data Indices, LLC does not endorse it, or guarantee, review, or endorse Eaton Vance’s products. BofA® is a licensed registered trademark of Bank of America Corporation in the United States and other countries. Unless otherwise stated, index returns do not reflect the effect of any applicable sales charges, commissions, expenses, taxes or leverage, as applicable. It is not possible to invest directly in an index. |
| 2 | Total Returns at NAV do not include applicable sales charges. If sales charges were deducted, the returns would be lower. Total Returns shown with maximum sales charge reflect the stated maximum sales charge. Unless otherwise stated, performance does not reflect the deduction of taxes on Fund distributions or redemptions of Fund shares.Performance prior to the inception date of a class may be linked to the performance of an older class of the Fund. This linked performance is adjusted for any applicable sales charge, but is not adjusted for class expense differences. If adjusted for such differences, the performance would be different. The performance of Class R6 is linked to Class I. Performance since inception for an index, if presented, is the performance since the Fund’s or oldest share class’ inception, as applicable. Performance presented in the Financial Highlights included in the financial statements is not linked.Effective November 5, 2020, Class C shares automatically convert to Class A shares eight years after purchase. The average annual total returns listed for Class C reflect conversion to Class A shares after eight years. Prior to November 5, 2020, Class C shares automatically converted to Class A shares ten years after purchase. |
| 3 | Source: Fund prospectus. The expense ratios for the current reporting period can be found in the Financial Highlights section of this report. |
| | Performance reflects expenses waived and/or reimbursed, if applicable. Without such waivers and/or reimbursements, performance would have been lower. |
| | Fund profile subject to change due to active management. |
| | Additional Information |
| | Bloomberg U.S. Aggregate Bond Index is an unmanaged index of domestic investment-grade bonds, including corporate, government and mortgage-backed securities. |
| | Duration is a measure of the expected change in price of a bond — in percentage terms — given a one percent change in interest rates, all else being constant. Securities with lower durations tend to be less sensitive to interest rate changes. |
Eaton Vance
High Income Opportunities Fund
October 31, 2023
Example
As a Fund shareholder, you incur two types of costs: (1) transaction costs, including sales charges (loads) on purchases; and (2) ongoing costs, including management fees; distribution and/or service fees; and other Fund expenses. This Example is intended to help you understand your ongoing costs (in dollars) of Fund investing and to compare these costs with the ongoing costs of investing in other mutual funds. The Example is based on an investment of $1,000 invested at the beginning of the period and held for the entire period (May 1, 2023 to October 31, 2023).
Actual Expenses
The first section of the table below provides information about actual account values and actual expenses. You may use the information in this section, together with the amount you invested, to estimate the expenses that you paid over the period. Simply divide your account value by $1,000 (for example, an $8,600 account value divided by $1,000 = 8.6), then multiply the result by the number in the first section under the heading entitled “Expenses Paid During Period” to estimate the expenses you paid on your account during this period.
Hypothetical Example for Comparison Purposes
The second section of the table below provides information about hypothetical account values and hypothetical expenses based on the actual Fund expense ratio and an assumed rate of return of 5% per year (before expenses), which is not the actual Fund return. The hypothetical account values and expenses may not be used to estimate the actual ending account balance or expenses you paid for the period. You may use this information to compare the ongoing costs of investing in your Fund and other funds. To do so, compare this 5% hypothetical example with the 5% hypothetical examples that appear in the shareholder reports of the other funds.
Please note that the expenses shown in the table are meant to highlight your ongoing costs only and do not reflect any transactional costs, such as sales charges (loads). Therefore, the second section of the table is useful in comparing ongoing costs only, and will not help you determine the relative total costs of owning different funds. In addition, if these transactional costs were included, your costs would be higher.
| | Beginning
Account Value
(5/1/23) | Ending
Account Value
(10/31/23) | Expenses Paid
During Period
(5/1/23 – 10/31/23) | Annualized
Expense
Ratio |
| Actual* | | | | |
| Class A | $1,000.00 | $ 993.10 | $4.77** | 0.95% |
| Class C | $1,000.00 | $ 991.90 | $8.48** | 1.69% |
| Class I | $1,000.00 | $ 996.90 | $3.47** | 0.69% |
| Class R6 | $1,000.00 | $ 991.70 | $2.03** | 0.60% |
| |
| Hypothetical *** | | | | |
| (5% return per year before expenses) | | | | |
| Class A | $1,000.00 | $1,020.42 | $4.84** | 0.95% |
| Class C | $1,000.00 | $1,016.69 | $8.59** | 1.69% |
| Class I | $1,000.00 | $1,021.73 | $3.52** | 0.69% |
| Class R6 | $1,000.00 | $1,022.18 | $3.06** | 0.60% |
| * | Class R6 had not commenced operations on April 1, 2023. Actual expenses are equal to the Fund’s annualized expense ratio for the indicated Class, multiplied by the average account value over the period, multiplied by 183/365 (to reflect the one-half year period); 123/365 for Class R6 (to reflect the period from the commencement of operations on June 30, 2023 to October 31, 2023). The Example assumes that the $1,000 was invested at the net asset value per share determined at the close of business on March 31, 2023 (June 30, 2023 for Class R6). |
| ** | Absent an allocation of certain expenses to affiliate(s), expenses would be higher. |
| *** | Hypothetical expenses are equal to the Fund’s annualized expense ratio for the indicated Class, multiplied by the average account value over the period, multiplied by 183/365 (to reflect the one-half year period). The Example assumes that the $1,000 was invested at the net asset value per share determined at the close of business on March 31, 2023 (June 30, 2023 for Class R6). |
Eaton Vance
High Income Opportunities Fund
October 31, 2023
Statement of Assets and Liabilities
| | October 31, 2023 |
| Assets | |
| Investment in High Income Opportunities Portfolio, at value (identified cost $888,106,670) | $ 842,192,369 |
| Receivable for Fund shares sold | 6,570,382 |
| Prepaid expenses | 10,575 |
| Total assets | $848,773,326 |
| Liabilities | |
| Payable for Fund shares redeemed | $ 2,749,424 |
| Distributions payable | 366,718 |
| Payable to affiliates: | |
| Distribution and service fees | 62,732 |
| Trustees' fees | 43 |
| Accrued expenses | 435,330 |
| Total liabilities | $ 3,614,247 |
| Net Assets | $845,159,079 |
| Sources of Net Assets | |
| Paid-in capital | $ 911,811,160 |
| Accumulated loss | (66,652,081) |
| Net Assets | $845,159,079 |
| Class A Shares | |
| Net Assets | $ 212,169,560 |
| Shares Outstanding | 54,103,631 |
Net Asset Value and Redemption Price Per Share
(net assets ÷ shares of beneficial interest outstanding) | $ 3.92 |
Maximum Offering Price Per Share
(100 ÷ 96.75 of net asset value per share) | $ 4.05 |
| Class C Shares | |
| Net Assets | $ 19,685,552 |
| Shares Outstanding | 5,013,085 |
Net Asset Value and Offering Price Per Share*
(net assets ÷ shares of beneficial interest outstanding) | $ 3.93 |
| Class I Shares | |
| Net Assets | $ 613,247,142 |
| Shares Outstanding | 156,200,707 |
Net Asset Value, Offering Price and Redemption Price Per Share
(net assets ÷ shares of beneficial interest outstanding) | $ 3.93 |
| Class R6 Shares | |
| Net Assets | $ 56,825 |
| Shares Outstanding | 14,465 |
Net Asset Value, Offering Price and Redemption Price Per Share
(net assets ÷ shares of beneficial interest outstanding) | $ 3.93 |
| On sales of $100,000 or more, the offering price of Class A shares is reduced. |
| * | Redemption price per share is equal to the net asset value less any applicable contingent deferred sales charge. |
7
See Notes to Financial Statements.
Eaton Vance
High Income Opportunities Fund
October 31, 2023
| | Year Ended |
| | October 31, 2023 |
| Investment Income | |
| Dividend income allocated from Portfolio (net of foreign taxes withheld of $969) | $ 2,130,424 |
| Interest and other income allocated from Portfolio | 49,730,340 |
| Expenses allocated from Portfolio | (4,141,692) |
| Total investment income from Portfolio | $47,719,072 |
| Expenses | |
| Distribution and service fees: | |
| Class A | $ 510,170 |
| Class C | 233,950 |
| Trustees’ fees and expenses | 501 |
| Custodian fee | 51,224 |
| Transfer and dividend disbursing agent fees | 887,460 |
| Legal and accounting services | 56,333 |
| Printing and postage | 208,515 |
| Registration fees | 132,541 |
| Miscellaneous | 16,096 |
| Total expenses | $ 2,096,790 |
| Net investment income | $45,622,282 |
| Realized and Unrealized Gain (Loss) from Portfolio | |
| Net realized gain (loss): | |
| Investment transactions | $ 5,790,642 |
| Securities sold short | (119,236) |
| Foreign currency transactions | 21,314 |
| Forward foreign currency exchange contracts | (306,229) |
| Net realized gain | $ 5,386,491 |
| Change in unrealized appreciation (depreciation): | |
| Investments | $ (7,948,261) |
| Foreign currency | (545) |
| Forward foreign currency exchange contracts | (118,511) |
| Net change in unrealized appreciation (depreciation) | $ (8,067,317) |
| Net realized and unrealized loss | $ (2,680,826) |
| Net increase in net assets from operations | $42,941,456 |
8
See Notes to Financial Statements.
Eaton Vance
High Income Opportunities Fund
October 31, 2023
Statements of Changes in Net Assets
| | Year Ended October 31, |
| | 2023 | 2022 |
| Increase (Decrease) in Net Assets | | |
| From operations: | | |
| Net investment income | $ 45,622,282 | $ 31,560,711 |
| Net realized gain (loss) | 5,386,491 | (3,209,893) |
| Net change in unrealized appreciation (depreciation) | (8,067,317) | (91,169,363) |
| Net increase (decrease) in net assets from operations | $ 42,941,456 | $ (62,818,545) |
| Distributions to shareholders: | | |
| Class A | $ (11,836,657) | $ (10,516,890) |
| Class C | (1,164,176) | (1,194,748) |
| Class I | (33,777,614) | (24,484,753) |
| Class R6(1) | (1,093) | — |
| Total distributions to shareholders | $ (46,779,540) | $ (36,196,391) |
| Tax return of capital to shareholders: | | |
| Class A | $ — | $ (339,864) |
| Class C | — | (38,238) |
| Class I | — | (804,758) |
| Total tax return of capital to shareholders | $ — | $ (1,182,860) |
| Transactions in shares of beneficial interest: | | |
| Class A | $ 24,012,527 | $ (15,056,064) |
| Class C | (4,149,680) | (5,218,614) |
| Class I | 145,523,571 | 60,820,323 |
| Class R6(1) | 58,314 | — |
| Net increase in net assets from Fund share transactions | $165,444,732 | $ 40,545,645 |
| Net increase (decrease) in net assets | $161,606,648 | $ (59,652,151) |
| Net Assets | | |
| At beginning of year | $ 683,552,431 | $ 743,204,582 |
| At end of year | $845,159,079 | $683,552,431 |
| (1) | For the period from the commencement of operations, June 30, 2023, to October 31, 2023. |
9
See Notes to Financial Statements.
Eaton Vance
High Income Opportunities Fund
October 31, 2023
| | Class A |
| | Year Ended October 31, |
| | 2023 | 2022 | 2021 | 2020 | 2019 |
| Net asset value — Beginning of year | $ 3.920 | $ 4.520 | $ 4.210 | $ 4.400 | $ 4.330 |
| Income (Loss) From Operations | | | | | |
| Net investment income(1) | $ 0.228 | $ 0.185 | $ 0.196 | $ 0.206 | $ 0.227 |
| Net realized and unrealized gain (loss) | 0.005 (2) | (0.565) | 0.340 | (0.157) | 0.081 |
| Total income (loss) from operations | $ 0.233 | $ (0.380) | $ 0.536 | $ 0.049 | $ 0.308 |
| Less Distributions | | | | | |
| From net investment income | $ (0.233) | $ (0.213) | $ (0.179) | $ (0.207) | $ (0.238) |
| Tax return of capital | — | (0.007) | (0.047) | (0.032) | — |
| Total distributions | $ (0.233) | $ (0.220) | $ (0.226) | $ (0.239) | $ (0.238) |
| Net asset value — End of year | $ 3.920 | $ 3.920 | $ 4.520 | $ 4.210 | $ 4.400 |
| Total Return(3) | 5.94% | (8.59)% | 12.93% | 1.26% | 7.31% |
| Ratios/Supplemental Data | | | | | |
| Net assets, end of year (000’s omitted) | $212,170 | $188,765 | $233,330 | $226,927 | $269,795 |
| Ratios (as a percentage of average daily net assets):(4) | | | | | |
| Expenses | 0.95% (5) | 0.91% (5) | 0.90% | 0.93% | 0.91% |
| Net investment income | 5.66% | 4.39% | 4.39% | 4.87% | 5.22% |
| Portfolio Turnover of the Portfolio | 29% | 19% | 64% | 67% | 32% |
| (1) | Computed using average shares outstanding. |
| (2) | The per share amount is not in accord with the net realized and unrealized gain (loss) for the period because of the timing of Fund share transactions and the amount of the per share realized and unrealized gains and losses at such time. |
| (3) | Returns are historical and are calculated by determining the percentage change in net asset value with all distributions reinvested and do not reflect the effect of sales charges. |
| (4) | Includes the Fund’s share of the Portfolio’s allocated expenses. |
| (5) | Includes a reduction by the investment adviser of a portion of the Portfolio’s adviser fee due to the Portfolio’s investment in the Liquidity Fund (equal to less than 0.01% and less than 0.005% of average daily net assets for the years ended October 31, 2023 and 2022, respectively). |
10
See Notes to Financial Statements.
Eaton Vance
High Income Opportunities Fund
October 31, 2023
Financial Highlights — continued
| | Class C |
| | Year Ended October 31, |
| | 2023 | 2022 | 2021 | 2020 | 2019 |
| Net asset value — Beginning of year | $ 3.920 | $ 4.520 | $ 4.210 | $ 4.400 | $ 4.330 |
| Income (Loss) From Operations | | | | | |
| Net investment income(1) | $ 0.197 | $ 0.153 | $ 0.162 | $ 0.174 | $ 0.195 |
| Net realized and unrealized gain (loss) | 0.015 (2) | (0.566) | 0.341 | (0.159) | 0.080 |
| Total income (loss) from operations | $ 0.212 | $ (0.413) | $ 0.503 | $ 0.015 | $ 0.275 |
| Less Distributions | | | | | |
| From net investment income | $ (0.202) | $ (0.181) | $ (0.153) | $ (0.178) | $ (0.205) |
| Tax return of capital | — | (0.006) | (0.040) | (0.027) | — |
| Total distributions | $ (0.202) | $ (0.187) | $ (0.193) | $ (0.205) | $ (0.205) |
| Net asset value — End of year | $ 3.930 | $ 3.920 | $ 4.520 | $ 4.210 | $ 4.400 |
| Total Return(3) | 5.38% | (9.31)% | 12.09% | 0.45% | 6.49% |
| Ratios/Supplemental Data | | | | | |
| Net assets, end of year (000’s omitted) | $19,686 | $23,724 | $32,926 | $37,680 | $55,246 |
| Ratios (as a percentage of average daily net assets):(4) | | | | | |
| Expenses | 1.70% (5) | 1.66% (5) | 1.65% | 1.68% | 1.67% |
| Net investment income | 4.89% | 3.62% | 3.64% | 4.12% | 4.50% |
| Portfolio Turnover of the Portfolio | 29% | 19% | 64% | 67% | 32% |
| (1) | Computed using average shares outstanding. |
| (2) | The per share amount is not in accord with the net realized and unrealized gain (loss) for the period because of the timing of Fund share transactions and the amount of the per share realized and unrealized gains and losses at such time. |
| (3) | Returns are historical and are calculated by determining the percentage change in net asset value with all distributions reinvested and do not reflect the effect of sales charges. |
| (4) | Includes the Fund’s share of the Portfolio’s allocated expenses. |
| (5) | Includes a reduction by the investment adviser of a portion of the Portfolio’s adviser fee due to the Portfolio’s investment in the Liquidity Fund (equal to less than 0.01% and less than 0.005% of average daily net assets for the years ended October 31, 2023 and 2022, respectively). |
11
See Notes to Financial Statements.
Eaton Vance
High Income Opportunities Fund
October 31, 2023
Financial Highlights — continued
| | Class I |
| | Year Ended October 31, |
| | 2023 | 2022 | 2021 | 2020 | 2019 |
| Net asset value — Beginning of year | $ 3.920 | $ 4.520 | $ 4.220 | $ 4.410 | $ 4.340 |
| Income (Loss) From Operations | | | | | |
| Net investment income(1) | $ 0.238 | $ 0.196 | $ 0.208 | $ 0.216 | $ 0.238 |
| Net realized and unrealized gain (loss) | 0.015 (2) | (0.565) | 0.329 | (0.156) | 0.081 |
| Total income (loss) from operations | $ 0.253 | $ (0.369) | $ 0.537 | $ 0.060 | $ 0.319 |
| Less Distributions | | | | | |
| From net investment income | $ (0.243) | $ (0.224) | $ (0.188) | $ (0.217) | $ (0.249) |
| Tax return of capital | — | (0.007) | (0.049) | (0.033) | — |
| Total distributions | $ (0.243) | $ (0.231) | $ (0.237) | $ (0.250) | $ (0.249) |
| Net asset value — End of year | $ 3.930 | $ 3.920 | $ 4.520 | $ 4.220 | $ 4.410 |
| Total Return(3) | 6.48% | (8.36)% | 12.93% | 1.52% | 7.57% |
| Ratios/Supplemental Data | | | | | |
| Net assets, end of year (000’s omitted) | $613,247 | $471,064 | $476,949 | $534,500 | $549,842 |
| Ratios (as a percentage of average daily net assets):(4) | | | | | |
| Expenses | 0.70% (5) | 0.66% (5) | 0.65% | 0.68% | 0.66% |
| Net investment income | 5.91% | 4.65% | 4.65% | 5.10% | 5.47% |
| Portfolio Turnover of the Portfolio | 29% | 19% | 64% | 67% | 32% |
| (1) | Computed using average shares outstanding. |
| (2) | The per share amount is not in accord with the net realized and unrealized gain (loss) for the period because of the timing of Fund share transactions and the amount of the per share realized and unrealized gains and losses at such time. |
| (3) | Returns are historical and are calculated by determining the percentage change in net asset value with all distributions reinvested. |
| (4) | Includes the Fund’s share of the Portfolio’s allocated expenses. |
| (5) | Includes a reduction by the investment adviser of a portion of the Portfolio’s adviser fee due to the Portfolio’s investment in the Liquidity Fund (equal to less than 0.01% and less than 0.005% of average daily net assets for the years ended October 31, 2023 and 2022, respectively). |
12
See Notes to Financial Statements.
Eaton Vance
High Income Opportunities Fund
October 31, 2023
Financial Highlights — continued
| | Class R6 |
| | Period Ended
October 31,
2023(1) |
| Net asset value — Beginning of period | $ 4.050 |
| Income (Loss) From Operations | |
| Net investment income(2) | $ 0.084 |
| Net realized and unrealized loss | (0.116) |
| Total loss from operations | $(0.032) |
| Less Distributions | |
| From net investment income | $ (0.088) |
| Total distributions | $(0.088) |
| Net asset value — End of period | $ 3.930 |
| Total Return(3) | (0.83)% (4) |
| Ratios/Supplemental Data | |
| Net assets, end of period (000’s omitted) | $ 57 |
| Ratios (as a percentage of average daily net assets):(5) | |
| Expenses | 0.60% (6)(7) |
| Net investment income | 6.18% (6) |
| Portfolio Turnover of the Portfolio | 29% (8) |
| (1) | For the period from the commencement of operations, June 30, 2023, to October 31, 2023. |
| (2) | Computed using average shares outstanding. |
| (3) | Returns are historical and are calculated by determining the percentage change in net asset value with all distributions reinvested. |
| (4) | Not annualized. |
| (5) | Includes the Fund’s share of the Portfolio’s allocated expenses. |
| (6) | Annualized. |
| (7) | Includes a reduction by the investment adviser of a portion of the Portfolio’s adviser fee due to the Portfolio’s investment in the Liquidity Fund (equal to less than 0.01% of average daily net assets for the period ended October 31, 2023). |
| (8) | For the year ended October 31, 2023. |
13
See Notes to Financial Statements.
Eaton Vance
High Income Opportunities Fund
October 31, 2023
Notes to Financial Statements
1 Significant Accounting Policies
Eaton Vance High Income Opportunities Fund (the Fund) is a diversified series of Eaton Vance Mutual Funds Trust (the Trust). The Trust is a Massachusetts business trust registered under the Investment Company Act of 1940, as amended (the 1940 Act), as an open-end management investment company. The Fund offers four classes of shares. Class A shares are generally sold subject to a sales charge imposed at time of purchase. Class C shares are sold at net asset value and are generally subject to a contingent deferred sales charge (see Note 5). Effective November 5, 2020, Class C shares automatically convert to Class A shares eight years after their purchase as described in the Fund’s prospectus. Class I and Class R6 shares are sold at net asset value and are not subject to a sales charge. Each class represents a pro rata interest in the Fund, but votes separately on class-specific matters and (as noted below) is subject to different expenses. Realized and unrealized gains and losses are allocated daily to each class of shares based on the relative net assets of each class to the total net assets of the Fund. Net investment income, other than class-specific expenses, is allocated daily to each class of shares based upon the ratio of the value of each class’s paid shares to the total value of all paid shares. Sub-accounting, recordkeeping and similar administrative fees payable to financial intermediaries, which are a component of transfer and dividend disbursing agent fees on the Statement of Operations, are not allocated to Class R6 shares. Each class of shares differs in its distribution plan and certain other class-specific expenses. The Fund invests all of its investable assets in interests in High Income Opportunities Portfolio (the Portfolio), a Massachusetts business trust, having the same investment objectives and policies as the Fund. The value of the Fund’s investment in the Portfolio reflects the Fund’s proportionate interest in the net assets of the Portfolio (77.2% at October 31, 2023). The performance of the Fund is directly affected by the performance of the Portfolio. The financial statements of the Portfolio, including the portfolio of investments, are included elsewhere in this report and should be read in conjunction with the Fund’s financial statements.
The following is a summary of significant accounting policies of the Fund. The policies are in conformity with accounting principles generally accepted in the United States of America (U.S. GAAP). The Fund is an investment company and follows accounting and reporting guidance in the Financial Accounting Standards Board (FASB) Accounting Standards Codification Topic 946.
A Investment Valuation—Valuation of securities by the Portfolio is discussed in Note 1A of the Portfolio's Notes to Financial Statements, which are included elsewhere in this report.
B Income—The Fund's net investment income or loss consists of the Fund's pro rata share of the net investment income or loss of the Portfolio, less all actual and accrued expenses of the Fund.
C Federal Taxes—The Fund's policy is to comply with the provisions of the Internal Revenue Code applicable to regulated investment companies and to distribute to shareholders each year substantially all of its net investment income, and all or substantially all of its net realized capital gains. Accordingly, no provision for federal income or excise tax is necessary.
As of October 31, 2023, the Fund had no uncertain tax positions that would require financial statement recognition, de-recognition, or disclosure. The Fund files a U.S. federal income tax return annually after its fiscal year-end, which is subject to examination by the Internal Revenue Service for a period of three years from the date of filing.
D Expenses—The majority of expenses of the Trust are directly identifiable to an individual fund. Expenses which are not readily identifiable to a specific fund are allocated taking into consideration, among other things, the nature and type of expense and the relative size of the funds.
E Use of Estimates—The preparation of the financial statements in conformity with U.S. GAAP requires management to make estimates and assumptions that affect the reported amounts of assets and liabilities at the date of the financial statements and the reported amounts of income and expense during the reporting period. Actual results could differ from those estimates.
F Indemnifications—Under the Trust’s organizational documents, its officers and Trustees may be indemnified against certain liabilities and expenses arising out of the performance of their duties to the Fund. Under Massachusetts law, if certain conditions prevail, shareholders of a Massachusetts business trust (such as the Trust) could be deemed to have personal liability for the obligations of the Trust. However, the Trust’s Declaration of Trust contains an express disclaimer of liability on the part of Fund shareholders and the By-laws provide that the Trust shall assume, upon request by the shareholder, the defense on behalf of any Fund shareholders. Moreover, the By-laws also provide for indemnification out of Fund property of any shareholder held personally liable solely by reason of being or having been a shareholder for all loss or expense arising from such liability. Additionally, in the normal course of business, the Fund enters into agreements with service providers that may contain indemnification clauses. The Fund’s maximum exposure under these arrangements is unknown as this would involve future claims that may be made against the Fund that have not yet occurred.
G Other—Investment transactions are accounted for on a trade date basis.
Eaton Vance
High Income Opportunities Fund
October 31, 2023
Notes to Financial Statements — continued
2 Distributions to Shareholders and Income Tax Information
The Fund declares dividends daily to shareholders of record at the time of declaration. Distributions are generally paid monthly. Distributions of realized capital gains are made at least annually. Distributions are declared separately for each class of shares. Shareholders may reinvest income and capital gain distributions in additional shares of the same class of the Fund at the net asset value as of the reinvestment date or, at the election of the shareholder, receive distributions in cash. Distributions to shareholders are determined in accordance with income tax regulations, which may differ from U.S. GAAP. As required by U.S. GAAP, only distributions in excess of tax basis earnings and profits are reported in the financial statements as a return of capital. Permanent differences between book and tax accounting relating to distributions are reclassified to paid-in capital. For tax purposes, distributions from short-term capital gains are considered to be from ordinary income.
The tax character of distributions declared for the years ended October 31, 2023 and October 31, 2022 was as follows:
| | Year Ended October 31, |
| | 2023 | 2022 |
| Ordinary income | $46,779,540 | $36,196,391 |
| Tax return of capital | $ — | $ 1,182,860 |
During the year ended October 31, 2023, accumulated loss was decreased by $684,728 and paid-in capital was decreased by $684,728 due to differences between book and tax accounting. These reclassifications had no effect on the net assets or net asset value per share of the Fund.
As of October 31, 2023, the components of distributable earnings (accumulated loss) on a tax basis were as follows:
| Deferred capital losses | $ (8,332,712) |
| Net unrealized depreciation | (57,952,651) |
| Distributions payable | (366,718) |
| Accumulated loss | $(66,652,081) |
At October 31, 2023, the Fund, for federal income tax purposes, had deferred capital losses of $8,332,712 which would reduce its taxable income arising from future net realized gains on investment transactions, if any, to the extent permitted by the Internal Revenue Code, and thus would reduce the amount of distributions to shareholders, which would otherwise be necessary to relieve the Fund of any liability for federal income or excise tax. The deferred capital losses are treated as arising on the first day of the Fund’s next taxable year and retain the same short-term or long-term character as when originally deferred. Of the deferred capital losses at October 31, 2023, $326,900 are short-term and $8,005,812 are long-term.
3 Investment Adviser Fee and Other Transactions with Affiliates
Pursuant to an investment advisory agreement with Eaton Vance Management (EVM), an indirect, wholly-owned subsidiary of Morgan Stanley, the Fund pays an investment adviser fee on its daily net assets that are not invested in other investment companies, and on its daily gross income that is not derived from other investment companies, for which EVM or its affiliates serve as investment adviser and receive an advisory fee at a per annum rate as follows and is payable monthly:
| Total Daily Net Assets | Annual Asset
Rate | Daily Income
Rate |
| Up to $500 million | 0.300% | 3.000% |
| $500 million but less than $1 billion | 0.275% | 2.750% |
| $1 billion but less than $1.5 billion | 0.250% | 2.500% |
| $1.5 billion but less than $2 billion | 0.225% | 2.250% |
| $2 billion but less than $3 billion | 0.200% | 2.000% |
| $3 billion and over | 0.175% | 1.750% |
For the year ended October 31, 2023, the Fund incurred no investment adviser fee on such assets. Pursuant to an investment sub-advisory agreement, EVM has delegated a portion of the investment management of the Fund to Eaton Vance Advisers International Ltd. (EVAIL), an affiliate of EVM. EVM pays EVAIL a portion of its investment adviser fee for sub-advisory services provided to the Fund. To the extent that the Fund’s assets are invested in the
Eaton Vance
High Income Opportunities Fund
October 31, 2023
Notes to Financial Statements — continued
Portfolio, the Fund is allocated its share of the Portfolio’s investment adviser fee. The Portfolio has engaged Boston Management and Research (BMR) to render investment advisory services. See Note 2 of the Portfolio’s Notes to Financial Statements which are included elsewhere in this report. EVM also serves as the administrator of the Fund, but receives no compensation.
EVM provides sub-transfer agency and related services to the Fund pursuant to a Sub-Transfer Agency Support Services Agreement. For the year ended October 31, 2023, EVM earned $69,126 from the Fund pursuant to such agreement, which is included in transfer and dividend disbursing agent fees on the Statement of Operations. The Fund was informed that Eaton Vance Distributors, Inc. (EVD), an affiliate of EVM and the Fund's principal underwriter, received $8,995 as its portion of the sales charge on sales of Class A shares for the year ended October 31, 2023. The Fund was informed that Morgan Stanley affiliated broker-dealers, which may be deemed to be affiliates of EVM, BMR and EVD, also received a portion of the sales charge on sales of Class A Fund shares for the year ended October 31, 2023 in the amount of $3,384. EVD also received distribution and service fees from Class A and Class C shares (see Note 4) and contingent deferred sales charges (see Note 5).
Trustees and officers of the Fund who are members of EVM’s or BMR's organizations receive remuneration for their services to the Fund out of the investment adviser fee. Certain officers and Trustees of the Fund and the Portfolio are officers of the above organizations.
4 Distribution Plans
The Fund has in effect a distribution plan for Class A shares (Class A Plan) pursuant to Rule 12b-1 under the 1940 Act. Pursuant to the Class A Plan, the Fund pays EVD a distribution and service fee of 0.25% per annum of its average daily net assets attributable to Class A shares for distribution services and facilities provided to the Fund by EVD, as well as for personal services and/or the maintenance of shareholder accounts. Distribution and service fees paid or accrued to EVD for the year ended October 31, 2023 amounted to $510,170 for Class A shares.
The Fund also has in effect a distribution plan for Class C shares (Class C Plan) pursuant to Rule 12b-1 under the 1940 Act. Pursuant to the Class C Plan, the Fund pays EVD amounts equal to 0.75% per annum of its average daily net assets attributable to Class C shares for providing ongoing distribution services and facilities to the Fund. For the year ended October 31, 2023, the Fund paid or accrued to EVD $175,462 for Class C shares.
Pursuant to the Class C Plan, the Fund also makes payments of service fees to EVD, financial intermediaries and other persons in amounts equal to 0.25% per annum of its average daily net assets attributable to that class. Service fees paid or accrued are for personal services and/or the maintenance of shareholder accounts. They are separate and distinct from the sales commissions and distribution fees payable to EVD. Service fees paid or accrued for the year ended October 31, 2023 amounted to $58,488 for Class C shares.
Distribution and service fees are subject to the limitations contained in the Financial Industry Regulatory Authority Rule 2341(d).
5 Contingent Deferred Sales Charges
A contingent deferred sales charge (CDSC) of 1% generally is imposed on redemptions of Class C shares made within 12 months of purchase. Class A shares may be subject to a 0.75% CDSC if redeemed within 12 months of purchase (depending on the circumstances of purchase). Generally, the CDSC is based upon the lower of the net asset value at date of redemption or date of purchase. No charge is levied on shares acquired by reinvestment of dividends or capital gain distributions. For the year ended October 31, 2023, the Fund was informed that EVD received $7,822 and $4,992 of CDSCs paid by Class A and Class C shareholders, respectively.
6 Investment Transactions
For the year ended October 31, 2023, increases and decreases in the Fund's investment in the Portfolio aggregated $290,329,396 and $177,838,991, respectively.
Eaton Vance
High Income Opportunities Fund
October 31, 2023
Notes to Financial Statements — continued
7 Shares of Beneficial Interest
The Fund’s Declaration of Trust permits the Trustees to issue an unlimited number of full and fractional shares of beneficial interest (without par value). Such shares may be issued in a number of different series (such as the Fund) and classes. Transactions in Fund shares, including direct exchanges pursuant to share class conversions, were as follows:
| | Year Ended
October 31, 2023 | | Year Ended
October 31, 2022 |
| | Shares | Amount | | Shares | Amount |
| Class A | | | | | |
| Sales | 25,909,705 | $ 104,607,632 | | 12,855,827 | $ 54,485,167 |
| Issued to shareholders electing to receive payments of distributions in Fund shares | 2,452,890 | 9,865,718 | | 2,136,365 | 8,927,869 |
| Redemptions | (22,445,803) | (90,460,823) | | (18,460,061) | (78,469,100) |
| Net increase (decrease) | 5,916,792 | $ 24,012,527 | | (3,467,869) | $ (15,056,064) |
| Class C | | | | | |
| Sales | 1,473,897 | $ 5,930,345 | | 1,179,357 | $ 4,855,528 |
| Issued to shareholders electing to receive payments of distributions in Fund shares | 273,882 | 1,104,020 | | 277,417 | 1,162,686 |
| Redemptions | (2,784,572) | (11,184,045) | | (2,691,624) | (11,236,828) |
| Net decrease | (1,036,793) | $ (4,149,680) | | (1,234,850) | $ (5,218,614) |
| Class I | | | | | |
| Sales | 96,969,296 | $ 390,540,736 | | 59,543,964 | $ 249,072,640 |
| Issued to shareholders electing to receive payments of distributions in Fund shares | 7,887,486 | 31,778,945 | | 5,662,096 | 23,620,177 |
| Redemptions | (68,760,238) | (276,796,110) | | (50,556,729) | (211,872,494) |
| Net increase | 36,096,544 | $ 145,523,571 | | 14,649,331 | $ 60,820,323 |
| Class R6(1) | | | | | |
| Sales | 14,194 | $ 57,225 | | — | $ — |
| Issued to shareholders electing to receive payments of distributions in Fund shares | 272 | 1,092 | | — | — |
| Redemptions | (1) | (3) | | — | — |
| Net increase | 14,465 | $ 58,314 | | — | $ — |
| (1) | For the period from the commencement of operations, June 30, 2023, to October 31, 2023. |
Eaton Vance
High Income Opportunities Fund
October 31, 2023
Report of Independent Registered Public Accounting Firm
To the Trustees of Eaton Vance Mutual Funds Trust and Shareholders of Eaton Vance High Income Opportunities Fund:
Opinion on the Financial Statements and Financial Highlights
We have audited the accompanying statement of assets and liabilities of Eaton Vance High Income Opportunities Fund (the “Fund") (one of the funds constituting Eaton Vance Mutual Funds Trust), as of October 31, 2023, the related statement of operations for the year then ended, the statements of changes in net assets for each of the two years in the period then ended, the financial highlights for each of the five years in the period then ended, and the related notes. In our opinion, the financial statements and financial highlights present fairly, in all material respects, the financial position of the Fund as of October 31, 2023, and the results of its operations for the year then ended, the changes in its net assets for each of the two years in the period then ended, and the financial highlights for each of the five years in the period then ended, in conformity with accounting principles generally accepted in the United States of America.
Basis for Opinion
These financial statements and financial highlights are the responsibility of the Fund's management. Our responsibility is to express an opinion on the Fund's financial statements and financial highlights based on our audits. We are a public accounting firm registered with the Public Company Accounting Oversight Board (United States) (PCAOB) and are required to be independent with respect to the Fund in accordance with the U.S. federal securities laws and the applicable rules and regulations of the Securities and Exchange Commission and the PCAOB.
We conducted our audits in accordance with the standards of the PCAOB. Those standards require that we plan and perform the audit to obtain reasonable assurance about whether the financial statements and financial highlights are free of material misstatement, whether due to error or fraud. The Fund is not required to have, nor were we engaged to perform, an audit of its internal control over financial reporting. As part of our audits, we are required to obtain an understanding of internal control over financial reporting but not for the purpose of expressing an opinion on the effectiveness of the Fund’s internal control over financial reporting. Accordingly, we express no such opinion.
Our audits included performing procedures to assess the risks of material misstatement of the financial statements and financial highlights, whether due to error or fraud, and performing procedures that respond to those risks. Such procedures included examining, on a test basis, evidence regarding the amounts and disclosures in the financial statements and financial highlights. Our audits also included evaluating the accounting principles used and significant estimates made by management, as well as evaluating the overall presentation of the financial statements and financial highlights. We believe that our audits provide a reasonable basis for our opinion.
/s/ Deloitte & Touche LLP
Boston, Massachusetts
December 22, 2023
We have served as the auditor of one or more Eaton Vance investment companies since 1959.
Eaton Vance
High Income Opportunities Fund
October 31, 2023
Federal Tax Information (Unaudited)
The Form 1099-DIV you receive in February 2024 will show the tax status of all distributions paid to your account in calendar year 2023. Shareholders are advised to consult their own tax adviser with respect to the tax consequences of their investment in the Fund. As required by the Internal Revenue Code and/or regulations, shareholders must be notified regarding the status of qualified dividend income for individuals, the dividends received deduction for corporations and 163(j) interest dividends.
Qualified Dividend Income. For the fiscal year ended October 31, 2023, the Fund designates approximately $303,872, or up to the maximum amount of such dividends allowable pursuant to the Internal Revenue Code, as qualified dividend income eligible for the reduced tax rate of 15%.
Dividends Received Deduction. Corporate shareholders are generally entitled to take the dividends received deduction on the portion of the Fund’s dividend distribution that qualifies under tax law. For the Fund’s fiscal 2023 ordinary income dividends, 0.68% qualifies for the corporate dividends received deduction.
163(j) Interest Dividends. For the fiscal year ended October 31, 2023, the Fund designates 99.32% of distributions from net investment income as a 163(j) interest dividend.
High Income Opportunities Portfolio
October 31, 2023
| Asset-Backed Securities — 1.7% |
| Security | Principal
Amount
(000's omitted) | Value |
| Ares LVlll CLO, Ltd., Series 2020-58A, Class ER, 12.094%, (3 mo. SOFR + 6.70%), 1/15/35(1)(2) | $ | 2,000 | $ 1,822,554 |
| Atlas Senior Loan Fund XX, Ltd., Series 2022-20A, Class B1, 8.547%, (3 mo. SOFR + 3.15%), 10/19/35(1)(2) | | 2,500 | 2,514,620 |
| Benefit Street Partners CLO XVII, Ltd., Series 2019-17A, Class ER, 12.006%, (3 mo. SOFR + 6.612%), 7/15/32(1)(2) | | 1,000 | 958,782 |
| Benefit Street Partners CLO XXV, Ltd., Series 2021-25A, Class E, 12.506%, (3 mo. SOFR + 7.112%), 1/15/35(1)(2) | | 2,000 | 1,896,804 |
| Canyon Capital CLO, Ltd., Series 2022-1A, Class E, 11.803%, (3 mo. SOFR + 6.40%), 4/15/35(1)(2) | | 2,000 | 1,811,636 |
| Carlyle US CLO, Ltd., Series 2019-4A, Class DR, 11.994%, (3 mo. SOFR + 6.60%), 4/15/35(1)(2) | | 2,000 | 1,772,646 |
| Golub Capital Partners CLO 50B-R, Ltd., Series 2020-50A, Class ER, 12.516%, (3 mo. SOFR + 7.10%), 4/20/35(1)(2) | | 2,000 | 1,843,070 |
| Madison Park Funding LIX, Ltd., Series 2021-59A, Class E, 12.257%, (3 mo. SOFR + 6.862%), 1/18/34(1)(2) | | 2,000 | 1,868,022 |
| Madison Park Funding XXXVII, Ltd., Series 2019-37A, Class ER, 11.806%, (3 mo. SOFR + 6.412%), 7/15/33(1)(2) | | 1,000 | 970,182 |
| Wellfleet CLO, Ltd.: | | | |
| Series 2021-2A, Class E, 12.616%, (3 mo. SOFR + 7.222%), 7/15/34(1)(2) | | 2,000 | 1,657,774 |
| Series 2021-3A, Class E, 12.756%, (3 mo. SOFR + 7.362%), 1/15/35(1)(2) | | 2,000 | 1,684,756 |
Total Asset-Backed Securities
(identified cost $20,415,091) | | | $ 18,800,846 |
| Security | Shares | Value |
| Diversified Media — 0.1% |
| National CineMedia, Inc.(3) | | 214,423 | $ 838,394 |
| | | | $ 838,394 |
| Energy — 0.1% |
| Ascent CNR Corp., Class A(3)(4)(5) | | 6,273,462 | $ 1,380,162 |
| | | | $ 1,380,162 |
| Environmental — 0.3% |
| GFL Environmental, Inc. | | 105,500 | $ 3,040,510 |
| | | | $ 3,040,510 |
| Security | Shares | Value |
| Gaming — 0.0% |
| New Cotai Participation Corp., Class B(3)(4)(5) | | 7 | $ 0 |
| | | | $ 0 |
| Leisure — 0.0% |
| iFIT Health and Fitness, Inc.(3)(4)(5) | | 514,080 | $ 0 |
| | | | $ 0 |
Total Common Stocks
(identified cost $4,989,091) | | | $ 5,259,066 |
| Security | Principal
Amount
(000's omitted) | Value |
| Containers — 0.3% |
| CryoPort, Inc., 0.75%, 12/1/26(1) | $ | 4,643 | $ 3,659,151 |
| | | | $ 3,659,151 |
| Leisure — 0.2% |
| Peloton Interactive, Inc., 0.00%, 2/15/26 | $ | 3,289 | $ 2,442,332 |
| | | | $ 2,442,332 |
| Utility — 0.3% |
| NextEra Energy Partners, L.P., 2.50%, 6/15/26(1) | $ | 3,136 | $ 2,718,912 |
| | | | $ 2,718,912 |
Total Convertible Bonds
(identified cost $9,641,016) | | | $ 8,820,395 |
| Security | Principal
Amount*
(000's omitted) | Value |
| Aerospace — 2.9% |
| Bombardier, Inc.: | | | |
| 7.125%, 6/15/26(1) | | 2,033 | $ 1,958,605 |
| 7.875%, 4/15/27(1) | | 1,357 | 1,307,263 |
| BWX Technologies, Inc.: | | | |
| 4.125%, 6/30/28(1) | | 1,501 | 1,322,569 |
| 4.125%, 4/15/29(1) | | 1,016 | 869,853 |
| Moog, Inc., 4.25%, 12/15/27(1) | | 2,796 | 2,492,378 |
| Rolls-Royce PLC, 5.75%, 10/15/27(1) | | 4,991 | 4,735,510 |
| Science Applications International Corp., 4.875%, 4/1/28(1) | | 3,792 | 3,387,722 |
High Income Opportunities Portfolio
October 31, 2023
Portfolio of Investments — continued
| Security | Principal
Amount*
(000's omitted) | Value |
| Aerospace (continued) |
| Spirit AeroSystems, Inc.: | | | |
| 4.60%, 6/15/28 | | 1,081 | $ 856,256 |
| 9.375%, 11/30/29(1) | | 403 | 414,357 |
| TransDigm, Inc.: | | | |
| 4.625%, 1/15/29 | | 1,677 | 1,447,871 |
| 5.50%, 11/15/27 | | 3,914 | 3,647,709 |
| 6.25%, 3/15/26(1) | | 4,436 | 4,337,985 |
| 6.75%, 8/15/28(1) | | 3,504 | 3,406,706 |
| 7.50%, 3/15/27 | | 1,705 | 1,704,669 |
| | | | $ 31,889,453 |
| Air Transportation — 1.0% |
| American Airlines, Inc., 7.25%, 2/15/28(1) | | 908 | $ 845,368 |
| American Airlines, Inc./AAdvantage Loyalty IP, Ltd., 5.50%, 4/20/26(1) | | 2,317 | 2,255,121 |
| United Airlines, Inc.: | | | |
| 4.375%, 4/15/26(1) | | 1,156 | 1,073,473 |
| 4.625%, 4/15/29(1) | | 1,799 | 1,521,240 |
| VistaJet Malta Finance PLC/Vista Management Holding, Inc.: | | | |
| 6.375%, 2/1/30(1) | | 5,300 | 3,540,201 |
| 9.50%, 6/1/28(1) | | 1,892 | 1,451,650 |
| | | | $ 10,687,053 |
| Automotive & Auto Parts — 2.7% |
| Ford Motor Co.: | | | |
| 3.25%, 2/12/32 | | 6,249 | $ 4,721,331 |
| 4.75%, 1/15/43 | | 2,651 | 1,844,822 |
| 6.10%, 8/19/32 | | 2,830 | 2,619,743 |
| 7.45%, 7/16/31 | | 794 | 801,866 |
| 9.625%, 4/22/30 | | 350 | 390,652 |
| Ford Motor Credit Co., LLC: | | | |
| 2.90%, 2/16/28 | | 568 | 483,774 |
| 3.37%, 11/17/23 | | 881 | 880,744 |
| 3.625%, 6/17/31 | | 2,065 | 1,633,519 |
| 3.815%, 11/2/27 | | 4,294 | 3,832,800 |
| 4.00%, 11/13/30 | | 1,461 | 1,204,620 |
| 4.125%, 8/17/27 | | 6,184 | 5,621,057 |
| 4.271%, 1/9/27 | | 752 | 696,569 |
| 5.584%, 3/18/24 | | 403 | 401,522 |
| Goodyear Tire & Rubber Co. (The), 5.00%, 7/15/29 | | 1,995 | 1,718,758 |
| Real Hero Merger Sub 2, Inc., 6.25%, 2/1/29(1) | | 2,806 | 2,234,937 |
| Wheel Pros, Inc., 6.50%, 5/15/29(1) | | 2,705 | 823,775 |
| | | | $ 29,910,489 |
| Security | Principal
Amount*
(000's omitted) | Value |
| Banking & Thrifts — 0.2% |
| JPMorgan Chase & Co., Series HH, 4.60% to 2/1/25(6)(7) | | 2,385 | $ 2,227,980 |
| | | | $ 2,227,980 |
| Broadcasting — 0.6% |
| Audacy Capital Corp., 6.75%, 3/31/29(1)(8) | | 2,316 | $ 39,418 |
| Playtika Holding Corp., 4.25%, 3/15/29(1) | | 2,349 | 1,896,958 |
| Townsquare Media, Inc., 6.875%, 2/1/26(1) | | 2,038 | 1,885,727 |
| Univision Communications, Inc.: | | | |
| 4.50%, 5/1/29(1) | | 1,183 | 941,673 |
| 7.375%, 6/30/30(1) | | 1,804 | 1,590,214 |
| | | | $ 6,353,990 |
| Building Materials — 2.2% |
| AmeriTex HoldCo Intermediate, LLC, 10.25%, 10/15/28(1) | | 3,920 | $ 3,711,260 |
| Builders FirstSource, Inc.: | | | |
| 4.25%, 2/1/32(1) | | 3,014 | 2,402,315 |
| 5.00%, 3/1/30(1) | | 2,685 | 2,346,133 |
| MIWD Holdco II, LLC/MIWD Finance Corp., 5.50%, 2/1/30(1) | | 2,234 | 1,775,382 |
| PGT Innovations, Inc., 4.375%, 10/1/29(1) | | 3,160 | 2,953,020 |
| Smyrna Ready Mix Concrete, LLC, 6.00%, 11/1/28(1) | | 5,000 | 4,627,634 |
| Standard Industries, Inc.: | | | |
| 2.25%, 11/21/26(9) | EUR | 2,443 | 2,274,736 |
| 3.375%, 1/15/31(1) | | 863 | 654,069 |
| 4.375%, 7/15/30(1) | | 2,932 | 2,398,325 |
| 5.00%, 2/15/27(1) | | 690 | 638,551 |
| | | | $ 23,781,425 |
| Cable & Satellite TV — 1.8% |
| CCO Holdings, LLC/CCO Holdings Capital Corp.: | | | |
| 4.50%, 8/15/30(1) | | 5,982 | $ 4,804,535 |
| 4.50%, 5/1/32 | | 2,500 | 1,915,755 |
| 4.75%, 3/1/30(1) | | 4,255 | 3,516,131 |
| 4.75%, 2/1/32(1) | | 1,825 | 1,426,292 |
| 5.00%, 2/1/28(1) | | 1,895 | 1,703,060 |
| 5.375%, 6/1/29(1) | | 868 | 760,923 |
| 6.375%, 9/1/29(1) | | 3,715 | 3,403,527 |
| DISH Network Corp., 11.75%, 11/15/27(1) | | 2,454 | 2,432,871 |
| | | | $ 19,963,094 |
| Capital Goods — 1.6% |
| Calderys Financing, LLC, 11.25%, 6/1/28(1) | | 2,992 | $ 3,021,920 |
| Chart Industries, Inc., 9.50%, 1/1/31(1) | | 4,038 | 4,163,885 |
High Income Opportunities Portfolio
October 31, 2023
Portfolio of Investments — continued
| Security | Principal
Amount*
(000's omitted) | Value |
| Capital Goods (continued) |
| Dornoch Debt Merger Sub, Inc., 6.625%, 10/15/29(1) | | 3,255 | $ 2,564,207 |
| Emerald Debt Merger Sub, LLC, 6.625%, 12/15/30(1) | | 748 | 712,470 |
| Madison IAQ, LLC, 5.875%, 6/30/29(1) | | 4,701 | 3,646,920 |
| Patrick Industries, Inc.: | | | |
| 4.75%, 5/1/29(1) | | 3,142 | 2,556,016 |
| 7.50%, 10/15/27(1) | | 415 | 395,750 |
| | | | $ 17,061,168 |
| Chemicals — 3.1% |
| ASP Unifrax Holdings, Inc., 5.25%, 9/30/28(1) | | 2,220 | $ 1,502,067 |
| Avient Corp., 7.125%, 8/1/30(1) | | 3,581 | 3,449,081 |
| Compass Minerals International, Inc., 6.75%, 12/1/27(1) | | 5,435 | 5,124,662 |
| Herens Holdco S.a.r.l., 4.75%, 5/15/28(1) | | 2,171 | 1,683,682 |
| Herens Midco S.a.r.l., 5.25%, 5/15/29(9) | EUR | 3,000 | 1,808,025 |
| NOVA Chemicals Corp.: | | | |
| 4.25%, 5/15/29(1) | | 2,428 | 1,798,057 |
| 4.875%, 6/1/24(1) | | 2,442 | 2,402,498 |
| Nufarm Australia, Ltd./Nufarm Americas, Inc., 5.00%, 1/27/30(1) | | 3,643 | 3,164,382 |
| Olympus Water US Holding Corp., 9.75%, 11/15/28(1) | | 4,100 | 4,009,599 |
| SNF Group SACA: | | | |
| 2.625%, 2/1/29(9) | EUR | 2,960 | 2,745,278 |
| 2.625%, 2/1/29(1) | EUR | 250 | 231,865 |
| Valvoline, Inc., 3.625%, 6/15/31(1) | | 2,654 | 2,020,848 |
| W.R. Grace Holdings, LLC: | | | |
| 4.875%, 6/15/27(1) | | 1,829 | 1,645,383 |
| 7.375%, 3/1/31(1) | | 2,211 | 2,051,565 |
| | | | $ 33,636,992 |
| Consumer Products — 1.1% |
| Acushnet Co., 7.375%, 10/15/28(1) | | 1,620 | $ 1,624,512 |
| CD&R Smokey Buyer, Inc., 6.75%, 7/15/25(1) | | 1,545 | 1,478,086 |
| Edgewell Personal Care Co., 4.125%, 4/1/29(1) | | 2,936 | 2,459,238 |
| Energizer Gamma Acquisition B.V., 3.50%, 6/30/29(9) | EUR | 2,600 | 2,178,829 |
| Spectrum Brands, Inc., 3.875%, 3/15/31(1) | | 1,773 | 1,421,006 |
| Tempur Sealy International, Inc., 3.875%, 10/15/31(1) | | 3,954 | 2,966,206 |
| | | | $ 12,127,877 |
| Containers — 2.0% |
| Ardagh Metal Packaging Finance USA, LLC/Ardagh Metal Packaging Finance PLC: | | | |
| 3.00%, 9/1/29(9) | EUR | 1,150 | $ 901,138 |
| 4.00%, 9/1/29(1) | | 2,256 | 1,695,100 |
| Security | Principal
Amount*
(000's omitted) | Value |
| Containers (continued) |
| Ball Corp.: | | | |
| 3.125%, 9/15/31 | | 3,800 | $ 2,946,704 |
| 6.875%, 3/15/28 | | 989 | 987,119 |
| Berry Global, Inc., 5.625%, 7/15/27(1) | | 2,026 | 1,936,050 |
| Canpack S.A./Canpack US, LLC, 3.875%, 11/15/29(1) | | 3,826 | 3,008,460 |
| Crown Americas, LLC/Crown Americas Capital Corp. V, 4.25%, 9/30/26 | | 2,415 | 2,285,797 |
| Owens-Brockway Glass Container, Inc., 7.25%, 5/15/31(1) | | 4,733 | 4,336,611 |
| Sealed Air Corp./Sealed Air Corp. US, 6.125%, 2/1/28(1) | | 467 | 445,081 |
| Trivium Packaging Finance B.V.: | | | |
| 5.50%, 8/15/26(1) | | 2,613 | 2,372,797 |
| 8.50%, 8/15/27(1) | | 1,500 | 1,253,883 |
| | | | $ 22,168,740 |
| Diversified Financial Services — 3.2% |
| AG TTMT Escrow Issuer, LLC, 8.625%, 9/30/27(1) | | 3,011 | $ 3,027,922 |
| Ally Financial, Inc., Series B, 4.70% to 5/15/26(6)(7) | | 3,182 | 2,075,376 |
| Cargo Aircraft Management, Inc., 4.75%, 2/1/28(1) | | 3,714 | 3,282,006 |
| Compass Group Diversified Holdings, LLC, 5.25%, 4/15/29(1) | | 3,332 | 2,848,787 |
| GTCR W-2 Merger Sub, LLC, 7.50%, 1/15/31(1) | | 2,784 | 2,751,288 |
| Jane Street Group/JSG Finance, Inc., 4.50%, 11/15/29(1) | | 3,591 | 3,064,108 |
| Jefferson Capital Holdings, LLC, 6.00%, 8/15/26(1) | | 3,288 | 2,874,820 |
| Macquarie Airfinance Holdings, Ltd., 8.125%, 3/30/29(1) | | 1,695 | 1,671,278 |
| MSCI, Inc.: | | | |
| 3.625%, 9/1/30(1) | | 867 | 718,422 |
| 3.875%, 2/15/31(1) | | 2,176 | 1,798,208 |
| Oxford Finance, LLC/Oxford Finance Co-Issuer II, Inc., 6.375%, 2/1/27(1) | | 2,769 | 2,526,159 |
| PRA Group, Inc., 7.375%, 9/1/25(1) | | 1,906 | 1,784,064 |
| PROG Holdings, Inc., 6.00%, 11/15/29(1) | | 1,660 | 1,408,809 |
| Rocket Mortgage, LLC/Rocket Mortgage Co.-Issuer, Inc.: | | | |
| 2.875%, 10/15/26(1) | | 2,036 | 1,774,801 |
| 3.625%, 3/1/29(1) | | 3,127 | 2,545,388 |
| 4.00%, 10/15/33(1) | | 425 | 312,872 |
| | | | $ 34,464,308 |
| Diversified Media — 1.7% |
| Arches Buyer, Inc.: | | | |
| 4.25%, 6/1/28(1) | | 1,226 | $ 1,016,757 |
| 6.125%, 12/1/28(1) | | 4,809 | 3,889,111 |
High Income Opportunities Portfolio
October 31, 2023
Portfolio of Investments — continued
| Security | Principal
Amount*
(000's omitted) | Value |
| Diversified Media (continued) |
| Cars.com, Inc., 6.375%, 11/1/28(1) | | 3,521 | $ 3,137,616 |
| Clear Channel Outdoor Holdings, Inc., 7.75%, 4/15/28(1) | | 4,167 | 3,189,923 |
| Match Group Holdings II, LLC, 3.625%, 10/1/31(1) | | 4,396 | 3,377,842 |
| Stagwell Global, LLC, 5.625%, 8/15/29(1) | | 2,447 | 2,025,235 |
| Urban One, Inc., 7.375%, 2/1/28(1) | | 2,139 | 1,760,751 |
| | | | $ 18,397,235 |
| Energy — 9.5% |
| Aethon United BR, L.P./Aethon United Finance Corp., 8.25%, 2/15/26(1) | | 3,039 | $ 3,021,283 |
| Antero Midstream Partners, L.P./Antero Midstream Finance Corp.: | | | |
| 5.75%, 3/1/27(1) | | 3,242 | 3,101,711 |
| 7.875%, 5/15/26(1) | | 1,283 | 1,293,345 |
| Callon Petroleum Co.: | | | |
| 7.50%, 6/15/30(1) | | 1,157 | 1,121,884 |
| 8.00%, 8/1/28(1) | | 3,002 | 2,969,943 |
| Cheniere Energy Partners, L.P.: | | | |
| 4.00%, 3/1/31 | | 2,552 | 2,139,217 |
| 4.50%, 10/1/29 | | 1,896 | 1,699,134 |
| Chord Energy Corp., 6.375%, 6/1/26(1) | | 1,560 | 1,533,082 |
| Civitas Resources, Inc., 8.625%, 11/1/30(1) | | 971 | 989,338 |
| CrownRock, L.P./CrownRock Finance, Inc., 5.00%, 5/1/29(1) | | 2,637 | 2,489,592 |
| CVR Energy, Inc., 5.75%, 2/15/28(1) | | 4,038 | 3,631,797 |
| DT Midstream, Inc., 4.125%, 6/15/29(1) | | 2,690 | 2,315,455 |
| Energy Transfer, L.P., 5.00%, 5/15/50 | | 2,087 | 1,566,217 |
| EQM Midstream Partners, L.P.: | | | |
| 4.50%, 1/15/29(1) | | 2,111 | 1,853,344 |
| 4.75%, 1/15/31(1) | | 2,377 | 2,004,055 |
| 6.00%, 7/1/25(1) | | 410 | 401,348 |
| 6.50%, 7/1/27(1) | | 1,121 | 1,090,704 |
| 7.50%, 6/1/30(1) | | 1,881 | 1,847,501 |
| Kinetik Holdings, L.P., 5.875%, 6/15/30(1) | | 4,659 | 4,279,429 |
| Nabors Industries, Ltd., 7.50%, 1/15/28(1) | | 1,118 | 988,424 |
| Neptune Energy Bondco PLC, 6.625%, 5/15/25(1) | | 5,066 | 5,020,019 |
| New Fortress Energy, Inc., 6.50%, 9/30/26(1) | | 3,895 | 3,492,361 |
| Occidental Petroleum Corp.: | | | |
| 8.50%, 7/15/27 | | 3,859 | 4,115,180 |
| 8.875%, 7/15/30 | | 3,417 | 3,797,620 |
| Parkland Corp.: | | | |
| 4.50%, 10/1/29(1) | | 2,371 | 2,041,621 |
| 4.625%, 5/1/30(1) | | 2,389 | 2,039,238 |
| Security | Principal
Amount*
(000's omitted) | Value |
| Energy (continued) |
| Permian Resources Operating, LLC: | | | |
| 5.875%, 7/1/29(1) | | 4,333 | $ 4,036,844 |
| 7.00%, 1/15/32(1) | | 2,551 | 2,475,383 |
| 7.75%, 2/15/26(1) | | 1,675 | 1,675,306 |
| Plains All American Pipeline, L.P., Series B, 9.736%, (3 mo. SOFR + 4.372%)(2)(6) | | 4,050 | 3,826,088 |
| Precision Drilling Corp.: | | | |
| 6.875%, 1/15/29(1) | | 1,307 | 1,211,436 |
| 7.125%, 1/15/26(1) | | 1,095 | 1,079,966 |
| Seadrill Finance, Ltd., 8.375%, 8/1/30(1) | | 1,026 | 1,027,447 |
| Southwestern Energy Co.: | | | |
| 4.75%, 2/1/32 | | 2,583 | 2,223,853 |
| 5.375%, 2/1/29(9) | | 2,500 | 1,864,575 |
| Sunoco, L.P./Sunoco Finance Corp., 4.50%, 4/30/30 | | 2,000 | 1,710,338 |
| Superior Plus, L.P./Superior General Partner, Inc., 4.50%, 3/15/29(1) | | 2,921 | 2,494,432 |
| Transocean Poseidon, Ltd., 6.875%, 2/1/27(1) | | 1,162 | 1,139,584 |
| Transocean, Inc., 8.75%, 2/15/30(1) | | 1,275 | 1,272,223 |
| Venture Global Calcasieu Pass, LLC: | | | |
| 3.875%, 11/1/33(1) | | 1,117 | 845,254 |
| 4.125%, 8/15/31(1) | | 1,449 | 1,166,491 |
| Venture Global LNG, Inc.: | | | |
| 8.125%, 6/1/28(1) | | 2,233 | 2,169,552 |
| 8.375%, 6/1/31(1) | | 3,572 | 3,411,260 |
| 9.50%, 2/1/29(1) | | 2,297 | 2,335,050 |
| 9.875%, 2/1/32(1) | | 2,312 | 2,345,787 |
| Vital Energy, Inc., 9.75%, 10/15/30 | | 2,151 | 2,110,102 |
| Weatherford International, Ltd., 8.625%, 4/30/30(1) | | 2,338 | 2,364,662 |
| Western Midstream Operating, L.P.: | | | |
| 4.50%, 3/1/28 | | 224 | 207,075 |
| 4.75%, 8/15/28 | | 224 | 208,591 |
| | | | $ 104,044,141 |
| Entertainment & Film — 0.3% |
| Cinemark USA, Inc.: | | | |
| 5.25%, 7/15/28(1) | | 3,166 | $ 2,737,220 |
| 5.875%, 3/15/26(1) | | 588 | 558,925 |
| 8.75%, 5/1/25(1) | | 247 | 249,846 |
| | | | $ 3,545,991 |
| Environmental — 1.7% |
| Clean Harbors, Inc.: | | | |
| 4.875%, 7/15/27(1) | | 1,029 | $ 960,356 |
| 5.125%, 7/15/29(1) | | 1,117 | 1,005,909 |
| 6.375%, 2/1/31(1) | | 585 | 556,734 |
High Income Opportunities Portfolio
October 31, 2023
Portfolio of Investments — continued
| Security | Principal
Amount*
(000's omitted) | Value |
| Environmental (continued) |
| Covanta Holding Corp.: | | | |
| 4.875%, 12/1/29(1) | | 5,189 | $ 4,055,411 |
| 5.00%, 9/1/30 | | 804 | 623,652 |
| GFL Environmental, Inc.: | | | |
| 3.50%, 9/1/28(1) | | 5,074 | 4,350,400 |
| 3.75%, 8/1/25(1) | | 669 | 633,491 |
| 4.75%, 6/15/29(1) | | 7,293 | 6,391,674 |
| | | | $ 18,577,627 |
| Food & Drug Retail — 0.9% |
| Albertsons Cos., Inc./Safeway, Inc./New Albertsons, L.P./Albertsons, LLC: | | | |
| 4.875%, 2/15/30(1) | | 2,492 | $ 2,227,687 |
| 5.875%, 2/15/28(1) | | 1,807 | 1,732,685 |
| Arko Corp., 5.125%, 11/15/29(1) | | 4,001 | 3,248,332 |
| Ingles Markets, Inc., 4.00%, 6/15/31(1) | | 3,410 | 2,715,110 |
| | | | $ 9,923,814 |
| Food, Beverage & Tobacco — 2.3% |
| BellRing Brands, Inc., 7.00%, 3/15/30(1) | | 3,553 | $ 3,454,511 |
| Chobani, LLC/Chobani Finance Corp., Inc.: | | | |
| 4.625%, 11/15/28(1) | | 1,650 | 1,428,152 |
| 7.50%, 4/15/25(1) | | 3,194 | 3,140,465 |
| Darling Ingredients, Inc., 6.00%, 6/15/30(1) | | 3,482 | 3,270,118 |
| Herbalife Nutrition, Ltd./HLF Financing, Inc., 7.875%, 9/1/25(1) | | 2,154 | 2,029,046 |
| Performance Food Group, Inc.: | | | |
| 4.25%, 8/1/29(1) | | 4,485 | 3,789,042 |
| 5.50%, 10/15/27(1) | | 1,504 | 1,407,931 |
| 6.875%, 5/1/25(1) | | 890 | 886,409 |
| Pilgrim's Pride Corp., 3.50%, 3/1/32 | | 3,553 | 2,711,081 |
| US Foods, Inc., 4.75%, 2/15/29(1) | | 3,511 | 3,100,572 |
| | | | $ 25,217,327 |
| Gaming — 3.0% |
| Allwyn Entertainment Financing UK PLC, 7.875%, 4/30/29(1) | | 3,554 | $ 3,521,872 |
| Caesars Entertainment, Inc.: | | | |
| 4.625%, 10/15/29(1) | | 784 | 645,108 |
| 6.25%, 7/1/25(1) | | 4,206 | 4,141,574 |
| 7.00%, 2/15/30(1) | | 1,535 | 1,482,838 |
| 8.125%, 7/1/27(1) | | 2,617 | 2,595,224 |
| CDI Escrow Issuer, Inc., 5.75%, 4/1/30(1) | | 3,852 | 3,445,401 |
| Fertitta Entertainment, LLC/Fertitta Entertainment Finance Co., Inc., 4.625%, 1/15/29(1) | | 1,303 | 1,096,364 |
| Security | Principal
Amount*
(000's omitted) | Value |
| Gaming (continued) |
| International Game Technology PLC: | | | |
| 4.125%, 4/15/26(1) | | 1,237 | $ 1,165,155 |
| 6.25%, 1/15/27(1) | | 1,848 | 1,802,727 |
| 6.50%, 2/15/25(1) | | 1,009 | 1,003,161 |
| Jacobs Entertainment, Inc., 6.75%, 2/15/29(1) | | 3,759 | 3,198,420 |
| Light & Wonder International, Inc., 7.00%, 5/15/28(1) | | 2,834 | 2,765,243 |
| MGM Resorts International: | | | |
| 4.75%, 10/15/28 | | 2,206 | 1,926,938 |
| 5.50%, 4/15/27 | | 779 | 727,494 |
| Raptor Acquisition Corp./Raptor Co.-Issuer, LLC, 4.875%, 11/1/26(1) | | 3,500 | 3,260,302 |
| | | | $ 32,777,821 |
| Healthcare — 8.9% |
| AHP Health Partners, Inc., 5.75%, 7/15/29(1) | | 1,193 | $ 979,382 |
| athenahealth Group, Inc., 6.50%, 2/15/30(1) | | 3,988 | 3,262,467 |
| Avantor Funding, Inc., 3.875%, 7/15/28(9) | EUR | 4,400 | 4,265,731 |
| Bausch & Lomb Escrow Corp., 8.375%, 10/1/28(1) | | 2,780 | 2,764,710 |
| Catalent Pharma Solutions, Inc., 3.50%, 4/1/30(1) | | 3,895 | 3,061,353 |
| Centene Corp.: | | | |
| 3.00%, 10/15/30 | | 2,015 | 1,596,460 |
| 3.375%, 2/15/30 | | 2,589 | 2,143,043 |
| 4.625%, 12/15/29 | | 507 | 453,329 |
| Encompass Health Corp.: | | | |
| 4.625%, 4/1/31 | | 2,543 | 2,119,772 |
| 4.75%, 2/1/30 | | 1,044 | 903,315 |
| Endo DAC/Endo Finance, LLC/Endo Finco, Inc., 5.875%, 10/15/24(1)(8) | | 1,153 | 775,393 |
| Endo Luxembourg Finance Co. I S.a.r.l./Endo US, Inc., 6.125%, 4/1/29(1)(8) | | 2,774 | 1,833,767 |
| Fortrea Holdings, Inc., 7.50%, 7/1/30(1) | | 3,977 | 3,842,776 |
| Grifols Escrow Issuer S.A., 4.75%, 10/15/28(1) | | 4,906 | 4,125,259 |
| HealthEquity, Inc., 4.50%, 10/1/29(1) | | 5,695 | 4,885,452 |
| Heartland Dental, LLC/Heartland Dental Finance Corp., 10.50%, 4/30/28(1) | | 6,200 | 5,966,756 |
| IQVIA, Inc.: | | | |
| 2.25%, 3/15/29(9) | EUR | 1,816 | 1,618,694 |
| 5.00%, 5/15/27(1) | | 1,329 | 1,251,684 |
| 6.50%, 5/15/30(1) | | 1,662 | 1,614,218 |
| Jazz Securities DAC, 4.375%, 1/15/29(1) | | 1,910 | 1,662,719 |
| Legacy LifePoint Health, LLC, 4.375%, 2/15/27(1) | | 587 | 485,936 |
| LifePoint Health, Inc.: | | | |
| 5.375%, 1/15/29(1) | | 4,397 | 2,668,246 |
| 9.875%, 8/15/30(1) | | 1,665 | 1,506,825 |
| Medline Borrower, L.P., 5.25%, 10/1/29(1) | | 7,014 | 5,977,378 |
High Income Opportunities Portfolio
October 31, 2023
Portfolio of Investments — continued
| Security | Principal
Amount*
(000's omitted) | Value |
| Healthcare (continued) |
| ModivCare Escrow Issuer, Inc., 5.00%, 10/1/29(1) | | 1,586 | $ 1,157,463 |
| ModivCare, Inc., 5.875%, 11/15/25(1) | | 2,104 | 1,990,510 |
| Molina Healthcare, Inc.: | | | |
| 3.875%, 11/15/30(1) | | 2,889 | 2,359,720 |
| 3.875%, 5/15/32(1) | | 2,207 | 1,736,808 |
| Option Care Health, Inc., 4.375%, 10/31/29(1) | | 4,735 | 3,962,615 |
| P&L Development, LLC/PLD Finance Corp., 7.75%, 11/15/25(1) | | 3,054 | 2,054,288 |
| Perrigo Finance Unlimited Co.: | | | |
| 4.65%, 6/15/30 | | 4,350 | 3,637,505 |
| 4.90%, 12/15/44 | | 1,242 | 849,731 |
| RegionalCare Hospital Partners Holdings, Inc./LifePoint Health, Inc., 9.75%, 12/1/26(1) | | 1,328 | 1,243,022 |
| Team Health Holdings, Inc., 6.375%, 2/1/25(1) | | 3,962 | 3,143,728 |
| Tenet Healthcare Corp.: | | | |
| 4.375%, 1/15/30 | | 272 | 230,322 |
| 5.125%, 11/1/27 | | 2,855 | 2,638,269 |
| 6.125%, 10/1/28 | | 3,985 | 3,699,594 |
| 6.875%, 11/15/31 | | 1,683 | 1,553,580 |
| US Acute Care Solutions, LLC, 6.375%, 3/1/26(1) | | 5,799 | 4,939,265 |
| Varex Imaging Corp., 7.875%, 10/15/27(1) | | 2,282 | 2,239,336 |
| | | | $ 97,200,421 |
| Homebuilders & Real Estate — 3.4% |
| Ashton Woods USA, LLC/Ashton Woods Finance Co.: | | | |
| 4.625%, 8/1/29(1) | | 1,516 | $ 1,228,181 |
| 4.625%, 4/1/30(1) | | 780 | 604,717 |
| Brundage-Bone Concrete Pumping Holdings, Inc., 6.00%, 2/1/26(1) | | 1,227 | 1,161,392 |
| CTR Partnership, L.P./CareTrust Capital Corp., 3.875%, 6/30/28(1) | | 3,770 | 3,171,665 |
| Cushman & Wakefield US Borrower, LLC, 8.875%, 9/1/31(1) | | 1,762 | 1,672,217 |
| Dycom Industries, Inc., 4.50%, 4/15/29(1) | | 1,923 | 1,661,626 |
| Greystar Real Estate Partners, LLC, 7.75%, 9/1/30(1) | | 3,748 | 3,687,339 |
| HAT Holdings I, LLC/HAT Holdings II, LLC: | | | |
| 3.375%, 6/15/26(1) | | 2,442 | 2,152,216 |
| 3.75%, 9/15/30(1) | | 3,492 | 2,510,515 |
| KB Home: | | | |
| 4.00%, 6/15/31 | | ��� 162 | 126,697 |
| 4.80%, 11/15/29 | | 1,044 | 905,780 |
| M/I Homes, Inc., 4.95%, 2/1/28 | | 1,537 | 1,376,129 |
| MGM Growth Properties Operating Partnership, L.P./MGP Finance Co-Issuer, Inc., 5.625%, 5/1/24 | | 585 | 581,081 |
| National Health Investors, Inc., 3.00%, 2/1/31 | | 3,117 | 2,248,943 |
| Security | Principal
Amount*
(000's omitted) | Value |
| Homebuilders & Real Estate (continued) |
| Outfront Media Capital, LLC/Outfront Media Capital Corp.: | | | |
| 4.625%, 3/15/30(1) | | 1,687 | $ 1,355,445 |
| 6.25%, 6/15/25(1) | | 2,319 | 2,289,340 |
| TopBuild Corp., 4.125%, 2/15/32(1) | | 2,753 | 2,181,546 |
| VICI Properties, L.P./VICI Note Co., Inc.: | | | |
| 3.75%, 2/15/27(1) | | 543 | 489,107 |
| 4.125%, 8/15/30(1) | | 1,859 | 1,535,357 |
| 4.625%, 12/1/29(1) | | 4,004 | 3,467,145 |
| 5.625%, 5/1/24(1) | | 2,505 | 2,490,218 |
| | | | $ 36,896,656 |
| Hotels — 0.2% |
| Resorts World Las Vegas, LLC/RWLV Capital, Inc.: | | | |
| 4.625%, 4/16/29(9) | | 500 | $ 384,525 |
| 4.625%, 4/6/31(9) | | 1,000 | 706,095 |
| 8.45%, 7/27/30(1) | | 1,300 | 1,199,924 |
| | | | $ 2,290,544 |
| Insurance — 1.3% |
| Alliant Holdings Intermediate, LLC/Alliant Holdings Co-Issuer, 6.75%, 10/15/27(1) | | 4,758 | $ 4,349,430 |
| AmWINS Group, Inc., 4.875%, 6/30/29(1) | | 2,466 | 2,113,972 |
| BroadStreet Partners, Inc., 5.875%, 4/15/29(1) | | 4,700 | 4,101,887 |
| Jones DesLauriers Insurance Management, Inc., 10.50%, 12/15/30(1) | | 3,252 | 3,230,675 |
| | | | $ 13,795,964 |
| Leisure — 3.4% |
| Boyne USA, Inc., 4.75%, 5/15/29(1) | | 3,617 | $ 3,152,602 |
| Carnival Corp., 5.75%, 3/1/27(1) | | 3,536 | 3,159,547 |
| Life Time, Inc.: | | | |
| 5.75%, 1/15/26(1) | | 1,452 | 1,407,515 |
| 8.00%, 4/15/26(1) | | 3,220 | 3,142,173 |
| Lindblad Expeditions Holdings, Inc., 9.00%, 5/15/28(1) | | 1,430 | 1,376,813 |
| Lindblad Expeditions, LLC, 6.75%, 2/15/27(1) | | 764 | 696,905 |
| NCL Corp., Ltd.: | | | |
| 3.625%, 12/15/24(1) | | 842 | 797,139 |
| 5.875%, 3/15/26(1) | | 2,292 | 2,059,110 |
| 5.875%, 2/15/27(1) | | 946 | 871,714 |
| 7.75%, 2/15/29(1) | | 1,792 | 1,565,446 |
| NCL Finance, Ltd., 6.125%, 3/15/28(1) | | 1,732 | 1,449,826 |
| Royal Caribbean Cruises, Ltd., 11.625%, 8/15/27(1) | | 3,713 | 4,030,610 |
| SeaWorld Parks & Entertainment, Inc., 5.25%, 8/15/29(1) | | 4,227 | 3,686,367 |
High Income Opportunities Portfolio
October 31, 2023
Portfolio of Investments — continued
| Security | Principal
Amount*
(000's omitted) | Value |
| Leisure (continued) |
| Speedway Motorsports, LLC/Speedway Funding II, Inc., 4.875%, 11/1/27(1) | | 2,674 | $ 2,389,313 |
| Viking Cruises, Ltd.: | | | |
| 5.875%, 9/15/27(1) | | 4,354 | 3,926,459 |
| 6.25%, 5/15/25(1) | | 1,820 | 1,780,155 |
| 7.00%, 2/15/29(1) | | 753 | 682,101 |
| Viking Ocean Cruises Ship VII, Ltd., 5.625%, 2/15/29(1) | | 521 | 462,304 |
| | | | $ 36,636,099 |
| Metals & Mining — 1.8% |
| Eldorado Gold Corp., 6.25%, 9/1/29(1) | | 2,968 | $ 2,548,650 |
| First Quantum Minerals, Ltd.: | | | |
| 6.875%, 3/1/26(1) | | 1,448 | 1,274,240 |
| 7.50%, 4/1/25(1) | | 1,695 | 1,592,519 |
| Freeport-McMoRan, Inc., 5.45%, 3/15/43 | | 2,400 | 1,977,912 |
| Hudbay Minerals, Inc.: | | | |
| 4.50%, 4/1/26(1) | | 2,459 | 2,291,172 |
| 6.125%, 4/1/29(1) | | 2,069 | 1,853,943 |
| New Gold, Inc., 7.50%, 7/15/27(1) | | 983 | 923,337 |
| Novelis Corp.: | | | |
| 3.25%, 11/15/26(1) | | 1,755 | 1,564,200 |
| 4.75%, 1/30/30(1) | | 2,548 | 2,164,639 |
| Roller Bearing Co. of America, Inc., 4.375%, 10/15/29(1) | | 3,847 | 3,267,103 |
| | | | $ 19,457,715 |
| Paper — 0.3% |
| Enviva Partners, L.P./Enviva Partners Finance Corp., 6.50%, 1/15/26(1) | | 4,583 | $ 3,224,576 |
| | | | $ 3,224,576 |
| Publishing & Printing — 0.6% |
| LABL, Inc.: | | | |
| 5.875%, 11/1/28(1) | | 767 | $ 650,509 |
| 8.25%, 11/1/29(1) | | 2,037 | 1,516,292 |
| McGraw-Hill Education, Inc.: | | | |
| 5.75%, 8/1/28(1) | | 1,405 | 1,185,679 |
| 8.00%, 8/1/29(1) | | 3,566 | 2,943,020 |
| | | | $ 6,295,500 |
| Railroad — 0.4% |
| Watco Cos., LLC/Watco Finance Corp., 6.50%, 6/15/27(1) | | 4,400 | $ 4,104,295 |
| | | | $ 4,104,295 |
| Security | Principal
Amount*
(000's omitted) | Value |
| Restaurant — 1.5% |
| 1011778 B.C. Unlimited Liability Company/New Red Finance, Inc.: | | | |
| 3.875%, 1/15/28(1) | | 1,761 | $ 1,573,749 |
| 4.00%, 10/15/30(1) | | 4,616 | 3,785,015 |
| 5.75%, 4/15/25(1) | | 581 | 576,800 |
| Dave & Buster's, Inc., 7.625%, 11/1/25(1) | | 4,883 | 4,851,309 |
| IRB Holding Corp., 7.00%, 6/15/25(1) | | 2,978 | 2,958,477 |
| Yum! Brands, Inc., 3.625%, 3/15/31 | | 2,452 | 1,993,690 |
| | | | $ 15,739,040 |
| Services — 6.4% |
| Adtalem Global Education, Inc., 5.50%, 3/1/28(1) | | 3,652 | $ 3,329,600 |
| Allied Universal Holdco, LLC/Allied Universal Finance Corp.: | | | |
| 6.625%, 7/15/26(1) | | 2,712 | 2,542,025 |
| 9.75%, 7/15/27(1) | | 2,000 | 1,739,532 |
| Allied Universal Holdco, LLC/Allied Universal Finance Corp./Atlas Luxco 4 S.a.r.l.: | | | |
| 4.625%, 6/1/28(1) | | 1,076 | 877,852 |
| 4.625%, 6/1/28(1) | | 1,231 | 1,008,133 |
| APi Group DE, Inc., 4.75%, 10/15/29(1) | | 4,407 | 3,778,259 |
| BCPE Empire Holdings, Inc., 7.625%, 5/1/27(1) | | 5,653 | 5,190,330 |
| Clarivate Science Holdings Corp., 4.875%, 7/1/29(1) | | 4,889 | 4,129,494 |
| Gartner, Inc.: | | | |
| 3.625%, 6/15/29(1) | | 605 | 511,541 |
| 3.75%, 10/1/30(1) | | 2,100 | 1,741,288 |
| 4.50%, 7/1/28(1) | | 1,449 | 1,305,880 |
| GEMS MENASA Cayman, Ltd./GEMS Education Delaware, LLC, 7.125%, 7/31/26(1) | | 5,546 | 5,344,237 |
| Hertz Corp. (The): | | | |
| 4.625%, 12/1/26(1) | | 372 | 311,951 |
| 5.00%, 12/1/29(1) | | 2,980 | 2,143,139 |
| Imola Merger Corp., 4.75%, 5/15/29(1) | | 4,502 | 3,928,707 |
| Korn Ferry, 4.625%, 12/15/27(1) | | 4,099 | 3,732,609 |
| NESCO Holdings II, Inc., 5.50%, 4/15/29(1) | | 2,776 | 2,383,154 |
| Ritchie Bros Holdings, Inc.: | | | |
| 6.75%, 3/15/28(1) | | 1,082 | 1,061,689 |
| 7.75%, 3/15/31(1) | | 1,945 | 1,952,294 |
| SRS Distribution, Inc.: | | | |
| 6.00%, 12/1/29(1) | | 1,481 | 1,234,517 |
| 6.125%, 7/1/29(1) | | 2,668 | 2,236,891 |
| Summer (BC) Bidco B, LLC, 5.50%, 10/31/26(1) | | 2,854 | 2,487,846 |
| VT Topco, Inc., 8.50%, 8/15/30(1) | | 3,907 | 3,815,361 |
| WASH Multifamily Acquisition, Inc., 5.75%, 4/15/26(1) | | 4,401 | 4,074,930 |
| WESCO Distribution, Inc., 7.25%, 6/15/28(1) | | 1,743 | 1,733,797 |
| White Cap Buyer, LLC, 6.875%, 10/15/28(1) | | 2,393 | 2,090,848 |
High Income Opportunities Portfolio
October 31, 2023
Portfolio of Investments — continued
| Security | Principal
Amount*
(000's omitted) | Value |
| Services (continued) |
| White Cap Parent, LLC, 8.25%, (8.25% cash or 9.00% PIK), 3/15/26(1)(10) | | 1,481 | $ 1,391,305 |
| Windsor Holdings III, LLC, 8.50%, 6/15/30(1) | | 4,082 | 3,978,793 |
| | | | $ 70,056,002 |
| Steel — 0.8% |
| Allegheny Ludlum, LLC, 6.95%, 12/15/25 | | 2,155 | $ 2,148,276 |
| ATI, Inc., 5.875%, 12/1/27 | | 86 | 79,884 |
| Big River Steel, LLC/BRS Finance Corp., 6.625%, 1/31/29(1) | | 1,292 | 1,277,646 |
| Cleveland-Cliffs, Inc., 6.75%, 3/15/26(1) | | 3,792 | 3,774,451 |
| TMS International Corp., 6.25%, 4/15/29(1) | | 2,204 | 1,741,154 |
| | | | $ 9,021,411 |
| Super Retail — 3.7% |
| Asbury Automotive Group, Inc.: | | | |
| 4.625%, 11/15/29(1) | | 839 | $ 710,769 |
| 4.75%, 3/1/30 | | 743 | 631,460 |
| 5.00%, 2/15/32(1) | | 2,334 | 1,895,455 |
| Bath & Body Works, Inc.: | | | |
| 6.75%, 7/1/36 | | 694 | 599,319 |
| 6.875%, 11/1/35 | | 2,146 | 1,895,920 |
| 6.95%, 3/1/33 | | 1,621 | 1,403,345 |
| 7.60%, 7/15/37 | | 198 | 168,084 |
| 9.375%, 7/1/25(1) | | 289 | 297,922 |
| Evergreen AcqCo 1, L.P./TVI, Inc., 9.75%, 4/26/28(1) | | 4,308 | 4,350,972 |
| Group 1 Automotive, Inc., 4.00%, 8/15/28(1) | | 1,497 | 1,290,141 |
| Ken Garff Automotive, LLC, 4.875%, 9/15/28(1) | | 2,048 | 1,733,897 |
| Kohl's Corp., 4.625%, 5/1/31 | | 1,685 | 1,154,057 |
| LCM Investments Holdings II, LLC: | | | |
| 4.875%, 5/1/29(1) | | 2,840 | 2,382,980 |
| 8.25%, 8/1/31(1) | | 529 | 503,715 |
| Lithia Motors, Inc.: | | | |
| 3.875%, 6/1/29(1) | | 905 | 749,697 |
| 4.375%, 1/15/31(1) | | 3,144 | 2,548,839 |
| Macy's Retail Holdings, LLC, 5.875%, 4/1/29(1) | | 1,169 | 1,031,789 |
| Metis Merger Sub, LLC, 6.50%, 5/15/29(1) | | 5,932 | 4,853,453 |
| PetSmart, Inc./PetSmart Finance Corp.: | | | |
| 4.75%, 2/15/28(1) | | 2,225 | 1,971,258 |
| 7.75%, 2/15/29(1) | | 3,088 | 2,845,923 |
| Sonic Automotive, Inc.: | | | |
| 4.625%, 11/15/29(1) | | 1,961 | 1,635,071 |
| 4.875%, 11/15/31(1) | | 1,634 | 1,303,306 |
| Security | Principal
Amount*
(000's omitted) | Value |
| Super Retail (continued) |
| William Carter Co. (The), 5.625%, 3/15/27(1) | | 1,510 | $ 1,432,283 |
| Wolverine World Wide, Inc., 4.00%, 8/15/29(1) | | 3,600 | 2,688,038 |
| | | | $ 40,077,693 |
| Technology — 5.0% |
| Black Knight InfoServ, LLC, 3.625%, 9/1/28(1) | | 2,048 | $ 1,827,840 |
| Booz Allen Hamilton, Inc.: | | | |
| 3.875%, 9/1/28(1) | | 2,659 | 2,378,941 |
| 4.00%, 7/1/29(1) | | 1,006 | 888,937 |
| Central Parent, LLC/CDK Global II, LLC/CDK Financing Co., Inc., 8.00%, 6/15/29(1) | | 2,168 | 2,143,605 |
| Ciena Corp., 4.00%, 1/31/30(1) | | 1,543 | 1,287,425 |
| Clarios Global, L.P., 6.75%, 5/15/25(1) | | 653 | 648,444 |
| Clarios Global, L.P./Clarios US Finance Co.: | | | |
| 4.375%, 5/15/26(9) | EUR | 2,958 | 3,002,854 |
| 8.50%, 5/15/27(1) | | 3,369 | 3,323,349 |
| Cloud Software Group, Inc.: | | | |
| 6.50%, 3/31/29(1) | | 1,976 | 1,736,722 |
| 9.00%, 9/30/29(1) | | 4,217 | 3,595,014 |
| Coherent Corp., 5.00%, 12/15/29(1) | | 3,540 | 3,008,734 |
| Fair Isaac Corp., 4.00%, 6/15/28(1) | | 2,227 | 1,985,633 |
| McAfee Corp., 7.375%, 2/15/30(1) | | 3,642 | 2,916,771 |
| NCR Voyix Corp.: | | | |
| 5.125%, 4/15/29(1) | | 1,782 | 1,534,287 |
| 5.25%, 10/1/30(1) | | 1,566 | 1,298,623 |
| ON Semiconductor Corp., 3.875%, 9/1/28(1) | | 3,132 | 2,694,037 |
| Open Text Corp., 3.875%, 2/15/28(1) | | 1,596 | 1,388,935 |
| Open Text Holdings, Inc., 4.125%, 2/15/30(1) | | 1,481 | 1,229,014 |
| Presidio Holdings, Inc.: | | | |
| 4.875%, 2/1/27(1) | | 412 | 377,998 |
| 8.25%, 2/1/28(1) | | 4,481 | 4,244,844 |
| Seagate HDD Cayman: | | | |
| 4.091%, 6/1/29 | | 803 | 693,151 |
| 9.625%, 12/1/32(1) | | 2,132 | 2,275,182 |
| Sensata Technologies B.V., 5.00%, 10/1/25(1) | | 842 | 819,572 |
| Sensata Technologies, Inc., 3.75%, 2/15/31(1) | | 3,219 | 2,580,679 |
| SS&C Technologies, Inc., 5.50%, 9/30/27(1) | | 961 | 902,641 |
| Viavi Solutions, Inc., 3.75%, 10/1/29(1) | | 2,295 | 1,788,971 |
| VM Consolidated, Inc., 5.50%, 4/15/29(1) | | 4,657 | 4,128,593 |
| | | | $ 54,700,796 |
| Telecommunications — 2.6% |
| Altice Financing S.A., 5.00%, 1/15/28(1) | | 1,945 | $ 1,583,389 |
| Altice France S.A.: | | | |
| 5.125%, 7/15/29(1) | | 1,060 | 726,467 |
High Income Opportunities Portfolio
October 31, 2023
Portfolio of Investments — continued
| Security | Principal
Amount*
(000's omitted) | Value |
| Telecommunications (continued) |
| Altice France S.A.: (continued) | | | |
| 5.50%, 1/15/28(1) | | 1,052 | $ 782,648 |
| 8.125%, 2/1/27(1) | | 3,263 | 2,754,299 |
| Connect Finco S.a.r.l./Connect US Finco, LLC, 6.75%, 10/1/26(1) | | 5,756 | 5,371,995 |
| Iliad Holding SASU: | | | |
| 6.50%, 10/15/26(1) | | 2,687 | 2,513,290 |
| 7.00%, 10/15/28(1) | | 1,592 | 1,441,966 |
| LCPR Senior Secured Financing DAC: | | | |
| 5.125%, 7/15/29(1) | | 2,163 | 1,687,184 |
| 6.75%, 10/15/27(1) | | 425 | 385,058 |
| Level 3 Financing, Inc., 4.25%, 7/1/28(1) | | 2,084 | 1,180,384 |
| Sprint Capital Corp., 6.875%, 11/15/28 | | 1,985 | 2,038,617 |
| Sprint, LLC, 7.625%, 2/15/25 | | 1,145 | 1,162,205 |
| Viasat, Inc., 5.625%, 4/15/27(1) | | 888 | 776,032 |
| Virgin Media Finance PLC, 5.00%, 7/15/30(1) | | 1,029 | 810,002 |
| Virgin Media Vendor Financing Notes III DAC, 4.875%, 7/15/28(9) | GBP | 1,106 | 1,130,555 |
| Virgin Media Vendor Financing Notes IV DAC, 5.00%, 7/15/28(1) | | 2,420 | 2,056,687 |
| Ziggo B.V., 4.875%, 1/15/30(1) | | 2,756 | 2,203,583 |
| | | | $ 28,604,361 |
| Transport Excluding Air & Rail — 0.2% |
| Seaspan Corp., 5.50%, 8/1/29(1) | | 3,386 | $ 2,601,057 |
| | | | $ 2,601,057 |
| Utility — 3.7% |
| Calpine Corp.: | | | |
| 4.50%, 2/15/28(1) | | 1,810 | $ 1,633,758 |
| 4.625%, 2/1/29(1) | | 2,060 | 1,741,601 |
| 5.00%, 2/1/31(1) | | 420 | 339,185 |
| 5.125%, 3/15/28(1) | | 3,554 | 3,183,964 |
| Ferrellgas, L.P./Ferrellgas Finance Corp., 5.875%, 4/1/29(1) | | 4,428 | 3,911,447 |
| FirstEnergy Corp.: | | | |
| 2.65%, 3/1/30 | | 750 | 605,687 |
| Series B, 4.15%, 7/15/27 | | 2,275 | 2,107,620 |
| Leeward Renewable Energy Operations, LLC, 4.25%, 7/1/29(1) | | 2,400 | 1,962,915 |
| NextEra Energy Operating Partners, L.P., 4.50%, 9/15/27(1) | | 1,628 | 1,459,266 |
| NRG Energy, Inc.: | | | |
| 3.375%, 2/15/29(1) | | 970 | 790,620 |
| 3.625%, 2/15/31(1) | | 1,617 | 1,222,253 |
| Security | Principal
Amount*
(000's omitted) | Value |
| Utility (continued) |
| NRG Energy, Inc.: (continued) | | | |
| 3.875%, 2/15/32(1) | | 3,164 | $ 2,356,073 |
| 5.25%, 6/15/29(1) | | 3,247 | 2,868,434 |
| 10.25% to 3/15/28(1)(6)(7) | | 2,762 | 2,669,272 |
| Pattern Energy Operations, L.P./Pattern Energy Operations, Inc., 4.50%, 8/15/28(1) | | 1,596 | 1,392,801 |
| Suburban Propane Partners, L.P./Suburban Energy Finance Corp., 5.00%, 6/1/31(1) | | 2,345 | 1,944,823 |
| TerraForm Power Operating, LLC, 5.00%, 1/31/28(1) | | 2,981 | 2,733,890 |
| TransAlta Corp., 7.75%, 11/15/29 | | 3,684 | 3,669,348 |
| Vistra Operations Co., LLC: | | | |
| 4.375%, 5/1/29(1) | | 2,094 | 1,780,968 |
| 5.00%, 7/31/27(1) | | 2,344 | 2,146,392 |
| | | | $ 40,520,317 |
Total Corporate Bonds
(identified cost $1,040,839,756) | | | $ 937,978,972 |
| Security | Shares | Value |
| Services — 0.3% |
| WESCO International, Inc., Series A, 10.625% to 6/22/25(7) | | 147,488 | $ 3,932,030 |
Total Preferred Stocks
(identified cost $4,129,729) | | | $ 3,932,030 |
| Senior Floating-Rate Loans — 5.2%(11) |
| Borrower/Description | Principal
Amount
(000's omitted) | Value |
| Aerospace — 0.2% |
| TransDigm, Inc., Term Loan, 8.64%, (SOFR + 3.25%), 8/24/28 | $ | 1,696 | $ 1,695,414 |
| | | | $ 1,695,414 |
| Air Transportation — 0.6% |
| Air Canada, Term Loan, 9.128%, (SOFR + 3.50%), 8/11/28 | $ | 2,669 | $ 2,668,183 |
| Mileage Plus Holdings, LLC, Term Loan, 10.798%, (SOFR + 5.25%), 6/21/27 | | 3,258 | 3,360,784 |
| | | | $ 6,028,967 |
High Income Opportunities Portfolio
October 31, 2023
Portfolio of Investments — continued
| Borrower/Description | Principal
Amount
(000's omitted) | Value |
| Broadcasting — 0.1% |
| ABG Intermediate Holdings 2, LLC, Term Loan, 8.924%, (SOFR + 3.50%), 12/21/28 | $ | 1,253 | $ 1,251,540 |
| | | | $ 1,251,540 |
| Capital Goods — 0.3% |
| DexKo Global, Inc., Term Loan, 9.64%, (SOFR + 4.25%), 10/4/28 | $ | 1,501 | $ 1,453,625 |
| EMRLD Borrower, L.P., Term Loan, 8.38%, (SOFR + 3.00%), 5/31/30 | | 1,631 | 1,629,761 |
| | | | $ 3,083,386 |
| Gaming — 0.6% |
| Peninsula Pacific Entertainment, LLC, Term Loan, 13.00%, 12/24/29(12) | $ | 2,351 | $ 2,351,333 |
| Spectacle Gary Holdings, LLC, Term Loan, 9.674%, (SOFR + 4.25%), 12/10/28 | | 4,255 | 4,158,048 |
| | | | $ 6,509,381 |
| Healthcare — 1.1% |
| athenahealth Group, Inc., Term Loan, 8.577%, (SOFR + 3.25%), 2/15/29 | $ | 1,772 | $ 1,717,384 |
| Jazz Financing Lux S.a.r.l., Term Loan, 8.939%, (SOFR + 3.50%), 5/5/28 | | 2,599 | 2,601,949 |
| Pearl Intermediate Parent, LLC, Term Loan - Second Lien, 11.674%, (SOFR + 6.25%), 2/13/26 | | 819 | 818,318 |
| Pluto Acquisition I, Inc., Term Loan, 9.684%, (SOFR + 4.00%), 6/22/26 | | 4,178 | 3,551,048 |
| Verscend Holding Corp., Term Loan, 9.439%, (SOFR + 4.00%), 8/27/25 | | 3,706 | 3,708,336 |
| | | | $ 12,397,035 |
| Leisure — 0.2% |
| Peloton Interactive, Inc., Term Loan, 12.263%, (SOFR + 6.50%), 5/25/27 | $ | 2,061 | $ 2,073,278 |
| | | | $ 2,073,278 |
| Restaurant — 0.5% |
| IRB Holding Corp., Term Loan, 8.424%, (SOFR + 3.00%), 12/15/27 | $ | 5,221 | $ 5,171,762 |
| | | | $ 5,171,762 |
| Services — 0.6% |
| AlixPartners, LLP, Term Loan, 8.189%, (SOFR + 2.75%), 2/4/28 | $ | 5,614 | $ 5,614,164 |
| Borrower/Description | Principal
Amount
(000's omitted) | Value |
| Services (continued) |
| Spin Holdco, Inc., Term Loan, 9.664%, (SOFR + 4.00%), 3/4/28 | $ | 1,676 | $ 1,440,540 |
| | | | $ 7,054,704 |
| Super Retail — 0.6% |
| Mavis Tire Express Services Corp., Term Loan, 9.439%, (SOFR + 4.00%), 5/4/28 | $ | 2,365 | $ 2,333,912 |
| Michaels Companies, Inc., Term Loan, 9.902%, (SOFR + 4.25%), 4/15/28 | | 1,856 | 1,555,657 |
| PetSmart, Inc., Term Loan, 9.174%, (SOFR + 3.75%), 2/11/28 | | 2,323 | 2,299,569 |
| | | | $ 6,189,138 |
| Technology — 0.4% |
| Clarios Global, L.P., Term Loan, 9.074%, (SOFR + 3.75%), 5/6/30 | $ | 1,878 | $ 1,877,414 |
| Riverbed Technology, Inc., Term Loan, 9.89%, (SOFR + 4.50%), 7/1/28 | | 500 | 326,736 |
| Travelport Finance (Luxembourg) S.a.r.l., Term Loan, 12.652%, (SOFR + 7.00%), 2/28/25 | | 2,764 | 2,634,429 |
| | | | $ 4,838,579 |
Total Senior Floating-Rate Loans
(identified cost $57,061,054) | | | $ 56,293,184 |
| Security | Principal
Amount/
Shares | Value |
| Cable & Satellite TV — 0.0% |
| ACC Claims Holdings, LLC(4) | | 8,415,190 | $ 0 |
| | | | $ 0 |
| Diversified Media — 0.0% |
| National CineMedia, Inc., Escrow Certificates(3)(4) | $ | 1,660,000 | $ 0 |
| | | | $ 0 |
| Gaming — 0.4% |
| PGP Investors, LLC, Membership Interests(3)(4)(5) | | 15,849 | $ 4,402,942 |
| | | | $ 4,402,942 |
High Income Opportunities Portfolio
October 31, 2023
Portfolio of Investments — continued
| Security | Principal
Amount/
Shares | Value |
| Services — 0.0%(13) |
| Hertz Corp., Escrow Certificates(3) | $ | 502,000 | $ 45,180 |
| | | | $ 45,180 |
Total Miscellaneous
(identified cost $0) | | | $ 4,448,122 |
| Short-Term Investments — 3.5% |
| Security | Shares | Value |
| Morgan Stanley Institutional Liquidity Funds - Government Portfolio, Institutional Class, 5.25%(14) | | 37,843,239 | $ 37,843,239 |
Total Short-Term Investments
(identified cost $37,843,239) | | | $ 37,843,239 |
Total Investments — 98.4%
(identified cost $1,174,918,976) | | | $1,073,375,854 |
| Other Assets, Less Liabilities — 1.6% | | | $ 17,449,823 |
| Net Assets — 100.0% | | | $1,090,825,677 |
| The percentage shown for each investment category in the Portfolio of Investments is based on net assets. |
| * | In U.S. dollars unless otherwise indicated. |
| (1) | Security exempt from registration under Rule 144A of the Securities Act of 1933, as amended. These securities may be sold in certain transactions in reliance on an exemption from registration (normally to qualified institutional buyers). At October 31, 2023, the aggregate value of these securities is $816,345,128 or 74.8% of the Portfolio's net assets. |
| (2) | Variable rate security. The stated interest rate represents the rate in effect at October 31, 2023. |
| (3) | Non-income producing security. |
| (4) | For fair value measurement disclosure purposes, security is categorized as Level 3 (see Note 9). |
| (5) | Restricted security. |
| (6) | Perpetual security with no stated maturity date but may be subject to calls by the issuer. |
| (7) | Security converts to variable rate after the indicated fixed-rate coupon period. |
| (8) | Issuer is in default with respect to interest and/or principal payments. |
| (9) | Security exempt from registration under Regulation S of the Securities Act of 1933, as amended, which exempts from registration securities offered and sold outside the United States. Security may not be offered or sold in the United States except pursuant to an exemption from, or in a transaction not subject to, the registration requirements of the Securities Act of 1933, as amended. At October 31, 2023, the aggregate value of these securities is $22,881,035 or 2.1% of the Portfolio's net assets. |
| (10) | Represents a payment-in-kind security which may pay interest in additional principal at the issuer’s discretion. |
| (11) | Senior floating-rate loans (Senior Loans) often require prepayments from excess cash flows or permit the borrowers to repay at their election. The degree to which borrowers repay, whether as a contractual requirement or at their election, cannot be predicted with accuracy. As a result, the actual remaining maturity may be substantially less than the stated maturities shown. However, Senior Loans will typically have an expected average life of approximately two to four years. Senior Loans typically have rates of interest which are redetermined periodically by reference to a base lending rate, plus a spread. These base lending rates are primarily the Secured Overnight Financing Rate (“SOFR”) (or the London Interbank Offered Rate (“LIBOR”) for those loans whose rates reset prior to the discontinuance of LIBOR on June 30, 2023) and secondarily, the prime rate offered by one or more major United States banks (the “Prime Rate”). Base lending rates may be subject to a floor, or minimum rate. Rates for SOFR are generally 1 or 3-month tenors and may also be subject to a credit spread adjustment. Senior Loans are generally subject to contractual restrictions that must be satisfied before they can be bought or sold. |
| (12) | Fixed-rate loan. |
| (13) | Amount is less than 0.05%. |
| (14) | May be deemed to be an affiliated investment company. The rate shown is the annualized seven-day yield as of October 31, 2023. |
| Forward Foreign Currency Exchange Contracts (OTC) |
| Currency Purchased | Currency Sold | Counterparty | Settlement
Date | Unrealized
Appreciation | Unrealized
(Depreciation) |
| USD | 9,090,545 | EUR | 8,549,684 | State Street Bank and Trust Company | 1/31/24 | $ 5,421 | $ — |
| USD | 10,267,930 | EUR | 9,665,938 | State Street Bank and Trust Company | 1/31/24 | — | (3,355) |
| USD | 1,136,684 | GBP | 934,777 | State Street Bank and Trust Company | 1/31/24 | — | (318) |
| | | | | | | $5,421 | $(3,673) |
High Income Opportunities Portfolio
October 31, 2023
Portfolio of Investments — continued
| Abbreviations: |
| OTC | – Over-the-counter |
| PIK | – Payment In Kind |
| SOFR | – Secured Overnight Financing Rate |
| Currency Abbreviations: |
| EUR | – Euro |
| GBP | – British Pound Sterling |
| USD | – United States Dollar |
High Income Opportunities Portfolio
October 31, 2023
Statement of Assets and Liabilities
| | October 31, 2023 |
| Assets | |
| Unaffiliated investments, at value (identified cost $1,137,075,737) | $ 1,035,532,615 |
| Affiliated investments, at value (identified cost $37,843,239) | 37,843,239 |
| Cash | 166,789 |
| Foreign currency, at value (identified cost $1,637) | 1,639 |
| Interest receivable | 16,637,591 |
| Dividends receivable from affiliated investments | 180,866 |
| Receivable for investments sold | 2,906,492 |
| Receivable for open forward foreign currency exchange contracts | 5,421 |
| Trustees' deferred compensation plan | 194,037 |
| Total assets | $1,093,468,689 |
| Liabilities | |
| Payable for investments purchased | $ 1,736,977 |
| Payable for open forward foreign currency exchange contracts | 3,673 |
| Payable to affiliates: | |
| Investment adviser fee | 449,401 |
| Trustees' fees | 5,865 |
| Trustees' deferred compensation plan | 194,037 |
| Accrued expenses | 253,059 |
| Total liabilities | $ 2,643,012 |
| Net Assets applicable to investors' interest in Portfolio | $1,090,825,677 |
32
See Notes to Financial Statements.
High Income Opportunities Portfolio
October 31, 2023
| | Year Ended |
| | October 31, 2023 |
| Investment Income | |
| Dividend income (net of foreign taxes withheld of $1,345) | $ 867,132 |
| Dividend income from affiliated investments | 2,059,660 |
| Interest and other income | 67,898,902 |
| Total investment income | $ 70,825,694 |
| Expenses | |
| Investment adviser fee | $ 5,153,891 |
| Trustees’ fees and expenses | 68,398 |
| Custodian fee | 279,789 |
| Legal and accounting services | 132,226 |
| Interest expense on securities sold short | 43,196 |
| Miscellaneous | 40,164 |
| Total expenses | $ 5,717,664 |
| Deduct: | |
| Waiver and/or reimbursement of expenses by affiliates | $ 66,281 |
| Total expense reductions | $ 66,281 |
| Net expenses | $ 5,651,383 |
| Net investment income | $ 65,174,311 |
| Realized and Unrealized Gain (Loss) | |
| Net realized gain (loss): | |
| Investment transactions | $ 11,290,872 |
| Securities sold short | (232,492) |
| Foreign currency transactions | 35,530 |
| Forward foreign currency exchange contracts | (528,593) |
| Net realized gain | $ 10,565,317 |
| Change in unrealized appreciation (depreciation): | |
| Investments | $ (10,228,619) |
| Foreign currency | 1,418 |
| Forward foreign currency exchange contracts | (198,181) |
| Net change in unrealized appreciation (depreciation) | $(10,425,382) |
| Net realized and unrealized gain | $ 139,935 |
| Net increase in net assets from operations | $ 65,314,246 |
33
See Notes to Financial Statements.
High Income Opportunities Portfolio
October 31, 2023
Statements of Changes in Net Assets
| | Year Ended October 31, |
| | 2023 | 2022 |
| Increase (Decrease) in Net Assets | | |
| From operations: | | |
| Net investment income | $ 65,174,311 | $ 51,594,657 |
| Net realized gain (loss) | 10,565,317 | (5,282,108) |
| Net change in unrealized appreciation (depreciation) | (10,425,382) | (141,360,652) |
| Net increase (decrease) in net assets from operations | $ 65,314,246 | $ (95,048,103) |
| Capital transactions: | | |
| Contributions | $ 295,215,386 | $ 343,450,718 |
| Withdrawals | (289,977,325) | (228,224,245) |
| Net increase in net assets from capital transactions | $ 5,238,061 | $ 115,226,473 |
| Net increase in net assets | $ 70,552,307 | $ 20,178,370 |
| Net Assets | | |
| At beginning of year | $ 1,020,273,370 | $ 1,000,095,000 |
| At end of year | $1,090,825,677 | $1,020,273,370 |
34
See Notes to Financial Statements.
High Income Opportunities Portfolio
October 31, 2023
| | Year Ended October 31, |
| Ratios/Supplemental Data | 2023 | 2022 | 2021 | 2020 | 2019 |
| Ratios (as a percentage of average daily net assets): | | | | | |
| Expenses | 0.53% (1) | 0.49% (1) | 0.49% | 0.51% | 0.50% |
| Net investment income | 6.07% | 4.82% | 4.78% | 5.26% | 5.61% |
| Portfolio Turnover | 29% | 19% | 64% | 67% | 32% |
| Total Return | 6.66% | (8.20)% | 13.11% | 1.69% | 7.74% |
| Net assets, end of year (000’s omitted) | $1,090,826 | $1,020,273 | $1,000,095 | $949,751 | $1,088,999 |
| (1) | Includes a reduction by the investment adviser of a portion of its adviser fee due to the Portfolio’s investment in the Liquidity Fund (equal to less than 0.01% and less than 0.005% of average daily net assets for the years ended October 31, 2023 and 2022, respectively). |
High Income Opportunities Portfolio
October 31, 2023
Notes to Financial Statements
1 Significant Accounting Policies
High Income Opportunities Portfolio (the Portfolio) is a Massachusetts business trust registered under the Investment Company Act of 1940, as amended (the 1940 Act), as a diversified, open-end management investment company. The Portfolio’s investment objective is to provide a high level of current income. The Portfolio also seeks growth of capital as a secondary investment objective. The Declaration of Trust permits the Trustees to issue interests in the Portfolio. At October 31, 2023, Eaton Vance High Income Opportunities Fund and Eaton Vance Floating-Rate & High Income Fund held an interest of 77.2% and 13.9%, respectively, in the Portfolio.
The following is a summary of significant accounting policies of the Portfolio. The policies are in conformity with accounting principles generally accepted in the United States of America (U.S. GAAP). The Portfolio is an investment company and follows accounting and reporting guidance in the Financial Accounting Standards Board (FASB) Accounting Standards Codification Topic 946.
A Investment Valuation—The following methodologies are used to determine the market value or fair value of investments.
Debt Obligations. Debt obligations are generally valued on the basis of valuations provided by third party pricing services, as derived from such services’ pricing models. Inputs to the models may include, but are not limited to, reported trades, executable bid and ask prices, broker/dealer quotations, prices or yields of securities with similar characteristics, interest rates, anticipated prepayments, benchmark curves or information pertaining to the issuer, as well as industry and economic events. The pricing services may use a matrix approach, which considers information regarding securities with similar characteristics to determine the valuation for a security. Short-term debt obligations purchased with a remaining maturity of sixty days or less for which a valuation from a third party pricing service is not readily available may be valued at amortized cost, which approximates fair value.
Senior Floating-Rate Loans. Interests in senior floating-rate loans (Senior Loans) are valued generally at the average mean of bid and ask quotations obtained from a third party pricing service. Senior Loans, for which a valuation is not available or deemed unreliable, are fair valued by the investment adviser utilizing one or more of the valuation techniques described below to assess the likelihood that the borrower will make a full repayment of the loan underlying such Senior Loan. If the investment adviser believes that there is a reasonable likelihood of full repayment, the investment adviser will determine fair value using a matrix pricing approach that considers the yield on the Senior Loan relative to yields on other Senior Loans issued by companies of comparable credit quality. If the investment adviser believes there is not a reasonable likelihood of full repayment, the investment adviser will determine fair value using analyses that include, but are not limited to: (i) a comparison of the value of the borrower's outstanding equity and debt to that of comparable public companies; (ii) a discounted cash flow analysis; or (iii) when the investment adviser believes it is likely that a borrower will be liquidated or sold, an analysis of the terms of such liquidation or sale. In certain cases, the investment adviser will use a combination of analytical methods to determine fair value, such as when only a portion of a borrower's assets are likely to be sold. In conducting its assessment and analyses for purposes of determining fair value of a Senior Loan, the investment adviser will use its discretion and judgment in considering and appraising relevant factors. Junior Loans (i.e., subordinated loans and second lien loans) are valued in the same manner as Senior Loans.
Equity Securities. Equity securities listed on a U.S. securities exchange generally are valued at the last sale or closing price on the day of valuation or, if no sales took place on such date, at the mean between the closing bid and ask prices on the exchange where such securities are principally traded. Equity securities listed on the NASDAQ National Market System are valued at the NASDAQ official closing price. Unlisted or listed securities for which closing sales prices or closing quotations are not available are valued at the mean between the latest available bid and ask prices or, in the case of preferred equity securities that are not listed or traded in the over-the-counter market, by a third party pricing service that uses various techniques that consider factors including, but not limited to, prices or yields of securities with similar characteristics, benchmark yields, broker/dealer quotes, quotes of underlying common stock, issuer spreads, as well as industry and economic events.
Derivatives. Forward foreign currency exchange contracts are generally valued at the mean of the average bid and average ask prices that are reported by currency dealers to a third party pricing service at the valuation time. Such third party pricing service valuations are supplied for specific settlement periods and the Portfolio’s forward foreign currency exchange contracts are valued at an interpolated rate between the closest preceding and subsequent settlement period reported by the third party pricing service.
Foreign Securities and Currencies. Foreign securities and currencies are valued in U.S. dollars, based on foreign currency exchange rate quotations supplied by a third party pricing service. The pricing service uses a proprietary model to determine the exchange rate. Inputs to the model include reported trades and implied bid/ask spreads.
Other. Investments in management investment companies (including money market funds) that do not trade on an exchange are valued at the net asset value as of the close of each business day.
Fair Valuation. In connection with Rule 2a-5 of the 1940 Act, the Trustees have designated the Portfolio’s investment adviser as its valuation designee. Investments for which valuations or market quotations are not readily available or are deemed unreliable are valued by the investment adviser, as valuation designee, at fair value using methods that most fairly reflect the security’s “fair value”, which is the amount that the Portfolio might reasonably expect to receive for the security upon its current sale in the ordinary course. Each such determination is based on a consideration of relevant factors, which are likely to vary from one pricing context to another. These factors may include, but are not limited to, the type of security, the existence of any contractual restrictions on the security’s disposition, the price and extent of public trading in similar securities of the issuer or of comparable companies or entities,
High Income Opportunities Portfolio
October 31, 2023
Notes to Financial Statements — continued
quotations or relevant information obtained from broker/dealers or other market participants, information obtained from the issuer, analysts, and/or the appropriate stock exchange (for exchange-traded securities), an analysis of the company’s or entity’s financial statements, and an evaluation of the forces that influence the issuer and the market(s) in which the security is purchased and sold.
B Investment Transactions—Investment transactions for financial statement purposes are accounted for on a trade date basis. Realized gains and losses on investments sold are determined on the basis of identified cost.
C Income—Interest income is recorded on the basis of interest accrued, adjusted for amortization of premium or accretion of discount. Fees associated with loan amendments are recognized immediately. Dividend income is recorded on the ex-dividend date for dividends received in cash and/or securities. Withholding taxes on foreign dividends have been provided for in accordance with the Portfolio’s understanding of the applicable countries’ tax rules and rates. Distributions from investment companies are recorded as dividend income, capital gains or return of capital based on the nature of the distribution.
D Federal Taxes—The Portfolio has elected to be treated as a partnership for federal tax purposes. No provision is made by the Portfolio for federal or state taxes on any taxable income of the Portfolio because each investor in the Portfolio is ultimately responsible for the payment of any taxes on its share of taxable income. Since at least one of the Portfolio's investors is a regulated investment company that invests all or substantially all of its assets in the Portfolio, the Portfolio normally must satisfy the applicable source of income and diversification requirements (under the Internal Revenue Code) in order for its investors to satisfy them. The Portfolio will allocate, at least annually among its investors, each investor's distributive share of the Portfolio's net investment income, net realized capital gains and losses and any other items of income, gain, loss, deduction or credit.
As of October 31, 2023, the Portfolio had no uncertain tax positions that would require financial statement recognition, de-recognition, or disclosure. The Portfolio files a U.S. federal income tax return annually after its fiscal year-end, which is subject to examination by the Internal Revenue Service for a period of three years from the date of filing.
E Foreign Currency Translation—Investment valuations, other assets, and liabilities initially expressed in foreign currencies are translated each business day into U.S. dollars based upon current exchange rates. Purchases and sales of foreign investment securities and income and expenses denominated in foreign currencies are translated into U.S. dollars based upon currency exchange rates in effect on the respective dates of such transactions. Recognized gains or losses on investment transactions attributable to changes in foreign currency exchange rates are recorded for financial statement purposes as net realized gains and losses on investments. That portion of unrealized gains and losses on investments that results from fluctuations in foreign currency exchange rates is not separately disclosed.
F Use of Estimates—The preparation of the financial statements in conformity with U.S. GAAP requires management to make estimates and assumptions that affect the reported amounts of assets and liabilities at the date of the financial statements and the reported amounts of income and expense during the reporting period. Actual results could differ from those estimates.
G Indemnifications—Under the Portfolio’s organizational documents, its officers and Trustees may be indemnified against certain liabilities and expenses arising out of the performance of their duties to the Portfolio. Under Massachusetts law, if certain conditions prevail, interestholders in the Portfolio could be deemed to have personal liability for the obligations of the Portfolio. However, the Portfolio’s Declaration of Trust contains an express disclaimer of liability on the part of Portfolio interestholders. Additionally, in the normal course of business, the Portfolio enters into agreements with service providers that may contain indemnification clauses. The Portfolio’s maximum exposure under these arrangements is unknown as this would involve future claims that may be made against the Portfolio that have not yet occurred.
H Forward Foreign Currency Exchange Contracts—The Portfolio may enter into forward foreign currency exchange contracts for the purchase or sale of a specific foreign currency at a fixed price on a future date. The forward foreign currency exchange contracts are adjusted by the daily exchange rate of the underlying currency and any gains or losses are recorded as unrealized until such time as the contracts have been closed. Risks may arise upon entering these contracts from the potential inability of counterparties to meet the terms of their contracts and from movements in the value of a foreign currency relative to the U.S. dollar.
I Repurchase Agreements—A repurchase agreement is the purchase by the Portfolio of securities from a counterparty in exchange for cash that is coupled with an agreement to resell those securities to the counterparty at a specified date and price. When a repurchase agreement is entered, the Portfolio typically receives securities with a value that equals or exceeds the repurchase price, including any accrued interest earned on the agreement. The value of such securities will be marked-to-market daily, and cash or additional securities will be exchanged between the parties as needed. Except in the case of a repurchase agreement entered to settle a short sale, the value of the securities delivered to the Portfolio will be at least equal to 90% of the repurchase price during the term of the repurchase agreement. The terms of a repurchase agreement entered to settle a short sale may provide that the cash purchase price paid by the Portfolio is more than the value of purchased securities that effectively collateralize the repurchase price payable by the counterparty. In the event of insolvency of the counterparty to a repurchase agreement, recovery of the repurchase price owed to the Portfolio may be delayed. Such an insolvency also may result in a loss to the extent that the value of the purchased securities decreases during the delay or that value has otherwise not been maintained at an amount at least equal to the repurchase price.
J Securities Sold Short—A short sale is a transaction in which the Portfolio sells a security it does not own in anticipation of a decline in the market value of that security. To complete such a transaction, the Portfolio must borrow the security to make delivery to the buyer with an obligation to replace such
High Income Opportunities Portfolio
October 31, 2023
Notes to Financial Statements — continued
borrowed security at a later date. Until the security is replaced, the Portfolio is required to repay the lender any dividends or interest, which accrue during the period of the loan. The proceeds received from a short sale are recorded as a liability and the Portfolio records an unrealized gain or loss to the extent of the difference between the proceeds received and the value of the open short position on the day of determination. A gain, limited to the price at which the Portfolio sold the security short, or a loss, potentially unlimited as there is no upward limit on the price of a security, is recorded when the short position is terminated. Interest and dividends payable on securities sold short are recorded as an expense.
2 Investment Adviser Fee and Other Transactions with Affiliates
The investment adviser fee is earned by Boston Management and Research (BMR), an indirect, wholly-owned subsidiary of Morgan Stanley, as compensation for investment advisory services rendered to the Portfolio. The investment adviser fee is based upon a percentage of total daily net assets plus a percentage of total daily gross income as follows and is payable monthly:
| Total Daily Net Assets | Annual Asset
Rate | Daily Income
Rate |
| Up to $500 million | 0.300% | 3.000% |
| $500 million but less than $1 billion | 0.275% | 2.750% |
| $1 billion but less than $1.5 billion | 0.250% | 2.500% |
| $1.5 billion but less than $2 billion | 0.225% | 2.250% |
| $2 billion but less than $3 billion | 0.200% | 2.000% |
| $3 billion and over | 0.175% | 1.750% |
For the year ended October 31, 2023, the Portfolio’s investment adviser fee amounted to $5,153,891 or 0.48% of the Portfolio's average daily net assets. Pursuant to an investment sub-advisory agreement, BMR has delegated a portion of the investment management of the Portfolio to Eaton Vance Advisers International Ltd. (EVAIL), an affiliate of BMR. BMR pays EVAIL a portion of its investment adviser fee for sub-advisory services provided to the Portfolio. The Portfolio may invest in a money market fund, the Institutional Class of the Morgan Stanley Institutional Liquidity Funds - Government Portfolio (the “Liquidity Fund”), an open-end management investment company managed by Morgan Stanley Investment Management Inc., a wholly-owned subsidiary of Morgan Stanley. The investment adviser fee paid by the Portfolio is reduced by an amount equal to its pro rata share of the advisory and administration fees paid by the Portfolio due to its investment in the Liquidity Fund. For the year ended October 31, 2023, the investment adviser fee paid was reduced by $66,281 relating to the Portfolio’s investment in the Liquidity Fund.
Trustees and officers of the Portfolio who are members of BMR’s organization receive remuneration for their services to the Portfolio out of the investment adviser fee. Trustees of the Portfolio who are not affiliated with the investment adviser may elect to defer receipt of all or a percentage of their annual fees in accordance with the terms of the Trustees Deferred Compensation Plan. Certain officers and Trustees of the Portfolio are officers of the above organization.
3 Purchases and Sales of Investments
Purchases and sales of investments, other than short-term obligations and including maturities, paydowns and principal repayments on Senior Loans, aggregated $398,571,309 and $296,776,471, respectively, for the year ended October 31, 2023.
4 Federal Income Tax Basis of Investments
The cost and unrealized appreciation (depreciation) of investments, including open derivative contracts, of the Portfolio at October 31, 2023, as determined on a federal income tax basis, were as follows:
| Aggregate cost | $1,184,986,070 |
| Gross unrealized appreciation | $ 8,453,602 |
| Gross unrealized depreciation | (120,063,818) |
| Net unrealized depreciation | $ (111,610,216) |
High Income Opportunities Portfolio
October 31, 2023
Notes to Financial Statements — continued
5 Restricted Securities
At October 31, 2023, the Portfolio owned the following securities (representing 0.5% of net assets) which were restricted as to public resale and not registered under the Securities Act of 1933 (excluding Rule 144A securities). The Portfolio has various registration rights (exercisable under a variety of circumstances) with respect to these securities. The value of these securities is determined based on valuations provided by brokers when available, or if not available, they are valued at fair value using methods determined in good faith by or at the direction of the Trustees' valuation designee.
| Description | Date(s) of
Acquisition | Shares | Cost | Value |
| Common Stocks | | | | |
| Ascent CNR Corp., Class A | 4/25/16, 11/16/16 | 6,273,462 | $ 0 | $ 1,380,162 |
| iFIT Health and Fitness, Inc. | 10/6/22 | 514,080 | 1,799,280 | 0 |
| New Cotai Participation Corp., Class B | 4/12/13 | 7 | 216,125 | 0 |
| Total Common Stocks | | | $2,015,405 | $1,380,162 |
| Miscellaneous | | | | |
| PGP Investors, LLC, Membership Interests | 2/18/15, 4/23/18, 12/17/21 | 15,849 | $ 0 | $ 4,402,942 |
| Total Miscellaneous | | | $ 0 | $4,402,942 |
| Total Restricted Securities | | | $2,015,405 | $5,783,104 |
6 Financial Instruments
The Portfolio may trade in financial instruments with off-balance sheet risk in the normal course of its investing activities. These financial instruments may include forward foreign currency exchange contracts and may involve, to a varying degree, elements of risk in excess of the amounts recognized for financial statement purposes. The notional or contractual amounts of these instruments represent the investment the Portfolio has in particular classes of financial instruments and do not necessarily represent the amounts potentially subject to risk. The measurement of the risks associated with these instruments is meaningful only when all related and offsetting transactions are considered. A summary of obligations under these financial instruments at October 31, 2023 is included in the Portfolio of Investments. At October 31, 2023, the Portfolio had sufficient cash and/or securities to cover commitments under these contracts.
The Portfolio is subject to foreign exchange risk in the normal course of pursuing its investment objectives. Because the Portfolio holds foreign currency denominated investments, the value of these investments and related receivables and payables may change due to future changes in foreign currency exchange rates. To hedge against this risk, the Portfolio enters into forward foreign currency exchange contracts.
The Portfolio enters into forward foreign currency exchange contracts that may contain provisions whereby the counterparty may terminate the contract under certain conditions, including but not limited to a decline in the Portfolio’s net assets below a certain level over a certain period of time, which would trigger a payment by the Portfolio for those derivatives in a liability position. At October 31, 2023, the fair value of derivatives with credit-related contingent features in a net liability position was $3,673. At October 31, 2023, there were no assets pledged by the Portfolio for such liability.
The over-the-counter (OTC) derivatives in which the Portfolio invests are subject to the risk that the counterparty to the contract fails to perform its obligations under the contract. To mitigate this risk, the Portfolio has entered into an International Swaps and Derivatives Association, Inc. Master Agreement (“ISDA Master Agreement”) or similar agreement with substantially all its derivative counterparties. An ISDA Master Agreement is a bilateral agreement between the Portfolio and a counterparty that governs certain OTC derivatives and typically contains, among other things, set-off provisions in the event of a default and/or termination event as defined under the relevant ISDA Master Agreement. Under an ISDA Master Agreement, the Portfolio may, under certain circumstances, offset with the counterparty certain derivative financial instruments’ payables and/or receivables with collateral held and/or posted and create one single net payment. The provisions of the ISDA Master Agreement typically permit a single net payment in the event of default including the bankruptcy or insolvency of the counterparty. However, bankruptcy or insolvency laws of a particular jurisdiction may impose restrictions on or prohibitions against the right of offset in bankruptcy or insolvency. Certain ISDA Master Agreements allow counterparties to OTC derivatives to terminate derivative contracts prior to maturity in the event the Portfolio’s net assets decline by a stated percentage or the Portfolio fails to meet the terms of its ISDA Master Agreements, which would cause the counterparty to accelerate payment by the Portfolio of any net liability owed to it.
The collateral requirements for derivatives traded under an ISDA Master Agreement are governed by a Credit Support Annex to the ISDA Master Agreement. Collateral requirements are determined at the close of business each day and are typically based on changes in market values for each transaction under an ISDA Master Agreement and netted into one amount for such agreement. Generally, the amount of collateral due from or to a counterparty is subject to a
High Income Opportunities Portfolio
October 31, 2023
Notes to Financial Statements — continued
minimum transfer threshold amount before a transfer is required, which may vary by counterparty. Collateral pledged for the benefit of the Portfolio and/or counterparty is held in segregated accounts by the Portfolio’s custodian and cannot be sold, re-pledged, assigned or otherwise used while pledged. The portion of such collateral representing cash, if any, is reflected as deposits for derivatives collateral and, in the case of cash pledged by a counterparty for the benefit of the Portfolio, a corresponding liability on the Statement of Assets and Liabilities. Securities pledged by the Portfolio as collateral, if any, are identified as such in the Portfolio of Investments.
The fair value of open derivative instruments (not considered to be hedging instruments for accounting disclosure purposes) and whose primary underlying risk exposure is foreign exchange risk at October 31, 2023 was as follows:
| | Fair Value |
| Derivative | Asset Derivative | Liability Derivative |
| Forward foreign currency exchange contracts | $5,421 (1) | $(3,673) (2) |
| (1) | Statement of Assets and Liabilities location: Receivable for forward foreign currency exchange contracts. |
| (2) | Statement of Assets and Liabilities location: Payable for open forward foreign currency exchange contracts. |
The Portfolio's derivative assets and liabilities at fair value by type, which are reported gross in the Statement of Assets and Liabilities, are presented in the table above. The following tables present the Portfolio's derivative assets and liabilities by counterparty, net of amounts available for offset under a master netting agreement and net of the related collateral received by the Portfolio for such assets and pledged by the Portfolio for such liabilities as of October 31, 2023.
| Counterparty | Derivative
Assets Subject to
Master Netting
Agreement | Derivatives
Available
for Offset | Non-cash
Collateral
Received(a) | Cash
Collateral
Received(a) | Net Amount
of Derivative
Assets(b) |
| State Street Bank and Trust Company | $5,421 | $(3,673) | $ — | $ — | $1,748 |
| Counterparty | Derivative
Liabilities Subject to
Master Netting
Agreement | Derivatives
Available
for Offset | Non-cash
Collateral
Pledged(a) | Cash
Collateral
Pledged(a) | Net Amount
of Derivative
Liabilities(c) |
| State Street Bank and Trust Company | $(3,673) | $3,673 | $ — | $ — | $ — |
| (a) | In some instances, the total collateral received and/or pledged may be more than the amount shown due to overcollateralization. |
| (b) | Net amount represents the net amount due from the counterparty in the event of default. |
| (c) | Net amount represents the net amount payable to the counterparty in the event of default. |
The effect of derivative instruments (not considered to be hedging instruments for accounting disclosure purposes) on the Statement of Operations and whose primary underlying risk exposure and whose primary underlying risk exposure is foreign exchange risk is foreign exchange risk for the year ended October 31, 2023 was as follows:
| Derivative | Realized Gain (Loss)
on Derivatives Recognized
in Income(1) | Change in Unrealized
Appreciation (Depreciation) on
Derivatives Recognized in Income(2) |
| Forward foreign currency exchange contracts | $(528,593) | $(198,181) |
| (1) | Statement of Operations location: Net realized gain (loss): Forward foreign currency exchange contracts. |
| (2) | Statement of Operations location: Change in unrealized appreciation (depreciation): Forward foreign currency exchange contracts. |
High Income Opportunities Portfolio
October 31, 2023
Notes to Financial Statements — continued
The average notional amount of forward foreign currency exchange contracts (based on the absolute value of notional amounts of currency purchased and currency sold) outstanding during the year ended October 31, 2023, which is indicative of the volume of this derivative type, was approximately $20,831,000.
7 Line of Credit
The Portfolio participates with other portfolios and funds managed by BMR and its affiliates in a $650 million unsecured revolving line of credit agreement with a group of banks, which is in effect through October 22, 2024. In connection with the renewal of the agreement on October 24, 2023, the borrowing limit was decreased from $725 million. Borrowings are made by the Portfolio solely for temporary purposes related to redemptions and other short-term cash needs. Interest is charged to the Portfolio based on its borrowings at an amount above either the Secured Overnight Financing Rate (SOFR) or Federal Funds rate. In addition, a fee computed at an annual rate of 0.15% on the daily unused portion of the line of credit is allocated among the participating portfolios and funds at the end of each quarter. In connection with the renewal of the agreement in October 2023, an arrangement fee totaling $150,000 was incurred that was allocated to the participating portfolios and funds. Because the line of credit is not available exclusively to the Portfolio, it may be unable to borrow some or all of its requested amounts at any particular time. The Portfolio did not have any significant borrowings or allocated fees during the year ended October 31, 2023.
8 Affiliated Investments
At October 31, 2023, the value of the Portfolio's investment in funds that may be deemed to be affiliated was $37,843,239, which represents 3.5% of the Portfolio's net assets. Transactions in such investments by the Portfolio for the year ended October 31, 2023 were as follows:
| Name | Value,
beginning
of period | Purchases | Sales
proceeds | Net
realized
gain (loss) | Change in
unrealized
appreciation
(depreciation) | Value, end
of period | Dividend
income | Shares,
end of period |
| Short-Term Investments |
| Liquidity Fund | $37,909,716 | $420,330,355 | $(420,396,832) | $ — | $ — | $37,843,239 | $2,059,660 | 37,843,239 |
9 Fair Value Measurements
Under generally accepted accounting principles for fair value measurements, a three-tier hierarchy to prioritize the assumptions, referred to as inputs, is used in valuation techniques to measure fair value. The three-tier hierarchy of inputs is summarized in the three broad levels listed below.
| • | Level 1 – quoted prices in active markets for identical investments |
| • | Level 2 – other significant observable inputs (including quoted prices for similar investments, interest rates, prepayment speeds, credit risk, etc.) |
| • | Level 3 – significant unobservable inputs (including a fund's own assumptions in determining the fair value of investments) |
In cases where the inputs used to measure fair value fall in different levels of the fair value hierarchy, the level disclosed is determined based on the lowest level input that is significant to the fair value measurement in its entirety. The inputs or methodology used for valuing securities are not necessarily an indication of the risk associated with investing in those securities.
At October 31, 2023, the hierarchy of inputs used in valuing the Portfolio’s investments and open derivative instruments, which are carried at fair value, were as follows:
| Asset Description | Level 1 | Level 2 | Level 3* | Total |
| Asset-Backed Securities | $ — | $ 18,800,846 | $ — | $ 18,800,846 |
| Common Stocks | 3,878,904 | — | 1,380,162 | 5,259,066 |
| Convertible Bonds | — | 8,820,395 | — | 8,820,395 |
| Corporate Bonds | — | 937,978,972 | — | 937,978,972 |
| Preferred Stocks | 3,932,030 | — | — | 3,932,030 |
| Senior Floating-Rate Loans | — | 56,293,184 | — | 56,293,184 |
| Miscellaneous | — | 45,180 | 4,402,942 | 4,448,122 |
High Income Opportunities Portfolio
October 31, 2023
Notes to Financial Statements — continued
| Asset Description (continued) | Level 1 | Level 2 | Level 3* | Total |
| Short-Term Investments | $ 37,843,239 | $ — | $ — | $ 37,843,239 |
| Total Investments | $ 45,654,173 | $ 1,021,938,577 | $ 5,783,104 | $ 1,073,375,854 |
| Forward Foreign Currency Exchange Contracts | $ — | $ 5,421 | $ — | $ 5,421 |
| Total | $ 45,654,173 | $ 1,021,943,998 | $ 5,783,104 | $ 1,073,381,275 |
| Liability Description | | | | |
| Forward Foreign Currency Exchange Contracts | $ — | $ (3,673) | $ — | $ (3,673) |
| Total | $ — | $ (3,673) | $ — | $ (3,673) |
| * | None of the unobservable inputs for Level 3 assets, individually or collectively, had a material impact on the Portfolio. |
The following is a reconciliation of Level 3 investments for which significant unobservable inputs were used to determine fair value:
| | Common Stocks | Convertible
Preferred Stocks | Miscellaneous | Total |
| Balance as of October 31, 2022 | $ 1,990,956 | $ — | $ 34,364,043 | $ 36,354,999 |
| Realized gains (losses) | (2,037,720) | (1,261,487) | 37,689,526 | 34,390,319 |
| Change in net unrealized appreciation (depreciation) | 1,408,847 | 1,239,137 | (29,665,729) | (27,017,745) |
| Cost of purchases | — | — | 0 | 0 |
| Proceeds from sales, including return of capital | — | — | (37,984,898) | (37,984,898) |
| Accrued discount (premium) | — | — | — | — |
| Transfers to Level 3(1) | 18,079 | 22,350 | — | 40,429 |
| Transfers from Level 3 | — | — | — | — |
| Balance as of October 31, 2023 | $ 1,380,162 | $ — | $ 4,402,942 | $ 5,783,104 |
| Change in net unrealized appreciation (depreciation) on investments still held as of October 31, 2023 | $ (610,794) | $ — | $ (3,800,964) | $ (4,411,758) |
| (1) | Transferred to Level 3 due to a decrease in observable inputs. |
The following is a summary of quantitative information about significant unobservable valuation inputs for Level 3 investments held as of October 31, 2023:
| Type of Investment | Fair Value as of
October 31, 2023 | Valuation Technique | Unobservable Input | Input | Impact to
Valuation from an
Increase to Input* |
| Common Stocks | $1,380,162 | Market approach | EBITDA multiple discount rate | 15% | Decrease |
| Miscellaneous | 4,402,942 | Market approach | Liquidity discount | 15% | Decrease |
| Included in common stocks and miscellaneous are securites valued at $0 based on their estimated recovery value percentage. |
| * | Represents the directional change in the fair value of the Level 3 investments that would result from an increase to the corresponding unobservable input. A decrease to the unobservable input would have the opposite effect. |
High Income Opportunities Portfolio
October 31, 2023
Notes to Financial Statements — continued
10 Risks and Uncertainties
Credit Risk
The Portfolio primarily invests in lower rated and comparable quality unrated high yield securities. These investments have different risks than investments in debt securities rated investment grade. Risk of loss upon default by the borrower is significantly greater with respect to such debt than with other debt securities because these securities are generally unsecured and are more sensitive to adverse economic conditions, such as recession or increasing interest rates, than are investment grade issuers.
High Income Opportunities Portfolio
October 31, 2023
Report of Independent Registered Public Accounting Firm
To the Trustees and Investors of High Income Opportunities Portfolio:
Opinion on the Financial Statements and Financial Highlights
We have audited the accompanying statement of assets and liabilities of High Income Opportunities Portfolio (the “Portfolio"), including the portfolio of investments, as of October 31, 2023, the related statement of operations for the year then ended, the statements of changes in net assets for each of the two years in the period then ended, the financial highlights for each of the five years in the period then ended, and the related notes. In our opinion, the financial statements and financial highlights present fairly, in all material respects, the financial position of the Portfolio as of October 31, 2023, and the results of its operations for the year then ended, the changes in its net assets for each of the two years in the period then ended, and the financial highlights for each of the five years in the period then ended, in conformity with accounting principles generally accepted in the United States of America.
Basis for Opinion
These financial statements and financial highlights are the responsibility of the Portfolio’s management. Our responsibility is to express an opinion on the Portfolio’s financial statements and financial highlights based on our audits. We are a public accounting firm registered with the Public Company Accounting Oversight Board (United States) (PCAOB) and are required to be independent with respect to the Portfolio in accordance with the U.S. federal securities laws and the applicable rules and regulations of the Securities and Exchange Commission and the PCAOB.
We conducted our audits in accordance with the standards of the PCAOB. Those standards require that we plan and perform the audit to obtain reasonable assurance about whether the financial statements and financial highlights are free of material misstatement, whether due to error or fraud. The Portfolio is not required to have, nor were we engaged to perform, an audit of its internal control over financial reporting. As part of our audits, we are required to obtain an understanding of internal control over financial reporting but not for the purpose of expressing an opinion on the effectiveness of the Portfolio’s internal control over financial reporting. Accordingly, we express no such opinion.
Our audits included performing procedures to assess the risks of material misstatement of the financial statements and financial highlights, whether due to error or fraud, and performing procedures that respond to those risks. Such procedures included examining, on a test basis, evidence regarding the amounts and disclosures in the financial statements and financial highlights. Our audits also included evaluating the accounting principles used and significant estimates made by management, as well as evaluating the overall presentation of the financial statements and financial highlights. Our procedures included confirmation of securities and senior loans owned as of October 31, 2023, by correspondence with the custodian, brokers, and agent banks; when replies were not received from brokers and agent banks, we performed other auditing procedures. We believe that our audits provide a reasonable basis for our opinion.
/s/ Deloitte & Touche LLP
Boston, Massachusetts
December 22, 2023
We have served as the auditor of one or more Eaton Vance investment companies since 1959.
Eaton Vance
High Income Opportunities Fund
October 31, 2023
Board of Trustees’ Contract Approval
Overview of the Contract Review Process
The Investment Company Act of 1940, as amended (the “1940 Act”), provides, in substance, that the investment advisory agreement between a fund and its investment adviser will continue in effect from year-to-year only if its continuation is approved on an annual basis by a vote of the fund’s board of trustees, including a majority of the trustees who are not “interested persons” of the fund (“independent trustees”), cast in person at a meeting called for the purpose of considering such approval.
At a meeting held on June 8, 2023, the Boards of Trustees/Directors (collectively, the “Board”) that oversee the registered investment companies advised by Eaton Vance Management or its affiliate, Boston Management and Research (the “Eaton Vance Funds”), including a majority of the independent trustees (the “Independent Trustees”), voted to approve the continuation of existing investment advisory agreements and sub-advisory agreements1 for each of the Eaton Vance Funds for an additional one-year period. The Board relied upon the affirmative recommendation of its Contract Review Committee, which is a committee exclusively comprised of Independent Trustees. Prior to making its recommendation, the Contract Review Committee reviewed information furnished by the adviser and sub-adviser to each of the Eaton Vance Funds (including information specifically requested by the Board) for a series of formal meetings held between April and June 2023, as well as certain additional information provided in response to specific requests from the Independent Trustees as members of the Contract Review Committee. Members of the Contract Review Committee also considered information received at prior meetings of the Board and its committees, to the extent such information was relevant to the Contract Review Committee’s annual evaluation of the investment advisory agreements and sub-advisory agreements.
In connection with its evaluation of the investment advisory agreements and sub-advisory agreements, the Board considered various information relating to the Eaton Vance Funds. This included information applicable to all or groups of Eaton Vance Funds, which is referenced immediately below, and information applicable to the particular Eaton Vance Fund covered by this report (each “Eaton Vance Fund” is referred to below as a “fund”). (For funds that invest through one or more underlying portfolios, references to “each fund” in this section may include information that was considered at the portfolio-level.)
Information about Fees, Performance and Expenses
• A report from an independent data provider comparing advisory and other fees paid by each fund to such fees paid by comparable funds, as identified by the independent data provider (“comparable funds”);
• A report from an independent data provider comparing each fund’s total expense ratio (and its components) to those of comparable funds;
• A report from an independent data provider comparing the investment performance of each fund (including, as relevant, total return data, income data, Sharpe ratios and information ratios) to the investment performance of comparable funds and, as applicable, benchmark indices, over various time periods;
• In certain instances, data regarding investment performance relative to customized groups of peer funds and blended indices identified by the adviser in consultation with the Portfolio Management Committee of the Board (a committee exclusively comprised of Independent Trustees);
• Comparative information concerning the fees charged and services provided by the adviser and sub-adviser to each fund in managing other accounts (which may include other mutual funds, collective investment funds and institutional accounts) using investment strategies and techniques similar to those used in managing such fund(s), if any;
• Profitability analyses with respect to the adviser and sub-adviser to each of the funds;
Information about Portfolio Management and Trading
• Descriptions of the investment management services provided to each fund, as well as each of the funds’ investment strategies and policies;
• The procedures and processes used to determine the value of fund assets, including, when necessary, the determination of “fair value” and actions taken to monitor and test the effectiveness of such procedures and processes;
• Information about the policies and practices of each fund’s adviser and sub-adviser with respect to trading, including their processes for seeking best execution of portfolio transactions;
• Information about the allocation of brokerage transactions and the benefits, if any, received by the adviser and sub-adviser to each fund as a result of brokerage allocation, including, as applicable, information concerning the acquisition of research through client commission arrangements and policies with respect to “soft dollars”;
• Data relating to the portfolio turnover rate of each fund and related information regarding active management in the context of particular strategies;
Information about each Adviser and Sub-adviser
• Reports detailing the financial results and condition of the adviser and sub-adviser to each fund;
• Information regarding the individual investment professionals whose responsibilities include portfolio management and investment research for the funds, and, for portfolio managers and certain other investment professionals, information relating to their responsibilities with respect to managing other mutual funds and investment accounts, as applicable;
1 Not all Eaton Vance Funds have entered into a sub-advisory agreement with a sub-adviser. Accordingly, references to “sub-adviser” or “sub-advisory agreement” in this “Overview” section may not be applicable to the particular Eaton Vance Fund covered by this report.
Eaton Vance
High Income Opportunities Fund
October 31, 2023
Board of Trustees’ Contract Approval — continued
• Information regarding the adviser’s and its parent company’s (Morgan Stanley’s) efforts to retain and attract talented investment professionals, including in the context of a competitive marketplace for talent, as well as the ongoing unique environment presented by hybrid, remote and other alternative work arrangements;
• Information regarding the adviser’s compensation methodology for its investment professionals and the incentives and accountability it creates, along with investment professionals’ investments in the fund(s) they manage;
• The Code of Ethics of the adviser and its affiliates and the sub-adviser of each fund, together with information relating to compliance with, and the administration of, such codes;
• Policies and procedures relating to proxy voting, including regular reporting with respect to fund proxy voting activities;
• Information regarding the handling of corporate actions and class actions, as well as information regarding litigation and other regulatory matters;
• Information concerning the resources devoted to compliance efforts undertaken by the adviser and its affiliates and the sub-adviser of each fund, if any, including descriptions of their various compliance programs and their record of compliance;
• Information concerning the business continuity and disaster recovery plans of the adviser and its affiliates and the sub-adviser of each fund, if any;
• A description of Eaton Vance Management’s and Boston Management and Research’s oversight of sub-advisers, including with respect to regulatory and compliance issues, investment management and other matters;
Other Relevant Information
• Information regarding ongoing initiatives to further integrate and harmonize, where applicable, the investment management and other departments of the adviser and its affiliates with the overall investment management infrastructure of Morgan Stanley, in light of Morgan Stanley’s acquisition of Eaton Vance Corp. on March 1, 2021;
• Information concerning the nature, cost and character of the administrative and other non-investment advisory services provided by Eaton Vance Management and its affiliates;
• Information concerning oversight of the relationship with the custodian, subcustodians, fund accountants, and other third-party service providers by the adviser and/or administrator to each of the funds;
• Information concerning efforts to implement policies and procedures with respect to various recently adopted regulations applicable to the funds, including Rule 12d1-4 (the Fund-of-Funds Rule), Rule 18f-4 (the Derivatives Rule) and Rule 2a-5 (the Fair Valuation Rule);
• For an Eaton Vance Fund structured as an exchange-listed closed-end fund, information concerning the benefits of the closed-end fund structure, as well as, where relevant, the closed-end fund’s market prices (including as compared to the closed-end fund’s net asset value (NAV)), trading volume data, continued use of auction preferred shares (where applicable), distribution rates and other relevant matters;
• The risks which the adviser and/or its affiliates incur in connection with the management and operation of the funds, including, among others, litigation, regulatory, entrepreneurial, and other business risks (and the associated costs of such risks); and
• The terms of each investment advisory agreement and sub-advisory agreement.
During the various meetings of the Board and its committees over the course of the year leading up to the June 8, 2023 meeting, the Board received information from portfolio managers and other investment professionals of the advisers and sub-advisers of the funds regarding investment and performance matters, and considered various investment and trading strategies used in pursuing the funds’ investment objectives. The Board also received information regarding risk management techniques employed in connection with the management of the funds. The Board and its committees evaluated issues pertaining to industry and regulatory developments, compliance procedures, fund governance and other issues with respect to the funds, and received and participated in reports and presentations provided by Eaton Vance Management, Boston Management and Research and fund sub-advisers, with respect to such matters. In addition to the formal meetings of the Board and its committees, the Independent Trustees held regular teleconferences to discuss, among other topics, matters relating to the continuation of investment advisory agreements and sub-advisory agreements.
The Contract Review Committee was advised throughout the contract review process by Goodwin Procter LLP, independent legal counsel for the Independent Trustees. The members of the Contract Review Committee, with the advice of such counsel, exercised their own business judgment in determining the material factors to be considered in evaluating each investment advisory agreement and sub-advisory agreement and the weight to be given to each such factor. The conclusions reached with respect to each investment advisory agreement and sub-advisory agreement were based on a comprehensive evaluation of all the information provided and not any single factor. Moreover, each member of the Contract Review Committee may have placed varying emphasis on particular factors in reaching conclusions with respect to each investment advisory agreement and sub-advisory agreement. In evaluating each investment advisory agreement and sub-advisory agreement, including the fee structures and other terms contained in such agreements, the members of the Contract Review Committee were also informed by multiple years of analysis and discussion with the adviser and sub-adviser to each of the Eaton Vance Funds.
Results of the Contract Review Process
Based on its consideration of the foregoing, and such other information it deemed relevant, including the factors and conclusions described below, the Contract Review Committee concluded that the continuation of the investment advisory agreement between Eaton Vance High Income Opportunities Fund (the “Fund”) and Eaton Vance Management (“EVM”), as well as the investment advisory agreement between High Income Opportunities Portfolio (the “Portfolio”), the portfolio in which the Fund invests, and Boston Management and Research (“BMR”) (EVM, with respect to the Fund, and BMR, with respect to the Portfolio, are each referred to herein as the “Adviser”), and the sub-advisory agreement between EVM and Eaton Vance Advisers International
Eaton Vance
High Income Opportunities Fund
October 31, 2023
Board of Trustees’ Contract Approval — continued
Ltd. (the “Sub-adviser”), an affiliate of the Advisers, with respect to the Fund, and the sub-advisory agreement between BMR and the Sub-adviser, with respect to the Portfolio, including their respective fee structures, are in the interests of shareholders and, therefore, recommended to the Board approval of each agreement. Based on the recommendation of the Contract Review Committee, the Board, including a majority of the Independent Trustees, voted to approve continuation of the investment advisory agreements for the Fund and the Portfolio (together, the “investment advisory agreements”) and the sub-advisory agreements for the Fund and the Portfolio (together, the “sub-advisory agreements”).
Nature, Extent and Quality of Services
In considering whether to approve the investment advisory agreements and sub-advisory agreements for the Fund and the Portfolio, the Board evaluated the nature, extent and quality of services provided to the Fund and to the Portfolio by the applicable Adviser and the Sub-adviser, respectively.
The Board considered each Adviser’s and the Sub-adviser’s management capabilities and investment processes in light of the types of investments held by the Fund and the Portfolio, including the education, experience and number of investment professionals and other personnel who provide portfolio management, investment research, and similar services to the Fund and the Portfolio. Regarding each Adviser, the Board considered the Adviser’s responsibilities with respect to oversight of the Sub-adviser. The Board also considered the abilities and experience of each Adviser’s investment professionals in analyzing special considerations relevant to investing in high-yield debt. With respect to the Sub-adviser, the Board considered the abilities and experience of the Sub-adviser’s investment professionals in analyzing factors such as special considerations relevant to investing in global high yield debt and foreign markets. The Board considered the international investment capabilities of the Sub-adviser, which is based in London, and the benefits to the Fund and the Portfolio of having portfolio management services involving investments in international securities provided by investment professionals located abroad. The Board also took into account the resources dedicated to portfolio management and other services, the compensation methods of each Adviser and other factors, including the reputation and resources of each Adviser to recruit and retain highly qualified research, advisory and supervisory investment professionals. In addition, the Board considered the time and attention devoted to the Eaton Vance Funds, including the Fund and the Portfolio, by senior management, as well as the infrastructure, operational capabilities and support staff in place to assist in the portfolio management and operations of the Fund and the Portfolio, including the provision of administrative services. The Board also considered the business-related and other risks to which each Adviser or its affiliates may be subject in managing the Fund and the Portfolio.
The Board noted that, under the terms of the investment advisory agreement of the Fund, EVM may invest assets of the Fund directly in securities, for which it would receive a fee, or in the Portfolio, for which it receives no separate fee but for which BMR receives an advisory fee from the Portfolio.
The Board considered the compliance programs of each Adviser and relevant affiliates thereof, including the Sub-adviser. The Board considered compliance and reporting matters regarding, among other things, personal trading by investment professionals, disclosure of portfolio holdings, late trading, frequent trading, portfolio valuation, business continuity and the allocation of investment opportunities. The Board also considered the responses of each Adviser and its affiliates to requests in recent years from regulatory authorities, such as the Securities and Exchange Commission and the Financial Industry Regulatory Authority.
The Board considered other administrative services provided or overseen by EVM and its affiliates, including transfer agency and accounting services. The Board evaluated the benefits to shareholders of investing in a fund that is a part of a large fund complex offering exposure to a variety of asset classes and investment disciplines, as well as the ability, in many cases, to exchange an investment among different funds without incurring additional sales charges.
After consideration of the foregoing factors, among others, the Board concluded that the nature, extent and quality of services provided by each Adviser and the Sub-adviser, taken as a whole, are appropriate and consistent with the terms of the applicable investment advisory agreement and the applicable sub-advisory agreement.
Fund Performance
The Board compared the Fund’s investment performance to that of comparable funds identified by an independent data provider (the peer group), as well as appropriate benchmark indices. The Board’s review included comparative performance data with respect to the Fund for the one-, three-, five- and ten-year periods ended December 31, 2022. In this regard, the Board noted that the performance of the Fund was higher than the median performance of the Fund’s peer group for the three-year period. The Board also noted that the performance of the Fund was higher than its primary and secondary benchmark indexes for the three-year period. The Board concluded that the performance of the Fund was satisfactory.
Management Fees and Expenses
The Board considered contractual fee rates payable by the Portfolio and by the Fund for advisory and administrative services (referred to collectively as “management fees”). As part of its review, the Board considered the Fund’s management fees and total expense ratio for the one-year period ended December 31, 2022, as compared to those of comparable funds, before and after giving effect to any undertaking to waive fees or reimburse expenses. The Board also received and considered information about the services offered and the fee rates charged by the Adviser and/or Sub-adviser to other types of accounts with investment objectives and strategies that are substantially similar to and/or managed in a similar investment style as the Portfolio. In this regard, the Board received information about the differences in the nature and scope of services the Adviser and/or Sub-adviser provide to the Portfolio as compared to other types of accounts and the material differences in compliance, reporting and other legal burdens and risks to the Adviser and/or Sub-adviser as between the Portfolio and other types of accounts. The Board also considered factors that had an impact on the Fund’s total expense ratio relative to comparable funds.
Eaton Vance
High Income Opportunities Fund
October 31, 2023
Board of Trustees’ Contract Approval — continued
After considering the foregoing information, and in light of the nature, extent and quality of the services provided by each Adviser and the Sub-adviser, the Board concluded that the management fees charged for advisory and related services are reasonable.
Profitability and “Fall-Out” Benefits
The Board considered the level of profits realized by each Adviser and relevant affiliates thereof, including the Sub-adviser, in providing investment advisory and administrative services to the Fund, to the Portfolio and to all Eaton Vance Funds as a group. The Board considered the level of profits realized without regard to marketing support or other payments by each Adviser and its affiliates to third parties in respect of distribution or other services.
The Board concluded that, in light of the foregoing factors and the nature, extent and quality of the services rendered, the profits realized by each Adviser and its affiliates, including the Sub-adviser, are deemed not to be excessive.
The Board also considered direct or indirect fall-out benefits received by each Adviser and its affiliates, including the Sub-adviser, in connection with their respective relationships with the Fund and the Portfolio, including the benefits of research services that may be available to each Adviser or the Sub-adviser as a result of securities transactions effected for the Fund and the Portfolio and other investment advisory clients.
Economies of Scale
In reviewing management fees and profitability, the Board also considered the extent to which the applicable Adviser and its affiliates, on the one hand, and the Fund and the Portfolio, on the other hand, can expect to realize benefits from economies of scale as the assets of the Fund and the Portfolio increase. The Board acknowledged the difficulty in accurately measuring the benefits resulting from economies of scale, if any, with respect to the management of any specific fund or group of funds. The Board reviewed data summarizing the increases and decreases in the assets of the Fund and of all Eaton Vance Funds as a group over various time periods, and evaluated the extent to which the total expense ratio of the Fund and the profitability of each Adviser and its affiliates may have been affected by such increases or decreases. Based upon the foregoing, the Board concluded that the Fund currently shares in the benefits from economies of scale, if any, when they are realized by the Adviser. The Board also concluded that the structure of the advisory fees, which include breakpoints at several asset levels, will allow the Fund and the Portfolio to continue to benefit from any economies of scale in the future.
High Income Opportunities Portfolio
October 31, 2023
Liquidity Risk Management Program
The Fund has implemented a written liquidity risk management program (Program) and related procedures to manage its liquidity in accordance with Rule 22e-4 under the Investment Company Act of 1940, as amended (Liquidity Rule). The Liquidity Rule defines “liquidity risk” as the risk that a fund could not meet requests to redeem shares issued by the fund without significant dilution of the remaining investors’ interests in the fund. The Fund’s Board of Trustees/Directors has designated the investment adviser to serve as the administrator of the Program and the related procedures. The administrator has established a Liquidity Risk Management Oversight Committee (Committee) to perform the functions necessary to administer the Program. As part of the Program, the administrator is responsible for identifying illiquid investments and categorizing the relative liquidity of the Fund’s investments in accordance with the Liquidity Rule. Under the Program, the administrator assesses, manages, and periodically reviews the Fund’s liquidity risk, and is responsible for making certain reports to the Fund’s Board of Trustees/Directors and the Securities and Exchange Commission (SEC) regarding the liquidity of the Fund’s investments, and to notify the Board of Trustees/Directors and the SEC of certain liquidity events specified in the Liquidity Rule. The liquidity of the Fund’s portfolio investments is determined based on a number of factors including, but not limited to, relevant market, trading and investment-specific considerations under the Program.
At a meeting of the Fund’s Board of Trustees/Directors on June 7, 2023, the Committee provided a written report to the Fund’s Board of Trustees/
Directors pertaining to the operation, adequacy, and effectiveness of implementation of the Program, as well as the operation of the highly liquid investment minimum (if applicable) for the period January 1, 2022 through December 31, 2022 (Review Period). The Program operated effectively during the Review Period, supporting the administrator’s ability to assess, manage and monitor Fund liquidity risk, including during periods of market volatility and net redemptions. During the Review Period, the Fund met redemption requests on a timely basis.
There can be no assurance that the Program will achieve its objectives in the future. Please refer to the Fund’s prospectus for more information regarding the Fund’s exposure to liquidity risk and other principal risks to which an investment in the Fund may be subject.
Eaton Vance
High Income Opportunities Fund
October 31, 2023
Management and Organization
Fund Management. The Trustees of Eaton Vance Mutual Funds Trust (the Trust) and High Income Opportunities Portfolio (the Portfolio) are responsible for the overall management and supervision of the Trust's and the Portfolio's affairs. The Board members and officers of the Trust and the Portfolio are listed below. Except as indicated, each individual has held the office shown or other offices in the same company for the last five years. Board members hold indefinite terms of office. Each Trustee holds office until his or her successor is elected and qualified, subject to a prior death, resignation, retirement, disqualification or removal. Under the terms of the Fund's and the Portfolio's current Trustee retirement policy, an Independent Trustee must retire and resign as a Trustee on the earlier of: (i) the first day of July following his or her 74th birthday; or (ii), with limited exception, December 31st of the 20th year in which he or she has served as a Trustee. However, if such retirement and resignation would cause the Fund and the Portfolio to be out of compliance with Section 16 of the 1940 Act or any other regulations or guidance of the SEC, then such retirement and resignation will not become effective until such time as action has been taken for the Fund and the Portfolio to be in compliance therewith. The “noninterested Trustees” consist of those Trustees who are not “interested persons” of the Trust and the Portfolio, as that term is defined under the 1940 Act. The business address of each Board member and officer is Two International Place, Boston, Massachusetts 02110. As used below, “BMR” refers to Boston Management and Research, “EV” refers to EV LLC, “EVM” refers to Eaton Vance Management, "MSIM" refers to Morgan Stanley Investment Management Inc. and “EVD” refers to Eaton Vance Distributors, Inc. EV is the trustee of each of EVM and BMR. Each of EVM, BMR, EVD and EV are indirect, wholly owned subsidiaries of Morgan Stanley. Each officer affiliated with EVM may hold a position with other EVM affiliates that is comparable to his or her position with EVM listed below. Each Trustee oversees 127 funds in the Eaton Vance fund complex (including both funds and portfolios in a hub and spoke structure).
| Name and Year of Birth | Trust/Portfolio
Position(s) | Length of Service | Principal Occupation(s) and Other Directorships
During Past Five Years and Other Relevant Experience |
| Interested Trustee |
Anchal Pachnanda(1)
1980 | Trustee | Since 2023 | Co-Head of Strategy of MSIM (since 2019). Formerly, Head of Strategy of MSIM (2017-2019). Ms. Pachnanda is an interested person because of her position with MSIM, which is an affiliate of the Trust.
Other Directorships. None. |
| Noninterested Trustees |
Alan C. Bowser
1962 | Trustee | Since 2022 | Private investor. Formerly, Chief Diversity Officer, Partner and a member of the Operating Committee, and formerly served as Senior Advisor on Diversity and Inclusion for the firm’s chief executive officer, Co-Head of the Americas Region, and Senior Client Advisor of Bridgewater Associates, an asset management firm (2011- 2023).
Other Directorships. Independent Director of Stout Risius Ross (a middle market professional services advisory firm) (since 2021). |
Mark R. Fetting
1954 | Trustee | Since 2016 | Private investor. Formerly held various positions at Legg Mason, Inc. (investment management firm) (2000-2012), including President, Chief Executive Officer, Director and Chairman (2008-2012), Senior Executive Vice President (2004-2008) and Executive Vice President (2001-2004). Formerly, President of Legg Mason family of funds (2001-2008). Formerly, Division President and Senior Officer of Prudential Financial Group, Inc. and related companies (investment management firm) (1991-2000).
Other Directorships. None. |
Cynthia E. Frost
1961 | Trustee | Since 2014 | Private investor. Formerly, Chief Investment Officer of Brown University (university endowment) (2000-2012). Formerly, Portfolio Strategist for Duke Management Company (university endowment manager) (1995-2000). Formerly, Managing Director, Cambridge Associates (investment consulting company) (1989-1995). Formerly, Consultant, Bain and Company (management consulting firm) (1987-1989). Formerly, Senior Equity Analyst, BA Investment Management Company (1983-1985).
Other Directorships. None. |
George J. Gorman
1952 | Chairperson
of the Board
and Trustee | Since 2021
(Chairperson) and
2014 (Trustee) | Principal at George J. Gorman LLC (consulting firm). Formerly, Senior Partner at Ernst & Young LLP (a registered public accounting firm) (1974-2009).
Other Directorships. None. |
Eaton Vance
High Income Opportunities Fund
October 31, 2023
Management and Organization — continued
| Name and Year of Birth | Trust/Portfolio
Position(s) | Length of Service | Principal Occupation(s) and Other Directorships
During Past Five Years and Other Relevant Experience |
| Noninterested Trustees (continued) |
Valerie A. Mosley
1960 | Trustee | Since 2014 | Chairwoman and Chief Executive Officer of Valmo Ventures (a consulting and investment firm). Founder of Upward Wealth, Inc., dba BrightUp, a fintech platform. Formerly, Partner and Senior Vice President, Portfolio Manager and Investment Strategist at Wellington Management Company, LLP (investment management firm) (1992-2012). Formerly, Chief Investment Officer, PG Corbin Asset Management (1990-1992). Formerly worked in institutional corporate bond sales at Kidder Peabody (1986-1990).
Other Directorships. Director of DraftKings, Inc. (digital sports entertainment and gaming company) (since September 2020). Director of Envestnet, Inc. (provider of intelligent systems for wealth management and financial wellness) (since 2018). Formerly, Director of Dynex Capital, Inc. (mortgage REIT) (2013-2020) and Director of Groupon, Inc. (ecommerce provider) (2020-2022). |
Keith Quinton
1958 | Trustee | Since 2018 | Private investor, researcher and lecturer. Formerly, Independent Investment Committee Member at New Hampshire Retirement System (2017-2021). Formerly, Portfolio Manager and Senior Quantitative Analyst at Fidelity Investments (investment management firm) (2001-2014).
Other Directorships. Formerly, Director (2016-2021) and Chairman (2019-2021) of New Hampshire Municipal Bond Bank. |
Marcus L. Smith
1966 | Trustee | Since 2018 | Private investor and independent corporate director. Formerly, Chief Investment Officer, Canada (2012-2017), Chief Investment Officer, Asia (2010-2012), Director of Asian Research (2004-2010) and portfolio manager (2001-2017) at MFS Investment Management (investment management firm).
Other Directorships. Director of First Industrial Realty Trust, Inc. (an industrial REIT) (since 2021). Director of MSCI Inc. (global provider of investment decision support tools) (since 2017). Formerly, Director of DCT Industrial Trust Inc. (logistics real estate company) (2017-2018). |
Susan J. Sutherland
1957 | Trustee | Since 2015 | Private investor. Director of Ascot Group Limited and certain of its subsidiaries (insurance and reinsurance) (since 2017). Formerly, Director of Hagerty Holding Corp. (insurance) (2015-2018) and Montpelier Re Holdings Ltd. (insurance and reinsurance) (2013-2015). Formerly, Associate, Counsel and Partner at Skadden, Arps, Slate, Meagher & Flom LLP (law firm) (1982-2013).
Other Directorships. Formerly, Director of Kairos Acquisition Corp. (insurance/InsurTech acquisition company) (2021-2023). |
Scott E. Wennerholm
1959 | Trustee | Since 2016 | Private investor. Formerly, Trustee at Wheelock College (postsecondary institution) (2012-2018). Formerly, Consultant at GF Parish Group (executive recruiting firm) (2016-2017). Formerly, Chief Operating Officer and Executive Vice President at BNY Mellon Asset Management (investment management firm) (2005-2011). Formerly, Chief Operating Officer and Chief Financial Officer at Natixis Global Asset Management (investment management firm) (1997-2004). Formerly, Vice President at Fidelity Investments Institutional Services (investment management firm) (1994-1997).
Other Directorships. None. |
Nancy A. Wiser
1967 | Trustee | Since 2022 | Formerly, Executive Vice President and the Global Head of Operations at Wells Fargo Asset Management (2011-2021).
Other Directorships. None. |
| Name and Year of Birth | Trust/Portfolio
Position(s) | Length of Service | Principal Occupation(s)
During Past Five Years |
| Principal Officers who are not Trustees |
Kenneth A. Topping
1966 | President | Since 2023 | Vice President and Chief Administrative Officer of EVM and BMR and Chief Operating Officer for Public Markets at MSIM. Also Vice President of Calvert Research and Management (“CRM”) since 2021. Formerly, Chief Operating Officer for Goldman Sachs Asset Management 'Classic’ (2009-2020). |
Deidre E. Walsh
1971 | Vice President and
Chief Legal Officer | Since 2009 | Vice President of EVM and BMR. Also Vice President of CRM. |
James F. Kirchner
1967 | Treasurer | Since 2007 | Vice President of EVM and BMR. Also Vice President of CRM. |
Eaton Vance
High Income Opportunities Fund
October 31, 2023
Management and Organization — continued
| Name and Year of Birth | Trust/Portfolio
Position(s) | Length of Service | Principal Occupation(s)
During Past Five Years |
| Principal Officers who are not Trustees (continued) |
Nicholas S. Di Lorenzo
1987 | Secretary | Since 2022 | Formerly, associate (2012-2021) and counsel (2022) at Dechert LLP. |
Richard F. Froio
1968 | Chief Compliance
Officer | Since 2017 | Vice President of EVM and BMR since 2017. Formerly, Deputy Chief Compliance Officer (Adviser/Funds) and Chief Compliance Officer (Distribution) at PIMCO (2012-2017) and Managing Director at BlackRock/Barclays Global Investors (2009-2012). |
(1) Ms. Pachnanda began serving as Trustee effective April 1, 2023.
The SAI for the Fund includes additional information about the Trustees and officers of the Fund and the Portfolio and can be obtained without charge on Eaton Vance’s website at www.eatonvance.com or by calling 1-800-262-1122.
| FACTS | WHAT DOES EATON VANCE DO WITH YOUR
PERSONAL INFORMATION? |
| Why? | Financial companies choose how they share your personal information. Federal law gives consumers the right to limit some but not all sharing. Federal law also requires us to tell you how we collect, share, and protect your personal information. Please read this notice carefully to understand what we do. |
| |
| What? | The types of personal information we collect and share depend on the product or service you have with us. This information can include:■ Social Security number and income
■ investment experience and risk tolerance
■ checking account number and wire transfer instructions |
| |
| How? | All financial companies need to share customers’ personal information to run their everyday business. In the section below, we list the reasons financial companies can share their customers’ personal information; the reasons Eaton Vance chooses to share; and whether you can limit this sharing. |
Reasons we can share your
personal information | Does Eaton Vance
share? | Can you limit
this sharing? |
| For our everyday business purposes — such as to process your transactions, maintain your account(s), respond to court orders and legal investigations, or report to credit bureaus | Yes | No |
| For our marketing purposes — to offer our products and services to you | Yes | No |
| For joint marketing with other financial companies | No | We don’t share |
| For our investment management affiliates’ everyday business purposes — information about your transactions, experiences, and creditworthiness | Yes | Yes |
| For our affiliates’ everyday business purposes — information about your transactions and experiences | Yes | No |
| For our affiliates’ everyday business purposes — information about your creditworthiness | No | We don’t share |
| For our investment management affiliates to market to you | Yes | Yes |
| For our affiliates to market to you | No | We don’t share |
| For nonaffiliates to market to you | No | We don’t share |
To limit our
sharing | Call toll-free 1-800-262-1122 or email: EVPrivacy@eatonvance.comPlease note:If you are a new customer, we can begin sharing your information 30 days from the date we sent this notice. When you are no longer our customer, we continue to share your information as described in this notice. However, you can contact us at any time to limit our sharing. |
| Questions? | Call toll-free 1-800-262-1122 or email: EVPrivacy@eatonvance.com |
| Privacy Notice — continued | April 2021 |
| Who we are |
| Who is providing this notice? | Eaton Vance Management, Eaton Vance Distributors, Inc., Eaton Vance Trust Company, Eaton Vance Management (International) Limited, Eaton Vance Advisers International Ltd., Eaton Vance Global Advisors Limited, Eaton Vance Management’s Real Estate Investment Group, Boston Management and Research, Calvert Research and Management, Eaton Vance and Calvert Fund Families and our investment advisory affiliates (“Eaton Vance”) (see Investment Management Affiliates definition below) |
| What we do |
How does Eaton Vance
protect my personal
information? | To protect your personal information from unauthorized access and use, we use security measures that comply with federal law. These measures include computer safeguards and secured files and buildings. We have policies governing the proper handling of customer information by personnel and requiring third parties that provide support to adhere to appropriate security standards with respect to such information. |
How does Eaton Vance
collect my personal
information? | We collect your personal information, for example, when you■ open an account or make deposits or withdrawals from your account
■ buy securities from us or make a wire transfer
■ give us your contact informationWe also collect your personal information from others, such as credit bureaus, affiliates, or other companies. |
| Why can’t I limit all sharing? | Federal law gives you the right to limit only■ sharing for affiliates’ everyday business purposes — information about your creditworthiness
■ affiliates from using your information to market to you
■ sharing for nonaffiliates to market to youState laws and individual companies may give you additional rights to limit sharing. See below for more on your rights under state law. |
| Definitions |
Investment Management
Affiliates | Eaton Vance Investment Management Affiliates include registered investment advisers, registered broker- dealers, and registered and unregistered funds. Investment Management Affiliates does not include entities associated with Morgan Stanley Wealth Management, such as Morgan Stanley Smith Barney LLC and Morgan Stanley & Co. |
| Affiliates | Companies related by common ownership or control. They can be financial and nonfinancial companies.■ Our affiliates include companies with a Morgan Stanley name and financial companies such as Morgan Stanley Smith Barney LLC and Morgan Stanley & Co. |
| Nonaffiliates | Companies not related by common ownership or control. They can be financial and nonfinancial companies.■ Eaton Vance does not share with nonaffiliates so they can market to you. |
| Joint marketing | A formal agreement between nonaffiliated financial companies that together market financial products or services to you.■ Eaton Vance doesn’t jointly market. |
| Other important information |
| Vermont: Except as permitted by law, we will not share personal information we collect about Vermont residents with Nonaffiliates unless you provide us with your written consent to share such information.California: Except as permitted by law, we will not share personal information we collect about California residents with Nonaffiliates and we will limit sharing such personal information with our Affiliates to comply with California privacy laws that apply to us. |
Delivery of Shareholder Documents. The Securities and Exchange Commission (SEC) permits funds to deliver only one copy of shareholder documents, including prospectuses, proxy statements and shareholder reports, to fund investors with multiple accounts at the same residential or post office box address. This practice is often called “householding” and it helps eliminate duplicate mailings to shareholders. Eaton Vance, or your financial intermediary, may household the mailing of your documents indefinitely unless you instruct Eaton Vance, or your financial intermediary, otherwise. If you would prefer that your Eaton Vance documents not be householded, please contact Eaton Vance at 1-800-262-1122, or contact your financial intermediary. Your instructions that householding not apply to delivery of your Eaton Vance documents will typically be effective within 30 days of receipt by Eaton Vance or your financial intermediary.
Portfolio Holdings. Each Eaton Vance Fund and its underlying Portfolio(s) (if applicable) files a schedule of portfolio holdings on Part F to Form N-PORT with the SEC. Certain information filed on Form N-PORT may be viewed on the Eaton Vance website at www.eatonvance.com, by calling Eaton Vance at 1-800-262-1122 or in the EDGAR database on the SEC’s website at www.sec.gov.
Proxy Voting. From time to time, funds are required to vote proxies related to the securities held by the funds. The Eaton Vance Funds or their underlying Portfolios (if applicable) vote proxies according to a set of policies and procedures approved by the Funds’ and Portfolios’ Boards. You may obtain a description of these policies and procedures and information on how the Funds or Portfolios voted proxies relating to portfolio securities during the most recent 12-month period ended June 30, without charge, upon request, by calling 1-800-262-1122 and by accessing the SEC’s website at www.sec.gov.
Tailored Shareholder Reports. Effective January 24, 2023, the SEC adopted rule and form amendments to require open-end mutual funds and ETFs to transmit concise and visually engaging streamlined annual and semiannual reports to shareholders that highlight key information. Other information, including financial statements, will no longer appear in a streamlined shareholder report but must be available online, delivered free of charge upon request, and filed on a semiannual basis on Form N-CSR. The rule and form amendments have a compliance date of July 24, 2024. At this time, management is evaluating the impact of these amendments on the shareholder reports for the Eaton Vance Funds.
This Page Intentionally Left Blank
Investment Adviser of High Income Opportunities Portfolio
Boston Management and Research
Two International Place
Boston, MA 02110
Investment Sub-Adviser of High Income Opportunities Portfolio
and Eaton Vance High Income Opportunities Fund
Eaton Vance Advisers International Ltd.
125 Old Broad Street
London, EC2N 1AR
United Kingdom
Investment Adviser and Administrator of Eaton Vance High
Income Opportunities Fund
Eaton Vance Management
Two International Place
Boston, MA 02110
Principal Underwriter*
Eaton Vance Distributors, Inc.
Two International Place
Boston, MA 02110
(617) 482-8260
Custodian
State Street Bank and Trust Company
One Congress Street, Suite 1
Boston, MA 02114-2016
Transfer Agent
BNY Mellon Investment Servicing (US) Inc.
Attn: Eaton Vance Funds
P.O. Box 534439
Pittsburgh, PA 15253-4439
(800) 262-1122
Independent Registered Public Accounting Firm
Deloitte & Touche LLP
200 Berkeley Street
Boston, MA 02116-5022
Fund Offices
Two International Place
Boston, MA 02110
* FINRA BrokerCheck. Investors may check the background of their Investment Professional by contacting the Financial Industry Regulatory Authority (FINRA). FINRA BrokerCheck is a free tool to help investors check the professional background of current and former FINRA-registered securities firms and brokers. FINRA BrokerCheck is available by calling 1-800-289-9999 and at www.FINRA.org. The FINRA BrokerCheck brochure describing this program is available to investors at www.FINRA.org.
Eaton Vance
Global Sovereign Opportunities Fund (formerly, Eaton Vance Global Bond Fund)
Annual Report
October 31, 2023
Commodity Futures Trading Commission Registration. The Commodity Futures Trading Commission (“CFTC”) has adopted regulations that subject registered investment companies and advisers to regulation by the CFTC if a fund invests more than a prescribed level of its assets in certain CFTC-regulated instruments (including futures, certain options and swap agreements) or markets itself as providing investment exposure to such instruments. The investment adviser has claimed an exclusion from the definition of “commodity pool operator” under the Commodity Exchange Act with respect to its management of the Fund. Accordingly, neither the Fund nor the adviser with respect to the operation of the Fund is subject to CFTC regulation. Because of its management of other strategies, the Fund's adviser is registered with the CFTC as a commodity pool operator. The adviser is also registered as a commodity trading advisor.
Fund shares are not insured by the FDIC and are not deposits or other obligations of, or guaranteed by, any depository institution. Shares are subject to investment risks, including possible loss of principal invested.
This report must be preceded or accompanied by a current summary prospectus or prospectus. Before investing, investors should consider carefully the investment objective, risks, and charges and expenses of a mutual fund. This and other important information is contained in the summary prospectus and prospectus, which can be obtained from a financial intermediary. Prospective investors should read the prospectus carefully before investing. For further information, please call 1-800-262-1122.
Annual Report October 31, 2023
Eaton Vance
Global Sovereign Opportunities Fund
Eaton Vance
Global Sovereign Opportunities Fund
October 31, 2023
Management’s Discussion of Fund Performance†
Economic and Market Conditions
The world’s financial markets posted broad gains for the 12-month period ended October 31, 2023. During the period, inflation moderated in many countries, the U.S. economy outperformed expectations, and credit spreads generally tightened. These and other positive dynamics overshadowed concerns about rising global bond yields and heightened geopolitical tensions, including renewed conflict in the Middle East.
The U.S. Federal Reserve (the Fed) raised short-term interest rates during the period, and the cumulative effects of the monetary tightening cycle that began in March 2022 helped reduce U.S. inflation. As a result, the Fed slowed its pace of interest rate increases and signaled that it was nearing the end of its rate hiking campaign. The U.S. economy was resilient in the higher rate environment, posting solid growth as strength in the labor market supported healthy levels of consumer spending.
Inflation also eased in Europe, where the European Central Bank and Bank of England joined the Fed in slowing interest rate increases. However, European economic growth was sluggish amid elevated energy costs, a downturn in global trade, and higher borrowing costs. The prevalence of adjustable-rate mortgages in the U.K. and Southern Europe was particularly challenging for consumers in these regions. While wage gains helped offset the impact of higher household expenses, the U.K. unemployment rate rose and the eurozone labor market showed signs of softening late in the period.
In emerging markets (EM), China ended its zero-COVID policy early in the period, triggering a rebound in economic activity. However, the recovery quickly lost momentum due to several factors, including a drop in consumer confidence and a desire among developed-market (DM) companies to become less dependent on Chinese manufacturing. China’s economy stabilized in the final months of the period, bolstered by various stimulus measures. Nonetheless, the Chinese government seemed more focused on national security interests than economic growth.
During the period, numerous EM countries, including Mexico and several Southeast Asian nations in particular, benefited from DM companies’ efforts to diversify their supply chains beyond China. In addition, because EM central banks were generally ahead of their DM peers in addressing rising inflation risks, many EM central banks were able to cut interest rates during the period -- moves that supported economic growth and asset prices. For the period as a whole, the U.S. dollar broadly weakened, providing another tailwind for EM assets.
Fund Performance
For the 12-month period ended October 31, 2023, Eaton Vance Global Sovereign Opportunities Fund (the Fund) returned 6.55% for Class A shares at net asset value (NAV), outperforming its benchmark, the FTSE World Government Bond Index (the Index), which returned 0.45%.
During the period, holdings in Western Europe made the largest contribution to the Fund’s performance relative to the Index. The Fund’s overweight exposure to the euro was particularly helpful, as the euro strengthened versus the U.S. dollar on expectations that the U.S. Federal Reserve was close to ending its rate-hiking cycle. The Fund’s out-of-Index position in Icelandic local bonds was another major contributor to relative returns amid strength in the nation’s tourism industry and substantial foreign direct investment into Iceland.
Investments in Latin America and Asia were the next-largest contributors to Index-relative performance during the period. In Latin America, the Fund’s out-of-Index position in Dominican Republic local bonds added a significant amount of relative value, benefiting from solid economic growth and falling inflation in the country. In Asia, the Fund’s out-of-Index exposure to the South Korean won was advantageous. The South Korean won strengthened early in the period on expectations that the end of China’s zero-COVID policy would spur a recovery in South Korea’s biggest export market.
Holdings in Eastern Europe and the Dollar Bloc -- Canada, New Zealand, and Australia -- made positive, yet more modest, contributions to relative returns during the period. In Eastern Europe, the Fund’s out-of-Index position in Ukrainian local bonds performed especially well as Western allies provided military aid to the Ukrainian government and liquidity conditions in the country improved. In the Dollar Bloc, an overweight position in the New Zealand dollar boosted Index-relative returns.
Results in the Middle East & Africa region had a slightly negative impact on Index-relative performance, driven by an out-of-Index position in South African local bonds that lagged in the rising rate environment. On a global basis, other notable detractors included overweight positions in the Japanese yen and U.K. local interest rates.
The Fund used derivatives extensively to hedge select undesired risk exposures as well as gain select desired risk exposures. Some of the notable drivers of performance at the country level involved the use of derivatives. The Fund’s use of derivatives broadly weighed on returns versus the Index. The main detractors were interest rate swaps, which are used to gain select exposures as well as hedge others, and currency forwards, which are used to gain exposure to select currencies around the world. In addition, futures used to gain select exposures as well as hedge others modestly detracted from Index-relative performance during the period.
See Endnotes and Additional Disclosures in this report.
Past performance is no guarantee of future results. Returns are historical and are calculated by determining the percentage change in net asset value (NAV) or offering price (as applicable) with all distributions reinvested. Furthermore, returns do not reflect the deduction of taxes that shareholders may have to pay on Fund distributions or upon the redemption of Fund shares. Investment return and principal value will fluctuate so that shares, when redeemed, may be worth more or less than their original cost. Performance for periods less than or equal to one year is cumulative. Performance is for the stated time period only; due to market volatility, current Fund performance may be lower or higher than the quoted return. For performance as of the most recent month-end, please refer to eatonvance.com.
Eaton Vance
Global Sovereign Opportunities Fund
October 31, 2023
Performance
Portfolio Manager(s) Kyle Lee, CFA, Patrick Campbell, CFA and Brian Shaw, CFA
| % Average Annual Total Returns1,2 | Class
Inception Date | Performance
Inception Date | One Year | Five Years | Ten Years |
| Class A at NAV | 06/27/2007 | 06/27/2007 | 6.55% | (0.80)% | (0.09)% |
| Class A with 3.25% Maximum Sales Charge | — | — | 3.05 | (1.46) | (0.42) |
| Class C at NAV | 03/01/2011 | 06/27/2007 | 5.79 | (1.49) | (0.65) |
| Class C with 1% Maximum Deferred Sales Charge | — | — | 4.79 | (1.49) | (0.65) |
| Class I at NAV | 03/01/2011 | 06/27/2007 | 6.86 | (0.52) | 0.21 |
|
| FTSE World Government Bond Index (WGBI) | — | — | 0.45% | (2.57)% | (1.40)% |
| Bloomberg Global Aggregate Bond Index | — | — | 1.72 | (1.64) | (0.66) |
| Blended Index | — | — | 2.96 | (1.94) | (1.29) |
| % Total Annual Operating Expense Ratios3 | Class A | Class C | Class I |
| Gross | 1.83% | 2.58% | 1.58% |
| Net | 0.97 | 1.72 | 0.72 |
Growth of $10,000
This graph shows the change in value of a hypothetical investment of $10,000 in Class A of the Fund for the period indicated. For comparison, the same investment is shown in the indicated index.
| Growth of Investment | Amount Invested | Period Beginning | At NAV | With Maximum Sales Charge |
| Class C | $10,000 | 10/31/2013 | $9,365 | N.A. |
| Class I, at minimum investment | $1,000,000 | 10/31/2013 | $1,021,074 | N.A. |
See Endnotes and Additional Disclosures in this report.
Past performance is no guarantee of future results. Returns are historical and are calculated by determining the percentage change in net asset value (NAV) or offering price (as applicable) with all distributions reinvested. Furthermore, returns do not reflect the deduction of taxes that shareholders may have to pay on Fund distributions or upon the redemption of Fund shares. Investment return and principal value will fluctuate so that shares, when redeemed, may be worth more or less than their original cost. Performance for periods less than or equal to one year is cumulative. Performance is for the stated time period only; due to market volatility, current Fund performance may be lower or higher than the quoted return. For performance as of the most recent month-end, please refer to eatonvance.com.
Eaton Vance
Global Sovereign Opportunities Fund
October 31, 2023
| Asset Allocation (% of net assets)1 |
| Foreign Currency Exposures (% of net assets)2 |
| Japan | 13.1% |
| Iceland | 8.5 |
| Euro | 5.4 |
| Australia | 5.2 |
| Serbia | 5.0 |
| South Korea | 4.8 |
| Dominican Republic | 4.8 |
| Hungary | 4.3 |
| United Kingdom | 3.9 |
| Canada | 3.1 |
| India | 3.0 |
| Uruguay | 2.6 |
| Mexico | 2.0 |
| Other | 0.2 4 |
| New Zealand | -5.2 |
| China | -5.8 |
| Total Long | 69.3% |
| Total Short | -14.4% |
| Total Net | 54.9% |
Fund invests in an affiliated investment company (Portfolio) with the same objective(s) and policies as the Fund. References to investments are to the Portfolio’s holdings.
Footnotes:
1 Other Net Assets represents other assets less liabilities and includes any investment type that represents less than 1% of net assets.
2 Currency exposures include all foreign exchange denominated assets and currency derivatives. Total exposures may exceed 100% due to implicit leverage created by derivatives.
3 Net of securities sold short.
4 Includes amounts each less than 1.0% or –1.0%, as applicable.
Eaton Vance
Global Sovereign Opportunities Fund
October 31, 2023
Endnotes and Additional Disclosures
| † | The views expressed in this report are those of the portfolio manager(s) and are current only through the date stated at the top of this page. These views are subject to change at any time based upon market or other conditions, and Eaton Vance and the Fund(s) disclaim any responsibility to update such views. These views may not be relied upon as investment advice and, because investment decisions are based on many factors, may not be relied upon as an indication of trading intent on behalf of any Eaton Vance fund. This commentary may contain statements that are not historical facts, referred to as “forward-looking statements.” The Fund’s actual future results may differ significantly from those stated in any forward-looking statement, depending on factors such as changes in securities or financial markets or general economic conditions, the volume of sales and purchases of Fund shares, the continuation of investment advisory, administrative and service contracts, and other risks discussed from time to time in the Fund’s filings with the Securities and Exchange Commission. |
| | |
| 1 | FTSE World Government Bond Index (WGBI) measures the performance of fixed-rate, local currency, investment-grade sovereign bonds. Bloomberg Global Aggregate Bond Index is an unmanaged index of global investment-grade bonds denominated in the U.S. Dollar, Euro, Japanese Yen, and British Sterling. The index includes corporate bonds, government bonds, and mortgage-backed securities. The Blended Index consists of 80% FTSE World Government Bond Index and 20% J.P. Morgan Government Bond Index: Emerging Market Global Diversified (JPM GBI-EM GD), rebalanced monthly. J.P. Morgan Government Bond Index: Emerging Market Global Diversified (JPM GBI-EM GD) is an unmanaged index of local currency bonds with maturities of more than one year issued by emerging markets governments. Information has been obtained from sources believed to be reliable but J.P. Morgan does not warrant its completeness or accuracy. The indexes are used with permission. The indexes may not be copied, used, or distributed without J.P. Morgan’s prior written approval. Copyright 2021, J.P. Morgan Chase & Co. All rights reserved. Unless otherwise stated, index returns do not reflect the effect of any applicable sales charges, commissions, expenses, taxes or leverage, as applicable. It is not possible to invest directly in an index. |
| 2 | Total Returns at NAV do not include applicable sales charges. If sales charges were deducted, the returns would be lower. Total Returns shown with maximum sales charge reflect the stated maximum sales charge. Unless otherwise stated, performance does not reflect the deduction of taxes on Fund distributions or redemptions of Fund shares.Effective November 5, 2020, Class C shares automatically convert to Class A shares eight years after purchase. The average annual total returns listed for Class C reflect conversion to Class A shares after eight years. Prior to November 5, 2020, Class C shares automatically converted to Class A shares ten years after purchase. |
| 3 | Source: Fund prospectus. Net expense ratios reflect a contractual expense reimbursement that continues through 2/29/24. The expense ratios for the current reporting period can be found in the Financial |
| | Highlights section of this report. Performance reflects expenses waived and/or reimbursed, if applicable. Without such waivers and/or reimbursements, performance would have been lower. |
| | Fund profile subject to change due to active management. |
| | Important Notice to Shareholders |
| | Effective on June 26, 2023, the Fund’s name was changed to Eaton Vance Global Sovereign Opportunities Fund and the Fund’s policy to, under normal market conditions, invest at least 80% of its net assets (plus any borrowings for investment purposes) in bonds was revised to state that, under normal market conditions, the Fund invests at least 80% of its net assets (plus any borrowings for investment purposes) in U.S. and non-U.S. sovereign investments. |
| | Also, effective on June 26, 2023, the Fund changed its primary benchmark to the FTSE World Government Bond Index because the investment adviser believes it is a more appropriate benchmark for the Fund and its secondary performance benchmark is a blended index consisting of 80% FTSE World Government Bond Index and 20% J.P. Morgan Government Bond Index: Emerging Market Global Diversified (JPM GBI-EM GD). |
Eaton Vance
Global Sovereign Opportunities Fund
October 31, 2023
Example
As a Fund shareholder, you incur two types of costs: (1) transaction costs, including sales charges (loads) on purchases; and (2) ongoing costs, including management fees; distribution and/or service fees; and other Fund expenses. This Example is intended to help you understand your ongoing costs (in dollars) of Fund investing and to compare these costs with the ongoing costs of investing in other mutual funds. The Example is based on an investment of $1,000 invested at the beginning of the period and held for the entire period (May 1, 2023 to October 31, 2023).
Actual Expenses
The first section of the table below provides information about actual account values and actual expenses. You may use the information in this section, together with the amount you invested, to estimate the expenses that you paid over the period. Simply divide your account value by $1,000 (for example, an $8,600 account value divided by $1,000 = 8.6), then multiply the result by the number in the first section under the heading entitled “Expenses Paid During Period” to estimate the expenses you paid on your account during this period.
Hypothetical Example for Comparison Purposes
The second section of the table below provides information about hypothetical account values and hypothetical expenses based on the actual Fund expense ratio and an assumed rate of return of 5% per year (before expenses), which is not the actual Fund return. The hypothetical account values and expenses may not be used to estimate the actual ending account balance or expenses you paid for the period. You may use this information to compare the ongoing costs of investing in your Fund and other funds. To do so, compare this 5% hypothetical example with the 5% hypothetical examples that appear in the shareholder reports of the other funds.
Please note that the expenses shown in the table are meant to highlight your ongoing costs only and do not reflect any transactional costs, such as sales charges (loads). Therefore, the second section of the table is useful in comparing ongoing costs only, and will not help you determine the relative total costs of owning different funds. In addition, if these transactional costs were included, your costs would be higher.
| | Beginning
Account Value
(5/1/23) | Ending
Account Value
(10/31/23) | Expenses Paid
During Period*
(5/1/23 – 10/31/23) | Annualized
Expense
Ratio |
| Actual | | | | |
| Class A | $1,000.00 | $ 944.00 | $5.00** | 1.02% |
| Class C | $1,000.00 | $ 940.50 | $8.51** | 1.74% |
| Class I | $1,000.00 | $ 945.00 | $3.63** | 0.74% |
| |
| Hypothetical | | | | |
| (5% return per year before expenses) | | | | |
| Class A | $1,000.00 | $1,020.06 | $5.19** | 1.02% |
| Class C | $1,000.00 | $1,016.43 | $8.84** | 1.74% |
| Class I | $1,000.00 | $1,021.48 | $3.77** | 0.74% |
| * | Expenses are equal to the Fund's annualized expense ratio for the indicated Class, multiplied by the average account value over the period, multiplied by 184/365 (to reflect the one-half year period). The Example assumes that the $1,000 was invested at the net asset value per share determined at the close of business on April 30, 2023. The Example reflects the expenses of both the Fund and the Portfolio. |
| ** | Absent an allocation of certain expenses to affiliate(s), expenses would be higher. |
Eaton Vance
Global Sovereign Opportunities Fund
October 31, 2023
Statement of Assets and Liabilities
| | October 31, 2023 |
| Assets | |
| Investment in International Income Portfolio, at value (identified cost $39,550,216) | $ 36,020,779 |
| Receivable for Fund shares sold | 86,225 |
| Receivable from affiliates | 18,443 |
| Total assets | $ 36,125,447 |
| Liabilities | |
| Payable for Fund shares redeemed | $ 34,925 |
| Payable to affiliates: | |
| Distribution and service fees | 3,204 |
| Trustees' fees | 42 |
| Accrued expenses | 60,872 |
| Total liabilities | $ 99,043 |
| Net Assets | $ 36,026,404 |
| Sources of Net Assets | |
| Paid-in capital | $ 74,714,204 |
| Accumulated loss | (38,687,800) |
| Net Assets | $ 36,026,404 |
| Class A Shares | |
| Net Assets | $ 10,889,261 |
| Shares Outstanding | 1,731,453 |
Net Asset Value and Redemption Price Per Share
(net assets ÷ shares of beneficial interest outstanding) | $ 6.29 |
Maximum Offering Price Per Share
(100 ÷ 96.75 of net asset value per share) | $ 6.50 |
| Class C Shares | |
| Net Assets | $ 970,145 |
| Shares Outstanding | 154,264 |
Net Asset Value and Offering Price Per Share*
(net assets ÷ shares of beneficial interest outstanding) | $ 6.29 |
| Class I Shares | |
| Net Assets | $ 24,166,998 |
| Shares Outstanding | 3,856,620 |
Net Asset Value, Offering Price and Redemption Price Per Share
(net assets ÷ shares of beneficial interest outstanding) | $ 6.27 |
| On sales of $100,000 or more, the offering price of Class A shares is reduced. |
| * | Redemption price per share is equal to the net asset value less any applicable contingent deferred sales charge. |
7
See Notes to Financial Statements.
Eaton Vance
Global Sovereign Opportunities Fund
October 31, 2023
| | Year Ended |
| | October 31, 2023 |
| Investment Income | |
| Dividend income allocated from Portfolio | $ 126,671 |
| Interest income allocated from Portfolio (net of foreign taxes withheld of $33,368) | 1,931,345 |
| Expenses, excluding interest expense, allocated from Portfolio | (263,298) |
| Interest expense allocated from Portfolio | (12,890) |
| Total investment income from Portfolio | $ 1,781,828 |
| Expenses | |
| Distribution and service fees: | |
| Class A | $ 34,250 |
| Class C | 12,377 |
| Trustees’ fees and expenses | 500 |
| Custodian fee | 20,035 |
| Transfer and dividend disbursing agent fees | 48,376 |
| Legal and accounting services | 28,784 |
| Printing and postage | 18,886 |
| Registration fees | 49,557 |
| Miscellaneous | 12,292 |
| Total expenses | $ 225,057 |
| Deduct: | |
| Waiver and/or reimbursement of expenses by affiliates | $ 178,460 |
| Total expense reductions | $ 178,460 |
| Net expenses | $ 46,597 |
| Net investment income | $ 1,735,231 |
| Realized and Unrealized Gain (Loss) from Portfolio | |
| Net realized gain (loss): | |
| Investment transactions (net of foreign capital gains taxes of $5,151) | $ (2,524,058) |
| Written swaptions¬ | 36,033 |
| Securities sold short | 3,431 |
| Futures contracts | (77,790) |
| Swap contracts | (472,334) |
| Foreign currency transactions | 125,010 |
| Forward foreign currency exchange contracts | (392,800) |
| Non-deliverable bond forward contracts | 106,405 |
| Net realized loss | $(3,196,103) |
| Change in unrealized appreciation (depreciation): | |
| Investments (including net increase in accrued foreign capital gains taxes of $155) | $ 3,987,459 |
| Written swaptions¬ | 49,393 |
| Securities sold short | 14,634 |
| Futures contracts | (276,276) |
| Swap contracts | (262,755) |
| Foreign currency | (29,379) |
| Forward foreign currency exchange contracts | (462,162) |
| Non-deliverable bond forward contracts | (16,845) |
| Net change in unrealized appreciation (depreciation) | $ 3,004,069 |
| Net realized and unrealized loss | $ (192,034) |
| Net increase in net assets from operations | $ 1,543,197 |
8
See Notes to Financial Statements.
Eaton Vance
Global Sovereign Opportunities Fund
October 31, 2023
Statements of Changes in Net Assets
| | Year Ended October 31, |
| | 2023 | 2022 |
| Increase (Decrease) in Net Assets | | |
| From operations: | | |
| Net investment income | $ 1,735,231 | $ 1,206,837 |
| Net realized loss | (3,196,103) | (2,839,362) |
| Net change in unrealized appreciation (depreciation) | 3,004,069 | (6,377,946) |
| Net increase (decrease) in net assets from operations | $ 1,543,197 | $ (8,010,471) |
| Tax return of capital to shareholders: | | |
| Class A | $ (549,647) | $ (632,949) |
| Class C | (46,885) | (56,224) |
| Class I | (1,223,106) | (1,023,870) |
| Total tax return of capital to shareholders | $ (1,819,638) | $ (1,713,043) |
| Transactions in shares of beneficial interest: | | |
| Class A | $ (788,165) | $ (5,394,244) |
| Class C | (302,582) | (477,741) |
| Class I | 8,983,730 | (13,964,529) |
| Net increase (decrease) in net assets from Fund share transactions | $ 7,892,983 | $(19,836,514) |
| Net increase (decrease) in net assets | $ 7,616,542 | $(29,560,028) |
| Net Assets | | |
| At beginning of year | $ 28,409,862 | $ 57,969,890 |
| At end of year | $36,026,404 | $ 28,409,862 |
9
See Notes to Financial Statements.
Eaton Vance
Global Sovereign Opportunities Fund
October 31, 2023
| | Class A |
| | Year Ended October 31, |
| | 2023 | 2022 | 2021 | 2020 | 2019 |
| Net asset value — Beginning of year | $ 6.190 | $ 7.960 | $ 8.440 | $ 8.510 | $ 8.500 |
| Income (Loss) From Operations | | | | | |
| Net investment income(1) | $ 0.292 | $ 0.207 | $ 0.132 | $ 0.176 | $ 0.295 |
| Net realized and unrealized gain (loss) | 0.113 (2) | (1.675) | (0.150) | 0.292 | 0.174 |
| Total income (loss) from operations | $ 0.405 | $ (1.468) | $ (0.018) | $ 0.468 | $ 0.469 |
| Less Distributions | | | | | |
| From net investment income | $ — | $ — | $ (0.146) | $ (0.378) | $ (0.459) |
| Tax return of capital | (0.305) | (0.302) | (0.316) | (0.160) | — |
| Total distributions | $ (0.305) | $ (0.302) | $ (0.462) | $ (0.538) | $ (0.459) |
| Net asset value — End of year | $ 6.290 | $ 6.190 | $ 7.960 | $ 8.440 | $ 8.510 |
| Total Return(3)(4) | 6.55% | (18.94)% | (0.38)% | 5.72% | 5.62% |
| Ratios/Supplemental Data | | | | | |
| Net assets, end of year (000’s omitted) | $10,889 | $11,466 | $20,539 | $18,354 | $18,677 |
| Ratios (as a percentage of average daily net assets):(5) | | | | | |
| Expenses (4) | 1.00% (6)(7) | 1.02% (6)(7) | 1.01% (6) | 1.01% (6) | 1.11% (6) |
| Net investment income | 4.37% | 2.89% | 1.57% | 2.09% | 3.43% |
| Portfolio Turnover of the Portfolio | 230% (8) | 159% (8) | 102% (8) | 88% (8) | 92% |
| (1) | Computed using average shares outstanding. |
| (2) | The per share amount is not in accord with the net realized and unrealized gain (loss) for the period because of the timing of sales of Fund shares and the amount of the per share realized and unrealized gains and losses at such time. |
| (3) | Returns are historical and are calculated by determining the percentage change in net asset value with all distributions reinvested and do not reflect the effect of sales charges. |
| (4) | The investment adviser and administrator of the Fund and the investment adviser of the Portfolio reimbursed certain operating expenses (equal to 1.03%, 0.86%, 0.49%, 0.49% and 0.40% of average daily net assets for the years ended October 31, 2023, 2022, 2021, 2020 and 2019, respectively). Absent this reimbursement, total return would be lower. |
| (5) | Includes the Fund’s share of the Portfolio's allocated expenses. |
| (6) | Includes interest expense, including on securities sold short and/or reverse repurchase agreements if applicable, of 0.03% and 0.02% of average daily net assets for the years ended October 31, 2023 and 2022, respectively, and 0.01% of average daily net assets for each of the years ended October 31, 2021, 2020 and 2019. |
| (7) | Includes a reduction by the investment adviser of a portion of the Portfolio’s adviser fee due to the Portfolio’s investment in the Liquidity Fund (equal to 0.01% and less than 0.005% of average daily net assets for the years ended October 31, 2023 and 2022, respectively). |
| (8) | Includes the effect of To-Be-Announced (TBA) transactions. |
10
See Notes to Financial Statements.
Eaton Vance
Global Sovereign Opportunities Fund
October 31, 2023
Financial Highlights — continued
| | Class C |
| | Year Ended October 31, |
| | 2023 | 2022 | 2021 | 2020 | 2019 |
| Net asset value — Beginning of year | $ 6.190 | $ 7.960 | $ 8.440 | $ 8.510 | $ 8.500 |
| Income (Loss) From Operations | | | | | |
| Net investment income(1) | $ 0.244 | $ 0.157 | $ 0.068 | $ 0.123 | $ 0.237 |
| Net realized and unrealized gain (loss) | 0.113 (2) | (1.674) | (0.146) | 0.286 | 0.171 |
| Total income (loss) from operations | $ 0.357 | $(1.517) | $(0.078) | $ 0.409 | $ 0.408 |
| Less Distributions | | | | | |
| From net investment income | $ — | $ — | $ (0.127) | $ (0.336) | $ (0.398) |
| Tax return of capital | (0.257) | (0.253) | (0.275) | (0.143) | — |
| Total distributions | $(0.257) | $(0.253) | $(0.402) | $(0.479) | $(0.398) |
| Net asset value — End of year | $ 6.290 | $ 6.190 | $ 7.960 | $ 8.440 | $ 8.510 |
| Total Return(3)(4) | 5.79% | (19.50)% | (1.09)% | 4.98% | 4.88% |
| Ratios/Supplemental Data | | | | | |
| Net assets, end of year (000’s omitted) | $ 970 | $ 1,238 | $ 2,115 | $ 5,173 | $ 9,517 |
| Ratios (as a percentage of average daily net assets):(5) | | | | | |
| Expenses (4) | 1.72% (6)(7) | 1.72% (6)(7) | 1.71% (6) | 1.71% (6) | 1.81% (6) |
| Net investment income | 3.66% | 2.20% | 0.80% | 1.47% | 2.76% |
| Portfolio Turnover of the Portfolio | 230% (8) | 159% (8) | 102% (8) | 88% (8) | 92% |
| (1) | Computed using average shares outstanding. |
| (2) | The per share amount is not in accord with the net realized and unrealized gain (loss) for the period because of the timing of sales of Fund shares and the amount of the per share realized and unrealized gains and losses at such time. |
| (3) | Returns are historical and are calculated by determining the percentage change in net asset value with all distributions reinvested and do not reflect the effect of sales charges. |
| (4) | The investment adviser and administrator of the Fund and the investment adviser of the Portfolio reimbursed certain operating expenses (equal to 1.03%, 0.86%, 0.49%, 0.49% and 0.40% of average daily net assets for the years ended October 31, 2023, 2022, 2021, 2020 and 2019, respectively). Absent this reimbursement, total return would be lower. |
| (5) | Includes the Fund’s share of the Portfolio's allocated expenses. |
| (6) | Includes interest expense, including on securities sold short and/or reverse repurchase agreements if applicable, of 0.03% and 0.02% of average daily net assets for the years ended October 31, 2023 and 2022, respectively, and 0.01% of average daily net assets for each of the years ended October 31, 2021, 2020 and 2019. |
| (7) | Includes a reduction by the investment adviser of a portion of the Portfolio’s adviser fee due to the Portfolio’s investment in the Liquidity Fund (equal to 0.01% and less than 0.005% of average daily net assets for the years ended October 31, 2023 and 2022, respectively). |
| (8) | Includes the effect of To-Be-Announced (TBA) transactions. |
11
See Notes to Financial Statements.
Eaton Vance
Global Sovereign Opportunities Fund
October 31, 2023
Financial Highlights — continued
| | Class I |
| | Year Ended October 31, |
| | 2023 | 2022 | 2021 | 2020 | 2019 |
| Net asset value — Beginning of year | $ 6.160 | $ 7.930 | $ 8.410 | $ 8.480 | $ 8.480 |
| Income (Loss) From Operations | | | | | |
| Net investment income(1) | $ 0.311 | $ 0.224 | $ 0.156 | $ 0.213 | $ 0.319 |
| Net realized and unrealized gain (loss) | 0.122 (2) | (1.671) | (0.151) | 0.279 | 0.164 |
| Total income (loss) from operations | $ 0.433 | $ (1.447) | $ 0.005 | $ 0.492 | $ 0.483 |
| Less Distributions | | | | | |
| From net investment income | $ — | $ — | $ (0.152) | $ (0.395) | $ (0.483) |
| Tax return of capital | (0.323) | (0.323) | (0.333) | (0.167) | — |
| Total distributions | $ (0.323) | $ (0.323) | $ (0.485) | $ (0.562) | $ (0.483) |
| Net asset value — End of year | $ 6.270 | $ 6.160 | $ 7.930 | $ 8.410 | $ 8.480 |
| Total Return(3)(4) | 6.86% | (18.65)% | (0.11)% | 6.04% | 5.82% |
| Ratios/Supplemental Data | | | | | |
| Net assets, end of year (000’s omitted) | $24,167 | $15,706 | $35,316 | $33,597 | $56,451 |
| Ratios (as a percentage of average daily net assets):(5) | | | | | |
| Expenses (4) | 0.72% (6)(7) | 0.72% (6)(7) | 0.71% (6) | 0.71% (6) | 0.81% (6) |
| Net investment income | 4.67% | 3.11% | 1.86% | 2.54% | 3.73% |
| Portfolio Turnover of the Portfolio | 230% (8) | 159% (8) | 102% (8) | 88% (8) | 92% |
| (1) | Computed using average shares outstanding. |
| (2) | The per share amount is not in accord with the net realized and unrealized gain (loss) for the period because of the timing of sales of Fund shares and the amount of the per share realized and unrealized gains and losses at such time. |
| (3) | Returns are historical and are calculated by determining the percentage change in net asset value with all distributions reinvested. |
| (4) | The investment adviser and administrator of the Fund and the investment adviser of the Portfolio reimbursed certain operating expenses (equal to 1.03%, 0.86%, 0.49%, 0.49% and 0.40% of average daily net assets for the years ended October 31, 2023, 2022, 2021, 2020 and 2019, respectively). Absent this reimbursement, total return would be lower. |
| (5) | Includes the Fund’s share of the Portfolio's allocated expenses. |
| (6) | Includes interest expense, including on securities sold short and/or reverse repurchase agreements if applicable, of 0.03% and 0.02% of average daily net assets for the years ended October 31, 2023 and 2022, respectively, and 0.01% of average daily net assets for each of the years ended October 31, 2021, 2020 and 2019. |
| (7) | Includes a reduction by the investment adviser of a portion of the Portfolio’s adviser fee due to the Portfolio’s investment in the Liquidity Fund (equal to 0.01% and less than 0.005% of average daily net assets for the years ended October 31, 2023 and 2022, respectively). |
| (8) | Includes the effect of To-Be-Announced (TBA) transactions. |
12
See Notes to Financial Statements.
Eaton Vance
Global Sovereign Opportunities Fund
October 31, 2023
Notes to Financial Statements
1 Significant Accounting Policies
Eaton Vance Global Sovereign Opportunities Fund (formerly, Eaton Vance Global Bond Fund) (the Fund) is a diversified series of Eaton Vance Mutual Funds Trust (the Trust). The Trust is a Massachusetts business trust registered under the Investment Company Act of 1940, as amended (the 1940 Act), as an open-end management investment company. The Fund offers three classes of shares. Class A shares are generally sold subject to a sales charge imposed at time of purchase. Class C shares are sold at net asset value and are generally subject to a contingent deferred sales charge (see Note 5). Effective November 5, 2020, Class C shares automatically convert to Class A shares eight years after their purchase as described in the Fund’s prospectus. Class I shares are sold at net asset value and are not subject to a sales charge. Each class represents a pro rata interest in the Fund, but votes separately on class-specific matters and (as noted below) is subject to different expenses. Realized and unrealized gains and losses and net investment income and losses, other than class-specific expenses, are allocated daily to each class of shares based on the relative net assets of each class to the total net assets of the Fund. Each class of shares differs in its distribution plan and certain other class-specific expenses. The Fund invests its assets in interests in International Income Portfolio (the Portfolio), a Massachusetts business trust, having the same investment objective and policies as the Fund. The value of the Fund’s investment in the Portfolio reflects the Fund’s proportionate interest in the net assets of the Portfolio (approximately 100% at October 31, 2023). The performance of the Fund is directly affected by the performance of the Portfolio. The financial statements of the Portfolio, including the portfolio of investments, are included elsewhere in this report and should be read in conjunction with the Fund’s financial statements.
The following is a summary of significant accounting policies of the Fund. The policies are in conformity with accounting principles generally accepted in the United States of America (U.S. GAAP). The Fund is an investment company and follows accounting and reporting guidance in the Financial Accounting Standards Board (FASB) Accounting Standards Codification Topic 946.
A Investment Valuation—Valuation of securities by the Portfolio is discussed in Note 1A of the Portfolio's Notes to Financial Statements, which are included elsewhere in this report.
B Income—The Fund's net investment income or loss consists of the Fund's pro rata share of the net investment income or loss of the Portfolio, less all actual and accrued expenses of the Fund.
C Federal and Other Taxes —The Fund's policy is to comply with the provisions of the Internal Revenue Code applicable to regulated investment companies and to distribute to shareholders each year substantially all of its net investment income, and all or substantially all of its net realized capital gains. Accordingly, no provision for federal income or excise tax is necessary.
As of October 31, 2023, the Fund had no uncertain tax positions that would require financial statement recognition, de-recognition, or disclosure. The Fund files a U.S. federal income tax return annually after its fiscal year-end, which is subject to examination by the Internal Revenue Service for a period of three years from the date of filing.
D Expenses—The majority of expenses of the Trust are directly identifiable to an individual fund. Expenses which are not readily identifiable to a specific fund are allocated taking into consideration, among other things, the nature and type of expense and the relative size of the funds.
E Use of Estimates—The preparation of the financial statements in conformity with U.S. GAAP requires management to make estimates and assumptions that affect the reported amounts of assets and liabilities at the date of the financial statements and the reported amounts of income and expense during the reporting period. Actual results could differ from those estimates.
F Indemnifications—Under the Trust’s organizational documents, its officers and Trustees may be indemnified against certain liabilities and expenses arising out of the performance of their duties to the Fund. Under Massachusetts law, if certain conditions prevail, shareholders of a Massachusetts business trust (such as the Trust) could be deemed to have personal liability for the obligations of the Trust. However, the Trust’s Declaration of Trust contains an express disclaimer of liability on the part of Fund shareholders and the By-laws provide that the Trust shall assume, upon request by the shareholder, the defense on behalf of any Fund shareholders. Moreover, the By-laws also provide for indemnification out of Fund property of any shareholder held personally liable solely by reason of being or having been a shareholder for all loss or expense arising from such liability. Additionally, in the normal course of business, the Fund enters into agreements with service providers that may contain indemnification clauses. The Fund’s maximum exposure under these arrangements is unknown as this would involve future claims that may be made against the Fund that have not yet occurred.
G Other—Investment transactions are accounted for on a trade date basis.
Eaton Vance
Global Sovereign Opportunities Fund
October 31, 2023
Notes to Financial Statements — continued
2 Distributions to Shareholders and Income Tax Information
The Fund expects to pay any required income distributions monthly and intends to distribute annually all or substantially all of its net realized capital gains. The Fund may include in its distributions amounts attributable to the imputed interest on foreign currency exposures and certain other derivative positions which, in certain circumstances, may result in a return of capital for federal income tax purposes. Distributions to shareholders are recorded on the ex-dividend date. Distributions are declared separately for each class of shares. Shareholders may reinvest income and capital gain distributions in additional shares of the same class of the Fund at the net asset value as of the ex-dividend date or, at the election of the shareholder, receive distributions in cash. Distributions to shareholders are determined in accordance with income tax regulations, which may differ from U.S. GAAP. As required by U.S. GAAP, only distributions in excess of tax basis earnings and profits are reported in the financial statements as a return of capital. Permanent differences between book and tax accounting relating to distributions are reclassified to paid-in capital. For tax purposes, distributions from short-term capital gains are considered to be from ordinary income.
The tax character of distributions declared for the years ended October 31, 2023 and October 31, 2022 was as follows:
| | Year Ended October 31, |
| | 2023 | 2022 |
| Tax return of capital | $1,819,638 | $1,713,043 |
During the year ended October 31, 2023, accumulated loss was increased by $1,611,108 and paid-in capital was increased by $1,611,108 due to differences between book and tax accounting. These reclassifications had no effect on the net assets or net asset value per share of the Fund.
As of October 31, 2023, the components of distributable earnings (accumulated loss) on a tax basis were as follows:
| Deferred capital losses | $ (34,797,571) |
| Net unrealized depreciation | (3,890,229) |
| Accumulated loss | $(38,687,800) |
At October 31, 2023, the Fund, for federal income tax purposes, had deferred capital losses of $34,797,571 which would reduce its taxable income arising from future net realized gains on investment transactions, if any, to the extent permitted by the Internal Revenue Code, and thus would reduce the amount of distributions to shareholders, which would otherwise be necessary to relieve the Fund of any liability for federal income or excise tax. The deferred capital losses are treated as arising on the first day of the Fund’s next taxable year and retain the same short-term or long-term character as when originally deferred. Of the deferred capital losses at October 31, 2023, $8,240,612 are short-term and $26,556,959 are long-term.
3 Investment Adviser Fee and Other Transactions with Affiliates
The investment adviser fee is earned by Eaton Vance Management (EVM), an indirect, wholly-owned subsidiary of Morgan Stanley, as compensation for investment advisory services rendered to the Fund. The investment adviser fee is computed at an annual rate as a percentage of the Fund’s average daily net assets that are not invested in other investment companies for which EVM or its affiliates serve as investment adviser and receive an advisory fee as follows and is payable monthly:
| Average Daily Net Assets | Annual Fee Rate |
| Up to $1 billion | 0.500% |
| $1 billion but less than $2.5 billion | 0.475% |
| $2.5 billion but less than $5 billion | 0.455% |
| $5 billion and over | 0.440% |
For the year ended October 31, 2023, the Fund incurred no investment adviser fee on such assets. To the extent the Fund’s assets are invested in the Portfolio, the Fund is allocated its share of the Portfolio’s investment adviser fee. The Portfolio has engaged Boston Management and Research (BMR), a subsidiary of EVM, to render investment advisory services. See Note 2 of the Portfolio’s Notes to Financial Statements which are included elsewhere in this report. EVM also serves as the administrator of the Fund, but receives no compensation. EVM has agreed to reimburse the Fund’s expenses to the extent that total annual operating expenses (relating to ordinary operating expenses only and excluding such expenses as brokerage commissions, acquired fund
Eaton Vance
Global Sovereign Opportunities Fund
October 31, 2023
Notes to Financial Statements — continued
fees and expenses of unaffiliated funds, borrowing costs, taxes or litigation expenses) exceed 0.95% (1.00% prior to July 1, 2023), 1.70% and 0.70% of the Fund’s average daily net assets for Class A, Class C and Class I, respectively. This agreement may be changed or terminated after February 29, 2024. Pursuant to this agreement, EVM was allocated $178,460 of the Fund’s operating expenses for the year ended October 31, 2023.
EVM provides sub-transfer agency and related services to the Fund pursuant to a Sub-Transfer Agency Support Services Agreement. For the year ended October 31, 2023, EVM earned $4,649 from the Fund pursuant to such agreement, which is included in transfer and dividend disbursing agent fees on the Statement of Operations. The Fund was informed that Eaton Vance Distributors, Inc. (EVD), an affiliate of EVM and the Fund’s principal underwriter, received $94 as its portion of the sales charge on sales of Class A shares for the year ended October 31, 2023. EVD also received distribution and service fees from Class A and Class C shares (see Note 4).
Trustees and officers of the Fund who are members of EVM’s or BMR’s organizations receive remuneration for their services to the Fund out of the investment adviser fee. Certain officers and Trustees of the Fund and the Portfolio are officers of the above organizations.
4 Distribution Plans
The Fund has in effect a distribution plan for Class A shares (Class A Plan) pursuant to Rule 12b-1 under the 1940 Act. Pursuant to the Class A Plan, the Fund pays EVD a distribution and service fee of 0.25% (0.30% prior to July 1, 2023) per annum of its average daily net assets attributable to Class A shares for distribution services and facilities provided to the Fund by EVD, as well as for personal services and/or the maintenance of shareholder accounts. Distribution and service fees paid or accrued to EVD for the year ended October 31, 2023 amounted to $34,250 for Class A shares.
The Fund also has in effect a distribution plan for Class C shares (Class C Plan) pursuant to Rule 12b-1 under the 1940 Act. Pursuant to the Class C Plan, the Fund pays EVD amounts equal to 0.75% per annum of its average daily net assets attributable to Class C shares for providing ongoing distribution services and facilities to the Fund. For the year ended October 31, 2023, the Fund paid or accrued to EVD $9,283 for Class C shares.
Pursuant to the Class C Plan, the Fund also makes payments of service fees to EVD, financial intermediaries and other persons in amounts equal to 0.25% per annum of its average daily net assets attributable to that class. Service fees paid or accrued are for personal services and/or the maintenance of shareholder accounts. They are separate and distinct from the sales commissions and distribution fees payable to EVD. Service fees paid or accrued for the year ended October 31, 2023 amounted to $3,094 for Class C shares.
Distribution and service fees are subject to the limitations contained in the Financial Industry Regulatory Authority Rule 2341(d).
5 Contingent Deferred Sales Charges
A contingent deferred sales charge (CDSC) of 1% generally is imposed on redemptions of Class C shares made within 12 months of purchase. Class A shares may be subject to a 0.75% CDSC if redeemed within 12 months of purchase (depending on the circumstances of purchase). Generally, the CDSC is based upon the lower of the net asset value at date of redemption or date of purchase. No charge is levied on shares acquired by reinvestment of dividends or capital gain distributions. For the year ended October 31, 2023, the Fund was informed that EVD received no CDSCs paid by Class A and Class C shareholders.
6 Investment Transactions
For the year ended October 31, 2023, increases and decreases in the Fund's investment in the Portfolio aggregated $17,066,116 and $11,182,963, respectively.
Eaton Vance
Global Sovereign Opportunities Fund
October 31, 2023
Notes to Financial Statements — continued
7 Shares of Beneficial Interest
The Fund’s Declaration of Trust permits the Trustees to issue an unlimited number of full and fractional shares of beneficial interest (without par value). Such shares may be issued in a number of different series (such as the Fund) and classes. Transactions in Fund shares, including direct exchanges pursuant to share class conversions, were as follows:
| | Year Ended
October 31, 2023 | | Year Ended
October 31, 2022 |
| | Shares | Amount | | Shares | Amount |
| Class A | | | | | |
| Sales | 148,841 | $ 999,091 | | 408,177 | $ 3,124,350 |
| Issued to shareholders electing to receive payments of distributions in Fund shares | 76,521 | 508,596 | | 83,567 | 588,630 |
| Redemptions | (347,415) | (2,295,852) | | (1,218,517) | (9,107,224) |
| Net decrease | (122,053) | $ (788,165) | | (726,773) | $ (5,394,244) |
| Class C | | | | | |
| Sales | 15,324 | $ 104,355 | | 38,835 | $ 264,123 |
| Issued to shareholders electing to receive payments of distributions in Fund shares | 6,461 | 42,995 | | 7,225 | 50,726 |
| Redemptions | (67,683) | (449,932) | | (111,572) | (792,590) |
| Net decrease | (45,898) | $ (302,582) | | (65,512) | $ (477,741) |
| Class I | | | | | |
| Sales | 3,242,457 | $ 21,765,548 | | 552,602 | $ 3,938,764 |
| Issued to shareholders electing to receive payments of distributions in Fund shares | 183,921 | 1,218,207 | | 144,084 | 1,019,604 |
| Redemptions | (2,117,925) | (14,000,025) | | (2,599,911) | (18,922,897) |
| Net increase (decrease) | 1,308,453 | $ 8,983,730 | | (1,903,225) | $(13,964,529) |
8 Name and Investment Policy Change
Effective June 26, 2023, the name of Eaton Vance Global Sovereign Opportunities Fund was changed from Eaton Vance Global Bond Fund. The Fund also revised its policy to, under normal market conditions, invest at least 80% of its net assets (plus any borrowings for investment purposes) in bonds to state that, under normal market conditions, the Fund invests at least 80% of its net assets (plus any borrowings for investment purposes) in U.S. and non-U.S.
sovereign investments.
Eaton Vance
Global Sovereign Opportunities Fund
October 31, 2023
Report of Independent Registered Public Accounting Firm
To the Trustees of Eaton Vance Mutual Funds Trust and Shareholders of Eaton Vance Global Sovereign Opportunities Fund:
Opinion on the Financial Statements and Financial Highlights
We have audited the accompanying statement of assets and liabilities of Eaton Vance Global Sovereign Opportunities Fund (formerly, Eaton Vance Global Bond Fund) (the “Fund”) (one of the funds constituting Eaton Vance Mutual Funds Trust), as of October 31, 2023, the related statement of operations for the year then ended, the statements of changes in net assets for each of the two years in the period then ended, the financial highlights for each of the five years in the period then ended, and the related notes. In our opinion, the financial statements and financial highlights present fairly, in all material respects, the financial position of the Fund as of October 31, 2023, and the results of its operations for the year then ended, the changes in its net assets for each of the two years in the period then ended, and the financial highlights for each of the five years in the period then ended, in conformity with accounting principles generally accepted in the United States of America.
Basis for Opinion
These financial statements and financial highlights are the responsibility of the Fund's management. Our responsibility is to express an opinion on the Fund's financial statements and financial highlights based on our audits. We are a public accounting firm registered with the Public Company Accounting Oversight Board (United States) (PCAOB) and are required to be independent with respect to the Fund in accordance with the U.S. federal securities laws and the applicable rules and regulations of the Securities and Exchange Commission and the PCAOB.
We conducted our audits in accordance with the standards of the PCAOB. Those standards require that we plan and perform the audit to obtain reasonable assurance about whether the financial statements and financial highlights are free of material misstatement, whether due to error or fraud. The Fund is not required to have, nor were we engaged to perform, an audit of its internal control over financial reporting. As part of our audits, we are required to obtain an understanding of internal control over financial reporting but not for the purpose of expressing an opinion on the effectiveness of the Fund’s internal control over financial reporting. Accordingly, we express no such opinion.
Our audits included performing procedures to assess the risks of material misstatement of the financial statements and financial highlights, whether due to error or fraud, and performing procedures that respond to those risks. Such procedures included examining, on a test basis, evidence regarding the amounts and disclosures in the financial statements and financial highlights. Our audits also included evaluating the accounting principles used and significant estimates made by management, as well as evaluating the overall presentation of the financial statements and financial highlights. We believe that our audits provide a reasonable basis for our opinion.
/s/ Deloitte & Touche LLP
Boston, Massachusetts
December 22, 2023
We have served as the auditor of one or more Eaton Vance investment companies since 1959.
Eaton Vance
Global Sovereign Opportunities Fund
October 31, 2023
Federal Tax Information (Unaudited)
The Form 1099-DIV you receive in February 2024 will show the tax status of all distributions paid to your account in calendar year 2023. Shareholders are advised to consult their own tax adviser with respect to the tax consequences of their investment in the Fund.
International Income Portfolio
October 31, 2023
| Collateralized Mortgage Obligations — 7.6% |
| Security | Principal
Amount
(000's omitted) | Value |
| Federal Home Loan Mortgage Corp., Series 2022-DNA1, Class M2, 7.821%, (30-day average SOFR + 2.50%), 1/25/42(1)(2) | $ | 1,800 | $ 1,771,608 |
| Government National Mortgage Association, Series 2023-115, Class AL, 6.00%, 8/20/53 | | 1,000 | 952,492 |
Total Collateralized Mortgage Obligations
(identified cost $2,696,855) | | | $ 2,724,100 |
| Foreign Corporate Bonds — 3.6% |
| Security | Principal
Amount
(000's omitted) | Value |
| Iceland — 3.6% |
| Arion Banki HF, 6.00%, 4/12/24(3) | ISK | 140,000 | $ 990,244 |
| Landsbankinn HF, 5.00%, 11/23/23(3) | ISK | 40,000 | 284,505 |
Total Foreign Corporate Bonds
(identified cost $1,092,600) | | | $ 1,274,749 |
| Sovereign Government Bonds — 58.8% |
| Security | Principal
Amount
(000's omitted) | Value |
| Cyprus — 5.8% |
| Cyprus Government International Bond: | | | |
| 2.75%, 2/26/34(3) | EUR | 407 | $ 377,525 |
| 4.125%, 4/13/33(3) | EUR | 1,618 | 1,727,330 |
| | | | $ 2,104,855 |
| Dominican Republic — 4.7% |
| Dominican Republic: | | | |
| 8.00%, 1/15/27(3) | DOP | 3,970 | $ 64,943 |
| 8.00%, 2/12/27(3) | DOP | 20,150 | 333,196 |
| 11.25%, 9/15/35(1) | DOP | 8,000 | 139,810 |
| 12.00%, 8/8/25(1) | DOP | 10,500 | 186,883 |
| 13.00%, 6/10/34(3) | DOP | 25,400 | 518,948 |
| 13.625%, 2/3/33(1) | DOP | 8,000 | 160,448 |
| Dominican Republic Central Bank Notes: | | | |
| 8.00%, 3/12/27(3) | DOP | 900 | 14,390 |
| 13.00%, 12/5/25(1) | DOP | 8,440 | 153,428 |
| 13.00%, 1/30/26(1) | DOP | 6,240 | 113,541 |
| | | | $ 1,685,587 |
| Security | Principal
Amount
(000's omitted) | Value |
| Germany — 4.9% |
| Bundesrepublik Deutschland Bundesanleihe, 1.70%, 8/15/32(3) | EUR | 1,800 | $ 1,753,799 |
| | | | $ 1,753,799 |
| Greece — 0.0%(4) |
| Hellenic Republic Government Bond, 0.00%, GDP-Linked, 10/15/42 | EUR | 4,090 | $ 13,611 |
| | | | $ 13,611 |
| Hungary — 1.6% |
| Hungary Government Bond: | | | |
| 3.00%, 10/27/38 | HUF | 68,870 | $ 115,070 |
| 4.00%, 4/28/51 | HUF | 37,210 | 61,562 |
| 4.75%, 11/24/32 | HUF | 167,540 | 382,454 |
| | | | $ 559,086 |
| Iceland — 4.6% |
| Republic of Iceland: | | | |
| 2.50%, 4/15/24 | ISK | 147,203 | $ 1,022,876 |
| 5.00%, 11/15/28 | ISK | 3,916 | 24,825 |
| 8.00%, 6/12/25 | ISK | 85,178 | 607,807 |
| | | | $ 1,655,508 |
| India — 8.2% |
| Export-Import Bank of India, 2.25%, 1/13/31(3) | USD | 1,000 | $ 768,512 |
| India Government Bond: | | | |
| 7.10%, 4/18/29 | INR | 124,900 | 1,481,383 |
| 7.26%, 2/6/33 | INR | 59,600 | 711,045 |
| | | | $ 2,960,940 |
| Indonesia — 1.1% |
| Indonesia Government Bond: | | | |
| 6.125%, 5/15/28 | IDR | 1,053,000 | $ 63,878 |
| 7.125%, 6/15/42 | IDR | 1,472,000 | 92,029 |
| 7.125%, 6/15/43 | IDR | 3,346,000 | 210,078 |
| 7.375%, 5/15/48 | IDR | 529,000 | 33,943 |
| | | | $ 399,928 |
| Mexico — 2.2% |
| Mexican Bonos: | | | |
| 7.75%, 11/13/42(5) | MXN | 9,160 | $ 405,948 |
| 8.00%, 7/31/53(5) | MXN | 8,400 | 374,820 |
| | | | $ 780,768 |
19
See Notes to Financial Statements.
International Income Portfolio
October 31, 2023
Portfolio of Investments — continued
| Security | Principal
Amount
(000's omitted) | Value |
| Peru — 5.9% |
| Peru Government Bond: | | | |
| 5.40%, 8/12/34 | PEN | 1,243 | $ 270,319 |
| 5.94%, 2/12/29 | PEN | 5,682 | 1,418,243 |
| 6.95%, 8/12/31 | PEN | 845 | 214,532 |
| 7.30%, 8/12/33(3) | PEN | 914 | 233,281 |
| | | | $ 2,136,375 |
| Philippines — 1.6% |
| Republic of the Philippines, 6.25%, 1/14/36 | PHP | 34,000 | $ 568,980 |
| | | | $ 568,980 |
| Romania — 0.7% |
| Romania Government International Bond, 3.375%, 1/28/50(3) | EUR | 405 | $ 254,382 |
| | | | $ 254,382 |
| Serbia — 4.8% |
| Serbia Treasury Bond, 5.875%, 2/8/28 | RSD | 187,260 | $ 1,730,357 |
| | | | $ 1,730,357 |
| South Africa — 6.3% |
| Republic of South Africa: | | | |
| 8.00%, 1/31/30 | ZAR | 19,710 | $ 930,878 |
| 10.50%, 12/21/26 | ZAR | 24,060 | 1,331,675 |
| | | | $ 2,262,553 |
| South Korea — 3.8% |
| Korea Treasury Bond, 4.00%, 12/10/31 | KRW | 1,901,500 | $ 1,381,583 |
| | | | $ 1,381,583 |
| Ukraine — 0.1% |
| Ukraine Government Bond: | | | |
| 10.95%, 11/1/23 | UAH | 563 | $ 14,721 |
| 11.67%, 11/22/23 | UAH | 67 | 1,565 |
| 15.84%, 2/26/25 | UAH | 1,180 | 25,530 |
| | | | $ 41,816 |
| Uruguay — 2.5% |
| Uruguay Government Bond: | | | |
| 3.875%, 7/2/40(6) | UYU | 11,125 | $ 282,463 |
| Security | Principal
Amount
(000's omitted) | Value |
| Uruguay (continued) |
| Uruguay Government Bond: (continued) | | | |
| 9.75%, 7/20/33(6) | UYU | 24,969 | $ 622,676 |
| | | | $ 905,139 |
Total Sovereign Government Bonds
(identified cost $23,679,628) | | | $21,195,267 |
| U.S. Government Agency Mortgage-Backed Securities — 9.8% |
| Security | Principal
Amount
(000's omitted) | Value |
| Federal National Mortgage Association: | | | |
| 5.00%, with maturity at 2052 | $ | 942 | $ 868,994 |
| 5.05%, (COF + 1.791%), with maturity at 2035(7) | | 97 | 94,709 |
| 5.50%, 30-Year, TBA(8) | | 2,700 | 2,562,996 |
Total U.S. Government Agency Mortgage-Backed Securities
(identified cost $3,627,799) | | | $ 3,526,699 |
| U.S. Treasury Obligations — 0.8% |
| Security | Principal
Amount
(000's omitted) | Value |
| U.S. Treasury Inflation-Protected Bond, 0.625%, 7/15/32(9) | $ | 343 | $ 294,203 |
Total U.S. Treasury Obligations
(identified cost $327,888) | | | $ 294,203 |
| Short-Term Investments — 27.3% |
| Security | Shares | Value |
| Morgan Stanley Institutional Liquidity Funds - Government Portfolio, Institutional Class, 5.25%(10) | | 803,076 | $ 803,076 |
Total Affiliated Fund
(identified cost $803,076) | | | $ 803,076 |
20
See Notes to Financial Statements.
International Income Portfolio
October 31, 2023
Portfolio of Investments — continued
| Repurchase Agreements — 1.6% |
| Description | Principal
Amount
(000's omitted) | Value |
| Barclays Bank PLC: | | | |
| Dated 9/29/23 with an interest rate of 5.15%, collateralized by MXN 4,978,484 Mexican Udibonos, 4.00%, due 11/3/50 and a market value, including accrued interest, of $241,415(11) | USD | 250 | $ 249,928 |
| Dated 10/16/23 with an interest rate of 5.15%, collateralized by MXN 6,400,908 Mexican Udibonos, 4.00%, due 11/15/40 and a market value, including accrued interest, of $320,092(11) | USD | 326 | 326,281 |
Total Repurchase Agreements
(identified cost $576,209) | | | $ 576,209 |
| Sovereign Government Securities — 4.7% |
| Security | Principal
Amount
(000's omitted) | Value |
| Brazil — 4.7% |
| Letra do Tesouro Nacional, 0.00%, 1/1/24 | BRL | 8,760 | $ 1,705,342 |
Total Sovereign Government Securities
(identified cost $1,749,073) | | | $ 1,705,342 |
| U.S. Treasury Obligations — 18.8% |
| Security | Principal
Amount
(000's omitted) | Value |
| U.S. Treasury Bills: | | | |
| 0.00%, 11/30/23(12) | $ | 4,800 | $ 4,779,568 |
| 0.00%, 1/9/24 | | 2,000 | 1,979,770 |
Total U.S. Treasury Obligations
(identified cost $6,759,198) | | | $ 6,759,338 |
Total Short-Term Investments
(identified cost $9,887,556) | | | $ 9,843,965 |
| | | |
Total Investments — 107.9%
(identified cost $41,312,326) | | | $38,858,983 |
Total Written Swaptions — (0.2)%
(premiums received $15,117) | | | $ (75,613) |
| Securities Sold Short — (1.5)% |
| Sovereign Government Bonds — (1.5)% |
| Security | Principal
Amount
(000's omitted) | Value |
| Mexico — (1.5)% |
| Mexican Udibonos: | | | |
| 4.00%, 11/15/40(6) | MXN | (6,401) | $ (314,451) |
| 4.00%, 11/3/50(6) | MXN | (4,978) | (237,027) |
Total Sovereign Government Bonds
(proceeds $566,115) | | | $ (551,478) |
Total Securities Sold Short
(proceeds $566,115) | | | $ (551,478) |
| | | |
| Other Assets, Less Liabilities — (6.2)% | | | $ (2,203,607) |
| Net Assets — 100.0% | | | $36,028,285 |
| The percentage shown for each investment category in the Portfolio of Investments is based on net assets. |
| (1) | Security exempt from registration under Rule 144A of the Securities Act of 1933, as amended. These securities may be sold in certain transactions in reliance on an exemption from registration (normally to qualified institutional buyers). At October 31, 2023, the aggregate value of these securities is $2,525,718 or 7.0% of the Portfolio's net assets. |
| (2) | Variable rate security. The stated interest rate represents the rate in effect at October 31, 2023. |
| (3) | Security exempt from registration under Regulation S of the Securities Act of 1933, as amended, which exempts from registration securities offered and sold outside the United States. Security may not be offered or sold in the United States except pursuant to an exemption from, or in a transaction not subject to, the registration requirements of the Securities Act of 1933, as amended. At October 31, 2023, the aggregate value of these securities is $7,321,055 or 20.3% of the Portfolio's net assets. |
| (4) | Amount is less than 0.05%. |
| (5) | Security (or a portion thereof) has been pledged for the benefit of the counterparty for reverse repurchase agreements. |
| (6) | Inflation-linked security whose principal is adjusted for inflation based on changes in a designated inflation index or inflation rate for the applicable country. Interest is calculated based on the inflation-adjusted principal. |
| (7) | Adjustable rate mortgage security whose interest rate generally adjusts monthly based on a weighted average of interest rates on the underlying mortgages. The coupon rate may not reflect the applicable index value as interest rates on the underlying mortgages may adjust on various dates and at various intervals and may be subject to lifetime ceilings and lifetime floors and lookback periods. Rate shown is the coupon rate at October 31, 2023. |
21
See Notes to Financial Statements.
International Income Portfolio
October 31, 2023
Portfolio of Investments — continued
| (8) | TBA (To Be Announced) securities are purchased on a forward commitment basis with an approximate principal amount and maturity date. The actual principal amount and maturity date are determined upon settlement. |
| (9) | Inflation-linked security whose principal is adjusted for inflation based on changes in the U.S. Consumer Price Index. Interest is calculated based on the inflation-adjusted principal. |
| (10) | May be deemed to be an affiliated investment company. The rate shown is the annualized seven-day yield as of October 31, 2023. |
| (11) | Open repurchase agreement with no specific maturity date. Either party may terminate the agreement upon demand. |
| (12) | Security (or a portion thereof) has been pledged to cover collateral requirements on open derivative contracts. |
| Written Interest Rate Swaptions (OTC) — (0.2)% |
| Description | Counterparty | Notional
Amount | Expiration
Date | Value |
| Option to enter into interest rate swap expiring 11/24/23 to pay SOFR and receive 3.80% | Citibank, N.A. | USD | (1,265,000) | 11/24/23 | $ (75,613) |
| Total | | | | | $(75,613) |
| Forward Foreign Currency Exchange Contracts (Centrally Cleared) |
| Currency Purchased | Currency Sold | Settlement
Date | Value/Unrealized
Appreciation
(Depreciation) |
| CLP | 99,881,000 | USD | 107,054 | 12/20/23 | $ 4,231 |
| CLP | 71,986,000 | USD | 76,601 | 12/20/23 | 3,603 |
| CLP | 66,516,000 | USD | 71,178 | 12/20/23 | 2,932 |
| CLP | 34,337,874 | USD | 36,578 | 12/20/23 | 1,680 |
| CLP | 37,433,000 | USD | 40,393 | 12/20/23 | 1,313 |
| CLP | 33,438,000 | USD | 36,074 | 12/20/23 | 1,182 |
| CLP | 28,795,000 | USD | 31,064 | 12/20/23 | 1,019 |
| CLP | 13,863,310 | USD | 15,000 | 12/20/23 | 446 |
| CLP | 157,600,000 | USD | 175,257 | 12/20/23 | 336 |
| CLP | 27,398,000 | USD | 30,570 | 12/20/23 | (44) |
| CLP | 27,398,000 | USD | 30,587 | 12/20/23 | (61) |
| CLP | 54,795,000 | USD | 61,121 | 12/20/23 | (70) |
| CLP | 27,398,000 | USD | 30,604 | 12/20/23 | (78) |
| CLP | 27,398,000 | USD | 30,604 | 12/20/23 | (78) |
| CLP | 27,397,000 | USD | 30,663 | 12/20/23 | (138) |
| COP | 46,739,718 | USD | 11,296 | 12/20/23 | (61) |
| COP | 1,111,194,438 | USD | 268,561 | 12/20/23 | (1,459) |
| EUR | 1,749,895 | USD | 1,846,687 | 12/20/23 | 9,004 |
| EUR | 67,274 | USD | 72,038 | 12/20/23 | (697) |
| EUR | 6,481,308 | USD | 6,940,314 | 12/20/23 | (67,155) |
| IDR | 142,584,870 | USD | 9,068 | 12/20/23 | (124) |
| IDR | 1,794,379,545 | USD | 116,801 | 12/20/23 | (4,242) |
| IDR | 3,176,589,845 | USD | 206,762 | 12/20/23 | (7,499) |
| IDR | 36,544,829,911 | USD | 2,324,188 | 12/20/23 | (31,785) |
| KRW | 226,000,000 | USD | 170,481 | 12/20/23 | (2,992) |
| KRW | 275,341,253 | USD | 207,781 | 12/20/23 | (3,725) |
| PEN | 787,000 | USD | 202,642 | 12/20/23 | 1,833 |
22
See Notes to Financial Statements.
International Income Portfolio
October 31, 2023
Portfolio of Investments — continued
| Forward Foreign Currency Exchange Contracts (Centrally Cleared) (continued) |
| Currency Purchased | Currency Sold | Settlement
Date | Value/Unrealized
Appreciation
(Depreciation) |
| PEN | 286,000 | USD | 74,018 | 12/20/23 | $ 289 |
| PEN | 925,300 | USD | 241,008 | 12/20/23 | (601) |
| USD | 175,257 | CLP | 157,600,000 | 12/20/23 | (336) |
| USD | 642,796 | CLP | 578,034,184 | 12/20/23 | (1,232) |
| USD | 189,539 | COP | 784,234,156 | 12/20/23 | 1,030 |
| USD | 90,319 | COP | 373,700,000 | 12/20/23 | 491 |
| USD | 2,533,756 | EUR | 2,366,183 | 12/20/23 | 24,517 |
| USD | 2,157,407 | EUR | 2,014,725 | 12/20/23 | 20,875 |
| USD | 1,417,347 | EUR | 1,323,609 | 12/20/23 | 13,714 |
| USD | 1,246,967 | EUR | 1,164,497 | 12/20/23 | 12,066 |
| USD | 830,678 | EUR | 775,740 | 12/20/23 | 8,038 |
| USD | 825,490 | EUR | 770,895 | 12/20/23 | 7,988 |
| USD | 581,499 | EUR | 543,041 | 12/20/23 | 5,627 |
| USD | 513,702 | EUR | 479,727 | 12/20/23 | 4,971 |
| USD | 169,273 | EUR | 158,078 | 12/20/23 | 1,638 |
| USD | 14,176 | EUR | 13,239 | 12/20/23 | 137 |
| USD | 1,928,502 | IDR | 30,323,184,263 | 12/20/23 | 26,373 |
| USD | 466,994 | IDR | 7,184,000,000 | 12/20/23 | 16,352 |
| USD | 301,178 | IDR | 4,627,000,000 | 12/20/23 | 10,933 |
| USD | 233,429 | IDR | 3,592,000,000 | 12/20/23 | 8,108 |
| USD | 233,414 | IDR | 3,592,000,000 | 12/20/23 | 8,093 |
| USD | 83,812 | INR | 7,000,000 | 12/20/23 | (126) |
| USD | 143,644 | INR | 12,000,000 | 12/20/23 | (250) |
| USD | 228,626 | INR | 19,100,000 | 12/20/23 | (405) |
| USD | 299,330 | INR | 25,000,000 | 12/20/23 | (450) |
| USD | 371,124 | INR | 31,000,000 | 12/20/23 | (602) |
| USD | 598,410 | PEN | 2,228,000 | 12/20/23 | 19,542 |
| USD | 352,152 | PEN | 1,313,000 | 12/20/23 | 11,015 |
| USD | 127,041 | PEN | 473,000 | 12/20/23 | 4,149 |
| USD | 74,829 | PEN | 279,000 | 12/20/23 | 2,341 |
| USD | 63,599 | PEN | 236,563 | 12/20/23 | 2,136 |
| USD | 273,341 | PEN | 1,046,000 | 12/20/23 | 1,575 |
| USD | 265,690 | PEN | 1,019,000 | 12/20/23 | 938 |
| USD | 16,652 | PEN | 62,000 | 12/20/23 | 544 |
| USD | 13,431 | PEN | 49,959 | 12/20/23 | 451 |
| USD | 259,365 | PEN | 997,000 | 12/20/23 | 330 |
| USD | 3,492 | PEN | 13,000 | 12/20/23 | 114 |
| USD | 1,199 | PEN | 4,640 | 12/20/23 | (6) |
| USD | 237,443 | PEN | 920,660 | 12/20/23 | (1,759) |
| USD | 88,097 | PHP | 5,000,000 | 12/20/23 | 52 |
| USD | 88,058 | PHP | 5,000,000 | 12/20/23 | 13 |
| USD | 105,645 | PHP | 6,000,000 | 12/20/23 | (9) |
| USD | 149,598 | PHP | 8,500,000 | 12/20/23 | (79) |
| USD | 87,772 | PHP | 5,000,000 | 12/20/23 | (273) |
23
See Notes to Financial Statements.
International Income Portfolio
October 31, 2023
Portfolio of Investments — continued
| Forward Foreign Currency Exchange Contracts (Centrally Cleared) (continued) |
| Currency Purchased | Currency Sold | Settlement
Date | Value/Unrealized
Appreciation
(Depreciation) |
| USD | 105,309 | PHP | 6,000,000 | 12/20/23 | $ (346) |
| | | | | | $115,337 |
| Forward Foreign Currency Exchange Contracts (OTC) |
| Currency Purchased | Currency Sold | Counterparty | Settlement
Date | Unrealized
Appreciation | Unrealized
(Depreciation) |
| USD | 672,853 | PEN | 2,579,000 | Standard Chartered Bank | 11/13/23 | $ 1,811 | $ — |
| AUD | 1,000,000 | USD | 639,103 | BNP Paribas | 12/20/23 | — | (3,731) |
| AUD | 1,000,000 | USD | 645,679 | Citibank, N.A. | 12/20/23 | — | (10,307) |
| AUD | 1,000,000 | USD | 645,950 | Citibank, N.A. | 12/20/23 | — | (10,578) |
| AUD | 734,932 | USD | 474,910 | Standard Chartered Bank | 12/20/23 | — | (7,955) |
| CAD | 1,720,000 | USD | 1,258,085 | Standard Chartered Bank | 12/20/23 | — | (16,717) |
| CZK | 686,406 | EUR | 27,874 | Goldman Sachs International | 12/20/23 | — | (29) |
| CZK | 3,537,528 | EUR | 143,865 | Goldman Sachs International | 12/20/23 | — | (371) |
| CZK | 686,406 | EUR | 27,902 | UBS AG | 12/20/23 | — | (58) |
| CZK | 3,389,660 | EUR | 137,746 | UBS AG | 12/20/23 | — | (244) |
| EUR | 42,763 | CZK | 1,059,397 | Bank of America, N.A. | 12/20/23 | — | (229) |
| EUR | 16,822 | CZK | 416,613 | Citibank, N.A. | 12/20/23 | — | (85) |
| EUR | 106,923 | CZK | 2,648,492 | Citibank, N.A. | 12/20/23 | — | (556) |
| EUR | 93,468 | CZK | 2,316,101 | Standard Chartered Bank | 12/20/23 | — | (525) |
| EUR | 42,777 | CZK | 1,059,397 | UBS AG | 12/20/23 | — | (214) |
| EUR | 104,411 | HUF | 40,929,828 | BNP Paribas | 12/20/23 | — | (1,721) |
| EUR | 26,051 | HUF | 10,216,407 | Goldman Sachs International | 12/20/23 | — | (441) |
| EUR | 36,942 | HUF | 14,445,822 | Goldman Sachs International | 12/20/23 | — | (511) |
| EUR | 91,650 | HUF | 35,824,150 | Goldman Sachs International | 12/20/23 | — | (1,227) |
| EUR | 26,052 | HUF | 10,216,407 | HSBC Bank USA, N.A. | 12/20/23 | — | (440) |
| EUR | 36,936 | HUF | 14,445,822 | Standard Chartered Bank | 12/20/23 | — | (518) |
| EUR | 92,354 | HUF | 36,114,553 | Standard Chartered Bank | 12/20/23 | — | (1,278) |
| EUR | 104,349 | HUF | 40,929,828 | UBS AG | 12/20/23 | — | (1,787) |
| GBP | 1,240,000 | USD | 1,544,770 | Citibank, N.A. | 12/20/23 | — | (37,043) |
| HUF | 83,537,765 | EUR | 213,103 | BNP Paribas | 12/20/23 | 3,513 | — |
| HUF | 76,466,976 | EUR | 195,628 | Goldman Sachs International | 12/20/23 | 2,619 | — |
| HUF | 30,757,086 | EUR | 78,655 | Goldman Sachs International | 12/20/23 | 1,087 | — |
| HUF | 20,906,778 | EUR | 53,310 | Goldman Sachs International | 12/20/23 | 903 | — |
| HUF | 20,906,778 | EUR | 53,312 | HSBC Bank USA, N.A. | 12/20/23 | 901 | — |
| HUF | 75,943,421 | EUR | 194,207 | Standard Chartered Bank | 12/20/23 | 2,688 | — |
| HUF | 30,757,086 | EUR | 78,641 | Standard Chartered Bank | 12/20/23 | 1,102 | — |
| HUF | 83,537,765 | EUR | 212,976 | UBS AG | 12/20/23 | 3,647 | — |
| JPY | 557,849,895 | USD | 3,877,117 | Citibank, N.A. | 12/20/23 | — | (167,541) |
| JPY | 187,000,000 | USD | 1,298,644 | UBS AG | 12/20/23 | — | (55,137) |
| MXN | 4,401,704 | USD | 250,038 | BNP Paribas | 12/20/23 | — | (7,778) |
| MXN | 7,818,000 | USD | 450,605 | Citibank, N.A. | 12/20/23 | — | (20,319) |
24
See Notes to Financial Statements.
International Income Portfolio
October 31, 2023
Portfolio of Investments — continued
| Forward Foreign Currency Exchange Contracts (OTC) (continued) |
| Currency Purchased | Currency Sold | Counterparty | Settlement
Date | Unrealized
Appreciation | Unrealized
(Depreciation) |
| MXN | 1,711,000 | USD | 93,848 | Goldman Sachs International | 12/20/23 | $ 322 | $ — |
| MXN | 2,332,000 | USD | 128,077 | Goldman Sachs International | 12/20/23 | 272 | — |
| MXN | 1,711,000 | USD | 94,094 | Goldman Sachs International | 12/20/23 | 76 | — |
| MXN | 1,711,000 | USD | 94,102 | Goldman Sachs International | 12/20/23 | 68 | — |
| MXN | 452,156 | USD | 26,005 | Goldman Sachs International | 12/20/23 | — | (1,119) |
| MXN | 751,340 | USD | 43,249 | JPMorgan Chase Bank, N.A. | 12/20/23 | — | (1,896) |
| MXN | 5,135,000 | USD | 281,894 | Standard Chartered Bank | 12/20/23 | 725 | — |
| MXN | 9,131,000 | USD | 526,510 | Standard Chartered Bank | 12/20/23 | — | (23,959) |
| MXN | 9,261,000 | USD | 531,866 | UBS AG | 12/20/23 | — | (22,161) |
| NZD | 123,149 | USD | 72,916 | Citibank, N.A. | 12/20/23 | — | (1,158) |
| NZD | 200,000 | USD | 118,908 | Goldman Sachs International | 12/20/23 | — | (2,370) |
| PLN | 121,627 | EUR | 26,027 | BNP Paribas | 12/20/23 | 1,233 | — |
| PLN | 30,076 | EUR | 6,437 | Goldman Sachs International | 12/20/23 | 304 | — |
| PLN | 121,419 | EUR | 25,981 | UBS AG | 12/20/23 | 1,233 | — |
| PLN | 30,076 | EUR | 6,442 | UBS AG | 12/20/23 | 298 | — |
| THB | 1,780,600 | USD | 50,210 | Standard Chartered Bank | 12/20/23 | — | (457) |
| THB | 1,622,000 | USD | 46,189 | Standard Chartered Bank | 12/20/23 | — | (868) |
| THB | 2,000,000 | USD | 57,421 | Standard Chartered Bank | 12/20/23 | — | (1,537) |
| USD | 468,031 | AUD | 730,000 | Goldman Sachs International | 12/20/23 | 4,210 | — |
| USD | 274,605 | CNH | 2,000,000 | Goldman Sachs International | 12/20/23 | 1,289 | — |
| USD | 1,669,434 | CNH | 12,156,800 | JPMorgan Chase Bank, N.A. | 12/20/23 | 8,114 | — |
| USD | 188,273 | CNH | 1,371,000 | JPMorgan Chase Bank, N.A. | 12/20/23 | 915 | — |
| USD | 190,866 | JPY | 28,601,250 | HSBC Bank USA, N.A. | 12/20/23 | 674 | — |
| USD | 182,857 | JPY | 27,398,750 | HSBC Bank USA, N.A. | 12/20/23 | 662 | — |
| USD | 71,255 | MXN | 1,292,000 | State Street Bank and Trust Company | 12/20/23 | 146 | — |
| USD | 69,655 | MXN | 1,265,000 | State Street Bank and Trust Company | 12/20/23 | 32 | — |
| USD | 24,532 | MXN | 451,000 | State Street Bank and Trust Company | 12/20/23 | — | (290) |
| USD | 82,215 | MXN | 1,500,800 | State Street Bank and Trust Company | 12/20/23 | — | (386) |
| USD | 1,789,089 | MXN | 31,815,200 | UBS AG | 12/20/23 | 38,049 | — |
| USD | 1,184,196 | NZD | 2,000,000 | Citibank, N.A. | 12/20/23 | 18,811 | — |
| USD | 932,014 | NZD | 1,579,162 | UBS AG | 12/20/23 | 11,848 | — |
| USD | 70,346 | ZAR | 1,349,521 | Goldman Sachs International | 12/20/23 | — | (1,762) |
| USD | 112,453 | ZAR | 2,146,197 | Goldman Sachs International | 12/20/23 | — | (2,223) |
| USD | 116,874 | ZAR | 2,235,622 | Goldman Sachs International | 12/20/23 | — | (2,580) |
| USD | 276,416 | ZAR | 5,306,169 | Goldman Sachs International | 12/20/23 | — | (7,103) |
| USD | 388,051 | ZAR | 7,428,653 | Goldman Sachs International | 12/20/23 | — | (8,877) |
| USD | 71,170 | ZAR | 1,365,360 | HSBC Bank USA, N.A. | 12/20/23 | — | (1,784) |
| USD | 112,425 | ZAR | 2,146,197 | HSBC Bank USA, N.A. | 12/20/23 | — | (2,250) |
| USD | 116,793 | ZAR | 2,235,622 | HSBC Bank USA, N.A. | 12/20/23 | — | (2,661) |
| USD | 314,895 | ZAR | 6,009,669 | HSBC Bank USA, N.A. | 12/20/23 | — | (6,214) |
| USD | 387,899 | ZAR | 7,428,652 | HSBC Bank USA, N.A. | 12/20/23 | — | (9,029) |
| USD | 275,199 | ZAR | 5,276,932 | JPMorgan Chase Bank, N.A. | 12/20/23 | — | (6,759) |
| USD | 313,120 | ZAR | 5,972,304 | UBS AG | 12/20/23 | — | (5,992) |
| ZAR | 708,932 | USD | 37,327 | HSBC Bank USA, N.A. | 12/20/23 | 553 | — |
| ZAR | 354,466 | USD | 18,797 | HSBC Bank USA, N.A. | 12/20/23 | 143 | — |
25
See Notes to Financial Statements.
International Income Portfolio
October 31, 2023
Portfolio of Investments — continued
| Forward Foreign Currency Exchange Contracts (OTC) (continued) |
| Currency Purchased | Currency Sold | Counterparty | Settlement
Date | Unrealized
Appreciation | Unrealized
(Depreciation) |
| ZAR | 727,919 | USD | 38,395 | Standard Chartered Bank | 12/20/23 | $ 499 | $ — |
| ZAR | 3,732,259 | USD | 195,577 | State Street Bank and Trust Company | 12/20/23 | 3,846 | — |
| ZAR | 354,466 | USD | 18,804 | State Street Bank and Trust Company | 12/20/23 | 136 | — |
| USD | 813,165 | BRL | 4,000,000 | BNP Paribas | 1/3/24 | 25,267 | — |
| USD | 946,943 | BRL | 4,760,000 | BNP Paribas | 1/3/24 | 9,345 | — |
| HUF | 28,704,178 | EUR | 70,424 | BNP Paribas | 1/11/24 | 3,881 | — |
| HUF | 87,499,292 | EUR | 217,682 | UBS AG | 1/11/24 | 8,638 | — |
| HUF | 25,982,880 | EUR | 64,090 | UBS AG | 1/11/24 | 3,150 | — |
| TRY | 2,085,315 | USD | 66,784 | Standard Chartered Bank | 3/20/24 | — | (1,704) |
| USD | 64,751 | TRY | 2,085,315 | Standard Chartered Bank | 3/20/24 | — | (330) |
| TRY | 1,020,467 | USD | 30,191 | Standard Chartered Bank | 6/21/24 | — | (1,108) |
| USD | 29,065 | TRY | 1,020,467 | Standard Chartered Bank | 6/21/24 | — | (19) |
| TRY | 5,059,000 | USD | 138,127 | Standard Chartered Bank | 9/20/24 | — | (6,155) |
| USD | 131,770 | TRY | 5,059,000 | Standard Chartered Bank | 9/20/24 | — | (201) |
| TRY | 1,375,000 | USD | 37,027 | Standard Chartered Bank | 9/23/24 | — | (1,262) |
| USD | 35,860 | TRY | 1,375,000 | Standard Chartered Bank | 9/23/24 | 95 | — |
| | | | | | | $163,105 | $(471,554) |
| Futures Contracts |
| Description | Number of
Contracts | Position | Expiration
Date | Notional
Amount | Value/Unrealized
Appreciation
(Depreciation) |
| Interest Rate Futures | | | | | |
| Long Gilt | 17 | Long | 12/27/23 | $1,924,931 | $ (31,017) |
| U.S. 10-Year Treasury Note | 20 | Long | 12/19/23 | 2,123,437 | (79,481) |
| U.S. Ultra-Long Treasury Bond | 5 | Long | 12/19/23 | 562,813 | (74,514) |
| Euro-Bobl | (1) | Short | 12/7/23 | (123,047) | 709 |
| Euro-Buxl | (1) | Short | 12/7/23 | (127,416) | 10,941 |
| Japan 10-Year Bond | (1) | Short | 12/13/23 | (948,375) | 14,514 |
| | | | | | $ (158,848) |
| Inflation Swaps (Centrally Cleared) |
Notional Amount
(000's omitted) | Portfolio
Pays/Receives
Return on
Reference Index | Reference Index | Portfolio
Pays/Receives
Rate | Annual
Rate | Termination
Date | Value/Unrealized
Appreciation
(Depreciation) |
| EUR | 300 | Receives | Eurostat Eurozone HICP ex Tobacco NSA
(pays upon termination) | Pays | 2.20%
(pays upon termination) | 10/15/36 | $ 41,255 |
| EUR | 300 | Receives | Eurostat Eurozone HICP ex Tobacco NSA
(pays upon termination) | Pays | 2.20%
(pays upon termination) | 10/15/36 | 41,255 |
26
See Notes to Financial Statements.
International Income Portfolio
October 31, 2023
Portfolio of Investments — continued
| Inflation Swaps (Centrally Cleared) (continued) |
Notional Amount
(000's omitted) | Portfolio
Pays/Receives
Return on
Reference Index | Reference Index | Portfolio
Pays/Receives
Rate | Annual
Rate | Termination
Date | Value/Unrealized
Appreciation
(Depreciation) |
| EUR | 200 | Receives | Eurostat Eurozone HICP ex Tobacco NSA
(pays upon termination) | Pays | 2.20%
(pays upon termination) | 10/15/36 | $ 27,479 |
| EUR | 280 | Receives | Eurostat Eurozone HICP ex Tobacco NSA
(pays upon termination) | Pays | 2.08%
(pays upon termination) | 1/15/37 | 40,753 |
| EUR | 200 | Pays | Eurostat Eurozone HICP ex Tobacco NSA
(pays upon termination) | Receives | 2.29%
(pays upon termination) | 10/15/46 | (32,279) |
| EUR | 300 | Pays | Eurostat Eurozone HICP ex Tobacco NSA
(pays upon termination) | Receives | 2.29%
(pays upon termination) | 10/15/46 | (48,419) |
| EUR | 300 | Pays | Eurostat Eurozone HICP ex Tobacco NSA
(pays upon termination) | Receives | 2.29%
(pays upon termination) | 10/15/46 | (48,517) |
| EUR | 280 | Pays | Eurostat Eurozone HICP ex Tobacco NSA
(pays upon termination) | Receives | 2.18%
(pays upon termination) | 1/15/47 | (49,853) |
| EUR | 110 | Pays | Eurostat Eurozone HICP ex Tobacco NSA
(pays upon termination) | Receives | 2.64%
(pays upon termination) | 3/13/53 | (1,801) |
| EUR | 500 | Pays | Eurostat Eurozone HICP ex Tobacco NSA
(pays upon termination) | Receives | 2.72%
(pays upon termination) | 6/15/53 | 6,578 |
| USD | 150 | Receives | Return on CPI-U (NSA)
(pays upon termination) | Pays | 2.44%
(pays upon termination) | 1/13/33 | 3,034 |
| USD | 1,300 | Pays | Return on CPI-U (NSA)
(pays upon termination) | Receives | 2.75%
(pays upon termination) | 10/29/36 | (57,832) |
| USD | 450 | Pays | Return on CPI-U (NSA)
(pays upon termination) | Receives | 2.67%
(pays upon termination) | 1/7/37 | (20,349) |
| USD | 800 | Receives | Return on CPI-U (NSA)
(pays upon termination) | Pays | 2.62%
(pays upon termination) | 10/29/46 | 44,688 |
| USD | 400 | Receives | Return on CPI-U (NSA)
(pays upon termination) | Pays | 2.62%
(pays upon termination) | 10/29/46 | 22,209 |
| USD | 490 | Receives | Return on CPI-U (NSA)
(pays upon termination) | Pays | 2.54%
(pays upon termination) | 1/7/47 | 30,677 |
| USD | 150 | Receives | Return on CPI-U (NSA)
(pays upon termination) | Pays | 2.40%
(pays upon termination) | 3/13/53 | 8,833 |
| | | | | | | | $ 7,711 |
| Interest Rate Swaps (Centrally Cleared) |
Notional Amount
(000's omitted) | Portfolio
Pays/
Receives
Floating
Rate | Floating Rate | Annual
Fixed Rate | Termination
Date | Value | Unamortized
Upfront
Receipts
(Payments) | Unrealized
Appreciation
(Depreciation) |
| AUD | 500 | Pays | 6-month AUD Bank Bill
(pays semi-annually) | 4.48%
(pays semi-annually) | 6/21/25 | $ (2,171) | $ — | $ (2,171) |
27
See Notes to Financial Statements.
International Income Portfolio
October 31, 2023
Portfolio of Investments — continued
| Interest Rate Swaps (Centrally Cleared) (continued) |
Notional Amount
(000's omitted) | Portfolio
Pays/
Receives
Floating
Rate | Floating Rate | Annual
Fixed Rate | Termination
Date | Value | Unamortized
Upfront
Receipts
(Payments) | Unrealized
Appreciation
(Depreciation) |
| BRL | 7,850 | Pays | Brazil CETIP Interbank Deposit Rate
(pays upon termination) | 10.40%
(pays upon termination) | 1/2/25 | $ (16,509) | $ — | $ (16,509) |
| BRL | 7,850 | Pays | Brazil CETIP Interbank Deposit Rate
(pays upon termination) | 10.50%
(pays upon termination) | 1/2/25 | (14,651) | — | (14,651) |
| BRL | 7,679 | Pays | Brazil CETIP Interbank Deposit Rate
(pays upon termination) | 10.52%
(pays upon termination) | 1/2/25 | (14,161) | — | (14,161) |
| BRL | 8,021 | Pays | Brazil CETIP Interbank Deposit Rate
(pays upon termination) | 10.52%
(pays upon termination) | 1/2/25 | (14,744) | — | (14,744) |
| BRL | 18,300 | Pays | Brazil CETIP Interbank Deposit Rate
(pays upon termination) | 10.96%
(pays upon termination) | 1/2/25 | (10,447) | — | (10,447) |
| CLP | 310,800 | Receives | 6-month Sinacofi Chile Interbank Rate
(pays semi-annually) | 5.51%
(pays semi-annually) | 9/20/28 | 10,645 | — | 10,645 |
| CLP | 310,800 | Pays | 6-month Sinacofi Chile Interbank Rate
(pays semi-annually) | 5.68%
(pays semi-annually) | 9/20/28 | (8,075) | — | (8,075) |
| CLP | 756,080 | Receives | 6-month Sinacofi Chile Interbank Rate
(pays semi-annually) | 4.77%
(pays semi-annually) | 6/6/33 | 31,285 | 237 | 31,522 |
| CLP | 253,920 | Receives | 6-month Sinacofi Chile Interbank Rate
(pays semi-annually) | 4.65%
(pays semi-annually) | 6/14/33 | 11,726 | — | 11,726 |
| CNY | 4,000 | Pays | 7-day China Fixing Repo Rates
(pays quarterly) | 2.28%
(pays quarterly) | 9/20/28 | (2,652) | — | (2,652) |
| CNY | 8,000 | Pays | 7-day China Fixing Repo Rates
(pays quarterly) | 2.29%
(pays quarterly) | 9/20/28 | (5,135) | — | (5,135) |
| CNY | 4,000 | Pays | 7-day China Fixing Repo Rates
(pays quarterly) | 2.29%
(pays quarterly) | 9/20/28 | (2,531) | — | (2,531) |
| CNY | 2,300 | Pays | 7-day China Fixing Repo Rates
(pays quarterly) | 2.29%
(pays quarterly) | 9/20/28 | (1,344) | — | (1,344) |
| CNY | 3,000 | Pays | 7-day China Fixing Repo Rates
(pays quarterly) | 2.41%
(pays quarterly) | 12/20/28 | (53) | — | (53) |
| CNY | 3,000 | Pays | 7-day China Fixing Repo Rates
(pays quarterly) | 2.41%
(pays quarterly) | 12/20/28 | (53) | — | (53) |
| CNY | 2,000 | Pays | 7-day China Fixing Repo Rates
(pays quarterly) | 2.42%
(pays quarterly) | 12/20/28 | 7 | — | 7 |
| CNY | 3,000 | Pays | 7-day China Fixing Repo Rates
(pays quarterly) | 2.42%
(pays quarterly) | 12/20/28 | 64 | — | 64 |
| CNY | 2,000 | Pays | 7-day China Fixing Repo Rates
(pays quarterly) | 2.43%
(pays quarterly) | 12/20/28 | 198 | — | 198 |
28
See Notes to Financial Statements.
International Income Portfolio
October 31, 2023
Portfolio of Investments — continued
| Interest Rate Swaps (Centrally Cleared) (continued) |
Notional Amount
(000's omitted) | Portfolio
Pays/
Receives
Floating
Rate | Floating Rate | Annual
Fixed Rate | Termination
Date | Value | Unamortized
Upfront
Receipts
(Payments) | Unrealized
Appreciation
(Depreciation) |
| CNY | 5,200 | Pays | 7-day China Fixing Repo Rates
(pays quarterly) | 2.43%
(pays quarterly) | 12/20/28 | $ 531 | $ — | $ 531 |
| CNY | 1,000 | Pays | 7-day China Fixing Repo Rates
(pays quarterly) | 2.44%
(pays quarterly) | 12/20/28 | 117 | — | 117 |
| CNY | 1,000 | Pays | 7-day China Fixing Repo Rates
(pays quarterly) | 2.44%
(pays quarterly) | 12/20/28 | 135 | — | 135 |
| CNY | 2,000 | Pays | 7-day China Fixing Repo Rates
(pays quarterly) | 2.44%
(pays quarterly) | 12/20/28 | 294 | — | 294 |
| CNY | 1,600 | Pays | 7-day China Fixing Repo Rates
(pays quarterly) | 2.44%
(pays quarterly) | 12/20/28 | 245 | — | 245 |
| CNY | 1,000 | Pays | 7-day China Fixing Repo Rates
(pays quarterly) | 2.45%
(pays quarterly) | 12/20/28 | 183 | — | 183 |
| CNY | 1,000 | Pays | 7-day China Fixing Repo Rates
(pays quarterly) | 2.46%
(pays quarterly) | 12/20/28 | 267 | — | 267 |
| CNY | 1,000 | Pays | 7-day China Fixing Repo Rates
(pays quarterly) | 2.47%
(pays quarterly) | 12/20/28 | 297 | — | 297 |
| CNY | 3,000 | Pays | 7-day China Fixing Repo Rates
(pays quarterly) | 2.47%
(pays quarterly) | 12/20/28 | 980 | — | 980 |
| CNY | 1,000 | Pays | 7-day China Fixing Repo Rates
(pays quarterly) | 2.47%
(pays quarterly) | 12/20/28 | 333 | — | 333 |
| COP | 651,600 | Receives | Colombia Overnight Interbank Reference Rate
(pays quarterly) | 6.25%
(pays quarterly) | 11/26/25 | 10,202 | — | 10,202 |
| COP | 1,117,600 | Receives | Colombia Overnight Interbank Reference Rate
(pays quarterly) | 8.49%
(pays quarterly) | 9/20/28 | 5,750 | — | 5,750 |
| CZK | 3,829 | Pays | 6-month CZK PRIBOR
(pays semi-annually) | 3.94%
(pays annually) | 9/20/33 | (8,068) | — | (8,068) |
| CZK | 7,658 | Pays | 6-month CZK PRIBOR
(pays semi-annually) | 3.96%
(pays annually) | 9/20/33 | (15,756) | — | (15,756) |
| CZK | 11,513 | Pays | 6-month CZK PRIBOR
(pays semi-annually) | 3.96%
(pays annually) | 9/20/33 | (23,390) | — | (23,390) |
| EUR | 4,100 | Pays | 6-month EURIBOR
(pays semi-annually) | 3.60%
(pays annually) | 6/21/25 | (14,002) | — | (14,002) |
| EUR | 2,065 | Pays | 6-month EURIBOR
(pays semi-annually) | 3.14%
(pays annually) | 9/20/28 | (14,704) | — | (14,704) |
| EUR | 2,065 | Pays | 6-month EURIBOR
(pays semi-annually) | 3.20%
(pays annually) | 9/20/28 | (8,359) | — | (8,359) |
| EUR | 625 | Pays | 6-month EURIBOR
(pays semi-annually) | 2.96%
(pays annually) | 9/20/43 | (39,774) | — | (39,774) |
| EUR | 625 | Pays | 6-month EURIBOR
(pays semi-annually) | 3.00%
(pays annually) | 9/20/43 | (35,682) | — | (35,682) |
29
See Notes to Financial Statements.
International Income Portfolio
October 31, 2023
Portfolio of Investments — continued
| Interest Rate Swaps (Centrally Cleared) (continued) |
Notional Amount
(000's omitted) | Portfolio
Pays/
Receives
Floating
Rate | Floating Rate | Annual
Fixed Rate | Termination
Date | Value | Unamortized
Upfront
Receipts
(Payments) | Unrealized
Appreciation
(Depreciation) |
| GBP | 101 | Pays | 1-day Sterling Overnight Index Average
(pays annually) | 4.56%
(pays annually) | 10/2/28 | $ 172 | $ — | $ 172 |
| GBP | 199 | Pays | 1-day Sterling Overnight Index Average
(pays annually) | 4.39%
(pays annually) | 12/20/28 | (857) | — | (857) |
| GBP | 100 | Pays | 1-day Sterling Overnight Index Average
(pays annually) | 4.59%
(pays annually) | 12/20/28 | 608 | — | 608 |
| GBP | 850 | Pays | 1-day Sterling Overnight Index Average
(pays annually) | 4.20%
(pays annually) | 6/21/33 | (17,695) | — | (17,695) |
| INR | 37,000 | Pays | 1-day INR FBIL MIBOR
(pays semi-annually) | 6.73%
(pays semi-annually) | 12/20/25 | 615 | — | 615 |
| INR | 23,000 | Pays | 1-day INR FBIL MIBOR
(pays semi-annually) | 6.73%
(pays semi-annually) | 12/20/25 | 395 | — | 395 |
| INR | 121,000 | Pays | 1-day INR FBIL MIBOR
(pays semi-annually) | 6.75%
(pays semi-annually) | 12/20/25 | 2,657 | — | 2,657 |
| INR | 173,000 | Pays | 1-day INR FBIL MIBOR
(pays semi-annually) | 6.75%
(pays semi-annually) | 12/20/25 | 3,856 | — | 3,856 |
| INR | 36,200 | Pays | 1-day INR FBIL MIBOR
(pays semi-annually) | 6.73%
(pays semi-annually) | 12/20/28 | 981 | — | 981 |
| JPY | 129,000 | Receives | 1-day Overnight Tokyo Average Rate
(pays annually) | 0.41%
(pays annually) | 9/20/28 | 9,503 | — | 9,503 |
| JPY | 80,000 | Receives | 1-day Overnight Tokyo Average Rate
(pays annually) | 0.43%
(pays annually) | 6/15/32 | 25,072 | — | 25,072 |
| JPY | 90,000 | Receives | 1-day Overnight Tokyo Average Rate
(pays annually) | 0.43%
(pays annually) | 6/15/32 | 28,206 | — | 28,206 |
| JPY | 21,000 | Receives | 1-day Overnight Tokyo Average Rate
(pays annually) | 0.90%
(pays annually) | 2/2/33 | 1,074 | — | 1,074 |
| JPY | 1,000 | Receives | 1-day Overnight Tokyo Average Rate
(pays annually) | 0.80%
(pays annually) | 9/20/33 | 194 | — | 194 |
| JPY | 1,000 | Receives | 1-day Overnight Tokyo Average Rate
(pays annually) | 0.80%
(pays annually) | 9/20/33 | 193 | — | 193 |
| JPY | 1,000 | Receives | 1-day Overnight Tokyo Average Rate
(pays annually) | 0.81%
(pays annually) | 9/20/33 | 190 | — | 190 |
| JPY | 120,000 | Receives | 1-day Overnight Tokyo Average Rate
(pays annually) | 0.82%
(pays annually) | 9/20/33 | 21,794 | — | 21,794 |
| JPY | 26,000 | Receives | 1-day Overnight Tokyo Average Rate
(pays annually) | 1.28%
(pays annually) | 3/15/53 | 17,256 | — | 17,256 |
| JPY | 23,000 | Receives | 1-day Overnight Tokyo Average Rate
(pays annually) | 1.28%
(pays annually) | 3/15/53 | 15,123 | — | 15,123 |
30
See Notes to Financial Statements.
International Income Portfolio
October 31, 2023
Portfolio of Investments — continued
| Interest Rate Swaps (Centrally Cleared) (continued) |
Notional Amount
(000's omitted) | Portfolio
Pays/
Receives
Floating
Rate | Floating Rate | Annual
Fixed Rate | Termination
Date | Value | Unamortized
Upfront
Receipts
(Payments) | Unrealized
Appreciation
(Depreciation) |
| JPY | 25,000 | Receives | 1-day Overnight Tokyo Average Rate
(pays annually) | 1.29%
(pays annually) | 3/15/53 | $ 16,214 | $ — | $ 16,214 |
| JPY | 11,900 | Receives | 1-day Overnight Tokyo Average Rate
(pays annually) | 1.29%
(pays annually) | 3/15/53 | 7,689 | — | 7,689 |
| JPY | 11,100 | Receives | 1-day Overnight Tokyo Average Rate
(pays annually) | 1.30%
(pays annually) | 3/15/53 | 7,066 | — | 7,066 |
| JPY | 11,000 | Receives | 1-day Overnight Tokyo Average Rate
(pays annually) | 1.30%
(pays annually) | 3/15/53 | 6,959 | — | 6,959 |
| KRW | 623,000 | Pays | 3-month KRW Certificate of Deposit Rate
(pays quarterly) | 3.10%
(pays quarterly) | 2/1/28 | (18,578) | — | (18,578) |
| KRW | 60,947 | Pays | 3-month KRW Certificate of Deposit Rate
(pays quarterly) | 3.23%
(pays quarterly) | 6/21/33 | (3,318) | — | (3,318) |
| KRW | 370,101 | Pays | 3-month KRW Certificate of Deposit Rate
(pays quarterly) | 3.31%
(pays quarterly) | 6/21/33 | (18,421) | — | (18,421) |
| KRW | 68,321 | Pays | 3-month KRW Certificate of Deposit Rate
(pays quarterly) | 3.33%
(pays quarterly) | 6/21/33 | (3,321) | — | (3,321) |
| KRW | 18,000 | Pays | 3-month KRW Certificate of Deposit Rate
(pays quarterly) | 3.35%
(pays quarterly) | 6/21/33 | (846) | — | (846) |
| KRW | 30,000 | Pays | 3-month KRW Certificate of Deposit Rate
(pays quarterly) | 3.29%
(pays quarterly) | 9/20/33 | (1,560) | — | (1,560) |
| KRW | 21,000 | Pays | 3-month KRW Certificate of Deposit Rate
(pays quarterly) | 3.31%
(pays quarterly) | 9/20/33 | (1,073) | — | (1,073) |
| KRW | 5,131 | Pays | 3-month KRW Certificate of Deposit Rate
(pays quarterly) | 3.31%
(pays quarterly) | 9/20/33 | (260) | — | (260) |
| KRW | 28,000 | Pays | 3-month KRW Certificate of Deposit Rate
(pays quarterly) | 3.33%
(pays quarterly) | 9/20/33 | (1,383) | — | (1,383) |
| KRW | 28,500 | Pays | 3-month KRW Certificate of Deposit Rate
(pays quarterly) | 3.34%
(pays quarterly) | 9/20/33 | (1,393) | — | (1,393) |
| KRW | 44,000 | Pays | 3-month KRW Certificate of Deposit Rate
(pays quarterly) | 3.40%
(pays quarterly) | 9/20/33 | (1,978) | — | (1,978) |
| KRW | 45,000 | Pays | 3-month KRW Certificate of Deposit Rate
(pays quarterly) | 3.52%
(pays quarterly) | 9/20/33 | (1,699) | — | (1,699) |
| KRW | 91,000 | Pays | 3-month KRW Certificate of Deposit Rate
(pays quarterly) | 3.56%
(pays quarterly) | 9/20/33 | (3,221) | — | (3,221) |
| KRW | 42,000 | Pays | 3-month KRW Certificate of Deposit Rate
(pays quarterly) | 3.56%
(pays quarterly) | 9/20/33 | (1,484) | — | (1,484) |
31
See Notes to Financial Statements.
International Income Portfolio
October 31, 2023
Portfolio of Investments — continued
| Interest Rate Swaps (Centrally Cleared) (continued) |
Notional Amount
(000's omitted) | Portfolio
Pays/
Receives
Floating
Rate | Floating Rate | Annual
Fixed Rate | Termination
Date | Value | Unamortized
Upfront
Receipts
(Payments) | Unrealized
Appreciation
(Depreciation) |
| KRW | 36,000 | Pays | 3-month KRW Certificate of Deposit Rate
(pays quarterly) | 3.56%
(pays quarterly) | 9/20/33 | $ (1,263) | $ — | $ (1,263) |
| KRW | 42,000 | Pays | 3-month KRW Certificate of Deposit Rate
(pays quarterly) | 3.59%
(pays quarterly) | 9/20/33 | (1,395) | — | (1,395) |
| MXN | 43,220 | Pays | Mexico Interbank TIIE 28 Day
(pays monthly) | 11.33%
(pays monthly) | 10/7/24 | (2,424) | — | (2,424) |
| MXN | 80,920 | Pays | Mexico Interbank TIIE 28 Day
(pays monthly) | 11.24%
(pays monthly) | 10/9/24 | (8,055) | — | (8,055) |
| MXN | 30,860 | Pays | Mexico Interbank TIIE 28 Day
(pays monthly) | 11.25%
(pays monthly) | 10/10/24 | (2,975) | — | (2,975) |
| PLN | 600 | Receives | 6-month PLN WIBOR
(pays semi-annually) | 6.99%
(pays annually) | 9/21/32 | (21,162) | — | (21,162) |
| PLN | 510 | Receives | 6-month PLN WIBOR
(pays semi-annually) | 5.53%
(pays annually) | 12/21/32 | (7,648) | — | (7,648) |
| PLN | 590 | Receives | 6-month PLN WIBOR
(pays semi-annually) | 5.85%
(pays annually) | 12/21/32 | (12,517) | — | (12,517) |
| PLN | 1,500 | Receives | 6-month PLN WIBOR
(pays semi-annually) | 5.98%
(pays annually) | 12/21/32 | (35,476) | — | (35,476) |
| PLN | 750 | Receives | 6-month PLN WIBOR
(pays semi-annually) | 5.32%
(pays annually) | 2/1/33 | (8,469) | — | (8,469) |
| PLN | 1,327 | Receives | 6-month PLN WIBOR
(pays semi-annually) | 4.70%
(pays annually) | 9/20/33 | 7,614 | — | 7,614 |
| PLN | 667 | Receives | 6-month PLN WIBOR
(pays semi-annually) | 4.71%
(pays annually) | 9/20/33 | 3,715 | — | 3,715 |
| PLN | 413 | Receives | 6-month PLN WIBOR
(pays semi-annually) | 4.82%
(pays annually) | 9/20/33 | 1,457 | — | 1,457 |
| USD | 1,050 | Pays | SOFR
(pays annually) | 4.01%
(pays annually) | 8/4/28 | (27,799) | — | (27,799) |
| USD | 1,050 | Pays | SOFR
(pays annually) | 4.01%
(pays annually) | 8/4/28 | (27,752) | — | (27,752) |
| USD | 1,000 | Pays | SOFR
(pays annually) | 3.06%
(pays annually) | 11/7/32 | (125,526) | — | (125,526) |
| USD | 160 | Pays | SOFR
(pays annually) | 3.23%
(pays semi-annually) | 1/13/33 | (20,037) | — | (20,037) |
| USD | 1,000 | Pays | SOFR
(pays annually) | 3.18%
(pays annually) | 2/2/33 | (119,707) | — | (119,707) |
| USD | 220 | Pays | SOFR
(pays annually) | 3.22%
(pays annually) | 6/6/33 | (10,340) | — | (10,340) |
| USD | 310 | Pays | SOFR
(pays annually) | 3.25%
(pays annually) | 6/6/33 | (14,323) | — | (14,323) |
| USD | 300 | Pays | SOFR
(pays annually) | 3.26%
(pays annually) | 6/7/33 | (13,731) | — | (13,731) |
| USD | 270 | Pays | SOFR
(pays annually) | 3.26%
(pays annually) | 6/14/33 | (12,304) | — | (12,304) |
| USD | 1,265 | Pays | SOFR
(pays annually) | 3.60%
(pays annually) | 8/28/33 | (103,207) | — | (103,207) |
32
See Notes to Financial Statements.
International Income Portfolio
October 31, 2023
Portfolio of Investments — continued
| Interest Rate Swaps (Centrally Cleared) (continued) |
Notional Amount
(000's omitted) | Portfolio
Pays/
Receives
Floating
Rate | Floating Rate | Annual
Fixed Rate | Termination
Date | Value | Unamortized
Upfront
Receipts
(Payments) | Unrealized
Appreciation
(Depreciation) |
| ZAR | 4,042 | Receives | 3-month ZAR JIBAR
(pays quarterly) | 8.94%
(pays quarterly) | 12/20/28 | $ (2,018) | $ — | $ (2,018) |
| ZAR | 4,868 | Receives | 3-month ZAR JIBAR
(pays quarterly) | 8.95%
(pays quarterly) | 12/20/28 | (2,555) | — | (2,555) |
| Total | | | | | | $(658,169) | $ 237 | $(657,932) |
| Credit Default Swaps - Sell Protection (OTC) |
| Reference Entity | Counterparty | Notional
Amount*
(000's omitted) | Contract Annual
Fixed Rate** | Current
Market
Annual
Fixed Rate*** | Termination
Date | Value | Unamortized
Upfront
Receipts
(Payments) | Unrealized
Appreciation
(Depreciation) |
| Vietnam | Goldman Sachs International | $ 300 | 1.00%
(pays quarterly)(1) | 0.68% | 6/20/24 | $ 955 | $ (570) | $ 385 |
| Total | | $300 | | | | $955 | $(570) | $385 |
| * | If the Portfolio is the seller of credit protection, the notional amount is the maximum potential amount of future payments the Portfolio could be required to make if a credit event, as defined in the credit default swap agreement, were to occur. At October 31, 2023, such maximum potential amount for all open credit default swaps in which the Portfolio is the seller was $300,000. |
| ** | The contract annual fixed rate represents the fixed rate of interest received by the Portfolio (as a seller of protection) or paid by the Portfolio (as a buyer of protection) on the notional amount of the credit default swap contract. |
| *** | Current market annual fixed rates, utilized in determining the net unrealized appreciation or depreciation as of period end, serve as an indicator of the market’s perception of the current status of the payment/performance risk associated with the credit derivative. The current market annual fixed rate of a particular reference entity reflects the cost, as quoted by the pricing vendor, of selling protection against default of that entity as of period end and may include upfront payments required to be made to enter into the agreement. The higher the fixed rate, the greater the market perceived risk of a credit event involving the reference entity. A rate identified as “Defaulted” indicates a credit event has occurred for the reference entity. |
| (1) | Upfront payment is exchanged with the counterparty as a result of the standardized trading coupon. |
33
See Notes to Financial Statements.
International Income Portfolio
October 31, 2023
Portfolio of Investments — continued
| Cross-Currency Swaps (OTC) | | |
| Counterparty | Portfolio Receives | Portfolio Pays | Effective Date/
Termination
Date(1) | Value/Unrealized
Appreciation
(Depreciation) |
| Barclays Bank PLC | 1-day Indice Camara Promedio Rate on CLP 140,904,680 (pays semi-annually)* | 1.41% on CLP equivalent of CLF 172,000 (pays semi-annually)* | Not Applicable/
1/13/33 | $ 18,972 |
| Goldman Sachs International | 1-day Indice Camara Promedio Rate on CLP 63,504,540 (pays semi-annually)* | 2.10% on CLP equivalent of CLF 2,000 (pays semi-annually)* | Not Applicable/
4/8/32 | (4,880) |
| Goldman Sachs International | 1-day Indice Camara Promedio Rate on CLP 158,776,700 (pays semi-annually)* | 2.25% on CLP equivalent of CLF 5,000 (pays semi-annually)* | Not Applicable/
4/11/32 | (14,498) |
| Goldman Sachs International | 1-day Indice Camara Promedio Rate on CLP 28,777,725 (pays semi-annually)* | 1.85% on CLP equivalent of CLF 900 (pays semi-annually)* | Not Applicable/
4/20/32 | (1,343) |
| | | | | $ (1,749) |
| (1) | Effective date represents the date on which the Portfolio and counterparty exchange the currencies and begin interest payment accrual. |
| * | At the termination date, the Portfolio will either pay or receive the USD equivalent of the difference between the initial CLP notional amount and the CLP equivalent of the CLF notional amount on such date. |
| Abbreviations: |
| COF | – Cost of Funds 11th District |
| CPI-U (NSA) | – Consumer Price Index All Urban Non-Seasonally Adjusted |
| EURIBOR | – Euro Interbank Offered Rate |
| FBIL | – Financial Benchmarks India Ltd. |
| GDP | – Gross Domestic Product |
| HICP | – Harmonised Indices of Consumer Prices |
| JIBAR | – Johannesburg Interbank Average Rate |
| |
| MIBOR | – Mumbai Interbank Offered Rate |
| OTC | – Over-the-counter |
| PRIBOR | – Prague Interbank Offered Rate |
| SOFR | – Secured Overnight Financing Rate |
| TBA | – To Be Announced |
| WIBOR | – Warsaw Interbank Offered Rate |
| Currency Abbreviations: |
| AUD | – Australian Dollar |
| BRL | – Brazilian Real |
| CAD | – Canadian Dollar |
| CLF | – Chilean Unidad de Fomento |
| CLP | – Chilean Peso |
| CNH | – Yuan Renminbi Offshore |
| CNY | – Yuan Renminbi |
| COP | – Colombian Peso |
| CZK | – Czech Koruna |
| DOP | – Dominican Peso |
| EUR | – Euro |
| GBP | – British Pound Sterling |
| HUF | – Hungarian Forint |
| IDR | – Indonesian Rupiah |
| INR | – Indian Rupee |
| ISK | – Icelandic Krona |
| |
| JPY | – Japanese Yen |
| KRW | – South Korean Won |
| MXN | – Mexican Peso |
| NZD | – New Zealand Dollar |
| PEN | – Peruvian Sol |
| PHP | – Philippine Peso |
| PLN | – Polish Zloty |
| RSD | – Serbian Dinar |
| THB | – Thai Baht |
| TRY | – Turkish Lira |
| UAH | – Ukrainian Hryvnia |
| USD | – United States Dollar |
| UYU | – Uruguayan Peso |
| ZAR | – South African Rand |
34
See Notes to Financial Statements.
International Income Portfolio
October 31, 2023
Statement of Assets and Liabilities
| | October 31, 2023 |
| Assets | |
| Unaffiliated investments, at value (identified cost $40,509,250) | $ 38,055,907 |
| Affiliated investments, at value (identified cost $803,076) | 803,076 |
| Cash | 3,261 |
| Deposits for derivatives collateral: | |
| Futures contracts | 167,185 |
| Centrally cleared derivatives | 184,933 |
| Foreign currency, at value (identified cost $752,969) | 752,403 |
| Interest and dividends receivable | 511,951 |
| Dividends receivable from affiliated investments | 6,544 |
| Receivable for investments sold | 1,308 |
| Receivable for variation margin on open futures contracts | 11,720 |
| Receivable for variation margin on open centrally cleared derivatives | 23,361 |
| Receivable for open forward foreign currency exchange contracts | 163,105 |
| Receivable for open swap contracts | 19,357 |
| Upfront payments on open non-centrally cleared swap contracts | 570 |
| Receivable from affiliates | 21,265 |
| Trustees' deferred compensation plan | 35,628 |
| Total assets | $40,761,574 |
| Liabilities | |
| Payable for reverse repurchase agreements, including accrued interest of $2,473 | $ 797,492 |
| Written swaptions outstanding, at value (premiums received $15,117) | 75,613 |
| Payable for investments purchased | 2,598,738 |
| Payable for securities sold short, at value (proceeds $566,115) | 551,478 |
| Payable for open forward foreign currency exchange contracts | 471,554 |
| Payable for open swap contracts | 20,721 |
| Payable for closed swap contracts | 5,025 |
| Payable to affiliates: | |
| Investment adviser fee | 15,557 |
| Trustees' fees | 268 |
| Trustees' deferred compensation plan | 35,628 |
| Interest payable on securities sold short | 9,700 |
| Accrued foreign capital gains taxes | 156 |
| Accrued expenses | 151,359 |
| Total liabilities | $ 4,733,289 |
| Net Assets applicable to investors' interest in Portfolio | $36,028,285 |
35
See Notes to Financial Statements.
International Income Portfolio
October 31, 2023
| | Year Ended |
| | October 31, 2023 |
| Investment Income | |
| Dividend income from affiliated investments | $ 126,697 |
| Interest income (net of foreign taxes withheld of $33,374) | 1,931,736 |
| Total investment income | $ 2,058,433 |
| Expenses | |
| Investment adviser fee | $ 190,937 |
| Trustees’ fees and expenses | 2,944 |
| Custodian fee | 191,407 |
| Legal and accounting services | 77,819 |
| Interest expense and fees | 6,459 |
| Interest expense on securities sold short | 6,434 |
| Miscellaneous | 13,595 |
| Total expenses | $ 489,595 |
| Deduct: | |
| Waiver and/or reimbursement of expenses by affiliates | $ 213,351 |
| Total expense reductions | $ 213,351 |
| Net expenses | $ 276,244 |
| Net investment income | $ 1,782,189 |
| Realized and Unrealized Gain (Loss) | |
| Net realized gain (loss): | |
| Investment transactions (net of foreign capital gains taxes of $5,151) | $ (2,524,591) |
| Written swaptions | 36,050 |
| Securities sold short | 3,431 |
| Futures contracts | (77,802) |
| Swap contracts | (472,449) |
| Foreign currency transactions | 125,022 |
| Forward foreign currency exchange contracts | (392,837) |
| Non-deliverable bond forward contracts | 106,415 |
| Net realized loss | $(3,196,761) |
| Change in unrealized appreciation (depreciation): | |
| Investments (including net increase in accrued foreign capital gains taxes of $156) | $ 3,988,386 |
| Written swaptions | 49,410 |
| Securities sold short | 14,637 |
| Futures contracts | (276,333) |
| Swap contracts | (262,773) |
| Foreign currency | (29,387) |
| Forward foreign currency exchange contracts | (462,253) |
| Non-deliverable bond forward contracts | (16,849) |
| Net change in unrealized appreciation (depreciation) | $ 3,004,838 |
| Net realized and unrealized loss | $ (191,923) |
| Net increase in net assets from operations | $ 1,590,266 |
36
See Notes to Financial Statements.
International Income Portfolio
October 31, 2023
Statements of Changes in Net Assets
| | Year Ended October 31, |
| | 2023 | 2022 |
| Increase (Decrease) in Net Assets | | |
| From operations: | | |
| Net investment income | $ 1,782,189 | $ 1,267,521 |
| Net realized loss | (3,196,761) | (2,839,955) |
| Net change in unrealized appreciation (depreciation) | 3,004,838 | (6,379,198) |
| Net increase (decrease) in net assets from operations | $ 1,590,266 | $ (7,951,632) |
| Capital transactions: | | |
| Contributions | $ 17,066,116 | $ 3,228,450 |
| Withdrawals | (11,182,963) | (24,824,354) |
| Net increase (decrease) in net assets from capital transactions | $ 5,883,153 | $(21,595,904) |
| Net increase (decrease) in net assets | $ 7,473,419 | $(29,547,536) |
| Net Assets | | |
| At beginning of year | $ 28,554,866 | $ 58,102,402 |
| At end of year | $ 36,028,285 | $ 28,554,866 |
37
See Notes to Financial Statements.
International Income Portfolio
October 31, 2023
| | Year Ended October 31, |
| Ratios/Supplemental Data | 2023 | 2022 | 2021 | 2020 | 2019 |
| Ratios (as a percentage of average daily net assets): | | | | | |
| Expenses | 0.72% (1)(2)(3) | 0.72% (1)(2)(3) | 0.71% (2)(3) | 0.71% (2)(3) | 0.81% (2)(3) |
| Net investment income | 4.66% | 3.13% | 1.86% | 2.48% | 3.73% |
| Portfolio Turnover | 230% (4) | 159% (4) | 102% (4) | 88% (4) | 92% |
| Total Return | 6.86% (3) | (18.54)% (3) | (0.08)% (3) | 6.04% (3) | 5.92% (3) |
| Net assets, end of year (000’s omitted) | $36,028 | $28,555 | $58,102 | $57,167 | $84,644 |
| (1) | Includes a reduction by the investment adviser of a portion of its adviser fee due to the Portfolio’s investment in the Liquidity Fund (equal to 0.01% and less than 0.005% of average daily net assets for the years ended October 31, 2023 and 2022, respectively). |
| (2) | Includes interest expense, including on securities sold short and/or reverse repurchase agreements if applicable, of 0.03% and 0.02% of average daily net assets for the years ended October 31, 2023 and 2022, respectively, and 0.01% of average daily net assets for each of the years ended October 31, 2021, 2020 and 2019. |
| (3) | The investment adviser reimbursed certain operating expenses (equal to 0.56%, 0.40%, 0.19%, 0.16% and 0.09% of average daily net assets for the years ended October 31, 2023, 2022, 2021, 2020 and 2019, respectively). Absent this reimbursement, total return would be lower. |
| (4) | Includes the effect of To-Be-Announced (TBA) transactions. |
International Income Portfolio
October 31, 2023
Notes to Financial Statements
1 Significant Accounting Policies
International Income Portfolio (the Portfolio) is a Massachusetts business trust registered under the Investment Company Act of 1940, as amended (the 1940 Act), as a diversified, open-end management investment company. The Portfolio’s investment objective is total return. The Declaration of Trust permits the Trustees to issue interests in the Portfolio. At October 31, 2023, Eaton Vance Global Sovereign Opportunities Fund held an interest of approximately 100% in the Portfolio.
The following is a summary of significant accounting policies of the Portfolio. The policies are in conformity with accounting principles generally accepted in the United States of America (U.S. GAAP). The Portfolio is an investment company and follows accounting and reporting guidance in the Financial Accounting Standards Board (FASB) Accounting Standards Codification Topic 946.
A Investment Valuation—The following methodologies are used to determine the market value or fair value of investments.
Debt Obligations. Debt obligations are generally valued on the basis of valuations provided by third party pricing services, as derived from such services’ pricing models. Inputs to the models may include, but are not limited to, reported trades, executable bid and ask prices, broker/dealer quotations, prices or yields of securities with similar characteristics, interest rates, anticipated prepayments, benchmark curves or information pertaining to the issuer, as well as industry and economic events. The pricing services may use a matrix approach, which considers information regarding securities with similar characteristics to determine the valuation for a security. Short-term debt obligations purchased with a remaining maturity of sixty days or less for which a valuation from a third party pricing service is not readily available may be valued at amortized cost, which approximates fair value.
Derivatives. U.S. exchange-traded options are valued at the mean between the bid and ask prices at valuation time as reported by the Options Price Reporting Authority. Non-U.S. exchange-traded options and over-the-counter options (including options on securities, indices and foreign currencies) are valued by a third party pricing service using techniques that consider factors including the value of the underlying instrument, the volatility of the underlying instrument and the period of time until option expiration. Futures contracts are valued at the closing settlement price established by the board of trade or exchange on which they are traded. Forward foreign currency exchange contracts are generally valued at the mean of the average bid and average ask prices that are reported by currency dealers to a third party pricing service at the valuation time. Such third party pricing service valuations are supplied for specific settlement periods and the Portfolio’s forward foreign currency exchange contracts are valued at an interpolated rate between the closest preceding and subsequent settlement period reported by the third party pricing service. Non-deliverable bond forward contracts are generally valued based on the current price of the underlying bond as provided by a third party pricing service and current interest rates. Swaps and options on interest rate swaps (“swaptions”) are normally valued using valuations provided by a third party pricing service. Such pricing service valuations are based on the present value of fixed and projected floating rate cash flows over the term of the swap contract, and in the case of credit default swaps, based on credit spread quotations obtained from broker/dealers and expected default recovery rates determined by the pricing service using proprietary models. Future cash flows on swaps are discounted to their present value using swap rates provided by electronic data services or by broker/dealers. Alternatively, swaptions may be valued at the valuation provided by a broker/dealer (usually the counterparty to the option), so determined using similar techniques as those employed by the pricing service.
Foreign Securities and Currencies. Foreign securities and currencies are valued in U.S. dollars, based on foreign currency exchange rate quotations supplied by a third party pricing service. The pricing service uses a proprietary model to determine the exchange rate. Inputs to the model include reported trades and implied bid/ask spreads.
Other. Investments in management investment companies (including money market funds) that do not trade on an exchange are valued at the net asset value as of the close of each business day.
Fair Valuation. In connection with Rule 2a-5 of the 1940 Act, the Trustees have designated the Portfolio’s investment adviser as its valuation designee. Investments for which valuations or market quotations are not readily available or are deemed unreliable are valued by the investment adviser, as valuation designee, at fair value using methods that most fairly reflect the security’s “fair value”, which is the amount that the Portfolio might reasonably expect to receive for the security upon its current sale in the ordinary course. Each such determination is based on a consideration of relevant factors, which are likely to vary from one pricing context to another. These factors may include, but are not limited to, the type of security, the existence of any contractual restrictions on the security’s disposition, the price and extent of public trading in similar securities of the issuer or of comparable companies or entities, quotations or relevant information obtained from broker/dealers or other market participants, information obtained from the issuer, analysts, and/or the appropriate stock exchange (for exchange-traded securities), an analysis of the company’s or entity’s financial statements, and an evaluation of the forces that influence the issuer and the market(s) in which the security is purchased and sold.
B Investment Transactions—Investment transactions for financial statement purposes are accounted for on a trade date basis. Realized gains and losses on investments sold are determined on the basis of identified cost.
C Income—Interest income is recorded on the basis of interest accrued, adjusted for amortization of premium or accretion of discount. Withholding taxes on foreign interest have been provided for in accordance with the Portfolio’s understanding of the applicable countries’ tax rules and rates. Inflation adjustments to the principal amount of inflation-adjusted bonds and notes are reflected as interest income. Deflation adjustments to the principal amount of an inflation-adjusted bond or note are reflected as reductions to interest income to the extent of interest income previously recorded on such bond or note. Dividend income is recorded on the ex-dividend date for dividends received in cash and/or securities.
International Income Portfolio
October 31, 2023
Notes to Financial Statements — continued
D Federal and Other Taxes—The Portfolio has elected to be treated as a partnership for federal tax purposes. No provision is made by the Portfolio for federal or state taxes on any taxable income of the Portfolio because each investor in the Portfolio is ultimately responsible for the payment of any taxes on its share of taxable income. Since at least one of the Portfolio’s investors is a regulated investment company that invests all or substantially all of its assets in the Portfolio, the Portfolio normally must satisfy the applicable source of income and diversification requirements (under the Internal Revenue Code) in order for its investors to satisfy them. The Portfolio will allocate, at least annually among its investors, each investor’s distributive share of the Portfolio’s net investment income, net realized capital gains and losses and any other items of income, gain, loss, deduction or credit.
In addition to the requirements of the Internal Revenue Code, the Portfolio may also be subject to local taxes on the recognition of capital gains in certain countries. In determining the daily net asset value, the Portfolio estimates the accrual for such taxes, if any, based on the unrealized appreciation on certain portfolio securities and the related tax rates. Taxes attributable to unrealized appreciation are included in the change in unrealized appreciation (depreciation) on investments. Capital gains taxes on securities sold are included in net realized gain (loss) on investments.
As of October 31, 2023, the Portfolio had no uncertain tax positions that would require financial statement recognition, de-recognition, or disclosure. The Portfolio files a U.S. federal income tax return annually after its fiscal year-end, which is subject to examination by the Internal Revenue Service for a period of three years from the date of filing.
E Foreign Currency Translation—Investment valuations, other assets, and liabilities initially expressed in foreign currencies are translated each business day into U.S. dollars based upon current exchange rates. Purchases and sales of foreign investment securities and income and expenses denominated in foreign currencies are translated into U.S. dollars based upon currency exchange rates in effect on the respective dates of such transactions. Recognized gains or losses on investment transactions attributable to changes in foreign currency exchange rates are recorded for financial statement purposes as net realized gains and losses on investments. That portion of unrealized gains and losses on investments that results from fluctuations in foreign currency exchange rates is not separately disclosed.
F Use of Estimates—The preparation of the financial statements in conformity with U.S. GAAP requires management to make estimates and assumptions that affect the reported amounts of assets and liabilities at the date of the financial statements and the reported amounts of income and expense during the reporting period. Actual results could differ from those estimates.
G Indemnifications—Under the Portfolio’s organizational documents, its officers and Trustees may be indemnified against certain liabilities and expenses arising out of the performance of their duties to the Portfolio. Under Massachusetts law, if certain conditions prevail, interestholders in the Portfolio could be deemed to have personal liability for the obligations of the Portfolio. However, the Portfolio’s Declaration of Trust contains an express disclaimer of liability on the part of Portfolio interestholders. Additionally, in the normal course of business, the Portfolio enters into agreements with service providers that may contain indemnification clauses. The Portfolio’s maximum exposure under these arrangements is unknown as this would involve future claims that may be made against the Portfolio that have not yet occurred.
H Futures Contracts—Upon entering into a futures contract, the Portfolio is required to deposit with the broker, either in cash or securities, an amount equal to a certain percentage of the contract amount (initial margin). Subsequent payments, known as variation margin, are made or received by the Portfolio each business day, depending on the daily fluctuations in the value of the underlying security or index, and are recorded as unrealized gains or losses by the Portfolio. Gains (losses) are realized upon the expiration or closing of the futures contracts. Should market conditions change unexpectedly, the Portfolio may not achieve the anticipated benefits of the futures contracts and may realize a loss. Futures contracts have minimal counterparty risk as they are exchange traded and the clearinghouse for the exchange is substituted as the counterparty, guaranteeing counterparty performance.
I Forward Foreign Currency Exchange and Non-Deliverable Bond Forward Contracts—The Portfolio may enter into forward foreign currency exchange contracts for the purchase or sale of a specific foreign currency at a fixed price on a future date. The forward foreign currency exchange contracts are adjusted by the daily exchange rate of the underlying currency and any gains or losses are recorded as unrealized until such time as the contracts have been closed. While forward foreign currency exchange contracts are privately negotiated agreements between the Portfolio and a counterparty, certain contracts may be “centrally cleared”, whereby all payments made or received by the Portfolio pursuant to the contract are with a central clearing party (CCP) rather than the original counterparty. The CCP guarantees the performance of the original parties to the contract. Upon entering into centrally cleared contracts, the Portfolio is required to deposit with the CCP, either in cash or securities, an amount of initial margin determined by the CCP, which is subject to adjustment. For centrally cleared contracts, the daily change in valuation is recorded as a receivable or payable for variation margin and settled in cash with the CCP daily. The Portfolio may also enter into non-deliverable bond forward contracts for the purchase or sale of a bond denominated in a non-deliverable foreign currency at a fixed price on a future date. For non-deliverable bond forward contracts, unrealized gains and losses, based on changes in the value of the contract, and realized gains and losses are accounted for as described above. Risks may arise upon entering these contracts from the potential inability of counterparties to meet the terms of their contracts and, in the case of forward foreign currency exchange contracts, from movements in the value of a foreign currency relative to the U.S. dollar. In the case of centrally cleared contracts, counterparty risk is minimal due to protections provided by the CCP.
J Purchased Options—Upon the purchase of a call or put option, the premium paid by the Portfolio is included in the Statement of Assets and Liabilities as an investment. The amount of the investment is subsequently marked-to-market to reflect the current market value of the option purchased, in accordance with the Portfolio’s policies on investment valuations discussed above. Premiums paid for purchasing options that expire are treated as realized losses. Premiums paid for purchasing options that are exercised or closed are added to the amounts paid or offset against the proceeds on the underlying
International Income Portfolio
October 31, 2023
Notes to Financial Statements — continued
investment transaction to determine the realized gain or loss. The risk associated with purchasing options is limited to the premium originally paid. Purchased options traded over-the-counter involve risk that the issuer or counterparty will fail to perform its contractual obligations.
K Interest Rate Swaps—Swap contracts are privately negotiated agreements between the Portfolio and a counterparty. Certain swap contracts may be centrally cleared. Pursuant to interest rate swap agreements, the Portfolio either makes floating-rate payments to the counterparty (or CCP in the case of centrally cleared swaps) based on a benchmark interest rate in exchange for fixed-rate payments or the Portfolio makes fixed-rate payments to the counterparty (or CCP in the case of a centrally cleared swap) in exchange for payments on a floating benchmark interest rate. Payments received or made, including amortization of upfront payments/receipts, if any (which are amortized over the life of the swap contract), are recorded as realized gains or losses. During the term of the outstanding swap agreement, changes in the underlying value of the swap are recorded as unrealized gains or losses. For centrally cleared swaps, the daily change in valuation is recorded as a receivable or payable for variation margin and settled in cash with the CCP daily. The value of the swap is determined by changes in the relationship between two rates of interest. The Portfolio is exposed to credit loss in the event of non-performance by the swap counterparty. In the case of centrally cleared swaps, counterparty risk is minimal due to protections provided by the CCP. Risk may also arise from movements in interest rates.
L Inflation Swaps—Pursuant to inflation swap agreements, the Portfolio either makes floating-rate payments to the counterparty (or CCP in the case of centrally cleared swaps) based on a benchmark index in exchange for fixed-rate payments or the Portfolio makes fixed-rate payments to the counterparty (or CCP in the case of centrally cleared swaps) in exchange for floating-rate payments based on the return of a benchmark index. By design, the benchmark index is an inflation index, such as the Consumer Price Index. The accounting policy for payments received or made and changes in the underlying value of the inflation swap are the same as for interest rate swaps as described above. The value of the swap is determined by changes in the relationship between the rate of interest and the benchmark index. The Portfolio is exposed to credit loss in the event of nonperformance by the swap counterparty. In the case of centrally cleared swaps, counterparty risk is minimal due to protections provided by the CCP. Risk may also arise from the unanticipated movements in value of interest rates or the index.
M Cross-Currency Swaps —Cross-currency swaps are interest rate swaps in which interest cash flows are exchanged between two parties based on the notional amounts of two different currencies. The notional amounts are typically determined based on the spot exchange rates at the inception of the trade. Cross-currency swaps also involve the exchange of the notional amounts at the start of the contract at the current spot rate with an agreement to re-exchange such amounts at a later date at either the same exchange rate, a specified rate or the then current spot rate. The entire principal value of a cross-currency swap is subject to the risk that the counterparty to the swap will default on its contractual delivery obligations.
N Credit Default Swaps—When the Portfolio is the buyer of a credit default swap contract, the Portfolio is entitled to receive the par (or other agreed-upon) value of a referenced debt obligation (or basket of debt obligations) from the counterparty (or CCP in the case of a centrally cleared swap) to the contract if a credit event by a third party, such as a U.S. or foreign corporate issuer or sovereign issuer, on the debt obligation occurs. In return, the Portfolio pays the counterparty a periodic stream of payments over the term of the contract provided that no credit event has occurred. If no credit event occurs, the Portfolio would have spent the stream of payments and received no proceeds from the contract. When the Portfolio is the seller of a credit default swap contract, it receives the stream of payments, but is obligated to pay to the buyer of the protection an amount up to the notional amount of the swap and in certain instances take delivery of securities of the reference entity upon the occurrence of a credit event, as defined under the terms of that particular swap agreement. Credit events are contract specific but may include bankruptcy, failure to pay, restructuring, obligation acceleration and repudiation/moratorium. If the Portfolio is a seller of protection and a credit event occurs, the maximum potential amount of future payments that the Portfolio could be required to make would be an amount equal to the notional amount of the agreement. This potential amount would be partially offset by any recovery value of the respective referenced obligation, or net amount received from the settlement of a buy protection credit default swap agreement entered into by the Portfolio for the same referenced obligation. As the seller, the Portfolio may create economic leverage to its portfolio because, in addition to its total net assets, the Portfolio is subject to investment exposure on the notional amount of the swap. The interest fee paid or received on the swap contract, which is based on a specified interest rate on a fixed notional amount, is accrued daily as a component of unrealized appreciation (depreciation) and is recorded as realized gain upon receipt or realized loss upon payment. The Portfolio also records an increase or decrease to unrealized appreciation (depreciation) in an amount equal to the daily valuation. For centrally cleared swaps, the daily change in valuation is recorded as a receivable or payable for variation margin and settled in cash with the CCP daily. All upfront payments and receipts, if any, are amortized over the life of the swap contract as realized gains or losses. Those upfront payments or receipts for non-centrally cleared swaps are recorded as other assets or other liabilities, respectively, net of amortization. For financial reporting purposes, unamortized upfront payments or receipts, if any, are netted with unrealized appreciation or depreciation on swap contracts to determine the market value of swaps as presented in Notes 5 and 9. These transactions involve certain risks, including the risk that the seller may be unable to fulfill the transaction. In the case of centrally cleared swaps, counterparty risk is minimal due to protections provided by the CCP.
O Swaptions—A written swaption gives the Portfolio the obligation, if exercised by the purchaser, to enter into a swap contract according to the terms of the underlying agreement. When the Portfolio writes a swaption, the premium received by the Portfolio is recorded as a liability and subsequently marked to- market to reflect the current value of the swaption. When a swaption is exercised, the cost of the swap is adjusted by the amount of the premium paid or received. When a swaption expires or an unexercised swaption is closed, a gain or loss is recognized in the amount of the premium paid or received, plus the cost to close. The writer of a swaption bears the risk of unfavorable changes in the preset terms of the underlying swap contract.
International Income Portfolio
October 31, 2023
Notes to Financial Statements — continued
P When-Issued Securities and Delayed Delivery Transactions—The Portfolio may purchase securities on a delayed delivery, when-issued or forward commitment basis, including TBA (To Be Announced) securities. Payment and delivery may take place after the customary settlement period for that security. At the time the transaction is negotiated, the price of the security that will be delivered is fixed. Securities purchased on a delayed delivery, when-issued or forward commitment basis are marked-to-market daily and begin earning interest on settlement date. Such security purchases are subject to the risk that when delivered they will be worth less than the agreed upon payment price. Losses may also arise if the counterparty does not perform under the contract. A forward purchase commitment may also be closed by entering into an offsetting commitment. If an offsetting commitment is entered into, the Portfolio will realize a gain or loss on investments based on the price established when the Portfolio entered into the commitment.
Q Repurchase Agreements—A repurchase agreement is the purchase by the Portfolio of securities from a counterparty in exchange for cash that is coupled with an agreement to resell those securities to the counterparty at a specified date and price. When a repurchase agreement is entered, the Portfolio typically receives securities with a value that equals or exceeds the repurchase price, including any accrued interest earned on the agreement. The value of such securities will be marked-to-market daily, and cash or additional securities will be exchanged between the parties as needed. Except in the case of a repurchase agreement entered to settle a short sale, the value of the securities delivered to the Portfolio will be at least equal to 90% of the repurchase price during the term of the repurchase agreement. The terms of a repurchase agreement entered to settle a short sale may provide that the cash purchase price paid by the Portfolio is more than the value of purchased securities that effectively collateralize the repurchase price payable by the counterparty. In the event of insolvency of the counterparty to a repurchase agreement, recovery of the repurchase price owed to the Portfolio may be delayed. Such an insolvency also may result in a loss to the extent that the value of the purchased securities decreases during the delay or that value has otherwise not been maintained at an amount at least equal to the repurchase price.
R Reverse Repurchase Agreements—Under a reverse repurchase agreement, the Portfolio temporarily transfers possession of a portfolio security to another party, such as a bank or broker/dealer, in return for cash. At the same time, the Portfolio agrees to repurchase the security at an agreed upon time and price, which reflects an interest payment. In periods of increased demand for a security, the Portfolio may receive a payment from the counterparty for the use of the security, which is recorded as interest income. Because the Portfolio retains effective control over the transferred security, the transaction is accounted for as a secured borrowing. The Portfolio may enter into such agreements when it believes it is able to invest the cash acquired at a rate higher than the cost of the agreement, which would increase earned income. When the Portfolio enters into a reverse repurchase agreement, any fluctuations in the market value of either the securities transferred to another party or the securities in which the proceeds may be invested would affect the market value of the Portfolio’s assets. Because reverse repurchase agreements may be considered to be the practical equivalent of borrowing funds (and the counterparty making a loan), they constitute a form of leverage. The Portfolio segregates cash or liquid assets equal to its obligation to repurchase the security. During the term of the agreement, the Portfolio may also be obligated to pledge additional cash and/or securities in the event of a decline in the fair value of the transferred security. In the event the counterparty to a reverse repurchase agreement becomes insolvent, recovery of the security transferred by the Portfolio may be delayed or the Portfolio may incur a loss equal to the amount by which the value of the security transferred by the Portfolio exceeds the repurchase price payable by the Portfolio.
S Securities Sold Short—A short sale is a transaction in which the Portfolio sells a security it does not own in anticipation of a decline in the market value of that security. To complete such a transaction, the Portfolio must borrow the security to make delivery to the buyer with an obligation to replace such borrowed security at a later date. Until the security is replaced, the Portfolio is required to repay the lender any dividends or interest, which accrue during the period of the loan. The proceeds received from a short sale are recorded as a liability and the Portfolio records an unrealized gain or loss to the extent of the difference between the proceeds received and the value of the open short position on the day of determination. A gain, limited to the price at which the Portfolio sold the security short, or a loss, potentially unlimited as there is no upward limit on the price of a security, is recorded when the short position is terminated. Interest and dividends payable on securities sold short are recorded as an expense.
2 Investment Adviser Fee and Other Transactions with Affiliates
The investment adviser fee is earned by Boston Management and Research (BMR), an indirect, wholly-owned subsidiary of Morgan Stanley, as compensation for investment advisory services rendered to the Portfolio. The fee is computed at an annual rate as a percentage of the Portfolio’s average daily net assets as follows and is payable monthly:
| Average Daily Net Assets | Annual Fee Rate |
| Up to $1 billion | 0.500% |
| $1 billion but less than $2.5 billion | 0.475% |
| $2.5 billion but less than $5 billion | 0.455% |
| $5 billion and over | 0.440% |
For the year ended October 31, 2023, the Portfolio’s investment adviser fee amounted to $190,937 or 0.50% of the Portfolio’s average daily net assets. Pursuant to a voluntary expense reimbursement, BMR was allocated $209,250 of the Portfolio’s operating expenses for the year ended October 31, 2023.
International Income Portfolio
October 31, 2023
Notes to Financial Statements — continued
The Portfolio may invest in a money market fund, the Institutional Class of the Morgan Stanley Institutional Liquidity Funds - Government Portfolio (the “Liquidity Fund”), an open-end management investment company managed by Morgan Stanley Investment Management Inc., a wholly-owned subsidiary of Morgan Stanley. The investment adviser fee paid by the Portfolio is reduced by an amount equal to its pro rata share of the advisory and administration fees paid by the Portfolio due to its investment in the Liquidity Fund. For the year ended October 31, 2023, the investment adviser fee paid was reduced by $4,101 relating to the Portfolio’s investment in the Liquidity Fund.
Trustees and officers of the Portfolio who are members of BMR’s organization receive remuneration for their services to the Portfolio out of the investment adviser fee. Trustees of the Portfolio who are not affiliated with the investment adviser may elect to defer receipt of all or a percentage of their annual fees in accordance with the terms of the Trustees Deferred Compensation Plan. Certain officers and Trustees of the Portfolio are officers of the above organization.
3 Purchases and Sales of Investments
Purchases and sales of investments, other than short-term obligations and including maturities, paydowns, TBA transactions and securities sold short, for the year ended October 31, 2023 were as follows:
| | Purchases | Sales |
| Investments (non-U.S. Government) | $ 31,769,809 | $ 29,154,964 |
| U.S. Government and Agency Securities | 42,785,615 | 42,039,583 |
| | $74,555,424 | $71,194,547 |
4 Federal Income Tax Basis of Investments
The cost and unrealized appreciation (depreciation) of investments, including open derivative contracts, of the Portfolio at October 31, 2023, as determined on a federal income tax basis, were as follows:
| Aggregate cost | $ 39,852,744 |
| Gross unrealized appreciation | $ 1,479,155 |
| Gross unrealized depreciation | (3,516,725) |
| Net unrealized depreciation | $ (2,037,570) |
5 Financial Instruments
The Portfolio may trade in financial instruments with off-balance sheet risk in the normal course of its investing activities. These financial instruments may include written swaptions, forward foreign currency exchange contracts, non-deliverable bond forward contracts, futures contracts and swap contracts and may involve, to a varying degree, elements of risk in excess of the amounts recognized for financial statement purposes. The notional or contractual amounts of these instruments represent the investment the Portfolio has in particular classes of financial instruments and do not necessarily represent the amounts potentially subject to risk. The measurement of the risks associated with these instruments is meaningful only when all related and offsetting transactions are considered. A summary of obligations under these financial instruments at October 31, 2023 is included in the Portfolio of Investments. At October 31, 2023, the Portfolio had sufficient cash and/or securities to cover commitments under these contracts.
In the normal course of pursuing its investment objective, the Portfolio is subject to the following risks:
Credit Risk: The Portfolio enters into credit default swap contracts to enhance total return and/or as a substitute for the purchase or sale of securities.
Foreign Exchange Risk: The Portfolio engages in forward foreign currency exchange contracts, currency options and cross-currency swaps to enhance total return, to seek to hedge against fluctuations in currency exchange rates and/or as a substitute for the purchase or sale of securities or currencies.
Interest Rate Risk: The Portfolio utilizes various interest rate derivatives including non-deliverable bond forward contracts, interest rate futures contracts, interest rate swaps and swaptions, inflation swaps and cross-currency swaps to enhance total return, to seek to hedge against fluctuations in interest rates and/or to change the effective duration of its portfolio.
International Income Portfolio
October 31, 2023
Notes to Financial Statements — continued
The Portfolio enters into over-the-counter (OTC) derivatives that may contain provisions whereby the counterparty may terminate the contract under certain conditions, including but not limited to a decline in the Portfolio’s net assets below a certain level over a certain period of time, which would trigger a payment by the Portfolio for those derivatives in a liability position. At October 31, 2023, the fair value of derivatives with credit-related contingent features in a net liability position was $567,888. The aggregate fair value of assets pledged as collateral by the Portfolio for such liability was $748,799 at October 31, 2023.
The OTC derivatives in which the Portfolio invests (except for written swaptions as the Portfolio, not the counterparty, is obligated to perform) are subject to the risk that the counterparty to the contract fails to perform its obligations under the contract. To mitigate this risk, the Portfolio has entered into an International Swaps and Derivatives Association, Inc. Master Agreement (“ISDA Master Agreement”) or similar agreement with substantially all its derivative counterparties. An ISDA Master Agreement is a bilateral agreement between the Portfolio and a counterparty that governs certain OTC derivatives and typically contains, among other things, set-off provisions in the event of a default and/ or termination event as defined under the relevant ISDA Master Agreement. Under an ISDA Master Agreement, the Portfolio may, under certain circumstances, offset with the counterparty certain derivative financial instruments’ payables and/or receivables with collateral held and/or posted and create one single net payment. The provisions of the ISDA Master Agreement typically permit a single net payment in the event of default including the bankruptcy or insolvency of the counterparty. However, bankruptcy or insolvency laws of a particular jurisdiction may impose restrictions on or prohibitions against the right of offset in bankruptcy or insolvency. Certain ISDA Master Agreements allow counterparties to OTC derivatives to terminate derivative contracts prior to maturity in the event the Portfolio’s net assets decline by a stated percentage or the Portfolio fails to meet the terms of its ISDA Master Agreements, which would cause the counterparty to accelerate payment by the Portfolio of any net liability owed to it.
The collateral requirements for derivatives traded under an ISDA Master Agreement are governed by a Credit Support Annex to the ISDA Master Agreement. Collateral requirements are determined at the close of business each day and are typically based on changes in market values for each transaction under an ISDA Master Agreement and netted into one amount for such agreement. Generally, the amount of collateral due from or to a counterparty is subject to a minimum transfer threshold amount before a transfer is required, which may vary by counterparty. Collateral pledged for the benefit of the Portfolio and/ or counterparty is held in segregated accounts by the Portfolio’s custodian and cannot be sold, re-pledged, assigned or otherwise used while pledged. The portion of such collateral representing cash, if any, is reflected as deposits for derivatives collateral and, in the case of cash pledged by a counterparty for the benefit of the Portfolio, a corresponding liability on the Statement of Assets and Liabilities. Securities pledged by the Portfolio as collateral, if any, are identified as such in the Portfolio of Investments.
International Income Portfolio
October 31, 2023
Notes to Financial Statements — continued
The fair value of open derivative instruments (not considered to be hedging instruments for accounting disclosure purposes) by risk exposure at October 31, 2023 was as follows:
| | Fair Value |
| Statement of Assets and Liabilities Caption | Credit | Foreign
Exchange | Interest
Rate | Total |
| Not applicable | $ — | $ 242,019* | $ 544,787* | $ 786,806 |
| Receivable for open forward foreign currency exchange contracts | — | 163,105 | — | 163,105 |
| Receivable for open swap contracts; Upfront payments on open non-centrally cleared swap contracts | 955 | — | 18,972 | 19,927 |
| Total Asset Derivatives | $ 955 | $ 405,124 | $ 563,759 | $ 969,838 |
| Derivatives not subject to master netting or similar agreements | $ — | $ 242,019 | $ 544,787 | $ 786,806 |
| Total Asset Derivatives subject to master netting or similar agreements | $ 955 | $ 163,105 | $ 18,972 | $ 183,032 |
| Written swaptions outstanding, at value | $ — | $ — | $ (75,613) | $ (75,613) |
| Not applicable | — | (126,682)* | (1,354,093)* | (1,480,775) |
| Payable for open forward foreign currency exchange contracts | — | (471,554) | — | (471,554) |
| Payable for open swap contracts; Upfront receipts on open non-centrally cleared swap contracts | — | — | (20,721) | (20,721) |
| Total Liability Derivatives | $ — | $(598,236) | $(1,450,427) | $(2,048,663) |
| Derivatives not subject to master netting or similar agreements | $ — | $(126,682) | $(1,354,093) | $(1,480,775) |
| Total Liability Derivatives subject to master netting or similar agreements | $ — | $(471,554) | $ (96,334) | $ (567,888) |
| * | Only the current day’s variation margin on open futures contracts and centrally cleared derivatives is reported within the Statement of Assets and Liabilities as Receivable or Payable for variation margin on open futures contracts and centrally cleared derivatives, as applicable. |
The Portfolio's derivative assets and liabilities at fair value by risk, which are reported gross in the Statement of Assets and Liabilities, are presented in the table above. The following tables present the Portfolio's derivative assets and liabilities by counterparty, net of amounts available for offset under a master netting agreement and net of the related collateral received by the Portfolio for such assets and pledged by the Portfolio for such liabilities as of October 31, 2023.
| Counterparty | Derivative
Assets Subject to
Master Netting
Agreement | Derivatives
Available
for Offset | Non-cash
Collateral
Received(a) | Cash
Collateral
Received(a) | Net Amount
of Derivative
Assets(b) |
| Barclays Bank PLC | $ 18,972 | $ — | $ — | $ — | $ 18,972 |
| BNP Paribas | 43,239 | (13,230) | — | — | 30,009 |
| Citibank, N.A. | 18,811 | (18,811) | — | — | — |
| Goldman Sachs International | 12,105 | (12,105) | — | — | — |
| HSBC Bank USA, N.A. | 2,933 | (2,933) | — | — | — |
| JPMorgan Chase Bank, N.A. | 9,029 | (8,655) | — | — | 374 |
| Standard Chartered Bank | 6,920 | (6,920) | — | — | — |
| State Street Bank and Trust Company | 4,160 | (676) | — | — | 3,484 |
| UBS AG | 66,863 | (66,863) | — | — | — |
| | $183,032 | $(130,193) | $ — | $ — | $52,839 |
International Income Portfolio
October 31, 2023
Notes to Financial Statements — continued
| Counterparty | Derivative
Liabilities Subject to
Master Netting
Agreement | Derivatives
Available
for Offset | Non-cash
Collateral
Pledged(a) | Cash
Collateral
Pledged(a) | Net Amount
of Derivative
Liabilities(c) |
| Bank of America, N.A. | $ (229) | $ — | $ — | $ — | $ (229) |
| BNP Paribas | (13,230) | 13,230 | — | — | — |
| Citibank, N.A. | (323,200) | 18,811 | 304,389 | — | — |
| Goldman Sachs International | (49,334) | 12,105 | — | — | (37,229) |
| HSBC Bank USA, N.A. | (22,378) | 2,933 | — | — | (19,445) |
| JPMorgan Chase Bank, N.A. | (8,655) | 8,655 | — | — | — |
| Standard Chartered Bank | (64,593) | 6,920 | 57,673 | — | — |
| State Street Bank and Trust Company | (676) | 676 | — | — | — |
| UBS AG | (85,593) | 66,863 | — | — | (18,730) |
| | $(567,888) | $130,193 | $362,062 | $ — | $(75,633) |
| (a) | In some instances, the total collateral received and/or pledged may be more than the amount shown due to overcollateralization. |
| (b) | Net amount represents the net amount due from the counterparty in the event of default. |
| (c) | Net amount represents the net amount payable to the counterparty in the event of default. |
Information with respect to repurchase and reverse repurchase agreements at October 31, 2023 is included at Note 7.
The effect of derivative instruments (not considered to be hedging instruments for accounting disclosure purposes) on the Statement of Operations by risk exposure for the year ended October 31, 2023 was as follows:
| Statement of Operations Caption | Credit | Foreign
Exchange | Interest
Rate | Total |
| Net realized gain (loss): | | | | |
| Investment transactions | $ — | $ (13,224) | $ (32,900) | $ (46,124) |
| Written swaptions | — | — | 36,050 | 36,050 |
| Futures contracts | — | — | (77,802) | (77,802) |
| Swap contracts | 146,602 | — | (619,051) | (472,449) |
| Forward foreign currency exchange contracts | — | (392,837) | — | (392,837) |
| Non-deliverable bond forward contracts | — | — | 106,415 | 106,415 |
| Total | $146,602 | $(406,061) | $(587,288) | $(846,747) |
| Change in unrealized appreciation (depreciation): | | | | |
| Investments | $ — | $ — | $ 32,899 | $ 32,899 |
| Written swaptions | — | — | 49,410 | 49,410 |
| Futures contracts | — | — | (276,333) | (276,333) |
| Swap contracts | (32,684) | — | (230,089) | (262,773) |
| Forward foreign currency exchange contracts | — | (462,253) | — | (462,253) |
| Non-deliverable bond forward contracts | — | — | (16,849) | (16,849) |
| Total | $ (32,684) | $(462,253) | $(440,962) | $(935,899) |
International Income Portfolio
October 31, 2023
Notes to Financial Statements — continued
The average notional cost of futures contracts and average notional amounts of other derivative contracts outstanding during the year ended October 31, 2023, which are indicative of the volume of these derivative types, were approximately as follows:
Futures
Contracts — Long | Futures
Contracts — Short | Forward
Foreign Currency
Exchange Contracts* | Non-Deliverable
Bond Forward
Contracts | Purchased Call
Options | Written
Swaptions | Swap
Contracts |
| $4,007,000 | $2,544,000 | $70,092,000 | $1,048,000 | $5,423,000 | $1,930,000 | $55,683,000 |
| * | The average notional amount for forward foreign currency exchange contracts is based on the absolute value of notional amounts of currency purchased and currency sold. |
The average principal amount of purchased currency options contracts outstanding during the year ended October 31, 2023, which is indicative of the volume of this derivative type, was approximately $467,000.
6 Line of Credit
The Portfolio participates with other portfolios and funds managed by EVM and its affiliates in a $650 million unsecured revolving line of credit agreement with a group of banks, which is in effect through October 22, 2024. In connection with the renewal of the agreement on October 24, 2023, the borrowing limit was decreased from $725 million. Borrowings are made by the Portfolio solely for temporary purposes related to redemptions and other short-term cash needs. Interest is charged to the Portfolio based on its borrowings at an amount above either the Secured Overnight Financing Rate (SOFR) or Federal Funds rate. In addition, a fee computed at an annual rate of 0.15% on the daily unused portion of the line of credit is allocated among the participating portfolios and funds at the end of each quarter. In connection with the renewal of the agreement in October 2023, an arrangement fee totaling $150,000 was incurred that was allocated to the participating portfolios and funds. Because the line of credit is not available exclusively to the Portfolio, it may be unable to borrow some or all of its requested amounts at any particular time. The Portfolio did not have any significant borrowings or allocated fees during the year ended October 31, 2023.
7 Reverse Repurchase Agreements
Reverse repurchase agreements outstanding as of October 31, 2023 were as follows:
| Counterparty | Trade
Date | Maturity
Date | Interest
Rate Paid
(Received) | Principal
Amount | Value
Including
Accrued
Interest |
| Barclays Bank PLC | 9/29/23 | On Demand(1) | 5.65% | $ 375,840 | $ 377,469 |
| Barclays Bank PLC | 10/16/23 | On Demand(1) | 5.65 | 419,179 | 420,023 |
| Total | | | | $795,019 | $797,492 |
| (1) | Open repurchase agreement with no specific maturity date. Either party may terminate the agreement upon demand. |
At October 31, 2023, the type of securities pledged as collateral for all open reverse repurchase agreements was Sovereign Government Bonds.
For the year ended October 31, 2023, the average borrowings under settled reverse repurchase agreements and the average interest rate paid were approximately $44,000 and 5.65%, respectively. Based on the short-term nature of the borrowings under the reverse repurchase agreements, the carrying value of the payable for reverse repurchase agreements approximated its fair value at October 31, 2023. If measured at fair value, borrowings under the reverse repurchase agreements would have been considered as Level 2 in the fair value hierarchy (see Note 9) at October 31, 2023.
Reverse repurchase agreements entered into by the Portfolio are subject to Master Repurchase Agreements (MRA), which permit the Portfolio, under certain circumstances, including an event of default (such as bankruptcy or insolvency), to offset payables and/or receivables under the MRA with collateral held and/or posted to the counterparty and create one single net payment due to or from the Portfolio.
International Income Portfolio
October 31, 2023
Notes to Financial Statements — continued
The following tables present the Portfolio’s repurchase and reverse repurchase agreements net of amounts available for offset under an MRA and net of the related collateral received and/or pledged by the Portfolio as of October 31, 2023.
| Counterparty | Repurchase
Agreements | Liabilities
Available for
Offset | Securities
Collateral
Received(a) | Net
Amount(b) |
| Barclays Bank PLC | $576,209 | $(576,209) | $ — | $ — |
| Counterparty | Reverse
Repurchase
Agreements* | Assets
Available for
Offset | Securities
Collateral
Pledged(a) | Net
Amount(c) |
| Barclays Bank PLC | $(797,492) | $576,209 | $221,283 | $ — |
| * | Including accrued interest. |
| (a) | In some instances, the total collateral received and/or pledged may be more than the amount shown due to overcollateralization. |
| (b) | Net amount represents the net amount receivable from the counterparty in the event of default. |
| (c) | Net amount represents the net amount payable to the counterparty in the event of default. |
8 Affiliated Investments
At October 31, 2023, the value of the Portfolio's investment in funds that may be deemed to be affiliated was $803,076, which represents 2.2% of the Portfolio's net assets. Transactions in such investments by the Portfolio for the year ended October 31, 2023 were as follows:
| Name | Value,
beginning
of period | Purchases | Sales
proceeds | Net
realized
gain (loss) | Change in
unrealized
appreciation
(depreciation) | Value, end
of period | Dividend
income | Shares,
end of period |
| Short-Term Investments |
| Liquidity Fund | $1,368,351 | $57,492,949 | $(58,058,224) | $ — | $ — | $803,076 | $126,697 | 803,076 |
9 Fair Value Measurements
Under generally accepted accounting principles for fair value measurements, a three-tier hierarchy to prioritize the assumptions, referred to as inputs, is used in valuation techniques to measure fair value. The three-tier hierarchy of inputs is summarized in the three broad levels listed below.
| • | Level 1 – quoted prices in active markets for identical investments |
| • | Level 2 – other significant observable inputs (including quoted prices for similar investments, interest rates, prepayment speeds, credit risk, etc.) |
| • | Level 3 – significant unobservable inputs (including a fund's own assumptions in determining the fair value of investments) |
In cases where the inputs used to measure fair value fall in different levels of the fair value hierarchy, the level disclosed is determined based on the lowest level input that is significant to the fair value measurement in its entirety. The inputs or methodology used for valuing securities are not necessarily an indication of the risk associated with investing in those securities.
At October 31, 2023, the hierarchy of inputs used in valuing the Portfolio's investments and open derivative instruments, which are carried at fair value, were as follows:
| Asset Description | Level 1 | Level 2 | Level 3 | Total |
| Collateralized Mortgage Obligations | $ — | $ 2,724,100 | $ — | $ 2,724,100 |
| Foreign Corporate Bonds | — | 1,274,749 | — | 1,274,749 |
International Income Portfolio
October 31, 2023
Notes to Financial Statements — continued
| Asset Description (continued) | Level 1 | Level 2 | Level 3 | Total |
| Sovereign Government Bonds | $ — | $ 21,195,267 | $ — | $ 21,195,267 |
| U.S. Government Agency Mortgage-Backed Securities | — | 3,526,699 | — | 3,526,699 |
| U.S. Treasury Obligations | — | 294,203 | — | 294,203 |
| Short-Term Investments: | | | | |
| Affiliated Fund | 803,076 | — | — | 803,076 |
| Repurchase Agreements | — | 576,209 | — | 576,209 |
| Sovereign Government Securities | — | 1,705,342 | — | 1,705,342 |
| U.S. Treasury Obligations | — | 6,759,338 | — | 6,759,338 |
| Total Investments | $ 803,076 | $ 38,055,907 | $ — | $ 38,858,983 |
| Forward Foreign Currency Exchange Contracts | $ — | $ 405,124 | $ — | $ 405,124 |
| Futures Contracts | 26,164 | — | — | 26,164 |
| Swap Contracts | — | 538,550 | — | 538,550 |
| Total | $ 829,240 | $ 38,999,581 | $ — | $ 39,828,821 |
| Liability Description | | | | |
| Securities Sold Short | $ — | $ (551,478) | $ — | $ (551,478) |
| Written Interest Rate Swaptions | — | (75,613) | — | (75,613) |
| Forward Foreign Currency Exchange Contracts | — | (598,236) | — | (598,236) |
| Futures Contracts | (185,012) | — | — | (185,012) |
| Swap Contracts | — | (1,189,802) | — | (1,189,802) |
| Total | $ (185,012) | $ (2,415,129) | $ — | $ (2,600,141) |
The following is a reconciliation of Level 3 investments for which significant unobservable inputs were used to determine fair value:
| | Sovereign
Government
Bonds | Sovereign
Government
Securities | Total |
| Balance as of October 31, 2022 | $ 532,429 | $ 41,884 | $ 574,313 |
| Realized gains (losses) | — | — | — |
| Change in net unrealized appreciation (depreciation) | — | — | — |
| Cost of purchases | — | — | — |
| Proceeds from sales, including return of capital | — | — | — |
| Accrued discount (premium) | — | — | — |
| Transfers to Level 3 | — | — | — |
| Transfers from Level 3(1) | (532,429) | (41,884) | (574,313) |
| Balance as of October 31, 2023 | $ — | $ — | $ — |
| (1) | Transferred from Level 3 based on the observability of valuation inputs resulting from new market activity. |
International Income Portfolio
October 31, 2023
Notes to Financial Statements — continued
10 Risks and Uncertainties
Risks Associated with Foreign Investments
Foreign investments can be adversely affected by political, economic and market developments abroad, including the imposition of economic and other sanctions by the United States or another country. There may be less publicly available information about foreign issuers because they may not be subject to reporting practices, requirements or regulations comparable to those to which United States companies are subject. Foreign markets may be smaller, less liquid and more volatile than the major markets in the United States. Trading in foreign markets typically involves higher expense than trading in the United States. The Portfolio may have difficulties enforcing its legal or contractual rights in a foreign country. Securities that trade or are denominated in currencies other than the U.S. dollar may be adversely affected by fluctuations in currency exchange rates.
Emerging market securities often involve greater risks than developed market securities. Investment markets within emerging market countries are typically smaller, less liquid, less developed and more volatile than those in more developed markets like the United States, and may be focused in certain economic sectors. The information available about an emerging market issuer may be less reliable than for comparable issuers in more developed capital markets. Governmental actions can have a significant effect on the economic conditions in emerging market countries. It may be more difficult to make a claim or obtain a judgment in the courts of these countries than it is in the United States. The possibility of fraud, negligence, undue influence being exerted by an issuer or refusal to recognize ownership exists in some emerging markets. Disruptions due to work stoppages and trading improprieties in foreign securities markets have caused such markets to close. Emerging market securities are also subject to speculative trading, which contributes to their volatility.
Economic data as reported by sovereign entities may be delayed, inaccurate or fraudulent. In the event of a default by a sovereign entity, there are typically no assets to be seized or cash flows to be attached. Furthermore, the willingness or ability of a sovereign entity to restructure defaulted debt may be limited. Therefore, losses on sovereign defaults may far exceed the losses from the default of a similarly rated U.S. debt issuer.
On February 24, 2022, Russia launched an invasion of Ukraine, following rising tensions over the buildup of Russian troops along the Ukrainian border and joint military exercises by Russia with Belarus. In response to the invasion, many countries, including the U.S., have imposed economic sanctions on Russian governmental institutions, Russian entities, and Russian individuals. The conflict and sanctions have had a negative impact on the Russian economy, on the Russian currency, and on investments having exposure to Russia, Belarus and Ukraine. The conflict could also have a significant effect on investments outside the region. The duration and extent of the military conflict with Russia and the related sanctions cannot be predicted at this time.
International Income Portfolio
October 31, 2023
Report of Independent Registered Public Accounting Firm
To the Trustees and Investors of International Income Portfolio:
Opinion on the Financial Statements and Financial Highlights
We have audited the accompanying statement of assets and liabilities of International Income Portfolio (the “Portfolio”), including the portfolio of investments, as of October 31, 2023, the related statement of operations for the year then ended, the statements of changes in net assets for each of the two years in the period then ended, the financial highlights for each of the five years in the period then ended, and the related notes. In our opinion, the financial statements and financial highlights present fairly, in all material respects, the financial position of the Portfolio as of October 31, 2023, and the results of its operations for the year then ended, the changes in its net assets for each of the two years in the period then ended, and the financial highlights for each of the five years in the period then ended, in conformity with accounting principles generally accepted in the United States of America.
Basis for Opinion
These financial statements and financial highlights are the responsibility of the Portfolio’s management. Our responsibility is to express an opinion on the Portfolio’s financial statements and financial highlights based on our audits. We are a public accounting firm registered with the Public Company Accounting Oversight Board (United States) (PCAOB) and are required to be independent with respect to the Portfolio in accordance with the U.S. federal securities laws and the applicable rules and regulations of the Securities and Exchange Commission and the PCAOB.
We conducted our audits in accordance with the standards of the PCAOB. Those standards require that we plan and perform the audit to obtain reasonable assurance about whether the financial statements and financial highlights are free of material misstatement, whether due to error or fraud. The Portfolio is not required to have, nor were we engaged to perform, an audit of its internal control over financial reporting. As part of our audits, we are required to obtain an understanding of internal control over financial reporting but not for the purpose of expressing an opinion on the effectiveness of the Portfolio’s internal control over financial reporting. Accordingly, we express no such opinion.
Our audits included performing procedures to assess the risks of material misstatement of the financial statements and financial highlights, whether due to error or fraud, and performing procedures that respond to those risks. Such procedures included examining, on a test basis, evidence regarding the amounts and disclosures in the financial statements and financial highlights. Our audits also included evaluating the accounting principles used and significant estimates made by management, as well as evaluating the overall presentation of the financial statements and financial highlights. Our procedures included confirmation of securities owned as of October 31, 2023, by correspondence with the custodian and brokers; when replies were not received from brokers, we performed other auditing procedures. We believe that our audits provide a reasonable basis for our opinion.
/s/ Deloitte & Touche LLP
Boston, Massachusetts
December 22, 2023
We have served as the auditor of one or more Eaton Vance investment companies since 1959.
Eaton Vance
Global Sovereign Opportunities Fund
October 31, 2023
Board of Trustees’ Contract Approval
Overview of the Contract Review Process
The Investment Company Act of 1940, as amended (the “1940 Act”), provides, in substance, that the investment advisory agreement between a fund and its investment adviser will continue in effect from year-to-year only if its continuation is approved on an annual basis by a vote of the fund’s board of trustees, including a majority of the trustees who are not “interested persons” of the fund (“independent trustees”), cast in person at a meeting called for the purpose of considering such approval.
At a meeting held on June 8, 2023, the Boards of Trustees/Directors (collectively, the “Board”) that oversee the registered investment companies advised by Eaton Vance Management or its affiliate, Boston Management and Research (the “Eaton Vance Funds”), including a majority of the independent trustees (the “Independent Trustees”), voted to approve the continuation of existing investment advisory agreements and sub-advisory agreements1 for each of the Eaton Vance Funds for an additional one-year period. The Board relied upon the affirmative recommendation of its Contract Review Committee, which is a committee exclusively comprised of Independent Trustees. Prior to making its recommendation, the Contract Review Committee reviewed information furnished by the adviser and sub-adviser to each of the Eaton Vance Funds (including information specifically requested by the Board) for a series of formal meetings held between April and June 2023, as well as certain additional information provided in response to specific requests from the Independent Trustees as members of the Contract Review Committee. Members of the Contract Review Committee also considered information received at prior meetings of the Board and its committees, to the extent such information was relevant to the Contract Review Committee’s annual evaluation of the investment advisory agreements and sub-advisory agreements.
In connection with its evaluation of the investment advisory agreements and sub-advisory agreements, the Board considered various information relating to the Eaton Vance Funds. This included information applicable to all or groups of Eaton Vance Funds, which is referenced immediately below, and information applicable to the particular Eaton Vance Fund covered by this report (each “Eaton Vance Fund” is referred to below as a “fund”). (For funds that invest through one or more underlying portfolios, references to “each fund” in this section may include information that was considered at the portfolio-level.)
Information about Fees, Performance and Expenses
• A report from an independent data provider comparing advisory and other fees paid by each fund to such fees paid by comparable funds, as identified by the independent data provider (“comparable funds”);
• A report from an independent data provider comparing each fund’s total expense ratio (and its components) to those of comparable funds;
• A report from an independent data provider comparing the investment performance of each fund (including, as relevant, total return data, income data, Sharpe ratios and information ratios) to the investment performance of comparable funds and, as applicable, benchmark indices, over various time periods;
• In certain instances, data regarding investment performance relative to customized groups of peer funds and blended indices identified by the adviser in consultation with the Portfolio Management Committee of the Board (a committee exclusively comprised of Independent Trustees);
• Comparative information concerning the fees charged and services provided by the adviser and sub-adviser to each fund in managing other accounts (which may include other mutual funds, collective investment funds and institutional accounts) using investment strategies and techniques similar to those used in managing such fund(s), if any;
• Profitability analyses with respect to the adviser and sub-adviser to each of the funds;
Information about Portfolio Management and Trading
• Descriptions of the investment management services provided to each fund, as well as each of the funds’ investment strategies and policies;
• The procedures and processes used to determine the value of fund assets, including, when necessary, the determination of “fair value” and actions taken to monitor and test the effectiveness of such procedures and processes;
• Information about the policies and practices of each fund’s adviser and sub-adviser with respect to trading, including their processes for seeking best execution of portfolio transactions;
• Information about the allocation of brokerage transactions and the benefits, if any, received by the adviser and sub-adviser to each fund as a result of brokerage allocation, including, as applicable, information concerning the acquisition of research through client commission arrangements and policies with respect to “soft dollars”;
• Data relating to the portfolio turnover rate of each fund and related information regarding active management in the context of particular strategies;
Information about each Adviser and Sub-adviser
• Reports detailing the financial results and condition of the adviser and sub-adviser to each fund;
• Information regarding the individual investment professionals whose responsibilities include portfolio management and investment research for the funds, and, for portfolio managers and certain other investment professionals, information relating to their responsibilities with respect to managing other mutual funds and investment accounts, as applicable;
1 Not all Eaton Vance Funds have entered into a sub-advisory agreement with a sub-adviser. Accordingly, references to “sub-adviser” or “sub-advisory agreement” in this “Overview” section may not be applicable to the particular Eaton Vance Fund covered by this report.
Eaton Vance
Global Sovereign Opportunities Fund
October 31, 2023
Board of Trustees’ Contract Approval — continued
• Information regarding the adviser’s and its parent company’s (Morgan Stanley’s) efforts to retain and attract talented investment professionals, including in the context of a competitive marketplace for talent, as well as the ongoing unique environment presented by hybrid, remote and other alternative work arrangements;
• Information regarding the adviser’s compensation methodology for its investment professionals and the incentives and accountability it creates, along with investment professionals’ investments in the fund(s) they manage;
• The Code of Ethics of the adviser and its affiliates and the sub-adviser of each fund, together with information relating to compliance with, and the administration of, such codes;
• Policies and procedures relating to proxy voting, including regular reporting with respect to fund proxy voting activities;
• Information regarding the handling of corporate actions and class actions, as well as information regarding litigation and other regulatory matters;
• Information concerning the resources devoted to compliance efforts undertaken by the adviser and its affiliates and the sub-adviser of each fund, if any, including descriptions of their various compliance programs and their record of compliance;
• Information concerning the business continuity and disaster recovery plans of the adviser and its affiliates and the sub-adviser of each fund, if any;
• A description of Eaton Vance Management’s and Boston Management and Research’s oversight of sub-advisers, including with respect to regulatory and compliance issues, investment management and other matters;
Other Relevant Information
• Information regarding ongoing initiatives to further integrate and harmonize, where applicable, the investment management and other departments of the adviser and its affiliates with the overall investment management infrastructure of Morgan Stanley, in light of Morgan Stanley’s acquisition of Eaton Vance Corp. on March 1, 2021;
• Information concerning the nature, cost and character of the administrative and other non-investment advisory services provided by Eaton Vance Management and its affiliates;
• Information concerning oversight of the relationship with the custodian, subcustodians, fund accountants, and other third-party service providers by the adviser and/or administrator to each of the funds;
• Information concerning efforts to implement policies and procedures with respect to various recently adopted regulations applicable to the funds, including Rule 12d1-4 (the Fund-of-Funds Rule), Rule 18f-4 (the Derivatives Rule) and Rule 2a-5 (the Fair Valuation Rule);
• For an Eaton Vance Fund structured as an exchange-listed closed-end fund, information concerning the benefits of the closed-end fund structure, as well as, where relevant, the closed-end fund’s market prices (including as compared to the closed-end fund’s net asset value (NAV)), trading volume data, continued use of auction preferred shares (where applicable), distribution rates and other relevant matters;
• The risks which the adviser and/or its affiliates incur in connection with the management and operation of the funds, including, among others, litigation, regulatory, entrepreneurial, and other business risks (and the associated costs of such risks); and
• The terms of each investment advisory agreement and sub-advisory agreement.
During the various meetings of the Board and its committees over the course of the year leading up to the June 8, 2023 meeting, the Board received information from portfolio managers and other investment professionals of the advisers and sub-advisers of the funds regarding investment and performance matters, and considered various investment and trading strategies used in pursuing the funds’ investment objectives. The Board also received information regarding risk management techniques employed in connection with the management of the funds. The Board and its committees evaluated issues pertaining to industry and regulatory developments, compliance procedures, fund governance and other issues with respect to the funds, and received and participated in reports and presentations provided by Eaton Vance Management, Boston Management and Research and fund sub-advisers, with respect to such matters. In addition to the formal meetings of the Board and its committees, the Independent Trustees held regular teleconferences to discuss, among other topics, matters relating to the continuation of investment advisory agreements and sub-advisory agreements.
The Contract Review Committee was advised throughout the contract review process by Goodwin Procter LLP, independent legal counsel for the Independent Trustees. The members of the Contract Review Committee, with the advice of such counsel, exercised their own business judgment in determining the material factors to be considered in evaluating each investment advisory agreement and sub-advisory agreement and the weight to be given to each such factor. The conclusions reached with respect to each investment advisory agreement and sub-advisory agreement were based on a comprehensive evaluation of all the information provided and not any single factor. Moreover, each member of the Contract Review Committee may have placed varying emphasis on particular factors in reaching conclusions with respect to each investment advisory agreement and sub-advisory agreement. In evaluating each investment advisory agreement and sub-advisory agreement, including the fee structures and other terms contained in such agreements, the members of the Contract Review Committee were also informed by multiple years of analysis and discussion with the adviser and sub-adviser to each of the Eaton Vance Funds.
Results of the Contract Review Process
Based on its consideration of the foregoing, and such other information it deemed relevant, including the factors and conclusions described below, the Contract Review Committee concluded that the continuation of the investment advisory agreement between Eaton Vance Global Sovereign Opportunities Fund (formerly, Eaton Vance Global Bond Fund) (the “Fund”) and Eaton Vance Management (“EVM”), as well as the investment advisory agreement between International Income Portfolio (the “Portfolio”), the portfolio in which the Fund invests, and Boston Management and Research (“BMR”) (EVM,
Eaton Vance
Global Sovereign Opportunities Fund
October 31, 2023
Board of Trustees’ Contract Approval — continued
with respect to the Fund, and BMR, with respect to the Portfolio, are each referred to herein as the “Adviser”), including their respective fee structures, are in the interests of shareholders and, therefore, recommended to the Board approval of each agreement. Based on the recommendation of the Contract Review Committee, the Board, including a majority of the Independent Trustees, voted to approve continuation of the investment advisory agreements for the Fund and the Portfolio.
Nature, Extent and Quality of Services
In considering whether to approve the investment advisory agreements for the Fund and the Portfolio, the Board evaluated the nature, extent and quality of services provided to the Fund and the Portfolio by the applicable Adviser.
The Board considered each Adviser’s management capabilities and investment processes in light of the types of investments held by the Fund and the Portfolio, including the education, experience and number of investment professionals and other personnel who provide portfolio management, investment research, and similar services to the Fund and the Portfolio. The Board considered the abilities and experience of each Adviser’s investment professionals in analyzing factors relevant to investment in sovereign obligations. The Board also considered each Adviser’s expertise with respect to global markets and in-house research capabilities. The Board also took into account the resources dedicated to portfolio management and other services, the compensation methods of each Adviser and other factors, including the reputation and resources of the Adviser to recruit and retain highly qualified research, advisory and supervisory investment professionals. In addition, the Board considered the time and attention devoted to the Eaton Vance Funds, including the Fund and the Portfolio, by senior management, as well as the infrastructure, operational capabilities and support staff in place to assist in the portfolio management and operations of the Fund and the Portfolio, including the provision of administrative services. The Board also considered the business-related and other risks to which each Adviser or its affiliates may be subject in managing the Fund and the Portfolio.
The Board noted that under the terms of the investment advisory agreement of the Fund, EVM may invest assets of the Fund directly in securities, for which it would receive a fee, or in the Portfolio, for which it receives no separate fee but for which BMR receives an advisory fee from the Portfolio.
The Board considered the compliance programs of each Adviser and relevant affiliates thereof. The Board considered compliance and reporting matters regarding, among other things, personal trading by investment professionals, disclosure of portfolio holdings, late trading, frequent trading, portfolio valuation, business continuity and the allocation of investment opportunities. The Board also considered the responses of each Adviser and its affiliates to requests in recent years from regulatory authorities, such as the Securities and Exchange Commission and the Financial Industry Regulatory Authority.
The Board considered other administrative services provided or overseen by Eaton Vance Management and its affiliates, including transfer agency and accounting services. The Board evaluated the benefits to shareholders of investing in a fund that is a part of a large fund complex offering exposure to a variety of asset classes and investment disciplines, as well as the ability, in many cases, to exchange an investment among different funds without incurring additional sales charges.
After consideration of the foregoing factors, among others, the Board concluded that the nature, extent and quality of services provided by each Adviser, taken as a whole, are appropriate and consistent with the terms of the applicable investment advisory agreement.
Fund Performance
The Board compared the Fund’s investment performance to that of comparable funds identified by an independent data provider (the peer group), as well as an appropriate benchmark indices. The Board’s review included comparative performance data with respect to the Fund for the one-, three-, five- and ten-year periods ended December 31, 2022. In this regard, the Board noted that the performance of the Fund was higher than the median performance of the Fund’s peer group for the three-year period. The Board also noted that the performance of the Fund was higher than its primary benchmark and blended benchmark indexes for the three-year period. The Board also considered the performance of the underlying Portfolios. The Board noted that, effective on or about June 26, 2023, the Fund’s name and investment strategies will change to allow the Fund, under normal market conditions, to invest at least 80% of its net assets (plus the amount of any borrowings for investment purposes) in U.S. and non-U.S. sovereign investments. The Board also noted that the Fund, under normal market conditions, will continue to invest at least 40% of its net assets in foreign investments. On the basis of the foregoing and other relevant information provided to the Board, the Board concluded that each Portfolio had achieved its performance objective. The Board also concluded that the performance of the Fund was satisfactory.
Management Fees and Expenses
The Board considered contractual fee rates payable by the Portfolio and by the Fund for advisory and administrative services (referred to collectively as “management fees”). As part of its review, the Board considered the Fund’s management fees and total expense ratio for the one-year period ended December 31, 2022, as compared to those of comparable funds, before and after giving effect to any undertaking to waive fees or reimburse expenses. The Board also considered factors that had an impact on the Fund’s total expense ratio relative to comparable funds.
After considering the foregoing information, and in light of the nature, extent and quality of the services provided by each Adviser, the Board concluded that the management fees charged for advisory and related services are reasonable.
Eaton Vance
Global Sovereign Opportunities Fund
October 31, 2023
Board of Trustees’ Contract Approval — continued
Profitability and “Fall-Out” Benefits
The Board considered the level of profits realized by each Adviser and relevant affiliates thereof in providing investment advisory and administrative services to the Fund, to the Portfolio and to all Eaton Vance Funds as a group. The Board considered the level of profits realized without regard to marketing support or other payments by each Adviser and its affiliates to third parties in respect of distribution or other services.
The Board concluded that, in light of the foregoing factors and the nature, extent and quality of the services rendered, the profits realized by each Adviser and its affiliates are deemed not to be excessive.
The Board also considered direct or indirect fall-out benefits received by each Adviser and its affiliates in connection with their respective relationships with the Fund and the Portfolio, including the benefits of research services that may be available to each Adviser as a result of securities transactions effected for the Fund and the Portfolio and other investment advisory clients.
Economies of Scale
In reviewing management fees and profitability, the Board also considered the extent to which the applicable Adviser and its affiliates, on the one hand, and the Fund and the Portfolio, on the other hand, can expect to realize benefits from economies of scale as the assets of the Fund and the Portfolio increase. The Board acknowledged the difficulty in accurately measuring the benefits resulting from economies of scale, if any, with respect to the management of any specific fund or group of funds. The Board reviewed data summarizing the increases and decreases in the assets of the Fund and of all Eaton Vance Funds as a group over various time periods, and evaluated the extent to which the total expense ratio of the Fund and the profitability of each Adviser and its affiliates may have been affected by such increases or decreases. Based upon the foregoing, the Board concluded that the Fund currently shares in the benefits from economies of scale, if any, when they are realized by the Adviser. The Board also concluded that the structure of the advisory fees, which include breakpoints at several asset levels, will allow the Fund and the Portfolio to continue to benefit from any economies of scale in the future.
Eaton Vance
Global Sovereign Opportunities Fund
October 31, 2023
Liquidity Risk Management Program
The Fund has implemented a written liquidity risk management program (Program) and related procedures to manage its liquidity in accordance with Rule 22e-4 under the Investment Company Act of 1940, as amended (Liquidity Rule). The Liquidity Rule defines “liquidity risk” as the risk that a fund could not meet requests to redeem shares issued by the fund without significant dilution of the remaining investors’ interests in the fund. The Fund’s Board of Trustees/Directors has designated the investment adviser to serve as the administrator of the Program and the related procedures. The administrator has established a Liquidity Risk Management Oversight Committee (Committee) to perform the functions necessary to administer the Program. As part of the Program, the administrator is responsible for identifying illiquid investments and categorizing the relative liquidity of the Fund’s investments in accordance with the Liquidity Rule. Under the Program, the administrator assesses, manages, and periodically reviews the Fund’s liquidity risk, and is responsible for making certain reports to the Fund’s Board of Trustees/Directors and the Securities and Exchange Commission (SEC) regarding the liquidity of the Fund’s investments, and to notify the Board of Trustees/Directors and the SEC of certain liquidity events specified in the Liquidity Rule. The liquidity of the Fund’s portfolio investments is determined based on a number of factors including, but not limited to, relevant market, trading and investment-specific considerations under the Program.
At a meeting of the Fund’s Board of Trustees/Directors on June 7, 2023, the Committee provided a written report to the Fund’s Board of Trustees/
Directors pertaining to the operation, adequacy, and effectiveness of implementation of the Program, as well as the operation of the highly liquid investment minimum (if applicable) for the period January 1, 2022 through December 31, 2022 (Review Period). The Program operated effectively during the Review Period, supporting the administrator’s ability to assess, manage and monitor Fund liquidity risk, including during periods of market volatility and net redemptions. During the Review Period, the Fund met redemption requests on a timely basis.
There can be no assurance that the Program will achieve its objectives in the future. Please refer to the Fund’s prospectus for more information regarding the Fund’s exposure to liquidity risk and other principal risks to which an investment in the Fund may be subject.
Eaton Vance
Global Sovereign Opportunities Fund
October 31, 2023
Management and Organization
Fund Management. The Trustees of Eaton Vance Mutual Funds Trust (the Trust) and International Income Portfolio (the Portfolio) are responsible for the overall management and supervision of the Trust's and the Portfolio's affairs. The Board members and officers of the Trust and the Portfolio are listed below. Except as indicated, each individual has held the office shown or other offices in the same company for the last five years. Board members hold indefinite terms of office. Each Trustee holds office until his or her successor is elected and qualified, subject to a prior death, resignation, retirement, disqualification or removal. Under the terms of the Fund's and the Portfolio's current Trustee retirement policy, an Independent Trustee must retire and resign as a Trustee on the earlier of: (i) the first day of July following his or her 74th birthday; or (ii), with limited exception, December 31st of the 20th year in which he or she has served as a Trustee. However, if such retirement and resignation would cause the Fund and the Portfolio to be out of compliance with Section 16 of the 1940 Act or any other regulations or guidance of the SEC, then such retirement and resignation will not become effective until such time as action has been taken for the Fund and the Portfolio to be in compliance therewith. The “noninterested Trustees” consist of those Trustees who are not “interested persons” of the Trust and the Portfolio, as that term is defined under the 1940 Act. The business address of each Board member and officer is Two International Place, Boston, Massachusetts 02110. As used below, “BMR” refers to Boston Management and Research, “EV” refers to EV LLC, “EVM” refers to Eaton Vance Management, "MSIM" refers to Morgan Stanley Investment Management Inc. and “EVD” refers to Eaton Vance Distributors, Inc. EV is the trustee of each of EVM and BMR. Each of EVM, BMR, EVD and EV are indirect, wholly owned subsidiaries of Morgan Stanley. Each officer affiliated with EVM may hold a position with other EVM affiliates that is comparable to his or her position with EVM listed below. Each Trustee oversees 127 funds in the Eaton Vance fund complex (including both funds and portfolios in a hub and spoke structure).
| Name and Year of Birth | Trust/Portfolio
Position(s) | Length of Service | Principal Occupation(s) and Other Directorships
During Past Five Years and Other Relevant Experience |
| Interested Trustee |
Anchal Pachnanda(1)
1980 | Trustee | Since 2023 | Co-Head of Strategy of MSIM (since 2019). Formerly, Head of Strategy of MSIM (2017-2019). Ms. Pachnanda is an interested person because of her position with MSIM, which is an affiliate of the Trust.
Other Directorships. None. |
| Noninterested Trustees |
Alan C. Bowser
1962 | Trustee | Since 2022 | Private investor. Formerly, Chief Diversity Officer, Partner and a member of the Operating Committee, and formerly served as Senior Advisor on Diversity and Inclusion for the firm’s chief executive officer, Co-Head of the Americas Region, and Senior Client Advisor of Bridgewater Associates, an asset management firm (2011- 2023).
Other Directorships. Independent Director of Stout Risius Ross (a middle market professional services advisory firm) (since 2021). |
Mark R. Fetting
1954 | Trustee | Since 2016 | Private investor. Formerly held various positions at Legg Mason, Inc. (investment management firm) (2000-2012), including President, Chief Executive Officer, Director and Chairman (2008-2012), Senior Executive Vice President (2004-2008) and Executive Vice President (2001-2004). Formerly, President of Legg Mason family of funds (2001-2008). Formerly, Division President and Senior Officer of Prudential Financial Group, Inc. and related companies (investment management firm) (1991-2000).
Other Directorships. None. |
Cynthia E. Frost
1961 | Trustee | Since 2014 | Private investor. Formerly, Chief Investment Officer of Brown University (university endowment) (2000-2012). Formerly, Portfolio Strategist for Duke Management Company (university endowment manager) (1995-2000). Formerly, Managing Director, Cambridge Associates (investment consulting company) (1989-1995). Formerly, Consultant, Bain and Company (management consulting firm) (1987-1989). Formerly, Senior Equity Analyst, BA Investment Management Company (1983-1985).
Other Directorships. None. |
George J. Gorman
1952 | Chairperson of the
Board and Trustee | Since 2021
(Chairperson) and 2014 (Trustee) | Principal at George J. Gorman LLC (consulting firm). Formerly, Senior Partner at Ernst & Young LLP (a registered public accounting firm) (1974-2009).
Other Directorships. None. |
Eaton Vance
Global Sovereign Opportunities Fund
October 31, 2023
Management and Organization — continued
| Name and Year of Birth | Trust/Portfolio
Position(s) | Length of Service | Principal Occupation(s) and Other Directorships
During Past Five Years and Other Relevant Experience |
| Noninterested Trustees (continued) |
Valerie A. Mosley
1960 | Trustee | Since 2014 | Chairwoman and Chief Executive Officer of Valmo Ventures (a consulting and investment firm). Founder of Upward Wealth, Inc., dba BrightUp, a fintech platform. Formerly, Partner and Senior Vice President, Portfolio Manager and Investment Strategist at Wellington Management Company, LLP (investment management firm) (1992-2012). Formerly, Chief Investment Officer, PG Corbin Asset Management (1990-1992). Formerly worked in institutional corporate bond sales at Kidder Peabody (1986-1990).
Other Directorships. Director of DraftKings, Inc. (digital sports entertainment and gaming company) (since September 2020). Director of Envestnet, Inc. (provider of intelligent systems for wealth management and financial wellness) (since 2018). Formerly, Director of Dynex Capital, Inc. (mortgage REIT) (2013-2020) and Director of Groupon, Inc. (e-commerce provider) (2020-2022). |
Keith Quinton
1958 | Trustee | Since 2018 | Private investor, researcher and lecturer. Formerly, Independent Investment Committee Member at New Hampshire Retirement System (2017-2021). Formerly, Portfolio Manager and Senior Quantitative Analyst at Fidelity Investments (investment management firm) (2001-2014).
Other Directorships. Formerly, Director (2016-2021) and Chairman (2019-2021) of New Hampshire Municipal Bond Bank. |
Marcus L. Smith
1966 | Trustee | Since 2018 | Private investor and independent corporate director. Formerly, Chief Investment Officer, Canada (2012-2017), Chief Investment Officer, Asia (2010-2012), Director of Asian Research (2004-2010) and portfolio manager (2001-2017) at MFS Investment Management (investment management firm).
Other Directorships. Director of First Industrial Realty Trust, Inc. (an industrial REIT) (since 2021). Director of MSCI Inc. (global provider of investment decision support tools) (since 2017). Formerly, Director of DCT Industrial Trust Inc. (logistics real estate company) (2017-2018). |
Susan J. Sutherland
1957 | Trustee | Since 2015 | Private investor. Director of Ascot Group Limited and certain of its subsidiaries (insurance and reinsurance) (since 2017). Formerly, Director of Hagerty Holding Corp. (insurance) (2015-2018) and Montpelier Re Holdings Ltd. (insurance and reinsurance) (2013-2015). Formerly, Associate, Counsel and Partner at Skadden, Arps, Slate, Meagher & Flom LLP (law firm) (1982-2013).
Other Directorships. Formerly, Director of Kairos Acquisition Corp. (insurance/InsurTech acquisition company) (2021-2023). |
Scott E. Wennerholm
1959 | Trustee | Since 2016 | Private investor. Formerly, Trustee at Wheelock College (postsecondary institution) (2012-2018). Formerly, Consultant at GF Parish Group (executive recruiting firm) (2016-2017). Formerly, Chief Operating Officer and Executive Vice President at BNY Mellon Asset Management (investment management firm) (2005-2011). Formerly, Chief Operating Officer and Chief Financial Officer at Natixis Global Asset Management (investment management firm) (1997-2004). Formerly, Vice President at Fidelity Investments Institutional Services (investment management firm) (1994-1997).
Other Directorships. None. |
Nancy A. Wiser
1967 | Trustee | Since 2022 | Formerly, Executive Vice President and the Global Head of Operations at Wells Fargo Asset Management (2011-2021).
Other Directorships. None. |
| Name and Year of Birth | Trust/Portfolio
Position(s) | Length of Service | Principal Occupation(s)
During Past Five Years |
| Principal Officers who are not Trustees |
Kenneth A. Topping
1966 | President | Since 2023 | Vice President and Chief Administrative Officer of EVM and BMR and Chief Operating Officer for Public Markets at MSIM. Also Vice President of Calvert Research and Management (“CRM”) since 2021. Formerly, Chief Operating Officer for Goldman Sachs Asset Management ‘Classic’ (2009-2020). |
Deidre E. Walsh
1971 | Vice President and Chief
Legal Officer | Since 2009 | Vice President of EVM and BMR. Also Vice President of CRM. |
James F. Kirchner
1967 | Treasurer | Since 2007 | Vice President of EVM and BMR. Also Vice President of CRM. |
Eaton Vance
Global Sovereign Opportunities Fund
October 31, 2023
Management and Organization — continued
| Name and Year of Birth | Trust/Portfolio
Position(s) | Length of Service | Principal Occupation(s)
During Past Five Years |
| Principal Officers who are not Trustees (continued) |
Nicholas S. Di Lorenzo
1987 | Secretary | Since 2022 | Formerly, associate (2012-2021) and counsel (2022) at Dechert LLP. |
Richard F. Froio
1968 | Chief Compliance
Officer | Since 2017 | Vice President of EVM and BMR since 2017. Formerly, Deputy Chief Compliance Officer (Adviser/Funds) and Chief Compliance Officer (Distribution) at PIMCO (2012-2017) and Managing Director at BlackRock/Barclays Global Investors (2009-2012). |
(1) Ms. Pachnanda began serving as Trustee effective April 1, 2023.
The SAI for the Fund includes additional information about the Trustees and officers of the Fund and the Portfolio and can be obtained without charge on Eaton Vance’s website at www.eatonvance.com or by calling 1-800-262-1122.
| FACTS | WHAT DOES EATON VANCE DO WITH YOUR
PERSONAL INFORMATION? |
| Why? | Financial companies choose how they share your personal information. Federal law gives consumers the right to limit some but not all sharing. Federal law also requires us to tell you how we collect, share, and protect your personal information. Please read this notice carefully to understand what we do. |
| |
| What? | The types of personal information we collect and share depend on the product or service you have with us. This information can include:■ Social Security number and income
■ investment experience and risk tolerance
■ checking account number and wire transfer instructions |
| |
| How? | All financial companies need to share customers’ personal information to run their everyday business. In the section below, we list the reasons financial companies can share their customers’ personal information; the reasons Eaton Vance chooses to share; and whether you can limit this sharing. |
Reasons we can share your
personal information | Does Eaton Vance
share? | Can you limit
this sharing? |
| For our everyday business purposes — such as to process your transactions, maintain your account(s), respond to court orders and legal investigations, or report to credit bureaus | Yes | No |
| For our marketing purposes — to offer our products and services to you | Yes | No |
| For joint marketing with other financial companies | No | We don’t share |
| For our investment management affiliates’ everyday business purposes — information about your transactions, experiences, and creditworthiness | Yes | Yes |
| For our affiliates’ everyday business purposes — information about your transactions and experiences | Yes | No |
| For our affiliates’ everyday business purposes — information about your creditworthiness | No | We don’t share |
| For our investment management affiliates to market to you | Yes | Yes |
| For our affiliates to market to you | No | We don’t share |
| For nonaffiliates to market to you | No | We don’t share |
To limit our
sharing | Call toll-free 1-800-262-1122 or email: EVPrivacy@eatonvance.comPlease note:If you are a new customer, we can begin sharing your information 30 days from the date we sent this notice. When you are no longer our customer, we continue to share your information as described in this notice. However, you can contact us at any time to limit our sharing. |
| Questions? | Call toll-free 1-800-262-1122 or email: EVPrivacy@eatonvance.com |
| Privacy Notice — continued | April 2021 |
| Who we are |
| Who is providing this notice? | Eaton Vance Management, Eaton Vance Distributors, Inc., Eaton Vance Trust Company, Eaton Vance Management (International) Limited, Eaton Vance Advisers International Ltd., Eaton Vance Global Advisors Limited, Eaton Vance Management’s Real Estate Investment Group, Boston Management and Research, Calvert Research and Management, Eaton Vance and Calvert Fund Families and our investment advisory affiliates (“Eaton Vance”) (see Investment Management Affiliates definition below) |
| What we do |
How does Eaton Vance
protect my personal
information? | To protect your personal information from unauthorized access and use, we use security measures that comply with federal law. These measures include computer safeguards and secured files and buildings. We have policies governing the proper handling of customer information by personnel and requiring third parties that provide support to adhere to appropriate security standards with respect to such information. |
How does Eaton Vance
collect my personal
information? | We collect your personal information, for example, when you■ open an account or make deposits or withdrawals from your account
■ buy securities from us or make a wire transfer
■ give us your contact informationWe also collect your personal information from others, such as credit bureaus, affiliates, or other companies. |
| Why can’t I limit all sharing? | Federal law gives you the right to limit only■ sharing for affiliates’ everyday business purposes — information about your creditworthiness
■ affiliates from using your information to market to you
■ sharing for nonaffiliates to market to youState laws and individual companies may give you additional rights to limit sharing. See below for more on your rights under state law. |
| Definitions |
Investment Management
Affiliates | Eaton Vance Investment Management Affiliates include registered investment advisers, registered broker- dealers, and registered and unregistered funds. Investment Management Affiliates does not include entities associated with Morgan Stanley Wealth Management, such as Morgan Stanley Smith Barney LLC and Morgan Stanley & Co. |
| Affiliates | Companies related by common ownership or control. They can be financial and nonfinancial companies.■ Our affiliates include companies with a Morgan Stanley name and financial companies such as Morgan Stanley Smith Barney LLC and Morgan Stanley & Co. |
| Nonaffiliates | Companies not related by common ownership or control. They can be financial and nonfinancial companies.■ Eaton Vance does not share with nonaffiliates so they can market to you. |
| Joint marketing | A formal agreement between nonaffiliated financial companies that together market financial products or services to you.■ Eaton Vance doesn’t jointly market. |
| Other important information |
| Vermont: Except as permitted by law, we will not share personal information we collect about Vermont residents with Nonaffiliates unless you provide us with your written consent to share such information.California: Except as permitted by law, we will not share personal information we collect about California residents with Nonaffiliates and we will limit sharing such personal information with our Affiliates to comply with California privacy laws that apply to us. |
Delivery of Shareholder Documents. The Securities and Exchange Commission (SEC) permits funds to deliver only one copy of shareholder documents, including prospectuses, proxy statements and shareholder reports, to fund investors with multiple accounts at the same residential or post office box address. This practice is often called “householding” and it helps eliminate duplicate mailings to shareholders. Eaton Vance, or your financial intermediary, may household the mailing of your documents indefinitely unless you instruct Eaton Vance, or your financial intermediary, otherwise. If you would prefer that your Eaton Vance documents not be householded, please contact Eaton Vance at 1-800-262-1122, or contact your financial intermediary. Your instructions that householding not apply to delivery of your Eaton Vance documents will typically be effective within 30 days of receipt by Eaton Vance or your financial intermediary.
Portfolio Holdings. Each Eaton Vance Fund and its underlying Portfolio(s) (if applicable) files a schedule of portfolio holdings on Part F to Form N-PORT with the SEC. Certain information filed on Form N-PORT may be viewed on the Eaton Vance website at www.eatonvance.com, by calling Eaton Vance at 1-800-262-1122 or in the EDGAR database on the SEC’s website at www.sec.gov.
Proxy Voting. From time to time, funds are required to vote proxies related to the securities held by the funds. The Eaton Vance Funds or their underlying Portfolios (if applicable) vote proxies according to a set of policies and procedures approved by the Funds’ and Portfolios’ Boards. You may obtain a description of these policies and procedures and information on how the Funds or Portfolios voted proxies relating to portfolio securities during the most recent 12-month period ended June 30, without charge, upon request, by calling 1-800-262-1122 and by accessing the SEC’s website at www.sec.gov.
Tailored Shareholder Reports. Effective January 24, 2023, the SEC adopted rule and form amendments to require open-end mutual funds and ETFs to transmit concise and visually engaging streamlined annual and semiannual reports to shareholders that highlight key information. Other information, including financial statements, will no longer appear in a streamlined shareholder report but must be available online, delivered free of charge upon request, and filed on a semiannual basis on Form N-CSR. The rule and form amendments have a compliance date of July 24, 2024. At this time, management is evaluating the impact of these amendments on the shareholder reports for the Eaton Vance Funds.
This Page Intentionally Left Blank
This Page Intentionally Left Blank
Investment Adviser of International Income Portfolio
Boston Management and Research
Two International Place
Boston, MA 02110
Investment Adviser and Administrator of Eaton Vance
Global Sovereign Opportunities Fund
Eaton Vance Management
Two International Place
Boston, MA 02110
Principal Underwriter*
Eaton Vance Distributors, Inc.
Two International Place
Boston, MA 02110
(617) 482-8260
Custodian
State Street Bank and Trust Company
One Congress Street, Suite 1
Boston, MA 02114-2016
Transfer Agent
BNY Mellon Investment Servicing (US) Inc.
Attn: Eaton Vance Funds
P.O. Box 534439
Pittsburgh, PA 15253-4439
(800) 262-1122
Independent Registered Public Accounting Firm
Deloitte & Touche LLP
200 Berkeley Street
Boston, MA 02116-5022
Fund Offices
Two International Place
Boston, MA 02110
* FINRA BrokerCheck. Investors may check the background of their Investment Professional by contacting the Financial Industry Regulatory Authority (FINRA). FINRA BrokerCheck is a free tool to help investors check the professional background of current and former FINRA-registered securities firms and brokers. FINRA BrokerCheck is available by calling 1-800-289-9999 and at www.FINRA.org. The FINRA BrokerCheck brochure describing this program is available to investors at www.FINRA.org.
Eaton Vance
Short Duration Government Income Fund
Annual Report
October 31, 2023
Commodity Futures Trading Commission Registration. The Commodity Futures Trading Commission (“CFTC”) has adopted regulations that subject registered investment companies and advisers to regulation by the CFTC if a fund invests more than a prescribed level of its assets in certain CFTC-regulated instruments (including futures, certain options and swap agreements) or markets itself as providing investment exposure to such instruments. The investment adviser has claimed an exclusion from the definition of “commodity pool operator” under the Commodity Exchange Act with respect to its management of the Fund. Accordingly, neither the Fund nor the adviser with respect to the operation of the Fund is subject to CFTC regulation. Because of its management of other strategies, the Fund's adviser is registered with the CFTC as a commodity pool operator. The adviser is also registered as a commodity trading advisor.
Fund shares are not insured by the FDIC and are not deposits or other obligations of, or guaranteed by, any depository institution. Shares are subject to investment risks, including possible loss of principal invested.
This report must be preceded or accompanied by a current summary prospectus or prospectus. Before investing, investors should consider carefully the investment objective, risks, and charges and expenses of a mutual fund. This and other important information is contained in the summary prospectus and prospectus, which can be obtained from a financial intermediary. Prospective investors should read the prospectus carefully before investing. For further information, please call 1-800-262-1122.
Annual Report October 31, 2023
Eaton Vance
Short Duration Government Income Fund
Eaton Vance
Short Duration Government Income Fund
October 31, 2023
Management’s Discussion of Fund Performance†
Economic and Market Conditions
For fixed-income investors, the dominant event during the 12-month period ended October 31, 2023, was the series of U.S. Federal Reserve (Fed) interest rate hikes -- six during the period, and 11 in total -- that brought the federal funds rate to its highest level in 22 years.
But while the Fed’s campaign to tamp down inflation led to negative performance for government bonds, corporate bond returns were positive during the period -- buoyed by the very factors that were fueling inflation: record low unemployment, strong job creation, and robust consumer spending.
By the summer of 2023, many economists and market observers came around to the view that Jerome Powell’s Fed might be able to accomplish what had seldom, if ever, been done before: raise rates significantly to lower inflation and still bring the U.S. economy in for a soft landing without a recession.
One persistent cloud over fixed-income markets during the period, however, was fear that even after it finished raising rates, the Fed would leave rates higher for longer than investors had previously anticipated. During the final three months of the period -- and especially after the Fed’s September 2023 meeting -- longer-term interest rates rose dramatically, as investor expectations of how high rates would go -- and how long they would stay there -- seemed to get higher and longer. As a result, shorter-duration bonds generally outperformed longer-duration bonds for the period as a whole.
Against the backdrop of aggressive monetary tightening, U.S. Treasurys were one of the worst-performing major fixed-income asset classes during the 12-month period, with the Bloomberg U.S. Treasury Index returning -0.63%.
In contrast, the strong U.S. economy and increasing confidence in a soft-landing scenario served as tailwinds for investment-grade corporate bonds. Even in a rising-rate environment, the Bloomberg U.S. Corporate Bond Index returned 2.77% during the period.
High yield bonds were the standout performer among major fixed-income asset classes, with the Bloomberg U.S. Corporate High Yield Index returning 6.23% during the period. With a strong U.S. economy helping keep bond defaults low, and a recession looking increasingly remote, investors gravitated toward riskier investments with greater yields.
Asset-backed securities -- including bonds backed by automobile and consumer loans -- benefited from strong consumer balance sheets and spending during the period, with the Bloomberg U.S. Asset-Backed Securities Index returning 3.51%.
Mortgage-backed securities (MBS), however, were dogged by two technical factors that depressed prices, causing the Bloomberg U.S. Mortgage-Backed Securities Index to return -0.82% during the period. As part of its quantitative tightening program, the Fed gradually reduced its MBS holdings by allowing up to $35 billion to roll off its balance sheet each month. And several regional banks that had been significant buyers of MBS were forced by the regional banking crisis of March 2023 to liquidate their assets. The resulting release of a significant amount of MBS into the market led MBS prices to fall and the asset class to deliver negative returns during the period.
Fund Performance
For the 12-month period ended October 31, 2023, Eaton Vance Short Duration Government Income Fund (the Fund) returned -0.92% for Class A shares at net asset value (NAV), underperforming its benchmark, the ICE BofA 0-1 Year U.S. Treasury Index (the Index), which returned 4.68%.
The main detractor from Fund performance relative to the Index during the period was its exposure to lower coupon collateralized mortgage obligations, which were negatively impacted by the sharp rise in interest rates during the period, as well as wider spreads in the agency mortgage-backed securities (agency MBS) market. The Fund’s allocation to fixed-rate agency MBS pools also weighed on returns versus the Index due to higher U.S. Treasury yields and wider spreads.
In contrast, strong performance by the Fund’s interest-only securities helped offset some market headwinds as interest-only MBS prices reacted positively to rising rates.
The Fund used derivatives during the period to reduce the impact of interest rate fluctuations on its bond holdings. Its exposure to interest rate swaps, in particular, had a positive impact on Index-relative performance during the period, as they benefited from the continued rise in U.S. Treasury yields.
See Endnotes and Additional Disclosures in this report.
Past performance is no guarantee of future results. Returns are historical and are calculated by determining the percentage change in net asset value (NAV) or offering price (as applicable) with all distributions reinvested. Furthermore, returns do not reflect the deduction of taxes that shareholders may have to pay on Fund distributions or upon the redemption of Fund shares. Investment return and principal value will fluctuate so that shares, when redeemed, may be worth more or less than their original cost. Performance for periods less than or equal to one year is cumulative. Performance is for the stated time period only; due to market volatility, current Fund performance may be lower or higher than the quoted return. For performance as of the most recent month-end, please refer to eatonvance.com.
Eaton Vance
Short Duration Government Income Fund
October 31, 2023
Performance
Portfolio Manager(s) Andrew Szczurowski, CFA and Alexander Payne, CFA
| % Average Annual Total Returns1,2 | Class
Inception Date | Performance
Inception Date | One Year | Five Years | Ten Years |
| Advisers Class at NAV | 05/17/2021 | 09/30/2002 | (0.92)% | 0.08% | 0.87% |
| Class A at NAV | 09/30/2002 | 09/30/2002 | (0.92) | 0.08 | 0.87 |
| Class A with 2.25% Maximum Sales Charge | — | — | (3.21) | (0.37) | 0.64 |
| Class C at NAV | 09/30/2002 | 09/30/2002 | (1.51) | (0.51) | 0.39 |
| Class C with 1% Maximum Deferred Sales Charge | — | — | (2.45) | (0.51) | 0.39 |
| Class I at NAV | 05/04/2009 | 09/30/2002 | (0.81) | 0.33 | 1.12 |
|
| ICE BofA 0-1 Year U.S. Treasury Index | — | — | 4.68% | 1.75% | 1.19% |
| % Total Annual Operating Expense Ratios3 | Advisers Class | Class A | Class C | Class I |
| | 0.79% | 0.79% | 1.39% | 0.54% |
Growth of $10,000
This graph shows the change in value of a hypothetical investment of $10,000 in Class A of the Fund for the period indicated. For comparison, the same investment is shown in the indicated index.
| Growth of Investment2 | Amount Invested | Period Beginning | At NAV | With Maximum Sales Charge |
| Advisers Class | $10,000 | 10/31/2013 | $10,903 | N.A. |
| Class C | $10,000 | 10/31/2013 | $10,392 | N.A. |
| Class I, at minimum investment | $1,000,000 | 10/31/2013 | $1,117,545 | N.A. |
See Endnotes and Additional Disclosures in this report.
Past performance is no guarantee of future results. Returns are historical and are calculated by determining the percentage change in net asset value (NAV) or offering price (as applicable) with all distributions reinvested. Furthermore, returns do not reflect the deduction of taxes that shareholders may have to pay on Fund distributions or upon the redemption of Fund shares. Investment return and principal value will fluctuate so that shares, when redeemed, may be worth more or less than their original cost. Performance for periods less than or equal to one year is cumulative. Performance is for the stated time period only; due to market volatility, current Fund performance may be lower or higher than the quoted return. For performance as of the most recent month-end, please refer to eatonvance.com.
Eaton Vance
Short Duration Government Income Fund
October 31, 2023
| Asset Allocation (% of total investments)1 |
Footnotes:
| 1 | Other represents any investment type less than 1% of total investments. |
Eaton Vance
Short Duration Government Income Fund
October 31, 2023
Endnotes and Additional Disclosures
| † | The views expressed in this report are those of the portfolio manager(s) and are current only through the date stated at the top of this page. These views are subject to change at any time based upon market or other conditions, and Eaton Vance and the Fund(s) disclaim any responsibility to update such views. These views may not be relied upon as investment advice and, because investment decisions are based on many factors, may not be relied upon as an indication of trading intent on behalf of any Eaton Vance fund. This commentary may contain statements that are not historical facts, referred to as “forward-looking statements.” The Fund’s actual future results may differ significantly from those stated in any forward-looking statement, depending on factors such as changes in securities or financial markets or general economic conditions, the volume of sales and purchases of Fund shares, the continuation of investment advisory, administrative and service contracts, and other risks discussed from time to time in the Fund’s filings with the Securities and Exchange Commission. |
| | |
| 1 | ICE BofA 0-1 Year U.S. Treasury Index is an unmanaged index of short-term U.S. Treasury securities having a maturity of less than one year. ICE® BofA® indices are not for redistribution or other uses; provided “as is”, without warranties, and with no liability. Eaton Vance has prepared this report and ICE Data Indices, LLC does not endorse it, or guarantee, review, or endorse Eaton Vance’s products. BofA® is a licensed registered trademark of Bank of America Corporation in the United States and other countries. Unless otherwise stated, index returns do not reflect the effect of any applicable sales charges, commissions, expenses, taxes or leverage, as applicable. It is not possible to invest directly in an index. |
| 2 | Total Returns at NAV do not include applicable sales charges. If sales charges were deducted, the returns would be lower. Total Returns shown with maximum sales charge reflect the stated maximum sales charge. Unless otherwise stated, performance does not reflect the deduction of taxes on Fund distributions or redemptions of Fund shares.Performance prior to the inception date of a class may be linked to the performance of an older class of the Fund. This linked performance is adjusted for any applicable sales charge, but is not adjusted for class expense differences. If adjusted for such differences, the performance would be different. The performance of Advisers Class is linked to Class A. Performance presented in the Financial Highlights included in the financial statements is not linked.Effective November 5, 2020, Class C shares automatically convert to Class A shares eight years after purchase. The average annual total returns listed for Class C reflect conversion to Class A shares after eight years. Prior to November 5, 2020, Class C shares automatically converted to Class A shares ten years after purchase. |
| 3 | Source: Fund prospectus. The expense ratios for the current reporting period can be found in the Financial Highlights section of this report. Performance reflects expenses waived and/or reimbursed, if applicable. Without such waivers and/or reimbursements, performance would have been lower. |
| | Fund profile subject to change due to active management. |
| | Additional Information |
| | Bloomberg U.S. Treasury Index measures the performance of U.S. Treasuries with a maturity of one year or more. Bloomberg U.S. Corporate Bond Index measures the performance of investment-grade U.S. corporate securities with a maturity of one year or more. Bloomberg U.S. Corporate High Yield Index measures USD-denominated, non-investment grade corporate securities. Bloomberg U.S. Asset-Backed Securities Index tracks the performance of U.S. dollar denominated investment grade, fixed rate asset-backed securities publicly issued in the U.S. domestic market. Bloomberg U.S. Mortgage-Backed Securities Index measures agency mortgage-backed pass-through securities issued by Ginnie Mae (GNMA), Fannie Mae (FNMA), and Freddie Mac (FHLMC). |
| | Duration is a measure of the expected change in price of a bond — in percentage terms — given a one percent change in interest rates, all else being constant. Securities with lower durations tend to be less sensitive to interest rate changes. |
| | Spread is the difference in yield between a U.S. Treasury bond and another debt security of the same maturity but different credit quality. |
| | Important Notice to Shareholders |
| | Effective December 31, 2023, the Fund's benchmark will change to the ICE BofA 1-3 Year Treasury Index (the “New Benchmark”). The Fund's investment adviser believes the New Benchmark is a better reflection of the Fund's long-term expected positioning and will be a more appropriate benchmark for the Fund going forward. |
Eaton Vance
Short Duration Government Income Fund
October 31, 2023
Example
As a Fund shareholder, you incur two types of costs: (1) transaction costs, including sales charges (loads) on purchases; and (2) ongoing costs, including management fees; distribution and/or service fees; and other Fund expenses. This Example is intended to help you understand your ongoing costs (in dollars) of Fund investing and to compare these costs with the ongoing costs of investing in other mutual funds. The Example is based on an investment of $1,000 invested at the beginning of the period and held for the entire period (May 1, 2023 to October 31, 2023).
Actual Expenses
The first section of the table below provides information about actual account values and actual expenses. You may use the information in this section, together with the amount you invested, to estimate the expenses that you paid over the period. Simply divide your account value by $1,000 (for example, an $8,600 account value divided by $1,000 = 8.6), then multiply the result by the number in the first section under the heading entitled “Expenses Paid During Period” to estimate the expenses you paid on your account during this period.
Hypothetical Example for Comparison Purposes
The second section of the table below provides information about hypothetical account values and hypothetical expenses based on the actual Fund expense ratio and an assumed rate of return of 5% per year (before expenses), which is not the actual Fund return. The hypothetical account values and expenses may not be used to estimate the actual ending account balance or expenses you paid for the period. You may use this information to compare the ongoing costs of investing in your Fund and other funds. To do so, compare this 5% hypothetical example with the 5% hypothetical examples that appear in the shareholder reports of the other funds.
Please note that the expenses shown in the table are meant to highlight your ongoing costs only and do not reflect any transactional costs, such as sales charges (loads). Therefore, the second section of the table is useful in comparing ongoing costs only, and will not help you determine the relative total costs of owning different funds. In addition, if these transactional costs were included, your costs would be higher.
| | Beginning
Account Value
(5/1/23) | Ending
Account Value
(10/31/23) | Expenses Paid
During Period*
(5/1/23 – 10/31/23) | Annualized
Expense
Ratio |
| Actual | | | | |
| Advisers Class | $1,000.00 | $ 988.40 | $5.31 | 1.06% |
| Class A | $1,000.00 | $ 987.10 | $5.26 | 1.05% |
| Class C | $1,000.00 | $ 984.20 | $8.20 | 1.64% |
| Class I | $1,000.00 | $ 988.30 | $4.01 | 0.80% |
| |
| Hypothetical | | | | |
| (5% return per year before expenses) | | | | |
| Advisers Class | $1,000.00 | $1,019.86 | $5.40 | 1.06% |
| Class A | $1,000.00 | $1,019.91 | $5.35 | 1.05% |
| Class C | $1,000.00 | $1,016.94 | $8.34 | 1.64% |
| Class I | $1,000.00 | $1,021.17 | $4.08 | 0.80% |
| * | Expenses are equal to the Fund's annualized expense ratio for the indicated Class, multiplied by the average account value over the period, multiplied by 184/365 (to reflect the one-half year period). The Example assumes that the $1,000 was invested at the net asset value per share determined at the close of business on April 30, 2023. |
Eaton Vance
Short Duration Government Income Fund
October 31, 2023
| Collateralized Mortgage Obligations — 45.2% |
| Security | Principal
Amount
(000's omitted) | Value |
| Federal Home Loan Mortgage Corp.: | | | |
| Series 2135, Class JZ, 6.00%, 3/15/29 | $ | 222 | $ 222,295 |
| Series 3866, Class DF, 6.00%, (30-day average SOFR + 1.564%), 5/15/41(1) | | 1,044 | 971,617 |
| Series 4102, Class DF, 5.50%, (30-day average SOFR + 1.264%), 9/15/42(1) | | 271 | 241,417 |
| Series 4159, Class FP, 5.00%, (30-day average SOFR + 1.014%), 11/15/42(1) | | 611 | 542,516 |
| Series 4180, Class KF, 5.00%, (30-day average SOFR + 1.114%), 1/15/43(1) | | 3,145 | 2,742,511 |
| Series 4204, Class AF, 5.00%, (30-day average SOFR + 1.114%), 5/15/43(1) | | 540 | 460,211 |
| Series 4212, Class NS, 0.00%, (5.263% - 30-day average SOFR x 1.20, Floor 0.00%), 6/15/43(2) | | 1,693 | 1,291,675 |
| Series 4223, Class NF, 6.00%, (30-day average SOFR + 1.064%), 7/15/43(1) | | 1,931 | 1,743,662 |
| Series 4249, Class CF, 6.231%, (30-day average SOFR + 0.914%), 9/15/43(1) | | 7,082 | 6,732,380 |
| Series 4299, Class JG, 2.50%, 7/15/43 | | 608 | 538,851 |
| Series 4389, Class CA, 3.00%, 9/15/44 | | 1,297 | 1,105,395 |
| Series 4619, Class KF, 5.00%, (30-day average SOFR + 0.864%), 6/15/39(1) | | 710 | 644,877 |
| Series 4678, Class PC, 3.00%, 1/15/46 | | 1,328 | 1,196,507 |
| Series 4876, Class FA, 6.135%, (30-day average SOFR + 0.814%), 5/15/49(1) | | 6,420 | 6,220,763 |
| Series 4995, Class ZN, 2.50%, 7/25/50 | | 1,042 | 482,334 |
| Series 5009, Class ZN, 3.50%, 7/25/50 | | 5,161 | 3,600,298 |
| Series 5028, Class AZ, 2.00%, 10/25/50 | | 1,010 | 346,975 |
| Series 5028, Class TZ, 2.00%, 10/25/50 | | 2,713 | 1,232,038 |
| Series 5028, Class ZA, 2.00%, 10/25/50 | | 1,161 | 530,404 |
| Series 5031, Class Z, 2.50%, 10/25/50 | | 8 | 4,023 |
| Series 5035, Class AZ, 2.00%, 11/25/50 | | 1,475 | 595,975 |
| Series 5035, Class ZK, 2.50%, 11/25/50 | | 17,294 | 8,789,878 |
| Series 5035, Class ZT, 2.00%, 10/25/50 | | 1,650 | 646,234 |
| Series 5037, Class ZQ, 2.00%, 11/25/50 | | 779 | 300,833 |
| Series 5038, Class Z, 2.50%, 10/25/50 | | 4 | 1,430 |
| Series 5038, Class ZN, 2.00%, 11/25/50 | | 1,820 | 630,153 |
| Series 5039, Class PZ, 2.00%, 11/25/50 | | 1,177 | 429,899 |
| Series 5039, Class ZJ, 2.00%, 11/25/50 | | 357 | 123,832 |
| Series 5040, Class TZ, 2.50%, 11/25/50 | | 4,345 | 1,944,663 |
| Series 5048, Class CZ, 2.00%, 12/25/50 | | 1,898 | 694,713 |
| Series 5058, Class Z, 2.00%, 1/25/51 | | 714 | 258,760 |
| Series 5058, Class ZA, 2.00%, 1/25/51 | | 1,036 | 390,039 |
| Series 5058, Class ZH, 3.00%, 5/25/50 | | 2,941 | 1,486,408 |
| Series 5068, Class UZ, 2.50%, 1/25/51 | | 9,578 | 4,915,822 |
| Series 5071, Class CS, 0.00%, (3.30% - 30-day average SOFR, Floor 0.00%), 2/25/51(2) | | 6,990 | 3,161,335 |
| Series 5071, Class SP, 0.00%, (3.30% - 30-day average SOFR, Floor 0.00%), 2/25/51(2) | | 9,615 | 3,294,021 |
| Security | Principal
Amount
(000's omitted) | Value |
| Federal Home Loan Mortgage Corp.: (continued) | | | |
| Series 5072, Class ZU, 2.50%, 2/25/51 | $ | 3,051 | $ 1,387,500 |
| Series 5083, Class SK, 0.00%, (3.867% - 30-day average SOFR x 1.333, Floor 0.00%), 3/25/51(2) | | 8,471 | 4,240,348 |
| Series 5083, Class ZW, 2.50%, 3/25/51 | | 5,115 | 2,297,756 |
| Series 5090, Class PZ, 2.50%, 3/25/51 | | 534 | 226,481 |
| Series 5093, Class Z, 3.00%, 1/25/51 | | 1 | 461 |
| Series 5093, Class ZM, 3.00%, 3/25/51 | | 2 | 1,054 |
| Series 5101, Class EZ, 2.00%, 3/25/51 | | 2,043 | 917,608 |
| Series 5104, Class WZ, 3.00%, 4/25/51 | | 909 | 501,249 |
| Series 5114, Class ZH, 3.00%, 5/25/51 | | 443 | 245,302 |
| Series 5123, Class JZ, 2.00%, 7/25/51 | | 780 | 352,536 |
| Series 5129, Class CZ, 3.00%, 8/25/50 | | 15,212 | 8,280,510 |
| Series 5129, Class HZ, 1.25%, 4/25/50 | | 1,637 | 627,781 |
| Series 5129, Class TZ, 2.50%, 8/25/51 | | 3,227 | 1,346,729 |
| Series 5129, Class WZ, 3.00%, 8/25/50 | | 1 | 469 |
| Series 5129, Class ZE, 3.00%, 9/25/50 | | 207 | 95,933 |
| Series 5129, Class ZH, 3.00%, 7/25/50 | | 1 | 492 |
| Series 5129, Class ZW, 3.00%, 8/25/50 | | 1 | 329 |
| Series 5131, Class QZ, 3.00%, 7/25/51 | | 2,996 | 1,602,196 |
| Series 5132, Class LZ, 2.50%, 8/25/51 | | 8,497 | 4,021,157 |
| Series 5135, Class MZ, 2.50%, 8/25/51 | | 12,974 | 6,551,810 |
| Series 5136, Class ZJ, 2.50%, 8/25/51 | | 17,384 | 8,523,911 |
| Series 5139, Class DZ, 2.50%, 9/25/51 | | 10,454 | 5,127,747 |
| Series 5139, Class EZ, 2.50%, 9/25/51 | | 12,126 | 5,777,281 |
| Series 5140, Class WZ, 2.50%, 9/25/51 | | 6,841 | 3,523,453 |
| Series 5141, Class ZJ, 2.50%, 9/25/51 | | 12,615 | 6,189,741 |
| Series 5141, Class ZP, 3.00%, 4/25/50 | | 12,486 | 7,488,263 |
| Series 5144, Class Z, 2.50%, 9/25/51 | | 36,071 | 18,580,477 |
| Series 5148, Class AZ, 2.50%, 10/25/51 | | 39,518 | 20,467,344 |
| Series 5150, Class QZ, 2.50%, 10/25/51 | | 4,813 | 2,466,056 |
| Series 5150, Class ZJ, 2.50%, 10/25/51 | | 13,823 | 7,100,366 |
| Series 5150, Class ZN, 2.50%, 10/25/51 | | 1,216 | 556,828 |
| Series 5159, Class KZ, 3.00%, 11/25/51 | | 6,683 | 3,866,455 |
| Series 5159, Class MZ, 3.00%, 11/25/51 | | 1,013 | 533,537 |
| Series 5159, Class ZP, 3.00%, 11/25/51 | | 4,570 | 2,448,741 |
| Series 5159, Class ZT, 3.00%, 11/25/51 | | 8,160 | 4,653,019 |
| Series 5160, Class ZW, 3.00%, 8/25/50 | | 2,705 | 1,693,024 |
| Series 5163, Class Z, 3.00%, 11/25/51 | | 5,737 | 2,903,108 |
| Series 5166, Class ZN, 3.00%, 9/25/50 | | 10,300 | 5,385,266 |
| Series 5168, Class MZ, 3.00%, 10/25/51 | | 6,546 | 3,654,656 |
| Series 5169, Class JZ, 3.00%, 1/25/49 | | 383 | 211,739 |
| Series 5300, Class EY, 6.00%, 12/25/52 | | 5,000 | 4,779,322 |
| Series 5327, Class B, 6.00%, 8/25/53 | | 20,000 | 19,083,588 |
| Interest Only:(3) | | | |
| Series 354, Class C11, 3.50%, 7/15/46 | | 8,349 | 1,471,551 |
| Series 354, Class C15, 3.50%, 11/15/46 | | 7,710 | 1,636,987 |
7
See Notes to Financial Statements.
Eaton Vance
Short Duration Government Income Fund
October 31, 2023
Portfolio of Investments — continued
| Security | Principal
Amount
(000's omitted) | Value |
| Interest Only: (continued) | | | |
| Series 362, Class C7, 3.50%, 9/15/47 | $ | 13,483 | $ 2,478,874 |
| Series 362, Class C11, 4.00%, 12/15/47 | | 4,009 | 840,108 |
| Series 362, Class C12, 4.00%, 12/15/47 | | 8,144 | 1,676,515 |
| Series 380, Class C1, 3.00%, 1/25/50 | | 30,626 | 5,345,097 |
| Series 380, Class C5, 3.50%, 1/25/50 | | 9,538 | 1,807,382 |
| Series 3030, Class SL, 0.665%, (5.986% - 30-day average SOFR), 9/15/35(2) | | 852 | 43,939 |
| Series 3114, Class TS, 1.215%, (6.536% - 30-day average SOFR), 9/15/30(2) | | 1,381 | 42,437 |
| Series 3339, Class JI, 1.155%, (6.476% - 30-day average SOFR), 7/15/37(2) | | 792 | 60,193 |
| Series 4088, Class EI, 3.50%, 9/15/41 | | 5 | 4 |
| Series 4094, Class CS, 0.565%, (5.886% - 30-day average SOFR), 8/15/42(2) | | 610 | 46,345 |
| Series 4109, Class SA, 0.765%, (6.086% - 30-day average SOFR), 9/15/32(2) | | 943 | 42,482 |
| Series 4497, Class CS, 0.765%, (6.086% - 30-day average SOFR), 9/15/44(2) | | 171 | 2,348 |
| Series 4507, Class EI, 4.00%, 8/15/44 | | 2,498 | 329,068 |
| Series 4507, Class MI, 3.50%, 8/15/44 | | 262 | 12,278 |
| Series 4549, Class DS, 0.465%, (5.786% - 30-day average SOFR), 8/15/45(2) | | �� 784 | 37,266 |
| Series 4601, Class IN, 3.50%, 7/15/46 | | 13,192 | 2,373,301 |
| Series 4625, Class BI, 3.50%, 6/15/46 | | 2,600 | 445,035 |
| Series 4637, Class IP, 3.50%, 4/15/44 | | 127 | 4,765 |
| Series 4749, Class IL, 4.00%, 12/15/47 | | 916 | 183,209 |
| Series 4768, Class IO, 4.00%, 3/15/48 | | 1,052 | 210,944 |
| Series 4768, Class KI, 4.00%, 11/15/47 | | 1,849 | 368,354 |
| Series 4772, Class PI, 4.00%, 1/15/48 | | 1,143 | 229,182 |
| Series 4791, Class JI, 4.00%, 5/15/48 | | 1,664 | 349,288 |
| Series 4791, Class SA, 0.765%, (6.086% - 30-day average SOFR), 5/15/48(2) | | 4,586 | 400,657 |
| Series 4796, Class AS, 0.765%, (6.086% - 30-day average SOFR), 5/15/48(2) | | 2,904 | 247,703 |
| Series 4808, Class IB, 4.00%, 5/15/48 | | 4,448 | 930,974 |
| Series 4966, Class SY, 0.615%, (5.936% - 30-day average SOFR), 4/25/50(2) | | 4,297 | 400,129 |
| Series 5008, Class IE, 2.00%, 9/25/50 | | 34,208 | 4,010,986 |
| Series 5010, Class I, 2.00%, 9/25/50 | | 30,175 | 3,558,065 |
| Series 5010, Class IB, 2.00%, 9/25/50 | | 44,637 | 5,233,750 |
| Series 5010, Class IN, 2.00%, 9/25/50 | | 52,495 | 6,199,919 |
| Series 5010, Class NI, 2.00%, 9/25/50 | | 14,927 | 1,870,985 |
| Series 5016, Class UI, 2.00%, 9/25/50 | | 14,284 | 1,674,800 |
| Series 5017, Class DI, 2.00%, 9/25/50 | | 29,588 | 3,469,228 |
| Series 5019, Class CI, 2.00%, 10/25/50 | | 24,213 | 2,862,692 |
| Series 5020, Class CI, 2.00%, 9/25/50 | | 5,967 | 682,504 |
| Series 5024, Class CI, 2.00%, 10/25/50 | | 61,924 | 7,338,522 |
| Series 5025, Class GI, 2.00%, 10/25/50 | | 10,480 | 1,238,224 |
| Series 5028, Class TI, 2.00%, 10/25/50 | | 13,241 | 1,262,167 |
| Security | Principal
Amount
(000's omitted) | Value |
| Interest Only: (continued) | | | |
| Series 5038, Class DI, 2.00%, 11/25/50 | $ | 75,519 | $ 8,923,415 |
| Series 5051, Class S, 0.00%, (3.60% - 30-day average SOFR, Floor 0.00%), 12/25/50(2) | | 30,020 | 714,483 |
| Series 5070, Class CI, 2.00%, 2/25/51 | | 74,866 | 9,480,258 |
| Series 5156, Class IP, 3.00%, 12/25/49 | | 23,761 | 3,745,929 |
| Series 5191, Class IB, 2.50%, 2/25/51 | | 49,883 | 7,647,588 |
| Principal Only:(4) | | | |
| Series 213, Class PO, 0.00%, 6/1/31 | | 904 | 773,992 |
| Series 239, Class PO, 0.00%, 8/15/36 | | 483 | 355,976 |
| Series 246, Class PO, 0.00%, 5/15/37 | | 1,172 | 897,838 |
| Series 3072, Class WO, 0.00%, 11/15/35 | | 411 | 322,670 |
| Series 3342, Class KO, 0.00%, 7/15/37 | | 164 | 129,167 |
| Series 3476, Class PO, 0.00%, 7/15/38 | | 209 | 153,513 |
| Series 3862, Class PO, 0.00%, 5/15/41 | | 434 | 319,968 |
| Series 4239, Class OU, 0.00%, 7/15/43 | | 2,826 | 1,354,862 |
| Federal National Mortgage Association: | | | |
| Series G97-4, Class FA, 6.235%, (30-day average SOFR + 0.914%), 6/17/27(1) | | 49 | 48,943 |
| Series 2001-4, Class GA, 9.00%, 4/17/25(5) | | 0 (6) | 20 |
| Series 2009-48, Class WA, 5.794%, 7/25/39(5) | | 217 | 216,346 |
| Series 2009-62, Class WA, 5.582%, 8/25/39(5) | | 314 | 311,207 |
| Series 2010-112, Class DZ, 4.00%, 10/25/40 | | 321 | 289,832 |
| Series 2011-49, Class NT, 6.00%, (64.855% - 30-day average SOFR x 10.00, Cap 6.00%), 6/25/41(2) | | 127 | 115,523 |
| Series 2012-51, Class FD, 6.015%, (30-day average SOFR + 0.694%), 5/25/42(1) | | 15,975 | 15,467,673 |
| Series 2012-103, Class ZP, 3.00%, 9/25/42 | | 808 | 559,138 |
| Series 2012-115, Class MX, 0.00%, (3.329% - 30-day average SOFR x 1.154, Floor 0.00%), 10/25/42(2) | | 628 | 193,360 |
| Series 2012-128, Class SH, 0.00%, (3.886% - 30-day average SOFR, Floor 0.00%), 11/25/42(2) | | 3,753 | 2,003,506 |
| Series 2012-128, Class WS, 0.00%, (3.886% - 30-day average SOFR, Floor 0.00%), 11/25/42(2) | | 547 | 287,767 |
| Series 2012-134, Class ZT, 2.00%, 12/25/42 | | 982 | 746,180 |
| Series 2013-52, Class GA, 1.00%, 6/25/43 | | 571 | 460,010 |
| Series 2013-58, Class SC, 0.00%, (5.828% - 30-day average SOFR x 1.50, Floor 0.00%), 6/25/43(2) | | 2,651 | 1,698,053 |
| Series 2013-67, Class NF, 5.00%, (30-day average SOFR + 1.114%), 7/25/43(1) | | 631 | 553,652 |
| Series 2014-1, Class HF, 5.00%, (30-day average SOFR + 1.614%), 6/25/43(1) | | 730 | 628,718 |
| Series 2014-5, Class LB, 2.50%, 7/25/43 | | 7 | 7,424 |
| Series 2015-74, Class SL, 0.00%, (2.282% - 30-day average SOFR x 0.587, Floor 0.00%), 10/25/45(2) | | 1,883 | 942,198 |
| Series 2016-26, Class KS, 0.00%, (5.05% - 30-day average SOFR x 1.75, Floor 0.00%), 11/25/42(2) | | 1,603 | 1,093,663 |
| Series 2017-15, Class LE, 3.00%, 6/25/46 | | 113 | 108,946 |
8
See Notes to Financial Statements.
Eaton Vance
Short Duration Government Income Fund
October 31, 2023
Portfolio of Investments — continued
| Security | Principal
Amount
(000's omitted) | Value |
| Federal National Mortgage Association: (continued) | | | |
| Series 2017-56, Class KF, 6.00%, (30-day average SOFR + 1.114%), 7/25/47(1) | $ | 561 | $ 504,321 |
| Series 2017-56, Class KS, 0.00%, (4.886% - 30-day average SOFR, Floor 0.00%), 7/25/47(2) | | 314 | 133,293 |
| Series 2019-1, Class FA, 6.00%, (30-day average SOFR + 0.714%), 2/25/49(1) | | 6,554 | 6,381,470 |
| Series 2019-8, Class FD, 6.135%, (30-day average SOFR + 0.814%), 3/25/49(1) | | 20,460 | 19,829,783 |
| Series 2019-9, Class LF, 5.985%, (30-day average SOFR + 0.664%), 3/25/49(1) | | 7,930 | 7,645,841 |
| Series 2019-16, Class AF, 5.985%, (30-day average SOFR + 0.664%), 4/25/49(1) | | 6,848 | 6,558,426 |
| Series 2020-45, Class MA, 0.00%, (3.108% - 30-day average SOFR x 0.80, Floor 0.00%), 6/25/43(2) | | 1,126 | 764,845 |
| Series 2020-63, Class ZN, 3.00%, 9/25/50 | | 309 | 149,972 |
| Series 2020-86, Class ZP, 2.50%, 12/25/50 | | 1,392 | 569,950 |
| Series 2020-95, Class BZ, 2.50%, 1/25/51 | | 319 | 124,935 |
| Series 2020-96, Class DZ, 2.50%, 1/25/51 | | 8,316 | 4,007,996 |
| Series 2020-96, Class EZ, 2.50%, 1/25/51 | | 656 | 264,370 |
| Series 2020-96, Class KZ, 2.50%, 1/25/51 | | 312 | 124,789 |
| Series 2021-3, Class ZH, 2.50%, 2/25/51 | | 1,703 | 732,324 |
| Series 2021-8, Class NZ, 2.50%, 3/25/51 | | 1,060 | 460,084 |
| Series 2021-11, Class KZ, 3.00%, 6/25/50 | | 551 | 294,723 |
| Series 2021-14, Class GZ, 2.50%, 3/25/51 | | 685 | 280,936 |
| Series 2021-22, Class MZ, 3.00%, 4/25/51 | | 2,265 | 1,179,885 |
| Series 2021-42, Class ZA, 3.00%, 2/25/51 | | 4,799 | 2,622,710 |
| Series 2021-42, Class ZD, 3.00%, 11/25/50 | | 5,940 | 3,260,476 |
| Series 2021-45, Class DZ, 3.00%, 7/25/51 | | 379 | 179,625 |
| Series 2021-51, Class EZ, 2.50%, 8/25/51 | | 1,228 | 546,639 |
| Series 2021-52, Class JZ, 2.50%, 8/25/51 | | 15,057 | 7,618,169 |
| Series 2021-55, Class ZN, 2.50%, 8/25/51 | | 354 | 153,840 |
| Series 2021-56, Class LZ, 2.50%, 9/25/51 | | 14,309 | 7,688,549 |
| Series 2021-57, Class ZW, 2.50%, 7/25/51 | | 19,029 | 9,277,416 |
| Series 2021-59, Class EZ, 2.50%, 9/25/51 | | 1,462 | 667,049 |
| Series 2021-61, Class Z, 2.50%, 9/25/51 | | 13,000 | 6,734,924 |
| Series 2021-63, Class QZ, 2.50%, 6/25/51 | | 9,726 | 4,635,161 |
| Series 2021-64, Class ZJ, 2.50%, 10/25/51 | | 17,626 | 8,699,155 |
| Series 2021-66, Class JZ, 2.50%, 10/25/51 | | 13,087 | 6,602,512 |
| Series 2021-69, Class JZ, 2.50%, 10/25/51 | | 13,720 | 7,107,980 |
| Series 2021-77, Class WZ, 3.00%, 8/25/50 | | 1,861 | 909,977 |
| Series 2021-95, Class ZC, 3.00%, 8/25/51 | | 4,503 | 2,511,231 |
| Series 2022-2, Class ZN, 3.00%, 2/25/52 | | 11,693 | 6,527,747 |
| Series 2023-12, Class LW, 6.00%, 4/25/53 | | 15,000 | 14,338,712 |
| Series 2023-13, Class LY, 6.00%, 4/25/53 | | 9,120 | 8,653,015 |
| Series 2023-14, Class EL, 6.00%, 4/25/53 | | 23,200 | 21,969,847 |
| Interest Only:(3) | | | |
| Series 296, Class 2, 8.00%, 4/25/24 | | 0 (6) | 1 |
| Security | Principal
Amount
(000's omitted) | Value |
| Interest Only: (continued) | | | |
| Series 424, Class C8, 3.50%, 2/25/48 | $ | 3,720 | $ 688,367 |
| Series 2004-60, Class SW, 1.615%, (6.936% - 30-day average SOFR), 4/25/34(2) | | 599 | 13,728 |
| Series 2005-68, Class XI, 6.00%, 8/25/35 | | 1,088 | 201,289 |
| Series 2006-65, Class PS, 1.785%, (7.106% - 30-day average SOFR), 7/25/36(2) | | 677 | 66,316 |
| Series 2007-99, Class SD, 0.965%, (6.286% - 30-day average SOFR), 10/25/37(2) | | 1,026 | 74,204 |
| Series 2007-102, Class ST, 1.005%, (6.326% - 30-day average SOFR), 11/25/37(2) | | 512 | 31,444 |
| Series 2011-59, Class IW, 6.00%, 7/25/41 | | 742 | 135,756 |
| Series 2011-101, Class IC, 3.50%, 10/25/26 | | 682 | 19,089 |
| Series 2012-147, Class SA, 0.665%, (5.986% - 30-day average SOFR), 1/25/43(2) | | 742 | 55,513 |
| Series 2014-41, Class SA, 0.615%, (5.936% - 30-day average SOFR), 7/25/44(2) | | 718 | 78,788 |
| Series 2014-55, Class IL, 3.50%, 9/25/44 | | 608 | 126,419 |
| Series 2014-55, Class IN, 3.50%, 7/25/44 | | 571 | 116,099 |
| Series 2014-89, Class IO, 3.50%, 1/25/45 | | 948 | 202,585 |
| Series 2015-22, Class GI, 3.50%, 4/25/45 | | 293 | 53,932 |
| Series 2015-31, Class SG, 0.665%, (5.986% - 30-day average SOFR), 5/25/45(2) | | 781 | 104,539 |
| Series 2015-36, Class IL, 3.00%, 6/25/45 | | 833 | 119,070 |
| Series 2016-61, Class DI, 3.00%, 4/25/46 | | 669 | 69,898 |
| Series 2018-21, Class IO, 3.00%, 4/25/48 | | 4,061 | 721,911 |
| Series 2018-42, Class IA, 3.50%, 6/25/47 | | 970 | 174,560 |
| Series 2019-1, Class SA, 0.00%, (5.286% - 30-day average SOFR, Floor 0.00%), 2/25/49(2) | | 4,582 | 161,521 |
| Series 2020-23, Class SP, 0.615%, (5.936% - 30-day average SOFR), 2/25/50(2) | | 12,046 | 1,134,681 |
| Series 2020-45, Class HI, 2.50%, 7/25/50 | | 6,516 | 931,099 |
| Series 2020-73, Class NI, 2.00%, 10/25/50 | | 6,498 | 769,752 |
| Series 2020-89, Class PI, 2.50%, 12/25/50 | | 13,149 | 1,970,897 |
| Series 2020-94, Class DI, 2.00%, 1/25/51 | | 15,056 | 1,892,404 |
| Series 2021-3, Class KI, 2.50%, 2/25/51 | | 28,482 | 4,013,033 |
| Series 2021-3, Class LI, 2.50%, 2/25/51 | | 26,984 | 3,732,180 |
| Series 2021-10, Class EI, 2.00%, 3/25/51 | | 11,886 | 1,515,774 |
| Series 2021-34, Class QI, 3.00%, 6/25/51 | | 39,010 | 6,580,813 |
| Series 2021-73, Class AI, 2.50%, 6/25/49 | | 7,946 | 832,007 |
| Series 2021-94, Class CI, 3.00%, 1/25/52 | | 11,017 | 1,800,855 |
| Series 2022-6, Class IO, 2.50%, 7/25/51 | | 31,038 | 4,776,874 |
| Principal Only:(4) | | | |
| Series 379, Class 1, 0.00%, 5/25/37 | | 1,023 | 769,980 |
| Series 380, Class 1, 0.00%, 7/25/37 | | 245 | 189,647 |
| Series 2007-17, Class PO, 0.00%, 3/25/37 | | 181 | 131,944 |
| Series 2009-82, Class PO, 0.00%, 10/25/39 | | 469 | 353,440 |
| Series 2012-5, Class PO, 0.00%, 12/25/39 | | 324 | 248,395 |
| Series 2012-61, Class PO, 0.00%, 8/25/37 | | 1,448 | 1,118,436 |
9
See Notes to Financial Statements.
Eaton Vance
Short Duration Government Income Fund
October 31, 2023
Portfolio of Investments — continued
| Security | Principal
Amount
(000's omitted) | Value |
| Principal Only: (continued) | | | |
| Series 2014-9, Class DO, 0.00%, 2/25/43 | $ | 7,385 | $ 5,122,460 |
| Series 2014-17, Class PO, 0.00%, 4/25/44 | | 1,038 | 697,840 |
| Government National Mortgage Association: | | | |
| Series 2012-77, Class MT, 5.839%, (1 mo. SOFR + 0.504%), 5/16/41(1) | | 358 | 337,669 |
| Series 2014-H20, Class MF, 4.915%, (1 mo. SOFR + 0.764%), 10/20/64(1) | | 4,411 | 4,377,200 |
| Series 2015-144, Class KB, 3.00%, 8/20/44 | | 503 | 395,242 |
| Series 2015-H03, Class FD, 4.402%, (1 mo. SOFR + 0.754%), 1/20/65(1) | | 16,135 | 15,982,211 |
| Series 2015-H05, Class FB, 4.528%, (1 mo. SOFR + 0.754%), 2/20/65(1) | | 17,068 | 16,901,504 |
| Series 2016-168, Class JF, 6.00%, (1 mo. SOFR + 1.114%), 11/20/46(1) | | 128 | 116,912 |
| Series 2017-121, Class DF, 5.00%, (1 mo. SOFR + 0.614%), 8/20/47(1) | | 3,108 | 2,907,412 |
| Series 2017-137, Class AF, 5.00%, (1 mo. SOFR + 0.614%), 9/20/47(1) | | 1,398 | 1,306,409 |
| Series 2018-H18, Class FG, 5.675%, (1 mo. SOFR + 0.714%), 10/20/68(1) | | 30,106 | 29,219,070 |
| Series 2018-H20, Class FA, 6.043%, (1 mo. SOFR + 0.714%), 12/20/68(1) | | 47,721 | 46,332,513 |
| Series 2020-76, Class ZL, 2.75%, 5/20/50 | | 312 | 191,745 |
| Series 2021-1, Class ZD, 3.00%, 1/20/51 | | 1,587 | 1,009,278 |
| Series 2021-8, Class ZG, 2.50%, 1/20/51 | | 3,240 | 1,457,617 |
| Series 2021-24, Class EZ, 2.50%, 1/20/51 | | 3,517 | 1,595,548 |
| Series 2021-24, Class KZ, 2.50%, 2/20/51 | | 3,597 | 1,867,454 |
| Series 2021-25, Class JZ, 2.50%, 2/20/51 | | 2,002 | 807,395 |
| Series 2021-49, Class VZ, 2.50%, 3/20/51 | | 21 | 7,916 |
| Series 2021-77, Class ZG, 3.00%, 7/20/50 | | 355 | 166,875 |
| Series 2021-86, Class ZJ, 1.50%, 5/20/51 | | 284 | 110,285 |
| Series 2021-97, Class MZ, 3.00%, 8/20/50 | | 5,789 | 3,100,878 |
| Series 2021-97, Class ZC, 3.00%, 8/20/50 | | 7,419 | 4,044,827 |
| Series 2021-105, Class MZ, 3.00%, 6/20/51 | | 4,734 | 2,501,004 |
| Series 2021-105, Class ZH, 1.50%, 6/20/51 | | 1,487 | 726,679 |
| Series 2021-107, Class GZ, 3.00%, 6/20/51 | | 2,411 | 1,327,562 |
| Series 2021-114, Class JZ, 3.00%, 6/20/51 | | 2,067 | 1,055,856 |
| Series 2021-118, Class EZ, 2.50%, 7/20/51 | | 7,084 | 3,685,190 |
| Series 2021-121, Class ZE, 2.50%, 7/20/51 | | 126 | 55,451 |
| Series 2021-122, Class ZL, 2.50%, 7/20/51 | | 11,480 | 5,710,250 |
| Series 2021-131, Class ZN, 3.00%, 7/20/51 | | 2,604 | 1,473,153 |
| Series 2021-136, Class WZ, 3.00%, 8/20/51 | | 6,099 | 3,227,992 |
| Series 2021-136, Class Z, 2.50%, 8/20/51 | | 10,795 | 5,447,285 |
| Series 2021-137, Class GZ, 2.50%, 8/20/51 | | 1,244 | 709,231 |
| Series 2021-138, Class Z, 2.50%, 8/20/51 | | 11,498 | 6,155,246 |
| Series 2021-154, Class ZC, 2.50%, 9/20/51 | | 6,205 | 3,158,776 |
| Series 2021-154, Class ZL, 3.00%, 9/20/51 | | 8,252 | 3,966,164 |
| Series 2021-156, Class ZQ, 2.50%, 9/20/51 | | 4,925 | 2,589,827 |
| Security | Principal
Amount
(000's omitted) | Value |
| Government National Mortgage Association: (continued) | | | |
| Series 2021-159, Class ZJ, 2.50%, 9/20/51 | $ | 8,238 | $ 4,310,151 |
| Series 2021-159, Class ZP, 2.00%, 9/20/51 | | 7,629 | 4,369,612 |
| Series 2021-160, Class NZ, 3.00%, 9/20/51 | | 2,574 | 1,247,389 |
| Series 2021-172, Class ZA, 3.00%, 9/20/51 | | 1,600 | 847,254 |
| Series 2021-175, Class DZ, 3.00%, 10/20/51 | | 2,104 | 1,015,564 |
| Series 2021-177, Class JZ, 3.00%, 10/20/51 | | 4,872 | 2,810,120 |
| Series 2021-182, Class KZ, 3.00%, 10/20/51 | | 1,330 | 643,547 |
| Series 2021-194, Class HZ, 3.00%, 11/20/51 | | 9,318 | 5,803,189 |
| Series 2021-199, Class ZM, 3.00%, 11/20/51 | | 3,818 | 1,997,950 |
| Series 2021-213, Class NZ, 3.00%, 12/20/51 | | 7,648 | 4,653,717 |
| Series 2021-214, Class LZ, 3.00%, 12/20/51 | | 10,413 | 6,404,482 |
| Series 2022-31, Class ZD, 3.00%, 2/20/52 | | 794 | 256,790 |
| Series 2022-189, Class US, 3.222%, (22.733% - 30-day average SOFR x 3.667), 11/20/52(2) | | 12,128 | 10,989,254 |
| Series 2022-195, Class AS, 3.436%, (23.125% - 30-day average SOFR x 3.70), 11/20/52(2) | | 3,608 | 3,521,067 |
| Series 2022-197, Class SW, 3.549%, (16.32% - 30-day average SOFR x 2.40), 11/20/52(2) | | 6,933 | 6,296,565 |
| Series 2022-208, Class YF, 6.321%, (30-day average SOFR + 1.00%), 12/20/52(1) | | 44,676 | 43,642,186 |
| Series 2022-211, Class HF, 6.321%, (30-day average SOFR + 1.00%), 12/20/52(1) | | 178,705 | 174,524,934 |
| Series 2023-53, Class AL, 5.50%, 4/20/53 | | 26,000 | 23,631,904 |
| Series 2023-53, Class SE, 3.039%, (22.55% - 30-day average SOFR x 3.667), 4/20/53(2) | | 16,634 | 15,403,399 |
| Series 2023-63, Class LB, 6.00%, 5/20/53 | | 10,000 | 9,482,454 |
| Series 2023-63, Class S, 3.039%, (22.55% - 30-day average SOFR x 3.667), 5/20/53(2) | | 7,870 | 7,027,353 |
| Series 2023-64, Class LB, 6.00%, 5/20/53 | | 4,079 | 3,869,302 |
| Series 2023-65, Class G, 3.039%, (22.55% - 30-day average SOFR x 3.667), 5/20/53(2) | | 11,795 | 10,271,916 |
| Series 2023-65, Class SB, 3.039%, (22.55% - 30-day average SOFR x 3.667), 5/20/53(2) | | 3,868 | 3,533,991 |
| Series 2023-65, Class SD, 3.039%, (22.55% - 30-day average SOFR x 3.667), 5/20/53(2) | | 2,981 | 2,794,543 |
| Series 2023-66, Class S, 3.039%, (22.55% - 30-day average SOFR x 3.667), 5/20/53(2) | | 4,923 | 4,545,988 |
| Series 2023-66, Class SD, 3.039%, (22.55% - 30-day average SOFR x 3.667), 5/20/53(2) | | 1,969 | 1,758,469 |
| Series 2023-82, Class AL, 6.00%, 6/20/53 | | 18,360 | 17,399,071 |
| Series 2023-83, Class GS, 3.122%, (27.60% - 30-day average SOFR x 4.60), 6/20/53(2) | | 8,203 | 7,330,432 |
| Series 2023-83, Class S, 2.754%, (22.868% - 30-day average SOFR x 3.78), 6/20/53(2) | | 4,434 | 3,875,326 |
| Series 2023-84, Class MW, 6.00%, 6/20/53 | | 4,600 | 4,361,446 |
| Series 2023-84, Class SN, 2.858%, (22.387% - 30-day average SOFR x 3.67), 6/20/53(2) | | 5,918 | 5,231,783 |
| Series 2023-89, Class SD, 2.672%, (22.183% - 30-day average SOFR x 3.667), 6/20/53(2) | | 4,962 | 4,330,925 |
| Series 2023-96, Class BL, 6.00%, 7/20/53 | | 5,000 | 4,755,382 |
| Series 2023-96, Class DB, 6.00%, 7/20/53 | | 12,250 | 11,627,366 |
10
See Notes to Financial Statements.
Eaton Vance
Short Duration Government Income Fund
October 31, 2023
Portfolio of Investments — continued
| Security | Principal
Amount
(000's omitted) | Value |
| Government National Mortgage Association: (continued) | | | |
| Series 2023-97, Class CB, 6.00%, 7/20/53 | $ | 14,000 | $ 13,537,442 |
| Series 2023-98, Class BW, 6.00%, 7/20/53 | | 3,250 | 3,086,582 |
| Series 2023-98, Class JB, 6.00%, 7/20/53 | | 12,714 | 12,080,430 |
| Series 2023-99, Class AL, 6.00%, 7/20/53 | | 17,468 | 16,582,572 |
| Series 2023-117, Class JB, 6.00%, 8/20/53 | | 9,602 | 9,123,160 |
| Interest Only:(3) | | | |
| Series 2014-98, Class IM, 0.00%, 1/20/43(5) | | 4,933 | 106,085 |
| Series 2015-151, Class KI, 0.00%, 11/20/42(5) | | 5,927 | 133,793 |
| Series 2017-104, Class SD, 0.746%, (6.086% - 1 mo. SOFR), 7/20/47(2) | | 2,248 | 181,302 |
| Series 2017-121, Class DS, 0.00%, (4.386% - 1 mo. SOFR, Floor 0.00%), 8/20/47(2) | | 2,528 | 71,519 |
| Series 2018-127, Class SG, 0.796%, (6.136% - 1 mo. SOFR), 9/20/48(2) | | 6,097 | 417,069 |
| Series 2019-27, Class SA, 0.596%, (5.936% - 1 mo. SOFR), 2/20/49(2) | | 2,097 | 166,136 |
| Series 2019-38, Class SQ, 0.596%, (5.936% - 1 mo. SOFR), 3/20/49(2) | | 6,274 | 465,369 |
| Series 2019-43, Class BS, 0.596%, (5.936% - 1 mo. SOFR), 4/20/49(2) | | 3,473 | 279,168 |
| Series 2020-97, Class MI, 2.50%, 3/20/50 | | 5,423 | 684,139 |
| Series 2020-116, Class MI, 2.00%, 8/20/50 | | 503 | 65,526 |
| Series 2020-134, Class IM, 2.50%, 9/20/50 | | 14,434 | 1,950,599 |
| Series 2020-146, Class IQ, 2.00%, 10/20/50 | | 135,705 | 15,071,912 |
| Series 2020-146, Class QI, 2.00%, 10/20/50 | | 40,579 | 4,438,599 |
| Series 2020-151, Class AI, 2.00%, 10/20/50 | | 85,089 | 10,463,972 |
| Series 2020-162, Class BI, 2.00%, 10/20/50 | | 19,339 | 2,349,267 |
| Series 2020-167, Class KI, 2.00%, 11/20/50 | | 84,306 | 9,369,884 |
| Series 2020-167, Class YI, 2.00%, 11/20/50 | | 102,503 | 12,172,178 |
| Series 2020-173, Class DI, 2.00%, 11/20/50 | | 84,282 | 10,189,368 |
| Series 2020-176, Class AI, 2.00%, 11/20/50 | | 28,483 | 3,249,322 |
| Series 2020-176, Class HI, 2.50%, 11/20/50 | | 19,644 | 2,668,393 |
| Series 2020-181, Class TI, 2.00%, 12/20/50 | | 82,896 | 9,555,050 |
| Series 2020-185, Class BI, 2.00%, 12/20/50 | | 16,605 | 1,918,687 |
| Series 2021-9, Class GI, 2.00%, 1/20/51 | | 40,724 | 4,736,456 |
| Series 2021-15, Class AI, 2.00%, 1/20/51 | | 22,219 | 2,685,387 |
| Series 2021-23, Class TI, 2.50%, 2/20/51 | | 11,403 | 1,485,033 |
| Series 2021-30, Class AI, 2.00%, 2/20/51 | | 9,410 | 1,126,869 |
| Series 2021-46, Class IM, 2.50%, 3/20/51 | | 4,612 | 614,130 |
| Series 2021-56, Class SD, 0.00%, (2.30% - 30-day average SOFR, Floor 0.00%), 9/20/50(2) | | 14,678 | 141,862 |
| Series 2021-56, Class SE, 0.00%, (2.30% - 30-day average SOFR, Floor 0.00%), 10/20/50(2) | | 5,387 | 52,656 |
| Series 2021-77, Class SB, 0.00%, (3.636% - 1 mo. SOFR, Floor 0.00%), 5/20/51(2) | | 16,473 | 346,466 |
| Series 2021-77, Class SE, 0.00%, (3.636% - 1 mo. SOFR, Floor 0.00%), 5/20/51(2) | | 10,067 | 211,724 |
| Series 2021-97, Class IG, 2.50%, 8/20/49 | | 75,029 | 8,223,906 |
| Series 2021-97, Class QI, 3.00%, 6/20/51 | | 16,508 | 2,446,004 |
| Security | Principal
Amount
(000's omitted) | Value |
| Interest Only: (continued) | | | |
| Series 2021-98, Class EI, 3.00%, 6/20/51 | $ | 32,488 | $ 4,735,693 |
| Series 2021-114, Class MI, 3.00%, 6/20/51 | | 12,063 | 1,872,568 |
| Series 2021-122, Class NI, 3.00%, 7/20/51 | | 8,272 | 1,262,629 |
| Series 2021-125, Class SA, 0.00%, (3.636% - 1 mo. SOFR, Floor 0.00%), 7/20/51(2) | | 19,422 | 408,187 |
| Series 2021-131, Class QI, 3.00%, 7/20/51 | | 31,473 | 3,986,963 |
| Series 2021-140, Class YS, 0.00%, (1.586% - 1 mo. SOFR, Floor 0.00%), 8/20/51(2) | | 21,632 | 124,515 |
| Series 2021-160, Class DI, 3.00%, 9/20/51 | | 28,781 | 4,509,478 |
| Series 2021-160, Class IT, 2.50%, 9/20/51 | | 41,874 | 4,587,540 |
| Series 2021-175, Class AS, 0.00%, (1.686% - 1 mo. SOFR, Floor 0.00%), 10/20/51(2) | | 43,539 | 263,295 |
| Series 2021-175, Class SB, 0.00%, (1.686% - 1 mo. SOFR, Floor 0.00%), 10/20/51(2) | | 21,891 | 132,620 |
| Series 2021-193, Class IU, 3.00%, 11/20/49 | | 65,468 | 8,913,152 |
| Series 2021-193, Class YS, 0.00%, (2.45% - 30-day average SOFR, Floor 0.00%), 11/20/51(2) | | 50,580 | 440,924 |
| Series 2021-196, Class GI, 3.00%, 11/20/51 | | 31,358 | 4,470,698 |
| Series 2021-201, Class PI, 3.00%, 11/20/51 | | 26,974 | 3,140,525 |
| Series 2021-209, Class IW, 3.00%, 11/20/51 | | 17,157 | 2,252,774 |
| Series 2022-104, Class IO, 2.50%, 6/20/51 | | 26,217 | 3,411,301 |
| Series 2022-119, Class CS, 0.00%, (3.00% - 30-day average SOFR, Floor 0.00%), 7/20/52(2) | | 208,493 | 1,577,169 |
| Series 2022-119, Class SC, 0.00%, (3.00% - 30-day average SOFR, Floor 0.00%), 7/20/52(2) | | 23,166 | 175,241 |
| Series 2022-126, Class AS, 0.00%, (3.69% - 30-day average SOFR, Floor 0.00%), 7/20/52(2) | | 62,173 | 827,905 |
| Series 2022-126, Class SC, 0.00%, (3.73% - 30-day average SOFR, Floor 0.00%), 7/20/52(2) | | 46,332 | 632,657 |
| Series 2022-135, Class SA, 0.00%, (3.00% - 30-day average SOFR, Floor 0.00%), 6/20/52(2) | | 129,741 | 1,085,400 |
| Series 2023-13, Class SA, 0.079%, (5.40% - 30-day average SOFR), 1/20/53(2) | | 18,347 | 335,932 |
| Series 2023-19, Class SD, 0.979%, (6.30% - 30-day average SOFR), 2/20/53(2) | | 20,536 | 1,081,315 |
| Series 2023-20, Class HS, 0.979%, (6.30% - 30-day average SOFR), 2/20/53(2) | | 14,443 | 774,536 |
| Series 2023-22, Class ES, 0.979%, (6.30% - 30-day average SOFR), 2/20/53(2) | | 19,258 | 1,032,714 |
| Series 2023-22, Class SA, 0.379%, (5.70% - 30-day average SOFR), 2/20/53(2) | | 32,170 | 877,709 |
| Series 2023-24, Class SB, 0.00%, (5.15% - 30-day average SOFR, Floor 0.00%), 2/20/53(2) | | 38,516 | 946,458 |
| Series 2023-24, Class SG, 0.979%, (6.30% - 30-day average SOFR), 2/20/53(2) | | 19,258 | 1,032,714 |
| Series 2023-32, Class SA, 0.979%, (6.30% - 30-day average SOFR), 2/20/53(2) | | 64,996 | 3,485,411 |
| Series 2023-38, Class LS, 0.979%, (6.30% - 30-day average SOFR), 3/20/53(2) | | 29,155 | 1,559,761 |
| Series 2023-47, Class HS, 0.979%, (6.30% - 30-day average SOFR), 3/20/53(2) | | 9,718 | 519,920 |
11
See Notes to Financial Statements.
Eaton Vance
Short Duration Government Income Fund
October 31, 2023
Portfolio of Investments — continued
| Security | Principal
Amount
(000's omitted) | Value |
| Interest Only: (continued) | | | |
| Series 2023-47, Class SC, 0.929%, (6.25% - 30-day average SOFR), 3/20/53(2) | $ | 14,544 | $ 758,232 |
| Series 2023-53, Class SK, 0.879%, (6.20% - 30-day average SOFR), 4/20/53(2) | | 36,899 | 1,917,239 |
| Series 2023-65, Class BS, 0.829%, (6.15% - 30-day average SOFR), 5/20/53(2) | | 31,243 | 1,715,912 |
| Principal Only:(4) | | | |
| Series 2009-117, Class PO, 0.00%, 12/16/39 | | 758 | 554,389 |
| Series 2010-88, Class OA, 0.00%, 7/20/40 | | 497 | 351,676 |
| Series 2015-24, Class KO, 0.00%, 6/20/35 | | 563 | 485,423 |
Total Collateralized Mortgage Obligations
(identified cost $1,804,788,168) | | | $1,377,985,697 |
| U.S. Department of Agriculture Loans — 1.4% |
| Security | Principal
Amount
(000's omitted) | Value |
| USDA Guaranteed Loans: | | | |
| 8.00%, (USD Prime - 0.50%), 7/1/27(1) | $ | 16,250 | $ 16,264,311 |
| 8.00%, (USD Prime - 0.50%), 7/1/27(1) | | 26,507 | 26,532,692 |
Total U.S. Department of Agriculture Loans
(identified cost $42,757,332) | | | $ 42,797,003 |
| U.S. Government Agency Commercial Mortgage-Backed Securities — 0.5% |
| Security | Principal
Amount
(000's omitted) | Value |
| FRESB Mortgage Trust: | | | |
| Interest Only:(3) | | | |
| Series 2021-SB91, Class X1, 0.572%, 8/25/41(5) | $ | 45,634 | $ 1,242,596 |
| Series 2021-SB92, Class X1, 0.58%, 8/25/41(5) | | 23,853 | 533,472 |
| Government National Mortgage Association: | | | |
| Interest Only:(3) | | | |
| Series 2021-101, Class IO, 0.679%, 4/16/63(5) | | 54,342 | 2,855,792 |
| Series 2021-132, Class IO, 0.726%, 4/16/63(5) | | 57,863 | 3,165,895 |
| Series 2021-144, Class IO, 0.825%, 4/16/63(5) | | 51,574 | 3,037,582 |
| Series 2021-186, Class IO, 0.765%, 5/16/63(5) | | 47,621 | 2,696,016 |
| Series 2022-3, Class IO, 0.64%, 2/16/61(5) | | 67,741 | 3,150,714 |
Total U.S. Government Agency Commercial Mortgage-Backed Securities
(identified cost $22,297,513) | | | $ 16,682,067 |
| U.S. Government Agency Mortgage-Backed Securities — 76.5% |
| Security | Principal
Amount
(000's omitted) | Value |
| Federal Home Loan Mortgage Corp.: | | | |
| 3.894%, (COF + 2.275%), with maturity at 2025(7) | $ | 44 | $ 44,290 |
| 4.11%, (COF + 1.296%), with maturity at 2034(7) | | 9 | 9,034 |
| 4.14%, (COF + 1.25%), with maturity at 2025(7) | | 19 | 18,296 |
| 4.168%, (5 yr. CMT + 2.515%), with maturity at 2032(7) | | 144 | 137,898 |
| 4.196%, (COF + 1.254%), with maturity at 2035(7) | | 174 | 170,304 |
| 4.243%, (COF + 1.254%), with maturity at 2029(7) | | 5 | 4,947 |
| 4.50%, with maturity at 2035 | | 285 | 271,712 |
| 4.502%, (COF + 1.252%), with maturity at 2032(7) | | 80 | 77,437 |
| 4.616%, (COF + 1.251%), with maturity at 2030(7) | | 112 | 110,505 |
| 4.649%, (COF + 1.254%), with maturity at 2033(7) | | 21 | 20,424 |
| 4.747%, (1 yr. CMT + 1.975%), with maturity at 2034(7) | | 479 | 477,049 |
| 4.834%, (1 yr. CMT + 2.249%), with maturity at 2038(7) | | 358 | 358,794 |
| 4.88%, (1 yr. CMT + 2.238%), with maturity at 2036(7) | | 400 | 400,468 |
| 5.00%, with maturity at 2052 | | 5,055 | 4,576,975 |
| 5.186%, (COF + 2.292%), with maturity at 2037(7) | | 355 | 351,773 |
| 5.50%, with various maturities to 2053 | | 139,203 | 132,352,756 |
| 5.554%, (1 yr. CMT + 2.255%), with maturity at 2035(7) | | 1,152 | 1,151,968 |
| 5.605%, (30-day average SOFR + 2.37%), with maturity at 2052(7) | | 676 | 651,766 |
| 5.685%, (1 yr. CMT + 2.318%), with maturity at 2036(7) | | 481 | 481,827 |
| 6.00%, with various maturities to 2053 | | 11,265 | 10,995,811 |
| 7.00%, with maturity at 2033 | | 47 | 46,767 |
| Federal National Mortgage Association: | | | |
| 3.00%, with various maturities to 2050 | | 17,004 | 13,804,516 |
| 4.144%, (COF + 1.254%), with maturity at 2033(7) | | 95 | 92,742 |
| 4.146%, (COF + 1.254%), with maturity at 2034(7) | | 20 | 18,973 |
| 4.149%, (COF + 1.254%), with maturity at 2033(7) | | 148 | 145,917 |
| 4.186%, (COF + 1.254%), with maturity at 2035(7) | | 41 | 40,108 |
| 4.219%, (COF + 1.25%), with various maturities to 2027(7) | | 63 | 62,359 |
| 4.223%, (COF + 1.254%), with maturity at 2034(7) | | 148 | 142,737 |
| 4.255%, (COF + 1.254%), with maturity at 2034(7) | | 86 | 83,730 |
| 4.406%, (COF + 1.26%), with maturity at 2036(7) | | 100 | 96,994 |
| 4.465%, (COF + 1.311%), with maturity at 2036(7) | | 56 | 54,113 |
| 4.50%, with maturity at 2052 | | 927 | 829,137 |
| 4.594%, (COF + 1.258%), with maturity at 2036(7) | | 25 | 24,728 |
| 4.645%, (COF + 2.283%), with maturity at 2026(7) | | 31 | 31,183 |
| 4.664%, (COF + 1.695%), with maturity at 2029(7) | | 0 (6) | 381 |
| 4.677%, (COF + 1.495%), with maturity at 2029(7) | | 161 | 160,658 |
| 4.721%, (COF + 1.26%), with maturity at 2037(7) | | 56 | 55,182 |
12
See Notes to Financial Statements.
Eaton Vance
Short Duration Government Income Fund
October 31, 2023
Portfolio of Investments — continued
| Security | Principal
Amount
(000's omitted) | Value |
| Federal National Mortgage Association: (continued) | | | |
| 4.75%, (COF + 1.265%), with maturity at 2038(7) | $ | 7 | $ 7,161 |
| 4.771%, (COF + 1.802%), with maturity at 2034(7) | | 142 | 138,701 |
| 4.924%, (COF + 1.736%), with maturity at 2035(7) | | 178 | 174,089 |
| 4.925%, (1 yr. RFUCCT + 1.75%), with maturity at 2035(7) | | 323 | 324,658 |
| 4.951%, (COF + 1.859%), with maturity at 2034(7) | | 37 | 36,827 |
| 5.00%, with various maturities to 2048 | | 1,051 | 958,489 |
| 5.05%, (COF + 1.791%), with maturity at 2035(7) | | 135 | 132,035 |
| 5.175%, (1 yr. RFUCCT + 1.80%), with maturity at 2034(7) | | 110 | 110,872 |
| 5.192%, (COF + 1.811%), with maturity at 2036(7) | | 303 | 295,793 |
| 5.225%, (1 yr. CMT + 2.206%), with maturity at 2039(7) | | 795 | 801,230 |
| 5.286%, (1 yr. CMT + 2.095%), with maturity at 2040(7) | | 171 | 171,175 |
| 5.292%, (1 yr. CMT + 2.547%), with maturity at 2038(7) | | 361 | 364,997 |
| 5.419%, (1 yr. CMT + 2.12%), with maturity at 2037(7) | | 375 | 377,174 |
| 5.441%, (1 yr. CMT + 2.156%), with maturity at 2036(7) | | 139 | 139,619 |
| 5.50%, 30-Year, TBA(8) | | 163,300 | 155,013,799 |
| 5.50%, with maturity at 2024 | | 0 (6) | 13 |
| 5.50%, with various maturities to 2052 | | 52,451 | 49,853,004 |
| 5.50%, with various maturities to 2052(9) | | 441,923 | 420,098,612 |
| 5.599%, (COF + 1.736%), with maturity at 2034(7) | | 43 | 42,882 |
| 5.653%, (1 yr. CMT + 2.192%), with maturity at 2031(7) | | 45 | 44,273 |
| 6.00%, with maturity at 2023 | | 0 (6) | 66 |
| 6.00%, with various maturities to 2053 | | 15,602 | 15,316,604 |
| 6.034%, (1 yr. CMT + 2.247%), with maturity at 2033(7) | | 954 | 959,713 |
| 6.068%, (1 yr. CMT + 2.068%), with maturity at 2033(7) | | 169 | 169,039 |
| 6.334%, (COF + 2.004%), with maturity at 2032(7) | | 24 | 24,519 |
| 6.50%, with various maturities to 2053 | | 6,943 | 6,925,880 |
| 6.50%, 30-Year, TBA(8) | | 63,200 | 62,819,814 |
| Government National Mortgage Association: | | | |
| 2.50%, with maturity at 2051 | | 2,062 | 1,621,878 |
| 2.75%, (1 yr. CMT + 1.50%), with maturity at 2027(7) | | 38 | 36,307 |
| 3.00%, (1 yr. CMT + 1.50%), with maturity at 2026(7) | | 28 | 26,872 |
| 4.00%, with various maturities to 2052 | | 9,637 | 8,448,660 |
| 4.50%, with various maturities to 2052 | | 283,719 | 253,448,544 |
| 5.00%, with various maturities to 2052 | | 90,814 | 84,376,714 |
| 5.50%, with various maturities to 2062 | | 117,593 | 112,726,098 |
| 5.50%, 30-Year, TBA(8) | | 242,575 | 232,033,345 |
| 5.50%, with maturity at 2062 | | 350 | 332,020 |
| Security | Principal
Amount
(000's omitted) | Value |
| Government National Mortgage Association: (continued) | | | |
| 6.00%, with various maturities to 2063 | $ | 113,522 | $ 111,826,079 |
| 6.00%, with maturity at 2053 | | 1,994 | 1,964,249 |
| 6.00%, 30-Year, TBA(8) | | 339,775 | 332,962,613 |
| 6.50%, with various maturities to 2063 | | 86,727 | 86,702,018 |
| 6.50%, 30-Year, TBA(8) | | 196,550 | 196,185,459 |
| 7.00%, with various maturities to 2062 | | 27,325 | 27,660,215 |
Total U.S. Government Agency Mortgage-Backed Securities
(identified cost $2,424,405,427) | | | $2,334,006,368 |
| U.S. Government Guaranteed Small Business Administration Pools & Loans — 4.8% |
| Security | Principal
Amount
(000's omitted) | Value |
| 6.125%, (USD Prime - 2.375%), 2/25/29(1) | $ | 31,842 | $ 31,824,909 |
| 6.25%, (USD Prime - 2.25%), 1/25/44 to 2/25/44(1) | | 35,089 | 35,150,440 |
| 6.30%, (USD Prime - 2.20%), 4/25/44(1) | | 17,008 | 17,078,077 |
| 7.50%, (USD Prime - 1.00%), 4/25/44(1) | | 19,234 | 19,978,020 |
| 7.825%, (USD Prime - 0.675%), 2/25/44(1) | | 16,461 | 17,307,340 |
| Interest Only:(10)(11) | | | |
| 1.03%, 1/18/39 | | 402 | 9,294 |
| 1.26%, 2/15/44 | | 1,436 | 56,060 |
| 1.51%, 2/15/44 | | 1,053 | 46,454 |
| 1.56%, 3/14/44 | | 528 | 23,896 |
| 1.76%, 12/18/28 | | 89 | 2,430 |
| 1.81%, 7/10/43 to 2/6/44 | | 5,221 | 235,226 |
| 1.88%, 12/18/43 to 12/27/43 | | 5,833 | 285,513 |
| 1.91%, 7/15/42 to 4/15/44 | | 17,616 | 844,401 |
| 1.93%, 6/14/43 to 2/8/44 | | 21,937 | 1,099,838 |
| 2.01%, 3/12/29 to 2/15/44 | | 3,626 | 182,518 |
| 2.06%, 3/15/29 to 3/15/44 | | 9,269 | 490,975 |
| 2.13%, 9/14/43 to 1/9/44 | | 4,967 | 266,063 |
| 2.16%, 3/15/42 to 4/15/44 | | 2,633 | �� 143,354 |
| 2.18%, 12/3/28 to 2/15/44 | | 14,184 | 776,523 |
| 2.19%, 11/14/32 to 5/16/43(12) | | 51,809 | 2,141,247 |
| 2.26%, 12/28/28 to 1/15/44 | | 2,959 | 159,817 |
| 2.31%, 12/15/28 to 4/15/44 | | 22,109 | 1,307,300 |
| 2.38%, 8/31/28 to 12/27/43 | | 2,542 | 144,479 |
| 2.41%, 6/15/42 to 4/15/44 | | 14,991 | 941,165 |
| 2.43%, 5/7/28 to 2/12/44 | | 9,358 | 580,967 |
| 2.48%, 3/15/44 | | 2,551 | 170,040 |
| 2.51%, 2/21/33 to 4/1/43(12) | | 14,443 | 872,941 |
| 2.51%, 7/12/28 to 1/15/44 | | 2,988 | 190,037 |
| 2.56%, 12/15/28 to 9/18/44 | | 18,957 | 1,237,425 |
13
See Notes to Financial Statements.
Eaton Vance
Short Duration Government Income Fund
October 31, 2023
Portfolio of Investments — continued
| Security | Principal
Amount
(000's omitted) | Value |
| Interest Only: (continued) | | | |
| 2.61%, 4/15/29 | $ | 59 | $ 2,416 |
| 2.63%, 9/13/42 to 1/11/44 | | 2,400 | 171,873 |
| 2.66%, 6/15/42 to 4/15/44 | | 10,107 | 682,581 |
| 2.68%, 10/19/28 to 2/19/44 | | 16,797 | 1,076,814 |
| 2.73%, 7/29/26 to 12/13/42(12) | | 16,545 | 750,479 |
| 2.76%, 10/1/28 to 2/15/44 | | 6,821 | 427,015 |
| 2.81%, 3/15/29 to 4/24/44 | | 20,968 | 1,424,889 |
| 2.88%, 12/3/43 to 12/27/43 | | 2,621 | 190,236 |
| 2.91%, 3/15/44 | | 674 | 53,642 |
| 2.93%, 10/1/28 to 1/23/44 | | 4,026 | 310,256 |
| 3.01%, 10/13/28 to 1/15/44 | | 1,483 | 100,730 |
| 3.06%, 1/15/29 to 2/21/44 | | 1,421 | 106,249 |
| 3.13%, 9/29/43 to 1/31/44 | | 7,787 | 660,055 |
| 3.18%, 5/8/28 to 2/19/44 | | 6,412 | 450,759 |
| 3.26%, 10/18/28 to 2/15/44 | | 2,586 | 190,446 |
| 3.26%, 3/28/24 to 7/26/42(12) | | 8,014 | 454,651 |
| 3.31%, 4/15/29 to 2/28/44 | | 2,950 | 294,660 |
| 3.36%, 1/15/29 | | 46 | 2,404 |
| 3.38%, 8/28/43 to 1/16/44 | | 7,192 | 695,399 |
| 3.43%, 4/27/28 to 7/27/43 | | 17,463 | 1,156,107 |
| 3.51%, 10/11/28 to 3/15/44 | | 10,792 | 828,150 |
| 3.53%, 3/10/26 to 3/23/42(12) | | 257 | 22,979 |
| 3.56%, 12/28/28 to 3/15/44 | | 9,361 | 682,296 |
| 3.61%, 12/27/28 | | 8 | 458 |
| 3.66%, 11/15/43 to 4/15/44 | | 6,648 | 654,203 |
| 3.98%, 12/11/28 to 12/13/28 | | 290 | 18,292 |
Total U.S. Government Guaranteed Small Business Administration Pools & Loans
(identified cost $167,641,942) | | | $ 144,954,788 |
| Short-Term Investments — 0.2% |
| Security | Shares | Value |
| Morgan Stanley Institutional Liquidity Funds - Government Portfolio, Institutional Class, 5.25%(13) | | 5,892,398 | $ 5,892,398 |
Total Short-Term Investments
(identified cost $5,892,398) | | | $ 5,892,398 |
Total Investments — 128.6%
(identified cost $4,467,782,780) | | | $3,922,318,321 |
Total Written Swaptions — (0.0)%(14)
(premiums received $3,738,390) | | | $ (216,409) |
| TBA Sale Commitments — (12.1)% |
| U.S. Government Agency Mortgage-Backed Securities — (12.1)% |
| Security | Principal
Amount
(000's omitted) | Value |
| Federal National Mortgage Association, 3.00%, 30-Year, TBA(8) | | $ (17,400) | $ (13,909,805) |
| Federal National Mortgage Association, 4.50%, 30-Year, TBA(8) | | (283,000) | (252,931,250) |
| Federal National Mortgage Association, 5.00%, 30-Year, TBA(8) | | (100,176) | (92,377,138) |
| Government National Mortgage Association, 4.00%, 30-Year, TBA(8) | | (9,700) | (8,524,605) |
Total U.S. Government Agency Mortgage-Backed Securities
(proceeds $371,507,787) | | | $ (367,742,798) |
Total TBA Sale Commitments
(proceeds $371,507,787) | | | $ (367,742,798) |
| Other Assets, Less Liabilities — (16.5)% | | | $ (505,164,062) |
| Net Assets — 100.0% | | | $3,049,195,052 |
| The percentage shown for each investment category in the Portfolio of Investments is based on net assets. |
| (1) | Variable rate security. The stated interest rate represents the rate in effect at October 31, 2023. |
| (2) | Inverse floating-rate security whose coupon varies inversely with changes in the interest rate index. The stated interest rate represents the coupon rate in effect at October 31, 2023. |
| (3) | Interest only security that entitles the holder to receive only interest payments on the underlying mortgages. Principal amount shown is the notional amount of the underlying mortgages on which coupon interest is calculated. |
| (4) | Principal only security that entitles the holder to receive only principal payments on the underlying mortgages. |
| (5) | Weighted average fixed-rate coupon that changes/updates monthly. Rate shown is the rate at October 31, 2023. |
| (6) | Principal amount is less than $500. |
| (7) | Adjustable rate mortgage security whose interest rate generally adjusts monthly based on a weighted average of interest rates on the underlying mortgages. The coupon rate may not reflect the applicable index value as interest rates on the underlying mortgages may adjust on various dates and at various intervals and may be subject to lifetime ceilings and lifetime floors and lookback periods. Rate shown is the coupon rate at October 31, 2023. |
| (8) | TBA (To Be Announced) securities are purchased or sold on a forward commitment basis with an approximate principal amount and maturity date. The actual principal amount and maturity date are determined upon settlement. |
| (9) | Security (or a portion thereof) has been pledged for the benefit of the counterparty for reverse repurchase agreements. |
14
See Notes to Financial Statements.
Eaton Vance
Short Duration Government Income Fund
October 31, 2023
Portfolio of Investments — continued
| (10) | Interest only security that entitles the holder to receive only a portion of the interest payments on the underlying loans. Principal amount shown is the notional amount of the underlying loans on which coupon interest is calculated. |
| (11) | Securities comprise a trust that is wholly-owned by the Fund and may only be sold on a pro rata basis with all securities in the trust. |
| (12) | The stated interest rate represents the weighted average fixed interest rate at October 31, 2023 of all interest only securities comprising the certificate. |
| (13) | May be deemed to be an affiliated investment company. The rate shown is the annualized seven-day yield as of October 31, 2023. |
| (14) | Amount is less than (0.05)%. |
| Written Interest Rate Swaptions (OTC) — (0.0)%(1) |
| Description | Counterparty | Notional
Amount | Expiration
Date | Value |
| Option to enter into interest rate swap expiring 5/10/29 to receive 1.93% and pay SOFR | Bank of America, N.A. | USD | (501,491,332) | 5/8/24 | $ (216,409) |
| Total | | | | | $(216,409) |
| (1) | Amount is less than (0.05)%. |
| Futures Contracts |
| Description | Number of
Contracts | Position | Expiration
Date | Notional
Amount | Value/Unrealized
Appreciation
(Depreciation) |
| Interest Rate Futures | | | | | |
| U.S. 5-Year Treasury Note | 11,851 | Long | 12/29/23 | $1,238,151,748 | $ (9,764,485) |
| U.S. Long Treasury Bond | (1,041) | Short | 12/19/23 | (113,924,438) | 3,331,262 |
| U.S. Ultra-Long Treasury Bond | (908) | Short | 12/19/23 | (102,206,750) | 5,633,707 |
| | | | | | $ (799,516) |
15
See Notes to Financial Statements.
Eaton Vance
Short Duration Government Income Fund
October 31, 2023
Portfolio of Investments — continued
| Interest Rate Swaps (Centrally Cleared) |
Notional Amount
(000's omitted) | Fund
Pays/
Receives
Floating
Rate | Floating Rate | Annual
Fixed Rate | Termination
Date | Value | Unamortized
Upfront
Receipts
(Payments) | Unrealized
Appreciation
(Depreciation) |
| USD | 450,000 | Receives | SOFR
(pays annually) | 3.07%
(pays annually) | 10/14/32 | $ 48,674,250 | $ — | $ 48,674,250 |
| USD | 94,000 | Receives | SOFR
(pays annually) | 3.16%
(pays annually) | 1/5/33 | 11,417,263 | — | 11,417,263 |
| USD | 125,000 | Receives | SOFR
(pays annually) | 2.47%
(pays annually) | 3/28/33 | 21,673,725 | (2,561,679) | 19,112,046 |
| USD | 300,000 | Receives | SOFR
(pays quarterly) | 2.01%
(pays semi-annually) | 2/16/52 | 128,691,782 | — | 128,691,782 |
| USD | 300,000 | Receives | SOFR
(pays annually) | 1.92%
(pays annually) | 4/8/52 | 124,842,906 | — | 124,842,906 |
| USD | 100,000 | Receives | SOFR
(pays annually) | 1.89%
(pays annually) | 8/3/52 | 40,790,922 | (958) | 40,789,964 |
| Total | | | | | | $376,090,848 | $(2,562,637) | $373,528,211 |
| Abbreviations: |
| CMT | – Constant Maturity Treasury |
| COF | – Cost of Funds 11th District |
| OTC | – Over-the-counter |
| RFUCCT | – Refinitiv USD IBOR Consumer Cash Fallbacks Term |
| SOFR | – Secured Overnight Financing Rate |
| TBA | – To Be Announced |
| Currency Abbreviations: |
| USD | – United States Dollar |
16
See Notes to Financial Statements.
Eaton Vance
Short Duration Government Income Fund
October 31, 2023
Statement of Assets and Liabilities
| | October 31, 2023 |
| Assets | |
| Unaffiliated investments, at value (identified cost $4,461,890,382) | $ 3,916,425,923 |
| Affiliated investments, at value (identified cost $5,892,398) | 5,892,398 |
| Deposits for forward purchase commitments | 3,768,000 |
| Deposits for reverse repurchase agreements | 1,470,000 |
| Deposits for derivatives collateral: | |
| Futures contracts | 9,522,440 |
| Centrally cleared swap contracts | 71,433,061 |
| OTC swaptions | 230,000 |
| Interest receivable | 22,271,421 |
| Dividends receivable from affiliated investments | 168,702 |
| Receivable for investments sold | 868,862,605 |
| Receivable for TBA sale commitments | 371,507,787 |
| Receivable for Fund shares sold | 9,459,002 |
| Receivable for variation margin on open centrally cleared swap contracts | 6,597,956 |
| Trustees' deferred compensation plan | 88,046 |
| Total assets | $5,287,697,341 |
| Liabilities | |
| Cash collateral due to brokers | $ 3,198,000 |
| Payable for reverse repurchase agreements, including accrued interest of $273,357 | 34,902,317 |
| Written swaptions outstanding, at value (premiums received $3,738,390) | 216,409 |
| Payable for forward commitment securities | 1,791,475,579 |
| TBA sale commitments, at value (proceeds receivable $371,507,787) | 367,742,798 |
| Payable for Fund shares redeemed | 31,063,900 |
| Payable for variation margin on open futures contracts | 5,262,414 |
| Distributions payable | 1,185,494 |
| Due to custodian | 563,671 |
| Payable to affiliates: | |
| Investment adviser fee | 1,281,740 |
| Distribution and service fees | 156,457 |
| Trustees' fees | 9,223 |
| Trustees' deferred compensation plan | 88,046 |
| Accrued expenses | 1,356,241 |
| Total liabilities | $2,238,502,289 |
| Net Assets | $3,049,195,052 |
| Sources of Net Assets | |
| Paid-in capital | $ 3,858,593,248 |
| Accumulated loss | (809,398,196) |
| Net Assets | $3,049,195,052 |
| Advisers Class Shares | |
| Net Assets | $ 72,271,600 |
| Shares Outstanding | 10,084,460 |
Net Asset Value, Offering Price and Redemption Price Per Share
(net assets ÷ shares of beneficial interest outstanding) | $ 7.17 |
| Class A Shares | |
| Net Assets | $ 465,669,721 |
| Shares Outstanding | 64,930,524 |
Net Asset Value and Redemption Price Per Share
(net assets ÷ shares of beneficial interest outstanding) | $ 7.17 |
Maximum Offering Price Per Share
(100 ÷ 97.75 of net asset value per share) | $ 7.34 |
17
See Notes to Financial Statements.
Eaton Vance
Short Duration Government Income Fund
October 31, 2023
Statement of Assets and Liabilities — continued
| | October 31, 2023 |
| Class C Shares | |
| Net Assets | $ 46,203,473 |
| Shares Outstanding | 6,433,543 |
Net Asset Value and Offering Price Per Share*
(net assets ÷ shares of beneficial interest outstanding) | $ 7.18 |
| Class I Shares | |
| Net Assets | $2,465,050,258 |
| Shares Outstanding | 344,121,684 |
Net Asset Value, Offering Price and Redemption Price Per Share
(net assets ÷ shares of beneficial interest outstanding) | $ 7.16 |
| On sales of $100,000 or more, the offering price of Class A shares is reduced. |
| * | Redemption price per share is equal to the net asset value less any applicable contingent deferred sales charge. |
18
See Notes to Financial Statements.
Eaton Vance
Short Duration Government Income Fund
October 31, 2023
| | Year Ended |
| | October 31, 2023 |
| Investment Income | |
| Dividend income from affiliated investments | $ 3,522,671 |
| Interest income | 226,015,141 |
| Total investment income | $ 229,537,812 |
| Expenses | |
| Investment adviser fee | $ 21,288,148 |
| Distribution and service fees: | |
| Advisers Class | 332,504 |
| Class A | 1,661,212 |
| Class C | 492,039 |
| Trustees’ fees and expenses | 108,660 |
| Custodian fee | 896,157 |
| Transfer and dividend disbursing agent fees | 2,198,342 |
| Legal and accounting services | 365,929 |
| Printing and postage | 732,206 |
| Registration fees | 153,168 |
| Interest expense and fees | 8,836,935 |
| Miscellaneous | 205,231 |
| Total expenses | $ 37,270,531 |
| Deduct: | |
| Waiver and/or reimbursement of expenses by affiliates | $ 117,120 |
| Total expense reductions | $ 117,120 |
| Net expenses | $ 37,153,411 |
| Net investment income | $ 192,384,401 |
| Realized and Unrealized Gain (Loss) | |
| Net realized gain (loss): | |
| Investment transactions | $ (274,759,997) |
| Written options and swaptions | 13,154,617 |
| Futures contracts | 19,483,826 |
| Swap contracts | 51,897,880 |
| Net realized loss | $(190,223,674) |
| Change in unrealized appreciation (depreciation): | |
| Investments | $ (22,938,844) |
| Written options and swaptions | 7,295,392 |
| TBA sale commitments | (26,941,197) |
| Futures contracts | (100,385,149) |
| Swap contracts | 126,106,275 |
| Net change in unrealized appreciation (depreciation) | $ (16,863,523) |
| Net realized and unrealized loss | $(207,087,197) |
| Net decrease in net assets from operations | $ (14,702,796) |
19
See Notes to Financial Statements.
Eaton Vance
Short Duration Government Income Fund
October 31, 2023
Statements of Changes in Net Assets
| | Year Ended October 31, |
| | 2023 | 2022 |
| Increase (Decrease) in Net Assets | | |
| From operations: | | |
| Net investment income | $ 192,384,401 | $ 144,933,239 |
| Net realized loss | (190,223,674) | (255,824,063) |
| Net change in unrealized appreciation (depreciation) | (16,863,523) | (78,363,249) |
| Net decrease in net assets from operations | $ (14,702,796) | $ (189,254,073) |
| Distributions to shareholders: | | |
| Advisers Class | $ (6,572,022) | $ (5,106,640) |
| Class A | (33,037,453) | (23,856,615) |
| Class C | (2,536,047) | (1,110,912) |
| Class I | (190,816,660) | (124,075,281) |
| Total distributions to shareholders | $ (232,962,182) | $ (154,149,448) |
| Tax return of capital to shareholders: | | |
| Advisers Class | $ — | $ (595,669) |
| Class A | — | (2,607,488) |
| Class C | — | (131,406) |
| Class I | — | (13,935,767) |
| Total tax return of capital to shareholders | $ — | $ (17,270,330) |
| Transactions in shares of beneficial interest: | | |
| Advisers Class | $ (121,675,168) | $ (62,059,678) |
| Class A | (377,404,758) | (1,079,149,132) |
| Class C | (22,733,550) | (27,197,878) |
| Class I | (2,072,888,856) | (2,659,546,385) |
| Net decrease in net assets from Fund share transactions | $(2,594,702,332) | $ (3,827,953,073) |
| Net decrease in net assets | $(2,842,367,310) | $ (4,188,626,924) |
| Net Assets | | |
| At beginning of year | $ 5,891,562,362 | $10,080,189,286 |
| At end of year | $ 3,049,195,052 | $ 5,891,562,362 |
20
See Notes to Financial Statements.
Eaton Vance
Short Duration Government Income Fund
October 31, 2023
| | Advisers Class |
| | Year Ended October 31, | Period Ended
October 31, |
| | 2023 | 2022 | 2021 (1) |
| Net asset value — Beginning of period | $ 7.610 | $ 7.990 | $ 8.100 |
| Income (Loss) From Operations | | | |
| Net investment income(2) | $ 0.304 | $ 0.133 | $ 0.033 |
| Net realized and unrealized loss | (0.371) | (0.349) | (0.089) |
| Total loss from operations | $ (0.067) | $ (0.216) | $ (0.056) |
| Less Distributions | | | |
| From net investment income | $ (0.373) | $ (0.147) | $ (0.051) |
| Tax return of capital | — | (0.017) | (0.003) |
| Total distributions | $ (0.373) | $ (0.164) | $ (0.054) |
| Net asset value — End of period | $ 7.170 | $ 7.610 | $ 7.990 |
| Total Return(3) | (0.92)% | (2.73)% | (0.70)% (4) |
| Ratios/Supplemental Data | | | |
| Net assets, end of period (000’s omitted) | $72,272 | $201,056 | $276,067 |
| Ratios (as a percentage of average daily net assets): | | | |
| Expenses | 1.02% (5)(6) | 0.79% (5)(6) | 0.75% (7) |
| Net investment income | 4.08% | 1.69% | 0.90% (7) |
| Portfolio Turnover | 711% (8) | 798% (8) | 310% (8)(9) |
| (1) | For the period from the commencement of operations, May 17, 2021, to October 31, 2021. |
| (2) | Computed using average shares outstanding. |
| (3) | Returns are historical and are calculated by determining the percentage change in net asset value with all distributions reinvested. |
| (4) | Not annualized. |
| (5) | Includes a reduction by the investment adviser of a portion of its adviser fee due to the Fund's investment in the Liquidity Fund (equal to less than 0.005% and less than 0.01% of average daily net assets for the years ended October 31, 2023 and 2022, respectively). |
| (6) | Includes interest expense, including on reverse repurchase agreements, of 0.20% and 0.01% of average daily net assets for the years ended October 31, 2023 and 2022, respectively. |
| (7) | Annualized. |
| (8) | Includes the effect of To Be Announced (TBA) transactions. |
| (9) | For the year ended October 31, 2021. |
21
See Notes to Financial Statements.
Eaton Vance
Short Duration Government Income Fund
October 31, 2023
Financial Highlights — continued
| | Class A |
| | Year Ended October 31, |
| | 2023 | 2022 | 2021 | 2020 | 2019 |
| Net asset value — Beginning of year | $ 7.610 | $ 8.000 | $ 8.120 | $ 8.100 | $ 8.200 |
| Income (Loss) From Operations | | | | | |
| Net investment income(1) | $ 0.304 | $ 0.127 | $ 0.072 | $ 0.097 | $ 0.202 |
| Net realized and unrealized gain (loss) | (0.370) | (0.353) | (0.072) | 0.104 | (0.057) |
| Total income (loss) from operations | $ (0.066) | $ (0.226) | $ — | $ 0.201 | $ 0.145 |
| Less Distributions | | | | | |
| From net investment income | $ (0.374) | $ (0.147) | $ (0.114) | $ (0.166) | $ (0.245) |
| From net realized gain | — | — | — | (0.015) | — |
| Tax return of capital | — | (0.017) | (0.006) | — | — |
| Total distributions | $ (0.374) | $ (0.164) | $ (0.120) | $ (0.181) | $ (0.245) |
| Net asset value — End of year | $ 7.170 | $ 7.610 | $ 8.000 | $ 8.120 | $ 8.100 |
| Total Return(2) | (0.92)% | (2.85)% | (0.01)% | 2.51% | 1.78% |
| Ratios/Supplemental Data | | | | | |
| Net assets, end of year (000’s omitted) | $465,670 | $879,760 | $2,018,166 | $1,764,637 | $795,015 |
| Ratios (as a percentage of average daily net assets): | | | | | |
| Expenses | 1.02% (3)(4) | 0.79% (3)(4) | 0.77% | 0.82% (4) | 0.85% (4) |
| Net investment income | 4.07% | 1.61% | 0.89% | 1.19% | 2.47% |
| Portfolio Turnover | 711% (5) | 798% (5) | 310% (5) | 152% (5) | 59% |
| (1) | Computed using average shares outstanding. |
| (2) | Returns are historical and are calculated by determining the percentage change in net asset value with all distributions reinvested and do not reflect the effect of sales charges. |
| (3) | Includes a reduction by the investment adviser of a portion of its adviser fee due to the Fund's investment in the Liquidity Fund (equal to less than 0.005% and less than 0.01% of average daily net assets for the years ended October 31, 2023 and 2022, respectively). |
| (4) | Includes interest expense, including on reverse repurchase agreements, of 0.20%, 0.01%, 0.02% and 0.02% of average daily net assets for the years ended October 31, 2023, 2022, 2020 and 2019, respectively. |
| (5) | Includes the effect of To Be Announced (TBA) transactions. |
22
See Notes to Financial Statements.
Eaton Vance
Short Duration Government Income Fund
October 31, 2023
Financial Highlights — continued
| | Class C |
| | Year Ended October 31, |
| | 2023 | 2022 | 2021 | 2020 | 2019 |
| Net asset value — Beginning of year | $ 7.620 | $ 8.010 | $ 8.130 | $ 8.110 | $ 8.210 |
| Income (Loss) From Operations | | | | | |
| Net investment income(1) | $ 0.259 | $ 0.088 | $ 0.024 | $ 0.054 | $ 0.154 |
| Net realized and unrealized gain (loss) | (0.370) | (0.361) | (0.073) | 0.098 | (0.058) |
| Total income (loss) from operations | $ (0.111) | $ (0.273) | $ (0.049) | $ 0.152 | $ 0.096 |
| Less Distributions | | | | | |
| From net investment income | $ (0.329) | $ (0.104) | $ (0.067) | $ (0.117) | $ (0.196) |
| From net realized gain | — | — | — | (0.015) | — |
| Tax return of capital | — | (0.013) | (0.004) | — | — |
| Total distributions | $ (0.329) | $ (0.117) | $ (0.071) | $ (0.132) | $ (0.196) |
| Net asset value — End of year | $ 7.180 | $ 7.620 | $ 8.010 | $ 8.130 | $ 8.110 |
| Total Return(2) | (1.51)% | (3.43)% | (0.60)% | 1.89% | 1.18% |
| Ratios/Supplemental Data | | | | | |
| Net assets, end of year (000’s omitted) | $46,203 | $72,212 | $103,518 | $144,742 | $112,868 |
| Ratios (as a percentage of average daily net assets): | | | | | |
| Expenses | 1.62% (3)(4) | 1.39% (3)(4) | 1.37% | 1.42% (4) | 1.45% (4) |
| Net investment income | 3.47% | 1.11% | 0.30% | 0.67% | 1.88% |
| Portfolio Turnover | 711% (5) | 798% (5) | 310% (5) | 152% (5) | 59% |
| (1) | Computed using average shares outstanding. |
| (2) | Returns are historical and are calculated by determining the percentage change in net asset value with all distributions reinvested and do not reflect the effect of sales charges. |
| (3) | Includes a reduction by the investment adviser of a portion of its adviser fee due to the Fund's investment in the Liquidity Fund (equal to less than 0.005% and less than 0.01% of average daily net assets for the years ended October 31, 2023 and 2022, respectively). |
| (4) | Includes interest expense, including on reverse repurchase agreements, of 0.20%, 0.01%, 0.02% and 0.02% of average daily net assets for the years ended October 31, 2023, 2022, 2020 and 2019, respectively. |
| (5) | Includes the effect of To Be Announced (TBA) transactions. |
23
See Notes to Financial Statements.
Eaton Vance
Short Duration Government Income Fund
October 31, 2023
Financial Highlights — continued
| | Class I |
| | Year Ended October 31, |
| | 2023 | 2022 | 2021 | 2020 | 2019 |
| Net asset value — Beginning of year | $ 7.600 | $ 7.990 | $ 8.110 | $ 8.090 | $ 8.190 |
| Income (Loss) From Operations | | | | | |
| Net investment income(1) | $ 0.322 | $ 0.153 | $ 0.093 | $ 0.118 | $ 0.223 |
| Net realized and unrealized gain (loss) | (0.370) | (0.359) | (0.073) | 0.103 | (0.058) |
| Total income (loss) from operations | $ (0.048) | $ (0.206) | $ 0.020 | $ 0.221 | $ 0.165 |
| Less Distributions | | | | | |
| From net investment income | $ (0.392) | $ (0.165) | $ (0.133) | $ (0.186) | $ (0.265) |
| From net realized gain | — | — | — | (0.015) | — |
| Tax return of capital | — | (0.019) | (0.007) | — | — |
| Total distributions | $ (0.392) | $ (0.184) | $ (0.140) | $ (0.201) | $ (0.265) |
| Net asset value — End of year | $ 7.160 | $ 7.600 | $ 7.990 | $ 8.110 | $ 8.090 |
| Total Return(2) | (0.81)% | (2.49)% | 0.24% | 2.76% | 2.04% |
| Ratios/Supplemental Data | | | | | |
| Net assets, end of year (000’s omitted) | $2,465,050 | $4,738,534 | $7,682,437 | $6,765,473 | $3,605,659 |
| Ratios (as a percentage of average daily net assets): | | | | | |
| Expenses | 0.77% (3)(4) | 0.54% (3)(4) | 0.52% | 0.57% (4) | 0.60% (4) |
| Net investment income | 4.32% | 1.94% | 1.15% | 1.46% | 2.73% |
| Portfolio Turnover | 711% (5) | 798% (5) | 310% (5) | 152% (5) | 59% |
| (1) | Computed using average shares outstanding. |
| (2) | Returns are historical and are calculated by determining the percentage change in net asset value with all distributions reinvested. |
| (3) | Includes a reduction by the investment adviser of a portion of its adviser fee due to the Fund's investment in the Liquidity Fund (equal to less than 0.005% and less than 0.01% of average daily net assets for the years ended October 31, 2023 and 2022, respectively). |
| (4) | Includes interest expense, including on reverse repurchase agreements, of 0.20%, 0.01%, 0.02% and 0.02% of average daily net assets for the years ended October 31, 2023, 2022, 2020 and 2019, respectively. |
| (5) | Includes the effect of To Be Announced (TBA) transactions. |
24
See Notes to Financial Statements.
Eaton Vance
Short Duration Government Income Fund
October 31, 2023
Notes to Financial Statements
1 Significant Accounting Policies
Eaton Vance Short Duration Government Income Fund (the Fund) is a diversified series of Eaton Vance Mutual Funds Trust (the Trust). The Trust is a Massachusetts business trust registered under the Investment Company Act of 1940, as amended (the 1940 Act), as an open-end management investment company. The Fund’s investment objective is to seek total return. The Fund offers four classes of shares. Class A shares are generally sold subject to a sales charge imposed at time of purchase. Class C shares are sold at net asset value and are generally subject to a contingent deferred sales charge (see Note 5). Effective November 5, 2020, Class C shares automatically convert to Class A shares eight years after their purchase as described in the Fund’s prospectus. Advisers Class and Class I shares are sold at net asset value and are not subject to a sales charge. Each class represents a pro rata interest in the Fund, but votes separately on class-specific matters and (as noted below) is subject to different expenses. Realized and unrealized gains and losses are allocated daily to each class of shares based on the relative net assets of each class to the total net assets of the Fund. Net investment income, other than class-specific expenses, is allocated daily to each class of shares based upon the ratio of the value of each class’s paid shares to the total value of all paid shares. Each class of shares differs in its distribution plan and certain other class-specific expenses.
The following is a summary of significant accounting policies of the Fund. The policies are in conformity with accounting principles generally accepted in the United States of America (U.S. GAAP). The Fund is an investment company and follows accounting and reporting guidance in the Financial Accounting Standards Board (FASB) Accounting Standards Codification Topic 946.
A Investment Valuation—The following methodologies are used to determine the market value or fair value of investments.
Debt Obligations. Debt obligations are generally valued on the basis of valuations provided by third party pricing services, as derived from such services’ pricing models. Inputs to the models may include, but are not limited to, reported trades, executable bid and ask prices, broker/dealer quotations, prices or yields of securities with similar characteristics, interest rates, anticipated prepayments, benchmark curves or information pertaining to the issuer, as well as industry and economic events. The pricing services may use a matrix approach, which considers information regarding securities with similar characteristics to determine the valuation for a security. Short-term debt obligations purchased with a remaining maturity of sixty days or less for which a valuation from a third party pricing service is not readily available may be valued at amortized cost, which approximates fair value.
Derivatives. U.S. exchange-traded options are valued at the mean between the bid and ask prices at valuation time as reported by the Options Price Reporting Authority. Non-U.S. exchange-traded options and over-the-counter options are valued by a third party pricing service using techniques that consider factors including the value of the underlying instrument, the volatility of the underlying instrument and the period of time until option expiration. Futures contracts are valued at the closing settlement price established by the board of trade or exchange on which they are traded. Swaps and options on interest rate swaps (“swaptions”) are normally valued using valuations provided by a third party pricing service. Such pricing service valuations are based on the present value of fixed and projected floating rate cash flows over the term of the swap contract, and in the case of credit default swaps, based on credit spread quotations obtained from broker/dealers and expected default recovery rates determined by the pricing service using proprietary models. Future cash flows on swaps are discounted to their present value using swap rates provided by electronic data services or by broker/dealers. Alternatively, swaptions may be valued at the valuation provided by a broker/dealer (usually the counterparty to the option), so determined using similar techniques as those employed by the pricing service.
Other. Investments in management investment companies (including money market funds) that do not trade on an exchange are valued at the net asset value as of the close of each business day.
Fair Valuation. In connection with Rule 2a-5 of the 1940 Act, the Trustees have designated the Fund’s investment adviser as its valuation designee. Investments for which valuations or market quotations are not readily available or are deemed unreliable are valued by the investment adviser, as valuation designee, at fair value using methods that most fairly reflect the security’s “fair value”, which is the amount that the Fund might reasonably expect to receive for the security upon its current sale in the ordinary course. Each such determination is based on a consideration of relevant factors, which are likely to vary from one pricing context to another. These factors may include, but are not limited to, the type of security, the existence of any contractual restrictions on the security’s disposition, the price and extent of public trading in similar securities of the issuer or of comparable companies or entities, quotations or relevant information obtained from broker/dealers or other market participants, information obtained from the issuer, analysts, and/or the appropriate stock exchange (for exchange-traded securities), an analysis of the company’s or entity’s financial statements, and an evaluation of the forces that influence the issuer and the market(s) in which the security is purchased and sold.
B Investment Transactions—Investment transactions for financial statement purposes are accounted for on a trade date basis. Realized gains and losses on investments sold are determined on the basis of identified cost.
C Income—Interest income is recorded on the basis of interest accrued, adjusted for amortization of premium or accretion of discount. Dividend income is recorded on the ex-dividend date for dividends received in cash and/or securities.
D Federal Taxes—The Fund's policy is to comply with the provisions of the Internal Revenue Code applicable to regulated investment companies and to distribute to shareholders each year substantially all of its net investment income, and all or substantially all of its net realized capital gains. Accordingly, no provision for federal income or excise tax is necessary.
Eaton Vance
Short Duration Government Income Fund
October 31, 2023
Notes to Financial Statements — continued
As of October 31, 2023, the Fund had no uncertain tax positions that would require financial statement recognition, de-recognition, or disclosure. The Fund files a U.S. federal income tax return annually after its fiscal year-end, which is subject to examination by the Internal Revenue Service for a period of three years from the date of filing.
E Expenses—The majority of expenses of the Trust are directly identifiable to an individual fund. Expenses which are not readily identifiable to a specific fund are allocated taking into consideration, among other things, the nature and type of expense and the relative size of the funds.
F Use of Estimates—The preparation of the financial statements in conformity with U.S. GAAP requires management to make estimates and assumptions that affect the reported amounts of assets and liabilities at the date of the financial statements and the reported amounts of income and expense during the reporting period. Actual results could differ from those estimates.
G Indemnifications—Under the Trust’s organizational documents, its officers and Trustees may be indemnified against certain liabilities and expenses arising out of the performance of their duties to the Fund. Under Massachusetts law, if certain conditions prevail, shareholders of a Massachusetts business trust (such as the Trust) could be deemed to have personal liability for the obligations of the Trust. However, the Trust’s Declaration of Trust contains an express disclaimer of liability on the part of Fund shareholders and the By-laws provide that the Trust shall assume, upon request by the shareholder, the defense on behalf of any Fund shareholders. Moreover, the By-laws also provide for indemnification out of Fund property of any shareholder held personally liable solely by reason of being or having been a shareholder for all loss or expense arising from such liability. Additionally, in the normal course of business, the Fund enters into agreements with service providers that may contain indemnification clauses. The Fund's maximum exposure under these arrangements is unknown as this would involve future claims that may be made against the Fund that have not yet occurred.
H Futures Contracts —Upon entering into a futures contract, the Fund is required to deposit with the broker, either in cash or securities, an amount equal to a certain percentage of the contract amount (initial margin). Subsequent payments, known as variation margin, are made or received by the Fund each business day, depending on the daily fluctuations in the value of the underlying security, and are recorded as unrealized gains or losses by the Fund. Gains (losses) are realized upon the expiration or closing of the futures contracts. Should market conditions change unexpectedly, the Fund may not achieve the anticipated benefits of the futures contracts and may realize a loss. Futures contracts have minimal counterparty risk as they are exchange traded and the clearinghouse for the exchange is substituted as the counterparty, guaranteeing counterparty performance.
I Interest Rate Swaps—Swap contracts are privately negotiated agreements between the Fund and a counterparty. Certain swap contracts may be centrally cleared (“centrally cleared swaps”), whereby all payments made or received by the Fund pursuant to the contract are with a central clearing party (CCP) rather than the original counterparty. The CCP guarantees the performance of the original parties to the contract. Upon entering into centrally cleared swaps, the Fund is required to deposit with the CCP, either in cash or securities, an amount of initial margin determined by the CCP, which is subject to adjustment. Pursuant to interest rate swap agreements, the Fund either makes floating-rate payments to the counterparty (or CCP in the case of centrally cleared swaps) based on a benchmark interest rate in exchange for fixed-rate payments or the Fund makes fixed-rate payments to the counterparty (or CCP in the case of a centrally cleared swap) in exchange for payments on a floating benchmark interest rate. Payments received or made, including amortization of upfront payments/receipts, if any (which are amortized over the life of the swap contract), are recorded as realized gains or losses. During the term of the outstanding swap agreement, changes in the underlying value of the swap are recorded as unrealized gains or losses. For centrally cleared swaps, the daily change in valuation is recorded as a receivable or payable for variation margin and settled in cash with the CCP daily. The value of the swap is determined by changes in the relationship between two rates of interest. The Fund is exposed to credit loss in the event of non-performance by the swap counterparty. In the case of centrally cleared swaps, counterparty risk is minimal due to protections provided by the CCP. Risk may also arise from movements in interest rates.
J Credit Default Swaps—When the Fund is the buyer of a credit default swap contract, the Fund is entitled to receive the par (or other agreed-upon) value of a referenced debt obligation (or basket of debt obligations) from the counterparty (or CCP in the case of a centrally cleared swap) to the contract if a credit event by a third party, such as a U.S. or foreign corporate issuer or sovereign issuer, on the debt obligation occurs. In return, the Fund pays the counterparty a periodic stream of payments over the term of the contract provided that no credit event has occurred. If no credit event occurs, the Fund would have spent the stream of payments and received no proceeds from the contract. When the Fund is the seller of a credit default swap contract, it receives the stream of payments, but is obligated to pay to the buyer of the protection an amount up to the notional amount of the swap and in certain instances take delivery of securities of the reference entity upon the occurrence of a credit event, as defined under the terms of that particular swap agreement. Credit events are contract specific but may include bankruptcy, failure to pay, restructuring, obligation acceleration and repudiation/moratorium. If the Fund is a seller of protection and a credit event occurs, the maximum potential amount of future payments that the Fund could be required to make would be an amount equal to the notional amount of the agreement. This potential amount would be partially offset by any recovery value of the respective referenced obligation, or net amount received from the settlement of a buy protection credit default swap agreement entered into by the Fund for the same referenced obligation. As the seller, the Fund may create economic leverage to its portfolio because, in addition to its total net assets, the Fund is subject to investment exposure on the notional amount of the swap. The interest fee paid or received on the swap contract, which is based on a specified interest rate on a fixed notional amount, is accrued daily as a component of unrealized appreciation (depreciation) and is recorded as realized gain upon receipt or realized loss upon payment. The Fund also records an increase or decrease to unrealized appreciation (depreciation) in an amount equal to the daily valuation. For centrally cleared swaps, the daily change in valuation is recorded as a receivable or payable for variation margin and settled in cash with the CCP daily. All upfront payments and receipts, if any, are amortized over the life of the swap contract as realized gains or losses. Those upfront payments or receipts for non-centrally cleared swaps are recorded as other assets or other liabilities, respectively, net of amortization. For financial reporting purposes,
Eaton Vance
Short Duration Government Income Fund
October 31, 2023
Notes to Financial Statements — continued
unamortized upfront payments or receipts, if any, are netted with unrealized appreciation or depreciation on swap contracts to determine the
market value of swaps as presented in Notes 8 and 12. These transactions involve certain risks, including the risk that the seller may be unable to fulfill
the transaction. In the case of centrally cleared swaps, counterparty risk is minimal due to protections provided by the CCP.
K Written Options—Upon the writing of a call or a put option, the premium received by the Fund is included in the Statement of Assets and Liabilities as a liability. The amount of the liability is subsequently marked-to-market to reflect the current market value of the option written, in accordance with the Fund’s policies on investment valuations discussed above. Premiums received from writing options which expire are treated as realized gains. Premiums received from writing options which are exercised or are closed are added to or offset against the proceeds or amount paid on the transaction to determine the realized gain or loss. When an index option is exercised, the Fund is required to deliver an amount of cash determined by the excess of the exercise price of the option over the value of the index (in the case of a put) or the excess of the value of the index over the exercise price of the option (in the case of a call) at contract termination. If a put option on a security is exercised, the premium reduces the cost basis of the securities purchased by the Fund. The Fund, as a writer of an option, may have no control over whether the underlying securities or other assets may be sold (call) or purchased (put) and, as a result, bears the market risk of an unfavorable change in the price of the securities or other assets underlying the written option. The Fund may also bear the risk of not being able to enter into a closing transaction if a liquid secondary market does not exist.
L Purchased Options—Upon the purchase of a call or put option, the premium paid by the Fund is included in the Statement of Assets and Liabilities as an investment. The amount of the investment is subsequently marked-to-market to reflect the current market value of the option purchased, in accordance with the Fund’s policies on investment valuations discussed above. Premiums paid for purchasing options that expire are treated as realized losses. Premiums paid for purchasing options that are exercised or closed are added to the amounts paid or offset against the proceeds on the underlying investment transaction to determine the realized gain or loss. The risk associated with purchasing options is limited to the premium originally paid. Purchased options traded over-the-counter involve risk that the issuer or counterparty will fail to perform its contractual obligations.
M Swaptions—A purchased swaption contract grants the Fund, in return for payment of the purchase price, the right, but not the obligation, to enter into a new swap agreement or to shorten, extend, cancel or otherwise modify an existing swap agreement, at some designated future time on specified terms. When the Fund purchases a swaption, the premium paid to the writer is recorded as an investment and subsequently marked-to-market to reflect the current value of the swaption. A written swaption gives the Fund the obligation, if exercised by the purchaser, to enter into a swap contract according to the terms of the underlying agreement. When the Fund writes a swaption, the premium received by the Fund is recorded as a liability and subsequently marked-to-market to reflect the current value of the swaption. When a swaption is exercised, the cost of the swap is adjusted by the amount of the premium paid or received. When a swaption expires or an unexercised swaption is closed, a gain or loss is recognized in the amount of the premium paid or received, plus the cost to close. The Fund’s risk for purchased swaptions is limited to the premium paid. The writer of a swaption bears the risk of unfavorable changes in the preset terms of the underlying swap contract. Purchased swaptions traded over-the-counter involve risk that the issuer or counterparty will fail to perform its contractual obligations.
N When-Issued Securities and Delayed Delivery Transactions—The Fund may purchase securities on a delayed delivery, when-issued or forward commitment basis, including TBA (To Be Announced) securities. Payment and delivery may take place after the customary settlement period for that security. At the time the transaction is negotiated, the price of the security that will be delivered is fixed. Securities purchased on a delayed delivery, when-issued or forward commitment basis are marked-to-market daily and begin earning interest on settlement date. Such security purchases are subject to the risk that when delivered they will be worth less than the agreed upon payment price. Losses may also arise if the counterparty does not perform under the contract. A forward purchase commitment may also be closed by entering into an offsetting commitment. If an offsetting commitment is entered into, the Fund will realize a gain or loss on investments based on the price established when the Fund entered into the commitment.
O Forward Sale Commitments—The Fund may enter into forward sale commitments to sell generic U.S. government agency mortgage-backed securities to hedge its portfolio positions and/or to enhance return. The proceeds to be received from the forward sale commitment are recorded as an asset and a corresponding liability, which is subsequently valued at approximately the current market value of the underlying security in accordance with the Fund's policies on investment valuations discussed above. The Fund records an unrealized gain or loss on investments to the extent of the difference between the proceeds to be received and the value of the open forward sale commitment on the day of determination. If the forward sale commitment is closed through the acquisition of an offsetting purchase commitment or the delivery of securities, the Fund realizes a gain or loss on investments based on the price established when the Fund entered into the commitment. If the Fund enters into a forward sale commitment for the delivery of a security that it does not own or has the right to obtain, it is subject to the risk of loss if the purchase price to settle the commitment is higher than the price at which it was sold.
P Reverse Repurchase Agreements—Under a reverse repurchase agreement, the Fund temporarily transfers possession of a portfolio security to another party, such as a bank or broker/dealer, in return for cash. At the same time, the Fund agrees to repurchase the security at an agreed upon time and price, which reflects an interest payment. In periods of increased demand for a security, the Fund may receive a payment from the counterparty for the use of the security, which is recorded as interest income. Because the Fund retains effective control over the transferred security, the transaction is accounted for as a secured borrowing. The Fund may enter into such agreements when it believes it is able to invest the cash acquired at a rate higher than the cost of the agreement, which would increase earned income. When the Fund enters into a reverse repurchase agreement, any fluctuations in the market value of either the securities transferred to another party or the securities in which the proceeds may be invested would affect the market value of the Fund’s assets. Because reverse repurchase agreements may be considered to be the practical equivalent of borrowing funds (and the counterparty making a loan), they constitute a form of leverage. The Fund segregates cash or liquid assets equal to its obligation to repurchase the security. During the term of the agreement,
Eaton Vance
Short Duration Government Income Fund
October 31, 2023
Notes to Financial Statements — continued
the Fund may also be obligated to pledge additional cash and/or securities in the event of a decline in the fair value of the transferred security. In the event the counterparty to a reverse repurchase agreement becomes insolvent, recovery of the security transferred by the Fund may be delayed or the Fund may incur a loss equal to the amount by which the value of the security transferred by the Fund exceeds the repurchase price payable by the Fund.
Q Stripped Mortgage-Backed Securities—The Fund may invest in Interest Only (IO) and Principal Only (PO) securities, a form of stripped mortgage-
backed securities, whereby the IO security receives all the interest and the PO security receives all the principal on a pool of mortgage assets. The yield to maturity on an IO security is extremely sensitive to the rate of principal payments (including prepayments) on the related underlying mortgage assets, and a rapid rate of principal payments may have a material adverse effect on the yield to maturity from these securities. If the underlying mortgages experience greater than anticipated prepayments of principal, the Fund may fail to recoup its initial investment in an IO security. The market value of IO and PO securities can be unusually volatile due to changes in interest rates.
2 Distributions to Shareholders and Income Tax Information
The Fund declares dividends daily to shareholders of record at the time of declaration. Distributions are generally paid monthly. Distributions of realized capital gains are made at least annually. Distributions are declared separately for each class of shares. Shareholders may reinvest income and capital gain distributions in additional shares of the same class of the Fund at the net asset value as of the reinvestment date or, at the election of the shareholder, receive distributions in cash. Distributions to shareholders are determined in accordance with income tax regulations, which may differ from U.S. GAAP. As required by U.S. GAAP, only distributions in excess of tax basis earnings and profits are reported in the financial statements as a return of capital. Permanent differences between book and tax accounting relating to distributions are reclassified to paid-in capital. For tax purposes, distributions from short-term capital gains are considered to be from ordinary income.
The tax character of distributions declared for the years ended October 31, 2023 and October 31, 2022 was as follows:
| | Year Ended October 31, |
| | 2023 | 2022 |
| Ordinary income | $232,962,182 | $154,149,448 |
| Tax return of capital | $ — | $ 17,270,330 |
During the year ended October 31, 2023, accumulated loss was increased by $702,726 and paid-in capital was increased by $702,726 due to the Fund’s use of equalization accounting. Tax equalization accounting allows the Fund to treat as a distribution that portion of redemption proceeds representing a redeeming shareholder’s portion of undistributed taxable income and net capital gains. These reclassifications had no effect on the net assets or net asset value per share of the Fund.
As of October 31, 2023, the components of distributable earnings (accumulated loss) on a tax basis were as follows:
| Undistributed ordinary income | $ 10,797,795 |
| Deferred capital losses | (639,105,694) |
| Net unrealized depreciation | (179,904,803) |
| Distributions payable | (1,185,494) |
| Accumulated loss | $(809,398,196) |
At October 31, 2023, the Fund, for federal income tax purposes, had deferred capital losses of $639,105,694 which would reduce its taxable income arising from future net realized gains on investment transactions, if any, to the extent permitted by the Internal Revenue Code, and thus would reduce the amount of distributions to shareholders, which would otherwise be necessary to relieve the Fund of any liability for federal income or excise tax. The deferred capital losses are treated as arising on the first day of the Fund’s next taxable year and retain the same short-term or long-term character as when originally deferred. Of the deferred capital losses at October 31, 2023, $475,193,344 are short-term and $163,912,350 are long-term.
Eaton Vance
Short Duration Government Income Fund
October 31, 2023
Notes to Financial Statements — continued
The cost and unrealized appreciation (depreciation) of investments, including open derivative contracts and TBA sale commitments, of the Fund at October 31, 2023, as determined on a federal income tax basis, were as follows:
| Aggregate cost | $4,059,626,857 |
| Gross unrealized appreciation | $ 422,001,418 |
| Gross unrealized depreciation | (601,906,221) |
| Net unrealized depreciation | $ (179,904,803) |
3 Investment Adviser Fee and Other Transactions with Affiliates
The investment adviser fee is earned by Boston Management and Research (BMR), an indirect, wholly-owned subsidiary of Morgan Stanley, as compensation for investment advisory services rendered to the Fund. The investment adviser fee is computed at an annual rate as a percentage of the Fund’s average daily net assets as follows and is payable monthly:
| Average Daily Net Assets | Annual Fee Rate |
| Up to $1 billion | 0.5000% |
| $1 billion but less than $2.5 billion | 0.4750% |
| $2.5 billion but less than $5 billion | 0.4550% |
| $5 billion but less than $10 billion | 0.4400% |
| $10 billion but less than $15 billion | 0.4300% |
| $15 billion but less than $20 billion | 0.4225% |
| $20 billion and over | 0.4175% |
Pursuant to an amendment to the investment advisory agreement dated April 29, 2022, BMR contractually agreed to reduce its investment advisory fee rate on average daily net assets of $10 billion and over from 0.4400% to the rates as stated above. This contractual reduction cannot be terminated or reduced without Trustee and shareholder approval. For the year ended October 31, 2023, the Fund’s investment adviser fee amounted to $21,288,148 or 0.47% of the Fund’s average daily net assets. The Fund may invest in a money market fund, the Institutional Class of the Morgan Stanley Institutional Liquidity Funds - Government Portfolio (the “Liquidity Fund”), an open-end management investment company managed by Morgan Stanley Investment Management Inc., a wholly-owned subsidiary of Morgan Stanley. The investment adviser fee paid by the Fund is reduced by an amount equal to its pro rata share of the advisory and administration fees paid by the Fund due to its investment in the Liquidity Fund. For the year ended October 31, 2023, the investment adviser fee paid was reduced by $117,120 relating to the Fund's investment in the Liquidity Fund.
Eaton Vance Management (EVM), an affiliate of BMR, serves as the administrator of the Fund, but receives no compensation. EVM provides sub-transfer agency and related services to the Fund pursuant to a Sub-Transfer Agency Support Services Agreement. For the year ended October 31, 2023, EVM earned $56,628 from the Fund pursuant to such agreement, which is included in transfer and dividend disbursing agent fees on the Statement of Operations. The Fund was informed that Eaton Vance Distributors, Inc. (EVD), an affiliate of EVM and the Fund’s principal underwriter, received $3,175 as its portion of the sales charge on sales of Class A shares for the year ended October 31, 2023. EVD also received distribution and service fees from Class A and Class C shares (see Note 4) and contingent deferred sales charges (see Note 5).
Trustees and officers of the Fund who are members of EVM’s or BMR’s organizations receive remuneration for their services to the Fund out of the investment adviser fee. Trustees of the Fund who are not affiliated with the investment adviser may elect to defer receipt of all or a percentage of their annual fees in accordance with the terms of the Trustees Deferred Compensation Plan. Certain officers and Trustees of the Fund are officers of the above organizations.
Eaton Vance
Short Duration Government Income Fund
October 31, 2023
Notes to Financial Statements — continued
4 Distribution Plans
The Fund has in effect distribution plans for the Advisers Class shares and Class A shares (Advisers/Class A Plan) pursuant to Rule 12b-1 under the 1940 Act. Pursuant to the Advisers/Class A Plan, the Fund pays EVD a distribution and service fee of 0.25% per annum of its average daily net assets attributable to Advisers Class shares and Class A shares for distribution services and facilities provided to the Fund by EVD, as well as for personal services and/or the maintenance of shareholder accounts. Distribution and service fees paid or accrued to EVD for the year ended October 31, 2023 amounted to $332,504 for Advisers Class shares and $1,661,212 for Class A shares. The Fund also has in effect a distribution plan for Class C shares (Class C Plan) pursuant to Rule 12b-1 under the 1940 Act. Pursuant to the Class C Plan, the Fund pays EVD amounts equal to 0.60% per annum of its average daily net assets attributable to Class C shares for providing ongoing distribution services and facilities to the Fund. For the year ended October 31, 2023, the Fund paid or accrued to EVD $347,322 for Class C shares.
Pursuant to the Class C Plan, the Fund also makes payments of service fees to EVD, financial intermediaries and other persons in amounts equal to 0.25% per annum of its average daily net assets attributable to Class C shares. Service fees paid or accrued are for personal services and/or the maintenance of shareholder accounts. They are separate and distinct from the sales commissions and distribution fees payable to EVD. Service fees paid or accrued for the year ended October 31, 2023 amounted to $144,717 for Class C shares.
Distribution and service fees are subject to the limitations contained in the Financial Industry Regulatory Authority Rule 2341(d).
5 Contingent Deferred Sales Charges
A contingent deferred sales charge (CDSC) of 1% generally is imposed on redemptions of Class C shares made within 12 months of purchase. Class A shares may be subject to a 0.25% CDSC if redeemed within 12 months of purchase (depending on the circumstances of purchase). Generally, the CDSC is based upon the lower of the net asset value at date of redemption or date of purchase. No charge is levied on shares acquired by reinvestment of dividends or capital gain distributions. For the year ended October 31, 2023, the Fund was informed that EVD received $5,191 of CDSCs paid by Class C shareholders and no CDSCs paid by Class A shareholders.
6 Purchases and Sales of Investments
Purchases and sales of investments (all U.S. Government and Agency Securities), other than short-term obligations and including maturities, paydowns and TBA transactions, aggregated $38,754,969,204 and $39,908,433,282, respectively, for the year ended October 31, 2023.
7 Shares of Beneficial Interest
The Fund’s Declaration of Trust permits the Trustees to issue an unlimited number of full and fractional shares of beneficial interest (without par value). Such shares may be issued in a number of different series (such as the Fund) and classes. Transactions in Fund shares, including direct exchanges pursuant to share class conversions, were as follows:
| | Year Ended
October 31, 2023 | | Year Ended
October 31, 2022 |
| | Shares | Amount | | Shares | Amount |
| Advisers Class | | | | | |
| Sales | 751,922 | $ 5,607,351 | | 20,487,425 | $ 162,612,808 |
| Issued to shareholders electing to receive payments of distributions in Fund shares | 883,097 | 6,569,182 | | 730,097 | 5,701,996 |
| Redemptions | (17,977,151) | (133,851,701) | | (29,325,327) | (230,374,482) |
| Net decrease | (16,342,132) | $ (121,675,168) | | (8,107,805) | $ (62,059,678) |
| Class A | | | | | |
| Sales | 9,417,867 | $ 70,367,415 | | 38,308,816 | $ 302,540,513 |
| Issued to shareholders electing to receive payments of distributions in Fund shares | 4,222,390 | 31,383,669 | | 3,220,325 | 25,211,768 |
| Redemptions | (64,269,169) | (479,155,842) | | (178,238,891) | (1,406,901,413) |
| Net decrease | (50,628,912) | $ (377,404,758) | | (136,709,750) | $(1,079,149,132) |
Eaton Vance
Short Duration Government Income Fund
October 31, 2023
Notes to Financial Statements — continued
| | Year Ended
October 31, 2023 | | Year Ended
October 31, 2022 |
| | Shares | Amount | | Shares | Amount |
| Class C | | | | | |
| Sales | 1,046,897 | $ 7,842,288 | | 2,240,137 | $ 17,655,395 |
| Issued to shareholders electing to receive payments of distributions in Fund shares | 335,044 | 2,491,954 | | 156,626 | 1,222,521 |
| Redemptions | (4,420,691) | (33,067,792) | | (5,847,025) | (46,075,794) |
| Net decrease | (3,038,750) | $ (22,733,550) | | (3,450,262) | $ (27,197,878) |
| Class I | | | | | |
| Sales | 213,618,713 | $ 1,600,523,672 | | 484,037,962 | $ 3,809,561,374 |
| Issued to shareholders electing to receive payments of distributions in Fund shares | 22,907,274 | 170,137,449 | | 15,149,682 | 118,325,821 |
| Redemptions | (515,577,977) | (3,843,549,977) | | (837,429,151) | (6,587,433,580) |
| Net decrease | (279,051,990) | $(2,072,888,856) | | (338,241,507) | $(2,659,546,385) |
8 Financial Instruments
The Fund may trade in financial instruments with off-balance sheet risk in the normal course of its investing activities. These financial instruments may include futures contracts, written swaptions and swap contracts and may involve, to a varying degree, elements of risk in excess of the amounts recognized for financial statement purposes. The notional or contractual amounts of these instruments represent the investment the Fund has in particular classes of financial instruments and do not necessarily represent the amounts potentially subject to risk. The measurement of the risks associated with these instruments is meaningful only when all related and offsetting transactions are considered. A summary of obligations under these financial instruments at October 31, 2023 is included in the Portfolio of Investments. At October 31, 2023, the Fund had sufficient cash and/or securities to cover commitments under these contracts.
In the normal course of pursuing its investment objective, the Fund is subject to the following risks:
Interest Rate Risk: Because the Fund holds fixed-rate bonds, the value of these bonds may decrease if interest rates rise. The Fund utilizes futures contracts and interest rate swaps and swaptions to enhance total return, to change the overall duration of the Fund and/or to hedge against fluctuations in securities prices due to changes in interest rates.
Credit Risk: The Fund enters into credit default swap contracts to manage certain investment risks and/or to enhance total return.
The Fund enters into over-the-counter (OTC) derivatives that may contain provisions whereby the counterparty may terminate the contract under certain conditions, including but not limited to a decline in the Fund’s net assets below a certain level over a certain period of time, which would trigger a payment by the Fund for those derivatives in a liability position. At October 31, 2023, the fair value of derivatives with credit-related contingent features in a net liability position was $216,409. The aggregate fair value of assets pledged as collateral by the Fund for such liability was $230,000 at October 31, 2023.
The OTC derivatives in which the Fund invests (except for written options and swaptions as the Fund, not the counterparty, is obligated to perform) are subject to the risk that the counterparty to the contract fails to perform its obligations under the contract. To mitigate this risk, the Fund has entered into an International Swaps and Derivatives Association, Inc. Master Agreement (“ISDA Master Agreement”) or similar agreement with substantially all its derivative counterparties. An ISDA Master Agreement is a bilateral agreement between the Fund and a counterparty that governs certain OTC derivatives and typically contains, among other things, set-off provisions in the event of a default and/or termination event as defined under the relevant ISDA Master Agreement. Under an ISDA Master Agreement, the Fund may, under certain circumstances, offset with the counterparty certain derivative financial instruments’ payables and/or receivables with collateral held and/or posted and create one single net payment. The provisions of the ISDA Master Agreement typically permit a single net payment in the event of default including the bankruptcy or insolvency of the counterparty. However, bankruptcy or insolvency laws of a particular jurisdiction may impose restrictions on or prohibitions against the right of offset in bankruptcy or insolvency. Certain ISDA Master Agreements allow counterparties to OTC derivatives to terminate derivative contracts prior to maturity in the event the Fund’s net assets decline by a stated percentage or the Fund fails to meet the terms of its ISDA Master Agreements, which would cause the counterparty to accelerate payment by the Fund of any net liability owed to it.
The collateral requirements for derivatives traded under an ISDA Master Agreement are governed by a Credit Support Annex to the ISDA Master Agreement. Collateral requirements are determined at the close of business each day and are typically based on changes in market values for each transaction under an ISDA Master Agreement and netted into one amount for such agreement. Generally, the amount of collateral due from or to a counterparty is subject to a
Eaton Vance
Short Duration Government Income Fund
October 31, 2023
Notes to Financial Statements — continued
minimum transfer threshold amount before a transfer is required, which may vary by counterparty. Collateral pledged for the benefit of the Fund and/or counterparty is held in segregated accounts by the Fund’s custodian and cannot be sold, re-pledged, assigned or otherwise used while pledged. The portion of such collateral representing cash, if any, is reflected as deposits for derivatives collateral and, in the case of cash pledged by a counterparty for the benefit of the Fund, a corresponding liability on the Statement of Assets and Liabilities. Securities pledged by the Fund as collateral, if any, are identified as such in the Portfolio of Investments. The carrying amount of the liability for cash collateral due to brokers at October 31, 2023 approximated its fair value. If measured at fair value, such liability would have been considered as Level 2 in the fair value hierarchy (see Note 12) at October 31, 2023.
The fair value of open derivative instruments (not considered to be hedging instruments for accounting disclosure purposes) and whose primary underlying risk exposure is interest rate risk at October 31, 2023 was as follows:
| | Fair Value |
| Derivative | Asset Derivative | Liability Derivative |
| Written swaptions | $ — | $ (216,409)(1) |
| Futures contracts | 8,964,969 (2) | (9,764,485) (2) |
| Swap contracts (centrally cleared) | 376,090,848 (2) | — |
| Total | $385,055,817 | $(9,980,894) |
| Derivatives not subject to master netting or similar agreements | $385,055,817 | $(9,764,485) |
| Total Derivatives subject to master netting or similar agreements | $ — | $ (216,409) |
| (1) | Statement of Assets and Liabilities location: Written swaptions outstanding, at value. |
| (2) | Only the current day’s variation margin on open futures contracts and centrally cleared swap contracts is reported within the Statement of Assets and Liabilities as Receivable or Payable for variation margin on open futures contracts and centrally cleared swap contracts, as applicable. |
The Fund’s derivative assets and liabilities at fair value by type, which are reported gross in the Statement of Assets and Liabilities, are presented in the table above. The following table presents the Fund’s derivative liabilities by counterparty, net of amounts available for offset under a master netting agreement and net of the related collateral pledged by the Fund for such liabilities as of October 31, 2023.
| Counterparty | Derivative
Liabilities Subject to
Master Netting
Agreement | Derivatives
Available
for Offset | Non-cash
Collateral
Pledged(a) | Cash
Collateral
Pledged(a) | Net Amount
of Derivative
Liabilities(b) |
| Bank of America, N.A. | $(216,409) | $ — | $ — | $216,409 | $ — |
| (a) | In some instances, the total collateral received and/or pledged may be more than the amount shown due to overcollateralization. |
| (b) | Net amount represents the net amount payable to the counterparty in the event of default. |
Eaton Vance
Short Duration Government Income Fund
October 31, 2023
Notes to Financial Statements — continued
The effect of derivative instruments (not considered to be hedging instruments for accounting disclosure purposes) on the Statement of Operations by risk exposure for the year ended October 31, 2023 was as follows:
| Risk | Derivative | Realized Gain (Loss)
on Derivatives Recognized
in Income | Change in Unrealized
Appreciation (Depreciation) on
Derivatives Recognized in Income |
| Credit | Swap contracts | $(18,205,082) (1) | $ 11,934,966(2) |
| Interest Rate | Purchased swaptions | (4,173,982) (3) | (37,045,118) (4) |
| Interest Rate | Written options and swaptions | 13,154,617 (5) | 7,295,392 (6) |
| Interest Rate | Futures contracts | 19,483,826 (7) | (100,385,149) (8) |
| Interest Rate | Swap contracts | 70,102,962 (1) | 114,171,309 (2) |
| Total | $ 80,362,341 | $ (4,028,600) |
| (1) | Statement of Operations location: Net realized gain (loss): Swap contracts. |
| (2) | Statement of Operations location: Change in unrealized appreciation (depreciation): Swap contracts. |
| (3) | Statement of Operations location: Net realized gain (loss): Investment transactions. |
| (4) | Statement of Operations location: Change in unrealized appreciation (depreciation): Investments. |
| (5) | Statement of Operations location: Net realized gain (loss): Written options and swaptions. |
| (6) | Statement of Operations location: Change in unrealized appreciation (depreciation): Written options and swaptions. |
| (7) | Statement of Operations location: Net realized gain (loss): Futures contracts. |
| (8) | Statement of Operations location: Change in unrealized appreciation (depreciation): Futures contracts. |
The average notional cost of futures contracts and average notional amounts of other derivative contracts outstanding during the year ended October 31, 2023, which are indicative of the volume of these derivative types, were approximately as follows:
Futures
Contracts — Long | Futures
Contracts — Short | Purchased
Swaptions | Written Options
and Swaptions | Swap
Contracts |
| $675,401,000 | $542,591,000 | $374,460,000 | $667,611,000 | $1,786,000,000 |
9 Line of Credit
The Fund participates with other portfolios and funds managed by BMR and its affiliates in a $650 million unsecured revolving line of credit agreement with a group of banks, which is in effect through October 22, 2024. In connection with the renewal of the agreement on October 24, 2023, the borrowing limit was decreased from $725 million. Borrowings are made by the Fund solely for temporary purposes related to redemptions and other short-term cash needs. Interest is charged to the Fund based on its borrowings at an amount above either the Secured Overnight Financing Rate (SOFR) or Federal Funds rate. In addition, a fee computed at an annual rate of 0.15% on the daily unused portion of the line of credit is allocated among the participating portfolios and funds at the end of each quarter. In connection with the renewal of the agreement in October 2023, an arrangement fee totaling $150,000 was incurred that was allocated to the participating portfolios and funds. Because the line of credit is not available exclusively to the Fund, it may be unable to borrow some or all of its requested amounts at any particular time. The Fund did not have any significant borrowings or allocated fees during the year ended October 31, 2023.
Eaton Vance
Short Duration Government Income Fund
October 31, 2023
Notes to Financial Statements — continued
10 Reverse Repurchase Agreements
Reverse repurchase agreements outstanding as of October 31, 2023 were as follows:
| Counterparty | Trade
Date | Maturity
Date | Interest
Rate Paid
(Received) | Principal
Amount | Value
Including
Accrued
Interest |
| BMO Capital Markets Corp. | 7/26/23 | 11/3/23 | 5.50% | $ 18,105,124 | $ 18,373,432 |
| BMO Capital Markets Corp. | 10/30/23 | On Demand(1) | 5.50 | 16,523,836 | 16,528,885 |
| Total | | | | $34,628,960 | $34,902,317 |
| (1) | Open reverse repurchase agreement with no specific maturity date. Either party may terminate the agreement upon demand. |
At October 31, 2023, the type of securities pledged as collateral for all open reverse repurchase agreements was U.S. Government Agency Mortgage-
Backed Securities.
The Fund also pledged $1,470,000 to BMO Capital Markets Corp. as additional collateral for its reverse repurchase obligations.
For the year ended October 31, 2023, the average borrowings under settled reverse repurchase agreements and the average interest rate paid were approximately $162,630,000 and 5.20%, respectively. Based on the short-term nature of the borrowings under the reverse repurchase agreements, the carrying value of the payable for reverse repurchase agreements approximated its fair value at October 31, 2023. If measured at fair value, borrowings under the reverse repurchase agreements would have been considered as Level 2 in the fair value hierarchy (see Note 12) at October 31, 2023.
Reverse repurchase agreements entered into by the Fund are subject to Master Repurchase Agreements (MRA), which permit the Fund, under certain circumstances, including an event of default (such as bankruptcy or insolvency), to offset payables and/or receivables under the MRA with collateral held and/or posted to the counterparty and create one single net payment due to or from the Fund.
The following table presents the Fund’s reverse repurchase agreements net of amounts available for offset under an MRA and net of the related collateral pledged by the Fund as of October 31, 2023.
| Counterparty | Reverse
Repurchase
Agreements* | Assets
Available for
Offset | Securities
Collateral
Pledged(a) | Net
Amount(b) |
| BMO Capital Markets Corp. | $(34,902,317) | $ — | $34,902,317 | $ — |
| * | Including accrued interest. |
| (a) | In some instances, the total collateral pledged may be more than the amount shown due to overcollateralization. |
| (b) | Net amount represents the net amount payable to the counterparty in the event of default. |
11 Affiliated Investments
At October 31, 2023, the value of the Fund's investment in funds that may be deemed to be affiliated was $5,892,398, which represents 0.2% of the Fund's net assets. Transactions in such investments by the Fund for the year ended October 31, 2023 were as follows:
| Name | Value,
beginning
of period | Purchases | Sales
proceeds | Net
realized
gain (loss) | Change in
unrealized
appreciation
(depreciation) | Value, end
of period | Dividend
income | Shares,
end of period |
| Short-Term Investments |
| Liquidity Fund | $40,759,128 | $3,426,333,702 | $(3,461,200,432) | $ — | $ — | $5,892,398 | $3,522,671 | 5,892,398 |
Eaton Vance
Short Duration Government Income Fund
October 31, 2023
Notes to Financial Statements — continued
12 Fair Value Measurements
Under generally accepted accounting principles for fair value measurements, a three-tier hierarchy to prioritize the assumptions, referred to as inputs, is used in valuation techniques to measure fair value. The three-tier hierarchy of inputs is summarized in the three broad levels listed below.
| • | Level 1 – quoted prices in active markets for identical investments |
| • | Level 2 – other significant observable inputs (including quoted prices for similar investments, interest rates, prepayment speeds, credit risk, etc.) |
| • | Level 3 – significant unobservable inputs (including a fund's own assumptions in determining the fair value of investments) |
In cases where the inputs used to measure fair value fall in different levels of the fair value hierarchy, the level disclosed is determined based on the lowest level input that is significant to the fair value measurement in its entirety. The inputs or methodology used for valuing securities are not necessarily an indication of the risk associated with investing in those securities.
At October 31, 2023, the hierarchy of inputs used in valuing the Fund’s investments and open derivative instruments, which are carried at fair value, were as follows:
| Asset Description | Level 1 | Level 2 | Level 3 | Total |
| Collateralized Mortgage Obligations | $ — | $ 1,377,985,697 | $ — | $ 1,377,985,697 |
| U.S. Department of Agriculture Loans | — | 42,797,003 | — | 42,797,003 |
| U.S. Government Agency Commercial Mortgage-Backed Securities | — | 16,682,067 | — | 16,682,067 |
| U.S. Government Agency Mortgage-Backed Securities | — | 2,334,006,368 | — | 2,334,006,368 |
| U.S. Government Guaranteed Small Business Administration Pools & Loans | — | 144,954,788 | — | 144,954,788 |
| Short-Term Investments | 5,892,398 | — | — | 5,892,398 |
| Total Investments | $ 5,892,398 | $ 3,916,425,923 | $ — | $ 3,922,318,321 |
| Futures Contracts | $ 8,964,969 | $ — | $ — | $ 8,964,969 |
| Swap Contracts | — | 376,090,848 | — | 376,090,848 |
| Total | $ 14,857,367 | $ 4,292,516,771 | $ — | $ 4,307,374,138 |
| Liability Description | | | | |
| TBA Sale Commitments | $ — | $ (367,742,798) | $ — | $ (367,742,798) |
| Written Interest Rate Swaptions | — | (216,409) | — | (216,409) |
| Futures Contracts | (9,764,485) | — | — | (9,764,485) |
| Total | $ (9,764,485) | $ (367,959,207) | $ — | $ (377,723,692) |
Eaton Vance
Short Duration Government Income Fund
October 31, 2023
Report of Independent Registered Public Accounting Firm
To the Trustees of Eaton Vance Mutual Funds Trust and Shareholders of Eaton Vance Short Duration Government Income Fund:
Opinion on the Financial Statements and Financial Highlights
We have audited the accompanying statement of assets and liabilities of Eaton Vance Short Duration Government Income Fund (the “Fund”) (one of the funds constituting Eaton Vance Mutual Funds Trust), including the portfolio of investments, as of October 31, 2023, the related statement of operations for the year then ended, the statements of changes in net assets for each of the two years in the period then ended, the financial highlights for each of the five years in the period then ended, and the related notes. In our opinion, the financial statements and financial highlights present fairly, in all material respects, the financial position of the Fund as of October 31, 2023, and the results of its operations for the year then ended, the changes in its net assets for each of the two years in the period then ended, and the financial highlights for each of the five years in the period then ended, in conformity with accounting principles generally accepted in the United States of America.
Basis for Opinion
These financial statements and financial highlights are the responsibility of the Fund's management. Our responsibility is to express an opinion on the Fund's financial statements and financial highlights based on our audits. We are a public accounting firm registered with the Public Company Accounting Oversight Board (United States) (PCAOB) and are required to be independent with respect to the Fund in accordance with the U.S. federal securities laws and the applicable rules and regulations of the Securities and Exchange Commission and the PCAOB.
We conducted our audits in accordance with the standards of the PCAOB. Those standards require that we plan and perform the audit to obtain reasonable assurance about whether the financial statements and financial highlights are free of material misstatement, whether due to error or fraud. The Fund is not required to have, nor were we engaged to perform, an audit of its internal control over financial reporting. As part of our audits, we are required to obtain an understanding of internal control over financial reporting but not for the purpose of expressing an opinion on the effectiveness of the Fund’s internal control over financial reporting. Accordingly, we express no such opinion.
Our audits included performing procedures to assess the risks of material misstatement of the financial statements and financial highlights, whether due to error or fraud, and performing procedures that respond to those risks. Such procedures included examining, on a test basis, evidence regarding the amounts and disclosures in the financial statements and financial highlights. Our audits also included evaluating the accounting principles used and significant estimates made by management, as well as evaluating the overall presentation of the financial statements and financial highlights. Our procedures included confirmation of securities owned as of October 31, 2023, by correspondence with the custodian and brokers; when replies were not received from brokers, we performed other auditing procedures. We believe that our audits provide a reasonable basis for our opinion.
/s/ Deloitte & Touche LLP
Boston, Massachusetts
December 22, 2023
We have served as the auditor of one or more Eaton Vance investment companies since 1959.
Eaton Vance
Short Duration Government Income Fund
October 31, 2023
Federal Tax Information (Unaudited)
The Form 1099-DIV you receive in February 2024 will show the tax status of all distributions paid to your account in calendar year 2023. Shareholders are advised to consult their own tax adviser with respect to the tax consequences of their investment in the Fund. As required by the Internal Revenue Code and/or regulations, shareholders must be notified regarding the status of 163(j) interest dividends.
163(j) Interest Dividends. For the fiscal year ended October 31, 2023, the Fund designates 86.81% of distributions from net investment income as a 163(j) interest dividend.
Eaton Vance
Short Duration Government Income Fund
October 31, 2023
Board of Trustees’ Contract Approval
Overview of the Contract Review Process
The Investment Company Act of 1940, as amended (the “1940 Act”), provides, in substance, that the investment advisory agreement between a fund and its investment adviser will continue in effect from year-to-year only if its continuation is approved on an annual basis by a vote of the fund’s board of trustees, including a majority of the trustees who are not “interested persons” of the fund (“independent trustees”), cast in person at a meeting called for the purpose of considering such approval.
At a meeting held on June 8, 2023, the Boards of Trustees/Directors (collectively, the “Board”) that oversee the registered investment companies advised by Eaton Vance Management or its affiliate, Boston Management and Research (the “Eaton Vance Funds”), including a majority of the independent trustees (the “Independent Trustees”), voted to approve the continuation of existing investment advisory agreements and sub-advisory agreements1 for each of the Eaton Vance Funds for an additional one-year period. The Board relied upon the affirmative recommendation of its Contract Review Committee, which is a committee exclusively comprised of Independent Trustees. Prior to making its recommendation, the Contract Review Committee reviewed information furnished by the adviser and sub-adviser to each of the Eaton Vance Funds (including information specifically requested by the Board) for a series of formal meetings held between April and June 2023, as well as certain additional information provided in response to specific requests from the Independent Trustees as members of the Contract Review Committee. Members of the Contract Review Committee also considered information received at prior meetings of the Board and its committees, to the extent such information was relevant to the Contract Review Committee’s annual evaluation of the investment advisory agreements and sub-advisory agreements.
In connection with its evaluation of the investment advisory agreements and sub-advisory agreements, the Board considered various information relating to the Eaton Vance Funds. This included information applicable to all or groups of Eaton Vance Funds, which is referenced immediately below, and information applicable to the particular Eaton Vance Fund covered by this report (each “Eaton Vance Fund” is referred to below as a “fund”). (For funds that invest through one or more underlying portfolios, references to “each fund” in this section may include information that was considered at the portfolio-level.)
Information about Fees, Performance and Expenses
• A report from an independent data provider comparing advisory and other fees paid by each fund to such fees paid by comparable funds, as identified by the independent data provider (“comparable funds”);
• A report from an independent data provider comparing each fund’s total expense ratio (and its components) to those of comparable funds;
• A report from an independent data provider comparing the investment performance of each fund (including, as relevant, total return data, income data, Sharpe ratios and information ratios) to the investment performance of comparable funds and, as applicable, benchmark indices, over various time periods;
• In certain instances, data regarding investment performance relative to customized groups of peer funds and blended indices identified by the adviser in consultation with the Portfolio Management Committee of the Board (a committee exclusively comprised of Independent Trustees);
• Comparative information concerning the fees charged and services provided by the adviser and sub-adviser to each fund in managing other accounts (which may include other mutual funds, collective investment funds and institutional accounts) using investment strategies and techniques similar to those used in managing such fund(s), if any;
• Profitability analyses with respect to the adviser and sub-adviser to each of the funds;
Information about Portfolio Management and Trading
• Descriptions of the investment management services provided to each fund, as well as each of the funds’ investment strategies and policies;
• The procedures and processes used to determine the value of fund assets, including, when necessary, the determination of “fair value” and actions taken to monitor and test the effectiveness of such procedures and processes;
• Information about the policies and practices of each fund’s adviser and sub-adviser with respect to trading, including their processes for seeking best execution of portfolio transactions;
• Information about the allocation of brokerage transactions and the benefits, if any, received by the adviser and sub-adviser to each fund as a result of brokerage allocation, including, as applicable, information concerning the acquisition of research through client commission arrangements and policies with respect to “soft dollars”;
• Data relating to the portfolio turnover rate of each fund and related information regarding active management in the context of particular strategies;
Information about each Adviser and Sub-adviser
• Reports detailing the financial results and condition of the adviser and sub-adviser to each fund;
• Information regarding the individual investment professionals whose responsibilities include portfolio management and investment research for the funds, and, for portfolio managers and certain other investment professionals, information relating to their responsibilities with respect to managing other mutual funds and investment accounts, as applicable;
1 Not all Eaton Vance Funds have entered into a sub-advisory agreement with a sub-adviser. Accordingly, references to “sub-adviser” or “sub-advisory agreement” in this “Overview” section may not be applicable to the particular Eaton Vance Fund covered by this report.
Eaton Vance
Short Duration Government Income Fund
October 31, 2023
Board of Trustees’ Contract Approval — continued
• Information regarding the adviser’s and its parent company’s (Morgan Stanley’s) efforts to retain and attract talented investment professionals, including in the context of a competitive marketplace for talent, as well as the ongoing unique environment presented by hybrid, remote and other alternative work arrangements;
• Information regarding the adviser’s compensation methodology for its investment professionals and the incentives and accountability it creates, along with investment professionals’ investments in the fund(s) they manage;
• The Code of Ethics of the adviser and its affiliates and the sub-adviser of each fund, together with information relating to compliance with, and the administration of, such codes;
• Policies and procedures relating to proxy voting, including regular reporting with respect to fund proxy voting activities;
• Information regarding the handling of corporate actions and class actions, as well as information regarding litigation and other regulatory matters;
• Information concerning the resources devoted to compliance efforts undertaken by the adviser and its affiliates and the sub-adviser of each fund, if any, including descriptions of their various compliance programs and their record of compliance;
• Information concerning the business continuity and disaster recovery plans of the adviser and its affiliates and the sub-adviser of each fund, if any;
• A description of Eaton Vance Management’s and Boston Management and Research’s oversight of sub-advisers, including with respect to regulatory and compliance issues, investment management and other matters;
Other Relevant Information
• Information regarding ongoing initiatives to further integrate and harmonize, where applicable, the investment management and other departments of the adviser and its affiliates with the overall investment management infrastructure of Morgan Stanley, in light of Morgan Stanley’s acquisition of Eaton Vance Corp. on March 1, 2021;
• Information concerning the nature, cost and character of the administrative and other non-investment advisory services provided by Eaton Vance Management and its affiliates;
• Information concerning oversight of the relationship with the custodian, subcustodians, fund accountants, and other third-party service providers by the adviser and/or administrator to each of the funds;
• Information concerning efforts to implement policies and procedures with respect to various recently adopted regulations applicable to the funds, including Rule 12d1-4 (the Fund-of-Funds Rule), Rule 18f-4 (the Derivatives Rule) and Rule 2a-5 (the Fair Valuation Rule);
• For an Eaton Vance Fund structured as an exchange-listed closed-end fund, information concerning the benefits of the closed-end fund structure, as well as, where relevant, the closed-end fund’s market prices (including as compared to the closed-end fund’s net asset value (NAV)), trading volume data, continued use of auction preferred shares (where applicable), distribution rates and other relevant matters;
• The risks which the adviser and/or its affiliates incur in connection with the management and operation of the funds, including, among others, litigation, regulatory, entrepreneurial, and other business risks (and the associated costs of such risks); and
• The terms of each investment advisory agreement and sub-advisory agreement.
During the various meetings of the Board and its committees over the course of the year leading up to the June 8, 2023 meeting, the Board received information from portfolio managers and other investment professionals of the advisers and sub-advisers of the funds regarding investment and performance matters, and considered various investment and trading strategies used in pursuing the funds’ investment objectives. The Board also received information regarding risk management techniques employed in connection with the management of the funds. The Board and its committees evaluated issues pertaining to industry and regulatory developments, compliance procedures, fund governance and other issues with respect to the funds, and received and participated in reports and presentations provided by Eaton Vance Management, Boston Management and Research and fund sub-advisers, with respect to such matters. In addition to the formal meetings of the Board and its committees, the Independent Trustees held regular teleconferences to discuss, among other topics, matters relating to the continuation of investment advisory agreements and sub-advisory agreements.
The Contract Review Committee was advised throughout the contract review process by Goodwin Procter LLP, independent legal counsel for the Independent Trustees. The members of the Contract Review Committee, with the advice of such counsel, exercised their own business judgment in determining the material factors to be considered in evaluating each investment advisory agreement and sub-advisory agreement and the weight to be given to each such factor. The conclusions reached with respect to each investment advisory agreement and sub-advisory agreement were based on a comprehensive evaluation of all the information provided and not any single factor. Moreover, each member of the Contract Review Committee may have placed varying emphasis on particular factors in reaching conclusions with respect to each investment advisory agreement and sub-advisory agreement. In evaluating each investment advisory agreement and sub-advisory agreement, including the fee structures and other terms contained in such agreements, the members of the Contract Review Committee were also informed by multiple years of analysis and discussion with the adviser and sub-adviser to each of the Eaton Vance Funds.
Results of the Contract Review Process
Based on its consideration of the foregoing, and such other information it deemed relevant, including the factors and conclusions described below, the Contract Review Committee concluded that the continuation of the investment advisory and administrative agreement between Eaton Vance Short Duration Government Income Fund (the “Fund”) and Boston Management and Research (the “Adviser”), including its fee structure, is in the interests of shareholders and, therefore, recommended to the Board approval of the agreement. Based on the recommendation of the Contract Review Committee, the Board, including a majority of the Independent Trustees, voted to approve continuation of the investment advisory and administrative agreement for the Fund.
Eaton Vance
Short Duration Government Income Fund
October 31, 2023
Board of Trustees’ Contract Approval — continued
Nature, Extent and Quality of Services
In considering whether to approve the investment advisory agreement for the Fund, the Board evaluated the nature, extent and quality of services provided to the Fund by the Adviser.
The Board considered the Adviser’s management capabilities and investment processes in light of the types of investments held by the Fund, including the education, experience and number of investment professionals and other personnel who provide portfolio management, investment research, and similar services to the Fund. In particular, the Board considered the abilities and experience of the Adviser’s investment professionals in analyzing special considerations relevant to investing in investment grade and other income securities, including in investing in securities issued, backed or otherwise guaranteed by the U.S. government. The Board also took into account the resources dedicated to portfolio management and other services, the compensation methods of the Adviser and other factors, including the reputation and resources of the Adviser to recruit and retain highly qualified research, advisory and supervisory investment professionals. In addition, the Board considered the time and attention devoted to the Eaton Vance Funds, including the Fund, by senior management, as well as the infrastructure, operational capabilities and support staff in place to assist in the portfolio management and operations of the Fund, including the provision of administrative services. The Board also considered the business-related and other risks to which the Adviser or its affiliates may be subject in managing the Fund.
The Board considered the compliance programs of the Adviser and relevant affiliates thereof. The Board considered compliance and reporting matters regarding, among other things, personal trading by investment professionals, disclosure of portfolio holdings, late trading, frequent trading, portfolio valuation, business continuity and the allocation of investment opportunities. The Board also considered the responses of the Adviser and its affiliates to requests in recent years from regulatory authorities, such as the Securities and Exchange Commission and the Financial Industry Regulatory Authority.
The Board considered other administrative services provided or overseen by Eaton Vance Management and its affiliates, including transfer agency and accounting services. The Board evaluated the benefits to shareholders of investing in a fund that is a part of a large fund complex offering exposure to a variety of asset classes and investment disciplines, as well as the ability, in many cases, to exchange an investment among different funds without incurring additional sales charges.
After consideration of the foregoing factors, among others, the Board concluded that the nature, extent and quality of services provided by the Adviser, taken as a whole, are appropriate and consistent with the terms of the investment advisory agreement.
Fund Performance
The Board compared the Fund’s investment performance to that of comparable funds identified by an independent data provider (the peer group), as well as an appropriate benchmark index and a custom peer group of similarly managed funds. The Board’s review included comparative performance data with respect to the Fund for the one-, three-, five- and ten-year periods ended December 31, 2022. In this regard, the Board noted that the performance of the Fund was consistent with the median performance of the Fund’s custom peer group and lower than the median performance of the Fund’s peer group for the three-year period. The Board also noted that the performance of the Fund was lower than its benchmark index for the three-year period. The Board concluded that the performance of the Fund was satisfactory.
Management Fees and Expenses
The Board considered contractual fee rates payable by the Fund for advisory and administrative services (referred to collectively as “management fees”). As part of its review, the Board considered the Fund’s management fees and total expense ratio for the one-year period ended December 31, 2022, as compared to those of comparable funds, before and after giving effect to any undertaking to waive fees or reimburse expenses. The Board also considered certain factors identified by management in response to inquiries from the Contract Review Committee regarding the Fund’s total expense ratio relative to comparable funds.
After considering the foregoing information, and in light of the nature, extent and quality of the services provided by the Adviser, the Board concluded that the management fees charged for advisory and related services are reasonable.
Profitability and “Fall-Out” Benefits
The Board considered the level of profits realized by the Adviser and relevant affiliates thereof in providing investment advisory and administrative services to the Fund and to all Eaton Vance Funds as a group. The Board considered the level of profits realized without regard to marketing support or other payments by the Adviser and its affiliates to third parties in respect of distribution or other services.
The Board concluded that, in light of the foregoing factors and the nature, extent and quality of the services rendered, the profits realized by the Adviser and its affiliates are deemed not to be excessive.
The Board also considered direct or indirect fall-out benefits received by the Adviser and its affiliates in connection with their respective relationships with the Fund, including the benefits of research services that may be available to the Adviser as a result of securities transactions effected for the Fund and other investment advisory clients.
Eaton Vance
Short Duration Government Income Fund
October 31, 2023
Board of Trustees’ Contract Approval — continued
Economies of Scale
In reviewing management fees and profitability, the Board also considered the extent to which the Adviser and its affiliates, on the one hand, and the Fund, on the other hand, can expect to realize benefits from economies of scale as the assets of the Fund increase. The Board acknowledged the difficulty in accurately measuring the benefits resulting from economies of scale, if any, with respect to the management of any specific fund or group of funds. The Board reviewed data summarizing the increases and decreases in the assets of the Fund and of all Eaton Vance Funds as a group over various time periods, and evaluated the extent to which the total expense ratio of the Fund and the profitability of the Adviser and its affiliates may have been affected by such increases or decreases. Based upon the foregoing, the Board concluded that the Fund currently shares in the benefits from economies of scale, if any, when they are realized by the Adviser. The Board also concluded that the structure of the advisory fee, which includes breakpoints at several asset levels, will allow the Fund to continue to benefit from any economies of scale in the future.
Eaton Vance
Short Duration Government Income Fund
October 31, 2023
Liquidity Risk Management Program
The Fund has implemented a written liquidity risk management program (Program) and related procedures to manage its liquidity in accordance with Rule 22e-4 under the Investment Company Act of 1940, as amended (Liquidity Rule). The Liquidity Rule defines “liquidity risk” as the risk that a fund could not meet requests to redeem shares issued by the fund without significant dilution of the remaining investors’ interests in the fund. The Fund’s Board of Trustees/Directors has designated the investment adviser to serve as the administrator of the Program and the related procedures. The administrator has established a Liquidity Risk Management Oversight Committee (Committee) to perform the functions necessary to administer the Program. As part of the Program, the administrator is responsible for identifying illiquid investments and categorizing the relative liquidity of the Fund’s investments in accordance with the Liquidity Rule. Under the Program, the administrator assesses, manages, and periodically reviews the Fund’s liquidity risk, and is responsible for making certain reports to the Fund’s Board of Trustees/Directors and the Securities and Exchange Commission (SEC) regarding the liquidity of the Fund’s investments, and to notify the Board of Trustees/Directors and the SEC of certain liquidity events specified in the Liquidity Rule. The liquidity of the Fund’s portfolio investments is determined based on a number of factors including, but not limited to, relevant market, trading and investment-specific considerations under the Program.
At a meeting of the Fund’s Board of Trustees/Directors on June 7, 2023, the Committee provided a written report to the Fund’s Board of Trustees/
Directors pertaining to the operation, adequacy, and effectiveness of implementation of the Program, as well as the operation of the highly liquid investment minimum (if applicable) for the period January 1, 2022 through December 31, 2022 (Review Period). The Program operated effectively during the Review Period, supporting the administrator’s ability to assess, manage and monitor Fund liquidity risk, including during periods of market volatility and net redemptions. During the Review Period, the Fund met redemption requests on a timely basis.
There can be no assurance that the Program will achieve its objectives in the future. Please refer to the Fund’s prospectus for more information regarding the Fund’s exposure to liquidity risk and other principal risks to which an investment in the Fund may be subject.
Eaton Vance
Short Duration Government Income Fund
October 31, 2023
Management and Organization
Fund Management. The Trustees of Eaton Vance Mutual Funds Trust (the Trust) are responsible for the overall management and supervision of the Trust's affairs. The Board members and officers of the Trust are listed below. Except as indicated, each individual has held the office shown or other offices in the same company for the last five years. Board members hold indefinite terms of office. Each Trustee holds office until his or her successor is elected and qualified, subject to a prior death, resignation, retirement, disqualification or removal. Under the terms of the Fund’s current Trustee retirement policy, an Independent Trustee must retire and resign as a Trustee on the earlier of: (i) the first day of July following his or her 74th birthday; or (ii), with limited exception, December 31st of the 20th year in which he or she has served as a Trustee. However, if such retirement and resignation would cause the Fund to be out of compliance with Section 16 of the 1940 Act or any other regulations or guidance of the SEC, then such retirement and resignation will not become effective until such time as action has been taken for the Fund to be in compliance therewith. The “noninterested Trustees” consist of those Trustees who are not “interested persons” of the Trust, as that term is defined under the 1940 Act. The business address of each Board member and officer is Two International Place, Boston, Massachusetts 02110. As used below, “BMR” refers to Boston Management and Research, “EV” refers to EV LLC, “EVM” refers to Eaton Vance Management, “MSIM" refers to Morgan Stanley Investment Management Inc. and “EVD” refers to Eaton Vance Distributors, Inc. EV is the trustee of each of EVM and BMR. Each of EVM, BMR, EVD and EV are indirect, wholly owned subsidiaries of Morgan Stanley. Each officer affiliated with EVM may hold a position with other EVM affiliates that is comparable to his or her position with EVM listed below. Each Trustee oversees
127 funds in the Eaton Vance fund complex (including both funds and portfolios in a hub and spoke structure).
| Name and Year of Birth | Trust
Position(s) | Length of Service | Principal Occupation(s) and Other Directorships
During Past Five Years and Other Relevant Experience |
| Interested Trustee |
Anchal Pachnanda(1)
1980 | Trustee | Since 2023 | Co-Head of Strategy of MSIM (since 2019). Formerly, Head of Strategy of MSIM (2017-2019). Ms. Pachnanda is an interested person because of her position with MSIM, which is an affiliate of the Trust.
Other Directorships. None. |
| Noninterested Trustees |
Alan C. Bowser
1962 | Trustee | Since 2022 | Private investor. Formerly, Chief Diversity Officer, Partner and a member of the Operating Committee, and formerly served as Senior Advisor on Diversity and Inclusion for the firm’s chief executive officer, Co-Head of the Americas Region, and Senior Client Advisor of Bridgewater Associates, an asset management firm (2011- 2023).
Other Directorships. Independent Director of Stout Risius Ross (a middle market professional services advisory firm) (since 2021). |
Mark R. Fetting
1954 | Trustee | Since 2016 | Private investor. Formerly held various positions at Legg Mason, Inc. (investment management firm) (2000-2012), including President, Chief Executive Officer, Director and Chairman (2008-2012), Senior Executive Vice President (2004-2008) and Executive Vice President (2001-2004). Formerly, President of Legg Mason family of funds (2001-2008). Formerly, Division President and Senior Officer of Prudential Financial Group, Inc. and related companies (investment management firm) (1991-2000).
Other Directorships. None. |
Cynthia E. Frost
1961 | Trustee | Since 2014 | Private investor. Formerly, Chief Investment Officer of Brown University (university endowment) (2000-2012). Formerly, Portfolio Strategist for Duke Management Company (university endowment manager) (1995-2000). Formerly, Managing Director, Cambridge Associates (investment consulting company) (1989-1995). Formerly, Consultant, Bain and Company (management consulting firm) (1987-1989). Formerly, Senior Equity Analyst, BA Investment Management Company (1983-1985).
Other Directorships. None. |
George J. Gorman
1952 | Chairperson of the
Board and Trustee | Since 2021
(Chairperson) and 2014 (Trustee) | Principal at George J. Gorman LLC (consulting firm). Formerly, Senior Partner at Ernst & Young LLP (a registered public accounting firm) (1974-2009).
Other Directorships. None. |
Eaton Vance
Short Duration Government Income Fund
October 31, 2023
Management and Organization — continued
| Name and Year of Birth | Trust
Position(s) | Length of Service | Principal Occupation(s) and Other Directorships
During Past Five Years and Other Relevant Experience |
| Noninterested Trustees (continued) |
Valerie A. Mosley
1960 | Trustee | Since 2014 | Chairwoman and Chief Executive Officer of Valmo Ventures (a consulting and investment firm). Founder of Upward Wealth, Inc., dba BrightUp, a fintech platform. Formerly, Partner and Senior Vice President, Portfolio Manager and Investment Strategist at Wellington Management Company, LLP (investment management firm) (1992-2012). Formerly, Chief Investment Officer, PG Corbin Asset Management (1990-1992). Formerly worked in institutional corporate bond sales at Kidder Peabody (1986-1990).
Other Directorships. Director of DraftKings, Inc. (digital sports entertainment and gaming company) (since September 2020). Director of Envestnet, Inc. (provider of intelligent systems for wealth management and financial wellness) (since 2018). Formerly, Director of Dynex Capital, Inc. (mortgage REIT) (2013-2020) and Director of Groupon, Inc. (e-commerce provider) (2020-2022). |
Keith Quinton
1958 | Trustee | Since 2018 | Private investor, researcher and lecturer. Formerly, Independent Investment Committee Member at New Hampshire Retirement System (2017-2021). Formerly, Portfolio Manager and Senior Quantitative Analyst at Fidelity Investments (investment management firm) (2001-2014).
Other Directorships. Formerly, Director (2016-2021) and Chairman (2019-2021) of New Hampshire Municipal Bond Bank. |
Marcus L. Smith
1966 | Trustee | Since 2018 | Private investor and independent corporate director. Formerly, Chief Investment Officer, Canada (2012-2017), Chief Investment Officer, Asia (2010-2012), Director of Asian Research (2004-2010) and portfolio manager (2001-2017) at MFS Investment Management (investment management firm).
Other Directorships. Director of First Industrial Realty Trust, Inc. (an industrial REIT) (since 2021). Director of MSCI Inc. (global provider of investment decision support tools) (since 2017). Formerly, Director of DCT Industrial Trust Inc. (logistics real estate company) (2017-2018). |
Susan J. Sutherland
1957 | Trustee | Since 2015 | Private investor. Director of Ascot Group Limited and certain of its subsidiaries (insurance and reinsurance) (since 2017). Formerly, Director of Hagerty Holding Corp. (insurance) (2015-2018) and Montpelier Re Holdings Ltd. (insurance and reinsurance) (2013-2015). Formerly, Associate, Counsel and Partner at Skadden, Arps, Slate, Meagher & Flom LLP (law firm) (1982-2013).
Other Directorships. Formerly, Director of Kairos Acquisition Corp. (insurance/InsurTech acquisition company) (2021-2023). |
Scott E. Wennerholm
1959 | Trustee | Since 2016 | Private investor. Formerly, Trustee at Wheelock College (postsecondary institution) (2012-2018). Formerly, Consultant at GF Parish Group (executive recruiting firm) (2016-2017). Formerly, Chief Operating Officer and Executive Vice President at BNY Mellon Asset Management (investment management firm) (2005-2011). Formerly, Chief Operating Officer and Chief Financial Officer at Natixis Global Asset Management (investment management firm) (1997-2004). Formerly, Vice President at Fidelity Investments Institutional Services (investment management firm) (1994-1997).
Other Directorships. None. |
Nancy A. Wiser
1967 | Trustee | Since 2022 | Formerly, Executive Vice President and the Global Head of Operations at Wells Fargo Asset Management (2011-2021).
Other Directorships. None. |
| Name and Year of Birth | Trust
Position(s) | Length of Service | Principal Occupation(s)
During Past Five Years |
| Principal Officers who are not Trustees |
Kenneth A. Topping
1966 | President | Since 2023 | Vice President and Chief Administrative Officer of EVM and BMR and Chief Operating Officer for Public Markets at MSIM. Also Vice President of Calvert Research and Management (“CRM”) since 2021. Formerly, Chief Operating Officer for Goldman Sachs Asset Management ‘Classic’ (2009-2020). |
Deidre E. Walsh
1971 | Vice President and Chief
Legal Officer | Since 2009 | Vice President of EVM and BMR. Also Vice President of CRM. |
James F. Kirchner
1967 | Treasurer | Since 2007 | Vice President of EVM and BMR. Also Vice President of CRM. |
Eaton Vance
Short Duration Government Income Fund
October 31, 2023
Management and Organization — continued
| Name and Year of Birth | Trust
Position(s) | Length of Service | Principal Occupation(s)
During Past Five Years |
| Principal Officers who are not Trustees (continued) |
Nicholas S. Di Lorenzo
1987 | Secretary | Since 2022 | Formerly, associate (2012-2021) and counsel (2022) at Dechert LLP. |
Richard F. Froio
1968 | Chief Compliance
Officer | Since 2017 | Vice President of EVM and BMR since 2017. Formerly, Deputy Chief Compliance Officer (Adviser/Funds) and Chief Compliance Officer (Distribution) at PIMCO (2012-2017) and Managing Director at BlackRock/Barclays Global Investors (2009-2012). |
(1) Ms. Pachnanda began serving as Trustee effective April 1, 2023.
The SAI for the Fund includes additional information about the Trustees and officers of the Fund and can be obtained without charge on Eaton Vance’s website at www.eatonvance.com or by calling 1-800-262-1122.
| FACTS | WHAT DOES EATON VANCE DO WITH YOUR
PERSONAL INFORMATION? |
| Why? | Financial companies choose how they share your personal information. Federal law gives consumers the right to limit some but not all sharing. Federal law also requires us to tell you how we collect, share, and protect your personal information. Please read this notice carefully to understand what we do. |
| |
| What? | The types of personal information we collect and share depend on the product or service you have with us. This information can include:■ Social Security number and income
■ investment experience and risk tolerance
■ checking account number and wire transfer instructions |
| |
| How? | All financial companies need to share customers’ personal information to run their everyday business. In the section below, we list the reasons financial companies can share their customers’ personal information; the reasons Eaton Vance chooses to share; and whether you can limit this sharing. |
Reasons we can share your
personal information | Does Eaton Vance
share? | Can you limit
this sharing? |
| For our everyday business purposes — such as to process your transactions, maintain your account(s), respond to court orders and legal investigations, or report to credit bureaus | Yes | No |
| For our marketing purposes — to offer our products and services to you | Yes | No |
| For joint marketing with other financial companies | No | We don’t share |
| For our investment management affiliates’ everyday business purposes — information about your transactions, experiences, and creditworthiness | Yes | Yes |
| For our affiliates’ everyday business purposes — information about your transactions and experiences | Yes | No |
| For our affiliates’ everyday business purposes — information about your creditworthiness | No | We don’t share |
| For our investment management affiliates to market to you | Yes | Yes |
| For our affiliates to market to you | No | We don’t share |
| For nonaffiliates to market to you | No | We don’t share |
To limit our
sharing | Call toll-free 1-800-262-1122 or email: EVPrivacy@eatonvance.comPlease note:If you are a new customer, we can begin sharing your information 30 days from the date we sent this notice. When you are no longer our customer, we continue to share your information as described in this notice. However, you can contact us at any time to limit our sharing. |
| Questions? | Call toll-free 1-800-262-1122 or email: EVPrivacy@eatonvance.com |
| Privacy Notice — continued | April 2021 |
| Who we are |
| Who is providing this notice? | Eaton Vance Management, Eaton Vance Distributors, Inc., Eaton Vance Trust Company, Eaton Vance Management (International) Limited, Eaton Vance Advisers International Ltd., Eaton Vance Global Advisors Limited, Eaton Vance Management’s Real Estate Investment Group, Boston Management and Research, Calvert Research and Management, Eaton Vance and Calvert Fund Families and our investment advisory affiliates (“Eaton Vance”) (see Investment Management Affiliates definition below) |
| What we do |
How does Eaton Vance
protect my personal
information? | To protect your personal information from unauthorized access and use, we use security measures that comply with federal law. These measures include computer safeguards and secured files and buildings. We have policies governing the proper handling of customer information by personnel and requiring third parties that provide support to adhere to appropriate security standards with respect to such information. |
How does Eaton Vance
collect my personal
information? | We collect your personal information, for example, when you■ open an account or make deposits or withdrawals from your account
■ buy securities from us or make a wire transfer
■ give us your contact informationWe also collect your personal information from others, such as credit bureaus, affiliates, or other companies. |
| Why can’t I limit all sharing? | Federal law gives you the right to limit only■ sharing for affiliates’ everyday business purposes — information about your creditworthiness
■ affiliates from using your information to market to you
■ sharing for nonaffiliates to market to youState laws and individual companies may give you additional rights to limit sharing. See below for more on your rights under state law. |
| Definitions |
Investment Management
Affiliates | Eaton Vance Investment Management Affiliates include registered investment advisers, registered broker- dealers, and registered and unregistered funds. Investment Management Affiliates does not include entities associated with Morgan Stanley Wealth Management, such as Morgan Stanley Smith Barney LLC and Morgan Stanley & Co. |
| Affiliates | Companies related by common ownership or control. They can be financial and nonfinancial companies.■ Our affiliates include companies with a Morgan Stanley name and financial companies such as Morgan Stanley Smith Barney LLC and Morgan Stanley & Co. |
| Nonaffiliates | Companies not related by common ownership or control. They can be financial and nonfinancial companies.■ Eaton Vance does not share with nonaffiliates so they can market to you. |
| Joint marketing | A formal agreement between nonaffiliated financial companies that together market financial products or services to you.■ Eaton Vance doesn’t jointly market. |
| Other important information |
| Vermont: Except as permitted by law, we will not share personal information we collect about Vermont residents with Nonaffiliates unless you provide us with your written consent to share such information.California: Except as permitted by law, we will not share personal information we collect about California residents with Nonaffiliates and we will limit sharing such personal information with our Affiliates to comply with California privacy laws that apply to us. |
Delivery of Shareholder Documents. The Securities and Exchange Commission (SEC) permits funds to deliver only one copy of shareholder documents, including prospectuses, proxy statements and shareholder reports, to fund investors with multiple accounts at the same residential or post office box address. This practice is often called “householding” and it helps eliminate duplicate mailings to shareholders. Eaton Vance, or your financial intermediary, may household the mailing of your documents indefinitely unless you instruct Eaton Vance, or your financial intermediary, otherwise. If you would prefer that your Eaton Vance documents not be householded, please contact Eaton Vance at 1-800-262-1122, or contact your financial intermediary. Your instructions that householding not apply to delivery of your Eaton Vance documents will typically be effective within 30 days of receipt by Eaton Vance or your financial intermediary.
Portfolio Holdings. Each Eaton Vance Fund and its underlying Portfolio(s) (if applicable) files a schedule of portfolio holdings on Part F to Form N-PORT with the SEC. Certain information filed on Form N-PORT may be viewed on the Eaton Vance website at www.eatonvance.com, by calling Eaton Vance at 1-800-262-1122 or in the EDGAR database on the SEC’s website at www.sec.gov.
Proxy Voting. From time to time, funds are required to vote proxies related to the securities held by the funds. The Eaton Vance Funds or their underlying Portfolios (if applicable) vote proxies according to a set of policies and procedures approved by the Funds’ and Portfolios’ Boards. You may obtain a description of these policies and procedures and information on how the Funds or Portfolios voted proxies relating to portfolio securities during the most recent 12-month period ended June 30, without charge, upon request, by calling 1-800-262-1122 and by accessing the SEC’s website at www.sec.gov.
Tailored Shareholder Reports. Effective January 24, 2023, the SEC adopted rule and form amendments to require open-end mutual funds and ETFs to transmit concise and visually engaging streamlined annual and semiannual reports to shareholders that highlight key information. Other information, including financial statements, will no longer appear in a streamlined shareholder report but must be available online, delivered free of charge upon request, and filed on a semiannual basis on Form N-CSR. The rule and form amendments have a compliance date of July 24, 2024. At this time, management is evaluating the impact of these amendments on the shareholder reports for the Eaton Vance Funds.
Investment Adviser
Boston Management and Research
Two International Place
Boston, MA 02110
Administrator
Eaton Vance Management
Two International Place
Boston, MA 02110
Principal Underwriter*
Eaton Vance Distributors, Inc.
Two International Place
Boston, MA 02110
(617) 482-8260
Custodian
State Street Bank and Trust Company
One Congress Street, Suite 1
Boston, MA 02114-2016
Transfer Agent
BNY Mellon Investment Servicing (US) Inc.
Attn: Eaton Vance Funds
P.O. Box 534439
Pittsburgh, PA 15253-4439
(800) 262-1122
Independent Registered Public Accounting Firm
Deloitte & Touche LLP
200 Berkeley Street
Boston, MA 02116-5022
Fund Offices
Two International Place
Boston, MA 02110
* FINRA BrokerCheck. Investors may check the background of their Investment Professional by contacting the Financial Industry Regulatory Authority (FINRA). FINRA BrokerCheck is a free tool to help investors check the professional background of current and former FINRA-registered securities firms and brokers. FINRA BrokerCheck is available by calling 1-800-289-9999 and at www.FINRA.org. The FINRA BrokerCheck brochure describing this program is available to investors at www.FINRA.org.
Eaton Vance
Global Macro Absolute Return Advantage Fund
Annual Report
October 31, 2023
Commodity Futures Trading Commission Registration. The Commodity Futures Trading Commission (“CFTC”) has adopted regulations that subject registered investment companies and advisers to regulation by the CFTC if a fund invests more than a prescribed level of its assets in certain CFTC-regulated instruments (including futures, certain options and swap agreements) or markets itself as providing investment exposure to such instruments. The adviser is registered with the CFTC as a commodity pool operator with respect to its management of the Fund. As the commodity pool operator of the Fund, the adviser has claimed relief under the Commodity Exchange Act from certain reporting and recordkeeping requirements. The adviser is also registered as a commodity trading advisor.
Fund shares are not insured by the FDIC and are not deposits or other obligations of, or guaranteed by, any depository institution. Shares are subject to investment risks, including possible loss of principal invested.
This report must be preceded or accompanied by a current summary prospectus or prospectus. Before investing, investors should consider carefully the investment objective, risks, and charges and expenses of a mutual fund. This and other important information is contained in the summary prospectus and prospectus, which can be obtained from a financial intermediary. Prospective investors should read the prospectus carefully before investing. For further information, please call 1-800-262-1122.
Annual Report October 31, 2023
Eaton Vance
Global Macro Absolute Return Advantage Fund
Eaton Vance
Global Macro Absolute Return Advantage Fund
October 31, 2023
Management’s Discussion of Fund Performance†
Economic and Market Conditions
The world’s financial markets posted broad gains for the 12-month period ended October 31, 2023. During the period, inflation moderated in many countries, the U.S. economy outperformed expectations, and credit spreads generally tightened. These and other positive dynamics overshadowed concerns about rising global bond yields and heightened geopolitical tensions, including renewed conflict in the Middle East.
The U.S. Federal Reserve (the Fed) raised short-term interest rates during the period, and the cumulative effects of the monetary tightening cycle that began in March 2022 helped reduce U.S. inflation. As a result, the Fed slowed its pace of interest rate increases and signaled that it was nearing the end of its rate hiking campaign. The U.S. economy was resilient in the higher rate environment, posting solid growth as strength in the labor market supported healthy levels of consumer spending.
Inflation also eased in Europe, where the European Central Bank and Bank of England joined the Fed in slowing interest rate increases. However, European economic growth was sluggish amid elevated energy costs, a downturn in global trade, and higher borrowing costs. The prevalence of adjustable-rate mortgages in the U.K. and Southern Europe was particularly challenging for consumers in these regions. While wage gains helped offset the impact of higher household expenses, the U.K. unemployment rate rose and the eurozone labor market showed signs of softening late in the period.
In emerging markets (EM), China ended its zero-COVID policy early in the period, triggering a rebound in economic activity. However, the recovery quickly lost momentum due to several factors, including a drop in consumer confidence and a desire among developed-market (DM) companies to become less dependent on Chinese manufacturing. China’s economy stabilized in the final months of the period, bolstered by various stimulus measures. Nonetheless, the Chinese government seemed more focused on national security interests than economic growth.
During the period, numerous EM countries, including Mexico and several Southeast Asian nations in particular, benefited from DM companies’ efforts to diversify their supply chains beyond China. In addition, because EM central banks were generally ahead of their DM peers in addressing rising inflation risks, many EM central banks were able to cut interest rates during the period -- moves that supported economic growth and asset prices. For the period as a whole, the U.S. dollar broadly weakened, providing another tailwind for EM assets.
Fund Performance
For the 12-month period ended October 31, 2023, Eaton Vance Global Macro Absolute Return Advantage Fund (the Fund) returned 9.16% for Class A shares at net asset value (NAV), outperforming its benchmark, the ICE BofA 3-Month U.S. Treasury Bill Index (the Index), which returned 4.77%.
The Fund’s sovereign credit exposure was the largest contributor to its performance during the period, followed by its currency and interest rate exposures. The Fund’s limited allocations to equities and corporate credit also positively impacted returns. Conversely, the Fund’s commodity exposure modestly detracted from performance.
By region, Eastern Europe and Latin America were the largest contributors to returns. In Eastern Europe, the Fund’s long Ukrainian local bond position performed especially well as Western allies provided military aid to the Ukrainian government and liquidity conditions in Ukraine improved. In Latin America, the Fund’s long local bond position in the Dominican Republic was a top contributor to returns, benefiting from solid economic growth and falling inflation in the country.
Investments in Western Europe and the Dollar Bloc -- Canada, New Zealand, and Australia -- made the next-largest contributions to performance during the period. A long position in Greek equities added significant value in Western Europe, as the Greek stock market surged amid a broad rally in global equities and a market-friendly outcome to the country’s national elections. In the Dollar Bloc, a long position in the Australian dollar versus a short position in the New Zealand dollar was advantageous.
Holdings in the Middle East & Africa region had minimal impact on the Fund’s returns, while investments in Asia modestly detracted. Despite fiscal deterioration in the country, a short sovereign credit position in Malaysia was particularly unfavorable alongside the broad tightening in credit spreads during the period. Other major detractors from returns included short positions in the Thai baht and Philippine peso. By period-end, the short position in the Thai baht was closed.
The Fund used derivatives extensively to hedge select undesired risk exposures, as well as to gain select desired risk exposures. Some of the notable drivers of performance at the country level involved the use of derivatives. The Fund’s use of derivatives broadly detracted from returns during the period. Credit default swaps used to gain long and short exposure to certain sovereign credits, which also acted as hedges to other exposures in certain cases, had the largest negative impact on Fund performance Currency forwards used to gain long and short exposure to select currencies around the world, as well as interest rate swaps used to gain select exposures as well as hedge others, further detracted from returns during the period.
See Endnotes and Additional Disclosures in this report.
Past performance is no guarantee of future results. Returns are historical and are calculated by determining the percentage change in net asset value (NAV) or offering price (as applicable) with all distributions reinvested. Furthermore, returns do not reflect the deduction of taxes that shareholders may have to pay on Fund distributions or upon the redemption of Fund shares. Investment return and principal value will fluctuate so that shares, when redeemed, may be worth more or less than their original cost. Performance for periods less than or equal to one year is cumulative. Performance is for the stated time period only; due to market volatility, current Fund performance may be lower or higher than the quoted return. For performance as of the most recent month-end, please refer to eatonvance.com.
Eaton Vance
Global Macro Absolute Return Advantage Fund
October 31, 2023
Performance
Portfolio Manager(s) Patrick Campbell, CFA, Kyle Lee, CFA, Federico Sequeda, CFA each of Eaton Vance Management and Hussein Khattab, CFA of Eaton Vance Advisers International, Ltd.
| % Average Annual Total Returns1,2 | Class
Inception Date | Performance
Inception Date | One Year | Five Years | Ten Years |
| Class A at NAV | 08/31/2010 | 08/31/2010 | 9.16% | 4.59% | 3.67% |
| Class A with 3.25% Maximum Sales Charge | — | — | 5.60 | 3.90 | 3.32 |
| Class C at NAV | 08/31/2010 | 08/31/2010 | 8.31 | 3.85 | 3.08 |
| Class C with 1% Maximum Deferred Sales Charge | — | — | 7.31 | 3.85 | 3.08 |
| Class I at NAV | 08/31/2010 | 08/31/2010 | 9.39 | 4.88 | 3.97 |
| Class R at NAV | 12/01/2010 | 08/31/2010 | 8.91 | 4.37 | 3.46 |
| Class R6 at NAV | 05/31/2017 | 08/31/2010 | 9.60 | 4.93 | 4.03 |
|
| ICE BofA 3-Month U.S. Treasury Bill Index | — | — | 4.77% | 1.77% | 1.16% |
| % Total Annual Operating Expense Ratios3 | Class A | Class C | Class I | Class R | Class R6 |
| Gross | 1.57% | 2.32% | 1.32% | 1.82% | 1.29% |
| Net | 1.46 | 2.21 | 1.21 | 1.71 | 1.18 |
Growth of $10,000
This graph shows the change in value of a hypothetical investment of $10,000 in Class A of the Fund for the period indicated. For comparison, the same investment is shown in the indicated index.
| Growth of Investment2 | Amount Invested | Period Beginning | At NAV | With Maximum Sales Charge |
| Class C | $10,000 | 10/31/2013 | $13,552 | N.A. |
| Class I, at minimum investment | $1,000,000 | 10/31/2013 | $1,475,589 | N.A. |
| Class R | $10,000 | 10/31/2013 | $14,050 | N.A. |
| Class R6, at minimum investment | $5,000,000 | 10/31/2013 | $7,420,801 | N.A. |
See Endnotes and Additional Disclosures in this report.
Past performance is no guarantee of future results. Returns are historical and are calculated by determining the percentage change in net asset value (NAV) or offering price (as applicable) with all distributions reinvested. Furthermore, returns do not reflect the deduction of taxes that shareholders may have to pay on Fund distributions or upon the redemption of Fund shares. Investment return and principal value will fluctuate so that shares, when redeemed, may be worth more or less than their original cost. Performance for periods less than or equal to one year is cumulative. Performance is for the stated time period only; due to market volatility, current Fund performance may be lower or higher than the quoted return. For performance as of the most recent month-end, please refer to eatonvance.com.
Eaton Vance
Global Macro Absolute Return Advantage Fund
October 31, 2023
| Asset Allocation (% of net assets)1 |
| Foreign Currency Exposures (% of net assets)2 |
| Australia | 4.7% |
| Iceland | 4.6 |
| Uzbekistan | 4.4 |
| Dominican Republic | 3.9 |
| Hungary | 3.7 |
| Serbia | 3.3 |
| Canada | 2.9 |
| South Korea | 2.8 |
| India | 2.8 |
| Uruguay | 2.2 |
| Armenia | 2.1 |
| Mexico | 2.0 |
| Japan | 1.3 |
| Chile | 1.1 |
| Other | -0.5 4 |
| South Africa | -1.5 |
| Saudi Arabia | -1.8 |
| Oman | -2.5 |
| Bahrain | -2.8 |
| Philippines | -4.0 |
| New Zealand | -4.5 |
| China | -7.2 |
| Euro | -11.9 |
| Total Long | 47.9% |
| Total Short | -42.8% |
| Total Net | 5.1% |
Fund invests in an affiliated investment company (Portfolio) with the same objective(s) and policies as the Fund. References to investments are to the Portfolio’s holdings.
Footnotes:
1 Other Net Assets represents other assets less liabilities and includes any investment type that represents less than 1% of net assets.
2 Currency exposures include all foreign exchange denominated assets, currency derivatives and commodities (including commodity derivatives). Total exposures may exceed 100% due to implicit leverage created by derivatives.
3 Net of securities sold short.
4 Includes amounts each less than 1.0% or –1.0%, as applicable.
Eaton Vance
Global Macro Absolute Return Advantage Fund
October 31, 2023
Endnotes and Additional Disclosures
| † | The views expressed in this report are those of the portfolio manager(s) and are current only through the date stated at the top of this page. These views are subject to change at any time based upon market or other conditions, and Eaton Vance and the Fund(s) disclaim any responsibility to update such views. These views may not be relied upon as investment advice and, because investment decisions are based on many factors, may not be relied upon as an indication of trading intent on behalf of any Eaton Vance fund. This commentary may contain statements that are not historical facts, referred to as “forward-looking statements.” The Fund’s actual future results may differ significantly from those stated in any forward-looking statement, depending on factors such as changes in securities or financial markets or general economic conditions, the volume of sales and purchases of Fund shares, the continuation of investment advisory, administrative and service contracts, and other risks discussed from time to time in the Fund’s filings with the Securities and Exchange Commission. |
| | |
| 1 | ICE BofA 3-Month U.S. Treasury Bill Index is an unmanaged index of U.S. Treasury securities maturing in 90 days. ICE® BofA® indices are not for redistribution or other uses; provided “as is”, without warranties, and with no liability. Eaton Vance has prepared this report and ICE Data Indices, LLC does not endorse it, or guarantee, review, or endorse Eaton Vance’s products. BofA® is a licensed registered trademark of Bank of America Corporation in the United States and other countries. Unless otherwise stated, index returns do not reflect the effect of any applicable sales charges, commissions, expenses, taxes or leverage, as applicable. It is not possible to invest directly in an index. |
| 2 | Total Returns at NAV do not include applicable sales charges. If sales charges were deducted, the returns would be lower. Total Returns shown with maximum sales charge reflect the stated maximum sales charge. Unless otherwise stated, performance does not reflect the deduction of taxes on Fund distributions or redemptions of Fund shares.Performance prior to the inception date of a class may be linked to the performance of an older class of the Fund. This linked performance is adjusted for any applicable sales charge, but is not adjusted for class expense differences. If adjusted for such differences, the performance would be different. The performance of Class R6 is linked to Class I. Performance presented in the Financial Highlights included in the financial statements is not linked.Effective November 5, 2020, Class C shares automatically convert to Class A shares eight years after purchase. The average annual total returns listed for Class C reflect conversion to Class A shares after eight years. Prior to November 5, 2020, Class C shares automatically converted to Class A shares ten years after purchase. |
| 3 | Source: Fund prospectus. Net expense ratios reflect a contractual expense reimbursement that continues through 2/29/24. The expense ratios for the current reporting period can be found in the Financial Highlights section of this report. Performance reflects expenses waived and/or reimbursed, if applicable. Without such waivers and/or reimbursements, performance would have been lower. |
| | Fund profile subject to change due to active management. |
| | Additional Information |
| | A long position is the purchase of an investment with the expectation that it will rise in value. |
| | A short position is the sale of a borrowed investment with the expectation that it will decline in value. |
| | Spread is the difference in yield between a U.S. Treasury bond and another debt security of the same maturity but different credit quality. |
Eaton Vance
Global Macro Absolute Return Advantage Fund
October 31, 2023
Example
As a Fund shareholder, you incur two types of costs: (1) transaction costs, including sales charges (loads) on purchases; and (2) ongoing costs, including management fees; distribution and/or service fees; and other Fund expenses. This Example is intended to help you understand your ongoing costs (in dollars) of Fund investing and to compare these costs with the ongoing costs of investing in other mutual funds. The Example is based on an investment of $1,000 invested at the beginning of the period and held for the entire period (May 1, 2023 to October 31, 2023).
Actual Expenses
The first section of the table below provides information about actual account values and actual expenses. You may use the information in this section, together with the amount you invested, to estimate the expenses that you paid over the period. Simply divide your account value by $1,000 (for example, an $8,600 account value divided by $1,000 = 8.6), then multiply the result by the number in the first section under the heading entitled “Expenses Paid During Period” to estimate the expenses you paid on your account during this period.
Hypothetical Example for Comparison Purposes
The second section of the table below provides information about hypothetical account values and hypothetical expenses based on the actual Fund expense ratio and an assumed rate of return of 5% per year (before expenses), which is not the actual Fund return. The hypothetical account values and expenses may not be used to estimate the actual ending account balance or expenses you paid for the period. You may use this information to compare the ongoing costs of investing in your Fund and other funds. To do so, compare this 5% hypothetical example with the 5% hypothetical examples that appear in the shareholder reports of the other funds.
Please note that the expenses shown in the table are meant to highlight your ongoing costs only and do not reflect any transactional costs, such as sales charges (loads). Therefore, the second section of the table is useful in comparing ongoing costs only, and will not help you determine the relative total costs of owning different funds. In addition, if these transactional costs were included, your costs would be higher.
| | Beginning
Account Value
(5/1/23) | Ending
Account Value
(10/31/23) | Expenses Paid
During Period*
(5/1/23 – 10/31/23) | Annualized
Expense
Ratio |
| Actual | | | | |
| Class A | $1,000.00 | $1,024.80 | $11.02** | 2.16% |
| Class C | $1,000.00 | $1,021.20 | $14.88** | 2.92% |
| Class I | $1,000.00 | $1,025.50 | $ 9.75** | 1.91% |
| Class R | $1,000.00 | $1,023.10 | $12.29** | 2.41% |
| Class R6 | $1,000.00 | $1,026.50 | $ 9.45** | 1.85% |
| |
| Hypothetical | | | | |
| (5% return per year before expenses) | | | | |
| Class A | $1,000.00 | $1,014.32 | $10.97** | 2.16% |
| Class C | $1,000.00 | $1,010.49 | $14.80** | 2.92% |
| Class I | $1,000.00 | $1,015.58 | $ 9.70** | 1.91% |
| Class R | $1,000.00 | $1,013.06 | $12.23** | 2.41% |
| Class R6 | $1,000.00 | $1,015.88 | $ 9.40** | 1.85% |
| * | Expenses are equal to the Fund's annualized expense ratio for the indicated Class, multiplied by the average account value over the period, multiplied by 184/365 (to reflect the one-half year period). The Example assumes that the $1,000 was invested at the net asset value per share determined at the close of business on April 30, 2023. The Example reflects the expenses of both the Fund and the Portfolio. |
| ** | Absent an allocation of certain expenses to affiliate(s), the expenses would be higher. |
Eaton Vance
Global Macro Absolute Return Advantage Fund
October 31, 2023
Statement of Assets and Liabilities
| | October 31, 2023 |
| Assets | |
| Investment in Global Macro Absolute Return Advantage Portfolio, at value (identified cost $1,928,399,054) | $ 1,804,447,077 |
| Receivable for Fund shares sold | 4,914,101 |
| Total assets | $1,809,361,178 |
| Liabilities | |
| Payable for Fund shares redeemed | $ 2,547,628 |
| Payable to affiliates: | |
| Distribution and service fees | 62,677 |
| Trustees' fees | 42 |
| Other | 37,769 |
| Accrued expenses | 385,159 |
| Total liabilities | $ 3,033,275 |
| Net Assets | $1,806,327,903 |
| Sources of Net Assets | |
| Paid-in capital | $ 2,136,402,249 |
| Accumulated loss | (330,074,346) |
| Net Assets | $1,806,327,903 |
| Class A Shares | |
| Net Assets | $ 258,776,386 |
| Shares Outstanding | 26,124,379 |
Net Asset Value and Redemption Price Per Share
(net assets ÷ shares of beneficial interest outstanding) | $ 9.91 |
Maximum Offering Price Per Share
(100 ÷ 96.75 of net asset value per share) | $ 10.24 |
| Class C Shares | |
| Net Assets | $ 8,277,857 |
| Shares Outstanding | 858,655 |
Net Asset Value and Offering Price Per Share*
(net assets ÷ shares of beneficial interest outstanding) | $ 9.64 |
| Class I Shares | |
| Net Assets | $ 870,693,784 |
| Shares Outstanding | 86,525,541 |
Net Asset Value, Offering Price and Redemption Price Per Share
(net assets ÷ shares of beneficial interest outstanding) | $ 10.06 |
| Class R Shares | |
| Net Assets | $ 1,441,402 |
| Shares Outstanding | 147,700 |
Net Asset Value, Offering Price and Redemption Price Per Share
(net assets ÷ shares of beneficial interest outstanding) | $ 9.76 |
7
See Notes to Financial Statements.
Eaton Vance
Global Macro Absolute Return Advantage Fund
October 31, 2023
Statement of Assets and Liabilities — continued
| | October 31, 2023 |
| Class R6 Shares | |
| Net Assets | $667,138,474 |
| Shares Outstanding | 66,356,098 |
Net Asset Value, Offering Price and Redemption Price Per Share
(net assets ÷ shares of beneficial interest outstanding) | $ 10.05 |
| On sales of $50,000 or more, the offering price of Class A shares is reduced. |
| * | Redemption price per share is equal to the net asset value less any applicable contingent deferred sales charge. |
8
See Notes to Financial Statements.
Eaton Vance
Global Macro Absolute Return Advantage Fund
October 31, 2023
| | Year Ended |
| | October 31, 2023 |
| Investment Income | |
| Dividend income allocated from Portfolio (net of foreign taxes withheld of $175,408) | $ 10,452,977 |
| Interest and other income allocated from Portfolio (net of foreign taxes withheld of $1,770,037) | 118,895,589 |
| Expenses, excluding interest and dividend expense, allocated from Portfolio | (16,984,751) |
| Interest and dividend expense allocated from Portfolio | (11,352,422) |
| Total investment income from Portfolio | $ 101,011,393 |
| Expenses | |
| Distribution and service fees: | |
| Class A | $ 689,602 |
| Class C | 100,505 |
| Class R | 6,980 |
| Trustees’ fees and expenses | 500 |
| Custodian fee | 62,000 |
| Transfer and dividend disbursing agent fees | 1,069,020 |
| Legal and accounting services | 78,447 |
| Printing and postage | 79,738 |
| Registration fees | 211,772 |
| Miscellaneous | 26,011 |
| Total expenses | $ 2,324,575 |
| Deduct: | |
| Waiver and/or reimbursement of expenses by affiliates | $ 1,123,829 |
| Total expense reductions | $ 1,123,829 |
| Net expenses | $ 1,200,746 |
| Net investment income | $ 99,810,647 |
| Realized and Unrealized Gain (Loss) from Portfolio | |
| Net realized gain (loss): | |
| Investment transactions | $ (160,779,979) |
| Written options | 1,672 |
| Securities sold short | (454,493) |
| Futures contracts | 5,973,454 |
| Swap contracts | (7,300,243) |
| Foreign currency transactions | (3,797,545) |
| Forward foreign currency exchange contracts | 8,900,221 |
| Non-deliverable bond forward contracts | 9,652,716 |
| Net realized loss | $(147,804,197) |
| Change in unrealized appreciation (depreciation): | |
| Investments (including net increase in accrued foreign capital gains taxes of $16,568) | $ 273,003,590 |
| Written options | 101,321 |
| Securities sold short | 5,145,955 |
| Futures contracts | (13,556,327) |
| Swap contracts | (49,468,494) |
| Foreign currency | (880,992) |
| Forward foreign currency exchange contracts | (21,479,787) |
| Non-deliverable bond forward contracts | (1,768,872) |
| Net change in unrealized appreciation (depreciation) | $ 191,096,394 |
| Net realized and unrealized gain | $ 43,292,197 |
| Net increase in net assets from operations | $ 143,102,844 |
9
See Notes to Financial Statements.
Eaton Vance
Global Macro Absolute Return Advantage Fund
October 31, 2023
Statements of Changes in Net Assets
| | Year Ended October 31, |
| | 2023 | 2022 |
| Increase (Decrease) in Net Assets | | |
| From operations: | | |
| Net investment income | $ 99,810,647 | $ 105,075,478 |
| Net realized gain (loss) | (147,804,197) | 110,702,571 |
| Net change in unrealized appreciation (depreciation) | 191,096,394 | (297,913,216) |
| Net increase (decrease) in net assets from operations | $ 143,102,844 | $ (82,135,167) |
| Distributions to shareholders: | | |
| Class A | $ (10,176,611) | $ (28,376,973) |
| Class C | (392,475) | (502,076) |
| Class I | (37,085,496) | (38,629,833) |
| Class R | (58,629) | (60,698) |
| Class R6 | (26,464,279) | (30,233,189) |
| Total distributions to shareholders | $ (74,177,490) | $ (97,802,769) |
| Transactions in shares of beneficial interest: | | |
| Class A | $ 97,209,145 | $ (485,597,806) |
| Class C | (3,108,752) | (1,857,675) |
| Class I | 33,594,093 | 50,348,589 |
| Class R | 43,276 | 76,078 |
| Class R6 | 88,926,661 | (28,870,732) |
| Net increase (decrease) in net assets from Fund share transactions | $ 216,664,423 | $ (465,901,546) |
| Net increase (decrease) in net assets | $ 285,589,777 | $ (645,839,482) |
| Net Assets | | |
| At beginning of year | $ 1,520,738,126 | $ 2,166,577,608 |
| At end of year | $1,806,327,903 | $1,520,738,126 |
10
See Notes to Financial Statements.
Eaton Vance
Global Macro Absolute Return Advantage Fund
October 31, 2023
| | Class A |
| | Year Ended October 31, |
| | 2023 | 2022 | 2021 | 2020 | 2019 |
| Net asset value — Beginning of year | $ 9.480 | $ 10.450 | $ 10.450 | $ 10.250 | $ 9.510 |
| Income (Loss) From Operations | | | | | |
| Net investment income(1) | $ 0.559 | $ 0.531 | $ 0.524 | $ 0.549 | $ 0.564 |
| Net realized and unrealized gain (loss) | 0.298 | (1.038) | 0.049 | 0.066 | 0.176 |
| Total income (loss) from operations | $ 0.857 | $ (0.507) | $ 0.573 | $ 0.615 | $ 0.740 |
| Less Distributions | | | | | |
| From net investment income | $ (0.427) | $ (0.463) | $ (0.573) | $ (0.415) | $ — |
| Total distributions | $ (0.427) | $ (0.463) | $ (0.573) | $ (0.415) | $ — |
| Net asset value — End of year | $ 9.910 | $ 9.480 | $ 10.450 | $ 10.450 | $ 10.250 |
| Total Return(2)(3) | 9.16% | (5.02)% | 5.52% | 6.15% | 7.78% |
| Ratios/Supplemental Data | | | | | |
| Net assets, end of year (000’s omitted) | $258,776 | $151,818 | $676,641 | $758,795 | $789,497 |
| Ratios (as a percentage of average daily net assets):(4) | | | | | |
| Expenses (3)(5) | 1.99% (6) | 1.51% (6) | 1.46% | 1.44% | 1.57% |
| Net investment income | 5.69% | 5.31% | 5.03% | 5.35% | 5.70% |
| Portfolio Turnover of the Portfolio | 56% | 94% | 82% | 80% | 71% |
| (1) | Computed using average shares outstanding. |
| (2) | Returns are historical and are calculated by determining the percentage change in net asset value with all distributions reinvested and do not reflect the effect of sales charges. |
| (3) | The investment adviser and administrator of the Fund and/or the investment adviser of the Portfolio reimbursed certain operating expenses (equal to 0.07%, 0.11%, 0.11%, 0.15% and 0.18% of average daily net assets for the years ended October 31, 2023, 2022, 2021, 2020 and 2019, respectively). Absent this reimbursement, total return would be lower. |
| (4) | Includes the Fund’s share of the Portfolio’s allocated expenses. |
| (5) | Includes interest and/or dividend expense, including on securities sold short and/or reverse repurchase agreements if applicable, of 0.67%, 0.16%, 0.11%, 0.09% and 0.22% of average daily net assets for the years ended October 31, 2023, 2022, 2021, 2020 and 2019, respectively. |
| (6) | Includes a reduction by the investment adviser of a portion of the Portfolio’s adviser fee due to the Portfolio’s investment in the Liquidity Fund (equal to 0.01% and less than 0.005% of average daily net assets for the years ended October 31, 2023 and 2022, respectively). |
11
See Notes to Financial Statements.
Eaton Vance
Global Macro Absolute Return Advantage Fund
October 31, 2023
Financial Highlights — continued
| | Class C |
| | Year Ended October 31, |
| | 2023 | 2022 | 2021 | 2020 | 2019 |
| Net asset value — Beginning of year | $ 9.230 | $10.180 | $ 10.150 | $ 9.930 | $ 9.270 |
| Income (Loss) From Operations | | | | | |
| Net investment income(1) | $ 0.482 | $ 0.495 | $ 0.441 | $ 0.468 | $ 0.453 |
| Net realized and unrealized gain (loss) | 0.281 | (1.059) | 0.043 | 0.056 | 0.207 |
| Total income (loss) from operations | $ 0.763 | $ (0.564) | $ 0.484 | $ 0.524 | $ 0.660 |
| Less Distributions | | | | | |
| From net investment income | $ (0.353) | $ (0.386) | $ (0.454) | $ (0.304) | $ — |
| Total distributions | $(0.353) | $ (0.386) | $ (0.454) | $ (0.304) | $ — |
| Net asset value — End of year | $ 9.640 | $ 9.230 | $10.180 | $10.150 | $ 9.930 |
| Total Return(2)(3) | 8.31% | (5.69)% | 4.85% | 5.29% | 7.12% |
| Ratios/Supplemental Data | | | | | |
| Net assets, end of year (000’s omitted) | $ 8,278 | $10,906 | $ 14,020 | $ 20,894 | $30,108 |
| Ratios (as a percentage of average daily net assets):(4) | | | | | |
| Expenses (3)(5) | 2.71% (6) | 2.21% (6) | 2.16% | 2.14% | 2.29% |
| Net investment income | 5.05% | 5.16% | 4.33% | 4.69% | 4.80% |
| Portfolio Turnover of the Portfolio | 56% | 94% | 82% | 80% | 71% |
| (1) | Computed using average shares outstanding. |
| (2) | Returns are historical and are calculated by determining the percentage change in net asset value with all distributions reinvested and do not reflect the effect of sales charges. |
| (3) | The investment adviser and administrator of the Fund and/or the investment adviser of the Portfolio reimbursed certain operating expenses (equal to 0.07%, 0.11%, 0.11%, 0.15% and 0.18% of average daily net assets for the years ended October 31, 2023, 2022, 2021, 2020 and 2019, respectively). Absent this reimbursement, total return would be lower. |
| (4) | Includes the Fund’s share of the Portfolio’s allocated expenses. |
| (5) | Includes interest and/or dividend expense, including on securities sold short and/or reverse repurchase agreements if applicable, of 0.67%, 0.16%, 0.11%, 0.09% and 0.24% of average daily net assets for the years ended October 31, 2023, 2022, 2021, 2020 and 2019, respectively. |
| (6) | Includes a reduction by the investment adviser of a portion of the Portfolio’s adviser fee due to the Portfolio’s investment in the Liquidity Fund (equal to 0.01% and less than 0.005% of average daily net assets for the years ended October 31, 2023 and 2022, respectively). |
12
See Notes to Financial Statements.
Eaton Vance
Global Macro Absolute Return Advantage Fund
October 31, 2023
Financial Highlights — continued
| | Class I |
| | Year Ended October 31, |
| | 2023 | 2022 | 2021 | 2020 | 2019 |
| Net asset value — Beginning of year | $ 9.640 | $ 10.620 | $ 10.610 | $ 10.390 | $ 9.610 |
| Income (Loss) From Operations | | | | | |
| Net investment income(1) | $ 0.593 | $ 0.619 | $ 0.565 | $ 0.592 | $ 0.570 |
| Net realized and unrealized gain (loss) | 0.288 | (1.099) | 0.047 | 0.062 | 0.216 |
| Total income (loss) from operations | $ 0.881 | $ (0.480) | $ 0.612 | $ 0.654 | $ 0.786 |
| Less Distributions | | | | | |
| From net investment income | $ (0.461) | $ (0.500) | $ (0.602) | $ (0.434) | $ (0.006) |
| Total distributions | $ (0.461) | $ (0.500) | $ (0.602) | $ (0.434) | $ (0.006) |
| Net asset value — End of year | $ 10.060 | $ 9.640 | $ 10.620 | $ 10.610 | $ 10.390 |
| Total Return(2)(3) | 9.39% | (4.79)% | 5.93% | 6.36% | 8.18% |
| Ratios/Supplemental Data | | | | | |
| Net assets, end of year (000’s omitted) | $870,694 | $803,281 | $836,706 | $1,293,211 | $2,075,104 |
| Ratios (as a percentage of average daily net assets):(4) | | | | | |
| Expenses (3)(5) | 1.71% (6) | 1.21% (6) | 1.16% | 1.14% | 1.29% |
| Net investment income | 5.96% | 6.22% | 5.35% | 5.70% | 5.81% |
| Portfolio Turnover of the Portfolio | 56% | 94% | 82% | 80% | 71% |
| (1) | Computed using average shares outstanding. |
| (2) | Returns are historical and are calculated by determining the percentage change in net asset value with all distributions reinvested. |
| (3) | The investment adviser and administrator of the Fund and/or the investment adviser of the Portfolio reimbursed certain operating expenses (equal to 0.07%, 0.11%, 0.11%, 0.15% and 0.18% of average daily net assets for the years ended October 31, 2023, 2022, 2021, 2020 and 2019, respectively). Absent this reimbursement, total return would be lower. |
| (4) | Includes the Fund’s share of the Portfolio’s allocated expenses. |
| (5) | Includes interest and/or dividend expense, including on securities sold short and/or reverse repurchase agreements if applicable, of 0.67%, 0.16%, 0.11%, 0.09% and 0.24% of average daily net assets for the years ended October 31, 2023, 2022, 2021, 2020 and 2019, respectively. |
| (6) | Includes a reduction by the investment adviser of a portion of the Portfolio’s adviser fee due to the Portfolio’s investment in the Liquidity Fund (equal to 0.01% and less than 0.005% of average daily net assets for the years ended October 31, 2023 and 2022, respectively). |
13
See Notes to Financial Statements.
Eaton Vance
Global Macro Absolute Return Advantage Fund
October 31, 2023
Financial Highlights — continued
| | Class R |
| | Year Ended October 31, |
| | 2023 | 2022 | 2021 | 2020 | 2019 |
| Net asset value — Beginning of year | $ 9.360 | $10.330 | $ 10.330 | $ 10.120 | $ 9.410 |
| Income (Loss) From Operations | | | | | |
| Net investment income(1) | $ 0.530 | $ 0.554 | $ 0.497 | $ 0.526 | $ 0.515 |
| Net realized and unrealized gain (loss) | 0.284 | (1.073) | 0.055 | 0.064 | 0.195 |
| Total income (loss) from operations | $ 0.814 | $ (0.519) | $ 0.552 | $ 0.590 | $ 0.710 |
| Less Distributions | | | | | |
| From net investment income | $ (0.414) | $ (0.451) | $ (0.552) | $ (0.380) | $ — |
| Total distributions | $(0.414) | $ (0.451) | $ (0.552) | $ (0.380) | $ — |
| Net asset value — End of year | $ 9.760 | $ 9.360 | $10.330 | $10.330 | $10.120 |
| Total Return(2)(3) | 8.91% | (5.29)% | 5.36% | 5.97% | 7.55% |
| Ratios/Supplemental Data | | | | | |
| Net assets, end of year (000’s omitted) | $ 1,441 | $ 1,340 | $ 1,398 | $ 1,506 | $ 1,566 |
| Ratios (as a percentage of average daily net assets):(4) | | | | | |
| Expenses (3)(5) | 2.21% (6) | 1.71% (6) | 1.66% | 1.64% | 1.79% |
| Net investment income | 5.48% | 5.71% | 4.82% | 5.18% | 5.35% |
| Portfolio Turnover of the Portfolio | 56% | 94% | 82% | 80% | 71% |
| (1) | Computed using average shares outstanding. |
| (2) | Returns are historical and are calculated by determining the percentage change in net asset value with all distributions reinvested. |
| (3) | The investment adviser and administrator of the Fund and/or the investment adviser of the Portfolio reimbursed certain operating expenses (equal to 0.07%, 0.11%, 0.11%, 0.15% and 0.18% of average daily net assets for the years ended October 31, 2023, 2022, 2021, 2020 and 2019, respectively). Absent this reimbursement, total return would be lower. |
| (4) | Includes the Fund’s share of the Portfolio’s allocated expenses. |
| (5) | Includes interest and/or dividend expense, including on securities sold short and/or reverse repurchase agreements if applicable, of 0.67%, 0.16%, 0.11%, 0.09% and 0.24% of average daily net assets for the years ended October 31, 2023, 2022, 2021, 2020 and 2019, respectively. |
| (6) | Includes a reduction by the investment adviser of a portion of the Portfolio’s adviser fee due to the Portfolio’s investment in the Liquidity Fund (equal to 0.01% and less than 0.005% of average daily net assets for the years ended October 31, 2023 and 2022, respectively). |
14
See Notes to Financial Statements.
Eaton Vance
Global Macro Absolute Return Advantage Fund
October 31, 2023
Financial Highlights — continued
| | Class R6 |
| | Year Ended October 31, |
| | 2023 | 2022 | 2021 | 2020 | 2019 |
| Net asset value — Beginning of year | $ 9.630 | $ 10.630 | $ 10.620 | $ 10.410 | $ 9.640 |
| Income (Loss) From Operations | | | | | |
| Net investment income(1) | $ 0.595 | $ 0.619 | $ 0.567 | $ 0.576 | $ 0.579 |
| Net realized and unrealized gain (loss) | 0.295 | (1.104) | 0.057 | 0.079 | 0.207 |
| Total income (loss) from operations | $ 0.890 | $ (0.485) | $ 0.624 | $ 0.655 | $ 0.786 |
| Less Distributions | | | | | |
| From net investment income | $ (0.470) | $ (0.515) | $ (0.614) | $ (0.445) | $ (0.016) |
| Total distributions | $ (0.470) | $ (0.515) | $ (0.614) | $ (0.445) | $ (0.016) |
| Net asset value — End of year | $ 10.050 | $ 9.630 | $ 10.630 | $ 10.620 | $ 10.410 |
| Total Return(2)(3) | 9.60% | (4.84)% | 5.94% | 6.56% | 8.07% |
| Ratios/Supplemental Data | | | | | |
| Net assets, end of year (000’s omitted) | $667,138 | $553,393 | $637,812 | $699,477 | $140,294 |
| Ratios (as a percentage of average daily net assets):(4) | | | | | |
| Expenses (3)(5) | 1.68% (6) | 1.18% (6) | 1.13% | 1.11% | 1.26% |
| Net investment income | 5.97% | 6.20% | 5.36% | 5.53% | 5.86% |
| Portfolio Turnover of the Portfolio | 56% | 94% | 82% | 80% | 71% |
| (1) | Computed using average shares outstanding. |
| (2) | Returns are historical and are calculated by determining the percentage change in net asset value with all distributions reinvested. |
| (3) | The investment adviser and administrator of the Fund and/or the investment adviser of the Portfolio reimbursed certain operating expenses (equal to 0.07%, 0.11%, 0.11%, 0.15% and 0.18% of average daily net assets for the years ended October 31, 2023, 2022, 2021, 2020 and 2019, respectively). Absent this reimbursement, total return would be lower. |
| (4) | Includes the Fund’s share of the Portfolio’s allocated expenses. |
| (5) | Includes interest and/or dividend expense, including on securities sold short and/or reverse repurchase agreements if applicable, of 0.67%, 0.16%, 0.11%, 0.09% and 0.24% of average daily net assets for the years ended October 31, 2023, 2022, 2021, 2020 and 2019, respectively. |
| (6) | Includes a reduction by the investment adviser of a portion of the Portfolio’s adviser fee due to the Portfolio’s investment in the Liquidity Fund (equal to 0.01% and less than 0.005% of average daily net assets for the years ended October 31, 2023 and 2022, respectively). |
15
See Notes to Financial Statements.
Eaton Vance
Global Macro Absolute Return Advantage Fund
October 31, 2023
Notes to Financial Statements
1 Significant Accounting Policies
Eaton Vance Global Macro Absolute Return Advantage Fund (the Fund) is a non-diversified series of Eaton Vance Mutual Funds Trust (the Trust). The Trust is a Massachusetts business trust registered under the Investment Company Act of 1940, as amended (the 1940 Act), as an open-end management investment company. The Fund offers five classes of shares. Class A shares are generally sold subject to a sales charge imposed at time of purchase. Class C shares are sold at net asset value and are generally subject to a contingent deferred sales charge (see Note 5). Effective November 5, 2020, Class C shares automatically convert to Class A shares eight years after their purchase as described in the Fund’s prospectus. Class I, Class R and Class R6 shares are sold at net asset value and are not subject to a sales charge. Each class represents a pro rata interest in the Fund, but votes separately on class-specific matters and (as noted below) is subject to different expenses. Realized and unrealized gains and losses and net investment income and losses, other than class-specific expenses, are allocated daily to each class of shares based on the relative net assets of each class to the total net assets of the Fund. Sub-accounting, recordkeeping and similar administrative fees payable to financial intermediaries, which are a component of transfer and dividend disbursing agent fees on the Statement of Operations, are not allocated to Class R6 shares. Each class of shares differs in its distribution plan and certain other class-specific expenses. The Fund invests its assets in interests of Global Macro Absolute Return Advantage Portfolio (the Portfolio), a Massachusetts business trust, having the same investment objective and policies as the Fund. The value of the Fund’s investment in the Portfolio reflects the Fund’s proportionate interest in the net assets of the Portfolio (73.0% at October 31, 2023). The performance of the Fund is directly affected by the performance of the Portfolio. The consolidated financial statements of the Portfolio, including the consolidated portfolio of investments, are included elsewhere in this report and should be read in conjunction with the Fund’s financial statements.
The following is a summary of significant accounting policies of the Fund. The policies are in conformity with accounting principles generally accepted in the United States of America (U.S. GAAP). The Fund is an investment company and follows accounting and reporting guidance in the Financial Accounting Standards Board (FASB) Accounting Standards Codification Topic 946.
A Investment Valuation—Valuation of securities by the Portfolio is discussed in Note 1A of the Portfolio's Notes to Consolidated Financial Statements, which are included elsewhere in this report.
B Income—The Fund's net investment income or loss consists of the Fund's pro rata share of the net investment income or loss of the Portfolio, less all actual and accrued expenses of the Fund.
C Federal and Other Taxes—The Fund’s policy is to comply with the provisions of the Internal Revenue Code applicable to regulated investment companies and to distribute to shareholders each year substantially all of its net investment income, and all or substantially all of its net realized capital gains. Accordingly, no provision for federal income or excise tax is necessary.
In addition to the requirements of the Internal Revenue Code, the Fund may also be required to recognize its pro rata share of the capital gains taxes incurred by the Portfolio. In doing so, the daily net asset value would reflect the Fund’s pro rata share of the estimated reserve for such taxes incurred by the Portfolio.
As of October 31, 2023, the Fund had no uncertain tax positions that would require financial statement recognition, de-recognition, or disclosure. The Fund files a U.S. federal income tax return annually after its fiscal year-end, which is subject to examination by the Internal Revenue Service for a period of three years from the date of filing.
D Expenses—The majority of expenses of the Trust are directly identifiable to an individual fund. Expenses which are not readily identifiable to a specific fund are allocated taking into consideration, among other things, the nature and type of expense and the relative size of the funds.
E Use of Estimates—The preparation of the financial statements in conformity with U.S. GAAP requires management to make estimates and assumptions that affect the reported amounts of assets and liabilities at the date of the financial statements and the reported amounts of income and expense during the reporting period. Actual results could differ from those estimates.
F Indemnifications— Under the Trust’s organizational documents, its officers and Trustees may be indemnified against certain liabilities and expenses arising out of the performance of their duties to the Fund. Under Massachusetts law, if certain conditions prevail, shareholders of a Massachusetts business trust (such as the Trust) could be deemed to have personal liability for the obligations of the Trust. However, the Trust’s Declaration of Trust contains an express disclaimer of liability on the part of Fund shareholders and the By-laws provide that the Trust shall assume, upon request by the shareholder, the defense on behalf of any Fund shareholders. Moreover, the By-laws also provide for indemnification out of Fund property of any shareholder held personally liable solely by reason of being or having been a shareholder for all loss or expense arising from such liability. Additionally, in the normal course of business, the Fund enters into agreements with service providers that may contain indemnification clauses. The Fund’s maximum exposure under these arrangements is unknown as this would involve future claims that may be made against the Fund that have not yet occurred.
G Other—Investment transactions are accounted for on a trade date basis.
Eaton Vance
Global Macro Absolute Return Advantage Fund
October 31, 2023
Notes to Financial Statements — continued
2 Distributions to Shareholders and Income Tax Information
It is the present policy of the Fund to make at least one distribution annually (normally in December) of all or substantially all of its net investment income and to distribute annually all or substantially all of its net realized capital gains. Distributions to shareholders are recorded on the ex-dividend date. Distributions are declared separately for each class of shares. Shareholders may reinvest income and capital gain distributions in additional shares of the same class of the Fund at the net asset value as of the ex-dividend date or, at the election of the shareholder, receive distributions in cash. Distributions to shareholders are determined in accordance with income tax regulations, which may differ from U.S. GAAP. As required by U.S. GAAP, only distributions in excess of tax basis earnings and profits are reported in the financial statements as a return of capital. Permanent differences between book and tax accounting relating to distributions are reclassified to paid-in capital. For tax purposes, distributions from short-term capital gains are considered to be from ordinary income.
The tax character of distributions declared for the years ended October 31, 2023 and October 31, 2022 was as follows:
| | Year Ended October 31, |
| | 2023 | 2022 |
| Ordinary income | $74,177,490 | $97,802,769 |
During the year ended October 31, 2023, accumulated loss was increased by $6,279,963 and paid-in capital was increased by $6,279,963 due to the Fund’s use of equalization accounting. Tax equalization accounting allows the Fund to treat as a distribution that portion of redemption proceeds representing a redeeming shareholder’s portion of undistributed taxable income and net capital gains. These reclassifications had no effect on the net assets or net asset value per share of the Fund.
As of October 31, 2023, the components of distributable earnings (accumulated loss) on a tax basis were as follows:
| Undistributed ordinary income | $ 46,753,805 |
| Deferred capital losses | (166,060,960) |
| Net unrealized depreciation | (210,767,191) |
| Accumulated loss | $(330,074,346) |
At October 31, 2023, the Fund, for federal income tax purposes, had deferred capital losses of $166,060,960 which would reduce its taxable income arising from future net realized gains on investment transactions, if any, to the extent permitted by the Internal Revenue Code, and thus would reduce the amount of distributions to shareholders, which would otherwise be necessary to relieve the Fund of any liability for federal income or excise tax. The deferred capital losses are treated as arising on the first day of the Fund’s next taxable year and retain the same short-term or long-term character as when originally deferred. Of the deferred capital losses at October 31, 2023, $35,614,689 are short-term and $130,446,271 are long-term.
3 Investment Adviser and Administration Fee and Other Transactions with Affiliates
The investment adviser and administration fee is earned by Eaton Vance Management (EVM), an indirect, wholly-owned subsidiary of Morgan Stanley, as compensation for investment advisory and administrative services rendered to the Fund. The investment adviser and administration fee is computed at an annual rate as a percentage of the Fund’s average daily net assets that are not invested in other investment companies for which EVM or its affiliates serve as investment adviser and receive an advisory fee as follows and is payable monthly:
| Average Daily Net Assets | Annual Fee Rate |
| Up to $500 million | 1.000% |
| $500 million but less than $1 billion | 0.950% |
| $1 billion but less than $2.5 billion | 0.925% |
| $2.5 billion but less than $5 billion | 0.900% |
| $5 billion and over | 0.880% |
For the year ended October 31, 2023, the Fund incurred no investment adviser and administration fee on such assets. Pursuant to an investment sub-advisory agreement, EVM has delegated a portion of the investment management of the Fund to Eaton Vance Advisers International Ltd. (EVAIL), an affiliate of EVM and an indirect, wholly-owned subsidiary of Morgan Stanley. EVM pays EVAIL a portion of its investment adviser and administration fee for
Eaton Vance
Global Macro Absolute Return Advantage Fund
October 31, 2023
Notes to Financial Statements — continued
sub-advisory services provided to the Fund. To the extent the Fund’s assets are invested in the Portfolio, the Fund is allocated its share of the Portfolio’s investment adviser fee. The Portfolio has engaged Boston Management and Research (BMR) to render investment advisory services. See Note 2 of the Portfolio’s Notes to Consolidated Financial Statements which are included elsewhere in this report.
EVM has agreed to reimburse the Fund’s expenses to the extent that total annual operating expenses (relating to ordinary operating expenses only and excluding such expenses as brokerage commissions, acquired fund fees and expenses of unaffiliated funds, borrowing costs, taxes or litigation expenses) exceed 1.30% (1.35% prior to July 1, 2023), 2.05%, 1.05%, 1.55% and 1.02% of the Fund’s average daily net assets for Class A, Class C, Class I, Class R and Class R6, respectively. This agreement may be changed or terminated after February 29, 2024. Pursuant to this agreement, EVM was allocated $1,123,829 of the Fund’s operating expenses for the year ended October 31, 2023.
EVM provides sub-transfer agency and related services to the Fund pursuant to a Sub-Transfer Agency Support Services Agreement. For the year ended October 31, 2023, EVM earned $34,093 from the Fund pursuant to such agreement, which is included in transfer and dividend disbursing agent fees on the Statement of Operations. The Fund was informed that Eaton Vance Distributors, Inc. (EVD), an affiliate of EVM and the Fund's principal underwriter, received $1,631 as its portion of the sales charge on sales of Class A shares for the year ended October 31, 2023. EVD also received distribution and service fees from Class A, Class C and Class R shares (see Note 4) and contingent deferred sales charges (see Note 5).
Trustees and officers of the Fund who are members of EVM’s or BMR's organizations receive remuneration for their services to the Fund out of the investment adviser fee. Certain officers and Trustees of the Fund and the Portfolio are officers of the above organizations.
4 Distribution Plans
The Fund has in effect a distribution plan for Class A shares (Class A Plan) pursuant to Rule 12b-1 under the 1940 Act. Pursuant to the Class A Plan, the Fund pays EVD a distribution and service fee of 0.25% (0.30% prior to July 1, 2023) per annum of its average daily net assets attributable to Class A shares for distribution services and facilities provided to the Fund by EVD, as well as for personal services and/or the maintenance of shareholder accounts. Distribution and service fees paid or accrued to EVD for the year ended October 31, 2023 amounted to $689,602 for Class A shares.
The Fund also has in effect distribution plans for Class C shares (Class C Plan) and Class R shares (Class R Plan) pursuant to Rule 12b-1 under the 1940 Act. Pursuant to the Class C Plan, the Fund pays EVD amounts equal to 0.75% per annum of its average daily net assets attributable to Class C shares for providing ongoing distribution services and facilities to the Fund. For the year ended October 31, 2023, the Fund paid or accrued to EVD $75,379 for Class C shares. The Class R Plan requires the Fund to pay EVD an amount up to 0.50% per annum of its average daily net assets attributable to Class R shares for providing ongoing distribution services and facilities to the Fund. The Trustees of the Trust have currently limited Class R distribution payments to 0.25% per annum of the average daily net assets attributable to Class R shares. For the year ended October 31, 2023, the Fund paid or accrued to EVD $3,490 for Class R shares.
Pursuant to the Class C and Class R Plans, the Fund also makes payments of service fees to EVD, financial intermediaries and other persons in amounts equal to 0.25% per annum of its average daily net assets attributable to that class. Service fees paid or accrued are for personal services and/or the maintenance of shareholder accounts. They are separate and distinct from the sales commissions and distribution fees payable to EVD. Service fees paid or accrued for the year ended October 31, 2023 amounted to $25,126 and $3,490 for Class C and Class R shares, respectively.
Distribution and service fees are subject to the limitations contained in the Financial Industry Regulatory Authority Rule 2341(d).
5 Contingent Deferred Sales Charges
A contingent deferred sales charge (CDSC) of 1% generally is imposed on redemptions of Class C shares made within 12 months of purchase. Class A shares may be subject to a 0.75% CDSC if redeemed within 12 months of purchase (depending on the circumstances of purchase). Generally, the CDSC is based upon the lower of the net asset value at date of redemption or date of purchase. No charge is levied on shares acquired by reinvestment of dividends or capital gain distributions. For the year ended October 31, 2023, the Fund was informed that EVD received no CDSCs paid by Class A and Class C shareholders.
6 Investment Transactions
For the year ended October 31, 2023, increases and decreases in the Fund's investment in the Portfolio aggregated $339,189,391 and $202,475,102, respectively.
Eaton Vance
Global Macro Absolute Return Advantage Fund
October 31, 2023
Notes to Financial Statements — continued
7 Shares of Beneficial Interest
The Fund’s Declaration of Trust permits the Trustees to issue an unlimited number of full and fractional shares of beneficial interest (without par value). Such shares may be issued in a number of different series (such as the Fund) and classes. Transactions in Fund shares, including direct exchanges pursuant to share class conversions, were as follows:
| | Year Ended
October 31, 2023 | | Year Ended
October 31, 2022 |
| | Shares | Amount | | Shares | Amount |
| Class A | | | | | |
| Sales | 11,588,829 | $ 111,848,668 | | 15,388,094 | $ 147,798,597 |
| Issued to shareholders electing to receive payments of distributions in Fund shares | 1,066,399 | 10,056,139 | | 2,781,624 | 28,094,404 |
| Redemptions | (2,537,454) | (24,695,662) | | (66,895,264) | (661,490,807) |
| Net increase (decrease) | 10,117,774 | $ 97,209,145 | | (48,725,546) | $(485,597,806) |
| Class C | | | | | |
| Sales | 104,536 | $ 989,341 | | 122,116 | $ 1,179,889 |
| Issued to shareholders electing to receive payments of distributions in Fund shares | 42,411 | 391,875 | | 50,650 | 500,931 |
| Redemptions | (469,383) | (4,489,968) | | (368,782) | (3,538,495) |
| Net decrease | (322,436) | $ (3,108,752) | | (196,016) | $ (1,857,675) |
| Class I | | | | | |
| Sales | 36,991,589 | $ 369,797,271 | | 45,214,100 | $ 450,703,862 |
| Issued to shareholders electing to receive payments of distributions in Fund shares | 3,259,856 | 31,164,219 | | 3,499,514 | 35,835,019 |
| Redemptions | (37,089,500) | (367,367,397) | | (44,160,394) | (436,190,292) |
| Net increase | 3,161,945 | $ 33,594,093 | | 4,553,220 | $ 50,348,589 |
| Class R | | | | | |
| Sales | 19,772 | $ 191,706 | | 26,070 | $ 249,901 |
| Issued to shareholders electing to receive payments of distributions in Fund shares | 6,297 | 58,629 | | 6,082 | 60,698 |
| Redemptions | (21,522) | (207,059) | | (24,426) | (234,521) |
| Net increase | 4,547 | $ 43,276 | | 7,726 | $ 76,078 |
| Class R6 | | | | | |
| Sales | 23,604,243 | $ 235,246,715 | | 16,341,304 | $ 158,889,083 |
| Issued to shareholders electing to receive payments of distributions in Fund shares | 1,216,876 | 11,621,165 | | 1,028,651 | 10,523,095 |
| Redemptions | (15,910,031) | (157,941,219) | | (19,941,518) | (198,282,910) |
| Net increase (decrease) | 8,911,088 | $ 88,926,661 | | (2,571,563) | $ (28,870,732) |
Eaton Vance
Global Macro Absolute Return Advantage Fund
October 31, 2023
Report of Independent Registered Public Accounting Firm
To the Trustees of Eaton Vance Mutual Funds Trust and Shareholders of Eaton Vance Global Macro Absolute Return Advantage Fund:
Opinion on the Financial Statements and Financial Highlights
We have audited the accompanying statement of assets and liabilities of Eaton Vance Global Macro Absolute Return Advantage Fund (the “Fund") (one of the funds constituting Eaton Vance Mutual Funds Trust), as of October 31, 2023, the related statement of operations for the year then ended, the statements of changes in net assets for each of the two years in the period then ended, the financial highlights for each of the five years in the period then ended, and the related notes. In our opinion, the financial statements and financial highlights present fairly, in all material respects, the financial position of the Fund as of October 31, 2023, and the results of its operations for the year then ended, the changes in its net assets for each of the two years in the period then ended, and the financial highlights for each of the five years in the period then ended, in conformity with accounting principles generally accepted in the United States of America.
Basis for Opinion
These financial statements and financial highlights are the responsibility of the Fund's management. Our responsibility is to express an opinion on the Fund's financial statements and financial highlights based on our audits. We are a public accounting firm registered with the Public Company Accounting Oversight Board (United States) (PCAOB) and are required to be independent with respect to the Fund in accordance with the U.S. federal securities laws and the applicable rules and regulations of the Securities and Exchange Commission and the PCAOB.
We conducted our audits in accordance with the standards of the PCAOB. Those standards require that we plan and perform the audit to obtain reasonable assurance about whether the financial statements and financial highlights are free of material misstatement, whether due to error or fraud. The Fund is not required to have, nor were we engaged to perform, an audit of its internal control over financial reporting. As part of our audits, we are required to obtain an understanding of internal control over financial reporting but not for the purpose of expressing an opinion on the effectiveness of the Fund’s internal control over financial reporting. Accordingly, we express no such opinion.
Our audits included performing procedures to assess the risks of material misstatement of the financial statements and financial highlights, whether due to error or fraud, and performing procedures that respond to those risks. Such procedures included examining, on a test basis, evidence regarding the amounts and disclosures in the financial statements and financial highlights. Our audits also included evaluating the accounting principles used and significant estimates made by management, as well as evaluating the overall presentation of the financial statements and financial highlights. We believe that our audits provide a reasonable basis for our opinion.
/s/ Deloitte & Touche LLP
Boston, Massachusetts
December 22, 2023
We have served as the auditor of one or more Eaton Vance investment companies since 1959.
Eaton Vance
Global Macro Absolute Return Advantage Fund
October 31, 2023
Federal Tax Information (Unaudited)
The Form 1099-DIV you receive in February 2024 will show the tax status of all distributions paid to your account in calendar year 2023. Shareholders are advised to consult their own tax adviser with respect to the tax consequences of their investment in the Fund. As required by the Internal Revenue Code and/or regulations, shareholders must be notified regarding the status of qualified dividend income for individuals and 163(j) interest dividends.
Qualified Dividend Income. For the fiscal year ended October 31, 2023, the Fund designates approximately $2,543,776, or up to the maximum amount of such dividends allowable pursuant to the Internal Revenue Code, as qualified dividend income eligible for the reduced tax rate of 15%.
163(j) Interest Dividends. For the fiscal year ended October 31, 2023, the Fund designates 24.97% of distributions from net investment income as a 163(j) interest dividend.
Global Macro Absolute Return Advantage Portfolio
October 31, 2023
Consolidated Portfolio of Investments
| Collateralized Mortgage Obligations — 4.0% |
| Security | Principal
Amount
(000's omitted) | Value |
| Federal Home Loan Mortgage Corp.: | | | |
| Interest Only:(1) | | | |
| Series 2770, Class SH, 1.665%, (6.986% - 30-day average SOFR), 3/15/34(2) | $ | 630 | $ 57,728 |
| Series 4791, Class JI, 4.00%, 5/15/48 | | 7,287 | 1,529,835 |
| Federal Home Loan Mortgage Corp. Structured Agency Credit Risk Debt Notes: | | | |
| Series 2020-DNA4, Class B1, 11.435%, (30-day average SOFR + 6.114%), 8/25/50(3)(4) | | 6,260 | 6,972,766 |
| Series 2020-HQA4, Class B1, 10.685%, (30-day average SOFR + 5.364%), 9/25/50(3)(4) | | 3,161 | 3,423,834 |
| Series 2022-HQA1, Class M1B, 8.821%, (30-day average SOFR + 3.50%), 3/25/42(3)(4) | | 2,521 | 2,603,697 |
| Series 2022-HQA1, Class M2, 10.571%, (30-day average SOFR + 5.25%), 3/25/42(3)(4) | | 5,043 | 5,320,956 |
| Federal National Mortgage Association: | | | |
| Series 2023-54, Class C, 6.50%, 11/25/53 | | 7,070 | 6,930,779 |
| Interest Only:(1) | | | |
| Series 424, Class C8, 3.50%, 2/25/48 | | 9,252 | 1,712,160 |
| Series 2010-109, Class PS, 1.165%, (6.486% - 30-day average SOFR), 10/25/40(2) | | 1,340 | 82,702 |
| Series 2018-21, Class IO, 3.00%, 4/25/48 | | 8,202 | 1,458,135 |
| Series 2018-58, Class BI, 4.00%, 8/25/48 | | 1,336 | 268,791 |
| Government National Mortgage Association: | | | |
| Series 2023-148, Class HL, 6.50%, 10/20/53 | | 7,070 | 7,058,357 |
| Sereis 2023-151, Class GL, 6.50%, 10/20/53 | | 5,096 | 5,086,298 |
| Series 2023-155, Class CH, 6.50%, 10/20/53 | | 19,303 | 19,247,220 |
| Unison Trust, Series 2021-1, Class A, 4.50%, 4/25/50(3)(5) | | 46,758 | 36,486,768 |
Total Collateralized Mortgage Obligations
(identified cost $130,514,062) | | | $ 98,240,026 |
| Security | Shares | Value |
| Belgium — 0.0%(6) |
| Cenergy Holdings S.A. | | 52,921 | $ 355,969 |
| | | | $ 355,969 |
| Bulgaria — 0.4% |
| Eurohold Bulgaria AD(7) | | 11,339,190 | $ 10,427,552 |
| | | | $ 10,427,552 |
| Cyprus — 0.7% |
| Bank of Cyprus Holdings PLC | | 5,496,009 | $ 16,945,629 |
| Security | Shares | Value |
| Cyprus (continued) |
| Galaxy Cosmos Mezz PLC(7) | | 48,440 | $ 26,151 |
| Optima bank S.A.(7) | | 186,213 | 1,398,928 |
| Sunrisemezz PLC(7) | | 272,828 | 75,257 |
| | | | $ 18,445,965 |
| Georgia — 0.3% |
| Bank of Georgia Group PLC | | 55,667 | $ 2,253,802 |
| Georgia Capital PLC(7) | | 175,700 | 1,969,722 |
| TBC Bank Group PLC | | 59,076 | 1,930,662 |
| | | | $ 6,154,186 |
| Greece — 1.8% |
| Alpha Services and Holdings S.A.(7) | | 1,820,600 | $ 2,725,315 |
| Eurobank Ergasias Services and Holdings S.A.(7) | | 3,074,700 | 5,025,670 |
| Hellenic Telecommunications Organization S.A. | | 325,212 | 4,558,298 |
| Ideal Holdings S.A.(7) | | 18,680 | 115,061 |
| JUMBO S.A. | | 203,438 | 5,352,567 |
| Motor Oil (Hellas) Corinth Refineries S.A. | | 109,300 | 2,603,263 |
| Mytilineos S.A. | | 145,257 | 5,380,958 |
| National Bank of Greece S.A.(7) | | 640,500 | 3,668,368 |
| OPAP S.A. | | 233,095 | 3,948,231 |
| Piraeus Financial Holdings S.A.(7) | | 2,652,700 | 7,862,985 |
| Public Power Corp. S.A.(7) | | 186,100 | 1,899,532 |
| Titan Cement International S.A. | | 7,468 | 139,864 |
| | | | $ 43,280,112 |
| Iceland — 0.3% |
| Arion Banki HF(3) | | 1,970,378 | $ 1,812,329 |
| Eik Fasteignafelag HF(7) | | 6,056,328 | 496,256 |
| Eimskipafelag Islands HF | | 483,446 | 1,630,033 |
| Hagar HF | | 1,926,423 | 943,080 |
| Islandsbanki HF | | 1,104,783 | 816,881 |
| Reginn HF(7) | | 2,864,793 | 460,500 |
| Reitir Fasteignafelag HF | | 1,754,792 | 969,273 |
| Siminn HF | | 3,351,976 | 211,681 |
| | | | $ 7,340,033 |
| Indonesia — 0.4% |
| Bank Central Asia Tbk PT | | 6,100,000 | $ 3,360,616 |
| Bank Mandiri Persero Tbk PT | | 6,600,000 | 2,357,864 |
| Bank Negara Indonesia Persero Tbk PT | | 1,380,000 | 416,465 |
| Bank Rakyat Indonesia Persero Tbk PT | | 8,500,000 | 2,657,813 |
| | | | $ 8,792,758 |
| Poland — 0.4% |
| Alior Bank S.A.(7) | | 12,085 | $ 190,251 |
22
See Notes to Consolidated Financial Statements.
Global Macro Absolute Return Advantage Portfolio
October 31, 2023
Consolidated Portfolio of Investments — continued
| Security | Shares | Value |
| Poland (continued) |
| Allegro.eu S.A.(3)(7) | | 69,423 | $ 497,991 |
| Asseco Poland S.A. | | 7,850 | 143,732 |
| Bank Millennium S.A.(7) | | 86,688 | 150,835 |
| Bank Polska Kasa Opieki S.A. | | 26,142 | 794,381 |
| Budimex S.A. | | 1,828 | 204,633 |
| CCC S.A.(7) | | 6,055 | 57,307 |
| CD Projekt S.A. | | 9,466 | 236,335 |
| Cyfrowy Polsat S.A.(7) | | 37,579 | 117,169 |
| Dino Polska S.A.(3)(7) | | 7,237 | 685,744 |
| Enea S.A.(7) | | 39,017 | 67,630 |
| Eurocash S.A. | | 12,263 | 40,795 |
| Grupa Azoty S.A.(7) | | 7,075 | 37,018 |
| Grupa Kety S.A. | | 1,428 | 240,880 |
| Jastrzebska Spolka Weglowa S.A.(7) | | 7,415 | 88,087 |
| KGHM Polska Miedz S.A. | | 19,590 | 522,765 |
| KRUK S.A. | | 2,534 | 280,323 |
| LPP S.A. | | 163 | 525,098 |
| mBank S.A.(7) | | 2,154 | 266,285 |
| Orange Polska S.A. | | 92,231 | 171,079 |
| ORLEN S.A. | | 80,522 | 1,273,368 |
| PGE S.A.(7) | | 133,371 | 231,627 |
| Powszechna Kasa Oszczednosci Bank Polski S.A.(7) | | 123,438 | 1,278,665 |
| Powszechny Zaklad Ubezpieczen S.A. | | 88,981 | 1,006,898 |
| Santander Bank Polska S.A.(7) | | 5,122 | 556,285 |
| Tauron Polska Energia S.A.(7) | | 154,214 | 135,626 |
| Text S.A. | | 2,565 | 69,106 |
| Warsaw Stock Exchange | | 3,778 | 35,086 |
| XTB S.A.(3) | | 6,748 | 52,463 |
| | | | $ 9,957,462 |
| Spain — 0.0%(6) |
| AmRest Holdings SE(7) | | 11,113 | $ 70,487 |
| | | | $ 70,487 |
| United Kingdom — 0.0%(6) |
| Pepco Group N.V.(7)(8) | | 25,985 | $ 105,320 |
| Tesnik Cuatro, Ltd.(9) | | 584,285 | 818,174 |
| | | | $ 923,494 |
| Vietnam — 0.6% |
| Bank for Foreign Trade of Vietnam JSC(7) | | 438,625 | $ 1,551,159 |
| Binh Minh Plastics JSC | | 45,300 | 144,931 |
| Coteccons Construction JSC(7) | | 198,093 | 410,080 |
| FPT Corp. | | 1,352,975 | 4,730,938 |
| Ho Chi Minh City Infrastructure Investment JSC | | 868,000 | 492,873 |
| Hoa Phat Group JSC(7) | | 1,601,821 | 1,503,104 |
| Security | Shares | Value |
| Vietnam (continued) |
| KIDO Group Corp. | | 38,090 | $ 98,482 |
| Masan Group Corp.(7) | | 167,040 | 396,600 |
| Mobile World Investment Corp. | | 1,116,000 | 1,717,400 |
| Phu Nhuan Jewelry JSC | | 477,066 | 1,400,398 |
| Refrigeration Electrical Engineering Corp. | | 576,424 | 1,320,537 |
| SSI Securities Corp. | | 280,688 | 295,272 |
| Vietnam Dairy Products JSC | | 352,996 | 977,664 |
| Vingroup JSC(7) | | 458,952 | 756,988 |
| | | | $ 15,796,426 |
Total Common Stocks
(identified cost $109,883,122) | | | $ 121,544,444 |
| Security | Principal
Amount
(000's omitted) | Value |
| India — 0.2% |
| Indiabulls Housing Finance, Ltd., 4.50%, 9/28/26(8) | USD | 4,605 | $ 4,104,298 |
Total Convertible Bonds
(identified cost $4,605,000) | | | $ 4,104,298 |
| Foreign Corporate Bonds — 2.0% |
| Security | Principal
Amount
(000's omitted) | Value |
| Armenia — 0.1% |
| Ardshinbank CJSC Via Dilijan Finance BV, 6.50%, 1/28/25(8) | USD | 1,237 | $ 1,221,538 |
| | | | $ 1,221,538 |
| Brazil — 0.1% |
| Coruripe Netherlands BV: | | | |
| 10.00%, 2/10/27(3) | USD | 1,194 | $ 845,209 |
| 10.00%, 2/10/27(8) | USD | 2,847 | 2,015,336 |
| | | | $ 2,860,545 |
| China — 0.1% |
| KWG Group Holdings, Ltd., 7.875%, 8/30/24(10) | USD | 2,385 | $ 186,626 |
| Shimao Group Holdings, Ltd., 5.60%, 7/15/26(8)(10) | USD | 7,800 | 195,000 |
| Sunac China Holdings, Ltd.: | | | |
| 6.50%, 7/9/23(8)(10) | USD | 2,800 | 406,000 |
| 8.35%, 4/19/23(8)(10) | USD | 5,201 | 745,043 |
23
See Notes to Consolidated Financial Statements.
Global Macro Absolute Return Advantage Portfolio
October 31, 2023
Consolidated Portfolio of Investments — continued
| Security | Principal
Amount
(000's omitted) | Value |
| China (continued) |
| Times China Holdings, Ltd.: | | | |
| 5.55%, 6/4/24(8)(10) | USD | 6,284 | $ 217,427 |
| 6.75%, 7/16/23(8)(10) | USD | 4,471 | 111,775 |
| | | | $ 1,861,871 |
| Hungary — 0.1% |
| MBH Bank Nyrt, 8.625% to 10/19/26, 10/19/27(8)(11) | EUR | 3,382 | $ 3,610,326 |
| | | | $ 3,610,326 |
| Iceland — 0.8% |
| Arion Banki HF, 6.00%, 4/12/24(8) | ISK | 1,720,000 | $ 12,165,854 |
| Landsbankinn HF, 5.00%, 11/23/23(8) | ISK | 1,020,000 | 7,254,878 |
| WOW Air HF: | | | |
| 0.00% (9)(10)(12) | EUR | 121 | 0 |
| 0.00%, (3 mo. EURIBOR + 9.00%)(9)(10)(12) | EUR | 5,500 | 0 |
| | | | $ 19,420,732 |
| India — 0.2% |
| JSW Steel, Ltd., 5.05%, 4/5/32(8) | USD | 2,277 | $ 1,757,155 |
| Vedanta Resources Finance II PLC, 13.875%, 1/21/24(8) | USD | 2,214 | 1,973,247 |
| | | | $ 3,730,402 |
| Mexico — 0.1% |
| Alpha Holding S.A. de CV: | | | |
| 9.00%, 2/10/25(8)(10) | USD | 5,542 | $ 103,918 |
| 10.00%, 12/19/22(8)(10) | USD | 2,697 | 40,454 |
| Grupo Kaltex S.A. de CV, 14.50%, (13.00% cash and 1.50% PIK), 9/30/25(3) | USD | 2,068 | 1,861,200 |
| | | | $ 2,005,572 |
| Moldova — 0.1% |
| Aragvi Finance International DAC, 8.45%, 4/29/26(8) | USD | 3,454 | $ 2,378,942 |
| | | | $ 2,378,942 |
| Nigeria — 0.0%(6) |
| IHS Netherlands Holdco BV, 8.00%, 9/18/27(8) | USD | 618 | $ 505,851 |
| SEPLAT Energy PLC, 7.75%, 4/1/26(8) | USD | 561 | 475,055 |
| | | | $ 980,906 |
| Saint Lucia — 0.1% |
| Digicel International Finance, Ltd./Digicel International Holdings, Ltd., 8.75%, 5/25/24(8) | USD | 1,633 | $ 1,499,959 |
| | | | $ 1,499,959 |
| Security | Principal
Amount
(000's omitted) | Value |
| South Africa — 0.0%(6) |
| Petra Diamonds US Treasury PLC, 9.75% PIK, 3/8/26(8) | USD | 914 | $ 781,565 |
| | | | $ 781,565 |
| Turkey — 0.2% |
| Limak Iskenderun Uluslararasi Liman Isletmeciligi AS, 9.50%, 7/10/36(8) | USD | 6,853 | $ 6,017,307 |
| | | | $ 6,017,307 |
| Uzbekistan — 0.1% |
| International Finance Corp., 16.00%, 2/21/25 | UZS | 25,000,000 | $ 2,051,881 |
| | | | $ 2,051,881 |
Total Foreign Corporate Bonds
(identified cost $78,952,034) | | | $ 48,421,546 |
| Loan Participation Notes — 2.0% |
| Security | Principal
Amount
(000's omitted) | Value |
| Uzbekistan — 2.0% |
| Daryo Finance BV (borrower - Uzbek Industrial and Construction Bank ATB), 18.75%, 6/15/25(8)(9)(13) | UZS | 316,179,530 | $ 25,264,989 |
| Europe Asia Investment Finance BV (borrower - Joint Stock Commercial Bank "Asaka"), 18.70%, 7/21/26(8)(9)(13) | UZS | 331,541,810 | 25,264,873 |
Total Loan Participation Notes
(identified cost $55,956,228) | | | $ 50,529,862 |
| Reinsurance Side Cars — 0.8% |
| Security | Shares | Value |
| Eden Re II, Ltd.: | | | |
| Series 2021A, 0.00%, 3/21/25(3)(9)(14)(15) | | 519,292 | $ 236,797 |
| Series 2022A, 0.00%, 3/20/26(3)(9)(14)(15) | | 387,743 | 287,047 |
| Series 2022B, 0.00%, 3/20/26(3)(9)(14)(15) | | 812,887 | 613,730 |
| Mt. Logan Re, Ltd., Series A-1(7)(9)(15)(16) | | 8,600 | 10,175,822 |
| Sussex Capital, Ltd.: | | | |
| Designated Investment Series 14(7)(9)(15)(16) | | 1,114 | 20,764 |
| Designated Investment Series 14(7)(9)(15)(16) | | 1,081 | 599,146 |
| Series 14, Preference Shares(9)(15)(16) | | 7,500 | 8,224,784 |
Total Reinsurance Side Cars
(identified cost $17,819,923) | | | $ 20,158,090 |
24
See Notes to Consolidated Financial Statements.
Global Macro Absolute Return Advantage Portfolio
October 31, 2023
Consolidated Portfolio of Investments — continued
| Security | Shares | Value |
| Vietnam — 0.0% |
| Ho Chi Minh City Technical, Exp. 11/20/2023(7) | | 868,000 | $ 0 |
Total Rights
(identified cost $0) | | | $ 0 |
| Senior Floating-Rate Loans — 0.7%(17) |
| Borrower/Description | Principal
Amount
(000's omitted) | Value |
| Argentina — 0.0%(6) |
| Desa, LLC, Term Loan, 2.50%, 6/30/24(9)(18) | $ | 1,125 | $ 397,208 |
| | | | $ 397,208 |
| Mexico — 0.7% |
| Petroleos Mexicanos, Term Loan, 8.447%, (SOFR + 3.00%), 6/28/24 | $ | 17,248 | $ 16,946,160 |
| | | | $ 16,946,160 |
Total Senior Floating-Rate Loans
(identified cost $18,141,606) | | | $ 17,343,368 |
| Sovereign Government Bonds — 54.5% |
| Security | Principal
Amount
(000's omitted) | Value |
| Albania — 1.8% |
| Albania Government International Bond: | | | |
| 3.50%, 10/9/25(8) | EUR | 3,150 | $ 3,195,446 |
| 3.50%, 6/16/27(8) | EUR | 304 | 300,559 |
| 3.50%, 11/23/31(8) | EUR | 200 | 172,716 |
| 5.90%, 6/9/28(8) | EUR | 39,761 | 40,740,163 |
| | | | $ 44,408,884 |
| Argentina — 1.0% |
| Republic of Argentina: | | | |
| 0.75% to 7/9/27, 7/9/30(19) | USD | 12,532 | $ 3,510,302 |
| 1.00%, 7/9/29 | USD | 3,033 | 822,211 |
| 3.50% to 7/9/29, 7/9/41(19) | USD | 26,247 | 6,944,427 |
| 3.625% to 7/9/24, 7/9/35(19) | USD | 29,626 | 7,394,825 |
| 4.255% to 7/9/24, 1/9/38(19) | USD | 17,245 | 5,250,669 |
| | | | $ 23,922,434 |
| Security | Principal
Amount
(000's omitted) | Value |
| Armenia — 2.1% |
| Republic of Armenia Treasury Bond: | | | |
| 9.00%, 4/29/26 | AMD | 424,740 | $ 1,026,956 |
| 9.25%, 4/29/28 | AMD | 6,628,520 | 15,790,028 |
| 9.60%, 10/29/33 | AMD | 11,568,620 | 27,497,468 |
| 9.75%, 10/29/50 | AMD | 1,427,165 | 3,404,527 |
| 9.75%, 10/29/52 | AMD | 1,543,990 | 3,677,366 |
| | | | $ 51,396,345 |
| Barbados — 1.1% |
| Government of Barbados, 6.50%, 10/1/29(8) | USD | 28,447 | $ 26,810,921 |
| | | | $ 26,810,921 |
| Benin — 1.9% |
| Benin Government International Bond: | | | |
| 4.875%, 1/19/32(8) | EUR | 17,891 | $ 14,202,965 |
| 4.95%, 1/22/35(8) | EUR | 9,220 | 6,639,231 |
| 6.875%, 1/19/52(8) | EUR | 35,702 | 24,833,382 |
| | | | $ 45,675,578 |
| Cyprus — 0.9% |
| Cyprus Government International Bond: | | | |
| 2.75%, 2/26/34(8) | EUR | 2,016 | $ 1,870,001 |
| 4.125%, 4/13/33(8) | EUR | 17,969 | 19,183,189 |
| | | | $ 21,053,190 |
| Dominican Republic — 3.8% |
| Dominican Republic: | | | |
| 8.00%, 1/15/27(8) | DOP | 128,350 | $ 2,099,617 |
| 8.00%, 2/12/27(8) | DOP | 621,240 | 10,272,686 |
| 11.25%, 9/15/35(3) | DOP | 289,800 | 5,064,615 |
| 12.00%, 8/8/25(3) | DOP | 535,040 | 9,522,855 |
| 12.75%, 9/23/29(3) | DOP | 1,010,500 | 19,709,605 |
| 13.00%, 6/10/34(8) | DOP | 402,900 | 8,231,653 |
| 13.625%, 2/3/33(3) | DOP | 827,650 | 16,599,398 |
| Dominican Republic Central Bank Notes: | | | |
| 8.00%, 3/12/27(8) | DOP | 46,050 | 736,294 |
| 12.00%, 10/3/25(3) | DOP | 379,500 | 6,761,772 |
| 13.00%, 12/5/25(3) | DOP | 497,230 | 9,038,978 |
| 13.00%, 1/30/26(3) | DOP | 342,670 | 6,235,098 |
| | | | $ 94,272,571 |
| Ecuador — 0.1% |
| Republic of Ecuador, 2.50% to 1/31/24, 7/31/40(8)(19) | USD | 5,728 | $ 1,417,553 |
| | | | $ 1,417,553 |
25
See Notes to Consolidated Financial Statements.
Global Macro Absolute Return Advantage Portfolio
October 31, 2023
Consolidated Portfolio of Investments — continued
| Security | Principal
Amount
(000's omitted) | Value |
| El Salvador — 0.7% |
| Republic of El Salvador: | | | |
| 5.875%, 1/30/25(8) | USD | 1,502 | $ 1,383,744 |
| 6.375%, 1/18/27(8) | USD | 1,623 | 1,335,123 |
| 7.625%, 2/1/41(8) | USD | 7,942 | 5,346,160 |
| 7.65%, 6/15/35(8) | USD | 534 | 376,395 |
| 8.25%, 4/10/32(8) | USD | 12,330 | 9,737,150 |
| | | | $ 18,178,572 |
| Ethiopia — 0.8% |
| Ethiopia Government International Bond, 6.625%, 12/11/24(8) | USD | 32,194 | $ 20,436,333 |
| | | | $ 20,436,333 |
| Ghana — 1.0% |
| Ghana Government International Bond: | | | |
| 6.375%, 2/11/27(8)(10) | USD | 4,321 | $ 1,854,400 |
| 7.625%, 5/16/29(8)(10) | USD | 4,452 | 1,907,820 |
| 7.75%, 4/7/29(8)(10) | USD | 9,463 | 4,069,942 |
| 7.875%, 3/26/27(8)(10) | USD | 1,399 | 604,921 |
| 7.875%, 2/11/35(8)(10) | USD | 1,481 | 642,384 |
| 8.125%, 3/26/32(8)(10) | USD | 10,382 | 4,402,902 |
| 8.625%, 4/7/34(8)(10) | USD | 6,908 | 2,957,867 |
| 8.627%, 6/16/49(8)(10) | USD | 6,254 | 2,619,331 |
| 8.75%, 3/11/61(8)(10) | USD | 7,430 | 3,111,387 |
| 8.875%, 5/7/42(8)(10) | USD | 2,929 | 1,227,559 |
| 8.95%, 3/26/51(8)(10) | USD | 1,016 | 426,248 |
| | | | $ 23,824,761 |
| Greece — 0.0%(6) |
| Hellenic Republic Government Bond, 0.00%, GDP-Linked, 10/15/42 | EUR | 218,317 | $ 726,451 |
| | | | $ 726,451 |
| Iceland — 1.3% |
| Republic of Iceland: | | | |
| 5.00%, 11/15/28 | ISK | 2,319,313 | $ 14,703,679 |
| 6.50%, 1/24/31 | ISK | 1,273,622 | 8,618,876 |
| 8.00%, 6/12/25 | ISK | 1,168,841 | 8,340,569 |
| | | | $ 31,663,124 |
| India — 5.7% |
| India Government Bond: | | | |
| 7.10%, 4/18/29 | INR | 8,779,810 | $ 104,133,385 |
| Security | Principal
Amount
(000's omitted) | Value |
| India (continued) |
| India Government Bond: (continued) | | | |
| 7.26%, 2/6/33 | INR | 3,161,740 | $ 37,720,436 |
| | | | $ 141,853,821 |
| Indonesia — 1.5% |
| Indonesia Government Bond: | | | |
| 7.125%, 6/15/42 | IDR | 101,384,000 | $ 6,338,526 |
| 7.125%, 6/15/43 | IDR | 464,841,000 | 29,184,904 |
| 7.375%, 5/15/48 | IDR | 36,392,000 | 2,335,068 |
| | | | $ 37,858,498 |
| Ivory Coast — 1.7% |
| Ivory Coast Government International Bond: | | | |
| 6.625%, 3/22/48(8) | EUR | 39,874 | $ 28,425,978 |
| 6.875%, 10/17/40(8) | EUR | 17,973 | 13,822,640 |
| | | | $ 42,248,618 |
| Lebanon — 0.1% |
| Lebanese Republic: | | | |
| 5.80%, 4/14/20(8)(10) | USD | 332 | $ 21,358 |
| 6.10%, 10/4/22(8)(10) | USD | 5,684 | 354,187 |
| 6.15%, 6/19/20(10) | USD | 442 | 28,435 |
| 6.375%, 3/9/20(10) | USD | 5,669 | 364,698 |
| 6.40%, 5/26/23(10) | USD | 11,020 | 688,750 |
| 6.65%, 11/3/28(8)(10) | USD | 2,073 | 136,298 |
| 6.85%, 5/25/29(10) | USD | 5,799 | 371,925 |
| 7.00%, 12/3/24(10) | USD | 4,878 | 321,314 |
| 8.20%, 5/17/33(10) | USD | 4,223 | 274,389 |
| 8.25%, 5/17/34(10) | USD | 3,507 | 233,917 |
| | | | $ 2,795,271 |
| Mexico — 2.0% |
| Mexican Bonos: | | | |
| 7.75%, 11/13/42(20) | MXN | 591,090 | $ 26,195,624 |
| 8.00%, 7/31/53(20) | MXN | 544,200 | 24,282,990 |
| | | | $ 50,478,614 |
| Nigeria — 1.6% |
| Republic of Nigeria: | | | |
| 7.375%, 9/28/33(8) | USD | 6,333 | $ 4,781,162 |
| 7.625%, 11/28/47(8) | USD | 3,531 | 2,393,068 |
| 7.696%, 2/23/38(8) | USD | 21,135 | 15,124,100 |
| 8.25%, 9/28/51(8) | USD | 25,398 | 17,944,805 |
| | | | $ 40,243,135 |
26
See Notes to Consolidated Financial Statements.
Global Macro Absolute Return Advantage Portfolio
October 31, 2023
Consolidated Portfolio of Investments — continued
| Security | Principal
Amount
(000's omitted) | Value |
| North Macedonia — 2.3% |
| North Macedonia Government International Bond: | | | |
| 1.625%, 3/10/28(8) | EUR | 24,292 | $ 20,956,936 |
| 3.675%, 6/3/26(8) | EUR | 3,970 | 3,951,433 |
| 6.96%, 3/13/27(8) | EUR | 30,696 | 32,956,440 |
| | | | $ 57,864,809 |
| Panama — 0.1% |
| Panama Bonos del Tesoro, 6.375%, 7/25/33(3)(8) | USD | 1,515 | $ 1,385,149 |
| | | | $ 1,385,149 |
| Peru — 5.8% |
| Peru Government Bond: | | | |
| 5.40%, 8/12/34 | PEN | 11,066 | $ 2,406,559 |
| 5.94%, 2/12/29 | PEN | 395,045 | 98,604,303 |
| 6.15%, 8/12/32 | PEN | 5,374 | 1,279,707 |
| 6.35%, 8/12/28 | PEN | 28,346 | 7,278,102 |
| 7.30%, 8/12/33(3)(8) | PEN | 136,689 | 34,887,320 |
| | | | $ 144,455,991 |
| Romania — 3.3% |
| Romania Government International Bond: | | | |
| 1.75%, 7/13/30(8) | EUR | 36,399 | $ 29,406,834 |
| 2.00%, 1/28/32(8) | EUR | 797 | 608,504 |
| 2.00%, 4/14/33(8) | EUR | 5,022 | 3,664,135 |
| 2.124%, 7/16/31(8) | EUR | 2,362 | 1,859,204 |
| 2.125%, 3/7/28(8) | EUR | 6,116 | 5,632,882 |
| 3.375%, 1/28/50(8) | EUR | 3,514 | 2,207,152 |
| 3.624%, 5/26/30(8) | EUR | 439 | 402,237 |
| 3.75%, 2/7/34(8) | EUR | 2,626 | 2,200,235 |
| 4.625%, 4/3/49(8) | EUR | 20,631 | 16,195,976 |
| 6.625%, 9/27/29(8) | EUR | 16,515 | 18,017,879 |
| | | | $ 80,195,038 |
| Serbia — 4.4% |
| Republic of Serbia: | | | |
| 1.00%, 9/23/28(8) | EUR | 14,100 | $ 11,760,071 |
| 1.50%, 6/26/29(8) | EUR | 15,362 | 12,618,072 |
| 1.65%, 3/3/33(8) | EUR | 9,131 | 6,423,457 |
| Serbia Treasury Bond: | | | |
| 4.50%, 8/20/32 | RSD | 5,345,300 | 42,521,780 |
| 5.875%, 2/8/28 | RSD | 3,900,890 | 36,045,766 |
| | | | $ 109,369,146 |
| Security | Principal
Amount
(000's omitted) | Value |
| Sri Lanka — 1.8% |
| Sri Lanka Government International Bond: | | | |
| 5.75%, 4/18/23(8)(10) | USD | 13,676 | $ 7,178,632 |
| 6.20%, 5/11/27(8)(10) | USD | 11,845 | 5,963,364 |
| 6.35%, 6/28/24(8)(10) | USD | 5,875 | 3,064,125 |
| 6.75%, 4/18/28(8)(10) | USD | 2,158 | 1,085,719 |
| 6.825%, 7/18/26(8)(10) | USD | 27,346 | 14,252,543 |
| 6.85%, 3/14/24(8)(10) | USD | 8,685 | 4,526,001 |
| 6.85%, 11/3/25(8)(10) | USD | 15,118 | 7,898,493 |
| | | | $ 43,968,877 |
| Suriname — 3.1% |
| Republic of Suriname: | | | |
| 9.25%, 10/26/26(3)(10) | USD | 200 | $ 182,500 |
| 9.25%, 10/26/26(8)(10) | USD | 80,695 | 73,634,187 |
| 12.875%, 12/30/23(8)(10) | USD | 2,634 | 2,412,744 |
| | | | $ 76,229,431 |
| Ukraine — 0.5% |
| Ukraine Government Bond: | | | |
| 10.95%, 11/1/23 | UAH | 57,722 | $ 1,509,322 |
| 11.67%, 11/22/23 | UAH | 74,022 | 1,729,211 |
| 15.84%, 2/26/25 | UAH | 426,258 | 9,222,200 |
| | | | $ 12,460,733 |
| Uruguay — 2.5% |
| Uruguay Government Bond: | | | |
| 3.875%, 7/2/40(21) | UYU | 890,796 | $ 22,618,170 |
| 9.75%, 7/20/33 | UYU | 1,393,331 | 34,746,813 |
| Uruguay Monetary Regulation Bill, 0.00%, 7/3/24 | UYU | 210,400 | 4,940,833 |
| | | | $ 62,305,816 |
| Uzbekistan — 1.2% |
| Republic of Uzbekistan: | | | |
| 14.00%, 7/19/24(8) | UZS | 4,180,000 | $ 341,339 |
| 16.25%, 10/12/26(8) | UZS | 367,300,000 | 30,171,083 |
| | | | $ 30,512,422 |
| Zambia — 0.4% |
| Zambia Government Bond: | | | |
| 11.00%, 1/25/26 | ZMW | 220,720 | $ 8,742,485 |
| 11.00%, 6/28/26 | ZMW | 8,247 | 310,584 |
| 12.00%, 6/28/28 | ZMW | 27,000 | 876,041 |
| 12.00%, 8/30/28 | ZMW | 2,500 | 79,974 |
| 12.00%, 11/29/28 | ZMW | 8,500 | 266,765 |
27
See Notes to Consolidated Financial Statements.
Global Macro Absolute Return Advantage Portfolio
October 31, 2023
Consolidated Portfolio of Investments — continued
| Security | Principal
Amount
(000's omitted) | Value |
| Zambia (continued) |
| Zambia Government Bond: (continued) | | | |
| 13.00%, 1/25/31 | ZMW | 13,735 | $ 386,887 |
| | | | $ 10,662,736 |
Total Sovereign Government Bonds
(identified cost $1,423,872,830) | | | $1,348,674,822 |
| Borrower/Description | Principal
Amount
(000's omitted) | Value |
| Ivory Coast — 0.2% |
| Republic of Ivory Coast, Term Loan, 9.638%, (6 mo. EURIBOR + 5.75%), 1/6/28(4) | EUR | 5,090 | $ 5,806,195 |
| | | | $ 5,806,195 |
| Kenya — 0.2% |
| Government of Kenya, Term Loan, 12.203%, (6 mo. SOFR + 6.45%), 6/29/25(4) | USD | 5,262 | $ 5,374,649 |
| | | | $ 5,374,649 |
| Tanzania — 3.3% |
| Government of the United Republic of Tanzania, Term Loan, 12.174%, (6 mo. USD LIBOR + 6.30%), 4/28/31(4) | USD | 81,953 | $ 79,997,298 |
| | | | $ 79,997,298 |
Total Sovereign Loans
(identified cost $93,170,821) | | | $ 91,178,142 |
| U.S. Government Guaranteed Small Business Administration Loans(22)(23)— 0.5% |
| Security | Principal
Amount
(000's omitted) | Value |
| 1.88%, 12/28/42 | $ | 1,277 | $ 70,474 |
| 2.24%, 11/15/32 to 4/10/43(24) | | 21,685 | 1,364,779 |
| 2.38%, 11/30/42 to 3/1/43 | | 5,629 | 377,816 |
| 2.63%, 10/27/42 to 3/20/43 | | 5,019 | 349,120 |
| 2.80%, 4/12/27 to 3/10/43(24) | | 45,200 | 3,131,289 |
| 2.88%, 11/7/42 to 2/13/43 | | 4,564 | 382,822 |
| 3.03%, 2/2/27 to 12/17/43(24) | | 53,480 | 3,973,286 |
| 3.13%, 10/12/42 to 1/2/43 | | 2,994 | 268,325 |
| Security | Principal
Amount
(000's omitted) | Value |
| 3.63%, 10/27/42 to 3/28/43 | $ | 14,966 | $ 1,579,526 |
Total U.S. Government Guaranteed Small Business Administration Loans
(identified cost $24,336,553) | | | $ 11,497,437 |
| Security | Shares | Value |
| IRSA Inversiones y Representaciones S.A., Exp. 3/5/26(7) | | 383,780 | $ 146,028 |
Total Warrants
(identified cost $0) | | | $ 146,028 |
| Security | Shares | Value |
| Financial Intermediaries — 0.0% |
| Alpha Holding S.A., Escrow Certificates(7)(9) | | 5,728,000 | $ 0 |
| Alpha Holding S.A., Escrow Certificates(7)(9) | | 11,758,000 | 0 |
Total Miscellaneous
(identified cost $0) | | | $ 0 |
| Short-Term Investments — 26.3% |
| Security | Shares | Value |
| Morgan Stanley Institutional Liquidity Funds - Government Portfolio, Institutional Class, 5.25%(25) | | 230,125,366 | $ 230,125,366 |
Total Affiliated Fund
(identified cost $230,125,366) | | | $ 230,125,366 |
| Repurchase Agreements — 8.1% |
| Description | Principal
Amount
(000's omitted) | Value |
| Bank of America: | | | |
| Dated 7/27/23 with an interest rate of 4.75%, collateralized by USD 3,500,000 Republic of Colombia, 5.20%, due 5/15/49 and a market value, including accrued interest, of $2,335,190(26) | USD | 2,563 | $ 2,563,050 |
| Dated 7/27/23 with an interest rate of 4.75%, collateralized by USD 6,824,000 Republic of Colombia, 6.125%, due 1/18/41 and a market value, including accrued interest, of $5,361,986(26) | USD | 4,997 | 4,997,215 |
28
See Notes to Consolidated Financial Statements.
Global Macro Absolute Return Advantage Portfolio
October 31, 2023
Consolidated Portfolio of Investments — continued
| Description | Principal
Amount
(000's omitted) | Value |
| Bank of America: (continued) | | | |
| Dated 7/27/23 with an interest rate of 4.80%, collateralized by USD 17,326,000 Republic of Colombia, 5.20%, due 5/15/49 and a market value, including accrued interest, of $11,559,859(26) | USD | 12,688 | $ 12,687,830 |
| Dated 7/27/23 with an interest rate of 5.00%, collateralized by USD 8,500,000 Republic of Colombia, 5.20%, due 5/15/49 and a market value, including accrued interest, of $5,671,176(26) | USD | 6,225 | 6,224,550 |
| Dated 8/17/23 with an interest rate of 4.00%, collateralized by USD 3,614,000 Republic of Ecuador, 0.00%, due 7/31/30 and a market value, including accrued interest, of $1,091,220(26) | USD | 1,071 | 1,070,648 |
| Dated 8/21/23 with an interest rate of 3.75%, collateralized by USD 5,075,000 Republic of Ecuador, 0.00%, due 7/31/30 and a market value, including accrued interest, of $1,532,358(26) | USD | 1,516 | 1,516,156 |
| Dated 8/23/23 with an interest rate of 3.60%, collateralized by USD 6,236,000 Republic of Ecuador, 0.00%, due 7/31/30 and a market value, including accrued interest, of $1,882,913(26) | USD | 1,832 | 1,831,825 |
| Dated 10/13/23 with an interest rate of 5.00%, collateralized by USD 2,597,000 Republic of Ecuador, 6.00%, due 7/31/30 and a market value, including accrued interest, of $1,366,127(26) | USD | 1,311 | 1,311,485 |
| Barclays Bank PLC: | | | |
| Dated 8/17/23 with an interest rate of 3.75%, collateralized by USD 3,625,000 Republic of Ecuador, 0.00%, due 7/31/30 and a market value, including accrued interest, of $1,094,541(26) | USD | 1,128 | 1,128,281 |
| Dated 9/8/23 with an interest rate of 4.00%, collateralized by USD 877,000 Republic of Azerbaijan, 5.125%, due 9/1/29 and a market value, including accrued interest, of $814,077(26) | USD | 868 | 868,230 |
| Dated 9/11/23 with an interest rate of 4.00%, collateralized by USD 7,250,000 Republic of Ecuador, 0.00%, due 7/31/30 and a market value, including accrued interest, of $2,189,083(26) | USD | 2,320 | 2,320,000 |
| Dated 9/11/23 with an interest rate of 4.00%, collateralized by USD 730,000 Republic of Azerbaijan, 5.125%, due 9/1/29 and a market value, including accrued interest, of $677,624(26) | USD | 720 | 719,963 |
| Dated 9/12/23 with an interest rate of 4.00%, collateralized by USD 2,191,000 Republic of Azerbaijan, 5.125%, due 9/1/29 and a market value, including accrued interest, of $2,033,799(26) | USD | 2,161 | 2,160,874 |
| Dated 9/20/23 with an interest rate of 2.50%, collateralized by EUR 4,206,000 Republic of Poland, 1.125%, due 8/7/26 and a market value, including accrued interest, of $4,154,468(26) | EUR | 4,111 | 4,350,236 |
| Description | Principal
Amount
(000's omitted) | Value |
| Barclays Bank PLC: (continued) | | | |
| Dated 9/20/23 with an interest rate of 2.60%, collateralized by EUR 3,000,000 Republic of Poland, 2.75%, due 5/25/32 and a market value, including accrued interest, of $2,923,616(26) | EUR | 2,888 | $ 3,055,265 |
| Dated 9/20/23 with an interest rate of 2.75%, collateralized by EUR 1,800,000 Republic of Poland, 1.00%, due 3/7/29 and a market value, including accrued interest, of $1,687,245(26) | EUR | 1,663 | 1,759,356 |
| Dated 9/20/23 with an interest rate of 3.10%, collateralized by EUR 6,000,000 Republic of Poland, 1.00%, due 3/7/29 and a market value, including accrued interest, of $5,624,150(26) | EUR | 5,543 | 5,864,521 |
| Dated 10/11/23 with an interest rate of 0.00%, collateralized by USD 6,441,000 Pakistan Government International Bond, 8.25%, due 9/30/25 and a market value, including accrued interest, of $4,663,781(26) | USD | 3,993 | 3,993,420 |
| Dated 10/11/23 with an interest rate of 1.75%, collateralized by USD 2,245,000 Pakistan Government International Bond, 6.00%, due 4/8/26 and a market value, including accrued interest, of $1,248,968(26) | USD | 1,173 | 1,173,012 |
| Dated 10/11/23 with an interest rate of 2.25%, collateralized by USD 3,400,000 Pakistan Government International Bond, 6.00%, due 4/8/26 and a market value, including accrued interest, of $1,891,533(26) | USD | 1,777 | 1,776,500 |
| Dated 10/11/23 with an interest rate of 2.50%, collateralized by USD 5,736,000 Pakistan Government International Bond, 6.875%, due 12/5/27 and a market value, including accrued interest, of $3,222,381(26) | USD | 3,019 | 3,018,570 |
| Dated 10/11/23 with an interest rate of 2.75%, collateralized by USD 12,453,000 Pakistan Government International Bond, 6.00%, due 4/8/26 and a market value, including accrued interest, of $6,928,019(26) | USD | 6,398 | 6,397,729 |
| Dated 10/11/23 with an interest rate of 4.50%, collateralized by USD 14,500,000 Republic of Ecuador, 0.00%, due 7/31/30 and a market value, including accrued interest, of $4,378,165(26) | USD | 4,368 | 4,368,125 |
| Dated 10/11/23 with an interest rate of 4.95%, collateralized by USD 3,649,000 Republic of Armenia International Bond, 3.60%, due 2/2/31 and a market value, including accrued interest, of $2,731,028(26) | USD | 2,874 | 2,873,587 |
| Dated 10/11/23 with an interest rate of 5.00%, collateralized by USD 26,599,000 Republic of Colombia, 5.20%, due 5/15/49 and a market value, including accrued interest, of $17,746,778(26) | USD | 18,254 | 18,253,564 |
| Dated 10/11/23 with an interest rate of 5.05%, collateralized by USD 14,875,000 Republic of Colombia, 5.20%, due 5/15/49 and a market value, including accrued interest, of $9,924,558(26) | USD | 10,208 | 10,207,969 |
29
See Notes to Consolidated Financial Statements.
Global Macro Absolute Return Advantage Portfolio
October 31, 2023
Consolidated Portfolio of Investments — continued
| Description | Principal
Amount
(000's omitted) | Value |
| Barclays Bank PLC: (continued) | | | |
| Dated 10/11/23 with an interest rate of 5.15% payable by the Portfolio, collateralized by MXN 319,966,354 Mexican Udibonos, 4.00%, due 11/3/50 and a market value, including accrued interest, of $15,515,681(26) | USD | 15,638 | $ 15,638,334 |
| Dated 10/16/23 with an interest rate of 5.15% payable by the Portfolio, collateralized by MXN 413,767,308 Mexican Udibonos, 4.00%, due 11/15/40 and a market value, including accrued interest, of $20,691,404(26) | USD | 21,091 | 21,091,465 |
| JPMorgan Chase Bank, N.A.: | | | |
| Dated 7/27/23 with an interest rate of 4.95%, collateralized by USD 6,824,000 Republic of Colombia, 5.20%, due 5/15/49 and a market value, including accrued interest, of $4,552,954(26) | USD | 5,013 | 5,012,531 |
| Dated 7/27/23 with an interest rate of 5.00%, collateralized by USD 6,813,000 Republic of Colombia, 5.20%, due 5/15/49 and a market value, including accrued interest, of $4,545,615(26) | USD | 5,004 | 5,004,451 |
| Dated 10/6/23 with an interest rate of 5.00%, collateralized by USD 7,317,000 Republic of Ecuador, 6.00%, due 7/31/30 and a market value, including accrued interest, of $3,849,039(26) | USD | 3,744 | 3,743,865 |
| Dated 10/13/23 with an interest rate of 5.00%, collateralized by USD 3,659,000 Republic of Ecuador, 6.00%, due 7/31/30 and a market value, including accrued interest, of $1,924,782(26) | USD | 1,873 | 1,872,798 |
| Nomura International PLC: | | | |
| Dated 8/14/23 with an interest rate of 3.25%, collateralized by USD 6,934,000 Pakistan Government International Bond, 6.00%, due 4/8/26 and a market value, including accrued interest, of $3,857,615(26) | USD | 4,605 | 4,605,043 |
| Dated 9/11/23 with an interest rate of 4.85%, collateralized by USD 3,652,000 Republic of Azerbaijan, 3.50%, due 9/1/32 and a market value, including accrued interest, of $2,883,668(26) | USD | 3,172 | 3,171,981 |
| Dated 9/13/23 with an interest rate of 4.85%, collateralized by USD 1,414,000 Republic of Azerbaijan, 3.50%, due 9/1/32 and a market value, including accrued interest, of $1,116,513(26) | USD | 1,216 | 1,216,118 |
| Dated 9/27/23 with an interest rate of 4.75%, collateralized by USD 4,379,000 Republic of Armenia International Bond, 3.60%, due 2/2/31 and a market value, including accrued interest, of $3,277,384(26) | USD | 3,499 | 3,499,500 |
| Dated 10/11/23 with an interest rate of 3.40%, collateralized by EUR 3,044,000 Republic of Poland, 1.00%, due 3/7/29 and a market value, including accrued interest, of $2,853,319(26) | USD | 2,975 | 2,974,880 |
| Dated 10/11/23 with an interest rate of 4.85%, collateralized by USD 8,762,000 Republic of Azerbaijan, 3.50%, due 9/1/32 and a market value, including accrued interest, of $6,918,592(26) | USD | 7,386 | 7,385,840 |
| Description | Principal
Amount
(000's omitted) | Value |
| Nomura International PLC: (continued) | | | |
| Dated 10/11/23 with an interest rate of 4.90%, collateralized by USD 6,824,000 Republic of Colombia, 5.20%, due 5/15/49 and a market value, including accrued interest, of $4,552,954(26) | USD | 4,718 | $ 4,717,568 |
| Dated 10/11/23 with an interest rate of 5.05%, collateralized by USD 6,826,000 Republic of Colombia, 5.625%, due 2/26/44 and a market value, including accrued interest, of $4,869,434(26) | USD | 5,138 | 5,137,507 |
| Dated 10/11/23 with an interest rate of 5.05%, collateralized by USD 6,825,000 Republic of Colombia, 5.00%, due 6/15/45 and a market value, including accrued interest, of $4,524,828(26) | USD | 4,771 | 4,770,887 |
| Dated 10/11/23 with an interest rate of 5.05%, collateralized by USD 6,875,000 Republic of Colombia, 5.20%, due 5/15/49 and a market value, including accrued interest, of $4,586,981(26) | USD | 4,753 | 4,752,825 |
Total Repurchase Agreements
(identified cost $201,197,637) | | | $ 201,087,554 |
| Sovereign Government Securities — 5.0% |
| Security | Principal
Amount
(000's omitted) | Value |
| Brazil — 4.4% |
| Letra do Tesouro Nacional, 0.00%, 1/1/24 | BRL | 561,300 | $ 109,270,403 |
| | | | $ 109,270,403 |
| Sri Lanka — 0.6% |
| Sri Lanka Treasury Bills: | | | |
| 0.00%, 11/17/23 | LKR | 332,000 | $ 1,007,297 |
| 0.00%, 11/24/23 | LKR | 166,000 | 502,193 |
| 0.00%, 12/8/23 | LKR | 384,641 | 1,156,810 |
| 0.00%, 1/5/24 | LKR | 890,000 | 2,644,286 |
| 0.00%, 1/12/24 | LKR | 1,648,000 | 4,881,097 |
| 0.00%, 3/15/24 | LKR | 200,000 | 577,719 |
| 0.00%, 4/19/24 | LKR | 857,000 | 2,446,002 |
| | | | $ 13,215,404 |
Total Sovereign Government Securities
(identified cost $125,672,882) | | | $ 122,485,807 |
30
See Notes to Consolidated Financial Statements.
Global Macro Absolute Return Advantage Portfolio
October 31, 2023
Consolidated Portfolio of Investments — continued
| U.S. Treasury Obligations — 3.9% |
| Security | Principal
Amount
(000's omitted) | Value |
| U.S. Treasury Bills: | | | |
| 0.00%, 11/30/23(27) | $ | 55,000 | $ 54,765,889 |
| 0.00%, 1/9/24(27) | | 42,000 | 41,575,161 |
Total U.S. Treasury Obligations
(identified cost $96,339,298) | | | $ 96,341,050 |
Total Short-Term Investments
(identified cost $653,335,183) | | | $ 650,039,777 |
| | | |
Total Purchased Options — 0.0%(6)
(identified cost $950,945) | | | $ 770,671 |
Total Investments — 99.6%
(identified cost $2,611,538,307) | | | $2,462,648,511 |
Total Written Options — (0.0)%(6)
(premiums received $338,138) | | | $ (202,436) |
| Securities Sold Short — (8.7)% |
| Common Stocks — (1.3)% |
| Security | Shares | Value |
| New Zealand — (1.3)% |
| a2 Milk Co., Ltd. (The)(7) | | (563,000) | $ (1,371,320) |
| Air New Zealand, Ltd. | | (1,306,400) | (509,864) |
| Auckland International Airport, Ltd. | | (827,749) | (3,540,506) |
| Chorus, Ltd. | | (258,615) | (1,081,732) |
| Contact Energy, Ltd. | | (534,300) | (2,427,039) |
| EBOS Group, Ltd. | | (32,800) | (669,586) |
| Fisher & Paykel Healthcare Corp., Ltd. | | (323,700) | (3,926,352) |
| Fletcher Building, Ltd. | | (629,500) | (1,586,470) |
| Freightways Group, Ltd. | | (51,108) | (221,950) |
| Goodman Property Trust | | (630,200) | (738,113) |
| Infratil, Ltd. | | (529,800) | (3,033,649) |
| Kiwi Property Group, Ltd. | | (714,465) | (322,729) |
| Mainfreight, Ltd. | | (56,400) | (1,882,530) |
| Mercury NZ, Ltd. | | (469,259) | (1,614,223) |
| Meridian Energy, Ltd. | | (854,400) | (2,406,298) |
| Precinct Properties New Zealand, Ltd. | | (1,111,675) | (719,619) |
| Ryman Healthcare, Ltd. | | (369,100) | (1,223,681) |
| SKYCITY Entertainment Group, Ltd. | | (402,000) | (438,178) |
| Security | Shares | Value |
| New Zealand (continued) |
| Spark New Zealand, Ltd. | | (1,322,400) | $ (3,839,084) |
| Summerset Group Holdings, Ltd. | | (106,094) | (602,508) |
Total Common Stocks
(proceeds $37,921,506) | | | $ (32,155,431) |
| Sovereign Government Bonds — (7.4)% |
| Security | Principal
Amount
(000's omitted) | Value |
| Armenia — (0.2)% |
| Republic of Armenia International Bond, 3.60%, 2/2/31(8) | USD | (8,028) | $ (5,936,963) |
| | | | $ (5,936,963) |
| Azerbaijan — (0.6)% |
| Republic of Azerbaijan: | | | |
| 3.50%, 9/1/32(8) | USD | (13,828) | $ (10,838,110) |
| 5.125%, 9/1/29(8) | USD | (3,798) | (3,493,058) |
| | | | $ (14,331,168) |
| Colombia — (3.1)% |
| Republic of Colombia: | | | |
| 5.00%, 6/15/45 | USD | (6,825) | $ (4,395,911) |
| 5.20%, 5/15/49 | USD | (95,747) | (61,586,330) |
| 5.625%, 2/26/44 | USD | (6,826) | (4,800,108) |
| 6.125%, 1/18/41 | USD | (6,824) | (5,240,603) |
| | | | $ (76,022,952) |
| Ecuador — (0.7)% |
| Republic of Ecuador: | | | |
| 0.00%, 7/31/30(8) | USD | (40,300) | $ (12,168,280) |
| 6.00% to 7/31/24, 7/31/30(8)(19) | USD | (9,219) | (4,709,747) |
| | | | $ (16,878,027) |
| Mexico — (1.4)% |
| Mexican Udibonos: | | | |
| 4.00%, 11/15/40(21) | MXN | (413,767) | $ (20,326,752) |
| 4.00%, 11/3/50(21) | MXN | (319,966) | (15,233,696) |
| | | | $ (35,560,448) |
| Pakistan — (0.9)% |
| Pakistan Government International Bond: | | | |
| 6.00%, 4/8/26(8) | USD | (25,032) | $ (13,830,180) |
31
See Notes to Consolidated Financial Statements.
Global Macro Absolute Return Advantage Portfolio
October 31, 2023
Consolidated Portfolio of Investments — continued
| Security | Principal
Amount
(000's omitted) | Value |
| Pakistan (continued) |
| Pakistan Government International Bond: (continued) | | | |
| 6.875%, 12/5/27(8) | USD | (5,736) | $ (3,062,450) |
| 8.25%, 9/30/25(8) | USD | (6,441) | (4,618,023) |
| | | | $ (21,510,653) |
| Poland — (0.5)% |
| Republic of Poland: | | | |
| 1.00%, 3/7/29(8) | EUR | (10,844) | $ (10,089,582) |
| 2.75%, 5/25/32(8) | EUR | (3,000) | (2,885,350) |
| | | | $ (12,974,932) |
Total Sovereign Government Bonds
(proceeds $190,720,218) | | | $ (183,215,143) |
Total Securities Sold Short
(proceeds $228,641,724) | | | $ (215,370,574) |
| | | |
| Other Assets, Less Liabilities — 9.1% | | | $ 225,942,282 |
| Net Assets — 100.0% | | | $2,473,017,783 |
| The percentage shown for each investment category in the Consolidated Portfolio of Investments is based on net assets. |
| (1) | Interest only security that entitles the holder to receive only interest payments on the underlying mortgages. Principal amount shown is the notional amount of the underlying mortgages on which coupon interest is calculated. |
| (2) | Inverse floating-rate security whose coupon varies inversely with changes in the interest rate index. The stated interest rate represents the coupon rate in effect at October 31, 2023. |
| (3) | Security exempt from registration under Rule 144A of the Securities Act of 1933, as amended. These securities may be sold in certain transactions in reliance on an exemption from registration (normally to qualified institutional buyers). At October 31, 2023, the aggregate value of these securities is $171,087,821 or 6.9% of the Portfolio's net assets. |
| (4) | Variable rate security. The stated interest rate represents the rate in effect at October 31, 2023. |
| (5) | Weighted average fixed-rate coupon that changes/updates monthly. Rate shown is the rate at October 31, 2023. |
| (6) | Amount is less than 0.05% or (0.05)%, as applicable. |
| (7) | Non-income producing security. |
| (8) | Security exempt from registration under Regulation S of the Securities Act of 1933, as amended, which exempts from registration securities offered and sold outside the United States. Security may not be offered or sold in the United States except pursuant to an exemption from, or in a transaction not subject to, the registration requirements of the Securities Act of 1933, as amended. At October 31, 2023, the aggregate value of these securities is $688,396,151 or 27.8% of the Portfolio's net assets. |
| (9) | For fair value measurement disclosure purposes, security is categorized as Level 3 (see Note 10). |
| (10) | Issuer is in default with respect to interest and/or principal payments or has declared bankruptcy. For a variable rate security, interest rate has been adjusted to reflect non-accrual status. |
| (11) | Security converts to variable rate after the indicated fixed-rate coupon period. |
| (12) | Perpetual security with no stated maturity date but may be subject to calls by the issuer. |
| (13) | Limited recourse note whose payments by the issuer are limited to amounts received by the issuer from the borrower pursuant to a loan agreement with the borrower. |
| (14) | Quantity held represents principal in USD. |
| (15) | Security is subject to risk of loss depending on the occurrence, frequency and severity of the loss events that are covered by underlying reinsurance contracts and that may occur during a specified risk period. |
| (16) | Restricted security (see Note 5). |
| (17) | Senior floating-rate loans (Senior Loans) often require prepayments from excess cash flows or permit the borrowers to repay at their election. The degree to which borrowers repay, whether as a contractual requirement or at their election, cannot be predicted with accuracy. As a result, the actual remaining maturity may be substantially less than the stated maturities shown. However, Senior Loans will typically have an expected average life of approximately two to four years. Senior Loans typically have rates of interest which are redetermined periodically by reference to a base lending rate, plus a spread. These base lending rates are primarily the Secured Overnight Financing Rate (“SOFR”) (or the London Interbank Offered Rate (“LIBOR”) for those loans whose rates reset prior to the discontinuance of LIBOR on June 30, 2023) and secondarily, the prime rate offered by one or more major United States banks (the “Prime Rate”). Base lending rates may be subject to a floor, or minimum rate. Rates for SOFR are generally 1 or 3-month tenors and may also be subject to a credit spread adjustment. Senior Loans are generally subject to contractual restrictions that must be satisfied before they can be bought or sold. |
| (18) | Fixed-rate loan. |
| (19) | Step coupon security. Interest rate represents the rate in effect at October 31, 2023. |
| (20) | Security (or a portion thereof) has been pledged for the benefit of the counterparty for reverse repurchase agreements. |
| (21) | Inflation-linked security whose principal is adjusted for inflation based on changes in a designated inflation index or inflation rate for the applicable country. Interest is calculated based on the inflation-adjusted principal. |
| (22) | Interest only security that entitles the holder to receive only a portion of the interest payments on the underlying loans. Principal amount shown is the notional amount of the underlying loans on which coupon interest is calculated. |
| (23) | Securities comprise a trust that is wholly-owned by the Portfolio and may only be sold on a pro rata basis with all securities in the trust. |
32
See Notes to Consolidated Financial Statements.
Global Macro Absolute Return Advantage Portfolio
October 31, 2023
Consolidated Portfolio of Investments — continued
| (24) | The stated interest rate represents the weighted average fixed interest rate at October 31, 2023 of all interest only securities comprising the certificate. |
| (25) | May be deemed to be an affiliated investment company. The rate shown is the annualized seven-day yield as of October 31, 2023. |
| (26) | Open repurchase agreement with no specific maturity date. Either party may terminate the agreement upon demand. |
| (27) | Security (or a portion thereof) has been pledged to cover collateral requirements on open derivative contracts. |
| Purchased Currency Options (OTC) — 0.0%(1) |
| Description | Counterparty | Notional Amount | Exercise
Price | Expiration
Date | Value |
| Call USD vs. Put CNH | Barclays Bank PLC | USD | 32,100,000 | CNH | 7.30 | 1/18/24 | $279,848 |
| Call USD vs. Put CNH | Goldman Sachs International | USD | 56,300,000 | CNH | 7.30 | 1/18/24 | 490,823 |
| Total | | | | | | | $770,671 |
| (1) | Amount is less than 0.05%. |
| Written Currency Options (OTC) — (0.0)%(1) |
| Description | Counterparty | Notional Amount | Exercise
Price | Expiration
Date | Value |
| Call USD vs. Put CNH | Barclays Bank PLC | USD | 32,100,000 | CNH | 7.50 | 1/18/24 | $ (73,509) |
| Call USD vs. Put CNH | Goldman Sachs International | USD | 56,300,000 | CNH | 7.50 | 1/18/24 | (128,927) |
| Total | | | | | | | $(202,436) |
| (1) | Amount is less than (0.05)%. |
| Forward Foreign Currency Exchange Contracts (Centrally Cleared) |
| Currency Purchased | Currency Sold | Settlement
Date | Value/Unrealized
Appreciation
(Depreciation) |
| CLP | 5,458,471,000 | USD | 5,850,451 | 12/20/23 | $ 231,212 |
| CLP | 3,834,034,000 | USD | 4,079,845 | 12/20/23 | 191,920 |
| CLP | 3,635,045,000 | USD | 3,889,829 | 12/20/23 | 160,228 |
| CLP | 1,876,537,774 | USD | 1,998,945 | 12/20/23 | 91,836 |
| CLP | 2,045,697,000 | USD | 2,207,483 | 12/20/23 | 71,770 |
| CLP | 1,827,357,000 | USD | 1,971,408 | 12/20/23 | 64,578 |
| CLP | 1,573,613,000 | USD | 1,697,606 | 12/20/23 | 55,666 |
| CLP | 725,023,570 | USD | 784,471 | 12/20/23 | 23,329 |
| CLP | 100,000,000 | USD | 106,755 | 12/20/23 | 4,662 |
| CLP | 1,494,947,000 | USD | 1,668,002 | 12/20/23 | (2,378) |
| CLP | 1,494,947,000 | USD | 1,668,971 | 12/20/23 | (3,346) |
| CLP | 2,989,892,000 | USD | 3,335,072 | 12/20/23 | (3,825) |
| CLP | 1,494,947,000 | USD | 1,669,865 | 12/20/23 | (4,241) |
| CLP | 1,494,946,000 | USD | 1,669,864 | 12/20/23 | (4,241) |
| CLP | 1,494,947,000 | USD | 1,673,136 | 12/20/23 | (7,511) |
| COP | 8,032,200,000 | USD | 1,941,280 | 12/20/23 | (10,549) |
33
See Notes to Consolidated Financial Statements.
Global Macro Absolute Return Advantage Portfolio
October 31, 2023
Consolidated Portfolio of Investments — continued
| Forward Foreign Currency Exchange Contracts (Centrally Cleared) (continued) |
| Currency Purchased | Currency Sold | Settlement
Date | Value/Unrealized
Appreciation
(Depreciation) |
| COP | 62,262,000,000 | USD | 15,047,927 | 12/20/23 | $ (81,770) |
| EUR | 2,140,000 | USD | 2,291,555 | 12/20/23 | (22,173) |
| EUR | 3,087,961 | USD | 3,306,650 | 12/20/23 | (31,995) |
| IDR | 64,596,619,897 | USD | 4,108,853 | 12/20/23 | (56,803) |
| IDR | 382,346,349,516 | USD | 24,316,563 | 12/20/23 | (332,543) |
| KRW | 48,288,000,000 | USD | 36,425,629 | 12/20/23 | (639,208) |
| KRW | 58,668,200,000 | USD | 44,272,875 | 12/20/23 | (793,648) |
| PEN | 55,562,000 | USD | 14,306,460 | 12/20/23 | 129,378 |
| PEN | 8,686,000 | USD | 2,247,988 | 12/20/23 | 8,765 |
| USD | 35,074,122 | CLP | 31,540,404,344 | 12/20/23 | (67,241) |
| USD | 11,232,339 | COP | 46,474,700,000 | 12/20/23 | 61,036 |
| USD | 965,240 | COP | 3,997,029,000 | 12/20/23 | 4,459 |
| USD | 968,908 | COP | 4,035,171,000 | 12/20/23 | (1,042) |
| USD | 89,088,248 | EUR | 83,196,287 | 12/20/23 | 862,026 |
| USD | 79,490,096 | EUR | 74,232,920 | 12/20/23 | 769,153 |
| USD | 58,382,187 | EUR | 54,521,009 | 12/20/23 | 564,911 |
| USD | 57,911,176 | EUR | 54,081,149 | 12/20/23 | 560,354 |
| USD | 46,123,336 | EUR | 43,072,912 | 12/20/23 | 446,293 |
| USD | 40,418,379 | EUR | 37,745,260 | 12/20/23 | 391,092 |
| USD | 39,888,339 | EUR | 37,250,275 | 12/20/23 | 385,963 |
| USD | 32,895,635 | EUR | 30,720,042 | 12/20/23 | 318,301 |
| USD | 29,925,326 | EUR | 27,946,178 | 12/20/23 | 289,560 |
| USD | 20,991,321 | EUR | 19,603,034 | 12/20/23 | 203,114 |
| USD | 16,055,839 | EUR | 14,993,967 | 12/20/23 | 155,358 |
| USD | 15,543,621 | EUR | 14,515,624 | 12/20/23 | 150,401 |
| USD | 6,892,395 | EUR | 6,436,558 | 12/20/23 | 66,691 |
| USD | 6,558,754 | EUR | 6,124,983 | 12/20/23 | 63,463 |
| USD | 747,363 | EUR | 697,936 | 12/20/23 | 7,232 |
| USD | 373,186 | EUR | 348,505 | 12/20/23 | 3,611 |
| USD | 4,906,667 | EUR | 4,649,490 | 12/20/23 | (23,925) |
| USD | 7,942,577 | EUR | 7,526,276 | 12/20/23 | (38,728) |
| USD | 22,172,649 | EUR | 21,010,496 | 12/20/23 | (108,113) |
| USD | 24,930,933 | IDR | 383,525,000,000 | 12/20/23 | 872,977 |
| USD | 16,078,583 | IDR | 247,015,275,227 | 12/20/23 | 583,681 |
| USD | 12,461,723 | IDR | 191,761,000,000 | 12/20/23 | 432,840 |
| USD | 12,461,044 | IDR | 191,763,000,000 | 12/20/23 | 432,034 |
| USD | 12,032,946 | IDR | 189,202,424,764 | 12/20/23 | 164,557 |
| USD | 649,137 | IDR | 9,986,000,000 | 12/20/23 | 22,730 |
| USD | 418,612 | IDR | 6,431,135,711 | 12/20/23 | 15,196 |
| USD | 324,474 | IDR | 4,993,000,000 | 12/20/23 | 11,270 |
| USD | 324,453 | IDR | 4,993,000,000 | 12/20/23 | 11,249 |
| USD | 5,723,180 | INR | 478,000,000 | 12/20/23 | (8,602) |
| USD | 9,624,132 | INR | 804,000,000 | 12/20/23 | (16,773) |
| USD | 14,411,826 | INR | 1,204,000,000 | 12/20/23 | (25,550) |
34
See Notes to Consolidated Financial Statements.
Global Macro Absolute Return Advantage Portfolio
October 31, 2023
Consolidated Portfolio of Investments — continued
| Forward Foreign Currency Exchange Contracts (Centrally Cleared) (continued) |
| Currency Purchased | Currency Sold | Settlement
Date | Value/Unrealized
Appreciation
(Depreciation) |
| USD | 19,216,954 | INR | 1,605,000,000 | 12/20/23 | $ (28,884) |
| USD | 24,733,629 | INR | 2,066,000,000 | 12/20/23 | (40,141) |
| USD | 67,288,354 | PEN | 250,528,000 | 12/20/23 | 2,197,436 |
| USD | 39,610,567 | PEN | 147,688,000 | 12/20/23 | 1,239,018 |
| USD | 7,156,786 | PEN | 26,620,383 | 12/20/23 | 240,413 |
| USD | 10,998,189 | PEN | 42,087,000 | 12/20/23 | 63,357 |
| USD | 1,858,616 | PEN | 6,920,000 | 12/20/23 | 60,697 |
| USD | 10,688,603 | PEN | 40,994,000 | 12/20/23 | 37,750 |
| USD | 10,454,995 | PEN | 40,189,000 | 12/20/23 | 13,292 |
| USD | 13,091,265 | PHP | 743,000,000 | 12/20/23 | 7,760 |
| USD | 15,269,327 | PHP | 867,000,000 | 12/20/23 | 2,302 |
| USD | 16,128,464 | PHP | 916,000,000 | 12/20/23 | (1,403) |
| USD | 26,155,134 | PHP | 1,486,108,580 | 12/20/23 | (13,789) |
| USD | 13,025,428 | PHP | 742,000,000 | 12/20/23 | (40,469) |
| USD | 15,375,057 | PHP | 876,000,000 | 12/20/23 | (50,449) |
| | | | | | $10,285,581 |
| Forward Foreign Currency Exchange Contracts (OTC) |
| Currency Purchased | Currency Sold | Counterparty | Settlement
Date | Unrealized
Appreciation | Unrealized
(Depreciation) |
| EUR | 20,819,015 | USD | 21,930,554 | Citibank, N.A. | 11/3/23 | $ 98,919 | $ — |
| USD | 1,797,297 | EUR | 1,697,232 | Citibank, N.A. | 11/3/23 | 1,384 | — |
| USD | 2,427,592 | EUR | 2,293,439 | Goldman Sachs International | 11/3/23 | 807 | — |
| USD | 1,787,983 | EUR | 1,697,232 | Goldman Sachs International | 11/3/23 | — | (7,929) |
| USD | 4,975,744 | EUR | 4,722,105 | Standard Chartered Bank | 11/3/23 | — | (20,913) |
| USD | 3,591,873 | EUR | 3,382,000 | UBS AG | 11/3/23 | 13,237 | — |
| USD | 2,314,107 | EUR | 2,184,212 | UBS AG | 11/3/23 | 2,901 | — |
| USD | 1,793,558 | EUR | 1,694,181 | UBS AG | 11/3/23 | 874 | — |
| USD | 5,550,960 | GBP | 4,573,374 | Citibank, N.A. | 11/3/23 | — | (7,774) |
| OMR | 10,000,000 | USD | 25,940,545 | Standard Chartered Bank | 11/6/23 | 43,218 | — |
| OMR | 5,300,000 | USD | 13,755,872 | Standard Chartered Bank | 11/6/23 | 15,523 | — |
| OMR | 548,000 | USD | 1,423,488 | Standard Chartered Bank | 11/6/23 | 423 | — |
| USD | 48,448,681 | OMR | 18,858,800 | Standard Chartered Bank | 11/6/23 | — | (553,580) |
| ILS | 41,606,661 | USD | 11,248,914 | Bank of America, N.A. | 11/13/23 | — | (951,157) |
| USD | 10,013,351 | ILS | 39,418,559 | Citibank, N.A. | 11/13/23 | 257,156 | — |
| USD | 554,267 | ILS | 2,188,102 | HSBC Bank USA, N.A. | 11/13/23 | 12,706 | — |
| USD | 27,114,500 | PEN | 103,928,000 | Standard Chartered Bank | 11/13/23 | 72,980 | — |
| USD | 3,508,739 | PKR | 1,084,200,446 | Standard Chartered Bank | 11/22/23 | — | (342,498) |
| ILS | 85,654,026 | USD | 22,659,795 | HSBC Bank USA, N.A. | 11/24/23 | — | (1,450,408) |
| USD | 10,761,387 | ILS | 42,363,277 | Standard Chartered Bank | 11/24/23 | 271,522 | — |
| USD | 10,965,513 | ILS | 43,290,749 | UBS AG | 11/24/23 | 245,990 | — |
| USD | 2,187,898 | PKR | 687,000,000 | Deutsche Bank AG | 11/24/23 | — | (252,390) |
35
See Notes to Consolidated Financial Statements.
Global Macro Absolute Return Advantage Portfolio
October 31, 2023
Consolidated Portfolio of Investments — continued
| Forward Foreign Currency Exchange Contracts (OTC) (continued) |
| Currency Purchased | Currency Sold | Counterparty | Settlement
Date | Unrealized
Appreciation | Unrealized
(Depreciation) |
| USD | 2,188,088 | PKR | 698,000,000 | JPMorgan Chase Bank, N.A. | 11/27/23 | $ — | $ (291,218) |
| USD | 2,076,190 | PKR | 654,000,000 | Standard Chartered Bank | 11/27/23 | — | (246,827) |
| USD | 2,028,993 | PKR | 650,799,554 | Standard Chartered Bank | 11/27/23 | — | (282,656) |
| UZS | 23,620,880,922 | USD | 2,005,168 | ICBC Standard Bank plc | 11/27/23 | — | (78,952) |
| ILS | 14,793,479 | USD | 3,934,949 | BNP Paribas | 11/28/23 | — | (271,217) |
| ILS | 47,022,462 | USD | 12,365,432 | BNP Paribas | 11/28/23 | — | (719,918) |
| ISK | 915,862,918 | EUR | 6,322,837 | JPMorgan Chase Bank, N.A. | 11/28/23 | — | (145,076) |
| USD | 5,677,636 | ILS | 22,397,381 | Citibank, N.A. | 11/28/23 | 130,733 | — |
| USD | 10,000,396 | ILS | 39,418,559 | JPMorgan Chase Bank, N.A. | 11/28/23 | 238,053 | — |
| TRY | 168,067,954 | USD | 5,837,665 | Standard Chartered Bank | 12/8/23 | — | (70,053) |
| USD | 3,379,089 | EUR | 3,191,000 | BNP Paribas | 12/8/23 | — | (2,433) |
| USD | 3,376,981 | EUR | 3,191,000 | Citibank, N.A. | 12/8/23 | — | (4,541) |
| USD | 10,502,000 | EUR | 9,927,000 | Citibank, N.A. | 12/8/23 | — | (17,701) |
| USD | 7,503,508 | EUR | 7,091,000 | HSBC Bank USA, N.A. | 12/8/23 | — | (10,867) |
| USD | 81,448 | EUR | 76,718 | UBS AG | 12/8/23 | 149 | — |
| USD | 5,858,020 | TRY | 168,067,954 | Standard Chartered Bank | 12/8/23 | 90,408 | — |
| UZS | 50,129,203,000 | USD | 4,010,336 | ICBC Standard Bank plc | 12/18/23 | — | (65,761) |
| AUD | 41,000,000 | USD | 26,203,215 | BNP Paribas | 12/20/23 | — | (152,982) |
| AUD | 41,000,000 | USD | 26,472,839 | Citibank, N.A. | 12/20/23 | — | (422,606) |
| AUD | 60,000,000 | USD | 38,757,000 | Citibank, N.A. | 12/20/23 | — | (634,707) |
| AUD | 36,275,670 | USD | 23,441,167 | Standard Chartered Bank | 12/20/23 | — | (392,639) |
| CAD | 101,170,000 | USD | 74,000,252 | Standard Chartered Bank | 12/20/23 | — | (983,263) |
| CZK | 45,388,806 | EUR | 1,843,179 | Goldman Sachs International | 12/20/23 | — | (1,894) |
| CZK | 233,920,133 | EUR | 9,513,125 | Goldman Sachs International | 12/20/23 | — | (24,548) |
| CZK | 45,388,807 | EUR | 1,845,019 | UBS AG | 12/20/23 | — | (3,847) |
| CZK | 224,142,254 | EUR | 9,108,512 | UBS AG | 12/20/23 | — | (16,137) |
| EUR | 3,129,348 | CZK | 77,525,248 | Bank of America, N.A. | 12/20/23 | — | (16,752) |
| EUR | 1,230,999 | CZK | 30,487,194 | Citibank, N.A. | 12/20/23 | — | (6,199) |
| EUR | 7,824,510 | CZK | 193,813,122 | Citibank, N.A. | 12/20/23 | — | (40,671) |
| EUR | 6,839,840 | CZK | 169,489,187 | Standard Chartered Bank | 12/20/23 | — | (38,408) |
| EUR | 3,130,396 | CZK | 77,525,249 | UBS AG | 12/20/23 | — | (15,641) |
| EUR | 2,708,432 | PLN | 12,656,581 | BNP Paribas | 12/20/23 | — | (128,322) |
| EUR | 665,125 | PLN | 3,107,765 | Goldman Sachs International | 12/20/23 | — | (31,422) |
| EUR | 665,707 | PLN | 3,107,765 | UBS AG | 12/20/23 | — | (30,805) |
| EUR | 2,660,018 | PLN | 12,431,060 | UBS AG | 12/20/23 | — | (126,200) |
| HUF | 4,912,670,454 | EUR | 12,532,131 | BNP Paribas | 12/20/23 | 206,573 | — |
| HUF | 4,496,853,170 | EUR | 11,504,434 | Goldman Sachs International | 12/20/23 | 154,045 | — |
| HUF | 1,808,755,940 | EUR | 4,625,518 | Goldman Sachs International | 12/20/23 | 63,951 | — |
| HUF | 1,229,481,162 | EUR | 3,135,051 | Goldman Sachs International | 12/20/23 | 53,111 | — |
| HUF | 1,229,481,162 | EUR | 3,135,158 | HSBC Bank USA, N.A. | 12/20/23 | 52,998 | — |
| HUF | 4,466,064,049 | EUR | 11,420,859 | Standard Chartered Bank | 12/20/23 | 158,087 | — |
| HUF | 1,808,755,940 | EUR | 4,624,683 | Standard Chartered Bank | 12/20/23 | 64,837 | — |
| HUF | 4,912,670,454 | EUR | 12,524,654 | UBS AG | 12/20/23 | 214,501 | — |
| ILS | 49,568,741 | USD | 13,054,334 | BNP Paribas | 12/20/23 | — | (757,975) |
| ISK | 915,863,000 | EUR | 6,335,960 | Bank of America, N.A. | 12/20/23 | — | (181,159) |
36
See Notes to Consolidated Financial Statements.
Global Macro Absolute Return Advantage Portfolio
October 31, 2023
Consolidated Portfolio of Investments — continued
| Forward Foreign Currency Exchange Contracts (OTC) (continued) |
| Currency Purchased | Currency Sold | Counterparty | Settlement
Date | Unrealized
Appreciation | Unrealized
(Depreciation) |
| ISK | 1,320,871,536 | EUR | 8,983,687 | JPMorgan Chase Bank, N.A. | 12/20/23 | $ — | $ (97,821) |
| ISK | 822,444,819 | EUR | 5,670,078 | JPMorgan Chase Bank, N.A. | 12/20/23 | — | (141,882) |
| ISK | 3,464,132,800 | EUR | 23,547,908 | JPMorgan Chase Bank, N.A. | 12/20/23 | — | (242,959) |
| JPY | 4,546,457,667 | USD | 31,598,371 | Citibank, N.A. | 12/20/23 | — | (1,365,456) |
| JPY | 1,528,000,000 | USD | 10,611,384 | UBS AG | 12/20/23 | — | (450,529) |
| MXN | 357,493,935 | USD | 20,307,412 | BNP Paribas | 12/20/23 | — | (631,717) |
| MXN | 55,936,000 | USD | 3,223,977 | Citibank, N.A. | 12/20/23 | — | (145,380) |
| MXN | 123,269,000 | USD | 6,761,262 | Goldman Sachs International | 12/20/23 | 23,198 | — |
| MXN | 167,989,000 | USD | 9,226,190 | Goldman Sachs International | 12/20/23 | 19,562 | — |
| MXN | 123,269,000 | USD | 6,778,988 | Goldman Sachs International | 12/20/23 | 5,472 | — |
| MXN | 123,269,000 | USD | 6,779,567 | Goldman Sachs International | 12/20/23 | 4,893 | — |
| MXN | 47,638,185 | USD | 2,739,840 | Goldman Sachs International | 12/20/23 | — | (117,937) |
| MXN | 79,159,680 | USD | 4,556,580 | JPMorgan Chase Bank, N.A. | 12/20/23 | — | (199,802) |
| MXN | 369,804,000 | USD | 20,300,987 | Standard Chartered Bank | 12/20/23 | 52,227 | — |
| MXN | 65,335,000 | USD | 3,767,335 | Standard Chartered Bank | 12/20/23 | — | (171,437) |
| NZD | 4,250,000 | USD | 2,516,417 | Citibank, N.A. | 12/20/23 | — | (39,974) |
| NZD | 4,262,617 | USD | 2,523,887 | Citibank, N.A. | 12/20/23 | — | (40,093) |
| NZD | 6,250,000 | USD | 3,700,613 | Citibank, N.A. | 12/20/23 | — | (58,786) |
| NZD | 35,303,077 | USD | 20,902,881 | Citibank, N.A. | 12/20/23 | — | (332,052) |
| NZD | 3,146,034 | USD | 1,859,533 | UBS AG | 12/20/23 | — | (26,363) |
| NZD | 22,034,089 | USD | 13,016,440 | UBS AG | 12/20/23 | — | (177,347) |
| THB | 111,924 | USD | 3,156 | Standard Chartered Bank | 12/20/23 | — | (29) |
| THB | 101,000 | USD | 2,876 | Standard Chartered Bank | 12/20/23 | — | (54) |
| THB | 1,000,000 | USD | 28,710 | Standard Chartered Bank | 12/20/23 | — | (769) |
| USD | 16,710,568 | CNH | 122,000,000 | Citibank, N.A. | 12/20/23 | 38,333 | — |
| USD | 15,240,558 | CNH | 111,000,000 | Goldman Sachs International | 12/20/23 | 71,557 | — |
| USD | 21,008,752 | CNH | 153,422,000 | Goldman Sachs International | 12/20/23 | 42,460 | — |
| USD | 96,979,768 | CNH | 706,205,700 | JPMorgan Chase Bank, N.A. | 12/20/23 | 471,346 | — |
| USD | 10,353,034 | ILS | 40,406,752 | BNP Paribas | 12/20/23 | 329,461 | — |
| USD | 2,326,062 | ILS | 9,161,989 | HSBC Bank USA, N.A. | 12/20/23 | 53,276 | — |
| USD | 6,785,970 | JPY | 1,016,876,598 | HSBC Bank USA, N.A. | 12/20/23 | 23,970 | — |
| USD | 6,501,224 | JPY | 974,123,402 | HSBC Bank USA, N.A. | 12/20/23 | 23,524 | — |
| USD | 4,703,285 | MXN | 85,280,000 | State Street Bank and Trust Company | 12/20/23 | 9,658 | — |
| USD | 4,545,817 | MXN | 82,556,000 | State Street Bank and Trust Company | 12/20/23 | 2,113 | — |
| USD | 4,520,414 | MXN | 82,518,200 | State Street Bank and Trust Company | 12/20/23 | — | (21,210) |
| USD | 2,320,623 | MXN | 42,663,000 | State Street Bank and Trust Company | 12/20/23 | — | (27,457) |
| USD | 34,053,096 | MXN | 605,562,800 | UBS AG | 12/20/23 | 724,226 | — |
| USD | 74,012,250 | NZD | 125,000,000 | Citibank, N.A. | 12/20/23 | 1,175,720 | — |
| USD | 48,114,151 | NZD | 81,522,464 | UBS AG | 12/20/23 | 611,644 | — |
| USD | 237,637 | THB | 8,277,000 | Standard Chartered Bank | 12/20/23 | 6,362 | — |
| USD | 6,276,210 | UYU | 244,636,000 | Citibank, N.A. | 12/20/23 | 192,486 | — |
| USD | 3,128,912 | UYU | 122,184,000 | Citibank, N.A. | 12/20/23 | 90,382 | — |
| USD | 2,210,232 | ZAR | 42,182,883 | Goldman Sachs International | 12/20/23 | — | (43,687) |
| USD | 2,297,123 | ZAR | 43,940,503 | Goldman Sachs International | 12/20/23 | — | (50,709) |
| USD | 7,627,028 | ZAR | 146,008,014 | Goldman Sachs International | 12/20/23 | — | (174,482) |
37
See Notes to Consolidated Financial Statements.
Global Macro Absolute Return Advantage Portfolio
October 31, 2023
Consolidated Portfolio of Investments — continued
| Forward Foreign Currency Exchange Contracts (OTC) (continued) |
| Currency Purchased | Currency Sold | Counterparty | Settlement
Date | Unrealized
Appreciation | Unrealized
(Depreciation) |
| USD | 2,209,687 | ZAR | 42,182,883 | HSBC Bank USA, N.A. | 12/20/23 | $ — | $ (44,232) |
| USD | 2,295,534 | ZAR | 43,940,503 | HSBC Bank USA, N.A. | 12/20/23 | — | (52,298) |
| USD | 6,189,161 | ZAR | 118,118,287 | HSBC Bank USA, N.A. | 12/20/23 | — | (122,143) |
| USD | 7,624,041 | ZAR | 146,008,013 | HSBC Bank USA, N.A. | 12/20/23 | — | (177,469) |
| USD | 6,154,293 | ZAR | 117,383,914 | UBS AG | 12/20/23 | — | (117,772) |
| USD | 400,317 | ZMW | 8,386,651 | JPMorgan Chase Bank, N.A. | 12/20/23 | 22,097 | — |
| ZAR | 22,838,464 | USD | 1,193,014 | Goldman Sachs International | 12/20/23 | 27,292 | — |
| ZAR | 18,687,785 | USD | 973,510 | Goldman Sachs International | 12/20/23 | 25,017 | — |
| ZAR | 6,837,864 | USD | 357,470 | Goldman Sachs International | 12/20/23 | 7,891 | — |
| ZAR | 4,669,292 | USD | 243,394 | Goldman Sachs International | 12/20/23 | 6,096 | — |
| ZAR | 5,880,563 | USD | 308,120 | Goldman Sachs International | 12/20/23 | 6,090 | — |
| ZAR | 22,838,464 | USD | 1,192,547 | HSBC Bank USA, N.A. | 12/20/23 | 27,760 | — |
| ZAR | 16,323,971 | USD | 855,343 | HSBC Bank USA, N.A. | 12/20/23 | 16,880 | — |
| ZAR | 6,837,864 | USD | 357,223 | HSBC Bank USA, N.A. | 12/20/23 | 8,138 | — |
| ZAR | 5,880,563 | USD | 308,044 | HSBC Bank USA, N.A. | 12/20/23 | 6,166 | — |
| ZAR | 4,669,292 | USD | 243,388 | HSBC Bank USA, N.A. | 12/20/23 | 6,102 | — |
| ZAR | 18,431,418 | USD | 961,221 | JPMorgan Chase Bank, N.A. | 12/20/23 | 23,608 | — |
| ZAR | 16,410,872 | USD | 860,402 | UBS AG | 12/20/23 | 16,465 | — |
| USD | 7,559,974 | KES | 1,171,795,907 | Standard Chartered Bank | 12/21/23 | 21,561 | — |
| USD | 3,418,240 | KES | 553,759,398 | Standard Chartered Bank | 12/21/23 | — | (144,211) |
| UZS | 48,492,293,000 | USD | 3,868,551 | ICBC Standard Bank plc | 12/21/23 | 28,106 | — |
| UZS | 24,149,433,000 | USD | 1,934,276 | ICBC Standard Bank plc | 12/21/23 | 6,282 | — |
| USD | 54,685,356 | BRL | 269,000,000 | BNP Paribas | 1/3/24 | 1,699,223 | — |
| USD | 58,149,482 | BRL | 292,300,000 | BNP Paribas | 1/3/24 | 573,844 | — |
| UZS | 44,918,382,000 | USD | 3,579,154 | JPMorgan Chase Bank, N.A. | 1/10/24 | — | (35,531) |
| HUF | 792,286,108 | EUR | 1,943,833 | BNP Paribas | 1/11/24 | 107,117 | — |
| HUF | 2,415,135,335 | EUR | 6,008,397 | UBS AG | 1/11/24 | 238,418 | — |
| HUF | 717,173,477 | EUR | 1,768,992 | UBS AG | 1/11/24 | 86,935 | — |
| EGP | 2,209,540 | USD | 64,989 | Standard Chartered Bank | 1/22/24 | — | (2,172) |
| USD | 61,359 | EGP | 2,209,540 | Goldman Sachs International | 1/22/24 | — | (1,458) |
| UZS | 46,590,925,423 | USD | 3,691,832 | ICBC Standard Bank plc | 1/22/24 | 54,748 | — |
| UZS | 24,410,559,000 | USD | 1,934,276 | ICBC Standard Bank plc | 1/22/24 | 28,684 | — |
| HUF | 3,860,572,749 | EUR | 9,045,391 | Barclays Bank PLC | 1/30/24 | 938,268 | — |
| USD | 2,149,500 | PKR | 644,850,000 | Citibank, N.A. | 1/31/24 | — | (131,723) |
| USD | 2,609,768 | PKR | 788,150,000 | JPMorgan Chase Bank, N.A. | 1/31/24 | — | (178,394) |
| USD | 3,735,505 | PKR | 1,146,800,000 | JPMorgan Chase Bank, N.A. | 2/2/24 | — | (320,447) |
| USD | 1,611,765 | PKR | 493,200,000 | Standard Chartered Bank | 2/2/24 | — | (132,563) |
| USD | 12,218,558 | UGX | 48,141,120,629 | Deutsche Bank AG | 2/6/24 | — | (332,274) |
| USD | 28,368,794 | OMR | 11,000,000 | Standard Chartered Bank | 2/22/24 | — | (194,803) |
| USD | 3,536,774 | KZT | 1,736,556,000 | ICBC Standard Bank plc | 3/14/24 | — | (24,614) |
| USD | 7,073,547 | KZT | 3,474,880,000 | ICBC Standard Bank plc | 3/14/24 | — | (52,855) |
| USD | 26,205,980 | SAR | 98,600,000 | Standard Chartered Bank | 3/14/24 | — | (53,951) |
| USD | 12,408,845 | BHD | 4,730,872 | Standard Chartered Bank | 3/18/24 | — | (114,641) |
| USD | 17,098,499 | BHD | 6,518,000 | Standard Chartered Bank | 3/18/24 | — | (155,842) |
| TRY | 268,396,676 | USD | 8,595,639 | Standard Chartered Bank | 3/20/24 | — | (219,286) |
38
See Notes to Consolidated Financial Statements.
Global Macro Absolute Return Advantage Portfolio
October 31, 2023
Consolidated Portfolio of Investments — continued
| Forward Foreign Currency Exchange Contracts (OTC) (continued) |
| Currency Purchased | Currency Sold | Counterparty | Settlement
Date | Unrealized
Appreciation | Unrealized
(Depreciation) |
| USD | 8,327,475 | TRY | 268,396,676 | Standard Chartered Bank | 3/20/24 | $ — | $ (48,878) |
| USD | 3,671,357 | EGP | 146,120,000 | HSBC Bank USA, N.A. | 3/25/24 | — | (49,444) |
| USD | 10,353,220 | EGP | 397,356,601 | Citibank, N.A. | 6/13/24 | 1,012,970 | — |
| USD | 4,951,483 | KZT | 2,500,499,000 | ICBC Standard Bank plc | 6/18/24 | — | (42,109) |
| NGN | 495,390,017 | USD | 582,812 | JPMorgan Chase Bank, N.A. | 6/20/24 | — | (111,412) |
| NGN | 2,601,891,623 | USD | 3,153,808 | Societe Generale | 6/21/24 | — | (678,683) |
| TRY | 131,342,227 | USD | 3,885,896 | Standard Chartered Bank | 6/21/24 | — | (142,600) |
| USD | 3,740,848 | TRY | 131,342,227 | Standard Chartered Bank | 6/21/24 | — | (2,448) |
| NGN | 1,352,433,739 | USD | 1,591,111 | Standard Chartered Bank | 6/24/24 | — | (305,763) |
| KZT | 1,957,500,000 | USD | 3,828,851 | Societe Generale | 6/25/24 | 73,722 | — |
| USD | 4,244,131 | KZT | 2,175,117,000 | ICBC Standard Bank plc | 6/25/24 | — | (92,295) |
| NGN | 1,393,006,751 | USD | 1,591,111 | Standard Chartered Bank | 6/26/24 | — | (268,021) |
| NGN | 1,313,023,184 | USD | 1,475,319 | Standard Chartered Bank | 7/3/24 | — | (230,889) |
| NGN | 1,414,379,737 | USD | 1,571,533 | Societe Generale | 7/8/24 | — | (233,105) |
| USD | 9,048,690 | SAR | 34,000,000 | Standard Chartered Bank | 7/15/24 | — | (317) |
| USD | 26,650,006 | OMR | 10,530,750 | Standard Chartered Bank | 8/29/24 | — | (647,340) |
| USD | 874,322 | AMD | 348,679,825 | Citibank, N.A. | 9/6/24 | 54,463 | — |
| USD | 52,039 | EGP | 2,209,540 | Standard Chartered Bank | 9/11/24 | 3,040 | — |
| KZT | 3,688,854,849 | USD | 7,073,547 | Citibank, N.A. | 9/16/24 | 143,425 | — |
| KZT | 2,362,387,916 | USD | 4,527,816 | Citibank, N.A. | 9/16/24 | 94,022 | — |
| KZT | 1,846,195,811 | USD | 3,536,774 | Citibank, N.A. | 9/16/24 | 75,172 | — |
| KZT | 1,844,427,424 | USD | 3,536,774 | Citibank, N.A. | 9/16/24 | 71,713 | — |
| USD | 1,213,868 | AMD | 493,134,000 | Citibank, N.A. | 9/16/24 | 56,137 | — |
| USD | 7,073,549 | KZT | 3,589,826,000 | Citibank, N.A. | 9/16/24 | 50,319 | — |
| USD | 3,536,773 | KZT | 1,808,175,000 | Citibank, N.A. | 9/16/24 | — | (788) |
| USD | 8,488,256 | KZT | 4,343,865,000 | Citibank, N.A. | 9/16/24 | — | (10,195) |
| USD | 12,532,608 | EGP | 506,944,000 | Citibank, N.A. | 9/17/24 | 1,323,953 | — |
| USD | 3,536,775 | KZT | 1,835,586,000 | Citibank, N.A. | 9/19/24 | — | (52,108) |
| TRY | 651,103,833 | USD | 17,777,187 | Standard Chartered Bank | 9/20/24 | — | (792,200) |
| USD | 16,999,396 | TRY | 651,103,833 | Standard Chartered Bank | 9/20/24 | 14,409 | — |
| TRY | 176,998,064 | USD | 4,766,379 | Standard Chartered Bank | 9/23/24 | — | (162,439) |
| USD | 4,616,140 | TRY | 176,998,064 | Standard Chartered Bank | 9/23/24 | 12,200 | — |
| USD | 3,603,639 | KZT | 1,877,496,000 | Bank of America, N.A. | 9/30/24 | — | (58,563) |
| USD | 7,657,092 | BHD | 2,927,000 | Standard Chartered Bank | 6/13/25 | — | (41,867) |
| USD | 35,111,769 | BHD | 13,422,878 | Standard Chartered Bank | 6/18/25 | — | (191,852) |
| USD | 11,380,379 | SAR | 42,945,000 | Standard Chartered Bank | 6/18/25 | — | (25,896) |
| | | | | | | $13,405,289 | $(21,155,869) |
39
See Notes to Consolidated Financial Statements.
Global Macro Absolute Return Advantage Portfolio
October 31, 2023
Consolidated Portfolio of Investments — continued
| Futures Contracts |
| Description | Number of
Contracts | Position | Expiration
Date | Notional
Amount | Value/Unrealized
Appreciation
(Depreciation) |
| Commodity Futures | | | | | |
| Brent Crude Oil | 285 | Long | 11/30/23 | $ 24,230,700 | $ (729,379) |
| Equity Futures | | | | | |
| Hang Seng Index | 46 | Long | 11/29/23 | 5,043,516 | 30,998 |
| Nikkei 225 Index | 126 | Long | 12/7/23 | 19,766,250 | (784,353) |
| Euro Stoxx 50 Index | (971) | Short | 12/15/23 | (41,926,911) | 1,815,279 |
| IFSC Nifty 50 Index | (733) | Short | 11/30/23 | (28,092,959) | 291,324 |
| SPI 200 Index | (113) | Short | 12/21/23 | (12,205,367) | 847,840 |
| Interest Rate Futures | | | | | |
| Long Gilt | 550 | Long | 12/27/23 | 62,277,193 | (1,003,504) |
| U.S. Ultra-Long Treasury Bond | 338 | Long | 12/19/23 | 38,046,125 | (4,310,614) |
| Euro-Bobl | (818) | Short | 12/7/23 | (100,652,023) | 565,947 |
| Euro-Bund | (764) | Short | 12/7/23 | (104,274,048) | 1,623,860 |
| Euro-Buxl | (124) | Short | 12/7/23 | (15,799,638) | 1,245,623 |
| Japan 10-Year Bond | (131) | Short | 12/13/23 | (124,237,176) | 1,900,224 |
| U.S. 5-Year Treasury Note | (1,094) | Short | 12/29/23 | (114,297,360) | 575,335 |
| U.S. 10-Year Treasury Note | (303) | Short | 12/19/23 | (32,170,078) | 857,025 |
| U.S. Long Treasury Bond | (217) | Short | 12/19/23 | (23,747,937) | 1,976,856 |
| | | | | | $ 4,902,461 |
| Inflation Swaps (Centrally Cleared) |
Notional Amount
(000's omitted) | Portfolio
Pays/Receives
Return on
Reference Index | Reference Index | Portfolio
Pays/Receives
Rate | Annual
Rate | Termination
Date | Value/Unrealized
Appreciation
(Depreciation) |
| EUR | 11,000 | Receives | Eurostat Eurozone HICP ex Tobacco NSA
(pays upon termination) | Pays | 2.20%
(pays upon termination) | 10/15/36 | $ 1,511,373 |
| EUR | 10,900 | Receives | Eurostat Eurozone HICP ex Tobacco NSA
(pays upon termination) | Pays | 2.20%
(pays upon termination) | 10/15/36 | 1,498,918 |
| EUR | 10,900 | Receives | Eurostat Eurozone HICP ex Tobacco NSA
(pays upon termination) | Pays | 2.20%
(pays upon termination) | 10/15/36 | 1,498,917 |
| EUR | 11,410 | Receives | Eurostat Eurozone HICP ex Tobacco NSA
(pays upon termination) | Pays | 2.08%
(pays upon termination) | 1/15/37 | 1,660,677 |
| EUR | 10,900 | Pays | Eurostat Eurozone HICP ex Tobacco NSA
(pays upon termination) | Receives | 2.29%
(pays upon termination) | 10/15/46 | (1,759,213) |
| EUR | 10,900 | Pays | Eurostat Eurozone HICP ex Tobacco NSA
(pays upon termination) | Receives | 2.29%
(pays upon termination) | 10/15/46 | (1,762,781) |
| EUR | 11,000 | Pays | Eurostat Eurozone HICP ex Tobacco NSA
(pays upon termination) | Receives | 2.29%
(pays upon termination) | 10/15/46 | (1,775,352) |
40
See Notes to Consolidated Financial Statements.
Global Macro Absolute Return Advantage Portfolio
October 31, 2023
Consolidated Portfolio of Investments — continued
| Inflation Swaps (Centrally Cleared) (continued) |
Notional Amount
(000's omitted) | Portfolio
Pays/Receives
Return on
Reference Index | Reference Index | Portfolio
Pays/Receives
Rate | Annual
Rate | Termination
Date | Value/Unrealized
Appreciation
(Depreciation) |
| EUR | 11,410 | Pays | Eurostat Eurozone HICP ex Tobacco NSA
(pays upon termination) | Receives | 2.18%
(pays upon termination) | 1/15/47 | $ (2,031,525) |
| EUR | 4,350 | Pays | Eurostat Eurozone HICP ex Tobacco NSA
(pays upon termination) | Receives | 1.10%
(pays upon termination) | 3/12/50 | (1,919,287) |
| EUR | 7,900 | Pays | Eurostat Eurozone HICP ex Tobacco NSA
(pays upon termination) | Receives | 2.64%
(pays upon termination) | 3/13/53 | (129,362) |
| EUR | 26,300 | Pays | Eurostat Eurozone HICP ex Tobacco NSA
(pays upon termination) | Receives | 2.72%
(pays upon termination) | 6/15/53 | 346,025 |
| USD | 75,000 | Receives | Return on CPI-U (NSA)
(pays upon termination) | Pays | 2.48%
(pays upon termination) | 3/16/28 | 811,772 |
| USD | 50,000 | Receives | Return on CPI-U (NSA)
(pays upon termination) | Pays | 2.49%
(pays upon termination) | 3/16/28 | 521,927 |
| USD | 64,000 | Receives | Return on CPI-U (NSA)
(pays upon termination) | Pays | 2.48%
(pays upon termination) | 3/20/28 | 676,237 |
| USD | 65,000 | Receives | Return on CPI-U (NSA)
(pays upon termination) | Pays | 2.41%
(pays upon termination) | 6/5/28 | 778,235 |
| USD | 26,500 | Receives | Return on CPI-U (NSA)
(pays upon termination) | Pays | 2.60%
(pays upon termination) | 7/31/28 | 71,792 |
| USD | 13,750 | Receives | Return on CPI-U (NSA)
(pays upon termination) | Pays | 2.58%
(pays upon termination) | 8/25/28 | 40,214 |
| USD | 9,489 | Receives | Return on CPI-U (NSA)
(pays upon termination) | Pays | 2.44%
(pays upon termination) | 1/13/33 | 191,917 |
| USD | 4,900 | Receives | Return on CPI-U (NSA)
(pays upon termination) | Pays | 2.60%
(pays upon termination) | 4/3/33 | 46,710 |
| USD | 10,000 | Receives | Return on CPI-U (NSA)
(pays upon termination) | Pays | 2.61%
(pays upon termination) | 4/3/33 | 86,240 |
| USD | 51,550 | Pays | Return on CPI-U (NSA)
(pays upon termination) | Receives | 2.75%
(pays upon termination) | 10/29/36 | (2,293,254) |
| USD | 18,160 | Pays | Return on CPI-U (NSA)
(pays upon termination) | Receives | 2.67%
(pays upon termination) | 1/7/37 | (821,182) |
| USD | 34,300 | Receives | Return on CPI-U (NSA)
(pays upon termination) | Pays | 2.62%
(pays upon termination) | 10/29/46 | 1,916,016 |
| USD | 17,300 | Receives | Return on CPI-U (NSA)
(pays upon termination) | Pays | 2.62%
(pays upon termination) | 10/29/46 | 960,533 |
| USD | 18,140 | Receives | Return on CPI-U (NSA)
(pays upon termination) | Pays | 2.54%
(pays upon termination) | 1/7/47 | 1,135,674 |
| USD | 5,824 | Receives | Return on CPI-U (NSA)
(pays upon termination) | Pays | 2.42%
(pays upon termination) | 6/8/48 | 618,930 |
| USD | 10,710 | Receives | Return on CPI-U (NSA)
(pays upon termination) | Pays | 2.40%
(pays upon termination) | 3/13/53 | 630,661 |
| | | | | | | | $ 2,510,812 |
41
See Notes to Consolidated Financial Statements.
Global Macro Absolute Return Advantage Portfolio
October 31, 2023
Consolidated Portfolio of Investments — continued
| Interest Rate Swaps (Centrally Cleared) |
Notional Amount
(000's omitted) | Portfolio
Pays/
Receives
Floating
Rate | Floating Rate | Annual
Fixed Rate | Termination
Date | Value | Unamortized
Upfront
Receipts
(Payments) | Unrealized
Appreciation
(Depreciation) |
| BRL | 1,551,900 | Pays | Brazil CETIP Interbank Deposit Rate
(pays upon termination) | 11.29%
(pays upon termination) | 7/1/24 | $ (938,974) | $ — | $ (938,974) |
| BRL | 261,625 | Pays | Brazil CETIP Interbank Deposit Rate
(pays upon termination) | 10.40%
(pays upon termination) | 1/2/25 | (550,197) | — | (550,197) |
| BRL | 261,625 | Pays | Brazil CETIP Interbank Deposit Rate
(pays upon termination) | 10.50%
(pays upon termination) | 1/2/25 | (488,280) | — | (488,280) |
| BRL | 255,919 | Pays | Brazil CETIP Interbank Deposit Rate
(pays upon termination) | 10.52%
(pays upon termination) | 1/2/25 | (471,961) | — | (471,961) |
| BRL | 267,331 | Pays | Brazil CETIP Interbank Deposit Rate
(pays upon termination) | 10.52%
(pays upon termination) | 1/2/25 | (491,400) | — | (491,400) |
| BRL | 1,158,100 | Pays | Brazil CETIP Interbank Deposit Rate
(pays upon termination) | 10.96%
(pays upon termination) | 1/2/25 | (661,105) | — | (661,105) |
| CLP | 40,832,380 | Receives | 6-month Sinacofi Chile Interbank Rate
(pays semi-annually) | 4.77%
(pays semi-annually) | 6/6/33 | 1,689,603 | 12,797 | 1,702,400 |
| CLP | 13,713,620 | Receives | 6-month Sinacofi Chile Interbank Rate
(pays semi-annually) | 4.65%
(pays semi-annually) | 6/14/33 | 633,292 | — | 633,292 |
| CLP | 11,010,000 | Receives | 6-month Sinacofi Chile Interbank Rate
(pays semi-annually) | 5.00%
(pays semi-annually) | 6/22/33 | 1,183,010 | — | 1,183,010 |
| CLP | 12,557,000 | Receives | 6-month Sinacofi Chile Interbank Rate
(pays semi-annually) | 5.20%
(pays semi-annually) | 6/22/33 | 1,125,128 | — | 1,125,128 |
| CNY | 170,000 | Pays | 7-day China Fixing Repo Rates
(pays quarterly) | 2.41%
(pays quarterly) | 12/20/28 | (2,987) | — | (2,987) |
| CNY | 225,000 | Pays | 7-day China Fixing Repo Rates
(pays quarterly) | 2.41%
(pays quarterly) | 12/20/28 | (3,954) | — | (3,954) |
| CNY | 108,000 | Pays | 7-day China Fixing Repo Rates
(pays quarterly) | 2.42%
(pays quarterly) | 12/20/28 | 365 | — | 365 |
| CNY | 225,000 | Pays | 7-day China Fixing Repo Rates
(pays quarterly) | 2.42%
(pays quarterly) | 12/20/28 | 4,799 | — | 4,799 |
| CNY | 108,000 | Pays | 7-day China Fixing Repo Rates
(pays quarterly) | 2.43%
(pays quarterly) | 12/20/28 | 10,707 | — | 10,707 |
| CNY | 333,800 | Pays | 7-day China Fixing Repo Rates
(pays quarterly) | 2.43%
(pays quarterly) | 12/20/28 | 34,091 | — | 34,091 |
| CNY | 61,000 | Pays | 7-day China Fixing Repo Rates
(pays quarterly) | 2.44%
(pays quarterly) | 12/20/28 | 7,143 | — | 7,143 |
| CNY | 48,700 | Pays | 7-day China Fixing Repo Rates
(pays quarterly) | 2.44%
(pays quarterly) | 12/20/28 | 6,577 | — | 6,577 |
42
See Notes to Consolidated Financial Statements.
Global Macro Absolute Return Advantage Portfolio
October 31, 2023
Consolidated Portfolio of Investments — continued
| Interest Rate Swaps (Centrally Cleared) (continued) |
Notional Amount
(000's omitted) | Portfolio
Pays/
Receives
Floating
Rate | Floating Rate | Annual
Fixed Rate | Termination
Date | Value | Unamortized
Upfront
Receipts
(Payments) | Unrealized
Appreciation
(Depreciation) |
| CNY | 148,000 | Pays | 7-day China Fixing Repo Rates
(pays quarterly) | 2.44%
(pays quarterly) | 12/20/28 | $ 21,759 | $ — | $ 21,759 |
| CNY | 111,100 | Pays | 7-day China Fixing Repo Rates
(pays quarterly) | 2.44%
(pays quarterly) | 12/20/28 | 16,999 | — | 16,999 |
| CNY | 40,500 | Pays | 7-day China Fixing Repo Rates
(pays quarterly) | 2.45%
(pays quarterly) | 12/20/28 | 7,409 | — | 7,409 |
| CNY | 101,000 | Pays | 7-day China Fixing Repo Rates
(pays quarterly) | 2.46%
(pays quarterly) | 12/20/28 | 26,939 | — | 26,939 |
| CNY | 101,000 | Pays | 7-day China Fixing Repo Rates
(pays quarterly) | 2.47%
(pays quarterly) | 12/20/28 | 29,961 | — | 29,961 |
| CNY | 121,500 | Pays | 7-day China Fixing Repo Rates
(pays quarterly) | 2.47%
(pays quarterly) | 12/20/28 | 39,679 | — | 39,679 |
| CNY | 83,000 | Pays | 7-day China Fixing Repo Rates
(pays quarterly) | 2.47%
(pays quarterly) | 12/20/28 | 27,602 | — | 27,602 |
| COP | 86,746,200 | Receives | Colombia Overnight Interbank Reference Rate
(pays quarterly) | 3.84%
(pays quarterly) | 5/5/25 | 2,329,911 | — | 2,329,911 |
| COP | 40,662,300 | Pays | Colombia Overnight Interbank Reference Rate
(pays quarterly) | 3.19%
(pays quarterly) | 6/4/25 | (1,154,544) | — | (1,154,544) |
| COP | 61,940,900 | Pays | Colombia Overnight Interbank Reference Rate
(pays quarterly) | 3.26%
(pays quarterly) | 6/5/25 | (1,745,078) | — | (1,745,078) |
| COP | 85,106,600 | Pays | Colombia Overnight Interbank Reference Rate
(pays quarterly) | 3.34%
(pays quarterly) | 6/8/25 | (2,362,469) | — | (2,362,469) |
| COP | 41,729,700 | Pays | Colombia Overnight Interbank Reference Rate
(pays quarterly) | 3.44%
(pays quarterly) | 6/9/25 | (1,135,328) | — | (1,135,328) |
| COP | 14,659,900 | Receives | Colombia Overnight Interbank Reference Rate
(pays quarterly) | 3.89%
(pays quarterly) | 11/26/25 | 436,513 | — | 436,513 |
| COP | 6,351,000 | Receives | Colombia Overnight Interbank Reference Rate
(pays quarterly) | 4.02%
(pays quarterly) | 11/26/25 | 185,242 | — | 185,242 |
| COP | 29,320,000 | Receives | Colombia Overnight Interbank Reference Rate
(pays quarterly) | 4.07%
(pays quarterly) | 11/26/25 | 847,339 | — | 847,339 |
| COP | 20,326,400 | Receives | Colombia Overnight Interbank Reference Rate
(pays quarterly) | 4.11%
(pays quarterly) | 11/26/25 | 583,963 | — | 583,963 |
| COP | 6,192,100 | Receives | Colombia Overnight Interbank Reference Rate
(pays quarterly) | 4.21%
(pays quarterly) | 11/26/25 | 174,880 | — | 174,880 |
| COP | 15,771,100 | Receives | Colombia Overnight Interbank Reference Rate
(pays quarterly) | 4.34%
(pays quarterly) | 11/26/25 | 434,758 | — | 434,758 |
43
See Notes to Consolidated Financial Statements.
Global Macro Absolute Return Advantage Portfolio
October 31, 2023
Consolidated Portfolio of Investments — continued
| Interest Rate Swaps (Centrally Cleared) (continued) |
Notional Amount
(000's omitted) | Portfolio
Pays/
Receives
Floating
Rate | Floating Rate | Annual
Fixed Rate | Termination
Date | Value | Unamortized
Upfront
Receipts
(Payments) | Unrealized
Appreciation
(Depreciation) |
| COP | 27,035,200 | Pays | Colombia Overnight Interbank Reference Rate
(pays quarterly) | 5.68%
(pays quarterly) | 11/26/25 | $ (569,412) | $ — | $ (569,412) |
| COP | 35,344,000 | Receives | Colombia Overnight Interbank Reference Rate
(pays quarterly) | 6.06%
(pays quarterly) | 11/26/25 | 583,240 | — | 583,240 |
| COP | 76,566,300 | Receives | Colombia Overnight Interbank Reference Rate
(pays quarterly) | 6.25%
(pays quarterly) | 11/26/25 | 1,198,800 | — | 1,198,800 |
| COP | 7,565,000 | Receives | Colombia Overnight Interbank Reference Rate
(pays quarterly) | 10.17%
(pays quarterly) | 11/26/25 | (6,025) | (88) | (6,113) |
| COP | 14,525,000 | Receives | Colombia Overnight Interbank Reference Rate
(pays quarterly) | 10.28%
(pays quarterly) | 11/26/25 | (19,346) | — | (19,346) |
| CZK | 569,000 | Pays | 6-month CZK PRIBOR
(pays semi-annually) | 4.18%
(pays annually) | 9/20/28 | (384,716) | — | (384,716) |
| CZK | 155,489 | Pays | 6-month CZK PRIBOR
(pays semi-annually) | 3.94%
(pays annually) | 9/20/33 | (327,647) | — | (327,647) |
| CZK | 310,979 | Pays | 6-month CZK PRIBOR
(pays semi-annually) | 3.96%
(pays annually) | 9/20/33 | (639,834) | — | (639,834) |
| CZK | 467,532 | Pays | 6-month CZK PRIBOR
(pays semi-annually) | 3.96%
(pays annually) | 9/20/33 | (949,818) | — | (949,818) |
| CZK | 225,000 | Pays | 6-month CZK PRIBOR
(pays semi-annually) | 4.31%
(pays annually) | 12/20/33 | (114,840) | — | (114,840) |
| EUR | 2,800 | Receives | 1-day Euro Short-Term Rate
(pays annually) | 2.60%
(pays annually) | 1/24/28 | 62,271 | (50) | 62,221 |
| EUR | 5,444 | Pays | 6-month EURIBOR
(pays semi-annually) | 3.03%
(pays annually) | 10/10/29 | (76,893) | — | (76,893) |
| EUR | 1,800 | Pays | 6-month EURIBOR
(pays semi-annually) | 3.17%
(pays annually) | 10/17/29 | (10,301) | — | (10,301) |
| EUR | 2,719 | Pays | 6-month EURIBOR
(pays semi-annually) | 3.01%
(pays annually) | 10/27/29 | (39,770) | — | (39,770) |
| EUR | 600 | Pays | 6-month EURIBOR
(pays semi-annually) | 3.26%
(pays annually) | 10/17/32 | (3,465) | — | (3,465) |
| EUR | 1,200 | Pays | 6-month EURIBOR
(pays semi-annually) | 3.31%
(pays annually) | 10/18/32 | (1,334) | — | (1,334) |
| EUR | 1,200 | Pays | 6-month EURIBOR
(pays semi-annually) | 3.20%
(pays annually) | 10/19/32 | (12,091) | — | (12,091) |
| EUR | 6,500 | Receives | 1-day Euro Short-Term Rate
(pays annually) | 0.83%
(pays annually) | 3/17/52 | 3,044,613 | (1,497) | 3,043,116 |
| EUR | 8,950 | Receives | 1-day Euro Short-Term Rate
(pays annually) | 0.86%
(pays annually) | 3/18/52 | 4,133,615 | 643 | 4,134,258 |
| EUR | 3,019 | Receives | 1-day Euro Short-Term Rate
(pays annually) | 0.87%
(pays annually) | 3/18/52 | 1,386,035 | (106) | 1,385,929 |
| EUR | 1,770 | Receives | 1-day Euro Short-Term Rate
(pays annually) | 1.29%
(pays annually) | 4/20/52 | 659,574 | 33 | 659,607 |
44
See Notes to Consolidated Financial Statements.
Global Macro Absolute Return Advantage Portfolio
October 31, 2023
Consolidated Portfolio of Investments — continued
| Interest Rate Swaps (Centrally Cleared) (continued) |
Notional Amount
(000's omitted) | Portfolio
Pays/
Receives
Floating
Rate | Floating Rate | Annual
Fixed Rate | Termination
Date | Value | Unamortized
Upfront
Receipts
(Payments) | Unrealized
Appreciation
(Depreciation) |
| GBP | 15,312 | Pays | 1-day Sterling Overnight Index Average
(pays annually) | 4.56%
(pays annually) | 10/2/28 | $ 26,027 | $ — | $ 26,027 |
| GBP | 30,192 | Pays | 1-day Sterling Overnight Index Average
(pays annually) | 4.39%
(pays annually) | 12/20/28 | (129,889) | — | (129,889) |
| GBP | 15,096 | Pays | 1-day Sterling Overnight Index Average
(pays annually) | 4.59%
(pays annually) | 12/20/28 | 92,102 | — | 92,102 |
| HUF | 607,981 | Pays | 6-month HUF BUBOR
(pays semi-annually) | 7.95%
(pays annually) | 4/25/33 | 116,211 | — | 116,211 |
| HUF | 3,776,964 | Pays | 6-month HUF BUBOR
(pays semi-annually) | 7.90%
(pays annually) | 4/27/33 | 676,565 | — | 676,565 |
| HUF | 5,920,391 | Pays | 6-month HUF BUBOR
(pays semi-annually) | 8.08%
(pays annually) | 5/25/33 | (1,727) | — | (1,727) |
| HUF | 1,888,482 | Pays | 6-month HUF BUBOR
(pays semi-annually) | 7.88%
(pays annually) | 6/5/33 | (54,712) | — | (54,712) |
| INR | 3,402,510 | Pays | 1-day INR FBIL MIBOR
(pays semi-annually) | 6.73%
(pays semi-annually) | 12/20/25 | 56,515 | — | 56,515 |
| INR | 2,103,490 | Pays | 1-day INR FBIL MIBOR
(pays semi-annually) | 6.73%
(pays semi-annually) | 12/20/25 | 36,088 | — | 36,088 |
| INR | 7,020,000 | Pays | 1-day INR FBIL MIBOR
(pays semi-annually) | 6.75%
(pays semi-annually) | 12/20/25 | 154,162 | — | 154,162 |
| INR | 9,992,000 | Pays | 1-day INR FBIL MIBOR
(pays semi-annually) | 6.75%
(pays semi-annually) | 12/20/25 | 222,705 | — | 222,705 |
| JPY | 6,104,000 | Receives | 1-day Overnight Tokyo Average Rate
(pays annually) | 0.31%
(pays annually) | 12/1/27 | 266,170 | — | 266,170 |
| JPY | 559,000 | Receives | 1-day Overnight Tokyo Average Rate
(pays annually) | 0.32%
(pays annually) | 12/1/27 | 23,226 | — | 23,226 |
| JPY | 5,588,000 | Receives | 1-day Overnight Tokyo Average Rate
(pays annually) | 0.32%
(pays annually) | 12/1/27 | 231,773 | — | 231,773 |
| JPY | 3,184,000 | Receives | 1-day Overnight Tokyo Average Rate
(pays annually) | 0.41%
(pays annually) | 9/20/28 | 234,558 | — | 234,558 |
| JPY | 45,000 | Receives | 1-day Overnight Tokyo Average Rate
(pays annually) | 0.80%
(pays annually) | 9/20/33 | 8,702 | — | 8,702 |
| JPY | 57,000 | Receives | 1-day Overnight Tokyo Average Rate
(pays annually) | 0.80%
(pays annually) | 9/20/33 | 10,986 | — | 10,986 |
| JPY | 36,000 | Receives | 1-day Overnight Tokyo Average Rate
(pays annually) | 0.81%
(pays annually) | 9/20/33 | 6,822 | — | 6,822 |
| JPY | 6,992,000 | Receives | 1-day Overnight Tokyo Average Rate
(pays annually) | 0.82%
(pays annually) | 9/20/33 | 1,269,857 | — | 1,269,857 |
| JPY | 2,841,000 | Receives | 1-day Overnight Tokyo Average Rate
(pays annually) | 0.86%
(pays annually) | 9/20/33 | 432,689 | — | 432,689 |
45
See Notes to Consolidated Financial Statements.
Global Macro Absolute Return Advantage Portfolio
October 31, 2023
Consolidated Portfolio of Investments — continued
| Interest Rate Swaps (Centrally Cleared) (continued) |
Notional Amount
(000's omitted) | Portfolio
Pays/
Receives
Floating
Rate | Floating Rate | Annual
Fixed Rate | Termination
Date | Value | Unamortized
Upfront
Receipts
(Payments) | Unrealized
Appreciation
(Depreciation) |
| JPY | 2,031,000 | Receives | 1-day Overnight Tokyo Average Rate
(pays annually) | 1.07%
(pays annually) | 12/20/33 | $ 107,781 | $ — | $ 107,781 |
| JPY | 537,000 | Receives | 1-day Overnight Tokyo Average Rate
(pays annually) | 1.28%
(pays annually) | 3/15/53 | 356,413 | — | 356,413 |
| JPY | 478,000 | Receives | 1-day Overnight Tokyo Average Rate
(pays annually) | 1.28%
(pays annually) | 3/15/53 | 314,289 | — | 314,289 |
| JPY | 510,000 | Receives | 1-day Overnight Tokyo Average Rate
(pays annually) | 1.29%
(pays annually) | 3/15/53 | 330,768 | — | 330,768 |
| JPY | 1,218,600 | Receives | 1-day Overnight Tokyo Average Rate
(pays annually) | 1.29%
(pays annually) | 3/15/53 | 787,426 | — | 787,426 |
| JPY | 1,128,100 | Receives | 1-day Overnight Tokyo Average Rate
(pays annually) | 1.30%
(pays annually) | 3/15/53 | 718,156 | — | 718,156 |
| JPY | 1,123,900 | Receives | 1-day Overnight Tokyo Average Rate
(pays annually) | 1.30%
(pays annually) | 3/15/53 | 711,003 | — | 711,003 |
| JPY | 480,000 | Receives | 1-day Overnight Tokyo Average Rate
(pays annually) | 1.33%
(pays annually) | 9/20/53 | 306,390 | — | 306,390 |
| KRW | 12,965,000 | Pays | 3-month KRW Certificate of Deposit Rate
(pays quarterly) | 3.57%
(pays quarterly) | 6/21/28 | (214,472) | — | (214,472) |
| KRW | 12,965,000 | Pays | 3-month KRW Certificate of Deposit Rate
(pays quarterly) | 3.60%
(pays quarterly) | 6/21/28 | (199,719) | — | (199,719) |
| KRW | 13,412,000 | Pays | 3-month KRW Certificate of Deposit Rate
(pays quarterly) | 3.61%
(pays quarterly) | 6/21/28 | (204,425) | — | (204,425) |
| KRW | 20,704,100 | Pays | 3-month KRW Certificate of Deposit Rate
(pays quarterly) | 1.65%
(pays quarterly) | 7/19/31 | (2,540,547) | — | (2,540,547) |
| KRW | 4,747,173 | Pays | 3-month KRW Certificate of Deposit Rate
(pays quarterly) | 3.23%
(pays quarterly) | 6/21/33 | (258,423) | — | (258,423) |
| KRW | 28,753,581 | Pays | 3-month KRW Certificate of Deposit Rate
(pays quarterly) | 3.31%
(pays quarterly) | 6/21/33 | (1,431,144) | — | (1,431,144) |
| KRW | 5,306,360 | Pays | 3-month KRW Certificate of Deposit Rate
(pays quarterly) | 3.33%
(pays quarterly) | 6/21/33 | (257,924) | — | (257,924) |
| KRW | 5,345,000 | Pays | 3-month KRW Certificate of Deposit Rate
(pays quarterly) | 3.35%
(pays quarterly) | 6/21/33 | (251,273) | — | (251,273) |
| KRW | 14,189,521 | Pays | 3-month KRW Certificate of Deposit Rate
(pays quarterly) | 3.41%
(pays quarterly) | 6/21/33 | (616,550) | — | (616,550) |
| KRW | 4,881,000 | Pays | 3-month KRW Certificate of Deposit Rate
(pays quarterly) | 3.29%
(pays quarterly) | 9/20/33 | (253,886) | — | (253,886) |
46
See Notes to Consolidated Financial Statements.
Global Macro Absolute Return Advantage Portfolio
October 31, 2023
Consolidated Portfolio of Investments — continued
| Interest Rate Swaps (Centrally Cleared) (continued) |
Notional Amount
(000's omitted) | Portfolio
Pays/
Receives
Floating
Rate | Floating Rate | Annual
Fixed Rate | Termination
Date | Value | Unamortized
Upfront
Receipts
(Payments) | Unrealized
Appreciation
(Depreciation) |
| KRW | 3,543,000 | Pays | 3-month KRW Certificate of Deposit Rate
(pays quarterly) | 3.31%
(pays quarterly) | 9/20/33 | $ (180,957) | $ — | $ (180,957) |
| KRW | 887,765 | Pays | 3-month KRW Certificate of Deposit Rate
(pays quarterly) | 3.31%
(pays quarterly) | 9/20/33 | (45,064) | — | (45,064) |
| KRW | 4,723,000 | Pays | 3-month KRW Certificate of Deposit Rate
(pays quarterly) | 3.33%
(pays quarterly) | 9/20/33 | (233,228) | — | (233,228) |
| KRW | 4,723,600 | Pays | 3-month KRW Certificate of Deposit Rate
(pays quarterly) | 3.34%
(pays quarterly) | 9/20/33 | (230,888) | — | (230,888) |
| KRW | 7,533,000 | Pays | 3-month KRW Certificate of Deposit Rate
(pays quarterly) | 3.40%
(pays quarterly) | 9/20/33 | (338,687) | — | (338,687) |
| KRW | 7,690,000 | Pays | 3-month KRW Certificate of Deposit Rate
(pays quarterly) | 3.52%
(pays quarterly) | 9/20/33 | (290,288) | — | (290,288) |
| KRW | 15,536,000 | Pays | 3-month KRW Certificate of Deposit Rate
(pays quarterly) | 3.56%
(pays quarterly) | 9/20/33 | (549,930) | — | (549,930) |
| KRW | 7,156,000 | Pays | 3-month KRW Certificate of Deposit Rate
(pays quarterly) | 3.56%
(pays quarterly) | 9/20/33 | (252,853) | — | (252,853) |
| KRW | 6,120,000 | Pays | 3-month KRW Certificate of Deposit Rate
(pays quarterly) | 3.56%
(pays quarterly) | 9/20/33 | (214,712) | — | (214,712) |
| KRW | 7,250,000 | Pays | 3-month KRW Certificate of Deposit Rate
(pays quarterly) | 3.59%
(pays quarterly) | 9/20/33 | (240,717) | — | (240,717) |
| KRW | 10,491,000 | Pays | 3-month KRW Certificate of Deposit Rate
(pays quarterly) | 4.02%
(pays quarterly) | 12/20/33 | (76,516) | — | (76,516) |
| KRW | 20,755,000 | Pays | 3-month KRW Certificate of Deposit Rate
(pays quarterly) | 4.03%
(pays quarterly) | 12/20/33 | (136,025) | — | (136,025) |
| MXN | 2,783,830 | Pays | Mexico Interbank TIIE 28 Day
(pays monthly) | 11.33%
(pays monthly) | 10/7/24 | (156,143) | — | (156,143) |
| MXN | 5,211,360 | Pays | Mexico Interbank TIIE 28 Day
(pays monthly) | 11.24%
(pays monthly) | 10/9/24 | (518,769) | — | (518,769) |
| MXN | 1,987,810 | Pays | Mexico Interbank TIIE 28 Day
(pays monthly) | 11.25%
(pays monthly) | 10/10/24 | (191,635) | — | (191,635) |
| PLN | 54,770 | Receives | 6-month PLN WIBOR
(pays semi-annually) | 2.49%
(pays annually) | 10/14/26 | 794,504 | — | 794,504 |
| PLN | 163,380 | Receives | 6-month PLN WIBOR
(pays semi-annually) | 2.49%
(pays annually) | 10/15/26 | 2,373,341 | — | 2,373,341 |
| PLN | 85,600 | Receives | 6-month PLN WIBOR
(pays semi-annually) | 3.39%
(pays annually) | 12/15/26 | 713,344 | — | 713,344 |
| PLN | 48,710 | Receives | 6-month PLN WIBOR
(pays semi-annually) | 5.56%
(pays annually) | 12/21/27 | (621,779) | — | (621,779) |
47
See Notes to Consolidated Financial Statements.
Global Macro Absolute Return Advantage Portfolio
October 31, 2023
Consolidated Portfolio of Investments — continued
| Interest Rate Swaps (Centrally Cleared) (continued) |
Notional Amount
(000's omitted) | Portfolio
Pays/
Receives
Floating
Rate | Floating Rate | Annual
Fixed Rate | Termination
Date | Value | Unamortized
Upfront
Receipts
(Payments) | Unrealized
Appreciation
(Depreciation) |
| PLN | 55,790 | Receives | 6-month PLN WIBOR
(pays semi-annually) | 6.02%
(pays annually) | 12/21/27 | $ (991,839) | $ — | $ (991,839) |
| USD | 1,000 | Receives | SOFR
(pays annually) | 1.21%
(pays annually) | 11/29/26 | 132,441 | — | 132,441 |
| USD | 5,458 | Pays | SOFR
(pays annually) | 1.60%
(pays semi-annually) | 3/10/27 | (678,916) | (3,727) | (682,643) |
| USD | 10,942 | Receives | SOFR
(pays annually) | 1.60%
(pays semi-annually) | 3/10/27 | 1,361,046 | 7,923 | 1,368,969 |
| USD | 75,000 | Pays | SOFR
(pays annually) | 3.55%
(pays semi-annually) | 3/16/28 | (4,942,511) | — | (4,942,511) |
| USD | 50,000 | Pays | SOFR
(pays annually) | 3.57%
(pays semi-annually) | 3/16/28 | (3,331,752) | — | (3,331,752) |
| USD | 64,000 | Pays | SOFR
(pays annually) | 3.56%
(pays annually) | 3/20/28 | (3,183,788) | — | (3,183,788) |
| USD | 65,000 | Pays | SOFR
(pays annually) | 3.49%
(pays annually) | 6/5/28 | (3,337,558) | — | (3,337,558) |
| USD | 26,500 | Pays | SOFR
(pays annually) | 3.95%
(pays annually) | 7/31/28 | (777,551) | — | (777,551) |
| USD | 55,000 | Pays | SOFR
(pays annually) | 4.01%
(pays annually) | 8/4/28 | (1,456,123) | — | (1,456,123) |
| USD | 55,000 | Pays | SOFR
(pays annually) | 4.01%
(pays annually) | 8/4/28 | (1,453,660) | — | (1,453,660) |
| USD | 13,625 | Pays | SOFR
(pays annually) | 4.18%
(pays annually) | 8/23/28 | (250,917) | (409) | (251,326) |
| USD | 11,800 | Pays | SOFR
(pays annually) | 4.05%
(pays annually) | 9/20/28 | (272,286) | — | (272,286) |
| USD | 11,800 | Pays | SOFR
(pays annually) | 4.06%
(pays annually) | 9/20/28 | (270,975) | — | (270,975) |
| USD | 6,917 | Receives | SOFR
(pays annually) | 1.94%
(pays annually) | 3/17/32 | 1,379,609 | 333 | 1,379,942 |
| USD | 10,205 | Pays | SOFR
(pays annually) | 3.23%
(pays semi-annually) | 1/13/33 | (1,277,975) | — | (1,277,975) |
| USD | 4,900 | Pays | SOFR
(pays annually) | 3.27%
(pays annually) | 4/3/33 | (529,459) | — | (529,459) |
| USD | 10,000 | Pays | SOFR
(pays annually) | 3.28%
(pays annually) | 4/3/33 | (1,071,527) | — | (1,071,527) |
| USD | 32,400 | Pays | SOFR
(pays annually) | 3.76%
(pays annually) | 9/20/33 | (901,857) | — | (901,857) |
| ZAR | 161,638 | Pays | 3-month ZAR JIBAR
(pays quarterly) | 7.67%
(pays quarterly) | 1/19/28 | (246,670) | 73 | (246,597) |
| ZAR | 649,365 | Pays | 3-month ZAR JIBAR
(pays quarterly) | 7.71%
(pays quarterly) | 1/19/28 | (935,096) | 332 | (934,764) |
| ZAR | 642,466 | Pays | 3-month ZAR JIBAR
(pays quarterly) | 8.39%
(pays quarterly) | 2/24/28 | (131,497) | 772 | (130,725) |
| ZAR | 603,659 | Pays | 3-month ZAR JIBAR
(pays quarterly) | 8.39%
(pays quarterly) | 2/24/28 | (117,429) | 730 | (116,699) |
| Total | | | | | | $(14,836,551) | $17,759 | $ (14,818,792) |
48
See Notes to Consolidated Financial Statements.
Global Macro Absolute Return Advantage Portfolio
October 31, 2023
Consolidated Portfolio of Investments — continued
| Credit Default Swaps - Sell Protection (Centrally Cleared) |
| Reference Entity | Notional
Amount*
(000's omitted) | Contract Annual
Fixed Rate** | Current
Market Annual
Fixed Rate*** | Termination
Date | Value | Unamortized
Upfront
Receipts
(Payments) | Unrealized
Appreciation
(Depreciation) |
| Colombia | $ 86,100 | 1.00%
(pays quarterly)(1) | 2.20% | 12/20/28 | $ (4,435,277) | $ 4,818,505 | $ 383,228 |
| Total | $86,100 | | | | $(4,435,277) | $4,818,505 | $383,228 |
| Credit Default Swaps - Buy Protection (Centrally Cleared) | |
| Reference Entity | Notional
Amount
(000's omitted) | Contract
Annual
Fixed Rate** | Termination
Date | Value | Unamortized
Upfront
Receipts
(Payments) | Unrealized
Appreciation
(Depreciation) |
| Austria | | $ 18,213 | 1.00%
(pays quarterly)(1) | 12/20/28 | $ (711,940) | $ 689,166 | $ (22,774) |
| China | | 165,600 | 1.00%
(pays quarterly)(1) | 12/20/28 | (1,545,162) | 1,628,896 | 83,734 |
| Finland | | 18,801 | 0.25%
(pays quarterly)(1) | 12/20/28 | (26,138) | 8,593 | (17,545) |
| France | | 87,573 | 0.25%
(pays quarterly)(1) | 12/20/28 | 97,944 | (80,009) | 17,935 |
| Germany | | 85,444 | 0.25%
(pays quarterly)(1) | 12/20/28 | (186,134) | 215,359 | 29,225 |
| Hungary | | 19,438 | 1.00%
(pays quarterly)(1) | 12/20/28 | 487,075 | (510,253) | (23,178) |
| Malaysia | | 286,450 | 1.00%
(pays quarterly)(1) | 12/20/28 | (5,001,055) | 6,581,236 | 1,580,181 |
| Markit CDX Emerging Markets Index (CDX.EM.31.V3) | | 860 | 1.00%
(pays quarterly)(1) | 6/20/24 | (3,914) | (16,771) | (20,685) |
| Markit CDX Emerging Markets Index (CDX.EM.40.V1) | | 100,600 | 1.00%
(pays quarterly)(1) | 12/20/28 | 5,383,770 | (5,558,972) | (175,202) |
| Markit CDX North America High Yield Index (CDX.NA.HY.41.V2) | | 122,000 | 5.00%
(pays quarterly)(1) | 12/20/28 | (119,641) | 393,355 | 273,714 |
| Philippines | | 66,000 | 1.00%
(pays quarterly)(1) | 12/20/28 | (395,796) | 570,538 | 174,742 |
| Poland | | 73,949 | 1.00%
(pays quarterly)(1) | 12/20/28 | (1,152,211) | 935,804 | (216,407) |
| Qatar | | 31,700 | 1.00%
(pays quarterly)(1) | 12/20/28 | (627,503) | 896,531 | 269,028 |
| Romania | | 19,120 | 1.00%
(pays quarterly)(1) | 12/20/28 | 545,577 | (583,706) | (38,129) |
| Saudi | | 192,700 | 1.00%
(pays quarterly)(1) | 12/20/28 | (3,053,782) | 4,400,328 | 1,346,546 |
| Saudi | | 57,200 | 1.00%
(pays quarterly)(1) | 12/20/33 | (164,372) | 817,969 | 653,597 |
| South Africa | | 459,827 | 1.00%
(pays quarterly)(1) | 12/20/28 | 34,241,233 | (32,806,254) | 1,434,979 |
| South Africa | | 58,700 | 1.00%
(pays quarterly)(1) | 6/20/29 | 5,265,033 | (4,829,826) | 435,207 |
| South Africa | | 9,464 | 1.00%
(pays quarterly)(1) | 6/20/31 | 1,327,218 | (1,101,977) | 225,241 |
49
See Notes to Consolidated Financial Statements.
Global Macro Absolute Return Advantage Portfolio
October 31, 2023
Consolidated Portfolio of Investments — continued
| Credit Default Swaps - Buy Protection (Centrally Cleared) (continued) | |
| Reference Entity | Notional
Amount
(000's omitted) | Contract
Annual
Fixed Rate** | Termination
Date | Value | Unamortized
Upfront
Receipts
(Payments) | Unrealized
Appreciation
(Depreciation) |
| Spain | | $127,300 | 1.00%
(pays quarterly)(1) | 12/20/28 | $ (2,755,931) | $ 2,793,906 | $ 37,975 |
| Turkey | | 21,042 | 1.00%
(pays quarterly)(1) | 12/20/28 | 2,534,461 | (2,627,907) | (93,446) |
| United Kingdom | | 85,267 | 1.00%
(pays quarterly)(1) | 12/20/28 | (2,747,974) | 2,723,120 | (24,854) |
| Total | | | | | $31,390,758 | $ (25,460,874) | $5,929,884 |
| Credit Default Swaps - Sell Protection (OTC) |
| Reference Entity | Counterparty | Notional
Amount*
(000's omitted) | Contract Annual
Fixed Rate** | Current
Market
Annual
Fixed Rate*** | Termination
Date | Value | Unamortized
Upfront
Receipts
(Payments) | Unrealized
Appreciation
(Depreciation) |
| Petroleos Mexicanos | Bank of America, N.A. | $ 17,700 | 1.00%
(pays quarterly)(1) | 2.34% | 12/20/23 | $ (11,887) | $ 17,974 | $ 6,087 |
| Vietnam | Goldman Sachs International | 19,880 | 1.00%
(pays quarterly)(1) | 0.68 | 6/20/24 | 63,252 | (37,737) | 25,515 |
| Total | | $37,580 | | | | $ 51,365 | $ (19,763) | $31,602 |
| Credit Default Swaps - Buy Protection (OTC) |
| Reference Entity | Counterparty | Notional
Amount
(000's omitted) | Contract
Annual
Fixed Rate** | Termination
Date | Value | Unamortized
Upfront
Receipts
(Payments) | Unrealized
Appreciation
(Depreciation) |
| Czech Republic | JPMorgan Chase Bank, N.A. | $19,840 | 1.00%
(pays quarterly)(1) | 12/20/28 | $ (633,856) | $ 606,983 | $ (26,873) |
| Dubai | Barclays Bank PLC | 6,348 | 1.00%
(pays quarterly)(1) | 12/20/24 | (54,713) | (23,974) | (78,687) |
| Dubai | Barclays Bank PLC | 9,572 | 1.00%
(pays quarterly)(1) | 12/20/24 | (82,501) | (36,181) | (118,682) |
| Saudi Arabia | Barclays Bank PLC | 25,486 | 1.00%
(pays quarterly)(1) | 6/20/31 | (253,982) | (358,509) | (612,491) |
| Sweden | Citibank, N.A. | 41,185 | 0.25%
(pays quarterly)(1) | 12/20/28 | (158,794) | 151,150 | (7,644) |
| Total | | | | | $(1,183,846) | $ 339,469 | $(844,377) |
50
See Notes to Consolidated Financial Statements.
Global Macro Absolute Return Advantage Portfolio
October 31, 2023
Consolidated Portfolio of Investments — continued
| * | If the Portfolio is the seller of credit protection, the notional amount is the maximum potential amount of future payments the Portfolio could be required to make if a credit event, as defined in the credit default swap agreement, were to occur. At October 31, 2023, such maximum potential amount for all open credit default swaps in which the Portfolio is the seller was $123,680,000. |
| ** | The contract annual fixed rate represents the fixed rate of interest received by the Portfolio (as a seller of protection) or paid by the Portfolio (as a buyer of protection) on the notional amount of the credit default swap contract. |
| *** | Current market annual fixed rates, utilized in determining the net unrealized appreciation or depreciation as of period end, serve as an indicator of the market’s perception of the current status of the payment/performance risk associated with the credit derivative. The current market annual fixed rate of a particular reference entity reflects the cost, as quoted by the pricing vendor, of selling protection against default of that entity as of period end and may include upfront payments required to be made to enter into the agreement. The higher the fixed rate, the greater the market perceived risk of a credit event involving the reference entity. A rate identified as “Defaulted” indicates a credit event has occurred for the reference entity. |
| (1) | Upfront payment is exchanged with the counterparty as a result of the standardized trading coupon. |
| Total Return Swaps (OTC) |
| Counterparty | Notional Amount
(000's omitted) | Portfolio Receives | Portfolio Pays | Termination
Date | Value/Unrealized
Appreciation
(Depreciation) |
| BNP Paribas | USD | 394,000 | Excess Return on Bloomberg Commodity 1 Month Forward Index (pays upon termination) | Excess Return on Bloomberg Commodity Index + 0.13% (pays upon termination) | 2/26/24 | $ (9,561) |
| BNP Paribas | USD | 147,000 | Excess Return on Bloomberg Commodity 3 Month Forward Index (pays upon termination) | Excess Return on Bloomberg Commodity Index + 0.13% (pays upon termination) | 2/26/24 | 63,376 |
| Citibank, N.A. | KRW | 80,750 | Positive Return on KOSPI 200 Index Futures 12/2023 (pays upon termination) | Negative Return on KOSPI 200 Index Futures 12/2023 (pays upon termination) | 12/14/23 | (1,741,959) |
| | | | | | | $ (1,688,144) |
| Cross-Currency Swaps (OTC) | | |
| Counterparty | Portfolio Receives | Portfolio Pays | Termination
Date | Value/Unrealized
Appreciation
(Depreciation) |
| Barclays Bank PLC | 1-day Indice Camara Promedio Rate on CLP 7,890,662,080 (pays semi-annually)* | 1.41% on CLP equivalent of CLF 224,000 (pays semi-annually)* | 1/13/33 | $1,062,411 |
| Goldman Sachs International | 1-day Indice Camara Promedio Rate on CLP 2,698,942,950 (pays semi-annually)* | 2.10% on CLP equivalent of CLF 85,000 (pays semi-annually)* | 4/8/32 | (207,403) |
| Goldman Sachs International | 1-day Indice Camara Promedio Rate on CLP 8,224,633,060 (pays semi-annually)* | 2.25% on CLP equivalent of CLF 259,000 (pays semi-annually)* | 4/11/32 | (750,986) |
| Goldman Sachs International | 1-day Indice Camara Promedio Rate on CLP 1,531,614,475 (pays semi-annually)* | 1.85% on CLP equivalent of CLF 47,900 (pays semi-annually)* | 4/20/32 | (71,473) |
| | | | | $ 32,549 |
| * | At the termination date, the Portfolio will either pay or receive the USD equivalent of the difference between the initial CLP notional amount and the CLP equivalent of the CLF notional amount on such date. |
51
See Notes to Consolidated Financial Statements.
Global Macro Absolute Return Advantage Portfolio
October 31, 2023
Consolidated Portfolio of Investments — continued
| Abbreviations: |
| BUBOR | – Budapest Interbank Offered Rate |
| CPI-U (NSA) | – Consumer Price Index All Urban Non-Seasonally Adjusted |
| EURIBOR | – Euro Interbank Offered Rate |
| FBIL | – Financial Benchmarks India Ltd. |
| GDP | – Gross Domestic Product |
| HICP | – Harmonised Indices of Consumer Prices |
| JIBAR | – Johannesburg Interbank Average Rate |
| |
| LIBOR | – London Interbank Offered Rate |
| MIBOR | – Mumbai Interbank Offered Rate |
| OTC | – Over-the-counter |
| PIK | – Payment In Kind |
| PRIBOR | – Prague Interbank Offered Rate |
| SOFR | – Secured Overnight Financing Rate |
| WIBOR | – Warsaw Interbank Offered Rate |
| Currency Abbreviations: |
| AMD | – Armenian Dram |
| AUD | – Australian Dollar |
| BHD | – Bahraini Dinar |
| BRL | – Brazilian Real |
| CAD | – Canadian Dollar |
| CLF | – Chilean Unidad de Fomento |
| CLP | – Chilean Peso |
| CNH | – Yuan Renminbi Offshore |
| CNY | – Yuan Renminbi |
| COP | – Colombian Peso |
| CZK | – Czech Koruna |
| DOP | – Dominican Peso |
| EGP | – Egyptian Pound |
| EUR | – Euro |
| GBP | – British Pound Sterling |
| HUF | – Hungarian Forint |
| IDR | – Indonesian Rupiah |
| ILS | – Israeli Shekel |
| INR | – Indian Rupee |
| ISK | – Icelandic Krona |
| JPY | – Japanese Yen |
| KES | – Kenyan Shilling |
| KRW | – South Korean Won |
| |
| KZT | – Kazakhstani Tenge |
| LKR | – Sri Lankan Rupee |
| MXN | – Mexican Peso |
| NGN | – Nigerian Naira |
| NZD | – New Zealand Dollar |
| OMR | – Omani Rial |
| PEN | – Peruvian Sol |
| PHP | – Philippine Peso |
| PKR | – Pakistan Rupee |
| PLN | – Polish Zloty |
| RSD | – Serbian Dinar |
| SAR | – Saudi Riyal |
| THB | – Thai Baht |
| TRY | – Turkish Lira |
| UAH | – Ukrainian Hryvnia |
| UGX | – Ugandan Shilling |
| USD | – United States Dollar |
| UYU | – Uruguayan Peso |
| UZS | – Uzbekistani Som |
| ZAR | – South African Rand |
| ZMW | – Zambian Kwacha |
52
See Notes to Consolidated Financial Statements.
Global Macro Absolute Return Advantage Portfolio
October 31, 2023
Consolidated Statement of Assets and Liabilities
| | October 31, 2023 |
| Assets | |
| Unaffiliated investments, at value (identified cost $2,381,412,941) | $ 2,232,523,145 |
| Affiliated investments, at value (identified cost $230,125,366) | 230,125,366 |
| Deposits for derivatives collateral: | |
| Centrally cleared derivatives | 188,834,489 |
| OTC derivatives | 2,099,800 |
| Cash collateral for securities sold short | 48,314,751 |
| Foreign currency, at value (identified cost $41,058,028) | 40,701,391 |
| Interest and dividends receivable | 34,959,530 |
| Dividends receivable from affiliated investments | 989,809 |
| Receivable for investments sold | 3,607,318 |
| Receivable for variation margin on open futures contracts | 137,258 |
| Receivable for open forward foreign currency exchange contracts | 13,405,289 |
| Receivable for open swap contracts | 1,157,389 |
| Upfront payments on open non-centrally cleared swap contracts | 456,401 |
| Tax reclaims receivable | 39,221 |
| Trustees' deferred compensation plan | 150,068 |
| Total assets | $2,797,501,225 |
| Liabilities | |
| Cash collateral due to brokers | $ 2,099,800 |
| Payable for reverse repurchase agreements, including accrued interest of $162,189 | 51,560,669 |
| Written options outstanding, at value (premiums received $338,138) | 202,436 |
| Payable for investments purchased | 17,125,260 |
| Payable for securities sold short, at value (proceeds $228,641,724) | 215,370,574 |
| Payable for variation margin on open centrally cleared derivatives | 396,996 |
| Payable for open forward foreign currency exchange contracts | 21,155,869 |
| Payable for open swap contracts | 3,625,759 |
| Payable for closed swap contracts | 1,145,194 |
| Upfront receipts on open non-centrally cleared swap contracts | 776,107 |
| Due to custodian | 3,954,272 |
| Payable to affiliates: | |
| Investment adviser fee | 1,942,064 |
| Trustees' fees | 9,223 |
| Trustees' deferred compensation plan | 150,068 |
| Other | 147,809 |
| Interest and dividends payable on securities sold short | 4,005,080 |
| Accrued foreign capital gains taxes | 20,331 |
| Accrued expenses | 795,931 |
| Total liabilities | $ 324,483,442 |
| Net Assets applicable to investors' interest in Portfolio | $2,473,017,783 |
53
See Notes to Consolidated Financial Statements.
Global Macro Absolute Return Advantage Portfolio
October 31, 2023
Consolidated Statement of Operations
| | Year Ended |
| | October 31, 2023 |
| Investment Income | |
| Dividend income (net of foreign taxes withheld of $238,643) | $ 3,932,913 |
| Dividend income from affiliated investments | 10,085,746 |
| Interest and other income (net of foreign taxes withheld of $2,397,281) | 159,039,853 |
| Total investment income | $ 173,058,512 |
| Expenses | |
| Investment adviser fee | $ 21,371,612 |
| Trustees’ fees and expenses | 108,505 |
| Custodian fee | 1,259,071 |
| Legal and accounting services | 295,319 |
| Interest expense and fees | 2,898,033 |
| Interest and dividend expense on securities sold short | 12,379,214 |
| Miscellaneous | 108,328 |
| Total expenses | $ 38,420,082 |
| Deduct: | |
| Waiver and/or reimbursement of expenses by affiliates | $ 377,927 |
| Total expense reductions | $ 377,927 |
| Net expenses | $ 38,042,155 |
| Net investment income | $ 135,016,357 |
| Realized and Unrealized Gain (Loss) | |
| Net realized gain (loss): | |
| Investment transactions | $ (214,129,460) |
| Written options | 2,183 |
| Securities sold short | (605,413) |
| Futures contracts | 7,240,307 |
| Swap contracts | (9,546,132) |
| Foreign currency transactions | (4,993,201) |
| Forward foreign currency exchange contracts | 11,702,455 |
| Non-deliverable bond forward contracts | 12,622,320 |
| Net realized loss | $(197,706,941) |
| Change in unrealized appreciation (depreciation): | |
| Investments (including net increase in accrued foreign capital gains taxes of $20,331) | $ 356,387,368 |
| Written options | 135,702 |
| Securities sold short | 7,478,831 |
| Futures contracts | (16,889,470) |
| Swap contracts | (63,796,293) |
| Foreign currency | (1,194,728) |
| Forward foreign currency exchange contracts | (27,477,651) |
| Non-deliverable bond forward contracts | (2,147,972) |
| Net change in unrealized appreciation (depreciation) | $ 252,495,787 |
| Net realized and unrealized gain | $ 54,788,846 |
| Net increase in net assets from operations | $ 189,805,203 |
54
See Notes to Consolidated Financial Statements.
Global Macro Absolute Return Advantage Portfolio
October 31, 2023
Consolidated Statements of Changes in Net Assets
| | Year Ended October 31, |
| | 2023 | 2022 |
| Increase (Decrease) in Net Assets | | |
| From operations: | | |
| Net investment income | $ 135,016,357 | $ 134,697,184 |
| Net realized gain (loss) | (197,706,941) | 139,946,227 |
| Net change in unrealized appreciation (depreciation) | 252,495,787 | (378,537,426) |
| Net increase (decrease) in net assets from operations | $ 189,805,203 | $ (103,894,015) |
| Capital transactions: | | |
| Contributions | $ 548,261,795 | $ 273,908,421 |
| Withdrawals | (209,820,317) | (857,398,700) |
| Net increase (decrease) in net assets from capital transactions | $ 338,441,478 | $ (583,490,279) |
| Net increase (decrease) in net assets | $ 528,246,681 | $ (687,384,294) |
| Net Assets | | |
| At beginning of year | $ 1,944,771,102 | $ 2,632,155,396 |
| At end of year | $2,473,017,783 | $1,944,771,102 |
55
See Notes to Consolidated Financial Statements.
Global Macro Absolute Return Advantage Portfolio
October 31, 2023
Consolidated Financial Highlights
| | Year Ended October 31, |
| Ratios/Supplemental Data | 2023 | 2022 | 2021 | 2020 | 2019 |
| Ratios (as a percentage of average daily net assets): | | | | | |
| Expenses (1) | 1.68% (2)(3) | 1.17% (2)(3) | 1.12% | 1.11% (2) | 1.26% (2) |
| Net investment income | 5.97% | 6.13% | 5.37% | 5.69% | 5.86% |
| Portfolio Turnover | 56% | 94% | 82% | 80% | 71% |
| Total Return | 9.60% | (4.83)% (2) | 5.94% | 6.57% (2) | 8.22% (2) |
| Net assets, end of year (000’s omitted) | $2,473,018 | $1,944,771 | $2,632,155 | $3,045,720 | $3,331,278 |
| (1) | Includes interest and/or dividend expense, including on securities sold short and/or reverse repurchase agreements if applicable, of 0.68%, 0.16%, 0.11%, 0.09% and 0.24%, of average daily net assets for the years ended October 31, 2023, 2022, 2021, 2020 and 2019, respectively. |
| (2) | The investment adviser reimbursed certain operating expenses (equal to less than 0.01%, 0.01%, 0.04% and 0.05% of average daily net assets for the years ended October 31, 2023, 2022, 2020 and 2019, respectively). Absent this reimbursement, total return would be lower. |
| (3) | Includes a reduction by the investment adviser of a portion of its adviser fee due to the Portfolio’s investment in the Liquidity Fund (equal to 0.01% and less than 0.005% of average daily net assets for the years ended October 31, 2023 and 2022, respectively). |
Global Macro Absolute Return Advantage Portfolio
October 31, 2023
Notes to Consolidated Financial Statements
1 Significant Accounting Policies
Global Macro Absolute Return Advantage Portfolio (the Portfolio) is a Massachusetts business trust registered under the Investment Company Act of 1940, as amended (the 1940 Act), as a non-diversified, open-end management investment company. The Portfolio’s investment objective is total return. The Declaration of Trust permits the Trustees to issue interests in the Portfolio. At October 31, 2023, Eaton Vance Global Macro Absolute Return Advantage Fund, Eaton Vance Short Duration Strategic Income Fund and Eaton Vance International (Cayman Islands) Short Duration Strategic Income Fund held an interest of 73.0%, 26.6% and 0.4%, respectively, in the Portfolio.
The Portfolio seeks to gain exposure to the commodity markets, in whole or in part, through investments in Eaton Vance GMAP Commodity Subsidiary, Ltd. (the Subsidiary), a wholly-owned subsidiary of the Portfolio organized under the laws of the Cayman Islands with the same objective and investment policies and restrictions as the Portfolio. The Portfolio may invest up to 25% of its total assets in the Subsidiary. The net assets of the Subsidiary at October 31, 2023 were $6,452,778 or 0.3% of the Portfolio’s consolidated net assets. The accompanying consolidated financial statements include the accounts of the Subsidiary. Intercompany balances and transactions have been eliminated in consolidation.
The following is a summary of significant accounting policies of the Portfolio. The policies are in conformity with accounting principles generally accepted in the United States of America (U.S. GAAP). The Portfolio is an investment company and follows accounting and reporting guidance in the Financial Accounting Standards Board (FASB) Accounting Standards Codification Topic 946.
A Investment Valuation—The following methodologies are used to determine the market value or fair value of investments.
Debt Obligations. Debt obligations are generally valued on the basis of valuations provided by third party pricing services, as derived from such services’ pricing models. Inputs to the models may include, but are not limited to, reported trades, executable bid and ask prices, broker/dealer quotations, prices or yields of securities with similar characteristics, interest rates, anticipated prepayments, benchmark curves or information pertaining to the issuer, as well as industry and economic events. The pricing services may use a matrix approach, which considers information regarding securities with similar characteristics to determine the valuation for a security. Short-term debt obligations purchased with a remaining maturity of sixty days or less for which a valuation from a third party pricing service is not readily available may be valued at amortized cost, which approximates fair value.
Senior Floating-Rate Loans. Interests in senior floating-rate loans (Senior Loans) are valued generally at the average mean of bid and ask quotations obtained from a third party pricing service.
Equity Securities. Equity securities listed on a U.S. securities exchange generally are valued at the last sale or closing price on the day of valuation or, if no sales took place on such date, at the mean between the closing bid and ask prices on the exchange where such securities are principally traded. Equity securities listed on the NASDAQ National Market System are valued at the NASDAQ official closing price. Unlisted or listed securities for which closing sales prices or closing quotations are not available are valued at the mean between the latest available bid and ask prices.
Derivatives. U.S. exchange-traded options are valued at the mean between the bid and ask prices at valuation time as reported by the Options Price Reporting Authority. Non-U.S. exchange-traded options and over-the-counter options (including options on securities, indices and foreign currencies) are valued by a third party pricing service using techniques that consider factors including the value of the underlying instrument, the volatility of the underlying instrument and the period of time until option expiration. Futures contracts are valued at the closing settlement price established by the board of trade or exchange on which they are traded, with adjustments for fair valuation for certain foreign futures contracts as described below. Forward foreign currency exchange contracts are generally valued at the mean of the average bid and average ask prices that are reported by currency dealers to a third party pricing service at the valuation time. Such third party pricing service valuations are supplied for specific settlement periods and the Portfolio’s forward foreign currency exchange contracts are valued at an interpolated rate between the closest preceding and subsequent settlement period reported by the third party pricing service. Non-deliverable bond forward contracts are generally valued based on the current price of the underlying bond as provided by a third party pricing service and current interest rates. Swaps and options on credit default swaps ("swaptions") are normally valued using valuations provided by a third party pricing service. Such pricing service valuations are based on the present value of fixed and projected floating rate cash flows over the term of the swap contract, and in the case of credit default swaps, based on credit spread quotations obtained from broker/dealers and expected default recovery rates determined by the pricing service using proprietary models. In the case of total return swaps, pricing service valuations are based on the value of the underlying index or instrument and reference interest rate. Future cash flows on swaps are discounted to their present value using swap rates provided by electronic data services or by broker/dealers.
Foreign Securities, Futures Contracts and Currencies. Foreign securities, futures contracts and currencies are valued in U.S. dollars, based on foreign currency exchange rate quotations supplied by a third party pricing service. The pricing service uses a proprietary model to determine the exchange rate. Inputs to the model include reported trades and implied bid/ask spreads. The daily valuation of exchange-traded foreign securities and certain exchange-traded foreign futures contracts generally is determined as of the close of trading on the principal exchange on which such securities and contracts trade. Events occurring after the close of trading on foreign exchanges may result in adjustments to the valuation of foreign securities and certain foreign futures contracts to more accurately reflect their fair value as of the close of regular trading on the New York Stock Exchange. When valuing foreign equity securities and foreign futures contracts that meet certain criteria, the Portfolio’s Trustees have approved the use of a fair value service that values such securities and foreign futures contracts to reflect market trading that occurs after the close of the applicable foreign markets of comparable securities or other instruments that have a strong correlation to the fair-valued securities and foreign futures contracts.
Global Macro Absolute Return Advantage Portfolio
October 31, 2023
Notes to Consolidated Financial Statements — continued
Other. Investments in management investment companies (including money market funds) that do not trade on an exchange are valued at the net asset value as of the close of each business day.
Fair Valuation. In connection with Rule 2a-5 of the 1940 Act, the Trustees have designated the Portfolio’s investment adviser as its valuation designee. Investments for which valuations or market quotations are not readily available or are deemed unreliable are valued by the investment adviser, as valuation designee, at fair value using methods that most fairly reflect the security’s “fair value”, which is the amount that the Portfolio might reasonably expect to receive for the security upon its current sale in the ordinary course. Each such determination is based on a consideration of relevant factors, which are likely to vary from one pricing context to another. These factors may include, but are not limited to, the type of security, the existence of any contractual restrictions on the security’s disposition, the price and extent of public trading in similar securities of the issuer or of comparable companies or entities, quotations or relevant information obtained from broker/dealers or other market participants, information obtained from the issuer, analysts, and/or the appropriate stock exchange (for exchange-traded securities), an analysis of the company’s or entity’s financial statements, and an evaluation of the forces that influence the issuer and the market(s) in which the security is purchased and sold.
B Investment Transactions—Investment transactions for financial statement purposes are accounted for on a trade date basis. Realized gains and losses on investments sold are determined on the basis of identified cost.
C Income—Interest income is recorded on the basis of interest accrued, adjusted for amortization of premium or accretion of discount. Inflation adjustments to the principal amount of inflation-adjusted bonds and notes are reflected as interest income. Deflation adjustments to the principal amount of an inflation-adjusted bond or note are reflected as reductions to interest income to the extent of interest income previously recorded on such bond or note. Dividend income is recorded on the ex-dividend date for dividends received in cash and/or securities. However, if the ex-dividend date has passed, certain dividends from foreign securities are recorded as the Portfolio is informed of the ex-dividend date. Withholding taxes on foreign dividends, interest and capital gains have been provided for in accordance with the Portfolio’s understanding of the applicable countries’ tax rules and rates.
D Federal and Other Taxes—The Portfolio has elected to be treated as a partnership for federal tax purposes. No provision is made by the Portfolio for federal or state taxes on any taxable income of the Portfolio because each investor in the Portfolio is ultimately responsible for the payment of any taxes on its share of taxable income. Since at least one of the Portfolio’s investors is a regulated investment company that invests all or substantially all of its assets in the Portfolio, the Portfolio normally must satisfy the applicable source of income and diversification requirements (under the Internal Revenue Code) in order for its investors to satisfy them. The Portfolio will allocate, at least annually among its investors, each investor’s distributive share of the Portfolio’s net investment income, net realized capital gains and losses and any other items of income, gain, loss, deduction or credit.
In addition to the requirements of the Internal Revenue Code, the Portfolio may also be subject to local taxes on the recognition of capital gains in certain countries. In determining the daily net asset value, the Portfolio estimates the accrual for such taxes, if any, based on the unrealized appreciation on certain portfolio securities and the related tax rates. Taxes attributable to unrealized appreciation are included in the change in unrealized appreciation (depreciation) on investments. Capital gains taxes on securities sold are included in net realized gain (loss) on investments.
The Subsidiary is treated as a controlled foreign corporation under the Internal Revenue Code and is not expected to be subject to U.S. federal income tax. The Portfolio is treated as a U.S. shareholder of the Subsidiary. As a result, the Portfolio is required to include in gross income for U.S. federal tax purposes all of the Subsidiary’s income, whether or not such income is distributed by the Subsidiary. If a net loss is realized by the Subsidiary, such loss is not generally available to offset the income earned by the Portfolio.
As of October 31, 2023, the Portfolio had no uncertain tax positions that would require financial statement recognition, de-recognition, or disclosure. The Portfolio files a U.S. federal income tax return annually after its fiscal year-end, which is subject to examination by the Internal Revenue Service for a period of three years from the date of filing.
E Foreign Currency Translation—Investment valuations, other assets, and liabilities initially expressed in foreign currencies are translated each business day into U.S. dollars based upon current exchange rates. Purchases and sales of foreign investment securities and income and expenses denominated in foreign currencies are translated into U.S. dollars based upon currency exchange rates in effect on the respective dates of such transactions. Recognized gains or losses on investment transactions attributable to changes in foreign currency exchange rates are recorded for financial statement purposes as net realized gains and losses on investments. That portion of unrealized gains and losses on investments that results from fluctuations in foreign currency exchange rates is not separately disclosed.
F Unfunded Loan Commitments—The Portfolio may enter into certain loan agreements all or a portion of which may be unfunded. The Portfolio is obligated to fund these commitments at the borrower's discretion. These commitments, if any, are disclosed in the accompanying Consolidated Portfolio of Investments.
G Use of Estimates—The preparation of the consolidated financial statements in conformity with U.S. GAAP requires management to make estimates and assumptions that affect the reported amounts of assets and liabilities at the date of the consolidated financial statements and the reported amounts of income and expense during the reporting period. Actual results could differ from those estimates.
H Indemnifications—Under the Portfolio’s organizational documents, its officers and Trustees may be indemnified against certain liabilities and expenses arising out of the performance of their duties to the Portfolio. Under Massachusetts law, if certain conditions prevail, interestholders in the Portfolio could
Global Macro Absolute Return Advantage Portfolio
October 31, 2023
Notes to Consolidated Financial Statements — continued
be deemed to have personal liability for the obligations of the Portfolio. However, the Portfolio’s Declaration of Trust contains an express disclaimer of liability on the part of Portfolio interestholders. Additionally, in the normal course of business, the Portfolio enters into agreements with service providers that may contain indemnification clauses. The Portfolio’s maximum exposure under these arrangements is unknown as this would involve future claims that may be made against the Portfolio that have not yet occurred.
I Futures Contracts—Upon entering into a futures contract, the Portfolio is required to deposit with the broker, either in cash or securities, an amount equal to a certain percentage of the contract amount (initial margin). Subsequent payments, known as variation margin, are made or received by the Portfolio each business day, depending on the daily fluctuations in the value of the underlying security, index, or commodity and are recorded as unrealized gains or losses by the Portfolio. Gains (losses) are realized upon the expiration or closing of the futures contracts. Should market conditions change unexpectedly, the Portfolio may not achieve the anticipated benefits of the futures contracts and may realize a loss. Futures contracts have minimal counterparty risk as they are exchange traded and the clearinghouse for the exchange is substituted as the counterparty, guaranteeing counterparty performance.
J Forward Foreign Currency Exchange and Non-Deliverable Bond Forward Contracts—The Portfolio may enter into forward foreign currency exchange contracts for the purchase or sale of a specific foreign currency at a fixed price on a future date. The forward foreign currency exchange contracts are adjusted by the daily exchange rate of the underlying currency and any gains or losses are recorded as unrealized until such time as the contracts have been closed. While forward foreign currency exchange contracts are privately negotiated agreements between the Portfolio and a counterparty, certain contracts may be “centrally cleared”, whereby all payments made or received by the Portfolio pursuant to the contract are with a central clearing party (CCP) rather than the original counterparty. The CCP guarantees the performance of the original parties to the contract. Upon entering into centrally cleared contracts, the Portfolio is required to deposit with the CCP, either in cash or securities, an amount of initial margin determined by the CCP, which is subject to adjustment. For centrally cleared contracts, the daily change in valuation is recorded as a receivable or payable for variation margin and settled in cash with the CCP daily. The Portfolio may also enter into non-deliverable bond forward contracts for the purchase or sale of a bond denominated in a non-deliverable foreign currency at a fixed price on a future date. For non-deliverable bond forward contracts, unrealized gains and losses, based on changes in the value of the contract, and realized gains and losses are accounted for as described above. Risks may arise upon entering these contracts from the potential inability of counterparties to meet the terms of their contracts and from movements in the value of a foreign currency relative to the U.S. dollar. In the case of centrally cleared contracts, counterparty risk is minimal due to protections provided by the CCP.
K Purchased Options—Upon the purchase of a call or put option, the premium paid by the Portfolio is included in the Consolidated Statement of Assets and Liabilities as an investment. The amount of the investment is subsequently marked-to-market to reflect the current market value of the option purchased, in accordance with the Portfolio’s policies on investment valuations discussed above. Premiums paid for purchasing options that expire are treated as realized losses. Premiums paid for purchasing options that are exercised or closed are added to the amounts paid or offset against the proceeds on the underlying investment transaction to determine the realized gain or loss. The risk associated with purchasing options is limited to the premium originally paid. Purchased options traded over-the-counter involve risk that the issuer or counterparty will fail to perform its contractual obligations.
L Written Options—Upon the writing of a call or a put option, the premium received by the Portfolio is included in the Consolidated Statement of Assets and Liabilities as a liability. The amount of the liability is subsequently marked-to-market to reflect the current market value of the option written, in accordance with the Portfolio’s policies on investment valuations discussed above. Premiums received from writing options that expire are treated as realized gains. Premiums received from writing options that are exercised or are closed are added to or offset against the proceeds or amount paid on the transaction to determine the realized gain or loss. The Portfolio, as a writer of an option, may have no control over whether the underlying instrument may be sold (call) or purchased (put) and, as a result, bears the market risk of an unfavorable change in the price of the instrument underlying the written option. The Portfolio may also bear the risk of not being able to enter into a closing transaction if a liquid secondary market does not exist.
M Interest Rate Swaps—Swap contracts are privately negotiated agreements between the Portfolio and a counterparty. Certain swap contracts may be centrally cleared. Pursuant to interest rate swap agreements, the Portfolio either makes floating-rate payments to the counterparty (or CCP in the case of centrally cleared swaps) based on a benchmark interest rate in exchange for fixed-rate payments or the Portfolio makes fixed-rate payments to the counterparty (or CCP in the case of a centrally cleared swap) in exchange for payments on a floating benchmark interest rate. Payments received or made, including amortization of upfront payments/receipts, if any (which are amortized over the life of the swap contract), are recorded as realized gains or losses. During the term of the outstanding swap agreement, changes in the underlying value of the swap are recorded as unrealized gains or losses. For centrally cleared swaps, the daily change in valuation is recorded as a receivable or payable for variation margin and settled in cash with the CCP daily. The value of the swap is determined by changes in the relationship between two rates of interest. The Portfolio is exposed to credit loss in the event of non-performance by the swap counterparty. In the case of centrally cleared swaps, counterparty risk is minimal due to protections provided by the CCP. Risk may also arise from movements in interest rates.
N Inflation Swaps—Pursuant to inflation swap agreements, the Portfolio either makes floating-rate payments to the counterparty (or CCP in the case of centrally cleared swaps) based on a benchmark index in exchange for fixed-rate payments or the Portfolio makes fixed-rate payments to the counterparty (or CCP in the case of centrally cleared swaps) in exchange for floating-rate payments based on the return of a benchmark index. By design, the benchmark index is an inflation index, such as the Consumer Price Index. The accounting policy for payments received or made and changes in the underlying value of the inflation swap are the same as for interest rate swaps as described above. The value of the swap is determined by changes in the relationship between
Global Macro Absolute Return Advantage Portfolio
October 31, 2023
Notes to Consolidated Financial Statements — continued
the rate of interest and the benchmark index. The Portfolio is exposed to credit loss in the event of nonperformance by the swap counterparty. In the case of centrally cleared swaps, counterparty risk is minimal due to protections provided by the CCP. Risk may also arise from the unanticipated movements in value of interest rates or the index.
O Cross-Currency Swaps—Cross-currency swaps are interest rate swaps in which interest cash flows are exchanged between two parties based on the notional amounts of two different currencies. The notional amounts are typically determined based on the spot exchange rates at the inception of the trade. Cross-currency swaps also involve the exchange of the notional amounts at the start of the contract at the current spot rate with an agreement to re-exchange such amounts at a later date at either the same exchange rate, a specified rate or the then current spot rate. The entire principal value of a cross-currency swap is subject to the risk that the counterparty to the swap will default on its contractual delivery obligations.
P Credit Default Swaps—When the Portfolio is the buyer of a credit default swap contract, the Portfolio is entitled to receive the par (or other agreed-upon) value of a referenced debt obligation (or basket of debt obligations) from the counterparty (or CCP in the case of a centrally cleared swap) to the contract if a credit event by a third party, such as a U.S. or foreign corporate issuer or sovereign issuer, on the debt obligation occurs. In return, the Portfolio pays the counterparty a periodic stream of payments over the term of the contract provided that no credit event has occurred. If no credit event occurs, the Portfolio would have spent the stream of payments and received no proceeds from the contract. When the Portfolio is the seller of a credit default swap contract, it receives the stream of payments, but is obligated to pay to the buyer of the protection an amount up to the notional amount of the swap and in certain instances take delivery of securities of the reference entity upon the occurrence of a credit event, as defined under the terms of that particular swap agreement. Credit events are contract specific but may include bankruptcy, failure to pay, restructuring, obligation acceleration and repudiation/moratorium. If the Portfolio is a seller of protection and a credit event occurs, the maximum potential amount of future payments that the Portfolio could be required to make would be an amount equal to the notional amount of the agreement. This potential amount would be partially offset by any recovery value of the respective referenced obligation, or net amount received from the settlement of a buy protection credit default swap agreement entered into by the Portfolio for the same referenced obligation. As the seller, the Portfolio may create economic leverage to its portfolio because, in addition to its total net assets, the Portfolio is subject to investment exposure on the notional amount of the swap. The interest fee paid or received on the swap contract, which is based on a specified interest rate on a fixed notional amount, is accrued daily as a component of unrealized appreciation (depreciation) and is recorded as realized gain upon receipt or realized loss upon payment. The Portfolio also records an increase or decrease to unrealized appreciation (depreciation) in an amount equal to the daily valuation. For centrally cleared swaps, the daily change in valuation is recorded as a receivable or payable for variation margin and settled in cash with the CCP daily. All upfront payments and receipts, if any, are amortized over the life of the swap contract as realized gains or losses. Those upfront payments or receipts for non-centrally cleared swaps are recorded as other assets or other liabilities, respectively, net of amortization. For financial reporting purposes, unamortized upfront payments or receipts, if any, are netted with unrealized appreciation or depreciation on swap contracts to determine the market value of swaps as presented in Notes 6 and 10. These transactions involve certain risks, including the risk that the seller may be unable to fulfill the transaction. In the case of centrally cleared swaps, counterparty risk is minimal due to protections provided by the CCP.
Q Total Return Swaps—In a total return swap, the buyer receives a periodic return equal to the total return of a specified security, securities or index for a specified period of time. In return, the buyer pays the counterparty a fixed or variable stream of payments, typically based upon short-term interest rates, possibly plus or minus an agreed upon spread. During the term of the outstanding swap agreement, changes in the underlying value of the swap are recorded as unrealized gains and losses. Periodic payments received or made are recorded as realized gains or losses. The Portfolio is exposed to credit loss in the event of nonperformance by the swap counterparty. Risk may also arise from the unanticipated movements in value of exchange rates, interest rates, securities, or the index.
R Swaptions—A purchased swaption contract grants the Portfolio, in return for payment of the purchase price, the right, but not the obligation, to enter into a new swap agreement or to shorten, extend, cancel or otherwise modify an existing swap agreement, at some designated future time on specified terms. When the Portfolio purchases a swaption, the premium paid to the writer is recorded as an investment and subsequently marked-to-market to reflect the current value of the swaption. A written swaption gives the Portfolio the obligation, if exercised by the purchaser, to enter into a swap contract according to the terms of the underlying agreement. When the Portfolio writes a swaption, the premium received by the Portfolio is recorded as a liability and subsequently marked-to-market to reflect the current value of the swaption. When a swaption is exercised, the cost of the swap is adjusted by the amount of the premium paid or received. When a swaption expires or an unexercised swaption is closed, a gain or loss is recognized in the amount of the premium paid or received, plus the cost to close. The Portfolio’s risk for purchased swaptions is limited to the premium paid. The writer of a swaption bears the risk of unfavorable changes in the preset terms of the underlying swap contract. Purchased swaptions traded over-the-counter involve risk that the issuer or counterparty will fail to perform its contractual obligations.
S Repurchase Agreements—A repurchase agreement is the purchase by the Portfolio of securities from a counterparty in exchange for cash that is coupled with an agreement to resell those securities to the counterparty at a specified date and price. When a repurchase agreement is entered, the Portfolio typically receives securities with a value that equals or exceeds the repurchase price, including any accrued interest earned on the agreement. The value of such securities will be marked-to-market daily, and cash or additional securities will be exchanged between the parties as needed. Except in the case of a repurchase agreement entered to settle a short sale, the value of the securities delivered to the Portfolio will be at least equal to 90% of the repurchase price during the term of the repurchase agreement. The terms of a repurchase agreement entered to settle a short sale may provide that the cash purchase price paid by the Portfolio is more than the value of purchased securities that effectively collateralize the repurchase price payable by the counterparty. In the event of insolvency of the counterparty to a repurchase agreement, recovery of the repurchase price owed to the Portfolio may be
Global Macro Absolute Return Advantage Portfolio
October 31, 2023
Notes to Consolidated Financial Statements — continued
delayed. Such an insolvency also may result in a loss to the extent that the value of the purchased securities decreases during the delay or that value has otherwise not been maintained at an amount at least equal to the repurchase price.
T Reverse Repurchase Agreements—Under a reverse repurchase agreement, the Portfolio temporarily transfers possession of a portfolio security to another party, such as a bank or broker/dealer, in return for cash. At the same time, the Portfolio agrees to repurchase the security at an agreed upon time and price, which reflects an interest payment. In periods of increased demand for a security, the Portfolio may receive a payment from the counterparty for the use of the security, which is recorded as interest income. Because the Portfolio retains effective control over the transferred security, the transaction is accounted for as a secured borrowing. The Portfolio may enter into such agreements when it believes it is able to invest the cash acquired at a rate higher than the cost of the agreement, which would increase earned income. When the Portfolio enters into a reverse repurchase agreement, any fluctuations in the market value of either the securities transferred to another party or the securities in which the proceeds may be invested would affect the market value of the Portfolio’s assets. Because reverse repurchase agreements may be considered to be the practical equivalent of borrowing funds (and the counterparty making a loan), they constitute a form of leverage. The Portfolio segregates cash or liquid assets equal to its obligation to repurchase the security. During the term of the agreement, the Portfolio may also be obligated to pledge additional cash and/or securities in the event of a decline in the fair value of the transferred security. In the event the counterparty to a reverse repurchase agreement becomes insolvent, recovery of the security transferred by the Portfolio may be delayed or the Portfolio may incur a loss equal to the amount by which the value of the security transferred by the Portfolio exceeds the repurchase price payable by the Portfolio.
U Securities Sold Short—A short sale is a transaction in which the Portfolio sells a security it does not own in anticipation of a decline in the market value of that security. To complete such a transaction, the Portfolio must borrow the security to make delivery to the buyer with an obligation to replace such borrowed security at a later date. Until the security is replaced, the Portfolio is required to repay the lender any dividends or interest, which accrue during the period of the loan. The proceeds received from a short sale are recorded as a liability and the Portfolio records an unrealized gain or loss to the extent of the difference between the proceeds received and the value of the open short position on the day of determination. A gain, limited to the price at which the Portfolio sold the security short, or a loss, potentially unlimited as there is no upward limit on the price of a security, is recorded when the short position is terminated. Interest and dividends payable on securities sold short are recorded as an expense.
V Stripped Mortgage-Backed Securities—The Portfolio may invest in Interest Only (IO) and Principal Only (PO) securities, forms of stripped mortgage-
backed securities, whereby the IO security receives all the interest and the PO security receives all the principal on a pool of mortgage assets. The yield to maturity on an IO security is extremely sensitive to the rate of principal payments (including prepayments) on the related underlying mortgage assets, and a rapid rate of principal payments may have a material adverse effect on the yield to maturity from these securities. If the underlying mortgages experience greater than anticipated prepayments of principal, the Portfolio may fail to recoup its initial investment in an IO security. The market value of IO and PO securities can be unusually volatile due to changes in interest rates.
2 Investment Adviser Fee and Other Transactions with Affiliates
The investment adviser fee is earned by Boston Management and Research (BMR), an indirect, wholly-owned subsidiary of Morgan Stanley, as compensation for investment advisory services rendered to the Portfolio and the Subsidiary. The Portfolio and Subsidiary each pay BMR a fee computed at an annual rate as a percentage of its respective average daily net assets as follows and is payable monthly:
| Average Daily Net Assets | Annual Fee Rate |
| Up to $500 million | 1.000% |
| $500 million but less than $1 billion | 0.950% |
| $1 billion but less than $2.5 billion | 0.925% |
| $2.5 billion but less than $5 billion | 0.900% |
| $5 billion and over | 0.880% |
In determining the investment adviser fee for the Portfolio and Subsidiary, the applicable advisory fee rate is based on the average daily net assets of the Portfolio (inclusive of its interest in the Subsidiary). Such fee rate is then assessed separately on the Portfolio’s average daily net assets (exclusive of its interest in the Subsidiary) and the Subsidiary’s average daily net assets to determine the amount of the investment adviser fee. For the year ended October 31, 2023, the Portfolio’s investment adviser fee amounted to $21,371,612 or 0.95% of the Portfolio’s consolidated average daily net assets. The Portfolio may invest in a money market fund, the Institutional Class of the Morgan Stanley Institutional Liquidity Funds - Government Portfolio (the “Liquidity Fund”), an open-end management investment company managed by Morgan Stanley Investment Management Inc., a wholly-owned subsidiary of Morgan Stanley. The investment adviser fee paid by the Portfolio is reduced by an amount equal to its pro rata share of the advisory and administration fees paid by the Portfolio due to its investment in the Liquidity Fund. For the year ended October 31, 2023, the investment adviser fee paid was reduced by $303,761 relating to the Portfolio’s investment in the Liquidity Fund. Pursuant to an expense reimbursement, BMR was allocated $74,166 of the Portfolio’s operating expenses for the year ended October 31, 2023.
Global Macro Absolute Return Advantage Portfolio
October 31, 2023
Notes to Consolidated Financial Statements — continued
Pursuant to an investment sub-advisory agreement, BMR has delegated a portion of the investment management of the Portfolio to Eaton Vance Advisers International Ltd. (EVAIL), an affiliate of BMR and an indirect, wholly-owned subsidiary of Morgan Stanley. BMR pays EVAIL a portion of its investment adviser fee for sub-advisory services provided to the Portfolio.
Trustees and officers of the Portfolio who are members of BMR’s organization receive remuneration for their services to the Portfolio out of the investment adviser fee. Trustees of the Portfolio who are not affiliated with the investment adviser may elect to defer receipt of all or a percentage of their annual fees in accordance with the terms of the Trustees Deferred Compensation Plan. Certain officers and Trustees of the Portfolio are officers of the above organization.
3 Purchases and Sales of Investments
Purchases and sales of investments, other than short-term obligations and including maturities, paydowns and securities sold short, for the year ended October 31, 2023 were as follows:
| | Purchases | Sales |
| Investments (non-U.S. Government) | $ 2,076,142,672 | $ 744,682,015 |
| U.S. Government and Agency Securities | 38,801,376 | 99,579,730 |
| | $2,114,944,048 | $844,261,745 |
4 Federal Income Tax Basis of Investments
The cost and unrealized appreciation (depreciation) of investments of the Portfolio, including open derivative contracts and the Portfolio's investment in the Subsidiary, at October 31, 2023, as determined on a federal income tax basis, were as follows:
| Aggregate cost | $2,514,894,842 |
| Gross unrealized appreciation | $ 117,439,314 |
| Gross unrealized depreciation | (395,361,696) |
| Net unrealized depreciation | $ (277,922,382) |
5 Restricted Securities
At October 31, 2023, the Portfolio owned the following securities (representing 0.8% of net assets) which were restricted as to public resale and not registered under the Securities Act of 1933 (excluding Rule 144A securities). The Portfolio has various registration rights (exercisable under a variety of circumstances) with respect to these securities. The value of these securities is determined based on valuations provided by brokers when available, or if not available, they are valued at fair value using methods determined in good faith by or at the direction of the Trustees’ valuation designee.
| Description | Date(s) of
Acquisition | Shares | Cost | Value |
| Reinsurance Side Cars | | | | |
| Mt. Logan Re, Ltd., Series A-1 | 12/30/20 | 8,600 | $ 8,600,000 | $ 10,175,822 |
| Sussex Capital, Ltd., Designated Investment Series 14 | 1/24/22 | 1,114 | 1,107,140 | 20,764 |
| Sussex Capital, Ltd., Designated Investment Series 14 | 11/30/22 | 1,081 | 1,080,115 | 599,146 |
| Sussex Capital, Ltd., Series 14, Preference Shares | 6/1/21 | 7,500 | 5,312,745 | 8,224,784 |
| Total Restricted Securities | | | $16,100,000 | $19,020,516 |
Global Macro Absolute Return Advantage Portfolio
October 31, 2023
Notes to Consolidated Financial Statements — continued
6 Financial Instruments
The Portfolio may trade in financial instruments with off-balance sheet risk in the normal course of its investing activities. These financial instruments may include written options, forward foreign currency exchange contracts, non-deliverable bond forward contracts, futures contracts and swap contracts and may involve, to a varying degree, elements of risk in excess of the amounts recognized for financial statement purposes. The notional or contractual amounts of these instruments represent the investment the Portfolio has in particular classes of financial instruments and do not necessarily represent the amounts potentially subject to risk. The measurement of the risks associated with these instruments is meaningful only when all related and offsetting transactions are considered. A summary of obligations under these financial instruments at October 31, 2023 is included in the Consolidated Portfolio of Investments. At October 31, 2023, the Portfolio had sufficient cash and/or securities to cover commitments under these contracts.
In the normal course of pursuing its investment objective, the Portfolio is subject to the following risks:
Commodity Risk: The Portfolio invests in commodities-linked derivative instruments, including commodity futures contracts, that provide exposure to the investment returns of certain commodities. Commodities-linked derivative instruments are used to enhance total return and/or as a substitute for the purchase or sale of commodities and to manage certain investment risks.
Credit Risk: The Portfolio enters into credit default swap contracts and swaptions to manage certain investment risks and/or to enhance total return or as a substitute for the purchase or sale of securities.
Equity Price Risk: The Portfolio enters into equity index futures contracts and total return swaps to enhance total return and/or to manage certain investment risks.
Foreign Exchange Risk: The Portfolio engages in forward foreign currency exchange contracts, currency options and cross-currency swaps to enhance total return, to seek to hedge against fluctuations in currency exchange rates and/or as a substitute for the purchase or sale of securities or currencies.
Interest Rate Risk: The Portfolio utilizes various interest rate derivatives including non-deliverable bond forward contracts, interest rate futures contracts, interest rate swaps, inflation swaps, cross-currency swaps and option contracts to enhance total return, to seek to hedge against fluctuations in interest rates and/or to change the effective duration of its portfolio.
The Portfolio enters into over-the-counter (OTC) derivatives that may contain provisions whereby the counterparty may terminate the contract under certain conditions, including but not limited to a decline in the Portfolio’s net assets below a certain level over a certain period of time, which would trigger a payment by the Portfolio for those derivatives in a liability position. At October 31, 2023, the fair value of derivatives with credit-related contingent features in a net liability position was $25,335,420. The aggregate fair value of assets pledged as collateral by the Portfolio for such liability was $31,945,155 at October 31, 2023.
The OTC derivatives in which the Portfolio invests (except for written options as the Portfolio, not the counterparty, is obligated to perform) are subject to the risk that the counterparty to the contract fails to perform its obligations under the contract. To mitigate this risk, the Portfolio (and Subsidiary) has entered into an International Swaps and Derivatives Association, Inc. Master Agreement (“ISDA Master Agreement”) or similar agreement with substantially all its derivative counterparties. An ISDA Master Agreement is a bilateral agreement between the Portfolio and a counterparty that governs certain OTC derivatives and typically contains, among other things, set-off provisions in the event of a default and/or termination event as defined under the relevant ISDA Master Agreement. Under an ISDA Master Agreement, the Portfolio (and Subsidiary) may, under certain circumstances, offset with the counterparty certain derivative financial instruments’ payables and/or receivables with collateral held and/or posted and create one single net payment. The provisions of the ISDA Master Agreement typically permit a single net payment in the event of default including the bankruptcy or insolvency of the counterparty. However, bankruptcy or insolvency laws of a particular jurisdiction may impose restrictions on or prohibitions against the right of offset in bankruptcy or insolvency. Certain ISDA Master Agreements allow counterparties to OTC derivatives to terminate derivative contracts prior to maturity in the event the Portfolio’s net assets decline by a stated percentage or the Portfolio fails to meet the terms of its ISDA Master Agreements, which would cause the counterparty to accelerate payment by the Portfolio of any net liability owed to it.
The collateral requirements for derivatives traded under an ISDA Master Agreement are governed by a Credit Support Annex to the ISDA Master Agreement. Collateral requirements are determined at the close of business each day and are typically based on changes in market values for each transaction under an ISDA Master Agreement and netted into one amount for such agreement. Generally, the amount of collateral due from or to a counterparty is subject to a minimum transfer threshold amount before a transfer is required, which may vary by counterparty. Collateral pledged for the benefit of the Portfolio (and Subsidiary) and/or counterparty is held in segregated accounts by the Portfolio’s custodian and cannot be sold, re-pledged, assigned or otherwise used while pledged. The portion of such collateral representing cash, if any, is reflected as deposits for derivatives collateral and, in the case of cash pledged by a counterparty for the benefit of the Portfolio, a corresponding liability on the Consolidated Statement of Assets and Liabilities. Securities pledged by the Portfolio as collateral, if any, are identified as such in the Consolidated Portfolio of Investments. The carrying amount of the liability for cash collateral due to brokers at October 31, 2023 approximated its fair value. If measured at fair value, such liability would have been considered as Level 2 in the fair value hierarchy (see Note 10) at October 31, 2023. Because the Subsidiary is not registered under the 1940 Act, it may not be able to negotiate terms with its counterparties that are equivalent to those a registered portfolio may negotiate. As a result, the Subsidiary may have greater exposure to those counterparties than a registered portfolio.
Global Macro Absolute Return Advantage Portfolio
October 31, 2023
Notes to Consolidated Financial Statements — continued
The fair value of open derivative instruments (not considered to be hedging instruments for accounting disclosure purposes) by risk exposure at October 31, 2023 was as follows:
| | Fair Value |
| Consolidated Statement of Assets and Liabilities Caption | Commodity | Credit | Equity
Price | Foreign
Exchange | Interest
Rate | Total |
| Unaffiliated investments, at value | $ — | $ — | $ — | $ 770,671 | $ — | $ 770,671 |
| Not applicable | — | 49,882,311* | 2,985,441* | 12,744,921* | 58,925,124* | 124,537,797 |
| Receivable for open forward foreign currency exchange contracts | — | — | — | 13,405,289 | — | 13,405,289 |
| Receivable/Payable for open swap contracts; Upfront payments/receipts on open non-centrally cleared swap contracts | 63,376 | 63,252 | — | — | 1,062,411 | 1,189,039 |
| Total Asset Derivatives | $ 63,376 | $ 49,945,563 | $ 2,985,441 | $ 26,920,881 | $ 59,987,535 | $ 139,902,796 |
| Derivatives not subject to master netting or similar agreements | $ — | $ 49,882,311 | $ 2,985,441 | $ 12,744,921 | $ 58,925,124 | $ 124,537,797 |
| Total Asset Derivatives subject to master netting or similar agreements | $ 63,376 | $ 63,252 | $ — | $ 14,175,960 | $ 1,062,411 | $ 15,364,999 |
| Written options outstanding, at value | $ — | $ — | $ — | $ (202,436) | $ — | $ (202,436) |
| Not applicable | (729,379)* | (22,926,830)* | (784,353)* | (2,459,340)* | (67,820,111)* | (94,720,013) |
| Payable for open forward foreign currency exchange contracts | — | — | — | (21,155,869) | — | (21,155,869) |
| Payable/Receivable for open swap contracts; Upfront payments/receipts on open non-centrally cleared swap contracts | (9,561) | (1,195,733) | (1,741,959) | — | (1,029,862) | (3,977,115) |
| Total Liability Derivatives | $(738,940) | $(24,122,563) | $(2,526,312) | $(23,817,645) | $(68,849,973) | $(120,055,433) |
| Derivatives not subject to master netting or similar agreements | $(729,379) | $(22,926,830) | $ (784,353) | $ (2,459,340) | $(67,820,111) | $ (94,720,013) |
| Total Liability Derivatives subject to master netting or similar agreements | $ (9,561) | $ (1,195,733) | $(1,741,959) | $(21,358,305) | $ (1,029,862) | $ (25,335,420) |
| * | Only the current day’s variation margin on open futures contracts and centrally cleared derivatives is reported within the Consolidated Statement of Assets and Liabilities as Receivable or Payable for variation margin on open futures contracts and centrally cleared derivatives, as applicable. |
The Portfolio's derivative assets and liabilities at fair value by risk, which are reported gross in the Consolidated Statement of Assets and Liabilities, are presented in the table above. The following tables present the Portfolio's derivative assets and liabilities by counterparty, net of amounts available for offset under a master netting agreement and net of the related collateral received by the Portfolio (and Subsidiary) for such assets and pledged by the Portfolio (and Subsidiary) for such liabilities as of October 31, 2023.
| Counterparty | Derivative
Assets Subject to
Master Netting
Agreement | Derivatives
Available
for Offset | Non-cash
Collateral
Received(a) | Cash
Collateral
Received(a) | Net Amount
of Derivative
Assets(b) | Total Cash
Collateral
Received |
| Barclays Bank PLC | $ 2,280,527 | $ (464,705) | $ — | $ (1,730,000) | $ 85,822 | $ 1,730,000 |
| BNP Paribas | 2,979,594 | (2,674,125) | — | (305,469) | — | 369,800 |
| Citibank, N.A. | 4,867,287 | (4,867,287) | — | — | — | — |
| Goldman Sachs International | 1,065,517 | (1,065,517) | — | — | — | — |
Global Macro Absolute Return Advantage Portfolio
October 31, 2023
Notes to Consolidated Financial Statements — continued
| Counterparty | Derivative
Assets Subject to
Master Netting
Agreement | Derivatives
Available
for Offset | Non-cash
Collateral
Received(a) | Cash
Collateral
Received(a) | Net Amount
of Derivative
Assets(b) | Total Cash
Collateral
Received |
| HSBC Bank USA, N.A. | $ 231,520 | $ (231,520) | $ — | $ — | $ — | $ — |
| ICBC Standard Bank plc | 117,820 | (117,820) | — | — | — | — |
| JPMorgan Chase Bank, N.A. | 755,104 | (755,104) | — | — | — | — |
| Societe Generale | 73,722 | (73,722) | — | — | — | — |
| Standard Chartered Bank | 826,797 | (826,797) | — | — | — | — |
| State Street Bank and Trust Company | 11,771 | (11,771) | — | — | — | — |
| UBS AG | 2,155,340 | (964,641) | (1,190,699) | — | — | — |
| | $15,364,999 | $(12,053,009) | $(1,190,699) | $(2,035,469) | $85,822 | $2,099,800 |
| Counterparty | Derivative
Liabilities Subject to
Master Netting
Agreement | Derivatives
Available
for Offset | Non-cash
Collateral
Pledged(a) | Cash
Collateral
Pledged(a) | Net Amount
of Derivative
Liabilities(c) | Total Cash
Collateral
Pledged |
| Bank of America, N.A. | $ (1,219,518) | $ — | $ 1,211,169 | $ — | $ (8,349) | $ — |
| Barclays Bank PLC | (464,705) | 464,705 | — | — | — | — |
| BNP Paribas | (2,674,125) | 2,674,125 | — | — | — | — |
| Citibank, N.A. | (5,211,507) | 4,867,287 | 344,220 | — | — | — |
| Deutsche Bank AG | (584,664) | — | 584,664 | — | — | — |
| Goldman Sachs International | (1,612,855) | 1,065,517 | 503,846 | — | (43,492) | — |
| HSBC Bank USA, N.A. | (1,906,861) | 231,520 | 1,600,160 | — | (75,181) | — |
| ICBC Standard Bank plc | (356,586) | 117,820 | — | — | (238,766) | — |
| JPMorgan Chase Bank, N.A. | (2,398,398) | 755,104 | 1,194,160 | — | (449,134) | — |
| Societe Generale | (911,788) | 73,722 | 789,625 | — | (48,441) | — |
| Standard Chartered Bank | (6,981,105) | 826,797 | 6,154,308 | — | — | — |
| State Street Bank and Trust Company | (48,667) | 11,771 | — | — | (36,896) | — |
| UBS AG | (964,641) | 964,641 | — | — | — | — |
| | $(25,335,420) | $12,053,009 | $12,382,152 | $ — | $(900,259) | $ — |
| Total — Deposits for derivatives collateral — OTC derivatives | | | | $2,099,800 |
| (a) | In some instances, the total collateral received and/or pledged may be more than the amount shown due to overcollateralization. |
| (b) | Net amount represents the net amount due from the counterparty in the event of default. |
| (c) | Net amount represents the net amount payable to the counterparty in the event of default. |
Information with respect to reverse repurchase agreements at October 31, 2023 is included at Note 8.
Global Macro Absolute Return Advantage Portfolio
October 31, 2023
Notes to Consolidated Financial Statements — continued
The effect of derivative instruments (not considered to be hedging instruments for accounting disclosure purposes) on the Consolidated Statement of Operations by risk exposure for the year ended October 31, 2023 was as follows:
| Consolidated Statement of Operations Caption | Commodity | Credit | Equity
Price | Foreign
Exchange | Interest
Rate | Total |
| Net realized gain (loss): | | | | | | |
| Investment transactions | $ — | $ (2,037,000) | $ — | $ 2,597,127 | $ (2,514,525) | $ (1,954,398) |
| Written options | — | — | — | 2,183 | — | 2,183 |
| Futures contracts | 948,879 | — | (4,031,491) | — | 10,322,919 | 7,240,307 |
| Swap contracts | (6,096,186) | (38,047,462) | 84,549 | 384,242 | 34,128,725 | (9,546,132) |
| Forward foreign currency exchange contracts | — | — | — | 11,702,455 | — | 11,702,455 |
| Non-deliverable bond forward contracts | — | — | — | — | 12,622,320 | 12,622,320 |
| Total | $(5,147,307) | $(40,084,462) | $(3,946,942) | $ 14,686,007 | $ 54,559,439 | $ 20,066,735 |
| Change in unrealized appreciation (depreciation): | | | | | | |
| Investments | $ — | $ — | $ — | $ (180,274) | $ 2,514,483 | $ 2,334,209 |
| Written options | — | — | — | 135,702 | — | 135,702 |
| Futures contracts | (8,808,548) | — | 2,863,951 | — | (10,944,873) | (16,889,470) |
| Swap contracts | 53,815 | 2,441,173 | (1,741,959) | — | (64,549,322) | (63,796,293) |
| Forward foreign currency exchange contracts | — | — | — | (27,477,651) | — | (27,477,651) |
| Non-deliverable bond forward contracts | — | — | — | — | (2,147,972) | (2,147,972) |
| Total | $(8,754,733) | $ 2,441,173 | $ 1,121,992 | $(27,522,223) | $(75,127,684) | $(107,841,475) |
The average notional cost of futures contracts and average notional amounts of other derivative contracts outstanding during the year ended October 31, 2023, which are indicative of the volume of these derivative types, were approximately as follows:
Futures
Contracts — Long | Futures
Contracts — Short | Forward
Foreign Currency
Exchange Contracts* | Non-Deliverable
Bond Forward
Contracts | Purchased
Swaptions |
| $131,762,000 | $493,553,000 | $3,099,012,000 | $132,598,000 | $53,846,000 |
Purchased Call
Options | Swap
Contracts |
| $325,562,000 | $6,610,395,000 |
| * | The average notional amount for forward foreign currency exchange contracts is based on the absolute value of notional amounts of currency purchased and currency sold. |
The average principal amount of purchased and written currency options contracts outstanding during the year ended October 31, 2023, which are indicative of the volume of these derivative types, were approximately $110,005,000 and $81,385,000, respectively.
Global Macro Absolute Return Advantage Portfolio
October 31, 2023
Notes to Consolidated Financial Statements — continued
7 Line of Credit
The Portfolio participates with other portfolios and funds managed by BMR and its affiliates in a $650 million unsecured revolving line of credit agreement with a group of banks, which is in effect through October 22, 2024. In connection with the renewal of the agreement on October 24, 2023, the borrowing limit was decreased from $725 million. Borrowings are made by the Portfolio solely for temporary purposes related to redemptions and other short-term cash needs. Interest is charged to the Portfolio based on its borrowings at an amount above either the Secured Overnight Financing Rate (SOFR) or Federal Funds rate. In addition, a fee computed at an annual rate of 0.15% on the daily unused portion of the line of credit is allocated among the participating portfolios and funds at the end of each quarter. In connection with the renewal of the agreement in October 2023, an arrangement fee totaling $150,000 was incurred that was allocated to the participating portfolios and funds. Because the line of credit is not available exclusively to the Portfolio, it may be unable to borrow some or all of its requested amounts at any particular time. The Portfolio did not have any significant borrowings or allocated fees during the year ended October 31, 2023.
8 Reverse Repurchase Agreements
Reverse repurchase agreements outstanding as of October 31, 2023 were as follows:
| Counterparty | Trade
Date | Maturity
Date | Interest
Rate Paid
(Received) | Principal
Amount | Value
Including
Accrued
Interest |
| Barclays Bank PLC | 9/29/23 | On Demand(1) | 5.65% | $ 24,349,053 | $ 24,456,054 |
| Barclays Bank PLC | 10/16/23 | On Demand(1) | 5.65 | 27,049,427 | 27,104,615 |
| Total | | | | $51,398,480 | $51,560,669 |
| (1) | Open reverse repurchase agreement with no specific maturity date. Either party may terminate the agreement upon demand. |
At October 31, 2023, the type of securities pledged as collateral for all open reverse repurchase agreements was Sovereign Government Bonds.
For the year ended October 31, 2023, the average borrowings under settled reverse repurchase agreements and the average interest rate paid were approximately $14,278,000 and 4.35%, respectively. Based on the short-term nature of the borrowings under the reverse repurchase agreements, the carrying value of the payable for reverse repurchase agreements approximated its fair value at October 31, 2023. If measured at fair value, borrowings under the reverse repurchase agreements would have been considered as Level 2 in the fair value hierarchy (see Note 10) at October 31, 2023.
Reverse repurchase agreements entered into by the Portfolio are subject to Master Repurchase Agreements (MRA), which permit the Portfolio, under certain circumstances, including an event of default (such as bankruptcy or insolvency), to offset payables and/or receivables under the MRA with collateral held and/or posted to the counterparty and create one single net payment due to or from the Portfolio.
The following tables present the Portfolio’s repurchase and reverse repurchase agreements net of amounts available for offset under an MRA and net of the related collateral pledged by the Portfolio as of October 31, 2023.
| Counterparty | Repurchase
Agreements | Liabilities
Available for
Offset | Securities
Collateral
Received(a) | Net
Amount(b) |
| Bank of America, N.A. | $ 32,202,759 | $ — | $ (30,800,829) | $ 1,401,930 |
| Barclays Bank PLC | 111,019,001 | (51,560,669) | (59,458,332) | — |
| JPMorgan Chase Bank, N.A. | 15,633,645 | — | (14,872,390) | 761,255 |
| Nomura International PLC | 42,232,149 | — | (39,441,288) | 2,790,861 |
| | $201,087,554 | $(51,560,669) | $(144,572,839) | $4,954,046 |
Global Macro Absolute Return Advantage Portfolio
October 31, 2023
Notes to Consolidated Financial Statements — continued
| Counterparty | Reverse
Repurchase
Agreements* | Assets
Available for
Offset | Securities
Collateral
Pledged(a) | Net
Amount(c) |
| Barclays Bank PLC | $(51,560,669) | $51,560,669 | $ — | $ — |
| * | Including accrued interest. |
| (a) | In some instances, the total collateral received and/or pledged may be more than the amount shown due to overcollateralization. |
| (b) | Net amount represents the net amount receivable from the counterparty in the event of default. |
| (c) | Net amount represents the net amount payable to the counterparty in the event of default. |
9 Affiliated Investments
At October 31, 2023, the value of the Portfolio's investment in funds that may be deemed to be affiliated was $230,125,366, which represents 9.3% of the Portfolio's net assets. Transactions in such investments by the Portfolio for the year ended October 31, 2023 were as follows:
| Name | Value,
beginning
of period | Purchases | Sales
proceeds | Net
realized
gain (loss) | Change in
unrealized
appreciation
(depreciation) | Value, end
of period | Dividend
income | Shares,
end of period |
| Short-Term Investments |
| Liquidity Fund | $118,583,106 | $2,294,736,967 | $(2,183,194,707) | $ — | $ — | $230,125,366 | $10,085,746 | 230,125,366 |
10 Fair Value Measurements
Under generally accepted accounting principles for fair value measurements, a three-tier hierarchy to prioritize the assumptions, referred to as inputs, is used in valuation techniques to measure fair value. The three-tier hierarchy of inputs is summarized in the three broad levels listed below.
| • | Level 1 – quoted prices in active markets for identical investments |
| • | Level 2 – other significant observable inputs (including quoted prices for similar investments, interest rates, prepayment speeds, credit risk, etc.) |
| • | Level 3 – significant unobservable inputs (including a fund's own assumptions in determining the fair value of investments) |
In cases where the inputs used to measure fair value fall in different levels of the fair value hierarchy, the level disclosed is determined based on the lowest level input that is significant to the fair value measurement in its entirety. The inputs or methodology used for valuing securities are not necessarily an indication of the risk associated with investing in those securities.
At October 31, 2023, the hierarchy of inputs used in valuing the Portfolio’s investments and open derivative instruments, which are carried at fair value, were as follows:
| Asset Description | Level 1 | Level 2 | Level 3 | Total |
| Collateralized Mortgage Obligations | $ — | $ 98,240,026 | $ — | $ 98,240,026 |
| Common Stocks | 1,398,928 | 119,327,342* | 818,174 | 121,544,444 |
| Convertible Bonds | — | 4,104,298 | — | 4,104,298 |
| Foreign Corporate Bonds | — | 48,421,546 | 0 | 48,421,546 |
| Loan Participation Notes | — | — | 50,529,862 | 50,529,862 |
| Reinsurance Side Cars | — | — | 20,158,090 | 20,158,090 |
| Rights | — | 0 | — | 0 |
| Senior Floating-Rate Loans | — | 16,946,160 | 397,208 | 17,343,368 |
| Sovereign Government Bonds | — | 1,348,674,822 | — | 1,348,674,822 |
| Sovereign Loans | — | 91,178,142 | — | 91,178,142 |
| U.S. Government Guaranteed Small Business Administration Loans | — | 11,497,437 | — | 11,497,437 |
Global Macro Absolute Return Advantage Portfolio
October 31, 2023
Notes to Consolidated Financial Statements — continued
| Asset Description (continued) | Level 1 | Level 2 | Level 3 | Total |
| Warrants | $ 146,028 | $ — | $ — | $ 146,028 |
| Miscellaneous | — | — | 0 | 0 |
| Short-Term Investments: | | | | |
| Affiliated Fund | 230,125,366 | — | — | 230,125,366 |
| Repurchase Agreements | — | 201,087,554 | — | 201,087,554 |
| Sovereign Government Securities | — | 122,485,807 | — | 122,485,807 |
| U.S. Treasury Obligations | — | 96,341,050 | — | 96,341,050 |
| Purchased Currency Options | — | 770,671 | — | 770,671 |
| Total Investments | $ 231,670,322 | $ 2,159,074,855 | $ 71,903,334 | $ 2,462,648,511 |
| Forward Foreign Currency Exchange Contracts | $ — | $ 26,150,210 | $ — | $ 26,150,210 |
| Futures Contracts | 9,036,194 | 2,694,117 | — | 11,730,311 |
| Swap Contracts | — | 101,251,604 | — | 101,251,604 |
| Total | $ 240,706,516 | $ 2,289,170,786 | $ 71,903,334 | $ 2,601,780,636 |
| Liability Description | | | | |
| Securities Sold Short | $ — | $ (215,370,574) | $ — | $ (215,370,574) |
| Written Currency Options | — | (202,436) | — | (202,436) |
| Forward Foreign Currency Exchange Contracts | — | (23,615,209) | — | (23,615,209) |
| Futures Contracts | (6,827,850) | — | — | (6,827,850) |
| Swap Contracts | — | (89,409,938) | — | (89,409,938) |
| Total | $ (6,827,850) | $ (328,598,157) | $ — | $ (335,426,007) |
| * | Includes foreign equity securities whose values were adjusted to reflect market trading of comparable securities or other correlated instruments that occurred after the close of trading in their applicable foreign markets. |
Global Macro Absolute Return Advantage Portfolio
October 31, 2023
Notes to Consolidated Financial Statements — continued
The following is a reconciliation of Level 3 investments for which significant unobservable inputs were used to determine fair value:
| | Common
Stocks | Foreign
Corporate
Bonds | Loan
Participation
Notes | Reinsurance
Side Cars** | Senior
Floating-Rate
Loans | Sovereign
Government
Bonds | Sovereign
Government
Securities | Total |
| Balance as of October 31, 2022 | $467,194 | $ 0 | $ 43,646,597 | $20,645,423 | $ 608,224 | $ 65,632,437 | $ 5,286,231 | $136,286,106 |
| Realized gains (losses) | — | — | (4,393,471) | — | 61,840 | — | — | (4,331,631) |
| Change in net unrealized appreciation (depreciation) | 350,980 | — | (146,254) | 5,669,749 | (206,102) | — | — | 5,668,373 |
| Cost of purchases | — | — | 40,909,578 | 2,187,255 | — | — | — | 43,096,833 |
| Proceeds from sales, including return of capital | — | — | (29,801,955) | (8,344,337) | (132,392) | — | — | (38,278,684) |
| Accrued discount (premium) | — | — | 315,367 | — | 65,638 | — | — | 381,005 |
| Transfers to Level 3 | — | — | — | — | — | — | — | — |
| Transfers from Level 3(1) | — | — | — | — | — | (65,632,437) | (5,286,231) | (70,918,668) |
| Balance as of October 31, 2023 | $818,174 | $ 0 | $ 50,529,862 | $20,158,090 | $ 397,208 | $ — | $ — | $ 71,903,334 |
| Change in net unrealized appreciation (depreciation) on investments still held as of October 31, 2023 | $350,980 | $ — | $ (3,828,946) | $ 5,027,019 | $(258,732) | $ — | $ — | $ 1,290,321 |
| * | The Portfolio’s investments in Reinsurance Side Cars were primarily valued on the basis of broker quotations. |
| (1) | Transferred from Level 3 based on the observability of valuation inputs resulting from new market activity. |
Not included in the table above are investments in securities categorized as Miscellaneous in the Portfolio of Investments which were acquired at $0 cost and valued at $0 at October 31, 2023.
The following is a summary of quantitative information about significant unobservable valuation inputs for Level 3 investments held as of October 31, 2023:
| Type of Investment | Fair Value as of
October 31, 2023 | Valuation Technique | Unobservable Input | Range of Unobservable Input | Impact to
Valuation from an
Increase to Input* |
| Common Stocks | $ 818,174 | Market Approach | EBITDA Multiple Discount Rate | 15% | Decrease |
| Foreign Corporate Bonds | 0 | Estimated Recovery Value | Estimated Recovery Value Percentage | 0% | Increase |
| Loan Participation Notes | 50,529,862 | Matrix Pricing | Adjusted Credit Spread to the Central Bank of Uzbekistan Quoted Policy Rate | 5.46% - 9.79%** | Decrease |
| Senior Floating-Rate Loans | 397,208 | Market Approach | Discount Rate | 10% | Decrease |
| * | Represents the directional change in the fair value of the Level 3 investments that would result from an increase to the corresponding unobservable input. A decrease to the unobservable input would have the opposite effect. |
| ** | The weighted average of the unobservable input is 7.68% based on relative principal amounts. |
Global Macro Absolute Return Advantage Portfolio
October 31, 2023
Notes to Consolidated Financial Statements — continued
11 Risks and Uncertainties
Risks Associated with Foreign Investments
Foreign investments can be adversely affected by political, economic and market developments abroad, including the imposition of economic and other sanctions by the United States or another country. There may be less publicly available information about foreign issuers because they may not be subject to reporting practices, requirements or regulations comparable to those to which United States companies are subject. Foreign markets may be smaller, less liquid and more volatile than the major markets in the United States. Trading in foreign markets typically involves higher expense than trading in the United States. The Portfolio may have difficulties enforcing its legal or contractual rights in a foreign country. Securities that trade or are denominated in currencies other than the U.S. dollar may be adversely affected by fluctuations in currency exchange rates.
Emerging market securities often involve greater risks than developed market securities. Investment markets within emerging market countries are typically smaller, less liquid, less developed and more volatile than those in more developed markets like the United States, and may be focused in certain economic sectors. The information available about an emerging market issuer may be less reliable than for comparable issuers in more developed capital markets. Governmental actions can have a significant effect on the economic conditions in emerging market countries. It may be more difficult to make a claim or obtain a judgment in the courts of these countries than it is in the United States. The possibility of fraud, negligence, undue influence being exerted by an issuer or refusal to recognize ownership exists in some emerging markets. Disruptions due to work stoppages and trading improprieties in foreign securities markets have caused such markets to close. Emerging market securities are also subject to speculative trading, which contributes to their volatility.
Economic data as reported by sovereign entities may be delayed, inaccurate or fraudulent. In the event of a default by a sovereign entity, there are typically no assets to be seized or cash flows to be attached. Furthermore, the willingness or ability of a sovereign entity to restructure defaulted debt may be limited. Therefore, losses on sovereign defaults may far exceed the losses from the default of a similarly rated U.S. debt issuer.
On February 24, 2022, Russia launched an invasion of Ukraine, following rising tensions over the buildup of Russian troops along the Ukrainian border and joint military exercises by Russia with Belarus. In response to the invasion, many countries, including the U.S., have imposed economic sanctions on Russian governmental institutions, Russian entities, and Russian individuals. The conflict and sanctions have had a negative impact on the Russian economy, on the Russian currency, and on investments having exposure to Russia, Belarus and Ukraine. The conflict could also have a significant effect on investments outside the region. The duration and extent of the military conflict with Russia and the related sanctions cannot be predicted at this time.
Global Macro Absolute Return Advantage Portfolio
October 31, 2023
Report of Independent Registered Public Accounting Firm
To the Trustees and Investors of Global Macro Absolute Return Advantage Portfolio:
Opinion on the Financial Statements and Financial Highlights
We have audited the accompanying consolidated statement of assets and liabilities of Global Macro Absolute Return Advantage Portfolio and subsidiary (the “Portfolio"), including the consolidated portfolio of investments, as of October 31, 2023, the related consolidated statement of operations for the year then ended, the consolidated statements of changes in net assets for each of the two years in the period then ended, the consolidated financial highlights for each of the five years in the period then ended, and the related notes (collectively referred to as the "financial statements and financial highlights"). In our opinion, the financial statements and financial highlights present fairly, in all material respects, the financial position of the Portfolio as of October 31, 2023, and the results of its operations for the year then ended, the changes in its net assets for each of the two years in the period then ended, and the financial highlights for each of the five years in the period then ended, in conformity with accounting principles generally accepted in the United States of America.
Basis for Opinion
These financial statements and financial highlights are the responsibility of the Portfolio’s management. Our responsibility is to express an opinion on the Portfolio’s financial statements and financial highlights based on our audits. We are a public accounting firm registered with the Public Company Accounting Oversight Board (United States) (PCAOB) and are required to be independent with respect to the Portfolio in accordance with the U.S. federal securities laws and the applicable rules and regulations of the Securities and Exchange Commission and the PCAOB.
We conducted our audits in accordance with the standards of the PCAOB. Those standards require that we plan and perform the audit to obtain reasonable assurance about whether the financial statements and financial highlights are free of material misstatement, whether due to error or fraud. The Portfolio is not required to have, nor were we engaged to perform, an audit of its internal control over financial reporting. As part of our audits, we are required to obtain an understanding of internal control over financial reporting but not for the purpose of expressing an opinion on the effectiveness of the Portfolio’s internal control over financial reporting. Accordingly, we express no such opinion.
Our audits included performing procedures to assess the risks of material misstatement of the financial statements and financial highlights, whether due to error or fraud, and performing procedures that respond to those risks. Such procedures included examining, on a test basis, evidence regarding the amounts and disclosures in the financial statements and financial highlights. Our audits also included evaluating the accounting principles used and significant estimates made by management, as well as evaluating the overall presentation of the financial statements and financial highlights. Our procedures included confirmation of securities and senior loans owned as of October 31, 2023, by correspondence with the custodian, brokers, and agent banks; when replies were not received from brokers and agent banks, we performed other auditing procedures. We believe that our audits provide a reasonable basis for our opinion.
/s/ Deloitte & Touche LLP
Boston, Massachusetts
December 22, 2023
We have served as the auditor of one or more Eaton Vance investment companies since 1959.
Eaton Vance
Global Macro Absolute Return Advantage Fund
October 31, 2023
Board of Trustees’ Contract Approval
Overview of the Contract Review Process
The Investment Company Act of 1940, as amended (the “1940 Act”), provides, in substance, that the investment advisory agreement between a fund and its investment adviser will continue in effect from year-to-year only if its continuation is approved on an annual basis by a vote of the fund’s board of trustees, including a majority of the trustees who are not “interested persons” of the fund (“independent trustees”), cast in person at a meeting called for the purpose of considering such approval.
At a meeting held on June 8, 2023, the Boards of Trustees/Directors (collectively, the “Board”) that oversee the registered investment companies advised by Eaton Vance Management or its affiliate, Boston Management and Research (the “Eaton Vance Funds”), including a majority of the independent trustees (the “Independent Trustees”), voted to approve the continuation of existing investment advisory agreements and sub-advisory agreements1 for each of the Eaton Vance Funds for an additional one-year period. The Board relied upon the affirmative recommendation of its Contract Review Committee, which is a committee exclusively comprised of Independent Trustees. Prior to making its recommendation, the Contract Review Committee reviewed information furnished by the adviser and sub-adviser to each of the Eaton Vance Funds (including information specifically requested by the Board) for a series of formal meetings held between April and June 2023, as well as certain additional information provided in response to specific requests from the Independent Trustees as members of the Contract Review Committee. Members of the Contract Review Committee also considered information received at prior meetings of the Board and its committees, to the extent such information was relevant to the Contract Review Committee’s annual evaluation of the investment advisory agreements and sub-advisory agreements.
In connection with its evaluation of the investment advisory agreements and sub-advisory agreements, the Board considered various information relating to the Eaton Vance Funds. This included information applicable to all or groups of Eaton Vance Funds, which is referenced immediately below, and information applicable to the particular Eaton Vance Fund covered by this report (each “Eaton Vance Fund” is referred to below as a “fund”). (For funds that invest through one or more underlying portfolios, references to “each fund” in this section may include information that was considered at the portfolio-level.)
Information about Fees, Performance and Expenses
• A report from an independent data provider comparing advisory and other fees paid by each fund to such fees paid by comparable funds, as identified by the independent data provider (“comparable funds”);
• A report from an independent data provider comparing each fund’s total expense ratio (and its components) to those of comparable funds;
• A report from an independent data provider comparing the investment performance of each fund (including, as relevant, total return data, income data, Sharpe ratios and information ratios) to the investment performance of comparable funds and, as applicable, benchmark indices, over various time periods;
• In certain instances, data regarding investment performance relative to customized groups of peer funds and blended indices identified by the adviser in consultation with the Portfolio Management Committee of the Board (a committee exclusively comprised of Independent Trustees);
• Comparative information concerning the fees charged and services provided by the adviser and sub-adviser to each fund in managing other accounts (which may include other mutual funds, collective investment funds and institutional accounts) using investment strategies and techniques similar to those used in managing such fund(s), if any;
• Profitability analyses with respect to the adviser and sub-adviser to each of the funds;
Information about Portfolio Management and Trading
• Descriptions of the investment management services provided to each fund, as well as each of the funds’ investment strategies and policies;
• The procedures and processes used to determine the value of fund assets, including, when necessary, the determination of “fair value” and actions taken to monitor and test the effectiveness of such procedures and processes;
• Information about the policies and practices of each fund’s adviser and sub-adviser with respect to trading, including their processes for seeking best execution of portfolio transactions;
• Information about the allocation of brokerage transactions and the benefits, if any, received by the adviser and sub-adviser to each fund as a result of brokerage allocation, including, as applicable, information concerning the acquisition of research through client commission arrangements and policies with respect to “soft dollars”;
• Data relating to the portfolio turnover rate of each fund and related information regarding active management in the context of particular strategies;
Information about each Adviser and Sub-adviser
• Reports detailing the financial results and condition of the adviser and sub-adviser to each fund;
• Information regarding the individual investment professionals whose responsibilities include portfolio management and investment research for the funds, and, for portfolio managers and certain other investment professionals, information relating to their responsibilities with respect to managing other mutual funds and investment accounts, as applicable;
1 Not all Eaton Vance Funds have entered into a sub-advisory agreement with a sub-adviser. Accordingly, references to “sub-adviser” or “sub-advisory agreement” in this “Overview” section may not be applicable to the particular Eaton Vance Fund covered by this report.
Eaton Vance
Global Macro Absolute Return Advantage Fund
October 31, 2023
Board of Trustees’ Contract Approval — continued
• Information regarding the adviser’s and its parent company’s (Morgan Stanley’s) efforts to retain and attract talented investment professionals, including in the context of a competitive marketplace for talent, as well as the ongoing unique environment presented by hybrid, remote and other alternative work arrangements;
• Information regarding the adviser’s compensation methodology for its investment professionals and the incentives and accountability it creates, along with investment professionals’ investments in the fund(s) they manage;
• The Code of Ethics of the adviser and its affiliates and the sub-adviser of each fund, together with information relating to compliance with, and the administration of, such codes;
• Policies and procedures relating to proxy voting, including regular reporting with respect to fund proxy voting activities;
• Information regarding the handling of corporate actions and class actions, as well as information regarding litigation and other regulatory matters;
• Information concerning the resources devoted to compliance efforts undertaken by the adviser and its affiliates and the sub-adviser of each fund, if any, including descriptions of their various compliance programs and their record of compliance;
• Information concerning the business continuity and disaster recovery plans of the adviser and its affiliates and the sub-adviser of each fund, if any;
• A description of Eaton Vance Management’s and Boston Management and Research’s oversight of sub-advisers, including with respect to regulatory and compliance issues, investment management and other matters;
Other Relevant Information
• Information regarding ongoing initiatives to further integrate and harmonize, where applicable, the investment management and other departments of the adviser and its affiliates with the overall investment management infrastructure of Morgan Stanley, in light of Morgan Stanley’s acquisition of Eaton Vance Corp. on March 1, 2021;
• Information concerning the nature, cost and character of the administrative and other non-investment advisory services provided by Eaton Vance Management and its affiliates;
• Information concerning oversight of the relationship with the custodian, subcustodians, fund accountants, and other third-party service providers by the adviser and/or administrator to each of the funds;
• Information concerning efforts to implement policies and procedures with respect to various recently adopted regulations applicable to the funds, including Rule 12d1-4 (the Fund-of-Funds Rule), Rule 18f-4 (the Derivatives Rule) and Rule 2a-5 (the Fair Valuation Rule);
• For an Eaton Vance Fund structured as an exchange-listed closed-end fund, information concerning the benefits of the closed-end fund structure, as well as, where relevant, the closed-end fund’s market prices (including as compared to the closed-end fund’s net asset value (NAV)), trading volume data, continued use of auction preferred shares (where applicable), distribution rates and other relevant matters;
• The risks which the adviser and/or its affiliates incur in connection with the management and operation of the funds, including, among others, litigation, regulatory, entrepreneurial, and other business risks (and the associated costs of such risks); and
The terms of each investment advisory agreement and sub-advisory agreement.
During the various meetings of the Board and its committees over the course of the year leading up to the June 8, 2023 meeting, the Board received information from portfolio managers and other investment professionals of the advisers and sub-advisers of the funds regarding investment and performance matters, and considered various investment and trading strategies used in pursuing the funds’ investment objectives. The Board also received information regarding risk management techniques employed in connection with the management of the funds. The Board and its committees evaluated issues pertaining to industry and regulatory developments, compliance procedures, fund governance and other issues with respect to the funds, and received and participated in reports and presentations provided by Eaton Vance Management, Boston Management and Research and fund sub-advisers, with respect to such matters. In addition to the formal meetings of the Board and its committees, the Independent Trustees held regular teleconferences to discuss, among other topics, matters relating to the continuation of investment advisory agreements and sub-advisory agreements.
The Contract Review Committee was advised throughout the contract review process by Goodwin Procter LLP, independent legal counsel for the Independent Trustees. The members of the Contract Review Committee, with the advice of such counsel, exercised their own business judgment in determining the material factors to be considered in evaluating each investment advisory agreement and sub-advisory agreement and the weight to be given to each such factor. The conclusions reached with respect to each investment advisory agreement and sub-advisory agreement were based on a comprehensive evaluation of all the information provided and not any single factor. Moreover, each member of the Contract Review Committee may have placed varying emphasis on particular factors in reaching conclusions with respect to each investment advisory agreement and sub-advisory agreement. In evaluating each investment advisory agreement and sub-advisory agreement, including the fee structures and other terms contained in such agreements, the members of the Contract Review Committee were also informed by multiple years of analysis and discussion with the adviser and sub-adviser to each of the Eaton Vance Funds.
Results of the Contract Review Process
Based on its consideration of the foregoing, and such other information it deemed relevant, including the factors and conclusions described below, the Contract Review Committee concluded that the continuation of the investment advisory and administrative agreement between Eaton Vance Global Macro Absolute Return Advantage Fund (the “Fund”) and Eaton Vance Management (“EVM”), as well as the investment advisory agreement between Global Macro Absolute Return Advantage Portfolio (the “Portfolio”), the portfolio in which the Fund invests, and Boston Management and Research (“BMR”)
Eaton Vance
Global Macro Absolute Return Advantage Fund
October 31, 2023
Board of Trustees’ Contract Approval — continued
(EVM, with respect to the Fund, and BMR, with respect to the Portfolio, are each referred to herein as the “Adviser”), and the sub-advisory agreement between EVM and Eaton Vance Advisers International Ltd. (the “Sub-adviser”), an affiliate of the Advisers, with respect to the Fund, and the sub-advisory agreement between BMR and the Sub-adviser, with respect to the Portfolio, including their respective fee structures, are in the interests of shareholders and, therefore, recommended to the Board approval of each agreement. Based on the recommendation of the Contract Review Committee, the Board, including a majority of the Independent Trustees, voted to approve continuation of the investment advisory and administrative agreement for the Fund and the investment advisory agreement for the Portfolio (together, the “investment advisory agreements”) and the sub-advisory agreements for the Fund and the Portfolio (together, the “sub-advisory agreements”).
Nature, Extent and Quality of Services
In considering whether to approve the investment advisory agreements and sub-advisory agreements for the Fund and the Portfolio, the Board evaluated the nature, extent and quality of services provided to the Fund and to the Portfolio by the applicable Adviser and the Sub-adviser, respectively.
The Board considered each Adviser’s and the Sub-adviser’s management capabilities and investment processes in light of the types of investments held by the Fund and the Portfolio, including the education, experience and number of investment professionals and other personnel who provide portfolio management, investment research, and similar services to the Fund and the Portfolio, including recent changes to such personnel. The Board considered each Adviser’s expertise with respect to global markets and in-house research capabilities. The Board also considered the resources available to the Sub-adviser in fulfilling its duties under the sub-advisory agreements and the abilities and experience of the Sub-adviser’s investment professionals in implementing the investment strategies of the Fund and the Portfolio. In particular, the Board considered the expertise of the Sub-adviser’s investment professionals with respect to global markets and in-house research capabilities. The Board considered the international investment capabilities of the Sub-adviser, which is based in London, and the benefits to the Fund and the Portfolio of having portfolio management services involving investments in international securities provided by investment professionals located abroad. The Board also took into account the resources dedicated to portfolio management and other services, the compensation methods of each Adviser and other factors, including the reputation and resources of each Adviser to recruit and retain highly qualified research, advisory and supervisory investment professionals. In addition, the Board considered the time and attention devoted to the Eaton Vance Funds, including the Fund and the Portfolio, by senior management, as well as the infrastructure, operational capabilities and support staff in place to assist in the portfolio management and operations of the Fund and the Portfolio, including the provision of administrative services. The Board also considered the business-related and other risks to which each Adviser or its affiliates may be subject in managing the Fund and the Portfolio.
The Board noted that, under the terms of the investment advisory agreement of the Fund, EVM may invest assets of the Fund directly in securities, for which it would receive a fee, or in the Portfolio, for which it receives no separate fee but for which BMR receives an advisory fee from the Portfolio.
The Board considered the compliance programs of each Adviser and relevant affiliates thereof, including the Sub-adviser. The Board considered compliance and reporting matters regarding, among other things, personal trading by investment professionals, disclosure of portfolio holdings, late trading, frequent trading, portfolio valuation, business continuity and the allocation of investment opportunities. The Board also considered the responses of each Adviser and its affiliates to requests in recent years from regulatory authorities, such as the Securities and Exchange Commission and the Financial Industry Regulatory Authority.
The Board considered other administrative services provided or overseen by EVM and its affiliates, including transfer agency and accounting services. The Board evaluated the benefits to shareholders of investing in a fund that is a part of a large fund complex offering exposure to a variety of asset classes and investment disciplines, as well as the ability, in many cases, to exchange an investment among different funds without incurring additional sales charges.
After consideration of the foregoing factors, among others, the Board concluded that the nature, extent and quality of services provided by each Adviser and the Sub-adviser, taken as a whole, are appropriate and consistent with the terms of the applicable investment advisory agreement and the applicable sub-advisory agreement.
Fund Performance
The Board compared the Fund���s investment performance to that of comparable funds identified by an independent data provider (the peer group), as well as an appropriate benchmark index. The Board’s review included comparative performance data with respect to the Fund for the one-, three-, five- and ten-year periods ended December 31, 2022. In this regard, the Board noted that the performance of the Fund was higher than the median performance of the Fund’s peer group for the three-year period. The Board also noted that the performance of the Fund was higher than its benchmark index for the three-year period. The Board concluded that the performance of the Fund was satisfactory.
Management Fees and Expenses
The Board considered contractual fee rates payable by the Portfolio and by the Fund for advisory and administrative services (referred to collectively as “management fees”). As part of its review, the Board considered the Fund’s management fees and total expense ratio for a one-year period ended December 31, 2021, as compared to those of comparable funds, before and after giving effect to any undertaking to waive fees or reimburse expenses. The Board noted that the Portfolio has established a wholly-owned subsidiary to accommodate the Portfolio’s commodity-related investments. The subsidiary is managed by BMR pursuant to a separate investment advisory agreement that is subject to annual approval by the Board. The subsidiary’s fee
Eaton Vance
Global Macro Absolute Return Advantage Fund
October 31, 2023
Board of Trustees’ Contract Approval — continued
rates are the same as those charged to the Portfolio, and the Portfolio will not pay any additional management fees with respect to its assets invested in the subsidiary. The Board also considered certain factors identified by management in response to inquiries from the Contract Review Committee regarding the Fund’s total expense ratio relative to comparable funds.
After considering the foregoing information, and in light of the nature, extent and quality of the services provided by each Adviser and the Sub-adviser, the Board concluded that the management fees charged for advisoryand related services are reasonable.
Profitability and “Fall-Out” Benefits
The Board considered the level of profits realized by each Adviser and relevant affiliates thereof, including the Sub-adviser, in providing investment advisory and administrative services to the Fund, to the Portfolio and to all Eaton Vance Funds as a group. The Board considered the level of profits realized without regard to marketing support or other payments by each Adviser and its affiliates to third parties in respect of distribution or other services.
The Board concluded that, in light of the foregoing factors and the nature, extent and quality of the services rendered, the profits realized by each Adviser and its affiliates, including the Sub-adviser, are deemed not to be excessive.
The Board also considered direct or indirect fall-out benefits received by each Adviser and its affiliates, including the Sub-adviser, in connection with their respective relationships with the Fund and the Portfolio, including the benefits of research services that may be available to each Adviser or the Sub-adviser as a result of securities transactions effected for the Fund and the Portfolio and other investment advisory clients.
Economies of Scale
In reviewing management fees and profitability, the Board also considered the extent to which the applicable Adviser and its affiliates, on the one hand, and the Fund and the Portfolio, on the other hand, can expect to realize benefits from economies of scale as the assets of the Fund and the Portfolio increase. The Board acknowledged the difficulty in accurately measuring the benefits resulting from economies of scale, if any, with respect to the management of any specific fund or group of funds. The Board reviewed data summarizing the increases and decreases in the assets of the Fund and of all Eaton Vance Funds as a group over various time periods, and evaluated the extent to which the total expense ratio of the Fund and the profitability of each Adviser and its affiliates may have been affected by such increases or decreases. Based upon the foregoing, the Board concluded that the Fund currently shares in the benefits from economies of scale, if any, when they are realized by each Adviser. The Board also concluded that the structure of the advisory fees, which include breakpoints at several asset levels, will allow the Fund and the Portfolio to continue to benefit from any economies of scale in the future.
Eaton Vance
Global Macro Absolute Return Advantage Fund
October 31, 2023
Liquidity Risk Management Program
The Fund has implemented a written liquidity risk management program (Program) and related procedures to manage its liquidity in accordance with Rule 22e-4 under the Investment Company Act of 1940, as amended (Liquidity Rule). The Liquidity Rule defines “liquidity risk” as the risk that a fund could not meet requests to redeem shares issued by the fund without significant dilution of the remaining investors’ interests in the fund. The Fund’s Board of Trustees/Directors has designated the investment adviser to serve as the administrator of the Program and the related procedures. The administrator has established a Liquidity Risk Management Oversight Committee (Committee) to perform the functions necessary to administer the Program. As part of the Program, the administrator is responsible for identifying illiquid investments and categorizing the relative liquidity of the Fund’s investments in accordance with the Liquidity Rule. Under the Program, the administrator assesses, manages, and periodically reviews the Fund’s liquidity risk, and is responsible for making certain reports to the Fund’s Board of Trustees/Directors and the Securities and Exchange Commission (SEC) regarding the liquidity of the Fund’s investments, and to notify the Board of Trustees/Directors and the SEC of certain liquidity events specified in the Liquidity Rule. The liquidity of the Fund’s portfolio investments is determined based on a number of factors including, but not limited to, relevant market, trading and investment-specific considerations under the Program.
At a meeting of the Fund’s Board of Trustees/Directors on June 7, 2023, the Committee provided a written report to the Fund’s Board of Trustees/
Directors pertaining to the operation, adequacy, and effectiveness of implementation of the Program, as well as the operation of the highly liquid investment minimum (if applicable) for the period January 1, 2022 through December 31, 2022 (Review Period). The Program operated effectively during the Review Period, supporting the administrator’s ability to assess, manage and monitor Fund liquidity risk, including during periods of market volatility and net redemptions. During the Review Period, the Fund met redemption requests on a timely basis.
There can be no assurance that the Program will achieve its objectives in the future. Please refer to the Fund’s prospectus for more information regarding the Fund’s exposure to liquidity risk and other principal risks to which an investment in the Fund may be subject.
Eaton Vance
Global Macro Absolute Return Advantage Fund
October 31, 2023
Management and Organization
Fund Management. The Trustees of Eaton Vance Mutual Funds Trust (the Trust) and Global Macro Absolute Return Advantage Portfolio (the Portfolio) are responsible for the overall management and supervision of the Trust's and the Portfolio’s affairs. The Board members and officers of the Trust and the Portfolio are listed below. Except as indicated, each individual has held the office shown or other offices in the same company for the last five years. Board members hold indefinite terms of office. Each Trustee holds office until his or her successor is elected and qualified, subject to a prior death, resignation, retirement, disqualification or removal. Under the terms of the Fund's and the Portfolio's current Trustee retirement policy, an Independent Trustee must retire and resign as a Trustee on the earlier of: (i) the first day of July following his or her 74th birthday; or (ii), with limited exception, December 31st of the 20th year in which he or she has served as a Trustee. However, if such retirement and resignation would cause the Fund and the Portfolio to be out of compliance with Section 16 of the 1940 Act or any other regulations or guidance of the SEC, then such retirement and resignation will not become effective until such time as action has been taken for the Fund and the Portfolio to be in compliance therewith. The “noninterested Trustees” consist of those Trustees who are not “interested persons” of the Trust and the Portfolio, as that term is defined under the 1940 Act. The business address of each Board member and officer is Two International Place, Boston, Massachusetts 02110. As used below, “BMR” refers to Boston Management and Research, “EV” refers to EV LLC, “EVM” refers to Eaton Vance Management, “MSIM” refers to Morgan Stanley Investment Management Inc. and “EVD” refers to Eaton Vance Distributors, Inc. EV is the trustee of each of EVM and BMR. Each of EVM, BMR, EVD and EV are indirect, wholly owned subsidiaries of Morgan Stanley. Each officer affiliated with EVM may hold a position with other EVM affiliates that is comparable to his or her position with EVM listed below. Each Trustee oversees 127 funds in the Eaton Vance fund complex (including both funds and portfolios in a hub and spoke structure).
| Name and Year of Birth | Trust/Portfolio
Position(s) | Length of Service | Principal Occupation(s) and Other Directorships
During Past Five Years and Other Relevant Experience |
| Interested Trustee |
Anchal Pachnanda(1)
1980 | Trustee | Since 2023 | Co-Head of Strategy of MSIM (since 2019). Formerly, Head of Strategy of MSIM (2017-2019). Ms. Pachnanda is an interested person because of her position with MSIM, which is an affiliate of the Trust.
Other Directorships. None. |
| Noninterested Trustees |
Alan C. Bowser
1962 | Trustee | Since 2022 | Private investor. Formerly, Chief Diversity Officer, Partner and a member of the Operating Committee, and formerly served as Senior Advisor on Diversity and Inclusion for the firm’s chief executive officer, Co-Head of the Americas Region, and Senior Client Advisor of Bridgewater Associates, an asset management firm (2011- 2023).
Other Directorships. Independent Director of Stout Risius Ross (a middle market professional services advisory firm) (since 2021). |
Mark R. Fetting
1954 | Trustee | Since 2016 | Private investor. Formerly held various positions at Legg Mason, Inc. (investment management firm) (2000-2012), including President, Chief Executive Officer, Director and Chairman (2008-2012), Senior Executive Vice President (2004-2008) and Executive Vice President (2001-2004). Formerly, President of Legg Mason family of funds (2001-2008). Formerly, Division President and Senior Officer of Prudential Financial Group, Inc. and related companies (investment management firm) (1991-2000).
Other Directorships. None. |
Cynthia E. Frost
1961 | Trustee | Since 2014 | Private investor. Formerly, Chief Investment Officer of Brown University (university endowment) (2000-2012). Formerly, Portfolio Strategist for Duke Management Company (university endowment manager) (1995-2000). Formerly, Managing Director, Cambridge Associates (investment consulting company) (1989-1995). Formerly, Consultant, Bain and Company (management consulting firm) (1987-1989). Formerly, Senior Equity Analyst, BA Investment Management Company (1983-1985).
Other Directorships. None. |
George J. Gorman
1952 | Chairperson
of the Board
and Trustee | Since 2021
(Chairperson) and
2014 (Trustee) | Principal at George J. Gorman LLC (consulting firm). Formerly, Senior Partner at Ernst & Young LLP (a registered public accounting firm) (1974-2009).
Other Directorships. None. |
Eaton Vance
Global Macro Absolute Return Advantage Fund
October 31, 2023
Management and Organization — continued
| Name and Year of Birth | Trust/Portfolio
Position(s) | Length of Service | Principal Occupation(s) and Other Directorships
During Past Five Years and Other Relevant Experience |
| Noninterested Trustees (continued) |
Valerie A. Mosley
1960 | Trustee | Since 2014 | Chairwoman and Chief Executive Officer of Valmo Ventures (a consulting and investment firm). Founder of Upward Wealth, Inc., dba BrightUp, a fintech platform. Formerly, Partner and Senior Vice President, Portfolio Manager and Investment Strategist at Wellington Management Company, LLP (investment management firm) (1992-2012). Formerly, Chief Investment Officer, PG Corbin Asset Management (1990-1992). Formerly worked in institutional corporate bond sales at Kidder Peabody (1986-1990).
Other Directorships. Director of DraftKings, Inc. (digital sports entertainment and gaming company) (since September 2020). Director of Envestnet, Inc. (provider of intelligent systems for wealth management and financial wellness) (since 2018). Formerly, Director of Dynex Capital, Inc. (mortgage REIT) (2013-2020) and Director of Groupon, Inc. (e-commerce provider) (2020-2022). |
Keith Quinton
1958 | Trustee | Since 2018 | Private investor, researcher and lecturer. Formerly, Independent Investment Committee Member at New Hampshire Retirement System (2017-2021). Formerly, Portfolio Manager and Senior Quantitative Analyst at Fidelity Investments (investment management firm) (2001-2014).
Other Directorships. Formerly, Director (2016-2021) and Chairman (2019-2021) of New Hampshire Municipal Bond Bank. |
Marcus L. Smith
1966 | Trustee | Since 2018 | Private investor and independent corporate director. Formerly, Chief Investment Officer, Canada (2012-2017), Chief Investment Officer, Asia (2010-2012), Director of Asian Research (2004-2010) and portfolio manager (2001-2017) at MFS Investment Management (investment management firm).
Other Directorships. Director of First Industrial Realty Trust, Inc. (an industrial REIT) (since 2021). Director of MSCI Inc. (global provider of investment decision support tools) (since 2017). Formerly, Director of DCT Industrial Trust Inc. (logistics real estate company) (2017-2018). |
Susan J. Sutherland
1957 | Trustee | Since 2015 | Private investor. Director of Ascot Group Limited and certain of its subsidiaries (insurance and reinsurance) (since 2017). Formerly, Director of Hagerty Holding Corp. (insurance) (2015-2018) and Montpelier Re Holdings Ltd. (insurance and reinsurance) (2013-2015). Formerly, Associate, Counsel and Partner at Skadden, Arps, Slate, Meagher & Flom LLP (law firm) (1982-2013).
Other Directorships. Formerly, Director of Kairos Acquisition Corp. (insurance/InsurTech acquisition company) (2021-2023). |
Scott E. Wennerholm
1959 | Trustee | Since 2016 | Private investor. Formerly, Trustee at Wheelock College (postsecondary institution) (2012-2018). Formerly, Consultant at GF Parish Group (executive recruiting firm) (2016-2017). Formerly, Chief Operating Officer and Executive Vice President at BNY Mellon Asset Management (investment management firm) (2005-2011). Formerly, Chief Operating Officer and Chief Financial Officer at Natixis Global Asset Management (investment management firm) (1997-2004). Formerly, Vice President at Fidelity Investments Institutional Services (investment management firm) (1994-1997).
Other Directorships. None. |
Nancy A. Wiser
1967 | Trustee | Since 2022 | Formerly, Executive Vice President and the Global Head of Operations at Wells Fargo Asset Management (2011-2021).
Other Directorships. None. |
| Name and Year of Birth | Trust/Portfolio
Position(s) | Length of Service | Principal Occupation(s)
During Past Five Years |
| Principal Officers who are not Trustees |
Kenneth A. Topping
1966 | President | Since 2023 | Vice President and Chief Administrative Officer of EVM and BMR and Chief Operating Officer for Public Markets at MSIM. Also Vice President of Calvert Research and Management (“CRM”) since 2021. Formerly, Chief Operating Officer for Goldman Sachs Asset Management ‘Classic’ (2009-2020). |
Deidre E. Walsh
1971 | Vice President and
Chief Legal Officer | Since 2009 | Vice President of EVM and BMR. Also Vice President of CRM. |
James F. Kirchner
1967 | Treasurer | Since 2007 | Vice President of EVM and BMR. Also Vice President of CRM. |
Eaton Vance
Global Macro Absolute Return Advantage Fund
October 31, 2023
Management and Organization — continued
| Name and Year of Birth | Trust/Portfolio
Position(s) | Length of Service | Principal Occupation(s)
During Past Five Years |
| Principal Officers who are not Trustees (continued) |
Nicholas S. Di Lorenzo
1987 | Secretary | Since 2022 | Formerly, associate (2012-2021) and counsel (2022) at Dechert LLP. |
Richard F. Froio
1968 | Chief Compliance
Officer | Since 2017 | Vice President of EVM and BMR since 2017. Formerly, Deputy Chief Compliance Officer (Adviser/Funds) and Chief Compliance Officer (Distribution) at PIMCO (2012-2017) and Managing Director at BlackRock/Barclays Global Investors (2009-2012). |
(1) Ms. Pachnanda began serving as Trustee effective April 1, 2023.
The SAI for the Fund includes additional information about the Trustees and officers of the Fund and the Portfolio and can be obtained without charge on Eaton Vance’s website at www.eatonvance.com or by calling 1-800-262-1122.
| FACTS | WHAT DOES EATON VANCE DO WITH YOUR
PERSONAL INFORMATION? |
| Why? | Financial companies choose how they share your personal information. Federal law gives consumers the right to limit some but not all sharing. Federal law also requires us to tell you how we collect, share, and protect your personal information. Please read this notice carefully to understand what we do. |
| |
| What? | The types of personal information we collect and share depend on the product or service you have with us. This information can include:■ Social Security number and income
■ investment experience and risk tolerance
■ checking account number and wire transfer instructions |
| |
| How? | All financial companies need to share customers’ personal information to run their everyday business. In the section below, we list the reasons financial companies can share their customers’ personal information; the reasons Eaton Vance chooses to share; and whether you can limit this sharing. |
Reasons we can share your
personal information | Does Eaton Vance
share? | Can you limit
this sharing? |
| For our everyday business purposes — such as to process your transactions, maintain your account(s), respond to court orders and legal investigations, or report to credit bureaus | Yes | No |
| For our marketing purposes — to offer our products and services to you | Yes | No |
| For joint marketing with other financial companies | No | We don’t share |
| For our investment management affiliates’ everyday business purposes — information about your transactions, experiences, and creditworthiness | Yes | Yes |
| For our affiliates’ everyday business purposes — information about your transactions and experiences | Yes | No |
| For our affiliates’ everyday business purposes — information about your creditworthiness | No | We don’t share |
| For our investment management affiliates to market to you | Yes | Yes |
| For our affiliates to market to you | No | We don’t share |
| For nonaffiliates to market to you | No | We don’t share |
To limit our
sharing | Call toll-free 1-800-262-1122 or email: EVPrivacy@eatonvance.comPlease note:If you are a new customer, we can begin sharing your information 30 days from the date we sent this notice. When you are no longer our customer, we continue to share your information as described in this notice. However, you can contact us at any time to limit our sharing. |
| Questions? | Call toll-free 1-800-262-1122 or email: EVPrivacy@eatonvance.com |
| Privacy Notice — continued | April 2021 |
| Who we are |
| Who is providing this notice? | Eaton Vance Management, Eaton Vance Distributors, Inc., Eaton Vance Trust Company, Eaton Vance Management (International) Limited, Eaton Vance Advisers International Ltd., Eaton Vance Global Advisors Limited, Eaton Vance Management’s Real Estate Investment Group, Boston Management and Research, Calvert Research and Management, Eaton Vance and Calvert Fund Families and our investment advisory affiliates (“Eaton Vance”) (see Investment Management Affiliates definition below) |
| What we do |
How does Eaton Vance
protect my personal
information? | To protect your personal information from unauthorized access and use, we use security measures that comply with federal law. These measures include computer safeguards and secured files and buildings. We have policies governing the proper handling of customer information by personnel and requiring third parties that provide support to adhere to appropriate security standards with respect to such information. |
How does Eaton Vance
collect my personal
information? | We collect your personal information, for example, when you■ open an account or make deposits or withdrawals from your account
■ buy securities from us or make a wire transfer
■ give us your contact informationWe also collect your personal information from others, such as credit bureaus, affiliates, or other companies. |
| Why can’t I limit all sharing? | Federal law gives you the right to limit only■ sharing for affiliates’ everyday business purposes — information about your creditworthiness
■ affiliates from using your information to market to you
■ sharing for nonaffiliates to market to youState laws and individual companies may give you additional rights to limit sharing. See below for more on your rights under state law. |
| Definitions |
Investment Management
Affiliates | Eaton Vance Investment Management Affiliates include registered investment advisers, registered broker- dealers, and registered and unregistered funds. Investment Management Affiliates does not include entities associated with Morgan Stanley Wealth Management, such as Morgan Stanley Smith Barney LLC and Morgan Stanley & Co. |
| Affiliates | Companies related by common ownership or control. They can be financial and nonfinancial companies.■ Our affiliates include companies with a Morgan Stanley name and financial companies such as Morgan Stanley Smith Barney LLC and Morgan Stanley & Co. |
| Nonaffiliates | Companies not related by common ownership or control. They can be financial and nonfinancial companies.■ Eaton Vance does not share with nonaffiliates so they can market to you. |
| Joint marketing | A formal agreement between nonaffiliated financial companies that together market financial products or services to you.■ Eaton Vance doesn’t jointly market. |
| Other important information |
| Vermont: Except as permitted by law, we will not share personal information we collect about Vermont residents with Nonaffiliates unless you provide us with your written consent to share such information.California: Except as permitted by law, we will not share personal information we collect about California residents with Nonaffiliates and we will limit sharing such personal information with our Affiliates to comply with California privacy laws that apply to us. |
Delivery of Shareholder Documents. The Securities and Exchange Commission (SEC) permits funds to deliver only one copy of shareholder documents, including prospectuses, proxy statements and shareholder reports, to fund investors with multiple accounts at the same residential or post office box address. This practice is often called “householding” and it helps eliminate duplicate mailings to shareholders. Eaton Vance, or your financial intermediary, may household the mailing of your documents indefinitely unless you instruct Eaton Vance, or your financial intermediary, otherwise. If you would prefer that your Eaton Vance documents not be householded, please contact Eaton Vance at 1-800-262-1122, or contact your financial intermediary. Your instructions that householding not apply to delivery of your Eaton Vance documents will typically be effective within 30 days of receipt by Eaton Vance or your financial intermediary.
Portfolio Holdings. Each Eaton Vance Fund and its underlying Portfolio(s) (if applicable) files a schedule of portfolio holdings on Part F to Form N-PORT with the SEC. Certain information filed on Form N-PORT may be viewed on the Eaton Vance website at www.eatonvance.com, by calling Eaton Vance at 1-800-262-1122 or in the EDGAR database on the SEC’s website at www.sec.gov.
Proxy Voting. From time to time, funds are required to vote proxies related to the securities held by the funds. The Eaton Vance Funds or their underlying Portfolios (if applicable) vote proxies according to a set of policies and procedures approved by the Funds’ and Portfolios’ Boards. You may obtain a description of these policies and procedures and information on how the Funds or Portfolios voted proxies relating to portfolio securities during the most recent 12-month period ended June 30, without charge, upon request, by calling 1-800-262-1122 and by accessing the SEC’s website at www.sec.gov.
Tailored Shareholder Reports. Effective January 24, 2023, the SEC adopted rule and form amendments to require open-end mutual funds and ETFs to transmit concise and visually engaging streamlined annual and semiannual reports to shareholders that highlight key information. Other information, including financial statements, will no longer appear in a streamlined shareholder report but must be available online, delivered free of charge upon request, and filed on a semiannual basis on Form N-CSR. The rule and form amendments have a compliance date of July 24, 2024. At this time, management is evaluating the impact of these amendments on the shareholder reports for the Eaton Vance Funds.
This Page Intentionally Left Blank
Investment Adviser of Global Macro Absolute Return Advantage Portfolio
Boston Management and Research
Two International Place
Boston, MA 02110
Investment Adviser and Administrator of Eaton Vance Global Macro Absolute Return Advantage Fund
Eaton Vance Management
Two International Place
Boston, MA 02110
Investment Sub-Adviser
Eaton Vance Advisers International Ltd.
125 Old Broad Street
London, EC2N 1AR
United Kingdom
Principal Underwriter*
Eaton Vance Distributors, Inc.
Two International Place
Boston, MA 02110
(617) 482-8260
Custodian
State Street Bank and Trust Company
One Congress Street, Suite 1
Boston, MA 02114-2016
Transfer Agent
BNY Mellon Investment Servicing (US) Inc.
Attn: Eaton Vance Funds
P.O. Box 534439
Pittsburgh, PA 15253-4439
(800) 262-1122
Independent Registered Public Accounting Firm
Deloitte & Touche LLP
200 Berkeley Street
Boston, MA 02116-5022
Fund Offices
Two International Place
Boston, MA 02110
* FINRA BrokerCheck. Investors may check the background of their Investment Professional by contacting the Financial Industry Regulatory Authority (FINRA). FINRA BrokerCheck is a free tool to help investors check the professional background of current and former FINRA-registered securities firms and brokers. FINRA BrokerCheck is available by calling 1-800-289-9999 and at www.FINRA.org. The FINRA BrokerCheck brochure describing this program is available to investors at www.FINRA.org.
Eaton Vance
Tax-Managed Global Dividend Income Fund
Annual Report
October 31, 2023
Commodity Futures Trading Commission Registration. The Commodity Futures Trading Commission (“CFTC”) has adopted regulations that subject registered investment companies and advisers to regulation by the CFTC if a fund invests more than a prescribed level of its assets in certain CFTC-regulated instruments (including futures, certain options and swap agreements) or markets itself as providing investment exposure to such instruments. The investment adviser has claimed an exclusion from the definition of “commodity pool operator” under the Commodity Exchange Act with respect to its management of the Fund. Accordingly, neither the Fund nor the adviser with respect to the operation of the Fund is subject to CFTC regulation. Because of its management of other strategies, the Fund's adviser is registered with the CFTC as a commodity pool operator. The adviser is also registered as a commodity trading advisor.
Fund shares are not insured by the FDIC and are not deposits or other obligations of, or guaranteed by, any depository institution. Shares are subject to investment risks, including possible loss of principal invested.
This report must be preceded or accompanied by a current summary prospectus or prospectus. Before investing, investors should consider carefully the investment objective, risks, and charges and expenses of a mutual fund. This and other important information is contained in the summary prospectus and prospectus, which can be obtained from a financial intermediary. Prospective investors should read the prospectus carefully before investing. For further information, please call 1-800-262-1122.
Annual Report October 31, 2023
Eaton Vance
Tax-Managed Global Dividend Income Fund
Eaton Vance
Tax-Managed Global Dividend Income Fund
October 31, 2023
Management’s Discussion of Fund Performance†
Economic and Market Conditions
For global equity investors, the 12-month period ended October 31, 2023, was a roller-coaster ride, driven largely by shifting perceptions of whether the U.S. Federal Reserve (the Fed) could bring the world’s largest economy in for a soft landing, and changing expectations of how long interest rates might remain high.
During the opening month of the period, stocks rallied on strong corporate earnings, attractive valuations, and hope the Fed might slow the pace of its interest rate hikes. But in December 2022, equities lost ground as “higher for longer” interest rate fears returned. A continuing irony throughout the period was that good economic news -- record low unemployment, strong job creation, and robust consumer spending -- was viewed as bad news for inflation and fuel for future rate hikes that could weigh on stock prices.
In January 2023, however, global equities began a rally that lasted through July. The initial tailwind was ChatGPT, an artificial intelligence (AI) application that led investors to perceive AI might become the next big innovation to drive the information technology (IT) sector. As a result, IT -- one of the worst-performing sectors in 2022 -- became the standout sector of the first half of 2023.
Earlier recession fears that had weighed on stock prices receded as many investors came around to the view that the U.S. and global economies were doing surprisingly well. European equities received an additional boost as feared continent-wide energy shortages failed to materialize during the winter.
But in the final three months of the period, the bond market halted the stock market’s momentum. As it became clear the Fed would keep rates higher for longer than investors had anticipated just a few months earlier, longer-term bond interest rates rose sharply. Given the potential for relatively attractive returns with lower risk than stocks, many investors shifted from equity assets to bonds. In the final two days of the period, however, signs of a stock rally emerged as investors began to believe the Fed might have reached the end of its monetary tightening cycle.
For the period as a whole, global equity performance was strong. The MSCI ACWI Index, a broad measure of global equities, returned 10.50%; the MSCI EAFE Index of developed-market international equities returned 14.40%; and the S&P 500® Index, a broad measure of U.S. stocks, returned 10.14%.
Meanwhile, in the world’s second-largest economy, the MSCI Golden Dragon Index, a measure of Chinese large-cap and mid-cap stocks, returned 21.11%. The strong 12-month performance, however, masked the significant decline in Chinese stock prices since early 2023, as Chinese equities were dogged by an ailing real estate sector -- the major investment area for millions of Chinese citizens -- and a failure of many Chinese industries to bounce back after onerous COVID restrictions were lifted.
Fund Performance
For the 12-month period ended October 31, 2023, Eaton Vance Tax-Managed Global Dividend Income Fund (the Fund) returned 13.10% for Class A shares at net asset value (NAV), outperforming its benchmark, the MSCI World Index (the Index), which returned 10.48%.
The Fund’s common stock allocation outperformed the Index and contributed to returns versus the Index. On an individual stock basis, the largest contributors to Index-relative returns were overweight positions in Novo Nordisk A/S (Novo Nordisk) and Eli Lilly & Co. (Eli Lilly).
Denmark-based Novo Nordisk is a pharmaceutical manufacturer focused on diabetes and obesity care. The company’s share price rose significantly during the period on robust sales of its weight-loss drug, Wegovy.
Eli Lilly is a global drugmaker specializing in diabetes, oncology, and immunology therapies. Its share price appreciated strongly during the period, with the best performance occurring in August 2023 after the company reported strong second-quarter earnings, driven in part by sales of the company’s diabetes drug, Mounjaro.
On a sector basis, stock selections in the health care, industrials, and consumer discretionary sectors contributed to performance versus the Index during the period.
In contrast, the largest individual stock detractors from Index-relative returns were an underweight position in NVIDIA Corp. (NVIDIA), and an overweight position in Dollar Tree, Inc. (Dollar Tree).
NVIDIA’s share price more than doubled during the period, lifted by increased demand for its high-end graphics processing units in the burgeoning artificial intelligence, or AI, industry. The Fund did not own NVIDIA until late in the period and missed most of its stock price appreciation.
Discount retailer Dollar Tree’s stock price fell after the firm warned that customers were shifting purchases from higher-margin discretionary items to lower-margin perishable goods to offset inflation. Dollar Tree also cited increased inventory shrinkage -- including losses through theft -- as another factor weighing on earnings during the period.
See Endnotes and Additional Disclosures in this report.
Past performance is no guarantee of future results. Returns are historical and are calculated by determining the percentage change in net asset value (NAV) or offering price (as applicable) with all distributions reinvested. Furthermore, returns do not reflect the deduction of taxes that shareholders may have to pay on Fund distributions or upon the redemption of Fund shares. Investment return and principal value will fluctuate so that shares, when redeemed, may be worth more or less than their original cost. Performance for periods less than or equal to one year is cumulative. Performance is for the stated time period only; due to market volatility, current Fund performance may be lower or higher than the quoted return. For performance as of the most recent month-end, please refer to eatonvance.com.
Eaton Vance
Tax-Managed Global Dividend Income Fund
October 31, 2023
Management’s Discussion of Fund Performance† — continued
On a sector basis, detractors from performance versus the Index included stock selections and underweight positions in the information technology and communication services sectors -- the two best performing sectors within the Index during the period -- along with stock selections in the consumer staples sector.
The Fund’s use of equity index futures contracts -- a type of derivative -- contributed to performance relative to the Index. Within the Fund’s common stock portfolio, the Fund’s strategy of emphasizing dividend-paying stocks resulted in an overweight allocation to European equities and an underweight allocation to U.S. equities. The Fund hedged these overweight and underweight exposures by selling short European index futures contracts and buying U.S. index futures contracts during the period.
See Endnotes and Additional Disclosures in this report.
Past performance is no guarantee of future results. Returns are historical and are calculated by determining the percentage change in net asset value (NAV) or offering price (as applicable) with all distributions reinvested. Furthermore, returns do not reflect the deduction of taxes that shareholders may have to pay on Fund distributions or upon the redemption of Fund shares. Investment return and principal value will fluctuate so that shares, when redeemed, may be worth more or less than their original cost. Performance for periods less than or equal to one year is cumulative. Performance is for the stated time period only; due to market volatility, current Fund performance may be lower or higher than the quoted return. For performance as of the most recent month-end, please refer to eatonvance.com.
Eaton Vance
Tax-Managed Global Dividend Income Fund
October 31, 2023
Performance
Portfolio Manager(s) Christopher M. Dyer, CFA, of Eaton Vance Advisers International Ltd. and Derek J.V. DiGregorio of Eaton Vance Management
| % Average Annual Total Returns1,2 | Class
Inception Date | Performance
Inception Date | One Year | Five Years | Ten Years |
| Class A at NAV | 05/30/2003 | 05/30/2003 | 13.10% | 8.35% | 6.75% |
| Class A with 5.25% Maximum Sales Charge | — | — | 7.19 | 7.18 | 6.18 |
| Class C at NAV | 05/30/2003 | 05/30/2003 | 12.20 | 7.53 | 6.11 |
| Class C with 1% Maximum Deferred Sales Charge | — | — | 11.20 | 7.53 | 6.11 |
| Class I at NAV | 08/27/2007 | 05/30/2003 | 13.38 | 8.60 | 7.02 |
|
| MSCI World Index | — | — | 10.48% | 8.26% | 7.53% |
| % After-Tax Returns with Maximum Sales Charge | Class
Inception Date | Performance
Inception Date | One Year | Five Years | Ten Years |
| Class A After Taxes on Distributions | 05/30/2003 | 05/30/2003 | 11.81% | 6.17% | 5.22% |
| Class A After Taxes on Distributions and Sale of Fund Shares | — | — | 8.77 | 5.73 | 4.88 |
| Class C After Taxes on Distributions | 05/30/2003 | 05/30/2003 | 11.11 | 6.68 | 5.29 |
| Class C After Taxes on Distributions and Sale of Fund Shares | — | — | 8.09 | 6.01 | 4.86 |
| Class I After Taxes on Distributions | 08/27/2007 | 05/30/2003 | 12.02 | 7.52 | 6.00 |
| Class I After Taxes on Distributions and Sale of Fund Shares | — | — | 8.98 | 6.88 | 5.58 |
| % Total Annual Operating Expense Ratios3 | Class A | Class C | Class I |
| | 1.18% | 1.94% | 0.93% |
Growth of $10,000
This graph shows the change in value of a hypothetical investment of $10,000 in Class A of the Fund for the period indicated. For comparison, the same investment is shown in the indicated index.
| Growth of Investment | Amount Invested | Period Beginning | At NAV | With Maximum Sales Charge |
| Class C | $10,000 | 10/31/2013 | $18,099 | N.A. |
| Class I, at minimum investment | $1,000,000 | 10/31/2013 | $1,971,097 | N.A. |
See Endnotes and Additional Disclosures in this report.
Past performance is no guarantee of future results. Returns are historical and are calculated by determining the percentage change in net asset value (NAV) or offering price (as applicable) with all distributions reinvested. Furthermore, returns do not reflect the deduction of taxes that shareholders may have to pay on Fund distributions or upon the redemption of Fund shares. Investment return and principal value will fluctuate so that shares, when redeemed, may be worth more or less than their original cost. Performance for periods less than or equal to one year is cumulative. Performance is for the stated time period only; due to market volatility, current Fund performance may be lower or higher than the quoted return. For performance as of the most recent month-end, please refer to eatonvance.com.
Eaton Vance
Tax-Managed Global Dividend Income Fund
October 31, 2023
| Sector Allocation (% of total investments)1 |
| Country Allocation (% of total investments) |
| Top 10 Holdings (% of total investments)1 |
| Microsoft Corp. | 4.3% |
| Eli Lilly & Co. | 4.1 |
| Novo Nordisk A/S, Class B | 3.2 |
| Apple, Inc. | 3.1 |
| Alphabet, Inc., Class C | 2.9 |
| EOG Resources, Inc. | 2.7 |
| Amazon.com, Inc. | 2.6 |
| ASML Holding NV | 2.0 |
| Nestle S.A. | 1.7 |
| ConocoPhillips | 1.7 |
| Total | 28.3% |
Footnotes:
| 1 | Excludes cash and cash equivalents. |
Eaton Vance
Tax-Managed Global Dividend Income Fund
October 31, 2023
Endnotes and Additional Disclosures
| † | The views expressed in this report are those of the portfolio manager(s) and are current only through the date stated at the top of this page. These views are subject to change at any time based upon market or other conditions, and Eaton Vance and the Fund(s) disclaim any responsibility to update such views. These views may not be relied upon as investment advice and, because investment decisions are based on many factors, may not be relied upon as an indication of trading intent on behalf of any Eaton Vance fund. This commentary may contain statements that are not historical facts, referred to as “forward-looking statements.” The Fund’s actual future results may differ significantly from those stated in any forward-looking statement, depending on factors such as changes in securities or financial markets or general economic conditions, the volume of sales and purchases of Fund shares, the continuation of investment advisory, administrative and service contracts, and other risks discussed from time to time in the Fund’s filings with the Securities and Exchange Commission. |
| | |
| 1 | MSCI World Index is an unmanaged index of equity securities in the developed markets. MSCI indexes are net of foreign withholding taxes. Source: MSCI. MSCI data may not be reproduced or used for any other purpose. MSCI provides no warranties, has not prepared or approved this report, and has no liability hereunder. Unless otherwise stated, index returns do not reflect the effect of any applicable sales charges, commissions, expenses, taxes or leverage, as applicable. It is not possible to invest directly in an index. |
| 2 | Total Returns at NAV do not include applicable sales charges. If sales charges were deducted, the returns would be lower. Total Returns shown with maximum sales charge reflect the stated maximum sales charge. Unless otherwise stated, performance does not reflect the deduction of taxes on Fund distributions or redemptions of Fund shares. After-tax returns are calculated using certain assumptions, including using the highest historical individual federal income tax rates, and do not reflect the impact of state/local taxes. Actual after-tax returns depend on a shareholder’s tax situation and the actual characterization of distributions and may differ from those shown. After-tax returns are not relevant to shareholders who hold shares in tax-deferred accounts or shares held by nontaxable entities. Return After Taxes on Distributions may be the same as Return Before Taxes for the same period because no taxable distributions were made during that period. Return After Taxes on Distributions and Sale of Fund Shares may be greater than or equal to Return After Taxes on Distributions for the same period because of losses realized on the sale of Fund shares. The Fund’s after-tax returns also may reflect foreign tax credits passed by the Fund to its shareholders.Effective November 5, 2020, Class C shares automatically convert to Class A shares eight years after purchase. The average annual total returns listed for Class C reflect conversion to Class A shares after eight years. Prior to November 5, 2020, Class C shares automatically converted to Class A shares ten years after purchase. |
| 3 | Source: Fund prospectus. The expense ratios for the current reporting period can be found in the Financial Highlights section of this report. Performance reflects expenses waived and/or reimbursed, if applicable. Without such waivers and/or reimbursements, performance would have been lower. |
| | Fund profile subject to change due to active management. |
| | Additional Information |
| | S&P 500® Index is an unmanaged index of large-cap stocks commonly used as a measure of U.S. stock market performance. S&P Dow Jones Indices are a product of S&P Dow Jones Indices LLC (“S&P DJI”) and have been licensed for use. S&P® and S&P 500® are registered trademarks of S&P DJI; Dow Jones® is a registered trademark of Dow Jones Trademark Holdings LLC (“Dow Jones”); S&P DJI, Dow Jones and their respective affiliates do not sponsor, endorse, sell or promote the Fund, will not have any liability with respect thereto and do not have any liability for any errors, omissions, or interruptions of the S&P Dow Jones Indices. MSCI Golden Dragon Index is an unmanaged index of common stocks traded in China, Hong Kong and Taiwan. MSCI ACWI Index is an unmanaged free-float-adjusted, market-capitalization-weighted index designed to measure the equity market performance of developed and emerging markets. MSCI EAFE Index is an unmanaged index of equities in the developed markets, excluding the U.S. and Canada. |
Eaton Vance
Tax-Managed Global Dividend Income Fund
October 31, 2023
Example
As a Fund shareholder, you incur two types of costs: (1) transaction costs, including sales charges (loads) on purchases; and (2) ongoing costs, including management fees; distribution and/or service fees; and other Fund expenses. This Example is intended to help you understand your ongoing costs (in dollars) of Fund investing and to compare these costs with the ongoing costs of investing in other mutual funds. The Example is based on an investment of $1,000 invested at the beginning of the period and held for the entire period (May 1, 2023 to October 31, 2023).
Actual Expenses
The first section of the table below provides information about actual account values and actual expenses. You may use the information in this section, together with the amount you invested, to estimate the expenses that you paid over the period. Simply divide your account value by $1,000 (for example, an $8,600 account value divided by $1,000 = 8.6), then multiply the result by the number in the first section under the heading entitled “Expenses Paid During Period” to estimate the expenses you paid on your account during this period.
Hypothetical Example for Comparison Purposes
The second section of the table below provides information about hypothetical account values and hypothetical expenses based on the actual Fund expense ratio and an assumed rate of return of 5% per year (before expenses), which is not the actual Fund return. The hypothetical account values and expenses may not be used to estimate the actual ending account balance or expenses you paid for the period. You may use this information to compare the ongoing costs of investing in your Fund and other funds. To do so, compare this 5% hypothetical example with the 5% hypothetical examples that appear in the shareholder reports of the other funds.
Please note that the expenses shown in the table are meant to highlight your ongoing costs only and do not reflect any transactional costs, such as sales charges (loads). Therefore, the second section of the table is useful in comparing ongoing costs only, and will not help you determine the relative total costs of owning different funds. In addition, if these transactional costs were included, your costs would be higher.
| | Beginning
Account Value
(5/1/23) | Ending
Account Value
(10/31/23) | Expenses Paid
During Period*
(5/1/23 – 10/31/23) | Annualized
Expense
Ratio |
| Actual | | | | |
| Class A | $1,000.00 | $ 995.80 | $6.09 | 1.21% |
| Class C | $1,000.00 | $ 992.10 | $9.84 | 1.96% |
| Class I | $1,000.00 | $ 997.10 | $4.83 | 0.96% |
| |
| Hypothetical | | | | |
| (5% return per year before expenses) | | | | |
| Class A | $1,000.00 | $1,019.11 | $6.16 | 1.21% |
| Class C | $1,000.00 | $1,015.33 | $9.96 | 1.96% |
| Class I | $1,000.00 | $1,020.37 | $4.89 | 0.96% |
| * | Expenses are equal to the Fund's annualized expense ratio for the indicated Class, multiplied by the average account value over the period, multiplied by 184/365 (to reflect the one-half year period). The Example assumes that the $1,000 was invested at the net asset value per share determined at the close of business on April 30, 2023. |
Eaton Vance
Tax-Managed Global Dividend Income Fund
October 31, 2023
| Security | Shares | Value |
| Aerospace & Defense — 1.1% |
| Safran S.A. | | 36,910 | $ 5,766,060 |
| | | | $ 5,766,060 |
| Air Freight & Logistics — 1.1% |
| GXO Logistics, Inc.(1) | | 115,179 | $ 5,817,691 |
| | | | $ 5,817,691 |
| Automobiles — 0.4% |
| Tesla, Inc.(1) | | 10,790 | $ 2,167,064 |
| | | | $ 2,167,064 |
| Banks — 8.2% |
| Banco Santander S.A. | | 2,020,541 | $ 7,431,415 |
| Barclays PLC | | 2,489,121 | 3,995,153 |
| Citigroup, Inc. | | 112,575 | 4,445,587 |
| HDFC Bank, Ltd. | | 249,880 | 4,429,499 |
| HSBC Holdings PLC | | 773,596 | 5,585,685 |
| ING Groep NV | | 293,763 | 3,766,196 |
| KBC Group NV | | 57,238 | 3,150,084 |
| Toronto-Dominion Bank (The) | | 58,206 | 3,251,225 |
| Truist Financial Corp. | | 108,073 | 3,064,950 |
| Wells Fargo & Co. | | 134,293 | 5,340,833 |
| | | | $ 44,460,627 |
| Beverages — 1.9% |
| Coca-Cola Co. (The) | | 121,355 | $ 6,855,344 |
| Diageo PLC | | 92,383 | 3,493,553 |
| | | | $ 10,348,897 |
| Biotechnology — 0.7% |
| CSL, Ltd. | | 24,891 | $ 3,678,693 |
| | | | $ 3,678,693 |
| Broadline Retail — 2.6% |
| Amazon.com, Inc.(1) | | 106,569 | $ 14,183,268 |
| | | | $ 14,183,268 |
| Capital Markets — 1.4% |
| Bank of New York Mellon Corp. (The) | | 30,386 | $ 1,291,405 |
| Security | Shares | Value |
| Capital Markets (continued) |
| Intercontinental Exchange, Inc. | | 30,995 | $ 3,330,103 |
| Stifel Financial Corp. | | 52,188 | 2,974,716 |
| | | | $ 7,596,224 |
| Chemicals — 0.2% |
| Sika AG | | 5,209 | $ 1,246,563 |
| | | | $ 1,246,563 |
| Commercial Services & Supplies — 0.7% |
| Veralto Corp. | | 1 | $ 69 |
| Waste Management, Inc. | | 22,912 | 3,765,129 |
| | | | $ 3,765,198 |
| Construction Materials — 0.2% |
| CRH PLC | | 16,187 | $ 867,138 |
| | | | $ 867,138 |
| Consumer Finance — 0.4% |
| Capital One Financial Corp. | | 20,676 | $ 2,094,272 |
| | | | $ 2,094,272 |
| Consumer Staples Distribution & Retail — 1.0% |
| Dollar Tree, Inc.(1) | | 50,469 | $ 5,606,601 |
| | | | $ 5,606,601 |
| Electric Utilities — 1.6% |
| Iberdrola S.A. | | 445,619 | $ 4,956,183 |
| NextEra Energy, Inc. | | 62,677 | 3,654,069 |
| | | | $ 8,610,252 |
| Electrical Equipment — 1.8% |
| AMETEK, Inc. | | 29,792 | $ 4,193,820 |
| Schneider Electric SE | | 37,208 | 5,724,722 |
| | | | $ 9,918,542 |
| Electronic Equipment, Instruments & Components — 3.2% |
| CDW Corp. | | 42,219 | $ 8,460,688 |
| Halma PLC | | 120,368 | 2,706,877 |
| Keyence Corp. | | 5,288 | 2,047,082 |
| Keysight Technologies, Inc.(1) | | 14,315 | 1,747,146 |
| TE Connectivity, Ltd. | | 21,795 | 2,568,541 |
| | | | $ 17,530,334 |
8
See Notes to Financial Statements.
Eaton Vance
Tax-Managed Global Dividend Income Fund
October 31, 2023
Portfolio of Investments — continued
| Security | Shares | Value |
| Entertainment — 1.3% |
| Walt Disney Co. (The)(1) | | 87,481 | $ 7,137,575 |
| | | | $ 7,137,575 |
| Financial Services — 2.8% |
| Berkshire Hathaway, Inc., Class B(1) | | 20,400 | $ 6,963,132 |
| Fidelity National Information Services, Inc. | | 57,906 | 2,843,764 |
| Visa, Inc., Class A | | 22,396 | 5,265,299 |
| | | | $ 15,072,195 |
| Food Products — 2.6% |
| Mondelez International, Inc., Class A | | 73,039 | $ 4,835,912 |
| Nestle S.A. | | 84,301 | 9,090,913 |
| | | | $ 13,926,825 |
| Ground Transportation — 0.8% |
| Union Pacific Corp. | | 20,505 | $ 4,257,043 |
| | | | $ 4,257,043 |
| Health Care Equipment & Supplies — 2.7% |
| Alcon, Inc. | | 45,181 | $ 3,233,881 |
| Boston Scientific Corp.(1) | | 112,755 | 5,771,928 |
| Intuitive Surgical, Inc.(1) | | 13,197 | 3,460,517 |
| Straumann Holding AG | | 20,175 | 2,384,364 |
| | | | $ 14,850,690 |
| Health Care Providers & Services — 2.0% |
| Elevance Health, Inc. | | 15,491 | $ 6,972,344 |
| UnitedHealth Group, Inc. | | 7,179 | 3,844,785 |
| | | | $ 10,817,129 |
| Health Care REITs — 0.5% |
| Healthpeak Properties, Inc. | | 165,850 | $ 2,578,967 |
| | | | $ 2,578,967 |
| Hotels, Restaurants & Leisure — 2.8% |
| Amadeus IT Group S.A. | | 56,401 | $ 3,218,964 |
| Compass Group PLC | | 328,507 | 8,282,107 |
| InterContinental Hotels Group PLC | | 56,336 | 3,992,110 |
| | | | $ 15,493,181 |
| Household Products — 0.9% |
| Reckitt Benckiser Group PLC | | 71,247 | $ 4,766,918 |
| | | | $ 4,766,918 |
| Security | Shares | Value |
| Industrial Conglomerates — 1.2% |
| Siemens AG | | 49,382 | $ 6,552,935 |
| | | | $ 6,552,935 |
| Insurance — 4.0% |
| AIA Group, Ltd. | | 460,409 | $ 3,998,101 |
| Allstate Corp. (The) | | 31,081 | 3,982,408 |
| Arch Capital Group, Ltd.(1) | | 8,222 | 712,683 |
| Assurant, Inc. | | 27,513 | 4,096,686 |
| AXA S.A. | | 131,430 | 3,894,327 |
| RenaissanceRe Holdings, Ltd. | | 21,825 | 4,792,552 |
| | | | $ 21,476,757 |
| Interactive Media & Services — 3.9% |
| Alphabet, Inc., Class C(1) | | 123,764 | $ 15,507,629 |
| Meta Platforms, Inc., Class A(1) | | 18,723 | 5,640,678 |
| | | | $ 21,148,307 |
| IT Services — 0.9% |
| Accenture PLC, Class A | | 15,992 | $ 4,751,063 |
| | | | $ 4,751,063 |
| Leisure Products — 0.4% |
| Yamaha Corp. | | 75,666 | $ 2,021,033 |
| | | | $ 2,021,033 |
| Life Sciences Tools & Services — 1.3% |
| Danaher Corp. | | 24,117 | $ 4,630,946 |
| Lonza Group AG | | 2,852 | 998,782 |
| Sartorius AG, PFC Shares | | 6,190 | 1,551,460 |
| | | | $ 7,181,188 |
| Machinery — 1.1% |
| Ingersoll Rand, Inc. | | 90,452 | $ 5,488,628 |
| Sandvik AB | | 20,944 | 356,739 |
| | | | $ 5,845,367 |
| Media — 0.6% |
| Dentsu Group, Inc. | | 118,177 | $ 3,432,566 |
| | | | $ 3,432,566 |
| Metals & Mining — 1.2% |
| Anglo American PLC | | 98,702 | $ 2,514,885 |
| Rio Tinto, Ltd. | | 55,322 | 4,132,447 |
| | | | $ 6,647,332 |
9
See Notes to Financial Statements.
Eaton Vance
Tax-Managed Global Dividend Income Fund
October 31, 2023
Portfolio of Investments — continued
| Security | Shares | Value |
| Multi-Utilities — 0.3% |
| CMS Energy Corp. | | 30,479 | $ 1,656,229 |
| | | | $ 1,656,229 |
| Oil, Gas & Consumable Fuels — 5.4% |
| Chevron Corp. | | 38,001 | $ 5,537,886 |
| ConocoPhillips | | 76,090 | 9,039,492 |
| EOG Resources, Inc. | | 114,956 | 14,513,195 |
| | | | $ 29,090,573 |
| Personal Care Products — 0.3% |
| Kose Corp. | | 25,880 | $ 1,714,575 |
| | | | $ 1,714,575 |
| Pharmaceuticals — 10.4% |
| AstraZeneca PLC | | 43,075 | $ 5,393,145 |
| Eli Lilly & Co. | | 39,712 | 21,997,668 |
| Novo Nordisk A/S, Class B | | 178,046 | 17,177,203 |
| Sanofi S.A. | | 55,068 | 5,000,518 |
| Zoetis, Inc. | | 42,902 | 6,735,614 |
| | | | $ 56,304,148 |
| Professional Services — 2.3% |
| Recruit Holdings Co., Ltd. | | 136,575 | $ 3,915,974 |
| RELX PLC | | 142,745 | 4,985,753 |
| Verisk Analytics, Inc. | | 16,679 | 3,792,137 |
| | | | $ 12,693,864 |
| Semiconductors & Semiconductor Equipment — 6.6% |
| ASML Holding NV | | 18,467 | $ 11,100,891 |
| Infineon Technologies AG | | 214,743 | 6,272,688 |
| Micron Technology, Inc. | | 86,277 | 5,769,343 |
| NVIDIA Corp. | | 19,020 | 7,756,356 |
| Taiwan Semiconductor Manufacturing Co., Ltd. ADR | | 54,340 | 4,690,085 |
| | | | $ 35,589,363 |
| Software — 7.6% |
| Adobe, Inc.(1) | | 15,003 | $ 7,982,496 |
| Dassault Systemes SE | | 71,140 | 2,930,497 |
| Intuit, Inc. | | 13,713 | 6,787,249 |
| Microsoft Corp. | | 69,598 | 23,531,780 |
| | | | $ 41,232,022 |
| Specialized REITs — 0.1% |
| American Tower Corp. | | 4,449 | $ 792,767 |
| | | | $ 792,767 |
| Security | Shares | Value |
| Specialty Retail — 2.3% |
| Lowe's Cos., Inc. | | 23,156 | $ 4,412,839 |
| TJX Cos., Inc. (The) | | 92,526 | 8,148,765 |
| | | | $ 12,561,604 |
| Technology Hardware, Storage & Peripherals — 3.1% |
| Apple, Inc. | | 98,553 | $ 16,829,896 |
| | | | $ 16,829,896 |
| Textiles, Apparel & Luxury Goods — 0.8% |
| LVMH Moet Hennessy Louis Vuitton SE | | 6,379 | $ 4,566,920 |
| | | | $ 4,566,920 |
| Trading Companies & Distributors — 1.9% |
| Ashtead Group PLC | | 74,284 | $ 4,260,368 |
| IMCD NV | | 52,769 | 6,353,155 |
| | | | $ 10,613,523 |
Total Common Stocks
(identified cost $389,711,285) | | | $535,259,979 |
| Security | Principal
Amount
(000's omitted) | Value |
| Financial Services — 0.7% |
| PPTT, 2006-A GS, Class A, 3.378%(2)(3)(4) | $ | 4,541 | $ 3,789,010 |
| | | | $ 3,789,010 |
| Oil, Gas & Consumable Fuels — 0.0%(5) |
| Odebrecht Oil & Gas Finance, Ltd., 0.00%(2)(3) | $ | 2,008 | $ 41,409 |
| | | | $ 41,409 |
Total Corporate Bonds
(identified cost $6,288,073) | | | $ 3,830,419 |
10
See Notes to Financial Statements.
Eaton Vance
Tax-Managed Global Dividend Income Fund
October 31, 2023
Portfolio of Investments — continued
| Short-Term Investments — 0.7% |
| Security | Shares | Value |
| Morgan Stanley Institutional Liquidity Funds - Government Portfolio, Institutional Class, 5.25%(6) | | 3,545,621 | $ 3,545,621 |
Total Short-Term Investments
(identified cost $3,545,621) | | | $ 3,545,621 |
Total Investments — 100.0%
(identified cost $399,544,979) | | | $542,636,019 |
| Other Assets, Less Liabilities — 0.0%(5) | | | $ 254,079 |
| Net Assets — 100.0% | | | $542,890,098 |
| The percentage shown for each investment category in the Portfolio of Investments is based on net assets. |
| (1) | Non-income producing security. |
| (2) | Security exempt from registration under Rule 144A of the Securities Act of 1933, as amended. These securities may be sold in certain transactions in reliance on an exemption from registration (normally to qualified institutional buyers). At October 31, 2023, the aggregate value of these securities is $3,830,419 or 0.7% of the Fund's net assets. |
| (3) | Perpetual security with no stated maturity date but may be subject to calls by the issuer. |
| (4) | Variable rate security. The stated interest rate, which resets quarterly, is determined at auction and represents the rate in effect at October 31, 2023. |
| (5) | Amount is less than 0.05%. |
| (6) | May be deemed to be an affiliated investment company. The rate shown is the annualized seven-day yield as of October 31, 2023. |
| Country Concentration of Portfolio |
| Country | Percentage of
Total Investments | Value |
| United States | 60.0% | $325,602,022 |
| United Kingdom | 9.2 | 49,976,554 |
| France | 5.1 | 27,883,044 |
| Netherlands | 3.9 | 21,220,242 |
| Switzerland | 3.6 | 19,523,044 |
| Denmark | 3.2 | 17,177,203 |
| Spain | 2.9 | 15,606,562 |
| Germany | 2.7 | 14,377,083 |
| Japan | 2.4 | 13,131,230 |
| Australia | 1.4 | 7,811,140 |
| Ireland | 1.0 | 5,618,201 |
| Bermuda | 0.9 | 4,792,552 |
| Taiwan | 0.9 | 4,690,085 |
| India | 0.8 | 4,429,499 |
| Hong Kong | 0.7 | 3,998,101 |
| Canada | 0.6 | 3,251,225 |
| Belgium | 0.6 | 3,150,084 |
| Sweden | 0.1 | 356,739 |
| Brazil | 0.0 (1) | 41,409 |
| Total Investments | 100.0% | $542,636,019 |
| (1) | Amount is less than 0.05%. |
| Abbreviations: |
| ADR | – American Depositary Receipt |
| PFC Shares | – Preference Shares |
| PPTT | – Preferred Pass-Through Trust |
| REITs | – Real Estate Investment Trusts |
11
See Notes to Financial Statements.
Eaton Vance
Tax-Managed Global Dividend Income Fund
October 31, 2023
Statement of Assets and Liabilities
| | October 31, 2023 |
| Assets | |
| Unaffiliated investments, at value (identified cost $395,999,358) | $ 539,090,398 |
| Affiliated investments, at value (identified cost $3,545,621) | 3,545,621 |
| Foreign currency, at value (identified cost $34,359) | 34,250 |
| Interest and dividends receivable | 288,823 |
| Dividends receivable from affiliated investments | 36,902 |
| Receivable for Fund shares sold | 338,014 |
| Tax reclaims receivable | 3,655,952 |
| Trustees' deferred compensation plan | 151,406 |
| Total assets | $547,141,366 |
| Liabilities | |
| Payable for investments purchased | $ 2,971,740 |
| Payable for Fund shares redeemed | 281,526 |
| Payable to affiliates: | |
| Investment adviser fee | 303,866 |
| Administration fee | 70,627 |
| Distribution and service fees | 94,860 |
| Trustees' fees | 3,133 |
| Trustees' deferred compensation plan | 151,406 |
| Accrued foreign capital gains taxes | 22,132 |
| Accrued expenses | 351,978 |
| Total liabilities | $ 4,251,268 |
| Net Assets | $542,890,098 |
| Sources of Net Assets | |
| Paid-in capital | $ 428,590,877 |
| Distributable earnings | 114,299,221 |
| Net Assets | $542,890,098 |
| Class A Shares | |
| Net Assets | $ 372,351,702 |
| Shares Outstanding | 26,564,440 |
Net Asset Value and Redemption Price Per Share
(net assets ÷ shares of beneficial interest outstanding) | $ 14.02 |
Maximum Offering Price Per Share
(100 ÷ 94.75 of net asset value per share) | $ 14.80 |
| Class C Shares | |
| Net Assets | $ 15,978,991 |
| Shares Outstanding | 1,142,796 |
Net Asset Value and Offering Price Per Share*
(net assets ÷ shares of beneficial interest outstanding) | $ 13.98 |
| Class I Shares | |
| Net Assets | $ 154,559,405 |
| Shares Outstanding | 11,014,622 |
Net Asset Value, Offering Price and Redemption Price Per Share
(net assets ÷ shares of beneficial interest outstanding) | $ 14.03 |
| On sales of $50,000 or more, the offering price of Class A shares is reduced. |
| * | Redemption price per share is equal to the net asset value less any applicable contingent deferred sales charge. |
12
See Notes to Financial Statements.
Eaton Vance
Tax-Managed Global Dividend Income Fund
October 31, 2023
| | Year Ended |
| | October 31, 2023 |
| Investment Income | |
| Dividend income (net of foreign taxes withheld of $3,778,347) | $ 26,778,892 |
| Dividend income from affiliated investments | 176,549 |
| Interest income | 97,148 |
| Other income | 848,492 |
| Total investment income | $27,901,081 |
| Expenses | |
| Investment adviser fee | $ 3,615,161 |
| Administration fee | 837,639 |
| Distribution and service fees: | |
| Class A | 964,626 |
| Class C | 185,602 |
| Trustees’ fees and expenses | 36,074 |
| Custodian fee | 229,349 |
| Transfer and dividend disbursing agent fees | 264,236 |
| Legal and accounting services | 70,462 |
| Printing and postage | 77,971 |
| Registration fees | 51,692 |
| Miscellaneous | 140,491 |
| Total expenses | $ 6,473,303 |
| Deduct: | |
| Waiver and/or reimbursement of expenses by affiliates | $ 5,394 |
| Total expense reductions | $ 5,394 |
| Net expenses | $ 6,467,909 |
| Net investment income | $21,433,172 |
| Realized and Unrealized Gain (Loss) | |
| Net realized gain (loss): | |
| Investment transactions (net of foreign capital gains taxes of $69,381) | $ 1,527,598 |
| Futures contracts | 11,640,851 |
| Foreign currency transactions | 188,876 |
| Net realized gain | $13,357,325 |
| Change in unrealized appreciation (depreciation): | |
| Investments (including net decrease in accrued foreign capital gains taxes of $96,420) | $ 32,176,561 |
| Foreign currency | 103,080 |
| Net change in unrealized appreciation (depreciation) | $32,279,641 |
| Net realized and unrealized gain | $45,636,966 |
| Net increase in net assets from operations | $67,070,138 |
13
See Notes to Financial Statements.
Eaton Vance
Tax-Managed Global Dividend Income Fund
October 31, 2023
Statements of Changes in Net Assets
| | Year Ended October 31, |
| | 2023 | 2022 |
| Increase (Decrease) in Net Assets | | |
| From operations: | | |
| Net investment income | $ 21,433,172 | $ 30,503,309 |
| Net realized gain (loss) | 13,357,325 | (27,989,042) |
| Net change in unrealized appreciation (depreciation) | 32,279,641 | (136,954,349) |
| Net increase (decrease) in net assets from operations | $ 67,070,138 | $(134,440,082) |
| Distributions to shareholders: | | |
| Class A | $ (19,402,761) | $ (36,746,038) |
| Class C | (802,494) | (2,080,114) |
| Class I | (8,120,405) | (14,667,950) |
| Total distributions to shareholders | $ (28,325,660) | $ (53,494,102) |
| Transactions in shares of beneficial interest: | | |
| Class A | $ (11,380,258) | $ (8,254,820) |
| Class C | (5,611,408) | (4,029,377) |
| Class I | 2,668,008 | 4,202,035 |
| Net decrease in net assets from Fund share transactions | $ (14,323,658) | $ (8,082,162) |
| Net increase (decrease) in net assets | $ 24,420,820 | $(196,016,346) |
| Net Assets | | |
| At beginning of year | $ 518,469,278 | $ 714,485,624 |
| At end of year | $542,890,098 | $ 518,469,278 |
14
See Notes to Financial Statements.
Eaton Vance
Tax-Managed Global Dividend Income Fund
October 31, 2023
| | Class A |
| | Year Ended October 31, |
| | 2023 | 2022 | 2021 | 2020 | 2019 |
| Net asset value — Beginning of year | $ 13.040 | $ 17.640 | $ 12.690 | $ 12.730 | $ 11.830 |
| Income (Loss) From Operations | | | | | |
| Net investment income(1) | $ 0.545 | $ 0.743 | $ 0.390 | $ 0.392 | $ 0.494 |
| Net realized and unrealized gain (loss) | 1.156 | (4.024) | 4.992 | — | 0.838 |
| Total income (loss) from operations | $ 1.701 | $ (3.281) | $ 5.382 | $ 0.392 | $ 1.332 |
| Less Distributions | | | | | |
| From net investment income | $ (0.721) | $ (0.644) | $ (0.432) | $ (0.432) | $ (0.432) |
| From net realized gain | — | (0.675) | — | — | — |
| Total distributions | $ (0.721) | $ (1.319) | $ (0.432) | $ (0.432) | $ (0.432) |
| Net asset value — End of year | $ 14.020 | $ 13.040 | $ 17.640 | $ 12.690 | $ 12.730 |
| Total Return(2) | 13.10% | (19.65)% | 42.80% | 3.20% | 11.52% |
| Ratios/Supplemental Data | | | | | |
| Net assets, end of year (000’s omitted) | $372,352 | $356,746 | $494,280 | $357,048 | $383,956 |
| Ratios (as a percentage of average daily net assets): | | | | | |
| Expenses | 1.20% (3) | 1.18% (3) | 1.16% | 1.20% | 1.22% |
| Net investment income | 3.80% | 4.97% | 2.41% | 3.09% | 4.08% |
| Portfolio Turnover | 107% | 99% | 56% | 173% | 128% |
| (1) | Computed using average shares outstanding. |
| (2) | Returns are historical and are calculated by determining the percentage change in net asset value with all distributions reinvested and do not reflect the effect of sales charges. |
| (3) | Includes a reduction by the investment adviser of a portion of its adviser fee due to the Fund's investment in the Liquidity Fund (equal to less than 0.005% of average daily net assets for the years ended October 31, 2023 and 2022). |
15
See Notes to Financial Statements.
Eaton Vance
Tax-Managed Global Dividend Income Fund
October 31, 2023
Financial Highlights — continued
| | Class C |
| | Year Ended October 31, |
| | 2023 | 2022 | 2021 | 2020 | 2019 |
| Net asset value — Beginning of year | $ 13.010 | $ 17.590 | $ 12.650 | $ 12.700 | $ 11.800 |
| Income (Loss) From Operations | | | | | |
| Net investment income(1) | $ 0.421 | $ 0.612 | $ 0.248 | $ 0.300 | $ 0.312 |
| Net realized and unrealized gain (loss) | 1.161 | (3.990) | 5.003 | (0.014) | 0.927 |
| Total income (loss) from operations | $ 1.582 | $ (3.378) | $ 5.251 | $ 0.286 | $ 1.239 |
| Less Distributions | | | | | |
| From net investment income | $ (0.612) | $ (0.527) | $ (0.311) | $ (0.336) | $ (0.339) |
| From net realized gain | — | (0.675) | — | — | — |
| Total distributions | $ (0.612) | $ (1.202) | $ (0.311) | $ (0.336) | $ (0.339) |
| Net asset value — End of year | $13.980 | $13.010 | $17.590 | $12.650 | $12.700 |
| Total Return(2) | 12.20% | (20.22)% | 41.79% | 2.34% | 10.70% |
| Ratios/Supplemental Data | | | | | |
| Net assets, end of year (000’s omitted) | $ 15,979 | $ 20,044 | $ 31,961 | $ 42,936 | $ 72,014 |
| Ratios (as a percentage of average daily net assets): | | | | | |
| Expenses | 1.95% (3) | 1.94% (3) | 1.92% | 1.96% | 1.97% |
| Net investment income | 2.96% | 4.08% | 1.55% | 2.38% | 2.62% |
| Portfolio Turnover | 107% | 99% | 56% | 173% | 128% |
| (1) | Computed using average shares outstanding. |
| (2) | Returns are historical and are calculated by determining the percentage change in net asset value with all distributions reinvested and do not reflect the effect of sales charges. |
| (3) | Includes a reduction by the investment adviser of a portion of its adviser fee due to the Fund's investment in the Liquidity Fund (equal to less than 0.005% of average daily net assets for the years ended October 31, 2023 and 2022). |
16
See Notes to Financial Statements.
Eaton Vance
Tax-Managed Global Dividend Income Fund
October 31, 2023
Financial Highlights — continued
| | Class I |
| | Year Ended October 31, |
| | 2023 | 2022 | 2021 | 2020 | 2019 |
| Net asset value — Beginning of year | $ 13.050 | $ 17.650 | $ 12.700 | $ 12.750 | $ 11.850 |
| Income (Loss) From Operations | | | | | |
| Net investment income(1) | $ 0.577 | $ 0.788 | $ 0.424 | $ 0.424 | $ 0.503 |
| Net realized and unrealized gain (loss) | 1.160 | (4.032) | 4.998 | (0.010) | 0.859 |
| Total income (loss) from operations | $ 1.737 | $ (3.244) | $ 5.422 | $ 0.414 | $ 1.362 |
| Less Distributions | | | | | |
| From net investment income | $ (0.757) | $ (0.681) | $ (0.472) | $ (0.464) | $ (0.462) |
| From net realized gain | — | (0.675) | — | — | — |
| Total distributions | $ (0.757) | $ (1.356) | $ (0.472) | $ (0.464) | $ (0.462) |
| Net asset value — End of year | $ 14.030 | $ 13.050 | $ 17.650 | $ 12.700 | $ 12.750 |
| Total Return(2) | 13.38% | (19.44)% | 43.12% | 3.38% | 11.78% |
| Ratios/Supplemental Data | | | | | |
| Net assets, end of year (000’s omitted) | $154,559 | $141,680 | $188,245 | $151,266 | $177,646 |
| Ratios (as a percentage of average daily net assets): | | | | | |
| Expenses | 0.95% (3) | 0.93% (3) | 0.91% | 0.95% | 0.97% |
| Net investment income | 4.03% | 5.26% | 2.63% | 3.34% | 4.16% |
| Portfolio Turnover | 107% | 99% | 56% | 173% | 128% |
| (1) | Computed using average shares outstanding. |
| (2) | Returns are historical and are calculated by determining the percentage change in net asset value with all distributions reinvested. |
| (3) | Includes a reduction by the investment adviser of a portion of its adviser fee due to the Fund's investment in the Liquidity Fund (equal to less than 0.005% of average daily net assets for the years ended October 31, 2023 and 2022). |
17
See Notes to Financial Statements.
Eaton Vance
Tax-Managed Global Dividend Income Fund
October 31, 2023
Notes to Financial Statements
1 Significant Accounting Policies
Eaton Vance Tax-Managed Global Dividend Income Fund (the Fund) is a diversified series of Eaton Vance Mutual Funds Trust (the Trust). The Trust is a Massachusetts business trust registered under the Investment Company Act of 1940, as amended (the 1940 Act), as an open-end management investment company. The Fund’s investment objective is to achieve after-tax total return for its shareholders. The Fund offers three classes of shares. Class A shares are generally sold subject to a sales charge imposed at time of purchase. Class C shares are sold at net asset value and are generally subject to a contingent deferred sales charge (see Note 5). Effective November 5, 2020, Class C shares automatically convert to Class A shares eight years after their purchase as described in the Fund’s prospectus. Class I shares are sold at net asset value and are not subject to a sales charge. Each class represents a pro rata interest in the Fund, but votes separately on class-specific matters and (as noted below) is subject to different expenses. Realized and unrealized gains and losses and net investment income and losses, other than class-specific expenses, are allocated daily to each class of shares based on the relative net assets of each class to the total net assets of the Fund. Each class of shares differs in its distribution plan and certain other class-specific expenses.
The following is a summary of significant accounting policies of the Fund. The policies are in conformity with accounting principles generally accepted in the United States of America (U.S. GAAP). The Fund is an investment company and follows accounting and reporting guidance in the Financial Accounting Standards Board (FASB) Accounting Standards Codification Topic 946.
A Investment Valuation—The following methodologies are used to determine the market value or fair value of investments.
Equity Securities. Equity securities listed on a U.S. securities exchange generally are valued at the last sale or closing price on the day of valuation or, if no sales took place on such date, at the mean between the closing bid and ask prices on the exchange where such securities are principally traded. Equity securities listed on the NASDAQ National Market System are valued at the NASDAQ official closing price. Unlisted or listed securities for which closing sales prices or closing quotations are not available are valued at the mean between the latest available bid and ask prices or, in the case of preferred equity securities that are not listed or traded in the over-the-counter market, by a third party pricing service that uses various techniques that consider factors including, but not limited to, prices or yields of securities with similar characteristics, benchmark yields, broker/dealer quotes, quotes of underlying common stock, issuer spreads, as well as industry and economic events.
Debt Obligations. Debt obligations are generally valued on the basis of valuations provided by third party pricing services, as derived from such services’ pricing models. Inputs to the models may include, but are not limited to, reported trades, executable bid and ask prices, broker/dealer quotations, prices or yields of securities with similar characteristics, interest rates, anticipated prepayments, benchmark curves or information pertaining to the issuer, as well as industry and economic events. The pricing services may use a matrix approach, which considers information regarding securities with similar characteristics to determine the valuation for a security. Short-term debt obligations purchased with a remaining maturity of sixty days or less for which a valuation from a third party pricing service is not readily available may be valued at amortized cost, which approximates fair value.
Derivatives. Futures contracts are valued at the closing settlement price established by the board of trade or exchange on which they are traded, with adjustments for fair valuation for certain foreign futures contracts as described below.
Foreign Securities, Futures Contracts and Currencies. Foreign securities, futures contracts and currencies are valued in U.S. dollars, based on foreign currency exchange rate quotations supplied by a third party pricing service. The pricing service uses a proprietary model to determine the exchange rate. Inputs to the model include reported trades and implied bid/ask spreads. The daily valuation of exchange-traded foreign securities and certain exchange-traded foreign futures contracts generally is determined as of the close of trading on the principal exchange on which such securities and contracts trade. Events occurring after the close of trading on foreign exchanges may result in adjustments to the valuation of foreign securities and certain foreign futures contracts to more accurately reflect their fair value as of the close of regular trading on the New York Stock Exchange. When valuing foreign equity securities and foreign futures contracts that meet certain criteria, the Fund’s Trustees have approved the use of a fair value service that values such securities and foreign futures contracts to reflect market trading that occurs after the close of the applicable foreign markets of comparable securities or other instruments that have a strong correlation to the fair-valued securities and foreign futures contracts.
Other. Investments in management investment companies (including money market funds) that do not trade on an exchange are valued at the net asset value as of the close of each business day.
Fair Valuation. In connection with Rule 2a-5 of the 1940 Act, the Trustees have designated the Fund’s investment adviser as its valuation designee. Investments for which valuations or market quotations are not readily available or are deemed unreliable are valued by the investment adviser, as valuation designee, at fair value using methods that most fairly reflect the security’s “fair value”, which is the amount that the Fund might reasonably expect to receive for the security upon its current sale in the ordinary course. Each such determination is based on a consideration of relevant factors, which are likely to vary from one pricing context to another. These factors may include, but are not limited to, the type of security, the existence of any contractual restrictions on the security’s disposition, the price and extent of public trading in similar securities of the issuer or of comparable companies or entities, quotations or relevant information obtained from broker/dealers or other market participants, information obtained from the issuer, analysts, and/or the appropriate stock exchange (for exchange-traded securities), an analysis of the company’s or entity’s financial statements, and an evaluation of the forces that influence the issuer and the market(s) in which the security is purchased and sold.
B Investment Transactions—Investment transactions for financial statement purposes are accounted for on a trade date basis. Realized gains and losses on investments sold are determined on the basis of identified cost.
Eaton Vance
Tax-Managed Global Dividend Income Fund
October 31, 2023
Notes to Financial Statements — continued
C Income—Dividend income is recorded on the ex-dividend date for dividends received in cash and/or securities. However, if the ex-dividend date has passed, certain dividends from foreign securities are recorded as the Fund is informed of the ex-dividend date. Withholding taxes on foreign dividends and capital gains have been provided for in accordance with the Fund’s understanding of the applicable countries’ tax rules and rates. In consideration of recent decisions rendered by European courts, the Fund has filed additional tax reclaims for previously withheld taxes on dividends earned in certain European Union countries. These filings are subject to various administrative and judicial proceedings within these countries. During the year ended October 31, 2023, the Fund recorded income of $848,492 for previously withheld foreign taxes from Sweden of which $485,818 was received and $362,674 is unpaid. Such amounts are included in Other income on the Statement of Operations. No other amounts for additional tax reclaims are reflected in the financial statements due to the uncertainty as to the ultimate resolution of proceedings, the likelihood of receipt of these reclaims, and the potential timing of payment. Interest income is recorded on the basis of interest accrued, adjusted for amortization of premium or accretion of discount. Distributions from investment companies are recorded as dividend income, capital gains or return of capital based on the nature of the distribution.
D Federal and Other Taxes—The Fund’s policy is to comply with the provisions of the Internal Revenue Code applicable to regulated investment companies and to distribute to shareholders each year substantially all of its net investment income, and all or substantially all of its net realized capital gains. Accordingly, no provision for federal income or excise tax is necessary.
In addition to the requirements of the Internal Revenue Code, the Fund may also be subject to local taxes on the recognition of capital gains in certain countries. In determining the daily net asset value, the Fund estimates the accrual for such taxes, if any, based on the unrealized appreciation on certain portfolio securities and the related tax rates. Taxes attributable to unrealized appreciation are included in the change in unrealized appreciation (depreciation) on investments. Capital gains taxes on securities sold are included in net realized gain (loss) on investments.
As of October 31, 2023, the Fund had no uncertain tax positions that would require financial statement recognition, de-recognition, or disclosure. The Fund files a U.S. federal income tax return annually after its fiscal year-end, which is subject to examination by the Internal Revenue Service for a period of three years from the date of filing.
E Expenses—The majority of expenses of the Trust are directly identifiable to an individual fund. Expenses which are not readily identifiable to a specific fund are allocated taking into consideration, among other things, the nature and type of expense and the relative size of the funds.
F Foreign Currency Translation—Investment valuations, other assets, and liabilities initially expressed in foreign currencies are translated each business day into U.S. dollars based upon current exchange rates. Purchases and sales of foreign investment securities and income and expenses denominated in foreign currencies are translated into U.S. dollars based upon currency exchange rates in effect on the respective dates of such transactions. Recognized gains or losses on investment transactions attributable to changes in foreign currency exchange rates are recorded for financial statement purposes as net realized gains and losses on investments. That portion of unrealized gains and losses on investments that results from fluctuations in foreign currency exchange rates is not separately disclosed.
G Use of Estimates—The preparation of the financial statements in conformity with U.S. GAAP requires management to make estimates and assumptions that affect the reported amounts of assets and liabilities at the date of the financial statements and the reported amounts of income and expense during the reporting period. Actual results could differ from those estimates.
H Indemnifications—Under the Trust’s organizational documents, its officers and Trustees may be indemnified against certain liabilities and expenses arising out of the performance of their duties to the Fund. Under Massachusetts law, if certain conditions prevail, shareholders of a Massachusetts business trust (such as the Trust) could be deemed to have personal liability for the obligations of the Trust. However, the Trust’s Declaration of Trust contains an express disclaimer of liability on the part of Fund shareholders and the By-laws provide that the Trust shall assume, upon request by the shareholder, the defense on behalf of any Fund shareholders. Moreover, the By-laws also provide for indemnification out of Fund property of any shareholder held personally liable solely by reason of being or having been a shareholder for all loss or expense arising from such liability. Additionally, in the normal course of business, the Fund enters into agreements with service providers that may contain indemnification clauses. The Fund’s maximum exposure under these arrangements is unknown as this would involve future claims that may be made against the Fund that have not yet occurred.
I Futures Contracts—Upon entering into a futures contract, the Fund is required to deposit with the broker, either in cash or securities, an amount equal to a certain percentage of the contract amount (initial margin). Subsequent payments, known as variation margin, are made or received by the Fund each business day, depending on the daily fluctuations in the value of the underlying security or index and are recorded as unrealized gains or losses by the Fund. Gains (losses) are realized upon the expiration or closing of the futures contracts. Should market conditions change unexpectedly, the Fund may not achieve the anticipated benefits of the futures contracts and may realize a loss. Futures contracts have minimal counterparty risk as they are exchange traded and the clearinghouse for the exchange is substituted as the counterparty, guaranteeing counterparty performance.
Eaton Vance
Tax-Managed Global Dividend Income Fund
October 31, 2023
Notes to Financial Statements — continued
2 Distributions to Shareholders and Income Tax Information
It is the present policy of the Fund to make monthly distributions of all or substantially all of its net investment income and to distribute annually all or substantially all of its net realized capital gains. Distributions to shareholders are recorded on the ex-dividend date. Distributions are declared separately for each class of shares. Shareholders may reinvest income and capital gain distributions in additional shares of the same class of the Fund at the net asset value as of the ex-dividend date or, at the election of the shareholder, receive distributions in cash. Distributions to shareholders are determined in accordance with income tax regulations, which may differ from U.S. GAAP. As required by U.S. GAAP, only distributions in excess of tax basis earnings and profits are reported in the financial statements as a return of capital. Permanent differences between book and tax accounting relating to distributions are reclassified to paid-in capital. For tax purposes, distributions from short-term capital gains are considered to be from ordinary income.
The tax character of distributions declared for the years ended October 31, 2023 and October 31, 2022 was as follows:
| | Year Ended October 31, |
| | 2023 | 2022 |
| Ordinary income | $28,325,660 | $26,337,455 |
| Long-term capital gains | $ — | $27,156,647 |
During the year ended October 31, 2023, distributable earnings was increased by $2,559 and paid-in capital was decreased by $2,559 due to the Fund’s use of equalization accounting. Tax equalization accounting allows the Fund to treat as a distribution that portion of redemption proceeds representing a redeeming shareholder’s portion of undistributed taxable income and net capital gains. These reclassifications had no effect on the net assets or net asset value per share of the Fund.
As of October 31, 2023, the components of distributable earnings (accumulated loss) on a tax basis were as follows:
| Undistributed ordinary income | $ 905,441 |
| Deferred capital losses | (20,442,053) |
| Net unrealized appreciation | 133,835,833 |
| Distributable earnings | $114,299,221 |
At October 31, 2023, the Fund, for federal income tax purposes, had deferred capital losses of $20,442,053 which would reduce its taxable income arising from future net realized gains on investment transactions, if any, to the extent permitted by the Internal Revenue Code, and thus would reduce the amount of distributions to shareholders, which would otherwise be necessary to relieve the Fund of any liability for federal income or excise tax. The deferred capital losses are treated as arising on the first day of the Fund’s next taxable year and retain the same short-term or long-term character as when originally deferred. Of the deferred capital losses at October 31, 2023, $20,442,053 are short-term.
The cost and unrealized appreciation (depreciation) of investments of the Fund at October 31, 2023, as determined on a federal income tax basis, were as follows:
| Aggregate cost | $ 408,675,671 |
| Gross unrealized appreciation | $ 151,392,133 |
| Gross unrealized depreciation | (17,431,785) |
| Net unrealized appreciation | $ 133,960,348 |
Eaton Vance
Tax-Managed Global Dividend Income Fund
October 31, 2023
Notes to Financial Statements — continued
3 Investment Adviser Fee and Other Transactions with Affiliates
The investment adviser fee is earned by Eaton Vance Management (EVM), an indirect, wholly-owned subsidiary of Morgan Stanley, as compensation for investment advisory services rendered to the Fund. The fee is computed at an annual rate as a percentage of average daily net assets as follows and is payable monthly:
| Average Daily Net Assets | Annual Fee Rate |
| Up to $500 million | 0.650% |
| $500 million but less than $1 billion | 0.625% |
| $1 billion but less than $2.5 billion | 0.600% |
| $2.5 billion and over | 0.575% |
For the year ended October 31, 2023, the Fund’s investment adviser fee amounted to $3,615,161 or 0.65% of the Fund’s average daily net assets.
Pursuant to an investment sub-advisory agreement, EVM has delegated a portion of the investment management of the Fund to Eaton Vance Advisers International Ltd. (EVAIL), an affiliate of EVM and an indirect wholly-owned subsidiary of Morgan Stanley. EVM pays EVAIL a portion of its investment adviser fee for sub-advisory services provided to the Fund. The Fund may invest in a money market fund, the Institutional Class of the Morgan Stanley Institutional Liquidity Funds - Government Portfolio (the “Liquidity Fund”), an open-end management investment company managed by Morgan Stanley Investment Management Inc., a wholly-owned subsidiary of Morgan Stanley. The investment adviser fee paid by the Fund is reduced by an amount equal to its pro rata share of the advisory and administration fees paid by the Fund due to its investment in the Liquidity Fund. For the year ended October 31, 2023, the investment adviser fee paid was reduced by $5,394 relating to the Fund's investment in the Liquidity Fund.
The administration fee is earned by EVM for administering the business affairs of the Fund and is computed at an annual rate of 0.15% of the Fund’s average daily net assets. For the year ended October 31, 2023, the administration fee amounted to $837,639.
EVM provides sub-transfer agency and related services to the Fund pursuant to a Sub-Transfer Agency Support Services Agreement. For the year ended October 31, 2023, EVM earned $36,923 from the Fund pursuant to such agreement, which is included in transfer and dividend disbursing agent fees on the Statement of Operations. The Fund was informed that Eaton Vance Distributors, Inc. (EVD), an affiliate of EVM and the Fund’s principal underwriter, received $20,621 as its portion of the sales charge on sales of Class A shares for the year ended October 31, 2023. EVD also received distribution and service fees from Class A and Class C shares (see Note 4) and contingent deferred sales charges (see Note 5).
Trustees and officers of the Fund who are members of EVM’s organization receive remuneration for their services to the Fund out of the investment adviser fee. Trustees of the Fund who are not affiliated with EVM may elect to defer receipt of all or a percentage of their annual fees in accordance with the terms of the Trustees Deferred Compensation Plan. Certain officers and Trustees of the Fund are officers of EVM.
4 Distribution Plan
The Fund has in effect a distribution plan for Class A shares (Class A Plan) pursuant to Rule 12b-1 under the 1940 Act. Pursuant to the Class A Plan, the Fund pays EVD a distribution and service fee of 0.25% per annum of its average daily net assets attributable to Class A shares for distribution services and facilities provided to the Fund by EVD, as well as for personal services and/or the maintenance of shareholder accounts. Distribution and service fees paid or accrued to EVD for the year ended October 31, 2023 amounted to $964,626 for Class A shares.
The Fund also has in effect a distribution plan for Class C shares (Class C Plan) pursuant to Rule 12b-1 under the 1940 Act. Pursuant to the Class C Plan, the Fund pays EVD amounts equal to 0.75% per annum of its average daily net assets attributable to Class C shares for providing ongoing distribution services and facilities to the Fund. For the year ended October 31, 2023, the Fund paid or accrued to EVD $139,201 for Class C shares.
Pursuant to the Class C Plan, the Fund also makes payments of service fees to EVD, financial intermediaries and other persons in amounts equal to 0.25% per annum of its average daily net assets attributable to that class. Service fees paid or accrued are for personal services and/or the maintenance of shareholder accounts. They are separate and distinct from the sales commissions and distribution fees payable to EVD. Service fees paid or accrued for the year ended October 31, 2023 amounted to $46,401 for Class C shares.
Distribution and service fees are subject to the limitations contained in the Financial Industry Regulatory Authority Rule 2341(d).
Eaton Vance
Tax-Managed Global Dividend Income Fund
October 31, 2023
Notes to Financial Statements — continued
5 Contingent Deferred Sales Charges
A contingent deferred sales charge (CDSC) of 1% generally is imposed on redemptions of Class C shares made within 12 months of purchase. Class A shares may be subject to a 1% CDSC if redeemed within 12 months of purchase (depending on the circumstances of purchase). Generally, the CDSC is based upon the lower of the net asset value at date of redemption or date of purchase. No charge is levied on shares acquired by reinvestment of dividends or capital gain distributions. For the year ended October 31, 2023, the Fund was informed that EVD received $703 of CDSCs paid by Class C shareholders and no CDSCs paid by Class A shareholders.
6 Purchases and Sales of Investments
Purchases and sales of investments, other than short-term obligations, aggregated $590,308,548 and $590,828,468, respectively, for the year ended October 31, 2023.
7 Shares of Beneficial Interest
The Fund’s Declaration of Trust permits the Trustees to issue an unlimited number of full and fractional shares of beneficial interest (without par value). Such shares may be issued in a number of different series (such as the Fund) and classes. Transactions in Fund shares, including direct exchanges pursuant to share class conversions, were as follows:
| | Year Ended
October 31, 2023 | | Year Ended
October 31, 2022 |
| | Shares | Amount | | Shares | Amount |
| Class A | | | | | |
| Sales | 917,870 | $ 13,169,060 | | 837,928 | $ 12,746,332 |
| Issued to shareholders electing to receive payments of distributions in Fund shares | 1,149,976 | 16,316,413 | | 1,988,103 | 31,128,867 |
| Redemptions | (2,859,448) | (40,865,731) | | (3,492,728) | (52,130,019) |
| Net decrease | (791,602) | $(11,380,258) | | (666,697) | $ (8,254,820) |
| Class C | | | | | |
| Sales | 82,510 | $ 1,190,290 | | 151,545 | $ 2,260,680 |
| Issued to shareholders electing to receive payments of distributions in Fund shares | 53,453 | 753,168 | | 123,746 | 1,950,604 |
| Redemptions | (533,903) | (7,554,866) | | (551,290) | (8,240,661) |
| Net decrease | (397,940) | $ (5,611,408) | | (275,999) | $ (4,029,377) |
| Class I | | | | | |
| Sales | 1,283,369 | $ 18,585,934 | | 1,203,000 | $ 18,090,072 |
| Issued to shareholders electing to receive payments of distributions in Fund shares | 563,960 | 8,014,130 | | 924,788 | 14,449,527 |
| Redemptions | (1,685,724) | (23,932,056) | | (1,937,346) | (28,337,564) |
| Net increase | 161,605 | $ 2,668,008 | | 190,442 | $ 4,202,035 |
8 Financial Instruments
The Fund may trade in financial instruments with off-balance sheet risk in the normal course of its investing activities. These financial instruments may include futures contracts and may involve, to a varying degree, elements of risk in excess of the amounts recognized for financial statement purposes. The notional or contractual amounts of these instruments represent the investment the Fund has in particular classes of financial instruments and do not necessarily represent the amounts potentially subject to risk. The measurement of the risks associated with these instruments is meaningful only when all related and offsetting transactions are considered. At October 31, 2023, there were no obligations outstanding under these financial instruments.
Eaton Vance
Tax-Managed Global Dividend Income Fund
October 31, 2023
Notes to Financial Statements — continued
The Fund is subject to equity price risk in the normal course of pursuing its investment objective. To hedge against this risk, the Fund enters into equity futures contracts on securities indices to gain or limit exposure to certain markets, particularly in connection with engaging in the dividend capture trading strategy.
The effect of derivative instruments (not considered to be hedging instruments for accounting disclosure purposes) on the Statement of Operations and whose primary underlying risk exposure is equity price risk for the year ended October 31, 2023 was as follows:
| Derivative | Realized Gain (Loss)
on Derivatives Recognized
in Income | Change in Unrealized
Appreciation (Depreciation) on
Derivatives Recognized in Income |
| Futures contracts | $11,640,851 (1) | $ — |
| (1) | Statement of Operations location: Net realized gain (loss): Futures contracts. |
The average notional cost of futures contracts outstanding during the year ended October 31, 2023, which is indicative of the volume of this derivative type, was approximately as follows:
Futures
Contracts — Long | Futures
Contracts — Short |
| $40,377,000 | $40,890,000 |
9 Line of Credit
The Fund participates with other portfolios and funds managed by EVM and its affiliates in a $650 million unsecured revolving line of credit agreement with a group of banks, which is in effect through October 22, 2024. In connection with the renewal of the agreement on October 24, 2023, the borrowing limit was decreased from $725 million. Borrowings are made by the Fund solely for temporary purposes related to redemptions and other short-term cash needs. Interest is charged to the Fund based on its borrowings at an amount above either the Secured Overnight Financing Rate (SOFR) or Federal Funds rate. In addition, a fee computed at an annual rate of 0.15% on the daily unused portion of the line of credit is allocated among the participating portfolios and funds at the end of each quarter. In connection with the renewal of the agreement in October 2023, an arrangement fee totaling $150,000 was incurred that was allocated to the participating portfolios and funds. Because the line of credit is not available exclusively to the Fund, it may be unable to borrow some or all of its requested amounts at any particular time. The Fund did not have any significant borrowings or allocated fees during the year ended October 31, 2023.
10 Affiliated Investments
At October 31, 2023, the value of the Fund's investment in funds that may be deemed to be affiliated was $3,545,621, which represents 0.7% of the Fund's net assets. Transactions in such investments by the Fund for the year ended October 31, 2023 were as follows:
| Name | Value,
beginning
of period | Purchases | Sales
proceeds | Net
realized
gain (loss) | Change in
unrealized
appreciation
(depreciation) | Value, end
of period | Dividend
income | Shares,
end of period |
| Short-Term Investments |
| Liquidity Fund | $5,023,564 | $130,971,017 | $(132,448,960) | $ — | $ — | $3,545,621 | $176,549 | 3,545,621 |
Eaton Vance
Tax-Managed Global Dividend Income Fund
October 31, 2023
Notes to Financial Statements — continued
11 Fair Value Measurements
Under generally accepted accounting principles for fair value measurements, a three-tier hierarchy to prioritize the assumptions, referred to as inputs, is used in valuation techniques to measure fair value. The three-tier hierarchy of inputs is summarized in the three broad levels listed below.
| • | Level 1 – quoted prices in active markets for identical investments |
| • | Level 2 – other significant observable inputs (including quoted prices for similar investments, interest rates, prepayment speeds, credit risk, etc.) |
| • | Level 3 – significant unobservable inputs (including a fund's own assumptions in determining the fair value of investments) |
In cases where the inputs used to measure fair value fall in different levels of the fair value hierarchy, the level disclosed is determined based on the lowest level input that is significant to the fair value measurement in its entirety. The inputs or methodology used for valuing securities are not necessarily an indication of the risk associated with investing in those securities.
At October 31, 2023, the hierarchy of inputs used in valuing the Fund's investments, which are carried at fair value, were as follows:
| Asset Description | Level 1 | Level 2 | Level 3 | Total |
| Common Stocks: | | | | |
| Communication Services | $ 28,285,882 | $ 3,432,566 | $ — | $ 31,718,448 |
| Consumer Discretionary | 28,911,936 | 22,081,134 | — | 50,993,070 |
| Consumer Staples | 17,297,857 | 19,065,959 | — | 36,363,816 |
| Energy | 29,090,573 | — | — | 29,090,573 |
| Financials | 54,449,615 | 36,250,460 | — | 90,700,075 |
| Health Care | 53,413,802 | 39,418,046 | — | 92,831,848 |
| Industrials | 27,314,517 | 37,915,706 | — | 65,230,223 |
| Information Technology | 90,874,643 | 25,058,035 | — | 115,932,678 |
| Materials | 867,138 | 7,893,895 | — | 8,761,033 |
| Real Estate | 3,371,734 | — | — | 3,371,734 |
| Utilities | 5,310,298 | 4,956,183 | — | 10,266,481 |
| Total Common Stocks | $ 339,187,995 | $ 196,071,984* | $ — | $535,259,979 |
| Corporate Bonds | $ — | $ 3,830,419 | $ — | $ 3,830,419 |
| Short-Term Investments | 3,545,621 | — | — | 3,545,621 |
| Total Investments | $ 342,733,616 | $ 199,902,403 | $ — | $542,636,019 |
| * | Includes foreign equity securities whose values were adjusted to reflect market trading of comparable securities or other correlated instruments that occurred after the close of trading in their applicable foreign markets. |
12 Risks and Uncertainties
Risks Associated with Foreign Investments
Foreign investments can be adversely affected by political, economic and market developments abroad, including the imposition of economic and other sanctions by the United States or another country. There may be less publicly available information about foreign issuers because they may not be subject to reporting practices, requirements or regulations comparable to those to which United States companies are subject. Foreign markets may be smaller, less liquid and more volatile than the major markets in the United States. Trading in foreign markets typically involves higher expense than trading in the United States. The Fund may have difficulties enforcing its legal or contractual rights in a foreign country. Securities that trade or are denominated in currencies other than the U.S. dollar may be adversely affected by fluctuations in currency exchange rates.
Eaton Vance
Tax-Managed Global Dividend Income Fund
October 31, 2023
Report of Independent Registered Public Accounting Firm
To the Trustees of Eaton Vance Mutual Funds Trust and Shareholders of Eaton Vance Tax-Managed Global Dividend Income Fund:
Opinion on the Financial Statements and Financial Highlights
We have audited the accompanying statement of assets and liabilities of Eaton Vance Tax-Managed Global Dividend Income Fund (the “Fund") (one of the funds constituting Eaton Vance Mutual Funds Trust), including the portfolio of investments, as of October 31, 2023, the related statement of operations for the year then ended, the statements of changes in net assets for each of the two years in the period then ended, the financial highlights for each of the five years in the period then ended, and the related notes. In our opinion, the financial statements and financial highlights present fairly, in all material respects, the financial position of the Fund as of October 31, 2023, and the results of its operations for the year then ended, the changes in its net assets for each of the two years in the period then ended, and the financial highlights for each of the five years in the period then ended, in conformity with accounting principles generally accepted in the United States of America.
Basis for Opinion
These financial statements and financial highlights are the responsibility of the Fund's management. Our responsibility is to express an opinion on the Fund's financial statements and financial highlights based on our audits. We are a public accounting firm registered with the Public Company Accounting Oversight Board (United States) (PCAOB) and are required to be independent with respect to the Fund in accordance with the U.S. federal securities laws and the applicable rules and regulations of the Securities and Exchange Commission and the PCAOB.
We conducted our audits in accordance with the standards of the PCAOB. Those standards require that we plan and perform the audit to obtain reasonable assurance about whether the financial statements and financial highlights are free of material misstatement, whether due to error or fraud. The Fund is not required to have, nor were we engaged to perform, an audit of its internal control over financial reporting. As part of our audits, we are required to obtain an understanding of internal control over financial reporting but not for the purpose of expressing an opinion on the effectiveness of the Fund’s internal control over financial reporting. Accordingly, we express no such opinion.
Our audits included performing procedures to assess the risks of material misstatement of the financial statements and financial highlights, whether due to error or fraud, and performing procedures that respond to those risks. Such procedures included examining, on a test basis, evidence regarding the amounts and disclosures in the financial statements and financial highlights. Our audits also included evaluating the accounting principles used and significant estimates made by management, as well as evaluating the overall presentation of the financial statements and financial highlights. Our procedures included confirmation of securities owned as of October 31, 2023, by correspondence with the custodian and brokers; when replies were not received from brokers, we performed other auditing procedures. We believe that our audits provide a reasonable basis for our opinion.
/s/ Deloitte & Touche LLP
Boston, Massachusetts
December 19, 2023
We have served as the auditor of one or more Eaton Vance investment companies since 1959.
Eaton Vance
Tax-Managed Global Dividend Income Fund
October 31, 2023
Federal Tax Information (Unaudited)
The Form 1099-DIV you receive in February 2024 will show the tax status of all distributions paid to your account in calendar year 2023. Shareholders are advised to consult their own tax adviser with respect to the tax consequences of their investment in the Fund. As required by the Internal Revenue Code and/or regulations, shareholders must be notified regarding the status of qualified dividend income for individuals, the dividends received deduction for corporations and 163(j) interest dividends.
Qualified Dividend Income. For the fiscal year ended October 31, 2023, the Fund designates approximately $30,073,531, or up to the maximum amount of such dividends allowable pursuant to the Internal Revenue Code, as qualified dividend income eligible for the reduced tax rate of 15%.
Dividends Received Deduction. Corporate shareholders are generally entitled to take the dividends received deduction on the portion of the Fund’s dividend distribution that qualifies under tax law. For the Fund’s fiscal 2023 ordinary income dividends, 16.73% qualifies for the corporate dividends received deduction.
163(j) Interest Dividends. For the fiscal year ended October 31, 2023, the Fund designates 0.33% of distributions from net investment income as a 163(j) interest dividend.
Eaton Vance
Tax-Managed Global Dividend Income Fund
October 31, 2023
Board of Trustees’ Contract Approval
Overview of the Contract Review Process
The Investment Company Act of 1940, as amended (the “1940 Act”), provides, in substance, that the investment advisory agreement between a fund and its investment adviser will continue in effect from year-to-year only if its continuation is approved on an annual basis by a vote of the fund’s board of trustees, including a majority of the trustees who are not “interested persons” of the fund (“independent trustees”), cast in person at a meeting called for the purpose of considering such approval.
At a meeting held on June 8, 2023, the Boards of Trustees/Directors (collectively, the “Board”) that oversee the registered investment companies advised by Eaton Vance Management or its affiliate, Boston Management and Research (the “Eaton Vance Funds”), including a majority of the independent trustees (the “Independent Trustees”), voted to approve the continuation of existing investment advisory agreements and sub-advisory agreements1 for each of the Eaton Vance Funds for an additional one-year period. The Board relied upon the affirmative recommendation of its Contract Review Committee, which is a committee exclusively comprised of Independent Trustees. Prior to making its recommendation, the Contract Review Committee reviewed information furnished by the adviser and sub-adviser to each of the Eaton Vance Funds (including information specifically requested by the Board) for a series of formal meetings held between April and June 2023, as well as certain additional information provided in response to specific requests from the Independent Trustees as members of the Contract Review Committee. Members of the Contract Review Committee also considered information received at prior meetings of the Board and its committees, to the extent such information was relevant to the Contract Review Committee’s annual evaluation of the investment advisory agreements and sub-advisory agreements.
In connection with its evaluation of the investment advisory agreements and sub-advisory agreements, the Board considered various information relating to the Eaton Vance Funds. This included information applicable to all or groups of Eaton Vance Funds, which is referenced immediately below, and information applicable to the particular Eaton Vance Fund covered by this report (each “Eaton Vance Fund” is referred to below as a “fund”). (For funds that invest through one or more underlying portfolios, references to “each fund” in this section may include information that was considered at the portfolio-level.)
Information about Fees, Performance and Expenses
• A report from an independent data provider comparing advisory and other fees paid by each fund to such fees paid by comparable funds, as identified by the independent data provider (“comparable funds”);
• A report from an independent data provider comparing each fund’s total expense ratio (and its components) to those of comparable funds;
• A report from an independent data provider comparing the investment performance of each fund (including, as relevant, total return data, income data, Sharpe ratios and information ratios) to the investment performance of comparable funds and, as applicable, benchmark indices, over various time periods;
• In certain instances, data regarding investment performance relative to customized groups of peer funds and blended indices identified by the adviser in consultation with the Portfolio Management Committee of the Board (a committee exclusively comprised of Independent Trustees);
• Comparative information concerning the fees charged and services provided by the adviser and sub-adviser to each fund in managing other accounts (which may include other mutual funds,collective investment funds and institutional accounts) using investment strategies and techniques similar to those used in managing such fund(s), if any;
• Profitability analyses with respect to the adviser and sub-adviser to each of the funds;
Information about Portfolio Management and Trading
• Descriptions of the investment management services provided to each fund, as well as each of the funds’ investment strategies and policies;
• The procedures and processes used to determine the value of fund assets, including, when necessary, the determination of “fair value” and actions taken to monitor and test the effectiveness of such procedures and processes;
• Information about the policies and practices of each fund’s adviser and sub-adviser with respect to trading, including their processes for seeking best execution of portfolio transactions;
• Information about the allocation of brokerage transactions and the benefits, if any, received by the adviser and sub-adviser to each fund as a result of brokerage allocation, including, as applicable, information concerning the acquisition of research through client commission arrangements and policies with respect to “soft dollars”;
• Data relating to the portfolio turnover rate of each fund and related information regarding active management in the context of particular strategies;
Information about each Adviser and Sub-adviser
• Reports detailing the financial results and condition of the adviser and sub-adviser to each fund;
• Information regarding the individual investment professionals whose responsibilities include portfolio management and investment research for the funds, and, for portfolio managers and certain other investment professionals, information relating to their responsibilities with respect to managing other mutual funds and investment accounts, as applicable;
1 Not all Eaton Vance Funds have entered into a sub-advisory agreement with a sub-adviser. Accordingly, references to “sub-adviser” or “sub-advisory agreement” in this “Overview” section may not be applicable to the particular Eaton Vance Fund covered by this report.
Eaton Vance
Tax-Managed Global Dividend Income Fund
October 31, 2023
Board of Trustees’ Contract Approval — continued
• Information regarding the adviser’s and its parent company’s (Morgan Stanley’s) efforts to retain and attract talented investment professionals, including in the context of a competitive marketplace for talent, as well as the ongoing unique environment presented by hybrid, remote and other alternative work arrangements;
• Information regarding the adviser’s compensation methodology for its investment professionals and the incentives and accountability it creates, along with investment professionals’ investments in the fund(s) they manage;
• The Code of Ethics of the adviser and its affiliates and the sub-adviser of each fund, together with information relating to compliance with, and the administration of, such codes;
• Policies and procedures relating to proxy voting, including regular reporting with respect to fund proxy voting activities;
• Information regarding the handling of corporate actions and class actions, as well as information regarding litigation and other regulatory matters;
• Information concerning the resources devoted to compliance efforts undertaken by the adviser and its affiliates and the sub-adviser of each fund, if any, including descriptions of their various compliance programs and their record of compliance;
• Information concerning the business continuity and disaster recovery plans of the adviser and its affiliates and the sub-adviser of each fund, if any;
• A description of Eaton Vance Management’s and Boston Management and Research’s oversight of sub-advisers, including with respect to regulatory and compliance issues, investment management and other matters;
Other Relevant Information
• Information regarding ongoing initiatives to further integrate and harmonize, where applicable, the investment management and other departments of the adviser and its affiliates with the overall investment management infrastructure of Morgan Stanley, in light of Morgan Stanley’s acquisition of Eaton Vance Corp. on March 1, 2021;
• Information concerning the nature, cost and character of the administrative and other non-investment advisory services provided by Eaton Vance Management and its affiliates;
• Information concerning oversight of the relationship with the custodian, subcustodians, fund accountants, and other third-party service providers by the adviser and/or administrator to each of the funds;
• Information concerning efforts to implement policies and procedures with respect to various recently adopted regulations applicable to the funds, including Rule 12d1-4 (the Fund-of-Funds Rule), Rule 18f-4 (the Derivatives Rule) and Rule 2a-5 (the Fair Valuation Rule);
• For an Eaton Vance Fund structured as an exchange-listed closed-end fund, information concerning the benefits of the closed-end fund structure, as well as, where relevant, the closed-end fund’s market prices (including as compared to the closed-end fund’s net asset value (NAV)), trading volume data, continued use of auction preferred shares (where applicable), distribution rates and other relevant matters;
• The risks which the adviser and/or its affiliates incur in connection with the management and operation of the funds, including, among others, litigation, regulatory, entrepreneurial, and other business risks (and the associated costs of such risks); and
• The terms of each investment advisory agreement and sub-advisory agreement.
During the various meetings of the Board and its committees over the course of the year leading up to the June 8, 2023 meeting, the Board received information from portfolio managers and other investment professionals of the advisers and sub-advisers of the funds regarding investment and performance matters, and considered various investment and trading strategies used in pursuing the funds’ investment objectives. The Board also received information regarding risk management techniques employed in connection with the management of the funds. The Board and its committees evaluated issues pertaining to industry and regulatory developments, compliance procedures, fund governance and other issues with respect to the funds, and received and participated in reports and presentations provided by Eaton Vance Management, Boston Management and Research and fund sub-advisers, with respect to such matters. In addition to the formal meetings of the Board and its committees, the Independent Trustees held regular teleconferences to discuss, among other topics, matters relating to the continuation of investment advisory agreements and sub-advisory agreements.
The Contract Review Committee was advised throughout the contract review process by Goodwin Procter LLP, independent legal counsel for the Independent Trustees. The members of the Contract Review Committee, with the advice of such counsel, exercised their own business judgment in determining the material factors to be considered in evaluating each investment advisory agreement and sub-advisory agreement and the weight to be given to each such factor. The conclusions reached with respect to each investment advisory agreement and sub-advisory agreement were based on a comprehensive evaluation of all the information provided and not any single factor. Moreover, each member of the Contract Review Committee may have placed varying emphasis on particular factors in reaching conclusions with respect to each investment advisory agreement and sub-advisory agreement. In evaluating each investment advisory agreement and sub-advisory agreement, including the fee structures and other terms contained in such agreements, the members of the Contract Review Committee were also informed by multiple years of analysis and discussion with the adviser and sub-adviser to each of the Eaton Vance Funds.
Results of the Contract Review Process
Based on its consideration of the foregoing, and such other information it deemed relevant, including the factors and conclusions described below, the Contract Review Committee concluded that the continuation of the investment advisory agreement between Eaton Vance Tax-Managed Global Dividend Income Fund (the “Fund”) and Eaton Vance Management (the “Adviser”), and the sub-advisory agreement between the Adviser and Eaton Vance Advisers
Eaton Vance
Tax-Managed Global Dividend Income Fund
October 31, 2023
Board of Trustees’ Contract Approval — continued
International Ltd. (the “Sub-adviser”), an affiliate of the Adviser, with respect to the Fund, including their respective fee structures, are in the interests of shareholders and, therefore, recommended to the Board approval of each agreement. Based on the recommendation of the Contract Review Committee, the Board, including a majority of the Independent Trustees, voted to approve continuation of the investment advisory agreement and the sub-advisory agreement for the Fund.
Nature, Extent and Quality of Services
In considering whether to approve the investment advisory agreement and the sub-advisory agreement for the Fund, the Board evaluated the nature, extent and quality of services provided to the Fund by the Adviser and the Sub-adviser.
The Board considered the Adviser’s and the Sub-adviser’s management capabilities and investment processes in light of the types of investments held by the Fund, including the education, experience and number of investment professionals and other personnel who provide portfolio management, investment research, and similar services to the Fund. Regarding the Adviser, the Board considered the Adviser’s responsibilities with respect to oversight of the Sub-adviser and coordinating activities in implementing the investment strategies of the Fund. The Board also considered the Adviser’s in-house equity research capabilities and experience in managing funds that seek to maximize after-tax returns. With respect to the Sub-adviser, the Board considered the abilities and experience of the Sub-adviser’s investment professionals in investing in equity securities, including investing in both U.S. and foreign common stocks. In particular, the Board considered the abilities and experience of the Adviser’s and the Sub-adviser’s investment professionals in analyzing factors such as special considerations relevant to investing in dividend-paying common and preferred stocks and foreign markets. The Board considered the international investment capabilities of the Sub-adviser, which is based in London, and the benefits to the Fund of having portfolio management services involving investments in international equities provided by investment professionals located abroad. The Board also took into account the resources dedicated to portfolio management and other services, the compensation methods of the Adviser and other factors, including the reputation and resources of the Adviser to recruit and retain highly qualified research, advisory and supervisory investment professionals. In addition, the Board considered the time and attention devoted to the Eaton Vance Funds, including the Fund, by senior management, as well as the infrastructure, operational capabilities and support staff in place to assist in the portfolio management and operations of the Fund, including the provision of administrative services. The Board also considered the business-related and other risks to which the Adviser or its affiliates may be subject in managing the Fund.
The Board considered the compliance programs of the Adviser and relevant affiliates thereof, including the Sub-adviser. The Board considered compliance and reporting matters regarding, among other things, personal trading by investment professionals, disclosure of portfolio holdings, late trading, frequent trading, portfolio valuation, business continuity and the allocation of investment opportunities. The Board also considered the responses of the Adviser and its affiliates to requests in recent years from regulatory authorities, such as the Securities and Exchange Commission and the Financial Industry Regulatory Authority.
The Board considered other administrative services provided or overseen by Eaton Vance Management and its affiliates, including transfer agency and accounting services. The Board evaluated the benefits to shareholders of investing in a fund that is a part of a large fund complex offering exposure to a variety of asset classes and investment disciplines, as well as the ability, in many cases, to exchange an investment among different funds without incurring additional sales charges.
After consideration of the foregoing factors, among others, the Board concluded that the nature, extent and quality of services provided by the Adviser and the Sub-adviser, taken as a whole, are appropriate and consistent with the terms of the investment advisory agreement and the sub-advisory agreement.
Fund Performance
The Board compared the Fund’s investment performance to that of comparable funds identified by an independent data provider (the peer group), as well as an appropriate benchmark index. The Board’s review included comparative performance data with respect to the Fund for the one-, three-, five- and ten-year periods ended December 31, 2022. In this regard, the Board noted that the performance of the Fund was higher than the median performance of the Fund’s peer group for the three-year period. The Board also noted that the performance of the Fund was lower than its benchmark index for the three-year period. The Board concluded that the performance of the Fund was satisfactory.
Management Fees and Expenses
The Board considered contractual fee rates payable by the Fund for advisory and administrative services (referred to collectively as “management fees”). As part of its review, the Board considered the Fund’s management fees and total expense ratio for the one-year period ended December 31, 2022, as compared to those of comparable funds, before and after giving effect to any undertaking to waive fees or reimburse expenses. The Board also considered certain factors identified by management in response to inquiries from the Contract Review Committee regarding the Fund’s total expense ratio relative to comparable funds.
After considering the foregoing information, and in light of the nature, extent and quality of the services provided by the Adviser and the Sub-adviser, the Board concluded that the management fees charged for advisoryand related services are reasonable.
Eaton Vance
Tax-Managed Global Dividend Income Fund
October 31, 2023
Board of Trustees’ Contract Approval — continued
Profitability and “Fall-Out” Benefits
The Board considered the level of profits realized by the Adviser and relevant affiliates thereof, including the Sub-adviser, in providing investment advisory and administrative services to the Fund and to all Eaton Vance Funds as a group. The Board considered the level of profits realized without regard to marketing support or other payments by the Adviser and its affiliates to third parties in respect of distribution or other services.
The Board concluded that, in light of the foregoing factors and the nature, extent and quality of the services rendered, the profits realized by the Adviser and its affiliates, including the Sub-adviser, are deemed not to be excessive.
The Board also considered direct or indirect fall-out benefits received by the Adviser and its affiliates, including the Sub-adviser, in connection with their respective relationships with the Fund, including the benefits of research services that may be available to the Adviser or the Sub-adviser as a result of securities transactions effected for the Fund and other investment advisory clients.
Economies of Scale
In reviewing management fees and profitability, the Board also considered the extent to which the Adviser and its affiliates, on the one hand, and the Fund, on the other hand, can expect to realize benefits from economies of scale as the assets of the Fund increase. The Board acknowledged the difficulty in accurately measuring the benefits resulting from economies of scale, if any, with respect to the management of any specific fund or group of funds. The Board reviewed data summarizing the increases and decreases in the assets of the Fund and of all Eaton Vance Funds as a group over various time periods, and evaluated the extent to which the total expense ratio of the Fund and the profitability of the Adviser and its affiliates may have been affected by such increases or decreases. Based upon the foregoing, the Board concluded that the Fund currently shares in the benefits from economies of scale, if any, when they are realized by the Adviser. The Board also concluded that the structure of the advisory fee, which includes breakpoints at several asset levels, will allow the Fund to continue to benefit from any economies of scale in the future.
Eaton Vance
Tax-Managed Global Dividend Income Fund
October 31, 2023
Liquidity Risk Management Program
The Fund has implemented a written liquidity risk management program (Program) and related procedures to manage its liquidity in accordance with Rule 22e-4 under the Investment Company Act of 1940, as amended (Liquidity Rule). The Liquidity Rule defines “liquidity risk” as the risk that a fund could not meet requests to redeem shares issued by the fund without significant dilution of the remaining investors’ interests in the fund. The Fund’s Board of Trustees/Directors has designated the investment adviser to serve as the administrator of the Program and the related procedures. The administrator has established a Liquidity Risk Management Oversight Committee (Committee) to perform the functions necessary to administer the Program. As part of the Program, the administrator is responsible for identifying illiquid investments and categorizing the relative liquidity of the Fund’s investments in accordance with the Liquidity Rule. Under the Program, the administrator assesses, manages, and periodically reviews the Fund’s liquidity risk, and is responsible for making certain reports to the Fund’s Board of Trustees/Directors and the Securities and Exchange Commission (SEC) regarding the liquidity of the Fund’s investments, and to notify the Board of Trustees/Directors and the SEC of certain liquidity events specified in the Liquidity Rule. The liquidity of the Fund’s portfolio investments is determined based on a number of factors including, but not limited to, relevant market, trading and investment-specific considerations under the Program.
At a meeting of the Fund’s Board of Trustees/Directors on June 7, 2023, the Committee provided a written report to the Fund’s Board of Trustees/
Directors pertaining to the operation, adequacy, and effectiveness of implementation of the Program, as well as the operation of the highly liquid investment minimum (if applicable) for the period January 1, 2022 through December 31, 2022 (Review Period). The Program operated effectively during the Review Period, supporting the administrator’s ability to assess, manage and monitor Fund liquidity risk, including during periods of market volatility and net redemptions. During the Review Period, the Fund met redemption requests on a timely basis.
There can be no assurance that the Program will achieve its objectives in the future. Please refer to the Fund’s prospectus for more information regarding the Fund’s exposure to liquidity risk and other principal risks to which an investment in the Fund may be subject.
Eaton Vance
Tax-Managed Global Dividend Income Fund
October 31, 2023
Management and Organization
Fund Management. The Trustees of Eaton Vance Mutual Funds Trust (the Trust) are responsible for the overall management and supervision of the Trust's affairs. The Board members and officers of the Trust are listed below. Except as indicated, each individual has held the office shown or other offices in the same company for the last five years. Board members hold indefinite terms of office. Each Trustee holds office until his or her successor is elected and qualified, subject to a prior death, resignation, retirement, disqualification or removal. Under the terms of the Fund’s current Trustee retirement policy, an Independent Trustee must retire and resign as a Trustee on the earlier of: (i) the first day of July following his or her 74th birthday; or (ii), with limited exception, December 31st of the 20th year in which he or she has served as a Trustee. However, if such retirement and resignation would cause the Fund to be out of compliance with Section 16 of the 1940 Act or any other regulations or guidance of the SEC, then such retirement and resignation will not become effective until such time as action has been taken for the Fund to be in compliance therewith. The “noninterested Trustees” consist of those Trustees who are not “interested persons” of the Trust, as that term is defined under the 1940 Act. The business address of each Board member and officer is Two International Place, Boston, Massachusetts 02110. As used below, “BMR” refers to Boston Management and Research, “EV” refers to EV LLC, “EVM” refers to Eaton Vance Management, “MSIM" refers to Morgan Stanley Investment Management Inc. and “EVD” refers to Eaton Vance Distributors, Inc. EV is the trustee of each of EVM and BMR. Each of EVM, BMR, EVD and EV are indirect, wholly owned subsidiaries of Morgan Stanley. Each officer affiliated with EVM may hold a position with other EVM affiliates that is comparable to his or her position with EVM listed below. Each Trustee oversees
127 funds in the Eaton Vance fund complex (including both funds and portfolios in a hub and spoke structure).
| Name and Year of Birth | Trust
Position(s) | Length of Service | Principal Occupation(s) and Other Directorships
During Past Five Years and Other Relevant Experience |
| Interested Trustee |
Anchal Pachnanda(1)
1980 | Trustee | Since 2023 | Co-Head of Strategy of MSIM (since 2019). Formerly, Head of Strategy of MSIM (2017-2019). Ms. Pachnanda is an interested person because of her position with MSIM, which is an affiliate of the Trust.
Other Directorships. None. |
| Noninterested Trustees |
Alan C. Bowser
1962 | Trustee | Since 2022 | Private investor. Formerly, Chief Diversity Officer, Partner and a member of the Operating Committee, and formerly served as Senior Advisor on Diversity and Inclusion for the firm’s chief executive officer, Co-Head of the Americas Region, and Senior Client Advisor of Bridgewater Associates, an asset management firm (2011- 2023).
Other Directorships. Independent Director of Stout Risius Ross (a middle market professional services advisory firm) (since 2021). |
Mark R. Fetting
1954 | Trustee | Since 2016 | Private investor. Formerly held various positions at Legg Mason, Inc. (investment management firm) (2000-2012), including President, Chief Executive Officer, Director and Chairman (2008-2012), Senior Executive Vice President (2004-2008) and Executive Vice President (2001-2004). Formerly, President of Legg Mason family of funds (2001-2008). Formerly, Division President and Senior Officer of Prudential Financial Group, Inc. and related companies (investment management firm) (1991-2000).
Other Directorships. None. |
Cynthia E. Frost
1961 | Trustee | Since 2014 | Private investor. Formerly, Chief Investment Officer of Brown University (university endowment) (2000-2012). Formerly, Portfolio Strategist for Duke Management Company (university endowment manager) (1995-2000). Formerly, Managing Director, Cambridge Associates (investment consulting company) (1989-1995). Formerly, Consultant, Bain and Company (management consulting firm) (1987-1989). Formerly, Senior Equity Analyst, BA Investment Management Company (1983-1985).
Other Directorships. None. |
George J. Gorman
1952 | Chairperson of the
Board and Trustee | Since 2021
(Chairperson) and 2014 (Trustee) | Principal at George J. Gorman LLC (consulting firm). Formerly, Senior Partner at Ernst & Young LLP (a registered public accounting firm) (1974-2009).
Other Directorships. None. |
Eaton Vance
Tax-Managed Global Dividend Income Fund
October 31, 2023
Management and Organization — continued
| Name and Year of Birth | Trust
Position(s) | Length of Service | Principal Occupation(s) and Other Directorships
During Past Five Years and Other Relevant Experience |
| Noninterested Trustees (continued) |
Valerie A. Mosley
1960 | Trustee | Since 2014 | Chairwoman and Chief Executive Officer of Valmo Ventures (a consulting and investment firm). Founder of Upward Wealth, Inc., dba BrightUp, a fintech platform. Formerly, Partner and Senior Vice President, Portfolio Manager and Investment Strategist at Wellington Management Company, LLP (investment management firm) (1992-2012). Formerly, Chief Investment Officer, PG Corbin Asset Management (1990-1992). Formerly worked in institutional corporate bond sales at Kidder Peabody (1986-1990).
Other Directorships. Director of DraftKings, Inc. (digital sports entertainment and gaming company) (since September 2020). Director of Envestnet, Inc. (provider of intelligent systems for wealth management and financial wellness) (since 2018). Formerly, Director of Dynex Capital, Inc. (mortgage REIT) (2013-2020) and Director of Groupon, Inc. (e-commerce provider) (2020-2022). |
Keith Quinton
1958 | Trustee | Since 2018 | Private investor, researcher and lecturer. Formerly, Independent Investment Committee Member at New Hampshire Retirement System (2017-2021). Formerly, Portfolio Manager and Senior Quantitative Analyst at Fidelity Investments (investment management firm) (2001-2014).
Other Directorships. Formerly, Director (2016-2021) and Chairman (2019-2021) of New Hampshire Municipal Bond Bank. |
Marcus L. Smith
1966 | Trustee | Since 2018 | Private investor and independent corporate director. Formerly, Chief Investment Officer, Canada (2012-2017), Chief Investment Officer, Asia (2010-2012), Director of Asian Research (2004-2010) and portfolio manager (2001-2017) at MFS Investment Management (investment management firm).
Other Directorships. Director of First Industrial Realty Trust, Inc. (an industrial REIT) (since 2021). Director of MSCI Inc. (global provider of investment decision support tools) (since 2017). Formerly, Director of DCT Industrial Trust Inc. (logistics real estate company) (2017-2018). |
Susan J. Sutherland
1957 | Trustee | Since 2015 | Private investor. Director of Ascot Group Limited and certain of its subsidiaries (insurance and reinsurance) (since 2017). Formerly, Director of Hagerty Holding Corp. (insurance) (2015-2018) and Montpelier Re Holdings Ltd. (insurance and reinsurance) (2013-2015). Formerly, Associate, Counsel and Partner at Skadden, Arps, Slate, Meagher & Flom LLP (law firm) (1982-2013).
Other Directorships. Formerly, Director of Kairos Acquisition Corp. (insurance/InsurTech acquisition company) (2021-2023). |
Scott E. Wennerholm
1959 | Trustee | Since 2016 | Private investor. Formerly, Trustee at Wheelock College (postsecondary institution) (2012-2018). Formerly, Consultant at GF Parish Group (executive recruiting firm) (2016-2017). Formerly, Chief Operating Officer and Executive Vice President at BNY Mellon Asset Management (investment management firm) (2005-2011). Formerly, Chief Operating Officer and Chief Financial Officer at Natixis Global Asset Management (investment management firm) (1997-2004). Formerly, Vice President at Fidelity Investments Institutional Services (investment management firm) (1994-1997).
Other Directorships. None. |
Nancy A. Wiser
1967 | Trustee | Since 2022 | Formerly, Executive Vice President and the Global Head of Operations at Wells Fargo Asset Management (2011-2021).
Other Directorships. None. |
| Name and Year of Birth | Trust
Position(s) | Length of Service | Principal Occupation(s)
During Past Five Years |
| Principal Officers who are not Trustees |
Kenneth A. Topping
1966 | President | Since 2023 | Vice President and Chief Administrative Officer of EVM and BMR and Chief Operating Officer for Public Markets at MSIM. Also Vice President of Calvert Research and Management (“CRM”) since 2021. Formerly, Chief Operating Officer for Goldman Sachs Asset Management ‘Classic’ (2009-2020). |
Deidre E. Walsh
1971 | Vice President and Chief
Legal Officer | Since 2009 | Vice President of EVM and BMR. Also Vice President of CRM. |
James F. Kirchner
1967 | Treasurer | Since 2007 | Vice President of EVM and BMR. Also Vice President of CRM. |
Eaton Vance
Tax-Managed Global Dividend Income Fund
October 31, 2023
Management and Organization — continued
| Name and Year of Birth | Trust
Position(s) | Length of Service | Principal Occupation(s)
During Past Five Years |
| Principal Officers who are not Trustees (continued) |
Nicholas S. Di Lorenzo
1987 | Secretary | Since 2022 | Formerly, associate (2012-2021) and counsel (2022) at Dechert LLP. |
Richard F. Froio
1968 | Chief Compliance
Officer | Since 2017 | Vice President of EVM and BMR since 2017. Formerly, Deputy Chief Compliance Officer (Adviser/Funds) and Chief Compliance Officer (Distribution) at PIMCO (2012-2017) and Managing Director at BlackRock/Barclays Global Investors (2009-2012). |
(1) Ms. Pachnanda began serving as Trustee effective April 1, 2023.
The SAI for the Fund includes additional information about the Trustees and officers of the Fund and can be obtained without charge on Eaton Vance’s website at www.eatonvance.com or by calling 1-800-262-1122.
| FACTS | WHAT DOES EATON VANCE DO WITH YOUR
PERSONAL INFORMATION? |
| Why? | Financial companies choose how they share your personal information. Federal law gives consumers the right to limit some but not all sharing. Federal law also requires us to tell you how we collect, share, and protect your personal information. Please read this notice carefully to understand what we do. |
| |
| What? | The types of personal information we collect and share depend on the product or service you have with us. This information can include:■ Social Security number and income
■ investment experience and risk tolerance
■ checking account number and wire transfer instructions |
| |
| How? | All financial companies need to share customers’ personal information to run their everyday business. In the section below, we list the reasons financial companies can share their customers’ personal information; the reasons Eaton Vance chooses to share; and whether you can limit this sharing. |
Reasons we can share your
personal information | Does Eaton Vance
share? | Can you limit
this sharing? |
| For our everyday business purposes — such as to process your transactions, maintain your account(s), respond to court orders and legal investigations, or report to credit bureaus | Yes | No |
| For our marketing purposes — to offer our products and services to you | Yes | No |
| For joint marketing with other financial companies | No | We don’t share |
| For our investment management affiliates’ everyday business purposes — information about your transactions, experiences, and creditworthiness | Yes | Yes |
| For our affiliates’ everyday business purposes — information about your transactions and experiences | Yes | No |
| For our affiliates’ everyday business purposes — information about your creditworthiness | No | We don’t share |
| For our investment management affiliates to market to you | Yes | Yes |
| For our affiliates to market to you | No | We don’t share |
| For nonaffiliates to market to you | No | We don’t share |
To limit our
sharing | Call toll-free 1-800-262-1122 or email: EVPrivacy@eatonvance.comPlease note:If you are a new customer, we can begin sharing your information 30 days from the date we sent this notice. When you are no longer our customer, we continue to share your information as described in this notice. However, you can contact us at any time to limit our sharing. |
| Questions? | Call toll-free 1-800-262-1122 or email: EVPrivacy@eatonvance.com |
| Privacy Notice — continued | April 2021 |
| Who we are |
| Who is providing this notice? | Eaton Vance Management, Eaton Vance Distributors, Inc., Eaton Vance Trust Company, Eaton Vance Management (International) Limited, Eaton Vance Advisers International Ltd., Eaton Vance Global Advisors Limited, Eaton Vance Management’s Real Estate Investment Group, Boston Management and Research, Calvert Research and Management, Eaton Vance and Calvert Fund Families and our investment advisory affiliates (“Eaton Vance”) (see Investment Management Affiliates definition below) |
| What we do |
How does Eaton Vance
protect my personal
information? | To protect your personal information from unauthorized access and use, we use security measures that comply with federal law. These measures include computer safeguards and secured files and buildings. We have policies governing the proper handling of customer information by personnel and requiring third parties that provide support to adhere to appropriate security standards with respect to such information. |
How does Eaton Vance
collect my personal
information? | We collect your personal information, for example, when you■ open an account or make deposits or withdrawals from your account
■ buy securities from us or make a wire transfer
■ give us your contact informationWe also collect your personal information from others, such as credit bureaus, affiliates, or other companies. |
| Why can’t I limit all sharing? | Federal law gives you the right to limit only■ sharing for affiliates’ everyday business purposes — information about your creditworthiness
■ affiliates from using your information to market to you
■ sharing for nonaffiliates to market to youState laws and individual companies may give you additional rights to limit sharing. See below for more on your rights under state law. |
| Definitions |
Investment Management
Affiliates | Eaton Vance Investment Management Affiliates include registered investment advisers, registered broker- dealers, and registered and unregistered funds. Investment Management Affiliates does not include entities associated with Morgan Stanley Wealth Management, such as Morgan Stanley Smith Barney LLC and Morgan Stanley & Co. |
| Affiliates | Companies related by common ownership or control. They can be financial and nonfinancial companies.■ Our affiliates include companies with a Morgan Stanley name and financial companies such as Morgan Stanley Smith Barney LLC and Morgan Stanley & Co. |
| Nonaffiliates | Companies not related by common ownership or control. They can be financial and nonfinancial companies.■ Eaton Vance does not share with nonaffiliates so they can market to you. |
| Joint marketing | A formal agreement between nonaffiliated financial companies that together market financial products or services to you.■ Eaton Vance doesn’t jointly market. |
| Other important information |
| Vermont: Except as permitted by law, we will not share personal information we collect about Vermont residents with Nonaffiliates unless you provide us with your written consent to share such information.California: Except as permitted by law, we will not share personal information we collect about California residents with Nonaffiliates and we will limit sharing such personal information with our Affiliates to comply with California privacy laws that apply to us. |
Delivery of Shareholder Documents. The Securities and Exchange Commission (SEC) permits funds to deliver only one copy of shareholder documents, including prospectuses, proxy statements and shareholder reports, to fund investors with multiple accounts at the same residential or post office box address. This practice is often called “householding” and it helps eliminate duplicate mailings to shareholders. Eaton Vance, or your financial intermediary, may household the mailing of your documents indefinitely unless you instruct Eaton Vance, or your financial intermediary, otherwise. If you would prefer that your Eaton Vance documents not be householded, please contact Eaton Vance at 1-800-262-1122, or contact your financial intermediary. Your instructions that householding not apply to delivery of your Eaton Vance documents will typically be effective within 30 days of receipt by Eaton Vance or your financial intermediary.
Portfolio Holdings. Each Eaton Vance Fund and its underlying Portfolio(s) (if applicable) files a schedule of portfolio holdings on Part F to Form N-PORT with the SEC. Certain information filed on Form N-PORT may be viewed on the Eaton Vance website at www.eatonvance.com, by calling Eaton Vance at 1-800-262-1122 or in the EDGAR database on the SEC’s website at www.sec.gov.
Proxy Voting. From time to time, funds are required to vote proxies related to the securities held by the funds. The Eaton Vance Funds or their underlying Portfolios (if applicable) vote proxies according to a set of policies and procedures approved by the Funds’ and Portfolios’ Boards. You may obtain a description of these policies and procedures and information on how the Funds or Portfolios voted proxies relating to portfolio securities during the most recent 12-month period ended June 30, without charge, upon request, by calling 1-800-262-1122 and by accessing the SEC’s website at www.sec.gov.
Tailored Shareholder Reports. Effective January 24, 2023, the SEC adopted rule and form amendments to require open-end mutual funds and ETFs to transmit concise and visually engaging streamlined annual and semiannual reports to shareholders that highlight key information. Other information, including financial statements, will no longer appear in a streamlined shareholder report but must be available online, delivered free of charge upon request, and filed on a semiannual basis on Form N-CSR. The rule and form amendments have a compliance date of July 24, 2024. At this time, management is evaluating the impact of these amendments on the shareholder reports for the Eaton Vance Funds.
This Page Intentionally Left Blank
This Page Intentionally Left Blank
This Page Intentionally Left Blank
Investment Adviser and Administrator
Eaton Vance Management
Two International Place
Boston, MA 02110
Investment Sub-Adviser
Eaton Vance Advisers International Ltd.
125 Old Broad Street
London, EC2N 1AR
United Kingdom
Principal Underwriter*
Eaton Vance Distributors, Inc.
Two International Place
Boston, MA 02110
(617) 482-8260
Custodian
State Street Bank and Trust Company
One Congress Street, Suite 1
Boston, MA 02114-2016
Transfer Agent
BNY Mellon Investment Servicing (US) Inc.
Attn: Eaton Vance Funds
P.O. Box 534439
Pittsburgh, PA 15253-4439
(800) 262-1122
Independent Registered Public Accounting Firm
Deloitte & Touche LLP
200 Berkeley Street
Boston, MA 02116-5022
Fund Offices
Two International Place
Boston, MA 02110
* FINRA BrokerCheck. Investors may check the background of their Investment Professional by contacting the Financial Industry Regulatory Authority (FINRA). FINRA BrokerCheck is a free tool to help investors check the professional background of current and former FINRA-registered securities firms and brokers. FINRA BrokerCheck is available by calling 1-800-289-9999 and at www.FINRA.org. The FINRA BrokerCheck brochure describing this program is available to investors at www.FINRA.org.
Parametric
Tax-Managed International Equity Fund
Annual Report
October 31, 2023
Commodity Futures Trading Commission Registration. The Commodity Futures Trading Commission (“CFTC”) has adopted regulations that subject registered investment companies and advisers to regulation by the CFTC if a fund invests more than a prescribed level of its assets in certain CFTC-regulated instruments (including futures, certain options and swap agreements) or markets itself as providing investment exposure to such instruments. The investment adviser has claimed an exclusion from the definition of “commodity pool operator” under the Commodity Exchange Act with respect to its management of the Fund. Accordingly, neither the Fund nor the adviser with respect to the operation of the Fund is subject to CFTC regulation. Because of its management of other strategies, the Fund's adviser and Parametric Portfolio Associates LLC (Parametric), sub-adviser to the Fund, are registered with the CFTC as commodity pool operators. The adviser and Parametric are also registered as commodity trading advisors.
Fund shares are not insured by the FDIC and are not deposits or other obligations of, or guaranteed by, any depository institution. Shares are subject to investment risks, including possible loss of principal invested.
This report must be preceded or accompanied by a current summary prospectus or prospectus. Before investing, investors should consider carefully the investment objective, risks, and charges and expenses of a mutual fund. This and other important information is contained in the summary prospectus and prospectus, which can be obtained from a financial intermediary. Prospective investors should read the prospectus carefully before investing. For further information, please call 1-800-260-0761.
Annual Report October 31, 2023
Parametric
Tax-Managed International Equity Fund
Parametric
Tax-Managed International Equity Fund
October 31, 2023
Management’s Discussion of Fund Performance†
Economic and Market Conditions
For global equity investors, the 12-month period ended October 31, 2023, was a roller-coaster ride, driven largely by shifting perceptions of whether the U.S. Federal Reserve (the Fed) could bring the world’s largest economy in for a soft landing, and changing expectations of how long interest rates might remain high.
During the opening month of the period, stocks rallied on strong corporate earnings, attractive valuations, and hope the Fed might slow the pace of its interest rate hikes. But in December 2022, equities lost ground as “higher for longer” interest rate fears returned. A continuing irony throughout the period was that good economic news -- record low unemployment, strong job creation, and robust consumer spending -- was viewed as bad news for inflation and fuel for future rate hikes that could weigh on stock prices.
In January 2023, however, global equities began a rally that lasted through July. The initial tailwind was ChatGPT, an artificial intelligence (AI) application that led investors to perceive AI might become the next big innovation to drive the information technology (IT) sector. As a result, IT -- one of the worst-performing sectors in 2022 -- became the standout sector of the first half of 2023.
Earlier recession fears that had weighed on stock prices receded as many investors came around to the view that the U.S. and global economies were doing surprisingly well. European equities received an additional boost as feared continent-wide energy shortages failed to materialize during the winter.
But in the final three months of the period, the bond market halted the stock market’s momentum. As it became clear the Fed would keep rates higher for longer than investors had anticipated just a few months earlier, longer-term bond interest rates rose sharply. Given the potential for relatively attractive returns with lower risk than stocks, many investors shifted from equity assets to bonds. In the final two days of the period, however, signs of a stock rally emerged as investors began to believe the Fed might have reached the end of its monetary tightening cycle.
For the period as a whole, global equity performance was strong. The MSCI ACWI Index, a broad measure of global equities, returned 10.50%; the MSCI EAFE Index of developed-market international equities returned 14.40%; and the S&P 500® Index, a broad measure of U.S. stocks, returned 10.14%.
Meanwhile, in the world’s second-largest economy, the MSCI Golden Dragon Index, a measure of Chinese large-cap and mid-cap stocks, returned 21.11%. The strong 12-month performance, however, masked the significant decline in Chinese stock prices since early 2023, as Chinese equities were dogged by an ailing real estate sector -- the major investment area for millions of Chinese citizens -- and a failure of many Chinese industries to bounce back after onerous COVID restrictions were lifted.
Fund Performance
For the 12-month period ended October 31, 2023, Parametric Tax-Managed International Equity Fund (the Fund) returned 12.54% for Class A shares at net asset value (NAV), underperforming its benchmark, the MSCI EAFE Index (the Index), which returned 14.40%.
The Fund’s emphasis on diversification at the country level -- via a system of targeting country weights and systematically rebalancing them as they change -- detracted from performance relative to the Index during the period. Based on country diversification targets, the Fund held underweight exposures to larger countries and overweight exposures to smaller countries.
The Fund’s emphasis on diversification at the sector level within each country also detracted from Index-relative returns.
The Fund’s emphasis on security-level diversification -- via a system of broad security representation with an emphasis on reducing portfolio risk -- did not impact performance relative to the Index during the period.
Factors detracting from the Fund’s performance relative to the Index included an overweight exposure to Israel, which fell in value amid the escalating conflict within the region. In addition, the Fund’s stock selections in Australia detracted from relative performance versus the Index. This relative loss was largely a result of emphasizing medium- and small-size companies within the information technology sector, which underperformed the Index during the period.
The Fund’s sector diversification in Denmark resulted in an overweight exposure to utilities, which harmed the Fund’s Index-relative performance during the period.
In contrast, factors contributing to Fund performance relative to the Index included sector allocations in Switzerland. This relative gain was partially due to an underweight exposure to the health care sector, which experienced a single-digit loss during the period.
In Portugal, the Fund’s active sector weighting also improved Index-relative performance, primarily the result of an overweight exposure to financials, which gained over 100% during the period.
See Endnotes and Additional Disclosures in this report.
Past performance is no guarantee of future results. Returns are historical and are calculated by determining the percentage change in net asset value (NAV) or offering price (as applicable) with all distributions reinvested. Furthermore, returns do not reflect the deduction of taxes that shareholders may have to pay on Fund distributions or upon the redemption of Fund shares. Investment return and principal value will fluctuate so that shares, when redeemed, may be worth more or less than their original cost. Performance for periods less than or equal to one year is cumulative. Performance is for the stated time period only; due to market volatility, current Fund performance may be lower or higher than the quoted return. For performance as of the most recent month-end, please refer to eatonvance.com.
Parametric
Tax-Managed International Equity Fund
October 31, 2023
Management’s Discussion of Fund Performance† — continued
Additionally, the Fund’s underweight position in the U.K. benefited returns versus the Index during the period. Although U.K. stock prices advanced during the period, they failed to keep pace with the broader international equity market rally due to lackluster performance in the consumer staples sector.
See Endnotes and Additional Disclosures in this report.
Past performance is no guarantee of future results. Returns are historical and are calculated by determining the percentage change in net asset value (NAV) or offering price (as applicable) with all distributions reinvested. Furthermore, returns do not reflect the deduction of taxes that shareholders may have to pay on Fund distributions or upon the redemption of Fund shares. Investment return and principal value will fluctuate so that shares, when redeemed, may be worth more or less than their original cost. Performance for periods less than or equal to one year is cumulative. Performance is for the stated time period only; due to market volatility, current Fund performance may be lower or higher than the quoted return. For performance as of the most recent month-end, please refer to eatonvance.com.
Parametric
Tax-Managed International Equity Fund
October 31, 2023
Performance
Portfolio Manager(s) Thomas C. Seto, Paul W. Bouchey, CFA and Jennifer Sireklove, CFA, each of Parametric Portfolio Associates LLC
| % Average Annual Total Returns1,2 | Class
Inception Date | Performance
Inception Date | One Year | Five Years | Ten Years |
| Class A at NAV | 04/22/1998 | 04/22/1998 | 12.54% | 2.90% | 2.87% |
| Class A with 5.25% Maximum Sales Charge | — | — | 6.61 | 1.81 | 2.32 |
| Class C at NAV | 04/22/1998 | 04/22/1998 | 11.71 | 2.14 | 2.27 |
| Class C with 1% Maximum Deferred Sales Charge | — | — | 10.71 | 2.14 | 2.27 |
| Class I at NAV | 09/02/2008 | 04/22/1998 | 12.87 | 3.18 | 3.14 |
|
| MSCI EAFE Index | — | — | 14.40% | 4.10% | 3.05% |
| % After-Tax Returns with Maximum Sales Charge2 | Class
Inception Date | Performance
Inception Date | One Year | Five Years | Ten Years |
| Class A After Taxes on Distributions | 04/22/1998 | 04/22/1998 | 12.51% | 2.85% | 2.72% |
| Class A After Taxes on Distributions and Sale of Fund Shares | — | — | 8.18 | 2.62 | 2.53 |
| Class C After Taxes on Distributions | 04/22/1998 | 04/22/1998 | 11.87 | 2.29 | 2.22 |
| Class C After Taxes on Distributions and Sale of Fund Shares | — | — | 7.52 | 2.02 | 2.02 |
| Class I After Taxes on Distributions | 09/02/2008 | 04/22/1998 | 12.78 | 3.07 | 2.95 |
| Class I After Taxes on Distributions and Sale of Fund Shares | — | — | 8.44 | 2.85 | 2.76 |
| % Total Annual Operating Expense Ratios3 | Class A | Class C | Class I |
| Gross | 1.46% | 2.21% | 1.21% |
| Net | 1.05 | 1.80 | 0.80 |
Growth of $10,000
This graph shows the change in value of a hypothetical investment of $10,000 in Class A of the Fund for the period indicated. For comparison, the same investment is shown in the indicated index.
| Growth of Investment | Amount Invested | Period Beginning | At NAV | With Maximum Sales Charge |
| Class C | $10,000 | 10/31/2013 | $12,513 | N.A. |
| Class I, at minimum investment | $1,000,000 | 10/31/2013 | $1,361,985 | N.A. |
See Endnotes and Additional Disclosures in this report.
Past performance is no guarantee of future results. Returns are historical and are calculated by determining the percentage change in net asset value (NAV) or offering price (as applicable) with all distributions reinvested. Furthermore, returns do not reflect the deduction of taxes that shareholders may have to pay on Fund distributions or upon the redemption of Fund shares. Investment return and principal value will fluctuate so that shares, when redeemed, may be worth more or less than their original cost. Performance for periods less than or equal to one year is cumulative. Performance is for the stated time period only; due to market volatility, current Fund performance may be lower or higher than the quoted return. For performance as of the most recent month-end, please refer to eatonvance.com.
Parametric
Tax-Managed International Equity Fund
October 31, 2023
| Sector Allocation (% of net assets)1 |
| Geographic Allocation (% of common stocks) |
| Top 10 Holdings (% of net assets)1 |
| Nestle S.A. | 1.2% |
| Novo Nordisk A/S, Class B | 1.2 |
| Cie Financiere Richemont S.A., Class A | 1.1 |
| E.ON SE | 0.9 |
| Air Liquide S.A. | 0.9 |
| Deutsche Telekom AG | 0.8 |
| SAP SE | 0.8 |
| TotalEnergies SE | 0.8 |
| AstraZeneca PLC | 0.8 |
| CSL, Ltd. | 0.8 |
| Total | 9.3% |
Fund invests in an affiliated investment company (Portfolio) with the same objective(s) and policies as the Fund. References to investments are to the Portfolio’s holdings.
Footnotes:
| 1 | Excludes cash and cash equivalents. |
Parametric
Tax-Managed International Equity Fund
October 31, 2023
Endnotes and Additional Disclosures
| † | The views expressed in this report are those of the portfolio manager(s) and are current only through the date stated at the top of this page. These views are subject to change at any time based upon market or other conditions, and Eaton Vance and the Fund(s) disclaim any responsibility to update such views. These views may not be relied upon as investment advice and, because investment decisions are based on many factors, may not be relied upon as an indication of trading intent on behalf of any Eaton Vance fund. This commentary may contain statements that are not historical facts, referred to as “forward-looking statements.” The Fund’s actual future results may differ significantly from those stated in any forward-looking statement, depending on factors such as changes in securities or financial markets or general economic conditions, the volume of sales and purchases of Fund shares, the continuation of investment advisory, administrative and service contracts, and other risks discussed from time to time in the Fund’s filings with the Securities and Exchange Commission. |
| | |
| 1 | MSCI EAFE Index is an unmanaged index of equities in the developed markets, excluding the U.S. and Canada. MSCI indexes are net of foreign withholding taxes. Source: MSCI. MSCI data may not be reproduced or used for any other purpose. MSCI provides no warranties, has not prepared or approved this report, and has no liability hereunder. Unless otherwise stated, index returns do not reflect the effect of any applicable sales charges, commissions, expenses, taxes or leverage, as applicable. It is not possible to invest directly in an index. |
| 2 | Total Returns at NAV do not include applicable sales charges. If sales charges were deducted, the returns would be lower. Total Returns shown with maximum sales charge reflect the stated maximum sales charge. Unless otherwise stated, performance does not reflect the deduction of taxes on Fund distributions or redemptions of Fund shares. After-tax returns are calculated using certain assumptions, including using the highest historical individual federal income tax rates, and do not reflect the impact of state/local taxes. Actual after-tax returns depend on a shareholder’s tax situation and the actual characterization of distributions and may differ from those shown. After-tax returns are not relevant to shareholders who hold shares in tax-deferred accounts or shares held by nontaxable entities. Return After Taxes on Distributions may be the same as Return Before Taxes for the same period because no taxable distributions were made during that period. Return After Taxes on Distributions and Sale of Fund Shares may be greater than or equal to Return After Taxes on Distributions for the same period because of losses realized on the sale of Fund shares. The Fund’s after-tax returns also may reflect foreign tax credits passed by the Fund to its shareholders.Effective November 5, 2020, Class C shares automatically convert to Class A shares eight years after purchase. The average annual total returns listed for Class C reflect conversion to Class A shares after eight years. Prior to November 5, 2020, Class C shares automatically converted to Class A shares ten years after purchase. |
| 3 | Source: Fund prospectus. Net expense ratios reflect a contractual expense reimbursement that continues through 2/29/24. The expense ratios for the current reporting period can be found in the Financial |
| | Highlights section of this report. Performance reflects expenses waived and/or reimbursed, if applicable. Without such waivers and/or reimbursements, performance would have been lower. |
| | Fund profile subject to change due to active management. |
| | Additional Information |
| | S&P 500® Index is an unmanaged index of large-cap stocks commonly used as a measure of U.S. stock market performance. S&P Dow Jones Indices are a product of S&P Dow Jones Indices LLC (“S&P DJI”) and have been licensed for use. S&P® and S&P 500® are registered trademarks of S&P DJI; Dow Jones® is a registered trademark of Dow Jones Trademark Holdings LLC (“Dow Jones”); S&P DJI, Dow Jones and their respective affiliates do not sponsor, endorse, sell or promote the Fund, will not have any liability with respect thereto and do not have any liability for any errors, omissions, or interruptions of the S&P Dow Jones Indices. MSCI Golden Dragon Index is an unmanaged index of common stocks traded in China, Hong Kong and Taiwan. MSCI ACWI Index is an unmanaged free-float-adjusted, market-capitalization-weighted index designed to measure the equity market performance of developed and emerging markets. MSCI EAFE Index is an unmanaged index of equities in the developed markets, excluding the U.S. and Canada. |
Parametric
Tax-Managed International Equity Fund
October 31, 2023
Example
As a Fund shareholder, you incur two types of costs: (1) transaction costs, including sales charges (loads) on purchases; and (2) ongoing costs, including management fees; distribution and/or service fees; and other Fund expenses. This Example is intended to help you understand your ongoing costs (in dollars) of Fund investing and to compare these costs with the ongoing costs of investing in other mutual funds. The Example is based on an investment of $1,000 invested at the beginning of the period and held for the entire period (May 1, 2023 to October 31, 2023).
Actual Expenses
The first section of the table below provides information about actual account values and actual expenses. You may use the information in this section, together with the amount you invested, to estimate the expenses that you paid over the period. Simply divide your account value by $1,000 (for example, an $8,600 account value divided by $1,000 = 8.6), then multiply the result by the number in the first section under the heading entitled “Expenses Paid During Period” to estimate the expenses you paid on your account during this period.
Hypothetical Example for Comparison Purposes
The second section of the table below provides information about hypothetical account values and hypothetical expenses based on the actual Fund expense ratio and an assumed rate of return of 5% per year (before expenses), which is not the actual Fund return. The hypothetical account values and expenses may not be used to estimate the actual ending account balance or expenses you paid for the period. You may use this information to compare the ongoing costs of investing in your Fund and other funds. To do so, compare this 5% hypothetical example with the 5% hypothetical examples that appear in the shareholder reports of the other funds.
Please note that the expenses shown in the table are meant to highlight your ongoing costs only and do not reflect any transactional costs, such as sales charges (loads). Therefore, the second section of the table is useful in comparing ongoing costs only, and will not help you determine the relative total costs of owning different funds. In addition, if these transactional costs were included, your costs would be higher.
| | Beginning
Account Value
(5/1/23) | Ending
Account Value
(10/31/23) | Expenses Paid
During Period*
(5/1/23 – 10/31/23) | Annualized
Expense
Ratio |
| Actual | | | | |
| Class A | $1,000.00 | $ 910.20 | $5.06** | 1.05% |
| Class C | $1,000.00 | $ 906.60 | $8.65** | 1.80% |
| Class I | $1,000.00 | $ 911.60 | $3.85** | 0.80% |
| |
| Hypothetical | | | | |
| (5% return per year before expenses) | | | | |
| Class A | $1,000.00 | $1,019.91 | $5.35** | 1.05% |
| Class C | $1,000.00 | $1,016.13 | $9.15** | 1.80% |
| Class I | $1,000.00 | $1,021.17 | $4.08** | 0.80% |
| * | Expenses are equal to the Fund's annualized expense ratio for the indicated Class, multiplied by the average account value over the period, multiplied by 184/365 (to reflect the one-half year period). The Example assumes that the $1,000 was invested at the net asset value per share determined at the close of business on April 30, 2023. The Example reflects the expenses of both the Fund and the Portfolio. |
| ** | Absent an allocation of certain expenses to affiliate(s), expenses would be higher. |
Parametric
Tax-Managed International Equity Fund
October 31, 2023
Statement of Assets and Liabilities
| | October 31, 2023 |
| Assets | |
| Investment in Tax-Managed International Equity Portfolio, at value (identified cost $33,896,269) | $ 33,973,853 |
| Receivable for Fund shares sold | 12,073 |
| Receivable from affiliates | 10,814 |
| Total assets | $33,996,740 |
| Liabilities | |
| Payable for Fund shares redeemed | $ 17,704 |
| Payable to affiliates: | |
| Distribution and service fees | 3,631 |
| Trustees' fees | 43 |
| Accrued expenses | 54,108 |
| Total liabilities | $ 75,486 |
| Net Assets | $33,921,254 |
| Sources of Net Assets | |
| Paid-in capital | $ 34,743,077 |
| Accumulated loss | (821,823) |
| Net Assets | $33,921,254 |
| Class A Shares | |
| Net Assets | $ 16,226,288 |
| Shares Outstanding | 1,481,609 |
Net Asset Value and Redemption Price Per Share
(net assets ÷ shares of beneficial interest outstanding) | $ 10.95 |
Maximum Offering Price Per Share
(100 ÷ 94.75 of net asset value per share) | $ 11.56 |
| Class C Shares | |
| Net Assets | $ 142,847 |
| Shares Outstanding | 13,749 |
Net Asset Value and Offering Price Per Share*
(net assets ÷ shares of beneficial interest outstanding) | $ 10.39 |
| Class I Shares | |
| Net Assets | $ 17,552,119 |
| Shares Outstanding | 1,606,118 |
Net Asset Value, Offering Price and Redemption Price Per Share
(net assets ÷ shares of beneficial interest outstanding) | $ 10.93 |
| On sales of $50,000 or more, the offering price of Class A shares is reduced. |
| * | Redemption price per share is equal to the net asset value less any applicable contingent deferred sales charge. |
8
See Notes to Financial Statements.
Parametric
Tax-Managed International Equity Fund
October 31, 2023
| | Year Ended |
| | October 31, 2023 |
| Investment Income | |
| Dividend income allocated from Portfolio (net of foreign taxes withheld of $175,886) | $ 1,228,699 |
| Securities lending income allocated from Portfolio, net | 30,746 |
| Expenses allocated from Portfolio | (261,382) |
| Total investment income from Portfolio | $ 998,063 |
| Expenses | |
| Distribution and service fees: | |
| Class A | $ 43,975 |
| Class C | 1,992 |
| Trustees’ fees and expenses | 500 |
| Custodian fee | 17,993 |
| Transfer and dividend disbursing agent fees | 61,211 |
| Legal and accounting services | 16,613 |
| Printing and postage | 12,524 |
| Registration fees | 48,268 |
| Miscellaneous | 10,492 |
| Total expenses | $ 213,568 |
| Deduct: | |
| Waiver and/or reimbursement of expenses by affiliates | $ 134,909 |
| Total expense reductions | $ 134,909 |
| Net expenses | $ 78,659 |
| Net investment income | $ 919,404 |
| Realized and Unrealized Gain (Loss) from Portfolio | |
| Net realized gain (loss): | |
| Investment transactions (net of foreign capital gains taxes of $58) | $ 84,135 |
| Foreign currency transactions | 3,455 |
| Net realized gain | $ 87,590 |
| Change in unrealized appreciation (depreciation): | |
| Investments | $ 3,175,765 |
| Foreign currency | 7,310 |
| Net change in unrealized appreciation (depreciation) | $3,183,075 |
| Net realized and unrealized gain | $3,270,665 |
| Net increase in net assets from operations | $4,190,069 |
9
See Notes to Financial Statements.
Parametric
Tax-Managed International Equity Fund
October 31, 2023
Statements of Changes in Net Assets
| | Year Ended October 31, |
| | 2023 | 2022 |
| Increase (Decrease) in Net Assets | | |
| From operations: | | |
| Net investment income | $ 919,404 | $ 778,148 |
| Net realized gain (loss) | 87,590 | (681,874) |
| Net change in unrealized appreciation (depreciation) | 3,183,075 | (10,804,696) |
| Net increase (decrease) in net assets from operations | $ 4,190,069 | $(10,708,422) |
| Distributions to shareholders: | | |
| Class A | $ (296,735) | $ (449,871) |
| Class C | (2,201) | (4,143) |
| Class I | (362,220) | (383,363) |
| Total distributions to shareholders | $ (661,156) | $ (837,377) |
| Transactions in shares of beneficial interest: | | |
| Class A | $ (1,115,426) | $ (671,576) |
| Class C | (92,237) | (121,046) |
| Class I | (1,799,797) | 6,720,798 |
| Net increase (decrease) in net assets from Fund share transactions | $ (3,007,460) | $ 5,928,176 |
| Net increase (decrease) in net assets | $ 521,453 | $ (5,617,623) |
| Net Assets | | |
| At beginning of year | $ 33,399,801 | $ 39,017,424 |
| At end of year | $33,921,254 | $ 33,399,801 |
10
See Notes to Financial Statements.
Parametric
Tax-Managed International Equity Fund
October 31, 2023
| | Class A |
| | Year Ended October 31, |
| | 2023 | 2022 | 2021 | 2020 | 2019 |
| Net asset value — Beginning of year | $ 9.900 | $13.550 | $ 10.480 | $ 11.330 | $ 10.370 |
| Income (Loss) From Operations | | | | | |
| Net investment income(1) | $ 0.277 | $ 0.230 | $ 0.250 | $ 0.147 | $ 0.242 |
| Net realized and unrealized gain (loss) | 0.964 | (3.606) | 2.955 | (0.738) | 0.887 |
| Total income (loss) from operations | $ 1.241 | $ (3.376) | $ 3.205 | $ (0.591) | $ 1.129 |
| Less Distributions | | | | | |
| From net investment income | $ (0.191) | $ (0.274) | $ (0.135) | $ (0.259) | $ (0.169) |
| Total distributions | $ (0.191) | $ (0.274) | $ (0.135) | $ (0.259) | $ (0.169) |
| Net asset value — End of year | $10.950 | $ 9.900 | $13.550 | $10.480 | $11.330 |
| Total Return(2)(3) | 12.54% | (25.40)% | 30.73% | (5.41)% | 11.16% |
| Ratios/Supplemental Data | | | | | |
| Net assets, end of year (000’s omitted) | $ 16,226 | $15,637 | $ 22,264 | $ 18,165 | $ 21,757 |
| Ratios (as a percentage of average daily net assets):(4) | | | | | |
| Expenses (3) | 1.05% (5) | 1.05% (5) | 1.05% | 1.05% | 1.05% |
| Net investment income | 2.41% | 1.97% | 1.93% | 1.37% | 2.26% |
| Portfolio Turnover of the Portfolio | 36% | 22% | 23% | 10% | 37% |
| (1) | Computed using average shares outstanding. |
| (2) | Returns are historical and are calculated by determining the percentage change in net asset value with all distributions reinvested and do not reflect the effect of sales charges. |
| (3) | The administrator of the Fund and sub-adviser of the Portfolio reimbursed certain operating expenses (equal to 0.37%, 0.41%, 0.34%, 0.45% and 0.51% of average daily net assets for the years ended October 31, 2023, 2022, 2021, 2020 and 2019, respectively). Absent this reimbursement, total return would be lower. |
| (4) | Includes the Fund’s share of the Portfolio's allocated expenses. |
| (5) | Includes a reduction by the investment adviser of a portion of the Portfolio’s adviser fee due to the Portfolio’s investment in the Liquidity Fund (equal to less than 0.005% of average daily net assets for the years ended October 31, 2023 and 2022). |
11
See Notes to Financial Statements.
Parametric
Tax-Managed International Equity Fund
October 31, 2023
Financial Highlights — continued
| | Class C |
| | Year Ended October 31, |
| | 2023 | 2022 | 2021 | 2020 | 2019 |
| Net asset value — Beginning of year | $ 9.390 | $12.840 | $ 9.900 | $10.690 | $ 9.770 |
| Income (Loss) From Operations | | | | | |
| Net investment income(1) | $ 0.169 | $ 0.133 | $ 0.133 | $ 0.062 | $ 0.119 |
| Net realized and unrealized gain (loss) | 0.931 | (3.431) | 2.807 | (0.701) | 0.886 |
| Total income (loss) from operations | $ 1.100 | $ (3.298) | $ 2.940 | $ (0.639) | $ 1.005 |
| Less Distributions | | | | | |
| From net investment income | $ (0.100) | $ (0.152) | $ — | $ (0.151) | $ (0.085) |
| Total distributions | $ (0.100) | $ (0.152) | $ — | $ (0.151) | $ (0.085) |
| Net asset value — End of year | $10.390 | $ 9.390 | $12.840 | $ 9.900 | $10.690 |
| Total Return(2)(3) | 11.71% | (25.98)% | 29.70% | (6.11)% | 10.42% |
| Ratios/Supplemental Data | | | | | |
| Net assets, end of year (000’s omitted) | $ 143 | $ 209 | $ 419 | $ 598 | $ 1,862 |
| Ratios (as a percentage of average daily net assets):(4) | | | | | |
| Expenses (3) | 1.80% (5) | 1.80% (5) | 1.80% | 1.80% | 1.80% |
| Net investment income | 1.55% | 1.19% | 1.09% | 0.62% | 1.20% |
| Portfolio Turnover of the Portfolio | 36% | 22% | 23% | 10% | 37% |
| (1) | Computed using average shares outstanding. |
| (2) | Returns are historical and are calculated by determining the percentage change in net asset value with all distributions reinvested and do not reflect the effect of sales charges. |
| (3) | The administrator of the Fund and sub-adviser of the Portfolio reimbursed certain operating expenses (equal to 0.37%, 0.41%, 0.34%, 0.45% and 0.51% of average daily net assets for the years ended October 31, 2023, 2022, 2021, 2020 and 2019, respectively). Absent this reimbursement, total return would be lower. |
| (4) | Includes the Fund’s share of the Portfolio's allocated expenses. |
| (5) | Includes a reduction by the investment adviser of a portion of the Portfolio’s adviser fee due to the Portfolio’s investment in the Liquidity Fund (equal to less than 0.005% of average daily net assets for the years ended October 31, 2023 and 2022). |
12
See Notes to Financial Statements.
Parametric
Tax-Managed International Equity Fund
October 31, 2023
Financial Highlights — continued
| | Class I |
| | Year Ended October 31, |
| | 2023 | 2022 | 2021 | 2020 | 2019 |
| Net asset value — Beginning of year | $ 9.880 | $13.520 | $ 10.460 | $ 11.310 | $ 10.350 |
| Income (Loss) From Operations | | | | | |
| Net investment income(1) | $ 0.303 | $ 0.260 | $ 0.289 | $ 0.173 | $ 0.264 |
| Net realized and unrealized gain (loss) | 0.967 | (3.592) | 2.934 | (0.736) | 0.895 |
| Total income (loss) from operations | $ 1.270 | $ (3.332) | $ 3.223 | $ (0.563) | $ 1.159 |
| Less Distributions | | | | | |
| From net investment income | $ (0.220) | $ (0.308) | $ (0.163) | $ (0.287) | $ (0.199) |
| Total distributions | $ (0.220) | $ (0.308) | $ (0.163) | $ (0.287) | $ (0.199) |
| Net asset value — End of year | $10.930 | $ 9.880 | $13.520 | $10.460 | $11.310 |
| Total Return(2)(3) | 12.87% | (25.19)% | 30.99% | (5.19)% | 11.52% |
| Ratios/Supplemental Data | | | | | |
| Net assets, end of year (000’s omitted) | $ 17,552 | $17,554 | $ 16,335 | $ 11,560 | $ 13,301 |
| Ratios (as a percentage of average daily net assets):(4) | | | | | |
| Expenses (3) | 0.80% (5) | 0.80% (5) | 0.80% | 0.80% | 0.80% |
| Net investment income | 2.64% | 2.27% | 2.23% | 1.62% | 2.48% |
| Portfolio Turnover of the Portfolio | 36% | 22% | 23% | 10% | 37% |
| (1) | Computed using average shares outstanding. |
| (2) | Returns are historical and are calculated by determining the percentage change in net asset value with all distributions reinvested. |
| (3) | The administrator of the Fund and sub-adviser of the Portfolio reimbursed certain operating expenses (equal to 0.37%, 0.41%, 0.34%, 0.45% and 0.51% of average daily net assets for the years ended October 31, 2023, 2022, 2021, 2020 and 2019, respectively). Absent this reimbursement, total return would be lower. |
| (4) | Includes the Fund’s share of the Portfolio's allocated expenses. |
| (5) | Includes a reduction by the investment adviser of a portion of the Portfolio’s adviser fee due to the Portfolio’s investment in the Liquidity Fund (equal to less than 0.005% of average daily net assets for the years ended October 31, 2023 and 2022). |
13
See Notes to Financial Statements.
Parametric
Tax-Managed International Equity Fund
October 31, 2023
Notes to Financial Statements
1 Significant Accounting Policies
Parametric Tax-Managed International Equity Fund (the Fund) is a diversified series of Eaton Vance Mutual Funds Trust (the Trust). The Trust is a Massachusetts business trust registered under the Investment Company Act of 1940, as amended (the 1940 Act), as an open-end management investment company. The Fund offers three classes of shares. Class A shares are generally sold subject to a sales charge imposed at time of purchase. Class A shares are offered at net asset value to shareholders who owned Investor Class shares, which were redesignated as Class A shares on April 29, 2022, and only for such shareholders' accounts established prior to such date. Class C shares are sold at net asset value and are generally subject to a contingent deferred sales charge (see Note 5). Effective March 1, 2013, Class C shares of the Fund are no longer available for purchase, except by existing shareholders (including shares acquired through the reinvestment of dividends and distributions) or employer sponsored retirement plans. Effective November 5, 2020, Class C shares automatically convert to Class A shares eight years after their purchase as described in the Fund’s prospectus. Class I shares are sold at net asset value and are not subject to a sales charge. Each class represents a pro rata interest in the Fund, but votes separately on class-specific matters and (as noted below) is subject to different expenses. Realized and unrealized gains and losses and net investment income and losses, other than class-specific expenses, are allocated daily to each class of shares based on the relative net assets of each class to the total net assets of the Fund. Each class of shares differs in its distribution plan and certain other class-specific expenses. The Fund invests its assets in interests in Tax-Managed International Equity Portfolio (the Portfolio), a Massachusetts business trust, having the same investment objective and policies as the Fund. The value of the Fund’s investment in the Portfolio reflects the Fund’s proportionate interest in the net assets of the Portfolio (54.3% at October 31, 2023). The performance of the Fund is directly affected by the performance of the Portfolio. The financial statements of the Portfolio, including the portfolio of investments, are included elsewhere in this report and should be read in conjunction with the Fund’s financial statements.
The following is a summary of significant accounting policies of the Fund. The policies are in conformity with accounting principles generally accepted in the United States of America (U.S. GAAP). The Fund is an investment company and follows accounting and reporting guidance in the Financial Accounting Standards Board (FASB) Accounting Standards Codification Topic 946.
A Investment Valuation—Valuation of securities by the Portfolio is discussed in Note 1A of the Portfolio's Notes to Financial Statements, which are included elsewhere in this report.
B Income—The Fund's net investment income or loss consists of the Fund's pro rata share of the net investment income or loss of the Portfolio, less all actual and accrued expenses of the Fund.
C Federal Taxes—The Fund’s policy is to comply with the provisions of the Internal Revenue Code applicable to regulated investment companies and to distribute to shareholders each year substantially all of its net investment income, and all or substantially all of its net realized capital gains. Accordingly, no provision for federal income or excise tax is necessary.
As of October 31, 2023, the Fund had no uncertain tax positions that would require financial statement recognition, de-recognition, or disclosure. The Fund files a U.S. federal income tax return annually after its fiscal year-end, which is subject to examination by the Internal Revenue Service for a period of three years from the date of filing.
D Expenses—The majority of expenses of the Trust are directly identifiable to an individual fund. Expenses which are not readily identifiable to a specific fund are allocated taking into consideration, among other things, the nature and type of expense and the relative size of the funds.
E Use of Estimates—The preparation of the financial statements in conformity with U.S. GAAP requires management to make estimates and assumptions that affect the reported amounts of assets and liabilities at the date of the financial statements and the reported amounts of income and expense during the reporting period. Actual results could differ from those estimates.
F Indemnifications—Under the Trust’s organizational documents, its officers and Trustees may be indemnified against certain liabilities and expenses arising out of the performance of their duties to the Fund. Under Massachusetts law, if certain conditions prevail, shareholders of a Massachusetts business trust (such as the Trust) could be deemed to have personal liability for the obligations of the Trust. However, the Trust’s Declaration of Trust contains an express disclaimer of liability on the part of Fund shareholders and the By-laws provide that the Trust shall assume, upon request by the shareholder, the defense on behalf of any Fund shareholders. Moreover, the By-laws also provide for indemnification out of Fund property of any shareholder held personally liable solely by reason of being or having been a shareholder for all loss or expense arising from such liability. Additionally, in the normal course of business, the Fund enters into agreements with service providers that may contain indemnification clauses. The Fund's maximum exposure under these arrangements is unknown as this would involve future claims that may be made against the Fund that have not yet occurred.
G Other—Investment transactions are accounted for on a trade date basis.
Parametric
Tax-Managed International Equity Fund
October 31, 2023
Notes to Financial Statements — continued
2 Distributions to Shareholders and Income Tax Information
It is the present policy of the Fund to make at least one distribution annually (normally in December) of all or substantially all of its net investment income and to distribute annually all or substantially all of its net realized capital gains. Distributions to shareholders are recorded on the ex-dividend date. Distributions are declared separately for each class of shares. Shareholders may reinvest income and capital gain distributions in additional shares of the same class of the Fund at the net asset value as of the ex-dividend date or, at the election of the shareholder, receive distributions in cash. Distributions to shareholders are determined in accordance with income tax regulations, which may differ from U.S. GAAP. As required by U.S. GAAP, only distributions in excess of tax basis earnings and profits are reported in the financial statements as a return of capital. Permanent differences between book and tax accounting relating to distributions are reclassified to paid-in capital. For tax purposes, distributions from short-term capital gains are considered to be from ordinary income.
The tax character of distributions declared for the years ended October 31, 2023 and October 31, 2022 was as follows:
| | Year Ended October 31, |
| | 2023 | 2022 |
| Ordinary income | $661,156 | $837,377 |
During the year ended October 31, 2023, accumulated loss was increased by $83,851 and paid-in capital was increased by $83,851 due to the Fund’s use of equalization accounting. Tax equalization accounting allows the Fund to treat as a distribution that portion of redemption proceeds representing a redeeming shareholder’s portion of undistributed taxable income and net capital gains. These reclassifications had no effect on the net assets or net asset value per share of the Fund.
As of October 31, 2023, the components of distributable earnings (accumulated loss) on a tax basis were as follows:
| Undistributed ordinary income | $ 892,513 |
| Deferred capital losses | (1,465,203) |
| Net unrealized depreciation | (249,133) |
| Accumulated loss | $ (821,823) |
At October 31, 2023, the Fund, for federal income tax purposes, had deferred capital losses of $1,465,203 which would reduce its taxable income arising from future net realized gains on investment transactions, if any, to the extent permitted by the Internal Revenue Code, and thus would reduce the amount of distributions to shareholders, which would otherwise be necessary to relieve the Fund of any liability for federal income or excise tax. The deferred capital losses are treated as arising on the first day of the Fund’s next taxable year and retain the same short-term or long-term character as when originally deferred. Of the deferred capital losses at October 31, 2023, $674,070 are short-term and $791,133 are long-term.
3 Investment Adviser Fee and Other Transactions with Affiliates
The investment adviser fee is earned by Eaton Vance Management (EVM), an indirect, wholly-owned subsidiary of Morgan Stanley, as compensation for investment advisory services rendered to the Fund. The fee is computed at an annual rate as a percentage of the Fund’s average daily net assets that are not invested in other investment companies for which EVM or its affiliates serve as investment adviser and receive an advisory fee as follows and is payable monthly:
| Average Daily Net Assets | Annual Fee Rate |
| Up to $1 billion | 0.500% |
| $1 billion but less than $2.5 billion | 0.475% |
| $2.5 billion but less than $5.0 billion | 0.455% |
| $5 billion and over | 0.440% |
For the year ended October 31, 2023, the Fund incurred no investment adviser fee on such assets. Pursuant to an investment sub-advisory agreement, EVM has delegated the investment management of the Fund to Parametric Portfolio Associates LLC (Parametric), an affiliate of EVM and an indirect, wholly-owned subsidiary of Morgan Stanley. EVM pays Parametric a portion of its investment adviser fee for sub-advisory services provided to the Fund. To
Parametric
Tax-Managed International Equity Fund
October 31, 2023
Notes to Financial Statements — continued
the extent that the Fund’s assets are invested in the Portfolio, the Fund is allocated its share of the Portfolio’s investment adviser fee. The Portfolio has engaged Boston Management and Research (BMR) to render investment advisory services. See Note 2 of the Portfolio’s Notes to Financial Statements which are included elsewhere in this report. EVM also serves as the administrator of the Fund, but receives no compensation.
EVM and Parametric have agreed to reimburse the Fund’s expenses to the extent that total annual operating expenses (relating to ordinary operating expenses only and excluding expenses such as brokerage commissions, acquired fund fees and expenses of unaffiliated funds, borrowing costs, taxes or litigation expenses) exceed 1.05%, 1.80% and 0.80% of the Fund’s average daily net assets for Class A, Class C and Class I, respectively. This agreement may be changed or terminated after February 29, 2024. Pursuant to this agreement, EVM and Parametric were allocated $134,909 in total of the Fund’s operating expenses for the year ended October 31, 2023.
EVM provides sub-transfer agency and related services to the Fund pursuant to a Sub-Transfer Agency Support Services Agreement. For the year ended October 31, 2023, EVM earned $20,148 from the Fund pursuant to such agreement, which is included in transfer and dividend disbursing agent fees on the Statement of Operations. The Fund was informed that Eaton Vance Distributors, Inc. (EVD), an affiliate of EVM and the Fund’s principal underwriter, received no sales charge on sales of Class A shares for the year ended October 31, 2023. EVD received distribution and service fees from Class A and Class C shares (see Note 4).
Trustees and officers of the Fund who are members of EVM’s or BMR’s organizations receive remuneration for their services to the Fund out of the investment adviser fee. Certain officers and Trustees of the Fund and the Portfolio are officers of the above organizations.
4 Distribution Plans
The Fund has in effect a distribution plan for Class A shares (Class A Plan) pursuant to Rule 12b-1 under the 1940 Act. Pursuant to the Class A Plan, the Fund pays EVD a distribution and service fee of 0.25% per annum of its average daily net assets attributable to Class A shares for distribution services and facilities provided to the Fund by EVD, as well as for personal services and/or the maintenance of shareholder accounts. Distribution and service fees paid or accrued to EVD for the year ended October 31, 2023 amounted to $43,975 for Class A shares.
The Fund also has in effect a distribution plan for Class C shares (Class C Plan) pursuant to Rule 12b-1 under the 1940 Act. Pursuant to the Class C Plan, the Fund pays EVD amounts equal to 0.75% per annum of its average daily net assets attributable to Class C shares for providing ongoing distribution services and facilities to the Fund. For the year ended October 31, 2023, the Fund paid or accrued to EVD $1,494 for Class C shares.
Pursuant to the Class C Plan, the Fund also makes payments of service fees to EVD, financial intermediaries and other persons in amounts equal to 0.25% per annum of its average daily net assets attributable to that class. Service fees paid or accrued are for personal services and/or the maintenance of shareholder accounts. They are separate and distinct from the sales commissions and distribution fees payable to EVD. Service fees paid or accrued for the year ended October 31, 2023 amounted to $498 for Class C shares.
Distribution and service fees are subject to the limitations contained in the Financial Industry Regulatory Authority Rule 2341(d).
5 Contingent Deferred Sales Charges
A contingent deferred sales charge (CDSC) of 1% generally is imposed on redemptions of Class C shares made within 12 months of purchase. Class A shares may be subject to a 1% CDSC if redeemed within 12 months of purchase (depending on the circumstances of purchase). Redemptions of Class A shares by former Investor Class shareholders are not subject to a CDSC. Generally, the CDSC is based upon the lower of the net asset value at date of redemption or date of purchase. No charge is levied on shares acquired by reinvestment of dividends or capital gain distributions. For the year ended October 31, 2023, the Fund was informed that EVD received no CDSCs paid by Class A and Class C shareolders.
6 Investment Transactions
For the year ended October 31, 2023, increases and decreases in the Fund's investment in the Portfolio aggregated $2,256,476 and $6,107,843, respectively.
Parametric
Tax-Managed International Equity Fund
October 31, 2023
Notes to Financial Statements — continued
7 Shares of Beneficial Interest
The Fund’s Declaration of Trust permits the Trustees to issue an unlimited number of full and fractional shares of beneficial interest (without par value). Such shares may be issued in a number of different series (such as the Fund) and classes. Transactions in Fund shares, including direct exchanges pursuant to share class conversions, were as follows:
| | Year Ended
October 31, 2023 | | Year Ended
October 31, 2022 |
| | Shares | Amount | | Shares | Amount |
| Class A | | | | | |
| Sales | 8,655 | $ 99,080 | | 31,676 | $ 383,229 |
| Issued to shareholders electing to receive payments of distributions in Fund shares | 25,064 | 273,696 | | 31,812 | 416,101 |
| Redemptions | (132,188) | (1,488,202) | | (126,605) | (1,470,906) |
| Net decrease | (98,469) | $(1,115,426) | | (63,117) | $ (671,576) |
| Class C | | | | | |
| Sales | 1,317 | $ 14,422 | | 2,090 | $ 24,376 |
| Issued to shareholders electing to receive payments of distributions in Fund shares | 206 | 2,152 | | 326 | 4,067 |
| Redemptions | (9,997) | (108,811) | | (12,818) | (149,489) |
| Net decrease | (8,474) | $ (92,237) | | (10,402) | $ (121,046) |
| Class I | | | | | |
| Sales | 281,604 | $ 3,251,778 | | 1,168,258 | $ 13,128,703 |
| Issued to shareholders electing to receive payments of distributions in Fund shares | 32,490 | 353,494 | | 28,431 | 370,458 |
| Redemptions | (485,147) | (5,405,069) | | (627,257) | (6,778,363) |
| Net increase (decrease) | (171,053) | $(1,799,797) | | 569,432 | $ 6,720,798 |
Parametric
Tax-Managed International Equity Fund
October 31, 2023
Report of Independent Registered Public Accounting Firm
To the Trustees of Eaton Vance Mutual Funds Trust and Shareholders of Parametric Tax-Managed International Equity Fund:
Opinion on the Financial Statements and Financial Highlights
We have audited the accompanying statement of assets and liabilities of Parametric Tax-Managed International Equity Fund (the “Fund”) (one of the funds constituting Eaton Vance Mutual Funds Trust), as of October 31, 2023, the related statement of operations for the year then ended, the statements of changes in net assets for each of the two years in the period then ended, the financial highlights for each of the five years in the period then ended, and the related notes. In our opinion, the financial statements and financial highlights present fairly, in all material respects, the financial position of the Fund as of October 31, 2023, and the results of its operations for the year then ended, the changes in its net assets for each of the two years in the period then ended, and the financial highlights for each of the five years in the period then ended, in conformity with accounting principles generally accepted in the United States of America.
Basis for Opinion
These financial statements and financial highlights are the responsibility of the Fund's management. Our responsibility is to express an opinion on the Fund's financial statements and financial highlights based on our audits. We are a public accounting firm registered with the Public Company Accounting Oversight Board (United States) (PCAOB) and are required to be independent with respect to the Fund in accordance with the U.S. federal securities laws and the applicable rules and regulations of the Securities and Exchange Commission and the PCAOB.
We conducted our audits in accordance with the standards of the PCAOB. Those standards require that we plan and perform the audit to obtain reasonable assurance about whether the financial statements and financial highlights are free of material misstatement, whether due to error or fraud. The Fund is not required to have, nor were we engaged to perform, an audit of its internal control over financial reporting. As part of our audits, we are required to obtain an understanding of internal control over financial reporting but not for the purpose of expressing an opinion on the effectiveness of the Fund’s internal control over financial reporting. Accordingly, we express no such opinion.
Our audits included performing procedures to assess the risks of material misstatement of the financial statements and financial highlights, whether due to error or fraud, and performing procedures that respond to those risks. Such procedures included examining, on a test basis, evidence regarding the amounts and disclosures in the financial statements and financial highlights. Our audits also included evaluating the accounting principles used and significant estimates made by management, as well as evaluating the overall presentation of the financial statements and financial highlights. We believe that our audits provide a reasonable basis for our opinion.
/s/ Deloitte & Touche LLP
Boston, Massachusetts
December 19, 2023
We have served as the auditor of one or more Eaton Vance investment companies since 1959.
Parametric
Tax-Managed International Equity Fund
October 31, 2023
Federal Tax Information (Unaudited)
The Form 1099-DIV you receive in February 2024 will show the tax status of all distributions paid to your account in calendar year 2023. Shareholders are advised to consult their own tax adviser with respect to the tax consequences of their investment in the Fund. As required by the Internal Revenue Code and/or regulations, shareholders must be notified regarding the status of qualified dividend income for individuals and the foreign tax credit.
Qualified Dividend Income. For the fiscal year ended October 31, 2023, the Fund designates approximately $1,246,407, or up to the maximum amount of such dividends allowable pursuant to the Internal Revenue Code, as qualified dividend income eligible for the reduced tax rate of 15%.
Foreign Tax Credit. For the fiscal year ended October 31, 2023, the Fund paid foreign taxes of $139,870 and recognized foreign source income of $1,278,779.
Tax-Managed International Equity Portfolio
October 31, 2023
| Security | Shares | Value |
| Australia — 8.4% |
| Altium, Ltd. | | 3,632 | $ 91,612 |
| APA Group | | 28,788 | 150,905 |
| ASX, Ltd. | | 1,525 | 54,484 |
| Atlas Arteria, Ltd.(1) | | 13,938 | 47,119 |
| Aurizon Holdings, Ltd.(1) | | 14,009 | 30,513 |
| Bapcor, Ltd.(1) | | 17,313 | 58,931 |
| BHP Group, Ltd. | | 9,711 | 274,894 |
| Brambles, Ltd. | | 17,422 | 145,400 |
| carsales.com, Ltd. | | 8,634 | 152,194 |
| Charter Hall Long Wale REIT(1) | | 17,564 | 33,743 |
| Charter Hall Retail REIT | | 18,162 | 35,291 |
| Codan, Ltd.(1) | | 4,717 | 23,396 |
| Coles Group, Ltd. | | 13,689 | 132,861 |
| Commonwealth Bank of Australia | | 1,651 | 101,563 |
| Computershare, Ltd. | | 7,415 | 117,023 |
| CSL, Ltd. | | 3,274 | 483,871 |
| Data#3, Ltd. | | 7,498 | 32,322 |
| Dexus (1) | | 13,975 | 57,719 |
| Elders, Ltd.(1) | | 5,348 | 20,181 |
| Endeavour Group, Ltd.(1) | | 13,721 | 43,104 |
| EVT, Ltd.(1) | | 10,106 | 67,010 |
| Hansen Technologies, Ltd. | | 14,633 | 48,321 |
| HomeCo Daily Needs REIT(1)(2) | | 42,841 | 29,215 |
| Incitec Pivot, Ltd. | | 22,926 | 40,021 |
| InvoCare, Ltd. | | 5,288 | 42,557 |
| IRESS, Ltd.(1) | | 7,406 | 23,616 |
| Lendlease Corp., Ltd.(1) | | 9,400 | 37,229 |
| Lottery Corp. Ltd. | | 32,522 | 93,877 |
| Medibank Private, Ltd. | | 16,474 | 35,951 |
| Mirvac Group(1) | | 41,842 | 48,547 |
| National Australia Bank, Ltd. | | 6,485 | 116,174 |
| National Storage REIT | | 24,990 | 31,862 |
| New Hope Corp., Ltd.(1) | | 6,072 | 22,345 |
| Newmont Corp. CDI(3) | | 942 | 36,083 |
| NEXTDC, Ltd.(3) | | 11,247 | 84,452 |
| Orica, Ltd. | | 4,147 | 38,749 |
| Origin Energy, Ltd. | | 34,036 | 197,438 |
| QBE Insurance Group, Ltd. | | 5,122 | 50,790 |
| Region RE, Ltd.(1) | | 20,523 | 25,662 |
| Rio Tinto, Ltd. | | 1,729 | 129,153 |
| Santos, Ltd.(1) | | 20,873 | 101,849 |
| Scentre Group | | 43,799 | 67,853 |
| Stockland | | 21,890 | 49,404 |
| Suncorp Group, Ltd. | | 5,349 | 45,529 |
| Security | Shares | Value |
| Australia (continued) |
| Tabcorp Holdings, Ltd. | | 88,897 | $ 43,864 |
| Technology One, Ltd. | | 8,485 | 78,688 |
| Telstra Group, Ltd. | | 90,240 | 218,821 |
| TPG Telecom, Ltd.(1) | | 20,255 | 66,815 |
| Transurban Group | | 22,607 | 170,196 |
| Vicinity, Ltd. | | 39,555 | 42,843 |
| Viva Energy Group, Ltd.(4) | | 12,311 | 22,169 |
| Waypoint REIT, Ltd. | | 9,833 | 13,280 |
| Weebit Nano, Ltd.(1)(3) | | 7,492 | 15,803 |
| Wesfarmers, Ltd. | | 8,581 | 276,083 |
| Westpac Banking Corp. | | 7,685 | 100,918 |
| Whitehaven Coal, Ltd. | | 7,762 | 36,561 |
| Woodside Energy Group, Ltd. | | 13,621 | 296,663 |
| Woolworths Group, Ltd. | | 13,266 | 296,956 |
| Yancoal Australia, Ltd.(1) | | 6,032 | 18,523 |
| | | | $ 5,248,996 |
| Austria — 1.1% |
| ANDRITZ AG | | 1,285 | $ 59,147 |
| AT&S Austria Technologie & Systemtechnik AG | | 1,360 | 34,144 |
| BAWAG Group AG(4) | | 407 | 18,128 |
| CA Immobilien Anlagen AG(1) | | 2,850 | 96,368 |
| Erste Group Bank AG | | 2,269 | 81,251 |
| Eurotelesites AG(3) | | 2,000 | 6,729 |
| Kontron AG | | 1,758 | 35,435 |
| Mayr-Melnhof Karton AG | | 125 | 14,706 |
| Oesterreichische Post AG | | 584 | 18,617 |
| OMV AG | | 1,834 | 80,436 |
| PIERER Mobility AG(1) | | 420 | 24,047 |
| Rhi Magnesita NV | | 764 | 23,848 |
| Telekom Austria AG | | 8,000 | 55,862 |
| Verbund AG(1) | | 1,229 | 106,784 |
| voestalpine AG(1) | | 1,326 | 33,112 |
| | | | $ 688,614 |
| Belgium — 2.1% |
| Ackermans & van Haaren NV | | 948 | $ 140,733 |
| Aedifica S.A. | | 737 | 40,207 |
| Ageas S.A./NV | | 1,164 | 44,713 |
| Anheuser-Busch InBev S.A./NV | | 2,419 | 137,636 |
| Barco NV | | 2,270 | 34,853 |
| Cofinimmo S.A. | | 488 | 30,346 |
| Colruyt Group NV | | 478 | 19,782 |
| D'Ieteren Group | | 715 | 106,207 |
| Econocom Group S.A./NV | | 10,730 | 26,326 |
| Elia Group S.A./NV | | 1,018 | 96,665 |
20
See Notes to Financial Statements.
Tax-Managed International Equity Portfolio
October 31, 2023
Portfolio of Investments — continued
| Security | Shares | Value |
| Belgium (continued) |
| Euronav NV | | 5,526 | $ 98,918 |
| EVS Broadcast Equipment S.A. | | 1,740 | 49,033 |
| KBC Group NV | | 1,598 | 87,946 |
| Montea NV | | 358 | 25,303 |
| Proximus SADP | | 9,427 | 78,136 |
| Retail Estates N.V. | | 587 | 35,740 |
| Solvay S.A. | | 842 | 89,013 |
| UCB S.A. | | 1,600 | 117,024 |
| Umicore S.A. | | 2,338 | 55,628 |
| Xior Student Housing NV(2) | | 621 | 17,868 |
| | | | $ 1,332,077 |
| Denmark — 4.4% |
| AP Moller - Maersk A/S, Class A | | 42 | $ 68,576 |
| AP Moller - Maersk A/S, Class B | | 45 | 74,980 |
| Carlsberg A/S, Class B | | 2,327 | 277,316 |
| Chr. Hansen Holding A/S | | 2,271 | 154,972 |
| D/S Norden A/S | | 671 | 38,124 |
| Danske Bank A/S(1) | | 9,592 | 225,016 |
| FLSmidth & Co. A/S | | 866 | 32,477 |
| ISS A/S | | 2,025 | 29,307 |
| Matas A/S | | 1,729 | 22,512 |
| Novo Nordisk A/S, Class B(1) | | 7,438 | 717,590 |
| Novozymes A/S, Class B | | 4,578 | 205,749 |
| Orsted A/S(1)(4) | | 4,338 | 209,608 |
| Pandora A/S | | 2,364 | 268,126 |
| Scandinavian Tobacco Group A/S, Class A(4) | | 5,079 | 75,415 |
| Topdanmark A/S | | 1,587 | 71,136 |
| TORM PLC, Class A(1) | | 907 | 27,680 |
| Tryg A/S | | 6,518 | 127,281 |
| Vestas Wind Systems A/S(3) | | 5,708 | 123,720 |
| | | | $ 2,749,585 |
| Finland — 2.2% |
| Citycon Oyj(3) | | 3,632 | $ 19,211 |
| Elisa Oyj | | 2,763 | 117,221 |
| Fortum Oyj | | 10,228 | 121,441 |
| Harvia Oyj(2) | | 1,032 | 25,430 |
| Kempower Oyj(1)(3) | | 436 | 13,671 |
| Kesko Oyj, Class B | | 7,282 | 123,150 |
| Kojamo Oyj(1) | | 3,939 | 33,650 |
| Kone Oyj, Class B | | 2,736 | 118,478 |
| Neste Oyj | | 3,560 | 119,644 |
| Nokia Oyj | | 31,287 | 104,207 |
| Nordea Bank Abp | | 13,924 | 146,651 |
| Orion Oyj, Class B | | 3,814 | 151,742 |
| Security | Shares | Value |
| Finland (continued) |
| Puuilo Oyj | | 2,988 | $ 25,021 |
| TietoEVRY Oyj | | 956 | 20,057 |
| Tokmanni Group Corp. | | 4,468 | 60,334 |
| UPM-Kymmene Oyj | | 4,505 | 151,710 |
| YIT Oyj(1) | | 9,254 | 16,467 |
| | | | $ 1,368,085 |
| France — 8.5% |
| Air Liquide S.A. | | 3,247 | $ 556,381 |
| Airbus SE | | 780 | 104,579 |
| AXA S.A. | | 6,703 | 198,613 |
| BNP Paribas S.A. | | 3,328 | 191,373 |
| Bollore SE | | 13,714 | 74,865 |
| Bouygues S.A. | | 1,100 | 38,697 |
| Bureau Veritas S.A. | | 921 | 20,978 |
| Capgemini SE | | 1,229 | 217,200 |
| Carrefour S.A. | | 5,094 | 89,305 |
| Cie Generale des Etablissements Michelin SCA | | 2,492 | 74,033 |
| Danone S.A. | | 2,980 | 177,282 |
| Dassault Systemes SE | | 5,415 | 223,062 |
| Edenred SE | | 1,068 | 56,851 |
| Eiffage S.A. | | 269 | 24,412 |
| Engie S.A. | | 23,380 | 371,856 |
| Eutelsat Communications S.A.(1) | | 10,085 | 43,066 |
| Gecina S.A. | | 1,055 | 103,591 |
| Getlink SE | | 2,197 | 35,479 |
| ICADE (1) | | 1,083 | 35,387 |
| Klepierre S.A. | | 4,222 | 102,526 |
| L'Oreal S.A. | | 281 | 118,113 |
| LVMH Moet Hennessy Louis Vuitton SE | | 596 | 426,695 |
| Orange S.A. | | 25,469 | 299,567 |
| Pernod Ricard S.A. | | 786 | 139,575 |
| Quadient S.A. | | 948 | 19,820 |
| Rubis SCA | | 5,497 | 119,684 |
| Safran S.A. | | 556 | 86,858 |
| Sanofi S.A. | | 4,937 | 448,310 |
| Sopra Steria Group SACA | | 385 | 69,121 |
| Thales S.A. | | 600 | 88,547 |
| TotalEnergies SE | | 7,524 | 503,036 |
| Vinci S.A. | | 1,159 | 128,156 |
| Vivendi SE | | 12,615 | 113,125 |
| Voltalia S.A.(1)(3) | | 1,827 | 15,279 |
| | | | $ 5,315,422 |
| Germany — 8.6% |
| Allianz SE | | 1,068 | $ 250,171 |
21
See Notes to Financial Statements.
Tax-Managed International Equity Portfolio
October 31, 2023
Portfolio of Investments — continued
| Security | Shares | Value |
| Germany (continued) |
| BASF SE | | 5,297 | $ 244,759 |
| Bayer AG | | 4,632 | 200,142 |
| Bayerische Motoren Werke AG | | 1,291 | 120,069 |
| Bayerische Motoren Werke AG, PFC Shares | | 792 | 67,344 |
| Brenntag SE | | 725 | 53,912 |
| Cropenergies AG | | 2,253 | 19,399 |
| Daimler Truck Holding AG | | 1,859 | 58,410 |
| Deutsche Boerse AG | | 659 | 108,469 |
| Deutsche Lufthansa AG(3) | | 5,121 | 35,908 |
| Deutsche Telekom AG | | 24,422 | 530,047 |
| Deutsche Wohnen SE | | 2,022 | 43,510 |
| E.ON SE | | 49,704 | 591,384 |
| Evonik Industries AG | | 3,498 | 64,380 |
| Fresenius Medical Care AG & Co. KGaA | | 1,941 | 64,492 |
| Fresenius SE & Co. KGaA | | 3,336 | 85,813 |
| FUCHS PETROLUB SE, PFC Shares | | 495 | 20,105 |
| Gea Group AG | | 1,075 | 36,765 |
| Gerresheimer AG | | 321 | 29,941 |
| Grand City Properties S.A.(3) | | 3,999 | 35,759 |
| Hamborner REIT AG | | 9,515 | 62,953 |
| Hannover Rueck SE | | 220 | 48,579 |
| Henkel AG & Co. KGaA | | 2,701 | 170,704 |
| Henkel AG & Co. KGaA, PFC Shares | | 3,830 | 276,277 |
| K+S AG | | 4,249 | 71,431 |
| Knorr-Bremse AG | | 398 | 22,230 |
| LEG Immobilien SE(3) | | 1,939 | 121,210 |
| Mercedes-Benz Group AG | | 2,924 | 172,031 |
| MTU Aero Engines AG | | 190 | 35,712 |
| Muenchener Rueckversicherungs-Gesellschaft AG | | 361 | 144,872 |
| QIAGEN NV(3) | | 1,735 | 64,660 |
| Rheinmetall AG | | 216 | 62,012 |
| RWE AG | | 1,362 | 52,118 |
| SAP SE | | 3,795 | 509,032 |
| Siemens AG | | 1,574 | 208,868 |
| Suedzucker AG | | 9,335 | 141,414 |
| Symrise AG, Class A | | 1,413 | 144,394 |
| Talanx AG | | 1,186 | 74,741 |
| Telefonica Deutschland Holding AG | | 23,557 | 40,049 |
| Vitesco Technologies Group AG(3) | | 445 | 43,524 |
| Volkswagen AG, PFC Shares | | 790 | 83,780 |
| Vonovia SE | | 8,759 | 201,650 |
| | | | $ 5,413,020 |
| Hong Kong — 4.3% |
| AIA Group, Ltd. | | 33,600 | $ 291,776 |
| ASMPT, Ltd. | | 2,900 | 24,562 |
| Security | Shares | Value |
| Hong Kong (continued) |
| Bank of East Asia, Ltd. (The) | | 52,200 | $ 61,994 |
| Beijing Tong Ren Tang Chinese Medicine Co., Ltd. | | 21,000 | 31,542 |
| BOC Hong Kong Holdings, Ltd. | | 11,500 | 30,412 |
| Budweiser Brewing Co. APAC, Ltd.(4) | | 66,900 | 127,133 |
| Cafe de Coral Holdings, Ltd. | | 20,000 | 25,190 |
| China Traditional Chinese Medicine Holdings Co., Ltd. | | 128,000 | 63,071 |
| Chow Sang Sang Holdings International, Ltd. | | 42,000 | 48,280 |
| Chow Tai Fook Jewellery Group, Ltd. | | 59,000 | 83,315 |
| CK Asset Holdings, Ltd. | | 18,000 | 89,970 |
| CK Hutchison Holdings, Ltd. | | 42,500 | 215,147 |
| CLP Holdings, Ltd. | | 23,000 | 168,332 |
| C-Mer Eye Care Holdings, Ltd.(2)(3) | | 44,000 | 21,503 |
| DFI Retail Group Holdings, Ltd.(1) | | 13,100 | 27,943 |
| Galaxy Entertainment Group, Ltd. | | 28,000 | 157,401 |
| Hang Lung Properties, Ltd. | | 37,000 | 48,635 |
| Hang Seng Bank, Ltd. | | 6,200 | 70,885 |
| HK Electric Investments & HK Electric Investments, Ltd.(2) | | 154,000 | 85,429 |
| HKT Trust and HKT, Ltd. | | 169,000 | 175,048 |
| Hongkong Land Holdings, Ltd. | | 15,800 | 50,113 |
| Hutchison Telecommunications Hong Kong Holdings, Ltd. | | 238,000 | 31,972 |
| Jardine Matheson Holdings, Ltd. | | 1,200 | 48,625 |
| Luk Fook Holdings International, Ltd. | | 15,000 | 37,212 |
| MTR Corp., Ltd. | | 18,000 | 67,287 |
| NWS Holdings, Ltd. | | 51,000 | 60,345 |
| PAX Global Technology, Ltd. | | 75,000 | 51,769 |
| Power Assets Holdings, Ltd. | | 30,000 | 143,425 |
| Shangri-La Asia, Ltd.(3) | | 38,000 | 24,243 |
| Sino Land Co., Ltd. | | 32,000 | 31,947 |
| Sun Hung Kai Properties, Ltd. | | 12,000 | 123,224 |
| Viva Goods Company, Ltd.(3) | | 192,000 | 25,281 |
| VSTECS Holdings, Ltd. | | 60,000 | 30,339 |
| VTech Holdings, Ltd. | | 10,000 | 58,188 |
| Wharf Holdings, Ltd. | | 17,000 | 43,137 |
| | | | $ 2,674,675 |
| Ireland — 2.2% |
| Bank of Ireland Group PLC | | 24,074 | $ 215,744 |
| CRH PLC | | 5,583 | 299,622 |
| DCC PLC | | 1,417 | 78,720 |
| Fineos Corp. Holdings PLC CDI(3) | | 16,777 | 17,665 |
| Flutter Entertainment PLC(3) | | 1,544 | 242,496 |
| ICON PLC ADR(3) | | 1,080 | 263,477 |
| Irish Continental Group PLC | | 6,302 | 28,753 |
| Irish Residential Properties REIT PLC | | 33,524 | 32,290 |
| Kerry Group PLC, Class A | | 2,357 | 182,064 |
| | | | $ 1,360,831 |
22
See Notes to Financial Statements.
Tax-Managed International Equity Portfolio
October 31, 2023
Portfolio of Investments — continued
| Security | Shares | Value |
| Israel — 2.2% |
| Airport City, Ltd.(3) | | 1,245 | $ 16,395 |
| Amot Investments, Ltd. | | 5,499 | 23,029 |
| Azrieli Group, Ltd. | | 509 | 21,916 |
| Bank Hapoalim B.M. | | 6,278 | 44,906 |
| Bank Leumi Le-Israel B.M. | | 10,138 | 65,298 |
| Bezeq The Israeli Telecommunication Corp., Ltd. | | 74,540 | 91,721 |
| Big Shopping Centers, Ltd.(3) | | 234 | 16,402 |
| Check Point Software Technologies, Ltd.(3) | | 385 | 51,686 |
| Delek Automotive Systems, Ltd. | | 5,228 | 24,167 |
| Delek Group, Ltd. | | 592 | 64,767 |
| Delta Galil, Ltd. | | 645 | 20,411 |
| Elbit Systems, Ltd. | | 297 | 55,242 |
| Electra, Ltd. | | 76 | 24,077 |
| Enlight Renewable Energy, Ltd.(3) | | 5,509 | 74,226 |
| Fattal Holdings 1998, Ltd.(3) | | 339 | 28,045 |
| Fiverr International, Ltd.(1)(3) | | 953 | 20,175 |
| Fox Wizel, Ltd. | | 492 | 27,935 |
| ICL Group, Ltd. | | 25,308 | 123,095 |
| Maytronics, Ltd. | | 2,874 | 26,737 |
| Melisron, Ltd. | | 379 | 20,543 |
| Nice, Ltd.(3) | | 412 | 63,158 |
| Nova, Ltd.(3) | | 138 | 13,214 |
| Oil Refineries, Ltd. | | 76,583 | 21,013 |
| OPC Energy, Ltd.(3) | | 4,225 | 22,915 |
| OY Nofar Energy, Ltd.(3) | | 1,707 | 30,418 |
| Partner Communications Co., Ltd.(3) | | 9,362 | 34,007 |
| Plus500, Ltd. | | 1,094 | 18,767 |
| Reit 1, Ltd. | | 8,315 | 30,072 |
| Shapir Engineering and Industry, Ltd. | | 3,467 | 18,581 |
| Shufersal, Ltd.(3) | | 11,960 | 50,491 |
| Strauss Group, Ltd.(3) | | 2,438 | 45,171 |
| Teva Pharmaceutical Industries, Ltd. ADR(3) | | 19,132 | 164,153 |
| | | | $ 1,352,733 |
| Italy — 4.3% |
| Assicurazioni Generali SpA | | 4,184 | $ 83,109 |
| Buzzi Unicem SpA | | 1,488 | 39,401 |
| Davide Campari-Milano NV | | 14,115 | 156,024 |
| De'Longhi SpA | | 1,200 | 26,850 |
| DiaSorin SpA | | 977 | 87,561 |
| Enav SpA(4) | | 5,309 | 17,695 |
| Enel SpA | | 40,123 | 254,684 |
| Eni SpA | | 21,987 | 359,436 |
| Ferrari NV | | 654 | 197,968 |
| GVS SpA(3)(4) | | 4,062 | 18,208 |
| Infrastrutture Wireless Italiane SpA(4) | | 18,725 | 205,036 |
| Security | Shares | Value |
| Italy (continued) |
| Italgas SpA | | 7,381 | $ 37,509 |
| Italmobiliare SpA | | 1,360 | 34,384 |
| Leonardo SpA | | 5,068 | 76,590 |
| Mediobanca Banca di Credito Finanziario SpA | | 2,659 | 31,763 |
| MFE-MediaForEurope NV, Class B | | 1,958 | 5,196 |
| Poste Italiane SpA(4) | | 5,564 | 55,085 |
| Prysmian SpA | | 2,617 | 97,999 |
| RAI Way SpA(4) | | 4,122 | 20,481 |
| Recordati Industria Chimica e Farmaceutica SpA | | 4,029 | 186,359 |
| Stellantis NV | | 6,033 | 112,711 |
| STMicroelectronics NV | | 7,572 | 288,647 |
| Technogym SpA(4) | | 2,741 | 20,634 |
| Terna - Rete Elettrica Nazionale | | 8,968 | 68,668 |
| UniCredit SpA | | 5,306 | 133,019 |
| UnipolSai Assicurazioni SpA | | 10,716 | 25,398 |
| Webuild SpA | | 11,250 | 20,261 |
| | | | $ 2,660,676 |
| Japan — 12.8% |
| Activia Properties, Inc. | | 16 | $ 43,288 |
| Aeon Co., Ltd. | | 4,300 | 90,470 |
| Air Water, Inc. | | 2,000 | 25,217 |
| ANA Holdings, Inc.(3) | | 1,100 | 21,595 |
| Asahi Kasei Corp. | | 8,100 | 49,797 |
| Astellas Pharma, Inc. | | 7,500 | 94,874 |
| Bandai Namco Holdings, Inc. | | 2,400 | 49,724 |
| Bridgestone Corp. | | 1,600 | 60,552 |
| Canon, Inc. | | 1,500 | 35,461 |
| Central Japan Railway Co. | | 1,500 | 33,763 |
| Concordia Financial Group, Ltd. | | 10,800 | 50,181 |
| Daicel Corp. | | 3,900 | 33,164 |
| Daiichi Sankyo Co., Ltd. | | 5,400 | 139,235 |
| Daiwa House REIT Investment Corp. | | 23 | 40,704 |
| Disco Corp. | | 600 | 105,959 |
| East Japan Railway Co. | | 900 | 46,744 |
| Eisai Co., Ltd. | | 1,400 | 74,170 |
| Electric Power Development Co., Ltd., Class C | | 2,500 | 38,327 |
| ENEOS Holdings, Inc. | | 31,200 | 115,609 |
| Fast Retailing Co., Ltd. | | 300 | 66,419 |
| Frontier Real Estate Investment Corp. | | 8 | 23,933 |
| FUJIFILM Holdings Corp. | | 500 | 27,349 |
| Fujitsu, Ltd. | | 300 | 38,864 |
| Fukuoka Financial Group, Inc. | | 1,600 | 42,294 |
| GLP J-REIT | | 41 | 36,722 |
| Hamamatsu Photonics K.K. | | 700 | 26,000 |
| Hirose Electric Co., Ltd. | | 315 | 35,689 |
23
See Notes to Financial Statements.
Tax-Managed International Equity Portfolio
October 31, 2023
Portfolio of Investments — continued
| Security | Shares | Value |
| Japan (continued) |
| Honda Motor Co., Ltd. | | 5,700 | $ 58,418 |
| Idemitsu Kosan Co., Ltd. | | 3,700 | 84,009 |
| ITOCHU Corp.(1) | | 1,900 | 68,440 |
| Iwatani Corp. | | 1,800 | 86,091 |
| Japan Logistics Fund, Inc. | | 29 | 53,716 |
| Japan Metropolitan Fund Investment Corporation | | 93 | 60,017 |
| Japan Post Bank Co., Ltd. | | 6,000 | 55,615 |
| Japan Post Holdings Co., Ltd. | | 7,500 | 66,384 |
| Japan Prime Realty Investment Corp. | | 22 | 51,530 |
| Japan Real Estate Investment Corp. | | 11 | 40,858 |
| Japan Tobacco, Inc. | | 4,100 | 95,443 |
| Kansai Electric Power Co., Inc. | | 7,200 | 92,188 |
| Kansai Paint Co., Ltd. | | 3,300 | 48,294 |
| Kao Corp. | | 2,100 | 76,616 |
| KDDI Corp. | | 6,400 | 191,454 |
| Kenedix Office Investment Corp.(1) | | 24 | 25,032 |
| Keyence Corp. | | 400 | 154,847 |
| Kintetsu Group Holdings Co., Ltd. | | 800 | 22,509 |
| Kirin Holdings Co., Ltd. | | 3,800 | 53,403 |
| Kobe Steel, Ltd. | | 3,000 | 35,470 |
| Komatsu, Ltd. | | 2,200 | 50,548 |
| Kuraray Co., Ltd. | | 2,300 | 26,315 |
| Kyocera Corp. | | 900 | 44,362 |
| Kyowa Kirin Co., Ltd. | | 2,700 | 42,348 |
| Kyushu Electric Power Co., Inc.(3) | | 8,300 | 53,030 |
| Lion Corp. | | 5,400 | 51,822 |
| Marubeni Corp. | | 3,400 | 49,714 |
| Maruichi Steel Tube, Ltd. | | 1,200 | 29,780 |
| MatsukiyoCocokara & Co. | | 2,700 | 47,363 |
| Medipal Holdings Corp. | | 2,800 | 47,076 |
| MEIJI Holdings Co., Ltd. | | 1,600 | 39,382 |
| Mitsubishi Chemical Group Corp. | | 10,000 | 56,586 |
| Mitsubishi Corp. | | 1,400 | 65,262 |
| Mitsubishi Electric Corp. | | 3,200 | 36,693 |
| Mitsubishi HC Capital, Inc. | | 6,100 | 40,213 |
| Mitsubishi Heavy Industries, Ltd. | | 600 | 30,903 |
| Mitsui & Co., Ltd. | | 1,800 | 65,419 |
| Mitsui Chemicals, Inc. | | 1,300 | 32,766 |
| Mitsui Fudosan Co., Ltd. | | 5,100 | 110,542 |
| Mitsui OSK Lines, Ltd.(1) | | 1,100 | 28,399 |
| Mizuho Financial Group, Inc. | | 5,630 | 95,588 |
| MS&AD Insurance Group Holdings, Inc. | | 1,800 | 65,953 |
| Murata Manufacturing Co., Ltd. | | 4,500 | 77,082 |
| NEC Corp. | | 1,500 | 72,226 |
| NH Foods, Ltd. | | 1,600 | 48,005 |
| Nintendo Co., Ltd. | | 6,000 | 247,886 |
| Security | Shares | Value |
| Japan (continued) |
| Nippon Accommodations Fund, Inc. | | 8 | $ 32,230 |
| Nippon Building Fund, Inc. | | 11 | 44,197 |
| Nippon Sanso Holdings Corp. | | 2,300 | 58,003 |
| Nippon Shokubai Co., Ltd. | | 600 | 22,285 |
| Nippon Steel Corp. | | 3,600 | 77,648 |
| Nippon Telegraph & Telephone Corp. | | 180,100 | 211,937 |
| Nippon Yusen KK | | 1,200 | 29,361 |
| Nisshin Seifun Group, Inc. | | 4,900 | 73,911 |
| Nissin Foods Holdings Co., Ltd. | | 700 | 60,906 |
| Nitori Holdings Co., Ltd. | | 300 | 32,488 |
| NOF Corp. | | 800 | 31,561 |
| Nomura Real Estate Holdings, Inc. | | 1,100 | 25,692 |
| Nomura Real Estate Master Fund, Inc. | | 63 | 69,518 |
| Nomura Research Institute, Ltd. | | 2,000 | 52,500 |
| NTT Data Group Corp. | | 4,400 | 54,252 |
| Obic Co., Ltd. | | 300 | 44,345 |
| Oji Holdings Corp. | | 12,700 | 54,316 |
| Ono Pharmaceutical Co., Ltd. | | 3,300 | 56,989 |
| Oriental Land Co., Ltd. | | 2,500 | 80,863 |
| Orix JREIT, Inc. | | 47 | 54,015 |
| Osaka Gas Co., Ltd. | | 5,500 | 103,718 |
| Otsuka Holdings Co., Ltd. | | 2,400 | 80,750 |
| Pan Pacific International Holdings Corp. | | 2,000 | 38,732 |
| Panasonic Holdings Corp. | | 5,400 | 47,377 |
| Resona Holdings, Inc. | | 6,700 | 35,800 |
| ROHM Co., Ltd. | | 800 | 12,818 |
| Rohto Pharmaceutical Co., Ltd. | | 1,600 | 37,330 |
| Santen Pharmaceutical Co., Ltd. | | 4,400 | 38,164 |
| SECOM Co., Ltd. | | 600 | 41,673 |
| Sekisui House Reit, Inc. | | 97 | 51,088 |
| Sekisui House, Ltd. | | 2,000 | 39,165 |
| Shimadzu Corp. | | 1,200 | 28,376 |
| Shionogi & Co., Ltd. | | 1,500 | 69,847 |
| Shizuoka Financial Group, Inc. | | 5,800 | 49,322 |
| SoftBank Corp. | | 14,500 | 163,949 |
| Sompo Holdings, Inc. | | 1,200 | 51,984 |
| Subaru Corp. | | 2,400 | 41,545 |
| Sumitomo Chemical Co., Ltd.(1) | | 10,900 | 27,705 |
| Sumitomo Corp. | | 2,400 | 47,178 |
| Sumitomo Electric Industries, Ltd. | | 2,900 | 30,445 |
| Sumitomo Mitsui Financial Group, Inc. | | 2,700 | 130,162 |
| Sumitomo Mitsui Trust Holdings, Inc. | | 1,500 | 56,245 |
| Suntory Beverage & Food, Ltd. | | 1,600 | 48,149 |
| Suzuki Motor Corp. | | 600 | 23,287 |
| Taiheiyo Cement Corp. | | 2,500 | 42,844 |
| Takeda Pharmaceutical Co., Ltd. | | 5,000 | 135,724 |
24
See Notes to Financial Statements.
Tax-Managed International Equity Portfolio
October 31, 2023
Portfolio of Investments — continued
| Security | Shares | Value |
| Japan (continued) |
| TEIJIN, Ltd. | | 3,300 | $ 29,869 |
| Tohoku Electric Power Co., Inc. | | 9,800 | 61,192 |
| Tokio Marine Holdings, Inc. | | 3,400 | 76,066 |
| Tokyo Gas Co., Ltd. | | 4,100 | 92,074 |
| Tokyu Corp.(1) | | 3,200 | 36,125 |
| TOPPAN Holdings, Inc. | | 2,000 | 46,128 |
| Toray Industries, Inc. | | 6,900 | 33,381 |
| Tosoh Corp. | | 2,200 | 26,937 |
| Toyo Seikan Group Holdings, Ltd. | | 2,900 | 48,756 |
| Toyo Suisan Kaisha, Ltd. | | 1,000 | 46,131 |
| Toyota Motor Corp. | | 13,600 | 237,915 |
| Trend Micro, Inc. | | 600 | 22,611 |
| United Urban Investment Corp. | | 35 | 35,286 |
| West Japan Railway Co. | | 700 | 26,680 |
| Yakult Honsha Co., Ltd. | | 2,000 | 47,130 |
| Yamato Holdings Co., Ltd. | | 2,000 | 33,312 |
| Yamato Kogyo Co., Ltd. | | 1,000 | 47,911 |
| Yamazaki Baking Co., Ltd. | | 1,300 | 27,523 |
| | | | $ 8,037,122 |
| Netherlands — 4.2% |
| ABN AMRO Bank NV GDR(4) | | 2,263 | $ 30,480 |
| Aegon, Ltd.(1) | | 12,248 | 59,565 |
| Akzo Nobel NV | | 683 | 45,819 |
| Alfen NV(1)(3)(4) | | 256 | 8,070 |
| ASML Holding NV | | 646 | 388,324 |
| ASR Nederland NV | | 1,620 | 60,456 |
| Corbion NV(1) | | 2,072 | 35,884 |
| DSM BV(3) | | 1,929 | 190,677 |
| Euronext NV(4) | | 576 | 40,169 |
| EXOR N.V. | | 350 | 30,040 |
| JDE Peet's NV(1) | | 1,640 | 45,546 |
| Koninklijke Ahold Delhaize NV | | 9,251 | 273,939 |
| Koninklijke KPN NV | | 65,476 | 220,077 |
| Koninklijke Philips NV | | 17,139 | 326,026 |
| NN Group NV | | 1,992 | 63,888 |
| NSI NV | | 1,000 | 18,063 |
| Prosus NV | | 11,033 | 309,297 |
| Randstad NV(1) | | 683 | 35,369 |
| SBM Offshore NV(1) | | 4,496 | 55,995 |
| Universal Music Group NV(1) | | 7,168 | 175,536 |
| Wolters Kluwer NV(1) | | 1,682 | 215,811 |
| | | | $ 2,629,031 |
| New Zealand — 1.0% |
| a2 Milk Co., Ltd. (The)(1)(3) | | 28,790 | $ 70,125 |
| Security | Shares | Value |
| New Zealand (continued) |
| Argosy Property, Ltd. | | 39,042 | $ 24,132 |
| Auckland International Airport, Ltd. | | 12,240 | 52,354 |
| Contact Energy, Ltd. | | 9,580 | 43,517 |
| Fisher & Paykel Healthcare Corp., Ltd. | | 5,931 | 71,941 |
| Goodman Property Trust | | 27,739 | 32,489 |
| Heartland Group Holdings, Ltd. | | 19,544 | 17,438 |
| Infratil, Ltd. | | 6,421 | 36,767 |
| Kiwi Property Group, Ltd. | | 57,056 | 25,772 |
| KMD Brands, Ltd. | | 27,332 | 13,221 |
| Meridian Energy, Ltd. | | 15,507 | 43,673 |
| SKYCITY Entertainment Group, Ltd.(1) | | 29,814 | 32,497 |
| Spark New Zealand, Ltd. | | 30,866 | 89,608 |
| Vulcan Steel, Ltd.(1) | | 3,600 | 16,359 |
| Xero, Ltd.(3) | | 1,231 | 84,160 |
| | | | $ 654,053 |
| Norway — 2.1% |
| Aker ASA, Class A | | 499 | $ 30,008 |
| ArcticZymes Technologies ASA(1)(3) | | 4,268 | 11,132 |
| Atea ASA(3) | | 2,752 | 28,635 |
| Austevoll Seafood ASA | | 3,899 | 26,648 |
| Borregaard ASA | | 3,526 | 47,853 |
| Crayon Group Holding ASA(3)(4) | | 2,500 | 14,449 |
| DNB Bank ASA | | 6,189 | 111,661 |
| Elkem ASA(4) | | 14,511 | 22,461 |
| Entra ASA(4) | | 2,972 | 23,228 |
| Equinor ASA | | 6,266 | 210,056 |
| Europris ASA(4) | | 6,059 | 34,341 |
| Gjensidige Forsikring ASA | | 1,701 | 25,510 |
| Golden Ocean Group, Ltd. | | 3,420 | 25,305 |
| Kitron ASA | | 9,412 | 24,860 |
| Kongsberg Gruppen ASA | | 1,873 | 76,511 |
| Mowi ASA | | 5,946 | 96,620 |
| Nykode Therapeutics ASA(3) | | 7,954 | 12,230 |
| Opera, Ltd. ADR(1) | | 3,500 | �� 40,530 |
| Orkla ASA | | 8,207 | 56,567 |
| REC Silicon ASA(3) | | 16,371 | 21,318 |
| Scatec ASA(4) | | 3,300 | 16,677 |
| Schibsted ASA, Class B | | 2,498 | 46,352 |
| SpareBank 1 Nord Norge | | 3,559 | 30,097 |
| Stolt-Nielsen, Ltd. | | 879 | 28,949 |
| Telenor ASA | | 11,887 | 121,514 |
| Veidekke ASA | | 3,671 | 31,674 |
| Yara International ASA | | 2,956 | 96,726 |
| | | | $ 1,311,912 |
25
See Notes to Financial Statements.
Tax-Managed International Equity Portfolio
October 31, 2023
Portfolio of Investments — continued
| Security | Shares | Value |
| Portugal — 1.1% |
| Banco Comercial Portugues S.A., Class R(3) | | 387,844 | $ 119,035 |
| Corticeira Amorim SGPS S.A. | | 4,721 | 45,854 |
| CTT-Correios de Portugal S.A. | | 12,855 | 49,040 |
| EDP-Energias de Portugal S.A. | | 19,728 | 82,907 |
| Galp Energia SGPS S.A. | | 8,111 | 122,109 |
| Jeronimo Martins SGPS S.A. | | 5,858 | 135,056 |
| Navigator Co. S.A. (The) | | 16,287 | 64,836 |
| NOS SGPS S.A. | | 11,659 | 42,621 |
| REN-Redes Energeticas Nacionais SGPS S.A. | | 11,590 | 30,174 |
| | | | $ 691,632 |
| Singapore — 4.3% |
| AEM Holdings, Ltd. | | 9,200 | $ 23,256 |
| BW LPG, Ltd.(4) | | 3,082 | 43,627 |
| CapitaLand Ascott Trust | | 27,455 | 18,052 |
| CapitaLand Integrated Commercial Trust | | 56,100 | 72,101 |
| City Developments, Ltd. | | 7,700 | 35,542 |
| ComfortDelGro Corp., Ltd. | | 36,500 | 35,254 |
| DBS Group Holdings, Ltd. | | 9,000 | 216,210 |
| ESR-LOGOS REIT | | 156,500 | 31,391 |
| First Resources, Ltd. | | 32,600 | 35,994 |
| Flex, Ltd.(3) | | 11,357 | 292,102 |
| Food Empire Holdings, Ltd. | | 25,900 | 20,805 |
| Frasers Centrepoint Trust | | 12,700 | 19,212 |
| Frasers Logistics & Commercial Trust(2) | | 54,700 | 41,551 |
| Genting Singapore, Ltd. | | 244,700 | 153,734 |
| Grab Holdings, Ltd., Class A(3) | | 21,600 | 66,312 |
| Haw Par Corp, Ltd. | | 4,700 | 32,835 |
| Jardine Cycle & Carriage, Ltd. | | 1,000 | 20,600 |
| Keppel Corp., Ltd. | | 14,400 | 65,367 |
| Keppel REIT(1) | | 55,680 | 32,331 |
| Lendlease Global Commercial REIT | | 77,600 | 28,903 |
| Mapletree Industrial Trust | | 27,660 | 43,479 |
| NetLink NBN Trust(2) | | 66,200 | 40,141 |
| Parkway Life REIT | | 13,500 | 33,119 |
| Raffles Medical Group, Ltd. | | 38,400 | 33,413 |
| SATS, Ltd.(3) | | 12,200 | 21,947 |
| Sea, Ltd. ADR(3) | | 4,137 | 172,513 |
| Sembcorp Industries, Ltd. | | 51,100 | 171,436 |
| Sheng Siong Group, Ltd. | | 41,900 | 47,438 |
| Singapore Airlines, Ltd.(1) | | 17,100 | 76,356 |
| Singapore Exchange, Ltd. | | 7,000 | 48,466 |
| Singapore Post, Ltd. | | 55,300 | 18,162 |
| Singapore Technologies Engineering, Ltd. | | 19,500 | 53,532 |
| Singapore Telecommunications, Ltd. | | 64,900 | 112,775 |
| StarHub, Ltd. | | 35,800 | 26,954 |
| Security | Shares | Value |
| Singapore (continued) |
| Suntec Real Estate Investment Trust(1) | | 27,000 | $ 21,697 |
| United Overseas Bank, Ltd. | | 8,200 | 161,742 |
| UOL Group, Ltd. | | 4,600 | 19,811 |
| Venture Corp., Ltd. | | 7,500 | 64,037 |
| Wilmar International, Ltd. | | 103,000 | 267,778 |
| | | | $ 2,719,975 |
| Spain — 4.2% |
| ACS Actividades de Construccion y Servicios S.A. | | 2,126 | $ 76,885 |
| Aena SME S.A.(4) | | 1,064 | 154,387 |
| Almirall S.A. | | 2,798 | 25,474 |
| Banco Santander S.A.(1) | | 61,792 | 227,267 |
| Bankinter S.A.(1) | | 12,265 | 77,557 |
| CaixaBank S.A. | | 15,438 | 62,764 |
| Cellnex Telecom S.A.(3)(4) | | 4,799 | 141,072 |
| Cia de Distribucion Integral Logista Holdings S.A. | | 2,665 | 65,440 |
| Ence Energia y Celulosa S.A.(1) | | 9,147 | 27,363 |
| Ercros S.A.(1) | | 8,525 | 26,300 |
| Fomento de Construcciones y Contratas S.A.(1) | | 1,562 | 19,817 |
| Grifols S.A.(3) | | 11,886 | 133,376 |
| Iberdrola S.A. | | 25,708 | 285,925 |
| Indra Sistemas S.A.(1) | | 3,340 | 46,898 |
| Industria de Diseno Textil S.A. | | 10,558 | 364,441 |
| Laboratorios Farmaceuticos Rovi S.A. | | 1,773 | 94,819 |
| Merlin Properties Socimi S.A. | | 15,993 | 133,346 |
| Metrovacesa S.A.(3)(4) | | 2,900 | 23,513 |
| Redeia Corp. S.A. | | 2,456 | 38,301 |
| Repsol S.A. | | 22,889 | 335,144 |
| Sacyr S.A.(1) | | 6,428 | 18,561 |
| Telefonica S.A. | | 43,001 | 166,097 |
| Vidrala S.A. | | 739 | 54,926 |
| Viscofan S.A.(1) | | 825 | 47,690 |
| | | | $ 2,647,363 |
| Sweden — 4.3% |
| Alfa Laval AB | | 1,197 | $ 38,791 |
| Alleima AB | | 7,335 | 44,650 |
| Arjo AB, Class B | | 8,801 | 29,434 |
| Assa Abloy AB, Class B | | 2,883 | 61,451 |
| Atrium Ljungberg AB, Class B(1) | | 2,504 | 38,506 |
| Betsson AB, Class B(3) | | 1,812 | 18,237 |
| Bilia AB, Class A | | 2,195 | 20,396 |
| BioArctic AB, Class B(3)(4) | | 1,352 | 27,319 |
| BioGaia AB, Class B | | 2,424 | 21,640 |
| Boliden AB | | 1,310 | 33,579 |
| BoneSupport Holding AB(3)(4) | | 2,221 | 28,905 |
26
See Notes to Financial Statements.
Tax-Managed International Equity Portfolio
October 31, 2023
Portfolio of Investments — continued
| Security | Shares | Value |
| Sweden (continued) |
| Camurus AB(3) | | 1,249 | $ 37,434 |
| Catena AB(1) | | 932 | 30,874 |
| Cibus Nordic Real Estate AB(1) | | 2,069 | 19,417 |
| Dios Fastigheter AB | | 3,475 | 18,812 |
| Elekta AB, Class B | | 5,121 | 34,883 |
| Epiroc AB, Class A | | 2,897 | 47,727 |
| Epiroc AB, Class B | | 1,712 | 23,772 |
| Essity AB, Class B | | 11,138 | 253,967 |
| Evolution AB(4) | | 1,309 | 116,639 |
| Fabege AB(1) | | 7,085 | 52,862 |
| Getinge AB, Class B | | 3,014 | 54,262 |
| H & M Hennes & Mauritz AB, Class B(1) | | 4,833 | 64,930 |
| Hemnet Group AB | | 2,581 | 44,829 |
| Hexagon AB, Class B | | 13,262 | 108,080 |
| Holmen AB, Class B | | 2,532 | 95,557 |
| Hufvudstaden AB, Class A | | 2,401 | 25,598 |
| Investor AB, Class B | | 3,101 | 56,925 |
| Kindred Group PLC SDR | | 4,528 | 37,070 |
| L E Lundbergforetagen AB, Class B | | 1,263 | 51,581 |
| Millicom International Cellular S.A., SDR(3) | | 3,136 | 49,273 |
| Mycronic AB | | 4,445 | 97,376 |
| Note AB(3) | | 3,097 | 40,595 |
| Nyfosa AB(1) | | 5,192 | 25,125 |
| Oatly Group AB ADR(1)(3) | | 91,500 | 44,414 |
| Orron Energy AB(1)(3) | | 4,713 | 2,944 |
| Pandox AB, Class B | | 1,960 | 19,292 |
| Paradox Interactive AB | | 1,527 | 29,045 |
| Platzer Fastigheter Holding AB, Class B | | 3,149 | 16,536 |
| Polestar Automotive Holding U.K. PLC, Class A ADR(1)(3) | | 6,400 | 12,864 |
| Skandinaviska Enskilda Banken AB, Class A | | 7,648 | 85,348 |
| Skanska AB, Class B | | 1,238 | 18,587 |
| SKF AB, Class B | | 2,466 | 39,980 |
| Spotify Technology S.A.(3) | | 1,019 | 167,891 |
| Stillfront Group AB(3) | | 16,614 | 17,198 |
| Svenska Cellulosa AB SCA, Class B | | 9,048 | 124,152 |
| Swedbank AB, Class A | | 4,828 | 79,292 |
| Swedish Orphan Biovitrum AB(3) | | 3,003 | 61,778 |
| Telefonaktiebolaget LM Ericsson, Class B | | 11,872 | 53,183 |
| Tethys Oil AB(3) | | 4,284 | 21,912 |
| Trelleborg AB, Class B | | 1,004 | 25,390 |
| Volvo AB, Class B | | 3,769 | 74,684 |
| Wihlborgs Fastigheter AB | | 6,283 | 40,727 |
| | | | $ 2,685,713 |
| Switzerland — 8.6% |
| ABB, Ltd. | | 5,264 | $ 176,858 |
| Security | Shares | Value |
| Switzerland (continued) |
| ALSO Holding AG | | 245 | $ 62,497 |
| Baloise Holding AG | | 396 | 56,860 |
| Banque Cantonale Vaudoise(1) | | 570 | 64,430 |
| BKW AG | | 330 | 55,476 |
| Cembra Money Bank AG | | 670 | 46,197 |
| Cie Financiere Richemont S.A., Class A | | 5,772 | 680,954 |
| Clariant AG | | 8,755 | 124,390 |
| DKSH Holding AG | | 773 | 47,335 |
| Flughafen Zurich AG | | 295 | 55,124 |
| Forbo Holding AG | | 26 | 28,674 |
| Galenica AG(4) | | 858 | 64,821 |
| Givaudan S.A. | | 88 | 292,910 |
| Helvetia Holding AG(1) | | 425 | 57,134 |
| Holcim AG | | 5,395 | 333,561 |
| Intershop Holding AG | | 78 | 51,755 |
| Kuehne & Nagel International AG | | 464 | 125,124 |
| Landis & Gyr Group AG | | 1,111 | 82,427 |
| LEM Holding S.A. | | 13 | 26,322 |
| Logitech International S.A. | | 2,732 | 215,039 |
| Meyer Burger Technology AG(1)(3) | | 49,710 | 13,318 |
| Nestle S.A. | | 6,891 | 743,117 |
| Novartis AG | | 3,416 | 319,805 |
| PSP Swiss Property AG | | 379 | 46,632 |
| Roche Holding AG PC | | 1,250 | 322,137 |
| Sandoz Group AG(3) | | 860 | 22,359 |
| Schindler Holding AG | | 320 | 62,381 |
| Schindler Holding AG PC | | 353 | 71,420 |
| SGS S.A. | | 900 | 73,504 |
| Stadler Rail AG | | 1,511 | 51,124 |
| Swatch Group AG (The), Bearer Shares | | 279 | 71,417 |
| Swiss Life Holding AG | | 172 | 110,472 |
| Swiss Prime Site AG | | 1,669 | 155,130 |
| Swiss Re AG | | 1,223 | 133,628 |
| Swisscom AG | | 366 | 219,303 |
| Zurich Insurance Group AG | | 617 | 293,070 |
| | | | $ 5,356,705 |
| United Kingdom — 8.6% |
| Admiral Group PLC | | 1,759 | $ 52,265 |
| Airtel Africa PLC(4) | | 64,844 | 89,325 |
| Assura PLC | | 41,543 | 20,693 |
| AstraZeneca PLC | | 3,884 | 486,291 |
| Aviva PLC | | 12,379 | 59,958 |
| B&M European Value Retail S.A. | | 4,833 | 31,114 |
| BAE Systems PLC | | 5,635 | 75,770 |
| Berkeley Group Holdings PLC | | 509 | 25,021 |
27
See Notes to Financial Statements.
Tax-Managed International Equity Portfolio
October 31, 2023
Portfolio of Investments — continued
| Security | Shares | Value |
| United Kingdom (continued) |
| Big Yellow Group PLC | | 5,278 | $ 61,384 |
| British American Tobacco PLC | | 4,267 | 127,466 |
| British Land Co. PLC (The) | | 7,798 | 28,270 |
| BT Group PLC | | 43,183 | 59,309 |
| Bunzl PLC | | 1,400 | 49,947 |
| Burberry Group PLC | | 3,492 | 71,970 |
| Compass Group PLC | | 7,473 | 188,404 |
| Computacenter PLC | | 1,269 | 39,691 |
| Darktrace PLC(3) | | 8,597 | 36,685 |
| Derwent London PLC | | 1,158 | 25,735 |
| Direct Line Insurance Group PLC(3) | | 9,041 | 16,669 |
| FDM Group Holdings PLC | | 2,454 | 13,019 |
| Fresnillo PLC | | 3,353 | 22,568 |
| Glencore PLC | | 46,127 | 244,327 |
| Grainger PLC | | 16,347 | 45,244 |
| Great Portland Estates PLC | | 3,877 | 18,406 |
| HSBC Holdings PLC | | 24,537 | 177,167 |
| Imperial Brands PLC | | 3,571 | 76,077 |
| Informa PLC | | 15,828 | 137,141 |
| Intertek Group PLC | | 919 | 42,801 |
| Land Securities Group PLC | | 14,692 | 101,841 |
| London Stock Exchange Group PLC | | 865 | 87,274 |
| LXi REIT PLC(2) | | 54,470 | 56,927 |
| Manchester United PLC, Class A(1)(3) | | 4,400 | 78,892 |
| National Grid PLC | | 27,610 | 329,193 |
| NCC Group PLC | | 21,199 | 27,512 |
| Next PLC | | 1,020 | 85,519 |
| Pearson PLC | | 7,487 | 86,667 |
| Phoenix Group Holdings PLC | | 5,262 | 29,067 |
| Primary Health Properties PLC | | 13,321 | 14,555 |
| QinetiQ Group PLC | | 8,311 | 33,504 |
| Reckitt Benckiser Group PLC | | 1,615 | 108,055 |
| RELX PLC | | 4,013 | 140,165 |
| Rentokil Initial PLC | | 8,784 | 44,732 |
| Rio Tinto PLC | | 3,810 | 243,080 |
| Rolls-Royce Holdings PLC(3) | | 27,107 | 71,352 |
| Sage Group PLC (The) | | 15,349 | 181,330 |
| Severn Trent PLC | | 5,650 | 182,541 |
| Shaftesbury Capital PLC | | 57,908 | 73,410 |
| Shell PLC | | 14,923 | 480,921 |
| Smiths Group PLC | | 2,292 | 44,959 |
| Spectris PLC | | 1,446 | 54,640 |
| Spirent Communications PLC | | 11,297 | 13,385 |
| Standard Chartered PLC | | 7,613 | 58,371 |
| Supermarket Income REIT PLC | | 58,122 | 51,317 |
| Unilever PLC | | 4,105 | 194,415 |
| Security | Shares | Value |
| United Kingdom (continued) |
| Vodafone Group PLC | | 147,595 | $ 135,867 |
| Whitbread PLC | | 806 | 32,682 |
| | | | $ 5,364,890 |
Total Common Stocks
(identified cost $60,507,263) | | | $62,263,110 |
| Preferred Stocks — 0.0%(5) |
| Security | Shares | Value |
| Italy — 0.0%(5) |
| Danieli & C Officine Meccaniche SpA, 1.574% | | 1,102 | $ 22,267 |
Total Preferred Stocks
(identified cost $20,107) | | | $ 22,267 |
| Short-Term Investments — 3.6% |
| Security | Shares | Value |
| Morgan Stanley Institutional Liquidity Funds - Government Portfolio, Institutional Class, 5.25%(6) | | 25,783 | $ 25,783 |
Total Affiliated Fund
(identified cost $25,783) | | | $ 25,783 |
| Securities Lending Collateral — 3.5% |
| Security | Shares | Value |
| State Street Navigator Securities Lending Government Money Market Portfolio, 5.36%(7) | | 2,204,773 | $ 2,204,773 |
Total Securities Lending Collateral
(identified cost $2,204,773) | | | $ 2,204,773 |
Total Short-Term Investments
(identified cost $2,230,556) | | | $ 2,230,556 |
| | | |
Total Investments — 103.1%
(identified cost $62,757,926) | | | $64,515,933 |
| Other Assets, Less Liabilities — (3.1)% | | | $ (1,940,136) |
| Net Assets — 100.0% | | | $62,575,797 |
28
See Notes to Financial Statements.
Tax-Managed International Equity Portfolio
October 31, 2023
Portfolio of Investments — continued
| The percentage shown for each investment category in the Portfolio of Investments is based on net assets. |
| (1) | All or a portion of this security was on loan at October 31, 2023. The aggregate market value of securities on loan at October 31, 2023 was $3,769,096. |
| (2) | Security exempt from registration under Regulation S of the Securities Act of 1933, as amended, which exempts from registration securities offered and sold outside the United States. Security may not be offered or sold in the United States except pursuant to an exemption from, or in a transaction not subject to, the registration requirements of the Securities Act of 1933, as amended. At October 31, 2023, the aggregate value of these securities is $318,064 or 0.5% of the Portfolio's net assets. |
| (3) | Non-income producing security. |
| (4) | Security exempt from registration under Rule 144A of the Securities Act of 1933, as amended. These securities may be sold in certain transactions in reliance on an exemption from registration (normally to qualified institutional buyers). At October 31, 2023, the aggregate value of these securities is $1,669,075 or 2.7% of the Portfolio's net assets. |
| (5) | Amount is less than 0.05%. |
| (6) | May be deemed to be an affiliated investment company. The rate shown is the annualized seven-day yield as of October 31, 2023. |
| (7) | Represents investment of cash collateral received in connection with securities lending. |
| Sector Classification of Portfolio |
| Sector | Percentage
of Net Assets | Value |
| Financials | 11.5% | $7,223,216 |
| Industrials | 10.8 | 6,762,040 |
| Consumer Discretionary | 10.3 | 6,438,153 |
| Consumer Staples | 10.1 | 6,343,198 |
| Health Care | 9.9 | 6,212,742 |
| Materials | 9.4 | 5,883,643 |
| Communication Services | 9.0 | 5,625,527 |
| Information Technology | 8.4 | 5,266,137 |
| Utilities | 7.4 | 4,642,061 |
| Real Estate | 7.3 | 4,540,748 |
| Energy | 5.4 | 3,347,912 |
| Short-Term Investments | 3.6 | 2,230,556 |
| Total Investments | 103.1% | $64,515,933 |
| Abbreviations: |
| ADR | – American Depositary Receipt |
| CDI | – CHESS Depositary Interest |
| GDR | – Global Depositary Receipt |
| PC | – Participation Certificate |
| PFC Shares | – Preference Shares |
| SDR | – Swedish Depositary Receipt |
29
See Notes to Financial Statements.
Tax-Managed International Equity Portfolio
October 31, 2023
Statement of Assets and Liabilities
| | October 31, 2023 |
| Assets | |
| Unaffiliated investments, at value (identified cost $62,732,143) — including $3,769,096 of securities on loan | $ 64,490,150 |
| Affiliated investments, at value (identified cost $25,783) | 25,783 |
| Foreign currency, at value (identified cost $27,460) | 27,464 |
| Interest and dividends receivable | 114,134 |
| Dividends receivable from affiliated investments | 399 |
| Securities lending income receivable | 1,826 |
| Tax reclaims receivable | 232,062 |
| Trustees' deferred compensation plan | 38,620 |
| Total assets | $64,930,438 |
| Liabilities | |
| Collateral for securities loaned | $ 2,204,773 |
| Payable for investments purchased | 1,683 |
| Payable to affiliates: | |
| Investment adviser fee | 26,991 |
| Trustees' fees | 411 |
| Trustees' deferred compensation plan | 38,620 |
| Accrued expenses | 82,163 |
| Total liabilities | $ 2,354,641 |
| Net Assets applicable to investors' interest in Portfolio | $62,575,797 |
30
See Notes to Financial Statements.
Tax-Managed International Equity Portfolio
October 31, 2023
| | Year Ended |
| | October 31, 2023 |
| Investment Income | |
| Dividend income (net of foreign taxes withheld of $322,492) | $ 2,247,867 |
| Dividend income from affiliated investments | 4,964 |
| Securities lending income, net | 56,319 |
| Total investment income | $2,309,150 |
| Expenses | |
| Investment adviser fee | $ 333,253 |
| Trustees’ fees and expenses | 4,751 |
| Custodian fee | 73,311 |
| Legal and accounting services | 57,897 |
| Miscellaneous | 9,157 |
| Total expenses | $ 478,369 |
| Deduct: | |
| Waiver and/or reimbursement of expenses by affiliates | $ 138 |
| Total expense reductions | $ 138 |
| Net expenses | $ 478,231 |
| Net investment income | $1,830,919 |
| Realized and Unrealized Gain (Loss) | |
| Net realized gain (loss): | |
| Investment transactions (net of foreign capital gains taxes of $107) | $ 94,445 |
| Investment transactions - affiliated investments | 54,003 |
| Foreign currency transactions | 6,134 |
| Net realized gain | $ 154,582 |
| Change in unrealized appreciation (depreciation): | |
| Investments | $ 5,593,098 |
| Investments - affiliated investments | 16,243 |
| Foreign currency | 12,936 |
| Net change in unrealized appreciation (depreciation) | $5,622,277 |
| Net realized and unrealized gain | $5,776,859 |
| Net increase in net assets from operations | $7,607,778 |
31
See Notes to Financial Statements.
Tax-Managed International Equity Portfolio
October 31, 2023
Statements of Changes in Net Assets
| | Year Ended October 31, |
| | 2023 | 2022 |
| Increase (Decrease) in Net Assets | | |
| From operations: | | |
| Net investment income | $ 1,830,919 | $ 1,606,130 |
| Net realized gain (loss) | 154,582 | (1,227,103) |
| Net change in unrealized appreciation (depreciation) | 5,622,277 | (20,060,081) |
| Net increase (decrease) in net assets from operations | $ 7,607,778 | $(19,681,054) |
| Capital transactions: | | |
| Contributions | $ 4,123,770 | $ 11,445,206 |
| Withdrawals | (8,732,642) | (9,274,277) |
| Net increase (decrease) in net assets from capital transactions | $ (4,608,872) | $ 2,170,929 |
| Net increase (decrease) in net assets | $ 2,998,906 | $(17,510,125) |
| Net Assets | | |
| At beginning of year | $ 59,576,891 | $ 77,087,016 |
| At end of year | $62,575,797 | $ 59,576,891 |
32
See Notes to Financial Statements.
Tax-Managed International Equity Portfolio
October 31, 2023
| | Year Ended October 31, |
| Ratios/Supplemental Data | 2023 | 2022 | 2021 | 2020 | 2019 |
| Ratios (as a percentage of average daily net assets): | | | | | |
| Expenses | 0.72% (1) | 0.69% (1) | 0.68% | 0.69% | 0.74% |
| Net investment income | 2.75% | 2.34% | 2.31% | 1.74% | 2.53% |
| Portfolio Turnover | 36% | 22% | 23% | 10% | 37% |
| Total Return | 12.91% | (25.13)% | 31.20% | (5.07)% | 11.59% |
| Net assets, end of year (000’s omitted) | $62,576 | $59,577 | $77,087 | $60,016 | $71,054 |
| (1) | Includes a reduction by the investment adviser of a portion of the Portfolio’s adviser fee due to the Portfolio’s investment in the Liquidity Fund (equal to less than 0.005% of average daily net assets for the years ended October 31, 2023 and 2022). |
33
See Notes to Financial Statements.
Tax-Managed International Equity Portfolio
October 31, 2023
Notes to Financial Statements
1 Significant Accounting Policies
Tax-Managed International Equity Portfolio (the Portfolio) is a Massachusetts business trust registered under the Investment Company Act of 1940, as amended (the 1940 Act), as a diversified, open-end management investment company. The Portfolio’s investment objective is to achieve long-term, after-tax returns by investing in a diversified portfolio of foreign equity securities. The Declaration of Trust permits the Trustees to issue interests in the Portfolio. At October 31, 2023, Parametric Tax-Managed International Equity Fund and Eaton Vance Tax-Managed Equity Asset Allocation Fund held an interest of 54.3% and 45.7%, respectively, in the Portfolio.
The following is a summary of significant accounting policies of the Portfolio. The policies are in conformity with accounting principles generally accepted in the United States of America (U.S. GAAP). The Portfolio is an investment company and follows accounting and reporting guidance in the Financial Accounting Standards Board (FASB) Accounting Standards Codification Topic 946.
A Investment Valuation—The following methodologies are used to determine the market value or fair value of investments.
Equity Securities. Equity securities listed on a U.S. securities exchange generally are valued at the last sale or closing price on the day of valuation or, if no sales took place on such date, at the mean between the closing bid and ask prices on the exchange where such securities are principally traded. Equity securities listed on the NASDAQ National Market System are valued at the NASDAQ official closing price. Unlisted or listed securities for which closing sales prices or closing quotations are not available are valued at the mean between the latest available bid and ask prices.
Foreign Securities and Currencies. Foreign securities and currencies are valued in U.S. dollars, based on foreign currency exchange rate quotations supplied by a third party pricing service. The pricing service uses a proprietary model to determine the exchange rate. Inputs to the model include reported trades and implied bid/ask spreads. The daily valuation of exchange-traded foreign securities generally is determined as of the close of trading on the principal exchange on which such securities trade. Events occurring after the close of trading on foreign exchanges may result in adjustments to the valuation of foreign securities to more accurately reflect their fair value as of the close of regular trading on the New York Stock Exchange. When valuing foreign equity securities that meet certain criteria, the Portfolio's Trustees have approved the use of a fair value service that values such securities to reflect market trading that occurs after the close of the applicable foreign markets of comparable securities or other instruments that have a strong correlation to the fair-valued securities.
Other. Investments in management investment companies (including money market funds) that do not trade on an exchange are valued at the net asset value as of the close of each business day.
Fair Valuation. In connection with Rule 2a-5 of the 1940 Act, the Trustees have designated the Portfolio’s investment adviser as its valuation designee. Investments for which valuations or market quotations are not readily available or are deemed unreliable are valued by the investment adviser, as valuation designee, at fair value using methods that most fairly reflect the security’s “fair value”, which is the amount that the Portfolio might reasonably expect to receive for the security upon its current sale in the ordinary course. Each such determination is based on a consideration of relevant factors, which are likely to vary from one pricing context to another. These factors may include, but are not limited to, the type of security, the existence of any contractual restrictions on the security’s disposition, the price and extent of public trading in similar securities of the issuer or of comparable companies or entities, quotations or relevant information obtained from broker/dealers or other market participants, information obtained from the issuer, analysts, and/or the appropriate stock exchange (for exchange-traded securities), an analysis of the company’s or entity’s financial statements, and an evaluation of the forces that influence the issuer and the market(s) in which the security is purchased and sold.
B Investment Transactions—Investment transactions for financial statement purposes are accounted for on a trade date basis. Realized gains and losses on investments sold are determined on the basis of identified cost.
C Income—Dividend income is recorded on the ex-dividend date for dividends received in cash and/or securities. However, if the ex-dividend date has passed, certain dividends from foreign securities are recorded as the Portfolio is informed of the ex-dividend date. Withholding taxes on foreign dividends and capital gains have been provided for in accordance with the Fund’s understanding of the applicable countries’ tax rules and rates. In consideration of recent decisions rendered by European courts, the Portfolio has filed additional tax reclaims for previously withheld taxes on dividends earned in certain European Union countries. These filings are subject to various administrative and judicial proceedings within these countries. Due to the uncertainty as to the ultimate resolution of these proceedings, the likelihood of receipt of these reclaims, and the potential timing of payment, no amounts are reflected in the financial statements for such outstanding reclaims.
D Federal Taxes—The Portfolio has elected to be treated as a partnership for federal tax purposes. No provision is made by the Portfolio for federal or state taxes on any taxable income of the Portfolio because each investor in the Portfolio is ultimately responsible for the payment of any taxes on its share of taxable income. Since at least one of the Portfolio's investors is a regulated investment company that invests all or substantially all of its assets in the Portfolio, the Portfolio normally must satisfy the applicable source of income and diversification requirements (under the Internal Revenue Code) in order for its investors to satisfy them. The Portfolio will allocate, at least annually among its investors, each investor's distributive share of the Portfolio's net investment income, net realized capital gains and losses and any other items of income, gain, loss, deduction or credit.
Tax-Managed International Equity Portfolio
October 31, 2023
Notes to Financial Statements — continued
As of October 31, 2023, the Portfolio had no uncertain tax positions that would require financial statement recognition, de-recognition, or disclosure. The Portfolio files a U.S. federal income tax return annually after its fiscal year-end, which is subject to examination by the Internal Revenue Service for a period of three years from the date of filing.
E Foreign Currency Translation—Investment valuations, other assets, and liabilities initially expressed in foreign currencies are translated each business day into U.S. dollars based upon current exchange rates. Purchases and sales of foreign investment securities and income and expenses denominated in foreign currencies are translated into U.S. dollars based upon currency exchange rates in effect on the respective dates of such transactions. Recognized gains or losses on investment transactions attributable to changes in foreign currency exchange rates are recorded for financial statement purposes as net realized gains and losses on investments. That portion of unrealized gains and losses on investments that results from fluctuations in foreign currency exchange rates is not separately disclosed.
F Use of Estimates—The preparation of the financial statements in conformity with U.S. GAAP requires management to make estimates and assumptions that affect the reported amounts of assets and liabilities at the date of the financial statements and the reported amounts of income and expense during the reporting period. Actual results could differ from those estimates.
G Indemnifications—Under the Portfolio’s organizational documents, its officers and Trustees may be indemnified against certain liabilities and expenses arising out of the performance of their duties to the Portfolio. Under Massachusetts law, if certain conditions prevail, interestholders in the Portfolio could be deemed to have personal liability for the obligations of the Portfolio. However, the Portfolio’s Declaration of Trust contains an express disclaimer of liability on the part of Portfolio interestholders. Additionally, in the normal course of business, the Portfolio enters into agreements with service providers that may contain indemnification clauses. The Portfolio’s maximum exposure under these arrangements is unknown as this would involve future claims that may be made against the Portfolio that have not yet occurred.
2 Investment Adviser Fee and Other Transactions with Affiliates
The investment adviser fee is earned by Boston Management and Research (BMR), an indirect, wholly-owned subsidiary of Morgan Stanley, as compensation for investment advisory services rendered to the Portfolio. The fee is computed at an annual rate as a percentage of the Portfolio’s average daily net assets as follows and is payable monthly:
| Average Daily Net Assets | Annual Fee Rate |
| Up to $1 billion | 0.500% |
| $1 billion but less than $2.5 billion | 0.475% |
| $2.5 billion but less than $5 billion | 0.455% |
| $5 billion and over | 0.440% |
For the year ended October 31, 2023, the investment adviser fee amounted to $333,253 or 0.50% of the Portfolio’s average daily net assets. Pursuant to an investment sub-advisory agreement, BMR has delegated the investment management of the Portfolio to Parametric Portfolio Associates LLC (Parametric), an affiliate of BMR and an indirect, wholly-owned subsidiary of Morgan Stanley. BMR pays Parametric a portion of its investment adviser fee for sub-advisory services provided to the Portfolio. The Portfolio may invest in a money market fund, the Institutional Class of the Morgan Stanley Institutional Liquidity Funds - Government Portfolio (the “Liquidity Fund”), an open-end management investment company managed by Morgan Stanley Investment Management Inc., a wholly-owned subsidiary of Morgan Stanley. The investment adviser fee paid by the Portfolio is reduced by an amount equal to its pro rata share of the advisory and administration fees paid by the Portfolio due to its investment in the Liquidity Fund. For the year ended October 31, 2023, the investment adviser fee paid was reduced by $138 relating to the Portfolio's investment in the Liquidity Fund.
During the year ended October 31, 2023, BMR reimbursed the Portfolio $3,347 for a net realized loss due to a trading error. The amount of the reimbursement had an impact on total return of less than 0.01%.
Trustees and officers of the Portfolio who are members of BMR’s organization receive remuneration for their services to the Portfolio out of the investment adviser fee. Trustees of the Portfolio who are not affiliated with the investment adviser may elect to defer receipt of all or a percentage of their annual fees in accordance with the terms of the Trustees Deferred Compensation Plan. Certain officers and Trustees of the Portfolio are officers of the above organization.
3 Purchases and Sales of Investments
Purchases and sales of investments, other than short-term obligations, aggregated $23,777,909 and $26,464,343, respectively, for the year ended October 31, 2023.
Tax-Managed International Equity Portfolio
October 31, 2023
Notes to Financial Statements — continued
4 Federal Income Tax Basis of Investments
The cost and unrealized appreciation (depreciation) of investments of the Portfolio at October 31, 2023, as determined on a federal income tax basis, were as follows:
| Aggregate cost | $ 63,431,168 |
| Gross unrealized appreciation | $ 8,193,955 |
| Gross unrealized depreciation | (7,109,190) |
| Net unrealized appreciation | $ 1,084,765 |
5 Line of Credit
The Portfolio participates with other portfolios and funds managed by BMR and its affiliates in a $650 million unsecured revolving line of credit agreement with a group of banks, which is in effect through October 22, 2024. In connection with the renewal of the agreement on October 24, 2023, the borrowing limit was decreased from $725 million. Borrowings are made by the Portfolio solely for temporary purposes related to redemptions and other short-term cash needs. Interest is charged to the Portfolio based on its borrowings at an amount above either the Secured Overnight Financing Rate (SOFR) or Federal Funds rate. In addition, a fee computed at an annual rate of 0.15% on the daily unused portion of the line of credit is allocated among the participating portfolios and funds at the end of each quarter. In connection with the renewal of the agreement in October 2022, an arrangement fee totaling $150,000 was incurred that was allocated to the participating portfolios and funds. Because the line of credit is not available exclusively to the Portfolio, it may be unable to borrow some or all of its requested amounts at any particular time. The Portfolio did not have any significant borrowings or allocated fees during the year ended October 31, 2023.
6 Securities Lending Agreement
The Portfolio has established a securities lending agreement with State Street Bank and Trust Company (SSBT) as securities lending agent in which the Portfolio lends portfolio securities to qualified borrowers in exchange for collateral consisting of either cash or securities issued or guaranteed by the U.S. government or its agencies or instrumentalities in an amount at least equal to the market value of the securities on loan. The market value of securities loaned is determined daily and any additional required collateral is delivered to the Portfolio on the next business day. Cash collateral is invested in the State Street Navigator Securities Lending Government Money Market Portfolio, a money market fund registered under the 1940 Act. The Portfolio earns interest on the amount invested but it must pay (and at times receive from) the broker a loan rebate fee computed as a varying percentage of the collateral received. For security loans secured by non-cash collateral, the Portfolio earns a negotiated lending fee from the borrower. A portion of the income earned by the Portfolio from its investment of cash collateral, net of rebate fees, and lending fees received is allocated to SSBT for its services as lending agent and the portion allocated to the Portfolio is presented as securities lending income, net on the Statement of Operations. Non-cash collateral is held by the lending agent on behalf of the Portfolio and cannot be sold or re-pledged by the Portfolio; accordingly, such collateral is not reflected in the Statement of Assets and Liabilities.
The Portfolio is subject to possible delay in the recovery of loaned securities. Pursuant to the securities lending agreement, SSBT has provided indemnification to the Portfolio in the event of default by a borrower with respect to a loan. The Portfolio bears the risk of loss with respect to the investment of cash collateral.
At October 31, 2023, the value of the securities loaned and the value of the collateral received, which exceeded the value of the securities loaned, amounted to $3,769,096 and $4,045,361, respectively. Collateral received was comprised of cash of $2,204,773 and U.S. government and/or agencies securities of $1,840,588. The securities lending transactions have no contractual maturity date and each of the Portfolio and borrower has the option to terminate a loan at any time.
The following table provides a breakdown of securities lending transactions accounted for as secured borrowings, the obligations by class of collateral pledged, and the remaining contractual maturity of those transactions as of October 31, 2023.
| | Remaining Contractual Maturity of the Transactions |
| | Overnight and
Continuous | <30 days | 30 to 90 days | >90 days | Total |
| Common Stocks | $2,204,773 | $ — | $ — | $ — | $2,204,773 |
Tax-Managed International Equity Portfolio
October 31, 2023
Notes to Financial Statements — continued
The carrying amount of the liability for collateral for securities loaned at October 31, 2023 approximated its fair value. If measured at fair value, such liability would have been considered as Level 2 in the fair value hierarchy (see Note 8) at October 31, 2023.
7 Affiliated Investments
At October 31, 2023, the value of the Portfolio's investment in issuers and funds that may be deemed to be affiliated was $25,783, which represents 0.1% of the Portfolio's net assets. Transactions in such investments by the Portfolio for the year ended October 31, 2023 were as follows:
| Name | Value,
beginning
of period | Purchases | Sales
proceeds | Net
realized
gain (loss) | Change in
unrealized
appreciation
(depreciation) | Value, end
of period | Dividend
income | Shares,
end of period |
| Common Stocks |
| Mitsubishi UFJ Financial Group, Inc. | $136,519 | $ — | $ (206,765) | $ 54,003 | $ 16,243 | $ — | $ — | — |
| Short-Term Investments |
| Liquidity Fund | 161,268 | 5,062,187 | (5,197,672) | — | — | 25,783 | 4,964 | 25,783 |
| Total | | | | $54,003 | $16,243 | $25,783 | $4,964 | |
8 Fair Value Measurements
Under generally accepted accounting principles for fair value measurements, a three-tier hierarchy to prioritize the assumptions, referred to as inputs, is used in valuation techniques to measure fair value. The three-tier hierarchy of inputs is summarized in the three broad levels listed below.
| • | Level 1 – quoted prices in active markets for identical investments |
| • | Level 2 – other significant observable inputs (including quoted prices for similar investments, interest rates, prepayment speeds, credit risk, etc.) |
| • | Level 3 – significant unobservable inputs (including a fund's own assumptions in determining the fair value of investments) |
In cases where the inputs used to measure fair value fall in different levels of the fair value hierarchy, the level disclosed is determined based on the lowest level input that is significant to the fair value measurement in its entirety. The inputs or methodology used for valuing securities are not necessarily an indication of the risk associated with investing in those securities.
At October 31, 2023, the hierarchy of inputs used in valuing the Portfolio's investments, which are carried at fair value, were as follows:
| Asset Description | Level 1 | Level 2 | Level 3 | Total |
| Common Stocks: | | | | |
| Asia/Pacific | $ 567,010 | $ 18,767,811 | $ — | $ 19,334,821 |
| Developed Europe | 637,156 | 40,938,400 | — | 41,575,556 |
| Developed Middle East | 236,014 | 1,116,719 | — | 1,352,733 |
| Total Common Stocks | $ 1,440,180 | $ 60,822,930* | $ — | $62,263,110 |
| Preferred Stocks | $ — | $ 22,267 | $ — | $ 22,267 |
| Short-Term Investments: | | | | |
| Affiliated Fund | 25,783 | — | — | 25,783 |
| Securities Lending Collateral | 2,204,773 | — | — | 2,204,773 |
| Total Investments | $ 3,670,736 | $ 60,845,197 | $ — | $64,515,933 |
| * | Includes foreign equity securities whose values were adjusted to reflect market trading of comparable securities or other correlated instruments that occurred after the close of trading in their applicable foreign markets. |
Level 3 investments at the beginning and/or end of the period in relation to net assets were not significant and accordingly, a reconciliation of Level 3 assets for the year ended October 31, 2023 is not presented.
Tax-Managed International Equity Portfolio
October 31, 2023
Notes to Financial Statements — continued
9 Risks and Uncertainties
Risks Associated with Foreign Investments
Foreign investments can be adversely affected by political, economic and market developments abroad, including the imposition of economic and other sanctions by the United States or another country. There may be less publicly available information about foreign issuers because they may not be subject to reporting practices, requirements or regulations comparable to those to which United States companies are subject. Foreign markets may be smaller, less liquid and more volatile than the major markets in the United States. Trading in foreign markets typically involves higher expense than trading in the United States. The Portfolio may have difficulties enforcing its legal or contractual rights in a foreign country. Securities that trade or are denominated in currencies other than the U.S. dollar may be adversely affected by fluctuations in currency exchange rates.
Tax-Managed International Equity Portfolio
October 31, 2023
Report of Independent Registered Public Accounting Firm
To the Trustees and Investors of Tax-Managed International Equity Portfolio:
Opinion on the Financial Statements and Financial Highlights
We have audited the accompanying statement of assets and liabilities of Tax-Managed International Equity Portfolio (the “Portfolio”), including the portfolio of investments, as of October 31, 2023, the related statement of operations for the year then ended, the statements of changes in net assets for each of the two years in the period then ended, the financial highlights for each of the five years in the period then ended, and the related notes. In our opinion, the financial statements and financial highlights present fairly, in all material respects, the financial position of the Portfolio as of October 31, 2023, and the results of its operations for the year then ended, the changes in its net assets for each of the two years in the period then ended, and the financial highlights for each of the five years in the period then ended, in conformity with accounting principles generally accepted in the United States of America.
Basis for Opinion
These financial statements and financial highlights are the responsibility of the Portfolio’s management. Our responsibility is to express an opinion on the Portfolio’s financial statements and financial highlights based on our audits. We are a public accounting firm registered with the Public Company Accounting Oversight Board (United States) (PCAOB) and are required to be independent with respect to the Portfolio in accordance with the U.S. federal securities laws and the applicable rules and regulations of the Securities and Exchange Commission and the PCAOB.
We conducted our audits in accordance with the standards of the PCAOB. Those standards require that we plan and perform the audit to obtain reasonable assurance about whether the financial statements and financial highlights are free of material misstatement, whether due to error or fraud. The Portfolio is not required to have, nor were we engaged to perform, an audit of its internal control over financial reporting. As part of our audits, we are required to obtain an understanding of internal control over financial reporting but not for the purpose of expressing an opinion on the effectiveness of the Portfolio’s internal control over financial reporting. Accordingly, we express no such opinion.
Our audits included performing procedures to assess the risks of material misstatement of the financial statements and financial highlights, whether due to error or fraud, and performing procedures that respond to those risks. Such procedures included examining, on a test basis, evidence regarding the amounts and disclosures in the financial statements and financial highlights. Our audits also included evaluating the accounting principles used and significant estimates made by management, as well as evaluating the overall presentation of the financial statements and financial highlights. Our procedures included confirmation of securities owned as of October 31, 2023, by correspondence with the custodian and brokers; when replies were not received from brokers, we performed other auditing procedures. We believe that our audits provide a reasonable basis for our opinion.
/s/ Deloitte & Touche LLP
Boston, Massachusetts
December 19, 2023
We have served as the auditor of one or more Eaton Vance investment companies since 1959.
Parametric
Tax-Managed International Equity Fund
October 31, 2023
Board of Trustees’ Contract Approval
Overview of the Contract Review Process
The Investment Company Act of 1940, as amended (the “1940 Act”), provides, in substance, that the investment advisory agreement between a fund and its investment adviser will continue in effect from year-to-year only if its continuation is approved on an annual basis by a vote of the fund’s board of trustees, including a majority of the trustees who are not “interested persons” of the fund (“independent trustees”), cast in person at a meeting called for the purpose of considering such approval.
At a meeting held on June 8, 2023, the Boards of Trustees/Directors (collectively, the “Board”) that oversee the registered investment companies advised by Eaton Vance Management or its affiliate, Boston Management and Research (the “Eaton Vance Funds”), including a majority of the independent trustees (the “Independent Trustees”), voted to approve the continuation of existing investment advisory agreements and sub-advisory agreements1 for each of the Eaton Vance Funds for an additional one-year period. The Board relied upon the affirmative recommendation of its Contract Review Committee, which is a committee exclusively comprised of Independent Trustees. Prior to making its recommendation, the Contract Review Committee reviewed information furnished by the adviser and sub-adviser to each of the Eaton Vance Funds (including information specifically requested by the Board) for a series of formal meetings held between April and June 2023, as well as certain additional information provided in response to specific requests from the Independent Trustees as members of the Contract Review Committee. Members of the Contract Review Committee also considered information received at prior meetings of the Board and its committees, to the extent such information was relevant to the Contract Review Committee’s annual evaluation of the investment advisory agreements and sub-advisory agreements.
In connection with its evaluation of the investment advisory agreements and sub-advisory agreements, the Board considered various information relating to the Eaton Vance Funds. This included information applicable to all or groups of Eaton Vance Funds, which is referenced immediately below, and information applicable to the particular Eaton Vance Fund covered by this report (each “Eaton Vance Fund” is referred to below as a “fund”). (For funds that invest through one or more underlying portfolios, references to “each fund” in this section may include information that was considered at the portfolio-level.)
Information about Fees, Performance and Expenses
• A report from an independent data provider comparing advisory and other fees paid by each fund to such fees paid by comparable funds, as identified by the independent data provider (“comparable funds”);
• A report from an independent data provider comparing each fund’s total expense ratio (and its components) to those of comparable funds;
• A report from an independent data provider comparing the investment performance of each fund (including, as relevant, total return data, income data, Sharpe ratios and information ratios) to the investment performance of comparable funds and, as applicable, benchmark indices, over various time periods;
• In certain instances, data regarding investment performance relative to customized groups of peer funds and blended indices identified by the adviser in consultation with the Portfolio Management Committee of the Board (a committee exclusively comprised of Independent Trustees);
• Comparative information concerning the fees charged and services provided by the adviser and sub-adviser to each fund in managing other accounts (which may include other mutual funds, collective investment funds and institutional accounts) using investment strategies and techniques similar to those used in managing such fund(s), if any;
• Profitability analyses with respect to the adviser and sub-adviser to each of the funds;
Information about Portfolio Management and Trading
• Descriptions of the investment management services provided to each fund, as well as each of the funds’ investment strategies and policies;
• The procedures and processes used to determine the value of fund assets, including, when necessary, the determination of “fair value” and actions taken to monitor and test the effectiveness of such procedures and processes;
• Information about the policies and practices of each fund’s adviser and sub-adviser with respect to trading, including their processes for seeking best execution of portfolio transactions;
• Information about the allocation of brokerage transactions and the benefits, if any, received by the adviser and sub-adviser to each fund as a result of brokerage allocation, including, as applicable, information concerning the acquisition of research through client commission arrangements and policies with respect to “soft dollars”;
• Data relating to the portfolio turnover rate of each fund and related information regarding active management in the context of particular strategies;
Information about each Adviser and Sub-adviser
• Reports detailing the financial results and condition of the adviser and sub-adviser to each fund;
• Information regarding the individual investment professionals whose responsibilities include portfolio management and investment research for the funds, and, for portfolio managers and certain other investment professionals, information relating to their responsibilities with respect to managing other mutual funds and investment accounts, as applicable;
1 Not all Eaton Vance Funds have entered into a sub-advisory agreement with a sub-adviser. Accordingly, references to “sub-adviser” or “sub-advisory agreement” in this “Overview” section may not be applicable to the particular Eaton Vance Fund covered by this report.
Parametric
Tax-Managed International Equity Fund
October 31, 2023
Board of Trustees’ Contract Approval — continued
• Information regarding the adviser’s and its parent company’s (Morgan Stanley’s) efforts to retain and attract talented investment professionals, including in the context of a competitive marketplace for talent, as well as the ongoing unique environment presented by hybrid, remote and other alternative work arrangements;
• Information regarding the adviser’s compensation methodology for its investment professionals and the incentives and accountability it creates, along with investment professionals’ investments in the fund(s) they manage;
• The Code of Ethics of the adviser and its affiliates and the sub-adviser of each fund, together with information relating to compliance with, and the administration of, such codes;
• Policies and procedures relating to proxy voting, including regular reporting with respect to fund proxy voting activities;
• Information regarding the handling of corporate actions and class actions, as well as information regarding litigation and other regulatory matters;
• Information concerning the resources devoted to compliance efforts undertaken by the adviser and its affiliates and the sub-adviser of each fund, if any, including descriptions of their various compliance programs and their record of compliance;
• Information concerning the business continuity and disaster recovery plans of the adviser and its affiliates and the sub-adviser of each fund, if any;
• A description of Eaton Vance Management’s and Boston Management and Research’s oversight of sub-advisers, including with respect to regulatory and compliance issues, investment management and other matters;
Other Relevant Information
• Information regarding ongoing initiatives to further integrate and harmonize, where applicable, the investment management and other departments of the adviser and its affiliates with the overall investment management infrastructure of Morgan Stanley, in light of Morgan Stanley’s acquisition of Eaton Vance Corp. on March 1, 2021;
• Information concerning the nature, cost and character of the administrative and other non-investment advisory services provided by Eaton Vance Management and its affiliates;
• Information concerning oversight of the relationship with the custodian, subcustodians, fund accountants, and other third-party service providers by the adviser and/or administrator to each of the funds;
• Information concerning efforts to implement policies and procedures with respect to various recently adopted regulations applicable to the funds, including Rule 12d1-4 (the Fund-of-Funds Rule), Rule 18f-4 (the Derivatives Rule) and Rule 2a-5 (the Fair Valuation Rule);
• For an Eaton Vance Fund structured as an exchange-listed closed-end fund, information concerning the benefits of the closed-end fund structure, as well as, where relevant, the closed-end fund’s market prices (including as compared to the closed-end fund’s net asset value (NAV)), trading volume data, continued use of auction preferred shares (where applicable), distribution rates and other relevant matters;
• The risks which the adviser and/or its affiliates incur in connection with the management and operation of the funds, including, among others, litigation, regulatory, entrepreneurial, and other business risks (and the associated costs of such risks); and
The terms of each investment advisory agreement and sub-advisory agreement.
During the various meetings of the Board and its committees over the course of the year leading up to the June 8, 2023 meeting, the Board received information from portfolio managers and other investment professionals of the advisers and sub-advisers of the funds regarding investment and performance matters, and considered various investment and trading strategies used in pursuing the funds’ investment objectives. The Board also received information regarding risk management techniques employed in connection with the management of the funds. The Board and its committees evaluated issues pertaining to industry and regulatory developments, compliance procedures, fund governance and other issues with respect to the funds, and received and participated in reports and presentations provided by Eaton Vance Management, Boston Management and Research and fund sub-advisers, with respect to such matters. In addition to the formal meetings of the Board and its committees, the Independent Trustees held regular teleconferences to discuss, among other topics, matters relating to the continuation of investment advisory agreements and sub-advisory agreements.
The Contract Review Committee was advised throughout the contract review process by Goodwin Procter LLP, independent legal counsel for the Independent Trustees. The members of the Contract Review Committee, with the advice of such counsel, exercised their own business judgment in determining the material factors to be considered in evaluating each investment advisory agreement and sub-advisory agreement and the weight to be given to each such factor. The conclusions reached with respect to each investment advisory agreement and sub-advisory agreement were based on a comprehensive evaluation of all the information provided and not any single factor. Moreover, each member of the Contract Review Committee may have placed varying emphasis on particular factors in reaching conclusions with respect to each investment advisory agreement and sub-advisory agreement. In evaluating each investment advisory agreement and sub-advisory agreement, including the fee structures and other terms contained in such agreements, the members of the Contract Review Committee were also informed by multiple years of analysis and discussion with the adviser and sub-adviser to each of the Eaton Vance Funds.
Results of the Contract Review Process
Based on its consideration of the foregoing, and such other information it deemed relevant, including the factors and conclusions described below, the Contract Review Committee concluded that the continuation of the investment advisory agreement between Parametric Tax-Managed International Equity Fund (the “Fund”) and Eaton Vance Management (“EVM”), as well as the investment advisory agreement between Tax-Managed International Equity Portfolio (the “Portfolio”), the portfolio in which the Fund invests, and Boston Management and Research (“BMR”) (EVM, with respect to the Fund, and
Parametric
Tax-Managed International Equity Fund
October 31, 2023
Board of Trustees’ Contract Approval — continued
BMR, with respect to the Portfolio, are each referred to herein as the “Adviser”), and the sub-advisory agreement between EVM and Parametric Portfolio Associates LLC (the “Sub-adviser”), an affiliate of the Advisers, with respect to the Fund, and the sub-advisory agreement between BMR and the Sub-adviser, with respect to the Portfolio, including their respective fee structures, are in the interests of shareholders and, therefore, recommended to the Board approval of each agreement. Based on the recommendation of the Contract Review Committee, the Board, including a majority of the Independent Trustees, voted to approve continuation of the investment advisory agreements for the Fund and the Portfolio (together, the “investment advisory agreements”) and sub-advisory agreements for the Fund and the Portfolio (together, the “sub-advisory agreements”).
Nature, Extent and Quality of Services
In considering whether to approve the investment advisory agreements and sub-advisory agreements for the Fund and the Portfolio, the Board evaluated the nature, extent and quality of services provided to the Fund and to the Portfolio by the applicable Adviser and the Sub-adviser, respectively.
The Board considered each Adviser’s and the Sub-adviser’s management capabilities and investment processes in light of the types of investments held by the Fund and the Portfolio, including the education, experience and number of investment professionals and other personnel who provide portfolio management, investment research, and similar services to the Portfolio. Regarding each Adviser, the Board considered such Adviser’s responsibilities with respect to oversight of the Sub-adviser. The Board also considered each Adviser’s in-house equity research capabilities and experience in managing funds that seek to maximize after-tax returns. With respect to the Sub-adviser, the Board considered the Sub-adviser’s experience in deploying quantitative-based investment strategies. The Board also took into account the resources dedicated to portfolio management and other services, the compensation methods of each Adviser and other factors, including the reputation and resources of each Adviser to recruit and retain highly qualified research, advisory and supervisory investment professionals. In addition, the Board considered the time and attention devoted to the Eaton Vance Funds, including the Fund and the Portfolio, by senior management, as well as the infrastructure, operational capabilities and support staff in place to assist in the portfolio management and operations of the Fund and the Portfolio, including the provision of administrative services. The Board also considered the business-related and other risks to which each Adviser or its affiliates may be subject in managing the Fund and the Portfolio.
The Board noted that, under the terms of the investment advisory agreement of the Fund, EVM may invest assets of the Fund directly in securities, for which it would receive a fee, or in the Portfolio, for which it receives no separate fee but for which BMR receives an advisory fee from the Portfolio.
The Board considered the compliance programs of each Adviser and relevant affiliates thereof, including the Sub-adviser. The Board considered compliance and reporting matters regarding, among other things, personal trading by investment professionals, disclosure of portfolio holdings, late trading, frequent trading, portfolio valuation, business continuity and the allocation of investment opportunities. The Board also considered the responses of each Adviser and its affiliates to requests in recent years from regulatory authorities, such as the Securities and Exchange Commission and the Financial Industry Regulatory Authority.
The Board considered other administrative services provided or overseen by EVM and its affiliates, including transfer agency and accounting services. The Board evaluated the benefits to shareholders of investing in a fund that is a part of a large fund complex offering exposure to a variety of asset classes and investment disciplines, as well as the ability, in many cases, to exchange an investment among different funds without incurring additional sales charges.
After consideration of the foregoing factors, among others, the Board concluded that the nature, extent and quality of services provided by each Adviser and the Sub-adviser, taken as a whole, are appropriate and consistent with the terms of the applicable investment advisory agreement and the applicable sub-advisory agreement.
Fund Performance
The Board compared the Fund’s investment performance to that of comparable funds identified by an independent data provider (the peer group), as well as an appropriate benchmark index. The Board’s review included comparative performance data with respect to the Fund for the one-, three-, five- and ten-year periods ended December 31, 2022. In this regard, the Board noted that the performance of the Fund was consistent with the median performance of the Fund’s peer group for the three-year period. The Board also noted that the performance of the Fund was lower than its benchmark index for the three-year period. The Board concluded that the performance of the Fund was satisfactory.
Management Fees and Expenses
The Board considered contractual fee rates payable by the Portfolio and by the Fund for advisory and administrative services (referred to collectively as “management fees”). As part of its review, the Board considered the Fund’s management fees and total expense ratio for the one-year period ended December 31, 2022, as compared to those of comparable funds, before and after giving effect to any undertaking to waive fees or reimburse expenses. The Board also considered factors that had an impact on the Fund’s total expense ratio relative to comparable funds.
After considering the foregoing information, and in light of the nature, extent and quality of the services provided by each Adviser and the Sub-adviser, the Board concluded that the management fees charged for advisory and related services are reasonable.
Parametric
Tax-Managed International Equity Fund
October 31, 2023
Board of Trustees’ Contract Approval — continued
Profitability and “Fall-Out” Benefits
The Board considered the level of profits realized by each Adviser and relevant affiliates thereof, including the Sub-adviser, in providing investment advisory and administrative services to the Fund, to the Portfolio and to all Eaton Vance Funds as a group. The Board considered the level of profits realized without regard to marketing support or other payments by each Adviser and its affiliates to third parties in respect of distribution or other services.
The Board concluded that, in light of the foregoing factors and the nature, extent and quality of the services rendered, the profits realized by each Adviser and its affiliates, including the Sub-adviser, are deemed not to be excessive.
The Board also considered direct or indirect fall-out benefits received by each Adviser and its affiliates, including the Sub-adviser, in connection with their respective relationships with the Fund and the Portfolio, including the benefits of research services that may be available to each Adviser or the Sub-adviser as a result of securities transactions effected for the Fund and the Portfolio and other investment advisory clients.
Economies of Scale
In reviewing management fees and profitability, the Board also considered the extent to which the applicable Adviser and its affiliates, on the one hand, and the Fund and the Portfolio, on the other hand, can expect to realize benefits from economies of scale as the assets of the Fund and the Portfolio increase. The Board acknowledged the difficulty in accurately measuring the benefits resulting from economies of scale, if any, with respect to the management of any specific fund or group of funds. The Board reviewed data summarizing the increases and decreases in the assets of the Fund and of all Eaton Vance Funds as a group over various time periods, and evaluated the extent to which the total expense ratio of the Fund and the profitability of each Adviser and its affiliates may have been affected by such increases or decreases. Based upon the foregoing, the Board concluded that the Fund currently shares in the benefits from economies of scale, if any, when they are realized by each Adviser. The Board also concluded that the structure of the advisory fees, which include breakpoints at several asset levels, will allow the Fund and the Portfolio to continue to benefit from any economies of scale in the future.
Parametric
Tax-Managed International Equity Fund
October 31, 2023
Liquidity Risk Management Program
The Fund has implemented a written liquidity risk management program (Program) and related procedures to manage its liquidity in accordance with Rule 22e-4 under the Investment Company Act of 1940, as amended (Liquidity Rule). The Liquidity Rule defines “liquidity risk” as the risk that a fund could not meet requests to redeem shares issued by the fund without significant dilution of the remaining investors’ interests in the fund. The Fund’s Board of Trustees/Directors has designated the investment adviser to serve as the administrator of the Program and the related procedures. The administrator has established a Liquidity Risk Management Oversight Committee (Committee) to perform the functions necessary to administer the Program. As part of the Program, the administrator is responsible for identifying illiquid investments and categorizing the relative liquidity of the Fund’s investments in accordance with the Liquidity Rule. Under the Program, the administrator assesses, manages, and periodically reviews the Fund’s liquidity risk, and is responsible for making certain reports to the Fund’s Board of Trustees/Directors and the Securities and Exchange Commission (SEC) regarding the liquidity of the Fund’s investments, and to notify the Board of Trustees/Directors and the SEC of certain liquidity events specified in the Liquidity Rule. The liquidity of the Fund’s portfolio investments is determined based on a number of factors including, but not limited to, relevant market, trading and investment-specific considerations under the Program.
At a meeting of the Fund’s Board of Trustees/Directors on June 7, 2023, the Committee provided a written report to the Fund’s Board of Trustees/
Directors pertaining to the operation, adequacy, and effectiveness of implementation of the Program, as well as the operation of the highly liquid investment minimum (if applicable) for the period January 1, 2022 through December 31, 2022 (Review Period). The Program operated effectively during the Review Period, supporting the administrator’s ability to assess, manage and monitor Fund liquidity risk, including during periods of market volatility and net redemptions. During the Review Period, the Fund met redemption requests on a timely basis.
There can be no assurance that the Program will achieve its objectives in the future. Please refer to the Fund’s prospectus for more information regarding the Fund’s exposure to liquidity risk and other principal risks to which an investment in the Fund may be subject.
Parametric
Tax-Managed International Equity Fund
October 31, 2023
Management and Organization
Fund Management. The Trustees of Eaton Vance Mutual Funds Trust (the Trust) and Tax-Managed International Equity Portfolio (the Portfolio) are responsible for the overall management and supervision of the Trust's and the Portfolio's affairs. The Board members and officers of the Trust and the Portfolio are listed below. Except as indicated, each individual has held the office shown or other offices in the same company for the last five years. Board members hold indefinite terms of office. Each Trustee holds office until his or her successor is elected and qualified, subject to a prior death, resignation, retirement, disqualification or removal. Under the terms of the Fund's and the Portfolio's current Trustee retirement policy, an Independent Trustee must retire and resign as a Trustee on the earlier of: (i) the first day of July following his or her 74th birthday; or (ii), with limited exception, December 31st of the 20th year in which he or she has served as a Trustee. However, if such retirement and resignation would cause the Fund and the Portfolio to be out of compliance with Section 16 of the 1940 Act or any other regulations or guidance of the SEC, then such retirement and resignation will not become effective until such time as action has been taken for the Fund and the Portfolio to be in compliance therewith. The “noninterested Trustees” consist of those Trustees who are not “interested persons” of the Trust and the Portfolio, as that term is defined under the 1940 Act. The business address of each Board member and officer is Two International Place, Boston, Massachusetts 02110. As used below, “BMR” refers to Boston Management and Research, “EV” refers to EV LLC, “EVM” refers to Eaton Vance Management, “MSIM" refers to Morgan Stanley Investment Management Inc. and “EVD” refers to Eaton Vance Distributors, Inc. EV is the trustee of each of EVM and BMR. Each of EVM, BMR, EVD and EV are indirect, wholly owned subsidiaries of Morgan Stanley. Each officer affiliated with EVM may hold a position with other EVM affiliates that is comparable to his or her position with EVM listed below. Each Trustee oversees 127 funds in the Eaton Vance fund complex (including both funds and portfolios in a hub and spoke structure).
| Name and Year of Birth | Trust/Portfolio
Position(s) | Length of Service | Principal Occupation(s) and Other Directorships
During Past Five Years and Other Relevant Experience |
| Interested Trustee |
Anchal Pachnanda(1)
1980 | Trustee | Since 2023 | Co-Head of Strategy of MSIM (since 2019). Formerly, Head of Strategy of MSIM (2017-2019). Ms. Pachnanda is an interested person because of her position with MSIM, which is an affiliate of the Trust.
Other Directorships. None. |
| Noninterested Trustees |
Alan C. Bowser
1962 | Trustee | Since 2022 | Private investor. Formerly, Chief Diversity Officer, Partner and a member of the Operating Committee, and formerly served as Senior Advisor on Diversity and Inclusion for the firm’s chief executive officer, Co-Head of the Americas Region, and Senior Client Advisor of Bridgewater Associates, an asset management firm (2011- 2023).
Other Directorships. Independent Director of Stout Risius Ross (a middle market professional services advisory firm) (since 2021). |
Mark R. Fetting
1954 | Trustee | Since 2016 | Private investor. Formerly held various positions at Legg Mason, Inc. (investment management firm) (2000-2012), including President, Chief Executive Officer, Director and Chairman (2008-2012), Senior Executive Vice President (2004-2008) and Executive Vice President (2001-2004). Formerly, President of Legg Mason family of funds (2001-2008). Formerly, Division President and Senior Officer of Prudential Financial Group, Inc. and related companies (investment management firm) (1991-2000).
Other Directorships. None. |
Cynthia E. Frost
1961 | Trustee | Since 2014 | Private investor. Formerly, Chief Investment Officer of Brown University (university endowment) (2000-2012). Formerly, Portfolio Strategist for Duke Management Company (university endowment manager) (1995-2000). Formerly, Managing Director, Cambridge Associates (investment consulting company) (1989-1995). Formerly, Consultant, Bain and Company (management consulting firm) (1987-1989). Formerly, Senior Equity Analyst, BA Investment Management Company (1983-1985).
Other Directorships. None. |
George J. Gorman
1952 | Chairperson
of the Board
and Trustee | Since 2021
(Chairperson) and
2014 (Trustee) | Principal at George J. Gorman LLC (consulting firm). Formerly, Senior Partner at Ernst & Young LLP (a registered public accounting firm) (1974-2009).
Other Directorships. None. |
Parametric
Tax-Managed International Equity Fund
October 31, 2023
Management and Organization — continued
| Name and Year of Birth | Trust/Portfolio
Position(s) | Length of Service | Principal Occupation(s) and Other Directorships
During Past Five Years and Other Relevant Experience |
| Noninterested Trustees (continued) |
Valerie A. Mosley
1960 | Trustee | Since 2014 | Chairwoman and Chief Executive Officer of Valmo Ventures (a consulting and investment firm). Founder of Upward Wealth, Inc., dba BrightUp, a fintech platform. Formerly, Partner and Senior Vice President, Portfolio Manager and Investment Strategist at Wellington Management Company, LLP (investment management firm) (1992-2012). Formerly, Chief Investment Officer, PG Corbin Asset Management (1990-1992). Formerly worked in institutional corporate bond sales at Kidder Peabody (1986-1990).
Other Directorships. Director of DraftKings, Inc. (digital sports entertainment and gaming company) (since September 2020). Director of Envestnet, Inc. (provider of intelligent systems for wealth management and financial wellness) (since 2018). Formerly, Director of Dynex Capital, Inc. (mortgage REIT) (2013-2020) and Director of Groupon, Inc. (e-commerce provider) (2020-2022). |
Keith Quinton
1958 | Trustee | Since 2018 | Private investor, researcher and lecturer. Formerly, Independent Investment Committee Member at New Hampshire Retirement System (2017-2021). Formerly, Portfolio Manager and Senior Quantitative Analyst at Fidelity Investments (investment management firm) (2001-2014).
Other Directorships. Formerly, Director (2016-2021) and Chairman (2019-2021) of New Hampshire Municipal Bond Bank. |
Marcus L. Smith
1966 | Trustee | Since 2018 | Private investor and independent corporate director. Formerly, Chief Investment Officer, Canada (2012-2017), Chief Investment Officer, Asia (2010-2012), Director of Asian Research (2004-2010) and portfolio manager (2001-2017) at MFS Investment Management (investment management firm).
Other Directorships. Director of First Industrial Realty Trust, Inc. (an industrial REIT) (since 2021). Director of MSCI Inc. (global provider of investment decision support tools) (since 2017). Formerly, Director of DCT Industrial Trust Inc. (logistics real estate company) (2017-2018). |
Susan J. Sutherland
1957 | Trustee | Since 2015 | Private investor. Director of Ascot Group Limited and certain of its subsidiaries (insurance and reinsurance) (since 2017). Formerly, Director of Hagerty Holding Corp. (insurance) (2015-2018) and Montpelier Re Holdings Ltd. (insurance and reinsurance) (2013-2015). Formerly, Associate, Counsel and Partner at Skadden, Arps, Slate, Meagher & Flom LLP (law firm) (1982-2013).
Other Directorships. Formerly, Director of Kairos Acquisition Corp. (insurance/InsurTech acquisition company) (2021-2023). |
Scott E. Wennerholm
1959 | Trustee | Since 2016 | Private investor. Formerly, Trustee at Wheelock College (postsecondary institution) (2012-2018). Formerly, Consultant at GF Parish Group (executive recruiting firm) (2016-2017). Formerly, Chief Operating Officer and Executive Vice President at BNY Mellon Asset Management (investment management firm) (2005-2011). Formerly, Chief Operating Officer and Chief Financial Officer at Natixis Global Asset Management (investment management firm) (1997-2004). Formerly, Vice President at Fidelity Investments Institutional Services (investment management firm) (1994-1997).
Other Directorships. None. |
Nancy A. Wiser
1967 | Trustee | Since 2022 | Formerly, Executive Vice President and the Global Head of Operations at Wells Fargo Asset Management (2011-2021).
Other Directorships. None. |
| Name and Year of Birth | Trust/Portfolio
Position(s) | Length of Service | Principal Occupation(s)
During Past Five Years |
| Principal Officers who are not Trustees |
Kenneth A. Topping
1966 | President of the Trust | Since 2023 | Vice President and Chief Administrative Officer of EVM and BMR and Chief Operating Officer for Public Markets at MSIM. Also Vice President of Calvert Research and Management (“CRM”) since 2021. Formerly, Chief Operating Officer for Goldman Sachs Asset Management ‘Classic’ (2009-2020). |
R. Kelly Williams, Jr.
1971 | President of the Portfolio | Since 2023 | President and Chief Operating Officer of Atlanta Capital Management Company, LLC. Officer of 21 registered investment companies managed by Eaton Vance or BMR. |
Deidre E. Walsh
1971 | Vice President and
Chief Legal Officer | Since 2009 | Vice President of EVM and BMR. Also Vice President of CRM. |
Parametric
Tax-Managed International Equity Fund
October 31, 2023
Management and Organization — continued
| Name and Year of Birth | Trust/Portfolio
Position(s) | Length of Service | Principal Occupation(s)
During Past Five Years |
| Principal Officers who are not Trustees (continued) |
James F. Kirchner
1967 | Treasurer | Since 2007 | Vice President of EVM and BMR. Also Vice President of CRM. |
Nicholas S. Di Lorenzo
1987 | Secretary | Since 2022 | Formerly, associate (2012-2021) and counsel (2022) at Dechert LLP. |
Richard F. Froio
1968 | Chief Compliance
Officer | Since 2017 | Vice President of EVM and BMR since 2017. Formerly, Deputy Chief Compliance Officer (Adviser/Funds) and Chief Compliance Officer (Distribution) at PIMCO (2012-2017) and Managing Director at BlackRock/Barclays Global Investors (2009-2012). |
(1) Ms. Pachnanda began serving as Trustee effective April 1, 2023.
The SAI for the Fund includes additional information about the Trustees and officers of the Fund and the Portfolio and can be obtained without charge on Eaton Vance’s website at www.eatonvance.com or by calling 1-800-260-0761.
| FACTS | WHAT DOES EATON VANCE DO WITH YOUR
PERSONAL INFORMATION? |
| Why? | Financial companies choose how they share your personal information. Federal law gives consumers the right to limit some but not all sharing. Federal law also requires us to tell you how we collect, share, and protect your personal information. Please read this notice carefully to understand what we do. |
| |
| What? | The types of personal information we collect and share depend on the product or service you have with us. This information can include:■ Social Security number and income
■ investment experience and risk tolerance
■ checking account number and wire transfer instructions |
| |
| How? | All financial companies need to share customers’ personal information to run their everyday business. In the section below, we list the reasons financial companies can share their customers’ personal information; the reasons Eaton Vance chooses to share; and whether you can limit this sharing. |
Reasons we can share your
personal information | Does Eaton Vance
share? | Can you limit
this sharing? |
| For our everyday business purposes — such as to process your transactions, maintain your account(s), respond to court orders and legal investigations, or report to credit bureaus | Yes | No |
| For our marketing purposes — to offer our products and services to you | Yes | No |
| For joint marketing with other financial companies | No | We don’t share |
| For our investment management affiliates’ everyday business purposes — information about your transactions, experiences, and creditworthiness | Yes | Yes |
| For our affiliates’ everyday business purposes — information about your transactions and experiences | Yes | No |
| For our affiliates’ everyday business purposes — information about your creditworthiness | No | We don’t share |
| For our investment management affiliates to market to you | Yes | Yes |
| For our affiliates to market to you | No | We don’t share |
| For nonaffiliates to market to you | No | We don’t share |
To limit our
sharing | Call toll-free 1-800-262-1122 or email: EVPrivacy@eatonvance.comPlease note:If you are a new customer, we can begin sharing your information 30 days from the date we sent this notice. When you are no longer our customer, we continue to share your information as described in this notice. However, you can contact us at any time to limit our sharing. |
| Questions? | Call toll-free 1-800-262-1122 or email: EVPrivacy@eatonvance.com |
| Privacy Notice — continued | April 2021 |
| Who we are |
| Who is providing this notice? | Eaton Vance Management, Eaton Vance Distributors, Inc., Eaton Vance Trust Company, Eaton Vance Management (International) Limited, Eaton Vance Advisers International Ltd., Eaton Vance Global Advisors Limited, Eaton Vance Management’s Real Estate Investment Group, Boston Management and Research, Calvert Research and Management, Eaton Vance and Calvert Fund Families and our investment advisory affiliates (“Eaton Vance”) (see Investment Management Affiliates definition below) |
| What we do |
How does Eaton Vance
protect my personal
information? | To protect your personal information from unauthorized access and use, we use security measures that comply with federal law. These measures include computer safeguards and secured files and buildings. We have policies governing the proper handling of customer information by personnel and requiring third parties that provide support to adhere to appropriate security standards with respect to such information. |
How does Eaton Vance
collect my personal
information? | We collect your personal information, for example, when you■ open an account or make deposits or withdrawals from your account
■ buy securities from us or make a wire transfer
■ give us your contact informationWe also collect your personal information from others, such as credit bureaus, affiliates, or other companies. |
| Why can’t I limit all sharing? | Federal law gives you the right to limit only■ sharing for affiliates’ everyday business purposes — information about your creditworthiness
■ affiliates from using your information to market to you
■ sharing for nonaffiliates to market to youState laws and individual companies may give you additional rights to limit sharing. See below for more on your rights under state law. |
| Definitions |
Investment Management
Affiliates | Eaton Vance Investment Management Affiliates include registered investment advisers, registered broker- dealers, and registered and unregistered funds. Investment Management Affiliates does not include entities associated with Morgan Stanley Wealth Management, such as Morgan Stanley Smith Barney LLC and Morgan Stanley & Co. |
| Affiliates | Companies related by common ownership or control. They can be financial and nonfinancial companies.■ Our affiliates include companies with a Morgan Stanley name and financial companies such as Morgan Stanley Smith Barney LLC and Morgan Stanley & Co. |
| Nonaffiliates | Companies not related by common ownership or control. They can be financial and nonfinancial companies.■ Eaton Vance does not share with nonaffiliates so they can market to you. |
| Joint marketing | A formal agreement between nonaffiliated financial companies that together market financial products or services to you.■ Eaton Vance doesn’t jointly market. |
| Other important information |
| Vermont: Except as permitted by law, we will not share personal information we collect about Vermont residents with Nonaffiliates unless you provide us with your written consent to share such information.California: Except as permitted by law, we will not share personal information we collect about California residents with Nonaffiliates and we will limit sharing such personal information with our Affiliates to comply with California privacy laws that apply to us. |
Delivery of Shareholder Documents. The Securities and Exchange Commission (SEC) permits funds to deliver only one copy of shareholder documents, including prospectuses, proxy statements and shareholder reports, to fund investors with multiple accounts at the same residential or post office box address. This practice is often called “householding” and it helps eliminate duplicate mailings to shareholders. Eaton Vance, or your financial intermediary, may household the mailing of your documents indefinitely unless you instruct Eaton Vance, or your financial intermediary, otherwise. If you would prefer that your Eaton Vance documents not be householded, please contact Eaton Vance at 1-800-260-0761, or contact your financial intermediary. Your instructions that householding not apply to delivery of your Eaton Vance documents will typically be effective within 30 days of receipt by Eaton Vance or your financial intermediary.
Portfolio Holdings. Each Eaton Vance Fund and its underlying Portfolio(s) (if applicable) files a schedule of portfolio holdings on Part F to Form N-PORT with the SEC. Certain information filed on Form N-PORT may be viewed on the Eaton Vance website at www.eatonvance.com, by calling Eaton Vance at 1-800-260-0761 or in the EDGAR database on the SEC’s website at www.sec.gov.
Proxy Voting. From time to time, funds are required to vote proxies related to the securities held by the funds. The Eaton Vance Funds or their underlying Portfolios (if applicable) vote proxies according to a set of policies and procedures approved by the Funds’ and Portfolios’ Boards. You may obtain a description of these policies and procedures and information on how the Funds or Portfolios voted proxies relating to portfolio securities during the most recent 12-month period ended June 30, without charge, upon request, by calling 1-800-260-0761 and by accessing the SEC’s website at www.sec.gov.
Tailored Shareholder Reports. Effective January 24, 2023, the SEC adopted rule and form amendments to require open-end mutual funds and ETFs to transmit concise and visually engaging streamlined annual and semiannual reports to shareholders that highlight key information. Other information, including financial statements, will no longer appear in a streamlined shareholder report but must be available online, delivered free of charge upon request, and filed on a semiannual basis on Form N-CSR. The rule and form amendments have a compliance date of July 24, 2024. At this time, management is evaluating the impact of these amendments on the shareholder reports for the Eaton Vance Funds.
This Page Intentionally Left Blank
This Page Intentionally Left Blank
Investment Adviser of Tax-Managed International Equity Portfolio
Boston Management and Research
Two International Place
Boston, MA 02110
Investment Sub-Adviser of Parametric Tax-Managed International
Equity Fund and Tax-Managed International Equity Portfolio
Parametric Portfolio Associates LLC
800 Fifth Avenue, Suite 2800
Seattle, WA 98104
Investment Adviser and Administrator of Parametric Tax-Managed
International Equity Fund
Eaton Vance Management
Two International Place
Boston, MA 02110
Principal Underwriter*
Eaton Vance Distributors, Inc.
Two International Place
Boston, MA 02110
(617) 482-8260
Custodian
State Street Bank and Trust Company
One Congress Street, Suite 1
Boston, MA 02114-2016
Transfer Agent
BNY Mellon Investment Servicing (US) Inc.
Attn: Eaton Vance Funds
P.O. Box 534439
Pittsburgh, PA 15253-4439
(800) 260-0761
Independent Registered Public Accounting Firm
Deloitte & Touche LLP
200 Berkeley Street
Boston, MA 02116-5022
Fund Offices
Two International Place
Boston, MA 02110
*FINRA BrokerCheck. Investors may check the background of their Investment Professional by contacting the Financial Industry Regulatory Authority (FINRA). FINRA BrokerCheck is a free tool to help investors check the professional background of current and former FINRA-registered securities firms and brokers. FINRA BrokerCheck is available by calling 1-800-289-9999 and at www.FINRA.org. The FINRA BrokerCheck brochure describing this program is available to investors at www.FINRA.org.
Eaton Vance
Tax-Managed Multi-Cap Growth Fund
Annual Report
October 31, 2023
Commodity Futures Trading Commission Registration. The Commodity Futures Trading Commission (“CFTC”) has adopted regulations that subject registered investment companies and advisers to regulation by the CFTC if a fund invests more than a prescribed level of its assets in certain CFTC-regulated instruments (including futures, certain options and swap agreements) or markets itself as providing investment exposure to such instruments. The investment adviser has claimed an exclusion from the definition of “commodity pool operator” under the Commodity Exchange Act with respect to its management of the Fund. Accordingly, neither the Fund nor the adviser with respect to the operation of the Fund is subject to CFTC regulation. Because of its management of other strategies, the Fund's adviser is registered with the CFTC as a commodity pool operator. The adviser is also registered as a commodity trading advisor.
Fund shares are not insured by the FDIC and are not deposits or other obligations of, or guaranteed by, any depository institution. Shares are subject to investment risks, including possible loss of principal invested.
This report must be preceded or accompanied by a current summary prospectus or prospectus. Before investing, investors should consider carefully the investment objective, risks, and charges and expenses of a mutual fund. This and other important information is contained in the summary prospectus and prospectus, which can be obtained from a financial intermediary. Prospective investors should read the prospectus carefully before investing. For further information, please call 1-800-262-1122.
Annual Report October 31, 2023
Eaton Vance
Tax-Managed Multi-Cap Growth Fund
Eaton Vance
Tax-Managed Multi-Cap Growth Fund
October 31, 2023
Management’s Discussion of Fund Performance†
Economic and Market Conditions
For U.S. equity investors, the 12-month period ended October 31, 2023, was a roller-coaster ride, driven largely by shifting perceptions of whether the U.S. Federal Reserve (the Fed) could bring the world’s largest economy in for a soft landing, and changing expectations of how long interest rates might remain high.
During the opening month of the period, stocks rallied on strong corporate earnings, attractive valuations, and hope the Fed might slow the pace of its interest rate hikes. But in December 2022, equities lost ground as “higher for longer” interest rate fears returned. A continuing irony throughout the period was that good economic news -- record low unemployment, strong job creation, and robust consumer spending -- was viewed as bad news for inflation and fuel for future rate hikes that could weigh on stock prices.
In January 2023, however, U.S. equities began a rally that lasted through July. The initial tailwind was ChatGPT, an artificial intelligence (AI) application that led investors to perceive AI might become the next big innovation to drive the information technology (IT) sector. As a result, IT -- one of the worst-performing sectors in 2022 -- became the standout sector of the first half of 2023. Earlier recession fears that had weighed on stock prices receded as many investors came around to the view that the U.S. economy was doing surprisingly well.
But in the final three months of the period, the bond market halted the stock market’s momentum. As it became clear the Fed would keep rates higher for longer than investors had anticipated just a few months earlier, longer-term bond interest rates rose sharply. Given the potential for relatively attractive returns with lower risk than stocks, many investors shifted from equity assets to bonds. In the final two days of the period, however, signs of a stock rally emerged as investors began to believe the Fed might have reached the end of its monetary tightening cycle.
For the period as a whole, however, U.S. equity performance was solid. The S&P 500® Index, a broad measure of U.S. stocks, returned 10.14%; the blue-chip Dow Jones Industrial Average® returned 3.17%; and the tech-heavy Nasdaq Composite Index returned 17.99%.
Fund Performance
For the 12-month period ended October 31, 2023, Eaton Vance Tax-Managed Multi-Cap Growth Fund (the Fund) returned 18.66% for Class A shares at net asset value (NAV), outperforming its benchmark, the Russell 3000® Growth Index (the Index), which returned 17.32%.
Security selections overall in the Fund contributed to performance relative to the Index during the period. Selections in the consumer discretionary, communication services, and industrials sectors especially added to Index-relative returns. Selections in information technology, however, detracted.
On an individual stock basis, Meta Platforms, Inc. (Meta) -- the social media giant that includes Facebook, Instagram, Messenger, and WhatsApp -- was a leading contributor to Index-relative performance. Meta’s share price rose as investors responded positively to the company’s focus on efficiency and cost reduction during the period.
Not owning Tesla, Inc. -- an Index component -- also contributed to relative returns as the electric car maker reduced its prices in response to stiffer competition, and as earnings fell during the period.
The Fund’s position in Adobe, Inc. (Adobe), a developer of software for graphic design, contributed to Index-relative returns. Adobe’s share price rose as the public’s fascination with artificial intelligence, or AI, grew during the period.
In contrast, the Fund’s underweight exposure to NVIDIA Corp. (NVIDIA), a manufacturer of semiconductor chips, was the leading individual detractor from Index-relative returns during the period. NVIDIA’s share price rose alongside burgeoning interest in AI that drove demand for microchips higher.
Not owning Broadcom, Inc. (Broadcom) -- a developer of semiconductors used in the wireless, networking, server storage, and industrial markets -- also weighed on Index-relative performance. Broadcom’s share price rose during the period on strong demand for its microchips propelled by the AI trend. The Fund did own other semiconductor and software stocks with similar end-market exposures during the period.
Not owning Eli Lilly & Co. (Eli Lilly) -- a global pharmaceutical company specializing in diabetes, oncology, and immunology therapies -- detracted from Index-relative returns during the period. Eli Lilly’s share price began climbing in March 2023 and spiked in August after the company reported strong second-quarter earnings, driven in part by sales of its diabetes drug, Mounjaro.
See Endnotes and Additional Disclosures in this report.
Past performance is no guarantee of future results. Returns are historical and are calculated by determining the percentage change in net asset value (NAV) or offering price (as applicable) with all distributions reinvested. Furthermore, returns do not reflect the deduction of taxes that shareholders may have to pay on Fund distributions or upon the redemption of Fund shares. Investment return and principal value will fluctuate so that shares, when redeemed, may be worth more or less than their original cost. Performance for periods less than or equal to one year is cumulative. Performance is for the stated time period only; due to market volatility, current Fund performance may be lower or higher than the quoted return. For performance as of the most recent month-end, please refer to eatonvance.com.
Eaton Vance
Tax-Managed Multi-Cap Growth Fund
October 31, 2023
Performance
Portfolio Manager(s) Douglas R. Rogers, CFA, CMT
| % Average Annual Total Returns1,2 | Class
Inception Date | Performance
Inception Date | One Year | Five Years | Ten Years |
| Class A at NAV | 06/30/2000 | 06/30/2000 | 18.66% | 10.45% | 10.43% |
| Class A with 5.25% Maximum Sales Charge | — | — | 12.43 | 9.27 | 9.84 |
| Class C at NAV | 07/10/2000 | 07/10/2000 | 17.74 | 9.62 | 9.76 |
| Class C with 1% Maximum Deferred Sales Charge | — | — | 16.74 | 9.62 | 9.76 |
|
| Russell 3000® Growth Index | — | — | 17.32% | 13.48% | 13.27% |
| S&P 500® Index | — | — | 10.14 | 11.00 | 11.17 |
| % After-Tax Returns with Maximum Sales Charge2 | Class
Inception Date | Performance
Inception Date | One Year | Five Years | Ten Years |
| Class A After Taxes on Distributions | 06/30/2000 | 06/30/2000 | 18.66% | 8.80% | 9.59% |
| Class A After Taxes on Distributions and Sale of Fund Shares | — | — | 11.04 | 7.38 | 8.15 |
| Class C After Taxes on Distributions | 07/10/2000 | 07/10/2000 | 16.74 | 9.06 | 9.49 |
| Class C After Taxes on Distributions and Sale of Fund Shares | — | — | 9.91 | 7.69 | 8.09 |
| % Total Annual Operating Expense Ratios3 | Class A | Class C |
| | 1.28% | 2.03% |
Growth of $10,000
This graph shows the change in value of a hypothetical investment of $10,000 in Class A of the Fund for the period indicated. For comparison, the same investment is shown in the indicated index.
| Growth of Investment | Amount Invested | Period Beginning | At NAV | With Maximum Sales Charge |
| Class C | $10,000 | 10/31/2013 | $25,397 | N.A. |
See Endnotes and Additional Disclosures in this report.
Past performance is no guarantee of future results. Returns are historical and are calculated by determining the percentage change in net asset value (NAV) or offering price (as applicable) with all distributions reinvested. Furthermore, returns do not reflect the deduction of taxes that shareholders may have to pay on Fund distributions or upon the redemption of Fund shares. Investment return and principal value will fluctuate so that shares, when redeemed, may be worth more or less than their original cost. Performance for periods less than or equal to one year is cumulative. Performance is for the stated time period only; due to market volatility, current Fund performance may be lower or higher than the quoted return. For performance as of the most recent month-end, please refer to eatonvance.com.
Eaton Vance
Tax-Managed Multi-Cap Growth Fund
October 31, 2023
| Sector Allocation (% of net assets)1 |
| Top 10 Holdings (% of net assets)1 |
| Microsoft Corp. | 12.1% |
| Apple, Inc. | 11.1 |
| Amazon.com, Inc. | 7.8 |
| Alphabet, Inc., Class C | 4.5 |
| Visa, Inc., Class A | 4.4 |
| Alphabet, Inc., Class A | 4.3 |
| UnitedHealth Group, Inc. | 3.9 |
| Adobe, Inc. | 3.6 |
| Meta Platforms, Inc., Class A | 3.0 |
| Salesforce, Inc. | 2.7 |
| Total | 57.4% |
Fund invests in an affiliated investment company (Portfolio) with the same objective(s) and policies as the Fund. References to investments are to the Portfolio’s holdings.
Footnotes:
| 1 | Excludes cash and cash equivalents. |
Eaton Vance
Tax-Managed Multi-Cap Growth Fund
October 31, 2023
Endnotes and Additional Disclosures
| † | The views expressed in this report are those of the portfolio manager(s) and are current only through the date stated at the top of this page. These views are subject to change at any time based upon market or other conditions, and Eaton Vance and the Fund(s) disclaim any responsibility to update such views. These views may not be relied upon as investment advice and, because investment decisions are based on many factors, may not be relied upon as an indication of trading intent on behalf of any Eaton Vance fund. This commentary may contain statements that are not historical facts, referred to as “forward-looking statements.” The Fund’s actual future results may differ significantly from those stated in any forward-looking statement, depending on factors such as changes in securities or financial markets or general economic conditions, the volume of sales and purchases of Fund shares, the continuation of investment advisory, administrative and service contracts, and other risks discussed from time to time in the Fund’s filings with the Securities and Exchange Commission. |
| | |
| 1 | Russell 3000® Growth Index is an unmanaged index of the broad growth segment of the U.S. equity universe. S&P 500® Index is an unmanaged index of large-cap stocks commonly used as a measure of U.S. stock market performance. S&P Dow Jones Indices are a product of S&P Dow Jones Indices LLC (“S&P DJI”) and have been licensed for use. S&P® and S&P 500® are registered trademarks of S&P DJI; Dow Jones® is a registered trademark of Dow Jones Trademark Holdings LLC (“Dow Jones”); S&P DJI, Dow Jones and their respective affiliates do not sponsor, endorse, sell or promote the Fund, will not have any liability with respect thereto and do not have any liability for any errors, omissions, or interruptions of the S&P Dow Jones Indices. Unless otherwise stated, index returns do not reflect the effect of any applicable sales charges, commissions, expenses, taxes or leverage, as applicable. It is not possible to invest directly in an index. |
| 2 | Total Returns at NAV do not include applicable sales charges. If sales charges were deducted, the returns would be lower. Total Returns shown with maximum sales charge reflect the stated maximum sales charge. Unless otherwise stated, performance does not reflect the deduction of taxes on Fund distributions or redemptions of Fund shares. After-tax returns are calculated using certain assumptions, including using the highest historical individual federal income tax rates, and do not reflect the impact of state/local taxes. Actual after-tax returns depend on a shareholder’s tax situation and the actual characterization of distributions and may differ from those shown. After-tax returns are not relevant to shareholders who hold shares in tax-deferred accounts or shares held by nontaxable entities. Return After Taxes on Distributions may be the same as Return Before Taxes for the same period because no taxable distributions were made during that period. Return After Taxes on Distributions and Sale of Fund Shares may be greater than or equal to Return After Taxes on Distributions for the same period because of losses realized on the sale of Fund shares. The Fund’s after-tax returns also may reflect foreign tax credits passed by the Fund to its shareholders.Effective November 5, 2020, Class C shares automatically convert to Class A shares eight years after purchase. The average annual total returns listed for Class C reflect conversion to Class A shares after eight years. Prior to November 5, 2020, Class C shares automatically converted to Class A shares ten years after purchase. |
| 3 | Source: Fund prospectus. The expense ratios for the current reporting period can be found in the Financial Highlights section of this report. Performance reflects expenses waived and/or reimbursed, if applicable. Without such waivers and/or reimbursements, performance would have been lower. |
| | Fund profile subject to change due to active management. |
| | Additional Information |
| | Dow Jones Industrial Average® is a price-weighted average of 30 blue-chip stocks that are generally the leaders in their industry. Nasdaq Composite Index is a market capitalization-weighted index of all domestic and international securities listed on Nasdaq. Source: Nasdaq, Inc. The information is provided by Nasdaq (with its affiliates, are referred to as the “Corporations”) and Nasdaq’s third party licensors on an “as is” basis and the Corporations make no guarantees and bear no liability of any kind with respect to the information or the Fund. |
Eaton Vance
Tax-Managed Multi-Cap Growth Fund
October 31, 2023
Example
As a Fund shareholder, you incur two types of costs: (1) transaction costs, including sales charges (loads) on purchases; and (2) ongoing costs, including management fees; distribution and/or service fees; and other Fund expenses. This Example is intended to help you understand your ongoing costs (in dollars) of Fund investing and to compare these costs with the ongoing costs of investing in other mutual funds. The Example is based on an investment of $1,000 invested at the beginning of the period and held for the entire period (May 1, 2023 to October 31, 2023).
Actual Expenses
The first section of the table below provides information about actual account values and actual expenses. You may use the information in this section, together with the amount you invested, to estimate the expenses that you paid over the period. Simply divide your account value by $1,000 (for example, an $8,600 account value divided by $1,000 = 8.6), then multiply the result by the number in the first section under the heading entitled “Expenses Paid During Period” to estimate the expenses you paid on your account during this period.
Hypothetical Example for Comparison Purposes
The second section of the table below provides information about hypothetical account values and hypothetical expenses based on the actual Fund expense ratio and an assumed rate of return of 5% per year (before expenses), which is not the actual Fund return. The hypothetical account values and expenses may not be used to estimate the actual ending account balance or expenses you paid for the period. You may use this information to compare the ongoing costs of investing in your Fund and other funds. To do so, compare this 5% hypothetical example with the 5% hypothetical examples that appear in the shareholder reports of the other funds.
Please note that the expenses shown in the table are meant to highlight your ongoing costs only and do not reflect any transactional costs, such as sales charges (loads). Therefore, the second section of the table is useful in comparing ongoing costs only, and will not help you determine the relative total costs of owning different funds. In addition, if these transactional costs were included, your costs would be higher.
| | Beginning
Account Value
(5/1/23) | Ending
Account Value
(10/31/23) | Expenses Paid
During Period*
(5/1/23 – 10/31/23) | Annualized
Expense
Ratio |
| Actual | | | | |
| Class A | $1,000.00 | $1,043.60 | $ 6.28 | 1.22% |
| Class C | $1,000.00 | $1,039.40 | $10.13 | 1.97% |
| |
| Hypothetical | | | | |
| (5% return per year before expenses) | | | | |
| Class A | $1,000.00 | $1,019.06 | $ 6.21 | 1.22% |
| Class C | $1,000.00 | $1,015.28 | $10.01 | 1.97% |
| * | Expenses are equal to the Fund’s annualized expense ratio for the indicated Class, multiplied by the average account value over the period, multiplied by 184/365 (to reflect the one-half year period). The Example assumes that the $1,000 was invested at the net asset value per share determined at the close of business on April 30, 2023. The Example reflects the expenses of both the Fund and the Portfolio. |
Eaton Vance
Tax-Managed Multi-Cap Growth Fund
October 31, 2023
Statement of Assets and Liabilities
| | October 31, 2023 |
| Assets | |
| Investment in Tax-Managed Multi-Cap Growth Portfolio, at value (identified cost $34,932,757) | $ 115,835,335 |
| Receivable for Fund shares sold | 96,919 |
| Total assets | $115,932,254 |
| Liabilities | |
| Payable for Fund shares redeemed | $ 122,366 |
| Payable to affiliates: | |
| Administration fee | 14,950 |
| Distribution and service fees | 28,965 |
| Trustees' fees | 42 |
| Accrued expenses | 59,022 |
| Total liabilities | $ 225,345 |
| Net Assets | $115,706,909 |
| Sources of Net Assets | |
| Paid-in capital | $ 45,494,736 |
| Distributable earnings | 70,212,173 |
| Net Assets | $115,706,909 |
| Class A Shares | |
| Net Assets | $ 109,561,737 |
| Shares Outstanding | 2,544,343 |
Net Asset Value and Redemption Price Per Share
(net assets ÷ shares of beneficial interest outstanding) | $ 43.06 |
Maximum Offering Price Per Share
(100 ÷ 94.75 of net asset value per share) | $ 45.45 |
| Class C Shares | |
| Net Assets | $ 6,145,172 |
| Shares Outstanding | 175,306 |
Net Asset Value and Offering Price Per Share*
(net assets ÷ shares of beneficial interest outstanding) | $ 35.05 |
| On sales of $50,000 or more, the offering price of Class A shares is reduced. |
| * | Redemption price per share is equal to the net asset value less any applicable contingent deferred sales charge. |
7
See Notes to Financial Statements.
Eaton Vance
Tax-Managed Multi-Cap Growth Fund
October 31, 2023
| | Year Ended |
| | October 31, 2023 |
| Investment Income | |
| Dividend income allocated from Portfolio (net of foreign taxes withheld of $14,232) | $ 726,618 |
| Securities lending income allocated from Portfolio, net | 5,844 |
| Expenses allocated from Portfolio | (790,695) |
| Total investment loss from Portfolio | $ (58,233) |
| Expenses | |
| Administration fee | $ 167,427 |
| Distribution and service fees: | |
| Class A | 261,487 |
| Class C | 70,231 |
| Trustees’ fees and expenses | 499 |
| Custodian fee | 18,485 |
| Transfer and dividend disbursing agent fees | 70,183 |
| Legal and accounting services | 16,079 |
| Printing and postage | 12,418 |
| Registration fees | 33,741 |
| ReFlow liquidity program fees | 7,283 |
| Miscellaneous | 9,150 |
| Total expenses | $ 666,983 |
| Net investment loss | $ (725,216) |
| Realized and Unrealized Gain (Loss) from Portfolio | |
| Net realized gain (loss): | |
| Investment transactions | $ 1,378,349(1) |
| Net realized gain | $ 1,378,349 |
| Change in unrealized appreciation (depreciation): | |
| Investments | $ 17,903,267 |
| Foreign currency | (6) |
| Net change in unrealized appreciation (depreciation) | $17,903,261 |
| Net realized and unrealized gain | $19,281,610 |
| Net increase in net assets from operations | $18,556,394 |
| (1) | Includes $1,658,636 of net realized gains from redemptions in-kind. |
8
See Notes to Financial Statements.
Eaton Vance
Tax-Managed Multi-Cap Growth Fund
October 31, 2023
Statements of Changes in Net Assets
| | Year Ended October 31, |
| | 2023 | 2022 |
| Increase (Decrease) in Net Assets | | |
| From operations: | | |
| Net investment loss | $ (725,216) | $ (1,022,992) |
| Net realized gain | 1,378,349 (1) | 655,566 (2) |
| Net change in unrealized appreciation (depreciation) | 17,903,261 | (39,125,248) |
| Net increase (decrease) in net assets from operations | $ 18,556,394 | $ (39,492,674) |
| Distributions to shareholders: | | |
| Class A | $ — | $ (4,198,521) |
| Class C | — | (485,564) |
| Total distributions to shareholders | $ — | $ (4,684,085) |
| Transactions in shares of beneficial interest: | | |
| Class A | $ (1,019,437) | $ (2,928,925) |
| Class C | (2,418,354) | (2,142,964) |
| Net decrease in net assets from Fund share transactions | $ (3,437,791) | $ (5,071,889) |
| Net increase (decrease) in net assets | $ 15,118,603 | $ (49,248,648) |
| Net Assets | | |
| At beginning of year | $ 100,588,306 | $ 149,836,954 |
| At end of year | $115,706,909 | $100,588,306 |
| (1) | Includes $1,658,636 of net realized gains from redemptions in-kind. |
| (2) | Includes $1,699,231 of net realized gains from redemptions in-kind. |
9
See Notes to Financial Statements.
Eaton Vance
Tax-Managed Multi-Cap Growth Fund
October 31, 2023
| | Class A |
| | Year Ended October 31, |
| | 2023 | 2022 | 2021 | 2020 | 2019 |
| Net asset value — Beginning of year | $ 36.290 | $ 51.600 | $ 39.630 | $ 32.250 | $ 29.220 |
| Income (Loss) From Operations | | | | | |
| Net investment loss(1) | $ (0.247) | $ (0.333) | $ (0.387) | $ (0.229) | $ (0.192) |
| Net realized and unrealized gain (loss) | 7.017 | (13.382) | 13.730 | 8.361 | 3.849 |
| Total income (loss) from operations | $ 6.770 | $(13.715) | $ 13.343 | $ 8.132 | $ 3.657 |
| Less Distributions | | | | | |
| From net realized gain | $ — | $ (1.595) | $ (1.373) | $ (0.752) | $ (0.627) |
| Total distributions | $ — | $ (1.595) | $ (1.373) | $ (0.752) | $ (0.627) |
| Net asset value — End of year | $ 43.060 | $ 36.290 | $ 51.600 | $ 39.630 | $32.250 |
| Total Return(2) | 18.66% | (27.42)% | 34.39% | 25.65% | 13.07% |
| Ratios/Supplemental Data | | | | | |
| Net assets, end of year (000’s omitted) | $109,562 | $ 93,206 | $136,537 | $101,649 | $ 82,914 |
| Ratios (as a percentage of average daily net assets):(3) | | | | | |
| Expenses | 1.26% (4) | 1.28% (4) | 1.25% | 1.28% | 1.33% |
| Net investment loss | (0.60)% | (0.79)% | (0.83)% | (0.64)% | (0.63)% |
| Portfolio Turnover of the Portfolio | 2% | 0% (5) | 13% | 24% | 18% |
| (1) | Computed using average shares outstanding. |
| (2) | Returns are historical and are calculated by determining the percentage change in net asset value with all distributions reinvested and do not reflect the effect of sales charges. |
| (3) | Includes the Fund’s share of the Portfolio’s allocated expenses. |
| (4) | Includes a reduction by the investment adviser of a portion of the Portfolio’s adviser fee due to the Portfolio’s investment in the Liquidity Fund (equal to less than 0.005% of average daily net assets for the years ended October 31, 2023 and 2022). |
| (5) | Amount is less than 0.5%. |
10
See Notes to Financial Statements.
Eaton Vance
Tax-Managed Multi-Cap Growth Fund
October 31, 2023
Financial Highlights — continued
| | Class C |
| | Year Ended October 31, |
| | 2023 | 2022 | 2021 | 2020 | 2019 |
| Net asset value — Beginning of year | $ 29.770 | $ 42.920 | $ 33.410 | $ 27.510 | $ 25.210 |
| Income (Loss) From Operations | | | | | |
| Net investment loss(1) | $ (0.445) | $ (0.538) | $ (0.607) | $ (0.418) | $ (0.353) |
| Net realized and unrealized gain (loss) | 5.725 | (11.017) | 11.490 | 7.070 | 3.280 |
| Total income (loss) from operations | $ 5.280 | $(11.555) | $10.883 | $ 6.652 | $ 2.927 |
| Less Distributions | | | | | |
| From net realized gain | $ — | $ (1.595) | $ (1.373) | $ (0.752) | $ (0.627) |
| Total distributions | $ — | $ (1.595) | $ (1.373) | $ (0.752) | $ (0.627) |
| Net asset value — End of year | $35.050 | $ 29.770 | $42.920 | $33.410 | $27.510 |
| Total Return(2) | 17.74% | (27.95)% | 33.40% | 24.67% | 12.24% |
| Ratios/Supplemental Data | | | | | |
| Net assets, end of year (000’s omitted) | $ 6,145 | $ 7,382 | $ 13,300 | $ 14,982 | $ 14,216 |
| Ratios (as a percentage of average daily net assets):(3) | | | | | |
| Expenses | 2.01% (4) | 2.03% (4) | 2.00% | 2.03% | 2.09% |
| Net investment loss | (1.34)% | (1.53)% | (1.57)% | (1.39)% | (1.37)% |
| Portfolio Turnover of the Portfolio | 2% | 0% (5) | 13% | 24% | 18% |
| (1) | Computed using average shares outstanding. |
| (2) | Returns are historical and are calculated by determining the percentage change in net asset value with all distributions reinvested and do not reflect the effect of sales charges. |
| (3) | Includes the Fund’s share of the Portfolio’s allocated expenses. |
| (4) | Includes a reduction by the investment adviser of a portion of the Portfolio’s adviser fee due to the Portfolio’s investment in the Liquidity Fund (equal to less than 0.005% of average daily net assets for the years ended October 31, 2023 and 2022). |
| (5) | Amount is less than 0.5%. |
11
See Notes to Financial Statements.
Eaton Vance
Tax-Managed Multi-Cap Growth Fund
October 31, 2023
Notes to Financial Statements
1 Significant Accounting Policies
Eaton Vance Tax-Managed Multi-Cap Growth Fund (the Fund) is a non-diversified series of Eaton Vance Mutual Funds Trust (the Trust). The Trust is a Massachusetts business trust registered under the Investment Company Act of 1940, as amended (the 1940 Act), as an open-end management investment company. The Fund offers two classes of shares. Class A shares are generally sold subject to a sales charge imposed at time of purchase. Class C shares are sold at net asset value and are generally subject to a contingent deferred sales charge (see Note 5). Effective November 5, 2020, Class C shares automatically convert to Class A shares eight years after their purchase as described in the Fund’s prospectus. Each class represents a pro rata interest in the Fund, but votes separately on class-specific matters and (as noted below) is subject to different expenses. Realized and unrealized gains and losses and net investment income and losses, other than class-specific expenses, are allocated daily to each class of shares based on the relative net assets of each class to the total net assets of the Fund. Each class of shares differs in its distribution plan and certain other class-specific expenses. The Fund invests its assets in interests in Tax-Managed Multi-Cap Growth Portfolio (the Portfolio), a Massachusetts business trust, having the same investment objective and policies as the Fund. The value of the Fund’s investment in the Portfolio reflects the Fund’s proportionate interest in the net assets of the Portfolio (55.7% at October 31, 2023). The performance of the Fund is directly affected by the performance of the Portfolio. The financial statements of the Portfolio, including the portfolio of investments, are included elsewhere in this report and should be read in conjunction with the Fund’s financial statements.
The following is a summary of significant accounting policies of the Fund. The policies are in conformity with accounting principles generally accepted in the United States of America (U.S. GAAP). The Fund is an investment company and follows accounting and reporting guidance in the Financial Accounting Standards Board (FASB) Accounting Standards Codification Topic 946.
A Investment Valuation—Valuation of securities by the Portfolio is discussed in Note 1A of the Portfolio's Notes to Financial Statements, which are included elsewhere in this report.
B Income—The Fund's net investment income or loss consists of the Fund's pro rata share of the net investment income or loss of the Portfolio, less all actual and accrued expenses of the Fund.
C Federal Taxes—The Fund's policy is to comply with the provisions of the Internal Revenue Code applicable to regulated investment companies and to distribute to shareholders each year substantially all of its net investment income, and all or substantially all of its net realized capital gains. Accordingly, no provision for federal income or excise tax is necessary.
As of October 31, 2023, the Fund had no uncertain tax positions that would require financial statement recognition, de-recognition, or disclosure. The Fund files a U.S. federal income tax return annually after its fiscal year-end, which is subject to examination by the Internal Revenue Service for a period of three years from the date of filing.
D Expenses—The majority of expenses of the Trust are directly identifiable to an individual fund. Expenses which are not readily identifiable to a specific fund are allocated taking into consideration, among other things, the nature and type of expense and the relative size of the funds.
E Use of Estimates—The preparation of the financial statements in conformity with U.S. GAAP requires management to make estimates and assumptions that affect the reported amounts of assets and liabilities at the date of the financial statements and the reported amounts of income and expense during the reporting period. Actual results could differ from those estimates.
F Indemnifications—Under the Trust’s organizational documents, its officers and Trustees may be indemnified against certain liabilities and expenses arising out of the performance of their duties to the Fund. Under Massachusetts law, if certain conditions prevail, shareholders of a Massachusetts business trust (such as the Trust) could be deemed to have personal liability for the obligations of the Trust. However, the Trust’s Declaration of Trust contains an express disclaimer of liability on the part of Fund shareholders and the By-laws provide that the Trust shall assume, upon request by the shareholder, the defense on behalf of any Fund shareholders. Moreover, the By-laws also provide for indemnification out of Fund property of any shareholder held personally liable solely by reason of being or having been a shareholder for all loss or expense arising from such liability. Additionally, in the normal course of business, the Fund enters into agreements with service providers that may contain indemnification clauses. The Fund's maximum exposure under these arrangements is unknown as this would involve future claims that may be made against the Fund that have not yet occurred.
G Other—Investment transactions are accounted for on a trade date basis.
Eaton Vance
Tax-Managed Multi-Cap Growth Fund
October 31, 2023
Notes to Financial Statements — continued
2 Distributions to Shareholders and Income Tax Information
It is the present policy of the Fund to make at least one distribution annually (normally in December) of all or substantially all of its net investment income and to distribute annually all or substantially all of its net realized capital gains. Distributions to shareholders are recorded on the ex-dividend date. Distributions are declared separately for each class of shares. Shareholders may reinvest income and capital gain distributions in additional shares of the same class of the Fund at the net asset value as of the ex-dividend date or, at the election of the shareholder, receive distributions in cash. Distributions to shareholders are determined in accordance with income tax regulations, which may differ from U.S. GAAP. As required by U.S. GAAP, only distributions in excess of tax basis earnings and profits are reported in the financial statements as a return of capital. Permanent differences between book and tax accounting relating to distributions are reclassified to paid-in capital. For tax purposes, distributions from short-term capital gains are considered to be from ordinary income.
The tax character of distributions declared for the years ended October 31, 2023 and October 31, 2022 was as follows:
| | Year Ended October 31, |
| | 2023 | 2022 |
| Long-term capital gains | $ — | $4,684,085 |
During the year ended October 31, 2023, distributable earnings was decreased by $314,015 and paid-in capital was increased by $314,015 due to differences between book and tax accounting, primarily for net operating losses and redemptions in-kind. These reclassifications had no effect on the net assets or net asset value per share of the Fund.
As of October 31, 2023, the components of distributable earnings (accumulated loss) on a tax basis were as follows:
| Deferred capital losses | $ (967,185) |
| Late year ordinary losses | (643,574) |
| Net unrealized appreciation | 71,822,932 |
| Distributable earnings | $70,212,173 |
At October 31, 2023, the Fund, for federal income tax purposes, had deferred capital losses of $967,185 which would reduce its taxable income arising from future net realized gains on investment transactions, if any, to the extent permitted by the Internal Revenue Code, and thus would reduce the amount of distributions to shareholders, which would otherwise be necessary to relieve the Fund of any liability for federal income or excise tax. The deferred capital losses are treated as arising on the first day of the Fund’s next taxable year and retain the same short-term or long-term character as when originally deferred. Of the deferred capital losses at October 31, 2023, $967,185 are short-term.
Additionally, at October 31, 2023, the Fund had a late year ordinary loss of $643,574 which it has elected to defer to the following taxable year pursuant to income tax regulations. Late year ordinary losses represent certain specified losses realized in that portion of a taxable year after October 31 that are treated as ordinary for tax purposes plus ordinary losses attributable to that portion of a taxable year after December 31.
3 Investment Adviser Fee and Other Transactions with Affiliates
The investment adviser fee is earned by Eaton Vance Management (EVM), an indirect, wholly-owned subsidiary of Morgan Stanley, as compensation for investment advisory services rendered to the Fund. The fee is computed at an annual rate as a percentage of the Fund’s average daily net assets that are not invested in other investment companies for which EVM or its affiliates serve as investment adviser and receive an advisory fee as follows and is payable monthly:
| Average Daily Net Assets | Annual Fee Rate |
| Up to $500 million | 0.650% |
| $500 million but less than $1 billion | 0.625% |
| $1 billion but less than $2.5 billion | 0.600% |
| $2.5 billion and over | 0.600% |
For the year ended October 31, 2023, the Fund incurred no investment adviser fee on such assets. To the extent the Fund’s assets are invested in the Portfolio, the Fund is allocated its share of the Portfolio’s investment adviser fee. The Portfolio has engaged Boston Management and Research (BMR) to
Eaton Vance
Tax-Managed Multi-Cap Growth Fund
October 31, 2023
Notes to Financial Statements — continued
render investment advisory services. See Note 2 of the Portfolio’s Notes to Financial Statements which are included elsewhere in this report. The administration fee is earned by EVM as compensation for administrative services rendered to the Fund. The fee is computed at an annual rate of 0.15% of the Fund’s average daily net assets. For the year ended October 31, 2023, the administration fee amounted to $167,427.
EVM provides sub-transfer agency and related services to the Fund pursuant to a Sub-Transfer Agency Support Services Agreement. For the year ended October 31, 2023, EVM earned $23,274 from the Fund pursuant to such agreement, which is included in transfer and dividend disbursing agent fees on the Statement of Operations. The Fund was informed that Eaton Vance Distributors, Inc. (EVD), an affiliate of EVM and the Fund's principal underwriter, received $3,999 as its portion of the sales charge on sales of Class A shares for the year ended October 31, 2023. EVD also received distribution and service fees from Class A and Class C shares (see Note 4) and contingent deferred sales charges (see Note 5).
Trustees and officers of the Fund who are members of EVM’s or BMR's organizations receive remuneration for their services to the Fund out of the investment adviser fee. Certain officers and Trustees of the Fund and the Portfolio are officers of the above organizations.
4 Distribution Plans
The Fund has in effect a distribution plan for Class A shares (Class A Plan) pursuant to Rule 12b-1 under the 1940 Act. Pursuant to the Class A Plan, the Fund pays EVD a distribution and service fee of 0.25% per annum of its average daily net assets attributable to Class A shares for distribution services and facilities provided to the Fund by EVD, as well as for personal services and/or the maintenance of shareholder accounts. Distribution and service fees paid or accrued to EVD for the year ended October 31, 2023 amounted to $261,487 for Class A shares.
The Fund also has in effect a distribution plan for Class C shares (Class C Plan) pursuant to Rule 12b-1 under the 1940 Act. Pursuant to the Class C Plan, the Fund pays EVD amounts equal to 0.75% per annum of its average daily net assets attributable to Class C shares for providing ongoing distribution services and facilities to the Fund. For the year ended October 31, 2023, the Fund paid or accrued to EVD $52,673 for Class C shares.
Pursuant to the Class C Plan, the Fund also makes payments of service fees to EVD, financial intermediaries and other persons in amounts equal to 0.25% per annum of its average daily net assets attributable to that class. Service fees paid or accrued are for personal services and/or the maintenance of shareholder accounts. They are separate and distinct from the sales commissions and distribution fees payable to EVD. Service fees paid or accrued for the year ended October 31, 2023 amounted to $17,558 for Class C shares.
Distribution fees are subject to the limitations contained in the Financial Industry Regulatory Authority Rule 2341(d).
5 Contingent Deferred Sales Charges
A contingent deferred sales charge (CDSC) of 1% generally is imposed on redemptions of Class C shares made within 12 months of purchase. Class A shares may be subject to a 0.75% CDSC if redeemed within 12 months of purchase (depending on the circumstances of purchase). Generally, the CDSC is based upon the lower of the net asset value at date of redemption or date of purchase. No charge is levied on shares acquired by reinvestment of dividends or capital gain distributions. For the year ended October 31, 2023, the Fund was informed that EVD received less than $100 of CDSCs paid by each of Class A and Class C shareholders.
6 Investment Transactions
For the year ended October 31, 2023, increases and decreases in the Fund's investment in the Portfolio aggregated $1,467,943 and $5,600,347, respectively. Decreases in the Fund's investment in the Portfolio include distributions of securities as the result of redemptions in-kind of $3,445,829.
Eaton Vance
Tax-Managed Multi-Cap Growth Fund
October 31, 2023
Notes to Financial Statements — continued
7 Shares of Beneficial Interest
The Fund’s Declaration of Trust permits the Trustees to issue an unlimited number of full and fractional shares of beneficial interest (without par value). Such shares may be issued in a number of different series (such as the Fund) and classes. Sales and redemptions of Class A shares include shares purchased and redeemed in connection with the ReFlow liquidity program, a program designed to provide an alternative liquidity source for mutual funds experiencing net redemptions of their shares. Transactions in Fund shares, including direct exchanges pursuant to share class conversions, were as follows:
| | Year Ended
October 31, 2023 | | Year Ended
October 31, 2022 |
| | Shares | Amount | | Shares | Amount |
| Class A | | | | | |
| Sales | 226,680 | $ 9,130,028 | | 236,476 | $ 9,713,120 |
| Issued to shareholders electing to receive payments of distributions in Fund shares | — | — | | 80,222 | 3,995,868 |
| Redemptions | (250,401) | (10,149,465) | | (394,902) | (16,637,913) |
| Net decrease | (23,721) | $ (1,019,437) | | (78,204) | $ (2,928,925) |
| Class C | | | | | |
| Sales | 14,556 | $ 482,415 | | 21,295 | $ 759,472 |
| Issued to shareholders electing to receive payments of distributions in Fund shares | — | — | | 11,778 | 484,298 |
| Redemptions | (87,232) | (2,900,769) | | (94,992) | (3,386,734) |
| Net decrease | (72,676) | $ (2,418,354) | | (61,919) | $ (2,142,964) |
Eaton Vance
Tax-Managed Multi-Cap Growth Fund
October 31, 2023
Report of Independent Registered Public Accounting Firm
To the Trustees of Eaton Vance Mutual Funds Trust and Shareholders of Eaton Vance Tax-Managed Multi-Cap Growth Fund:
Opinion on the Financial Statements and Financial Highlights
We have audited the accompanying statement of assets and liabilities of Eaton Vance Tax-Managed Multi-Cap Growth Fund (the “Fund") (one of the funds constituting Eaton Vance Mutual Funds Trust), as of October 31, 2023, the related statement of operations for the year then ended, the statements of changes in net assets for each of the two years in the period then ended, the financial highlights for each of the five years in the period then ended, and the related notes. In our opinion, the financial statements and financial highlights present fairly, in all material respects, the financial position of the Fund as of October 31, 2023, and the results of its operations for the year then ended, the changes in its net assets for each of the two years in the period then ended, and the financial highlights for each of the five years in the period then ended, in conformity with accounting principles generally accepted in the United States of America.
Basis for Opinion
These financial statements and financial highlights are the responsibility of the Fund's management. Our responsibility is to express an opinion on the Fund's financial statements and financial highlights based on our audits. We are a public accounting firm registered with the Public Company Accounting Oversight Board (United States) (PCAOB) and are required to be independent with respect to the Fund in accordance with the U.S. federal securities laws and the applicable rules and regulations of the Securities and Exchange Commission and the PCAOB.
We conducted our audits in accordance with the standards of the PCAOB. Those standards require that we plan and perform the audit to obtain reasonable assurance about whether the financial statements and financial highlights are free of material misstatement, whether due to error or fraud. The Fund is not required to have, nor were we engaged to perform, an audit of its internal control over financial reporting. As part of our audits, we are required to obtain an understanding of internal control over financial reporting but not for the purpose of expressing an opinion on the effectiveness of the Fund’s internal control over financial reporting. Accordingly, we express no such opinion.
Our audits included performing procedures to assess the risks of material misstatement of the financial statements and financial highlights, whether due to error or fraud, and performing procedures that respond to those risks. Such procedures included examining, on a test basis, evidence regarding the amounts and disclosures in the financial statements and financial highlights. Our audits also included evaluating the accounting principles used and significant estimates made by management, as well as evaluating the overall presentation of the financial statements and financial highlights. We believe that our audits provide a reasonable basis for our opinion.
/s/ Deloitte & Touche LLP
Boston, Massachusetts
December 19, 2023
We have served as the auditor of one or more Eaton Vance investment companies since 1959.
Eaton Vance
Tax-Managed Multi-Cap Growth Fund
October 31, 2023
Federal Tax Information (Unaudited)
The Form 1099-DIV you receive in February 2024 will show the tax status of all distributions paid to your account in calendar year 2023. Shareholders are advised to consult their own tax adviser with respect to the tax consequences of their investment in the Fund. As required by the Internal Revenue Code and/or regulations, shareholders must be notified regarding the status of qualified dividend income for individuals.
Qualified Dividend Income. For the fiscal year ended October 31, 2023, the Fund designates approximately $659,385, or up to the maximum amount of such dividends allowable pursuant to the Internal Revenue Code, as qualified dividend income eligible for the reduced tax rate of 15%.
Tax-Managed Multi-Cap Growth Portfolio
October 31, 2023
| Security | Shares | Value |
| Biotechnology — 2.6% |
| Vertex Pharmaceuticals, Inc.(1) | | 15,175 | $ 5,495,019 |
| | | | $ 5,495,019 |
| Broadline Retail — 7.8% |
| Amazon.com, Inc.(1) | | 122,446 | $ 16,296,338 |
| | | | $ 16,296,338 |
| Building Products — 0.4% |
| Trex Co., Inc.(1) | | 15,892 | $ 893,289 |
| | | | $ 893,289 |
| Capital Markets — 1.0% |
| S&P Global, Inc. | | 5,966 | $ 2,083,984 |
| | | | $ 2,083,984 |
| Chemicals — 1.6% |
| Celanese Corp. | | 4,789 | $ 548,388 |
| Ecolab, Inc. | | 7,531 | 1,263,250 |
| Sherwin-Williams Co. (The) | | 6,570 | 1,565,040 |
| | | | $ 3,376,678 |
| Commercial Services & Supplies — 2.0% |
| Copart, Inc.(1) | | 49,420 | $ 2,150,758 |
| Veralto Corp.(1) | | 1 | 69 |
| Waste Connections, Inc. | | 16,156 | 2,092,202 |
| | | | $ 4,243,029 |
| Consumer Staples Distribution & Retail — 1.6% |
| Performance Food Group Co.(1) | | 58,516 | $ 3,379,884 |
| | | | $ 3,379,884 |
| Electrical Equipment — 2.3% |
| AMETEK, Inc. | | 34,300 | $ 4,828,411 |
| | | | $ 4,828,411 |
| Entertainment — 1.0% |
| Electronic Arts, Inc. | | 7,649 | $ 946,870 |
| Walt Disney Co. (The)(1) | | 12,454 | 1,016,122 |
| | | | $ 1,962,992 |
| Security | Shares | Value |
| Financial Services — 5.5% |
| Fiserv, Inc.(1) | | 13,974 | $ 1,589,543 |
| Shift4 Payments, Inc., Class A(1) | | 13,838 | 616,068 |
| Visa, Inc., Class A | | 38,845 | 9,132,459 |
| | | | $ 11,338,070 |
| Food Products — 1.1% |
| Mondelez International, Inc., Class A | | 35,144 | $ 2,326,884 |
| | | | $ 2,326,884 |
| Ground Transportation — 3.0% |
| J.B. Hunt Transport Services, Inc. | | 14,100 | $ 2,423,367 |
| Norfolk Southern Corp. | | 8,734 | 1,666,360 |
| Uber Technologies, Inc.(1) | | 47,387 | 2,050,909 |
| | | | $ 6,140,636 |
| Health Care Equipment & Supplies — 2.7% |
| Intuitive Surgical, Inc.(1) | | 8,574 | $ 2,248,274 |
| Stryker Corp. | | 12,668 | 3,423,147 |
| | | | $ 5,671,421 |
| Health Care Providers & Services — 4.1% |
| R1 RCM, Inc.(1) | | 36,738 | $ 433,141 |
| UnitedHealth Group, Inc. | | 15,062 | 8,066,605 |
| | | | $ 8,499,746 |
| Hotels, Restaurants & Leisure — 1.5% |
| Booking Holdings, Inc.(1) | | 735 | $ 2,050,327 |
| Starbucks Corp. | | 12,443 | 1,147,742 |
| | | | $ 3,198,069 |
| Interactive Media & Services — 11.8% |
| Alphabet, Inc., Class A(1) | | 71,981 | $ 8,931,403 |
| Alphabet, Inc., Class C(1) | | 74,560 | 9,342,368 |
| Meta Platforms, Inc., Class A(1) | | 20,515 | 6,180,554 |
| | | | $ 24,454,325 |
| IT Services — 4.7% |
| Accenture PLC, Class A | | 18,307 | $ 5,438,827 |
| GoDaddy, Inc., Class A(1) | | 44,180 | 3,235,301 |
| Okta, Inc.(1) | | 15,035 | 1,013,509 |
| | | | $ 9,687,637 |
| Life Sciences Tools & Services — 1.1% |
| Danaher Corp. | | 11,868 | $ 2,278,893 |
| | | | $ 2,278,893 |
18
See Notes to Financial Statements.
Tax-Managed Multi-Cap Growth Portfolio
October 31, 2023
Portfolio of Investments — continued
| Security | Shares | Value |
| Personal Care Products — 0.7% |
| Estee Lauder Cos., Inc. (The), Class A | | 10,679 | $ 1,376,203 |
| | | | $ 1,376,203 |
| Pharmaceuticals — 2.0% |
| Zoetis, Inc. | | 26,003 | $ 4,082,471 |
| | | | $ 4,082,471 |
| Semiconductors & Semiconductor Equipment — 2.8% |
| Monolithic Power Systems, Inc. | | 8,854 | $ 3,911,166 |
| NVIDIA Corp. | | 4,678 | 1,907,688 |
| | | | $ 5,818,854 |
| Software — 20.1% |
| Adobe, Inc.(1) | | 14,102 | $ 7,503,110 |
| Altair Engineering, Inc., Class A(1) | | 7,902 | 490,872 |
| Intuit, Inc. | | 6,414 | 3,174,609 |
| Microsoft Corp. | | 74,352 | 25,139,155 |
| Salesforce, Inc.(1) | | 27,530 | 5,528,850 |
| | | | $ 41,836,596 |
| Specialty Retail — 1.9% |
| TJX Cos., Inc. (The) | | 44,664 | $ 3,933,559 |
| | | | $ 3,933,559 |
| Technology Hardware, Storage & Peripherals — 11.1% |
| Apple, Inc. | | 134,541 | $ 22,975,567 |
| | | | $ 22,975,567 |
| Textiles, Apparel & Luxury Goods — 3.4% |
| Lululemon Athletica, Inc.(1) | | 13,063 | $ 5,140,030 |
| NIKE, Inc., Class B | | 19,321 | 1,985,619 |
| | | | $ 7,125,649 |
| Trading Companies & Distributors — 1.8% |
| United Rentals, Inc. | | 9,152 | $ 3,718,183 |
| | | | $ 3,718,183 |
Total Common Stocks
(identified cost $67,848,594) | | | $207,022,387 |
| Short-Term Investments — 0.5% |
| Security | Shares | Value |
| Morgan Stanley Institutional Liquidity Funds - Government Portfolio, Institutional Class, 5.25%(2) | | 957,927 | $ 957,927 |
Total Short-Term Investments
(identified cost $957,927) | | | $ 957,927 |
Total Investments — 100.1%
(identified cost $68,806,521) | | | $207,980,314 |
| Other Assets, Less Liabilities — (0.1)% | | | $ (153,403) |
| Net Assets — 100.0% | | | $207,826,911 |
| The percentage shown for each investment category in the Portfolio of Investments is based on net assets. |
| (1) | Non-income producing security. |
| (2) | May be deemed to be an affiliated investment company. The rate shown is the annualized seven-day yield as of October 31, 2023. |
19
See Notes to Financial Statements.
Tax-Managed Multi-Cap Growth Portfolio
October 31, 2023
Statement of Assets and Liabilities
| | October 31, 2023 |
| Assets | |
| Unaffiliated investments, at value (identified cost $67,848,594) | $ 207,022,387 |
| Affiliated investments, at value (identified cost $957,927) | 957,927 |
| Dividends receivable | 30,815 |
| Dividends receivable from affiliated investments | 6,374 |
| Securities lending income receivable | 5,833 |
| Tax reclaims receivable | 1,226 |
| Trustees' deferred compensation plan | 37,249 |
| Total assets | $208,061,811 |
| Liabilities | |
| Payable to affiliates: | |
| Investment adviser fee | $ 116,284 |
| Trustees' fees | 1,195 |
| Trustees' deferred compensation plan | 37,249 |
| Accrued expenses | 80,172 |
| Total liabilities | $ 234,900 |
| Net Assets applicable to investors' interest in Portfolio | $207,826,911 |
20
See Notes to Financial Statements.
Tax-Managed Multi-Cap Growth Portfolio
October 31, 2023
| | Year Ended |
| | October 31, 2023 |
| Investment Income | |
| Dividend income (net of foreign taxes withheld of $25,402) | $ 1,171,271 |
| Dividend income from affiliated investments | 124,258 |
| Securities lending income, net | 10,476 |
| Total investment income | $ 1,306,005 |
| Expenses | |
| Investment adviser fee | $ 1,295,731 |
| Trustees’ fees and expenses | 13,147 |
| Custodian fee | 50,985 |
| Legal and accounting services | 43,579 |
| Miscellaneous | 11,579 |
| Total expenses | $ 1,415,021 |
| Deduct: | |
| Waiver and/or reimbursement of expenses by affiliates | $ 4,074 |
| Total expense reductions | $ 4,074 |
| Net expenses | $ 1,410,947 |
| Net investment loss | $ (104,942) |
| Realized and Unrealized Gain (Loss) | |
| Net realized gain (loss): | |
| Investment transactions | $ 2,460,551(1) |
| Net realized gain | $ 2,460,551 |
| Change in unrealized appreciation (depreciation): | |
| Investments | $ 31,766,012 |
| Foreign currency | (11) |
| Net change in unrealized appreciation (depreciation) | $31,766,001 |
| Net realized and unrealized gain | $34,226,552 |
| Net increase in net assets from operations | $34,121,610 |
| (1) | Includes $2,960,554 of net realized gains from redemptions in-kind. |
21
See Notes to Financial Statements.
Tax-Managed Multi-Cap Growth Portfolio
October 31, 2023
Statements of Changes in Net Assets
| | Year Ended October 31, |
| | 2023 | 2022 |
| Increase (Decrease) in Net Assets | | |
| From operations: | | |
| Net investment loss | $ (104,942) | $ (486,478) |
| Net realized gain | 2,460,551 (1) | 1,183,064 (2) |
| Net change in unrealized appreciation (depreciation) | 31,766,001 | (69,092,945) |
| Net increase (decrease) in net assets from operations | $ 34,121,610 | $ (68,396,359) |
| Capital transactions: | | |
| Contributions | $ 4,277,854 | $ 3,854,719 |
| Withdrawals | (9,546,515) | (18,838,502) |
| Net decrease in net assets from capital transactions | $ (5,268,661) | $ (14,983,783) |
| Net increase (decrease) in net assets | $ 28,852,949 | $ (83,380,142) |
| Net Assets | | |
| At beginning of year | $ 178,973,962 | $ 262,354,104 |
| At end of year | $207,826,911 | $178,973,962 |
| (1) | Includes $2,960,554 of net realized gains from redemptions in-kind. |
| (2) | Includes $3,009,242 of net realized gains from redemptions in-kind. |
22
See Notes to Financial Statements.
Tax-Managed Multi-Cap Growth Portfolio
October 31, 2023
| | Year Ended October 31, |
| Ratios/Supplemental Data | 2023 | 2022 | 2021 | 2020 | 2019 |
| Ratios (as a percentage of average daily net assets): | | | | | |
| Expenses | 0.71% (1) | 0.72% (1) | 0.70% | 0.71% | 0.72% |
| Net investment loss | (0.05)% | (0.23)% | (0.28)% | (0.08)% | (0.01)% |
| Portfolio Turnover | 2% | 0% (2) | 13% | 24% | 18% |
| Total Return | 19.30% | (27.00)% | 35.12% | 26.36% | 13.76% |
| Net assets, end of year (000’s omitted) | $207,827 | $178,974 | $262,354 | $200,795 | $167,562 |
| (1) | Includes a reduction by the investment adviser of a portion of the Portfolio’s adviser fee due to the Portfolio’s investment in the Liquidity Fund (equal to less than 0.005% of average daily net assets for the years ended October 31, 2023 and 2022). |
| (2) | Amount is less than 0.5%. |
Tax-Managed Multi-Cap Growth Portfolio
October 31, 2023
Notes to Financial Statements
1 Significant Accounting Policies
Tax-Managed Multi-Cap Growth Portfolio (the Portfolio) is a Massachusetts business trust registered under the Investment Company Act of 1940, as amended (the 1940 Act), as a non-diversified, open-end management investment company. The Portfolio’s investment objective is to achieve long-term, after-tax returns by investing in a portfolio of equity securities. The Declaration of Trust permits the Trustees to issue interests in the Portfolio. At October 31, 2023, Eaton Vance Tax-Managed Multi-Cap Growth Fund and Eaton Vance Tax-Managed Equity Asset Allocation Fund held an interest of 55.7% and 44.3%, respectively, in the Portfolio.
The following is a summary of significant accounting policies of the Portfolio. The policies are in conformity with accounting principles generally accepted in the United States of America (U.S. GAAP). The Portfolio is an investment company and follows accounting and reporting guidance in the Financial Accounting Standards Board (FASB) Accounting Standards Codification Topic 946.
A Investment Valuation—The following methodologies are used to determine the market value or fair value of investments.
Equity Securities. Equity securities listed on a U.S. securities exchange generally are valued at the last sale or closing price on the day of valuation or, if no sales took place on such date, at the mean between the closing bid and ask prices on the exchange where such securities are principally traded. Equity securities listed on the NASDAQ National Market System are valued at the NASDAQ official closing price. Unlisted or listed securities for which closing sales prices or closing quotations are not available are valued at the mean between the latest available bid and ask prices.
Foreign Securities and Currencies. Foreign securities and currencies are valued in U.S. dollars, based on foreign currency exchange rate quotations supplied by a third party pricing service. The pricing service uses a proprietary model to determine the exchange rate. Inputs to the model include reported trades and implied bid/ask spreads. The daily valuation of exchange-traded foreign securities generally is determined as of the close of trading on the principal exchange on which such securities trade. Events occurring after the close of trading on foreign exchanges may result in adjustments to the valuation of foreign securities to more accurately reflect their fair value as of the close of regular trading on the New York Stock Exchange. When valuing foreign equity securities that meet certain criteria, the Portfolio's Trustees have approved the use of a fair value service that values such securities to reflect market trading that occurs after the close of the applicable foreign markets of comparable securities or other instruments that have a strong correlation to the fair-valued securities.
Other. Investments in management investment companies (including money market funds) that do not trade on an exchange are valued at the net asset value as of the close of each business day.
Fair Valuation. In connection with Rule 2a-5 of the 1940 Act, the Trustees have designated the Portfolio’s investment adviser as its valuation designee. Investments for which valuations or market quotations are not readily available or are deemed unreliable are valued by the investment adviser, as valuation designee, at fair value using methods that most fairly reflect the security’s “fair value”, which is the amount that the Portfolio might reasonably expect to receive for the security upon its current sale in the ordinary course. Each such determination is based on a consideration of relevant factors, which are likely to vary from one pricing context to another. These factors may include, but are not limited to, the type of security, the existence of any contractual restrictions on the security’s disposition, the price and extent of public trading in similar securities of the issuer or of comparable companies or entities, quotations or relevant information obtained from broker/dealers or other market participants, information obtained from the issuer, analysts, and/or the appropriate stock exchange (for exchange-traded securities), an analysis of the company’s or entity’s financial statements, and an evaluation of the forces that influence the issuer and the market(s) in which the security is purchased and sold.
B Investment Transactions—Investment transactions for financial statement purposes are accounted for on a trade date basis. Realized gains and losses on investments sold are determined on the basis of identified cost.
C Income—Dividend income is recorded on the ex-dividend date for dividends received in cash and/or securities. However, if the ex-dividend date has passed, certain dividends from foreign securities are recorded as the Portfolio is informed of the ex-dividend date. Withholding taxes on foreign dividends and capital gains have been provided for in accordance with the Portfolio's understanding of the applicable countries’ tax rules and rates. In consideration of recent decisions rendered by European courts, the Portfolio has filed additional tax reclaims for previously withheld taxes on dividends earned in certain European Union countries. These filings are subject to various administrative and judicial proceedings within these countries. Due to the uncertainty as to the ultimate resolution of these proceedings, the likelihood of receipt of these reclaims, and the potential timing of payment, no amounts are reflected in the financial statements for such outstanding reclaims.
D Federal Taxes—The Portfolio has elected to be treated as a partnership for federal tax purposes. No provision is made by the Portfolio for federal or state taxes on any taxable income of the Portfolio because each investor in the Portfolio is ultimately responsible for the payment of any taxes on its share of taxable income. Since at least one of the Portfolio's investors is a regulated investment company that invests all or substantially all of its assets in the Portfolio, the Portfolio normally must satisfy the applicable source of income and diversification requirements (under the Internal Revenue Code) in order for its investors to satisfy them. The Portfolio will allocate, at least annually among its investors, each investor's distributive share of the Portfolio's net investment income, net realized capital gains and losses and any other items of income, gain, loss, deduction or credit.
Tax-Managed Multi-Cap Growth Portfolio
October 31, 2023
Notes to Financial Statements — continued
As of October 31, 2023, the Portfolio had no uncertain tax positions that would require financial statement recognition, de-recognition, or disclosure. The Portfolio files a U.S. federal income tax return annually after its fiscal year-end, which is subject to examination by the Internal Revenue Service for a period of three years from the date of filing.
E Foreign Currency Translation—Investment valuations, other assets, and liabilities initially expressed in foreign currencies are translated each business day into U.S. dollars based upon current exchange rates. Purchases and sales of foreign investment securities and income and expenses denominated in foreign currencies are translated into U.S. dollars based upon currency exchange rates in effect on the respective dates of such transactions. Recognized gains or losses on investment transactions attributable to changes in foreign currency exchange rates are recorded for financial statement purposes as net realized gains and losses on investments. That portion of unrealized gains and losses on investments that results from fluctuations in foreign currency exchange rates is not separately disclosed.
F Use of Estimates—The preparation of the financial statements in conformity with U.S. GAAP requires management to make estimates and assumptions that affect the reported amounts of assets and liabilities at the date of the financial statements and the reported amounts of income and expense during the reporting period. Actual results could differ from those estimates.
G Indemnifications—Under the Portfolio’s organizational documents, its officers and Trustees may be indemnified against certain liabilities and expenses arising out of the performance of their duties to the Portfolio. Under Massachusetts law, if certain conditions prevail, interestholders in the Portfolio could be deemed to have personal liability for the obligations of the Portfolio. However, the Portfolio’s Declaration of Trust contains an express disclaimer of liability on the part of Portfolio interestholders. Additionally, in the normal course of business, the Portfolio enters into agreements with service providers that may contain indemnification clauses. The Portfolio’s maximum exposure under these arrangements is unknown as this would involve future claims that may be made against the Portfolio that have not yet occurred.
2 Investment Adviser Fee and Other Transactions with Affiliates
The investment adviser fee is earned by Boston Management and Research (BMR), an indirect, wholly-owned subsidiary of Morgan Stanley, as compensation for investment advisory services rendered to the Portfolio. The fee is computed at an annual rate as a percentage of the Portfolio’s average daily net assets as follows and is payable monthly:
| Average Daily Net Assets | Annual Fee Rate |
| Up to $500 million | 0.650% |
| $500 million but less than $1 billion | 0.625% |
| $1 billion but less than $2.5 billion | 0.600% |
| $2.5 billion and over | 0.600% |
For the year ended October 31, 2023, the investment adviser fee amounted to $1,295,731 or 0.65% of the Portfolio’s average daily net assets. The Portfolio may invest in a money market fund, the Institutional Class of the Morgan Stanley Institutional Liquidity Funds - Government Portfolio (the “Liquidity Fund”), an open-end management investment company managed by Morgan Stanley Investment Management Inc., a wholly-owned subsidiary of Morgan Stanley. The investment adviser fee paid by the Portfolio is reduced by an amount equal to its pro rata share of the advisory and administration fees paid by the Portfolio due to its investment in the Liquidity Fund. For the year ended October 31, 2023, the investment adviser fee paid was reduced by $4,074 relating to the Portfolio’s investment in the Liquidity Fund.
Trustees and officers of the Portfolio who are members of BMR’s organization receive remuneration for their services to the Portfolio out of the investment adviser fee. Trustees of the Portfolio who are not affiliated with the investment adviser may elect to defer receipt of all or a percentage of their annual fees in accordance with the terms of the Trustees Deferred Compensation Plan. Certain officers and Trustees of the Portfolio are officers of the above organization.
3 Purchases and Sales of Investments
Purchases and sales of investments, other than short-term obligations and in-kind transactions, aggregated $4,411,345 and $3,842,116, respectively, for the year ended October 31, 2023. In-kind sales for the year ended October 31, 2023 aggregated $3,445,829.
Tax-Managed Multi-Cap Growth Portfolio
October 31, 2023
Notes to Financial Statements — continued
4 Federal Income Tax Basis of Investments
The cost and unrealized appreciation (depreciation) of investments of the Portfolio at October 31, 2023, as determined on a federal income tax basis, were as follows:
| Aggregate cost | $ 68,931,672 |
| Gross unrealized appreciation | $ 140,101,638 |
| Gross unrealized depreciation | (1,052,996) |
| Net unrealized appreciation | $139,048,642 |
5 Line of Credit
The Portfolio participates with other portfolios and funds managed by BMR and its affiliates in a $650 million unsecured revolving line of credit agreement with a group of banks, which is in effect through October 22, 2024. In connection with the renewal of the agreement on October 24, 2023, the borrowing limit was decreased from $725 million. Borrowings are made by the Portfolio solely for temporary purposes related to redemptions and other short-term cash needs. Interest is charged to the Portfolio based on its borrowings at an amount above either the Secured Overnight Financing Rate (SOFR) or Federal Funds rate. In addition, a fee computed at an annual rate of 0.15% on the daily unused portion of the line of credit is allocated among the participating portfolios and funds at the end of each quarter. In connection with the renewal of the agreement in October 2023, an arrangement fee totaling $150,000 was incurred that was allocated to the participating portfolios and funds. Because the line of credit is not available exclusively to the Portfolio, it may be unable to borrow some or all of its requested amounts at any particular time. The Portfolio did not have any significant borrowings or allocated fees during the year ended October 31, 2023.
6 Affiliated Investments
At October 31, 2023, the value of the Portfolio's investment in funds that may be deemed to be affiliated was $957,927, which represents 0.5% of the Portfolio's net assets. Transactions in such investments by the Portfolio for the year ended October 31, 2023 were as follows:
| Name | Value,
beginning
of period | Purchases | Sales
proceeds | Net
realized
gain (loss) | Change in
unrealized
appreciation
(depreciation) | Value, end
of period | Dividend
income | Shares,
end of period |
| Short-Term Investments |
| Liquidity Fund | $1,264,568 | $7,870,832 | $(8,177,473) | $ — | $ — | $957,927 | $124,258 | 957,927 |
7 Fair Value Measurements
Under generally accepted accounting principles for fair value measurements, a three-tier hierarchy to prioritize the assumptions, referred to as inputs, is used in valuation techniques to measure fair value. The three-tier hierarchy of inputs is summarized in the three broad levels listed below.
| • | Level 1 – quoted prices in active markets for identical investments |
| • | Level 2 – other significant observable inputs (including quoted prices for similar investments, interest rates, prepayment speeds, credit risk, etc.) |
| • | Level 3 – significant unobservable inputs (including a fund's own assumptions in determining the fair value of investments) |
In cases where the inputs used to measure fair value fall in different levels of the fair value hierarchy, the level disclosed is determined based on the lowest level input that is significant to the fair value measurement in its entirety. The inputs or methodology used for valuing securities are not necessarily an indication of the risk associated with investing in those securities.
Tax-Managed Multi-Cap Growth Portfolio
October 31, 2023
Notes to Financial Statements — continued
At October 31, 2023, the hierarchy of inputs used in valuing the Portfolio's investments, which are carried at fair value, were as follows:
| Asset Description | Level 1 | Level 2 | Level 3 | Total |
| Common Stocks | $ 207,022,387* | $ — | $ — | $ 207,022,387 |
| Short-Term Investments | 957,927 | — | — | 957,927 |
| Total Investments | $ 207,980,314 | $ — | $ — | $207,980,314 |
| * | The level classification by major category of investments is the same as the category presentation in the Portfolio of Investments. |
Tax-Managed Multi-Cap Growth Portfolio
October 31, 2023
Report of Independent Registered Public Accounting Firm
To the Trustees and Investors of Tax-Managed Multi-Cap Growth Portfolio:
Opinion on the Financial Statements and Financial Highlights
We have audited the accompanying statement of assets and liabilities of Tax-Managed Multi-Cap Growth Portfolio (the “Portfolio"), including the portfolio of investments, as of October 31, 2023, the related statement of operations for the year then ended, the statements of changes in net assets for each of the two years in the period then ended, the financial highlights for each of the five years in the period then ended, and the related notes. In our opinion, the financial statements and financial highlights present fairly, in all material respects, the financial position of the Portfolio as of October 31, 2023, and the results of its operations for the year then ended, the changes in its net assets for each of the two years in the period then ended, and the financial highlights for each of the five years in the period then ended, in conformity with accounting principles generally accepted in the United States of America.
Basis for Opinion
These financial statements and financial highlights are the responsibility of the Portfolio’s management. Our responsibility is to express an opinion on the Portfolio’s financial statements and financial highlights based on our audits. We are a public accounting firm registered with the Public Company Accounting Oversight Board (United States) (PCAOB) and are required to be independent with respect to the Portfolio in accordance with the U.S. federal securities laws and the applicable rules and regulations of the Securities and Exchange Commission and the PCAOB.
We conducted our audits in accordance with the standards of the PCAOB. Those standards require that we plan and perform the audit to obtain reasonable assurance about whether the financial statements and financial highlights are free of material misstatement, whether due to error or fraud. The Portfolio is not required to have, nor were we engaged to perform, an audit of its internal control over financial reporting. As part of our audits we are required to obtain an understanding of internal control over financial reporting but not for the purpose of expressing an opinion on the effectiveness of the Portfolio’s internal control over financial reporting. Accordingly, we express no such opinion.
Our audits included performing procedures to assess the risks of material misstatement of the financial statements and financial highlights, whether due to error or fraud, and performing procedures that respond to those risks. Such procedures included examining, on a test basis, evidence regarding the amounts and disclosures in the financial statements and financial highlights. Our audits also included evaluating the accounting principles used and significant estimates made by management, as well as evaluating the overall presentation of the financial statements and financial highlights. Our procedures included confirmation of securities owned as of October 31, 2023, by correspondence with the custodian and brokers; when replies were not received from brokers, we performed other auditing procedures. We believe that our audits provide a reasonable basis for our opinion.
/s/ Deloitte & Touche LLP
Boston, Massachusetts
December 19, 2023
We have served as the auditor of one or more Eaton Vance investment companies since 1959.
Eaton Vance
Tax-Managed Multi-Cap Growth Fund
October 31, 2023
Board of Trustees’ Contract Approval
Overview of the Contract Review Process
The Investment Company Act of 1940, as amended (the “1940 Act”), provides, in substance, that the investment advisory agreement between a fund and its investment adviser will continue in effect from year-to-year only if its continuation is approved on an annual basis by a vote of the fund’s board of trustees, including a majority of the trustees who are not “interested persons” of the fund (“independent trustees”), cast in person at a meeting called for the purpose of considering such approval.
At a meeting held on June 8, 2023, the Boards of Trustees/Directors (collectively, the “Board”) that oversee the registered investment companies advised by Eaton Vance Management or its affiliate, Boston Management and Research (the “Eaton Vance Funds”), including a majority of the independent trustees (the “Independent Trustees”), voted to approve the continuation of existing investment advisory agreements and sub-advisory agreements1 for each of the Eaton Vance Funds for an additional one-year period. The Board relied upon the affirmative recommendation of its Contract Review Committee, which is a committee exclusively comprised of Independent Trustees. Prior to making its recommendation, the Contract Review Committee reviewed information furnished by the adviser and sub-adviser to each of the Eaton Vance Funds (including information specifically requested by the Board) for a series of formal meetings held between April and June 2023, as well as certain additional information provided in response to specific requests from the Independent Trustees as members of the Contract Review Committee. Members of the Contract Review Committee also considered information received at prior meetings of the Board and its committees, to the extent such information was relevant to the Contract Review Committee’s annual evaluation of the investment advisory agreements and sub-advisory agreements.
In connection with its evaluation of the investment advisory agreements and sub-advisory agreements, the Board considered various information relating to the Eaton Vance Funds. This included information applicable to all or groups of Eaton Vance Funds, which is referenced immediately below, and information applicable to the particular Eaton Vance Fund covered by this report (each “Eaton Vance Fund” is referred to below as a “fund”). (For funds that invest through one or more underlying portfolios, references to “each fund” in this section may include information that was considered at the portfolio-level.)
Information about Fees, Performance and Expenses
• A report from an independent data provider comparing advisory and other fees paid by each fund to such fees paid by comparable funds, as identified by the independent data provider (“comparable funds”);
• A report from an independent data provider comparing each fund’s total expense ratio (and its components) to those of comparable funds;
• A report from an independent data provider comparing the investment performance of each fund (including, as relevant, total return data, income data, Sharpe ratios and information ratios) to the investment performance of comparable funds and, as applicable, benchmark indices, over various time periods;
• In certain instances, data regarding investment performance relative to customized groups of peer funds and blended indices identified by the adviser in consultation with the Portfolio Management Committee of the Board (a committee exclusively comprised of Independent Trustees);
• Comparative information concerning the fees charged and services provided by the adviser and sub-adviser to each fund in managing other accounts (which may include other mutual funds, collective investment funds and institutional accounts) using investment strategies and techniques similar to those used in managing such fund(s), if any;
• Profitability analyses with respect to the adviser and sub-adviser to each of the funds;
Information about Portfolio Management and Trading
• Descriptions of the investment management services provided to each fund, as well as each of the funds’ investment strategies and policies;
• The procedures and processes used to determine the value of fund assets, including, when necessary, the determination of “fair value” and actions taken to monitor and test the effectiveness of such procedures and processes;
• Information about the policies and practices of each fund’s adviser and sub-adviser with respect to trading, including their processes for seeking best execution of portfolio transactions;
• Information about the allocation of brokerage transactions and the benefits, if any, received by the adviser and sub-adviser to each fund as a result of brokerage allocation, including, as applicable, information concerning the acquisition of research through client commission arrangements and policies with respect to “soft dollars”;
• Data relating to the portfolio turnover rate of each fund and related information regarding active management in the context of particular strategies;
Information about each Adviser and Sub-adviser
• Reports detailing the financial results and condition of the adviser and sub-adviser to each fund;
1 Not all Eaton Vance Funds have entered into a sub-advisory agreement with a sub-adviser. Accordingly, references to “sub-adviser” or “sub-advisory agreement” in this “Overview” section may not be applicable to the particular Eaton Vance Fund covered by this report.
Eaton Vance
Tax-Managed Multi-Cap Growth Fund
October 31, 2023
Board of Trustees’ Contract Approval — continued
• Information regarding the individual investment professionals whose responsibilities include portfolio management and investment research for the funds, and, for portfolio managers and certain other investment professionals, information relating to their responsibilities with respect to managing other mutual funds and investment accounts, as applicable;
• Information regarding the adviser’s and its parent company’s (Morgan Stanley’s) efforts to retain and attract talented investment professionals, including in the context of a competitive marketplace for talent, as well as the ongoing unique environment presented by hybrid, remote and other alternative work arrangements;
• Information regarding the adviser’s compensation methodology for its investment professionals and the incentives and accountability it creates, along with investment professionals’ investments in the fund(s) they manage;
• The Code of Ethics of the adviser and its affiliates and the sub-adviser of each fund, together with information relating to compliance with, and the administration of, such codes;
• Policies and procedures relating to proxy voting, including regular reporting with respect to fund proxy voting activities;
• Information regarding the handling of corporate actions and class actions, as well as information regarding litigation and other regulatory matters;
• Information concerning the resources devoted to compliance efforts undertaken by the adviser and its affiliates and the sub-adviser of each fund, if any, including descriptions of their various compliance programs and their record of compliance;
• Information concerning the business continuity and disaster recovery plans of the adviser and its affiliates and the sub-adviser of each fund, if any;
• A description of Eaton Vance Management’s and Boston Management and Research’s oversight of sub-advisers, including with respect to regulatory and compliance issues, investment management and other matters;
Other Relevant Information
• Information regarding ongoing initiatives to further integrate and harmonize, where applicable, the investment management and other departments of the adviser and its affiliates with the overall investment management infrastructure of Morgan Stanley, in light of Morgan Stanley’s acquisition of Eaton Vance Corp. on March 1, 2021;
• Information concerning the nature, cost and character of the administrative and other non-investment advisory services provided by Eaton Vance Management and its affiliates;
• Information concerning oversight of the relationship with the custodian, subcustodians, fund accountants, and other third-party service providers by the adviser and/or administrator to each of the funds;
• Information concerning efforts to implement policies and procedures with respect to various recently adopted regulations applicable to the funds, including Rule 12d1-4 (the Fund-of-Funds Rule), Rule 18f-4 (the Derivatives Rule) and Rule 2a-5 (the Fair Valuation Rule);
• For an Eaton Vance Fund structured as an exchange-listed closed-end fund, information concerning the benefits of the closed-end fund structure, as well as, where relevant, the closed-end fund’s market prices (including as compared to the closed-end fund’s net asset value (NAV)), trading volume data, continued use of auction preferred shares (where applicable), distribution rates and other relevant matters;
• The risks which the adviser and/or its affiliates incur in connection with the management and operation of the funds, including, among others, litigation, regulatory, entrepreneurial, and other business risks (and the associated costs of such risks); and
• The terms of each investment advisory agreement and sub-advisory agreement.
During the various meetings of the Board and its committees over the course of the year leading up to the June 8, 2023 meeting, the Board received information from portfolio managers and other investment professionals of the advisers and sub-advisers of the funds regarding investment and performance matters, and considered various investment and trading strategies used in pursuing the funds’ investment objectives. The Board also received information regarding risk management techniques employed in connection with the management of the funds. The Board and its committees evaluated issues pertaining to industry and regulatory developments, compliance procedures, fund governance and other issues with respect to the funds, and received and participated in reports and presentations provided by Eaton Vance Management, Boston Management and Research and fund sub-advisers, with respect to such matters. In addition to the formal meetings of the Board and its committees, the Independent Trustees held regular teleconferences to discuss, among other topics, matters relating to the continuation of investment advisory agreements and sub-advisory agreements.
The Contract Review Committee was advised throughout the contract review process by Goodwin Procter LLP, independent legal counsel for the Independent Trustees. The members of the Contract Review Committee, with the advice of such counsel, exercised their own business judgment in determining the material factors to be considered in evaluating each investment advisory agreement and sub-advisory agreement and the weight to be given to each such factor. The conclusions reached with respect to each investment advisory agreement and sub-advisory agreement were based on a comprehensive evaluation of all the information provided and not any single factor. Moreover, each member of the Contract Review Committee may have placed varying emphasis on particular factors in reaching conclusions with respect to each investment advisory agreement and sub-advisory agreement. In evaluating each investment advisory agreement and sub-advisory agreement, including the fee structures and other terms contained in such agreements, the members of the Contract Review Committee were also informed by multiple years of analysis and discussion with the adviser and sub-adviser to each of the Eaton Vance Funds.
Eaton Vance
Tax-Managed Multi-Cap Growth Fund
October 31, 2023
Board of Trustees’ Contract Approval — continued
Results of the Contract Review Process
Based on its consideration of the foregoing, and such other information it deemed relevant, including the factors and conclusions described below, the Contract Review Committee concluded that the continuation of the investment advisory agreement between Eaton Vance Tax-Managed Multi-Cap Growth Fund (the “Fund”) and Eaton Vance Management (“EVM”), as well as the investment advisory agreement between Tax-Managed Multi-Cap Growth Portfolio (the “Portfolio”), the portfolio in which the Fund invests, and Boston Management and Research (“BMR”) (EVM, with respect to the Fund, and BMR, with respect to the Portfolio, are each referred to herein as the “Adviser”), including their respective fee structures, are in the interests of shareholders and, therefore, recommended to the Board approval of each agreement. Based on the recommendation of the Contract Review Committee, the Board, including a majority of the Independent Trustees, voted to approve continuation of the investment advisory agreements for the Fund and the Portfolio (together, the “investment advisory agreements”).
Nature, Extent and Quality of Services
In considering whether to approve the investment advisory agreements for the Fund and the Portfolio, the Board evaluated the nature, extent and quality of services provided to the Fund and to the Portfolio by the applicable Adviser.
The Board considered each Adviser’s management capabilities and investment processes in light of the types of investments held by the Fund and the Portfolio, including the education, experience and number of investment professionals and other personnel who provide portfolio management, investment research, and similar services to the Portfolio, including recent changes to such personnel. The Board specifically noted that each Adviser has devoted extensive resources to in-house equity research capabilities and also draws upon independent research available from third-party sources. The Board considered each Adviser’s experience managing funds that seek to maximize after-tax returns. The Board also took into account the resources dedicated to portfolio management and other services, the compensation methods of each Adviser and other factors, including the reputation and resources of each Adviser to recruit and retain highly qualified research, advisory and supervisory investment professionals. In addition, the Board considered the time and attention devoted to the Eaton Vance Funds, including the Fund and the Portfolio, by senior management, as well as the infrastructure, operational capabilities and support staff in place to assist in the portfolio management and operations of the Fund and the Portfolio, including the provision of administrative services. The Board also considered the business-related and other risks to which each Adviser or its affiliates may be subject in managing the Fund and the Portfolio.
The Board noted that, under the terms of the investment advisory agreement of the Fund, EVM may invest assets of the Fund directly in securities, for which it would receive a fee, or in the Portfolio, for which it receives no separate fee but for which BMR receives an advisory fee from the Portfolio.
The Board considered the compliance programs of each Adviser and relevant affiliates thereof. The Board considered compliance and reporting matters regarding, among other things, personal trading by investment professionals, disclosure of portfolio holdings, late trading, frequent trading, portfolio valuation, business continuity and the allocation of investment opportunities. The Board also considered the responses of each Adviser and its affiliates to requests in recent years from regulatory authorities, such as the Securities and Exchange Commission and the Financial Industry Regulatory Authority.
The Board considered other administrative services provided or overseen by EVM and its affiliates, including transfer agency and accounting services. The Board evaluated the benefits to shareholders of investing in a fund that is a part of a large fund complex offering exposure to a variety of asset classes and investment disciplines, as well as the ability, in many cases, to exchange an investment among different funds without incurring additional sales charges.
After consideration of the foregoing factors, among others, the Board concluded that the nature, extent and quality of services provided by each Adviser, taken as a whole, are appropriate and consistent with the terms of the applicable investment advisory agreement.
Fund Performance
The Board compared the Fund’s investment performance to that of comparable funds identified by an independent data provider (the peer group), as well as appropriate benchmark indices. The Board’s review included comparative performance data with respect to the Fund for the one-, three-, five- and ten-year periods ended December 31, 2022. In this regard, the Board noted that the performance of the Fund was higher than the median performance of the Fund’s peer group for the three-year period. The Board also noted that the performance of the Fund was lower than its primary and secondary benchmark indexes for the three-year period. The Board concluded that the performance of the Fund was satisfactory.
Management Fees and Expenses
The Board considered contractual fee rates payable by the Portfolio and by the Fund for advisory and administrative services (referred to collectively as “management fees”). As part of its review, the Board considered the Fund’s management fees and total expense ratio for the one-year period ended December 31, 2022, as compared to those of comparable funds, before and after giving effect to any undertaking to waive fees or reimburse expenses. The Board also considered factors that had an impact on the Fund’s total expense ratio relative to comparable funds.
After considering the foregoing information, and in light of the nature, extent and quality of the services provided by each Adviser, the Board concluded that the management fees charged for advisoryand related services are reasonable.
Eaton Vance
Tax-Managed Multi-Cap Growth Fund
October 31, 2023
Board of Trustees’ Contract Approval — continued
Profitability and “Fall-Out” Benefits
The Board considered the level of profits realized by each Adviser and relevant affiliates thereof in providing investment advisory and administrative services to the Fund, to the Portfolio and to all Eaton Vance Funds as a group. The Board considered the level of profits realized without regard to marketing support or other payments by each Adviser and its affiliates to third parties in respect of distribution or other services.
The Board concluded that, in light of the foregoing factors and the nature, extent and quality of the services rendered, the profits realized by each Adviser and its affiliates are deemed not to be excessive.
The Board also considered direct or indirect fall-out benefits received by each Adviser and its affiliates in connection with their respective relationships with the Fund and the Portfolio, including the benefits of research services that may be available to each Adviser as a result of securities transactions effected for the Fund and the Portfolio and other investment advisory clients.
Economies of Scale
In reviewing management fees and profitability, the Board also considered the extent to which the applicable Adviser and its affiliates, on the one hand, and the Fund and the Portfolio, on the other hand, can expect to realize benefits from economies of scale as the assets of the Fund and the Portfolio increase. The Board acknowledged the difficulty in accurately measuring the benefits resulting from economies of scale, if any, with respect to the management of any specific fund or group of funds. The Board reviewed data summarizing the increases and decreases in the assets of the Fund and of all Eaton Vance Funds as a group over various time periods, and evaluated the extent to which the total expense ratio of the Fund and the profitability of each Adviser and its affiliates may have been affected by such increases or decreases. Based upon the foregoing, the Board concluded that the Fund currently shares in the benefits from economies of scale, if any, when they are realized by each Adviser. The Board also concluded that the structure of the advisory fees, which include breakpoints at several asset levels, will allow the Fund and the Portfolio to continue to benefit from any economies of scale in the future.
Eaton Vance
Tax-Managed Multi-Cap Growth Fund
October 31, 2023
Liquidity Risk Management Program
The Fund has implemented a written liquidity risk management program (Program) and related procedures to manage its liquidity in accordance with Rule 22e-4 under the Investment Company Act of 1940, as amended (Liquidity Rule). The Liquidity Rule defines “liquidity risk” as the risk that a fund could not meet requests to redeem shares issued by the fund without significant dilution of the remaining investors’ interests in the fund. The Fund’s Board of Trustees/Directors has designated the investment adviser to serve as the administrator of the Program and the related procedures. The administrator has established a Liquidity Risk Management Oversight Committee (Committee) to perform the functions necessary to administer the Program. As part of the Program, the administrator is responsible for identifying illiquid investments and categorizing the relative liquidity of the Fund’s investments in accordance with the Liquidity Rule. Under the Program, the administrator assesses, manages, and periodically reviews the Fund’s liquidity risk, and is responsible for making certain reports to the Fund’s Board of Trustees/Directors and the Securities and Exchange Commission (SEC) regarding the liquidity of the Fund’s investments, and to notify the Board of Trustees/Directors and the SEC of certain liquidity events specified in the Liquidity Rule. The liquidity of the Fund’s portfolio investments is determined based on a number of factors including, but not limited to, relevant market, trading and investment-specific considerations under the Program.
At a meeting of the Fund’s Board of Trustees/Directors on June 7, 2023, the Committee provided a written report to the Fund’s Board of Trustees/
Directors pertaining to the operation, adequacy, and effectiveness of implementation of the Program, as well as the operation of the highly liquid investment minimum (if applicable) for the period January 1, 2022 through December 31, 2022 (Review Period). The Program operated effectively during the Review Period, supporting the administrator’s ability to assess, manage and monitor Fund liquidity risk, including during periods of market volatility and net redemptions. During the Review Period, the Fund met redemption requests on a timely basis.
There can be no assurance that the Program will achieve its objectives in the future. Please refer to the Fund’s prospectus for more information regarding the Fund’s exposure to liquidity risk and other principal risks to which an investment in the Fund may be subject.
Eaton Vance
Tax-Managed Multi-Cap Growth Fund
October 31, 2023
Management and Organization
Fund Management. The Trustees of Eaton Vance Mutual Funds Trust (the Trust) and Tax-Managed Multi-Cap Growth Portfolio (the Portfolio) are responsible for the overall management and supervision of the the Trust's and the Portfolio's affairs. The Board members and officers of the Trust and the Portfolio are listed below. Except as indicated, each individual has held the office shown or other offices in the same company for the last five years. Board members hold indefinite terms of office. Each Trustee holds office until his or her successor is elected and qualified, subject to a prior death, resignation, retirement, disqualification or removal. Under the terms of the Fund's and the Portfolio's current Trustee retirement policy, an Independent Trustee must retire and resign as a Trustee on the earlier of: (i) the first day of July following his or her 74th birthday; or (ii), with limited exception, December 31st of the 20th year in which he or she has served as a Trustee. However, if such retirement and resignation would cause the Fund and the Portfolio to be out of compliance with Section 16 of the 1940 Act or any other regulations or guidance of the SEC, then such retirement and resignation will not become effective until such time as action has been taken for the Fund and the Portfolio to be in compliance therewith. The “noninterested Trustees” consist of those Trustees who are not “interested persons” of the Trust and the Portfolio, as that term is defined under the 1940 Act. The business address of each Board member and officer is Two International Place, Boston, Massachusetts 02110. As used below, “BMR” refers to Boston Management and Research, “EV” refers to EV LLC, “EVM” refers to Eaton Vance Management, “MSIM” refers to Morgan Stanley Investment Management Inc. and “EVD” refers to Eaton Vance Distributors, Inc. EV is the trustee of each of EVM and BMR. Each of EVM, BMR, EVD and EV are indirect, wholly owned subsidiaries of Morgan Stanley. Each officer affiliated with EVM may hold a position with other EVM affiliates that is comparable to his or her position with EVM listed below. Each Trustee oversees 127 funds in the Eaton Vance fund complex (including both funds and portfolios in a hub and spoke structure).
| Name and Year of Birth | Trust/Portfolio
Position(s) | Length of Service | Principal Occupation(s) and Other Directorships
During Past Five Years and Other Relevant Experience |
| Interested Trustee |
Anchal Pachnanda(1)
1980 | Trustee | Since 2023 | Co-Head of Strategy of MSIM (since 2019). Formerly, Head of Strategy of MSIM (2017-2019). Ms. Pachnanda is an interested person because of her position with MSIM, which is an affiliate of the Trust.
Other Directorships. None. |
| Noninterested Trustees |
Alan C. Bowser
1962 | Trustee | Since 2022 | Private investor. Formerly, Chief Diversity Officer, Partner and a member of the Operating Committee, and formerly served as Senior Advisor on Diversity and Inclusion for the firm’s chief executive officer, Co-Head of the Americas Region, and Senior Client Advisor of Bridgewater Associates, an asset management firm (2011- 2023).
Other Directorships. Independent Director of Stout Risius Ross (a middle market professional services advisory firm) (since 2021). |
Mark R. Fetting
1954 | Trustee | Since 2016 | Private investor. Formerly held various positions at Legg Mason, Inc. (investment management firm) (2000-2012), including President, Chief Executive Officer, Director and Chairman (2008-2012), Senior Executive Vice President (2004-2008) and Executive Vice President (2001-2004). Formerly, President of Legg Mason family of funds (2001-2008). Formerly, Division President and Senior Officer of Prudential Financial Group, Inc. and related companies (investment management firm) (1991-2000).
Other Directorships. None. |
Cynthia E. Frost
1961 | Trustee | Since 2014 | Private investor. Formerly, Chief Investment Officer of Brown University (university endowment) (2000-2012). Formerly, Portfolio Strategist for Duke Management Company (university endowment manager) (1995-2000). Formerly, Managing Director, Cambridge Associates (investment consulting company) (1989-1995). Formerly, Consultant, Bain and Company (management consulting firm) (1987-1989). Formerly, Senior Equity Analyst, BA Investment Management Company (1983-1985).
Other Directorships. None. |
George J. Gorman
1952 | Chairperson of the
Board and Trustee | Since 2021
(Chairperson) and 2014 (Trustee) | Principal at George J. Gorman LLC (consulting firm). Formerly, Senior Partner at Ernst & Young LLP (a registered public accounting firm) (1974-2009).
Other Directorships. None. |
Eaton Vance
Tax-Managed Multi-Cap Growth Fund
October 31, 2023
Management and Organization — continued
| Name and Year of Birth | Trust/Portfolio
Position(s) | Length of Service | Principal Occupation(s) and Other Directorships
During Past Five Years and Other Relevant Experience |
| Noninterested Trustees (continued) |
Valerie A. Mosley
1960 | Trustee | Since 2014 | Chairwoman and Chief Executive Officer of Valmo Ventures (a consulting and investment firm). Founder of Upward Wealth, Inc., dba BrightUp, a fintech platform. Formerly, Partner and Senior Vice President, Portfolio Manager and Investment Strategist at Wellington Management Company, LLP (investment management firm) (1992-2012). Formerly, Chief Investment Officer, PG Corbin Asset Management (1990-1992). Formerly worked in institutional corporate bond sales at Kidder Peabody (1986-1990).
Other Directorships. Director of DraftKings, Inc. (digital sports entertainment and gaming company) (since September 2020). Director of Envestnet, Inc. (provider of intelligent systems for wealth management and financial wellness) (since 2018). Formerly, Director of Dynex Capital, Inc. (mortgage REIT) (2013-2020) and Director of Groupon, Inc. (e-commerce provider) (2020-2022). |
Keith Quinton
1958 | Trustee | Since 2018 | Private investor, researcher and lecturer. Formerly, Independent Investment Committee Member at New Hampshire Retirement System (2017-2021). Formerly, Portfolio Manager and Senior Quantitative Analyst at Fidelity Investments (investment management firm) (2001-2014).
Other Directorships. Formerly, Director (2016-2021) and Chairman (2019-2021) of New Hampshire Municipal Bond Bank. |
Marcus L. Smith
1966 | Trustee | Since 2018 | Private investor and independent corporate director. Formerly, Chief Investment Officer, Canada (2012-2017), Chief Investment Officer, Asia (2010-2012), Director of Asian Research (2004-2010) and portfolio manager (2001-2017) at MFS Investment Management (investment management firm).
Other Directorships. Director of First Industrial Realty Trust, Inc. (an industrial REIT) (since 2021). Director of MSCI Inc. (global provider of investment decision support tools) (since 2017). Formerly, Director of DCT Industrial Trust Inc. (logistics real estate company) (2017-2018). |
Susan J. Sutherland
1957 | Trustee | Since 2015 | Private investor. Director of Ascot Group Limited and certain of its subsidiaries (insurance and reinsurance) (since 2017). Formerly, Director of Hagerty Holding Corp. (insurance) (2015-2018) and Montpelier Re Holdings Ltd. (insurance and reinsurance) (2013-2015). Formerly, Associate, Counsel and Partner at Skadden, Arps, Slate, Meagher & Flom LLP (law firm) (1982-2013).
Other Directorships. Formerly, Director of Kairos Acquisition Corp. (insurance/InsurTech acquisition company) (2021-2023). |
Scott E. Wennerholm
1959 | Trustee | Since 2016 | Private investor. Formerly, Trustee at Wheelock College (postsecondary institution) (2012-2018). Formerly, Consultant at GF Parish Group (executive recruiting firm) (2016-2017). Formerly, Chief Operating Officer and Executive Vice President at BNY Mellon Asset Management (investment management firm) (2005-2011). Formerly, Chief Operating Officer and Chief Financial Officer at Natixis Global Asset Management (investment management firm) (1997-2004). Formerly, Vice President at Fidelity Investments Institutional Services (investment management firm) (1994-1997).
Other Directorships. None. |
Nancy A. Wiser
1967 | Trustee | Since 2022 | Formerly, Executive Vice President and the Global Head of Operations at Wells Fargo Asset Management (2011-2021).
Other Directorships. None. |
| Name and Year of Birth | Trust/Portfolio
Position(s) | Length of Service | Principal Occupation(s)
During Past Five Years |
| Principal Officers who are not Trustees |
Kenneth A. Topping
1966 | President of the
Trust | Since 2023 | Vice President and Chief Administrative Officer of EVM and BMR and Chief Operating Officer for Public Markets at MSIM. Also Vice President of Calvert Research and Management (“CRM”) since 2021. Formerly, Chief Operating Officer for Goldman Sachs Asset Management ‘Classic’ (2009-2020). |
R. Kelly Williams, Jr.
1971 | President of the
Portfolio | Since 2023 | President and Chief Operating Officer of Atlanta Capital Management Company, LLC. Officer of 21 registered investment companies managed by Eaton Vance or BMR. |
Eaton Vance
Tax-Managed Multi-Cap Growth Fund
October 31, 2023
Management and Organization — continued
| Name and Year of Birth | Trust/Portfolio
Position(s) | Length of Service | Principal Occupation(s)
During Past Five Years |
| Principal Officers who are not Trustees (continued) |
Deidre E. Walsh
1971 | Vice President and Chief
Legal Officer | Since 2009 | Vice President of EVM and BMR. Also Vice President of CRM. |
James F. Kirchner
1967 | Treasurer | Since 2007 | Vice President of EVM and BMR. Also Vice President of CRM. |
Nicholas S. Di Lorenzo
1987 | Secretary | Since 2022 | Formerly, associate (2012-2021) and counsel (2022) at Dechert LLP. |
Richard F. Froio
1968 | Chief Compliance
Officer | Since 2017 | Vice President of EVM and BMR since 2017. Formerly Deputy Chief Compliance Officer (Adviser/Funds) and Chief Compliance Officer (Distribution) at PIMCO (2012-2017) and Managing Director at BlackRock/Barclays Global Investors (2009-2012). |
(1) Ms. Pachnanda began serving as Trustee effective April 1, 2023.
The SAI for the Fund includes additional information about the Trustees and officers of the Fund and the Portfolio and can be obtained without charge on Eaton Vance’s website at www.eatonvance.com or by calling 1-800-262-1122.
| FACTS | WHAT DOES EATON VANCE DO WITH YOUR
PERSONAL INFORMATION? |
| Why? | Financial companies choose how they share your personal information. Federal law gives consumers the right to limit some but not all sharing. Federal law also requires us to tell you how we collect, share, and protect your personal information. Please read this notice carefully to understand what we do. |
| |
| What? | The types of personal information we collect and share depend on the product or service you have with us. This information can include:■ Social Security number and income
■ investment experience and risk tolerance
■ checking account number and wire transfer instructions |
| |
| How? | All financial companies need to share customers’ personal information to run their everyday business. In the section below, we list the reasons financial companies can share their customers’ personal information; the reasons Eaton Vance chooses to share; and whether you can limit this sharing. |
Reasons we can share your
personal information | Does Eaton Vance
share? | Can you limit
this sharing? |
| For our everyday business purposes — such as to process your transactions, maintain your account(s), respond to court orders and legal investigations, or report to credit bureaus | Yes | No |
| For our marketing purposes — to offer our products and services to you | Yes | No |
| For joint marketing with other financial companies | No | We don’t share |
| For our investment management affiliates’ everyday business purposes — information about your transactions, experiences, and creditworthiness | Yes | Yes |
| For our affiliates’ everyday business purposes — information about your transactions and experiences | Yes | No |
| For our affiliates’ everyday business purposes — information about your creditworthiness | No | We don’t share |
| For our investment management affiliates to market to you | Yes | Yes |
| For our affiliates to market to you | No | We don’t share |
| For nonaffiliates to market to you | No | We don’t share |
To limit our
sharing | Call toll-free 1-800-262-1122 or email: EVPrivacy@eatonvance.comPlease note:If you are a new customer, we can begin sharing your information 30 days from the date we sent this notice. When you are no longer our customer, we continue to share your information as described in this notice. However, you can contact us at any time to limit our sharing. |
| Questions? | Call toll-free 1-800-262-1122 or email: EVPrivacy@eatonvance.com |
| Privacy Notice — continued | April 2021 |
| Who we are |
| Who is providing this notice? | Eaton Vance Management, Eaton Vance Distributors, Inc., Eaton Vance Trust Company, Eaton Vance Management (International) Limited, Eaton Vance Advisers International Ltd., Eaton Vance Global Advisors Limited, Eaton Vance Management’s Real Estate Investment Group, Boston Management and Research, Calvert Research and Management, Eaton Vance and Calvert Fund Families and our investment advisory affiliates (“Eaton Vance”) (see Investment Management Affiliates definition below) |
| What we do |
How does Eaton Vance
protect my personal
information? | To protect your personal information from unauthorized access and use, we use security measures that comply with federal law. These measures include computer safeguards and secured files and buildings. We have policies governing the proper handling of customer information by personnel and requiring third parties that provide support to adhere to appropriate security standards with respect to such information. |
How does Eaton Vance
collect my personal
information? | We collect your personal information, for example, when you■ open an account or make deposits or withdrawals from your account
■ buy securities from us or make a wire transfer
■ give us your contact informationWe also collect your personal information from others, such as credit bureaus, affiliates, or other companies. |
| Why can’t I limit all sharing? | Federal law gives you the right to limit only■ sharing for affiliates’ everyday business purposes — information about your creditworthiness
■ affiliates from using your information to market to you
■ sharing for nonaffiliates to market to youState laws and individual companies may give you additional rights to limit sharing. See below for more on your rights under state law. |
| Definitions |
Investment Management
Affiliates | Eaton Vance Investment Management Affiliates include registered investment advisers, registered broker- dealers, and registered and unregistered funds. Investment Management Affiliates does not include entities associated with Morgan Stanley Wealth Management, such as Morgan Stanley Smith Barney LLC and Morgan Stanley & Co. |
| Affiliates | Companies related by common ownership or control. They can be financial and nonfinancial companies.■ Our affiliates include companies with a Morgan Stanley name and financial companies such as Morgan Stanley Smith Barney LLC and Morgan Stanley & Co. |
| Nonaffiliates | Companies not related by common ownership or control. They can be financial and nonfinancial companies.■ Eaton Vance does not share with nonaffiliates so they can market to you. |
| Joint marketing | A formal agreement between nonaffiliated financial companies that together market financial products or services to you.■ Eaton Vance doesn’t jointly market. |
| Other important information |
| Vermont: Except as permitted by law, we will not share personal information we collect about Vermont residents with Nonaffiliates unless you provide us with your written consent to share such information.California: Except as permitted by law, we will not share personal information we collect about California residents with Nonaffiliates and we will limit sharing such personal information with our Affiliates to comply with California privacy laws that apply to us. |
Delivery of Shareholder Documents. The Securities and Exchange Commission (SEC) permits funds to deliver only one copy of shareholder documents, including prospectuses, proxy statements and shareholder reports, to fund investors with multiple accounts at the same residential or post office box address. This practice is often called “householding” and it helps eliminate duplicate mailings to shareholders. Eaton Vance, or your financial intermediary, may household the mailing of your documents indefinitely unless you instruct Eaton Vance, or your financial intermediary, otherwise. If you would prefer that your Eaton Vance documents not be householded, please contact Eaton Vance at 1-800-262-1122, or contact your financial intermediary. Your instructions that householding not apply to delivery of your Eaton Vance documents will typically be effective within 30 days of receipt by Eaton Vance or your financial intermediary.
Portfolio Holdings. Each Eaton Vance Fund and its underlying Portfolio(s) (if applicable) files a schedule of portfolio holdings on Part F to Form N-PORT with the SEC. Certain information filed on Form N-PORT may be viewed on the Eaton Vance website at www.eatonvance.com, by calling Eaton Vance at 1-800-262-1122 or in the EDGAR database on the SEC’s website at www.sec.gov.
Proxy Voting. From time to time, funds are required to vote proxies related to the securities held by the funds. The Eaton Vance Funds or their underlying Portfolios (if applicable) vote proxies according to a set of policies and procedures approved by the Funds’ and Portfolios’ Boards. You may obtain a description of these policies and procedures and information on how the Funds or Portfolios voted proxies relating to portfolio securities during the most recent 12-month period ended June 30, without charge, upon request, by calling 1-800-262-1122 and by accessing the SEC’s website at www.sec.gov.
Tailored Shareholder Reports. Effective January 24, 2023, the SEC adopted rule and form amendments to require open-end mutual funds and ETFs to transmit concise and visually engaging streamlined annual and semiannual reports to shareholders that highlight key information. Other information, including financial statements, will no longer appear in a streamlined shareholder report but must be available online, delivered free of charge upon request, and filed on a semiannual basis on Form N-CSR. The rule and form amendments have a compliance date of July 24, 2024. At this time, management is evaluating the impact of these amendments on the shareholder reports for the Eaton Vance Funds.
This Page Intentionally Left Blank
Investment Adviser of Tax-Managed Multi-Cap Growth Portfolio
Boston Management and Research
Two International Place
Boston, MA 02110
Investment Adviser and Administrator of Eaton Vance
Tax-Managed Multi-Cap Growth Fund
Eaton Vance Management
Two International Place
Boston, MA 02110
Principal Underwriter*
Eaton Vance Distributors, Inc.
Two International Place
Boston, MA 02110
(617) 482-8260
Custodian
State Street Bank and Trust Company
One Congress Street, Suite 1
Boston, MA 02114-2016
Transfer Agent
BNY Mellon Investment Servicing (US) Inc.
Attn: Eaton Vance Funds
P.O. Box 534439
Pittsburgh, PA 15253-4439
(800) 262-1122
Independent Registered Public Accounting Firm
Deloitte & Touche LLP
200 Berkeley Street
Boston, MA 02116-5022
Fund Offices
Two International Place
Boston, MA 02110
* FINRA BrokerCheck. Investors may check the background of their Investment Professional by contacting the Financial Industry Regulatory Authority (FINRA). FINRA BrokerCheck is a free tool to help investors check the professional background of current and former FINRA-registered securities firms and brokers. FINRA BrokerCheck is available by calling 1-800-289-9999 and at www.FINRA.org. The FINRA BrokerCheck brochure describing this program is available to investors at www.FINRA.org.
Eaton Vance
Tax-Managed Small-Cap Fund
Annual Report
October 31, 2023
Commodity Futures Trading Commission Registration. The Commodity Futures Trading Commission (“CFTC”) has adopted regulations that subject registered investment companies and advisers to regulation by the CFTC if a fund invests more than a prescribed level of its assets in certain CFTC-regulated instruments (including futures, certain options and swap agreements) or markets itself as providing investment exposure to such instruments. The investment adviser has claimed an exclusion from the definition of “commodity pool operator” under the Commodity Exchange Act with respect to its management of the Fund. Accordingly, neither the Fund nor the adviser with respect to the operation of the Fund is subject to CFTC regulation. Because of its management of other strategies, the Fund's adviser is registered with the CFTC as a commodity pool operator. The adviser is also registered as a commodity trading advisor.
Fund shares are not insured by the FDIC and are not deposits or other obligations of, or guaranteed by, any depository institution. Shares are subject to investment risks, including possible loss of principal invested.
This report must be preceded or accompanied by a current summary prospectus or prospectus. Before investing, investors should consider carefully the investment objective, risks, and charges and expenses of a mutual fund. This and other important information is contained in the summary prospectus and prospectus, which can be obtained from a financial intermediary. Prospective investors should read the prospectus carefully before investing. For further information, please call 1-800-262-1122.
Annual Report October 31, 2023
Eaton Vance
Tax-Managed Small-Cap Fund
Eaton Vance
Tax-Managed Small-Cap Fund
October 31, 2023
Management’s Discussion of Fund Performance†
Economic and Market Conditions
For U.S. equity investors, the 12-month period ended October 31, 2023, was a roller-coaster ride, driven largely by shifting perceptions of whether the U.S. Federal Reserve (the Fed) could bring the world’s largest economy in for a soft landing, and changing expectations of how long interest rates might remain high.
During the opening month of the period, stocks rallied on strong corporate earnings, attractive valuations, and hope the Fed might slow the pace of its interest rate hikes. But in December 2022, equities lost ground as “higher for longer” interest rate fears returned. A continuing irony throughout the period was that good economic news -- record low unemployment, strong job creation, and robust consumer spending -- was viewed as bad news for inflation and fuel for future rate hikes that could weigh on stock prices.
In January 2023, however, U.S. equities began a rally that lasted through July. The initial tailwind was ChatGPT, an artificial intelligence (AI) application that led investors to perceive AI might become the next big innovation to drive the information technology (IT) sector. As a result, IT -- one of the worst-performing sectors in 2022 -- became the standout sector of the first half of 2023. Earlier recession fears that had weighed on stock prices receded as many investors came around to the view that the U.S. economy was doing surprisingly well.
But in the final three months of the period, the bond market halted the stock market’s momentum. As it became clear the Fed would keep rates higher for longer than investors had anticipated just a few months earlier, longer-term bond interest rates rose sharply. Given the potential for relatively attractive returns with lower risk than stocks, many investors shifted from equity assets to bonds. In the final two days of the period, however, signs of a stock rally emerged as investors began to believe the Fed might have reached the end of its monetary tightening cycle.
For the period as a whole, however, U.S. equity performance was solid. The S&P 500® Index, a broad measure of U.S. stocks, returned 10.14%; the blue-chip Dow Jones Industrial Average® returned 3.17%; and the tech-heavy Nasdaq Composite Index returned 17.99%.
Fund Performance
For the 12-month period ended October 31, 2023, Eaton Vance Tax-Managed Small-Cap Fund (the Fund) returned -7.62% for Class A shares at net asset value (NAV), outperforming its benchmark, the Russell 2000® Index, (the Index), which returned -8.56%.
Security selections, especially in the industrials and information technology sectors, contributed most to relative returns during the period. Selections in the consumer staples, real estate, and materials sectors also contributed. Although sector allocations overall detracted, an overweight exposure to the industrials sector benefited Index-relative performance.
In contrast, the Fund’s underweight exposure to the energy sector was the leading detractor from Index-relative returns during the period. An overweight exposure to the financials sector also weighed on performance relative to the Index. Security selections in the financials, consumer discretionary, and health care sectors further detracted from Index-relative returns.
On an individual stock basis, AZEK Co., Inc. (AZEK), a manufacturer of residential and commercial building products, was a leading contributor to relative returns during the period. AZEK’s share price rose on improved housing industry trends and better-than-expected demand for its products.
The share price of Chemed Corp., a diversified provider of hospice care and plumbing services, rose after the company announced third-quarter earnings that exceeded expectations.
Core & Main, Inc. (Core & Main) is a distributor of water, wastewater, storm drainage, and fire protection infrastructure products. Core & Main’s share price rose after the company reported double-digit sales growth for its 2022 fourth quarter. The company’s strong fiscal year resulted from several business acquisitions, and Core & Main’s ability to raise prices during the period due to its competitive market strength.
On the negative side, Agiliti, Inc. (Agiliti), which rents medical equipment to health care providers, detracted from relative performance during the period. Agiliti’s share price dropped after the company reduced its earnings projections. Agiliti’s profitable peak-need rental business declined as health care activity normalized after the pandemic.
The share price of Commerce Bancshares, Inc., a midwestern regional bank, also fell along with other peers in the banking sector as bond yields rose during the period.
The share price of Premier, Inc., a health care acquisition company, fell after Premier announced layoffs, and projected lower-than-expected revenue and earnings for its 2023 fiscal year.
See Endnotes and Additional Disclosures in this report.
Past performance is no guarantee of future results. Returns are historical and are calculated by determining the percentage change in net asset value (NAV) or offering price (as applicable) with all distributions reinvested. Furthermore, returns do not reflect the deduction of taxes that shareholders may have to pay on Fund distributions or upon the redemption of Fund shares. Investment return and principal value will fluctuate so that shares, when redeemed, may be worth more or less than their original cost. Performance for periods less than or equal to one year is cumulative. Performance is for the stated time period only; due to market volatility, current Fund performance may be lower or higher than the quoted return. For performance as of the most recent month-end, please refer to eatonvance.com.
Eaton Vance
Tax-Managed Small-Cap Fund
October 31, 2023
Performance
Portfolio Manager(s) J. Griffith Noble, CFA and Michael D. McLean, CFA
| % Average Annual Total Returns1,2 | Class
Inception Date | Performance
Inception Date | One Year | Five Years | Ten Years |
| Class A at NAV | 09/25/1997 | 09/25/1997 | (7.62)% | 4.47% | 6.26% |
| Class A with 5.25% Maximum Sales Charge | — | — | (12.48) | 3.35 | 5.69 |
| Class C at NAV | 09/29/1997 | 09/25/1997 | (8.31) | 3.70 | 5.63 |
| Class C with 1% Maximum Deferred Sales Charge | — | — | (9.20) | 3.70 | 5.63 |
| Class I at NAV | 10/01/2009 | 09/25/1997 | (7.40) | 4.74 | 6.53 |
|
| Russell 2000® Index | — | — | (8.56)% | 3.31% | 5.63% |
| % After-Tax Returns with Maximum Sales Charge2 | Class
Inception Date | Performance
Inception Date | One Year | Five Years | Ten Years |
| Class A After Taxes on Distributions | 09/25/1997 | 09/25/1997 | (8.13)% | 2.31% | 4.55% |
| Class A After Taxes on Distributions and Sale of Fund Shares | — | — | (3.94) | 2.73 | 4.47 |
| Class C After Taxes on Distributions | 09/29/1997 | 09/25/1997 | (8.95) | 2.44 | 4.31 |
| Class C After Taxes on Distributions and Sale of Fund Shares | — | — | (4.19) | 3.08 | 4.41 |
| Class I After Taxes on Distributions | 10/01/2009 | 09/25/1997 | (7.94) | 3.67 | 5.38 |
| Class I After Taxes on Distributions and Sale of Fund Shares | — | — | (3.77) | 3.82 | 5.17 |
| % Total Annual Operating Expense Ratios3 | Class A | Class C | Class I |
| | 1.15% | 1.90% | 0.90% |
Growth of $10,000
This graph shows the change in value of a hypothetical investment of $10,000 in Class A of the Fund for the period indicated. For comparison, the same investment is shown in the indicated index.
| Growth of Investment | Amount Invested | Period Beginning | At NAV | With Maximum Sales Charge |
| Class C | $10,000 | 10/31/2013 | $17,291 | N.A. |
| Class I, at minimum investment | $1,000,000 | 10/31/2013 | $1,882,767 | N.A. |
See Endnotes and Additional Disclosures in this report.
Past performance is no guarantee of future results. Returns are historical and are calculated by determining the percentage change in net asset value (NAV) or offering price (as applicable) with all distributions reinvested. Furthermore, returns do not reflect the deduction of taxes that shareholders may have to pay on Fund distributions or upon the redemption of Fund shares. Investment return and principal value will fluctuate so that shares, when redeemed, may be worth more or less than their original cost. Performance for periods less than or equal to one year is cumulative. Performance is for the stated time period only; due to market volatility, current Fund performance may be lower or higher than the quoted return. For performance as of the most recent month-end, please refer to eatonvance.com.
Eaton Vance
Tax-Managed Small-Cap Fund
October 31, 2023
| Sector Allocation (% of net assets)1 |
| Top 10 Holdings (% of net assets)1 |
| Chemed Corp. | 3.5% |
| CBIZ, Inc. | 3.3 |
| Wyndham Hotels & Resorts, Inc. | 2.9 |
| Core & Main, Inc., Class A | 2.7 |
| AptarGroup, Inc. | 2.7 |
| Valvoline, Inc. | 2.7 |
| Essential Properties Realty Trust, Inc. | 2.6 |
| White Mountains Insurance Group, Ltd. | 2.6 |
| ONE Gas, Inc. | 2.3 |
| U.S. Physical Therapy, Inc. | 2.3 |
| Total | 27.6% |
Footnotes:
Fund invests in an affiliated investment company (Portfolio) with the same objective(s) and policies as the Fund. References to investments are to the Portfolio’s holdings.
| 1 | Excludes cash and cash equivalents. |
Eaton Vance
Tax-Managed Small-Cap Fund
October 31, 2023
Endnotes and Additional Disclosures
| † | The views expressed in this report are those of the portfolio manager(s) and are current only through the date stated at the top of this page. These views are subject to change at any time based upon market or other conditions, and Eaton Vance and the Fund(s) disclaim any responsibility to update such views. These views may not be relied upon as investment advice and, because investment decisions are based on many factors, may not be relied upon as an indication of trading intent on behalf of any Eaton Vance fund. This commentary may contain statements that are not historical facts, referred to as “forward-looking statements.” The Fund’s actual future results may differ significantly from those stated in any forward-looking statement, depending on factors such as changes in securities or financial markets or general economic conditions, the volume of sales and purchases of Fund shares, the continuation of investment advisory, administrative and service contracts, and other risks discussed from time to time in the Fund’s filings with the Securities and Exchange Commission. |
| | |
| 1 | Russell 2000® Index is an unmanaged index of 2,000 U.S. small-cap stocks. Unless otherwise stated, index returns do not reflect the effect of any applicable sales charges, commissions, expenses, taxes or leverage, as applicable. It is not possible to invest directly in an index. |
| 2 | Total Returns at NAV do not include applicable sales charges. If sales charges were deducted, the returns would be lower. Total Returns shown with maximum sales charge reflect the stated maximum sales charge. Unless otherwise stated, performance does not reflect the deduction of taxes on Fund distributions or redemptions of Fund shares. After-tax returns are calculated using certain assumptions, including using the highest historical individual federal income tax rates, and do not reflect the impact of state/local taxes. Actual after-tax returns depend on a shareholder’s tax situation and the actual characterization of distributions and may differ from those shown. After-tax returns are not relevant to shareholders who hold shares in tax-deferred accounts or shares held by nontaxable entities. Return After Taxes on Distributions may be the same as Return Before Taxes for the same period because no taxable distributions were made during that period. Return After Taxes on Distributions and Sale of Fund Shares may be greater than or equal to Return After Taxes on Distributions for the same period because of losses realized on the sale of Fund shares. The Fund’s after-tax returns also may reflect foreign tax credits passed by the Fund to its shareholders.Effective November 5, 2020, Class C shares automatically convert to Class A shares eight years after purchase. The average annual total returns listed for Class C reflect conversion to Class A shares after eight years. Prior to November 5, 2020, Class C shares automatically converted to Class A shares ten years after purchase. |
| 3 | Source: Fund prospectus. The expense ratios for the current reporting period can be found in the Financial Highlights section of this report. Performance reflects expenses waived and/or reimbursed, if applicable. Without such waivers and/or reimbursements, performance would have been lower. |
| | Fund profile subject to change due to active management. |
| | Additional Information |
| | S&P 500® Index is an unmanaged index of large-cap stocks commonly used as a measure of U.S. stock market performance. Dow Jones Industrial Average® is a price-weighted average of 30 blue-chip stocks that are generally the leaders in their industry. S&P Dow Jones Indices are a product of S&P Dow Jones Indices LLC (“S&P DJI”) and have been licensed for use. S&P® and S&P 500® are registered trademarks of S&P DJI; Dow Jones® is a registered trademark of Dow Jones Trademark Holdings LLC (“Dow Jones”); S&P DJI, Dow Jones and their respective affiliates do not sponsor, endorse, sell or promote the Fund, will not have any liability with respect thereto and do not have any liability for any errors, omissions, or interruptions of the S&P Dow Jones Indices. Nasdaq Composite Index is a market capitalization-weighted index of all domestic and international securities listed on Nasdaq. Source: Nasdaq, Inc. The information is provided by Nasdaq (with its affiliates, are referred to as the “Corporations”) and Nasdaq’s third party licensors on an “as is” basis and the Corporations make no guarantees and bear no liability of any kind with respect to the information or the Fund. |
Eaton Vance
Tax-Managed Small-Cap Fund
October 31, 2023
Example
As a Fund shareholder, you incur two types of costs: (1) transaction costs, including sales charges (loads) on purchases; and (2) ongoing costs, including management fees; distribution and/or service fees; and other Fund expenses. This Example is intended to help you understand your ongoing costs (in dollars) of Fund investing and to compare these costs with the ongoing costs of investing in other mutual funds. The Example is based on an investment of $1,000 invested at the beginning of the period and held for the entire period (May 1, 2023 to October 31, 2023).
Actual Expenses
The first section of the table below provides information about actual account values and actual expenses. You may use the information in this section, together with the amount you invested, to estimate the expenses that you paid over the period. Simply divide your account value by $1,000 (for example, an $8,600 account value divided by $1,000 = 8.6), then multiply the result by the number in the first section under the heading entitled “Expenses Paid During Period” to estimate the expenses you paid on your account during this period.
Hypothetical Example for Comparison Purposes
The second section of the table below provides information about hypothetical account values and hypothetical expenses based on the actual Fund expense ratio and an assumed rate of return of 5% per year (before expenses), which is not the actual Fund return. The hypothetical account values and expenses may not be used to estimate the actual ending account balance or expenses you paid for the period. You may use this information to compare the ongoing costs of investing in your Fund and other funds. To do so, compare this 5% hypothetical example with the 5% hypothetical examples that appear in the shareholder reports of the other funds.
Please note that the expenses shown in the table are meant to highlight your ongoing costs only and do not reflect any transactional costs, such as sales charges (loads). Therefore, the second section of the table is useful in comparing ongoing costs only, and will not help you determine the relative total costs of owning different funds. In addition, if these transactional costs were included, your costs would be higher.
| | Beginning
Account Value
(5/1/23) | Ending
Account Value
(10/31/23) | Expenses Paid
During Period*
(5/1/23 – 10/31/23) | Annualized
Expense
Ratio |
| Actual | | | | |
| Class A | $1,000.00 | $ 883.50 | $5.32 | 1.12% |
| Class C | $1,000.00 | $ 880.40 | $8.86 | 1.87% |
| Class I | $1,000.00 | $ 885.00 | $4.13 | 0.87% |
| |
| Hypothetical | | | | |
| (5% return per year before expenses) | | | | |
| Class A | $1,000.00 | $1,019.56 | $5.70 | 1.12% |
| Class C | $1,000.00 | $1,015.78 | $9.50 | 1.87% |
| Class I | $1,000.00 | $1,020.82 | $4.43 | 0.87% |
| * | Expenses are equal to the Fund's annualized expense ratio for the indicated Class, multiplied by the average account value over the period, multiplied by 184/365 (to reflect the one-half year period). The Example assumes that the $1,000 was invested at the net asset value per share determined at the close of business on April 30, 2023. The Example reflects the expenses of both the Fund and the Portfolio. |
Eaton Vance
Tax-Managed Small-Cap Fund
October 31, 2023
Statement of Assets and Liabilities
| | October 31, 2023 |
| Assets | |
| Investment in Tax-Managed Small-Cap Portfolio, at value (identified cost $98,129,799) | $ 105,981,339 |
| Receivable for Fund shares sold | 120,203 |
| Total assets | $106,101,542 |
| Liabilities | |
| Payable for Fund shares redeemed | $ 21,498 |
| Payable to affiliates: | |
| Distribution and service fees | 18,790 |
| Trustees' fees | 42 |
| Accrued expenses | 73,975 |
| Total liabilities | $ 114,305 |
| Net Assets | $105,987,237 |
| Sources of Net Assets | |
| Paid-in capital | $ 101,945,470 |
| Distributable earnings | 4,041,767 |
| Net Assets | $105,987,237 |
| Class A Shares | |
| Net Assets | $ 76,963,209 |
| Shares Outstanding | 3,065,738 |
Net Asset Value and Redemption Price Per Share
(net assets ÷ shares of beneficial interest outstanding) | $ 25.10 |
Maximum Offering Price Per Share
(100 ÷ 94.75 of net asset value per share) | $ 26.49 |
| Class C Shares | |
| Net Assets | $ 2,073,149 |
| Shares Outstanding | 111,773 |
Net Asset Value and Offering Price Per Share*
(net assets ÷ shares of beneficial interest outstanding) | $ 18.55 |
| Class I Shares | |
| Net Assets | $ 26,950,879 |
| Shares Outstanding | 1,033,425 |
Net Asset Value, Offering Price and Redemption Price Per Share
(net assets ÷ shares of beneficial interest outstanding) | $ 26.08 |
| On sales of $50,000 or more, the offering price of Class A shares is reduced. |
| * | Redemption price per share is equal to the net asset value less any applicable contingent deferred sales charge. |
7
See Notes to Financial Statements.
Eaton Vance
Tax-Managed Small-Cap Fund
October 31, 2023
| | Year Ended |
| | October 31, 2023 |
| Investment Income | |
| Dividend income allocated from Portfolio | $ 1,593,522 |
| Expenses allocated from Portfolio | (818,349) |
| Total investment income from Portfolio | $ 775,173 |
| Expenses | |
| Distribution and service fees: | |
| Class A | $ 221,122 |
| Class C | 24,659 |
| Trustees’ fees and expenses | 500 |
| Custodian fee | 18,484 |
| Transfer and dividend disbursing agent fees | 117,923 |
| Legal and accounting services | 21,915 |
| Printing and postage | 16,066 |
| Registration fees | 46,360 |
| ReFlow liquidity program fees | 10,377 |
| Miscellaneous | 11,434 |
| Total expenses | $ 488,840 |
| Net investment income | $ 286,333 |
| Realized and Unrealized Gain (Loss) from Portfolio | |
| Net realized gain (loss): | |
| Investment transactions | $ 4,093,315(1) |
| Net realized gain | $ 4,093,315 |
| Change in unrealized appreciation (depreciation): | |
| Investments | $ (13,045,673) |
| Net change in unrealized appreciation (depreciation) | $(13,045,673) |
| Net realized and unrealized loss | $ (8,952,358) |
| Net decrease in net assets from operations | $ (8,666,025) |
| (1) | Includes $2,379,832 of net realized gains from redemptions in-kind. |
8
See Notes to Financial Statements.
Eaton Vance
Tax-Managed Small-Cap Fund
October 31, 2023
Statements of Changes in Net Assets
| | Year Ended October 31, |
| | 2023 | 2022 |
| Increase (Decrease) in Net Assets | | |
| From operations: | | |
| Net investment income (loss) | $ 286,333 | $ (12,864) |
| Net realized gain | 4,093,315 (1) | 5,996,029 (2) |
| Net change in unrealized appreciation (depreciation) | (13,045,673) | (23,823,045) |
| Net decrease in net assets from operations | $ (8,666,025) | $ (17,839,880) |
| Distributions to shareholders: | | |
| Class A | $ (2,335,309) | $ (8,360,876) |
| Class C | (83,428) | (312,679) |
| Class I | (759,585) | (2,381,714) |
| Total distributions to shareholders | $ (3,178,322) | $ (11,055,269) |
| Transactions in shares of beneficial interest: | | |
| Class A | $ (2,786,288) | $ 2,875,658 |
| Class C | (235,003) | 49,659 |
| Class I | 2,556,539 | 3,524,878 |
| Net increase (decrease) in net assets from Fund share transactions | $ (464,752) | $ 6,450,195 |
| Net decrease in net assets | $ (12,309,099) | $ (22,444,954) |
| Net Assets | | |
| At beginning of year | $ 118,296,336 | $ 140,741,290 |
| At end of year | $105,987,237 | $118,296,336 |
| (1) | Includes $2,379,832 of net realized gains from redemptions in-kind. |
| (2) | Includes $3,413,071 of net realized gains from redemptions in-kind. |
9
See Notes to Financial Statements.
Eaton Vance
Tax-Managed Small-Cap Fund
October 31, 2023
| | Class A |
| | Year Ended October 31, |
| | 2023 | 2022 | 2021 | 2020 | 2019 |
| Net asset value — Beginning of year | $ 27.940 | $ 34.810 | $ 24.520 | $ 26.960 | $ 25.910 |
| Income (Loss) From Operations | | | | | |
| Net investment income (loss)(1) | $ 0.056 | $ (0.014) | $ (0.052) | $ 0.016 | $ (0.001) |
| Net realized and unrealized gain (loss) | (2.146) | (4.121) | 10.369 | (0.739) | 2.765 |
| Total income (loss) from operations | $ (2.090) | $ (4.135) | $ 10.317 | $ (0.723) | $ 2.764 |
| Less Distributions | | | | | |
| From net investment income | $ (0.041) | $ (0.025) | $ (0.027) | $ — | $ (0.032) |
| From net realized gain | (0.709) | (2.710) | — | (1.717) | (1.682) |
| Total distributions | $ (0.750) | $ (2.735) | $ (0.027) | $ (1.717) | $ (1.714) |
| Net asset value — End of year | $25.100 | $27.940 | $ 34.810 | $24.520 | $26.960 |
| Total Return(2) | (7.62)% | (12.82)% | 42.10% | (3.09)% | 12.26% |
| Ratios/Supplemental Data | | | | | |
| Net assets, end of year (000’s omitted) | $ 76,963 | $ 88,303 | $107,257 | $ 78,430 | $ 89,352 |
| Ratios (as a percentage of average daily net assets):(3) | | | | | |
| Expenses | 1.14% (4) | 1.15% (4) | 1.11% | 1.17% | 1.20% |
| Net investment income (loss) | 0.20% | (0.05)% | (0.16)% | 0.06% | (0.01)% |
| Portfolio Turnover of the Portfolio | 38% | 43% | 40% | 44% | 51% |
| (1) | Computed using average shares outstanding. |
| (2) | Returns are historical and are calculated by determining the percentage change in net asset value with all distributions reinvested and do not reflect the effect of sales charges. |
| (3) | Includes the Fund’s share of the Portfolio’s allocated expenses. |
| (4) | Includes a reduction by the investment adviser of a portion of the Portfolio’s adviser fee due to the Portfolio’s investment in the Liquidity Fund (equal to less than 0.005% of average daily net assets for the years ended October 31, 2023 and 2022). |
10
See Notes to Financial Statements.
Eaton Vance
Tax-Managed Small-Cap Fund
October 31, 2023
Financial Highlights — continued
| | Class C |
| | Year Ended October 31, |
| | 2023 | 2022 | 2021 | 2020 | 2019 |
| Net asset value — Beginning of year | $ 20.960 | $ 26.780 | $ 18.990 | $ 21.410 | $ 21.070 |
| Income (Loss) From Operations | | | | | |
| Net investment loss(1) | $ (0.115) | $ (0.177) | $ (0.215) | $ (0.126) | $ (0.111) |
| Net realized and unrealized gain (loss) | (1.586) | (3.100) | 8.005 | (0.577) | 2.133 |
| Total income (loss) from operations | $ (1.701) | $ (3.277) | $ 7.790 | $ (0.703) | $ 2.022 |
| Less Distributions | | | | | |
| From net realized gain | $ (0.709) | $ (2.543) | $ — | $ (1.717) | $ (1.682) |
| Total distributions | $ (0.709) | $ (2.543) | $ — | $ (1.717) | $ (1.682) |
| Net asset value — End of year | $18.550 | $20.960 | $26.780 | $18.990 | $21.410 |
| Total Return(2) | (8.31)% | (13.43)% | 41.02% | (3.86)% | 11.45% |
| Ratios/Supplemental Data | | | | | |
| Net assets, end of year (000’s omitted) | $ 2,073 | $ 2,574 | $ 3,236 | $ 3,565 | $ 5,675 |
| Ratios (as a percentage of average daily net assets):(3) | | | | | |
| Expenses | 1.89% (4) | 1.90% (4) | 1.86% | 1.92% | 1.95% |
| Net investment loss | (0.55)% | (0.79)% | (0.87)% | (0.66)% | (0.55)% |
| Portfolio Turnover of the Portfolio | 38% | 43% | 40% | 44% | 51% |
| (1) | Computed using average shares outstanding. |
| (2) | Returns are historical and are calculated by determining the percentage change in net asset value with all distributions reinvested and do not reflect the effect of sales charges. |
| (3) | Includes the Fund’s share of the Portfolio’s allocated expenses. |
| (4) | Includes a reduction by the investment adviser of a portion of the Portfolio’s adviser fee due to the Portfolio’s investment in the Liquidity Fund (equal to less than 0.005% of average daily net assets for the years ended October 31, 2023 and 2022). |
11
See Notes to Financial Statements.
Eaton Vance
Tax-Managed Small-Cap Fund
October 31, 2023
Financial Highlights — continued
| | Class I |
| | Year Ended October 31, |
| | 2023 | 2022 | 2021 | 2020 | 2019 |
| Net asset value — Beginning of year | $ 29.010 | $ 36.020 | $ 25.370 | $ 27.770 | $ 26.650 |
| Income (Loss) From Operations | | | | | |
| Net investment income(1) | $ 0.128 | $ 0.059 | $ 0.027 | $ 0.081 | $ 0.071 |
| Net realized and unrealized gain (loss) | (2.232) | (4.251) | 10.714 | (0.764) | 2.833 |
| Total income (loss) from operations | $ (2.104) | $ (4.192) | $10.741 | $ (0.683) | $ 2.904 |
| Less Distributions | | | | | |
| From net investment income | $ (0.117) | $ (0.108) | $ (0.091) | $ — | $ (0.102) |
| From net realized gain | (0.709) | (2.710) | — | (1.717) | (1.682) |
| Total distributions | $ (0.826) | $ (2.818) | $ (0.091) | $ (1.717) | $ (1.784) |
| Net asset value — End of year | $26.080 | $29.010 | $36.020 | $25.370 | $27.770 |
| Total Return(2) | (7.40)% | (12.56)% | 42.46% | (2.89)% | 12.52% |
| Ratios/Supplemental Data | | | | | |
| Net assets, end of year (000’s omitted) | $ 26,951 | $ 27,419 | $ 30,248 | $ 20,346 | $ 24,763 |
| Ratios (as a percentage of average daily net assets):(3) | | | | | |
| Expenses | 0.89% (4) | 0.90% (4) | 0.86% | 0.92% | 0.95% |
| Net investment income | 0.44% | 0.19% | 0.08% | 0.32% | 0.27% |
| Portfolio Turnover of the Portfolio | 38% | 43% | 40% | 44% | 51% |
| (1) | Computed using average shares outstanding. |
| (2) | Returns are historical and are calculated by determining the percentage change in net asset value with all distributions reinvested. |
| (3) | Includes the Fund’s share of the Portfolio’s allocated expenses. |
| (4) | Includes a reduction by the investment adviser of a portion of the Portfolio’s adviser fee due to the Portfolio’s investment in the Liquidity Fund (equal to less than 0.005% of average daily net assets for the years ended October 31, 2023 and 2022). |
12
See Notes to Financial Statements.
Eaton Vance
Tax-Managed Small-Cap Fund
October 31, 2023
Notes to Financial Statements
1 Significant Accounting Policies
Eaton Vance Tax-Managed Small-Cap Fund (the Fund) is a diversified series of Eaton Vance Mutual Funds Trust (the Trust). The Trust is a Massachusetts business trust registered under the Investment Company Act of 1940, as amended (the 1940 Act), as an open-end management investment company. The Fund offers three classes of shares. Class A shares are generally sold subject to a sales charge imposed at time of purchase. Class C shares are sold at net asset value and are generally subject to a contingent deferred sales charge (see Note 5). Effective November 5, 2020, Class C shares automatically convert to Class A shares eight years after their purchase as described in the Fund’s prospectus. Class I shares are sold at net asset value and are not subject to a sales charge. Each class represents a pro rata interest in the Fund, but votes separately on class-specific matters and (as noted below) is subject to different expenses. Realized and unrealized gains and losses and net investment income and losses, other than class-specific expenses, are allocated daily to each class of shares based on the relative net assets of each class to the total net assets of the Fund. Each class of shares differs in its distribution plan and certain other class-specific expenses. The Fund invests its assets in interests in Tax-Managed Small-Cap Portfolio (the Portfolio), a Massachusetts business trust, having the same investment objective and policies as the Fund. The value of the Fund’s investment in the Portfolio reflects the Fund’s proportionate interest in the net assets of the Portfolio (65.5% at October 31, 2023). The performance of the Fund is directly affected by the performance of the Portfolio. The financial statements of the Portfolio, including the portfolio of investments, are included elsewhere in this report and should be read in conjunction with the Fund’s financial statements.
The following is a summary of significant accounting policies of the Fund. The policies are in conformity with accounting principles generally accepted in the United States of America (U.S. GAAP). The Fund is an investment company and follows accounting and reporting guidance in the Financial Accounting Standards Board (FASB) Accounting Standards Codification Topic 946.
A Investment Valuation—Valuation of securities by the Portfolio is discussed in Note 1A of the Portfolio's Notes to Financial Statements, which are included elsewhere in this report.
B Income—The Fund's net investment income or loss consists of the Fund's pro rata share of the net investment income or loss of the Portfolio, less all actual and accrued expenses of the Fund.
C Federal Taxes—The Fund's policy is to comply with the provisions of the Internal Revenue Code applicable to regulated investment companies and to distribute to shareholders each year substantially all of its net investment income, and all or substantially all of its net realized capital gains. Accordingly, no provision for federal income or excise tax is necessary.
As of October 31, 2023, the Fund had no uncertain tax positions that would require financial statement recognition, de-recognition, or disclosure. The Fund files a U.S. federal income tax return annually after its fiscal year-end, which is subject to examination by the Internal Revenue Service for a period of three years from the date of filing.
D Expenses—The majority of expenses of the Trust are directly identifiable to an individual fund. Expenses which are not readily identifiable to a specific fund are allocated taking into consideration, among other things, the nature and type of expense and the relative size of the funds.
E Use of Estimates—The preparation of the financial statements in conformity with U.S. GAAP requires management to make estimates and assumptions that affect the reported amounts of assets and liabilities at the date of the financial statements and the reported amounts of income and expense during the reporting period. Actual results could differ from those estimates.
F Indemnifications—Under the Trust’s organizational documents, its officers and Trustees may be indemnified against certain liabilities and expenses arising out of the performance of their duties to the Fund. Under Massachusetts law, if certain conditions prevail, shareholders of a Massachusetts business trust (such as the Trust) could be deemed to have personal liability for the obligations of the Trust. However, the Trust’s Declaration of Trust contains an express disclaimer of liability on the part of Fund shareholders and the By-laws provide that the Trust shall assume, upon request by the shareholder, the defense on behalf of any Fund shareholders. Moreover, the By-laws also provide for indemnification out of Fund property of any shareholder held personally liable solely by reason of being or having been a shareholder for all loss or expense arising from such liability. Additionally, in the normal course of business, the Fund enters into agreements with service providers that may contain indemnification clauses. The Fund’s maximum exposure under these arrangements is unknown as this would involve future claims that may be made against the Fund that have not yet occurred.
G Other—Investment transactions are accounted for on a trade date basis.
Eaton Vance
Tax-Managed Small-Cap Fund
October 31, 2023
Notes to Financial Statements — continued
2 Distributions to Shareholders and Income Tax Information
It is the present policy of the Fund to make at least one distribution annually (normally in December) of all or substantially all of its net investment income and to distribute annually all or substantially all of its net realized capital gains. Distributions to shareholders are recorded on the ex-dividend date. Distributions are declared separately for each class of shares. Shareholders may reinvest income and capital gain distributions in additional shares of the same class of the Fund at the net asset value as of the ex-dividend date or, at the election of the shareholder, receive distributions in cash. Distributions to shareholders are determined in accordance with income tax regulations, which may differ from U.S. GAAP. As required by U.S. GAAP, only distributions in excess of tax basis earnings and profits are reported in the financial statements as a return of capital. Permanent differences between book and tax accounting relating to distributions are reclassified to paid-in capital. For tax purposes, distributions from short-term capital gains are considered to be from ordinary income.
The tax character of distributions declared for the years ended October 31, 2023 and October 31, 2022 was as follows:
| | Year Ended October 31, |
| | 2023 | 2022 |
| Ordinary income | $ 234,551 | $1,966,083 |
| Long-term capital gains | $2,943,771 | $9,089,186 |
During the year ended October 31, 2023, distributable earnings was decreased by $3,784,326 and paid-in capital was increased by $3,784,326 due to differences between book and tax accounting for redemptions in-kind and the Fund's use of equalization accounting. Tax equalization accounting allows the Fund to treat as a distribution that portion of redemption proceeds representing a redeeming shareholder’s portion of undistributed taxable income and net capital gains. These reclassifications had no effect on the net assets or net asset value per share of the Fund.
As of October 31, 2023, the components of distributable earnings (accumulated loss) on a tax basis were as follows:
| Undistributed long-term capital gains | $ 1,541,807 |
| Net unrealized appreciation | 2,499,960 |
| Distributable earnings | $4,041,767 |
3 Investment Adviser Fee and Other Transactions with Affiliates
The investment adviser fee is earned by Eaton Vance Management (EVM), an indirect, wholly-owned subsidiary of Morgan Stanley, as compensation for investment advisory services rendered to the Fund. The fee is computed at an annual rate as a percentage of the Fund’s average daily net assets that are not invested in other investment companies for which EVM or its affiliates serve as investment adviser and receive an advisory fee as follows and is payable monthly:
| Average Daily Net Assets | Annual Fee Rate |
| Up to $500 million | 0.6250% |
| $500 million but less than $1 billion | 0.5625% |
| $1 billion but less than $1.5 billion | 0.5000% |
| $1.5 billion and over | 0.4375% |
For the year ended October 31, 2023, the Fund incurred no investment adviser fee on such assets. To the extent that the Fund’s assets are invested in the Portfolio, the Fund is allocated its share of the Portfolio’s investment adviser fee. The Portfolio has engaged Boston Management and Research (BMR) to render investment advisory services. See Note 2 of the Portfolio’s Notes to Financial Statements which are included elsewhere in this report. EVM also serves as the administrator of the Fund, but receives no compensation.
EVM provides sub-transfer agency and related services to the Fund pursuant to a Sub-Transfer Agency Support Services Agreement. For the year ended October 31, 2023, EVM earned $39,283 from the Fund pursuant to such agreement, which is included in transfer and dividend disbursing agent fees on the Statement of Operations. The Fund was informed that Eaton Vance Distributors, Inc. (EVD), an affiliate of EVM and the Fund's principal underwriter, received $3,362 as its portion of the sales charge on sales of Class A shares for the year ended October 31, 2023. EVD also received distribution and service fees from Class A and Class C shares (see Note 4) and contingent deferred sales charges (see Note 5).
Eaton Vance
Tax-Managed Small-Cap Fund
October 31, 2023
Notes to Financial Statements — continued
Trustees and officers of the Fund who are members of EVM’s or BMR's organizations receive remuneration for their services to the Fund out of the investment adviser fee. Certain officers and Trustees of the Fund and the Portfolio are officers of the above organizations.
4 Distribution Plans
The Fund has in effect a distribution plan for Class A shares (Class A Plan) pursuant to Rule 12b-1 under the 1940 Act. Pursuant to the Class A Plan, the Fund pays EVD a distribution and service fee of 0.25% per annum of its average daily net assets attributable to Class A shares for distribution services and facilities provided to the Fund by EVD, as well as for personal services and/or the maintenance of shareholder accounts. Distribution and service fees paid or accrued to EVD for the year ended October 31, 2023 amounted to $221,122 for Class A shares.
The Fund also has in effect a distribution plan for Class C shares (Class C Plan) pursuant to Rule 12b-1 under the 1940 Act. Pursuant to the Class C Plan, the Fund pays EVD amounts equal to 0.75% per annum of its average daily net assets attributable to Class C shares for providing ongoing distribution services and facilities to the Fund. For the year ended October 31, 2023, the Fund paid or accrued to EVD $18,494 for Class C shares.
Pursuant to the Class C Plan, the Fund also makes payments of service fees to EVD, financial intermediaries and other persons in amounts equal to 0.25% per annum of its average daily net assets attributable to that class. Service fees paid or accrued are for personal services and/or the maintenance of shareholder accounts. They are separate and distinct from the sales commissions and distribution fees payable to EVD. Service fees paid or accrued for the year ended October 31, 2023 amounted to $6,165 for Class C shares.
Distribution and service fees are subject to the limitations contained in the Financial Industry Regulatory Authority Rule 2341(d).
5 Contingent Deferred Sales Charges
A contingent deferred sales charge (CDSC) of 1% generally is imposed on redemptions of Class C shares made within 12 months of purchase. Class A shares may be subject to a 1% CDSC if redeemed within 12 months of purchase (depending on the circumstances of purchase). Generally, the CDSC is based upon the lower of the net asset value at date of redemption or date of purchase. No charge is levied on shares acquired by reinvestment of dividends or capital gain distributions. For the year ended October 31, 2023, the Fund was informed that EVD received less than $100 of CDSCs paid by Class C shareholders and no CDSCs paid by Class A shareholders.
6 Investment Transactions
For the year ended October 31, 2023, increases and decreases in the Fund's investment in the Portfolio aggregated $3,393,890 and $7,644,350, respectively. Decreases in the Fund's investment in the Portfolio include distributions of securities as the result of redemptions in-kind of $5,020,145.
7 Shares of Beneficial Interest
The Fund’s Declaration of Trust permits the Trustees to issue an unlimited number of full and fractional shares of beneficial interest (without par value). Such shares may be issued in a number of different series (such as the Fund) and classes. Sales and redemptions of Class I shares include shares purchased and redeemed in connection with the ReFlow liquidity program, a program designed to provide an alternative liquidity source for mutual funds experiencing net redemptions of their shares. Transactions in Fund shares, including direct exchanges pursuant to share class conversions, were as follows:
| | Year Ended
October 31, 2023 | | Year Ended
October 31, 2022 |
| | Shares | Amount | | Shares | Amount |
| Class A | | | | | |
| Sales | 73,010 | $ 2,062,811 | | 81,221 | $ 2,443,616 |
| Issued to shareholders electing to receive payments of distributions in Fund shares | 82,542 | 2,187,359 | | 245,909 | 7,810,082 |
| Redemptions | (249,931) | (7,036,458) | | (248,566) | (7,378,040) |
| Net increase (decrease) | (94,379) | $ (2,786,288) | | 78,564 | $ 2,875,658 |
Eaton Vance
Tax-Managed Small-Cap Fund
October 31, 2023
Notes to Financial Statements — continued
| | Year Ended
October 31, 2023 | | Year Ended
October 31, 2022 |
| | Shares | Amount | | Shares | Amount |
| Class C | | | | | |
| Sales | 10,417 | $ 212,806 | | 18,563 | $ 424,160 |
| Issued to shareholders electing to receive payments of distributions in Fund shares | 4,235 | 83,420 | | 12,995 | 311,624 |
| Redemptions | (25,719) | (531,229) | | (29,551) | (686,125) |
| Net increase (decrease) | (11,067) | $ (235,003) | | 2,007 | $ 49,659 |
| Class I | | | | | |
| Sales | 437,764 | $ 12,709,225 | | 638,523 | $ 19,988,523 |
| Issued to shareholders electing to receive payments of distributions in Fund shares | 26,395 | 725,071 | | 70,535 | 2,320,590 |
| Redemptions | (376,018) | (10,877,757) | | (603,427) | (18,784,235) |
| Net increase | 88,141 | $ 2,556,539 | | 105,631 | $ 3,524,878 |
Eaton Vance
Tax-Managed Small-Cap Fund
October 31, 2023
Report of Independent Registered Public Accounting Firm
To the Trustees of Eaton Vance Mutual Funds Trust and Shareholders of Eaton Vance Tax-Managed Small-Cap Fund:
Opinion on the Financial Statements and Financial Highlights
We have audited the accompanying statement of assets and liabilities of Eaton Vance Tax-Managed Small-Cap Fund (the “Fund") (one of the funds constituting Eaton Vance Mutual Funds Trust), as of October 31, 2023, the related statement of operations for the year then ended, the statements of changes in net assets for each of the two years in the period then ended, the financial highlights for each of the five years in the period then ended, and the related notes. In our opinion, the financial statements and financial highlights present fairly, in all material respects, the financial position of the Fund as of October 31, 2023, and the results of its operations for the year then ended, the changes in its net assets for each of the two years in the period then ended, and the financial highlights for each of the five years in the period then ended, in conformity with accounting principles generally accepted in the United States of America.
Basis for Opinion
These financial statements and financial highlights are the responsibility of the Fund's management. Our responsibility is to express an opinion on the Fund's financial statements and financial highlights based on our audits. We are a public accounting firm registered with the Public Company Accounting Oversight Board (United States) (PCAOB) and are required to be independent with respect to the Fund in accordance with the U.S. federal securities laws and the applicable rules and regulations of the Securities and Exchange Commission and the PCAOB.
We conducted our audits in accordance with the standards of the PCAOB. Those standards require that we plan and perform the audit to obtain reasonable assurance about whether the financial statements and financial highlights are free of material misstatement, whether due to error or fraud. The Fund is not required to have, nor were we engaged to perform, an audit of its internal control over financial reporting. As part of our audits, we are required to obtain an understanding of internal control over financial reporting but not for the purpose of expressing an opinion on the effectiveness of the Fund’s internal control over financial reporting. Accordingly, we express no such opinion.
Our audits included performing procedures to assess the risks of material misstatement of the financial statements and financial highlights, whether due to error or fraud, and performing procedures that respond to those risks. Such procedures included examining, on a test basis, evidence regarding the amounts and disclosures in the financial statements and financial highlights. Our audits also included evaluating the accounting principles used and significant estimates made by management, as well as evaluating the overall presentation of the financial statements and financial highlights. We believe that our audits provide a reasonable basis for our opinion.
/s/ Deloitte & Touche LLP
Boston, Massachusetts
December 19, 2023
We have served as the auditor of one or more Eaton Vance investment companies since 1959.
Eaton Vance
Tax-Managed Small-Cap Fund
October 31, 2023
Federal Tax Information (Unaudited)
The Form 1099-DIV you receive in February 2024 will show the tax status of all distributions paid to your account in calendar year 2023. Shareholders are advised to consult their own tax adviser with respect to the tax consequences of their investment in the Fund. As required by the Internal Revenue Code and/or regulations, shareholders must be notified regarding the status of qualified dividend income for individuals, the dividends received deduction for corporations and capital gains dividends.
Qualified Dividend Income. For the fiscal year ended October 31, 2023, the Fund designates approximately $1,107,995, or up to the maximum amount of such dividends allowable pursuant to the Internal Revenue Code, as qualified dividend income eligible for the reduced tax rate of 15%.
Dividends Received Deduction. Corporate shareholders are generally entitled to take the dividends received deduction on the portion of the Fund’s dividend distribution that qualifies under tax law. For the Fund’s fiscal 2023 ordinary income dividends, 100% qualifies for the corporate dividends received deduction.
Capital Gains Dividends. The Fund hereby designates as a capital gain dividend with respect to the taxable year ended October 31, 2023, $1,696,454 or, if subsequently determined to be different, the net capital gain of such year.
Tax-Managed Small-Cap Portfolio
October 31, 2023
| Security | Shares | Value |
| Aerospace & Defense — 2.8% |
| Hexcel Corp. | | 16,646 | $ 1,030,720 |
| Woodward, Inc. | | 27,453 | 3,423,389 |
| | | | $ 4,454,109 |
| Automobile Components — 3.6% |
| Atmus Filtration Technologies, Inc.(1) | | 43,182 | $ 810,094 |
| Dorman Products, Inc.(1) | | 58,024 | 3,607,933 |
| Visteon Corp.(1) | | 12,376 | 1,424,849 |
| | | | $ 5,842,876 |
| Automobiles — 0.7% |
| Harley-Davidson, Inc. | | 39,525 | $ 1,061,246 |
| | | | $ 1,061,246 |
| Banks — 4.4% |
| Commerce Bancshares, Inc. | | 61,613 | $ 2,702,346 |
| Community Bank System, Inc. | | 22,549 | 900,833 |
| SouthState Corp. | | 37,538 | 2,481,262 |
| Stock Yards Bancorp, Inc. | | 25,477 | 996,405 |
| | | | $ 7,080,846 |
| Building Products — 5.9% |
| AAON, Inc. | | 44,949 | $ 2,448,822 |
| AZEK Co., Inc. (The), Class A(1) | | 108,752 | 2,849,302 |
| CSW Industrials, Inc. | | 16,112 | 2,856,013 |
| Hayward Holdings, Inc.(1) | | 77,843 | 817,352 |
| Janus International Group, Inc.(1) | | 59,625 | 558,090 |
| | | | $ 9,529,579 |
| Capital Markets — 2.6% |
| Cohen & Steers, Inc. | | 40,159 | $ 2,097,906 |
| Stifel Financial Corp. | | 35,954 | 2,049,378 |
| | | | $ 4,147,284 |
| Chemicals — 1.6% |
| Quaker Chemical Corp. | | 18,227 | $ 2,619,584 |
| | | | $ 2,619,584 |
| Commercial Services & Supplies — 1.1% |
| Rentokil Initial PLC ADR | | 67,736 | $ 1,733,364 |
| | | | $ 1,733,364 |
| Security | Shares | Value |
| Consumer Staples Distribution & Retail — 4.1% |
| Casey's General Stores, Inc. | | 11,178 | $ 3,039,410 |
| Chefs' Warehouse, Inc. (The)(1) | | 35,174 | 669,361 |
| Performance Food Group Co.(1) | | 51,067 | 2,949,630 |
| | | | $ 6,658,401 |
| Containers & Packaging — 2.7% |
| AptarGroup, Inc. | | 35,953 | $ 4,395,973 |
| | | | $ 4,395,973 |
| Diversified Consumer Services — 0.5% |
| Bright Horizons Family Solutions, Inc.(1) | | 10,879 | $ 805,699 |
| | | | $ 805,699 |
| Diversified REITs — 2.6% |
| Essential Properties Realty Trust, Inc. | | 194,237 | $ 4,263,502 |
| | | | $ 4,263,502 |
| Electric Utilities — 1.3% |
| IDACORP, Inc. | | 22,219 | $ 2,104,362 |
| | | | $ 2,104,362 |
| Financial Services — 1.1% |
| Euronet Worldwide, Inc.(1) | | 22,664 | $ 1,741,502 |
| | | | $ 1,741,502 |
| Food Products — 2.3% |
| J&J Snack Foods Corp. | | 13,818 | $ 2,164,037 |
| Lancaster Colony Corp. | | 4,689 | 793,238 |
| Simply Good Foods Co. (The)(1) | | 20,626 | 769,144 |
| | | | $ 3,726,419 |
| Gas Utilities — 2.3% |
| ONE Gas, Inc. | | 62,703 | $ 3,787,261 |
| | | | $ 3,787,261 |
| Ground Transportation — 1.5% |
| Landstar System, Inc. | | 14,840 | $ 2,445,335 |
| | | | $ 2,445,335 |
| Health Care Equipment & Supplies — 5.1% |
| Envista Holdings Corp.(1) | | 105,996 | $ 2,466,527 |
| ICU Medical, Inc.(1) | | 7,870 | 771,732 |
| Integer Holdings Corp.(1) | | 21,521 | 1,746,860 |
19
See Notes to Financial Statements.
Tax-Managed Small-Cap Portfolio
October 31, 2023
Portfolio of Investments — continued
| Security | Shares | Value |
| Health Care Equipment & Supplies (continued) |
| Integra LifeSciences Holdings Corp.(1) | | 19,673 | $ 707,441 |
| Neogen Corp.(1) | | 176,677 | 2,630,720 |
| | | | $ 8,323,280 |
| Health Care Providers & Services — 9.6% |
| Addus HomeCare Corp.(1) | | 12,975 | $ 1,023,727 |
| Agiliti, Inc.(1) | | 62,037 | 349,268 |
| Chemed Corp. | | 9,941 | 5,593,304 |
| Option Care Health, Inc.(1) | | 66,117 | 1,833,424 |
| Premier, Inc., Class A | | 33,499 | 643,851 |
| R1 RCM, Inc.(1) | | 208,878 | 2,462,672 |
| U.S. Physical Therapy, Inc. | | 43,652 | 3,671,570 |
| | | | $ 15,577,816 |
| Hotels, Restaurants & Leisure — 4.2% |
| Papa John's International, Inc. | | 15,568 | $ 1,012,231 |
| Texas Roadhouse, Inc. | | 10,134 | 1,029,007 |
| Wyndham Hotels & Resorts, Inc. | | 65,602 | 4,749,585 |
| | | | $ 6,790,823 |
| Industrial REITs — 4.3% |
| EastGroup Properties, Inc. | | 22,005 | $ 3,592,316 |
| Rexford Industrial Realty, Inc. | | 28,203 | 1,219,498 |
| Terreno Realty Corp. | | 40,692 | 2,168,070 |
| | | | $ 6,979,884 |
| Insurance — 9.0% |
| AMERISAFE, Inc. | | 28,060 | $ 1,430,218 |
| RLI Corp. | | 23,812 | 3,172,711 |
| Ryan Specialty Holdings, Inc.(1) | | 55,838 | 2,412,201 |
| Selective Insurance Group, Inc. | | 33,135 | 3,449,685 |
| White Mountains Insurance Group, Ltd. | | 2,897 | 4,144,883 |
| | | | $ 14,609,698 |
| Leisure Products — 0.6% |
| Brunswick Corp. | | 13,719 | $ 953,059 |
| | | | $ 953,059 |
| Machinery — 2.8% |
| Albany International Corp., Class A | | 19,957 | $ 1,628,691 |
| Middleby Corp.(1) | | 25,649 | 2,895,002 |
| | | | $ 4,523,693 |
| Professional Services — 4.4% |
| CBIZ, Inc.(1) | | 102,511 | $ 5,326,472 |
| Security | Shares | Value |
| Professional Services (continued) |
| NV5 Global, Inc.(1) | | 19,154 | $ 1,807,180 |
| | | | $ 7,133,652 |
| Retail REITs — 1.2% |
| NETSTREIT Corp. | | 139,681 | $ 1,990,454 |
| | | | $ 1,990,454 |
| Software — 7.8% |
| Altair Engineering, Inc., Class A(1) | | 43,972 | $ 2,731,541 |
| Clearwater Analytics Holdings, Inc., Class A(1) | | 108,405 | 1,959,962 |
| Envestnet, Inc.(1) | | 63,643 | 2,354,791 |
| PowerSchool Holdings, Inc., Class A(1) | | 44,207 | 880,603 |
| Progress Software Corp. | | 44,923 | 2,308,144 |
| SPS Commerce, Inc.(1) | | 14,429 | 2,313,546 |
| | | | $ 12,548,587 |
| Specialized REITs — 1.4% |
| CubeSmart | | 64,989 | $ 2,215,475 |
| | | | $ 2,215,475 |
| Specialty Retail — 3.7% |
| Burlington Stores, Inc.(1) | | 6,791 | $ 821,915 |
| RH (1) | | 3,530 | 769,399 |
| Valvoline, Inc. | | 145,360 | 4,312,831 |
| | | | $ 5,904,145 |
| Textiles, Apparel & Luxury Goods — 0.5% |
| Steven Madden, Ltd. | | 22,477 | $ 737,021 |
| | | | $ 737,021 |
| Trading Companies & Distributors — 3.3% |
| Core & Main, Inc., Class A(1) | | 146,343 | $ 4,401,997 |
| Herc Holdings, Inc. | | 9,350 | 998,487 |
| | | | $ 5,400,484 |
Total Common Stocks
(identified cost $143,641,542) | | | $160,085,413 |
20
See Notes to Financial Statements.
Tax-Managed Small-Cap Portfolio
October 31, 2023
Portfolio of Investments — continued
| Short-Term Investments — 0.9% |
| Security | Shares | Value |
| Morgan Stanley Institutional Liquidity Funds - Government Portfolio, Institutional Class, 5.25%(2) | | 1,508,206 | $ 1,508,206 |
Total Short-Term Investments
(identified cost $1,508,206) | | | $ 1,508,206 |
Total Investments — 99.9%
(identified cost $145,149,748) | | | $161,593,619 |
| Other Assets, Less Liabilities — 0.1% | | | $ 176,715 |
| Net Assets — 100.0% | | | $161,770,334 |
| The percentage shown for each investment category in the Portfolio of Investments is based on net assets. |
| (1) | Non-income producing security. |
| (2) | May be deemed to be an affiliated investment company. The rate shown is the annualized seven-day yield as of October 31, 2023. |
| Abbreviations: |
| ADR | – American Depositary Receipt |
| REITs | – Real Estate Investment Trusts |
21
See Notes to Financial Statements.
Tax-Managed Small-Cap Portfolio
October 31, 2023
Statement of Assets and Liabilities
| | October 31, 2023 |
| Assets | |
| Unaffiliated investments, at value (identified cost $143,641,542) | $ 160,085,413 |
| Affiliated investments, at value (identified cost $1,508,206) | 1,508,206 |
| Dividends receivable | 41,051 |
| Dividends receivable from affiliated investments | 6,470 |
| Receivable for investments sold | 525,733 |
| Trustees' deferred compensation plan | 56,591 |
| Total assets | $162,223,464 |
| Liabilities | |
| Payable for investments purchased | $ 236,006 |
| Payable to affiliates: | |
| Investment adviser fee | 88,896 |
| Trustees' fees | 1,038 |
| Trustees' deferred compensation plan | 56,591 |
| Accrued expenses | 70,599 |
| Total liabilities | $ 453,130 |
| Net Assets applicable to investors' interest in Portfolio | $161,770,334 |
22
See Notes to Financial Statements.
Tax-Managed Small-Cap Portfolio
October 31, 2023
| | Year Ended |
| | October 31, 2023 |
| Investment Income | |
| Dividend income | $ 2,310,027 |
| Dividend income from affiliated investments | 119,756 |
| Total investment income | $ 2,429,783 |
| Expenses | |
| Investment adviser fee | $ 1,140,367 |
| Trustees’ fees and expenses | 12,138 |
| Custodian fee | 49,542 |
| Legal and accounting services | 40,422 |
| Miscellaneous | 10,128 |
| Total expenses | $ 1,252,597 |
| Deduct: | |
| Waiver and/or reimbursement of expenses by affiliates | $ 4,291 |
| Total expense reductions | $ 4,291 |
| Net expenses | $ 1,248,306 |
| Net investment income | $ 1,181,477 |
| Realized and Unrealized Gain (Loss) | |
| Net realized gain (loss): | |
| Investment transactions | $ 6,239,441(1) |
| Net realized gain | $ 6,239,441 |
| Change in unrealized appreciation (depreciation): | |
| Investments | $ (19,977,504) |
| Net change in unrealized appreciation (depreciation) | $(19,977,504) |
| Net realized and unrealized loss | $(13,738,063) |
| Net decrease in net assets from operations | $(12,556,586) |
| (1) | Includes $3,629,618 of net realized gains from redemptions in-kind. |
23
See Notes to Financial Statements.
Tax-Managed Small-Cap Portfolio
October 31, 2023
Statements of Changes in Net Assets
| | Year Ended October 31, |
| | 2023 | 2022 |
| Increase (Decrease) in Net Assets | | |
| From operations: | | |
| Net investment income | $ 1,181,477 | $ 793,887 |
| Net realized gain | 6,239,441 (1) | 9,133,748 (2) |
| Net change in unrealized appreciation (depreciation) | (19,977,504) | (36,265,894) |
| Net decrease in net assets from operations | $ (12,556,586) | $ (26,338,259) |
| Capital transactions: | | |
| Contributions | $ 5,986,402 | $ 7,915,041 |
| Withdrawals | (11,288,950) | (17,215,619) |
| Net decrease in net assets from capital transactions | $ (5,302,548) | $ (9,300,578) |
| Net decrease in net assets | $ (17,859,134) | $ (35,638,837) |
| Net Assets | | |
| At beginning of year | $ 179,629,468 | $ 215,268,305 |
| At end of year | $161,770,334 | $179,629,468 |
| (1) | Includes $3,629,618 of net realized gains from redemptions in-kind. |
| (2) | Includes $5,199,110 of net realized gains from redemptions in-kind. |
24
See Notes to Financial Statements.
Tax-Managed Small-Cap Portfolio
October 31, 2023
| | Year Ended October 31, |
| Ratios/Supplemental Data | 2023 | 2022 | 2021 | 2020 | 2019 |
| Ratios (as a percentage of average daily net assets): | | | | | |
| Expenses | 0.68% (1) | 0.69% (1) | 0.68% | 0.69% | 0.69% |
| Net investment income | 0.65% | 0.41% | 0.27% | 0.54% | 0.51% |
| Portfolio Turnover | 38% | 43% | 40% | 44% | 51% |
| Total Return | (7.19)% | (12.42)% | 42.69% | (2.63)% | 12.82% |
| Net assets, end of year (000’s omitted) | $161,770 | $179,629 | $215,268 | $155,429 | $178,500 |
| (1) | Includes a reduction by the investment adviser of a portion of its adviser fee due to the Portfolio’s investment in the Liquidity Fund (equal to less than 0.005% of average daily net assets for the years ended October 31, 2023 and 2022). |
Tax-Managed Small-Cap Portfolio
October 31, 2023
Notes to Financial Statements
1 Significant Accounting Policies
Tax-Managed Small-Cap Portfolio (the Portfolio) is a Massachusetts business trust registered under the Investment Company Act of 1940, as amended (the 1940 Act), as a diversified, open-end management investment company. The Portfolio’s investment objective is to achieve long-term, after-tax returns by investing primarily in a diversified portfolio of publicly-traded equity securities of small-cap companies. The Declaration of Trust permits the Trustees to issue interests in the Portfolio. At October 31, 2023, Eaton Vance Tax-Managed Small-Cap Fund and Eaton Vance Tax-Managed Equity Asset Allocation Fund held an interest of 65.5% and 34.5%, respectively, in the Portfolio.
The following is a summary of significant accounting policies of the Portfolio. The policies are in conformity with accounting principles generally accepted in the United States of America (U.S. GAAP). The Portfolio is an investment company and follows accounting and reporting guidance in the Financial Accounting Standards Board (FASB) Accounting Standards Codification Topic 946.
A Investment Valuation—The following methodologies are used to determine the market value or fair value of investments.
Equity Securities. Equity securities listed on a U.S. securities exchange generally are valued at the last sale or closing price on the day of valuation or, if no sales took place on such date, at the mean between the closing bid and ask prices on the exchange where such securities are principally traded. Equity securities listed on the NASDAQ National Market System are valued at the NASDAQ official closing price. Unlisted or listed securities for which closing sales prices or closing quotations are not available are valued at the mean between the latest available bid and ask prices.
Other. Investments in management investment companies (including money market funds) that do not trade on an exchange are valued at the net asset value as of the close of each business day.
Fair Valuation. In connection with Rule 2a-5 of the 1940 Act, the Trustees have designated the Portfolio’s investment adviser as its valuation designee. Investments for which valuations or market quotations are not readily available or are deemed unreliable are valued by the investment adviser, as valuation designee, at fair value using methods that most fairly reflect the security’s “fair value”, which is the amount that the Portfolio might reasonably expect to receive for the security upon its current sale in the ordinary course. Each such determination is based on a consideration of relevant factors, which are likely to vary from one pricing context to another. These factors may include, but are not limited to, the type of security, the existence of any contractual restrictions on the security’s disposition, the price and extent of public trading in similar securities of the issuer or of comparable companies or entities, quotations or relevant information obtained from broker/dealers or other market participants, information obtained from the issuer, analysts, and/or the appropriate stock exchange (for exchange-traded securities), an analysis of the company’s or entity’s financial statements, and an evaluation of the forces that influence the issuer and the market(s) in which the security is purchased and sold.
B Investment Transactions—Investment transactions for financial statement purposes are accounted for on a trade date basis. Realized gains and losses on investments sold are determined on the basis of identified cost.
C Income—Dividend income is recorded on the ex-dividend date for dividends received in cash and/or securities.
D Federal Taxes—The Portfolio has elected to be treated as a partnership for federal tax purposes. No provision is made by the Portfolio for federal or state taxes on any taxable income of the Portfolio because each investor in the Portfolio is ultimately responsible for the payment of any taxes on its share of taxable income. Since at least one of the Portfolio's investors is a regulated investment company that invests all or substantially all of its assets in the Portfolio, the Portfolio normally must satisfy the applicable source of income and diversification requirements (under the Internal Revenue Code) in order for its investors to satisfy them. The Portfolio will allocate, at least annually among its investors, each investor's distributive share of the Portfolio's net investment income, net realized capital gains and losses and any other items of income, gain, loss, deduction or credit.
As of October 31, 2023, the Portfolio had no uncertain tax positions that would require financial statement recognition, de-recognition, or disclosure. The Portfolio files a U.S. federal income tax return annually after its fiscal year-end, which is subject to examination by the Internal Revenue Service for a period of three years from the date of filing.
E Use of Estimates—The preparation of the financial statements in conformity with U.S. GAAP requires management to make estimates and assumptions that affect the reported amounts of assets and liabilities at the date of the financial statements and the reported amounts of income and expense during the reporting period. Actual results could differ from those estimates.
F Indemnifications—Under the Portfolio’s organizational documents, its officers and Trustees may be indemnified against certain liabilities and expenses arising out of the performance of their duties to the Portfolio. Under Massachusetts law, if certain conditions prevail, interestholders in the Portfolio could be deemed to have personal liability for the obligations of the Portfolio. However, the Portfolio’s Declaration of Trust contains an express disclaimer of liability on the part of Portfolio interestholders. Additionally, in the normal course of business, the Portfolio enters into agreements with service providers that may contain indemnification clauses. The Portfolio’s maximum exposure under these arrangements is unknown as this would involve future claims that may be made against the Portfolio that have not yet occurred.
Tax-Managed Small-Cap Portfolio
October 31, 2023
Notes to Financial Statements — continued
2 Investment Adviser Fee and Other Transactions with Affiliates
The investment adviser fee is earned by Boston Management and Research (BMR), an indirect, wholly-owned subsidiary of Morgan Stanley, as compensation for investment advisory services rendered to the Portfolio. The fee is computed at an annual rate as a percentage of the Portfolio’s average daily net assets as follows and is payable monthly:
| Average Daily Net Assets | Annual Fee Rate |
| Up to $500 million | 0.6250% |
| $500 million but less than $1 billion | 0.5625% |
| $1 billion but less than $1.5 billion | 0.5000% |
| $1.5 billion and over | 0.4375% |
For the year ended October 31, 2023, the investment adviser fee amounted to $1,140,367 or 0.625% of the Portfolio’s average daily net assets. The Portfolio may invest in a money market fund, the Institutional Class of the Morgan Stanley Institutional Liquidity Funds - Government Portfolio (the “Liquidity Fund”), an open-end management investment company managed by Morgan Stanley Investment Management Inc., a wholly-owned subsidiary of Morgan Stanley. The investment adviser fee paid by the Portfolio is reduced by an amount equal to its pro rata share of the advisory and administration fees paid by the Portfolio due to its investment in the Liquidity Fund. For the year ended October 31, 2023, the investment adviser fee paid was reduced by $4,291 relating to the Portfolio’s investment in the Liquidity Fund.
Trustees and officers of the Portfolio who are members of BMR’s organization receive remuneration for their services to the Portfolio out of the investment adviser fee. Trustees of the Portfolio who are not affiliated with the investment adviser may elect to defer receipt of all or a percentage of their annual fees in accordance with the terms of the Trustees Deferred Compensation Plan. Certain officers and Trustees of the Portfolio are officers of the above organization.
3 Purchases and Sales of Investments
Purchases and sales of investments, other than short-term obligations and in-kind transactions, aggregated $70,864,807 and $67,616,828, respectively, for the year ended October 31, 2023. In-kind sales for the year ended October 31, 2023 aggregated $5,020,145.
4 Federal Income Tax Basis of Investments
The cost and unrealized appreciation (depreciation) of investments of the Portfolio at October 31, 2023, as determined on a federal income tax basis, were as follows:
| Aggregate cost | $ 145,797,562 |
| Gross unrealized appreciation | $ 29,206,291 |
| Gross unrealized depreciation | (13,410,234) |
| Net unrealized appreciation | $ 15,796,057 |
5 Line of Credit
The Portfolio participates with other portfolios and funds managed by BMR and its affiliates in a $650 million unsecured revolving line of credit agreement with a group of banks, which is in effect through October 22, 2024. In connection with the renewal of the agreement on October 24, 2023, the borrowing limit was decreased from $725 million. Borrowings are made by the Portfolio solely for temporary purposes related to redemptions and other short-term cash needs. Interest is charged to the Portfolio based on its borrowings at an amount above either the Secured Overnight Financing Rate (SOFR) or Federal Funds rate. In addition, a fee computed at an annual rate of 0.15% on the daily unused portion of the line of credit is allocated among the participating portfolios and funds at the end of each quarter. In connection with the renewal of the agreement in October 2023, an arrangement fee totaling $150,000 was incurred that was allocated to the participating portfolios and funds. Because the line of credit is not available exclusively to the Portfolio, it may be unable to borrow some or all of its requested amounts at any particular time. The Portfolio did not have any significant borrowings or allocated fees during the year ended October 31, 2023.
Tax-Managed Small-Cap Portfolio
October 31, 2023
Notes to Financial Statements — continued
6 Affiliated Investments
At October 31, 2023, the value of the Portfolio's investment in funds that may be deemed to be affiliated was $1,508,206, which represents 0.9% of the Portfolio's net assets. Transactions in such investments by the Portfolio for the fiscal year to date ended October 31, 2023 were as follows:
| Name | Value,
beginning
of period | Purchases | Sales
proceeds | Net
realized
gain (loss) | Change in
unrealized
appreciation
(depreciation) | Value, end
of period | Dividend
income | Shares,
end of period |
| Short-Term Investments |
| Liquidity Fund | $5,430,229 | $35,787,135 | $(39,709,158) | $ — | $ — | $1,508,206 | $119,756 | 1,508,206 |
7 Fair Value Measurements
Under generally accepted accounting principles for fair value measurements, a three-tier hierarchy to prioritize the assumptions, referred to as inputs, is used in valuation techniques to measure fair value. The three-tier hierarchy of inputs is summarized in the three broad levels listed below.
| • | Level 1 – quoted prices in active markets for identical investments |
| • | Level 2 – other significant observable inputs (including quoted prices for similar investments, interest rates, prepayment speeds, credit risk, etc.) |
| • | Level 3 – significant unobservable inputs (including a fund's own assumptions in determining the fair value of investments) |
In cases where the inputs used to measure fair value fall in different levels of the fair value hierarchy, the level disclosed is determined based on the lowest level input that is significant to the fair value measurement in its entirety. The inputs or methodology used for valuing securities are not necessarily an indication of the risk associated with investing in those securities.
At October 31, 2023, the hierarchy of inputs used in valuing the Portfolio's investments, which are carried at fair value, were as follows:
| Asset Description | Level 1 | Level 2 | Level 3 | Total |
| Common Stocks | $ 160,085,413* | $ — | $ — | $ 160,085,413 |
| Short-Term Investments | 1,508,206 | — | — | 1,508,206 |
| Total Investments | $ 161,593,619 | $ — | $ — | $161,593,619 |
| * | The level classification by major category of investments is the same as the category presentation in the Portfolio of Investments. |
Tax-Managed Small-Cap Portfolio
October 31, 2023
Report of Independent Registered Public Accounting Firm
To the Trustees and Investors of Tax-Managed Small-Cap Portfolio:
Opinion on the Financial Statements and Financial Highlights
We have audited the accompanying statement of assets and liabilities of Tax-Managed Small-Cap Portfolio (the “Portfolio"), including the portfolio of investments, as of October 31, 2023, the related statement of operations for the year then ended, the statements of changes in net assets for each of the two years in the period then ended, the financial highlights for each of the five years in the period then ended, and the related notes. In our opinion, the financial statements and financial highlights present fairly, in all material respects, the financial position of the Portfolio as of October 31, 2023, and the results of its operations for the year then ended, the changes in its net assets for each of the two years in the period then ended, and the financial highlights for each of the five years in the period then ended, in conformity with accounting principles generally accepted in the United States of America.
Basis for Opinion
These financial statements and financial highlights are the responsibility of the Portfolio’s management. Our responsibility is to express an opinion on the Portfolio’s financial statements and financial highlights based on our audits. We are a public accounting firm registered with the Public Company Accounting Oversight Board (United States) (PCAOB) and are required to be independent with respect to the Portfolio in accordance with the U.S. federal securities laws and the applicable rules and regulations of the Securities and Exchange Commission and the PCAOB.
We conducted our audits in accordance with the standards of the PCAOB. Those standards require that we plan and perform the audit to obtain reasonable assurance about whether the financial statements and financial highlights are free of material misstatement, whether due to error or fraud. The Portfolio is not required to have, nor were we engaged to perform, an audit of its internal control over financial reporting. As part of our audits, we are required to obtain an understanding of internal control over financial reporting but not for the purpose of expressing an opinion on the effectiveness of the Portfolio’s internal control over financial reporting. Accordingly, we express no such opinion.
Our audits included performing procedures to assess the risks of material misstatement of the financial statements and financial highlights, whether due to error or fraud, and performing procedures that respond to those risks. Such procedures included examining, on a test basis, evidence regarding the amounts and disclosures in the financial statements and financial highlights. Our audits also included evaluating the accounting principles used and significant estimates made by management, as well as evaluating the overall presentation of the financial statements and financial highlights. Our procedures included confirmation of securities owned as of October 31, 2023, by correspondence with the custodian and brokers; when replies were not received from brokers, we performed other auditing procedures. We believe that our audits provide a reasonable basis for our opinion.
/s/ Deloitte & Touche LLP
Boston, Massachusetts
December 19, 2023
We have served as the auditor of one or more Eaton Vance investment companies since 1959.
Eaton Vance
Tax-Managed Small-Cap Fund
October 31, 2023
Board of Trustees’ Contract Approval
Overview of the Contract Review Process
The Investment Company Act of 1940, as amended (the “1940 Act”), provides, in substance, that the investment advisory agreement between a fund and its investment adviser will continue in effect from year-to-year only if its continuation is approved on an annual basis by a vote of the fund’s board of trustees, including a majority of the trustees who are not “interested persons” of the fund (“independent trustees”), cast in person at a meeting called for the purpose of considering such approval.
At a meeting held on June 8, 2023, the Boards of Trustees/Directors (collectively, the “Board”) that oversee the registered investment companies advised by Eaton Vance Management or its affiliate, Boston Management and Research (the “Eaton Vance Funds”), including a majority of the independent trustees (the “Independent Trustees”), voted to approve the continuation of existing investment advisory agreements and sub-advisory agreements1 for each of the Eaton Vance Funds for an additional one-year period. The Board relied upon the affirmative recommendation of its Contract Review Committee, which is a committee exclusively comprised of Independent Trustees. Prior to making its recommendation, the Contract Review Committee reviewed information furnished by the adviser and sub-adviser to each of the Eaton Vance Funds (including information specifically requested by the Board) for a series of formal meetings held between April and June 2023, as well as certain additional information provided in response to specific requests from the Independent Trustees as members of the Contract Review Committee. Members of the Contract Review Committee also considered information received at prior meetings of the Board and its committees, to the extent such information was relevant to the Contract Review Committee’s annual evaluation of the investment advisory agreements and sub-advisory agreements.
In connection with its evaluation of the investment advisory agreements and sub-advisory agreements, the Board considered various information relating to the Eaton Vance Funds. This included information applicable to all or groups of Eaton Vance Funds, which is referenced immediately below, and information applicable to the particular Eaton Vance Fund covered by this report (each “Eaton Vance Fund” is referred to below as a “fund”). (For funds that invest through one or more underlying portfolios, references to “each fund” in this section may include information that was considered at the portfolio-level.)
Information about Fees, Performance and Expenses
• A report from an independent data provider comparing advisory and other fees paid by each fund to such fees paid by comparable funds, as identified by the independent data provider (“comparable funds”);
• A report from an independent data provider comparing each fund’s total expense ratio (and its components) to those of comparable funds;
• A report from an independent data provider comparing the investment performance of each fund (including, as relevant, total return data, income data, Sharpe ratios and information ratios) to the investment performance of comparable funds and, as applicable, benchmark indices, over various time periods;
• In certain instances, data regarding investment performance relative to customized groups of peer funds and blended indices identified by the adviser in consultation with the Portfolio Management Committee of the Board (a committee exclusively comprised of Independent Trustees);
• Comparative information concerning the fees charged and services provided by the adviser and sub-adviser to each fund in managing other accounts (which may include other mutual funds, collective investment funds and institutional accounts) using investment strategies and techniques similar to those used in managing such fund(s), if any;
• Profitability analyses with respect to the adviser and sub-adviser to each of the funds;
Information about Portfolio Management and Trading
• Descriptions of the investment management services provided to each fund, as well as each of the funds’ investment strategies and policies;
• The procedures and processes used to determine the value of fund assets, including, when necessary, the determination of “fair value” and actions taken to monitor and test the effectiveness of such procedures and processes;
• Information about the policies and practices of each fund’s adviser and sub-adviser with respect to trading, including their processes for seeking best execution of portfolio transactions;
• Information about the allocation of brokerage transactions and the benefits, if any, received by the adviser and sub-adviser to each fund as a result of brokerage allocation, including, as applicable, information concerning the acquisition of research through client commission arrangements and policies with respect to “soft dollars”;
• Data relating to the portfolio turnover rate of each fund and related information regarding active management in the context of particular strategies;
Information about each Adviser and Sub-adviser
• Reports detailing the financial results and condition of the adviser and sub-adviser to each fund;
1 Not all Eaton Vance Funds have entered into a sub-advisory agreement with a sub-adviser. Accordingly, references to “sub-adviser” or “sub-advisory agreement” in this “Overview” section may not be applicable to the particular Eaton Vance Fund covered by this report.
Eaton Vance
Tax-Managed Small-Cap Fund
October 31, 2023
Board of Trustees’ Contract Approval — continued
• Information regarding the individual investment professionals whose responsibilities include portfolio management and investment research for the funds, and, for portfolio managers and certain other investment professionals, information relating to their responsibilities with respect to managing other mutual funds and investment accounts, as applicable;
• Information regarding the adviser’s and its parent company’s (Morgan Stanley’s) efforts to retain and attract talented investment professionals, including in the context of a competitive marketplace for talent, as well as the ongoing unique environment presented by hybrid, remote and other alternative work arrangements;
• Information regarding the adviser’s compensation methodology for its investment professionals and the incentives and accountability it creates, along with investment professionals’ investments in the fund(s) they manage;
• The Code of Ethics of the adviser and its affiliates and the sub-adviser of each fund, together with information relating to compliance with, and the administration of, such codes;
• Policies and procedures relating to proxy voting, including regular reporting with respect to fund proxy voting activities;
• Information regarding the handling of corporate actions and class actions, as well as information regarding litigation and other regulatory matters;
• Information concerning the resources devoted to compliance efforts undertaken by the adviser and its affiliates and the sub-adviser of each fund, if any, including descriptions of their various compliance programs and their record of compliance;
• Information concerning the business continuity and disaster recovery plans of the adviser and its affiliates and the sub-adviser of each fund, if any;
• A description of Eaton Vance Management’s and Boston Management and Research’s oversight of sub-advisers, including with respect to regulatory and compliance issues, investment management and other matters;
Other Relevant Information
• Information regarding ongoing initiatives to further integrate and harmonize, where applicable, the investment management and other departments of the adviser and its affiliates with the overall investment management infrastructure of Morgan Stanley, in light of Morgan Stanley’s acquisition of Eaton Vance Corp. on March 1, 2021;
• Information concerning the nature, cost and character of the administrative and other non-investment advisory services provided by Eaton Vance Management and its affiliates;
• Information concerning oversight of the relationship with the custodian, subcustodians, fund accountants, and other third-party service providers by the adviser and/or administrator to each of the funds;
• Information concerning efforts to implement policies and procedures with respect to various recently adopted regulations applicable to the funds, including Rule 12d1-4 (the Fund-of-Funds Rule), Rule 18f-4 (the Derivatives Rule) and Rule 2a-5 (the Fair Valuation Rule);
• For an Eaton Vance Fund structured as an exchange-listed closed-end fund, information concerning the benefits of the closed-end fund structure, as well as, where relevant, the closed-end fund’s market prices (including as compared to the closed-end fund’s net asset value (NAV)), trading volume data, continued use of auction preferred shares (where applicable), distribution rates and other relevant matters;
• The risks which the adviser and/or its affiliates incur in connection with the management and operation of the funds, including, among others, litigation, regulatory, entrepreneurial, and other business risks (and the associated costs of such risks); and
• The terms of each investment advisory agreement and sub-advisory agreement.
During the various meetings of the Board and its committees over the course of the year leading up to the June 8, 2023 meeting, the Board received information from portfolio managers and other investment professionals of the advisers and sub-advisers of the funds regarding investment and performance matters, and considered various investment and trading strategies used in pursuing the funds’ investment objectives. The Board also received information regarding risk management techniques employed in connection with the management of the funds. The Board and its committees evaluated issues pertaining to industry and regulatory developments, compliance procedures, fund governance and other issues with respect to the funds, and received and participated in reports and presentations provided by Eaton Vance Management, Boston Management and Research and fund sub-advisers, with respect to such matters. In addition to the formal meetings of the Board and its committees, the Independent Trustees held regular teleconferences to discuss, among other topics, matters relating to the continuation of investment advisory agreements and sub-advisory agreements.
The Contract Review Committee was advised throughout the contract review process by Goodwin Procter LLP, independent legal counsel for the Independent Trustees. The members of the Contract Review Committee, with the advice of such counsel, exercised their own business judgment in determining the material factors to be considered in evaluating each investment advisory agreement and sub-advisory agreement and the weight to be given to each such factor. The conclusions reached with respect to each investment advisory agreement and sub-advisory agreement were based on a comprehensive evaluation of all the information provided and not any single factor. Moreover, each member of the Contract Review Committee may have placed varying emphasis on particular factors in reaching conclusions with respect to each investment advisory agreement and sub-advisory agreement. In evaluating each investment advisory agreement and sub-advisory agreement, including the fee structures and other terms contained in such agreements, the members of the Contract Review Committee were also informed by multiple years of analysis and discussion with the adviser and sub-adviser to each of the Eaton Vance Funds.
Eaton Vance
Tax-Managed Small-Cap Fund
October 31, 2023
Board of Trustees’ Contract Approval — continued
Results of the Contract Review Process
Based on its consideration of the foregoing, and such other information it deemed relevant, including the factors and conclusions described below, the Contract Review Committee concluded that the continuation of the investment advisory agreement between Eaton Vance Tax-Managed Small-Cap Fund (the “Fund”) and Eaton Vance Management (“EVM”), as well as the investment advisory agreement between Tax-Managed Small-Cap Portfolio (the “Portfolio”), the portfolio in which the Fund invests, and Boston Management and Research (“BMR”) (EVM, with respect to the Fund, and BMR, with respect to the Portfolio, are each referred to herein as the “Adviser”), including their respective fee structures, are in the interests of shareholders and, therefore, recommended to the Board approval of each agreement. Based on the recommendation of the Contract Review Committee, the Board, including a majority of the Independent Trustees, voted to approve continuation of the investment advisory agreements for the Fund and the Portfolio (together, the “investment advisory agreements”).
Nature, Extent and Quality of Services
In considering whether to approve the investment advisory agreements for the Fund and the Portfolio, the Board evaluated the nature, extent and quality of services provided to the Fund and to the Portfolio by the applicable Adviser.
The Board considered each Adviser’s management capabilities and investment processes in light of the types of investments held by the Fund and the Portfolio, including the education, experience and number of investment professionals and other personnel who provide portfolio management, investment research, and similar services to the Fund and the Portfolio. The Board specifically noted that each Adviser has devoted extensive resources to in-house equity research and also draws upon independent research available from third-party sources. The Board considered each Adviser’s experience managing funds that seek to maximize after-tax returns. The Board also took into account the resources dedicated to portfolio management and other services, the compensation methods of each Adviser and other factors, including the reputation and resources of the Adviser to recruit and retain highly qualified research, advisory and supervisory investment professionals. In addition, the Board considered the time and attention devoted to the Eaton Vance Funds, including the Fund and the Portfolio, by senior management, as well as the infrastructure, operational capabilities and support staff in place to assist in the portfolio management and operations of the Fund and the Portfolio, including the provision of administrative services. The Board also considered the business-related and other risks to which each Adviser or its affiliates may be subject in managing the Fund and the Portfolio.
The Board noted that, under the terms of the investment advisory agreement of the Fund, EVM may invest assets of the Fund directly in securities, for which it would receive a fee, or in the Portfolio, for which it receives no separate fee but for which BMR receives an advisory fee from the Portfolio.
The Board considered the compliance programs of each Adviser and relevant affiliates thereof. The Board considered compliance and reporting matters regarding, among other things, personal trading by investment professionals, disclosure of portfolio holdings, late trading, frequent trading, portfolio valuation, business continuity and the allocation of investment opportunities. The Board also considered the responses of each Adviser and its affiliates to requests in recent years from regulatory authorities, such as the Securities and Exchange Commission and the Financial Industry Regulatory Authority.
The Board considered other administrative services provided or overseen by EVM and its affiliates, including transfer agency and accounting services. The Board evaluated the benefits to shareholders of investing in a fund that is a part of a large fund complex offering exposure to a variety of asset classes and investment disciplines, as well as the ability, in many cases, to exchange an investment among different funds without incurring additional sales charges.
After consideration of the foregoing factors, among others, the Board concluded that the nature, extent and quality of services provided by each Adviser, taken as a whole, are appropriate and consistent with the terms of the applicable investment advisory agreement.
Fund Performance
The Board compared the Fund’s investment performance to that of comparable funds identified by an independent data provider (the peer group), as well as an appropriate benchmark index and a custom peer group of similarly managed funds. The Board’s review included comparative performance data with respect to the Fund for the one-, three-, five- and ten-year periods ended December 31, 2022. In this regard, the Board noted that the performance of the Fund was higher than the median performance of the Fund’s peer group and custom peer group for the three-year period. The Board also noted that the performance of the Fund was higher than its benchmark index for the three-year period. The Board concluded that the performance of the Fund was satisfactory.
Management Fees and Expenses
The Board considered contractual fee rates payable by the Portfolio and by the Fund for advisory and administrative services (referred to collectively as “management fees”). As part of its review, the Board considered the Fund’s management fees and total expense ratio for the one-year period ended December 31, 2022, as compared to those of comparable funds, before and after giving effect to any undertaking to waive fees or reimburse expenses. The Board also considered factors that had an impact on the Fund’s total expense ratio relative to comparable funds.
After considering the foregoing information, and in light of the nature, extent and quality of the services provided by each Adviser, the Board concluded that the management fees charged for advisory and related services are reasonable.
Eaton Vance
Tax-Managed Small-Cap Fund
October 31, 2023
Board of Trustees’ Contract Approval — continued
Profitability and “Fall-Out” Benefits
The Board considered the level of profits realized by each Adviser and relevant affiliates thereof in providing investment advisory and administrative services to the Fund, to the Portfolio and to all Eaton Vance Funds as a group. The Board considered the level of profits realized without regard to marketing support or other payments by each Adviser and its affiliates to third parties in respect of distribution or other services.
The Board concluded that, in light of the foregoing factors and the nature, extent and quality of the services rendered, the profits realized by each Adviser and its affiliates are deemed not to be excessive.
The Board also considered direct or indirect fall-out benefits received by each Adviser and its affiliates in connection with their respective relationships with the Fund and the Portfolio, including the benefits of research services that may be available to each Adviser as a result of securities transactions effected for the Fund and the Portfolio and other investment advisory clients.
Economies of Scale
In reviewing management fees and profitability, the Board also considered the extent to which the applicable Adviser and its affiliates, on the one hand, and the Fund and the Portfolio, on the other hand, can expect to realize benefits from economies of scale as the assets of the Fund and the Portfolio increase. The Board acknowledged the difficulty in accurately measuring the benefits resulting from economies of scale, if any, with respect to the management of any specific fund or group of funds. The Board reviewed data summarizing the increases and decreases in the assets of the Fund and of all Eaton Vance Funds as a group over various time periods, and evaluated the extent to which the total expense ratio of the Fund and the profitability of each Adviser and its affiliates may have been affected by such increases or decreases. Based upon the foregoing, the Board concluded that the Fund currently shares in the benefits from economies of scale, if any, when they are realized by the Adviser. The Board also concluded that the structure of the advisory fees, which include breakpoints at several asset levels, will allow the Fund and the Portfolio to continue to benefit from any economies of scale in the future.
Eaton Vance
Tax-Managed Small-Cap Fund
October 31, 2023
Liquidity Risk Management Program
The Fund has implemented a written liquidity risk management program (Program) and related procedures to manage its liquidity in accordance with Rule 22e-4 under the Investment Company Act of 1940, as amended (Liquidity Rule). The Liquidity Rule defines “liquidity risk” as the risk that a fund could not meet requests to redeem shares issued by the fund without significant dilution of the remaining investors’ interests in the fund. The Fund’s Board of Trustees/Directors has designated the investment adviser to serve as the administrator of the Program and the related procedures. The administrator has established a Liquidity Risk Management Oversight Committee (Committee) to perform the functions necessary to administer the Program. As part of the Program, the administrator is responsible for identifying illiquid investments and categorizing the relative liquidity of the Fund’s investments in accordance with the Liquidity Rule. Under the Program, the administrator assesses, manages, and periodically reviews the Fund’s liquidity risk, and is responsible for making certain reports to the Fund’s Board of Trustees/Directors and the Securities and Exchange Commission (SEC) regarding the liquidity of the Fund’s investments, and to notify the Board of Trustees/Directors and the SEC of certain liquidity events specified in the Liquidity Rule. The liquidity of the Fund’s portfolio investments is determined based on a number of factors including, but not limited to, relevant market, trading and investment-specific considerations under the Program.
At a meeting of the Fund’s Board of Trustees/Directors on June 7, 2023, the Committee provided a written report to the Fund’s Board of Trustees/
Directors pertaining to the operation, adequacy, and effectiveness of implementation of the Program, as well as the operation of the highly liquid investment minimum (if applicable) for the period January 1, 2022 through December 31, 2022 (Review Period). The Program operated effectively during the Review Period, supporting the administrator’s ability to assess, manage and monitor Fund liquidity risk, including during periods of market volatility and net redemptions. During the Review Period, the Fund met redemption requests on a timely basis.
There can be no assurance that the Program will achieve its objectives in the future. Please refer to the Fund’s prospectus for more information regarding the Fund’s exposure to liquidity risk and other principal risks to which an investment in the Fund may be subject.
Eaton Vance
Tax-Managed Small-Cap Fund
October 31, 2023
Management and Organization
Fund Management. The Trustees of Eaton Vance Mutual Funds Trust (the Trust) and Tax-Managed Small-Cap Portfolo (the Portfolio) are responsible for the overall management and supervision of the Trust's and the Portfolio's affairs. The Board members and officers of the Trust and the Portfolio are listed below. Except as indicated, each individual has held the office shown or other offices in the same company for the last five years. Board members hold indefinite terms of office. Each Trustee holds office until his or her successor is elected and qualified, subject to a prior death, resignation, retirement, disqualification or removal. Under the terms of the Fund’s and the Portfolio's current Trustee retirement policy, an Independent Trustee must retire and resign as a Trustee on the earlier of: (i) the first day of July following his or her 74th birthday; or (ii), with limited exception, December 31st of the 20th year in which he or she has served as a Trustee. However, if such retirement and resignation would cause the Fund and the Portfolio to be out of compliance with Section 16 of the 1940 Act or any other regulations or guidance of the SEC, then such retirement and resignation will not become effective until such time as action has been taken for the Fund and the Portfolio to be in compliance therewith. The “noninterested Trustees” consist of those Trustees who are not “interested persons” of the Trust and the Portfolio, as that term is defined under the 1940 Act. The business address of each Board member and officer is Two International Place, Boston, Massachusetts 02110. As used below, “BMR” refers to Boston Management and Research, “EV” refers to EV LLC, “EVM” refers to Eaton Vance Management, “MSIM” refers to Morgan Stanley Investment Management Inc. and “EVD” refers to Eaton Vance Distributors, Inc. EV is the trustee of each of EVM and BMR. Each of EVM, BMR, EVD and EV are indirect, wholly owned subsidiaries of Morgan Stanley. Each officer affiliated with EVM may hold a position with other EVM affiliates that is comparable to his or her position with EVM listed below. Each Trustee oversees 127 funds in the Eaton Vance fund complex (including both funds and portfolios in a hub and spoke structure).
| Name and Year of Birth | Trust/Portfolio
Position(s) | Length of Service | Principal Occupation(s) and Other Directorships
During Past Five Years and Other Relevant Experience |
| Interested Trustee |
Anchal Pachnanda(1)
1980 | Trustee | Since 2023 | Co-Head of Strategy of MSIM (since 2019). Formerly, Head of Strategy of MSIM (2017-2019). Ms. Pachnanda is an interested person because of her position with MSIM, which is an affiliate of the Trust.
Other Directorships. None. |
| Noninterested Trustees |
Alan C. Bowser
1962 | Trustee | Since 2022 | Private investor. Formerly, Chief Diversity Officer, Partner and a member of the Operating Committee, and formerly served as Senior Advisor on Diversity and Inclusion for the firm’s chief executive officer, Co-Head of the Americas Region, and Senior Client Advisor of Bridgewater Associates, an asset management firm (2011- 2023).
Other Directorships. Independent Director of Stout Risius Ross (a middle market professional services advisory firm) (since 2021). |
Mark R. Fetting
1954 | Trustee | Since 2016 | Private investor. Formerly held various positions at Legg Mason, Inc. (investment management firm) (2000-2012), including President, Chief Executive Officer, Director and Chairman (2008-2012), Senior Executive Vice President (2004-2008) and Executive Vice President (2001-2004). Formerly, President of Legg Mason family of funds (2001-2008). Formerly, Division President and Senior Officer of Prudential Financial Group, Inc. and related companies (investment management firm) (1991-2000).
Other Directorships. None. |
Cynthia E. Frost
1961 | Trustee | Since 2014 | Private investor. Formerly, Chief Investment Officer of Brown University (university endowment) (2000-2012). Formerly, Portfolio Strategist for Duke Management Company (university endowment manager) (1995-2000). Formerly, Managing Director, Cambridge Associates (investment consulting company) (1989-1995). Formerly, Consultant, Bain and Company (management consulting firm) (1987-1989). Formerly, Senior Equity Analyst, BA Investment Management Company (1983-1985).
Other Directorships. None. |
George J. Gorman
1952 | Chairperson of the Board and Trustee | Since 2021
(Chairperson) and 2014 (Trustee) | Principal at George J. Gorman LLC (consulting firm). Formerly, Senior Partner at Ernst & Young LLP (a registered public accounting firm) (1974-2009).
Other Directorships. None. |
Eaton Vance
Tax-Managed Small-Cap Fund
October 31, 2023
Management and Organization — continued
| Name and Year of Birth | Trust/Portfolio
Position(s) | Length of Service | Principal Occupation(s) and Other Directorships
During Past Five Years and Other Relevant Experience |
| Noninterested Trustees (continued) |
Valerie A. Mosley
1960 | Trustee | Since 2014 | Chairwoman and Chief Executive Officer of Valmo Ventures (a consulting and investment firm). Founder of Upward Wealth, Inc., dba BrightUp, a fintech platform. Formerly, Partner and Senior Vice President, Portfolio Manager and Investment Strategist at Wellington Management Company, LLP (investment management firm) (1992-2012). Formerly, Chief Investment Officer, PG Corbin Asset Management (1990-1992). Formerly worked in institutional corporate bond sales at Kidder Peabody (1986-1990).
Other Directorships. Director of DraftKings, Inc. (digital sports entertainment and gaming company) (since September 2020). Director of Envestnet, Inc. (provider of intelligent systems for wealth management and financial wellness) (since 2018). Formerly, Director of Dynex Capital, Inc. (mortgage REIT) (2013-2020) and Director of Groupon, Inc. (e-commerce provider) (2020-2022). |
Keith Quinton
1958 | Trustee | Since 2018 | Private investor, researcher and lecturer. Formerly, Independent Investment Committee Member at New Hampshire Retirement System (2017-2021). Formerly, Portfolio Manager and Senior Quantitative Analyst at Fidelity Investments (investment management firm) (2001-2014).
Other Directorships. Formerly, Director (2016-2021) and Chairman (2019-2021) of New Hampshire Municipal Bond Bank. |
Marcus L. Smith
1966 | Trustee | Since 2018 | Private investor and independent corporate director. Formerly, Chief Investment Officer, Canada (2012-2017), Chief Investment Officer, Asia (2010-2012), Director of Asian Research (2004-2010) and portfolio manager (2001-2017) at MFS Investment Management (investment management firm).
Other Directorships. Director of First Industrial Realty Trust, Inc. (an industrial REIT) (since 2021). Director of MSCI Inc. (global provider of investment decision support tools) (since 2017). Formerly, Director of DCT Industrial Trust Inc. (logistics real estate company) (2017-2018). |
Susan J. Sutherland
1957 | Trustee | Since 2015 | Private investor. Director of Ascot Group Limited and certain of its subsidiaries (insurance and reinsurance) (since 2017). Formerly, Director of Hagerty Holding Corp. (insurance) (2015-2018) and Montpelier Re Holdings Ltd. (insurance and reinsurance) (2013-2015). Formerly, Associate, Counsel and Partner at Skadden, Arps, Slate, Meagher & Flom LLP (law firm) (1982-2013).
Other Directorships. Director of Kairos Acquisition Corp. (insurance/InsurTech acquisition company) (2021-2023). |
Scott E. Wennerholm
1959 | Trustee | Since 2016 | Private investor. Formerly, Trustee at Wheelock College (postsecondary institution) (2012-2018). Formerly, Consultant at GF Parish Group (executive recruiting firm) (2016-2017). Formerly, Chief Operating Officer and Executive Vice President at BNY Mellon Asset Management (investment management firm) (2005-2011). Formerly, Chief Operating Officer and Chief Financial Officer at Natixis Global Asset Management (investment management firm) (1997-2004). Formerly, Vice President at Fidelity Investments Institutional Services (investment management firm) (1994-1997).
Other Directorships. None. |
Nancy A. Wiser
1967 | Trustee | Since 2022 | Formerly, Executive Vice President and the Global Head of Operations at Wells Fargo Asset Management (2011-2021).
Other Directorships. None. |
| Name and Year of Birth | Trust/Portfolio
Position(s) | Length of Service | Principal Occupation(s)
During Past Five Years |
| Principal Officers who are not Trustees |
Kenneth A. Topping
1966 | President of the
Trust | Since 2023 | Vice President and Chief Administrative Officer of EVM and BMR and Chief Operating Officer for Public Markets at MSIM. Also Vice President of Calvert Research and Management (“CRM”) since 2021. Formerly, Chief Operating Officer for Goldman Sachs Asset Management ‘Classic’ (2009-2020). |
R. Kelly Williams, Jr.
1971 | President of the
Portfolio | Since 2023 | President and Chief Operating Officer of Atlanta Capital Management Company, LLC. Officer of 21 registered investment companies managed by Eaton Vance or BMR. |
Deidre E. Walsh
1971 | Vice President and Chief Legal Officer | Since 2009 | Vice President of EVM and BMR. Also Vice President of CRM. |
Eaton Vance
Tax-Managed Small-Cap Fund
October 31, 2023
Management and Organization — continued
| Name and Year of Birth | Trust/Portfolio
Position(s) | Length of Service | Principal Occupation(s)
During Past Five Years |
| Principal Officers who are not Trustees (continued) |
James F. Kirchner
1967 | Treasurer | Since 2007 | Vice President of EVM and BMR. Also Vice President of CRM. |
Nicholas S. Di Lorenzo
1987 | Secretary | Since 2022 | Formerly, associate (2012-2021) and counsel (2022) at Dechert LLP. |
Richard F. Froio
1968 | Chief Compliance
Officer | Since 2017 | Vice President of EVM and BMR since 2017. Formerly, Deputy Chief Compliance Officer (Adviser/Funds) and Chief Compliance Officer (Distribution) at PIMCO (2012-2017) and Managing Director at BlackRock/Barclays Global Investors (2009-2012). |
(1) Ms. Pachnanda began serving as Trustee effective April 1, 2023.
The SAI for the Fund includes additional information about the Trustees and officers of the Fund and the Portfolio and can be obtained without charge on Eaton Vance’s website at www.eatonvance.com or by calling 1-800-262-1122.
| FACTS | WHAT DOES EATON VANCE DO WITH YOUR
PERSONAL INFORMATION? |
| Why? | Financial companies choose how they share your personal information. Federal law gives consumers the right to limit some but not all sharing. Federal law also requires us to tell you how we collect, share, and protect your personal information. Please read this notice carefully to understand what we do. |
| |
| What? | The types of personal information we collect and share depend on the product or service you have with us. This information can include:■ Social Security number and income
■ investment experience and risk tolerance
■ checking account number and wire transfer instructions |
| |
| How? | All financial companies need to share customers’ personal information to run their everyday business. In the section below, we list the reasons financial companies can share their customers’ personal information; the reasons Eaton Vance chooses to share; and whether you can limit this sharing. |
Reasons we can share your
personal information | Does Eaton Vance
share? | Can you limit
this sharing? |
| For our everyday business purposes — such as to process your transactions, maintain your account(s), respond to court orders and legal investigations, or report to credit bureaus | Yes | No |
| For our marketing purposes — to offer our products and services to you | Yes | No |
| For joint marketing with other financial companies | No | We don’t share |
| For our investment management affiliates’ everyday business purposes — information about your transactions, experiences, and creditworthiness | Yes | Yes |
| For our affiliates’ everyday business purposes — information about your transactions and experiences | Yes | No |
| For our affiliates’ everyday business purposes — information about your creditworthiness | No | We don’t share |
| For our investment management affiliates to market to you | Yes | Yes |
| For our affiliates to market to you | No | We don’t share |
| For nonaffiliates to market to you | No | We don’t share |
To limit our
sharing | Call toll-free 1-800-262-1122 or email: EVPrivacy@eatonvance.comPlease note:If you are a new customer, we can begin sharing your information 30 days from the date we sent this notice. When you are no longer our customer, we continue to share your information as described in this notice. However, you can contact us at any time to limit our sharing. |
| Questions? | Call toll-free 1-800-262-1122 or email: EVPrivacy@eatonvance.com |
| Privacy Notice — continued | April 2021 |
| Who we are |
| Who is providing this notice? | Eaton Vance Management, Eaton Vance Distributors, Inc., Eaton Vance Trust Company, Eaton Vance Management (International) Limited, Eaton Vance Advisers International Ltd., Eaton Vance Global Advisors Limited, Eaton Vance Management’s Real Estate Investment Group, Boston Management and Research, Calvert Research and Management, Eaton Vance and Calvert Fund Families and our investment advisory affiliates (“Eaton Vance”) (see Investment Management Affiliates definition below) |
| What we do |
How does Eaton Vance
protect my personal
information? | To protect your personal information from unauthorized access and use, we use security measures that comply with federal law. These measures include computer safeguards and secured files and buildings. We have policies governing the proper handling of customer information by personnel and requiring third parties that provide support to adhere to appropriate security standards with respect to such information. |
How does Eaton Vance
collect my personal
information? | We collect your personal information, for example, when you■ open an account or make deposits or withdrawals from your account
■ buy securities from us or make a wire transfer
■ give us your contact informationWe also collect your personal information from others, such as credit bureaus, affiliates, or other companies. |
| Why can’t I limit all sharing? | Federal law gives you the right to limit only■ sharing for affiliates’ everyday business purposes — information about your creditworthiness
■ affiliates from using your information to market to you
■ sharing for nonaffiliates to market to youState laws and individual companies may give you additional rights to limit sharing. See below for more on your rights under state law. |
| Definitions |
Investment Management
Affiliates | Eaton Vance Investment Management Affiliates include registered investment advisers, registered broker- dealers, and registered and unregistered funds. Investment Management Affiliates does not include entities associated with Morgan Stanley Wealth Management, such as Morgan Stanley Smith Barney LLC and Morgan Stanley & Co. |
| Affiliates | Companies related by common ownership or control. They can be financial and nonfinancial companies.■ Our affiliates include companies with a Morgan Stanley name and financial companies such as Morgan Stanley Smith Barney LLC and Morgan Stanley & Co. |
| Nonaffiliates | Companies not related by common ownership or control. They can be financial and nonfinancial companies.■ Eaton Vance does not share with nonaffiliates so they can market to you. |
| Joint marketing | A formal agreement between nonaffiliated financial companies that together market financial products or services to you.■ Eaton Vance doesn’t jointly market. |
| Other important information |
| Vermont: Except as permitted by law, we will not share personal information we collect about Vermont residents with Nonaffiliates unless you provide us with your written consent to share such information.California: Except as permitted by law, we will not share personal information we collect about California residents with Nonaffiliates and we will limit sharing such personal information with our Affiliates to comply with California privacy laws that apply to us. |
Delivery of Shareholder Documents. The Securities and Exchange Commission (SEC) permits funds to deliver only one copy of shareholder documents, including prospectuses, proxy statements and shareholder reports, to fund investors with multiple accounts at the same residential or post office box address. This practice is often called “householding” and it helps eliminate duplicate mailings to shareholders. Eaton Vance, or your financial intermediary, may household the mailing of your documents indefinitely unless you instruct Eaton Vance, or your financial intermediary, otherwise. If you would prefer that your Eaton Vance documents not be householded, please contact Eaton Vance at 1-800-262-1122, or contact your financial intermediary. Your instructions that householding not apply to delivery of your Eaton Vance documents will typically be effective within 30 days of receipt by Eaton Vance or your financial intermediary.
Portfolio Holdings. Each Eaton Vance Fund and its underlying Portfolio(s) (if applicable) files a schedule of portfolio holdings on Part F to Form N-PORT with the SEC. Certain information filed on Form N-PORT may be viewed on the Eaton Vance website at www.eatonvance.com, by calling Eaton Vance at 1-800-262-1122 or in the EDGAR database on the SEC’s website at www.sec.gov.
Proxy Voting. From time to time, funds are required to vote proxies related to the securities held by the funds. The Eaton Vance Funds or their underlying Portfolios (if applicable) vote proxies according to a set of policies and procedures approved by the Funds’ and Portfolios’ Boards. You may obtain a description of these policies and procedures and information on how the Funds or Portfolios voted proxies relating to portfolio securities during the most recent 12-month period ended June 30, without charge, upon request, by calling 1-800-262-1122 and by accessing the SEC’s website at www.sec.gov.
Tailored Shareholder Reports. Effective January 24, 2023, the SEC adopted rule and form amendments to require open-end mutual funds and ETFs to transmit concise and visually engaging streamlined annual and semiannual reports to shareholders that highlight key information. Other information, including financial statements, will no longer appear in a streamlined shareholder report but must be available online, delivered free of charge upon request, and filed on a semiannual basis on Form N-CSR. The rule and form amendments have a compliance date of July 24, 2024. At this time, management is evaluating the impact of these amendments on the shareholder reports for the Eaton Vance Funds.
Investment Adviser of Tax-Managed Small-Cap Portfolio
Boston Management and Research
Two International Place
Boston, MA 02110
Investment Adviser and Administrator of Eaton Vance
Tax-Managed Small-Cap Fund
Eaton Vance Management
Two International Place
Boston, MA 02110
Principal Underwriter*
Eaton Vance Distributors, Inc.
Two International Place
Boston, MA 02110
(617) 482-8260
Custodian
State Street Bank and Trust Company
One Congress Street, Suite 1
Boston, MA 02114-2016
Transfer Agent
BNY Mellon Investment Servicing (US) Inc.
Attn: Eaton Vance Funds
P.O. Box 534439
Pittsburgh, PA 15253-4439
(800) 262-1122
Independent Registered Public Accounting Firm
Deloitte & Touche LLP
200 Berkeley Street
Boston, MA 02116-5022
Fund Offices
Two International Place
Boston, MA 02110
* FINRA BrokerCheck. Investors may check the background of their Investment Professional by contacting the Financial Industry Regulatory Authority (FINRA). FINRA BrokerCheck is a free tool to help investors check the professional background of current and former FINRA-registered securities firms and brokers. FINRA BrokerCheck is available by calling 1-800-289-9999 and at www.FINRA.org. The FINRA BrokerCheck brochure describing this program is available to investors at www.FINRA.org.
Eaton Vance
Tax-Managed Value Fund
Annual Report
October 31, 2023
Commodity Futures Trading Commission Registration. The Commodity Futures Trading Commission (“CFTC”) has adopted regulations that subject registered investment companies and advisers to regulation by the CFTC if a fund invests more than a prescribed level of its assets in certain CFTC-regulated instruments (including futures, certain options and swap agreements) or markets itself as providing investment exposure to such instruments. The investment adviser has claimed an exclusion from the definition of “commodity pool operator” under the Commodity Exchange Act with respect to its management of the Fund. Accordingly, neither the Fund nor the adviser with respect to the operation of the Fund is subject to CFTC regulation. Because of its management of other strategies, the Fund's adviser is registered with the CFTC as a commodity pool operator. The adviser is also registered as a commodity trading advisor.
Fund shares are not insured by the FDIC and are not deposits or other obligations of, or guaranteed by, any depository institution. Shares are subject to investment risks, including possible loss of principal invested.
This report must be preceded or accompanied by a current summary prospectus or prospectus. Before investing, investors should consider carefully the investment objective, risks, and charges and expenses of a mutual fund. This and other important information is contained in the summary prospectus and prospectus, which can be obtained from a financial intermediary. Prospective investors should read the prospectus carefully before investing. For further information, please call 1-800-262-1122.
Annual Report October 31, 2023
Eaton Vance
Tax-Managed Value Fund
Eaton Vance
Tax-Managed Value Fund
October 31, 2023
Management’s Discussion of Fund Performance†
Economic and Market Conditions
For U.S. equity investors, the 12-month period ended October 31, 2023, was a roller-coaster ride, driven largely by shifting perceptions of whether the U.S. Federal Reserve (the Fed) could bring the world’s largest economy in for a soft landing, and changing expectations of how long interest rates might remain high.
During the opening month of the period, stocks rallied on strong corporate earnings, attractive valuations, and hope the Fed might slow the pace of its interest rate hikes. But in December 2022, equities lost ground as “higher for longer” interest rate fears returned. A continuing irony throughout the period was that good economic news -- record low unemployment, strong job creation, and robust consumer spending -- was viewed as bad news for inflation and fuel for future rate hikes that could weigh on stock prices.
In January 2023, however, U.S. equities began a rally that lasted through July. The initial tailwind was ChatGPT, an artificial intelligence (AI) application that led investors to perceive AI might become the next big innovation to drive the information technology (IT) sector. As a result, IT -- one of the worst-performing sectors in 2022 -- became the standout sector of the first half of 2023. Earlier recession fears that had weighed on stock prices receded as many investors came around to the view that the U.S. economy was doing surprisingly well.
But in the final three months of the period, the bond market halted the stock market’s momentum. As it became clear the Fed would keep rates higher for longer than investors had anticipated just a few months earlier, longer-term bond interest rates rose sharply. Given the potential for relatively attractive returns with lower risk than stocks, many investors shifted from equity assets to bonds. In the final two days of the period, however, signs of a stock rally emerged as investors began to believe the Fed might have reached the end of its monetary tightening cycle.
For the period as a whole, however, U.S. equity performance was solid. The S&P 500® Index, a broad measure of U.S. stocks, returned 10.14%; the blue-chip Dow Jones Industrial Average® returned 3.17%; and the tech-heavy Nasdaq Composite Index returned 17.99%.
Fund Performance
For the 12-month period ended October 31, 2023, Eaton Vance Tax-Managed Value Fund (the Fund) returned -2.32% for Class A shares at net asset value (NAV), underperforming its benchmark, the Russell 1000® Value Index (the Index), which returned 0.13%.
On an individual stock basis, the largest detractors from Fund performance versus the Index were not owning Index component Meta Platforms, Inc. (Meta), and holding overweight positions in NextEra Energy, Inc. (NextEra) and PNC Financial Services Group, Inc. (PNC).
Not owning Meta -- the social media giant behind Facebook, Instagram, and Messenger -- detracted from returns as its stock price more than doubled during the period. Meta’s advertising revenues rebounded on improved ad targeting, while profit margins exceeded expectations due to a decrease in spending on longer-term initiatives. The Fund did not own Meta due to concerns that the stock was priced above its fair market value, as well as questions about the sustainability of the company’s earnings.
Despite strong earnings growth and a competitive advantage in renewable energy development, the share price of Florida-based utility NextEra declined during the period. Increasing 10-year U.S. Treasury yields were a headwind for NextEra’s stock price, raising concerns about the return potential of renewable energy projects amid the rising costs of debt financing.
The stock price of banking and financial services firm PNC declined on fears -- ultimately unfounded -- that the collapse of three large U.S. regional banks in the spring of 2023 might lead to liquidity issues across the regional banking sector.
On a sector basis, detractors from Fund performance relative to the Index included stock selections and an underweight position in the communication services sector -- the best performing sector within the Index during the period -- as well as stock selections in the consumer staples sector, and stock selections and an overweight position in the utilities sector.
In contrast, the largest contributors to Fund performance versus the Index on an individual stock basis included overweight positions in Eli Lilly & Co. (Eli Lilly) and Arch Capital Group, Ltd. (Arch Capital).
Eli Lilly is a global drugmaker specializing in diabetes, oncology, and immunology therapies. Eli Lilly’s share price appreciated significantly during the period, with its best performance occurring in August 2023 after the company reported strong second-quarter earnings driven in part by sales of its diabetes drug, Mounjaro.
Arch Capital writes insurance, reinsurance, and mortgage insurance policies worldwide. Arch Capital’s share price rose during the period as a result of strong earnings, driven by higher profit margins, lower-than-projected catastrophic losses, and growth in its reinsurance business.
See Endnotes and Additional Disclosures in this report.
Past performance is no guarantee of future results. Returns are historical and are calculated by determining the percentage change in net asset value (NAV) or offering price (as applicable) with all distributions reinvested. Furthermore, returns do not reflect the deduction of taxes that shareholders may have to pay on Fund distributions or upon the redemption of Fund shares. Investment return and principal value will fluctuate so that shares, when redeemed, may be worth more or less than their original cost. Performance for periods less than or equal to one year is cumulative. Performance is for the stated time period only; due to market volatility, current Fund performance may be lower or higher than the quoted return. For performance as of the most recent month-end, please refer to eatonvance.com.
Eaton Vance
Tax-Managed Value Fund
October 31, 2023
Management’s Discussion of Fund Performance† — continued
On a sector basis, stock selections in the health care and consumer discretionary sectors, along with stock selections and an overweight position in the industrials sector, contributed to Fund performance versus the Index during the period.
See Endnotes and Additional Disclosures in this report.
Past performance is no guarantee of future results. Returns are historical and are calculated by determining the percentage change in net asset value (NAV) or offering price (as applicable) with all distributions reinvested. Furthermore, returns do not reflect the deduction of taxes that shareholders may have to pay on Fund distributions or upon the redemption of Fund shares. Investment return and principal value will fluctuate so that shares, when redeemed, may be worth more or less than their original cost. Performance for periods less than or equal to one year is cumulative. Performance is for the stated time period only; due to market volatility, current Fund performance may be lower or higher than the quoted return. For performance as of the most recent month-end, please refer to eatonvance.com.
Eaton Vance
Tax-Managed Value Fund
October 31, 2023
Performance
Portfolio Manager(s) Aaron S. Dunn, CFA and Bradley T. Galko, CFA
| % Average Annual Total Returns1,2 | Class
Inception Date | Performance
Inception Date | One Year | Five Years | Ten Years |
| Class A at NAV | 12/27/1999 | 12/27/1999 | (2.32)% | 6.38% | 7.58% |
| Class A with 5.25% Maximum Sales Charge | — | — | (7.45) | 5.24 | 7.00 |
| Class C at NAV | 01/24/2000 | 01/24/2000 | (3.05) | 5.58 | 6.93 |
| Class C with 1% Maximum Deferred Sales Charge | — | — | (4.01) | 5.58 | 6.93 |
| Class I at NAV | 11/30/2007 | 12/27/1999 | (2.08) | 6.65 | 7.84 |
|
| Russell 1000® Value Index | — | — | 0.13% | 6.59% | 7.59% |
| % After-Tax Returns with Maximum Sales Charge | Class
Inception Date | Performance
Inception Date | One Year | Five Years | Ten Years |
| Class A After Taxes on Distributions | 12/27/1999 | 12/27/1999 | (2.74)% | 4.79% | 6.19% |
| Class A After Taxes on Distributions and Sale of Fund Shares | — | — | (0.91) | 4.16 | 5.50 |
| Class C After Taxes on Distributions | 01/24/2000 | 01/24/2000 | (3.34) | 5.30 | 6.25 |
| Class C After Taxes on Distributions and Sale of Fund Shares | — | — | (1.49) | 4.43 | 5.47 |
| Class I After Taxes on Distributions | 11/30/2007 | 12/27/1999 | (2.56) | 6.15 | 6.96 |
| Class I After Taxes on Distributions and Sale of Fund Shares | — | — | (0.72) | 5.30 | 6.20 |
| % Total Annual Operating Expense Ratios3 | Class A | Class C | Class I |
| | 1.21% | 1.96% | 0.96% |
Growth of $10,000
This graph shows the change in value of a hypothetical investment of $10,000 in Class A of the Fund for the period indicated. For comparison, the same investment is shown in the indicated index.
| Growth of Investment | Amount Invested | Period Beginning | At NAV | With Maximum Sales Charge |
| Class C | $10,000 | 10/31/2013 | $19,549 | N.A. |
| Class I, at minimum investment | $1,000,000 | 10/31/2013 | $2,127,973 | N.A. |
See Endnotes and Additional Disclosures in this report.
Past performance is no guarantee of future results. Returns are historical and are calculated by determining the percentage change in net asset value (NAV) or offering price (as applicable) with all distributions reinvested. Furthermore, returns do not reflect the deduction of taxes that shareholders may have to pay on Fund distributions or upon the redemption of Fund shares. Investment return and principal value will fluctuate so that shares, when redeemed, may be worth more or less than their original cost. Performance for periods less than or equal to one year is cumulative. Performance is for the stated time period only; due to market volatility, current Fund performance may be lower or higher than the quoted return. For performance as of the most recent month-end, please refer to eatonvance.com.
Eaton Vance
Tax-Managed Value Fund
October 31, 2023
| Sector Allocation (% of net assets)1 |
| Top 10 Holdings (% of net assets)1 |
| JPMorgan Chase & Co. | 3.9% |
| Chevron Corp. | 3.2 |
| Constellation Brands, Inc., Class A | 3.1 |
| Home Depot, Inc. (The) | 2.8 |
| NextEra Energy, Inc. | 2.8 |
| Sempra | 2.8 |
| Charles Schwab Corp. (The) | 2.7 |
| Ingersoll Rand, Inc. | 2.6 |
| Micron Technology, Inc. | 2.6 |
| Eli Lilly & Co. | 2.4 |
| Total | 28.9% |
Fund invests in an affiliated investment company (Portfolio) with the same objective(s) and policies as the Fund. References to investments are to the Portfolio’s holdings.
Footnotes:
| 1 | Excludes cash and cash equivalents. |
Eaton Vance
Tax-Managed Value Fund
October 31, 2023
Endnotes and Additional Disclosures
| † | The views expressed in this report are those of the portfolio manager(s) and are current only through the date stated at the top of this page. These views are subject to change at any time based upon market or other conditions, and Eaton Vance and the Fund(s) disclaim any responsibility to update such views. These views may not be relied upon as investment advice and, because investment decisions are based on many factors, may not be relied upon as an indication of trading intent on behalf of any Eaton Vance fund. This commentary may contain statements that are not historical facts, referred to as “forward-looking statements.” The Fund’s actual future results may differ significantly from those stated in any forward-looking statement, depending on factors such as changes in securities or financial markets or general economic conditions, the volume of sales and purchases of Fund shares, the continuation of investment advisory, administrative and service contracts, and other risks discussed from time to time in the Fund’s filings with the Securities and Exchange Commission. |
| | |
| 1 | Russell 1000® Value Index is an unmanaged index of U.S. large-cap value stocks. Unless otherwise stated, index returns do not reflect the effect of any applicable sales charges, commissions, expenses, taxes or leverage, as applicable. It is not possible to invest directly in an index. |
| 2 | Total Returns at NAV do not include applicable sales charges. If sales charges were deducted, the returns would be lower. Total Returns shown with maximum sales charge reflect the stated maximum sales charge. Unless otherwise stated, performance does not reflect the deduction of taxes on Fund distributions or redemptions of Fund shares. After-tax returns are calculated using certain assumptions, including using the highest historical individual federal income tax rates, and do not reflect the impact of state/local taxes. Actual after-tax returns depend on a shareholder’s tax situation and the actual characterization of distributions and may differ from those shown. After-tax returns are not relevant to shareholders who hold shares in tax-deferred accounts or shares held by nontaxable entities. Return After Taxes on Distributions may be the same as Return Before Taxes for the same period because no taxable distributions were made during that period. Return After Taxes on Distributions and Sale of Fund Shares may be greater than or equal to Return After Taxes on Distributions for the same period because of losses realized on the sale of Fund shares. The Fund’s after-tax returns also may reflect foreign tax credits passed by the Fund to its shareholders.Effective November 5, 2020, Class C shares automatically convert to Class A shares eight years after purchase. The average annual total returns listed for Class C reflect conversion to Class A shares after eight years. Prior to November 5, 2020, Class C shares automatically converted to Class A shares ten years after purchase. |
| 3 | Source: Fund prospectus. The expense ratios for the current reporting period can be found in the Financial Highlights section of this report. Performance reflects expenses waived and/or reimbursed, if applicable. Without such waivers and/or reimbursements, performance would have been lower. |
| | Additional Information |
| | S&P 500® Index is an unmanaged index of large-cap stocks commonly used as a measure of U.S. stock market performance. Dow Jones Industrial Average® is a price-weighted average of 30 blue-chip stocks that are generally the leaders in their industry. S&P Dow Jones Indices are a product of S&P Dow Jones Indices LLC (“S&P DJI”) and have been licensed for use. S&P® and S&P 500® are registered trademarks of S&P DJI; Dow Jones® is a registered trademark of Dow Jones Trademark Holdings LLC (“Dow Jones”); S&P DJI, Dow Jones and their respective affiliates do not sponsor, endorse, sell or promote the Fund, will not have any liability with respect thereto and do not have any liability for any errors, omissions, or interruptions of the S&P Dow Jones Indices. Nasdaq Composite Index is a market capitalization-weighted index of all domestic and international securities listed on Nasdaq. Source: Nasdaq, Inc. The information is provided by Nasdaq (with its affiliates, are referred to as the “Corporations”) and Nasdaq’s third party licensors on an “as is” basis and the Corporations make no guarantees and bear no liability of any kind with respect to the information or the Fund. |
Eaton Vance
Tax-Managed Value Fund
October 31, 2023
Example
As a Fund shareholder, you incur two types of costs: (1) transaction costs, including sales charges (loads) on purchases; and (2) ongoing costs, including management fees; distribution and/or service fees; and other Fund expenses. This Example is intended to help you understand your ongoing costs (in dollars) of Fund investing and to compare these costs with the ongoing costs of investing in other mutual funds. The Example is based on an investment of $1,000 invested at the beginning of the period and held for the entire period (May 1, 2023 to October 31, 2023).
Actual Expenses
The first section of the table below provides information about actual account values and actual expenses. You may use the information in this section, together with the amount you invested, to estimate the expenses that you paid over the period. Simply divide your account value by $1,000 (for example, an $8,600 account value divided by $1,000 = 8.6), then multiply the result by the number in the first section under the heading entitled “Expenses Paid During Period” to estimate the expenses you paid on your account during this period.
Hypothetical Example for Comparison Purposes
The second section of the table below provides information about hypothetical account values and hypothetical expenses based on the actual Fund expense ratio and an assumed rate of return of 5% per year (before expenses), which is not the actual Fund return. The hypothetical account values and expenses may not be used to estimate the actual ending account balance or expenses you paid for the period. You may use this information to compare the ongoing costs of investing in your Fund and other funds. To do so, compare this 5% hypothetical example with the 5% hypothetical examples that appear in the shareholder reports of the other funds.
Please note that the expenses shown in the table are meant to highlight your ongoing costs only and do not reflect any transactional costs, such as sales charges (loads). Therefore, the second section of the table is useful in comparing ongoing costs only, and will not help you determine the relative total costs of owning different funds. In addition, if these transactional costs were included, your costs would be higher.
| | Beginning
Account Value
(5/1/23) | Ending
Account Value
(10/31/23) | Expenses Paid
During Period*
(5/1/23 – 10/31/23) | Annualized
Expense
Ratio |
| Actual | | | | |
| Class A | $1,000.00 | $ 942.20 | $5.68 | 1.16% |
| Class C | $1,000.00 | $ 938.60 | $9.33 | 1.91% |
| Class I | $1,000.00 | $ 943.30 | $4.46 | 0.91% |
| |
| Hypothetical | | | | |
| (5% return per year before expenses) | | | | |
| Class A | $1,000.00 | $1,019.36 | $5.90 | 1.16% |
| Class C | $1,000.00 | $1,015.58 | $9.70 | 1.91% |
| Class I | $1,000.00 | $1,020.62 | $4.63 | 0.91% |
| * | Expenses are equal to the Fund's annualized expense ratio for the indicated Class, multiplied by the average account value over the period, multiplied by 184/365 (to reflect the one-half year period). The Example assumes that the $1,000 was invested at the net asset value per share determined at the close of business on April 30, 2023. The Example reflects the expenses of both the Fund and the Portfolio. |
Eaton Vance
Tax-Managed Value Fund
October 31, 2023
Statement of Assets and Liabilities
| | October 31, 2023 |
| Assets | |
| Investment in Tax-Managed Value Portfolio, at value (identified cost $335,151,633) | $ 666,234,105 |
| Receivable for Fund shares sold | 436,492 |
| Total assets | $666,670,597 |
| Liabilities | |
| Payable for Fund shares redeemed | $ 1,501,793 |
| Payable to affiliates: | |
| Administration fee | 86,664 |
| Distribution and service fees | 103,985 |
| Trustees' fees | 42 |
| Accrued expenses | 149,892 |
| Total liabilities | $ 1,842,376 |
| Net Assets | $664,828,221 |
| Sources of Net Assets | |
| Paid-in capital | $ 364,081,284 |
| Distributable earnings | 300,746,937 |
| Net Assets | $664,828,221 |
| Class A Shares | |
| Net Assets | $ 399,602,740 |
| Shares Outstanding | 12,080,847 |
Net Asset Value and Redemption Price Per Share
(net assets ÷ shares of beneficial interest outstanding) | $ 33.08 |
Maximum Offering Price Per Share
(100 ÷ 94.75 of net asset value per share) | $ 34.91 |
| Class C Shares | |
| Net Assets | $ 19,793,929 |
| Shares Outstanding | 625,487 |
Net Asset Value and Offering Price Per Share*
(net assets ÷ shares of beneficial interest outstanding) | $ 31.65 |
| Class I Shares | |
| Net Assets | $ 245,431,552 |
| Shares Outstanding | 7,445,580 |
Net Asset Value, Offering Price and Redemption Price Per Share
(net assets ÷ shares of beneficial interest outstanding) | $ 32.96 |
| On sales of $50,000 or more, the offering price of Class A shares is reduced. |
| * | Redemption price per share is equal to the net asset value less any applicable contingent deferred sales charge. |
8
See Notes to Financial Statements.
Eaton Vance
Tax-Managed Value Fund
October 31, 2023
| | Year Ended |
| | October 31, 2023 |
| Investment Income | |
| Dividend income allocated from Portfolio (net of foreign taxes withheld of $58,034) | $ 15,109,773 |
| Securities lending income allocated from Portfolio, net | 17,373 |
| Expenses allocated from Portfolio | (4,926,605) |
| Total investment income from Portfolio | $ 10,200,541 |
| Expenses | |
| Administration fee | $ 1,079,096 |
| Distribution and service fees: | |
| Class A | 1,081,926 |
| Class C | 229,864 |
| Trustees’ fees and expenses | 499 |
| Custodian fee | 47,413 |
| Transfer and dividend disbursing agent fees | 314,759 |
| Legal and accounting services | 34,508 |
| Printing and postage | 39,395 |
| Registration fees | 53,496 |
| ReFlow liquidity program fees | 58,247 |
| Miscellaneous | 15,483 |
| Total expenses | $ 2,954,686 |
| Net investment income | $ 7,245,855 |
| Realized and Unrealized Gain (Loss) from Portfolio | |
| Net realized gain (loss): | |
| Investment transactions | $ 37,251,006(1) |
| Foreign currency transactions | 1,516 |
| Net realized gain | $ 37,252,522 |
| Change in unrealized appreciation (depreciation): | |
| Investments | $ (59,130,199) |
| Foreign currency | 17,449 |
| Net change in unrealized appreciation (depreciation) | $(59,112,750) |
| Net realized and unrealized loss | $(21,860,228) |
| Net decrease in net assets from operations | $(14,614,373) |
| (1) | Includes $21,085,534 of net realized gains from redemptions in-kind. |
9
See Notes to Financial Statements.
Eaton Vance
Tax-Managed Value Fund
October 31, 2023
Statements of Changes in Net Assets
| | Year Ended October 31, |
| | 2023 | 2022 |
| Increase (Decrease) in Net Assets | | |
| From operations: | | |
| Net investment income | $ 7,245,855 | $ 9,370,753 |
| Net realized gain | 37,252,522 (1) | 25,367,482 (2) |
| Net change in unrealized appreciation (depreciation) | (59,112,750) | (105,776,261) |
| Net decrease in net assets from operations | $ (14,614,373) | $ (71,038,026) |
| Distributions to shareholders: | | |
| Class A | $ (9,264,246) | $ (21,856,449) |
| Class C | (361,789) | (1,044,216) |
| Class I | (6,334,332) | (13,331,190) |
| Total distributions to shareholders | $ (15,960,367) | $ (36,231,855) |
| Transactions in shares of beneficial interest: | | |
| Class A | $ (13,926,797) | $ (428,147) |
| Class C | (3,598,530) | 1,562,566 |
| Class I | (6,008,615) | 17,784,670 |
| Net increase (decrease) in net assets from Fund share transactions | $ (23,533,942) | $ 18,919,089 |
| Net decrease in net assets | $ (54,108,682) | $ (88,350,792) |
| Net Assets | | |
| At beginning of year | $ 718,936,903 | $ 807,287,695 |
| At end of year | $664,828,221 | $ 718,936,903 |
| (1) | Includes $21,085,534 of net realized gains from redemptions in-kind. |
| (2) | Includes $17,763,343 of net realized gains from redemptions in-kind. |
10
See Notes to Financial Statements.
Eaton Vance
Tax-Managed Value Fund
October 31, 2023
| | Class A |
| | Year Ended October 31, |
| | 2023 | 2022 | 2021 | 2020 | 2019 |
| Net asset value — Beginning of year | $ 34.610 | $ 39.770 | $ 28.170 | $ 29.890 | $ 27.000 |
| Income (Loss) From Operations | | | | | |
| Net investment income(1) | $ 0.329 | $ 0.425 | $ 0.286 | $ 0.354 | $ 0.344 |
| Net realized and unrealized gain (loss) | (1.111) | (3.833) | 11.731 | (1.720) | 2.931 |
| Total income (loss) from operations | $ (0.782) | $ (3.408) | $ 12.017 | $ (1.366) | $ 3.275 |
| Less Distributions | | | | | |
| From net investment income | $ (0.387) | $ (0.307) | $ (0.341) | $ (0.339) | $ (0.278) |
| From net realized gain | (0.361) | (1.445) | (0.076) | (0.015) | (0.107) |
| Total distributions | $ (0.748) | $ (1.752) | $ (0.417) | $ (0.354) | $ (0.385) |
| Net asset value — End of year | $ 33.080 | $ 34.610 | $ 39.770 | $ 28.170 | $ 29.890 |
| Total Return(2) | (2.32)% | (8.95)% | 43.03% | (4.66)% | 12.35% |
| Ratios/Supplemental Data | | | | | |
| Net assets, end of year (000’s omitted) | $399,603 | $431,902 | $497,565 | $362,651 | $417,533 |
| Ratios (as a percentage of average daily net assets):(3) | | | | | |
| Expenses | 1.16% (4) | 1.16% (4) | 1.15% | 1.17% | 1.18% |
| Net investment income | 0.94% | 1.18% | 0.80% | 1.25% | 1.24% |
| Portfolio Turnover of the Portfolio | 31% | 29% | 11% | 25% | 18% |
| (1) | Computed using average shares outstanding. |
| (2) | Returns are historical and are calculated by determining the percentage change in net asset value with all distributions reinvested and do not reflect the effect of sales charges. |
| (3) | Includes the Fund’s share of the Portfolio’s allocated expenses. |
| (4) | Includes a reduction by the investment adviser of a portion of the Portfolio’s adviser fee due to the Portfolio’s investment in the Liquidity Fund (equal to less than 0.005% of average daily net assets for the years ended October 31, 2023 and 2022). |
11
See Notes to Financial Statements.
Eaton Vance
Tax-Managed Value Fund
October 31, 2023
Financial Highlights — continued
| | Class C |
| | Year Ended October 31, |
| | 2023 | 2022 | 2021 | 2020 | 2019 |
| Net asset value — Beginning of year | $ 33.140 | $ 38.170 | $ 27.020 | $ 28.580 | $ 25.810 |
| Income (Loss) From Operations | | | | | |
| Net investment income(1) | $ 0.066 | $ 0.148 | $ 0.018 | $ 0.137 | $ 0.150 |
| Net realized and unrealized gain (loss) | (1.061) | (3.677) | 11.278 | (1.673) | 2.794 |
| Total income (loss) from operations | $ (0.995) | $ (3.529) | $11.296 | $ (1.536) | $ 2.944 |
| Less Distributions | | | | | |
| From net investment income | $ (0.134) | $ (0.056) | $ (0.070) | $ (0.009) | $ (0.067) |
| From net realized gain | (0.361) | (1.445) | (0.076) | (0.015) | (0.107) |
| Total distributions | $ (0.495) | $ (1.501) | $ (0.146) | $ (0.024) | $ (0.174) |
| Net asset value — End of year | $31.650 | $33.140 | $38.170 | $27.020 | $28.580 |
| Total Return(2) | (3.05)% | (9.61)% | 41.94% | (5.38)% | 11.50% |
| Ratios/Supplemental Data | | | | | |
| Net assets, end of year (000’s omitted) | $ 19,794 | $ 24,304 | $ 26,389 | $ 20,066 | $ 26,672 |
| Ratios (as a percentage of average daily net assets):(3) | | | | | |
| Expenses | 1.91% (4) | 1.91% (4) | 1.90% | 1.92% | 1.93% |
| Net investment income | 0.20% | 0.43% | 0.05% | 0.50% | 0.58% |
| Portfolio Turnover of the Portfolio | 31% | 29% | 11% | 25% | 18% |
| (1) | Computed using average shares outstanding. |
| (2) | Returns are historical and are calculated by determining the percentage change in net asset value with all distributions reinvested and do not reflect the effect of sales charges. |
| (3) | Includes the Fund’s share of the Portfolio’s allocated expenses. |
| (4) | Includes a reduction by the investment adviser of a portion of the Portfolio’s adviser fee due to the Portfolio’s investment in the Liquidity Fund (equal to less than 0.005% of average daily net assets for the years ended October 31, 2023 and 2022). |
12
See Notes to Financial Statements.
Eaton Vance
Tax-Managed Value Fund
October 31, 2023
Financial Highlights — continued
| | Class I |
| | Year Ended October 31, |
| | 2023 | 2022 | 2021 | 2020 | 2019 |
| Net asset value — Beginning of year | $ 34.510 | $ 39.650 | $ 28.080 | $ 29.790 | $ 26.920 |
| Income (Loss) From Operations | | | | | |
| Net investment income(1) | $ 0.414 | $ 0.512 | $ 0.373 | $ 0.421 | $ 0.411 |
| Net realized and unrealized gain (loss) | (1.123) | (3.807) | 11.690 | (1.707) | 2.914 |
| Total income (loss) from operations | $ (0.709) | $ (3.295) | $ 12.063 | $ (1.286) | $ 3.325 |
| Less Distributions | | | | | |
| From net investment income | $ (0.480) | $ (0.400) | $ (0.417) | $ (0.409) | $ (0.348) |
| From net realized gain | (0.361) | (1.445) | (0.076) | (0.015) | (0.107) |
| Total distributions | $ (0.841) | $ (1.845) | $ (0.493) | $ (0.424) | $ (0.455) |
| Net asset value — End of year | $ 32.960 | $ 34.510 | $ 39.650 | $ 28.080 | $ 29.790 |
| Total Return(2) | (2.08)% | (8.70)% | 43.41% | (4.42)% | 12.61% |
| Ratios/Supplemental Data | | | | | |
| Net assets, end of year (000’s omitted) | $245,432 | $262,732 | $283,334 | $189,549 | $195,921 |
| Ratios (as a percentage of average daily net assets):(3) | | | | | |
| Expenses | 0.91% (4) | 0.91% (4) | 0.90% | 0.92% | 0.93% |
| Net investment income | 1.19% | 1.42% | 1.05% | 1.49% | 1.49% |
| Portfolio Turnover of the Portfolio | 31% | 29% | 11% | 25% | 18% |
| (1) | Computed using average shares outstanding. |
| (2) | Returns are historical and are calculated by determining the percentage change in net asset value with all distributions reinvested. |
| (3) | Includes the Fund’s share of the Portfolio’s allocated expenses. |
| (4) | Includes a reduction by the investment adviser of a portion of the Portfolio’s adviser fee due to the Portfolio’s investment in the Liquidity Fund (equal to less than 0.005% of average daily net assets for the years ended October 31, 2023 and 2022). |
13
See Notes to Financial Statements.
Eaton Vance
Tax-Managed Value Fund
October 31, 2023
Notes to Financial Statements
1 Significant Accounting Policies
Eaton Vance Tax-Managed Value Fund (the Fund) is a diversified series of Eaton Vance Mutual Funds Trust (the Trust). The Trust is a Massachusetts business trust registered under the Investment Company Act of 1940, as amended (the 1940 Act), as an open-end management investment company. The Fund offers three classes of shares. Class A shares are generally sold subject to a sales charge imposed at time of purchase. Class C shares are sold at net asset value and are generally subject to a contingent deferred sales charge (see Note 5). Effective November 5, 2020, Class C shares automatically convert to Class A shares eight years after their purchase as described in the Fund’s prospectus. Class I shares are sold at net asset value and are not subject to a sales charge. Each class represents a pro rata interest in the Fund, but votes separately on class-specific matters and (as noted below) is subject to different expenses. Realized and unrealized gains and losses and net investment income and losses, other than class-specific expenses, are allocated daily to each class of shares based on the relative net assets of each class to the total net assets of the Fund. Each class of shares differs in its distribution plan and certain other class-specific expenses. The Fund invests its assets in interests in Tax-Managed Value Portfolio (the Portfolio), a Massachusetts business trust, having the same investment objective and policies as the Fund. The value of the Fund’s investment in the Portfolio reflects the Fund’s proportionate interest in the net assets of the Portfolio (81.1% at October 31, 2023). The performance of the Fund is directly affected by the performance of the Portfolio. The financial statements of the Portfolio, including the portfolio of investments, are included elsewhere in this report and should be read in conjunction with the Fund’s financial statements.
The following is a summary of significant accounting policies of the Fund. The policies are in conformity with accounting principles generally accepted in the United States of America (U.S. GAAP). The Fund is an investment company and follows accounting and reporting guidance in the Financial Accounting Standards Board (FASB) Accounting Standards Codification Topic 946.
A Investment Valuation—Valuation of securities by the Portfolio is discussed in Note 1A of the Portfolio's Notes to Financial Statements, which are included elsewhere in this report.
B Income—The Fund's net investment income or loss consists of the Fund's pro rata share of the net investment income or loss of the Portfolio, less all actual and accrued expenses of the Fund.
C Federal Taxes—The Fund's policy is to comply with the provisions of the Internal Revenue Code applicable to regulated investment companies and to distribute to shareholders each year substantially all of its net investment income, and all or substantially all of its net realized capital gains. Accordingly, no provision for federal income or excise tax is necessary.
As of October 31, 2023, the Fund had no uncertain tax positions that would require financial statement recognition, de-recognition, or disclosure. The Fund files a U.S. federal income tax return annually after its fiscal year-end, which is subject to examination by the Internal Revenue Service for a period of three years from the date of filing.
D Expenses—The majority of expenses of the Trust are directly identifiable to an individual fund. Expenses which are not readily identifiable to a specific fund are allocated taking into consideration, among other things, the nature and type of expense and the relative size of the funds.
E Use of Estimates—The preparation of the financial statements in conformity with U.S. GAAP requires management to make estimates and assumptions that affect the reported amounts of assets and liabilities at the date of the financial statements and the reported amounts of income and expense during the reporting period. Actual results could differ from those estimates.
F Indemnifications—Under the Trust’s organizational documents, its officers and Trustees may be indemnified against certain liabilities and expenses arising out of the performance of their duties to the Fund. Under Massachusetts law, if certain conditions prevail, shareholders of a Massachusetts business trust (such as the Trust) could be deemed to have personal liability for the obligations of the Trust. However, the Trust’s Declaration of Trust contains an express disclaimer of liability on the part of Fund shareholders and the By-laws provide that the Trust shall assume, upon request by the shareholder, the defense on behalf of any Fund shareholders. Moreover, the By-laws also provide for indemnification out of Fund property of any shareholder held personally liable solely by reason of being or having been a shareholder for all loss or expense arising from such liability. Additionally, in the normal course of business, the Fund enters into agreements with service providers that may contain indemnification clauses. The Fund’s maximum exposure under these arrangements is unknown as this would involve future claims that may be made against the Fund that have not yet occurred.
G Other—Investment transactions are accounted for on a trade date basis.
Eaton Vance
Tax-Managed Value Fund
October 31, 2023
Notes to Financial Statements — continued
2 Distributions to Shareholders and Income Tax Information
It is the present policy of the Fund to make at least one distribution annually (normally in December) of all or substantially all of its net investment income and to distribute annually all or substantially all of its net realized capital gains. Distributions to shareholders are recorded on the ex-dividend date. Distributions are declared separately for each class of shares. Shareholders may reinvest income and capital gain distributions in additional shares of the same class of the Fund at the net asset value as of the ex-dividend date or, at the election of the shareholder, receive distributions in cash. Distributions to shareholders are determined in accordance with income tax regulations, which may differ from U.S. GAAP. As required by U.S. GAAP, only distributions in excess of tax basis earnings and profits are reported in the financial statements as a return of capital. Permanent differences between book and tax accounting relating to distributions are reclassified to paid-in capital. For tax purposes, distributions from short-term capital gains are considered to be from ordinary income.
The tax character of distributions declared for the years ended October 31, 2023 and October 31, 2022 was as follows:
| | Year Ended October 31, |
| | 2023 | 2022 |
| Ordinary income | $8,514,487 | $ 6,941,399 |
| Long-term capital gains | $7,445,880 | $29,290,456 |
During the year ended October 31, 2023, distributable earnings was decreased by $27,281,600 and paid-in capital was increased by $27,281,600 due to the Fund’s use of equalization accounting and differences between book and tax accounting for redemptions in-kind. Tax equalization accounting allows the Fund to treat as a distribution that portion of redemption proceeds representing a redeeming shareholder’s portion of undistributed taxable income and net capital gains. These reclassifications had no effect on the net assets or net asset value per share of the Fund.
As of October 31, 2023, the components of distributable earnings (accumulated loss) on a tax basis were as follows:
| Undistributed ordinary income | $ 4,466,562 |
| Undistributed long-term capital gains | 18,328,909 |
| Net unrealized appreciation | 277,951,466 |
| Distributable earnings | $300,746,937 |
3 Investment Adviser Fee and Other Transactions with Affiliates
The investment adviser fee is earned by Eaton Vance Management (EVM), an indirect, wholly-owned subsidiary of Morgan Stanley, as compensation for investment advisory services rendered to the Fund. The fee is computed at an annual rate as a percentage of the Fund’s average daily net assets that are not invested in other investment companies for which EVM or its affiliates serve as investment adviser and receive an advisory fee as follows and is payable monthly:
| Average Daily Net Assets | Annual Fee Rate |
| Up to $500 million | 0.6500% |
| $500 million but less than $1 billion | 0.6250% |
| $1 billion but less than $2 billion | 0.6000% |
| $2 billion but less than $5 billion | 0.5750% |
| $5 billion and over | 0.5550% |
For the year ended October 31, 2023, the Fund incurred no investment adviser fee on such assets. To the extent the Fund’s assets are invested in the Portfolio, the Fund is allocated its share of the Portfolio’s investment adviser fee. The Portfolio has engaged Boston Management and Research (BMR) to render investment advisory services. See Note 2 of the Portfolio’s Notes to Financial Statements which are included elsewhere in this report. The administration fee is earned by EVM as compensation for administrative services rendered to the Fund. The fee is computed at an annual rate of 0.15% of the Fund’s average daily net assets. For the year ended October 31, 2023, the administration fee amounted to $1,079,096.
EVM provides sub-transfer agency and related services to the Fund pursuant to a Sub-Transfer Agency Support Services Agreement. For the year ended October 31, 2023, EVM earned $66,638 from the Fund pursuant to such agreement, which is included in transfer and dividend disbursing agent fees on
Eaton Vance
Tax-Managed Value Fund
October 31, 2023
Notes to Financial Statements — continued
the Statement of Operations. The Fund was informed that Eaton Vance Distributors, Inc. (EVD), an affiliate of EVM and the Fund’s principal underwriter, received $22,479 as its portion of the sales charge on sales of Class A shares for the year ended October 31, 2023. The Fund was informed that Morgan Stanley affiliated broker-dealers, which may be deemed to be affiliates of EVM, BMR and EVD, also received a portion of the sales charge on sales of Class A shares for the year ended October 31, 2023 in the amount of $21,113. EVD also received distribution and service fees from Class A and Class C shares (see Note 4) and contingent deferred sales charges (see Note 5).
Trustees and officers of the Fund who are members of EVM’s or BMR's organizations receive remuneration for their services to the Fund out of the investment adviser fee. Certain officers and Trustees of the Fund and the Portfolio are officers of the above organizations.
4 Distribution Plans
The Fund has in effect a distribution plan for Class A shares (Class A Plan) pursuant to Rule 12b-1 under the 1940 Act. Pursuant to the Class A Plan, the Fund pays EVD a distribution and service fee of 0.25% per annum of its average daily net assets attributable to Class A shares for distribution services and facilities provided to the Fund by EVD, as well as for personal services and/or the maintenance of shareholder accounts. Distribution and service fees paid or accrued to EVD for the year ended October 31, 2023 amounted to $1,081,926 for Class A shares.
The Fund also has in effect a distribution plan for Class C shares (Class C Plan) pursuant to Rule 12b-1 under the 1940 Act. Pursuant to the Class C Plan, the Fund pays EVD amounts equal to 0.75% per annum of its average daily net assets attributable to Class C shares for providing ongoing distribution services and facilities to the Fund. For the year ended October 31, 2023, the Fund paid or accrued to EVD $172,398 for Class C shares.
Pursuant to the Class C Plan, the Fund also makes payments of service fees to EVD, financial intermediaries and other persons in amounts equal to 0.25% per annum of its average daily net assets attributable to that class. Service fees paid or accrued are for personal services and/or the maintenance of shareholder accounts. They are separate and distinct from the sales commissions and distribution fees payable to EVD. Service fees paid or accrued for the year ended October 31, 2023 amounted to $57,466 for Class C shares.
Distribution and service fees are subject to the limitations contained in the Financial Industry Regulatory Authority Rule 2341(d).
5 Contingent Deferred Sales Charges
A contingent deferred sales charge (CDSC) of 1% generally is imposed on redemptions of Class C shares made within 12 months of purchase. Class A shares may be subject to a 1% CDSC if redeemed within 12 months of purchase (depending on the circumstances of purchase). Generally, the CDSC is based upon the lower of the net asset value at date of redemption or date of purchase. No charge is levied on shares acquired by reinvestment of dividends or capital gain distributions. For the year ended October 31, 2023, the Fund was informed that EVD received $1,582 of CDSCs paid by Class C shareholders and no CDSCs paid by Class A shareholders.
6 Investment Transactions
For the year ended October 31, 2023, increases and decreases in the Fund's investment in the Portfolio aggregated $4,660,244 and $46,249,969, respectively. Decreases in the Fund's investment in the Portfolio include distributions of securities as the result of redemptions in-kind of $31,139,838.
Eaton Vance
Tax-Managed Value Fund
October 31, 2023
Notes to Financial Statements — continued
7 Shares of Beneficial Interest
The Fund’s Declaration of Trust permits the Trustees to issue an unlimited number of full and fractional shares of beneficial interest (without par value). Such shares may be issued in a number of different series (such as the Fund) and classes. Sales and redemptions of Class I shares include shares purchased and redeemed in connection with the ReFlow liquidity program, a program designed to provide an alternative liquidity source for mutual funds experiencing net redemptions of their shares. Transactions in Fund shares, including direct exchanges pursuant to share class conversions, were as follows:
| | Year Ended
October 31, 2023 | | Year Ended
October 31, 2022 |
| | Shares | Amount | | Shares | Amount |
| Class A | | | | | |
| Sales | 347,876 | $ 12,154,003 | | 441,788 | $ 15,988,190 |
| Issued to shareholders electing to receive payments of distributions in Fund shares | 236,811 | 8,039,734 | | 499,033 | 18,918,332 |
| Redemptions | (981,152) | (34,120,534) | | (974,887) | (35,334,669) |
| Net decrease | (396,465) | $(13,926,797) | | (34,066) | $ (428,147) |
| Class C | | | | | |
| Sales | 76,735 | $ 2,579,066 | | 167,228 | $ 5,812,328 |
| Issued to shareholders electing to receive payments of distributions in Fund shares | 10,082 | 329,566 | | 26,062 | 952,311 |
| Redemptions | (194,674) | (6,507,162) | | (151,235) | (5,202,073) |
| Net increase (decrease) | (107,857) | $ (3,598,530) | | 42,055 | $ 1,562,566 |
| Class I | | | | | |
| Sales | 1,650,812 | $ 57,264,037 | | 2,314,128 | $ 83,408,226 |
| Issued to shareholders electing to receive payments of distributions in Fund shares | 168,916 | 5,702,619 | | 314,485 | 11,859,243 |
| Redemptions | (1,988,179) | (68,975,271) | | (2,160,896) | (77,482,799) |
| Net increase (decrease) | (168,451) | $ (6,008,615) | | 467,717 | $ 17,784,670 |
Eaton Vance
Tax-Managed Value Fund
October 31, 2023
Report of Independent Registered Public Accounting Firm
To the Trustees of Eaton Vance Mutual Funds Trust and Shareholders of Eaton Vance Tax-Managed Value Fund:
Opinion on the Financial Statements and Financial Highlights
We have audited the accompanying statement of assets and liabilities of Eaton Vance Tax-Managed Value Fund (the “Fund") (one of the funds constituting Eaton Vance Mutual Funds Trust), as of October 31, 2023, the related statement of operations for the year then ended, the statements of changes in net assets for each of the two years in the period then ended, the financial highlights for each of the five years in the period then ended, and the related notes. In our opinion, the financial statements and financial highlights present fairly, in all material respects, the financial position of the Fund as of October 31, 2023, and the results of its operations for the year then ended, the changes in its net assets for each of the two years in the period then ended, and the financial highlights for each of the five years in the period then ended, in conformity with accounting principles generally accepted in the United States of America.
Basis for Opinion
These financial statements and financial highlights are the responsibility of the Fund's management. Our responsibility is to express an opinion on the Fund's financial statements and financial highlights based on our audits. We are a public accounting firm registered with the Public Company Accounting Oversight Board (United States) (PCAOB) and are required to be independent with respect to the Fund in accordance with the U.S. federal securities laws and the applicable rules and regulations of the Securities and Exchange Commission and the PCAOB.
We conducted our audits in accordance with the standards of the PCAOB. Those standards require that we plan and perform the audit to obtain reasonable assurance about whether the financial statements and financial highlights are free of material misstatement, whether due to error or fraud. The Fund is not required to have, nor were we engaged to perform, an audit of its internal control over financial reporting. As part of our audits, we are required to obtain an understanding of internal control over financial reporting but not for the purpose of expressing an opinion on the effectiveness of the Fund’s internal control over financial reporting. Accordingly, we express no such opinion.
Our audits included performing procedures to assess the risks of material misstatement of the financial statements and financial highlights, whether due to error or fraud, and performing procedures that respond to those risks. Such procedures included examining, on a test basis, evidence regarding the amounts and disclosures in the financial statements and financial highlights. Our audits also included evaluating the accounting principles used and significant estimates made by management, as well as evaluating the overall presentation of the financial statements and financial highlights. We believe that our audits provide a reasonable basis for our opinion.
/s/ Deloitte & Touche LLP
Boston, Massachusetts
December 19, 2023
We have served as the auditor of one or more Eaton Vance investment companies since 1959.
Eaton Vance
Tax-Managed Value Fund
October 31, 2023
Federal Tax Information (Unaudited)
The Form 1099-DIV you receive in February 2024 will show the tax status of all distributions paid to your account in calendar year 2023. Shareholders are advised to consult their own tax adviser with respect to the tax consequences of their investment in the Fund. As required by the Internal Revenue Code and/or regulations, shareholders must be notified regarding the status of qualified dividend income for individuals, the dividends received deduction for
corporations, capital gains dividends and 163(j) interest dividends.
Qualified Dividend Income. For the fiscal year ended October 31, 2023, the Fund designates approximately $13,656,434, or up to the maximum amount of such dividends allowable pursuant to the Internal Revenue Code, as qualified dividend income eligible for the reduced tax rate of 15%.
Dividends Received Deduction. Corporate shareholders are generally entitled to take the dividends received deduction on the portion of the Fund’s dividend distribution that qualifies under tax law. For the Fund’s fiscal 2023 ordinary income dividends, 20.90% qualifies for the corporate dividends received deduction.
Capital Gains Dividends. The Fund hereby designates as a capital gain dividend with respect to the taxable year ended October 31, 2023, $19,456,027 or, if subsequently determined to be different, the net capital gain of such year.
163(j) Interest Dividends. For the fiscal year ended October 31, 2023, the Fund designates 0.13% of distributions from net investment income as a 163(j) interest dividend.
Tax-Managed Value Portfolio
October 31, 2023
| Security | Shares | Value |
| Aerospace & Defense — 1.1% |
| RTX Corp. | | 113,000 | $ 9,197,070 |
| | | | $ 9,197,070 |
| Banks — 6.8% |
| JPMorgan Chase & Co. | | 230,958 | $ 32,117,019 |
| PNC Financial Services Group, Inc. (The) | | 142,029 | 16,258,060 |
| Wells Fargo & Co. | | 188,847 | 7,510,445 |
| | | | $ 55,885,524 |
| Beverages — 3.1% |
| Constellation Brands, Inc., Class A | | 108,163 | $ 25,326,367 |
| | | | $ 25,326,367 |
| Biotechnology — 0.9% |
| Vertex Pharmaceuticals, Inc.(1) | | 20,039 | $ 7,256,322 |
| | | | $ 7,256,322 |
| Building Products — 0.7% |
| Carrier Global Corp. | | 113,000 | $ 5,385,580 |
| | | | $ 5,385,580 |
| Capital Markets — 6.7% |
| Ameriprise Financial, Inc. | | 28,187 | $ 8,866,785 |
| Cboe Global Markets, Inc. | | 22,561 | 3,697,522 |
| Charles Schwab Corp. (The) | | 434,452 | 22,608,882 |
| Goldman Sachs Group, Inc. (The) | | 42,496 | 12,902,210 |
| Interactive Brokers Group, Inc., Class A | | 90,310 | 7,231,122 |
| | | | $ 55,306,521 |
| Chemicals — 3.4% |
| FMC Corp. | | 158,439 | $ 8,428,955 |
| Linde PLC | | 50,216 | 19,190,546 |
| | | | $ 27,619,501 |
| Consumer Staples Distribution & Retail — 2.8% |
| BJ's Wholesale Club Holdings, Inc.(1) | | 284,500 | $ 19,380,140 |
| Performance Food Group Co.(1) | | 59,613 | 3,443,247 |
| | | | $ 22,823,387 |
| Security | Shares | Value |
| Containers & Packaging — 0.3% |
| Ball Corp. | | 46,376 | $ 2,233,004 |
| | | | $ 2,233,004 |
| Electric Utilities — 2.8% |
| NextEra Energy, Inc. | | 392,766 | $ 22,898,258 |
| | | | $ 22,898,258 |
| Electrical Equipment — 1.1% |
| Rockwell Automation, Inc. | | 33,916 | $ 8,913,464 |
| | | | $ 8,913,464 |
| Energy Equipment & Services — 1.7% |
| Halliburton Co. | | 359,854 | $ 14,156,656 |
| | | | $ 14,156,656 |
| Entertainment — 1.5% |
| Walt Disney Co. (The)(1) | | 147,913 | $ 12,068,222 |
| | | | $ 12,068,222 |
| Financial Services — 3.1% |
| Fiserv, Inc.(1) | | 133,560 | $ 15,192,450 |
| Visa, Inc., Class A | | 44,697 | 10,508,265 |
| | | | $ 25,700,715 |
| Food Products — 1.2% |
| Nestle S.A. | | 90,000 | $ 9,705,485 |
| | | | $ 9,705,485 |
| Ground Transportation — 1.3% |
| Union Pacific Corp. | | 50,876 | $ 10,562,366 |
| | | | $ 10,562,366 |
| Health Care Equipment & Supplies — 1.9% |
| Stryker Corp. | | 58,093 | $ 15,697,891 |
| | | | $ 15,697,891 |
| Health Care Providers & Services — 2.2% |
| Humana, Inc. | | 11,106 | $ 5,816,101 |
| McKesson Corp. | | 5,281 | 2,404,756 |
| UnitedHealth Group, Inc. | | 18,719 | 10,025,148 |
| | | | $ 18,246,005 |
| Household Durables — 1.3% |
| D.R. Horton, Inc. | | 99,360 | $ 10,373,184 |
| | | | $ 10,373,184 |
20
See Notes to Financial Statements.
Tax-Managed Value Portfolio
October 31, 2023
Portfolio of Investments — continued
| Security | Shares | Value |
| Household Products — 0.5% |
| Clorox Co. (The) | | 35,258 | $ 4,149,867 |
| | | | $ 4,149,867 |
| Industrial Conglomerates — 1.9% |
| Honeywell International, Inc. | | 83,731 | $ 15,344,543 |
| | | | $ 15,344,543 |
| Insurance — 4.1% |
| Arch Capital Group, Ltd.(1) | | 183,981 | $ 15,947,473 |
| Reinsurance Group of America, Inc. | | 49,257 | 7,362,444 |
| Travelers Cos., Inc. (The) | | 64,030 | 10,721,183 |
| | | | $ 34,031,100 |
| Interactive Media & Services — 2.2% |
| Alphabet, Inc., Class A(1) | | 148,159 | $ 18,383,569 |
| | | | $ 18,383,569 |
| IT Services — 0.5% |
| Accenture PLC, Class A | | 14,366 | $ 4,267,995 |
| | | | $ 4,267,995 |
| Life Sciences Tools & Services — 2.2% |
| Thermo Fisher Scientific, Inc. | | 40,907 | $ 18,194,206 |
| | | | $ 18,194,206 |
| Machinery — 7.0% |
| Ingersoll Rand, Inc. | | 353,722 | $ 21,463,851 |
| Otis Worldwide Corp. | | 56,500 | 4,362,365 |
| Parker-Hannifin Corp. | | 32,913 | 12,141,935 |
| Toro Co. (The) | | 44,934 | 3,632,464 |
| Westinghouse Air Brake Technologies Corp. | | 150,850 | 15,993,117 |
| | | | $ 57,593,732 |
| Metals & Mining — 0.7% |
| Alcoa Corp. | | 231,367 | $ 5,932,250 |
| | | | $ 5,932,250 |
| Multi-Utilities — 3.2% |
| CMS Energy Corp. | | 68,853 | $ 3,741,472 |
| Sempra | | 325,074 | 22,764,932 |
| | | | $ 26,506,404 |
| Oil, Gas & Consumable Fuels — 8.8% |
| Chevron Corp. | | 182,306 | $ 26,567,453 |
| ConocoPhillips | | 161,617 | 19,200,100 |
| Security | Shares | Value |
| Oil, Gas & Consumable Fuels (continued) |
| EOG Resources, Inc. | | 113,483 | $ 14,327,229 |
| Phillips 66 | | 109,182 | 12,454,391 |
| | | | $ 72,549,173 |
| Personal Care Products — 1.0% |
| Estee Lauder Cos., Inc. (The), Class A | | 61,550 | $ 7,931,949 |
| | | | $ 7,931,949 |
| Pharmaceuticals — 10.5% |
| Bristol-Myers Squibb Co. | | 251,751 | $ 12,972,729 |
| Eli Lilly & Co. | | 36,280 | 20,096,581 |
| Johnson & Johnson | | 116,398 | 17,266,479 |
| Merck & Co., Inc. | | 167,049 | 17,155,932 |
| Novo Nordisk A/S ADR | | 23,831 | 2,301,360 |
| Zoetis, Inc. | | 106,794 | 16,766,658 |
| | | | $ 86,559,739 |
| Residential REITs — 2.1% |
| AvalonBay Communities, Inc. | | 47,915 | $ 7,941,432 |
| Mid-America Apartment Communities, Inc. | | 77,009 | 9,098,613 |
| | | | $ 17,040,045 |
| Semiconductors & Semiconductor Equipment — 3.9% |
| Micron Technology, Inc. | | 310,361 | $ 20,753,840 |
| QUALCOMM, Inc. | | 69,710 | 7,597,693 |
| Texas Instruments, Inc. | | 24,085 | 3,420,311 |
| | | | $ 31,771,844 |
| Software — 1.0% |
| Microsoft Corp. | | 9,160 | $ 3,097,088 |
| Oracle Corp. | | 52,884 | 5,468,205 |
| | | | $ 8,565,293 |
| Specialized REITs — 0.7% |
| CubeSmart | | 174,330 | $ 5,942,910 |
| | | | $ 5,942,910 |
| Specialty Retail — 2.8% |
| Home Depot, Inc. (The) | | 81,060 | $ 23,076,971 |
| | | | $ 23,076,971 |
Total Common Stocks
(identified cost $413,418,522) | | | $797,197,112 |
21
See Notes to Financial Statements.
Tax-Managed Value Portfolio
October 31, 2023
Portfolio of Investments — continued
| Short-Term Investments — 3.9% |
| Security | Shares | Value |
| Morgan Stanley Institutional Liquidity Funds - Government Portfolio, Institutional Class, 5.25%(2) | | 32,183,861 | $ 32,183,861 |
Total Short-Term Investments
(identified cost $32,183,861) | | | $ 32,183,861 |
Total Investments — 100.9%
(identified cost $445,602,383) | | | $829,380,973 |
| Other Assets, Less Liabilities — (0.9)% | | | $ (7,622,228) |
| Net Assets — 100.0% | | | $821,758,745 |
| The percentage shown for each investment category in the Portfolio of Investments is based on net assets. |
| (1) | Non-income producing security. |
| (2) | May be deemed to be an affiliated investment company. The rate shown is the annualized seven-day yield as of October 31, 2023. |
| Abbreviations: |
| ADR | – American Depositary Receipt |
| REITs | – Real Estate Investment Trusts |
22
See Notes to Financial Statements.
Tax-Managed Value Portfolio
October 31, 2023
Statement of Assets and Liabilities
| | October 31, 2023 |
| Assets | |
| Unaffiliated investments, at value (identified cost $413,418,522) | $ 797,197,112 |
| Affiliated investments, at value (identified cost $32,183,861) | 32,183,861 |
| Dividends receivable | 588,474 |
| Dividends receivable from affiliated investments | 35,152 |
| Receivable for investments sold | 10,523,812 |
| Tax reclaims receivable | 315,289 |
| Trustees' deferred compensation plan | 172,472 |
| Total assets | $841,016,172 |
| Liabilities | |
| Payable for investments purchased | $ 18,430,228 |
| Payable to affiliates: | |
| Investment adviser fee | 455,897 |
| Trustees' fees | 4,733 |
| Trustees' deferred compensation plan | 172,472 |
| Accrued expenses | 194,097 |
| Total liabilities | $ 19,257,427 |
| Net Assets applicable to investors' interest in Portfolio | $821,758,745 |
23
See Notes to Financial Statements.
Tax-Managed Value Portfolio
October 31, 2023
| | Year Ended |
| | October 31, 2023 |
| Investment Income | |
| Dividend income (net of foreign taxes withheld of $71,302) | $ 18,447,164 |
| Dividend income from affiliated investments | 117,955 |
| Securities lending income, net | 21,426 |
| Total investment income | $ 18,586,545 |
| Expenses | |
| Investment adviser fee | $ 5,654,648 |
| Trustees’ fees and expenses | 57,013 |
| Custodian fee | 211,419 |
| Legal and accounting services | 80,331 |
| Miscellaneous | 54,764 |
| Total expenses | $ 6,058,175 |
| Deduct: | |
| Waiver and/or reimbursement of expenses by affiliates | $ 3,194 |
| Total expense reductions | $ 3,194 |
| Net expenses | $ 6,054,981 |
| Net investment income | $ 12,531,564 |
| Realized and Unrealized Gain (Loss) | |
| Net realized gain (loss): | |
| Investment transactions | $ 45,676,871(1) |
| Foreign currency transactions | 1,858 |
| Net realized gain | $ 45,678,729 |
| Change in unrealized appreciation (depreciation): | |
| Investments | $ (72,902,000) |
| Foreign currency | 21,334 |
| Net change in unrealized appreciation (depreciation) | $(72,880,666) |
| Net realized and unrealized loss | $(27,201,937) |
| Net decrease in net assets from operations | $(14,670,373) |
| (1) | Includes $25,897,342 of net realized gains from redemptions in-kind. |
24
See Notes to Financial Statements.
Tax-Managed Value Portfolio
October 31, 2023
Statements of Changes in Net Assets
| | Year Ended October 31, |
| | 2023 | 2022 |
| Increase (Decrease) in Net Assets | | |
| From operations: | | |
| Net investment income | $ 12,531,564 | $ 15,326,955 |
| Net realized gain | 45,678,729 (1) | 31,200,330 (2) |
| Net change in unrealized appreciation (depreciation) | (72,880,666) | (129,835,288) |
| Net decrease in net assets from operations | $ (14,670,373) | $ (83,308,003) |
| Capital transactions: | | |
| Contributions | $ 11,089,671 | $ 19,403,167 |
| Withdrawals | (55,288,578) | (49,804,502) |
| Net decrease in net assets from capital transactions | $ (44,198,907) | $ (30,401,335) |
| Net decrease in net assets | $ (58,869,280) | $(113,709,338) |
| Net Assets | | |
| At beginning of year | $ 880,628,025 | $ 994,337,363 |
| At end of year | $821,758,745 | $ 880,628,025 |
| (1) | Includes $25,897,342 of net realized gains from redemptions in-kind. |
| (2) | Includes $21,802,941 of net realized gains from redemptions in-kind. |
25
See Notes to Financial Statements.
Tax-Managed Value Portfolio
October 31, 2023
| | Year Ended October 31, |
| Ratios/Supplemental Data | 2023 | 2022 | 2021 | 2020 | 2019 |
| Ratios (as a percentage of average daily net assets): | | | | | |
| Expenses | 0.68% (1) | 0.68% (1) | 0.68% | 0.68% | 0.68% |
| Net investment income | 1.42% | 1.65% | 1.27% | 1.73% | 1.74% |
| Portfolio Turnover | 31% | 29% | 11% | 25% | 18% |
| Total Return | (1.84)% | (8.51)% | 43.69% | (4.18)% | 12.90% |
| Net assets, end of year (000’s omitted) | $821,759 | $880,628 | $994,337 | $704,707 | $788,248 |
| (1) | Includes a reduction by the investment adviser of a portion of its adviser fee due to the Portfolio’s investment in the Liquidity Fund (equal to less than 0.005% of average daily net assets for the years ended October 31, 2023 and 2022). |
26
See Notes to Financial Statements.
Tax-Managed Value Portfolio
October 31, 2023
Notes to Financial Statements
1 Significant Accounting Policies
Tax-Managed Value Portfolio (the Portfolio) is a Massachusetts business trust registered under the Investment Company Act of 1940, as amended (the 1940 Act), as a diversified, open-end management investment company. The Portfolio’s investment objective is to achieve long-term, after-tax returns by investing primarily in value stocks. The Declaration of Trust permits the Trustees to issue interests in the Portfolio. At October 31, 2023, Eaton Vance Tax-Managed Value Fund and Eaton Vance Tax-Managed Equity Asset Allocation Fund held an interest of 81.1% and 18.9%, respectively, in the Portfolio.
The following is a summary of significant accounting policies of the Portfolio. The policies are in conformity with accounting principles generally accepted in the United States of America (U.S. GAAP). The Portfolio is an investment company and follows accounting and reporting guidance in the Financial Accounting Standards Board (FASB) Accounting Standards Codification Topic 946.
A Investment Valuation—The following methodologies are used to determine the market value or fair value of investments.
Equity Securities. Equity securities listed on a U.S. securities exchange generally are valued at the last sale or closing price on the day of valuation or, if no sales took place on such date, at the mean between the closing bid and ask prices on the exchange where such securities are principally traded. Equity securities listed on the NASDAQ National Market System are valued at the NASDAQ official closing price. Unlisted or listed securities for which closing sales prices or closing quotations are not available are valued at the mean between the latest available bid and ask prices.
Foreign Securities and Currencies. Foreign securities and currencies are valued in U.S. dollars, based on foreign currency exchange rate quotations supplied by a third party pricing service. The pricing service uses a proprietary model to determine the exchange rate. Inputs to the model include reported trades and implied bid/ask spreads. The daily valuation of exchange-traded foreign securities generally is determined as of the close of trading on the principal exchange on which such securities trade. Events occurring after the close of trading on foreign exchanges may result in adjustments to the valuation of foreign securities to more accurately reflect their fair value as of the close of regular trading on the New York Stock Exchange. When valuing foreign equity securities that meet certain criteria, the Portfolio's Trustees have approved the use of a fair value service that values such securities to reflect market trading that occurs after the close of the applicable foreign markets of comparable securities or other instruments that have a strong correlation to the fair-valued securities.
Other. Investments in management investment companies (including money market funds) that do not trade on an exchange are valued at the net asset value as of the close of each business day.
Fair Valuation. In connection with Rule 2a-5 of the 1940 Act, the Trustees have designated the Portfolio’s investment adviser as its valuation designee. Investments for which valuations or market quotations are not readily available or are deemed unreliable are valued by the investment adviser, as valuation designee, at fair value using methods that most fairly reflect the security’s “fair value”, which is the amount that the Portfolio might reasonably expect to receive for the security upon its current sale in the ordinary course. Each such determination is based on a consideration of relevant factors, which are likely to vary from one pricing context to another. These factors may include, but are not limited to, the type of security, the existence of any contractual restrictions on the security’s disposition, the price and extent of public trading in similar securities of the issuer or of comparable companies or entities, quotations or relevant information obtained from broker/dealers or other market participants, information obtained from the issuer, analysts, and/or the appropriate stock exchange (for exchange-traded securities), an analysis of the company’s or entity’s financial statements, and an evaluation of the forces that influence the issuer and the market(s) in which the security is purchased and sold.
B Investment Transactions—Investment transactions for financial statement purposes are accounted for on a trade date basis. Realized gains and losses on investments sold are determined on the basis of identified cost.
C Income—Dividend income is recorded on the ex-dividend date for dividends received in cash and/or securities. However, if the ex-dividend date has passed, certain dividends from foreign securities are recorded as the Portfolio is informed of the ex-dividend date. Withholding taxes on foreign dividends and capital gains have been provided for in accordance with the Portfolio's understanding of the applicable countries’ tax rules and rates. In consideration of recent decisions rendered by European courts, the Portfolio has filed additional tax reclaims for previously withheld taxes on dividends earned in certain European Union countries. These filings are subject to various administrative and judicial proceedings within these countries. Due to the uncertainty as to the ultimate resolution of these proceedings, the likelihood of receipt of these reclaims, and the potential timing of payment, no amounts are reflected in the financial statements for such outstanding reclaims.
D Federal Taxes—The Portfolio has elected to be treated as a partnership for federal tax purposes. No provision is made by the Portfolio for federal or state taxes on any taxable income of the Portfolio because each investor in the Portfolio is ultimately responsible for the payment of any taxes on its share of taxable income. Since at least one of the Portfolio's investors is a regulated investment company that invests all or substantially all of its assets in the Portfolio, the Portfolio normally must satisfy the applicable source of income and diversification requirements (under the Internal Revenue Code) in order for its investors to satisfy them. The Portfolio will allocate, at least annually among its investors, each investor's distributive share of the Portfolio's net investment income, net realized capital gains and losses and any other items of income, gain, loss, deduction or credit.
As of October 31, 2023, the Portfolio had no uncertain tax positions that would require financial statement recognition, de-recognition, or disclosure. The Portfolio files a U.S. federal income tax return annually after its fiscal year-end, which is subject to examination by the Internal Revenue Service for a period of three years from the date of filing.
Tax-Managed Value Portfolio
October 31, 2023
Notes to Financial Statements — continued
E Foreign Currency Translation—Investment valuations, other assets, and liabilities initially expressed in foreign currencies are translated each business day into U.S. dollars based upon current exchange rates. Purchases and sales of foreign investment securities and income and expenses denominated in foreign currencies are translated into U.S. dollars based upon currency exchange rates in effect on the respective dates of such transactions. Recognized gains or losses on investment transactions attributable to changes in foreign currency exchange rates are recorded for financial statement purposes as net realized gains and losses on investments. That portion of unrealized gains and losses on investments that results from fluctuations in foreign currency exchange rates is not separately disclosed.
F Use of Estimates—The preparation of the financial statements in conformity with U.S. GAAP requires management to make estimates and assumptions that affect the reported amounts of assets and liabilities at the date of the financial statements and the reported amounts of income and expense during the reporting period. Actual results could differ from those estimates.
G Indemnifications—Under the Portfolio’s organizational documents, its officers and Trustees may be indemnified against certain liabilities and expenses arising out of the performance of their duties to the Portfolio. Under Massachusetts law, if certain conditions prevail, interestholders in the Portfolio could be deemed to have personal liability for the obligations of the Portfolio. However, the Portfolio’s Declaration of Trust contains an express disclaimer of liability on the part of Portfolio interestholders. Additionally, in the normal course of business, the Portfolio enters into agreements with service providers that may contain indemnification clauses. The Portfolio’s maximum exposure under these arrangements is unknown as this would involve future claims that may be made against the Portfolio that have not yet occurred.
2 Investment Adviser Fee and Other Transactions with Affiliates
The investment adviser fee is earned by Boston Management and Research (BMR), an indirect, wholly-owned subsidiary of Morgan Stanley, as compensation for investment advisory services rendered to the Portfolio. The fee is computed at an annual rate as a percentage of the Portfolio’s average daily net assets as follows and is payable monthly:
| Average Daily Net Assets | Annual Fee Rate |
| Up to $500 million | 0.650% |
| $500 million but less than $1 billion | 0.625% |
| $1 billion but less than $2 billion | 0.600% |
| $2 billion but less than $5 billion | 0.575% |
| $5 billion and over | 0.555% |
For the year ended October 31, 2023, the investment adviser fee amounted to $5,654,648 or 0.64% of the Portfolio's average daily net assets. The Portfolio may invest in a money market fund, the Institutional Class of the Morgan Stanley Institutional Liquidity Funds - Government Portfolio (the “Liquidity Fund”), an open-end management investment company managed by Morgan Stanley Investment Management Inc., a wholly-owned subsidiary of Morgan Stanley. The investment adviser fee paid by the Portfolio is reduced by an amount equal to its pro rata share of the advisory and administration fees paid by the Portfolio due to its investment in the Liquidity Fund. For the year ended October 31, 2023, the investment adviser fee paid was reduced by $3,194 relating to the Portfolio's investment in the Liquidity Fund.
Trustees and officers of the Portfolio who are members of BMR’s organization receive remuneration for their services to the Portfolio out of the investment adviser fee. Trustees of the Portfolio who are not affiliated with the investment adviser may elect to defer receipt of all or a percentage of their annual fees in accordance with the terms of the Trustees Deferred Compensation Plan. Certain officers and Trustees of the Portfolio are officers of the above organization.
3 Purchases and Sales of Investments
Purchases and sales of investments, other than short-term obligations and in-kind transactions, aggregated $270,544,311 and $293,089,549, respectively, for the year ended October 31, 2023. In-kind sales for the year ended October 31, 2023 aggregated $31,139,838.
Tax-Managed Value Portfolio
October 31, 2023
Notes to Financial Statements — continued
4 Federal Income Tax Basis of Investments
The cost and unrealized appreciation (depreciation) of investments of the Fund at October 31, 2023, as determined on a federal income tax basis, were as follows:
| Aggregate cost | $449,274,086 |
| Gross unrealized appreciation | $ 383,799,341 |
| Gross unrealized depreciation | (3,692,454) |
| Net unrealized appreciation | $380,106,887 |
5 Line of Credit
The Portfolio participates with other portfolios and funds managed by BMR and its affiliates in a $650 million unsecured revolving line of credit agreement with a group of banks, which is in effect through October 22, 2024. In connection with the renewal of the agreement on October 24, 2023, the borrowing limit was decreased from $725 million. Borrowings are made by the Portfolio solely for temporary purposes related to redemptions and other short-term cash needs. Interest is charged to the Portfolio based on its borrowings at an amount above either the Secured Overnight Financing Rate (SOFR) or Federal Funds rate. In addition, a fee computed at an annual rate of 0.15% on the daily unused portion of the line of credit is allocated among the participating portfolios and funds at the end of each quarter. In connection with the renewal of the agreement in October 2023, an arrangement fee totaling $150,000 was incurred that was allocated to the participating portfolios and funds. Because the line of credit is not available exclusively to the Portfolio, it may be unable to borrow some or all of its requested amounts at any particular time. The Portfolio did not have any significant borrowings or allocated fees during the year ended October 31, 2023.
6 Securities Lending Agreement
The Portfolio has established a securities lending agreement with State Street Bank and Trust Company (SSBT) as securities lending agent in which the Portfolio lends portfolio securities to qualified borrowers in exchange for collateral consisting of either cash or securities issued or guaranteed by the U.S. government or its agencies or instrumentalities in an amount at least equal to the market value of the securities on loan. The market value of securities loaned is determined daily and any additional required collateral is delivered to the Portfolio on the next business day. Cash collateral is invested in the State Street Navigator Securities Lending Government Money Market Portfolio, a money market fund registered under the 1940 Act. The Portfolio earns interest on the amount invested but it must pay (and at times receive from) the broker a loan rebate fee computed as a varying percentage of the collateral received. For security loans secured by non-cash collateral, the Portfolio earns a negotiated lending fee from the borrower. A portion of the income earned by the Portfolio from its investment of cash collateral, net of rebate fees, and lending fees received is allocated to SSBT for its services as lending agent and the portion allocated to the Portfolio is presented as securities lending income, net on the Statement of Operations. Non-cash collateral is held by the lending agent on behalf of the Portfolio and cannot be sold or re-pledged by the Portfolio; accordingly, such collateral is not reflected in the Statement of Assets and Liabilities.
The Portfolio is subject to possible delay in the recovery of loaned securities. Pursuant to the securities lending agreement, SSBT has provided indemnification to the Portfolio in the event of default by a borrower with respect to a loan. The Portfolio bears the risk of loss with respect to the investment of cash collateral. At October 31, 2023, the Portfolio had no securities on loan.
7 Affiliated Investments
At October 31, 2023, the value of the Portfolio's investment in funds that may be deemed to be affiliated was $32,183,861, which represents 3.9% of the Portfolio's net assets. Transactions in such investments by the Portfolio for the year ended October 31, 2023 were as follows:
| Name | Value,
beginning
of period | Purchases | Sales
proceeds | Net
realized
gain (loss) | Change in
unrealized
appreciation
(depreciation) | Value, end
of period | Dividend
income | Shares,
end of period |
| Short-Term Investments |
| Liquidity Fund | $2,138,376 | $105,027,287 | $(74,981,802) | $ — | $ — | $32,183,861 | $117,955 | 32,183,861 |
Tax-Managed Value Portfolio
October 31, 2023
Notes to Financial Statements — continued
8 Fair Value Measurements
Under generally accepted accounting principles for fair value measurements, a three-tier hierarchy to prioritize the assumptions, referred to as inputs, is used in valuation techniques to measure fair value. The three-tier hierarchy of inputs is summarized in the three broad levels listed below.
| • | Level 1 – quoted prices in active markets for identical investments |
| • | Level 2 – other significant observable inputs (including quoted prices for similar investments, interest rates, prepayment speeds, credit risk, etc.) |
| • | Level 3 – significant unobservable inputs (including a fund's own assumptions in determining the fair value of investments) |
In cases where the inputs used to measure fair value fall in different levels of the fair value hierarchy, the level disclosed is determined based on the lowest level input that is significant to the fair value measurement in its entirety. The inputs or methodology used for valuing securities are not necessarily an indication of the risk associated with investing in those securities.
At October 31, 2023, the hierarchy of inputs used in valuing the Portfolio's investments, which are carried at fair value, were as follows:
| Asset Description | Level 1 | Level 2 | Level 3 | Total |
| Common Stocks: | | | | |
| Communication Services | $ 30,451,791 | $ — | $ — | $ 30,451,791 |
| Consumer Discretionary | 33,450,155 | — | — | 33,450,155 |
| Consumer Staples | 60,231,570 | 9,705,485 | — | 69,937,055 |
| Energy | 86,705,829 | — | — | 86,705,829 |
| Financials | 170,923,860 | — | — | 170,923,860 |
| Health Care | 145,954,163 | — | — | 145,954,163 |
| Industrials | 106,996,755 | — | — | 106,996,755 |
| Information Technology | 44,605,132 | — | — | 44,605,132 |
| Materials | 35,784,755 | — | — | 35,784,755 |
| Real Estate | 22,982,955 | — | — | 22,982,955 |
| Utilities | 49,404,662 | — | — | 49,404,662 |
| Total Common Stocks | $787,491,627 | $ 9,705,485* | $ — | $797,197,112 |
| Short-Term Investments | $ 32,183,861 | $ — | $ — | $ 32,183,861 |
| Total Investments | $819,675,488 | $ 9,705,485 | $ — | $829,380,973 |
| * | Includes foreign equity securities whose values were adjusted to reflect market trading of comparable securities or other correlated instruments that occurred after the close of trading in their applicable foreign markets. |
Tax-Managed Value Portfolio
October 31, 2023
Report of Independent Registered Public Accounting Firm
To the Trustees and Investors of Tax-Managed Value Portfolio:
Opinion on the Financial Statements and Financial Highlights
We have audited the accompanying statement of assets and liabilities of Tax-Managed Value Portfolio (the “Portfolio"), including the portfolio of investments, as of October 31, 2023, the related statement of operations for the year then ended, the statements of changes in net assets for each of the two years in the period then ended, the financial highlights for each of the five years in the period then ended, and the related notes. In our opinion, the financial statements and financial highlights present fairly, in all material respects, the financial position of the Portfolio as of October 31, 2023, and the results of its operations for the year then ended, the changes in its net assets for each of the two years in the period then ended, and the financial highlights for each of the five years in the period then ended, in conformity with accounting principles generally accepted in the United States of America.
Basis for Opinion
These financial statements and financial highlights are the responsibility of the Portfolio’s management. Our responsibility is to express an opinion on the Portfolio’s financial statements and financial highlights based on our audits. We are a public accounting firm registered with the Public Company Accounting Oversight Board (United States) (PCAOB) and are required to be independent with respect to the Portfolio in accordance with the U.S. federal securities laws and the applicable rules and regulations of the Securities and Exchange Commission and the PCAOB.
We conducted our audits in accordance with the standards of the PCAOB. Those standards require that we plan and perform the audit to obtain reasonable assurance about whether the financial statements and financial highlights are free of material misstatement, whether due to error or fraud. The Portfolio is not required to have, nor were we engaged to perform, an audit of its internal control over financial reporting. As part of our audits, we are required to obtain an understanding of internal control over financial reporting but not for the purpose of expressing an opinion on the effectiveness of the Portfolio’s internal control over financial reporting. Accordingly, we express no such opinion.
Our audits included performing procedures to assess the risks of material misstatement of the financial statements and financial highlights, whether due to error or fraud, and performing procedures that respond to those risks. Such procedures included examining, on a test basis, evidence regarding the amounts and disclosures in the financial statements and financial highlights. Our audits also included evaluating the accounting principles used and significant estimates made by management, as well as evaluating the overall presentation of the financial statements and financial highlights. Our procedures included confirmation of securities owned as of October 31, 2023, by correspondence with the custodian and brokers; when replies were not received from brokers, we performed other auditing procedures. We believe that our audits provide a reasonable basis for our opinion.
/s/ Deloitte & Touche LLP
Boston, Massachusetts
December 19, 2023
We have served as the auditor of one or more Eaton Vance investment companies since 1959.
Eaton Vance
Tax-Managed Value Fund
October 31, 2023
Board of Trustees’ Contract Approval
Overview of the Contract Review Process
The Investment Company Act of 1940, as amended (the “1940 Act”), provides, in substance, that the investment advisory agreement between a fund and its investment adviser will continue in effect from year-to-year only if its continuation is approved on an annual basis by a vote of the fund’s board of trustees, including a majority of the trustees who are not “interested persons” of the fund (“independent trustees”), cast in person at a meeting called for the purpose of considering such approval.
At a meeting held on June 8, 2023, the Boards of Trustees/Directors (collectively, the “Board”) that oversee the registered investment companies advised by Eaton Vance Management or its affiliate, Boston Management and Research (the “Eaton Vance Funds”), including a majority of the independent trustees (the “Independent Trustees”), voted to approve the continuation of existing investment advisory agreements and sub-advisory agreements1 for each of the Eaton Vance Funds for an additional one-year period. The Board relied upon the affirmative recommendation of its Contract Review Committee, which is a committee exclusively comprised of Independent Trustees. Prior to making its recommendation, the Contract Review Committee reviewed information furnished by the adviser and sub-adviser to each of the Eaton Vance Funds (including information specifically requested by the Board) for a series of formal meetings held between April and June 2023, as well as certain additional information provided in response to specific requests from the Independent Trustees as members of the Contract Review Committee. Members of the Contract Review Committee also considered information received at prior meetings of the Board and its committees, to the extent such information was relevant to the Contract Review Committee’s annual evaluation of the investment advisory agreements and sub-advisory agreements.
In connection with its evaluation of the investment advisory agreements and sub-advisory agreements, the Board considered various information relating to the Eaton Vance Funds. This included information applicable to all or groups of Eaton Vance Funds, which is referenced immediately below, and information applicable to the particular Eaton Vance Fund covered by this report (each “Eaton Vance Fund” is referred to below as a “fund”). (For funds that invest through one or more underlying portfolios, references to “each fund” in this section may include information that was considered at the portfolio-level.)
Information about Fees, Performance and Expenses
• A report from an independent data provider comparing advisory and other fees paid by each fund to such fees paid by comparable funds, as identified by the independent data provider (“comparable funds”);
• A report from an independent data provider comparing each fund’s total expense ratio (and its components) to those of comparable funds;
• A report from an independent data provider comparing the investment performance of each fund (including, as relevant, total return data, income data, Sharpe ratios and information ratios) to the investment performance of comparable funds and, as applicable, benchmark indices, over various time periods;
• In certain instances, data regarding investment performance relative to customized groups of peer funds and blended indices identified by the adviser in consultation with the Portfolio Management Committee of the Board (a committee exclusively comprised of Independent Trustees);
• Comparative information concerning the fees charged and services provided by the adviser and sub-adviser to each fund in managing other accounts (which may include other mutual funds, collective investment funds and institutional accounts) using investment strategies and techniques similar to those used in managing such fund(s), if any;
• Profitability analyses with respect to the adviser and sub-adviser to each of the funds;
Information about Portfolio Management and Trading
• Descriptions of the investment management services provided to each fund, as well as each of the funds’ investment strategies and policies;
• The procedures and processes used to determine the value of fund assets, including, when necessary, the determination of “fair value” and actions taken to monitor and test the effectiveness of such procedures and processes;
• Information about the policies and practices of each fund’s adviser and sub-adviser with respect to trading, including their processes for seeking best execution of portfolio transactions;
• Information about the allocation of brokerage transactions and the benefits, if any, received by the adviser and sub-adviser to each fund as a result of brokerage allocation, including, as applicable, information concerning the acquisition of research through client commission arrangements and policies with respect to “soft dollars”;
• Data relating to the portfolio turnover rate of each fund and related information regarding active management in the context of particular strategies;
Information about each Adviser and Sub-adviser
• Reports detailing the financial results and condition of the adviser and sub-adviser to each fund;
• Information regarding the individual investment professionals whose responsibilities include portfolio management and investment research for the funds, and, for portfolio managers and certain other investment professionals, information relating to their responsibilities with respect to managing other mutual funds and investment accounts, as applicable;
1 Not all Eaton Vance Funds have entered into a sub-advisory agreement with a sub-adviser. Accordingly, references to “sub-adviser” or “sub-advisory agreement” in this “Overview” section may not be applicable to the particular Eaton Vance Fund covered by this report.
Eaton Vance
Tax-Managed Value Fund
October 31, 2023
Board of Trustees’ Contract Approval — continued
• Information regarding the adviser’s and its parent company’s (Morgan Stanley’s) efforts to retain and attract talented investment professionals, including in the context of a competitive marketplace for talent, as well as the ongoing unique environment presented by hybrid, remote and other alternative work arrangements;
• Information regarding the adviser’s compensation methodology for its investment professionals and the incentives and accountability it creates, along with investment professionals’ investments in the fund(s) they manage;
• The Code of Ethics of the adviser and its affiliates and the sub-adviser of each fund, together with information relating to compliance with, and the administration of, such codes;
• Policies and procedures relating to proxy voting, including regular reporting with respect to fund proxy voting activities;
• Information regarding the handling of corporate actions and class actions, as well as information regarding litigation and other regulatory matters;
• Information concerning the resources devoted to compliance efforts undertaken by the adviser and its affiliates and the sub-adviser of each fund, if any, including descriptions of their various compliance programs and their record of compliance;
• Information concerning the business continuity and disaster recovery plans of the adviser and its affiliates and the sub-adviser of each fund, if any;
• A description of Eaton Vance Management’s and Boston Management and Research’s oversight of sub-advisers, including with respect to regulatory and compliance issues, investment management and other matters;
Other Relevant Information
• Information regarding ongoing initiatives to further integrate and harmonize, where applicable, the investment management and other departments of the adviser and its affiliates with the overall investment management infrastructure of Morgan Stanley, in light of Morgan Stanley’s acquisition of Eaton Vance Corp. on March 1, 2021;
• Information concerning the nature, cost and character of the administrative and other non-investment advisory services provided by Eaton Vance Management and its affiliates;
• Information concerning oversight of the relationship with the custodian, subcustodians, fund accountants, and other third-party service providers by the adviser and/or administrator to each of the funds;
• Information concerning efforts to implement policies and procedures with respect to various recently adopted regulations applicable to the funds, including Rule 12d1-4 (the Fund-of-Funds Rule), Rule 18f-4 (the Derivatives Rule) and Rule 2a-5 (the Fair Valuation Rule);
• For an Eaton Vance Fund structured as an exchange-listed closed-end fund, information concerning the benefits of the closed-end fund structure, as well as, where relevant, the closed-end fund’s market prices (including as compared to the closed-end fund’s net asset value (NAV)), trading volume data, continued use of auction preferred shares (where applicable), distribution rates and other relevant matters;
• The risks which the adviser and/or its affiliates incur in connection with the management and operation of the funds, including, among others, litigation, regulatory, entrepreneurial, and other business risks (and the associated costs of such risks); and
• The terms of each investment advisory agreement and sub-advisory agreement.
During the various meetings of the Board and its committees over the course of the year leading up to the June 8, 2023 meeting, the Board received information from portfolio managers and other investment professionals of the advisers and sub-advisers of the funds regarding investment and performance matters, and considered various investment and trading strategies used in pursuing the funds’ investment objectives. The Board also received information regarding risk management techniques employed in connection with the management of the funds. The Board and its committees evaluated issues pertaining to industry and regulatory developments, compliance procedures, fund governance and other issues with respect to the funds, and received and participated in reports and presentations provided by Eaton Vance Management, Boston Management and Research and fund sub-advisers, with respect to such matters. In addition to the formal meetings of the Board and its committees, the Independent Trustees held regular teleconferences to discuss, among other topics, matters relating to the continuation of investment advisory agreements and sub-advisory agreements.
The Contract Review Committee was advised throughout the contract review process by Goodwin Procter LLP, independent legal counsel for the Independent Trustees. The members of the Contract Review Committee, with the advice of such counsel, exercised their own business judgment in determining the material factors to be considered in evaluating each investment advisory agreement and sub-advisory agreement and the weight to be given to each such factor. The conclusions reached with respect to each investment advisory agreement and sub-advisory agreement were based on a comprehensive evaluation of all the information provided and not any single factor. Moreover, each member of the Contract Review Committee may have placed varying emphasis on particular factors in reaching conclusions with respect to each investment advisory agreement and sub-advisory agreement. In evaluating each investment advisory agreement and sub-advisory agreement, including the fee structures and other terms contained in such agreements, the members of the Contract Review Committee were also informed by multiple years of analysis and discussion with the adviser and sub-adviser to each of the Eaton Vance Funds.
Results of the Contract Review Process
Based on its consideration of the foregoing, and such other information it deemed relevant, including the factors and conclusions described below, the Contract Review Committee concluded that the continuation of the investment advisory agreement between Eaton Vance Tax-Managed Value Fund (the “Fund”) and Eaton Vance Management (“EVM”), as well as the investment advisory agreement between Tax-Managed Value Portfolio (the “Portfolio”), the portfolio in which the Fund invests, and Boston Management and Research (“BMR”) (EVM, with respect to the Fund, and BMR, with respect to the
Eaton Vance
Tax-Managed Value Fund
October 31, 2023
Board of Trustees’ Contract Approval — continued
Portfolio, are each referred to herein as the “Adviser”), including their respective fee structures, are in the interests of shareholders and, therefore, recommended to the Board approval of each agreement. Based on the recommendation of the Contract Review Committee, the Board, including a majority of the Independent Trustees, voted to approve continuation of the investment advisory agreements for the Fund and the Portfolio (together, the “investment advisory agreements”).
Nature, Extent and Quality of Services
In considering whether to approve the investment advisory agreements for the Fund and the Portfolio, the Board evaluated the nature, extent and quality of services provided to the Fund and to the Portfolio by the applicable Adviser.
The Board considered each Adviser’s management capabilities and investment processes in light of the types of investments held by the Fund and the Portfolio, including the education, experience and number of investment professionals and other personnel who provide portfolio management, investment research, and similar services to the Portfolio. The Board specifically noted that each Adviser has devoted extensive resources to in-house equity research capabilities and also draws upon independent research available from third-party sources. The Board considered each Adviser’s experience managing funds that seek to maximize after-tax returns. The Board also took into account the resources dedicated to portfolio management and other services, the compensation methods of each Adviser and other factors, including the reputation and resources of each Adviser to recruit and retain highly qualified research, advisory and supervisory investment professionals. In addition, the Board considered the time and attention devoted to the Eaton Vance Funds, including the Fund and the Portfolio, by senior management, as well as the infrastructure, operational capabilities and support staff in place to assist in the portfolio management and operations of the Fund and the Portfolio, including the provision of administrative services. The Board also considered the business-related and other risks to which each Adviser or its affiliates may be subject in managing the Fund and the Portfolio.
The Board noted that, under the terms of the investment advisory agreement of the Fund, EVM may invest assets of the Fund directly in securities, for which it would receive a fee, or in the Portfolio, for which it receives no separate fee but for which BMR receives an advisory fee from the Portfolio.
The Board considered the compliance programs of each Adviser and relevant affiliates thereof. The Board considered compliance and reporting matters regarding, among other things, personal trading by investment professionals, disclosure of portfolio holdings, late trading, frequent trading, portfolio valuation, business continuity and the allocation of investment opportunities. The Board also considered the responses of each Adviser and its affiliates to requests in recent years from regulatory authorities, such as the Securities and Exchange Commission and the Financial Industry Regulatory Authority.
The Board considered other administrative services provided or overseen by EVM and its affiliates, including transfer agency and accounting services. The Board evaluated the benefits to shareholders of investing in a fund that is a part of a large fund complex offering exposure to a variety of asset classes and investment disciplines, as well as the ability, in many cases, to exchange an investment among different funds without incurring additional sales charges.
After consideration of the foregoing factors, among others, the Board concluded that the nature, extent and quality of services provided by each Adviser, taken as a whole, are appropriate and consistent with the terms of the applicable investment advisory agreement.
Fund Performance
The Board compared the Fund’s investment performance to that of comparable funds identified by an independent data provider (the peer group), as well as an appropriate benchmark index. The Board’s review included comparative performance data with respect to the Fund for the one-, three-, five- and ten-year periods ended December 31, 2022. In this regard, the Board noted that the performance of the Fund was consistent with the median performance of the Fund’s peer group for the three-year period. The Board also noted that the performance of the Fund was lower than its benchmark index for the three-year period. The Board concluded that the performance of the Fund was satisfactory.
Management Fees and Expenses
The Board considered contractual fee rates payable by the Portfolio and by the Fund for advisory and administrative services (referred to collectively as “management fees”). As part of its review, the Board considered the Fund’s management fees and total expense ratio for the one-year period ended December 31, 2022, as compared to those of comparable funds, before and after giving effect to any undertaking to waive fees or reimburse expenses. The Board also considered certain Fund specific factors that had an impact on the Fund’s total expense ratio relative to comparable funds, as identified by management in response to inquiries from the Contract Review Committee.
After considering the foregoing information, and in light of the nature, extent and quality of the services provided by each Adviser, the Board concluded that the management fees charged for advisory and related services are reasonable.
Profitability and “Fall-Out” Benefits
The Board considered the level of profits realized by each Adviser and relevant affiliates thereof in providing investment advisory and administrative services to the Fund, to the Portfolio and to all Eaton Vance Funds as a group. The Board considered the level of profits realized without regard to marketing support or other payments by each Adviser and its affiliates to third parties in respect of distribution or other services.
The Board concluded that, in light of the foregoing factors and the nature, extent and quality of the services rendered, the profits realized by each Adviser and its affiliates are deemed not to be excessive.
Eaton Vance
Tax-Managed Value Fund
October 31, 2023
Board of Trustees’ Contract Approval — continued
The Board also considered direct or indirect fall-out benefits received by each Adviser and its affiliates in connection with their respective relationships with the Fund and the Portfolio, including the benefits of research services that may be available to each Adviser as a result of securities transactions effected for the Fund and the Portfolio and other investment advisory clients.
Economies of Scale
In reviewing management fees and profitability, the Board also considered the extent to which the applicable Adviser and its affiliates, on the one hand, and the Fund and the Portfolio, on the other hand, can expect to realize benefits from economies of scale as the assets of the Fund and the Portfolio increase. The Board acknowledged the difficulty in accurately measuring the benefits resulting from economies of scale, if any, with respect to the management of any specific fund or group of funds. The Board reviewed data summarizing the increases and decreases in the assets of the Fund and of all Eaton Vance Funds as a group over various time periods, and evaluated the extent to which the total expense ratio of the Fund and the profitability of each Adviser and its affiliates may have been affected by such increases or decreases. Based upon the foregoing, the Board concluded that the Fund currently shares in the benefits from economies of scale, if any, when they are realized by each Adviser. The Board also concluded that the structure of the advisory fees, which include breakpoints at several asset levels, will allow the Fund and the Portfolio to continue to benefit from any economies of scale in the future.
Eaton Vance
Tax-Managed Value Fund
October 31, 2023
Liquidity Risk Management Program
The Fund has implemented a written liquidity risk management program (Program) and related procedures to manage its liquidity in accordance with Rule 22e-4 under the Investment Company Act of 1940, as amended (Liquidity Rule). The Liquidity Rule defines “liquidity risk” as the risk that a fund could not meet requests to redeem shares issued by the fund without significant dilution of the remaining investors’ interests in the fund. The Fund’s Board of Trustees/Directors has designated the investment adviser to serve as the administrator of the Program and the related procedures. The administrator has established a Liquidity Risk Management Oversight Committee (Committee) to perform the functions necessary to administer the Program. As part of the Program, the administrator is responsible for identifying illiquid investments and categorizing the relative liquidity of the Fund’s investments in accordance with the Liquidity Rule. Under the Program, the administrator assesses, manages, and periodically reviews the Fund’s liquidity risk, and is responsible for making certain reports to the Fund’s Board of Trustees/Directors and the Securities and Exchange Commission (SEC) regarding the liquidity of the Fund’s investments, and to notify the Board of Trustees/Directors and the SEC of certain liquidity events specified in the Liquidity Rule. The liquidity of the Fund’s portfolio investments is determined based on a number of factors including, but not limited to, relevant market, trading and investment-specific considerations under the Program.
At a meeting of the Fund’s Board of Trustees/Directors on June 7, 2023, the Committee provided a written report to the Fund’s Board of Trustees/
Directors pertaining to the operation, adequacy, and effectiveness of implementation of the Program, as well as the operation of the highly liquid investment minimum (if applicable) for the period January 1, 2022 through December 31, 2022 (Review Period). The Program operated effectively during the Review Period, supporting the administrator’s ability to assess, manage and monitor Fund liquidity risk, including during periods of market volatility and net redemptions. During the Review Period, the Fund met redemption requests on a timely basis.
There can be no assurance that the Program will achieve its objectives in the future. Please refer to the Fund’s prospectus for more information regarding the Fund’s exposure to liquidity risk and other principal risks to which an investment in the Fund may be subject.
Eaton Vance
Tax-Managed Value Fund
October 31, 2023
Management and Organization
Fund Management. The Trustees of Eaton Vance Mutual Funds Trust (the Trust) and Tax-Managed Value Portfolio (the Portfolio) are responsible for the overall management and supervision of the Trust's and the Portfolio's affairs. The Board members and officers of the Trust and the Portfolio are listed below. Except as indicated, each individual has held the office shown or other offices in the same company for the last five years. Board members hold indefinite terms of office. Each Trustee holds office until his or her successor is elected and qualified, subject to a prior death, resignation, retirement, disqualification or removal. Under the terms of the Fund's and the Portfolio's current Trustee retirement policy, an Independent Trustee must retire and resign as a Trustee on the earlier of: (i) the first day of July following his or her 74th birthday; or (ii), with limited exception, December 31st of the 20th year in which he or she has served as a Trustee. However, if such retirement and resignation would cause the Fund and the Portfolio to be out of compliance with Section 16 of the 1940 Act or any other regulations or guidance of the SEC, then such retirement and resignation will not become effective until such time as action has been taken for the Fund and the Portfolio to be in compliance therewith. The “noninterested Trustees” consist of those Trustees who are not “interested persons” of the Trust and the Portfolio, as that term is defined under the 1940 Act. The business address of each Board member and officer is Two International Place, Boston, Massachusetts 02110. As used below, “BMR” refers to Boston Management and Research, “EV” refers to EV LLC, “EVM” refers to Eaton Vance Management , “MSIM" refers to Morgan Stanley Investment Management Inc. and “EVD” refers to Eaton Vance Distributors, Inc. EV is the trustee of each of EVM and BMR. Each of EVM, BMR, EVD and EV are indirect, wholly owned subsidiaries of Morgan Stanley. Each officer affiliated with EVM may hold a position with other EVM affiliates that is comparable to his or her position with EVM listed below. Each Trustee oversees 127 funds in the Eaton Vance fund complex (including both funds and portfolios in a hub and spoke structure).
| Name and Year of Birth | Trust/Portfolio
Position(s) | Length of Service | Principal Occupation(s) and Other Directorships
During Past Five Years and Other Relevant Experience |
| Interested Trustee |
Anchal Pachnanda(1)
1980 | Trustee | Since 2023 | Co-Head of Strategy of MSIM (since 2019). Formerly, Head of Strategy of MSIM (2017-2019). Ms. Pachnanda is an interested person because of her position with MSIM, which is an affiliate of the Trust and the Portfolio.
Other Directorships. None. |
| Noninterested Trustees |
Alan C. Bowser
1962 | Trustee | Since 2022 | Private investor. Formerly, Chief Diversity Officer, Partner and a member of the Operating Committee, and formerly served as Senior Advisor on Diversity and Inclusion for the firm’s chief executive officer, Co-Head of the Americas Region, and Senior Client Advisor of Bridgewater Associates, an asset management firm (2011- 2023).
Other Directorships. Independent Director of Stout Risius Ross (a middle market professional services advisory firm) (since 2021). |
Mark R. Fetting
1954 | Trustee | Since 2016 | Private investor. Formerly held various positions at Legg Mason, Inc. (investment management firm) (2000-2012), including President, Chief Executive Officer, Director and Chairman (2008-2012), Senior Executive Vice President (2004-2008) and Executive Vice President (2001-2004). Formerly, President of Legg Mason family of funds (2001-2008). Formerly, Division President and Senior Officer of Prudential Financial Group, Inc. and related companies (investment management firm) (1991-2000).
Other Directorships. None. |
Cynthia E. Frost
1961 | Trustee | Since 2014 | Private investor. Formerly, Chief Investment Officer of Brown University (university endowment) (2000-2012). Formerly, Portfolio Strategist for Duke Management Company (university endowment manager) (1995-2000). Formerly, Managing Director, Cambridge Associates (investment consulting company) (1989-1995). Formerly, Consultant, Bain and Company (management consulting firm) (1987- 1989). Formerly, Senior Equity Analyst, BA Investment Management Company (1983-1985).
Other Directorships. None. |
George J. Gorman
1952 | Chairperson of the
Board and Trustee | Since 2021
(Chairperson) and 2014 (Trustee) | Principal at George J. Gorman LLC (consulting firm). Formerly, Senior Partner at Ernst & Young LLP (a registered public accounting firm) (1974-2009).
Other Directorships. None. |
Eaton Vance
Tax-Managed Value Fund
October 31, 2023
Management and Organization — continued
| Name and Year of Birth | Trust/Portfolio
Position(s) | Length of Service | Principal Occupation(s) and Other Directorships
During Past Five Years and Other Relevant Experience |
| Noninterested Trustees (continued) |
Valerie A. Mosley
1960 | Trustee | Since 2014 | Chairwoman and Chief Executive Officer of Valmo Ventures (a consulting and investment firm). Founder of Upward Wealth, Inc., dba BrightUp, a fintech platform. Formerly, Partner and Senior Vice President, Portfolio Manager and Investment Strategist at Wellington Management Company, LLP (investment management firm) (1992-2012). Formerly, Chief Investment Officer, PG Corbin Asset Management (1990-1992). Formerly worked in institutional corporate bond sales at Kidder Peabody (1986-1990).
Other Directorships. Director of DraftKings, Inc. (digital sports entertainment and gaming company) (since September 2020). Director of Envestnet, Inc. (provider of intelligent systems for wealth management and financial wellness) (since 2018). Formerly, Director of Dynex Capital, Inc. (mortgage REIT) (2013-2020) and Director of Groupon, Inc. (e-commerce provider) (2020-2022). |
Keith Quinton
1958 | Trustee | Since 2018 | Private investor, researcher and lecturer. Formerly, Independent Investment Committee Member at New Hampshire Retirement System (2017-2021). Formerly, Portfolio Manager and Senior Quantitative Analyst at Fidelity Investments (investment management firm) (2001-2014).
Other Directorships. Formerly, Director (2016-2021) and Chairman (2019-2021) of New Hampshire Municipal Bond Bank. |
Marcus L. Smith
1966 | Trustee | Since 2018 | Private investor and independent corporate director. Formerly, Chief Investment Officer, Canada (2012-2017), Chief Investment Officer, Asia (2010-2012), Director of Asian Research (2004-2010) and portfolio manager (2001-2017) at MFS Investment Management (investment management firm).
Other Directorships. Director of First Industrial Realty Trust, Inc. (an industrial REIT) (since 2021). Director of MSCI Inc. (global provider of investment decision support tools) (since 2017). Formerly, Director of DCT Industrial Trust Inc. (logistics real estate company) (2017-2018). |
Susan J. Sutherland
1957 | Trustee | Since 2015 | Private investor. Director of Ascot Group Limited and certain of its subsidiaries (insurance and reinsurance) (since 2017). Formerly, Director of Hagerty Holding Corp. (insurance) (2015-2018) and Montpelier Re Holdings Ltd. (insurance and reinsurance) (2013-2015). Formerly, Associate, Counsel and Partner at Skadden, Arps, Slate, Meagher & Flom LLP (law firm) (1982-2013).
Other Directorships. Director of Kairos Acquisition Corp. (insurance/InsurTech acquisition company) (since 2021 - 2023). |
Scott E. Wennerholm
1959 | Trustee | Since 2016 | Private investor. Formerly, Trustee at Wheelock College (postsecondary institution) (2012-2018). Formerly, Consultant at GF Parish Group (executive recruiting firm) (2016-2017). Formerly, Chief Operating Officer and Executive Vice President at BNY Mellon Asset Management (investment management firm) (2005-2011). Formerly, Chief Operating Officer and Chief Financial Officer at Natixis Global Asset Management (investment management firm) (1997-2004). Formerly, Vice President at Fidelity Investments Institutional Services (investment management firm) (1994-1997).
Other Directorships. None. |
Nancy A. Wiser(1)
1967 | Trustee | Since 2022 | Formerly, Executive Vice President and the Global Head of Operations at Wells Fargo Asset Management (2011-2021).
Other Directorships. None. |
| Name and Year of Birth | Trust/Portfolio
Position(s) | Length of Service | Principal Occupation(s)
During Past Five Years |
| Principal Officers who are not Trustees |
Kenneth A. Topping
1966 | President of the Trust | Since 2023 | Vice President and Chief Administrative Officer of EVM and BMR and Chief Operating Officer for Public Markets at MSIM. Also Vice President of Calvert Research and Management (“CRM”) since 2021. Formerly, Chief Operating Officer for Goldman Sachs Asset Management `Classic' (2009-2020). |
R. Kelly Williams, Jr.
1971 | President of the
Portfolio | Since 2023 | President and Chief Operating Officer of Atlanta Capital Management Company, LLC. Officer of 21 registered investment companies managed by Eaton Vance or BMR. |
Eaton Vance
Tax-Managed Value Fund
October 31, 2023
Management and Organization — continued
| Name and Year of Birth | Trust/Portfolio
Position(s) | Length of Service | Principal Occupation(s)
During Past Five Years |
| Principal Officers who are not Trustees (continued) |
Deidre E. Walsh
1971 | Vice President and Chief
Legal Officer | Since 2009 | Vice President of EVM and BMR. Also Vice President of CRM. |
James F. Kirchner
1967 | Treasurer | Since 2007 | Vice President of EVM and BMR. Also Vice President of CRM. |
Nicholas S. Di Lorenzo
1987 | Secretary | Since 2022 | Formerly, associate (2012-2021) and counsel (2022) at Dechert LLP. |
Richard F. Froio
1968 | Chief Compliance
Officer | Since 2017 | Vice President of EVM and BMR since 2017. Formerly Deputy Chief Compliance Officer (Adviser/Funds) and Chief Compliance Officer (Distribution) at PIMCO (2012-2017) and Managing Director at BlackRock/Barclays Global Investors (2009-2012). |
(1) Ms. Pachnanda began serving as Trustee effective April 1, 2023.
The SAI for the Fund includes additional information about the Trustees and officers of the Fund and the Portfolio and can be obtained without charge on Eaton Vance’s website at www.eatonvance.com or by calling 1-800-262-1122.
| FACTS | WHAT DOES EATON VANCE DO WITH YOUR
PERSONAL INFORMATION? |
| Why? | Financial companies choose how they share your personal information. Federal law gives consumers the right to limit some but not all sharing. Federal law also requires us to tell you how we collect, share, and protect your personal information. Please read this notice carefully to understand what we do. |
| |
| What? | The types of personal information we collect and share depend on the product or service you have with us. This information can include:■ Social Security number and income
■ investment experience and risk tolerance
■ checking account number and wire transfer instructions |
| |
| How? | All financial companies need to share customers’ personal information to run their everyday business. In the section below, we list the reasons financial companies can share their customers’ personal information; the reasons Eaton Vance chooses to share; and whether you can limit this sharing. |
Reasons we can share your
personal information | Does Eaton Vance
share? | Can you limit
this sharing? |
| For our everyday business purposes — such as to process your transactions, maintain your account(s), respond to court orders and legal investigations, or report to credit bureaus | Yes | No |
| For our marketing purposes — to offer our products and services to you | Yes | No |
| For joint marketing with other financial companies | No | We don’t share |
| For our investment management affiliates’ everyday business purposes — information about your transactions, experiences, and creditworthiness | Yes | Yes |
| For our affiliates’ everyday business purposes — information about your transactions and experiences | Yes | No |
| For our affiliates’ everyday business purposes — information about your creditworthiness | No | We don’t share |
| For our investment management affiliates to market to you | Yes | Yes |
| For our affiliates to market to you | No | We don’t share |
| For nonaffiliates to market to you | No | We don’t share |
To limit our
sharing | Call toll-free 1-800-262-1122 or email: EVPrivacy@eatonvance.comPlease note:If you are a new customer, we can begin sharing your information 30 days from the date we sent this notice. When you are no longer our customer, we continue to share your information as described in this notice. However, you can contact us at any time to limit our sharing. |
| Questions? | Call toll-free 1-800-262-1122 or email: EVPrivacy@eatonvance.com |
| Privacy Notice — continued | April 2021 |
| Who we are |
| Who is providing this notice? | Eaton Vance Management, Eaton Vance Distributors, Inc., Eaton Vance Trust Company, Eaton Vance Management (International) Limited, Eaton Vance Advisers International Ltd., Eaton Vance Global Advisors Limited, Eaton Vance Management’s Real Estate Investment Group, Boston Management and Research, Calvert Research and Management, Eaton Vance and Calvert Fund Families and our investment advisory affiliates (“Eaton Vance”) (see Investment Management Affiliates definition below) |
| What we do |
How does Eaton Vance
protect my personal
information? | To protect your personal information from unauthorized access and use, we use security measures that comply with federal law. These measures include computer safeguards and secured files and buildings. We have policies governing the proper handling of customer information by personnel and requiring third parties that provide support to adhere to appropriate security standards with respect to such information. |
How does Eaton Vance
collect my personal
information? | We collect your personal information, for example, when you■ open an account or make deposits or withdrawals from your account
■ buy securities from us or make a wire transfer
■ give us your contact informationWe also collect your personal information from others, such as credit bureaus, affiliates, or other companies. |
| Why can’t I limit all sharing? | Federal law gives you the right to limit only■ sharing for affiliates’ everyday business purposes — information about your creditworthiness
■ affiliates from using your information to market to you
■ sharing for nonaffiliates to market to youState laws and individual companies may give you additional rights to limit sharing. See below for more on your rights under state law. |
| Definitions |
Investment Management
Affiliates | Eaton Vance Investment Management Affiliates include registered investment advisers, registered broker- dealers, and registered and unregistered funds. Investment Management Affiliates does not include entities associated with Morgan Stanley Wealth Management, such as Morgan Stanley Smith Barney LLC and Morgan Stanley & Co. |
| Affiliates | Companies related by common ownership or control. They can be financial and nonfinancial companies.■ Our affiliates include companies with a Morgan Stanley name and financial companies such as Morgan Stanley Smith Barney LLC and Morgan Stanley & Co. |
| Nonaffiliates | Companies not related by common ownership or control. They can be financial and nonfinancial companies.■ Eaton Vance does not share with nonaffiliates so they can market to you. |
| Joint marketing | A formal agreement between nonaffiliated financial companies that together market financial products or services to you.■ Eaton Vance doesn’t jointly market. |
| Other important information |
| Vermont: Except as permitted by law, we will not share personal information we collect about Vermont residents with Nonaffiliates unless you provide us with your written consent to share such information.California: Except as permitted by law, we will not share personal information we collect about California residents with Nonaffiliates and we will limit sharing such personal information with our Affiliates to comply with California privacy laws that apply to us. |
Delivery of Shareholder Documents. The Securities and Exchange Commission (SEC) permits funds to deliver only one copy of shareholder documents, including prospectuses, proxy statements and shareholder reports, to fund investors with multiple accounts at the same residential or post office box address. This practice is often called “householding” and it helps eliminate duplicate mailings to shareholders. Eaton Vance, or your financial intermediary, may household the mailing of your documents indefinitely unless you instruct Eaton Vance, or your financial intermediary, otherwise. If you would prefer that your Eaton Vance documents not be householded, please contact Eaton Vance at 1-800-262-1122, or contact your financial intermediary. Your instructions that householding not apply to delivery of your Eaton Vance documents will typically be effective within 30 days of receipt by Eaton Vance or your financial intermediary.
Portfolio Holdings. Each Eaton Vance Fund and its underlying Portfolio(s) (if applicable) files a schedule of portfolio holdings on Part F to Form N-PORT with the SEC. Certain information filed on Form N-PORT may be viewed on the Eaton Vance website at www.eatonvance.com, by calling Eaton Vance at 1-800-262-1122 or in the EDGAR database on the SEC’s website at www.sec.gov.
Proxy Voting. From time to time, funds are required to vote proxies related to the securities held by the funds. The Eaton Vance Funds or their underlying Portfolios (if applicable) vote proxies according to a set of policies and procedures approved by the Funds’ and Portfolios’ Boards. You may obtain a description of these policies and procedures and information on how the Funds or Portfolios voted proxies relating to portfolio securities during the most recent 12-month period ended June 30, without charge, upon request, by calling 1-800-262-1122 and by accessing the SEC’s website at www.sec.gov.
Tailored Shareholder Reports. Effective January 24, 2023, the SEC adopted rule and form amendments to require open-end mutual funds and ETFs to transmit concise and visually engaging streamlined annual and semiannual reports to shareholders that highlight key information. Other information, including financial statements, will no longer appear in a streamlined shareholder report but must be available online, delivered free of charge upon request, and filed on a semiannual basis on Form N-CSR. The rule and form amendments have a compliance date of July 24, 2024. At this time, management is evaluating the impact of these amendments on the shareholder reports for the Eaton Vance Funds.
This Page Intentionally Left Blank
This Page Intentionally Left Blank
Investment Adviser of Tax-Managed Value Portfolio
Boston Management and Research
Two International Place
Boston, MA 02110
Investment Adviser and Administrator of Eaton Vance Tax-Managed Value Fund
Eaton Vance Management
Two International Place
Boston, MA 02110
Principal Underwriter*
Eaton Vance Distributors, Inc.
Two International Place
Boston, MA 02110
(617) 482-8260
Custodian
State Street Bank and Trust Company
One Congress Street, Suite 1
Boston, MA 02114-2016
Transfer Agent
BNY Mellon Investment Servicing (US) Inc.
Attn: Eaton Vance Funds
P.O. Box 534439
Pittsburgh, PA 15253-4439
(800) 262-1122
Fund Offices
Two International Place
Boston, MA 02110
* FINRA BrokerCheck. Investors may check the background of their Investment Professional by contacting the Financial Industry Regulatory Authority (FINRA). FINRA BrokerCheck is a free tool to help investors check the professional background of current and former FINRA-registered securities firms and brokers. FINRA BrokerCheck is available by calling 1-800-289-9999 and at www.FINRA.org. The FINRA BrokerCheck brochure describing this program is available to investors at www.FINRA.org.
Eaton Vance
Floating-Rate Advantage Fund
Annual Report
October 31, 2023
Commodity Futures Trading Commission Registration. The Commodity Futures Trading Commission (“CFTC”) has adopted regulations that subject registered investment companies and advisers to regulation by the CFTC if a fund invests more than a prescribed level of its assets in certain CFTC-regulated instruments (including futures, certain options and swap agreements) or markets itself as providing investment exposure to such instruments. The investment adviser has claimed an exclusion from the definition of “commodity pool operator” under the Commodity Exchange Act with respect to its management of the Fund. Accordingly, neither the Fund nor the adviser with respect to the operation of the Fund is subject to CFTC regulation. Because of its management of other strategies, the Fund's adviser is registered with the CFTC as a commodity pool operator. The adviser is also registered as a commodity trading advisor.
Fund shares are not insured by the FDIC and are not deposits or other obligations of, or guaranteed by, any depository institution. Shares are subject to investment risks, including possible loss of principal invested.
This report must be preceded or accompanied by a current summary prospectus or prospectus. Before investing, investors should consider carefully the investment objective, risks, and charges and expenses of a mutual fund. This and other important information is contained in the summary prospectus and prospectus, which can be obtained from a financial intermediary. Prospective investors should read the prospectus carefully before investing. For further information, please call 1-800-262-1122.
Annual Report October 31, 2023
Eaton Vance
Floating-Rate Advantage Fund
Eaton Vance
Floating-Rate Advantage Fund
October 31, 2023
Management’s Discussion of Fund Performance†
Economic and Market Conditions
Amid global concerns about inflation, rising interest rates, and the Russia-Ukraine war, senior loans displayed their value as a portfolio diversifier by outperforming most U.S. fixed-income asset classes during the 12-month period ended October 31, 2023.
With senior loans among the few asset classes to benefit from rising interest rates, the Morningstar® LSTA® US Leveraged Loan IndexSM (the Index), a broad measure of the asset class, returned 11.92% during the period. Senior loans generally outperformed investment-grade corporate bonds, corporate high yield bonds, municipal bonds, and U.S. government bonds.
As the period began in November 2022, the U.S. Federal Reserve’s (the Fed’s) campaign of interest rate hikes was generally viewed as a positive environment for floating-rate loans, and the asset class rallied during the closing months of 2022.
The senior loan rally continued into 2023, with the Index returning 2.73% in January -- its best monthly performance since May 2020 -- and posting positive performance in February 2023 as well. But in mid-March, the unexpected collapse of Silicon Valley Bank and Signature Bank triggered fears of contagion in the regional banking sector and put a damper on asset performance across capital markets. As a result, the Index return was virtually flat in March 2023.
Senior loans rallied again in April 2023, but gave back some of those gains in May amid recession concerns. From June through September 2023, senior loans rallied once more as recession fears receded. In the rising-rate environment, coupon interest accounted for nearly three-quarters of the Index’s performance in 2023 through September.
However, in October 2023, amid volatility that rattled capital markets, loan prices slipped modestly and the Index return was virtually flat for the month -- although senior loans continued to outperform virtually all other U.S. fixed-income asset classes during the closing month of the period.
Asset class technical factors were generally supportive throughout the period, contributing to the overall performance of senior loans. For example, the supply of new loans was limited during the period, which supported floating-rate prices in secondary markets.
In addition, new capital formation in structured products provided a tailwind for the asset class, reflecting continued institutional interest in senior loans during the period.
While issuer fundamentals deteriorated for the period as a whole, they improved during the period’s closing months. The trailing 12-month default rate rose from 0.83% at the start of the period to 1.71% as of June 30, 2023, and then declined to 1.36% at period-end -- about half the market’s 2.70% long-term average. Despite fluctuating default rates, loan prices improved from $92.20 at the start of the period to $94.80 at period-end.
For the period as a whole, BBB-, BB-, B-, CCC- and D-rated (defaulted) loans within the Index returned 8.71%, 9.82%, 13.27%, 12.40%, and -30.85%, respectively.
Fund Performance
For the 12-month period ended October 31, 2023, Eaton Vance Floating-Rate Advantage Fund (the Fund) returned 11.91% for Class A shares at net asset value (NAV), performing approximately in line with its benchmark, the Morningstar® LSTA® US Leveraged Loan IndexSM (the Index), which returned 11.92%.
The Index is unmanaged, and returns do not reflect any applicable sales charges, commissions, expenses, or leverage.
The Fund’s use of investment leverage -- not employed by the Index -- was the largest single contributor to Fund performance versus the Index during the period. The Fund uses leverage to gain additional exposure to the loan market, magnifying exposure to the Fund’s underlying investments in both up and down market environments. During a period when loan prices generally rose, leverage magnified the increase in value of the Fund’s underlying holdings.
The Fund’s modest out-of-Index allocation to collateralized loan obligation debt investments, which performed strongly during the period, contributed to returns versus the Index as well.
On an industry basis, loan selections in the health care equipment & supplies industry contributed to returns versus the Index. On an individual loan basis, the top contributors to relative returns were overweight positions in a home health care provider and a financial software firm.
In contrast, the Fund’s out-of-Index allocation to secured high yield bonds detracted from Fund returns versus the Index, as floating-rate loans outperformed their fixed-rate counterparts in the bond market during the period.
See Endnotes and Additional Disclosures in this report.
Past performance is no guarantee of future results. Returns are historical and are calculated by determining the percentage change in net asset value (NAV) or offering price (as applicable) with all distributions reinvested. Furthermore, returns do not reflect the deduction of taxes that shareholders may have to pay on Fund distributions or upon the redemption of Fund shares. Investment return and principal value will fluctuate so that shares, when redeemed, may be worth more or less than their original cost. Performance for periods less than or equal to one year is cumulative. Performance is for the stated time period only; due to market volatility, current Fund performance may be lower or higher than the quoted return. For performance as of the most recent month-end, please refer to eatonvance.com.
Eaton Vance
Floating-Rate Advantage Fund
October 31, 2023
Management’s Discussion of Fund Performance† — continued
On an industry basis, loan selections in the information technology services; media; diversified telecommunication services; and commercial services & supplies industries also detracted from returns versus the Index. On an individual loan basis, the top detractors from Index-relative performance were overweight positions in a digital infrastructure provider and in a rocket company that provides launch services for satellites.
See Endnotes and Additional Disclosures in this report.
Past performance is no guarantee of future results. Returns are historical and are calculated by determining the percentage change in net asset value (NAV) or offering price (as applicable) with all distributions reinvested. Furthermore, returns do not reflect the deduction of taxes that shareholders may have to pay on Fund distributions or upon the redemption of Fund shares. Investment return and principal value will fluctuate so that shares, when redeemed, may be worth more or less than their original cost. Performance for periods less than or equal to one year is cumulative. Performance is for the stated time period only; due to market volatility, current Fund performance may be lower or higher than the quoted return. For performance as of the most recent month-end, please refer to eatonvance.com.
Eaton Vance
Floating-Rate Advantage Fund
October 31, 2023
Performance
Portfolio Manager(s) Andrew N. Sveen, CFA, Ralph H. Hinckley, Jr., CFA and Jake T. Lemle, CFA
| % Average Annual Total Returns1,2 | Class
Inception Date | Performance
Inception Date | One Year | Five Years | Ten Years |
| Advisers Class at NAV | 03/15/2008 | 08/04/1989 | 11.92% | 3.44% | 3.85% |
| Class A at NAV | 03/17/2008 | 08/04/1989 | 11.91 | 3.43 | 3.84 |
| Class A with 3.25% Maximum Sales Charge | — | — | 8.31 | 2.74 | 3.49 |
| Class C at NAV | 03/15/2008 | 08/04/1989 | 11.48 | 2.95 | 3.42 |
| Class C with 1% Maximum Deferred Sales Charge | — | — | 10.48 | 2.95 | 3.42 |
| Class I at NAV | 03/15/2008 | 08/04/1989 | 12.19 | 3.70 | 4.10 |
| Class R6 at NAV | 05/31/2019 | 08/04/1989 | 12.35 | 3.75 | 4.12 |
|
| Morningstar® LSTA® US Leveraged Loan IndexSM | — | — | 11.92% | 4.46% | 4.22% |
| % Total Annual Operating Expense Ratios3 | Advisers Class | Class A | Class C | Class I | Class R6 |
| | 2.37% | 2.37% | 2.87% | 2.12% | 2.06% |
| % Total Leverage4 | |
| Borrowings | 20.61% |
Growth of $10,0002
This graph shows the change in value of a hypothetical investment of $10,000 in Class A of the Fund for the period indicated. For comparison, the same investment is shown in the indicated index.
| Growth of Investment2 | Amount Invested | Period Beginning | At NAV | With Maximum Sales Charge |
| Advisers Class | $10,000 | 10/31/2013 | $14,591 | N.A. |
| Class C | $10,000 | 10/31/2013 | $14,007 | N.A. |
| Class I, at minimum investment | $1,000,000 | 10/31/2013 | $1,494,414 | N.A. |
| Class R6, at minimum investment | $5,000,000 | 10/31/2013 | $7,487,991 | N.A. |
See Endnotes and Additional Disclosures in this report.
Past performance is no guarantee of future results. Returns are historical and are calculated by determining the percentage change in net asset value (NAV) or offering price (as applicable) with all distributions reinvested. Furthermore, returns do not reflect the deduction of taxes that shareholders may have to pay on Fund distributions or upon the redemption of Fund shares. Investment return and principal value will fluctuate so that shares, when redeemed, may be worth more or less than their original cost. Performance for periods less than or equal to one year is cumulative. Performance is for the stated time period only; due to market volatility, current Fund performance may be lower or higher than the quoted return. For performance as of the most recent month-end, please refer to eatonvance.com.
Eaton Vance
Floating-Rate Advantage Fund
October 31, 2023
| Top 10 Issuers (% of total investments)1 | |
| TransDigm, Inc. | 1.2% |
| Carnival Corporation | 1.1 |
| Epicor Software Corporation | 1.1 |
| Uber Technologies, Inc. | 0.9 |
| Applied Systems, Inc. | 0.9 |
| ICON Luxembourg S.a.r.l. | 0.9 |
| Asurion LLC | 0.9 |
| Go Daddy Operating Company, LLC | 0.8 |
| American Airlines, Inc. | 0.8 |
| Select Medical Corporation | 0.8 |
| Total | 9.4% |
| Top 10 Sectors (% of total investments)1 |
| Software | 13.3% |
| Machinery | 5.2 |
| Hotels, Restaurants & Leisure | 5.1 |
| Capital Markets | 5.0 |
| Chemicals | 5.0 |
| Health Care Providers & Services | 4.9 |
| IT Services | 4.6 |
| Commercial Services & Supplies | 2.8 |
| Trading Companies & Distributors | 2.8 |
| Professional Services | 2.7 |
| Total | 51.4% |
| Credit Quality (% of bonds, loans and asset-backed securities)2 |
Fund invests in an affiliated investment company (Portfolio) with the same objective(s) and policies as the Fund. References to investments are to the Portfolio’s holdings.
Footnotes:
| 1 | Excludes cash and cash equivalents. |
| 2 | Credit ratings are categorized using S&P Global Ratings (“S&P”). Ratings, which are subject to change, apply to the creditworthiness of the issuers of the underlying securities and not to the Fund or its shares. Credit ratings measure the quality of a bond based on the issuer’s creditworthiness, with ratings ranging from AAA, being the highest, to D, being the lowest based on S&P’s measures. Ratings of BBB or higher by S&P are considered to be investment-grade quality. Credit ratings are based largely on the ratings agency’s analysis at the time of rating. The rating assigned to any particular security is not necessarily a reflection of the issuer’s current financial condition and does not necessarily reflect its assessment of the volatility of a security’s market value or of the liquidity of an investment in the security. Holdings designated as “Not Rated” (if any) are not rated by S&P. |
Eaton Vance
Floating-Rate Advantage Fund
October 31, 2023
Endnotes and Additional Disclosures
| † | The views expressed in this report are those of the portfolio manager(s) and are current only through the date stated at the top of this page. These views are subject to change at any time based upon market or other conditions, and Eaton Vance and the Fund(s) disclaim any responsibility to update such views. These views may not be relied upon as investment advice and, because investment decisions are based on many factors, may not be relied upon as an indication of trading intent on behalf of any Eaton Vance fund. This commentary may contain statements that are not historical facts, referred to as “forward-looking statements.” The Fund’s actual future results may differ significantly from those stated in any forward-looking statement, depending on factors such as changes in securities or financial markets or general economic conditions, the volume of sales and purchases of Fund shares, the continuation of investment advisory, administrative and service contracts, and other risks discussed from time to time in the Fund’s filings with the Securities and Exchange Commission. |
| | |
| 1 | Morningstar® LSTA® US Leveraged Loan IndexSM is an unmanaged index of the institutional leveraged loan market. Morningstar® LSTA® Leveraged Loan indices are a product of Morningstar, Inc. (“Morningstar”) and have been licensed for use. Morningstar® is a registered trademark of Morningstar licensed for certain use. Loan Syndications and Trading Association® and LSTA® are trademarks of the LSTA licensed for certain use by Morningstar, and further sublicensed by Morningstar for certain use. Neither Morningstar nor LSTA guarantees the accuracy and/or completeness of the Morningstar® LSTA® US Leveraged Loan IndexSM or any data included therein, and shall have no liability for any errors, omissions, or interruptions therein. Unless otherwise stated, index returns do not reflect the effect of any applicable sales charges, commissions, expenses, taxes or leverage, as applicable. It is not possible to invest directly in an index. |
| 2 | Total Returns at NAV do not include applicable sales charges. If sales charges were deducted, the returns would be lower. Total Returns shown with maximum sales charge reflect the stated maximum sales charge. Unless otherwise stated, performance does not reflect the deduction of taxes on Fund distributions or redemptions of Fund shares.Effective November 5, 2020, Class C shares automatically convert to Class A shares eight years after purchase. The average annual total returns listed for Class C reflect conversion to Class A shares after eight years. Prior to November 5, 2020, Class C shares automatically converted to Class A shares ten years after purchase.Performance prior to the inception date of a class may be linked to the performance of an older class of the Fund. This linked performance is adjusted for any applicable sales charge, but is not adjusted for class expense differences. If adjusted for such differences, the performance would be different. The performance of Class R6 is linked to Class I. Performance presented in the Financial Highlights included in the financial statements is not linked. |
| 3 | Source: Fund prospectus. The expense ratios for the current reporting period can be found in the Financial Highlights section of this report. Performance reflects expenses waived and/or reimbursed, if applicable. Without such waivers and/or reimbursements, performance would have been lower. |
| 4 | Total leverage is shown as a percentage of the Fund’s aggregate net assets plus borrowings outstanding. The Fund employs leverage through borrowings. Use of leverage creates an opportunity for income, but creates risks including greater volatility of NAV. The cost of borrowings rises and falls with changes in short-term interest rates. The Fund may be required to maintain prescribed asset coverage for its leverage and may be required to reduce its leverage at an inopportune time. |
| | Fund profile subject to change due to active management. |
Eaton Vance
Floating-Rate Advantage Fund
October 31, 2023
Example
As a Fund shareholder, you incur two types of costs: (1) transaction costs, including sales charges (loads) on purchases; and (2) ongoing costs, including management fees; distribution and/or service fees; and other Fund expenses. This Example is intended to help you understand your ongoing costs (in dollars) of Fund investing and to compare these costs with the ongoing costs of investing in other mutual funds. The Example is based on an investment of $1,000 invested at the beginning of the period and held for the entire period (May 1, 2023 to October 31, 2023).
Actual Expenses
The first section of the table below provides information about actual account values and actual expenses. You may use the information in this section, together with the amount you invested, to estimate the expenses that you paid over the period. Simply divide your account value by $1,000 (for example, an $8,600 account value divided by $1,000 = 8.6), then multiply the result by the number in the first section under the heading entitled “Expenses Paid During Period” to estimate the expenses you paid on your account during this period.
Hypothetical Example for Comparison Purposes
The second section of the table below provides information about hypothetical account values and hypothetical expenses based on the actual Fund expense ratio and an assumed rate of return of 5% per year (before expenses), which is not the actual Fund return. The hypothetical account values and expenses may not be used to estimate the actual ending account balance or expenses you paid for the period. You may use this information to compare the ongoing costs of investing in your Fund and other funds. To do so, compare this 5% hypothetical example with the 5% hypothetical examples that appear in the shareholder reports of the other funds.
Please note that the expenses shown in the table are meant to highlight your ongoing costs only and do not reflect any transactional costs, such as sales charges (loads). Therefore, the second section of the table is useful in comparing ongoing costs only, and will not help you determine the relative total costs of owning different funds. In addition, if these transactional costs were included, your costs would be higher.
| | Beginning
Account Value
(5/1/23) | Ending
Account Value
(10/31/23) | Expenses Paid
During Period*
(5/1/23 – 10/31/23) | Annualized
Expense
Ratio |
| Actual | | | | |
| Advisers Class | $1,000.00 | $1,049.40 | $15.03 | 2.91% |
| Class A | $1,000.00 | $1,049.40 | $15.03 | 2.91% |
| Class C | $1,000.00 | $1,047.90 | $17.60 | 3.41% |
| Class I | $1,000.00 | $1,050.70 | $13.75 | 2.66% |
| Class R6 | $1,000.00 | $1,050.80 | $13.80 | 2.67% |
| |
| Hypothetical | | | | |
| (5% return per year before expenses) | | | | |
| Advisers Class | $1,000.00 | $1,010.54 | $14.75 | 2.91% |
| Class A | $1,000.00 | $1,010.54 | $14.75 | 2.91% |
| Class C | $1,000.00 | $1,008.02 | $17.26 | 3.41% |
| Class I | $1,000.00 | $1,011.80 | $13.49 | 2.66% |
| Class R6 | $1,000.00 | $1,011.75 | $13.54 | 2.67% |
| * | Expenses are equal to the Fund's annualized expense ratio for the indicated Class, multiplied by the average account value over the period, multiplied by 184/365 (to reflect the one-half year period). The Example assumes that the $1,000 was invested at the net asset value per share determined at the close of business on April 30, 2023. The Example reflects the expenses of both the Fund and the Portfolio. |
Eaton Vance
Floating-Rate Advantage Fund
October 31, 2023
Statement of Assets and Liabilities
| | October 31, 2023 |
| Assets | |
| Investment in Senior Debt Portfolio, at value (identified cost $6,139,877,950) | $ 5,652,234,655 |
| Receivable for Fund shares sold | 17,330,249 |
| Total assets | $ 5,669,564,904 |
| Liabilities | |
| Payable for Fund shares redeemed | $ 21,011,869 |
| Distributions payable | 7,185,413 |
| Payable to affiliates: | |
| Administration fee | 480,403 |
| Distribution and service fees | 447,128 |
| Trustees' fees | 42 |
| Accrued expenses | 1,129,199 |
| Total liabilities | $ 30,254,054 |
| Net Assets | $ 5,639,310,850 |
| Sources of Net Assets | |
| Paid-in capital | $ 6,945,461,702 |
| Accumulated loss | (1,306,150,852) |
| Net Assets | $ 5,639,310,850 |
| Advisers Class Shares | |
| Net Assets | $ 67,432,304 |
| Shares Outstanding | 6,833,150 |
Net Asset Value, Offering Price and Redemption Price Per Share
(net assets ÷ shares of beneficial interest outstanding) | $ 9.87 |
| Class A Shares | |
| Net Assets | $ 1,141,067,240 |
| Shares Outstanding | 115,602,752 |
Net Asset Value and Redemption Price Per Share
(net assets ÷ shares of beneficial interest outstanding) | $ 9.87 |
Maximum Offering Price Per Share
(100 ÷ 96.75 of net asset value per share) | $ 10.20 |
| Class C Shares | |
| Net Assets | $ 294,805,275 |
| Shares Outstanding | 29,919,752 |
Net Asset Value and Offering Price Per Share*
(net assets ÷ shares of beneficial interest outstanding) | $ 9.85 |
| Class I Shares | |
| Net Assets | $ 4,120,652,688 |
| Shares Outstanding | 417,509,146 |
Net Asset Value, Offering Price and Redemption Price Per Share
(net assets ÷ shares of beneficial interest outstanding) | $ 9.87 |
8
See Notes to Financial Statements.
Eaton Vance
Floating-Rate Advantage Fund
October 31, 2023
Statement of Assets and Liabilities — continued
| | October 31, 2023 |
| Class R6 Shares | |
| Net Assets | $15,353,343 |
| Shares Outstanding | 1,555,356 |
Net Asset Value, Offering Price and Redemption Price Per Share
(net assets ÷ shares of beneficial interest outstanding) | $ 9.87 |
| On sales of $100,000 or more, the offering price of Class A shares is reduced. |
| * | Redemption price per share is equal to the net asset value less any applicable contingent deferred sales charge. |
9
See Notes to Financial Statements.
Eaton Vance
Floating-Rate Advantage Fund
October 31, 2023
| | Year Ended |
| | October 31, 2023 |
| Investment Income | |
| Dividend income allocated from Portfolio | $ 9,619,251 |
| Interest and other income allocated from Portfolio | 674,823,521 |
| Expenses, excluding interest expense, allocated from Portfolio | (34,167,349) |
| Interest expense allocated from Portfolio | (108,629,886) |
| Total investment income from Portfolio | $ 541,645,537 |
| Expenses | |
| Administration fee | $ 5,989,812 |
| Distribution and service fees: | |
| Advisers Class | 180,008 |
| Class A | 2,959,713 |
| Class C | 2,415,108 |
| Trustees’ fees and expenses | 500 |
| Custodian fee | 62,000 |
| Transfer and dividend disbursing agent fees | 3,819,326 |
| Legal and accounting services | 187,292 |
| Printing and postage | 324,745 |
| Registration fees | 228,636 |
| Miscellaneous | 60,918 |
| Total expenses | $ 16,228,058 |
| Net investment income | $ 525,417,479 |
| Realized and Unrealized Gain (Loss) from Portfolio | |
| Net realized gain (loss): | |
| Investment transactions | $ (244,251,251) |
| Foreign currency transactions | 2,393,529 |
| Forward foreign currency exchange contracts | (63,924,681) |
| Net realized loss | $(305,782,403) |
| Change in unrealized appreciation (depreciation): | |
| Investments | $ 460,425,398 |
| Foreign currency | 449,059 |
| Forward foreign currency exchange contracts | 10,614,125 |
| Net change in unrealized appreciation (depreciation) | $ 471,488,582 |
| Net realized and unrealized gain | $ 165,706,179 |
| Net increase in net assets from operations | $ 691,123,658 |
10
See Notes to Financial Statements.
Eaton Vance
Floating-Rate Advantage Fund
October 31, 2023
Statements of Changes in Net Assets
| | Year Ended October 31, |
| | 2023 | 2022 |
| Increase (Decrease) in Net Assets | | |
| From operations: | | |
| Net investment income | $ 525,417,479 | $ 410,387,965 |
| Net realized gain (loss) | (305,782,403) | 58,565,060 |
| Net change in unrealized appreciation (depreciation) | 471,488,582 | (889,862,264) |
| Net increase (decrease) in net assets from operations | $ 691,123,658 | $ (420,909,239) |
| Distributions to shareholders: | | |
| Advisers Class | $ (6,268,276) | $ (4,262,210) |
| Class A | (103,262,365) | (64,863,824) |
| Class C | (26,443,101) | (17,090,864) |
| Class I | (392,701,024) | (317,923,672) |
| Class R6 | (2,418,465) | (3,300,693) |
| Total distributions to shareholders | $ (531,093,231) | $ (407,441,263) |
| Transactions in shares of beneficial interest: | | |
| Advisers Class | $ (17,430,701) | $ 2,955,057 |
| Class A | (149,330,418) | 11,843,171 |
| Class C | (66,155,497) | (44,912,321) |
| Class I | (1,212,271,549) | (37,587,568) |
| Class R6 | (9,637,466) | (107,120,998) |
| Net decrease in net assets from Fund share transactions | $(1,454,825,631) | $ (174,822,659) |
| Net decrease in net assets | $(1,294,795,204) | $(1,003,173,161) |
| Net Assets | | |
| At beginning of year | $ 6,934,106,054 | $ 7,937,279,215 |
| At end of year | $ 5,639,310,850 | $ 6,934,106,054 |
11
See Notes to Financial Statements.
Eaton Vance
Floating-Rate Advantage Fund
October 31, 2023
| | Advisers Class |
| | Year Ended October 31, |
| | 2023 | 2022 | 2021 | 2020 | 2019 |
| Net asset value — Beginning of year | $ 9.620 | $10.580 | $ 10.070 | $ 10.550 | $ 10.940 |
| Income (Loss) From Operations | | | | | |
| Net investment income(1) | $ 0.849 | $ 0.487 | $ 0.398 | $ 0.457 | $ 0.558 |
| Net realized and unrealized gain (loss) | 0.261 | (0.966) | 0.528 | (0.473) | (0.390) |
| Total income (loss) from operations | $ 1.110 | $ (0.479) | $ 0.926 | $ (0.016) | $ 0.168 |
| Less Distributions | | | | | |
| From net investment income | $ (0.860) | $ (0.481) | $ (0.416) | $ (0.464) | $ (0.558) |
| Total distributions | $ (0.860) | $ (0.481) | $ (0.416) | $ (0.464) | $ (0.558) |
| Net asset value — End of year | $ 9.870 | $ 9.620 | $10.580 | $10.070 | $ 10.550 |
| Total Return(2) | 11.92% | (4.62)% | 9.30% | (0.05)% | 1.59% |
| Ratios/Supplemental Data | | | | | |
| Net assets, end of year (000’s omitted) | $67,432 | $82,925 | $ 88,509 | $ 64,551 | $139,516 |
| Ratios (as a percentage of average daily net assets):(3) | | | | | |
| Expenses excluding interest and fees | 1.00% | 0.94% | 0.95% | 1.00% | 0.99% |
| Interest and fee expense | 1.82% | 0.49% | 0.33% | 0.63% | 0.87% |
| Total expenses | 2.82% (4) | 1.43% (4) | 1.28% | 1.63% | 1.86% |
| Net investment income | 8.62% | 4.79% | 3.79% | 4.50% | 5.21% |
| Portfolio Turnover of the Portfolio | 18% | 27% | 28% | 30% | 17% |
| (1) | Computed using average shares outstanding. |
| (2) | Returns are historical and are calculated by determining the percentage change in net asset value with all distributions reinvested. |
| (3) | Includes the Fund’s share of the Portfolio’s allocated expenses. |
| (4) | Includes a reduction by the investment adviser of a portion of the Portfolio’s adviser fee due to the Portfolio’s investment in the Liquidity Fund (equal to less than 0.005% of average daily net assets for the years ended October 31, 2023 and 2022). |
12
See Notes to Financial Statements.
Eaton Vance
Floating-Rate Advantage Fund
October 31, 2023
Financial Highlights — continued
| | Class A |
| | Year Ended October 31, |
| | 2023 | 2022 | 2021 | 2020 | 2019 |
| Net asset value — Beginning of year | $ 9.620 | $ 10.580 | $ 10.070 | $ 10.550 | $ 10.950 |
| Income (Loss) From Operations | | | | | |
| Net investment income(1) | $ 0.851 | $ 0.485 | $ 0.399 | $ 0.447 | $ 0.559 |
| Net realized and unrealized gain (loss) | 0.259 | (0.964) | 0.527 | (0.463) | (0.401) |
| Total income (loss) from operations | $ 1.110 | $ (0.479) | $ 0.926 | $ (0.016) | $ 0.158 |
| Less Distributions | | | | | |
| From net investment income | $ (0.860) | $ (0.481) | $ (0.416) | $ (0.464) | $ (0.558) |
| Total distributions | $ (0.860) | $ (0.481) | $ (0.416) | $ (0.464) | $ (0.558) |
| Net asset value — End of year | $ 9.870 | $ 9.620 | $ 10.580 | $ 10.070 | $ 10.550 |
| Total Return(2) | 11.91% | (4.62)% | 9.30% | (0.05)% | 1.50% |
| Ratios/Supplemental Data | | | | | |
| Net assets, end of year (000’s omitted) | $1,141,067 | $1,259,540 | $1,378,928 | $1,175,942 | $1,426,205 |
| Ratios (as a percentage of average daily net assets):(3) | | | | | |
| Expenses excluding interest and fees | 1.00% | 0.94% | 0.95% | 0.99% | 0.99% |
| Interest and fee expense | 1.82% | 0.49% | 0.33% | 0.60% | 0.88% |
| Total expenses | 2.82% (4) | 1.43% (4) | 1.28% | 1.59% | 1.87% |
| Net investment income | 8.64% | 4.77% | 3.80% | 4.44% | 5.21% |
| Portfolio Turnover of the Portfolio | 18% | 27% | 28% | 30% | 17% |
| (1) | Computed using average shares outstanding. |
| (2) | Returns are historical and are calculated by determining the percentage change in net asset value with all distributions reinvested and do not reflect the effect of sales charges. |
| (3) | Includes the Fund’s share of the Portfolio’s allocated expenses. |
| (4) | Includes a reduction by the investment adviser of a portion of the Portfolio’s adviser fee due to the Portfolio’s investment in the Liquidity Fund (equal to less than 0.005% of average daily net assets for the years ended October 31, 2023 and 2022). |
13
See Notes to Financial Statements.
Eaton Vance
Floating-Rate Advantage Fund
October 31, 2023
Financial Highlights — continued
| | Class C |
| | Year Ended October 31, |
| | 2023 | 2022 | 2021 | 2020 | 2019 |
| Net asset value — Beginning of year | $ 9.610 | $ 10.560 | $ 10.050 | $ 10.530 | $ 10.920 |
| Income (Loss) From Operations | | | | | |
| Net investment income(1) | $ 0.799 | $ 0.430 | $ 0.347 | $ 0.397 | $ 0.503 |
| Net realized and unrealized gain (loss) | 0.250 | (0.950) | 0.526 | (0.464) | (0.390) |
| Total income (loss) from operations | $ 1.049 | $ (0.520) | $ 0.873 | $ (0.067) | $ 0.113 |
| Less Distributions | | | | | |
| From net investment income | $ (0.809) | $ (0.430) | $ (0.363) | $ (0.413) | $ (0.503) |
| Total distributions | $ (0.809) | $ (0.430) | $ (0.363) | $ (0.413) | $ (0.503) |
| Net asset value — End of year | $ 9.850 | $ 9.610 | $ 10.560 | $ 10.050 | $ 10.530 |
| Total Return(2) | 11.48% | (5.11)% | 8.77% | (0.56)% | 1.08% |
| Ratios/Supplemental Data | | | | | |
| Net assets, end of year (000’s omitted) | $294,805 | $352,239 | $435,786 | $508,535 | $754,873 |
| Ratios (as a percentage of average daily net assets):(3) | | | | | |
| Expenses excluding interest and fees | 1.50% | 1.44% | 1.46% | 1.50% | 1.49% |
| Interest and fee expense | 1.82% | 0.48% | 0.33% | 0.60% | 0.87% |
| Total expenses | 3.32% (4) | 1.92% (4) | 1.79% | 2.10% | 2.36% |
| Net investment income | 8.13% | 4.23% | 3.31% | 3.95% | 4.71% |
| Portfolio Turnover of the Portfolio | 18% | 27% | 28% | 30% | 17% |
| (1) | Computed using average shares outstanding. |
| (2) | Returns are historical and are calculated by determining the percentage change in net asset value with all distributions reinvested and do not reflect the effect of sales charges. |
| (3) | Includes the Fund’s share of the Portfolio’s allocated expenses. |
| (4) | Includes a reduction by the investment adviser of a portion of the Portfolio’s adviser fee due to the Portfolio’s investment in the Liquidity Fund (equal to less than 0.005% of average daily net assets for the years ended October 31, 2023 and 2022). |
14
See Notes to Financial Statements.
Eaton Vance
Floating-Rate Advantage Fund
October 31, 2023
Financial Highlights — continued
| | Class I |
| | Year Ended October 31, |
| | 2023 | 2022 | 2021 | 2020 | 2019 |
| Net asset value — Beginning of year | $ 9.620 | $ 10.580 | $ 10.070 | $ 10.550 | $ 10.940 |
| Income (Loss) From Operations | | | | | |
| Net investment income(1) | $ 0.873 | $ 0.507 | $ 0.423 | $ 0.474 | $ 0.586 |
| Net realized and unrealized gain (loss) | 0.262 | (0.961) | 0.529 | (0.465) | (0.392) |
| Total income (loss) from operations | $ 1.135 | $ (0.454) | $ 0.952 | $ 0.009 | $ 0.194 |
| Less Distributions | | | | | |
| From net investment income | $ (0.885) | $ (0.506) | $ (0.442) | $ (0.489) | $ (0.584) |
| Total distributions | $ (0.885) | $ (0.506) | $ (0.442) | $ (0.489) | $ (0.584) |
| Net asset value — End of year | $ 9.870 | $ 9.620 | $ 10.580 | $ 10.070 | $ 10.550 |
| Total Return(2) | 12.19% | (4.38)% | 9.57% | 0.20% | 1.84% |
| Ratios/Supplemental Data | | | | | |
| Net assets, end of year (000’s omitted) | $4,120,653 | $5,215,271 | $5,898,403 | $3,545,676 | $4,898,901 |
| Ratios (as a percentage of average daily net assets):(3) | | | | | |
| Expenses excluding interest and fees | 0.75% | 0.69% | 0.70% | 0.75% | 0.74% |
| Interest and fee expense | 1.82% | 0.47% | 0.32% | 0.60% | 0.88% |
| Total expenses | 2.57% (4) | 1.16% (4) | 1.02% | 1.35% | 1.62% |
| Net investment income | 8.87% | 4.99% | 4.02% | 4.70% | 5.47% |
| Portfolio Turnover of the Portfolio | 18% | 27% | 28% | 30% | 17% |
| (1) | Computed using average shares outstanding. |
| (2) | Returns are historical and are calculated by determining the percentage change in net asset value with all distributions reinvested. |
| (3) | Includes the Fund’s share of the Portfolio’s allocated expenses. |
| (4) | Includes a reduction by the investment adviser of a portion of the Portfolio’s adviser fee due to the Portfolio’s investment in the Liquidity Fund (equal to less than 0.005% of average daily net assets for the years ended October 31, 2023 and 2022). |
15
See Notes to Financial Statements.
Eaton Vance
Floating-Rate Advantage Fund
October 31, 2023
Financial Highlights — continued
| | Class R6 | |
| | Year Ended October 31, | Period Ended
October 31,
2019(1) | |
| | 2023 | 2022 | 2021 | 2020 | |
| Net asset value — Beginning of period | $ 9.620 | $10.580 | $ 10.060 | $ 10.550 | $ 10.740 | |
| Income (Loss) From Operations | | | | | | |
| Net investment income(2) | $ 0.914 | $ 0.480 | $ 0.427 | $ 0.460 | $ 0.247 | |
| Net realized and unrealized gain (loss) | 0.224 | (0.931) | 0.540 | (0.455) | (0.190) | |
| Total income (loss) from operations | $ 1.138 | $ (0.451) | $ 0.967 | $ 0.005 | $ 0.057 | |
| Less Distributions | | | | | | |
| From net investment income | $ (0.888) | $ (0.509) | $ (0.447) | $ (0.495) | $ (0.247) | |
| Total distributions | $ (0.888) | $ (0.509) | $ (0.447) | $ (0.495) | $ (0.247) | |
| Net asset value — End of period | $ 9.870 | $ 9.620 | $ 10.580 | $10.060 | $10.550 | |
| Total Return(3) | 12.35% | (4.36)% | 9.63% | 0.16% | 0.53% (4) | |
| Ratios/Supplemental Data | | | | | | |
| Net assets, end of period (000’s omitted) | $15,353 | $24,131 | $135,653 | $ 33,814 | $ 10 | |
| Ratios (as a percentage of average daily net assets):(5) | | | | | | |
| Expenses excluding interest and fees | 0.79% | 0.63% | 0.65% | 0.68% | 0.62% (6) | |
| Interest and fee expense | 1.82% | 0.38% | 0.30% | 0.55% | 0.94% (6) | |
| Total expenses | 2.60% (7) | 1.01% (7) | 0.95% | 1.23% | 1.56% (6) | |
| Net investment income | 9.26% | 4.66% | 4.06% | 4.63% | 5.48% (6) | |
| Portfolio Turnover of the Portfolio | 18% | 27% | 28% | 30% | 17% (4)(8) | |
| (1) | For the period from the commencement of operations, May 31, 2019, to October 31, 2019. |
| (2) | Computed using average shares outstanding. |
| (3) | Returns are historical and are calculated by determining the percentage change in net asset value with all distributions reinvested. |
| (4) | Not annualized. |
| (5) | Includes the Fund’s share of the Portfolio’s allocated expenses. |
| (6) | Annualized. |
| (7) | Includes a reduction by the investment adviser of a portion of the Portfolio’s adviser fee due to the Portfolio’s investment in the Liquidity Fund (equal to less than 0.005% of average daily net assets for the years ended October 31, 2023 and 2022). |
| (8) | For the year ended October 31, 2019. |
16
See Notes to Financial Statements.
Eaton Vance
Floating-Rate Advantage Fund
October 31, 2023
Notes to Financial Statements
1 Significant Accounting Policies
Eaton Vance Floating-Rate Advantage Fund (the Fund) is a diversified series of Eaton Vance Mutual Funds Trust (the Trust). The Trust is a Massachusetts business trust registered under the Investment Company Act of 1940, as amended (the 1940 Act), as an open-end management investment company. The Fund offers five classes of shares. Class A shares are generally sold subject to a sales charge imposed at time of purchase. Class C shares are sold at net asset value and are generally subject to a contingent deferred sales charge (see Note 5). Effective November 5, 2020, Class C shares automatically convert to Class A shares eight years after their purchase as described in the Fund’s prospectus. Advisers Class, Class I and Class R6 shares are generally sold at net asset value and are not subject to a sales charge. Each class represents a pro rata interest in the Fund, but votes separately on class-specific matters and (as noted below) is subject to different expenses. Realized and unrealized gains and losses are allocated daily to each class of shares based on the relative net assets of each class to the total net assets of the Fund. Net investment income, other than class-specific expenses, is allocated daily to each class of shares based upon the ratio of the value of each class’s paid shares to the total value of all paid shares. Sub-accounting, recordkeeping and similar administrative fees payable to financial intermediaries, which are a component of transfer and dividend disbursing agent fees on the Statement of Operations, are not allocated to Class R6 shares. Each class of shares differs in its distribution plan and certain other class-specific expenses. The Fund invests all of its investable assets in interests in Senior Debt Portfolio (the Portfolio), a Massachusetts business trust, having the same investment objective and policies as the Fund. The value of the Fund’s investment in the Portfolio reflects the Fund’s proportionate interest in the net assets of the Portfolio (96.2% at October 31, 2023). The performance of the Fund is directly affected by the performance of the Portfolio. The financial statements of the Portfolio, including the portfolio of investments, are included elsewhere in this report and should be read in conjunction with the Fund’s financial statements.
The following is a summary of significant accounting policies of the Fund. The policies are in conformity with accounting principles generally accepted in the United States of America (U.S. GAAP). The Fund is an investment company and follows accounting and reporting guidance in the Financial Accounting Standards Board (FASB) Accounting Standards Codification Topic 946.
A Investment Valuation—Valuation of securities by the Portfolio is discussed in Note 1A of the Portfolio's Notes to Financial Statements, which are included elsewhere in this report.
B Income—The Fund's net investment income or loss consists of the Fund's pro rata share of the net investment income or loss of the Portfolio, less all actual and accrued expenses of the Fund.
C Federal Taxes—The Fund's policy is to comply with the provisions of the Internal Revenue Code applicable to regulated investment companies and to distribute to shareholders each year substantially all of its net investment income, and all or substantially all of its net realized capital gains. Accordingly, no provision for federal income or excise tax is necessary.
As of October 31, 2023, the Fund had no uncertain tax positions that would require financial statement recognition, de-recognition, or disclosure. The Fund files a U.S. federal income tax return annually after its fiscal year-end, which is subject to examination by the Internal Revenue Service for a period of three years from the date of filing.
D Expenses—The majority of expenses of the Trust are directly identifiable to an individual fund. Expenses which are not readily identifiable to a specific fund are allocated taking into consideration, among other things, the nature and type of expense and the relative size of the funds.
E Use of Estimates—The preparation of the financial statements in conformity with U.S. GAAP requires management to make estimates and assumptions that affect the reported amounts of assets and liabilities at the date of the financial statements and the reported amounts of income and expense during the reporting period. Actual results could differ from those estimates.
F Indemnifications—Under the Trust’s organizational documents, its officers and Trustees may be indemnified against certain liabilities and expenses arising out of the performance of their duties to the Fund. Under Massachusetts law, if certain conditions prevail, shareholders of a Massachusetts business trust (such as the Trust) could be deemed to have personal liability for the obligations of the Trust. However, the Trust’s Declaration of Trust contains an express disclaimer of liability on the part of Fund shareholders and the By-laws provide that the Trust shall assume, upon request by the shareholder, the defense on behalf of any Fund shareholders. Moreover, the By-laws also provide for indemnification out of Fund property of any shareholder held personally liable solely by reason of being or having been a shareholder for all loss or expense arising from such liability. Additionally, in the normal course of business, the Fund enters into agreements with service providers that may contain indemnification clauses. The Fund’s maximum exposure under these arrangements is unknown as this would involve future claims that may be made against the Fund that have not yet occurred.
G Other—Investment transactions are accounted for on a trade date basis.
Eaton Vance
Floating-Rate Advantage Fund
October 31, 2023
Notes to Financial Statements — continued
2 Distributions to Shareholders and Income Tax Information
The Fund declares dividends daily to shareholders of record at the time of declaration. Distributions are generally paid monthly. Distributions of realized capital gains are made at least annually. Distributions are declared separately for each class of shares. Shareholders may reinvest income and capital gain distributions in additional shares of the same class of the Fund at the net asset value as of the reinvestment date or, at the election of the shareholder, receive distributions in cash. Distributions to shareholders are determined in accordance with income tax regulations, which may differ from U.S. GAAP. As required by U.S. GAAP, only distributions in excess of tax basis earnings and profits are reported in the financial statements as a return of capital. Permanent differences between book and tax accounting relating to distributions are reclassified to paid-in capital. For tax purposes, distributions from short-term capital gains are considered to be from ordinary income.
The tax character of distributions declared for the years ended October 31, 2023 and October 31, 2022 was as follows:
| | Year Ended October 31, |
| | 2023 | 2022 |
| Ordinary income | $531,093,231 | $407,441,263 |
During the year ended October 31, 2023, accumulated loss was increased by $871,193 and paid-in capital was increased by $871,193 due to the Fund’s use of equalization accounting. Tax equalization accounting allows the Fund to treat as a distribution that portion of redemption proceeds representing a redeeming shareholder’s portion of undistributed taxable income and net capital gains. These reclassifications had no effect on the net assets or net asset value per share of the Fund.
As of October 31, 2023, the components of distributable earnings (accumulated loss) on a tax basis were as follows:
| Undistributed ordinary income | $ 24,182,644 |
| Deferred capital losses | (873,249,379) |
| Net unrealized depreciation | (449,898,704) |
| Distributions payable | (7,185,413) |
| Accumulated loss | $(1,306,150,852) |
At October 31, 2023, the Fund, for federal income tax purposes, had deferred capital losses of $873,249,379 which would reduce its taxable income arising from future net realized gains on investment transactions, if any, to the extent permitted by the Internal Revenue Code, and thus would reduce the amount of distributions to shareholders, which would otherwise be necessary to relieve the Fund of any liability for federal income or excise tax. The deferred capital losses are treated as arising on the first day of the Fund’s next taxable year and retain the same short-term or long-term character as when originally deferred. Of the deferred capital losses at October 31, 2023, $775,036,648 are long-term and $98,212,731 are short-term.
3 Investment Adviser Fee and Other Transactions with Affiliates
The investment adviser fee is earned by Eaton Vance Management (EVM), an indirect, wholly-owned subsidiary of Morgan Stanley, as compensation for investment advisory services rendered to the Fund. The investment adviser fee is computed at an annual rate as a percentage of the Fund’s average daily gross assets that are not invested in other investment companies for which EVM or its affiliates serve as investment adviser and receive an advisory fee as follows and is payable monthly:
| Average Daily Gross Assets | Annual Fee Rate |
| Up to and including $1 billion | 0.5000% |
| In excess of $1 billion up to and including $2 billion | 0.4500% |
| In excess of $2 billion up to and including $7 billion | 0.4000% |
| In excess of $7 billion up to and including $10 billion | 0.3875% |
| In excess of $10 billion up to and including $15 billion | 0.3750% |
| In excess of $15 billion | 0.3625% |
Eaton Vance
Floating-Rate Advantage Fund
October 31, 2023
Notes to Financial Statements — continued
Gross assets are calculated by deducting all liabilities of the Fund except the principal amount of any indebtedness for money borrowed. For the year ended October 31, 2023, the Fund incurred no investment adviser fee on such assets. To the extent that the Fund’s assets are invested in the Portfolio, the Fund is allocated its share of the Portfolio’s investment adviser fee. The Portfolio has engaged Boston Management and Research (BMR) to render investment advisory services. See Note 2 of the Portfolio’s Notes to Financial Statements which are included elsewhere in this report.
The administration fee is earned by EVM as compensation for administrative services rendered to the Fund. The fee is computed at an annual rate of 0.10% of the Fund’s average daily net assets. For the year ended October 31, 2023, the administration fee amounted to $5,989,812. EVM provides subtransfer agency and related services to the Fund pursuant to a Sub-Transfer Agency Support Services Agreement. For the year ended October 31, 2023, EVM earned $246,461 from the Fund pursuant to such agreement, which is included in transfer and dividend disbursing agent fees on the Statement of Operations. The Fund was informed that Eaton Vance Distributors, Inc. (EVD), an affiliate of EVM and the Fund’s principal underwriter, received $43,894 as its portion of the sales charge on sales of Class A shares for the year ended October 31, 2023. The Fund was informed that Morgan Stanley affiliated broker-dealers, which may be deemed to be affiliates of EVM, BMR and EVD, also received a portion of the sales charge on sales of Class A shares for the year ended October 31, 2023 in the amount of $4,847. EVD also received distribution and service fees from Advisers Class, Class A and Class C shares (see Note 4) and contingent deferred sales charges (see Note 5).
Trustees and officers of the Fund who are members of EVM’s or BMR's organizations receive remuneration for their services to the Fund out of the investment adviser fee. Certain officers and Trustees of the Fund and the Portfolio are officers of the above organizations.
4 Distribution Plans
The Fund has in effect a distribution plan for Advisers Class shares and Class A shares (Advisers/Class A Plan) pursuant to Rule 12b-1 under the 1940 Act. Pursuant to the Advisers/Class A Plan, the Fund pays EVD a distribution and service fee of 0.25% per annum of its average daily net assets attributable to Advisers Class and Class A shares for distribution services and facilities provided to the Fund by EVD, as well as for personal services and/or the maintenance of shareholder accounts. Distribution and service fees paid or accrued to EVD for the year ended October 31, 2023 amounted to $180,008 for Advisers Class shares and $2,959,713 for Class A shares.
The Fund also has in effect a distribution plan for Class C shares (Class C Plan) pursuant to Rule 12b-1 under the 1940 Act. Pursuant to the Class C Plan, the Fund pays EVD amounts equal to 0.60% per annum of its average daily net assets attributable to Class C shares for providing ongoing distribution services and facilities to the Fund. For the year ended October 31, 2023, the Fund paid or accrued to EVD $1,932,086 for Class C shares.
Pursuant to the Class C Plan, the Fund also makes payments of service fees to EVD, financial intermediaries and other persons in amounts equal to 0.15% per annum of its average daily net assets attributable to Class C shares. Although there is no present intention to do so, Class C shares could pay service fees of up to 0.25% annually upon Trustee approval. Service fees paid or accrued are for personal services and/or the maintenance of shareholder accounts. They are separate and distinct from the sales commissions and distribution fees payable to EVD. Service fees paid or accrued for the year ended October 31, 2023 amounted to $483,022 for Class C shares.
Distribution and service fees are subject to the limitations contained in the Financial Industry Regulatory Authority Rule 2341(d).
5 Contingent Deferred Sales Charges
A contingent deferred sales charge (CDSC) of 1% generally is imposed on redemptions of Class C shares made within 12 months of purchase. Class A shares may be subject to a 0.75% CDSC if redeemed within 12 months of purchase (depending on the circumstances of purchase). Generally, the CDSC is based upon the lower of the net asset value at date of redemption or date of purchase. No charge is levied on shares acquired by reinvestment of dividends or capital gain distributions. For the year ended October 31, 2023, the Fund was informed that EVD received $28,775 of CDSCs paid by Class C shareholders and no CDSCs paid by Class A shareholders.
6 Investment Transactions
For the year ended October 31, 2023, increases and decreases in the Fund's investment in the Portfolio aggregated $277,613,527 and $2,303,126,948, respectively.
Eaton Vance
Floating-Rate Advantage Fund
October 31, 2023
Notes to Financial Statements — continued
7 Shares of Beneficial Interest
The Fund’s Declaration of Trust permits the Trustees to issue an unlimited number of full and fractional shares of beneficial interest (without par value). Such shares may be issued in a number of different series (such as the Fund) and classes. Transactions in Fund shares, including direct exchanges pursuant to share class conversions, were as follows:
| | Year Ended
October 31, 2023 | | Year Ended
October 31, 2022 |
| | Shares | Amount | | Shares | Amount |
| Advisers Class | | | | | |
| Sales | 1,128,130 | $ 11,140,190 | | 3,137,426 | $ 32,082,416 |
| Issued to shareholders electing to receive payments of distributions in Fund shares | 630,898 | 6,215,546 | | 421,564 | 4,228,403 |
| Redemptions | (3,544,982) | (34,786,437) | | (3,306,979) | (33,355,762) |
| Net increase (decrease) | (1,785,954) | $ (17,430,701) | | 252,011 | $ 2,955,057 |
| Class A | | | | | |
| Sales | 13,520,333 | $ 133,342,035 | | 31,521,602 | $ 325,499,146 |
| Issued to shareholders electing to receive payments of distributions in Fund shares | 8,818,151 | 86,926,063 | | 5,414,555 | 54,348,789 |
| Redemptions | (37,618,515) | (369,598,516) | | (36,378,082) | (368,004,764) |
| Net increase (decrease) | (15,280,031) | $ (149,330,418) | | 558,075 | $ 11,843,171 |
| Class C | | | | | |
| Sales | 2,918,796 | $ 28,717,972 | | 7,124,983 | $ 73,641,186 |
| Issued to shareholders electing to receive payments of distributions in Fund shares | 2,427,933 | 23,887,925 | | 1,521,498 | 15,247,782 |
| Redemptions | (12,093,790) | (118,761,394) | | (13,237,792) | (133,801,289) |
| Net decrease | (6,747,061) | $ (66,155,497) | | (4,591,311) | $ (44,912,321) |
| Class I | | | | | |
| Sales | 144,101,389 | $ 1,423,150,623 | | 378,384,610 | $ 3,911,906,179 |
| Issued to shareholders electing to receive payments of distributions in Fund shares | 32,436,796 | 319,569,650 | | 25,769,703 | 258,944,572 |
| Redemptions | (301,013,983) | (2,954,991,822) | | (419,698,107) | (4,208,438,319) |
| Net decrease | (124,475,798) | $(1,212,271,549) | | (15,543,794) | $ (37,587,568) |
| Class R6 | | | | | |
| Sales | 8,134,927 | $ 80,029,817 | | 10,838,711 | $ 111,166,323 |
| Issued to shareholders electing to receive payments of distributions in Fund shares | 108,951 | 1,073,201 | | 213,520 | 2,159,950 |
| Redemptions | (9,198,167) | (90,740,484) | | (21,370,023) | (220,447,271) |
| Net decrease | (954,289) | $ (9,637,466) | | (10,317,792) | $ (107,120,998) |
Eaton Vance
Floating-Rate Advantage Fund
October 31, 2023
Report of Independent Registered Public Accounting Firm
To the Trustees of Eaton Vance Mutual Funds Trust and Shareholders of Eaton Vance Floating-Rate Advantage Fund:
Opinion on the Financial Statements and Financial Highlights
We have audited the accompanying statement of assets and liabilities of Eaton Vance Floating-Rate Advantage Fund (the “Fund”) (one of the funds constituting Eaton Vance Mutual Funds Trust), as of October 31, 2023, the related statement of operations for the year then ended, the statements of changes in net assets for each of the two years in the period then ended, the financial highlights for each of the five years in the period then ended, and the related notes. In our opinion, the financial statements and financial highlights present fairly, in all material respects, the financial position of the Fund as of October 31, 2023, and the results of its operations for the year then ended, the changes in its net assets for each of the two years in the period then ended, and the financial highlights for each of the five years in the period then ended, in conformity with accounting principles generally accepted in the United States of America.
Basis for Opinion
These financial statements and financial highlights are the responsibility of the Fund's management. Our responsibility is to express an opinion on the Fund's financial statements and financial highlights based on our audits. We are a public accounting firm registered with the Public Company Accounting Oversight Board (United States) (PCAOB) and are required to be independent with respect to the Fund in accordance with the U.S. federal securities laws and the applicable rules and regulations of the Securities and Exchange Commission and the PCAOB.
We conducted our audits in accordance with the standards of the PCAOB. Those standards require that we plan and perform the audit to obtain reasonable assurance about whether the financial statements and financial highlights are free of material misstatement, whether due to error or fraud. The Fund is not required to have, nor were we engaged to perform, an audit of its internal control over financial reporting. As part of our audits, we are required to obtain an understanding of internal control over financial reporting but not for the purpose of expressing an opinion on the effectiveness of the Fund’s internal control over financial reporting. Accordingly, we express no such opinion.
Our audits included performing procedures to assess the risks of material misstatement of the financial statements and financial highlights, whether due to error or fraud, and performing procedures that respond to those risks. Such procedures included examining, on a test basis, evidence regarding the amounts and disclosures in the financial statements and financial highlights. Our audits also included evaluating the accounting principles used and significant estimates made by management, as well as evaluating the overall presentation of the financial statements and financial highlights. We believe that our audits provide a reasonable basis for our opinion.
/s/ Deloitte & Touche LLP
Boston, Massachusetts
December 19, 2023
We have served as the auditor of one or more Eaton Vance investment companies since 1959.
Eaton Vance
Floating-Rate Advantage Fund
October 31, 2023
Federal Tax Information (Unaudited)
The Form 1099-DIV you receive in February 2024 will show the tax status of all distributions paid to your account in calendar year 2023. Shareholders are advised to consult their own tax adviser with respect to the tax consequences of their investment in the Fund. As required by the Internal Revenue Code and/or regulations, shareholders must be notified regarding the status of qualified dividend income for individuals, the dividends received deduction for corporations and 163(j) interest dividends.
Qualified Dividend Income. For the fiscal year ended October 31, 2023, the Fund designates approximately $2,494,276, or up to the maximum amount of such dividends allowable pursuant to the Internal Revenue Code, as qualified dividend income eligible for the reduced tax rate of 15%.
Dividends Received Deduction. Corporate shareholders are generally entitled to take the dividends received deduction on the portion of the Fund’s dividend distribution that qualifies under tax law. For the Fund’s fiscal 2023 ordinary income dividends, 0.66% qualifies for the corporate dividends received deduction.
163(j) Interest Dividends. For the fiscal year ended October 31, 2023, the Fund designates 94.00% of distributions from net investment income as a 163(j) interest dividend.
Senior Debt Portfolio
October 31, 2023
| Asset-Backed Securities — 4.9% |
| Security | Principal
Amount
(000's omitted) | Value |
| Alinea CLO, Ltd.: | | | |
| Series 2018-1A, Class D, 8.777%, (3 mo. SOFR + 3.362%), 7/20/31(1)(2) | $ | 2,500 | $ 2,403,450 |
| Series 2018-1A, Class E, 11.677%, (3 mo. SOFR + 6.262%), 7/20/31(1)(2) | | 3,000 | 2,621,361 |
| AMMC CLO 15, Ltd., Series 2014-15A, Class ERR, 12.566%, (3 mo. SOFR + 7.172%), 1/15/32(1)(2) | | 5,000 | 4,394,235 |
| AMMC CLO XII, Ltd., Series 2013-12A, Class ER, 11.807%, (3 mo. SOFR + 6.442%), 11/10/30(1)(2) | | 3,525 | 3,009,589 |
| Apidos CLO XX, Series 2015-20A, Class DR, 11.356%, (3 mo. SOFR + 5.962%), 7/16/31(1)(2) | | 2,375 | 2,135,332 |
| Ares Loan Funding II, Ltd., Series 2022-ALF2A, Class ER, 13.656%, (3 mo. SOFR + 8.24%), 10/20/36(1)(2) | | 1,675 | 1,642,003 |
| Ares LVlll CLO, Ltd., Series 2020-58A, Class ER, 12.094%, (3 mo. SOFR + 6.70%), 1/15/35(1)(2) | | 3,000 | 2,733,831 |
| Ares XLIX CLO, Ltd., Series 2018-49A, Class D, 8.674%, (3 mo. SOFR + 3.262%), 7/22/30(1)(2) | | 2,500 | 2,395,640 |
| Ares XXXIIR CLO, Ltd.: | | | |
| Series 2014-32RA, Class C, 8.526%, (3 mo. SOFR + 3.162%), 5/15/30(1)(2) | | 5,000 | 4,754,640 |
| Series 2014-32RA, Class D, 11.476%, (3 mo. SOFR + 6.111%), 5/15/30(1)(2) | | 1,000 | 856,831 |
| Ares XXXVR CLO, Ltd., Series 2015-35RA, Class E, 11.356%, (3 mo. SOFR + 5.962%), 7/15/30(1)(2) | | 4,000 | 3,552,104 |
| Babson CLO, Ltd.: | | | |
| Series 2015-1A, Class DR, 8.277%, (3 mo. SOFR + 2.862%), 1/20/31(1)(2) | | 2,500 | 2,362,727 |
| Series 2018-1A, Class C, 8.256%, (3 mo. SOFR + 2.862%), 4/15/31(1)(2) | | 3,500 | 3,276,546 |
| Bain Capital Credit CLO, Ltd., Series 2018-1A, Class D, 8.374%, (3 mo. SOFR + 2.962%), 4/23/31(1)(2) | | 5,000 | 4,651,770 |
| Battalion CLO XXII, Ltd., Series 2021-22A, Class E, 12.627%, (3 mo. SOFR + 7.212%), 1/20/35(1)(2) | | 1,750 | 1,482,668 |
| Battalion CLO XXIII, Ltd., Series 2022-23A, Class D, 9.344%, (3 mo. SOFR + 3.95%), 5/19/36(1)(2) | | 3,500 | 3,230,965 |
| Benefit Street Partners CLO V-B, Ltd., Series 2018-5BA, Class D, 11.627%, (3 mo. SOFR + 6.212%), 4/20/31(1)(2) | | 3,500 | 3,250,653 |
| Benefit Street Partners CLO VIII, Ltd., Series 2015-8A, Class DR, 11.277%, (3 mo. SOFR + 5.862%), 1/20/31(1)(2) | | 5,401 | 4,544,758 |
| Benefit Street Partners CLO XIV, Ltd., Series 2018-14A, Class D, 8.277%, (3 mo. SOFR + 2.862%), 4/20/31(1)(2) | | 1,500 | 1,419,594 |
| Benefit Street Partners CLO XVI, Ltd., Series 2018-16A, Class E, 12.364%, (3 mo. SOFR + 6.962%), 1/17/32(1)(2) | | 2,250 | 2,108,072 |
| Security | Principal
Amount
(000's omitted) | Value |
| Benefit Street Partners CLO XVII, Ltd., Series 2019-17A, Class ER, 12.006%, (3 mo. SOFR + 6.612%), 7/15/32(1)(2) | $ | 1,750 | $ 1,677,869 |
| Benefit Street Partners CLO XXII, Ltd., Series 2020-22A, Class ER, 12.346%, (3 mo. SOFR + 6.93%), 4/20/35(1)(2) | | 1,000 | 930,082 |
| Benefit Street Partners CLO XXV, Ltd., Series 2021-25A, Class E, 12.506%, (3 mo. SOFR + 7.112%), 1/15/35(1)(2) | | 3,000 | 2,845,206 |
| Betony CLO 2, Ltd.: | | | |
| Series 2018-1A, Class C, 8.552%, (3 mo. SOFR + 3.162%), 4/30/31(1)(2) | | 2,500 | 2,387,102 |
| Series 2018-1A, Class D, 11.302%, (3 mo. SOFR + 5.912%), 4/30/31(1)(2) | | 2,525 | 2,222,104 |
| BlueMountain CLO XXIV, Ltd., Series 2019-24A, Class ER, 12.517%, (3 mo. SOFR + 7.102%), 4/20/34(1)(2) | | 1,250 | 1,100,115 |
| BlueMountain CLO XXVI, Ltd., Series 2019-26A, Class ER, 12.807%, (3 mo. SOFR + 7.392%), 10/20/34(1)(2) | | 3,000 | 2,781,324 |
| BlueMountain CLO XXX, Ltd., Series 2020-30A, Class ER, 12.094%, (3 mo. SOFR + 6.70%), 4/15/35(1)(2) | | 2,000 | 1,779,092 |
| BlueMountain CLO XXXIII, Ltd., Series 2021-33A, Class E, 12.471%, (3 mo. SOFR + 7.092%), 11/20/34(1)(2) | | 2,500 | 2,322,227 |
| BlueMountain CLO XXXV, Ltd., Series 2022-35A, Class E, 13.162%, (3 mo. SOFR + 7.75%), 7/22/35(1)(2) | | 2,000 | 1,884,938 |
| BlueMountain CLO, Ltd.: | | | |
| Series 2015-3A, Class CR, 8.277%, (3 mo. SOFR + 2.862%), 4/20/31(1)(2) | | 5,000 | 4,652,830 |
| Series 2015-3A, Class DR, 11.077%, (3 mo. SOFR + 5.662%), 4/20/31(1)(2) | | 3,000 | 2,510,772 |
| Series 2016-3A, Class DR, 8.726%, (3 mo. SOFR + 3.362%), 11/15/30(1)(2) | | 1,500 | 1,375,377 |
| Series 2016-3A, Class ER, 11.576%, (3 mo. SOFR + 6.212%), 11/15/30(1)(2) | | 1,500 | 1,224,608 |
| Series 2018-1A, Class D, 8.702%, (3 mo. SOFR + 3.312%), 7/30/30(1)(2) | | 2,500 | 2,266,957 |
| Series 2018-1A, Class E, 11.602%, (3 mo. SOFR + 6.212%), 7/30/30(1)(2) | | 2,000 | 1,534,322 |
| Bryant Park Funding, Ltd.: | | | |
| Series 2023-20A, Class D, 11.449%, (3 mo. SOFR + 6.09%), 7/15/36(1)(2) | | 5,250 | 5,116,156 |
| Series 2023-21A, Class D, 10.935%, (3 mo. SOFR + 5.45%), 10/18/36(1)(2) | | 4,475 | 4,445,599 |
| Canyon Capital CLO, Ltd.: | | | |
| Series 2012-1RA, Class E, 11.356%, (3 mo. SOFR + 5.962%), 7/15/30(1)(2) | | 4,875 | 4,244,814 |
| Series 2016-1A, Class ER, 11.406%, (3 mo. SOFR + 6.012%), 7/15/31(1)(2) | | 4,000 | 3,392,436 |
23
See Notes to Financial Statements.
Senior Debt Portfolio
October 31, 2023
Portfolio of Investments — continued
| Security | Principal
Amount
(000's omitted) | Value |
| Canyon Capital CLO, Ltd.: (continued) | | | |
| Series 2016-2A, Class ER, 11.656%, (3 mo. SOFR + 6.262%), 10/15/31(1)(2) | $ | 4,500 | $ 3,826,125 |
| Series 2018-1A, Class D, 8.556%, (3 mo. SOFR + 3.162%), 7/15/31(1)(2) | | 3,000 | 2,848,887 |
| Series 2018-1A, Class E, 11.406%, (3 mo. SOFR + 6.012%), 7/15/31(1)(2) | | 2,750 | 2,345,882 |
| Series 2019-2A, Class ER, 12.406%, (3 mo. SOFR + 7.011%), 10/15/34(1)(2) | | 1,500 | 1,360,722 |
| Carlyle CLO C17, Ltd.: | | | |
| Series C17A, Class CR, 8.452%, (3 mo. SOFR + 3.062%), 4/30/31(1)(2) | | 5,000 | 4,680,700 |
| Series C17A, Class DR, 11.652%, (3 mo. SOFR + 6.262%), 4/30/31(1)(2) | | 3,500 | 2,841,314 |
| Carlyle Global Market Strategies CLO, Ltd.: | | | |
| Series 2012-3A, Class CR2, 9.156%, (3 mo. SOFR + 3.762%), 1/14/32(1)(2) | | 2,500 | 2,408,155 |
| Series 2012-3A, Class DR2, 12.156%, (3 mo. SOFR + 6.761%), 1/14/32(1)(2) | | 1,500 | 1,251,521 |
| Series 2014-3RA, Class C, 8.599%, (3 mo. SOFR + 3.212%), 7/27/31(1)(2) | | 1,000 | 924,119 |
| Series 2014-3RA, Class D, 11.049%, (3 mo. SOFR + 5.662%), 7/27/31(1)(2) | | 2,150 | 1,877,116 |
| Series 2014-4RA, Class C, 8.556%, (3 mo. SOFR + 3.162%), 7/15/30(1)(2) | | 2,750 | 2,542,001 |
| Series 2014-4RA, Class D, 11.306%, (3 mo. SOFR + 5.912%), 7/15/30(1)(2) | | 1,500 | 1,206,492 |
| Carlyle US CLO, Ltd.: | | | |
| Series 2019-4A, Class DR, 11.994%, (3 mo. SOFR + 6.60%), 4/15/35(1)(2) | | 3,000 | 2,658,969 |
| Series 2022-6A, Class DR, 10.13%, (3 mo. SOFR + 4.75%), 10/25/36(1)(2) | | 2,800 | 2,809,523 |
| CarVal CLO IV, Ltd., Series 2021-1A, Class E, 12.277%, (3 mo. SOFR + 6.862%), 7/20/34(1)(2) | | 1,000 | 975,659 |
| CIFC Funding, Ltd., Series 2022-4A, Class D, 8.944%, (3 mo. SOFR + 3.55%), 7/16/35(1)(2) | | 1,750 | 1,725,726 |
| Crown City CLO I, Series 2020-1A, Class DR, 12.677%, (3 mo. SOFR + 7.262%), 7/20/34(1)(2) | | 250 | 223,087 |
| Dryden CLO, Ltd.: | | | |
| Series 2018-55A, Class D, 8.506%, (3 mo. SOFR + 3.112%), 4/15/31(1)(2) | | 1,500 | 1,399,137 |
| Series 2018-55A, Class E, 11.056%, (3 mo. SOFR + 5.662%), 4/15/31(1)(2) | | 2,000 | 1,749,672 |
| Series 2022-112A, Class E, 13.145%, (3 mo. SOFR + 7.78%), 8/15/34(1)(2) | | 2,000 | 1,973,216 |
| Dryden Senior Loan Fund: | | | |
| Series 2015-41A, Class DR, 8.256%, (3 mo. SOFR + 2.862%), 4/15/31(1)(2) | | 7,000 | 6,498,611 |
| Series 2015-41A, Class ER, 10.956%, (3 mo. SOFR + 5.562%), 4/15/31(1)(2) | | 1,268 | 989,947 |
| Series 2016-42A, Class DR, 8.586%, (3 mo. SOFR + 3.192%), 7/15/30(1)(2) | | 2,500 | 2,348,357 |
| Series 2016-42A, Class ER, 11.206%, (3 mo. SOFR + 5.812%), 7/15/30(1)(2) | | 3,500 | 2,953,135 |
| Security | Principal
Amount
(000's omitted) | Value |
| Elmwood CLO 14, Ltd., Series 2022-1A, Class E, 11.766%, (3 mo. SOFR + 6.35%), 4/20/35(1)(2) | $ | 1,950 | $ 1,875,321 |
| Elmwood CLO 17, Ltd., Series 2022-4A, Class E, 12.553%, (3 mo. SOFR + 7.15%), 7/17/35(1)(2) | | 2,000 | 1,981,362 |
| Empower CLO, Ltd., Series 2023-2A, Class D, 10.74%, (3 mo. SOFR + 5.40%), 7/15/36(1)(2) | | 2,000 | 1,995,574 |
| Galaxy XXV CLO, Ltd.: | | | |
| Series 2015-19A, Class D1R, 12.19%, (3 mo. SOFR + 6.792%), 7/24/30(1)(2) | | 2,000 | 1,769,058 |
| Series 2018-25A, Class D, 8.74%, (3 mo. SOFR + 3.362%), 10/25/31(1)(2) | | 2,500 | 2,438,492 |
| Series 2018-25A, Class E, 11.59%, (3 mo. SOFR + 6.211%), 10/25/31(1)(2) | | 3,500 | 3,098,378 |
| Golub Capital Partners CLO 37B, Ltd.: | | | |
| Series 2018-37A, Class D, 8.977%, (3 mo. SOFR + 3.562%), 7/20/30(1)(2) | | 4,000 | 3,709,444 |
| Series 2018-37A, Class E, 11.427%, (3 mo. SOFR + 6.012%), 7/20/30(1)(2) | | 4,750 | 4,695,978 |
| Golub Capital Partners CLO 53B, Ltd., Series 2021-53A, Class E, 12.377%, (3 mo. SOFR + 6.962%), 7/20/34(1)(2) | | 1,250 | 1,141,728 |
| Golub Capital Partners CLO 58B, Ltd., Series 2021-58A, Class E, 12.45%, (3 mo. SOFR + 7.072%), 1/25/35(1)(2) | | 2,500 | 2,306,540 |
| Golub Capital Partners CLO, Ltd., Series 2020-48A, Class D, 9.464%, (3 mo. SOFR + 4.062%), 4/17/33(1)(2) | | 2,000 | 1,881,668 |
| Halseypoint CLO 5, Ltd., Series 2021-5A, Class E, 12.592%, (3 mo. SOFR + 7.202%), 1/30/35(1)(2) | | 2,000 | 1,821,042 |
| Harriman Park CLO, Ltd., Series 2020-1A, Class ER, 12.077%, (3 mo. SOFR + 6.662%), 4/20/34(1)(2) | | 1,000 | 929,261 |
| ICG US CLO, Ltd.: | | | |
| Series 2018-2A, Class D, 8.774%, (3 mo. SOFR + 3.362%), 7/22/31(1)(2) | | 2,000 | 1,844,714 |
| Series 2018-2A, Class E, 11.424%, (3 mo. SOFR + 6.012%), 7/22/31(1)(2) | | 3,000 | 2,468,892 |
| Madison Park Funding LIX, Ltd., Series 2021-59A, Class E, 12.257%, (3 mo. SOFR + 6.862%), 1/18/34(1)(2) | | 1,550 | 1,447,717 |
| Madison Park Funding XXXVI, Ltd., Series 2019-36A, Class ER, 12.444%, (3 mo. SOFR + 7.05%), 4/15/35(1)(2) | | 2,500 | 2,464,607 |
| Marble Point CLO XXIV, Ltd., Series 2022-1A, Class D1, 9.656%, (3 mo. SOFR + 4.24%), 4/20/35(1)(2) | | 2,000 | 1,948,968 |
| Neuberger Berman CLO XVIII, Ltd., Series 2014-18A, Class DR2, 11.594%, (3 mo. SOFR + 6.182%), 10/21/30(1)(2) | | 2,000 | 1,857,866 |
| Neuberger Berman CLO XXII, Ltd.: | | | |
| Series 2016-22A, Class DR, 8.764%, (3 mo. SOFR + 3.362%), 10/17/30(1)(2) | | 2,500 | 2,405,505 |
| Series 2016-22A, Class ER, 11.724%, (3 mo. SOFR + 6.322%), 10/17/30(1)(2) | | 3,000 | 2,729,217 |
24
See Notes to Financial Statements.
Senior Debt Portfolio
October 31, 2023
Portfolio of Investments — continued
| Security | Principal
Amount
(000's omitted) | Value |
| Neuberger Berman Loan Advisers CLO 28, Ltd., Series 2018-28A, Class E, 11.277%, (3 mo. SOFR + 5.862%), 4/20/30(1)(2) | $ | 1,950 | $ 1,712,176 |
| Neuberger Berman Loan Advisers CLO 48, Ltd., Series 2022-48A, Class E, 11.878%, (3 mo. SOFR + 6.50%), 4/25/36(1)(2) | | 2,600 | 2,473,812 |
| OCP CLO, Ltd.: | | | |
| Series 2022-24A, Class D, 9.216%, (3 mo. SOFR + 3.80%), 7/20/35(1)(2) | | 500 | 472,812 |
| Series 2022-24A, Class E, 12.836%, (3 mo. SOFR + 7.42%), 7/20/35(1)(2) | | 1,000 | 966,488 |
| Palmer Square CLO, Ltd.: | | | |
| Series 2013-2A, Class DRR, 11.514%, (3 mo. SOFR + 6.111%), 10/17/31(1)(2) | | 1,425 | 1,334,976 |
| Series 2015-1A, Class DR4, 12.141%, (3 mo. SOFR + 6.762%), 5/21/34(1)(2) | | 2,000 | 1,847,830 |
| Series 2018-1A, Class D, 10.807%, (3 mo. SOFR + 5.412%), 4/18/31(1)(2) | | 2,000 | 1,881,298 |
| Series 2018-2A, Class D, 11.256%, (3 mo. SOFR + 5.862%), 7/16/31(1)(2) | | 2,000 | 1,928,870 |
| Series 2021-2A, Class E, 12.006%, (3 mo. SOFR + 6.612%), 7/15/34(1)(2) | | 1,000 | 962,846 |
| Series 2022-1A, Class E, 11.766%, (3 mo. SOFR + 6.35%), 4/20/35(1)(2) | | 5,500 | 5,306,378 |
| RAD CLO 5, Ltd., Series 2019-5A, Class E, 12.36%, (3 mo. SOFR + 6.962%), 7/24/32(1)(2) | | 1,250 | 1,169,161 |
| RAD CLO 11, Ltd., Series 2021-11A, Class E, 11.906%, (3 mo. SOFR + 6.512%), 4/15/34(1)(2) | | 750 | 711,525 |
| RAD CLO 14, Ltd., Series 2021-14A, Class E, 12.156%, (3 mo. SOFR + 6.762%), 1/15/35(1)(2) | | 1,050 | 983,733 |
| Regatta XIII Funding, Ltd.: | | | |
| Series 2018-2A, Class C, 8.756%, (3 mo. SOFR + 3.362%), 7/15/31(1)(2) | | 2,500 | 2,432,925 |
| Series 2018-2A, Class D, 11.606%, (3 mo. SOFR + 6.212%), 7/15/31(1)(2) | | 5,000 | 4,067,035 |
| Regatta XIV Funding, Ltd.: | | | |
| Series 2018-3A, Class D, 8.84%, (3 mo. SOFR + 3.462%), 10/25/31(1)(2) | | 2,500 | 2,442,735 |
| Series 2018-3A, Class E, 11.59%, (3 mo. SOFR + 6.211%), 10/25/31(1)(2) | | 2,000 | 1,801,678 |
| Regatta XV Funding, Ltd., Series 2018-4A, Class D, 12.14%, (3 mo. SOFR + 6.762%), 10/25/31(1)(2) | | 2,875 | 2,543,044 |
| Symphony CLO, Ltd., Series 2022-37A, Class D1, 10.846%, (3 mo. SOFR + 5.43%), 10/20/34(1)(2) | | 2,500 | 2,518,007 |
| Upland CLO, Ltd.: | | | |
| Series 2016-1A, Class CR, 8.577%, (3 mo. SOFR + 3.162%), 4/20/31(1)(2) | | 4,500 | 4,239,504 |
| Series 2016-1A, Class DR, 11.577%, (3 mo. SOFR + 6.162%), 4/20/31(1)(2) | | 2,125 | 1,920,182 |
| Vibrant CLO IX, Ltd.: | | | |
| Series 2018-9A, Class C, 8.877%, (3 mo. SOFR + 3.462%), 7/20/31(1)(2) | | 2,500 | 2,231,463 |
| Security | Principal
Amount
(000's omitted) | Value |
| Vibrant CLO IX, Ltd.: (continued) | | | |
| Series 2018-9A, Class D, 11.927%, (3 mo. SOFR + 6.512%), 7/20/31(1)(2) | $ | 3,500 | $ 2,432,773 |
| Vibrant CLO X, Ltd.: | | | |
| Series 2018-10A, Class C, 8.927%, (3 mo. SOFR + 3.512%), 10/20/31(1)(2) | | 5,000 | 4,605,920 |
| Series 2018-10A, Class D, 11.867%, (3 mo. SOFR + 6.452%), 10/20/31(1)(2) | | 5,000 | 3,719,755 |
| Voya CLO, Ltd.: | | | |
| Series 2014-1A, Class DR2, 11.657%, (3 mo. SOFR + 6.262%), 4/18/31(1)(2) | | 3,250 | 2,613,543 |
| Series 2015-3A, Class CR, 8.827%, (3 mo. SOFR + 3.412%), 10/20/31(1)(2) | | 2,500 | 2,177,888 |
| Series 2015-3A, Class DR, 11.877%, (3 mo. SOFR + 6.462%), 10/20/31(1)(2) | | 5,500 | 4,405,318 |
| Series 2016-3A, Class CR, 8.907%, (3 mo. SOFR + 3.512%), 10/18/31(1)(2) | | 2,000 | 1,813,576 |
| Series 2016-3A, Class DR, 11.737%, (3 mo. SOFR + 6.342%), 10/18/31(1)(2) | | 2,375 | 1,880,140 |
| Webster Park CLO, Ltd.: | | | |
| Series 2015-1A, Class CR, 8.577%, (3 mo. SOFR + 3.162%), 7/20/30(1)(2) | | 2,000 | 1,925,990 |
| Series 2015-1A, Class DR, 11.177%, (3 mo. SOFR + 5.762%), 7/20/30(1)(2) | | 2,500 | 2,130,353 |
| Wellfleet CLO, Ltd.: | | | |
| Series 2021-3A, Class E, 12.756%, (3 mo. SOFR + 7.362%), 1/15/35(1)(2) | | 1,050 | 884,497 |
| Series 2022-1A, Class D, 9.534%, (3 mo. SOFR + 4.14%), 4/15/34(1)(2) | | 1,000 | 945,569 |
| Series 2022-1A, Class E, 13.254%, (3 mo. SOFR + 7.86%), 4/15/34(1)(2) | | 2,300 | 2,130,223 |
| Series 2022-2A, Class E, 13.955%, (3 mo. SOFR + 8.56%), 10/18/35(1)(2) | | 1,000 | 990,339 |
Total Asset-Backed Securities
(identified cost $315,618,680) | | | $ 287,354,466 |
| Security | Shares | Value |
| Aerospace and Defense — 0.0% |
| IAP Global Services, LLC(3)(4)(5) | | 168 | $ 0 |
| | | | $ 0 |
| Chemicals — 0.0% |
| Flint Campfire Topco, Ltd., Class A(3)(4)(5) | | 4,095,976 | $ 0 |
| | | | $ 0 |
| Commercial Services & Supplies — 0.1% |
| Monitronics International, Inc.(4)(5) | | 199,603 | $ 4,191,663 |
25
See Notes to Financial Statements.
Senior Debt Portfolio
October 31, 2023
Portfolio of Investments — continued
| Security | Shares | Value |
| Commercial Services & Supplies (continued) |
| Phoenix Services International, LLC(4)(5) | | 291,132 | $ 2,765,754 |
| Phoenix Services International, LLC(4)(5) | | 26,562 | 252,339 |
| | | | $ 7,209,756 |
| Containers and Glass Products — 0.0%(6) |
| LG Newco Holdco, Inc.(4)(5) | | 342,076 | $ 1,966,937 |
| | | | $ 1,966,937 |
| Electronics/Electrical — 0.0%(6) |
| Skillsoft Corp.(4)(5) | | 50,519 | $ 949,757 |
| | | | $ 949,757 |
| Entertainment — 0.1% |
| New Cineworld, Ltd.(4)(5) | | 113,548 | $ 2,427,088 |
| | | | $ 2,427,088 |
| Health Care — 0.0% |
| Akorn Holding Company, LLC(3)(4)(5) | | 792,089 | $ 0 |
| | | | $ 0 |
| Household Durables — 0.3% |
| Serta Simmons Bedding, Inc.(4)(5) | | 1,401,999 | $ 19,627,986 |
| Serta SSB Equipment Co.(3)(4)(5) | | 1,401,999 | 0 |
| | | | $ 19,627,986 |
| Investment Companies — 0.0%(6) |
| Aegletes B.V.(4)(5) | | 138,671 | $ 334,544 |
| Jubilee Topco, Ltd., Class A(3)(4) | | 2,563,805 | 0 |
| | | | $ 334,544 |
| Nonferrous Metals/Minerals — 0.1% |
| ACNR Holdings, Inc., Class A(4)(5) | | 30,298 | $ 2,590,479 |
| | | | $ 2,590,479 |
| Oil and Gas — 0.0%(6) |
| AFG Holdings, Inc.(3)(4)(5) | | 281,241 | $ 556,857 |
| McDermott International, Ltd.(4)(5) | | 1,382,889 | 373,380 |
| | | | $ 930,237 |
| Pharmaceuticals — 0.0%(6) |
| Covis Midco 1 S.a.r.l., Class A(4)(5) | | 8,349 | $ 4,258 |
| Covis Midco 1 S.a.r.l., Class B(4)(5) | | 8,349 | 4,258 |
| Covis Midco 1 S.a.r.l., Class C(4)(5) | | 8,349 | 4,258 |
| Security | Shares | Value |
| Pharmaceuticals (continued) |
| Covis Midco 1 S.a.r.l., Class D(4)(5) | | 8,349 | $ 4,258 |
| Covis Midco 1 S.a.r.l., Class E(4)(5) | | 8,349 | 4,258 |
| | | | $ 21,290 |
| Retailers (Except Food and Drug) — 0.0%(6) |
| Phillips Pet Holding Corp.(3)(4)(5) | | 2,960 | $ 117,617 |
| | | | $ 117,617 |
| Telecommunications — 0.0% |
| Global Eagle Entertainment(3)(4)(5) | | 390,679 | $ 0 |
| | | | $ 0 |
| Utilities — 0.1% |
| Longview Intermediate Holdings, LLC, Class A(4)(5) | | 359,046 | $ 2,897,502 |
| | | | $ 2,897,502 |
Total Common Stocks
(identified cost $79,555,952) | | | $ 39,073,193 |
| Security | Principal
Amount*
(000's omitted) | Value |
| Aerospace and Defense — 0.4% |
| TransDigm, Inc.: | | | |
| 6.25%, 3/15/26(1) | | 1,500 | $ 1,466,857 |
| 6.75%, 8/15/28(1) | | 3,825 | 3,718,792 |
| 6.875%, 12/15/30(1) | | 19,500 | 18,847,335 |
| | | | $ 24,032,984 |
| Air Transport — 0.6% |
| American Airlines, Inc./AAdvantage Loyalty IP, Ltd.: | | | |
| 5.50%, 4/20/26(1) | | 16,083 | $ 15,656,057 |
| 5.75%, 4/20/29(1) | | 14,475 | 13,071,356 |
| United Airlines, Inc.: | | | |
| 4.375%, 4/15/26(1) | | 5,050 | 4,689,478 |
| 4.625%, 4/15/29(1) | | 5,050 | 4,270,296 |
| | | | $ 37,687,187 |
| Automotive — 0.2% |
| Adient Global Holdings, Ltd., 7.00%, 4/15/28(1) | | 2,650 | $ 2,611,297 |
26
See Notes to Financial Statements.
Senior Debt Portfolio
October 31, 2023
Portfolio of Investments — continued
| Security | Principal
Amount*
(000's omitted) | Value |
| Automotive (continued) |
| Clarios Global, L.P., 6.75%, 5/15/25(1) | | 2,183 | $ 2,167,769 |
| Clarios Global, L.P./Clarios US Finance Co., 6.25%, 5/15/26(1) | | 4,478 | 4,382,269 |
| | | | $ 9,161,335 |
| Building and Development — 0.1% |
| Cushman & Wakefield U.S. Borrower, LLC, 6.75%, 5/15/28(1) | | 7,493 | $ 6,839,978 |
| Winnebago Industries, Inc., 6.25%, 7/15/28(1) | | 1,100 | 1,035,557 |
| | | | $ 7,875,535 |
| Business Equipment and Services — 1.0% |
| Allied Universal Holdco, LLC/Allied Universal Finance Corp., 6.625%, 7/15/26(1) | | 2,475 | $ 2,319,879 |
| Allied Universal Holdco, LLC/Allied Universal Finance Corp./Atlas Luxco 4 S.a.r.l.: | | | |
| 4.625%, 6/1/28(1) | | 20,725 | 16,908,433 |
| 4.625%, 6/1/28(1) | | 27,575 | 22,582,678 |
| Prime Security Services Borrower, LLC/Prime Finance, Inc., 5.75%, 4/15/26(1) | | 17,950 | 17,431,027 |
| | | | $ 59,242,017 |
| Chemicals — 0.5% |
| Cheever Escrow Issuer, LLC, 7.125%, 10/1/27(1) | | 1,075 | $ 990,825 |
| INEOS Finance PLC, 3.375%, 3/31/26(1) | EUR | 2,000 | 2,005,100 |
| INEOS Quattro Finance 2 PLC, 3.375%, 1/15/26(1) | | 5,464 | 5,223,966 |
| Olympus Water US Holding Corp.: | | | |
| 4.25%, 10/1/28(1) | | 10,050 | 8,029,649 |
| 9.75%, 11/15/28(1) | | 11,400 | 11,148,641 |
| | | | $ 27,398,181 |
| Commercial Services — 0.3% |
| Neptune Bidco U.S., Inc., 9.29%, 4/15/29(1) | | 21,600 | $ 19,083,354 |
| | | | $ 19,083,354 |
| Containers & Packaging — 0.2% |
| Pactiv Evergreen Group Issuer, Inc./Pactiv Evergreen Group Issuer, LLC: | | | |
| 4.00%, 10/15/27(1) | | 6,325 | $ 5,525,828 |
| 4.375%, 10/15/28(1) | | 10,100 | 8,603,411 |
| | | | $ 14,129,239 |
| Diversified Financial Services — 0.3% |
| AG Issuer, LLC, 6.25%, 3/1/28(1) | | 11,581 | $ 10,681,362 |
| Security | Principal
Amount*
(000's omitted) | Value |
| Diversified Financial Services (continued) |
| AG TTMT Escrow Issuer, LLC, 8.625%, 9/30/27(1) | | 3,350 | $ 3,368,827 |
| Aretec Escrow Issuer 2, Inc., 10.00%, 8/15/30(1)(7) | | 5,375 | 5,442,188 |
| | | | $ 19,492,377 |
| Diversified Telecommunication Services — 1.0% |
| Altice France S.A.: | | | |
| 5.125%, 1/15/29(1) | | 1,600 | $ 1,105,958 |
| 5.125%, 7/15/29(1) | | 55,000 | 37,694,052 |
| 5.50%, 10/15/29(1) | | 6,455 | 4,445,207 |
| Level 3 Financing, Inc., 3.875%, 11/15/29(1) | | 11,175 | 9,968,071 |
| Virgin Media Secured Finance PLC, 4.50%, 8/15/30(1) | | 7,625 | 6,296,649 |
| | | | $ 59,509,937 |
| Drugs — 0.1% |
| Jazz Securities DAC, 4.375%, 1/15/29(1) | | 10,050 | $ 8,748,862 |
| | | | $ 8,748,862 |
| Ecological Services and Equipment — 0.1% |
| GFL Environmental, Inc., 4.25%, 6/1/25(1) | | 6,025 | $ 5,798,269 |
| | | | $ 5,798,269 |
| Electronics/Electrical — 0.4% |
| GoTo Group, Inc., 5.50%, 9/1/27(1) | | 12,010 | $ 6,276,551 |
| Imola Merger Corp., 4.75%, 5/15/29(1) | | 20,200 | 17,627,694 |
| | | | $ 23,904,245 |
| Entertainment — 0.1% |
| Live Nation Entertainment, Inc., 3.75%, 1/15/28(1) | | 2,412 | $ 2,114,118 |
| Six Flags Theme Parks, Inc., 7.00%, 7/1/25(1) | | 1,208 | 1,200,812 |
| | | | $ 3,314,930 |
| Health Care — 0.7% |
| Medline Borrower, L.P., 3.875%, 4/1/29(1) | | 25,150 | $ 21,259,312 |
| Tenet Healthcare Corp., 4.25%, 6/1/29 | | 25,375 | 21,742,876 |
| | | | $ 43,002,188 |
| Hotels, Restaurants & Leisure — 0.6% |
| Carnival Corp., 4.00%, 8/1/28(1) | | 37,975 | $ 33,062,736 |
| SeaWorld Parks & Entertainment, Inc., 8.75%, 5/1/25(1) | | 2,425 | 2,460,126 |
| | | | $ 35,522,862 |
27
See Notes to Financial Statements.
Senior Debt Portfolio
October 31, 2023
Portfolio of Investments — continued
| Security | Principal
Amount*
(000's omitted) | Value |
| Household Products — 0.3% |
| Kronos Acquisition Holdings, Inc./KIK Custom Products, Inc., 5.00%, 12/31/26(1) | | 16,969 | $ 15,366,534 |
| | | | $ 15,366,534 |
| Insurance — 0.4% |
| Alliant Holdings Intermediate, LLC/Alliant Holdings Co., 4.25%, 10/15/27(1) | | 700 | $ 616,144 |
| NFP Corp.: | | | |
| 4.875%, 8/15/28(1) | | 7,025 | 6,158,031 |
| 7.50%, 10/1/30(1) | | 3,350 | 3,176,167 |
| 8.50%, 10/1/31(1) | | 10,725 | 10,555,187 |
| | | | $ 20,505,529 |
| Internet Software & Services — 0.3% |
| Central Parent, Inc./CDK Global, Inc., 7.25%, 6/15/29(1) | | 15,225 | $ 14,642,308 |
| | | | $ 14,642,308 |
| Leisure Goods/Activities/Movies — 0.4% |
| Lindblad Expeditions, LLC, 6.75%, 2/15/27(1) | | 3,475 | $ 3,169,825 |
| NCL Corp., Ltd., 5.875%, 2/15/27(1) | | 22,375 | 20,617,983 |
| | | | $ 23,787,808 |
| Machinery — 0.3% |
| Madison IAQ, LLC, 4.125%, 6/30/28(1) | | 12,300 | $ 10,286,928 |
| TK Elevator U.S. Newco, Inc., 5.25%, 7/15/27(1) | | 4,950 | 4,511,713 |
| | | | $ 14,798,641 |
| Media — 0.4% |
| iHeartCommunications, Inc.: | | | |
| 4.75%, 1/15/28(1) | | 2,975 | $ 2,107,986 |
| 5.25%, 8/15/27(1) | | 2,500 | 1,834,505 |
| 6.375%, 5/1/26 | | 1,159 | 946,222 |
| 8.375%, 5/1/27 | | 2,101 | 1,290,215 |
| Univision Communications, Inc.: | | | |
| 4.50%, 5/1/29(1) | | 10,075 | 8,019,739 |
| 7.375%, 6/30/30(1) | | 10,000 | 8,814,934 |
| | | | $ 23,013,601 |
| Oil, Gas & Consumable Fuels — 0.2% |
| CITGO Petroleum Corporation, 7.00%, 6/15/25(1) | | 12,175 | $ 11,975,879 |
| | | | $ 11,975,879 |
| Security | Principal
Amount*
(000's omitted) | Value |
| Professional Services — 0.1% |
| CoreLogic, Inc., 4.50%, 5/1/28(1) | | 6,000 | $ 4,761,360 |
| | | | $ 4,761,360 |
| Real Estate Investment Trusts (REITs) — 0.1% |
| Park Intermediate Holdings, LLC/PK Domestic Property, LLC/PK Finance Co-Issuer, 5.875%, 10/1/28(1) | | 7,925 | $ 7,145,576 |
| | | | $ 7,145,576 |
| Retail — 0.1% |
| Fertitta Entertainment, LLC/Fertitta Entertainment Finance Co., Inc., 4.625%, 1/15/29(1) | | 6,790 | $ 5,713,208 |
| | | | $ 5,713,208 |
| Retailers (Except Food and Drug) — 0.0%(6) |
| PetSmart, Inc./PetSmart Finance Corp., 4.75%, 2/15/28(1) | | 1,575 | $ 1,395,385 |
| | | | $ 1,395,385 |
| Software — 0.3% |
| Boxer Parent Co., Inc., 7.125%, 10/2/25(1) | | 4,850 | $ 4,789,375 |
| Cloud Software Group, Inc., 9.00%, 9/30/29(1) | | 12,100 | 10,315,311 |
| Veritas US, Inc./Veritas Bermuda, Ltd., 7.50%, 9/1/25(1) | | 4,000 | 3,277,710 |
| | | | $ 18,382,396 |
| Technology — 0.3% |
| Clarivate Science Holdings Corp., 3.875%, 7/1/28(1) | | 12,575 | $ 10,812,462 |
| NCR Atleos Escrow Corp., 9.50%, 4/1/29(1) | | 8,700 | 8,537,223 |
| | | | $ 19,349,685 |
| Telecommunications — 0.4% |
| LCPR Senior Secured Financing DAC, 5.125%, 7/15/29(1) | | 17,200 | $ 13,416,354 |
| VMED O2 UK Financing I PLC, 4.25%, 1/31/31(1) | | 10,575 | 8,328,044 |
| | | | $ 21,744,398 |
| Trading Companies & Distributors — 0.0%(6) |
| American Builders & Contractors Supply Co., Inc., 4.00%, 1/15/28(1) | | 875 | $ 786,373 |
| | | | $ 786,373 |
28
See Notes to Financial Statements.
Senior Debt Portfolio
October 31, 2023
Portfolio of Investments — continued
| Security | Principal
Amount*
(000's omitted) | Value |
| Wireless Telecommunication Services — 0.1% |
| Digicel International Finance, Ltd./Digicel International Holdings, Ltd., 8.75%, 5/25/24(1) | | 7,250 | $ 6,659,342 |
| | | | $ 6,659,342 |
Total Corporate Bonds
(identified cost $693,166,182) | | | $ 607,931,525 |
| Exchange-Traded Funds — 0.3% |
| Security | Shares | Value |
| SPDR Blackstone Senior Loan ETF | | 384,000 | $ 15,955,200 |
Total Exchange-Traded Funds
(identified cost $17,625,066) | | | $ 15,955,200 |
| Security | Shares | Value |
| Nonferrous Metals/Minerals — 0.1% |
| ACNR Holdings, Inc., 15.00% (PIK)(4)(5) | | 14,309 | $ 7,359,595 |
Total Preferred Stocks
(identified cost $0) | | | $ 7,359,595 |
| Senior Floating-Rate Loans — 108.6%(8) |
| Borrower/Description | Principal
Amount*
(000's omitted) | Value |
| Aerospace and Defense — 2.7% |
| Aernnova Aerospace S.A.U.: | | | |
| Term Loan, 6.783%, (3 mo. EURIBOR + 3.00%), 2/26/27 | EUR | 4,179 | $ 4,272,127 |
| Term Loan, 6.934%, (3 mo. EURIBOR + 3.00%), 2/26/27 | EUR | 1,071 | 1,095,417 |
| AI Convoy (Luxembourg) S.a.r.l., Term Loan, 7.722%, (3 mo. EURIBOR + 3.50%), 1/18/27 | EUR | 4,300 | 4,428,979 |
| Dynasty Acquisition Co., Inc.: | | | |
| Term Loan, 9.324%, (SOFR + 4.00%), 8/24/28 | | 37,242 | 36,875,857 |
| Term Loan, 9.324%, (SOFR + 4.00%), 8/24/28 | | 15,961 | 15,803,939 |
| IAP Worldwide Services, Inc., Term Loan - Second Lien, 12.152%, (3 mo. USD LIBOR + 6.50%), 7/18/23(3) | | 1,184 | 904,120 |
| TransDigm, Inc.: | | | |
| Term Loan, 8.64%, (SOFR + 3.25%), 2/22/27 | | 29,446 | 29,458,251 |
| Term Loan, 8.64%, (SOFR + 3.25%), 8/24/28 | | 34,729 | 34,722,348 |
| Borrower/Description | Principal
Amount*
(000's omitted) | Value |
| Aerospace and Defense (continued) |
| WP CPP Holdings, LLC, Term Loan, 9.29%, (SOFR + 3.75%), 4/30/25 | | 35,212 | $ 33,944,111 |
| | | | $ 161,505,149 |
| Airlines — 0.6% |
| American Airlines, Inc., Term Loan, 10.427%, (SOFR + 4.75%), 4/20/28 | | 32,400 | $ 32,900,742 |
| | | | $ 32,900,742 |
| Apparel & Luxury Goods — 0.1% |
| Hanesbrands, Inc., Term Loan, 9.074%, (SOFR + 3.75%), 3/8/30 | | 5,448 | $ 5,386,339 |
| | | | $ 5,386,339 |
| Auto Components — 2.3% |
| Adient US, LLC, Term Loan, 8.689%, (SOFR + 3.25%), 4/10/28 | | 7,981 | $ 7,990,709 |
| Autokiniton US Holdings, Inc., Term Loan, 9.939%, (SOFR + 4.50%), 4/6/28 | | ��� 22,289 | 21,889,252 |
| Clarios Global, L.P., Term Loan, 7.118%, (1 mo. EURIBOR + 3.25%), 4/30/26 | EUR | 21,261 | 22,432,920 |
| DexKo Global, Inc.: | | | |
| Term Loan, 7.972%, (3 mo. EURIBOR + 4.00%), 10/4/28 | EUR | 3,604 | 3,603,801 |
| Term Loan, 7.972%, (3 mo. EURIBOR + 4.00%), 10/4/28 | EUR | 8,046 | 8,045,089 |
| Term Loan, 9.402%, (SOFR + 3.75%), 10/4/28 | | 14,258 | 13,685,336 |
| Garrett LX I S.a.r.l., Term Loan, 8.895%, (SOFR + 3.25%), 4/30/28 | | 6,272 | 6,230,185 |
| Garrett Motion, Inc., Term Loan, 9.883%, (SOFR + 4.50%), 4/30/28 | | 9,429 | 9,452,143 |
| LSF12 Badger Bidco, LLC, Term Loan, 11.324%, (SOFR + 6.00%), 8/30/30 | | 4,000 | 3,995,000 |
| LTI Holdings, Inc.: | | | |
| Term Loan, 8.939%, (SOFR + 3.50%), 9/6/25 | | 8,073 | 7,715,307 |
| Term Loan, 10.189%, (SOFR + 4.75%), 7/24/26 | | 8,607 | 8,255,196 |
| RealTruck Group, Inc.: | | | |
| Term Loan, 9.189%, (SOFR + 3.75%), 1/31/28 | | 13,910 | 13,291,923 |
| Term Loan, 10.406%, (SOFR + 5.00%), 1/31/28 | | 8,950 | 8,583,605 |
| | | | $ 135,170,466 |
| Automobiles — 1.0% |
| Bombardier Recreational Products, Inc., Term Loan, 7.424%, (SOFR + 2.00%), 5/24/27 | | 35,185 | $ 34,921,139 |
| MajorDrive Holdings IV, LLC: | | | |
| Term Loan, 9.652%, (SOFR + 4.00%), 6/1/28 | | 20,362 | 19,835,689 |
29
See Notes to Financial Statements.
Senior Debt Portfolio
October 31, 2023
Portfolio of Investments — continued
| Borrower/Description | Principal
Amount*
(000's omitted) | Value |
| Automobiles (continued) |
| MajorDrive Holdings IV, LLC: (continued) | | | |
| Term Loan, 11.04%, (SOFR + 5.50%), 6/1/29 | | 1,496 | $ 1,483,111 |
| | | | $ 56,239,939 |
| Beverages — 0.6% |
| Arterra Wines Canada, Inc., Term Loan, 9.152%, (SOFR + 3.50%), 11/24/27 | | 3,404 | $ 3,222,564 |
| City Brewing Company, LLC, Term Loan, 9.164%, (SOFR + 3.50%), 4/5/28 | | 8,700 | 6,451,156 |
| Triton Water Holdings, Inc., Term Loan, 8.902%, (SOFR + 3.25%), 3/31/28 | | 25,515 | 24,247,685 |
| | | | $ 33,921,405 |
| Biotechnology — 0.5% |
| Alkermes, Inc., Term Loan, 7.949%, (SOFR + 2.50%), 3/12/26 | | 12,702 | $ 12,606,930 |
| Alltech, Inc., Term Loan, 9.439%, (SOFR + 4.00%), 10/13/28 | | 6,842 | 6,696,628 |
| Grifols Worldwide Operations USA, Inc., Term Loan, 7.424%, (SOFR + 2.00%), 11/15/27 | | 9,268 | 9,027,382 |
| | | | $ 28,330,940 |
| Building Products — 1.0% |
| Cornerstone Building Brands, Inc., Term Loan, 8.685%, (SOFR + 3.25%), 4/12/28 | | 17,967 | $ 17,132,640 |
| CPG International, Inc., Term Loan, 7.924%, (SOFR + 2.50%), 4/28/29 | | 14,801 | 14,798,650 |
| LHS Borrower, LLC, Term Loan, 10.174%, (SOFR + 4.75%), 2/16/29 | | 6,697 | 5,876,506 |
| MI Windows and Doors, LLC, Term Loan, 8.924%, (SOFR + 3.50%), 12/18/27 | | 6,351 | 6,358,445 |
| Standard Industries, Inc., Term Loan, 7.953%, (SOFR + 2.50%), 9/22/28 | | 13,029 | 13,063,965 |
| | | | $ 57,230,206 |
| Capital Markets — 6.0% |
| Advisor Group, Inc., Term Loan, 9.824%, (SOFR + 4.50%), 8/17/28 | | 31,480 | $ 31,397,521 |
| AllSpring Buyer, LLC, Term Loan, 8.949%, (SOFR + 3.25%), 11/1/28 | | 8,230 | 8,026,346 |
| Aretec Group, Inc.: | | | |
| Term Loan, 9.674%, (SOFR + 4.25%), 10/1/25 | | 25,515 | 25,529,243 |
| Term Loan, 9.924%, (SOFR + 4.50%), 8/9/30 | | 10,898 | 10,611,623 |
| Brookfield Property REIT, Inc., Term Loan, 7.924%, (SOFR + 2.50%), 8/27/25 | | 5,186 | 5,138,419 |
| CeramTec AcquiCo GmbH, Term Loan, 7.283%, (3 mo. EURIBOR + 3.50%), 3/16/29 | EUR | 14,461 | 14,957,464 |
| Borrower/Description | Principal
Amount*
(000's omitted) | Value |
| Capital Markets (continued) |
| Citadel Securities, L.P., Term Loan, 7.939%, (SOFR + 2.50%), 7/29/30 | | 9,682 | $ 9,667,338 |
| Citco Funding, LLC, Term Loan, 4/27/28(9) | | 10,425 | 10,444,547 |
| Clipper Acquisitions Corp., Term Loan, 7.192%, (SOFR + 1.75%), 3/3/28 | | 7,795 | 7,762,829 |
| Edelman Financial Center, LLC, Term Loan, 8.939%, (SOFR + 3.50%), 4/7/28 | | 22,283 | 21,937,845 |
| EIG Management Company, LLC, Term Loan, 9.177%, (SOFR + 3.75%), 2/22/25 | | 2,670 | 2,669,625 |
| FinCo I, LLC, Term Loan, 8.383%, (SOFR + 3.00%), 6/27/29 | | 16,284 | 16,292,330 |
| Focus Financial Partners, LLC: | | | |
| Term Loan, 7.824%, (SOFR + 2.50%), 6/30/28 | | 10,831 | 10,745,152 |
| Term Loan, 8.574%, (SOFR + 3.25%), 6/30/28 | | 27,453 | 27,380,762 |
| Term Loan, 8.824%, (SOFR + 3.50%), 6/30/28 | | 8,475 | 8,466,169 |
| Franklin Square Holdings, L.P., Term Loan, 7.674%, (SOFR + 2.25%), 8/1/25 | | 6,484 | 6,491,817 |
| Guggenheim Partners, LLC, Term Loan, 8.64%, (SOFR + 3.25%), 12/12/29 | | 32,353 | 32,366,485 |
| HighTower Holdings, LLC, Term Loan, 9.38%, (SOFR + 4.00%), 4/21/28 | | 9,264 | 9,107,225 |
| Hudson River Trading, LLC, Term Loan, 8.439%, (SOFR + 3.00%), 3/20/28 | | 29,737 | 29,353,712 |
| LPL Holdings, Inc., Term Loan, 7.165%, (SOFR + 1.75%), 11/12/26 | | 19,154 | 19,197,645 |
| Mariner Wealth Advisors, LLC, Term Loan, 8.901%, (SOFR + 3.25%), 8/18/28 | | 15,069 | 14,842,532 |
| Victory Capital Holdings, Inc.: | | | |
| Term Loan, 7.772%, (SOFR + 2.25%), 7/1/26 | | 18,707 | 18,697,902 |
| Term Loan, 7.772%, (SOFR + 2.25%), 12/29/28 | | 8,636 | 8,603,913 |
| | | | $ 349,688,444 |
| Chemicals — 6.0% |
| Axalta Coating Systems U.S. Holdings, Inc., Term Loan, 7.89%, (SOFR + 2.50%), 12/20/29 | | 21,207 | $ 21,268,762 |
| CPC Acquisition Corp., Term Loan, 9.402%, (SOFR + 3.75%), 12/29/27 | | 17,474 | 13,831,823 |
| Flint Group Midco Limited, Term Loan, 10.674%, (SOFR + 5.00%), 9.924% cash, 0.75% PIK, 12/31/26 | | 5,770 | 5,366,411 |
| Flint Group Packaging INKS North America Holdings, LLC: | | | |
| Term Loan, 9.002%, (3 mo. EURIBOR + 5.00%), 8.252% cash, 0.75% PIK, 12/31/26 | EUR | 1,283 | 1,262,388 |
| Term Loan, 11.002%, (3 mo. EURIBOR + 7.00%), 4.102% cash, 6.90% PIK, 12/31/27 | EUR | 623 | 482,565 |
| Term Loan - Second Lien, 11.002%, (3 mo. EURIBOR + 7.00%), 4.102% cash, 6.90% PIK, 12/31/27 | EUR | 830 | 158,868 |
30
See Notes to Financial Statements.
Senior Debt Portfolio
October 31, 2023
Portfolio of Investments — continued
| Borrower/Description | Principal
Amount*
(000's omitted) | Value |
| Chemicals (continued) |
| Flint Group Topco Limited: | | | |
| Term Loan, 12.674%, (SOFR + 7.00%), 5.774% cash, 6.90% PIK, 12/31/27 | | 2,814 | $ 2,061,038 |
| Term Loan - Second Lien, 12.674%, (SOFR + 7.00%), 5.774% cash, 6.90% PIK, 12/31/27 | | 3,752 | 678,526 |
| Gemini HDPE, LLC, Term Loan, 8.645%, (SOFR + 3.00%), 12/31/27 | | 5,681 | 5,671,942 |
| GEON Performance Solutions, LLC, Term Loan, 10.402%, (SOFR + 4.75%), 8/18/28 | | 7,620 | 7,467,817 |
| Groupe Solmax, Inc., Term Loan, 10.303%, (SOFR + 4.75%), 5/29/28(10) | | 19,874 | 18,616,633 |
| INEOS Enterprises Holdings II Limited, Term Loan, 7.783%, (3 mo. EURIBOR + 4.00%), 7/7/30 | EUR | 2,290 | 2,388,564 |
| INEOS Enterprises Holdings US Finco, LLC, Term Loan, 9.273%, (SOFR + 3.75%), 7/8/30 | | 14,000 | 13,708,338 |
| INEOS Finance PLC: | | | |
| Term Loan, 6.618%, (1 mo. EURIBOR + 2.75%), 11/8/28 | EUR | 9,675 | 9,830,829 |
| Term Loan, 7.868%, (1 mo. EURIBOR + 4.00%), 11/8/27 | EUR | 7,846 | 8,201,887 |
| INEOS Quattro Holdings UK, Ltd.: | | | |
| Term Loan, 6.622%, (1 week EURIBOR + 2.75%), 1/29/26 | EUR | 26,250 | 27,423,777 |
| Term Loan, 7.872%, (1 week EURIBOR + 4.00%), 3/14/30 | EUR | 4,075 | 4,177,016 |
| Term Loan, 9.174%, (SOFR + 3.75%), 3/14/30 | | 6,110 | 6,006,587 |
| INEOS Styrolution US Holding, LLC, Term Loan, 8.189%, (SOFR + 2.75%), 1/29/26 | | 12,578 | 12,379,268 |
| INEOS US Finance, LLC: | | | |
| Term Loan, 7.825%, (SOFR + 2.50%), 11/8/28 | | 6,768 | 6,623,744 |
| Term Loan, 8.924%, (SOFR + 3.50%), 2/18/30 | | 11,122 | 10,937,920 |
| Term Loan, 9.174%, (SOFR + 3.75%), 11/8/27 | | 3,422 | 3,385,364 |
| Kraton Corporation, Term Loan, 8.921%, (SOFR + 3.25%), 3/15/29 | | 6,132 | 5,848,037 |
| Kraton Polymers Holdings B.V., Term Loan, 7.217%, (EURIBOR + 3.25%), 3/15/29(10) | EUR | 4,650 | 4,739,759 |
| Lonza Group AG: | | | |
| Term Loan, 7.897%, (3 mo. EURIBOR + 3.93%), 7/3/28 | EUR | 9,600 | 8,778,846 |
| Term Loan, 9.415%, (SOFR + 3.93%), 7/3/28 | | 14,720 | 12,504,105 |
| Messer Industries GmbH: | | | |
| Term Loan, 6.368%, (1 mo. EURIBOR + 2.50%), 3/2/26 | EUR | 1,622 | 1,717,302 |
| Term Loan, 8.152%, (SOFR + 2.50%), 3/2/26 | | 7,900 | 7,902,468 |
| Momentive Performance Materials, Inc., Term Loan, 9.824%, (SOFR + 4.50%), 3/29/28 | | 16,122 | 15,396,143 |
| Olympus Water US Holding Corporation: | | | |
| Term Loan, 9.402%, (SOFR + 3.75%), 11/9/28 | | 4,438 | 4,336,305 |
| Term Loan, 9.99%, (SOFR + 4.50%), 11/9/28 | | 5,861 | 5,767,957 |
| Borrower/Description | Principal
Amount*
(000's omitted) | Value |
| Chemicals (continued) |
| Orion Engineered Carbons GmbH: | | | |
| Term Loan, 6.372%, (3 mo. EURIBOR + 2.40%), 9/24/28 | EUR | 1,250 | $ 1,325,932 |
| Term Loan, 7.64%, (SOFR + 2.15%), 9/24/28 | | 4,851 | 4,790,363 |
| PQ Corporation, Term Loan, 7.983%, (SOFR + 2.50%), 6/9/28 | | 25,204 | 25,085,595 |
| Rohm Holding GmbH: | | | |
| Term Loan, 8.472%, (6 mo. EURIBOR + 4.50%), 7/31/26 | EUR | 1,000 | 950,968 |
| Term Loan, 10.881%, (SOFR + 5.00%), 7/31/26 | | 17,350 | 16,034,260 |
| Term Loan, 7/31/26(9) | EUR | 13,700 | 13,028,257 |
| SCUR-Alpha 1503 GmbH, Term Loan, 10.883%, (SOFR + 5.50%), 3/29/30 | | 6,866 | 6,333,464 |
| Tronox Finance, LLC: | | | |
| Term Loan, 8.116%, (SOFR + 2.50%), 3/10/28(10) | | 12,836 | 12,611,521 |
| Term Loan, 8.64%, (SOFR + 3.25%), 4/4/29 | | 3,915 | 3,863,171 |
| Term Loan, 8.824%, (SOFR + 3.50%), 8/16/28 | | 6,425 | 6,344,688 |
| W.R. Grace & Co.-Conn., Term Loan, 9.402%, (SOFR + 3.75%), 9/22/28 | | 12,969 | 12,767,894 |
| | | | $ 352,057,102 |
| Commercial Services & Supplies — 2.0% |
| Asplundh Tree Expert, LLC, Term Loan, 7.174%, (SOFR + 1.75%), 9/7/27 | | 10,137 | $ 10,154,715 |
| Belfor Holdings, Inc.: | | | |
| Term Loan, 9.439%, (SOFR + 4.00%), 4/6/26 | | 2,261 | 2,261,479 |
| Term Loan, 9.574%, (SOFR + 4.25%), 4/6/26 | | 4,550 | 4,558,673 |
| Term Loan, 10/25/30(9) | | 8,425 | 8,425,000 |
| EnergySolutions, LLC, Term Loan, 9.382%, (SOFR + 4.00%), 9/20/30 | | 17,247 | 17,171,895 |
| Foundever Group, Term Loan, 7.62%, (1 mo. EURIBOR + 3.75%), 8/28/28 | EUR | 7,075 | 7,203,461 |
| GFL Environmental, Inc., Term Loan, 7.912%, (SOFR + 2.50%), 5/31/27 | | 4,322 | 4,330,513 |
| Harsco Corporation, Term Loan, 7.689%, (SOFR + 2.25%), 3/10/28 | | 1,301 | 1,271,273 |
| JFL-Tiger Acquisition Co., Inc., Term Loan, 10.403%, (SOFR + 5.00%), 10/17/30 | | 9,375 | 9,269,531 |
| LABL, Inc., Term Loan, 10.424%, (SOFR + 5.00%), 10/29/28 | | 9,358 | 8,841,846 |
| Monitronics International, Inc., Term Loan, 13.145%, (SOFR + 7.50%), 6/30/28 | | 11,001 | 11,125,052 |
| Phoenix Services International, LLC, Term Loan, 11.427%, (SOFR + 6.10%), 6/30/28 | | 3,500 | 3,264,012 |
| SITEL Worldwide Corporation, Term Loan, 9.189%, (SOFR + 3.75%), 8/28/28 | | 13,409 | 12,952,447 |
31
See Notes to Financial Statements.
Senior Debt Portfolio
October 31, 2023
Portfolio of Investments — continued
| Borrower/Description | Principal
Amount*
(000's omitted) | Value |
| Commercial Services & Supplies (continued) |
| Tempo Acquisition, LLC, Term Loan, 8.074%, (SOFR + 2.75%), 8/31/28 | | 4,199 | $ 4,200,072 |
| TMF Group Holding B.V., Term Loan, 10.414%, (SOFR + 5.00%), 5/3/28 | | 5,175 | 5,178,235 |
| TruGreen Limited Partnership, Term Loan, 9.424%, (SOFR + 4.00%), 11/2/27 | | 9,333 | 8,778,041 |
| | | | $ 118,986,245 |
| Communications Equipment — 0.1% |
| CommScope, Inc., Term Loan, 8.689%, (SOFR + 3.25%), 4/6/26 | | 4,484 | $ 3,883,445 |
| Digi International, Inc., Term Loan, 10.439%, (SOFR + 5.00%), 11/1/28 | | 4,547 | 4,549,057 |
| | | | $ 8,432,502 |
| Construction Materials — 0.3% |
| Quikrete Holdings, Inc.: | | | |
| Term Loan, 8.064%, (SOFR + 2.63%), 2/1/27 | | 4,742 | $ 4,740,346 |
| Term Loan, 8.189%, (SOFR + 2.75%), 3/19/29 | | 11,303 | 11,311,166 |
| | | | $ 16,051,512 |
| Consumer Staples Distribution & Retail — 0.5% |
| Cardenas Markets, Inc., Term Loan, 12.24%, (SOFR + 6.75%), 8/1/29 | | 5,373 | $ 5,373,536 |
| Peer Holding III B.V.: | | | |
| Term Loan, 7.722%, (3 mo. EURIBOR + 3.75%), 9/29/28 | EUR | 7,550 | 7,973,263 |
| Term Loan, 10/19/30(9) | | 14,625 | 14,570,156 |
| | | | $ 27,916,955 |
| Containers & Packaging — 2.0% |
| Berlin Packaging, LLC, Term Loan, 9.189%, (SOFR + 3.75%), 3/11/28(10) | | 9,681 | $ 9,474,244 |
| Clydesdale Acquisition Holdings, Inc., Term Loan, 9.599%, (SOFR + 4.18%), 4/13/29 | | 22,679 | 21,978,496 |
| Kouti B.V.: | | | |
| Term Loan, 7.458%, (3 mo. EURIBOR + 3.68%), 8/31/28 | EUR | 32,750 | 33,431,620 |
| Term Loan, 8.533%, (3 mo. EURIBOR + 4.75%), 8/31/28 | EUR | 2,000 | 2,099,007 |
| Pregis TopCo Corporation: | | | |
| Term Loan, 9.074%, (SOFR + 3.75%), 7/31/26 | | 2,334 | 2,314,312 |
| Term Loan, 9.189%, (SOFR + 3.75%), 7/31/26 | | 1,617 | 1,608,915 |
| Pretium Packaging, LLC, Term Loan - Second Lien, 9.995%, (SOFR + 4.60%), 10/2/28 | | 7,242 | 5,522,031 |
| Pretium PKG Holdings, Inc., Term Loan - Second Lien, 12.20%, (SOFR + 6.75%), 10/1/29(10) | | 7,100 | 3,150,625 |
| Borrower/Description | Principal
Amount*
(000's omitted) | Value |
| Containers & Packaging (continued) |
| Proampac PG Borrower, LLC, Term Loan, 10.585%, (SOFR + 4.50%), 9/15/28 | | 15,000 | $ 14,843,745 |
| Trident TPI Holdings, Inc.: | | | |
| Term Loan, 9.652%, (SOFR + 4.00%), 9/15/28 | | 6,496 | 6,425,228 |
| Term Loan, 9.89%, (SOFR + 4.50%), 9/15/28 | | 17,532 | 17,488,562 |
| | | | $ 118,336,785 |
| Distributors — 0.1% |
| Phillips Feed Service, Inc., Term Loan, 12.427%, (SOFR + 7.00%), 11/13/24(3) | | 538 | $ 430,363 |
| Winterfell Financing S.a.r.l., Term Loan, 8.765%, (3 mo. EURIBOR + 5.00%), 5/4/28 | EUR | 2,500 | 2,595,652 |
| | | | $ 3,026,015 |
| Diversified Consumer Services — 1.0% |
| Ascend Learning, LLC: | | | |
| Term Loan, 8.924%, (SOFR + 3.50%), 12/11/28 | | 12,471 | $ 11,641,244 |
| Term Loan - Second Lien, 11.174%, (SOFR + 5.75%), 12/10/29 | | 5,243 | 4,473,864 |
| Belron Finance US, LLC, Term Loan, 8.057%, (SOFR + 2.43%), 4/13/28 | | 8,507 | 8,516,445 |
| FrontDoor, Inc., Term Loan, 7.689%, (SOFR + 2.25%), 6/17/28 | | 953 | 950,382 |
| KUEHG Corp., Term Loan, 10.39%, (SOFR + 5.00%), 6/12/30 | | 18,250 | 18,258,139 |
| Sotheby's, Term Loan, 10.156%, (SOFR + 4.50%), 1/15/27 | | 10,422 | 10,122,566 |
| Spring Education Group, Inc., Term Loan, 9.914%, (SOFR + 4.50%), 10/4/30 | | 4,725 | 4,679,720 |
| | | | $ 58,642,360 |
| Diversified Financial Services — 0.1% |
| Concorde Midco, Ltd., Term Loan, 7.892%, (6 mo. EURIBOR + 4.00%), 3/1/28 | EUR | 7,480 | $ 7,799,172 |
| | | | $ 7,799,172 |
| Diversified Telecommunication Services — 1.0% |
| CenturyLink, Inc., Term Loan, 7.689%, (SOFR + 2.25%), 3/15/27 | | 28,655 | $ 21,603,167 |
| GEE Holdings 2, LLC: | | | |
| Term Loan, 13.50%, (SOFR + 8.25%), 3/24/25 | | 9,869 | 8,980,646 |
| Term Loan - Second Lien, 13.75%, (SOFR + 8.25%), 7.00% cash, 6.75% PIK, 3/23/26 | | 7,607 | 4,564,183 |
| Level 3 Financing, Inc., Term Loan, 7.189%, (SOFR + 1.75%), 3/1/27 | | 11,500 | 10,816,532 |
| Telenet Financing USD, LLC, Term Loan, 7.449%, (SOFR + 2.00%), 4/30/28 | | 5,075 | 4,941,781 |
32
See Notes to Financial Statements.
Senior Debt Portfolio
October 31, 2023
Portfolio of Investments — continued
| Borrower/Description | Principal
Amount*
(000's omitted) | Value |
| Diversified Telecommunication Services (continued) |
| Virgin Media Bristol, LLC, Term Loan, 7.949%, (SOFR + 2.50%), 1/31/28 | | 4,843 | $ 4,714,101 |
| Virgin Media SFA Finance Limited, Term Loan, 6.372%, (1 mo. EURIBOR + 2.50%), 1/31/29 | EUR | 1,125 | 1,149,975 |
| | | | $ 56,770,385 |
| Electronic Equipment, Instruments & Components — 1.3% |
| Creation Technologies, Inc., Term Loan, 11.176%, (SOFR + 5.50%), 10/5/28 | | 15,513 | $ 14,699,003 |
| II-VI Incorporated, Term Loan, 8.189%, (SOFR + 2.75%), 7/2/29 | | 1,474 | 1,472,919 |
| Ingram Micro, Inc., Term Loan, 8.653%, (SOFR + 3.00%), 6/30/28 | | 4,481 | 4,481,233 |
| Minimax Viking GmbH, Term Loan, 7.133%, (EURIBOR + 3.25%), 7/31/28(10) | EUR | 3,984 | 4,215,437 |
| Mirion Technologies, Inc., Term Loan, 8.402%, (SOFR + 2.75%), 10/20/28 | | 2,350 | 2,346,099 |
| MX Holdings US, Inc., Term Loan, 7/31/28(9) | | 3,350 | 3,343,719 |
| Robertshaw US Holding Corp.: | | | |
| Term Loan, 13.49%, (SOFR + 8.00%), 8.490% cash, 5.00% PIK, 2/28/27 | | 4,853 | 4,901,278 |
| Term Loan - Second Lien, 12.49%, (SOFR + 7.00%), 2/28/27 | | 20,495 | 17,317,867 |
| TTM Technologies, Inc., Term Loan, 8.065%, (SOFR + 2.75%), 5/30/30 | | 6,983 | 6,986,864 |
| Verifone Systems, Inc., Term Loan, 9.653%, (SOFR + 4.00%), 8/20/25 | | 20,407 | 19,013,339 |
| | | | $ 78,777,758 |
| Energy Equipment & Services — 0.5% |
| Ameriforge Group, Inc.: | | | |
| Term Loan, 16.731%, (SOFR + 13.00%), 12/29/23(3)(11) | | 2,245 | $ 1,791,244 |
| Term Loan, 18.456%, (SOFR + 13.00%), 12/29/23(3)(10) | | 17,625 | 14,061,537 |
| GIP Pilot Acquisition Partners L.P., Term Loan, 8.388%, (SOFR + 3.00%), 10/4/30 | | 6,250 | 6,250,000 |
| Lealand Finance Company B.V.: | | | |
| Letter of Credit, 3.638%, 6/28/24(11) | | 10,000 | 7,450,000 |
| Term Loan, 12.439%, (SOFR + 7.00%), 9.439% cash, 3.00% PIK, 6/30/25 | | 3,435 | 1,914,859 |
| | | | $ 31,467,640 |
| Engineering & Construction — 1.2% |
| Aegion Corporation, Term Loan, 10.395%, (SOFR + 4.75%), 5/17/28 | | 17,680 | $ 17,581,008 |
| American Residential Services, LLC, Term Loan, 9.152%, (SOFR + 3.50%), 10/15/27 | | 8,445 | 8,434,845 |
| Borrower/Description | Principal
Amount*
(000's omitted) | Value |
| Engineering & Construction (continued) |
| APi Group DE, Inc.: | | | |
| Term Loan, 7.689%, (SOFR + 2.25%), 10/1/26 | | 11,043 | $ 11,059,970 |
| Term Loan, 7.939%, (SOFR + 2.50%), 1/3/29 | | 5,176 | 5,186,926 |
| Centuri Group, Inc., Term Loan, 7.939%, (SOFR + 2.50%), 8/27/28 | | 9,144 | 9,137,183 |
| Northstar Group Services, Inc.: | | | |
| Term Loan, 10.939%, (SOFR + 5.50%), 11/12/26 | | 12,962 | 12,962,369 |
| Term Loan, 10.949%, (SOFR + 5.50%), 11/12/26 | | 1,963 | 1,957,594 |
| USIC Holdings, Inc., Term Loan, 8.939%, (SOFR + 3.50%), 5/12/28 | | 6,177 | 5,974,312 |
| | | | $ 72,294,207 |
| Entertainment — 1.3% |
| City Football Group Limited, Term Loan, 8.453%, (SOFR + 3.00%), 7/21/28 | | 12,001 | $ 11,910,884 |
| Crown Finance US, Inc., Term Loan, 7.381%, (SOFR + 1.50%), 7/31/28 | | 2,461 | 2,517,188 |
| Delta 2 (LUX) S.a.r.l., Term Loan, 7.574%, (SOFR + 2.25%), 1/15/30 | | 2,500 | 2,493,750 |
| EP Purchaser, LLC, Term Loan, 9.152%, (SOFR + 3.50%), 11/6/28 | | 997 | 973,467 |
| Playtika Holding Corp., Term Loan, 8.189%, (SOFR + 2.75%), 3/13/28 | | 27,261 | 26,490,582 |
| Renaissance Holding Corp.: | | | |
| Term Loan, 10.074%, (SOFR + 4.75%), 4/5/30 | | 13,750 | 13,580,985 |
| Term Loan - Second Lien, 12.424%, (SOFR + 7.00%), 5/29/26 | | 143 | 142,251 |
| UFC Holdings, LLC, Term Loan, 8.399%, (SOFR + 2.75%), 4/29/26 | | 14,700 | 14,704,284 |
| Vue International Bidco PLC: | | | |
| Term Loan, 12.13%, (6 mo. EURIBOR + 8.00%), 6/30/27 | EUR | 384 | 397,980 |
| Term Loan, 12.63%, (6 mo. EURIBOR + 8.50%), 6.13% cash, 6.50% PIK, 12/31/27 | EUR | 2,682 | 1,266,375 |
| | | | $ 74,477,746 |
| Equity Real Estate Investment Trusts (REITs) — 0.2% |
| Iron Mountain, Inc., Term Loan, 7.189%, (1 mo. USD LIBOR + 1.75%), 1/2/26 | | 8,954 | $ 8,945,476 |
| | | | $ 8,945,476 |
| Financial Services — 1.2% |
| Ditech Holding Corporation, Term Loan, 0.00%, 3/28/24(12) | | 15,063 | $ 1,656,959 |
| GTCR W Merger Sub, LLC: | | | |
| Term Loan, 9/20/30(9) | | 38,850 | 38,614,142 |
| Term Loan, 9/20/30(9) | EUR | 1,000 | 1,056,778 |
33
See Notes to Financial Statements.
Senior Debt Portfolio
October 31, 2023
Portfolio of Investments — continued
| Borrower/Description | Principal
Amount*
(000's omitted) | Value |
| Financial Services (continued) |
| NCR Atleos, LLC, Term Loan, 10.176%, (SOFR + 4.75%), 3/27/29 | | 17,400 | $ 16,707,619 |
| Walker & Dunlop, Inc., Term Loan, 7.674%, (SOFR + 2.25%), 12/16/28 | | 13,976 | 13,952,764 |
| | | | $ 71,988,262 |
| Food Products — 1.5% |
| 8th Avenue Food & Provisions, Inc., Term Loan, 10.189%, (SOFR + 4.75%), 10/1/25 | | 7,252 | $ 6,868,246 |
| Badger Buyer Corp., Term Loan, 8.939%, (SOFR + 3.50%), 9/30/24 | | 9,493 | 8,128,089 |
| CHG PPC Parent, LLC, Term Loan, 8.439%, (SOFR + 3.00%), 12/8/28 | | 6,230 | 6,167,415 |
| Del Monte Foods, Inc., Term Loan, 9.682%, (SOFR + 4.25%), 5/16/29 | | 6,559 | 6,363,627 |
| Froneri International, Ltd.: | | | |
| Term Loan, 6.097%, (6 mo. EURIBOR + 2.13%), 1/29/27 | EUR | 1,500 | 1,544,637 |
| Term Loan, 7.674%, (SOFR + 2.25%), 1/29/27 | | 8,706 | 8,658,385 |
| Monogram Food Solutions, LLC, Term Loan, 9.439%, (SOFR + 4.00%), 8/28/28 | | 1,770 | 1,725,344 |
| Nomad Foods US, LLC, Term Loan, 8.469%, (SOFR + 3.00%), 11/13/29 | | 14,174 | 14,188,228 |
| Sovos Brands Intermediate, Inc., Term Loan, 9.145%, (SOFR + 3.50%), 6/8/28 | | 9,191 | 9,211,337 |
| United Petfood Group B.V., Term Loan, 6.852%, (6 mo. EURIBOR + 2.75%), 4/23/28 | EUR | 9,025 | 9,326,540 |
| Valeo F1 Company Limited (Ireland): | | | |
| Term Loan, 8.136%, (6 mo. EURIBOR + 4.00%), 9/29/28 | EUR | 9,450 | 9,002,713 |
| Term Loan, 10.186%, (SONIA + 5.00%), 6/28/28 | GBP | 5,500 | 5,755,760 |
| | | | $ 86,940,321 |
| Gas Utilities — 0.4% |
| CQP Holdco, L.P., Term Loan, 8.99%, (SOFR + 3.50%), 6/5/28 | | 24,456 | $ 24,463,147 |
| | | | $ 24,463,147 |
| Health Care Equipment & Supplies — 1.5% |
| Artivion, Inc., Term Loan, 8.939%, (SOFR + 3.50%), 6/1/27 | | 6,506 | $ 6,313,523 |
| Bayou Intermediate II, LLC, Term Loan, 10.128%, (SOFR + 4.50%), 8/2/28 | | 9,093 | 8,729,125 |
| Gloves Buyer, Inc., Term Loan, 9.439%, (SOFR + 4.00%), 12/29/27 | | 18,261 | 17,621,459 |
| ICU Medical, Inc., Term Loan, 8.04%, (SOFR + 2.50%), 1/8/29 | | 7,979 | 7,962,711 |
| Borrower/Description | Principal
Amount*
(000's omitted) | Value |
| Health Care Equipment & Supplies (continued) |
| Journey Personal Care Corp., Term Loan, 9.981%, (6 mo. USD LIBOR + 4.25%), 3/1/28 | | 28,647 | $ 27,545,920 |
| Medline Borrower, L.P.: | | | |
| Term Loan, 7.368%, (1 mo. EURIBOR + 3.50%), 10/23/28 | EUR | 1,000 | 1,049,172 |
| Term Loan, 8.689%, (SOFR + 3.25%), 10/23/28 | | 19,227 | 19,117,396 |
| | | | $ 88,339,306 |
| Health Care Providers & Services — 5.8% |
| AEA International Holdings (Lux) S.a.r.l., Term Loan, 9.402%, (SOFR + 3.75%), 9/7/28 | | 14,860 | $ 14,822,854 |
| BW NHHC Holdco, Inc., Term Loan - Second Lien, 13.39%, (SOFR + 8.00%), 1/15/26 | | 19,042 | 16,281,321 |
| Cano Health, LLC, Term Loan, 9.533%, (SOFR + 4.00%), 11/23/27(10) | | 7,609 | 4,489,209 |
| CCRR Parent, Inc., Term Loan, 9.189%, (SOFR + 3.75%), 3/6/28 | | 5,235 | 4,986,479 |
| Cerba Healthcare S.A.S.: | | | |
| Term Loan, 7.583%, (1 mo. EURIBOR + 3.70%), 6/30/28 | EUR | 20,800 | 20,475,749 |
| Term Loan, 7.883%, (1 mo. EURIBOR + 4.00%), 2/16/29 | EUR | 8,600 | 8,584,012 |
| CHG Healthcare Services, Inc.: | | | |
| Term Loan, 8.689%, (SOFR + 3.25%), 9/29/28 | | 7,863 | 7,787,950 |
| Term Loan, 9.145%, (SOFR + 3.75%), 9/29/28 | | 5,275 | 5,234,340 |
| Covis Finco S.a.r.l.: | | | |
| Term Loan, 9.90%, (SOFR + 4.50%), 2/18/27 | | 4,368 | 4,193,458 |
| Term Loan, 12.04%, (SOFR + 6.50%), 2/18/27 | | 10,270 | 7,394,694 |
| Dedalus Finance GmbH, Term Loan, 7.712%, (6 mo. EURIBOR + 3.75%), 7/17/27 | EUR | 14,150 | 14,290,349 |
| Elsan S.A.S., Term Loan, 7.39%, (6 mo. EURIBOR + 3.35%), 6/16/28 | EUR | 4,150 | 4,259,110 |
| Ensemble RCM, LLC, Term Loan, 9.233%, (SOFR + 3.75%), 8/3/26 | | 8,401 | 8,407,777 |
| Envision Healthcare Corporation: | | | |
| Term Loan, 0.00%, 3/31/27(12) | | 6,718 | 7,994,599 |
| Term Loan - Second Lien, 0.00%, 3/31/27(12) | | 47,025 | 8,229,435 |
| IVC Acquisition, Ltd., Term Loan, 7.687%, (6 mo. EURIBOR + 4.00%), 2/13/26 | EUR | 20,825 | 21,832,944 |
| Medical Solutions Holdings, Inc.: | | | |
| Term Loan, 8.773%, (SOFR + 3.25%), 11/1/28 | | 15,174 | 14,181,313 |
| Term Loan - Second Lien, 12.523%, (SOFR + 7.00%), 11/1/29 | | 9,500 | 8,478,750 |
| Mehilainen Yhtiot Oy, Term Loan, 7.497%, (3 mo. EURIBOR + 3.53%), 8/8/25 | EUR | 6,475 | 6,847,986 |
| Midwest Physician Administrative Services, LLC, Term Loan, 8.902%, (SOFR + 3.25%), 3/12/28 | | 10,030 | 9,425,688 |
34
See Notes to Financial Statements.
Senior Debt Portfolio
October 31, 2023
Portfolio of Investments — continued
| Borrower/Description | Principal
Amount*
(000's omitted) | Value |
| Health Care Providers & Services (continued) |
| National Mentor Holdings, Inc.: | | | |
| Term Loan, 9.187%, (SOFR + 3.75%), 3/2/28(10) | | 15,735 | $ 13,781,060 |
| Term Loan, 9.24%, (SOFR + 3.75%), 3/2/28 | | 438 | 383,336 |
| Term Loan - Second Lien, 12.74%, (SOFR + 7.25%), 3/2/29 | | 6,475 | 4,516,313 |
| Phoenix Guarantor, Inc.: | | | |
| Term Loan, 8.689%, (SOFR + 3.25%), 3/5/26 | | 24,054 | 23,846,845 |
| Term Loan, 8.939%, (SOFR + 3.50%), 3/5/26 | | 4,434 | 4,395,794 |
| Radiology Partners, Inc., Term Loan, 10.179%, (SOFR + 4.25%), 7/9/25 | | 17,020 | 12,754,055 |
| Ramsay Generale de Sante S.A., Term Loan, 6.952%, (3 mo. EURIBOR + 2.95%), 4/22/27 | EUR | 7,400 | 7,826,027 |
| Select Medical Corporation, Term Loan, 8.324%, (SOFR + 3.00%), 3/6/27 | | 56,317 | 56,237,577 |
| Sound Inpatient Physicians, Term Loan, 8.645%, (SOFR + 3.00%), 6/27/25 | | 2,566 | 856,061 |
| Synlab Bondco PLC, Term Loan, 6.392%, (6 mo. EURIBOR + 2.50%), 7/1/27 | EUR | 2,600 | 2,724,408 |
| TTF Holdings, LLC, Term Loan, 9.439%, (SOFR + 4.00%), 3/31/28 | | 5,644 | 5,651,378 |
| U.S. Anesthesia Partners, Inc., Term Loan, 9.679%, (SOFR + 4.25%), 10/1/28 | | 9,419 | 8,215,082 |
| | | | $ 339,385,953 |
| Health Care Technology — 1.7% |
| Certara, L.P., Term Loan, 9.184%, (SOFR + 3.50%), 8/15/26 | | 9,283 | $ 9,294,499 |
| eResearchTechnology, Inc., Term Loan, 9.939%, (SOFR + 4.50%), 2/4/27 | | 9,562 | 9,257,424 |
| Imprivata, Inc.: | | | |
| Term Loan, 9.189%, (SOFR + 3.75%), 12/1/27 | | 15,197 | 15,158,512 |
| Term Loan, 9.574%, (SOFR + 4.25%), 12/1/27 | | 3,580 | 3,581,180 |
| MedAssets Software Intermediate Holdings, Inc.: | | | |
| Term Loan, 9.439%, (SOFR + 4.00%), 12/18/28 | | 17,533 | 13,916,819 |
| Term Loan - Second Lien, 12.189%, (SOFR + 6.75%), 12/17/29 | | 9,625 | 5,849,594 |
| Navicure, Inc., Term Loan, 9.439%, (SOFR + 4.00%), 10/22/26 | | 10,028 | 10,036,341 |
| PointClickCare Technologies, Inc., Term Loan, 8.76%, (SOFR + 3.00%), 12/29/27 | | 4,288 | 4,282,650 |
| Symplr Software, Inc., Term Loan, 9.983%, (SOFR + 4.50%), 12/22/27 | | 11,445 | 10,064,454 |
| Verscend Holding Corp., Term Loan, 9.439%, (SOFR + 4.00%), 8/27/25 | | 21,362 | 21,377,130 |
| | | | $ 102,818,603 |
| Borrower/Description | Principal
Amount*
(000's omitted) | Value |
| Hotels, Restaurants & Leisure — 5.2% |
| 1011778 B.C. Unlimited Liability Company, Term Loan, 7.574%, (SOFR + 2.25%), 9/20/30 | | 45,515 | $ 45,252,796 |
| Bally's Corporation, Term Loan, 8.927%, (SOFR + 3.25%), 10/2/28 | | 3,834 | 3,588,037 |
| Carnival Corporation: | | | |
| Term Loan, 7.618%, (1 mo. EURIBOR + 3.75%), 6/30/25 | EUR | 9,546 | 10,116,261 |
| Term Loan, 8.689%, (SOFR + 3.25%), 10/18/28 | | 39,988 | 39,321,274 |
| ClubCorp Holdings, Inc., Term Loan, 8.19%, (1 mo. USD LIBOR + 2.75%), 9/18/26 | | 22,314 | 21,876,990 |
| Fertitta Entertainment, LLC, Term Loan, 9.324%, (SOFR + 4.00%), 1/27/29 | | 29,627 | 29,022,275 |
| Great Canadian Gaming Corporation, Term Loan, 9.658%, (SOFR + 4.00%), 11/1/26 | | 9,643 | 9,647,105 |
| GVC Holdings (Gibraltar) Limited, Term Loan, 7.722%, (3 mo. EURIBOR + 3.75%), 6/30/28 | EUR | 21,325 | 22,549,886 |
| Ontario Gaming GTA L.P., Term Loan, 9.64%, (SOFR + 4.25%), 8/1/30 | | 12,025 | 12,030,363 |
| Oravel Stays Singapore Pte., Ltd., Term Loan, 13.908%, (SOFR + 8.25%), 6/23/26 | | 5,914 | 5,233,780 |
| Playa Resorts Holding B.V., Term Loan, 9.585%, (SOFR + 4.25%), 1/5/29 | | 39,680 | 39,605,144 |
| Scientific Games Holdings, L.P., Term Loan, 7.964%, (3 mo. EURIBOR + 4.00%), 4/4/29 | EUR | 1,000 | 1,045,139 |
| Scientific Games International, Inc., Term Loan, 8.435%, (SOFR + 3.00%), 4/14/29 | | 7,885 | 7,886,525 |
| SeaWorld Parks & Entertainment, Inc., Term Loan, 8.439%, (SOFR + 3.00%), 8/25/28 | | 13,295 | 13,289,695 |
| Stars Group Holdings B.V. (The): | | | |
| Term Loan, 6.358%, (3 mo. EURIBOR + 2.50%), 7/21/26 | EUR | 12,305 | 13,034,257 |
| Term Loan, 7.902%, (SOFR + 2.25%), 7/21/26 | | 32,829 | 32,847,479 |
| | | | $ 306,347,006 |
| Household Durables — 1.2% |
| ACProducts, Inc., Term Loan, 9.902%, (SOFR + 4.25%), 5/17/28 | | 20,377 | $ 16,250,630 |
| Libbey Glass, Inc., Term Loan, 11.939%, (SOFR + 6.50%), 11/22/27 | | 19,909 | 18,963,452 |
| Serta Simmons Bedding, LLC, Term Loan, 12.90%, (SOFR + 7.50%), 6/29/28 | | 20,679 | 20,480,448 |
| Solis IV B.V., Term Loan, 8.891%, (SOFR + 3.50%), 2/26/29 | | 17,967 | 17,001,560 |
| | | | $ 72,696,090 |
| Household Products — 0.5% |
| Energizer Holdings, Inc., Term Loan, 7.703%, (SOFR + 2.25%), 12/22/27 | | 7,185 | $ 7,181,370 |
35
See Notes to Financial Statements.
Senior Debt Portfolio
October 31, 2023
Portfolio of Investments — continued
| Borrower/Description | Principal
Amount*
(000's omitted) | Value |
| Household Products (continued) |
| Kronos Acquisition Holdings, Inc.: | | | |
| Term Loan, 9.402%, (SOFR + 3.75%), 12/22/26 | | 9,807 | $ 9,628,496 |
| Term Loan, 11.567%, (SOFR + 6.00%), 12/22/26 | | 5,649 | 5,649,375 |
| Nobel Bidco B.V., Term Loan, 7.27%, (6 mo. EURIBOR + 3.50%), 9/1/28 | EUR | 9,050 | 8,831,020 |
| | | | $ 31,290,261 |
| Independent Power and Renewable Electricity Producers — 0.3% |
| Calpine Construction Finance Company L.P., Term Loan, 7.574%, (SOFR + 2.25%), 7/31/30 | | 10,519 | $ 10,445,606 |
| Calpine Corporation: | | | |
| Term Loan, 7.439%, (SOFR + 2.00%), 4/5/26 | | 3,174 | 3,174,829 |
| Term Loan, 7.939%, (SOFR + 2.50%), 12/16/27 | | 3,693 | 3,693,777 |
| | | | $ 17,314,212 |
| Industrial Conglomerates — 0.5% |
| Ammeraal Beltech Holding B.V., Term Loan, 8.972%, (3 mo. EURIBOR + 5.00%), 12/30/28 | EUR | 10,775 | $ 11,375,378 |
| Rain Carbon GmbH, Term Loan, 8.787%, (3 mo. EURIBOR + 5.00%), 10/31/28 | EUR | 15,875 | 16,713,131 |
| | | | $ 28,088,509 |
| Insurance — 2.2% |
| Alliant Holdings Intermediate, LLC: | | | |
| Term Loan, 8.835%, (SOFR + 3.50%), 11/5/27 | | 2,873 | $ 2,867,134 |
| Term Loan, 8.939%, (1 mo. USD LIBOR + 3.50%), 11/5/27 | | 13,967 | 13,939,991 |
| AmWINS Group, Inc.: | | | |
| Term Loan, 7.689%, (SOFR + 2.25%), 2/19/28 | | 11,302 | 11,221,190 |
| Term Loan, 8.189%, (SOFR + 2.75%), 2/19/28 | | 15,419 | 15,405,171 |
| AssuredPartners, Inc.: | | | |
| Term Loan, 8.824%, (SOFR + 3.50%), 2/12/27 | | 5,294 | 5,254,005 |
| Term Loan, 2/12/27(9) | | 13,000 | 12,909,273 |
| Financiere CEP S.A.S., Term Loan, 7.722%, (3 mo. EURIBOR + 3.75%), 6/18/27 | EUR | 5,242 | 5,463,733 |
| HUB International Limited, Term Loan, 9.662%, (SOFR + 4.25%), 6/20/30 | | 17,758 | 17,773,218 |
| NFP Corp., Term Loan, 8.689%, (SOFR + 3.25%), 2/16/27 | | 27,630 | 27,150,532 |
| Ryan Specialty Group, LLC, Term Loan, 8.424%, (SOFR + 3.00%), 9/1/27 | | 9,814 | 9,823,534 |
| USI, Inc., Term Loan, 9/27/30(9) | | 9,050 | 9,017,945 |
| | | | $ 130,825,726 |
| Borrower/Description | Principal
Amount*
(000's omitted) | Value |
| Interactive Media & Services — 0.7% |
| Adevinta ASA: | | | |
| Term Loan, 6.472%, (3 mo. EURIBOR + 2.50%), 6/26/28 | EUR | 6,799 | $ 7,198,200 |
| Term Loan, 8.322%, (SOFR + 2.75%), 6/26/28 | | 3,626 | 3,631,613 |
| Buzz Finco, LLC: | | | |
| Term Loan, 8.174%, (SOFR + 2.75%), 1/29/27 | | 2,734 | 2,735,571 |
| Term Loan, 8.674%, (SOFR + 3.25%), 1/29/27 | | 549 | 549,527 |
| Foundational Education Group, Inc., Term Loan, 9.895%, (SOFR + 4.25%), 8/31/28 | | 3,558 | 3,326,786 |
| Getty Images, Inc.: | | | |
| Term Loan, 9.00%, (3 mo. EURIBOR + 5.00%), 2/19/26 | EUR | 2,224 | 2,348,783 |
| Term Loan, 9.99%, (SOFR + 4.50%), 2/19/26 | | 15,075 | 15,127,062 |
| Match Group, Inc., Term Loan, 7.298%, (SOFR + 1.75%), 2/13/27 | | 7,625 | 7,603,558 |
| | | | $ 42,521,100 |
| IT Services — 5.8% |
| Asurion, LLC: | | | |
| Term Loan, 8.689%, (SOFR + 3.25%), 12/23/26 | | 5,407 | $ 5,233,905 |
| Term Loan, 8.689%, (SOFR + 3.25%), 7/31/27 | | 11,456 | 10,955,039 |
| Term Loan, 9.424%, (SOFR + 4.00%), 8/19/28 | | 21,544 | 20,604,725 |
| Term Loan, 9.674%, (SOFR + 4.25%), 8/19/28 | | 7,338 | 7,022,057 |
| Term Loan - Second Lien, 10.689%, (SOFR + 5.25%), 1/31/28 | | 18,610 | 16,244,985 |
| Term Loan - Second Lien, 10.689%, (SOFR + 5.25%), 1/20/29 | | 4,375 | 3,758,742 |
| Cyxtera DC Holdings, Inc.: | | | |
| DIP Loan, 13.951%, (SOFR + 8.50%), 12/7/23 | | 16,383 | 16,495,163 |
| Term Loan, 0.00%, 5/1/24(12) | | 45,767 | 26,773,588 |
| Term Loan, 0.00%, 5/1/24(12) | | 13,280 | 7,801,825 |
| Endure Digital, Inc., Term Loan, 9.422%, (SOFR + 3.50%), 2/10/28 | | 33,744 | 31,408,700 |
| Gainwell Acquisition Corp., Term Loan, 9.49%, (SOFR + 4.00%), 10/1/27 | | 51,267 | 49,131,005 |
| Go Daddy Operating Company, LLC: | | | |
| Term Loan, 7.439%, (SOFR + 2.00%), 8/10/27 | | 9,796 | 9,800,022 |
| Term Loan, 7.824%, (SOFR + 2.50%), 11/9/29 | | 52,470 | 52,576,405 |
| Informatica, LLC, Term Loan, 8.189%, (SOFR + 2.75%), 10/27/28 | | 34,327 | 34,300,440 |
| NAB Holdings, LLC, Term Loan, 8.54%, (SOFR + 3.00%), 11/23/28 | | 13,797 | 13,729,526 |
| Rackspace Technology Global, Inc., Term Loan, 8.206%, (SOFR + 2.75%), 2/15/28 | | 13,485 | 6,078,423 |
| Sedgwick Claims Management Services, Inc., Term Loan, 9.074%, (SOFR + 3.75%), 2/24/28 | | 9,975 | 9,953,402 |
36
See Notes to Financial Statements.
Senior Debt Portfolio
October 31, 2023
Portfolio of Investments — continued
| Borrower/Description | Principal
Amount*
(000's omitted) | Value |
| IT Services (continued) |
| team.blue Finco S.a.r.l., Term Loan, 7.105%, (1 mo. EURIBOR + 3.20%), 3/30/28 | EUR | 12,375 | $ 12,598,881 |
| WEX, Inc., Term Loan, 7.689%, (SOFR + 2.25%), 3/31/28 | | 4,339 | 4,341,761 |
| | | | $ 338,808,594 |
| Leisure Products — 0.9% |
| Accell Group N.V., Term Loan, 8.653%, (3 mo. EURIBOR + 4.90%), 6/14/29 | EUR | 3,500 | $ 3,207,258 |
| Amer Sports Oyj, Term Loan, 7.948%, (3 mo. EURIBOR + 4.00%), 3/30/26 | EUR | 20,475 | 21,515,659 |
| Fender Musical Instruments Corporation, Term Loan, 9.439%, (SOFR + 4.00%), 12/1/28 | | 4,268 | 4,126,158 |
| Hayward Industries, Inc., Term Loan, 8.189%, (SOFR + 2.75%), 5/30/28 | | 12,281 | 12,096,343 |
| Recess Holdings, Inc., Term Loan, 9.383%, (SOFR + 4.00%), 3/29/27 | | 7,800 | 7,785,375 |
| SRAM, LLC, Term Loan, 8.189%, (SOFR + 2.75%), 5/18/28 | | 2,074 | 2,068,679 |
| | | | $ 50,799,472 |
| Life Sciences Tools & Services — 2.9% |
| Avantor Funding, Inc.: | | | |
| Term Loan, 6.368%, (1 mo. EURIBOR + 2.50%), 6/12/28 | EUR | 21,310 | $ 22,446,124 |
| Term Loan, 7.674%, (SOFR + 2.25%), 11/8/27 | | 5,966 | 5,970,559 |
| Cambrex Corporation, Term Loan, 8.924%, (SOFR + 3.50%), 12/4/26 | | 5,938 | 5,894,310 |
| Catalent Pharma Solutions, Inc., Term Loan, 7.453%, (SOFR + 2.00%), 2/22/28 | | 782 | 762,211 |
| Curia Global, Inc., Term Loan, 9.233%, (SOFR + 3.75%), 8/30/26(10) | | 19,418 | 15,636,722 |
| ICON Luxembourg S.a.r.l., Term Loan, 7.902%, (SOFR + 2.25%), 7/3/28 | | 53,065 | 53,146,632 |
| IQVIA, Inc., Term Loan, 7.402%, (SOFR + 1.75%), 1/17/25 | | 13,620 | 13,667,314 |
| LGC Group Holdings, Ltd., Term Loan, 7.118%, (1 mo. EURIBOR + 3.25%), 4/21/27 | EUR | 4,025 | 4,174,439 |
| Loire Finco Luxembourg S.a.r.l., Term Loan, 8.924%, (SOFR + 3.50%), 4/21/27 | | 3,485 | 3,401,906 |
| PRA Health Sciences, Inc., Term Loan, 7.902%, (SOFR + 2.25%), 7/3/28 | | 13,221 | 13,241,728 |
| Sotera Health Holdings, LLC, Term Loan, 8.395%, (SOFR + 2.75%), 12/11/26 | | 11,625 | 11,578,500 |
| Star Parent, Inc., Term Loan, 9.386%, (3 mo. USD LIBOR + 4.00%), 9/27/30 | | 18,475 | 17,680,187 |
| | | | $ 167,600,632 |
| Borrower/Description | Principal
Amount*
(000's omitted) | Value |
| Machinery — 6.3% |
| AI Aqua Merger Sub, Inc., Term Loan, 9.082%, (SOFR + 3.75%), 7/31/28 | | 19,610 | $ 19,250,949 |
| Albion Financing 3 S.a.r.l.: | | | |
| Term Loan, 10.883%, (SOFR + 5.50%), 8/17/26 | | 4,254 | 4,250,967 |
| Term Loan, 10.924%, (SOFR + 5.25%), 8/17/26 | | 19,994 | 19,993,875 |
| Ali Group North America Corporation, Term Loan, 7.439%, (SOFR + 2.00%), 7/30/29 | | 16,370 | 16,373,849 |
| American Trailer World Corp., Term Loan, 9.174%, (SOFR + 3.75%), 3/3/28 | | 16,117 | 15,162,955 |
| Apex Tool Group, LLC, Term Loan, 10.689%, (SOFR + 5.25%), 2/8/29 | | 23,517 | 20,062,537 |
| Barnes Group, Inc., Term Loan, 8.424%, (SOFR + 3.00%), 9/3/30 | | 14,800 | 14,702,882 |
| Clark Equipment Company, Term Loan, 7.99%, (SOFR + 2.50%), 4/20/29 | | 12,403 | 12,431,054 |
| Conair Holdings, LLC, Term Loan, 9.189%, (SOFR + 3.75%), 5/17/28 | | 26,044 | 24,204,178 |
| CPM Holdings, Inc., Term Loan, 9.827%, (SOFR + 4.50%), 9/28/28 | | 7,000 | 7,006,566 |
| Delachaux Group S.A., Term Loan, 9.88%, (SOFR + 4.50%), 4/16/26 | | 4,130 | 4,130,000 |
| Delachaux Group SA, Term Loan, 4/16/29(9) | EUR | 8,400 | 8,772,978 |
| EMRLD Borrower, L.P., Term Loan, 8.38%, (SOFR + 3.00%), 5/31/30 | | 14,790 | 14,781,123 |
| Engineered Machinery Holdings, Inc.: | | | |
| Term Loan, 7.722%, (3 mo. EURIBOR + 3.75%), 5/21/28 | EUR | 11,883 | 12,407,858 |
| Term Loan, 9.152%, (SOFR + 3.50%), 5/19/28 | | 22,583 | 22,388,868 |
| Term Loan - Second Lien, 11.652%, (SOFR + 6.00%), 5/21/29 | | 2,000 | 1,960,000 |
| Filtration Group Corporation, Term Loan, 8.939%, (SOFR + 3.50%), 10/21/28 | | 3,218 | 3,197,922 |
| Gates Global, LLC, Term Loan, 7.924%, (SOFR + 2.50%), 3/31/27 | | 18,374 | 18,365,381 |
| Icebox Holdco III, Inc., Term Loan, 9.402%, (SOFR + 3.75%), 12/22/28 | | 12,621 | 12,378,944 |
| INNIO Group Holding GmbH, Term Loan, 6.871%, (1 mo. EURIBOR + 3.00%), 10/31/25 | EUR | 6,125 | 6,444,409 |
| Madison IAQ, LLC, Term Loan, 8.703%, (SOFR + 3.25%), 6/21/28 | | 23,025 | 22,235,916 |
| Pro Mach Group, Inc., Term Loan, 9.439%, (SOFR + 4.00%), 8/31/28 | | 4,773 | 4,766,186 |
| Roper Industrial Products Investment Company, LLC: | | | |
| Term Loan, 8.972%, (3 mo. EURIBOR + 5.25%), 11/22/29 | EUR | 995 | 1,050,836 |
| Term Loan, 9.89%, (SOFR + 4.50%), 11/22/29 | | 11,275 | 11,266,019 |
| SPX Flow, Inc., Term Loan, 9.924%, (SOFR + 4.50%), 4/5/29 | | 19,620 | 19,476,372 |
37
See Notes to Financial Statements.
Senior Debt Portfolio
October 31, 2023
Portfolio of Investments — continued
| Borrower/Description | Principal
Amount*
(000's omitted) | Value |
| Machinery (continued) |
| Titan Acquisition Limited, Term Loan, 8.731%, (3 mo. USD LIBOR + 3.00%), 3/28/25 | | 29,880 | $ 29,460,479 |
| TK Elevator Topco GmbH, Term Loan, 7.597%, (6 mo. EURIBOR + 3.63%), 7/30/27 | EUR | 12,100 | 12,600,969 |
| Vertical US Newco, Inc., Term Loan, 9.381%, (SOFR + 3.50%), 7/30/27 | | 6 | 6,138 |
| Zephyr German BidCo GmbH, Term Loan, 7.833%, (3 mo. EURIBOR + 3.85%), 3/10/28 | EUR | 13,675 | 13,665,653 |
| | | | $ 372,795,863 |
| Media — 1.7% |
| CSC Holdings, LLC: | | | |
| Term Loan, 7.699%, (1 mo. USD LIBOR + 2.25%), 7/17/25 | | 24,723 | $ 24,045,725 |
| Term Loan, 7.699%, (1 mo. USD LIBOR + 2.25%), 1/15/26 | | 5,592 | 5,391,043 |
| Hubbard Radio, LLC, Term Loan, 9.69%, (1 mo. USD LIBOR + 4.25%), 3/28/25 | | 7,610 | 6,443,074 |
| iHeartCommunications, Inc.: | | | |
| Term Loan, 8.439%, (SOFR + 3.00%), 5/1/26 | | 1,127 | 964,957 |
| Term Loan, 8.689%, (SOFR + 3.25%), 5/1/26 | | 3,165 | 2,718,891 |
| Mission Broadcasting, Inc., Term Loan, 7.939%, (SOFR + 2.50%), 6/2/28 | | 4,008 | 4,014,639 |
| Nexstar Broadcasting, Inc., Term Loan, 7.939%, (SOFR + 2.50%), 9/18/26 | | 1,167 | 1,168,113 |
| Recorded Books, Inc., Term Loan, 9.324%, (SOFR + 4.00%), 8/29/25 | | 11,351 | 11,347,501 |
| Sinclair Television Group, Inc.: | | | |
| Term Loan, 7.939%, (SOFR + 2.50%), 9/30/26 | | 5,305 | 4,479,575 |
| Term Loan, 8.439%, (SOFR + 3.00%), 4/1/28 | | 25,186 | 18,185,893 |
| Univision Communications, Inc., Term Loan, 8.689%, (SOFR + 3.25%), 3/15/26 | | 23,194 | 23,057,713 |
| | | | $ 101,817,124 |
| Metals/Mining — 1.5% |
| Arsenal AIC Parent, LLC, Term Loan, 9.879%, (SOFR + 4.50%), 8/18/30 | | 18,425 | $ 18,413,484 |
| Dynacast International, LLC: | | | |
| Term Loan, 10.017%, (SOFR + 4.50%), 7/22/25 | | 16,367 | 15,343,726 |
| Term Loan, 14.517%, (SOFR + 9.00%), 10/22/25 | | 2,926 | 2,209,012 |
| PMHC II, Inc., Term Loan, 9.807%, (SOFR + 4.25%), 4/23/29 | | 20,550 | 18,747,407 |
| WireCo WorldGroup, Inc., Term Loan, 9.699%, (SOFR + 4.25%), 11/13/28 | | 6,458 | 6,433,987 |
| Zekelman Industries, Inc., Term Loan, 7.449%, (SOFR + 2.00%), 1/24/27 | | 26,813 | 26,790,361 |
| | | | $ 87,937,977 |
| Borrower/Description | Principal
Amount*
(000's omitted) | Value |
| Oil, Gas & Consumable Fuels — 1.4% |
| Freeport LNG Investments, LLP, Term Loan, 9.177%, (SOFR + 3.50%), 12/21/28 | | 9,279 | $ 9,132,811 |
| GIP II Blue Holding, L.P., Term Loan, 9.939%, (SOFR + 4.50%), 9/29/28 | | 17,292 | 17,337,555 |
| ITT Holdings, LLC, Term Loan, 10/5/30(9) | | 10,850 | 10,704,198 |
| Matador Bidco S.a.r.l., Term Loan, 9.924%, (SOFR + 4.50%), 10/15/26 | | 30,332 | 30,402,592 |
| Oxbow Carbon, LLC, Term Loan, 9.457%, (SOFR + 4.00%), 5/10/30(10) | | 7,506 | 7,501,496 |
| QuarterNorth Energy Holding, Inc., Term Loan - Second Lien, 13.439%, (SOFR + 8.00%), 8/27/26 | | 7,607 | 7,602,609 |
| | | | $ 82,681,261 |
| Personal Products — 0.2% |
| HLF Financing S.a.r.l., Term Loan, 7.939%, (SOFR + 2.50%), 8/18/25 | | 13,794 | $ 13,683,744 |
| | | | $ 13,683,744 |
| Pharmaceuticals — 2.2% |
| Aenova Holding GmbH, Term Loan, 8.487%, (3 mo. EURIBOR + 4.50%), 3/6/26 | EUR | 4,075 | $ 4,293,791 |
| AI Sirona (Luxembourg) Acquisition S.a.r.l., Term Loan, 8.868%, (1 mo. EURIBOR + 5.00%), 9/30/28 | EUR | 12,550 | 13,288,454 |
| Bausch Health Companies, Inc., Term Loan, 10.689%, (SOFR + 5.25%), 2/1/27 | | 18,433 | 14,463,005 |
| Ceva Sante Animale: | | | |
| Term Loan, 11/1/30(9) | EUR | 13,200 | 13,910,749 |
| Term Loan, 11/1/30(9) | | 5,375 | 5,381,719 |
| Elanco Animal Health Incorporated, Term Loan, 7.165%, (SOFR + 1.75%), 8/1/27 | | 7,960 | 7,785,446 |
| Jazz Financing Lux S.a.r.l., Term Loan, 8.939%, (SOFR + 3.50%), 5/5/28 | | 8,317 | 8,326,220 |
| Mallinckrodt International Finance S.A.: | | | |
| DIP Loan, 13.439%, (SOFR + 8.00%), 8/28/24 | | 1,788 | 1,861,122 |
| DIP Loan, 13.451%, (SOFR + 8.00%), 8/28/24 | | 3,379 | 3,527,311 |
| Term Loan, 12.703%, (SOFR + 7.25%), 9/30/27 | | 38,268 | 29,143,242 |
| Term Loan, 12.953%, (SOFR + 7.50%), 9/30/27 | | 12,161 | 9,295,692 |
| PharmaZell GmbH, Term Loan, 7.972%, (3 mo. EURIBOR + 4.00%), 5/12/27 | EUR | 1,950 | 1,992,112 |
| Recipharm AB, Term Loan, 6.737%, (3 mo. EURIBOR + 2.95%), 2/17/28 | EUR | 15,275 | 15,449,603 |
| | | | $ 128,718,466 |
38
See Notes to Financial Statements.
Senior Debt Portfolio
October 31, 2023
Portfolio of Investments — continued
| Borrower/Description | Principal
Amount*
(000's omitted) | Value |
| Professional Services — 2.7% |
| APFS Staffing Holdings, Inc., Term Loan, 9.324%, (SOFR + 4.00%), 12/29/28 | | 3,940 | $ 3,875,975 |
| Apleona Holding GmbH, Term Loan, 6.898%, (3 mo. EURIBOR + 2.95%), 4/28/28 | EUR | 10,525 | 10,872,014 |
| ASGN Incorporated, Term Loan, 7.574%, (SOFR + 2.25%), 8/30/30 | | 4,875 | 4,898,614 |
| CoreLogic, Inc., Term Loan, 8.939%, (SOFR + 3.50%), 6/2/28 | | 17,334 | 15,817,118 |
| Corporation Service Company, Term Loan, 8.674%, (SOFR + 3.25%), 11/2/29 | | 4,991 | 4,997,762 |
| Deerfield Dakota Holding, LLC, Term Loan, 9.14%, (SOFR + 3.75%), 4/9/27 | | 10,728 | 10,382,005 |
| EAB Global, Inc., Term Loan, 8.939%, (SOFR + 3.50%), 8/16/28 | | 15,695 | 15,454,120 |
| Employbridge Holding Company, Term Loan, 10.407%, (SOFR + 4.75%), 7/19/28 | | 23,801 | 20,759,006 |
| First Advantage Holdings, LLC, Term Loan, 8.189%, (SOFR + 2.75%), 1/31/27 | | 3,606 | 3,611,349 |
| Genuine Financial Holdings, LLC, Term Loan, 9.40%, (SOFR + 4.00%), 9/27/30 | | 5,175 | 5,128,104 |
| Neptune Bidco US, Inc., Term Loan, 10.507%, (SOFR + 5.00%), 4/11/29 | | 9,129 | 8,032,206 |
| Rockwood Service Corporation, Term Loan, 9.439%, (SOFR + 4.00%), 1/23/27 | | 11,302 | 11,326,302 |
| Trans Union, LLC: | | | |
| Term Loan, 7.174%, (SOFR + 1.75%), 11/16/26 | | 2,471 | 2,469,157 |
| Term Loan, 7.689%, (SOFR + 2.25%), 12/1/28 | | 34,098 | 34,089,508 |
| Vaco Holdings, LLC, Term Loan, 10.393%, (SOFR + 5.00%), 1/21/29 | | 5,453 | 5,173,719 |
| | | | $ 156,886,959 |
| Real Estate Management & Development — 1.0% |
| Cushman & Wakefield U.S. Borrower, LLC: | | | |
| Term Loan, 8.189%, (SOFR + 2.75%), 8/21/25 | | 921 | $ 920,898 |
| Term Loan, 8.674%, (SOFR + 3.25%), 1/31/30 | | 10,634 | 10,182,019 |
| Term Loan, 9.324%, (SOFR + 4.00%), 1/31/30 | | 8,009 | 7,648,986 |
| Greystar Real Estate Partners, LLC, Term Loan, 9.147%, (SOFR + 3.75%), 8/21/30 | | 8,350 | 8,350,000 |
| Homeserve USA Holding Corp., Term Loan, 8.416%, (SOFR + 3.00%), 10/21/30 | | 12,075 | 12,044,812 |
| RE/MAX International, Inc., Term Loan, 7.939%, (SOFR + 2.50%), 7/21/28 | | 17,888 | 17,266,633 |
| | | | $ 56,413,348 |
| Road & Rail — 2.7% |
| Avis Budget Car Rental, LLC: | | | |
| Term Loan, 7.189%, (SOFR + 1.75%), 8/6/27 | | 33,771 | $ 33,637,570 |
| Borrower/Description | Principal
Amount*
(000's omitted) | Value |
| Road & Rail (continued) |
| Avis Budget Car Rental, LLC: (continued) | | | |
| Term Loan, 8.924%, (SOFR + 3.50%), 3/16/29 | | 4,104 | $ 4,112,375 |
| Grab Holdings, Inc., Term Loan, 9.939%, (SOFR + 4.50%), 1/29/26 | | 17,194 | 17,264,084 |
| Hertz Corporation (The): | | | |
| Term Loan, 8.691%, (SOFR + 3.25%), 6/30/28 | | 16,492 | 16,381,677 |
| Term Loan, 8.691%, (SOFR + 3.25%), 6/30/28 | | 3,180 | 3,158,379 |
| Kenan Advantage Group, Inc., Term Loan, 9.477%, (SOFR + 3.75%), 3/24/26 | | 16,820 | 16,795,688 |
| Uber Technologies, Inc., Term Loan, 8.159%, (SOFR + 2.75%), 3/3/30 | | 68,388 | 68,439,682 |
| | | | $ 159,789,455 |
| Semiconductors & Semiconductor Equipment — 1.2% |
| Altar Bidco, Inc.: | | | |
| Term Loan, 8.142%, (SOFR + 3.10%), 2/1/29(10) | | 20,811 | $ 20,653,470 |
| Term Loan - Second Lien, 10.493%, (SOFR + 5.60%), 2/1/30 | | 7,300 | 7,099,250 |
| Bright Bidco B.V., Term Loan, 14.378%, (SOFR + 9.00%), 6.378% cash, 8.00% PIK, 10/31/27 | | 4,376 | 1,712,251 |
| Entegris, Inc., Term Loan, 7.89%, (SOFR + 2.50%), 7/6/29 | | 1,261 | 1,263,364 |
| MaxLinear, Inc., Term Loan, 7.689%, (SOFR + 2.25%), 6/23/28 | | 3,250 | 3,201,250 |
| MKS Instruments, Inc., Term Loan, 7.819%, (SOFR + 2.50%), 8/17/29 | | 33,342 | 33,141,895 |
| Synaptics Incorporated, Term Loan, 7.914%, (SOFR + 2.25%), 12/2/28 | | 3,173 | 3,159,998 |
| Ultra Clean Holdings, Inc., Term Loan, 9.191%, (SOFR + 3.75%), 8/27/25 | | 2,848 | 2,855,431 |
| | | | $ 73,086,909 |
| Software — 16.4% |
| Applied Systems, Inc., Term Loan, 9.89%, (SOFR + 4.50%), 9/18/26 | | 67,781 | $ 68,011,446 |
| Aptean, Inc.: | | | |
| Term Loan, 9.674%, (SOFR + 4.25%), 4/23/26 | | 22,344 | 22,326,156 |
| Term Loan - Second Lien, 12.424%, (SOFR + 7.00%), 4/23/27 | | 6,500 | 6,069,375 |
| Astra Acquisition Corp.: | | | |
| Term Loan, 10.902%, (SOFR + 5.25%), 10/25/28 | | 14,219 | 9,753,192 |
| Term Loan - Second Lien, 14.527%, (SOFR + 8.88%), 10/25/29 | | 21,995 | 11,547,224 |
| Banff Merger Sub, Inc.: | | | |
| Term Loan, 7.868%, (1 mo. EURIBOR + 4.00%), 10/2/25 | EUR | 5,922 | 6,257,553 |
| Term Loan, 9.189%, (SOFR + 3.75%), 10/2/25 | | 14,998 | 15,001,149 |
39
See Notes to Financial Statements.
Senior Debt Portfolio
October 31, 2023
Portfolio of Investments — continued
| Borrower/Description | Principal
Amount*
(000's omitted) | Value |
| Software (continued) |
| Banff Merger Sub, Inc.: (continued) | | | |
| Term Loan - Second Lien, 10.939%, (SOFR + 5.50%), 2/27/26 | | 9,470 | $ 9,432,518 |
| Cegid Group SAS, Term Loan, 7/10/28(9) | EUR | 7,850 | 8,255,902 |
| Central Parent, Inc., Term Loan, 9.406%, (SOFR + 4.00%), 7/6/29 | | 33,487 | 33,348,158 |
| CentralSquare Technologies, LLC, Term Loan, 9.29%, (SOFR + 3.75%), 8/29/25 | | 23,577 | 22,306,639 |
| Cloud Software Group, Inc., Term Loan, 9.99%, (SOFR + 4.50%), 9/29/28(10) | | 22,472 | 21,348,286 |
| Cloudera, Inc.: | | | |
| Term Loan, 9.174%, (SOFR + 3.75%), 10/8/28 | | 22,685 | 21,881,374 |
| Term Loan - Second Lien, 11.424%, (SOFR + 6.00%), 10/8/29 | | 4,450 | 4,013,344 |
| Constant Contact, Inc., Term Loan, 9.687%, (SOFR + 4.00%), 2/10/28 | | 12,979 | 12,067,507 |
| Cornerstone OnDemand, Inc., Term Loan, 9.189%, (SOFR + 3.75%), 10/16/28 | | 16,991 | 16,083,272 |
| Delta TopCo, Inc., Term Loan, 9.069%, (SOFR + 3.75%), 12/1/27 | | 14,035 | 13,838,071 |
| E2open, LLC, Term Loan, 8.939%, (SOFR + 3.50%), 2/4/28 | | 20,063 | 19,825,208 |
| ECI Macola Max Holding, LLC, Term Loan, 9.402%, (SOFR + 3.75%), 11/9/27 | | 26,794 | 26,697,268 |
| Epicor Software Corporation: | | | |
| Term Loan, 8.689%, (SOFR + 3.25%), 7/30/27 | | 69,746 | 69,488,218 |
| Term Loan, 9.074%, (SOFR + 3.75%), 7/30/27 | | 10,900 | 10,931,337 |
| Fiserv Investment Solutions, Inc., Term Loan, 9.383%, (SOFR + 4.00%), 2/18/27 | | 12,035 | 11,309,136 |
| Gen Digital, Inc., Term Loan, 7.424%, (SOFR + 2.00%), 9/12/29 | | 3,652 | 3,624,166 |
| GoTo Group, Inc., Term Loan, 10.283%, (SOFR + 4.75%), 8/31/27 | | 28,349 | 17,948,603 |
| IGT Holding IV AB: | | | |
| Term Loan, 7.122%, (3 mo. EURIBOR + 3.15%), 3/31/28 | EUR | 6,205 | 6,406,403 |
| Term Loan, 8.962%, (SOFR + 3.40%), 3/31/28 | | 1,657 | 1,649,758 |
| Imperva, Inc., Term Loan, 9.627%, (SOFR + 4.00%), 1/12/26 | | 4,899 | 4,908,098 |
| iSolved, Inc., Term Loan, 9.484%, (SOFR + 4.00%), 10/14/30 | | 6,550 | 6,562,281 |
| Ivanti Software, Inc., Term Loan, 9.907%, (SOFR + 4.25%), 12/1/27 | | 10,275 | 9,159,946 |
| Magenta Buyer, LLC: | | | |
| Term Loan, 10.645%, (SOFR + 5.00%), 7/27/28 | | 22,176 | 15,523,291 |
| Term Loan - Second Lien, 13.895%, (SOFR + 8.25%), 7/27/29 | | 7,475 | 3,236,675 |
| Borrower/Description | Principal
Amount*
(000's omitted) | Value |
| Software (continued) |
| Marcel LUX IV S.a.r.l.: | | | |
| Term Loan, 7.455%, (3 mo. EURIBOR + 3.50%), 3/16/26 | EUR | 9,150 | $ 9,675,567 |
| Term Loan, 8.689%, (SOFR + 3.25%), 3/15/26 | | 15,965 | 15,965,033 |
| Term Loan, 9.436%, (SOFR + 4.00%), 12/31/27 | | 3,254 | 3,254,231 |
| Maverick Bidco, Inc., Term Loan, 9.283%, (SOFR + 3.75%), 5/18/28 | | 11,914 | 11,663,223 |
| McAfee, LLC, Term Loan, 9.165%, (SOFR + 3.75%), 3/1/29 | | 24,476 | 23,440,877 |
| Mosel Bidco SE: | | | |
| Term Loan, 8.691%, (3 mo. EURIBOR + 4.75%), 9/16/30 | EUR | 1,825 | 1,918,987 |
| Term Loan, 10.164%, (SOFR + 4.75%), 9/16/30 | | 3,275 | 3,270,906 |
| N-Able International Holdings II, LLC, Term Loan, 8.434%, (SOFR + 2.75%), 7/19/28 | | 1,632 | 1,629,494 |
| Open Text Corporation, Term Loan, 8.174%, (SOFR + 2.75%), 1/31/30 | | 28,443 | 28,473,452 |
| Polaris Newco, LLC: | | | |
| Term Loan, 7.868%, (1 mo. EURIBOR + 4.00%), 6/2/28 | EUR | 9,163 | 9,143,949 |
| Term Loan, 9.439%, (SOFR + 4.00%), 6/2/28 | | 7,770 | 7,355,519 |
| Project Alpha Intermediate Holding, Inc., Term Loan, 10/28/30(9) | | 5,500 | 5,350,713 |
| Proofpoint, Inc.: | | | |
| Term Loan, 8.689%, (SOFR + 3.25%), 8/31/28 | | 39,330 | 38,729,406 |
| Term Loan - Second Lien, 11.689%, (SOFR + 6.25%), 8/31/29 | | 2,070 | 2,081,321 |
| Quartz Acquireco, LLC, Term Loan, 8.824%, (SOFR + 3.50%), 6/28/30 | | 10,625 | 10,625,000 |
| Quest Software US Holdings, Inc., Term Loan, 9.783%, (SOFR + 4.25%), 2/1/29 | | 25,210 | 20,068,835 |
| RealPage, Inc., Term Loan, 8.439%, (SOFR + 3.00%), 4/24/28 | | 10,981 | 10,739,861 |
| Red Planet Borrower, LLC, Term Loan, 9.174%, (SOFR + 3.75%), 10/2/28 | | 16,613 | 15,557,804 |
| Redstone Holdco 2, L.P., Term Loan, 10.189%, (SOFR + 4.75%), 4/27/28 | | 12,915 | 10,380,338 |
| Sabre GLBL, Inc.: | | | |
| Term Loan, 8.939%, (SOFR + 3.50%), 12/17/27 | | 8,392 | 7,185,831 |
| Term Loan, 8.939%, (SOFR + 3.50%), 12/17/27 | | 5,371 | 4,598,562 |
| Term Loan, 9.674%, (SOFR + 4.25%), 6/30/28 | | 7,345 | 6,291,941 |
| Term Loan, 10.424%, (SOFR + 5.00%), 6/30/28 | | 1,000 | 858,333 |
| Skillsoft Corporation, Term Loan, 10.699%, (SOFR + 5.25%), 7/14/28 | | 14,915 | 13,688,972 |
| SolarWinds Holdings, Inc., Term Loan, 9.074%, (SOFR + 3.75%), 2/5/27 | | 26,616 | 26,641,216 |
| Sophia, L.P., Term Loan, 8.924%, (SOFR + 3.50%), 10/7/27 | | 32,861 | 32,475,124 |
40
See Notes to Financial Statements.
Senior Debt Portfolio
October 31, 2023
Portfolio of Investments — continued
| Borrower/Description | Principal
Amount*
(000's omitted) | Value |
| Software (continued) |
| SS&C European Holdings S.a.r.l., Term Loan, 7.189%, (SOFR + 1.75%), 4/16/25 | | 4,995 | $ 4,999,276 |
| SS&C Technologies, Inc.: | | | |
| Term Loan, 7.189%, (SOFR + 1.75%), 4/16/25 | | 5,290 | 5,294,273 |
| Term Loan, 7.189%, (SOFR + 1.75%), 4/16/25 | | 4,745 | 4,748,421 |
| Term Loan, 7.674%, (SOFR + 2.25%), 3/22/29 | | 2,978 | 2,979,123 |
| Term Loan, 7.674%, (SOFR + 2.25%), 3/22/29 | | 4,718 | 4,719,194 |
| Turing Midco, LLC, Term Loan, 7.939%, (SOFR + 2.50%), 3/24/28 | | 726 | 724,553 |
| Ultimate Software Group, Inc. (The): | | | |
| Term Loan, 8.764%, (SOFR + 3.25%), 5/4/26 | | 54,101 | 53,888,185 |
| Term Loan, 9.233%, (SOFR + 3.75%), 5/4/26 | | 782 | 781,231 |
| Veritas US, Inc., Term Loan, 10.439%, (SOFR + 5.11%), 9/1/25 | | 20,007 | 16,987,401 |
| Vision Solutions, Inc.: | | | |
| Term Loan, 9.64%, (SOFR + 4.00%), 4/24/28 | | 39,257 | 37,514,755 |
| Term Loan - Second Lien, 12.791%, (SOFR + 7.25%), 4/23/29 | | 1,500 | 1,332,187 |
| VS Buyer, LLC, Term Loan, 8.674%, (SOFR + 3.25%), 2/28/27 | | 1,812 | 1,801,117 |
| | | | $ 965,645,765 |
| Specialty Retail — 2.6% |
| Belron Luxembourg S.a.r.l., Term Loan, 6.147%, (3 mo. EURIBOR + 2.43%), 4/13/28 | EUR | 3,925 | $ 4,151,561 |
| Boels Topholding B.V., Term Loan, 7.049%, (EURIBOR + 3.25%), 2/6/27(10) | EUR | 7,586 | 8,028,637 |
| Etraveli Holding AB, Term Loan, 7.972%, (3 mo. EURIBOR + 4.00%), 8/2/24 | EUR | 9,472 | 10,009,840 |
| Great Outdoors Group, LLC, Term Loan, 9.402%, (SOFR + 3.75%), 3/6/28 | | 35,275 | 35,065,436 |
| Harbor Freight Tools USA, Inc., Term Loan, 8.189%, (SOFR + 2.75%), 10/19/27 | | 25,349 | 25,065,068 |
| Hoya Midco, LLC, Term Loan, 8.633%, (SOFR + 3.25%), 2/3/29 | | 4,845 | 4,846,963 |
| Les Schwab Tire Centers, Term Loan, 8.692%, (SOFR + 3.25%), 11/2/27 | | 28,684 | 28,624,423 |
| LIDS Holdings, Inc., Term Loan, 11.06%, (SOFR + 5.50%), 12/14/26 | | 5,527 | 5,347,705 |
| Mattress Firm, Inc., Term Loan, 9.95%, (6 mo. USD LIBOR + 4.25%), 9/25/28 | | 17,449 | 17,268,984 |
| PetSmart, Inc., Term Loan, 9.174%, (SOFR + 3.75%), 2/11/28 | | 15,390 | 15,237,590 |
| | | | $ 153,646,207 |
| Borrower/Description | Principal
Amount*
(000's omitted) | Value |
| Trading Companies & Distributors — 3.5% |
| Avolon TLB Borrower 1 (US), LLC: | | | |
| Term Loan, 7.689%, (SOFR + 2.25%), 12/1/27 | | 17,796 | $ 17,819,649 |
| Term Loan, 7.839%, (SOFR + 2.50%), 6/22/28 | | 23,366 | 23,395,368 |
| Core & Main, L.P., Term Loan, 7.967%, (SOFR + 2.50%), 7/27/28(10) | | 9,545 | 9,548,978 |
| DXP Enterprises, Inc., Term Loan, 10.291%, (SOFR + 4.75%), 10/11/30 | | 9,150 | 9,104,250 |
| Electro Rent Corporation, Term Loan, 11.002%, (SOFR + 5.50%), 11/1/24 | | 21,917 | 20,602,422 |
| Hillman Group, Inc. (The), Term Loan, 8.189%, (SOFR + 2.75%), 7/14/28 | | 1,078 | 1,076,957 |
| Park River Holdings, Inc., Term Loan, 8.907%, (SOFR + 3.25%), 12/28/27 | | 3,726 | 3,531,593 |
| Patagonia Bidco Limited, Term Loan, 10.181%, (SONIA + 5.25%), 11/1/28 | GBP | 20,050 | 20,424,904 |
| PEARLS (Netherlands) Bidco B.V., Term Loan, 7.448%, (3 mo. EURIBOR + 3.50%), 2/26/29 | EUR | 6,000 | 6,199,143 |
| Spin Holdco, Inc., Term Loan, 9.664%, (SOFR + 4.00%), 3/4/28 | | 51,147 | 43,966,470 |
| SRS Distribution, Inc.: | | | |
| Term Loan, 8.825%, (SOFR + 3.50%), 6/2/28 | | 5,355 | 5,246,194 |
| Term Loan, 8.939%, (SOFR + 3.50%), 6/2/28 | | 16,294 | 15,953,575 |
| White Cap Buyer, LLC, Term Loan, 9.074%, (SOFR + 3.75%), 10/19/27 | | 16,349 | 16,260,597 |
| Windsor Holdings III, LLC, Term Loan, 9.815%, (SOFR + 4.50%), 8/1/30 | | 13,900 | 13,874,563 |
| | | | $ 207,004,663 |
| Wireless Telecommunication Services — 0.5% |
| CCI Buyer, Inc., Term Loan, 9.39%, (SOFR + 4.00%), 12/17/27 | | 9,871 | $ 9,678,967 |
| Digicel International Finance Limited, Term Loan, 8.902%, (3 mo. USD LIBOR + 3.25%), 5/28/24 | | 18,919 | 17,421,048 |
| | | | $ 27,100,015 |
Total Senior Floating-Rate Loans
(identified cost $6,735,136,792) | | | $ 6,381,790,440 |
41
See Notes to Financial Statements.
Senior Debt Portfolio
October 31, 2023
Portfolio of Investments — continued
| Short-Term Investments — 1.4% |
| Security | Shares | Value |
| Morgan Stanley Institutional Liquidity Funds - Government Portfolio, Institutional Class, 5.25%(13) | | 83,572,578 | $ 83,572,578 |
Total Short-Term Investments
(identified cost $83,572,578) | | | $ 83,572,578 |
Total Investments — 126.3%
(identified cost $7,924,675,250) | | | $ 7,423,036,997 |
| Less Unfunded Loan Commitments — (0.2)% | | | $ (10,209,831) |
Net Investments — 126.1%
(identified cost $7,914,465,419) | | | $ 7,412,827,166 |
| Other Assets, Less Liabilities — (26.1)% | | | $ (1,537,361,779) |
| Net Assets — 100.0% | | | $ 5,875,465,387 |
| The percentage shown for each investment category in the Portfolio of Investments is based on net assets. |
| * | In U.S. dollars unless otherwise indicated. |
| (1) | Security exempt from registration under Rule 144A of the Securities Act of 1933, as amended. These securities may be sold in certain transactions in reliance on an exemption from registration (normally to qualified institutional buyers). At October 31, 2023, the aggregate value of these securities is $871,306,678 or 14.8% of the Portfolio's net assets. |
| (2) | Variable rate security. The stated interest rate represents the rate in effect at October 31, 2023. |
| (3) | For fair value measurement disclosure purposes, security is categorized as Level 3 (see Note 8). |
| (4) | Non-income producing security. |
| (5) | Security was acquired in connection with a restructuring of a Senior Loan and may be subject to restrictions on resale. |
| (6) | Amount is less than 0.05%. |
| (7) | When-issued security. |
| (8) | Senior floating-rate loans (Senior Loans) often require prepayments from excess cash flows or permit the borrowers to repay at their election. The degree to which borrowers repay, whether as a contractual requirement or at their election, cannot be predicted with accuracy. As a result, the actual remaining maturity may be substantially less than the stated maturities shown. However, Senior Loans will typically have an expected average life of approximately two to four years. Senior Loans typically have rates of interest which are redetermined periodically by reference to a base lending rate, plus a spread. These base lending rates are primarily the Secured Overnight Financing Rate (“SOFR”) (or the London Interbank Offered Rate (“LIBOR”) for those loans whose rates reset prior to the discontinuance of LIBOR on June 30, 2023) and secondarily, the prime rate offered by one or more major United States banks (the “Prime Rate”). Base lending rates may be subject to a floor, or minimum rate. Rates for SOFR are generally 1 or 3-month tenors and may also be subject to a credit spread adjustment. Senior Loans are generally subject to contractual restrictions that must be satisfied before they can be bought or sold. |
| (9) | This Senior Loan will settle after October 31, 2023, at which time the interest rate will be determined. |
| (10) | The stated interest rate represents the weighted average interest rate at October 31, 2023 of contracts within the senior loan facility. Interest rates on contracts are primarily redetermined either monthly or quarterly by reference to the indicated base lending rate and spread and the reset period. |
| (11) | Unfunded or partially unfunded loan commitments. The stated interest rate reflects the weighted average of the reference rate and spread for the funded portion, if any, and the commitment fees on the portion of the loan that is unfunded. At October 31, 2023, the total value of unfunded loan commitments is $7,617,406. See Note 1F for description. |
| (12) | Issuer is in default with respect to interest and/or principal payments or has declared bankruptcy. For a variable rate security, interest rate has been adjusted to reflect non-accrual status. |
| (13) | May be deemed to be an affiliated investment company. The rate shown is the annualized seven-day yield as of October 31, 2023. |
| Forward Foreign Currency Exchange Contracts (OTC) |
| Currency Purchased | Currency Sold | Counterparty | Settlement
Date | Unrealized
Appreciation | Unrealized
(Depreciation) |
| USD | 315,263,746 | EUR | 297,407,318 | Standard Chartered Bank | 11/2/23 | $ 576,977 | $ — |
| EUR | 20,000,000 | USD | 21,486,354 | Citibank, N.A. | 11/30/23 | — | (300,653) |
| EUR | 40,000,000 | USD | 42,327,580 | Standard Chartered Bank | 11/30/23 | 43,822 | — |
| GBP | 2,357,648 | USD | 2,857,894 | Bank of America, N.A. | 11/30/23 | 8,173 | — |
| GBP | 3,000,000 | USD | 3,745,067 | Standard Chartered Bank | 11/30/23 | — | (98,127) |
| USD | 116,064,697 | EUR | 106,243,836 | Bank of America, N.A. | 11/30/23 | 3,522,189 | — |
| USD | 62,855,595 | EUR | 57,560,153 | Bank of America, N.A. | 11/30/23 | 1,882,985 | — |
| USD | 72,465,865 | EUR | 66,379,854 | State Street Bank and Trust Company | 11/30/23 | 2,150,676 | — |
| USD | 2,232,524 | EUR | 2,045,193 | The Toronto-Dominion Bank | 11/30/23 | 66,081 | — |
| USD | 41,739,674 | GBP | 33,074,976 | State Street Bank and Trust Company | 11/30/23 | 1,532,194 | — |
42
See Notes to Financial Statements.
Senior Debt Portfolio
October 31, 2023
Portfolio of Investments — continued
| Forward Foreign Currency Exchange Contracts (OTC) (continued) |
| Currency Purchased | Currency Sold | Counterparty | Settlement
Date | Unrealized
Appreciation | Unrealized
(Depreciation) |
| USD | 314,756,312 | EUR | 297,407,318 | Standard Chartered Bank | 12/4/23 | $ — | $ (333,443) |
| EUR | 17,000,000 | USD | 18,051,246 | Standard Chartered Bank | 12/29/23 | — | (13,840) |
| GBP | 6,000,000 | USD | 7,317,447 | State Street Bank and Trust Company | 12/29/23 | — | (21,207) |
| USD | 7,102,868 | EUR | 6,729,574 | Australia and New Zealand Banking Group Limited | 12/29/23 | — | (37,372) |
| USD | 32,690,461 | EUR | 31,000,000 | Australia and New Zealand Banking Group Limited | 12/29/23 | — | (201,279) |
| USD | 32,704,566 | EUR | 31,000,000 | Goldman Sachs International | 12/29/23 | — | (187,174) |
| USD | 32,690,188 | EUR | 31,000,000 | State Street Bank and Trust Company | 12/29/23 | — | (201,552) |
| USD | 34,097,643 | EUR | 32,342,549 | State Street Bank and Trust Company | 12/29/23 | — | (218,574) |
| USD | 34,095,356 | EUR | 32,342,549 | State Street Bank and Trust Company | 12/29/23 | — | (220,860) |
| | | | | | | $9,783,097 | $(1,834,081) |
| Abbreviations: |
| DIP | – Debtor In Possession |
| EURIBOR | – Euro Interbank Offered Rate |
| LIBOR | – London Interbank Offered Rate |
| OTC | – Over-the-counter |
| PIK | – Payment In Kind |
| SOFR | – Secured Overnight Financing Rate |
| SONIA | – Sterling Overnight Interbank Average |
| Currency Abbreviations: |
| EUR | – Euro |
| GBP | – British Pound Sterling |
| USD | – United States Dollar |
43
See Notes to Financial Statements.
Senior Debt Portfolio
October 31, 2023
Statement of Assets and Liabilities
| | October 31, 2023 |
| Assets | |
| Unaffiliated investments, at value (identified cost $7,830,892,841) | $ 7,329,254,588 |
| Affiliated investments, at value (identified cost $83,572,578) | 83,572,578 |
| Cash | 26,564,056 |
| Deposits for derivatives collateral — forward foreign currency exchange contracts | 1,720,000 |
| Foreign currency, at value (identified cost $27,293,161) | 27,317,109 |
| Interest receivable | 48,121,291 |
| Dividends receivable from affiliated investments | 397,657 |
| Receivable for investments sold | 67,432,178 |
| Receivable for open forward foreign currency exchange contracts | 9,783,097 |
| Prepaid upfront fees on notes payable | 1,307,380 |
| Trustees' deferred compensation plan | 273,147 |
| Prepaid expenses | 91,621 |
| Total assets | $7,595,834,702 |
| Liabilities | |
| Notes payable | $ 1,525,000,000 |
| Payable for investments purchased | 178,250,208 |
| Payable for when-issued securities | 5,375,000 |
| Payable for open forward foreign currency exchange contracts | 1,834,081 |
| Payable to affiliates: | |
| Investment adviser fee | 2,634,200 |
| Trustees' fees | 9,042 |
| Trustees' deferred compensation plan | 273,147 |
| Accrued expenses | 6,993,637 |
| Total liabilities | $1,720,369,315 |
| Net Assets applicable to investors' interest in Portfolio | $5,875,465,387 |
44
See Notes to Financial Statements.
Senior Debt Portfolio
October 31, 2023
| | Year Ended |
| | October 31, 2023 |
| Investment Income | |
| Dividend income | $ 4,384,967 |
| Dividend income from affiliated investments | 5,747,653 |
| Interest and other income | 711,315,184 |
| Total investment income | $ 721,447,804 |
| Expenses | |
| Investment adviser fee | $ 33,952,435 |
| Trustees’ fees and expenses | 108,500 |
| Custodian fee | 1,308,498 |
| Legal and accounting services | 410,206 |
| Interest expense and fees | 114,477,456 |
| Miscellaneous | 425,800 |
| Total expenses | $ 150,682,895 |
| Deduct: | |
| Waiver and/or reimbursement of expenses by affiliates | $ 187,525 |
| Total expense reductions | $ 187,525 |
| Net expenses | $ 150,495,370 |
| Net investment income | $ 570,952,434 |
| Realized and Unrealized Gain (Loss) | |
| Net realized gain (loss): | |
| Investment transactions | $ (256,805,482) |
| Foreign currency transactions | 2,530,617 |
| Forward foreign currency exchange contracts | (67,585,880) |
| Net realized loss | $(321,860,745) |
| Change in unrealized appreciation (depreciation): | |
| Investments | $ 484,673,959 |
| Foreign currency | 464,567 |
| Forward foreign currency exchange contracts | 11,505,499 |
| Net change in unrealized appreciation (depreciation) | $ 496,644,025 |
| Net realized and unrealized gain | $ 174,783,280 |
| Net increase in net assets from operations | $ 745,735,714 |
45
See Notes to Financial Statements.
Senior Debt Portfolio
October 31, 2023
Statements of Changes in Net Assets
| | Year Ended October 31, |
| | 2023 | 2022 |
| Increase (Decrease) in Net Assets | | |
| From operations: | | |
| Net investment income | $ 570,952,434 | $ 454,111,028 |
| Net realized gain (loss) | (321,860,745) | 61,185,798 |
| Net change in unrealized appreciation (depreciation) | 496,644,025 | (933,652,683) |
| Net increase (decrease) in net assets from operations | $ 745,735,714 | $ (418,355,857) |
| Capital transactions: | | |
| Contributions | $ 365,123,130 | $ 2,156,822,498 |
| Withdrawals | (2,604,898,648) | (2,792,514,701) |
| Net decrease in net assets from capital transactions | $(2,239,775,518) | $ (635,692,203) |
| Net decrease in net assets | $(1,494,039,804) | $(1,054,048,060) |
| Net Assets | | |
| At beginning of year | $ 7,369,505,191 | $ 8,423,553,251 |
| At end of year | $ 5,875,465,387 | $ 7,369,505,191 |
46
See Notes to Financial Statements.
Senior Debt Portfolio
October 31, 2023
| | Year Ended |
| | October 31, 2023 |
| Cash Flows From Operating Activities | |
| Net increase in net assets from operations | $ 745,735,714 |
| Adjustments to reconcile net increase in net assets from operations to net cash provided by operating activities: | |
| Investments purchased | (1,225,778,411) |
| Investments sold and principal repayments | 3,503,558,761 |
| Decrease in short-term investments, net | 2,637,385 |
| Net amortization/accretion of premium (discount) | (18,858,014) |
| Amortization of prepaid upfront fees on notes payable | 3,951,049 |
| Increase in interest receivable | (2,070,002) |
| Increase in dividends receivable from affiliated investments | (102,095) |
| Increase in Trustees’ deferred compensation plan | (273,147) |
| Decrease in payable to affiliate for investment adviser fee | (708,469) |
| Increase in payable to affiliate for Trustees' deferred compensation plan | 273,147 |
| Decrease in accrued expenses | (122,395) |
| Decrease in unfunded loan commitments | (7,313,422) |
| Net change in unrealized (appreciation) depreciation from investments | (484,673,959) |
| Net change in unrealized (appreciation) depreciation from forward foreign currency exchange contracts | (11,505,499) |
| Net realized loss from investments | 256,805,482 |
| Net cash provided by operating activities | $ 2,761,556,125 |
| Cash Flows From Financing Activities | |
| Proceeds from capital contributions | $ 365,123,130 |
| Payments for capital withdrawals | (2,604,898,648) |
| Proceeds from notes payable | 375,000,000 |
| Repayments of notes payable | (925,000,000) |
| Payment of prepaid upfront fees on notes payable | (3,787,500) |
| Net cash used in financing activities | $(2,793,563,018) |
| Net decrease in cash and restricted cash* | $ (32,006,893) |
| Cash and restricted cash at beginning of year (including foreign currency) | $ 87,608,058 |
| Cash and restricted cash at end of year (including foreign currency) | $ 55,601,165 |
| Supplemental disclosure of cash flow information: | |
| Cash paid for interest and fees on borrowings | $ 114,591,036 |
| * | Includes net change in unrealized (appreciation) depreciation on foreign currency of $(26,993). |
The following table provides a reconciliation of cash and restricted cash reported within the Statement of Assets and Liabilities that sum to the total of such amounts shown on the Statement of Cash Flows.
| | |
| | October 31, 2023 |
| Cash | $ 26,564,056 |
| Deposits for derivatives collateral — forward foreign currency exchange contracts | 1,720,000 |
| Foreign currency | 27,317,109 |
| Total cash and restricted cash as shown on the Statement of Cash Flows | $55,601,165 |
47
See Notes to Financial Statements.
Senior Debt Portfolio
October 31, 2023
| | Year Ended
October 31, |
| | 2023 | 2022 | 2021 | 2020 | 2019 |
| Ratios/Supplemental Data | | | | | |
| Ratios (as a percentage of average daily net assets): | | | | | |
| Expenses excluding interest and fees | 0.56% | 0.52% | 0.53% | 0.56% | 0.55% |
| Interest and fee expense | 1.81% | 0.47% | 0.32% | 0.60% | 0.88% |
| Total expenses | 2.37% (1) | 0.99% (1) | 0.85% | 1.16% | 1.43% |
| Net investment income | 9.01% | 5.16% | 4.19% | 4.86% | 5.63% |
| Portfolio Turnover | 18% | 27% | 28% | 30% | 17% |
| Total Return | 12.42% | (4.22)% | 9.75% | 0.39% | 2.04% |
| Net assets, end of year (000’s omitted) | $5,875,465 | $7,369,505 | $8,423,553 | $5,449,434 | $7,343,453 |
| (1) | Includes a reduction by the investment adviser of a portion of its adviser fee due to the Portfolio’s investment in the Liquidity Fund (equal to less than 0.005% of average daily net assets for the years ended October 31, 2023 and 2022). |
Senior Debt Portfolio
October 31, 2023
Notes to Financial Statements
1 Significant Accounting Policies
Senior Debt Portfolio (the Portfolio) is a Massachusetts business trust registered under the Investment Company Act of 1940, as amended (the 1940 Act), as an open-end management investment company. The Portfolio’s investment objective is to provide a high level of current income. The Declaration of Trust permits the Trustees to issue interests in the Portfolio. At October 31, 2023, Eaton Vance Floating-Rate Advantage Fund, Eaton Vance Short Duration Strategic Income Fund and Eaton Vance Short Duration Inflation-Protected Income Fund held an interest of 96.2%, 1.8% and 2.0%, respectively, in the Portfolio.
The following is a summary of significant accounting policies of the Portfolio. The policies are in conformity with accounting principles generally accepted in the United States of America (U.S. GAAP). The Portfolio is an investment company and follows accounting and reporting guidance in the Financial Accounting Standards Board (FASB) Accounting Standards Codification Topic 946.
A Investment Valuation—The following methodologies are used to determine the market value or fair value of investments.
Senior Floating-Rate Loans. Interests in senior floating-rate loans (Senior Loans) are valued generally at the average mean of bid and ask quotations obtained from a third party pricing service. Senior Loans, for which a valuation is not available or deemed unreliable, are fair valued by the investment adviser utilizing one or more of the valuation techniques described below to assess the likelihood that the borrower will make a full repayment of the loan underlying such Senior Loan. If the investment adviser believes that there is a reasonable likelihood of full repayment, the investment adviser will determine fair value using a matrix pricing approach that considers the yield on the Senior Loan relative to yields on other Senior Loans issued by companies of comparable credit quality. If the investment adviser believes there is not a reasonable likelihood of full repayment, the investment adviser will determine fair value using analyses that include, but are not limited to: (i) a comparison of the value of the borrower’s outstanding equity and debt to that of comparable public companies; (ii) a discounted cash flow analysis; or (iii) when the investment adviser believes it is likely that a borrower will be liquidated or sold, an analysis of the terms of such liquidation or sale. In certain cases, the investment adviser will use a combination of analytical methods to determine fair value, such as when only a portion of a borrower’s assets are likely to be sold. In conducting its assessment and analyses for purposes of determining fair value of a Senior Loan, the investment adviser will use its discretion and judgment in considering and appraising relevant factors. Junior Loans (i.e., subordinated loans and second lien loans) are valued in the same manner as Senior Loans.
Debt Obligations. Debt obligations are generally valued on the basis of valuations provided by third party pricing services, as derived from such services’ pricing models. Inputs to the models may include, but are not limited to, reported trades, executable bid and ask prices, broker/dealer quotations, prices or yields of securities with similar characteristics, interest rates, anticipated prepayments, benchmark curves or information pertaining to the issuer, as well as industry and economic events. The pricing services may use a matrix approach, which considers information regarding securities with similar characteristics to determine the valuation for a security. Short-term debt obligations purchased with a remaining maturity of sixty days or less for which a valuation from a third party pricing service is not readily available may be valued at amortized cost, which approximates fair value.
Equity Securities. Equity securities listed on a U.S. securities exchange generally are valued at the last sale or closing price on the day of valuation or, if no sales took place on such date, at the mean between the closing bid and ask prices on the exchange where such securities are principally traded. Equity securities listed on the NASDAQ National Market System are valued at the NASDAQ official closing price. Unlisted or listed securities for which closing sales prices or closing quotations are not available are valued at the mean between the latest available bid and ask prices or, in the case of preferred equity securities that are not listed or traded in the over-the-counter market, by a third party pricing service that uses various techniques that consider factors including, but not limited to, prices or yields of securities with similar characteristics, benchmark yields, broker/dealer quotes, quotes of underlying common stock, issuer spreads, as well as industry and economic events.
Derivatives. Forward foreign currency exchange contracts are generally valued at the mean of the average bid and average ask prices that are reported by currency dealers to a third party pricing service at the valuation time. Such third party pricing service valuations are supplied for specific settlement periods and the Portfolio’s forward foreign currency exchange contracts are valued at an interpolated rate between the closest preceding and subsequent settlement period reported by the third party pricing service.
Foreign Securities and Currencies. Foreign securities and currencies are valued in U.S. dollars, based on foreign currency exchange rate quotations supplied by a third party pricing service. The pricing service uses a proprietary model to determine the exchange rate. Inputs to the model include reported trades and implied bid/ask spreads.
Other. Investments in management investment companies (including money market funds) that do not trade on an exchange are valued at the net asset value as of the close of each business day.
Fair Valuation. In connection with Rule 2a-5 of the 1940 Act, the Trustees have designated the Portfolio’s investment adviser as its valuation designee. Investments for which valuations or market quotations are not readily available or are deemed unreliable are valued by the investment adviser, as valuation designee, at fair value using methods that most fairly reflect the security’s “fair value”, which is the amount that the Portfolio might reasonably expect to receive for the security upon its current sale in the ordinary course. Each such determination is based on a consideration of relevant factors, which are likely to vary from one pricing context to another. These factors may include, but are not limited to, the type of security, the existence of any contractual restrictions on the security’s disposition, the price and extent of public trading in similar securities of the issuer or of comparable companies or entities,
Senior Debt Portfolio
October 31, 2023
Notes to Financial Statements — continued
quotations or relevant information obtained from broker/dealers or other market participants, information obtained from the issuer, analysts, and/or the appropriate stock exchange (for exchange-traded securities), an analysis of the company’s or entity’s financial statements, and an evaluation of the forces that influence the issuer and the market(s) in which the security is purchased and sold.
B Investment Transactions—Investment transactions for financial statement purposes are accounted for on a trade date basis. Realized gains and losses on investments sold are determined on the basis of identified cost.
C Income—Interest income is recorded on the basis of interest accrued, adjusted for amortization of premium or accretion of discount. Fees associated with loan amendments are recognized immediately. Dividend income is recorded on the ex-dividend date for dividends received in cash and/or securities. Withholding taxes on foreign dividends have been provided for in accordance with the Portfolio’s understanding of the applicable countries’ tax rules and rates. Distributions from investment companies are recorded as dividend income, capital gains or return of capital based on the nature of the distribution.
D Federal Taxes—The Portfolio has elected to be treated as a partnership for federal tax purposes. No provision is made by the Portfolio for federal or state taxes on any taxable income of the Portfolio because each investor in the Portfolio is ultimately responsible for the payment of any taxes on its share of taxable income. Since at least one of the Portfolio's investors is a regulated investment company that invests all or substantially all of its assets in the Portfolio, the Portfolio normally must satisfy the applicable source of income and diversification requirements (under the Internal Revenue Code) in order for its investors to satisfy them. The Portfolio will allocate, at least annually among its investors, each investor's distributive share of the Portfolio's net investment income, net realized capital gains and losses and any other items of income, gain, loss, deduction or credit.
As of October 31, 2023, the Portfolio had no uncertain tax positions that would require financial statement recognition, de-recognition, or disclosure. The Portfolio files a U.S. federal income tax return annually after its fiscal year-end, which is subject to examination by the Internal Revenue Service for a period of three years from the date of filing.
E Foreign Currency Translation—Investment valuations, other assets, and liabilities initially expressed in foreign currencies are translated each business day into U.S. dollars based upon current exchange rates. Purchases and sales of foreign investment securities and income and expenses denominated in foreign currencies are translated into U.S. dollars based upon currency exchange rates in effect on the respective dates of such transactions. Recognized gains or losses on investment transactions attributable to changes in foreign currency exchange rates are recorded for financial statement purposes as net realized gains and losses on investments. That portion of unrealized gains and losses on investments that results from fluctuations in foreign currency exchange rates is not separately disclosed.
F Unfunded Loan Commitments—The Portfolio may enter into certain loan agreements all or a portion of which may be unfunded. The Portfolio is obligated to fund these commitments at the borrower's discretion. These commitments are disclosed in the accompanying Portfolio of Investments. At October 31, 2023, the Portfolio had sufficient cash and/or securities to cover these commitments.
G Use of Estimates—The preparation of the financial statements in conformity with U.S. GAAP requires management to make estimates and assumptions that affect the reported amounts of assets and liabilities at the date of the financial statements and the reported amounts of income and expense during the reporting period. Actual results could differ from those estimates.
H Indemnifications—Under the Portfolio’s organizational documents, its officers and Trustees may be indemnified against certain liabilities and expenses arising out of the performance of their duties to the Portfolio. Under Massachusetts law, if certain conditions prevail, interestholders in the Portfolio could be deemed to have personal liability for the obligations of the Portfolio. However, the Portfolio’s Declaration of Trust contains an express disclaimer of liability on the part of Portfolio interestholders. Additionally, in the normal course of business, the Portfolio enters into agreements with service providers that may contain indemnification clauses. The Portfolio’s maximum exposure under these arrangements is unknown as this would involve future claims that may be made against the Portfolio that have not yet occurred.
I Forward Foreign Currency Exchange Contracts—The Portfolio may enter into forward foreign currency exchange contracts for the purchase or sale of a specific foreign currency at a fixed price on a future date. The forward foreign currency exchange contracts are adjusted by the daily exchange rate of the underlying currency and any gains or losses are recorded as unrealized until such time as the contracts have been closed. Risks may arise upon entering these contracts from the potential inability of counterparties to meet the terms of their contracts and from movements in the value of a foreign currency relative to the U.S. dollar.
J When-Issued Securities and Delayed Delivery Transactions—The Portfolio may purchase securities on a delayed delivery or when-issued basis. Payment and delivery may take place after the customary settlement period for that security. At the time the transaction is negotiated, the price of the security that will be delivered is fixed. The Portfolio maintains cash and/or security positions for these commitments such that sufficient liquid assets will be available to make payments upon settlement. Securities purchased on a delayed delivery or when-issued basis are marked-to-market daily and begin earning interest on settlement date. Such security purchases are subject to the risk that when delivered they will be worth less than the agreed upon payment price. Losses may also arise if the counterparty does not perform under the contract.
Senior Debt Portfolio
October 31, 2023
Notes to Financial Statements — continued
2 Investment Adviser Fee and Other Transactions with Affiliates
The investment adviser fee is earned by Boston Management and Research (BMR), an indirect, wholly-owned subsidiary of Morgan Stanley, as compensation for investment advisory services rendered to the Portfolio. The fee is computed at an annual rate as a percentage of average daily gross assets as follows and is payable monthly:
| Average Daily Gross Assets | Annual Fee Rate |
| Up to and including $1 billion | 0.5000% |
| In excess of $1 billion up to and including $2 billion | 0.4500% |
| In excess of $2 billion up to and including $7 billion | 0.4000% |
| In excess of $7 billion up to and including $10 billion | 0.3875% |
| In excess of $10 billion up to and including $15 billion | 0.3750% |
| In excess of $15 billion | 0.3625% |
Gross assets are calculated by deducting all liabilities of the Portfolio except the principal amount of any indebtedness for money borrowed. For the year ended October 31, 2023, the Portfolio’s investment adviser fee amounted to $33,952,435 or 0.54% of the Portfolio's average daily net assets. The Portfolio may invest in a money market fund, the Institutional Class of the Morgan Stanley Institutional Liquidity Funds - Government Portfolio (the “Liquidity Fund”), an open-end management investment company managed by Morgan Stanley Investment Management Inc., a wholly-owned subsidiary of Morgan Stanley. The investment adviser fee paid by the Portfolio is reduced by an amount equal to its pro rata share of the advisory and administration fees paid by the Portfolio due to its investment in the Liquidity Fund. For the year ended October 31, 2023, the investment adviser fee paid was reduced by $187,525 relating to the Portfolio's investment in the Liquidity Fund.
Trustees and officers of the Portfolio who are members of BMR’s organization receive remuneration for their services to the Portfolio out of the investment adviser fee. Trustees of the Portfolio who are not affiliated with the investment adviser may elect to defer receipt of all or a percentage of their annual fees in accordance with the terms of the Trustees Deferred Compensation Plan. Certain officers and Trustees of the Portfolio are officers of the above organization.
3 Purchases and Sales of Investments
Purchases and sales of investments, other than short-term obligations and including maturities, paydowns and principal repayments on Senior Loans, aggregated $1,391,620,740 and $3,439,247,956, respectively, for the year ended October 31, 2023.
4 Federal Income Tax Basis of Investments
The cost and unrealized appreciation (depreciation) of investments, including open derivative contracts, of the Portfolio at October 31, 2023, as determined on a federal income tax basis, were as follows:
| Aggregate cost | $7,855,187,552 |
| Gross unrealized appreciation | $ 33,109,887 |
| Gross unrealized depreciation | (475,470,273) |
| Net unrealized depreciation | $ (442,360,386) |
5 Financial Instruments
The Portfolio may trade in financial instruments with off-balance sheet risk in the normal course of its investing activities. These financial instruments may include forward foreign currency exchange contracts and may involve, to a varying degree, elements of risk in excess of the amounts recognized for financial statement purposes. The notional or contractual amounts of these instruments represent the investment the Portfolio has in particular classes of financial instruments and do not necessarily represent the amounts potentially subject to risk. The measurement of the risks associated with these instruments is meaningful only when all related and offsetting transactions are considered. A summary of obligations under these financial instruments at October 31, 2023 is included in the Portfolio of Investments. At October 31, 2023, the Portfolio had sufficient cash and/or securities to cover commitments under these contracts.
Senior Debt Portfolio
October 31, 2023
Notes to Financial Statements — continued
The Portfolio is subject to foreign exchange risk in the normal course of pursuing its investment objective. Because the Portfolio holds foreign currency denominated investments, the value of these investments and related receivables and payables may change due to future changes in foreign currency exchange rates. To hedge against this risk, the Portfolio enters into forward foreign currency exchange contracts.
The Portfolio enters into forward foreign currency exchange contracts that may contain provisions whereby the counterparty may terminate the contract under certain conditions, including but not limited to a decline in the Portfolio's net assets below a certain level over a certain period of time, which would trigger a payment by the Portfolio for those derivatives in a liability position. At October 31, 2023, the fair value of derivatives with credit related contingent features in a net liability position was $1,834,081. The aggregate fair value of assets pledged as collateral by the Portfolio for such liability was $1,720,000 at October 31, 2023.
The over-the-counter (OTC) derivatives in which the Portfolio invests are subject to the risk that the counterparty to the contract fails to perform its obligations under the contract. To mitigate this risk, the Portfolio has entered into an International Swaps and Derivatives Association, Inc. Master Agreement (“ISDA Master Agreement”) or similar agreement with substantially all its derivative counterparties. An ISDA Master Agreement is a bilateral agreement between the Portfolio and a counterparty that governs certain OTC derivatives and typically contains, among other things, set-off provisions in the event of a default and/or termination event as defined under the relevant ISDA Master Agreement. Under an ISDA Master Agreement, the Portfolio may, under certain circumstances, offset with the counterparty certain derivative financial instruments’ payables and/or receivables with collateral held and/or posted and create one single net payment. The provisions of the ISDA Master Agreement typically permit a single net payment in the event of default including the bankruptcy or insolvency of the counterparty. However, bankruptcy or insolvency laws of a particular jurisdiction may impose restrictions on or prohibitions against the right of offset in bankruptcy or insolvency. Certain ISDA Master Agreements allow counterparties to OTC derivatives to terminate derivative contracts prior to maturity in the event the Portfolio’s net assets decline by a stated percentage or the Portfolio fails to meet the terms of its ISDA Master Agreements, which would cause the counterparty to accelerate payment by the Portfolio of any net liability owed to it.
The collateral requirements for derivatives traded under an ISDA Master Agreement are governed by a Credit Support Annex to the ISDA Master Agreement. Collateral requirements are determined at the close of business each day and are typically based on changes in market values for each transaction under an ISDA Master Agreement and netted into one amount for such agreement. Generally, the amount of collateral due from or to a counterparty is subject to a minimum transfer threshold amount before a transfer is required, which may vary by counterparty. Collateral pledged for the benefit of the Portfolio and/or counterparty is held in segregated accounts by the Portfolio’s custodian and cannot be sold, re-pledged, assigned or otherwise used while pledged. The portion of such collateral representing cash, if any, is reflected as deposits for derivatives collateral and, in the case of cash pledged by a counterparty for the benefit of the Portfolio, a corresponding liability on the Statement of Assets and Liabilities. Securities pledged by the Portfolio as collateral, if any, are identified as such in the Portfolio of Investments.
The fair value of open derivative instruments (not considered to be hedging instruments for accounting disclosure purposes) and whose primary underlying risk exposure is foreign exchange risk at October 31, 2023 was as follows:
| | Fair Value |
| Derivative | Asset Derivative(1) | Liability Derivative(2) |
| Forward foreign currency exchange contracts | $9,783,097 | $(1,834,081) |
| (1) | Statement of Assets and Liabilities location: Receivable for open forward foreign currency exchange contracts. |
| (2) | Statement of Assets and Liabilities location: Payable for open forward foreign currency exchange contracts. |
Senior Debt Portfolio
October 31, 2023
Notes to Financial Statements — continued
The Portfolio's derivative assets and liabilities at fair value by type, which are reported gross in the Statement of Assets and Liabilities, are presented in the table above.The following tables present the Portfolio’s derivative assets and liabilities by counterparty, net of amounts available for offset under a master netting agreement and net of the related collateral received by the Portfolio for such assets and pledged by the Portfolio for such liabilities as of October 31, 2023.
| Counterparty | Derivative
Assets Subject to
Master Netting
Agreement | Derivatives
Available
for Offset | Non-cash
Collateral
Received(a) | Cash
Collateral
Received(a) | Net Amount
of Derivative
Assets(b) |
| Bank of America, N.A. | $ 5,413,347 | $ — | $ (5,133,962) | $ — | $ 279,385 |
| Standard Chartered Bank | 620,799 | (445,410) | — | — | 175,389 |
| State Street Bank and Trust Company | 3,682,870 | (662,193) | (1,523,875) | — | 1,496,802 |
| The Toronto-Dominion Bank | 66,081 | — | — | — | 66,081 |
| | $9,783,097 | $(1,107,603) | $(6,657,837) | $ — | $2,017,657 |
| Counterparty | Derivative
Liabilities Subject to
Master Netting
Agreement | Derivatives
Available
for Offset | Non-cash
Collateral
Pledged(a) | Cash
Collateral
Pledged(a) | Net Amount
of Derivative
Liabilities(c) |
| Australia and New Zealand Banking Group Limited | $ (238,651) | $ — | $ — | $ 238,651 | $ — |
| Citibank, N.A. | (300,653) | — | — | 300,653 | — |
| Goldman Sachs International | (187,174) | — | — | 187,174 | — |
| Standard Chartered Bank | (445,410) | 445,410 | — | — | — |
| State Street Bank and Trust Company | (662,193) | 662,193 | — | — | — |
| | $(1,834,081) | $1,107,603 | $ — | $726,478 | $ — |
| (a) | In some instances, the total collateral received and/or pledged may be more than the amount shown due to overcollateralization. |
| (b) | Net amount represents the net amount due from the counterparty in the event of default. |
| (c) | Net amount represents the net amount payable to the counterparty in the event of default. |
The effect of derivative instruments (not considered to be hedging instruments for accounting disclosure purposes) on the Statement of Operations and whose primary underlying risk is foreign exchange risk for the year ended October 31, 2023 was as follows:
| Derivative | Realized Gain (Loss)
on Derivatives Recognized
in Income(1) | Change in Unrealized
Appreciation (Depreciation) on
Derivatives Recognized in Income(2) |
| Forward foreign currency exchange contracts | $(67,585,880) | $11,505,499 |
| (1) | Statement of Operations location: Net realized gain (loss): Forward foreign currency exchange contracts. |
| (2) | Statement of Operations location: Change in unrealized appreciation (depreciation): Forward foreign currency exchange contracts. |
The average notional amount of forward foreign currency exchange contracts (based on the absolute value of notional amounts of currency purchased and currency sold) outstanding during the year ended October 31, 2023, which is indicative of the volume of this derivative type, was approximately $1,353,880,000.
Senior Debt Portfolio
October 31, 2023
Notes to Financial Statements — continued
6 Revolving Credit and Security Agreement
The Portfolio has entered into a Revolving Credit and Security Agreement, as amended (the “Loan Facility”), with The Bank of Nova Scotia as direct lender and agent and certain other banks as direct lenders that allows it to borrow up to $2.525 billion ($2.825 billion prior to March 6, 2023) and to invest the borrowings in accordance with its investment practices. Borrowings under the Loan Facility are secured by the assets of the Portfolio and the Loan Facility is in effect through March 4, 2024. The Portfolio pays (1) an upfront fee equal to 0.15% of the total commitment amount under the Loan Facility, (2) a drawn fee equal to 0.90% per annum on outstanding borrowings (or, during periods prior to March 6, 2023, Term SOFR plus 0.11448% credit spread adjustment plus 4.40% on the outstanding borrowings funded by secondary lenders and a drawn fee equal to 0.90% per annum on outstanding borrowings funded by conduit lenders), and (3) a liquidity fee equal to 0.15% or 0.25% per annum of the undrawn amount under the Loan Facility depending on the amount borrowed by the Portfolio thereunder.
Prior to December 7, 2022, the lenders under the Loan Facility were certain conduits that issued commercial paper and were sponsored by Citibank, N.A. (“Citi”), with certain banks serving as direct lenders and Citi serving as secondary lender and agent for the conduit lenders. The Bank of Nova Scotia became lead agent on December 7, 2022 and, effective March 6, 2023, Citi and the conduit lenders exited the Loan Facility and the facility size decreased from $2.825 billion to $2.525 billion.
Drawn and liquidity fees for the year ended October 31, 2023 totaled $18,048,519 and are included in interest expense and fees on the Statement of Operations. In connection with the renewal of the Loan Facility on March 6, 2023, the Portfolio paid upfront fees of $3,787,500. These upfront fees are being amortized to interest expense through March 4, 2024. The unamortized balance at October 31, 2023 is approximately $1,307,000 and is included in prepaid upfront fees on notes payable on the Statement of Assets and Liabilities. At October 31, 2023, the Portfolio had borrowings outstanding under the Loan Facility of $1,525,000,000 at an annual interest rate of 5.45%. Based on the short-term nature of borrowings under the Loan Facility and the variable interest rate, the carrying amount of the borrowings at October 31, 2023 approximated its fair value. If measured at fair value, borrowings under the Loan Facility would have been considered as Level 2 in the fair value hierarchy (see Note 8) at October 31, 2023. For the year ended October 31, 2023, the average borrowings under the Loan Facility and the average annual interest rate (excluding fees) were $1,805,068,493 and 5.09%, respectively.
7 Affiliated Investments
At October 31, 2023, the value of the Portfolio's investment in funds that may be deemed to be affiliated was $83,572,578, which represents 1.4% of the Portfolio's net assets. Transactions in such investments by the Portfolio for the year ended October 31, 2023 were as follows:
| Name | Value,
beginning
of period | Purchases | Sales
proceeds | Net
realized
gain (loss) | Change in
unrealized
appreciation
(depreciation) | Value, end
of period | Dividend
income | Shares,
end of period |
| Short-Term Investments |
| Liquidity Fund | $86,209,963 | $2,721,664,974 | $(2,724,302,359) | $ — | $ — | $83,572,578 | $5,747,653 | 83,572,578 |
8 Fair Value Measurements
Under generally accepted accounting principles for fair value measurements, a three-tier hierarchy to prioritize the assumptions, referred to as inputs, is used in valuation techniques to measure fair value. The three-tier hierarchy of inputs is summarized in the three broad levels listed below.
| • | Level 1 – quoted prices in active markets for identical investments |
| • | Level 2 – other significant observable inputs (including quoted prices for similar investments, interest rates, prepayment speeds, credit risk, etc.) |
| • | Level 3 – significant unobservable inputs (including a fund's own assumptions in determining the fair value of investments) |
In cases where the inputs used to measure fair value fall in different levels of the fair value hierarchy, the level disclosed is determined based on the lowest level input that is significant to the fair value measurement in its entirety. The inputs or methodology used for valuing securities are not necessarily an indication of the risk associated with investing in those securities.
Senior Debt Portfolio
October 31, 2023
Notes to Financial Statements — continued
At October 31, 2023, the hierarchy of inputs used in valuing the Portfolio's investments and open derivative instruments, which are carried at fair value, were as follows:
| Asset Description | Level 1 | Level 2 | Level 3* | Total |
| Asset-Backed Securities | $ — | $ 287,354,466 | $ — | $ 287,354,466 |
| Common Stocks | 949,757 | 37,448,962 | 674,474 | 39,073,193 |
| Corporate Bonds | — | 607,931,525 | — | 607,931,525 |
| Exchange-Traded Funds | 15,955,200 | — | — | 15,955,200 |
| Preferred Stocks | — | 7,359,595 | — | 7,359,595 |
| Senior Floating-Rate Loans (Less Unfunded Loan Commitments) | — | 6,354,393,345 | 17,187,264 | 6,371,580,609 |
| Short-Term Investments | 83,572,578 | — | — | 83,572,578 |
| Total Investments | $ 100,477,535 | $ 7,294,487,893 | $ 17,861,738 | $ 7,412,827,166 |
| Forward Foreign Currency Exchange Contracts | $ — | $ 9,783,097 | $ — | $ 9,783,097 |
| Total | $ 100,477,535 | $ 7,304,270,990 | $ 17,861,738 | $ 7,422,610,263 |
| Liability Description | | | | |
| Forward Foreign Currency Exchange Contracts | $ — | $ (1,834,081) | $ — | $ (1,834,081) |
| Total | $ — | $ (1,834,081) | $ — | $ (1,834,081) |
| * | None of the unobservable inputs for Level 3 assets, individually or collectively, had a material impact on the Portfolio. |
Level 3 investments at the beginning and/or end of the period in relation to net assets were not significant and accordingly, a reconciliation of Level 3 assets for the year ended October 31, 2023 is not presented.
9 Risks and Uncertainties
Risks Associated with Foreign Investments
Foreign investments can be adversely affected by political, economic and market developments abroad, including the imposition of economic and other sanctions by the United States or another country. There may be less publicly available information about foreign issuers because they may not be subject to reporting practices, requirements or regulations comparable to those to which United States companies are subject. Foreign markets may be smaller, less liquid and more volatile than the major markets in the United States. Trading in foreign markets typically involves higher expense than trading in the United States. The Portfolio may have difficulties enforcing its legal or contractual rights in a foreign country. Securities that trade or are denominated in currencies other than the U.S. dollar may be adversely affected by fluctuations in currency exchange rates.
Credit Risk
The Portfolio invests primarily in below investment grade floating-rate loans, which are considered speculative because of the credit risk of their issuers. Changes in economic conditions or other circumstances are more likely to reduce the capacity of issuers of these securities to make principal and interest payments. Such companies are more likely to default on their payments of interest and principal owed than issuers of investment grade bonds. An economic downturn generally leads to a higher non-payment rate, and a loan or other debt obligation may lose significant value before a default occurs. Lower rated investments also may be subject to greater price volatility than higher rated investments. Moreover, the specific collateral used to secure a loan may decline in value or become illiquid, which would adversely affect the loan’s value.
Senior Debt Portfolio
October 31, 2023
Report of Independent Registered Public Accounting Firm
To the Trustees and Investors of Senior Debt Portfolio:
Opinion on the Financial Statements and Financial Highlights
We have audited the accompanying statement of assets and liabilities of Senior Debt Portfolio (the “Portfolio”), including the portfolio of investments, as of October 31, 2023, the related statements of operations and cash flows for the year then ended, the statements of changes in net assets for each of the two years in the period then ended, the financial highlights for each of the five years in the period then ended, and the related notes. In our opinion, the financial statements and financial highlights present fairly, in all material respects, the financial position of the Portfolio as of October 31, 2023, and the results of its operations and its cash flows for the year then ended, the changes in its net assets for each of the two years in the period then ended, and the financial highlights for each of the five years in the period then ended, in conformity with accounting principles generally accepted in the United States of America.
Basis for Opinion
These financial statements and financial highlights are the responsibility of the Portfolio’s management. Our responsibility is to express an opinion on the Portfolio’s financial statements and financial highlights based on our audits. We are a public accounting firm registered with the Public Company Accounting Oversight Board (United States) (PCAOB) and are required to be independent with respect to the Portfolio in accordance with the U.S. federal securities laws and the applicable rules and regulations of the Securities and Exchange Commission and the PCAOB.
We conducted our audits in accordance with the standards of the PCAOB. Those standards require that we plan and perform the audit to obtain reasonable assurance about whether the financial statements and financial highlights are free of material misstatement, whether due to error or fraud. The Portfolio is not required to have, nor were we engaged to perform, an audit of its internal control over financial reporting. As part of our audits, we are required to obtain an understanding of internal control over financial reporting but not for the purpose of expressing an opinion on the effectiveness of the Portfolio’s internal control over financial reporting. Accordingly, we express no such opinion.
Our audits included performing procedures to assess the risks of material misstatement of the financial statements and financial highlights, whether due to error or fraud, and performing procedures that respond to those risks. Such procedures included examining, on a test basis, evidence regarding the amounts and disclosures in the financial statements and financial highlights. Our audits also included evaluating the accounting principles used and significant estimates made by management, as well as evaluating the overall presentation of the financial statements and financial highlights. Our procedures included confirmation of securities and senior loans owned as of October 31, 2023, by correspondence with the custodian, brokers and agent banks; when replies were not received from brokers and agent banks, we performed other auditing procedures. We believe that our audits provide a reasonable basis for our opinion.
/s/ Deloitte & Touche LLP
Boston, Massachusetts
December 19, 2023
We have served as the auditor of one or more Eaton Vance investment companies since 1959.
Eaton Vance
Floating-Rate Advantage Fund
October 31, 2023
Board of Trustees’ Contract Approval
Overview of the Contract Review Process
The Investment Company Act of 1940, as amended (the “1940 Act”), provides, in substance, that the investment advisory agreement between a fund and its investment adviser will continue in effect from year-to-year only if its continuation is approved on an annual basis by a vote of the fund’s board of trustees, including a majority of the trustees who are not “interested persons” of the fund (“independent trustees”), cast in person at a meeting called for the purpose of considering such approval.
At a meeting held on June 8, 2023, the Boards of Trustees/Directors (collectively, the “Board”) that oversee the registered investment companies advised by Eaton Vance Management or its affiliate, Boston Management and Research (the “Eaton Vance Funds”), including a majority of the independent trustees (the “Independent Trustees”), voted to approve the continuation of existing investment advisory agreements and sub-advisory agreements1 for each of the Eaton Vance Funds for an additional one-year period. The Board relied upon the affirmative recommendation of its Contract Review Committee, which is a committee exclusively comprised of Independent Trustees. Prior to making its recommendation, the Contract Review Committee reviewed information furnished by the adviser and sub-adviser to each of the Eaton Vance Funds (including information specifically requested by the Board) for a series of formal meetings held between April and June 2023, as well as certain additional information provided in response to specific requests from the Independent Trustees as members of the Contract Review Committee. Members of the Contract Review Committee also considered information received at prior meetings of the Board and its committees, to the extent such information was relevant to the Contract Review Committee’s annual evaluation of the investment advisory agreements and sub-advisory agreements.
In connection with its evaluation of the investment advisory agreements and sub-advisory agreements, the Board considered various information relating to the Eaton Vance Funds. This included information applicable to all or groups of Eaton Vance Funds, which is referenced immediately below, and information applicable to the particular Eaton Vance Fund covered by this report (each “Eaton Vance Fund” is referred to below as a “fund”). (For funds that invest through one or more underlying portfolios, references to “each fund” in this section may include information that was considered at the portfolio-level.)
Information about Fees, Performance and Expenses
• A report from an independent data provider comparing advisory and other fees paid by each fund to such fees paid by comparable funds, as identified by the independent data provider (“comparable funds”);
• A report from an independent data provider comparing each fund’s total expense ratio (and its components) to those of comparable funds;
• A report from an independent data provider comparing the investment performance of each fund (including, as relevant, total return data, income data, Sharpe ratios and information ratios) to the investment performance of comparable funds and, as applicable, benchmark indices, over various time periods;
• In certain instances, data regarding investment performance relative to customized groups of peer funds and blended indices identified by the adviser in consultation with the Portfolio Management Committee of the Board (a committee exclusively comprised of Independent Trustees);
• Comparative information concerning the fees charged and services provided by the adviser and sub-adviser to each fund in managing other accounts (which may include other mutual funds, collective investment funds and institutional accounts) using investment strategies and techniques similar to those used in managing such fund(s), if any;
• Profitability analyses with respect to the adviser and sub-adviser to each of the funds;
Information about Portfolio Management and Trading
• Descriptions of the investment management services provided to each fund, as well as each of the funds’ investment strategies and policies;
• The procedures and processes used to determine the value of fund assets, including, when necessary, the determination of “fair value” and actions taken to monitor and test the effectiveness of such procedures and processes;
• Information about the policies and practices of each fund’s adviser and sub-adviser with respect to trading, including their processes for seeking best execution of portfolio transactions;
• Information about the allocation of brokerage transactions and the benefits, if any, received by the adviser and sub-adviser to each fund as a result of brokerage allocation, including, as applicable, information concerning the acquisition of research through client commission arrangements and policies with respect to “soft dollars”;
• Data relating to the portfolio turnover rate of each fund and related information regarding active management in the context of particular strategies;
Information about each Adviser and Sub-adviser
• Reports detailing the financial results and condition of the adviser and sub-adviser to each fund;
• Information regarding the individual investment professionals whose responsibilities include portfolio management and investment research for the funds, and, for portfolio managers and certain other investment professionals, information relating to their responsibilities with respect to managing other mutual funds and investment accounts, as applicable;
1 Not all Eaton Vance Funds have entered into a sub-advisory agreement with a sub-adviser. Accordingly, references to “sub-adviser” or “sub-advisory agreement” in this “Overview” section may not be applicable to the particular Eaton Vance Fund covered by this report.
Eaton Vance
Floating-Rate Advantage Fund
October 31, 2023
Board of Trustees’ Contract Approval — continued
• Information regarding the adviser’s and its parent company’s (Morgan Stanley’s) efforts to retain and attract talented investment professionals, including in the context of a competitive marketplace for talent, as well as the ongoing unique environment presented by hybrid, remote and other alternative work arrangements;
• Information regarding the adviser’s compensation methodology for its investment professionals and the incentives and accountability it creates, along with investment professionals’ investments in the fund(s) they manage;
• The Code of Ethics of the adviser and its affiliates and the sub-adviser of each fund, together with information relating to compliance with, and the administration of, such codes;
• Policies and procedures relating to proxy voting, including regular reporting with respect to fund proxy voting activities;
• Information regarding the handling of corporate actions and class actions, as well as information regarding litigation and other regulatory matters;
• Information concerning the resources devoted to compliance efforts undertaken by the adviser and its affiliates and the sub-adviser of each fund, if any, including descriptions of their various compliance programs and their record of compliance;
• Information concerning the business continuity and disaster recovery plans of the adviser and its affiliates and the sub-adviser of each fund, if any;
• A description of Eaton Vance Management’s and Boston Management and Research’s oversight of sub-advisers, including with respect to regulatory and compliance issues, investment management and other matters;
Other Relevant Information
• Information regarding ongoing initiatives to further integrate and harmonize, where applicable, the investment management and other departments of the adviser and its affiliates with the overall investment management infrastructure of Morgan Stanley, in light of Morgan Stanley’s acquisition of Eaton Vance Corp. on March 1, 2021;
• Information concerning the nature, cost and character of the administrative and other non-investment advisory services provided by Eaton Vance Management and its affiliates;
• Information concerning oversight of the relationship with the custodian, subcustodians, fund accountants, and other third-party service providers by the adviser and/or administrator to each of the funds;
• Information concerning efforts to implement policies and procedures with respect to various recently adopted regulations applicable to the funds, including Rule 12d1-4 (the Fund-of-Funds Rule), Rule 18f-4 (the Derivatives Rule) and Rule 2a-5 (the Fair Valuation Rule);
• For an Eaton Vance Fund structured as an exchange-listed closed-end fund, information concerning the benefits of the closed-end fund structure, as well as, where relevant, the closed-end fund’s market prices (including as compared to the closed-end fund’s net asset value (NAV)), trading volume data, continued use of auction preferred shares (where applicable), distribution rates and other relevant matters;
• The risks which the adviser and/or its affiliates incur in connection with the management and operation of the funds, including, among others, litigation, regulatory, entrepreneurial, and other business risks (and the associated costs of such risks); and
• The terms of each investment advisory agreement and sub-advisory agreement.
During the various meetings of the Board and its committees over the course of the year leading up to the June 8, 2023 meeting, the Board received information from portfolio managers and other investment professionals of the advisers and sub-advisers of the funds regarding investment and performance matters, and considered various investment and trading strategies used in pursuing the funds’ investment objectives. The Board also received information regarding risk management techniques employed in connection with the management of the funds. The Board and its committees evaluated issues pertaining to industry and regulatory developments, compliance procedures, fund governance and other issues with respect to the funds, and received and participated in reports and presentations provided by Eaton Vance Management, Boston Management and Research and fund sub-advisers, with respect to such matters. In addition to the formal meetings of the Board and its committees, the Independent Trustees held regular teleconferences to discuss, among other topics, matters relating to the continuation of investment advisory agreements and sub-advisory agreements.
The Contract Review Committee was advised throughout the contract review process by Goodwin Procter LLP, independent legal counsel for the Independent Trustees. The members of the Contract Review Committee, with the advice of such counsel, exercised their own business judgment in determining the material factors to be considered in evaluating each investment advisory agreement and sub-advisory agreement and the weight to be given to each such factor. The conclusions reached with respect to each investment advisory agreement and sub-advisory agreement were based on a comprehensive evaluation of all the information provided and not any single factor. Moreover, each member of the Contract Review Committee may have placed varying emphasis on particular factors in reaching conclusions with respect to each investment advisory agreement and sub-advisory agreement. In evaluating each investment advisory agreement and sub-advisory agreement, including the fee structures and other terms contained in such agreements, the members of the Contract Review Committee were also informed by multiple years of analysis and discussion with the adviser and sub-adviser to each of the Eaton Vance Funds.
Results of the Contract Review Process
Based on its consideration of the foregoing, and such other information it deemed relevant, including the factors and conclusions described below, the Contract Review Committee concluded that the continuation of the investment advisory agreement between Eaton Vance Floating-Rate Advantage Fund (the “Fund”) and Eaton Vance Management (“EVM”), as well as the investment advisory agreement between Senior Debt Portfolio (the “Portfolio”), the portfolio in which the Fund invests, and Boston Management and Research (“BMR”) (EVM, with respect to the Fund, and BMR, with respect to the
Eaton Vance
Floating-Rate Advantage Fund
October 31, 2023
Board of Trustees’ Contract Approval — continued
Portfolio, are each referred to herein as the “Adviser”), including their respective fee structures, are in the interests of shareholders and, therefore, recommended to the Board approval of each agreement. Based on the recommendation of the Contract Review Committee, the Board, including a majority of the Independent Trustees, voted to approve continuation of the investment advisory agreements for the Fund and the Portfolio (together, the “investment advisory agreements”).
Nature, Extent and Quality of Services
In considering whether to approve the investment advisory agreements for the Fund and the Portfolio, the Board evaluated the nature, extent and quality of services provided to the Fund and to the Portfolio by the applicable Adviser.
The Board considered each Adviser’s management capabilities and investment processes in light of the types of investments held by the Fund and the Portfolio, including the education, experience and number of investment professionals and other personnel who provide portfolio management, investment research, and similar services to the Portfolio, including recent changes to such personnel. In particular, the Board considered the abilities and experience of each Adviser’s investment professionals in analyzing special considerations relevant to investing in senior floating rate loans. The Board considered each Adviser’s large group of bank loan investment professionals and other personnel who provide services to the Fund and to the Portfolio, including portfolio managers and analysts. The Board also took into account the resources dedicated to portfolio management and other services, the compensation methods of each Adviser and other factors, including the reputation and resources of the Adviser to recruit and retain highly qualified research, advisory and supervisory investment professionals. In addition, the Board considered the time and attention devoted to the Eaton Vance Funds, including the Fund and the Portfolio, by senior management, as well as the infrastructure, operational capabilities and support staff in place to assist in the portfolio management and operations of the Fund and the Portfolio, including the provision of administrative services. The Board also considered the business-related and other risks to which each Adviser or its affiliates may be subject in managing the Fund and the Portfolio.
The Board noted that, under the terms of the investment advisory agreement of the Fund, EVM may invest assets of the Fund directly in securities, for which it would receive a fee, or in the Portfolio, for which it receives no separate fee but for which BMR receives an advisory fee from the Portfolio.
The Board considered the compliance programs of each Adviser and relevant affiliates thereof. The Board considered compliance and reporting matters regarding, among other things, personal trading by investment professionals, disclosure of portfolio holdings, late trading, frequent trading, portfolio valuation, business continuity and the allocation of investment opportunities. The Board also considered the responses of each Adviser and its affiliates to requests in recent years from regulatory authorities, such as the Securities and Exchange Commission and the Financial Industry Regulatory Authority.
The Board considered other administrative services provided or overseen by EVM and its affiliates, including transfer agency and accounting services. The Board evaluated the benefits to shareholders of investing in a fund that is a part of a large fund complex offering exposure to a variety of asset classes and investment disciplines, as well as the ability, in many cases, to exchange an investment among different funds without incurring additional sales charges.
After consideration of the foregoing factors, among others, the Board concluded that the nature, extent and quality of services provided by each Adviser, taken as a whole, are appropriate and consistent with the terms of the applicable investment advisory agreement.
Fund Performance
The Board compared the Fund’s investment performance to that of comparable funds identified by an independent data provider (the peer group), as well as an appropriate benchmark index. The Board’s review included comparative performance data with respect to the Fund for the one-, three-, five- and ten-year periods ended December 31, 2022. In this regard, the Board noted that the performance of the Fund was consistent with the median performance of the Fund’s peer group for the three-year period. The Board also noted that the performance of the Fund was lower than its benchmark index for the three-year period. The Board concluded that the performance of the Fund was satisfactory.
Management Fees and Expenses
The Board considered contractual fee rates payable by the Portfolio and by the Fund for advisory and administrative services (referred to collectively as “management fees”). As part of its review, the Board considered the Fund’s management fees and total expense ratio for the one-year period ended December 31, 2022, as compared to those of comparable funds, before and after giving effect to any undertaking to waive fees or reimburse expenses. The Board also considered certain factors identified by management in response to inquiries from the Contract Review Committee regarding the Fund’s total expense ratio relative to comparable funds.
After considering the foregoing information, and in light of the nature, extent and quality of the services provided by each Adviser, the Board concluded that the management fees charged for advisory and related services are reasonable.
Profitability and “Fall-Out” Benefits
The Board considered the level of profits realized by each Adviser and relevant affiliates thereof in providing investment advisory and administrative services to the Fund, to the Portfolio and to all Eaton Vance Funds as a group. The Board considered the level of profits realized without regard to marketing support or other payments by each Adviser and its affiliates to third parties in respect of distribution or other services.
Eaton Vance
Floating-Rate Advantage Fund
October 31, 2023
Board of Trustees’ Contract Approval — continued
The Board concluded that, in light of the foregoing factors and the nature, extent and quality of the services rendered, the profits realized by each Adviser and its affiliates are deemed not to be excessive.
The Board also considered direct or indirect fall-out benefits received by each Adviser and its affiliates in connection with their respective relationships with the Fund and the Portfolio, including the benefits of research services that may be available to each Adviser as a result of securities transactions effected for the Fund and the Portfolio and other investment advisory clients.
Economies of Scale
In reviewing management fees and profitability, the Board also considered the extent to which the applicable Adviser and its affiliates, on the one hand, and the Fund and the Portfolio, on the other hand, can expect to realize benefits from economies of scale as the assets of the Fund and the Portfolio increase. The Board acknowledged the difficulty in accurately measuring the benefits resulting from economies of scale, if any, with respect to the management of any specific fund or group of funds. The Board reviewed data summarizing the increases and decreases in the assets of the Fund and of all Eaton Vance Funds as a group over various time periods, and evaluated the extent to which the total expense ratio of the Fund and the profitability of each Adviser and its affiliates may have been affected by such increases or decreases. Based upon the foregoing, the Board concluded that the Fund currently shares in the benefits from economies of scale, if any, when they are realized by the Adviser. The Board also concluded that the structure of the advisory fees, which include breakpoints at several asset levels will allow the Fund and the Portfolio to continue to benefit from any economies of scale in the future.
Eaton Vance
Floating-Rate Advantage Fund
October 31, 2023
Liquidity Risk Management Program
The Fund has implemented a written liquidity risk management program (Program) and related procedures to manage its liquidity in accordance with Rule 22e-4 under the Investment Company Act of 1940, as amended (Liquidity Rule). The Liquidity Rule defines “liquidity risk” as the risk that a fund could not meet requests to redeem shares issued by the fund without significant dilution of the remaining investors’ interests in the fund. The Fund’s Board of Trustees/Directors has designated the investment adviser to serve as the administrator of the Program and the related procedures. The administrator has established a Liquidity Risk Management Oversight Committee (Committee) to perform the functions necessary to administer the Program. As part of the Program, the administrator is responsible for identifying illiquid investments and categorizing the relative liquidity of the Fund’s investments in accordance with the Liquidity Rule. Under the Program, the administrator assesses, manages, and periodically reviews the Fund’s liquidity risk, and is responsible for making certain reports to the Fund’s Board of Trustees/Directors and the Securities and Exchange Commission (SEC) regarding the liquidity of the Fund’s investments, and to notify the Board of Trustees/Directors and the SEC of certain liquidity events specified in the Liquidity Rule. The liquidity of the Fund’s portfolio investments is determined based on a number of factors including, but not limited to, relevant market, trading and investment-specific considerations under the Program.
At a meeting of the Fund’s Board of Trustees/Directors on June 7, 2023, the Committee provided a written report to the Fund’s Board of Trustees/
Directors pertaining to the operation, adequacy, and effectiveness of implementation of the Program, as well as the operation of the highly liquid investment minimum (if applicable) for the period January 1, 2022 through December 31, 2022 (Review Period). The Program operated effectively during the Review Period, supporting the administrator’s ability to assess, manage and monitor Fund liquidity risk, including during periods of market volatility and net redemptions. During the Review Period, the Fund met redemption requests on a timely basis.
There can be no assurance that the Program will achieve its objectives in the future. Please refer to the Fund’s prospectus for more information regarding the Fund’s exposure to liquidity risk and other principal risks to which an investment in the Fund may be subject.
Eaton Vance
Floating-Rate Advantage Fund
October 31, 2023
Management and Organization
Fund Management. The Trustees of Eaton Vance Mutual Funds Trust (the Trust) and Senior Debt Portfolio (the Portfolio) are responsible for the overall management and supervision of the Trust's and the Portfolio's affairs. The Board members and officers of the Trust and the Portfolio are listed below. Except as indicated, each individual has held the office shown or other offices in the same company for the last five years. Board members hold indefinite terms of office. Each Trustee holds office until his or her successor is elected and qualified, subject to a prior death, resignation, retirement, disqualification or removal. Under the terms of the Fund's and the Portfolio's current Trustee retirement policy, an Independent Trustee must retire and resign as a Trustee on the earlier of: (i) the first day of July following his or her 74th birthday; or (ii), with limited exception, December 31st of the 20th year in which he or she has served as a Trustee. However, if such retirement and resignation would cause the Fund and the Portfolio to be out of compliance with Section 16 of the 1940 Act or any other regulations or guidance of the SEC, then such retirement and resignation will not become effective until such time as action has been taken for the Fund and the Portfolio to be in compliance therewith. The “noninterested Trustees” consist of those Trustees who are not “interested persons” of the Trust and the Portfolio, as that term is defined under the 1940 Act. The business address of each Board member and officer is Two International Place, Boston, Massachusetts 02110. As used below, “BMR” refers to Boston Management and Research, “EV” refers to EV LLC, “EVM” refers to Eaton Vance Management, "MSIM" refers to Morgan Stanley Investment Management Inc. and “EVD” refers to Eaton Vance Distributors, Inc. EV is the trustee of each of EVM and BMR. Each of EVM, BMR, EVD and EV are indirect, wholly owned subsidiaries of Morgan Stanley. Each officer affiliated with EVM may hold a position with other EVM affiliates that is comparable to his or her position with EVM listed below. Each Trustee oversees 127 funds in the Eaton Vance fund complex (including both funds and portfolios in a hub and spoke structure).
| Name and Year of Birth | Trust/Portfolio
Position(s) | Length of Service | Principal Occupation(s) and Other Directorships
During Past Five Years and Other Relevant Experience |
| Interested Trustee |
Anchal Pachnanda(1)
1980 | Trustee | Since 2023 | Co-Head of Strategy of MSIM (since 2019). Formerly, Head of Strategy of MSIM (2017-2019). Ms. Pachnanda is an interested person because of her position with MSIM, which is an affiliate of the Trust.
Other Directorships. None. |
| Noninterested Trustees |
Alan C. Bowser
1962 | Trustee | Since 2022 | Private investor. Formerly, Chief Diversity Officer, Partner and a member of the Operating Committee, and formerly served as Senior Advisor on Diversity and Inclusion for the firm’s chief executive officer, Co-Head of the Americas Region, and Senior Client Advisor of Bridgewater Associates, an asset management firm (2011- 2023).
Other Directorships. Independent Director of Stout Risius Ross (a middle market professional services advisory firm) (since 2021). |
Mark R. Fetting
1954 | Trustee | Since 2016 | Private investor. Formerly held various positions at Legg Mason, Inc. (investment management firm) (2000-2012), including President, Chief Executive Officer, Director and Chairman (2008-2012), Senior Executive Vice President (2004-2008) and Executive Vice President (2001-2004). Formerly, President of Legg Mason family of funds (2001-2008). Formerly, Division President and Senior Officer of Prudential Financial Group, Inc. and related companies (investment management firm) (1991-2000).
Other Directorships. None. |
Cynthia E. Frost
1961 | Trustee | Since 2014 | Private investor. Formerly, Chief Investment Officer of Brown University (university endowment) (2000-2012). Formerly, Portfolio Strategist for Duke Management Company (university endowment manager) (1995-2000). Formerly, Managing Director, Cambridge Associates (investment consulting company) (1989-1995). Formerly, Consultant, Bain and Company (management consulting firm) (1987-1989). Formerly, Senior Equity Analyst, BA Investment Management Company (1983-1985).
Other Directorships. None. |
George J. Gorman
1952 | Chairperson of the
Board and Trustee | Since 2021
(Chairperson) and 2014 (Trustee) | Principal at George J. Gorman LLC (consulting firm). Formerly, Senior Partner at Ernst & Young LLP (a registered public accounting firm) (1974-2009).
Other Directorships. None. |
Eaton Vance
Floating-Rate Advantage Fund
October 31, 2023
Management and Organization — continued
| Name and Year of Birth | Trust/Portfolio
Position(s) | Length of Service | Principal Occupation(s) and Other Directorships
During Past Five Years and Other Relevant Experience |
| Noninterested Trustees (continued) |
Valerie A. Mosley
1960 | Trustee | Since 2014 | Chairwoman and Chief Executive Officer of Valmo Ventures (a consulting and investment firm). Founder of Upward Wealth, Inc., dba BrightUp, a fintech platform. Formerly, Partner and Senior Vice President, Portfolio Manager and Investment Strategist at Wellington Management Company, LLP (investment management firm) (1992-2012). Formerly, Chief Investment Officer, PG Corbin Asset Management (1990-1992). Formerly worked in institutional corporate bond sales at Kidder Peabody (1986-1990).
Other Directorships. Director of DraftKings, Inc. (digital sports entertainment and gaming company) (since September 2020). Director of Envestnet, Inc. (provider of intelligent systems for wealth management and financial wellness) (since 2018). Formerly, Director of Dynex Capital, Inc. (mortgage REIT) (2013-2020) and Director of Groupon, Inc. (e-commerce provider) (2020-2022). |
Keith Quinton
1958 | Trustee | Since 2018 | Private investor, researcher and lecturer. Formerly, Independent Investment Committee Member at New Hampshire Retirement System (2017-2021). Formerly, Portfolio Manager and Senior Quantitative Analyst at Fidelity Investments (investment management firm) (2001-2014).
Other Directorships. Formerly, Director (2016-2021) and Chairman (2019-2021) of New Hampshire Municipal Bond Bank. |
Marcus L. Smith
1966 | Trustee | Since 2018 | Private investor and independent corporate director. Formerly, Chief Investment Officer, Canada (2012-2017), Chief Investment Officer, Asia (2010-2012), Director of Asian Research (2004-2010) and portfolio manager (2001-2017) at MFS Investment Management (investment management firm).
Other Directorships. Director of First Industrial Realty Trust, Inc. (an industrial REIT) (since 2021). Director of MSCI Inc. (global provider of investment decision support tools) (since 2017). Formerly, Director of DCT Industrial Trust Inc. (logistics real estate company) (2017-2018). |
Susan J. Sutherland
1957 | Trustee | Since 2015 | Private investor. Director of Ascot Group Limited and certain of its subsidiaries (insurance and reinsurance) (since 2017). Formerly, Director of Hagerty Holding Corp. (insurance) (2015-2018) and Montpelier Re Holdings Ltd. (insurance and reinsurance) (2013-2015). Formerly, Associate, Counsel and Partner at Skadden, Arps, Slate, Meagher & Flom LLP (law firm) (1982-2013).
Other Directorships. Formerly, Director of Kairos Acquisition Corp. (insurance/InsurTech acquisition company) (2021-2023). |
Scott E. Wennerholm
1959 | Trustee | Since 2016 | Private investor. Formerly, Trustee at Wheelock College (postsecondary institution) (2012-2018). Formerly, Consultant at GF Parish Group (executive recruiting firm) (2016-2017). Formerly, Chief Operating Officer and Executive Vice President at BNY Mellon Asset Management (investment management firm) (2005-2011). Formerly, Chief Operating Officer and Chief Financial Officer at Natixis Global Asset Management (investment management firm) (1997-2004). Formerly, Vice President at Fidelity Investments Institutional Services (investment management firm) (1994-1997).
Other Directorships. None. |
Nancy A. Wiser
1967 | Trustee | Since 2022 | Formerly, Executive Vice President and the Global Head of Operations at Wells Fargo Asset Management (2011-2021).
Other Directorships. None. |
| Name and Year of Birth | Trust/Portfolio
Position(s) | Length of Service | Principal Occupation(s)
During Past Five Years |
| Principal Officers who are not Trustees |
Kenneth A. Topping
1966 | President | Since 2023 | Vice President and Chief Administrative Officer of EVM and BMR and Chief Operating Officer for Public Markets at MSIM. Also Vice President of Calvert Research and Management (“CRM”) since 2021. Formerly, Chief Operating Officer for Goldman Sachs Asset Management ‘Classic’ (2009-2020). |
Deidre E. Walsh
1971 | Vice President and Chief
Legal Officer | Since 2009 | Vice President of EVM and BMR. Also Vice President of CRM. |
James F. Kirchner
1967 | Treasurer | Since 2007 | Vice President of EVM and BMR. Also Vice President of CRM. |
Eaton Vance
Floating-Rate Advantage Fund
October 31, 2023
Management and Organization — continued
| Name and Year of Birth | Trust/Portfolio
Position(s) | Length of Service | Principal Occupation(s)
During Past Five Years |
| Principal Officers who are not Trustees (continued) |
Nicholas S. Di Lorenzo
1987 | Secretary | Since 2022 | Formerly, associate (2012-2021) and counsel (2022) at Dechert LLP. |
Richard F. Froio
1968 | Chief Compliance
Officer | Since 2017 | Vice President of EVM and BMR since 2017. Formerly, Deputy Chief Compliance Officer (Adviser/Funds) and Chief Compliance Officer (Distribution) at PIMCO (2012-2017) and Managing Director at BlackRock/Barclays Global Investors (2009-2012). |
(1) Ms. Pachnanda began serving as Trustee effective April 1, 2023.
The SAI for the Fund includes additional information about the Trustees and officers of the Fund and the Portfolio and can be obtained without charge on Eaton Vance’s website at www.eatonvance.com or by calling 1-800-262-1122.
| FACTS | WHAT DOES EATON VANCE DO WITH YOUR
PERSONAL INFORMATION? |
| Why? | Financial companies choose how they share your personal information. Federal law gives consumers the right to limit some but not all sharing. Federal law also requires us to tell you how we collect, share, and protect your personal information. Please read this notice carefully to understand what we do. |
| |
| What? | The types of personal information we collect and share depend on the product or service you have with us. This information can include:■ Social Security number and income
■ investment experience and risk tolerance
■ checking account number and wire transfer instructions |
| |
| How? | All financial companies need to share customers’ personal information to run their everyday business. In the section below, we list the reasons financial companies can share their customers’ personal information; the reasons Eaton Vance chooses to share; and whether you can limit this sharing. |
Reasons we can share your
personal information | Does Eaton Vance
share? | Can you limit
this sharing? |
| For our everyday business purposes — such as to process your transactions, maintain your account(s), respond to court orders and legal investigations, or report to credit bureaus | Yes | No |
| For our marketing purposes — to offer our products and services to you | Yes | No |
| For joint marketing with other financial companies | No | We don’t share |
| For our investment management affiliates’ everyday business purposes — information about your transactions, experiences, and creditworthiness | Yes | Yes |
| For our affiliates’ everyday business purposes — information about your transactions and experiences | Yes | No |
| For our affiliates’ everyday business purposes — information about your creditworthiness | No | We don’t share |
| For our investment management affiliates to market to you | Yes | Yes |
| For our affiliates to market to you | No | We don’t share |
| For nonaffiliates to market to you | No | We don’t share |
To limit our
sharing | Call toll-free 1-800-262-1122 or email: EVPrivacy@eatonvance.comPlease note:If you are a new customer, we can begin sharing your information 30 days from the date we sent this notice. When you are no longer our customer, we continue to share your information as described in this notice. However, you can contact us at any time to limit our sharing. |
| Questions? | Call toll-free 1-800-262-1122 or email: EVPrivacy@eatonvance.com |
| Privacy Notice — continued | April 2021 |
| Who we are |
| Who is providing this notice? | Eaton Vance Management, Eaton Vance Distributors, Inc., Eaton Vance Trust Company, Eaton Vance Management (International) Limited, Eaton Vance Advisers International Ltd., Eaton Vance Global Advisors Limited, Eaton Vance Management’s Real Estate Investment Group, Boston Management and Research, Calvert Research and Management, Eaton Vance and Calvert Fund Families and our investment advisory affiliates (“Eaton Vance”) (see Investment Management Affiliates definition below) |
| What we do |
How does Eaton Vance
protect my personal
information? | To protect your personal information from unauthorized access and use, we use security measures that comply with federal law. These measures include computer safeguards and secured files and buildings. We have policies governing the proper handling of customer information by personnel and requiring third parties that provide support to adhere to appropriate security standards with respect to such information. |
How does Eaton Vance
collect my personal
information? | We collect your personal information, for example, when you■ open an account or make deposits or withdrawals from your account
■ buy securities from us or make a wire transfer
■ give us your contact informationWe also collect your personal information from others, such as credit bureaus, affiliates, or other companies. |
| Why can’t I limit all sharing? | Federal law gives you the right to limit only■ sharing for affiliates’ everyday business purposes — information about your creditworthiness
■ affiliates from using your information to market to you
■ sharing for nonaffiliates to market to youState laws and individual companies may give you additional rights to limit sharing. See below for more on your rights under state law. |
| Definitions |
Investment Management
Affiliates | Eaton Vance Investment Management Affiliates include registered investment advisers, registered broker- dealers, and registered and unregistered funds. Investment Management Affiliates does not include entities associated with Morgan Stanley Wealth Management, such as Morgan Stanley Smith Barney LLC and Morgan Stanley & Co. |
| Affiliates | Companies related by common ownership or control. They can be financial and nonfinancial companies.■ Our affiliates include companies with a Morgan Stanley name and financial companies such as Morgan Stanley Smith Barney LLC and Morgan Stanley & Co. |
| Nonaffiliates | Companies not related by common ownership or control. They can be financial and nonfinancial companies.■ Eaton Vance does not share with nonaffiliates so they can market to you. |
| Joint marketing | A formal agreement between nonaffiliated financial companies that together market financial products or services to you.■ Eaton Vance doesn’t jointly market. |
| Other important information |
| Vermont: Except as permitted by law, we will not share personal information we collect about Vermont residents with Nonaffiliates unless you provide us with your written consent to share such information.California: Except as permitted by law, we will not share personal information we collect about California residents with Nonaffiliates and we will limit sharing such personal information with our Affiliates to comply with California privacy laws that apply to us. |
Delivery of Shareholder Documents. The Securities and Exchange Commission (SEC) permits funds to deliver only one copy of shareholder documents, including prospectuses, proxy statements and shareholder reports, to fund investors with multiple accounts at the same residential or post office box address. This practice is often called “householding” and it helps eliminate duplicate mailings to shareholders. Eaton Vance, or your financial intermediary, may household the mailing of your documents indefinitely unless you instruct Eaton Vance, or your financial intermediary, otherwise. If you would prefer that your Eaton Vance documents not be householded, please contact Eaton Vance at 1-800-262-1122, or contact your financial intermediary. Your instructions that householding not apply to delivery of your Eaton Vance documents will typically be effective within 30 days of receipt by Eaton Vance or your financial intermediary.
Portfolio Holdings. Each Eaton Vance Fund and its underlying Portfolio(s) (if applicable) files a schedule of portfolio holdings on Part F to Form N-PORT with the SEC. Certain information filed on Form N-PORT may be viewed on the Eaton Vance website at www.eatonvance.com, by calling Eaton Vance at 1-800-262-1122 or in the EDGAR database on the SEC’s website at www.sec.gov.
Proxy Voting. From time to time, funds are required to vote proxies related to the securities held by the funds. The Eaton Vance Funds or their underlying Portfolios (if applicable) vote proxies according to a set of policies and procedures approved by the Funds’ and Portfolios’ Boards. You may obtain a description of these policies and procedures and information on how the Funds or Portfolios voted proxies relating to portfolio securities during the most recent 12-month period ended June 30, without charge, upon request, by calling 1-800-262-1122 and by accessing the SEC’s website at www.sec.gov.
Tailored Shareholder Reports. Effective January 24, 2023, the SEC adopted rule and form amendments to require open-end mutual funds and ETFs to transmit concise and visually engaging streamlined annual and semiannual reports to shareholders that highlight key information. Other information, including financial statements, will no longer appear in a streamlined shareholder report but must be available online, delivered free of charge upon request, and filed on a semiannual basis on Form N-CSR. The rule and form amendments have a compliance date of July 24, 2024. At this time, management is evaluating the impact of these amendments on the shareholder reports for the Eaton Vance Funds.
This Page Intentionally Left Blank
Investment Adviser of Senior Debt Portfolio
Boston Management and Research
Two International Place
Boston, MA 02110
Investment Adviser and Administrator of Eaton Vance
Floating-Rate Advantage Fund
Eaton Vance Management
Two International Place
Boston, MA 02110
Principal Underwriter*
Eaton Vance Distributors, Inc.
Two International Place
Boston, MA 02110
(617) 482-8260
Custodian
State Street Bank and Trust Company
One Congress Street, Suite 1
Boston, MA 02114-2016
Transfer Agent
BNY Mellon Investment Servicing (US) Inc.
Attn: Eaton Vance Funds
P.O. Box 534439
Pittsburgh, PA 15253-4439
(800) 262-1122
Independent Registered Public Accounting Firm
Deloitte & Touche LLP
200 Berkeley Street
Boston, MA 02116-5022
Fund Offices
Two International Place
Boston, MA 02110
* FINRA BrokerCheck. Investors may check the background of their Investment Professional by contacting the Financial Industry Regulatory Authority (FINRA). FINRA BrokerCheck is a free tool to help investors check the professional background of current and former FINRA-registered securities firms and brokers. FINRA BrokerCheck is available by calling 1-800-289-9999 and at www.FINRA.org. The FINRA BrokerCheck brochure describing this program is available to investors at www.FINRA.org.
Eaton Vance
Multi-Asset Credit Fund
Annual Report
October 31, 2023
Commodity Futures Trading Commission Registration. The Commodity Futures Trading Commission (“CFTC”) has adopted regulations that subject registered investment companies and advisers to regulation by the CFTC if a fund invests more than a prescribed level of its assets in certain CFTC-regulated instruments (including futures, certain options and swap agreements) or markets itself as providing investment exposure to such instruments. The investment adviser has claimed an exclusion from the definition of “commodity pool operator” under the Commodity Exchange Act with respect to its management of the Fund. Accordingly, neither the Fund nor the adviser with respect to the operation of the Fund is subject to CFTC regulation. Because of its management of other strategies, the Fund's adviser is registered with the CFTC as a commodity pool operator. The adviser is also registered as a commodity trading advisor.
Fund shares are not insured by the FDIC and are not deposits or other obligations of, or guaranteed by, any depository institution. Shares are subject to investment risks, including possible loss of principal invested.
This report must be preceded or accompanied by a current summary prospectus or prospectus. Before investing, investors should consider carefully the investment objective, risks, and charges and expenses of a mutual fund. This and other important information is contained in the summary prospectus and prospectus, which can be obtained from a financial intermediary. Prospective investors should read the prospectus carefully before investing. For further information, please call 1-800-262-1122.
Annual Report October 31, 2023
Eaton Vance
Multi-Asset Credit Fund
Eaton Vance
Multi-Asset Credit Fund
October 31, 2023
Management’s Discussion of Fund Performance†
Economic and Market Conditions
For fixed-income investors, the dominant event during the 12-month period ended October 31, 2023, was the series of U.S. Federal Reserve (Fed) interest rate hikes -- six during the period, and 11 in total -- that brought the federal funds rate to its highest level in 22 years.
But while the Fed’s campaign to tamp down inflation led to negative performance for government bonds, corporate bond returns were positive during the period -- buoyed by the very factors that were fueling inflation: record low unemployment, strong job creation, and robust consumer spending.
By the summer of 2023, many economists and market observers came around to the view that Jerome Powell’s Fed might be able to accomplish what had seldom, if ever, been done before: raise rates significantly to lower inflation and still bring the U.S. economy in for a soft landing without a recession.
One persistent cloud over fixed-income markets during the period, however, was fear that even after it finished raising rates, the Fed would leave rates higher for longer than investors had previously anticipated. During the final three months of the period -- and especially after the Fed’s September 2023 meeting -- longer-term interest rates rose dramatically, as investor expectations of how high rates would go -- and how long they would stay there -- seemed to get higher and longer. As a result, shorter-duration bonds generally outperformed longer-duration bonds for the period as a whole.
Against the backdrop of aggressive monetary tightening, U.S. Treasurys were one of the worst-performing major fixed-income asset classes during the 12-month period, with the Bloomberg U.S. Treasury Index returning -0.63%.
In contrast, the strong U.S. economy and increasing confidence in a soft-landing scenario served as tailwinds for investment-grade corporate bonds. Even in a rising-rate environment, the Bloomberg U.S. Corporate Bond Index returned 2.77% during the period.
High yield bonds were strong performers, with the Bloomberg U.S. Corporate High Yield Index returning 6.23% during the period. With a resilient U.S. economy helping keep bond defaults low, and a recession looking increasingly remote, investors gravitated toward riskier investments with greater yields.
Asset-backed securities -- including bonds backed by automobile and consumer loans -- benefited from strong consumer balance sheets and spending during the period, with the Bloomberg U.S. Asset-Backed Securities Index returning 3.51%.
Senior loans were among the few asset classes to benefit from rising interest rates, with the Morningstar® LSTA® US Leveraged Loan IndexSM, a broad measure of the asset class, returning 11.92% -- outperforming virtually every other major U.S. fixed-income asset class during the period.
However, mortgage-backed securities (MBS) were dogged by two technical factors that depressed prices, causing the Bloomberg U.S. Mortgage-Backed Securities Index to return -0.82% during the period. As the Fed reduced its balance sheet, it sold off much of its MBS holdings. And several regional banks that had been significant buyers of MBS were forced by the regional banking crisis of March 2023 to liquidate their assets. The resulting release of a significant amount of MBS into the market led MBS prices to fall and the asset class to deliver negative returns during the period.
Fund Performance
For the 12-month period ended October 31, 2023, Eaton Vance Multi-Asset Credit Fund (the Fund) returned 8.13% for Class A shares at net asset value (NAV). The Fund underperformed its primary benchmark, the Morningstar® LSTA® US Leveraged Loan IndexSM (the Primary Index), which returned 11.92%; and underperformed its blended benchmark (the Blended Index) -- consisting of 50% Primary Index and 50% ICE BofA Developed Markets High Yield ex-Subordinated Financials Index-Hedged USD (the High Yield Index) -- which returned 9.57% during the period.
The Blended Index is more representative of the Fund’s investment strategy and holdings than the Primary Index. The Fund seeks total returns by investing across multiple areas of the credit markets.
The Fund’s underweight position in floating-rate loans detracted from performance relative to the Blended Index, as floating-rate loans were one of the best-performing fixed-income asset classes during a period of rising interest rates.
The Fund’s floating-rate allocation also underperformed the floating-rate market, as measured by the Primary Index. Within the floating-rate allocation, detractors from relative returns included security selections in CCC-rated loans; security selections in the information technology, the machinery, and the chemicals industries; and an overweight position in a digital infrastructure provider that was in Chapter 11 reorganization during the period.
Contributors to relative performance of the floating-rate allocation included security selections in D-rated (defaulted) loans; security selections in the health care providers & services industry and the professional services industry; and an overweight position in a provider of device insurance for cell phones, home appliances, and consumer electronics.
See Endnotes and Additional Disclosures in this report.
Past performance is no guarantee of future results. Returns are historical and are calculated by determining the percentage change in net asset value (NAV) or offering price (as applicable) with all distributions reinvested. Furthermore, returns do not reflect the deduction of taxes that shareholders may have to pay on Fund distributions or upon the redemption of Fund shares. Investment return and principal value will fluctuate so that shares, when redeemed, may be worth more or less than their original cost. Performance for periods less than or equal to one year is cumulative. Performance is for the stated time period only; due to market volatility, current Fund performance may be lower or higher than the quoted return. For performance as of the most recent month-end, please refer to eatonvance.com.
Eaton Vance
Multi-Asset Credit Fund
October 31, 2023
Management’s Discussion of Fund Performance† — continued
The Fund’s overweight position in high yield corporate bonds also detracted from returns versus the Blended Index during the period, as high yield bonds generally underperformed floating-rate loans, the other component of the Blended Index.
The Fund’s high yield allocation did, however, outperform the high yield market, as measured by the High Yield Index. Within the high yield allocation, contributors to relative returns included security selections in CCC-rated bonds; an underweight position in BB-rated bonds; and security selections in the telecommunications and the cable & satellite TV industries. Detractors from relative returns included security selections in BB-rated bonds, and security selections in the homebuilders & real estate industry, which included two European companies.
Additional detractors from performance versus the Blended Index included out-of-Index allocations to longer duration investment-grade corporate bonds -- whose performance was hurt by rising interest rates during the period -- and to commercial mortgage-backed securities.
Given the strong positive performance of the floating-rate and high yield asset classes during the period, the Fund’s modest cash position hurt returns relative to the Blended Index as well.
In contrast, the Fund’s out-of-Index allocation to collateralized loan obligation debt investments, which outperformed the Blended Index during the period, contributed to relative returns.
See Endnotes and Additional Disclosures in this report.
Past performance is no guarantee of future results. Returns are historical and are calculated by determining the percentage change in net asset value (NAV) or offering price (as applicable) with all distributions reinvested. Furthermore, returns do not reflect the deduction of taxes that shareholders may have to pay on Fund distributions or upon the redemption of Fund shares. Investment return and principal value will fluctuate so that shares, when redeemed, may be worth more or less than their original cost. Performance for periods less than or equal to one year is cumulative. Performance is for the stated time period only; due to market volatility, current Fund performance may be lower or higher than the quoted return. For performance as of the most recent month-end, please refer to eatonvance.com.
Eaton Vance
Multi-Asset Credit Fund
October 31, 2023
Performance
Portfolio Manager(s) Justin H. Bourgette, CFA, Daniel P. McElaney, CFA and Kelley Gerrity of Eaton Vance Management; Jeffrey D. Mueller of Eaton Vance Advisers International Ltd.
| % Average Annual Total Returns1,2 | Class
Inception Date | Performance
Inception Date | One Year | Five Years | Ten Years |
| Class A at NAV | 10/31/2011 | 10/31/2011 | 8.13% | 2.72% | 3.33% |
| Class A with 3.25% Maximum Sales Charge | — | — | 4.57 | 2.04 | 2.98 |
| Class C at NAV | 10/31/2011 | 10/31/2011 | 7.32 | 1.96 | 2.76 |
| Class C with 1% Maximum Deferred Sales Charge | — | — | 6.32 | 1.96 | 2.76 |
| Class I at NAV | 10/31/2011 | 10/31/2011 | 8.40 | 2.99 | 3.64 |
| Class R6 at NAV | 09/03/2019 | 10/31/2011 | 8.44 | 3.00 | 3.65 |
|
| Morningstar® LSTA® US Leveraged Loan IndexSM | — | — | 11.92% | 4.46% | 4.22% |
| ICE BofA Developed Markets High Yield ex-Subordinated Financials Index – Hedged USD | — | — | 7.25 | 3.04 | 3.96 |
| Blended Index | — | — | 9.57 | 3.78 | 4.11 |
| % Total Annual Operating Expense Ratios3 | Class A | Class C | Class I | Class R6 |
| | 0.98% | 1.73% | 0.73% | 0.67% |
Growth of $10,000
This graph shows the change in value of a hypothetical investment of $10,000 in Class A of the Fund for the period indicated. For comparison, the same investment is shown in the indicated index.
| Growth of Investment2 | Amount Invested | Period Beginning | At NAV | With Maximum Sales Charge |
| Class C | $10,000 | 10/31/2013 | $13,133 | N.A. |
| Class I, at minimum investment | $1,000,000 | 10/31/2013 | $1,430,268 | N.A. |
| Class R6, at minimum investment | $5,000,000 | 10/31/2013 | $7,156,288 | N.A. |
See Endnotes and Additional Disclosures in this report.
Past performance is no guarantee of future results. Returns are historical and are calculated by determining the percentage change in net asset value (NAV) or offering price (as applicable) with all distributions reinvested. Furthermore, returns do not reflect the deduction of taxes that shareholders may have to pay on Fund distributions or upon the redemption of Fund shares. Investment return and principal value will fluctuate so that shares, when redeemed, may be worth more or less than their original cost. Performance for periods less than or equal to one year is cumulative. Performance is for the stated time period only; due to market volatility, current Fund performance may be lower or higher than the quoted return. For performance as of the most recent month-end, please refer to eatonvance.com.
Eaton Vance
Multi-Asset Credit Fund
October 31, 2023
| Asset Allocation (% of total investments)1 |
| Credit Quality (% of net assets)2 |
Footnotes:
| 1 | Other represents any investment type less than 1% of total investments. |
| 2 | Ratings are based on Moody’s Investors Service, Inc. (“Moody’s”), S&P Global Ratings (“S&P”) or Fitch Ratings (“Fitch”), as applicable. For purposes of ratings restrictions, the average of Moody’s, S&P and Fitch is used. Ratings, which are subject to change, apply to the creditworthiness of the issuers of the underlying securities and not to the Fund or its shares. Credit ratings measure the quality of a bond based on the issuer’s creditworthiness, with ratings ranging from AAA, being the highest, to D, being the lowest based on S&P’s measures. Ratings of BBB or higher by S&P or Fitch (Baa or higher by Moody’s) are considered to be investment-grade quality. Credit ratings are based largely on the ratings agency’s analysis at the time of rating. The rating assigned to any particular security is not necessarily a reflection of the issuer’s current financial condition and does not necessarily reflect its assessment of the volatility of a security’s market value or of the liquidity of an investment in the security. Holdings designated as “Not Rated” (if any) are not rated by the national ratings agencies stated above. |
3 Amount is less than 0.05%.
Eaton Vance
Multi-Asset Credit Fund
October 31, 2023
Endnotes and Additional Disclosures
| † | The views expressed in this report are those of the portfolio manager(s) and are current only through the date stated at the top of this page. These views are subject to change at any time based upon market or other conditions, and Eaton Vance and the Fund(s) disclaim any responsibility to update such views. These views may not be relied upon as investment advice and, because investment decisions are based on many factors, may not be relied upon as an indication of trading intent on behalf of any Eaton Vance fund. This commentary may contain statements that are not historical facts, referred to as “forward-looking statements.” The Fund’s actual future results may differ significantly from those stated in any forward-looking statement, depending on factors such as changes in securities or financial markets or general economic conditions, the volume of sales and purchases of Fund shares, the continuation of investment advisory, administrative and service contracts, and other risks discussed from time to time in the Fund’s filings with the Securities and Exchange Commission. |
| | |
| 1 | Morningstar® LSTA® US Leveraged Loan IndexSM is an unmanaged index of the institutional leveraged loan market. Morningstar® LSTA® Leveraged Loan indices are a product of Morningstar, Inc. (“Morningstar”) and have been licensed for use. Morningstar® is a registered trademark of Morningstar licensed for certain use. Loan Syndications and Trading Association® and LSTA® are trademarks of the LSTA licensed for certain use by Morningstar, and further sublicensed by Morningstar for certain use. Neither Morningstar nor LSTA guarantees the accuracy and/or completeness of the Morningstar® LSTA® US Leveraged Loan IndexSM or any data included therein, and shall have no liability for any errors, omissions, or interruptions therein. Unless otherwise stated, index returns do not reflect the effect of any applicable sales charges, commissions, expenses, taxes or leverage, as applicable. It is not possible to invest directly in an index. ICE BofA Developed Markets High Yield ex-Subordinated Financials Index – Hedged USD is an unmanaged index of global developed market, below investment grade corporate bonds, USD hedged. ICE® BofA® indices are not for redistribution or other uses; provided “as is”, without warranties, and with no liability. Eaton Vance has prepared this report and ICE Data Indices, LLC does not endorse it, or guarantee, review, or endorse Eaton Vance’s products. BofA® is a licensed registered trademark of Bank of America Corporation in the United States and other countries. The Blended Index consists of 50% Morningstar® LSTA® US Leveraged Loan IndexSM and 50% ICE BofA Developed Markets High Yield ex-Subordinated Financials Index – Hedged USD, rebalanced monthly. Unless otherwise stated, index returns do not reflect the effect of any applicable sales charges, commissions, expenses, taxes or leverage, as applicable. It is not possible to invest directly in an index. |
| 2 | Total Returns at NAV do not include applicable sales charges. If sales charges were deducted, the returns would be lower. Total Returns shown with maximum sales charge reflect the stated maximum sales charge. Unless otherwise stated, performance does not reflect the deduction of taxes on Fund distributions or redemptions of Fund shares. |
| | Performance prior to the inception date of a class may be linked to the performance of an older class of the Fund. This linked performance is adjusted for any applicable sales charge, but is not adjusted for class expense differences. If adjusted for such differences, the performance would be different. The performance of Class R6 is linked to Class I. Performance presented in the Financial Highlights included in the financial statements is not linked.Effective November 5, 2020, Class C shares automatically convert to Class A shares eight years after purchase. The average annual total returns listed for Class C reflect conversion to Class A shares after eight years. Prior to November 5, 2020, Class C shares automatically converted to Class A shares ten years after purchase.Effective September 15, 2018, the Fund changed its investment strategy to invest at least 80% of its net assets (plus any borrowings for investment purposes) in credit-related investments. Prior to September 15, 2018, the Fund was a “fund-of-funds” and invested primarily among other investment companies managed by Eaton Vance and its affiliates that invested in various asset classes. |
| 3 | Source: Fund prospectus. The expense ratios for the current reporting period can be found in the Financial Highlights section of this report. Performance reflects expenses waived and/or reimbursed, if applicable. Without such waivers and/or reimbursements, performance would have been lower. |
| | Fund profile subject to change due to active management. |
| | Additional Information |
| | Bloomberg U.S. Treasury Index measures the performance of U.S. Treasuries with a maturity of one year or more. Bloomberg U.S. Corporate Bond Index measures the performance of investment-grade U.S. corporate securities with a maturity of one year or more. Bloomberg U.S. Corporate High Yield Index measures USD-denominated, non-investment grade corporate securities.
Bloomberg U.S. Asset-Backed Securities Index tracks the performance of U.S. dollar denominated investment grade fixed rate asset-backed securities publicly issued in the U.S. domestic market. Bloomberg U.S. Mortgage Backed Securities Index measures agency mortgage-backed pass-through securities issued by Ginnie Mae (GNMA), Fannie Mae (FNMA), and Freddie Mac (FHLMC). |
| | Duration is a measure of the expected change in price of a bond — in percentage terms — given a one percent change in interest rates, all else being constant. Securities with lower durations tend to be less sensitive to interest rate changes. |
Eaton Vance
Multi-Asset Credit Fund
October 31, 2023
Example
As a Fund shareholder, you incur two types of costs: (1) transaction costs, including sales charges (loads) on purchases; and (2) ongoing costs, including management fees; distribution and/or service fees; and other Fund expenses. This Example is intended to help you understand your ongoing costs (in dollars) of Fund investing and to compare these costs with the ongoing costs of investing in other mutual funds. The Example is based on an investment of $1,000 invested at the beginning of the period and held for the entire period (May 1, 2023 to October 31, 2023).
Actual Expenses
The first section of the table below provides information about actual account values and actual expenses. You may use the information in this section, together with the amount you invested, to estimate the expenses that you paid over the period. Simply divide your account value by $1,000 (for example, an $8,600 account value divided by $1,000 = 8.6), then multiply the result by the number in the first section under the heading entitled “Expenses Paid During Period” to estimate the expenses you paid on your account during this period.
Hypothetical Example for Comparison Purposes
The second section of the table below provides information about hypothetical account values and hypothetical expenses based on the actual Fund expense ratio and an assumed rate of return of 5% per year (before expenses), which is not the actual Fund return. The hypothetical account values and expenses may not be used to estimate the actual ending account balance or expenses you paid for the period. You may use this information to compare the ongoing costs of investing in your Fund and other funds. To do so, compare this 5% hypothetical example with the 5% hypothetical examples that appear in the shareholder reports of the other funds.
Please note that the expenses shown in the table are meant to highlight your ongoing costs only and do not reflect any transactional costs, such as sales charges (loads). Therefore, the second section of the table is useful in comparing ongoing costs only, and will not help you determine the relative total costs of owning different funds. In addition, if these transactional costs were included, your costs would be higher.
| | Beginning
Account Value
(5/1/23) | Ending
Account Value
(10/31/23) | Expenses Paid
During Period*
(5/1/23 – 10/31/23) | Annualized
Expense
Ratio |
| Actual | | | | |
| Class A | $1,000.00 | $1,022.10 | $4.79 | 0.94% |
| Class C | $1,000.00 | $1,018.20 | $8.60 | 1.69% |
| Class I | $1,000.00 | $1,024.50 | $3.52 | 0.69% |
| Class R6 | $1,000.00 | $1,023.60 | $3.26 | 0.64% |
| |
| Hypothetical | | | | |
| (5% return per year before expenses) | | | | |
| Class A | $1,000.00 | $1,020.47 | $4.79 | 0.94% |
| Class C | $1,000.00 | $1,016.69 | $8.59 | 1.69% |
| Class I | $1,000.00 | $1,021.73 | $3.52 | 0.69% |
| Class R6 | $1,000.00 | $1,021.98 | $3.26 | 0.64% |
| * | Expenses are equal to the Fund's annualized expense ratio for the indicated Class, multiplied by the average account value over the period, multiplied by 184/365 (to reflect the one-half year period). The Example assumes that the $1,000 was invested at the net asset value per share determined at the close of business on April 30, 2023. |
Eaton Vance
Multi-Asset Credit Fund
October 31, 2023
| Asset-Backed Securities — 4.1% |
| Security | Principal
Amount
(000's omitted) | Value |
| Ares LII CLO, Ltd., Series 2019-52A, Class DR, 8.974%, (3 mo. SOFR + 3.562%), 4/22/31(1)(2) | $ | 1,750 | $ 1,669,563 |
| Benefit Street Partners CLO XIX, Ltd.: | | | |
| Series 2019-19A, Class D, 9.456%, (3 mo. SOFR + 4.062%), 1/15/33(1)(2) | | 1,000 | 983,520 |
| Series 2019-19A, Class E, 12.676%, (3 mo. SOFR + 7.281%), 1/15/33(1)(2) | | 1,000 | 980,592 |
| Benefit Street Partners CLO XVIII, Ltd., Series 2019-18A, Class ER, 12.406%, (3 mo. SOFR + 7.011%), 10/15/34(1)(2) | | 500 | 483,246 |
| BlueMountain CLO XXVI, Ltd., Series 2019-26A, Class ER, 12.807%, (3 mo. SOFR + 7.392%), 10/20/34(1)(2) | | 500 | 463,554 |
| Bryant Park Funding, Ltd., Series 2023-20A, Class D, 11.449%, (3 mo. SOFR + 6.09%), 7/15/36(1)(2) | | 1,000 | 974,506 |
| Canyon Capital CLO, Ltd., Series 2020-3A, Class E, 12.906%, (3 mo. SOFR + 7.512%), 1/15/34(1)(2) | | 1,000 | 992,063 |
| Carlyle Global Market Strategies CLO, Ltd.: | | | |
| Series 2014-3RA, Class C, 8.599%, (3 mo. SOFR + 3.212%), 7/27/31(1)(2) | | 2,725 | 2,518,224 |
| Series 2014-4RA, Class C, 8.556%, (3 mo. SOFR + 3.162%), 7/15/30(1)(2) | | 2,000 | 1,848,728 |
| Series 2014-4RA, Class D, 11.306%, (3 mo. SOFR + 5.912%), 7/15/30(1)(2) | | 250 | 201,082 |
| Series 2015-5A, Class DR, 12.377%, (3 mo. SOFR + 6.961%), 1/20/32(1)(2) | | 250 | 204,431 |
| Coinstar Funding, LLC, Series 2017-1A, Class A2, 5.216%, 4/25/47(1) | | 61 | 50,184 |
| Crown City CLO III, Series 2021-1A, Class C, 8.977%, (3 mo. SOFR + 3.562%), 7/20/34(1)(2) | | 1,000 | 897,007 |
| Golub Capital Partners CLO 53B, Ltd., Series 2021-53A, Class E, 12.377%, (3 mo. SOFR + 6.962%), 7/20/34(1)(2) | | 500 | 456,691 |
| Golub Capital Partners CLO 60B, Ltd., Series 2022-60A, Class D, 9.148%, (3 mo. SOFR + 3.77%), 10/25/34(1)(2) | | 2,000 | 1,903,754 |
| Madison Park Funding XXXVI, Ltd.: | | | |
| Series 2019-36A, Class D1R, 8.894%, (3 mo. SOFR + 3.50%), 4/15/35(1)(2) | | 1,000 | 969,875 |
| Series 2019-36A, Class ER, 12.444%, (3 mo. SOFR + 7.05%), 4/15/35(1)(2) | | 1,000 | 985,843 |
| Neuberger Berman CLO XXII, Ltd., Series 2016-22A, Class ER, 11.724%, (3 mo. SOFR + 6.322%), 10/17/30(1)(2) | | 250 | 227,435 |
| Palmer Square CLO, Ltd., Series 2013-2A, Class DRR, 11.514%, (3 mo. SOFR + 6.111%), 10/17/31(1)(2) | | 250 | 234,206 |
| Retained Vantage Data Centers Issuer, LLC, Series 2023-1A, Class A2A, 5.00%, 9/15/48(1) | | 850 | 768,799 |
| Stack Infrastructure Issuer, LLC, Series 2021-1A, Class A2, 1.877%, 3/26/46(1) | | 890 | 791,243 |
| Security | Principal
Amount
(000's omitted) | Value |
| Sunnova Helios X Issuer, LLC, Series 2022-C, Class B, 5.60%, 11/22/49(1) | $ | 662 | $ 618,171 |
| Theorem Funding Trust, Series 2022-3A, Class A, 7.60%, 4/15/29(1) | | 344 | 345,549 |
Total Asset-Backed Securities
(identified cost $20,299,849) | | | $ 19,568,266 |
| Collateralized Mortgage Obligations — 0.2% |
| Security | Principal
Amount
(000's omitted) | Value |
| PNMAC GMSR Issuer Trust, Series 2018-GT2, Class A, 8.089% (1 mo. USD LIBOR + 2.65%), 8/25/25(1)(2) | $ | 117 | $ 116,987 |
| Unison Trust, Series 2021-1, Class A, 4.50%, 4/25/50(1)(3) | | 1,191 | 929,009 |
Total Collateralized Mortgage Obligations
(identified cost $1,291,059) | | | $ 1,045,996 |
| Commercial Mortgage-Backed Securities — 2.1% |
| Security | Principal
Amount*
(000's omitted) | Value |
| BBCMS Mortgage Trust, Series 2017-C1, Class D, 3.541%, 2/15/50(1)(3) | | 1,000 | $ 660,572 |
| CSMC Trust: | | | |
| Series 2021-4SZN, Class A, 9.302%, (1 mo. SOFR + 3.967%), 11/15/23(1)(2) | | 1,000 | 999,107 |
| Series 2022-CNTR, Class A, 9.279%, (1 mo. SOFR + 3.944%), 1/15/24(1)(2) | | 1,000 | 867,235 |
| JPMBB Commercial Mortgage Securities Trust: | | | |
| Series 2014-C19, Class B, 4.394%, 4/15/47(3) | | 215 | 208,277 |
| Series 2014-C23, Class D, 3.983%, 9/15/47(1)(3) | | 750 | 631,256 |
| JPMorgan Chase Commercial Mortgage Securities Trust: | | | |
| Series 2014-DSTY, Class B, 3.771%, 6/10/27(1) | | 150 | 21,263 |
| Series 2021-MHC, Class C, 6.749%, (1 mo. SOFR + 1.414%), 4/15/38(1)(2) | | 1,800 | 1,761,866 |
| Morgan Stanley Capital I Trust, Series 2019-BPR, Class A, 7.307%, (1 mo. SOFR + 1.992%), 5/15/36(1)(2)(4) | | 379 | 366,998 |
| Natixis Commercial Mortgage Securities Trust, Series 2018-FL1, Class C, 8.50%, (1 mo. SOFR + 2.314%), 6/15/35(1)(2) | | 100 | 46,110 |
| Vita Scientia, Series 2022-1A, Class D, 6.274%, (3 mo. EURIBOR + 2.49%), 8/27/25(1)(2) | EUR | 450 | 429,490 |
| VMC Finance, LLC, Series 2021-HT1, Class B, 9.949%, (1 mo. SOFR + 4.614%), 1/18/37(1)(2) | | 2,000 | 1,900,043 |
8
See Notes to Financial Statements.
Eaton Vance
Multi-Asset Credit Fund
October 31, 2023
Portfolio of Investments — continued
| Security | Principal
Amount*
(000's omitted) | Value |
| Wells Fargo Commercial Mortgage Trust, Series 2016-C35, Class D, 3.142%, 7/15/48(1) | | 1,700 | $ 1,207,120 |
| WFRBS Commercial Mortgage Trust, Series 2013-UBS1, Class E, 5.053%, 3/15/46(1)(3) | | 1,000 | 961,147 |
Total Commercial Mortgage-Backed Securities
(identified cost $10,960,265) | | | $ 10,060,484 |
| Security | Shares | Value |
| Media — 0.1% |
| National CineMedia, Inc.(5) | | 64,991 | $ 254,117 |
Total Common Stocks
(identified cost $217,720) | | | $ 254,117 |
| Security | Principal
Amount
(000's omitted) | Value |
| Energy — 0.1% |
| NextEra Energy Partners, L.P., 2.50%, 6/15/26(1) | $ | 654 | $ 567,018 |
| | | | $ 567,018 |
| Leisure Goods/Activities/Movies — 0.1% |
| Peloton Interactive, Inc., 0.00%, 2/15/26 | $ | 741 | $ 550,249 |
| | | | $ 550,249 |
| Transportation — 0.2% |
| CryoPort, Inc., 0.75%, 12/1/26(1) | $ | 1,088 | $ 857,453 |
| | | | $ 857,453 |
Total Convertible Bonds
(identified cost $2,152,371) | | | $ 1,974,720 |
| Security | Principal
Amount*
(000's omitted) | Value |
| Aerospace and Defense — 0.8% |
| Moog, Inc., 4.25%, 12/15/27(1) | | 791 | $ 705,104 |
| Rolls-Royce PLC, 5.75%, 10/15/27(1) | | 1,200 | 1,138,572 |
| Security | Principal
Amount*
(000's omitted) | Value |
| Aerospace and Defense (continued) |
| Spirit AeroSystems, Inc.: | | | |
| 4.60%, 6/15/28 | | 174 | $ 137,825 |
| 9.375%, 11/30/29(1) | | 59 | 60,663 |
| TransDigm, Inc.: | | | |
| 4.625%, 1/15/29 | | 343 | 296,136 |
| 5.50%, 11/15/27 | | 943 | 878,842 |
| 7.50%, 3/15/27 | | 791 | 790,846 |
| | | | $ 4,007,988 |
| Agriculture — 0.1% |
| Darling Ingredients, Inc., 6.00%, 6/15/30(1) | | 693 | $ 650,831 |
| | | | $ 650,831 |
| Air Transport — 0.9% |
| Air France-KLM, 8.125%, 5/31/28(6) | EUR | 1,000 | $ 1,113,793 |
| American Airlines, Inc., 7.25%, 2/15/28(1) | | 145 | 134,998 |
| American Airlines, Inc./AAdvantage Loyalty IP, Ltd., 5.50%, 4/20/26(1) | | 648 | 631,109 |
| Deutsche Lufthansa AG: | | | |
| 2.875%, 5/16/27(6) | EUR | 100 | 97,862 |
| 3.50%, 7/14/29(6) | EUR | 200 | 190,135 |
| 4.382% to 2/12/26, 8/12/75(6)(7) | EUR | 500 | 496,125 |
| Gatwick Airport Finance PLC, 4.375%, 4/7/26(6) | GBP | 1,270 | 1,430,165 |
| United Airlines, Inc., 4.625%, 4/15/29(1) | | 445 | 376,294 |
| | | | $ 4,470,481 |
| Automotive — 1.9% |
| Asbury Automotive Group, Inc.: | | | |
| 4.625%, 11/15/29(1) | | 392 | $ 332,087 |
| 4.75%, 3/1/30 | | 303 | 257,513 |
| Clarios Global, L.P./Clarios US Finance Co.: | | | |
| 4.375%, 5/15/26(6) | EUR | 1,500 | 1,522,746 |
| 8.50%, 5/15/27(1) | | 670 | 660,921 |
| Dana Financing Luxembourg S.a.r.l.: | | | |
| 3.00%, 7/15/29(6) | EUR | 300 | 251,597 |
| 8.50%, 7/15/31(6) | EUR | 300 | 324,969 |
| Dornoch Debt Merger Sub, Inc., 6.625%, 10/15/29(1) | | 595 | 468,726 |
| Ford Motor Co.: | | | |
| 4.75%, 1/15/43 | | 325 | 226,166 |
| 6.10%, 8/19/32 | | 530 | 490,623 |
| 6.625%, 10/1/28 | | 825 | 816,127 |
| 9.625%, 4/22/30 | | 44 | 49,111 |
| Forvia SE: | | | |
| 2.375%, 6/15/29(6) | EUR | 150 | 131,925 |
| 2.75%, 2/15/27(6) | EUR | 200 | 192,818 |
9
See Notes to Financial Statements.
Eaton Vance
Multi-Asset Credit Fund
October 31, 2023
Portfolio of Investments — continued
| Security | Principal
Amount*
(000's omitted) | Value |
| Automotive (continued) |
| Forvia SE: (continued) | | | |
| 3.75%, 6/15/28(6) | EUR | 250 | $ 241,625 |
| Goodyear Tire & Rubber Co. (The), 5.00%, 7/15/29 | | 546 | 470,397 |
| IHO Verwaltungs GmbH, 8.75%, (8.75% cash or 9.50% PIK), 5/15/28(6)(8) | EUR | 600 | 655,502 |
| Lithia Motors, Inc.: | | | |
| 3.875%, 6/1/29(1) | | 398 | 329,701 |
| 4.375%, 1/15/31(1) | | 452 | 366,436 |
| Real Hero Merger Sub 2, Inc., 6.25%, 2/1/29(1) | | 444 | 353,639 |
| Sonic Automotive, Inc.: | | | |
| 4.625%, 11/15/29(1) | | 587 | 489,437 |
| 4.875%, 11/15/31(1) | | 239 | 190,631 |
| Wheel Pros, Inc., 6.50%, 5/15/29(1) | | 332 | 101,107 |
| | | | $ 8,923,804 |
| Banks and Thrifts — 0.1% |
| Synchrony Bank, 5.625%, 8/23/27 | | 351 | $ 320,870 |
| | | | $ 320,870 |
| Building and Development — 1.4% |
| Ashton Woods USA, LLC/Ashton Woods Finance Co.: | | | |
| 4.625%, 8/1/29(1) | | 136 | $ 110,180 |
| 4.625%, 4/1/30(1) | | 136 | 105,438 |
| Builders FirstSource, Inc.: | | | |
| 4.25%, 2/1/32(1) | | 735 | 585,833 |
| 5.00%, 3/1/30(1) | | 105 | 91,748 |
| Castle U.K. Finco PLC, 9.031%, (3 mo. EURIBOR + 5.25%), 5/15/28(2)(6) | EUR | 400 | 364,039 |
| Emerald Debt Merger Sub, LLC, 6.625%, 12/15/30(1) | | 520 | 495,300 |
| MIWD Holdco II, LLC/MIWD Finance Corp., 5.50%, 2/1/30(1) | | 354 | 281,327 |
| Patrick Industries, Inc., 4.75%, 5/1/29(1) | | 675 | 549,112 |
| PGT Innovations, Inc., 4.375%, 10/1/29(1) | | 397 | 370,997 |
| Smyrna Ready Mix Concrete, LLC, 6.00%, 11/1/28(1) | | 898 | 831,123 |
| SRS Distribution, Inc., 6.00%, 12/1/29(1) | | 668 | 556,825 |
| Standard Industries, Inc.: | | | |
| 2.25%, 11/21/26(6) | EUR | 850 | 791,455 |
| 4.75%, 1/15/28(1) | | 753 | 674,733 |
| White Cap Buyer, LLC, 6.875%, 10/15/28(1) | | 700 | 611,615 |
| | | | $ 6,419,725 |
| Business Equipment and Services — 0.7% |
| Adtalem Global Education, Inc., 5.50%, 3/1/28(1) | | 942 | $ 858,840 |
| Security | Principal
Amount*
(000's omitted) | Value |
| Business Equipment and Services (continued) |
| Allied Universal Holdco, LLC/Allied Universal Finance Corp./Atlas Luxco 4 S.a.r.l.: | | | |
| 3.625%, 6/1/28(6) | EUR | 350 | $ 299,472 |
| 4.625%, 6/1/28(1) | | 239 | 194,987 |
| GEMS MENASA Cayman, Ltd./GEMS Education Delaware, LLC: | | | |
| 7.125%, 7/31/26(1) | | 1,935 | 1,864,605 |
| 7.125%, 7/31/26(6) | | 260 | 250,541 |
| | | | $ 3,468,445 |
| Cable and Satellite Television — 1.3% |
| Altice Financing S.A., 5.00%, 1/15/28(1) | | 470 | $ 382,618 |
| CCO Holdings, LLC/CCO Holdings Capital Corp.: | | | |
| 4.25%, 2/1/31(1) | | 865 | 673,811 |
| 4.50%, 8/15/30(1) | | 900 | 722,849 |
| 4.75%, 3/1/30(1) | | 1,288 | 1,064,343 |
| 4.75%, 2/1/32(1) | | 225 | 175,844 |
| 5.00%, 2/1/28(1) | | 400 | 359,485 |
| 6.375%, 9/1/29(1) | | 601 | 550,611 |
| DISH Network Corp., 11.75%, 11/15/27(1) | | 397 | 393,582 |
| Virgin Media Vendor Financing Notes III DAC, 4.875%, 7/15/28(6) | GBP | 1,851 | 1,892,095 |
| | | | $ 6,215,238 |
| Capital Goods — 0.2% |
| BWX Technologies, Inc.: | | | |
| 4.125%, 6/30/28(1) | | 609 | $ 536,605 |
| 4.125%, 4/15/29(1) | | 221 | 189,210 |
| | | | $ 725,815 |
| Chemicals — 0.2% |
| Calderys Financing, LLC, 11.25%, 6/1/28(1) | | 544 | $ 549,440 |
| Olympus Water US Holding Corp., 9.75%, 11/15/28(1) | | 614 | 600,462 |
| | | | $ 1,149,902 |
| Chemicals and Plastics — 1.0% |
| ASP Unifrax Holdings, Inc., 5.25%, 9/30/28(1) | | 128 | $ 86,606 |
| Avient Corp., 7.125%, 8/1/30(1) | | 681 | 655,913 |
| Herens Holdco S.a.r.l., 4.75%, 5/15/28(1) | | 452 | 350,541 |
| Herens Midco S.a.r.l., 5.25%, 5/15/29(6) | EUR | 1,000 | 602,675 |
| Italmatch Chemicals SpA: | | | |
| 9.455%, (3 mo. EURIBOR + 5.50%), 2/6/28(2)(6) | EUR | 200 | 204,974 |
| 10.00%, 2/6/28(6) | EUR | 650 | 658,983 |
| NOVA Chemicals Corp., 4.875%, 6/1/24(1) | | 399 | 392,546 |
10
See Notes to Financial Statements.
Eaton Vance
Multi-Asset Credit Fund
October 31, 2023
Portfolio of Investments — continued
| Security | Principal
Amount*
(000's omitted) | Value |
| Chemicals and Plastics (continued) |
| Nufarm Australia, Ltd./Nufarm Americas, Inc., 5.00%, 1/27/30(1) | | 783 | $ 680,129 |
| Valvoline, Inc., 3.625%, 6/15/31(1) | | 699 | 532,243 |
| W.R. Grace Holdings, LLC: | | | |
| 4.875%, 6/15/27(1) | | 639 | 574,850 |
| 7.375%, 3/1/31(1) | | 185 | 171,660 |
| | | | $ 4,911,120 |
| Commercial Services — 2.2% |
| Abertis Infraestructuras Finance B.V., 3.248% to 11/24/25(6)(7)(9) | EUR | 600 | $ 588,136 |
| AMN Healthcare, Inc., 4.00%, 4/15/29(1) | | 557 | 461,965 |
| APi Group DE, Inc., 4.75%, 10/15/29(1) | | 662 | 567,553 |
| EC Finance PLC, 3.00%, 10/15/26(6) | EUR | 256 | 251,651 |
| GTCR W-2 Merger Sub, LLC, 7.50%, 1/15/31(1) | | 250 | 247,062 |
| GTCR W-2 Merger Sub, LLC/GTCR W Dutch Finance Sub B.V., 8.50%, 1/15/31(6) | GBP | 330 | 403,605 |
| HealthEquity, Inc., 4.50%, 10/1/29(1) | | 1,196 | 1,025,988 |
| IPD 3 B.V., 8.00%, 6/15/28(6) | EUR | 700 | 748,609 |
| Korn Ferry, 4.625%, 12/15/27(1) | | 620 | 564,581 |
| LABL, Inc.: | | | |
| 5.875%, 11/1/28(1) | | 598 | 507,176 |
| 8.25%, 11/1/29(1) | | 300 | 223,313 |
| Metis Merger Sub, LLC, 6.50%, 5/15/29(1) | | 1,178 | 963,818 |
| NESCO Holdings II, Inc., 5.50%, 4/15/29(1) | | 565 | 485,044 |
| Verisure Holding AB, 3.25%, 2/15/27(6) | EUR | 1,130 | 1,083,561 |
| Verisure Midholding AB, 5.25%, 2/15/29(6) | EUR | 380 | 348,060 |
| VT Topco, Inc., 8.50%, 8/15/30(1) | | 867 | 846,665 |
| WASH Multifamily Acquisition, Inc., 5.75%, 4/15/26(1) | | 1,110 | 1,027,760 |
| | | | $ 10,344,547 |
| Computers — 0.7% |
| Kyndryl Holdings, Inc., 2.70%, 10/15/28 | | 775 | $ 626,958 |
| McAfee Corp., 7.375%, 2/15/30(1) | | 855 | 684,744 |
| NCR Voyix Corp.: | | | |
| 5.125%, 4/15/29(1) | | 296 | 254,853 |
| 5.25%, 10/1/30(1) | | 405 | 335,851 |
| Presidio Holdings, Inc., 8.25%, 2/1/28(1) | | 763 | 722,789 |
| Seagate HDD Cayman: | | | |
| 4.091%, 6/1/29 | | 129 | 111,353 |
| 9.625%, 12/1/32(1) | | 344 | 367,360 |
| | | | $ 3,103,908 |
| Security | Principal
Amount*
(000's omitted) | Value |
| Containers and Glass Products — 0.6% |
| Ardagh Metal Packaging Finance USA, LLC/Ardagh Metal Packaging Finance PLC, 3.00%, 9/1/29(6) | EUR | 850 | $ 666,059 |
| Ardagh Packaging Finance PLC/Ardagh Holdings USA, Inc.: | | | |
| 2.125%, 8/15/26(6) | EUR | 300 | 275,080 |
| 2.125%, 8/15/26(6) | EUR | 1,070 | 981,740 |
| Canpack S.A./Canpack US, LLC, 3.875%, 11/15/29(1) | | 547 | 430,117 |
| Crown Americas, LLC/Crown Americas Capital Corp. VI, 4.75%, 2/1/26 | | 377 | 362,974 |
| | | | $ 2,715,970 |
| Cosmetics/Toiletries — 0.1% |
| Edgewell Personal Care Co.: | | | |
| 4.125%, 4/1/29(1) | | 238 | $ 199,352 |
| 5.50%, 6/1/28(1) | | 391 | 357,257 |
| | | | $ 556,609 |
| Distribution & Wholesale — 1.1% |
| BCPE Empire Holdings, Inc., 7.625%, 5/1/27(1) | | 1,138 | $ 1,044,861 |
| Parts Europe S.A., 7.993%, (3 mo. EURIBOR + 4.00%), 7/20/27(2)(6) | EUR | 1,167 | 1,237,696 |
| Performance Food Group, Inc.: | | | |
| 4.25%, 8/1/29(1) | | 551 | 465,499 |
| 6.875%, 5/1/25(1) | | 209 | 208,157 |
| Rexel S.A., 5.25%, 9/15/30(6) | EUR | 680 | 710,845 |
| Ritchie Bros Holdings, Inc.: | | | |
| 6.75%, 3/15/28(1) | | 190 | 186,433 |
| 7.75%, 3/15/31(1) | | 457 | 458,714 |
| Windsor Holdings III, LLC, 8.50%, 6/15/30(1) | | 719 | 700,821 |
| | | | $ 5,013,026 |
| Diversified Financial Services — 1.8% |
| AG TTMT Escrow Issuer, LLC, 8.625%, 9/30/27(1) | | 345 | $ 346,939 |
| Encore Capital Group, Inc., 5.375%, 2/15/26(6) | GBP | 230 | 255,917 |
| Intrum AB, 4.875%, 8/15/25(6) | EUR | 600 | 571,139 |
| Jane Street Group/JSG Finance, Inc., 4.50%, 11/15/29(1) | | 511 | 436,023 |
| Jefferson Capital Holdings, LLC, 6.00%, 8/15/26(1) | | 798 | 697,721 |
| KOC Holding AS, 6.50%, 3/11/25(6) | | 1,400 | 1,383,424 |
| Macquarie Airfinance Holdings, Ltd., 8.125%, 3/30/29(1) | | 265 | 261,292 |
| Oxford Finance, LLC/Oxford Finance Co-Issuer II, Inc., 6.375%, 2/1/27(1) | | 443 | 404,149 |
| PRA Group, Inc., 7.375%, 9/1/25(1) | | 651 | 609,352 |
| ProGroup AG, 3.00%, 3/31/26(6) | EUR | 500 | 494,651 |
| Rocket Mortgage, LLC/Rocket Mortgage Co.-Issuer, Inc.: | | | |
| 2.875%, 10/15/26(1) | | 261 | 227,516 |
11
See Notes to Financial Statements.
Eaton Vance
Multi-Asset Credit Fund
October 31, 2023
Portfolio of Investments — continued
| Security | Principal
Amount*
(000's omitted) | Value |
| Diversified Financial Services (continued) |
Rocket Mortgage, LLC/Rocket Mortgage Co.-Issuer, Inc.:
(continued) | | | |
| 3.625%, 3/1/29(1) | | 849 | $ 691,089 |
| 4.00%, 10/15/33(1) | | 65 | 47,851 |
| Sherwood Financing PLC, 6.00%, 11/15/26(6) | GBP | 934 | 948,757 |
| VistaJet Malta Finance PLC/Vista Management Holding, Inc.: | | | |
| 6.375%, 2/1/30(1) | | 945 | 631,225 |
| 7.875%, 5/1/27(1) | | 250 | 192,541 |
| 9.50%, 6/1/28(1) | | 297 | 227,875 |
| | | | $ 8,427,461 |
| Diversified Telecommunication Services — 0.2% |
| Altice France S.A., 8.125%, 2/1/27(1) | | 1,065 | $ 898,967 |
| | | | $ 898,967 |
| Drugs — 0.6% |
| Catalent Pharma Solutions, Inc., 2.375%, 3/1/28(6) | EUR | 900 | $ 785,235 |
| Endo DAC/Endo Finance, LLC/Endo Finco, Inc., 5.875%, 10/15/24(1)(10) | | 400 | 269,000 |
| Endo Luxembourg Finance Co. I S.a.r.l./Endo US, Inc., 6.125%, 4/1/29(1)(10) | | 459 | 303,424 |
| Gruenenthal GmbH, 3.625%, 11/15/26(6) | EUR | 500 | 503,083 |
| Perrigo Finance Unlimited Co.: | | | |
| 4.65%, 6/15/30 | | 899 | 751,751 |
| 4.90%, 12/15/44 | | 406 | 277,770 |
| | | | $ 2,890,263 |
| Ecological Services and Equipment — 1.0% |
| Clean Harbors, Inc.: | | | |
| 4.875%, 7/15/27(1) | | 200 | $ 186,658 |
| 5.125%, 7/15/29(1) | | 418 | 376,428 |
| Covanta Holding Corp., 4.875%, 12/1/29(1) | | 1,290 | 1,008,187 |
| GFL Environmental, Inc.: | | | |
| 3.50%, 9/1/28(1) | | 889 | 762,220 |
| 4.25%, 6/1/25(1) | | 313 | 301,221 |
| 4.75%, 6/15/29(1) | | 906 | 794,029 |
| Paprec Holding S.A.: | | | |
| 3.50%, 7/1/28(6) | EUR | 910 | 855,030 |
| 4.00%, 3/31/25(6) | EUR | 400 | 418,728 |
| | | | $ 4,702,501 |
| Electric Utilities — 0.9% |
| EDP - Energias de Portugal S.A., 4.496% to 1/30/24, 4/30/79(6)(7) | EUR | 1,500 | $ 1,580,802 |
| Security | Principal
Amount*
(000's omitted) | Value |
| Electric Utilities (continued) |
| Electricite de France S.A., 7.50% to 9/6/28(6)(7)(9) | EUR | 400 | $ 428,869 |
| Energizer Gamma Acquisition B.V., 3.50%, 6/30/29(6) | EUR | 550 | 460,906 |
| FirstEnergy Corp.: | | | |
| 2.65%, 3/1/30 | | 585 | 472,436 |
| Series B, 4.15%, 7/15/27 | | 494 | 457,655 |
| Pattern Energy Operations, L.P./Pattern Energy Operations, Inc., 4.50%, 8/15/28(1) | | 578 | 504,411 |
| TransAlta Corp., 7.75%, 11/15/29 | | 448 | 446,218 |
| | | | $ 4,351,297 |
| Electronics/Electrical — 0.6% |
| Coherent Corp., 5.00%, 12/15/29(1) | | 995 | $ 845,676 |
| Imola Merger Corp., 4.75%, 5/15/29(1) | | 1,026 | 895,347 |
| Open Text Corp., 3.875%, 2/15/28(1) | | 798 | 694,467 |
| Sensata Technologies, Inc., 4.375%, 2/15/30(1) | | 360 | 304,682 |
| | | | $ 2,740,172 |
| Energy — 1.0% |
| Enviva Partners, L.P./Enviva Partners Finance Corp., 6.50%, 1/15/26(1) | | 1,078 | $ 758,475 |
| Greenko Solar Mauritius, Ltd.: | | | |
| 5.55%, 1/29/25(1) | | 1,100 | 1,057,375 |
| 5.95%, 7/29/26(1) | | 1,200 | 1,108,500 |
| New Fortress Energy, Inc., 6.50%, 9/30/26(1) | | 941 | 843,726 |
| Sunoco, L.P./Sunoco Finance Corp.: | | | |
| 4.50%, 5/15/29 | | 583 | 505,693 |
| 4.50%, 4/30/30 | | 372 | 318,123 |
| | | | $ 4,591,892 |
| Engineering & Construction — 0.1% |
| Brundage-Bone Concrete Pumping Holdings, Inc., 6.00%, 2/1/26(1) | | 42 | $ 39,754 |
| TopBuild Corp., 4.125%, 2/15/32(1) | | 791 | 626,808 |
| | | | $ 666,562 |
| Entertainment — 1.5% |
| Allwyn Entertainment Financing UK PLC, 7.25%, 4/30/30(6) | EUR | 1,047 | $ 1,105,892 |
| Boyne USA, Inc., 4.75%, 5/15/29(1) | | 814 | 709,488 |
| Caesars Entertainment, Inc.: | | | |
| 6.25%, 7/1/25(1) | | 1,031 | 1,015,207 |
| 7.00%, 2/15/30(1) | | 250 | 241,504 |
| 8.125%, 7/1/27(1) | | 508 | 503,773 |
| CDI Escrow Issuer, Inc., 5.75%, 4/1/30(1) | | 669 | 598,384 |
| CPUK Finance, Ltd., 4.875%, 2/28/47(6) | GBP | 1,130 | 1,286,511 |
12
See Notes to Financial Statements.
Eaton Vance
Multi-Asset Credit Fund
October 31, 2023
Portfolio of Investments — continued
| Security | Principal
Amount*
(000's omitted) | Value |
| Entertainment (continued) |
| Jacobs Entertainment, Inc., 6.75%, 2/15/29(1) | | 755 | $ 642,407 |
| Light & Wonder International, Inc., 7.00%, 5/15/28(1) | | 719 | 701,556 |
| Speedway Motorsports, LLC/Speedway Funding II, Inc., 4.875%, 11/1/27(1) | | 519 | 463,745 |
| | | | $ 7,268,467 |
| Financial Intermediaries — 1.0% |
| Ally Financial, Inc., Series B, 4.70% to 5/15/26(7)(9) | | 635 | $ 414,162 |
| Compass Group Diversified Holdings, LLC, 5.25%, 4/15/29(1) | | 788 | 673,723 |
| Ford Motor Credit Co., LLC: | | | |
| 2.70%, 8/10/26 | | 800 | 717,861 |
| 2.90%, 2/16/28 | | 203 | 172,898 |
| 3.815%, 11/2/27 | | 1,141 | 1,018,450 |
| 4.125%, 8/17/27 | | 457 | 415,398 |
| 5.113%, 5/3/29 | | 600 | 546,658 |
| 5.125%, 6/16/25 | | 273 | 265,883 |
| MSCI, Inc.: | | | |
| 3.625%, 9/1/30(1) | | 357 | 295,821 |
| 3.875%, 2/15/31(1) | | 443 | 366,087 |
| | | | $ 4,886,941 |
| Food Products — 0.5% |
| Chobani, LLC/Chobani Finance Corp., Inc., 7.50%, 4/15/25(1) | | 463 | $ 455,239 |
| Nomad Foods Bondco PLC, 2.50%, 6/24/28(6) | EUR | 1,170 | 1,076,279 |
| Pilgrim's Pride Corp., 3.50%, 3/1/32 | | 951 | 725,651 |
| | | | $ 2,257,169 |
| Food Service — 0.4% |
| 1011778 B.C. Unlimited Liability Company/New Red Finance, Inc.: | | | |
| 3.875%, 1/15/28(1) | | 386 | $ 344,956 |
| 4.375%, 1/15/28(1) | | 673 | 606,576 |
| IRB Holding Corp., 7.00%, 6/15/25(1) | | 37 | 36,757 |
| US Foods, Inc., 4.75%, 2/15/29(1) | | 816 | 720,611 |
| | | | $ 1,708,900 |
| Food/Drug Retailers — 0.2% |
| Albertsons Cos., Inc./Safeway, Inc./New Albertsons, L.P./Albertsons, LLC, 5.875%, 2/15/28(1) | | 806 | $ 772,852 |
| | | | $ 772,852 |
| Health Care — 3.5% |
| AHP Health Partners, Inc., 5.75%, 7/15/29(1) | | 212 | $ 174,039 |
| Security | Principal
Amount*
(000's omitted) | Value |
| Health Care (continued) |
| Avantor Funding, Inc., 2.625%, 11/1/25(6) | EUR | 300 | $ 306,250 |
| Bausch & Lomb Escrow Corp., 8.375%, 10/1/28(1) | | 595 | 591,728 |
| Cerba Healthcare SACA, 3.50%, 5/31/28(6) | EUR | 250 | 215,697 |
| Chrome Holdco S.A.S., 5.00%, 5/31/29(6) | EUR | 1,100 | 844,645 |
| Encompass Health Corp., 4.75%, 2/1/30 | | 616 | 532,990 |
| Fortrea Holdings, Inc., 7.50%, 7/1/30(1) | | 844 | 815,515 |
| Grifols Escrow Issuer S.A.: | | | |
| 3.875%, 10/15/28(6) | EUR | 2,100 | 1,856,012 |
| 4.75%, 10/15/28(1) | | 595 | 500,312 |
| Grifols S.A., 3.20%, 5/1/25(6) | EUR | 350 | 355,711 |
| Heartland Dental, LLC/Heartland Dental Finance Corp., 10.50%, 4/30/28(1) | | 1,155 | 1,111,549 |
| IQVIA, Inc.: | | | |
| 2.25%, 3/15/29(6) | EUR | 611 | 544,616 |
| 2.875%, 6/15/28(6) | EUR | 350 | 330,300 |
| 6.50%, 5/15/30(1) | | 337 | 327,311 |
| Legacy LifePoint Health, LLC, 4.375%, 2/15/27(1) | | 354 | 293,052 |
| LifePoint Health, Inc.: | | | |
| 5.375%, 1/15/29(1) | | 377 | 228,776 |
| 9.875%, 8/15/30(1) | | 290 | 262,450 |
| Medline Borrower, L.P., 5.25%, 10/1/29(1) | | 1,361 | 1,159,853 |
| ModivCare Escrow Issuer, Inc., 5.00%, 10/1/29(1) | | 519 | 378,766 |
| ModivCare, Inc., 5.875%, 11/15/25(1) | | 708 | 669,810 |
| Molina Healthcare, Inc.: | | | |
| 3.875%, 11/15/30(1) | | 573 | 468,023 |
| 3.875%, 5/15/32(1) | | 814 | 640,581 |
| Option Care Health, Inc., 4.375%, 10/31/29(1) | | 805 | 673,686 |
| RegionalCare Hospital Partners Holdings, Inc./LifePoint Health, Inc., 9.75%, 12/1/26(1) | | 643 | 601,855 |
| Team Health Holdings, Inc., 6.375%, 2/1/25(1) | | 639 | 507,027 |
| Tenet Healthcare Corp.: | | | |
| 6.125%, 10/1/28 | | 1,004 | 932,094 |
| 6.875%, 11/15/31 | | 313 | 288,931 |
| US Acute Care Solutions, LLC, 6.375%, 3/1/26(1) | | 845 | 719,724 |
| Varex Imaging Corp., 7.875%, 10/15/27(1) | | 446 | 437,662 |
| | | | $ 16,768,965 |
| Home Furnishings — 0.2% |
| CD&R Smokey Buyer, Inc., 6.75%, 7/15/25(1) | | 245 | $ 234,389 |
| Tempur Sealy International, Inc., 3.875%, 10/15/31(1) | | 673 | 504,870 |
| | | | $ 739,259 |
| Hotels, Restaurants & Leisure — 0.1% |
| Resorts World Las Vegas, LLC/RWLV Capital, Inc.: | | | |
| 4.625%, 4/6/31(6) | | 400 | $ 282,438 |
13
See Notes to Financial Statements.
Eaton Vance
Multi-Asset Credit Fund
October 31, 2023
Portfolio of Investments — continued
| Security | Principal
Amount*
(000's omitted) | Value |
| Hotels, Restaurants & Leisure (continued) |
Resorts World Las Vegas, LLC/RWLV Capital, Inc.:
(continued) | | | |
| 8.45%, 7/27/30(1) | | 200 | $ 184,604 |
| | | | $ 467,042 |
| Household Products — 0.1% |
| Spectrum Brands, Inc., 3.875%, 3/15/31(1) | | 299 | $ 239,639 |
| | | | $ 239,639 |
| Industrial Equipment — 0.1% |
| Madison IAQ, LLC, 5.875%, 6/30/29(1) | | 864 | $ 670,270 |
| | | | $ 670,270 |
| Insurance — 0.5% |
| Alliant Holdings Intermediate, LLC/Alliant Holdings Co-Issuer, 6.75%, 10/15/27(1) | | 480 | $ 438,783 |
| Galaxy Finco, Ltd., 9.25%, 7/31/27(6) | GBP | 981 | 1,070,139 |
| Jones DesLauriers Insurance Management, Inc., 10.50%, 12/15/30(1) | | 728 | 723,226 |
| | | | $ 2,232,148 |
| Internet Software & Services — 0.7% |
| Arches Buyer, Inc.: | | | |
| 4.25%, 6/1/28(1) | | 270 | $ 223,919 |
| 6.125%, 12/1/28(1) | | 940 | 760,192 |
| Cars.com, Inc., 6.375%, 11/1/28(1) | | 814 | 725,368 |
| Match Group Holdings II, LLC, 3.625%, 10/1/31(1) | | 919 | 706,150 |
| Science Applications International Corp., 4.875%, 4/1/28(1) | | 1,108 | 989,872 |
| | | | $ 3,405,501 |
| Leisure Goods/Activities/Movies — 1.7% |
| Acushnet Co., 7.375%, 10/15/28(1) | | 258 | $ 258,719 |
| Cinemark USA, Inc.: | | | |
| 5.25%, 7/15/28(1) | | 390 | 337,181 |
| 5.875%, 3/15/26(1) | | 375 | 356,457 |
| 8.75%, 5/1/25(1) | | 248 | 250,857 |
| LHMC Finco 2 S.a.r.l., 7.25%, (7.25% cash or 8.00% PIK), 10/2/25(6)(8) | EUR | 1,562 | 1,596,815 |
| Life Time, Inc.: | | | |
| 5.75%, 1/15/26(1) | | 401 | 388,715 |
| 8.00%, 4/15/26(1) | | 821 | 801,156 |
| Lindblad Expeditions Holdings, Inc., 9.00%, 5/15/28(1) | | 228 | 219,520 |
| Lindblad Expeditions, LLC, 6.75%, 2/15/27(1) | | 142 | 129,530 |
| Security | Principal
Amount*
(000's omitted) | Value |
| Leisure Goods/Activities/Movies (continued) |
| NCL Corp., Ltd.: | | | |
| 3.625%, 12/15/24(1) | | 135 | $ 127,807 |
| 5.875%, 3/15/26(1) | | 512 | 459,976 |
| 5.875%, 2/15/27(1) | | 102 | 93,990 |
| 7.75%, 2/15/29(1) | | 86 | 75,127 |
| NCL Finance, Ltd., 6.125%, 3/15/28(1) | | 295 | 246,939 |
| Playtika Holding Corp., 4.25%, 3/15/29(1) | | 757 | 611,323 |
| Royal Caribbean Cruises, Ltd., 11.625%, 8/15/27(1) | | 480 | 521,059 |
| SeaWorld Parks & Entertainment, Inc., 5.25%, 8/15/29(1) | | 688 | 600,005 |
| Viking Cruises, Ltd.: | | | |
| 5.875%, 9/15/27(1) | | 985 | 888,278 |
| 7.00%, 2/15/29(1) | | 205 | 185,698 |
| Viking Ocean Cruises Ship VII, Ltd., 5.625%, 2/15/29(1) | | 131 | 116,242 |
| | | | $ 8,265,394 |
| Machinery — 0.4% |
| Chart Industries, Inc., 9.50%, 1/1/31(1) | | 648 | $ 668,201 |
| IMA Industria Macchine Automatiche SpA, 3.75%, 1/15/28(6) | EUR | 700 | 666,781 |
| Renk AG, 5.75%, 7/15/25(6) | EUR | 500 | 522,721 |
| | | | $ 1,857,703 |
| Media — 0.3% |
| Beasley Mezzanine Holdings, LLC, 8.625%, 2/1/26(1) | | 470 | $ 310,788 |
| Outfront Media Capital, LLC/Outfront Media Capital Corp., 4.625%, 3/15/30(1) | | 514 | 412,981 |
| Univision Communications, Inc., 7.375%, 6/30/30(1) | | 564 | 497,162 |
| | | | $ 1,220,931 |
| Metals/Mining — 0.8% |
| Compass Minerals International, Inc., 6.75%, 12/1/27(1) | | 1,000 | $ 942,900 |
| Freeport-McMoRan, Inc., 5.45%, 3/15/43 | | 416 | 342,838 |
| Hudbay Minerals, Inc.: | | | |
| 4.50%, 4/1/26(1) | | 503 | 468,670 |
| 6.125%, 4/1/29(1) | | 220 | 197,133 |
| Novelis Corp., 3.25%, 11/15/26(1) | | 237 | 211,234 |
| Novelis Sheet Ingot GmbH, 3.375%, 4/15/29(6) | EUR | 1,077 | 977,059 |
| Roller Bearing Co. of America, Inc., 4.375%, 10/15/29(1) | | 552 | 468,791 |
| | | | $ 3,608,625 |
| Nonferrous Metals/Minerals — 0.3% |
| Eldorado Gold Corp., 6.25%, 9/1/29(1) | | 485 | $ 416,474 |
14
See Notes to Financial Statements.
Eaton Vance
Multi-Asset Credit Fund
October 31, 2023
Portfolio of Investments — continued
| Security | Principal
Amount*
(000's omitted) | Value |
| Nonferrous Metals/Minerals (continued) |
| First Quantum Minerals, Ltd., 6.875%, 3/1/26(1) | | 400 | $ 352,000 |
| New Gold, Inc., 7.50%, 7/15/27(1) | | 653 | 613,366 |
| | | | $ 1,381,840 |
| Oil and Gas — 2.2% |
| Aethon United BR, L.P./Aethon United Finance Corp., 8.25%, 2/15/26(1) | | 950 | $ 944,462 |
| Callon Petroleum Co., 8.00%, 8/1/28(1) | | 704 | 696,482 |
| Civitas Resources, Inc., 8.625%, 11/1/30(1) | | 150 | 152,833 |
| CrownRock, L.P./CrownRock Finance, Inc., 5.00%, 5/1/29(1) | | 487 | 459,777 |
| CVR Energy, Inc., 5.75%, 2/15/28(1) | | 865 | 777,985 |
| Endeavor Energy Resources, L.P./EER Finance, Inc., 5.75%, 1/30/28(1) | | 485 | 465,746 |
| Neptune Energy Bondco PLC, 6.625%, 5/15/25(1) | | 1,150 | 1,139,562 |
| Parkland Corp.: | | | |
| 4.50%, 10/1/29(1) | | 480 | 413,318 |
| 4.625%, 5/1/30(1) | | 292 | 249,250 |
| Permian Resources Operating, LLC: | | | |
| 5.875%, 7/1/29(1) | | 701 | 653,087 |
| 7.00%, 1/15/32(1) | | 418 | 405,610 |
| 7.75%, 2/15/26(1) | | 362 | 362,066 |
| Precision Drilling Corp., 7.125%, 1/15/26(1) | | 670 | 660,801 |
| Seadrill Finance, Ltd., 8.375%, 8/1/30(1) | | 200 | 200,282 |
| Southwestern Energy Co., 4.75%, 2/1/32 | | 810 | 697,375 |
| Transocean Poseidon, Ltd., 6.875%, 2/1/27(1) | | 439 | 430,379 |
| Transocean, Inc., 8.75%, 2/15/30(1) | | 206 | 205,717 |
| Vital Energy, Inc., 9.75%, 10/15/30 | | 466 | 457,140 |
| Wintershall Dea Finance 2 B.V., Series NC5, 2.499% to 4/20/26(6)(7)(9) | EUR | 1,300 | 1,210,377 |
| | | | $ 10,582,249 |
| Packaging & Containers — 1.0% |
| Ball Corp., 6.875%, 3/15/28 | | 487 | $ 486,074 |
| Berry Global, Inc., 5.625%, 7/15/27(1) | | 321 | 306,748 |
| Kleopatra Finco S.a.r.l., 4.25%, 3/1/26(6) | EUR | 1,110 | 975,692 |
| Owens-Brockway Glass Container, Inc., 7.25%, 5/15/31(1) | | 752 | 689,020 |
| Schoeller Packaging B.V., 6.375%, 11/1/24(6) | EUR | 950 | 990,620 |
| Trivium Packaging Finance B.V.: | | | |
| 3.75%, 8/15/26(6) | EUR | 575 | 552,294 |
| 7.531%, (3 mo. EURIBOR + 3.75%), 8/15/26(2)(6) | EUR | 740 | 763,420 |
| | | | $ 4,763,868 |
| Security | Principal
Amount*
(000's omitted) | Value |
| Pharmaceuticals — 0.6% |
| Bayer AG, 5.375% to 6/25/30, 3/25/82(6)(7) | EUR | 500 | $ 484,962 |
| BellRing Brands, Inc., 7.00%, 3/15/30(1) | | 535 | 520,170 |
| Cheplapharm Arzneimittel GmbH, 8.531%, (3 mo. EURIBOR + 4.75%), 5/15/30(2)(6) | EUR | 825 | 879,480 |
| Herbalife Nutrition, Ltd./HLF Financing, Inc., 7.875%, 9/1/25(1) | | 575 | 541,644 |
| P&L Development, LLC/PLD Finance Corp., 7.75%, 11/15/25(1) | | 590 | 396,866 |
| | | | $ 2,823,122 |
| Pipelines — 1.5% |
| Antero Midstream Partners, L.P./Antero Midstream Finance Corp.: | | | |
| 5.75%, 3/1/27(1) | | 493 | $ 471,667 |
| 7.875%, 5/15/26(1) | | 148 | 149,193 |
| Cheniere Energy Partners, L.P., 4.00%, 3/1/31 | | 611 | 512,171 |
| DT Midstream, Inc., 4.125%, 6/15/29(1) | | 599 | 515,598 |
| Energy Transfer, L.P., 5.00%, 5/15/50 | | 337 | 252,906 |
| EQM Midstream Partners, L.P.: | | | |
| 4.50%, 1/15/29(1) | | 1,033 | 906,918 |
| 6.00%, 7/1/25(1) | | 75 | 73,417 |
| 6.50%, 7/1/27(1) | | 405 | 394,055 |
| 7.50%, 6/1/30(1) | | 536 | 526,454 |
| Kinetik Holdings, L.P., 5.875%, 6/15/30(1) | | 679 | 623,682 |
| Plains All American Pipeline, L.P., Series B, 9.736%, (3 mo. SOFR + 4.372%)(2)(9) | | 601 | 567,773 |
| Venture Global LNG, Inc.: | | | |
| 8.125%, 6/1/28(1) | | 609 | 591,696 |
| 8.375%, 6/1/31(1) | | 574 | 548,170 |
| 9.50%, 2/1/29(1) | | 370 | 376,129 |
| 9.875%, 2/1/32(1) | | 373 | 378,451 |
| | | | $ 6,888,280 |
| Publishing — 0.1% |
| McGraw-Hill Education, Inc.: | | | |
| 5.75%, 8/1/28(1) | | 326 | $ 275,112 |
| 8.00%, 8/1/29(1) | | 481 | 396,969 |
| | | | $ 672,081 |
| Radio and Television — 0.1% |
| Clear Channel Outdoor Holdings, Inc., 7.75%, 4/15/28(1) | | 875 | $ 669,830 |
| | | | $ 669,830 |
15
See Notes to Financial Statements.
Eaton Vance
Multi-Asset Credit Fund
October 31, 2023
Portfolio of Investments — continued
| Security | Principal
Amount*
(000's omitted) | Value |
| Real Estate Investment Trusts (REITs) — 0.9% |
| CTR Partnership, L.P./CareTrust Capital Corp., 3.875%, 6/30/28(1) | | 662 | $ 556,934 |
| Cushman & Wakefield US Borrower, LLC, 8.875%, 9/1/31(1) | | 302 | 286,612 |
| Emeria SASU: | | | |
| 3.375%, 3/31/28(6) | EUR | 600 | 508,185 |
| 7.75%, 3/31/28(6) | EUR | 480 | 468,160 |
| Greystar Real Estate Partners, LLC, 7.75%, 9/1/30(1) | | 643 | 632,593 |
| HAT Holdings I, LLC/HAT Holdings II, LLC: | | | |
| 3.375%, 6/15/26(1) | | 600 | 528,800 |
| 3.75%, 9/15/30(1) | | 785 | 564,363 |
| Heimstaden Bostad AB, 3.248% to 11/19/24(6)(7)(9) | EUR | 950 | 533,427 |
| | | | $ 4,079,074 |
| Retail — 1.7% |
| Arko Corp., 5.125%, 11/15/29(1) | | 699 | $ 567,504 |
| Dufry One B.V., 3.375%, 4/15/28(6) | EUR | 1,350 | 1,268,912 |
| Evergreen AcqCo 1, L.P./TVI, Inc., 9.75%, 4/26/28(1) | | 871 | 879,688 |
| Ferrellgas, L.P./Ferrellgas Finance Corp., 5.875%, 4/1/29(1) | | 793 | 700,492 |
| Group 1 Automotive, Inc., 4.00%, 8/15/28(1) | | 575 | 495,545 |
| Ken Garff Automotive, LLC, 4.875%, 9/15/28(1) | | 724 | 612,960 |
| Kohl's Corp., 4.625%, 5/1/31 | | 439 | 300,671 |
| LCM Investments Holdings II, LLC: | | | |
| 4.875%, 5/1/29(1) | | 775 | 650,285 |
| 8.25%, 8/1/31(1) | | 92 | 87,603 |
| Midco GB SASU, 7.75%, (7.75% cash or 8.50% PIK), 11/1/27(6)(8) | EUR | 815 | 815,205 |
| PEU (Fin) PLC, 7.25%, 7/1/28(6) | EUR | 600 | 610,757 |
| Punch Finance PLC, 6.125%, 6/30/26(6) | GBP | 745 | 781,364 |
| Suburban Propane Partners, L.P./Suburban Energy Finance Corp., 5.00%, 6/1/31(1) | | 254 | 210,655 |
| | | | $ 7,981,641 |
| Retailers (Except Food and Drug) — 0.6% |
| Bath & Body Works, Inc.: | | | |
| 6.875%, 11/1/35 | | 410 | $ 362,221 |
| 6.95%, 3/1/33 | | 282 | 244,135 |
| 7.60%, 7/15/37 | | 13 | 11,036 |
| 9.375%, 7/1/25(1) | | 54 | 55,667 |
| Dave & Buster's, Inc., 7.625%, 11/1/25(1) | | 923 | 917,010 |
| Security | Principal
Amount*
(000's omitted) | Value |
| Retailers (Except Food and Drug) (continued) |
| PetSmart, Inc./PetSmart Finance Corp., 7.75%, 2/15/29(1) | | 844 | $ 777,837 |
| Superior Plus, L.P./Superior General Partner, Inc., 4.50%, 3/15/29(1) | | 737 | 629,372 |
| | | | $ 2,997,278 |
| Semiconductors & Semiconductor Equipment — 0.1% |
| ON Semiconductor Corp., 3.875%, 9/1/28(1) | | 554 | $ 495,445 |
| | | | $ 495,445 |
| Software — 0.4% |
| Central Parent, LLC/CDK Global II, LLC/CDK Financing Co., Inc., 8.00%, 6/15/29(1) | | 374 | $ 369,792 |
| Clarivate Science Holdings Corp., 4.875%, 7/1/29(1) | | 994 | 839,582 |
| Cloud Software Group, Inc.: | | | |
| 6.50%, 3/31/29(1) | | 344 | 302,344 |
| 9.00%, 9/30/29(1) | | 648 | 552,423 |
| | | | $ 2,064,141 |
| Software and Services — 0.2% |
| Fair Isaac Corp., 4.00%, 6/15/28(1) | | 667 | $ 594,709 |
| Gartner, Inc., 3.75%, 10/1/30(1) | | 547 | 453,564 |
| | | | $ 1,048,273 |
| Specialty Retail — 0.3% |
| Fiber Bidco SpA: | | | |
| 9.955%, (3 mo. EURIBOR + 6.00%), 10/25/27(2)(6) | EUR | 817 | $ 873,653 |
| 11.00%, 10/25/27(6) | EUR | 270 | 304,042 |
| | | | $ 1,177,695 |
| Steel — 0.1% |
| Allegheny Ludlum, LLC, 6.95%, 12/15/25 | | 401 | $ 399,749 |
| TMS International Corp., 6.25%, 4/15/29(1) | | 89 | 70,310 |
| | | | $ 470,059 |
| Surface Transport — 0.1% |
| Hertz Corp. (The): | | | |
| 4.625%, 12/1/26(1) | | 47 | $ 39,413 |
| 5.00%, 12/1/29(1) | | 679 | 488,320 |
| | | | $ 527,733 |
| Technology — 0.5% |
| athenahealth Group, Inc., 6.50%, 2/15/30(1) | | 1,055 | $ 863,065 |
16
See Notes to Financial Statements.
Eaton Vance
Multi-Asset Credit Fund
October 31, 2023
Portfolio of Investments — continued
| Security | Principal
Amount*
(000's omitted) | Value |
| Technology (continued) |
| International Game Technology PLC: | | | |
| 3.50%, 6/15/26(6) | EUR | 250 | $ 253,159 |
| 4.125%, 4/15/26(1) | | 573 | 539,720 |
| 6.25%, 1/15/27(1) | | 200 | 195,100 |
| 6.50%, 2/15/25(1) | | 383 | 380,784 |
| | | | $ 2,231,828 |
| Telecommunications — 2.9% |
| Ciena Corp., 4.00%, 1/31/30(1) | | 706 | $ 589,062 |
| Connect Finco S.a.r.l./Connect US Finco, LLC, 6.75%, 10/1/26(1) | | 1,299 | 1,212,339 |
| Iliad Holding SASU: | | | |
| 6.50%, 10/15/26(1) | | 943 | 882,037 |
| 7.00%, 10/15/28(1) | | 362 | 327,884 |
| LCPR Senior Secured Financing DAC, 5.125%, 7/15/29(1) | | 1,141 | 890,003 |
| Level 3 Financing, Inc., 4.25%, 7/1/28(1) | | 594 | 336,443 |
| Lorca Telecom Bondco S.A., 4.00%, 9/18/27(6) | EUR | 1,600 | 1,576,119 |
| Network i2i, Ltd., 3.975% to 3/3/26(6)(7)(9) | | 1,000 | 904,990 |
| PLT VII Finance S.a.r.l., 8.59%, (3 mo. EURIBOR + 4.625%), 1/5/26(2)(6) | EUR | 500 | 529,804 |
| Stagwell Global, LLC, 5.625%, 8/15/29(1) | | 429 | 355,058 |
| Summer (BC) Bidco B, LLC, 5.50%, 10/31/26(1) | | 383 | 333,863 |
| Summer (BC) Holdco A S.a.r.l., 9.25%, 10/31/27(6) | EUR | 327 | 276,869 |
| Summer (BC) Holdco B S.a.r.l., 5.75%, 10/31/26(6) | EUR | 600 | 575,355 |
| Telecom Italia Finance S.A., 7.75%, 1/24/33 | EUR | 435 | 483,471 |
| Telecom Italia SpA: | | | |
| 2.75%, 4/15/25(6) | EUR | 367 | 370,549 |
| 6.875%, 2/15/28(6) | EUR | 300 | 316,240 |
| 7.875%, 7/31/28(6) | EUR | 300 | 325,380 |
| Telefonica Europe B.V., 7.125% to 8/23/28(6)(7)(9) | EUR | 800 | 867,068 |
| Viasat, Inc., 5.625%, 4/15/27(1) | | 528 | 461,424 |
| Viavi Solutions, Inc., 3.75%, 10/1/29(1) | | 601 | 468,485 |
| Vodafone Group PLC, 4.875% to 7/3/25, 10/3/78(6)(7) | GBP | 500 | 576,621 |
| Wp/ap Telecom Holdings III B.V., 5.50%, 1/15/30(6) | EUR | 1,125 | 999,705 |
| | | | $ 13,658,769 |
| Transportation — 0.3% |
| Cargo Aircraft Management, Inc., 4.75%, 2/1/28(1) | | 457 | $ 403,844 |
| Seaspan Corp., 5.50%, 8/1/29(1) | | 836 | 642,198 |
| Watco Cos., LLC/Watco Finance Corp., 6.50%, 6/15/27(1) | | 609 | 568,072 |
| | | | $ 1,614,114 |
| Utilities — 0.9% |
| Calpine Corp.: | | | |
| 5.00%, 2/1/31(1) | | 615 | $ 496,664 |
| Security | Principal
Amount*
(000's omitted) | Value |
| Utilities (continued) |
| Calpine Corp.: (continued) | | | |
| 5.125%, 3/15/28(1) | | 450 | $ 403,147 |
| Leeward Renewable Energy Operations, LLC, 4.25%, 7/1/29(1) | | 411 | 336,149 |
| NRG Energy, Inc.: | | | |
| 3.625%, 2/15/31(1) | | 563 | 425,559 |
| 3.875%, 2/15/32(1) | | 118 | 87,869 |
| 5.75%, 1/15/28 | | 384 | 359,788 |
| 10.25% to 3/15/28(1)(7)(9) | | 509 | 491,911 |
| TerraForm Power Operating, LLC: | | | |
| 4.75%, 1/15/30(1) | | 460 | 389,234 |
| 5.00%, 1/31/28(1) | | 450 | 412,697 |
| Vistra Operations Co., LLC: | | | |
| 4.375%, 5/1/29(1) | | 193 | 164,148 |
| 5.00%, 7/31/27(1) | | 580 | 531,104 |
| | | | $ 4,098,270 |
Total Corporate Bonds
(identified cost $237,366,162) | | | $218,862,790 |
| Foreign Corporate Bonds — 0.2% |
| Security | Principal
Amount
(000's omitted) | Value |
| Chemicals and Plastics — 0.2% | | | |
| Braskem Idesa SAPI, 7.45%, 11/15/29(6) | $ | 1,150 | $ 728,476 |
| | | | $ 728,476 |
| Real Estate Investment Trusts (REITs) — 0.0%(11) | | | |
| Shimao Group Holdings, Ltd., 5.60%, 7/15/26(6)(10) | $ | 1,250 | $ 31,250 |
| | | | $ 31,250 |
Total Foreign Corporate Bonds
(identified cost $2,523,182) | | | $ 759,726 |
| Security | Shares | Value |
| Distribution & Wholesale — 0.2% |
| WESCO International, Inc., Series A, 10.625% to 6/22/25(7) | | 36,126 | $ 963,119 |
Total Preferred Stocks
(identified cost $1,027,931) | | | $ 963,119 |
17
See Notes to Financial Statements.
Eaton Vance
Multi-Asset Credit Fund
October 31, 2023
Portfolio of Investments —��continued
| Senior Floating-Rate Loans — 38.0%(12) |
| Borrower/Description | Principal
Amount
(000's omitted) | Value |
| Aerospace and Defense — 0.9% |
| Dynasty Acquisition Co., Inc.: | | | |
| Term Loan, 9.324%, (SOFR + 4.00%), 8/24/28 | $ | 890 | $ 881,310 |
| Term Loan, 9.324%, (SOFR + 4.00%), 8/24/28 | | 381 | 377,705 |
| TransDigm, Inc., Term Loan, 8.64%, (SOFR + 3.25%), 8/24/28 | | 1,741 | 1,740,916 |
| WP CPP Holdings, LLC, Term Loan, 9.29%, (SOFR + 3.75%), 4/30/25 | | 1,105 | 1,064,756 |
| | | | $ 4,064,687 |
| Airlines — 0.6% |
| Air Canada, Term Loan, 9.128%, (SOFR + 3.50%), 8/11/28 | $ | 479 | $ 478,777 |
| American Airlines, Inc., Term Loan, 10.427%, (SOFR + 4.75%), 4/20/28 | | 1,350 | 1,370,864 |
| Mileage Plus Holdings, LLC, Term Loan, 10.798%, (SOFR + 5.25%), 6/21/27 | | 490 | 505,568 |
| United Airlines, Inc., Term Loan, 9.189%, (SOFR + 3.75%), 4/21/28 | | 373 | 375,213 |
| | | | $ 2,730,422 |
| Apparel & Luxury Goods — 0.3% |
| ABG Intermediate Holdings 2, LLC, Term Loan, 8.924%, (SOFR + 3.50%), 12/21/28 | $ | 291 | $ 290,618 |
| Hanesbrands, Inc., Term Loan, 9.074%, (SOFR + 3.75%), 3/8/30 | | 1,047 | 1,035,468 |
| | | | $ 1,326,086 |
| Auto Components — 1.0% |
| Adient US, LLC, Term Loan, 8.689%, (SOFR + 3.25%), 4/10/28 | $ | 1,000 | $ 1,001,161 |
| Autokiniton US Holdings, Inc., Term Loan, 9.939%, (SOFR + 4.50%), 4/6/28 | | 1,087 | 1,067,271 |
| Clarios Global, L.P., Term Loan, 9.074%, (SOFR + 3.75%), 5/6/30 | | 1,669 | 1,668,479 |
| DexKo Global, Inc., Term Loan, 9.402%, (SOFR + 3.75%), 10/4/28 | | 517 | 496,360 |
| LTI Holdings, Inc., Term Loan, 8.939%, (SOFR + 3.50%), 9/6/25 | | 711 | 679,908 |
| | | | $ 4,913,179 |
| Automobiles — 0.5% |
| Bombardier Recreational Products, Inc., Term Loan, 7.424%, (SOFR + 2.00%), 5/24/27 | $ | 1,389 | $ 1,378,756 |
| Borrower/Description | Principal
Amount
(000's omitted) | Value |
| Automobiles (continued) |
| MajorDrive Holdings IV, LLC, Term Loan, 9.652%, (SOFR + 4.00%), 6/1/28 | $ | 996 | $ 969,828 |
| | | | $ 2,348,584 |
| Beverages — 0.1% |
| Triton Water Holdings, Inc., Term Loan, 8.902%, (SOFR + 3.25%), 3/31/28 | $ | 748 | $ 710,916 |
| | | | $ 710,916 |
| Biotechnology — 0.1% |
| Alltech, Inc., Term Loan, 9.439%, (SOFR + 4.00%), 10/13/28 | $ | 732 | $ 716,360 |
| | | | $ 716,360 |
| Building Products — 0.5% |
| Cornerstone Building Brands, Inc., Term Loan, 8.685%, (SOFR + 3.25%), 4/12/28 | $ | 497 | $ 474,339 |
| Oscar AcquisitionCo, LLC, Term Loan, 9.99%, (SOFR + 4.50%), 4/29/29 | | 743 | 724,402 |
| Standard Industries, Inc., Term Loan, 7.953%, (SOFR + 2.50%), 9/22/28 | | 984 | 986,840 |
| | | | $ 2,185,581 |
| Capital Markets — 1.6% |
| Advisor Group, Inc., Term Loan, 9.824%, (SOFR + 4.50%), 8/17/28 | $ | 965 | $ 961,998 |
| Aretec Group, Inc.: | | | |
| Term Loan, 9.674%, (SOFR + 4.25%), 10/1/25 | | 692 | 692,333 |
| Term Loan, 9.924%, (SOFR + 4.50%), 8/9/30 | | 474 | 461,375 |
| Citco Funding, LLC, Term Loan, 4/27/28(13) | | 1,225 | 1,227,297 |
| Edelman Financial Center, LLC, Term Loan, 8.939%, (SOFR + 3.50%), 4/7/28 | | 746 | 734,640 |
| Focus Financial Partners, LLC, Term Loan, 8.574%, (SOFR + 3.25%), 6/30/28 | | 997 | 994,863 |
| HighTower Holdings, LLC, Term Loan, 9.38%, (SOFR + 4.00%), 4/21/28 | | 997 | 980,623 |
| Mariner Wealth Advisors, LLC, Term Loan, 8.901%, (SOFR + 3.25%), 8/18/28 | | 796 | 784,000 |
| Victory Capital Holdings, Inc., Term Loan, 7.772%, (SOFR + 2.25%), 7/1/26 | | 1,000 | 999,531 |
| | | | $ 7,836,660 |
| Chemicals — 3.0% |
| Aruba Investments, Inc., Term Loan, 9.424%, (SOFR + 4.00%), 11/24/27 | $ | 598 | $ 589,309 |
18
See Notes to Financial Statements.
Eaton Vance
Multi-Asset Credit Fund
October 31, 2023
Portfolio of Investments — continued
| Borrower/Description | Principal
Amount
(000's omitted) | Value |
| Chemicals (continued) |
| Axalta Coating Systems U.S. Holdings, Inc., Term Loan, 7.89%, (SOFR + 2.50%), 12/20/29 | $ | 1,388 | $ 1,391,972 |
| Charter NEX US, Inc., Term Loan, 9.189%, (SOFR + 3.75%), 12/1/27 | | 896 | 874,706 |
| CPC Acquisition Corp., Term Loan, 9.402%, (SOFR + 3.75%), 12/29/27 | | 659 | 521,326 |
| Groupe Solmax, Inc., Term Loan, 10.303%, (SOFR + 4.75%), 5/29/28(14) | | 497 | 465,991 |
| INEOS Quattro Holdings UK, Ltd., Term Loan, 9.174%, (SOFR + 3.75%), 3/14/30 | | 773 | 760,017 |
| INEOS US Finance, LLC: | | | |
| Term Loan, 8.924%, (SOFR + 3.50%), 2/18/30 | | 499 | 490,490 |
| Term Loan, 9.174%, (SOFR + 3.75%), 11/8/27 | | 995 | 984,221 |
| Kraton Corporation, Term Loan, 8.921%, (SOFR + 3.25%), 3/15/29 | | 995 | 948,933 |
| Lonza Group AG, Term Loan, 9.415%, (SOFR + 3.93%), 7/3/28 | | 499 | 423,660 |
| Messer Industries GmbH, Term Loan, 8.152%, (SOFR + 2.50%), 3/2/26 | | 1,266 | 1,266,546 |
| Momentive Performance Materials, Inc., Term Loan, 9.824%, (SOFR + 4.50%), 3/29/28 | | 547 | 522,624 |
| Olympus Water US Holding Corporation, Term Loan, 9.99%, (SOFR + 4.50%), 11/9/28 | | 980 | 964,509 |
| PQ Corporation, Term Loan, 7.983%, (SOFR + 2.50%), 6/9/28 | | 1,004 | 999,542 |
| Starfruit Finco B.V., Term Loan, 9.419%, (SOFR + 4.00%), 4/3/28 | | 723 | 707,518 |
| Tronox Finance, LLC, Term Loan, 8/16/28(13) | | 1,000 | 987,500 |
| W.R. Grace & Co.-Conn., Term Loan, 9.402%, (SOFR + 3.75%), 9/22/28 | | 1,278 | 1,257,776 |
| | | | $ 14,156,640 |
| Commercial Services & Supplies — 1.4% |
| Allied Universal Holdco, LLC, Term Loan, 9.174%, (SOFR + 3.75%), 5/12/28 | $ | 631 | $ 599,897 |
| Belfor Holdings, Inc., Term Loan, 9.439%, (SOFR + 4.00%), 4/6/26 | | 497 | 497,403 |
| EnergySolutions, LLC, Term Loan, 9.382%, (SOFR + 4.00%), 9/20/30 | | 791 | �� 787,753 |
| Garda World Security Corporation, Term Loan, 9.746%, (SOFR + 4.25%), 10/30/26 | | 1,050 | 1,048,360 |
| GFL Environmental, Inc., Term Loan, 7.912%, (SOFR + 2.50%), 5/31/27 | | 795 | 796,745 |
| SITEL Worldwide Corporation, Term Loan, 9.189%, (SOFR + 3.75%), 8/28/28 | | 995 | 961,047 |
| Borrower/Description | Principal
Amount
(000's omitted) | Value |
| Commercial Services & Supplies (continued) |
| Tempo Acquisition, LLC, Term Loan, 8.074%, (SOFR + 2.75%), 8/31/28 | $ | 1,474 | $ 1,474,201 |
| TruGreen Limited Partnership, Term Loan, 9.424%, (SOFR + 4.00%), 11/2/27 | | 598 | 562,853 |
| | | | $ 6,728,259 |
| Communications Equipment — 0.1% |
| CommScope, Inc., Term Loan, 8.689%, (SOFR + 3.25%), 4/6/26 | $ | 579 | $ 501,502 |
| | | | $ 501,502 |
| Construction Materials — 0.3% |
| Quikrete Holdings, Inc., Term Loan, 8.189%, (SOFR + 2.75%), 3/19/29 | $ | 1,285 | $ 1,286,430 |
| | | | $ 1,286,430 |
| Containers & Packaging — 0.2% |
| Clydesdale Acquisition Holdings, Inc., Term Loan, 9.599%, (SOFR + 4.18%), 4/13/29 | $ | 742 | $ 719,544 |
| Trident TPI Holdings, Inc., Term Loan, 9.652%, (SOFR + 4.00%), 9/15/28 | | 496 | 490,874 |
| | | | $ 1,210,418 |
| Diversified Consumer Services — 0.6% |
| Ascend Learning, LLC, Term Loan, 8.924%, (SOFR + 3.50%), 12/11/28 | $ | 499 | $ 465,535 |
| Belron Finance US, LLC, Term Loan, 8.245%, (SOFR + 2.75%), 4/18/29 | | 1,397 | 1,400,340 |
| KUEHG Corp., Term Loan, 10.39%, (SOFR + 5.00%), 6/12/30 | | 875 | 875,390 |
| | | | $ 2,741,265 |
| Electrical Equipment — 0.3% |
| Brookfield WEC Holdings, Inc., Term Loan, 8.189%, (SOFR + 2.75%), 8/1/25 | $ | 1,256 | $ 1,255,803 |
| | | | $ 1,255,803 |
| Electronic Equipment, Instruments & Components — 0.9% |
| Chamberlain Group, Inc., Term Loan, 8.674%, (SOFR + 3.25%), 11/3/28 | $ | 748 | $ 727,757 |
| Creation Technologies, Inc., Term Loan, 11.176%, (SOFR + 5.50%), 10/5/28 | | 497 | 471,358 |
| Ingram Micro, Inc., Term Loan, 8.653%, (SOFR + 3.00%), 6/30/28 | | 372 | 371,501 |
| Robertshaw US Holding Corp.: | | | |
| Term Loan, 13.49%, (SOFR + 8.00%), 8.49% cash, 5.00% PIK, 2/28/27 | | 443 | 447,846 |
19
See Notes to Financial Statements.
Eaton Vance
Multi-Asset Credit Fund
October 31, 2023
Portfolio of Investments — continued
| Borrower/Description | Principal
Amount
(000's omitted) | Value |
| Electronic Equipment, Instruments & Components (continued) |
| Robertshaw US Holding Corp.: (continued) | | | |
| Term Loan - Second Lien, 12.49%, (SOFR + 7.00%), 2/28/27 | $ | 1,873 | $ 1,582,392 |
| Verifone Systems, Inc., Term Loan, 9.653%, (SOFR + 4.00%), 8/20/25 | | 742 | 691,493 |
| | | | $ 4,292,347 |
| Energy Equipment & Services — 0.2% |
| GIP Pilot Acquisition Partners L.P., Term Loan, 8.388%, (SOFR + 3.00%), 10/4/30 | $ | 925 | $ 925,000 |
| | | | $ 925,000 |
| Entertainment — 0.7% |
| Delta 2 (LUX) S.a.r.l., Term Loan, 7.574%, (SOFR + 2.25%), 1/15/30 | $ | 1,000 | $ 997,500 |
| Playtika Holding Corp., Term Loan, 8.189%, (SOFR + 2.75%), 3/13/28 | | 348 | 338,377 |
| Renaissance Holding Corp., Term Loan, 10.074%, (SOFR + 4.75%), 4/5/30 | | 625 | 617,317 |
| UFC Holdings, LLC, Term Loan, 8.399%, (SOFR + 2.75%), 4/29/26 | | 1,311 | 1,311,010 |
| | | | $ 3,264,204 |
| Financial Services — 0.2% |
| GTCR W Merger Sub, LLC, Term Loan, 9/20/30(13) | $ | 850 | $ 844,840 |
| | | | $ 844,840 |
| Food Products — 0.4% |
| Del Monte Foods, Inc., Term Loan, 9.682%, (SOFR + 4.25%), 5/16/29 | $ | 499 | $ 483,903 |
| Nomad Foods US, LLC, Term Loan, 8.469%, (SOFR + 3.00%), 11/13/29 | | 1,207 | 1,207,890 |
| | | | $ 1,691,793 |
| Gas Utilities — 0.3% |
| CQP Holdco, L.P., Term Loan, 8.99%, (SOFR + 3.50%), 6/5/28 | $ | 1,491 | $ 1,491,569 |
| | | | $ 1,491,569 |
| Health Care Equipment & Supplies — 0.3% |
| Gloves Buyer, Inc., Term Loan, 9.439%, (SOFR + 4.00%), 12/29/27 | $ | 497 | $ 480,038 |
| Borrower/Description | Principal
Amount
(000's omitted) | Value |
| Health Care Equipment & Supplies (continued) |
| Journey Personal Care Corp., Term Loan, 9.981%, (6 mo. USD LIBOR + 4.25%), 3/1/28 | $ | 497 | $ 478,334 |
| Medline Borrower, L.P., Term Loan, 8.689%, (SOFR + 3.25%), 10/23/28 | | 691 | 687,536 |
| | | | $ 1,645,908 |
| Health Care Providers & Services — 1.3% |
| CCRR Parent, Inc., Term Loan, 9.189%, (SOFR + 3.75%), 3/6/28 | $ | 997 | $ 950,064 |
| CHG Healthcare Services, Inc., Term Loan, 8.689%, (SOFR + 3.25%), 9/29/28 | | 874 | 865,448 |
| Medical Solutions Holdings, Inc., Term Loan, 8.773%, (SOFR + 3.25%), 11/1/28 | | 986 | 921,305 |
| National Mentor Holdings, Inc.: | | | |
| Term Loan, 9.187%, (SOFR + 3.75%), 3/2/28(14) | | 760 | 665,727 |
| Term Loan, 9.24%, (SOFR + 3.75%), 3/2/28 | | 27 | 24,068 |
| Pearl Intermediate Parent, LLC, Term Loan - Second Lien, 11.674%, (SOFR + 6.25%), 2/13/26 | | 142 | 141,882 |
| Pluto Acquisition I, Inc., Term Loan, 9.684%, (SOFR + 4.00%), 6/22/26 | | 992 | 842,786 |
| Surgery Center Holdings, Inc., Term Loan, 9.203%, (SOFR + 3.75%), 8/31/26 | | 1,000 | 1,000,455 |
| TTF Holdings, LLC, Term Loan, 3/31/28(13) | | 750 | 750,937 |
| | | | $ 6,162,672 |
| Health Care Technology — 0.6% |
| athenahealth Group, Inc., Term Loan, 8.577%, (SOFR + 3.25%), 2/15/29 | $ | 880 | $ 853,107 |
| Navicure, Inc., Term Loan, 9.439%, (SOFR + 4.00%), 10/22/26 | | 660 | 660,893 |
| Symplr Software, Inc., Term Loan, 9.983%, (SOFR + 4.50%), 12/22/27 | | 499 | 438,563 |
| Verscend Holding Corp., Term Loan, 9.439%, (SOFR + 4.00%), 8/27/25 | | 1,028 | 1,028,677 |
| | | | $ 2,981,240 |
| Hotels, Restaurants & Leisure — 1.9% |
| Carnival Corporation, Term Loan, 8.689%, (SOFR + 3.25%), 10/18/28 | $ | 1,147 | $ 1,128,337 |
| ClubCorp Holdings, Inc., Term Loan, 10.398%, (SOFR + 5.00%), 9/18/26 | | 692 | 678,514 |
| Dave & Buster's, Inc., Term Loan, 9.188%, (SOFR + 3.75%), 6/29/29 | | 348 | 348,584 |
| Fertitta Entertainment, LLC, Term Loan, 9.324%, (SOFR + 4.00%), 1/27/29 | | 854 | 836,600 |
| Four Seasons Hotels Limited, Term Loan, 11/30/29(13) | | 1,400 | 1,402,722 |
20
See Notes to Financial Statements.
Eaton Vance
Multi-Asset Credit Fund
October 31, 2023
Portfolio of Investments — continued
| Borrower/Description | Principal
Amount
(000's omitted) | Value |
| Hotels, Restaurants & Leisure (continued) |
| IRB Holding Corp., Term Loan, 8.424%, (SOFR + 3.00%), 12/15/27 | $ | 1,810 | $ 1,792,971 |
| SeaWorld Parks & Entertainment, Inc., Term Loan, 8.439%, (SOFR + 3.00%), 8/25/28 | | 995 | 994,509 |
| Spectacle Gary Holdings, LLC, Term Loan, 9.674%, (SOFR + 4.25%), 12/10/28 | | 801 | 783,128 |
| Stars Group Holdings B.V. (The), Term Loan, 8.902%, (SOFR + 3.25%), 7/22/28 | | 995 | 997,066 |
| | | | $ 8,962,431 |
| Household Durables — 0.3% |
| ACProducts, Inc., Term Loan, 9.902%, (SOFR + 4.25%), 5/17/28 | $ | 792 | $ 631,539 |
| Solis IV B.V., Term Loan, 8.891%, (SOFR + 3.50%), 2/26/29 | | 994 | 940,300 |
| | | | $ 1,571,839 |
| Household Products — 0.4% |
| Energizer Holdings, Inc., Term Loan, 7.703%, (SOFR + 2.25%), 12/22/27 | $ | 1,266 | $ 1,265,841 |
| Kronos Acquisition Holdings, Inc., Term Loan, 9.402%, (SOFR + 3.75%), 12/22/26 | | 897 | 881,114 |
| | | | $ 2,146,955 |
| Insurance — 1.3% |
| Alliant Holdings Intermediate, LLC, Term Loan, 8.939%, (1 mo. USD LIBOR + 3.50%), 11/5/27 | $ | 746 | $ 744,727 |
| AmWINS Group, Inc., Term Loan, 7.689%, (SOFR + 2.25%), 2/19/28 | | 1,680 | 1,667,704 |
| AssuredPartners, Inc., Term Loan, 8.939%, (SOFR + 3.50%), 2/12/27 | | 497 | 493,673 |
| NFP Corp., Term Loan, 8.689%, (SOFR + 3.25%), 2/16/27 | | 995 | 977,574 |
| Ryan Specialty Group, LLC, Term Loan, 8.424%, (SOFR + 3.00%), 9/1/27 | | 997 | 998,365 |
| USI, Inc., Term Loan, 9.14%, (SOFR + 3.75%), 11/22/29 | | 1,183 | 1,182,941 |
| | | | $ 6,064,984 |
| Interactive Media & Services — 0.1% |
| Getty Images, Inc., Term Loan, 9.99%, (SOFR + 4.50%), 2/19/26 | $ | 506 | $ 507,707 |
| | | | $ 507,707 |
| IT Services — 2.0% |
| Asurion, LLC: | | | |
| Term Loan, 8.689%, (SOFR + 3.25%), 12/23/26 | $ | 1,031 | $ 998,389 |
| Borrower/Description | Principal
Amount
(000's omitted) | Value |
| IT Services (continued) |
| Asurion, LLC: (continued) | | | |
| Term Loan - Second Lien, 10.689%, (SOFR + 5.25%), 1/31/28 | $ | 1,000 | $ 872,917 |
| Cyxtera DC Holdings, Inc.: | | | |
| DIP Loan, 13.951%, (SOFR + 8.50%), 12/7/23 | | 410 | 413,258 |
| Term Loan, 0.00%, 5/1/24(10) | | 1,480 | 866,014 |
| Endure Digital, Inc., Term Loan, 9.422%, (SOFR + 3.50%), 2/10/28 | | 990 | 921,355 |
| Gainwell Acquisition Corp., Term Loan, 9.49%, (SOFR + 4.00%), 10/1/27 | | 1,076 | 1,030,717 |
| Go Daddy Operating Company, LLC, Term Loan, 7.824%, (SOFR + 2.50%), 11/9/29 | | 998 | 999,526 |
| Informatica, LLC, Term Loan, 8.189%, (SOFR + 2.75%), 10/27/28 | | 1,798 | 1,796,221 |
| NAB Holdings, LLC, Term Loan, 8.54%, (SOFR + 3.00%), 11/23/28 | | 998 | 993,511 |
| Travelport Finance (Luxembourg) S.a.r.l., Term Loan, 12.652%, (SOFR + 7.26%), 5.402% cash, 7.25% PIK, 2/28/25 | | 399 | 379,997 |
| | | | $ 9,271,905 |
| Leisure Products — 0.1% |
| Peloton Interactive, Inc., Term Loan, 12.263%, (SOFR + 6.50%), 5/25/27 | $ | 312 | $ 313,922 |
| | | | $ 313,922 |
| Life Sciences Tools & Services — 0.2% |
| Curia Global, Inc., Term Loan, 9.233%, (SOFR + 3.75%), 8/30/26(14) | $ | 758 | $ 610,427 |
| Star Parent, Inc., Term Loan, 9.386%, (SOFR + 4.00%), 9/27/30 | | 600 | 574,187 |
| | | | $ 1,184,614 |
| Machinery — 2.7% |
| AI Aqua Merger Sub, Inc., Term Loan, 9.082%, (SOFR + 3.75%), 7/31/28 | $ | 1,047 | $ 1,027,658 |
| Albion Financing 3 S.a.r.l., Term Loan, 10.883%, (SOFR + 5.50%), 8/17/26 | | 597 | 596,627 |
| Alliance Laundry Systems, LLC, Term Loan, 8.932%, (SOFR + 3.50%), 10/8/27 | | 479 | 478,677 |
| Apex Tool Group, LLC, Term Loan, 10.689%, (SOFR + 5.25%), 2/8/29 | | 830 | 707,684 |
| Barnes Group, Inc., Term Loan, 9/3/30(13) | | 1,000 | 993,438 |
| Clark Equipment Company, Term Loan, 7.99%, (SOFR + 2.50%), 4/20/29 | | 437 | 437,937 |
| Conair Holdings, LLC, Term Loan, 9.189%, (SOFR + 3.75%), 5/17/28 | | 795 | 738,555 |
21
See Notes to Financial Statements.
Eaton Vance
Multi-Asset Credit Fund
October 31, 2023
Portfolio of Investments — continued
| Borrower/Description | Principal
Amount
(000's omitted) | Value |
| Machinery (continued) |
| EMRLD Borrower, L.P., Term Loan, 8.38%, (SOFR + 3.00%), 5/31/30 | $ | 1,225 | $ 1,224,234 |
| Engineered Machinery Holdings, Inc., Term Loan, 9.152%, (SOFR + 3.50%), 5/19/28 | | 735 | 728,655 |
| Filtration Group Corporation, Term Loan, 8.939%, (SOFR + 3.50%), 10/21/28 | | 748 | 743,416 |
| Gates Global, LLC, Term Loan, 7.924%, (SOFR + 2.50%), 3/31/27 | | 1,527 | 1,525,956 |
| Madison IAQ, LLC, Term Loan, 8.703%, (SOFR + 3.25%), 6/21/28 | | 681 | 658,093 |
| Roper Industrial Products Investment Company, LLC, Term Loan, 9.89%, (SOFR + 4.50%), 11/22/29 | | 698 | 697,419 |
| SPX Flow, Inc., Term Loan, 9.924%, (SOFR + 4.50%), 4/5/29 | | 950 | 943,023 |
| Vertical US Newco, Inc., Term Loan, 8.98%, (SOFR + 3.50%), 7/30/27 | | 1,244 | 1,236,935 |
| | | | $ 12,738,307 |
| Media — 0.1% |
| Recorded Books, Inc., Term Loan, 9.324%, (SOFR + 4.00%), 8/29/25 | $ | 431 | $ 430,741 |
| | | | $ 430,741 |
| Metals/Mining — 0.6% |
| Arsenal AIC Parent, LLC, Term Loan, 9.879%, (SOFR + 4.50%), 8/18/30 | $ | 875 | $ 874,453 |
| PMHC II, Inc., Term Loan, 9.807%, (SOFR + 4.25%), 4/23/29 | | 796 | 726,383 |
| WireCo WorldGroup, Inc., Term Loan, 9.699%, (SOFR + 4.25%), 11/13/28 | | 689 | 686,332 |
| Zekelman Industries, Inc., Term Loan, 7.449%, (SOFR + 2.00%), 1/24/27 | | 498 | 497,646 |
| | | | $ 2,784,814 |
| Oil, Gas & Consumable Fuels — 0.5% |
| ITT Holdings, LLC, Term Loan, 10/5/30(13) | $ | 700 | $ 690,593 |
| Oryx Midstream Services Permian Basin, LLC, Term Loan, 8.692%, (SOFR + 3.25%), 10/5/28 | | 746 | 745,948 |
| UGI Energy Services, LLC, Term Loan, 8.674%, (SOFR + 3.25%), 2/22/30 | | 748 | 748,525 |
| | | | $ 2,185,066 |
| Pharmaceuticals — 0.5% |
| Bausch Health Companies, Inc., Term Loan, 10.689%, (SOFR + 5.25%), 2/1/27 | $ | 845 | $ 662,804 |
| Jazz Financing Lux S.a.r.l., Term Loan, 8.939%, (SOFR + 3.50%), 5/5/28 | | 960 | 961,057 |
| Borrower/Description | Principal
Amount
(000's omitted) | Value |
| Pharmaceuticals (continued) |
| Mallinckrodt International Finance S.A.: | | | |
| DIP Loan, 13.439%, (SOFR + 8.00%), 8/28/24 | $ | 29 | $ 30,534 |
| DIP Loan, 13.451%, (SOFR + 8.00%), 8/28/24 | | 55 | 57,871 |
| Term Loan, 12.703%, (SOFR + 7.25%), 9/30/27 | | 827 | 630,077 |
| | | | $ 2,342,343 |
| Professional Services — 1.3% |
| AlixPartners, LLP, Term Loan, 8.189%, (SOFR + 2.75%), 2/4/28 | $ | 705 | $ 705,319 |
| CoreLogic, Inc., Term Loan, 8.939%, (SOFR + 3.50%), 6/2/28 | | 974 | 888,585 |
| Employbridge Holding Company, Term Loan, 10.407%, (SOFR + 4.75%), 7/19/28 | | 497 | 433,880 |
| First Advantage Holdings, LLC, Term Loan, 8.189%, (SOFR + 2.75%), 1/31/27 | | 1,237 | 1,238,544 |
| Genuine Financial Holdings, LLC, Term Loan, 9.40%, (SOFR + 4.00%), 9/27/30 | | 500 | 495,469 |
| Neptune Bidco US, Inc., Term Loan, 10.507%, (SOFR + 5.00%), 4/11/29 | | 796 | 700,356 |
| Rockwood Service Corporation, Term Loan, 9.439%, (SOFR + 4.00%), 1/23/27 | | 724 | 725,727 |
| Trans Union, LLC, Term Loan, 7.689%, (SOFR + 2.25%), 12/1/28 | | 1,127 | 1,126,623 |
| | | | $ 6,314,503 |
| Real Estate Management & Development — 0.4% |
| Cushman & Wakefield U.S. Borrower, LLC, Term Loan, 8.674%, (SOFR + 3.25%), 1/31/30 | $ | 916 | $ 877,336 |
| Greystar Real Estate Partners, LLC, Term Loan, 9.147%, (SOFR + 3.75%), 8/21/30 | | 1,100 | 1,100,000 |
| | | | $ 1,977,336 |
| Road & Rail — 1.0% |
| Avis Budget Car Rental, LLC, Term Loan, 8.924%, (SOFR + 3.50%), 3/16/29 | $ | 1,393 | $ 1,395,715 |
| First Student Bidco, Inc.: | | | |
| Term Loan, 8.652%, (SOFR + 3.00%), 7/21/28 | | 136 | 132,123 |
| Term Loan, 8.655%, (SOFR + 3.00%), 7/21/28 | | 362 | 351,476 |
| Hertz Corporation (The): | | | |
| Term Loan, 8.691%, (SOFR + 3.25%), 6/30/28 | | 878 | 871,713 |
| Term Loan, 8.691%, (SOFR + 3.25%), 6/30/28 | | 169 | 168,066 |
| Uber Technologies, Inc., Term Loan, 8.159%, (SOFR + 2.75%), 3/3/30 | | 1,741 | 1,742,534 |
| | | | $ 4,661,627 |
22
See Notes to Financial Statements.
Eaton Vance
Multi-Asset Credit Fund
October 31, 2023
Portfolio of Investments — continued
| Borrower/Description | Principal
Amount
(000's omitted) | Value |
| Semiconductors & Semiconductor Equipment — 0.5% |
| Altar Bidco, Inc., Term Loan, 8.142%, (SOFR + 3.10%), 2/1/29(14) | $ | 996 | $ 988,671 |
| Entegris, Inc., Term Loan, 7.89%, (SOFR + 2.50%), 7/6/29 | | 616 | 617,621 |
| MKS Instruments, Inc., Term Loan, 7.819%, (SOFR + 2.50%), 8/17/29 | | 746 | 741,754 |
| | | | $ 2,348,046 |
| Software — 4.6% |
| Applied Systems, Inc., Term Loan, 9.89%, (SOFR + 4.50%), 9/18/26 | $ | 1,521 | $ 1,526,521 |
| Astra Acquisition Corp., Term Loan, 10.902%, (SOFR + 5.25%), 10/25/28 | | 771 | 528,576 |
| Banff Merger Sub, Inc., Term Loan, 9.189%, (SOFR + 3.75%), 10/2/25 | | 1,041 | 1,040,805 |
| Central Parent, Inc., Term Loan, 9.406%, (SOFR + 4.00%), 7/6/29 | | 1,191 | 1,186,311 |
| Cloud Software Group, Inc., Term Loan, 9.99%, (SOFR + 4.50%), 3/30/29(14) | | 1,096 | 1,043,529 |
| Delta TopCo, Inc., Term Loan, 9.069%, (SOFR + 3.75%), 12/1/27 | | 795 | 783,519 |
| Epicor Software Corporation, Term Loan, 8.689%, (SOFR + 3.25%), 7/30/27 | | 1,701 | 1,695,170 |
| GoTo Group, Inc., Term Loan, 10.13%, (SOFR + 4.75%), 8/31/27 | | 807 | 511,142 |
| Magenta Buyer, LLC, Term Loan, 10.645%, (SOFR + 5.00%), 7/27/28 | | 1,124 | 786,891 |
| McAfee, LLC, Term Loan, 9.165%, (SOFR + 3.75%), 3/1/29 | | 988 | 945,737 |
| Open Text Corporation, Term Loan, 8.174%, (SOFR + 2.75%), 1/31/30 | | 850 | 851,042 |
| Polaris Newco, LLC, Term Loan, 9.439%, (SOFR + 4.00%), 6/2/28 | | 723 | 684,062 |
| Proofpoint, Inc., Term Loan, 8.689%, (SOFR + 3.25%), 8/31/28 | | 1,133 | 1,115,693 |
| Quest Software US Holdings, Inc., Term Loan, 9.783%, (SOFR + 4.25%), 2/1/29 | | 499 | 397,030 |
| RealPage, Inc., Term Loan, 8.439%, (SOFR + 3.00%), 4/24/28 | | 966 | 945,142 |
| Redstone Holdco 2, L.P., Term Loan, 10.189%, (SOFR + 4.75%), 4/27/28 | | 310 | 248,870 |
| Riverbed Technology, Inc., Term Loan, 9.89%, (SOFR + 4.50%), 7/1/28 | | 110 | 71,942 |
| Skillsoft Corporation, Term Loan, 10.699%, (SOFR + 5.25%), 7/14/28 | | 499 | 457,677 |
| Sophia, L.P., Term Loan, 8.924%, (SOFR + 3.50%), 10/7/27 | | 1,466 | 1,449,025 |
| Borrower/Description | Principal
Amount
(000's omitted) | Value |
| Software (continued) |
| SS&C Technologies, Inc.: | | | |
| Term Loan, 7.674%, (SOFR + 2.25%), 3/22/29 | $ | 529 | $ 528,720 |
| Term Loan, 7.674%, (SOFR + 2.25%), 3/22/29 | | 837 | 837,540 |
| Ultimate Software Group, Inc. (The): | | | |
| Term Loan, 8.764%, (SOFR + 3.25%), 5/4/26 | | 1,461 | 1,455,116 |
| Term Loan, 9.233%, (SOFR + 3.75%), 5/4/26 | | 683 | 682,065 |
| Veritas US, Inc., Term Loan, 10.439%, (SOFR + 5.11%), 9/1/25 | | 953 | 809,438 |
| Vision Solutions, Inc., Term Loan, 9.64%, (SOFR + 4.00%), 4/24/28 | | 1,221 | 1,166,527 |
| | | | $ 21,748,090 |
| Specialty Retail — 1.5% |
| Great Outdoors Group, LLC, Term Loan, 9.402%, (SOFR + 3.75%), 3/6/28 | $ | 1,219 | $ 1,211,618 |
| Harbor Freight Tools USA, Inc., Term Loan, 8.189%, (SOFR + 2.75%), 10/19/27 | | 746 | 737,806 |
| Hoya Midco, LLC, Term Loan, 8.633%, (SOFR + 3.25%), 2/3/29 | | 623 | 623,072 |
| Les Schwab Tire Centers, Term Loan, 8.692%, (SOFR + 3.25%), 11/2/27 | | 1,202 | 1,199,365 |
| Mattress Firm, Inc., Term Loan, 9/25/28(13) | | 750 | 742,266 |
| Mavis Tire Express Services Corp., Term Loan, 9.439%, (SOFR + 4.00%), 5/4/28 | | 400 | 394,727 |
| Michaels Companies, Inc., Term Loan, 9.902%, (SOFR + 4.25%), 4/15/28 | | 382 | 320,456 |
| PetSmart, Inc., Term Loan, 9.174%, (SOFR + 3.75%), 2/11/28 | | 1,858 | 1,839,894 |
| | | | $ 7,069,204 |
| Trading Companies & Distributors — 1.4% |
| Core & Main, L.P., Term Loan, 7.967%, (SOFR + 2.50%), 7/27/28(14) | $ | 1,019 | $ 1,019,761 |
| Electro Rent Corporation, Term Loan, 11.002%, (SOFR + 5.50%), 11/1/24 | | 686 | 644,737 |
| Park River Holdings, Inc., Term Loan, 8.907%, (SOFR + 3.25%), 12/28/27 | | 497 | 471,509 |
| Spin Holdco, Inc., Term Loan, 9.664%, (SOFR + 4.00%), 3/4/28 | | 1,544 | 1,327,220 |
| SRS Distribution, Inc., Term Loan, 8.939%, (SOFR + 3.50%), 6/2/28 | | 1,239 | 1,212,742 |
| White Cap Buyer, LLC, Term Loan, 9.074%, (SOFR + 3.75%), 10/19/27 | | 1,244 | 1,237,601 |
| Windsor Holdings III, LLC, Term Loan, 9.815%, (SOFR + 4.50%), 8/1/30 | | 675 | 673,765 |
| | | | $ 6,587,335 |
23
See Notes to Financial Statements.
Eaton Vance
Multi-Asset Credit Fund
October 31, 2023
Portfolio of Investments — continued
| Borrower/Description | Principal
Amount
(000's omitted) | Value |
| Wireless Telecommunication Services — 0.2% |
| CCI Buyer, Inc., Term Loan, 9.39%, (SOFR + 4.00%), 12/17/27 | $ | 797 | $ 781,406 |
| | | | $ 781,406 |
Total Senior Floating-Rate Loans
(identified cost $183,269,160) | | | $180,005,540 |
| Security | Principal
Amount | Value |
| Entertainment — 0.0% |
| National CineMedia, Inc., Escrow Certificates(5)(15) | $ | 333,000 | $ 0 |
| | | | $ 0 |
| Surface Transport — 0.0%(11) |
| Hertz Corp., Escrow Certificates(1)(5) | $ | 105,000 | $ 9,450 |
| | | | $ 9,450 |
Total Miscellaneous
(identified cost $0) | | | $ 9,450 |
| Short-Term Investments — 9.6% |
| Security | Shares | Value |
| Morgan Stanley Institutional Liquidity Funds - Government Portfolio, Institutional Class, 5.25%(16) | | 45,142,813 | $ 45,142,813 |
Total Short-Term Investments
(identified cost $45,142,813) | | | $ 45,142,813 |
Total Investments — 101.2%
(identified cost $504,250,512) | | | $478,647,021 |
| Other Assets, Less Liabilities — (1.2)% | | | $ (5,595,689) |
| Net Assets — 100.0% | | | $473,051,332 |
| The percentage shown for each investment category in the Portfolio of Investments is based on net assets. |
| * | In U.S. dollars unless otherwise indicated. |
| (1) | Security exempt from registration under Rule 144A of the Securities Act of 1933, as amended. These securities may be sold in certain transactions in reliance on an exemption from registration (normally to qualified institutional buyers). At October 31, 2023, the aggregate value of these securities is $169,864,115 or 35.9% of the Fund's net assets. |
| (2) | Variable rate security. The stated interest rate represents the rate in effect at October 31, 2023. |
| (3) | Weighted average fixed-rate coupon that changes/updates monthly. Rate shown is the rate at October 31, 2023. |
| (4) | Represents an investment in an issuer that may be deemed to be an affiliate (see Note 10). |
| (5) | Non-income producing security. |
| (6) | Security exempt from registration under Regulation S of the Securities Act of 1933, as amended, which exempts from registration securities offered and sold outside the United States. Security may not be offered or sold in the United States except pursuant to an exemption from, or in a transaction not subject to, the registration requirements of the Securities Act of 1933, as amended. At October 31, 2023, the aggregate value of these securities is $61,085,080 or 12.9% of the Fund's net assets. |
| (7) | Security converts to variable rate after the indicated fixed-rate coupon period. |
| (8) | Represents a payment-in-kind security which may pay interest in additional principal at the issuer’s discretion. |
| (9) | Perpetual security with no stated maturity date but may be subject to calls by the issuer. |
| (10) | Issuer is in default with respect to interest and/or principal payments. |
| (11) | Amount is less than 0.05%. |
| (12) | Senior floating-rate loans (Senior Loans) often require prepayments from excess cash flows or permit the borrowers to repay at their election. The degree to which borrowers repay, whether as a contractual requirement or at their election, cannot be predicted with accuracy. As a result, the actual remaining maturity may be substantially less than the stated maturities shown. However, Senior Loans will typically have an expected average life of approximately two to four years. Senior Loans typically have rates of interest which are redetermined periodically by reference to a base lending rate, plus a spread. These base lending rates are primarily the Secured Overnight Financing Rate (“SOFR”) (or the London Interbank Offered Rate (“LIBOR”) for those loans whose rates reset prior to the discontinuance of LIBOR on June 30, 2023) and secondarily, the prime rate offered by one or more major United States banks (the “Prime Rate”). Base lending rates may be subject to a floor, or minimum rate. Rates for SOFR are generally 1 or 3-month tenors and may also be subject to a credit spread adjustment. Senior Loans are generally subject to contractual restrictions that must be satisfied before they can be bought or sold. |
| (13) | This Senior Loan will settle after October 31, 2023, at which time the interest rate will be determined. |
| (14) | The stated interest rate represents the weighted average interest rate at October 31, 2023 of contracts within the senior loan facility. Interest rates on contracts are primarily redetermined either monthly or quarterly by reference to the indicated base lending rate and spread and the reset period. |
| (15) | For fair value measurement disclosure purposes, security is categorized as Level 3 (see Note 11). |
| (16) | May be deemed to be an affiliated investment company. The rate shown is the annualized seven-day yield as of October 31, 2023. |
24
See Notes to Financial Statements.
Eaton Vance
Multi-Asset Credit Fund
October 31, 2023
Portfolio of Investments — continued
| Forward Foreign Currency Exchange Contracts (OTC) |
| Currency Purchased | Currency Sold | Counterparty | Settlement
Date | Unrealized
Appreciation | Unrealized
(Depreciation) |
| USD | 50,507,242 | EUR | 47,482,502 | Bank of America, N.A. | 1/31/24 | $ 51,056 | $ — |
| USD | 415,398 | EUR | 390,347 | State Street Bank and Trust Company | 1/31/24 | 606 | — |
| USD | 8,735,438 | GBP | 7,183,784 | State Street Bank and Trust Company | 1/31/24 | — | (2,444) |
| | | | | | | $51,662 | $(2,444) |
| Abbreviations: |
| DIP | – Debtor In Possession |
| EURIBOR | – Euro Interbank Offered Rate |
| LIBOR | – London Interbank Offered Rate |
| OTC | – Over-the-counter |
| PIK | – Payment In Kind |
| SOFR | – Secured Overnight Financing Rate |
| Currency Abbreviations: |
| EUR | – Euro |
| GBP | – British Pound Sterling |
| USD | – United States Dollar |
25
See Notes to Financial Statements.
Eaton Vance
Multi-Asset Credit Fund
October 31, 2023
Statement of Assets and Liabilities
| | October 31, 2023 |
| Assets | |
| Unaffiliated investments, at value (identified cost $458,744,053) | $ 433,137,210 |
| Affiliated investments, at value (identified cost $45,506,459) | 45,509,811 |
| Cash | 1,670,982 |
| Deposits for derivatives collateral - forward foreign currency exchange contracts | 2,680,000 |
| Foreign currency, at value (identified cost $45,129) | 45,112 |
| Interest receivable | 4,846,270 |
| Interest and dividends receivable from affiliated investments | 195,813 |
| Receivable for investments sold | 1,431,271 |
| Receivable for Fund shares sold | 1,203,360 |
| Receivable for open forward foreign currency exchange contracts | 51,662 |
| Tax reclaims receivable | 45,764 |
| Trustees' deferred compensation plan | 48,684 |
| Total assets | $ 490,865,939 |
| Liabilities | |
| Cash collateral due to brokers | $ 2,680,000 |
| Payable for investments purchased | 13,961,661 |
| Payable for Fund shares redeemed | 559,161 |
| Payable for open forward foreign currency exchange contracts | 2,444 |
| Distributions payable | 91,654 |
| Payable to affiliates: | |
| Investment adviser and administration fee | 211,892 |
| Distribution and service fees | 12,121 |
| Trustees' fees | 2,527 |
| Trustees' deferred compensation plan | 48,684 |
| Accrued expenses | 244,463 |
| Total liabilities | $ 17,814,607 |
| Net Assets | $ 473,051,332 |
| Sources of Net Assets | |
| Paid-in capital | $ 731,733,581 |
| Accumulated loss | (258,682,249) |
| Net Assets | $ 473,051,332 |
| Class A Shares | |
| Net Assets | $ 40,737,914 |
| Shares Outstanding | 4,286,970 |
Net Asset Value and Redemption Price Per Share
(net assets ÷ shares of beneficial interest outstanding) | $ 9.50 |
Maximum Offering Price Per Share
(100 ÷ 96.75 of net asset value per share) | $ 9.82 |
| Class C Shares | |
| Net Assets | $ 3,869,904 |
| Shares Outstanding | 406,929 |
Net Asset Value and Offering Price Per Share*
(net assets ÷ shares of beneficial interest outstanding) | $ 9.51 |
| Class I Shares | |
| Net Assets | $ 180,662,813 |
| Shares Outstanding | 18,962,372 |
Net Asset Value, Offering Price and Redemption Price Per Share
(net assets ÷ shares of beneficial interest outstanding) | $ 9.53 |
26
See Notes to Financial Statements.
Eaton Vance
Multi-Asset Credit Fund
October 31, 2023
Statement of Assets and Liabilities — continued
| | October 31, 2023 |
| Class R6 Shares | |
| Net Assets | $247,780,701 |
| Shares Outstanding | 26,017,515 |
Net Asset Value, Offering Price and Redemption Price Per Share
(net assets ÷ shares of beneficial interest outstanding) | $ 9.52 |
| On sales of $100,000 or more, the offering price of Class A shares is reduced. |
| * | Redemption price per share is equal to the net asset value less any applicable contingent deferred sales charge. |
27
See Notes to Financial Statements.
Eaton Vance
Multi-Asset Credit Fund
October 31, 2023
| | Year Ended |
| | October 31, 2023 |
| Investment Income | |
| Dividend income | $ 96,254 |
| Dividend income from affiliated investments | 1,621,766 |
| Interest and other income | 31,002,604 |
| Interest income from affiliated investments | 31,123 |
| Total investment income | $ 32,751,747 |
| Expenses | |
| Investment adviser and administration fee | $ 2,370,074 |
| Distribution and service fees: | |
| Class A | 107,403 |
| Class C | 54,292 |
| Trustees’ fees and expenses | 28,674 |
| Custodian fee | 194,396 |
| Transfer and dividend disbursing agent fees | 133,040 |
| Legal and accounting services | 107,224 |
| Printing and postage | 22,232 |
| Registration fees | 75,366 |
| Miscellaneous | 49,227 |
| Total expenses | $ 3,141,928 |
| Deduct: | |
| Waiver and/or reimbursement of expenses by affiliates | $ 50,799 |
| Total expense reductions | $ 50,799 |
| Net expenses | $ 3,091,129 |
| Net investment income | $ 29,660,618 |
| Realized and Unrealized Gain (Loss) | |
| Net realized gain (loss): | |
| Investment transactions | $ (21,528,999) |
| Foreign currency transactions | 183,291 |
| Forward foreign currency exchange contracts | (1,818,054) |
| Net realized loss | $(23,163,762) |
| Change in unrealized appreciation (depreciation): | |
| Investments | $ 28,642,962 |
| Investments - affiliated investments | 2,300 |
| Foreign currency | (9,980) |
| Forward foreign currency exchange contracts | (523,486) |
| Net change in unrealized appreciation (depreciation) | $ 28,111,796 |
| Net realized and unrealized gain | $ 4,948,034 |
| Net increase in net assets from operations | $ 34,608,652 |
28
See Notes to Financial Statements.
Eaton Vance
Multi-Asset Credit Fund
October 31, 2023
Statements of Changes in Net Assets
| | Year Ended October 31, |
| | 2023 | 2022 |
| Increase (Decrease) in Net Assets | | |
| From operations: | | |
| Net investment income | $ 29,660,618 | $ 19,272,667 |
| Net realized loss | (23,163,762) | (3,797,265) |
| Net change in unrealized appreciation (depreciation) | 28,111,796 | (47,511,771) |
| Net increase (decrease) in net assets from operations | $ 34,608,652 | $ (32,036,369) |
| Distributions to shareholders: | | |
| Class A | $ (2,908,778) | $ (2,179,540) |
| Class C | (323,146) | (613,791) |
| Class I | (13,472,073) | (12,184,954) |
| Class R6 | (13,600,022) | (5,097,071) |
| Total distributions to shareholders | $ (30,304,019) | $ (20,075,356) |
| Transactions in shares of beneficial interest: | | |
| Class A | $ (4,686,715) | $ (10,630,209) |
| Class C | (4,510,269) | (13,534,522) |
| Class I | (27,558,904) | (108,874,811) |
| Class R6 | 102,903,580 | 113,967,404 |
| Net increase (decrease) in net assets from Fund share transactions | $ 66,147,692 | $ (19,072,138) |
| Net increase (decrease) in net assets | $ 70,452,325 | $ (71,183,863) |
| Net Assets | | |
| At beginning of year | $ 402,599,007 | $ 473,782,870 |
| At end of year | $473,051,332 | $ 402,599,007 |
29
See Notes to Financial Statements.
Eaton Vance
Multi-Asset Credit Fund
October 31, 2023
| | Class A |
| | Year Ended October 31, |
| | 2023 | 2022 | 2021 | 2020 | 2019 |
| Net asset value — Beginning of year | $ 9.400 | $10.680 | $ 10.210 | $ 10.760 | $ 10.620 |
| Income (Loss) From Operations | | | | | |
| Net investment income(1) | $ 0.636 | $ 0.468 | $ 0.394 | $ 0.423 | $ 0.496 |
| Net realized and unrealized gain (loss) | 0.114 | (1.287) | 0.489 | (0.500) | 0.148 |
| Total income (loss) from operations | $ 0.750 | $ (0.819) | $ 0.883 | $ (0.077) | $ 0.644 |
| Less Distributions | | | | | |
| From net investment income | $ (0.650) | $ (0.461) | $ (0.413) | $ (0.473) | $ (0.504) |
| Total distributions | $ (0.650) | $ (0.461) | $ (0.413) | $ (0.473) | $ (0.504) |
| Net asset value — End of year | $ 9.500 | $ 9.400 | $10.680 | $10.210 | $10.760 |
| Total Return(2) | 8.13% | (7.80)% | 8.73% | (0.66)% (3) | 6.22% (3) |
| Ratios/Supplemental Data | | | | | |
| Net assets, end of year (000’s omitted) | $40,738 | $44,921 | $ 61,518 | $ 63,023 | $ 3,888 |
| Ratios (as a percentage of average daily net assets): | | | | | |
| Expenses | 0.95% (4) | 0.97% (4) | 0.96% | 0.99% (3) | 1.00% (3) |
| Net investment income | 6.63% | 4.66% | 3.70% | 4.13% | 4.64% |
| Portfolio Turnover | 54% | 80% | 76% | 93% | 96% |
| (1) | Computed using average shares outstanding. |
| (2) | Returns are historical and are calculated by determining the percentage change in net asset value with all distributions reinvested and do not reflect the effect of sales charges. |
| (3) | The investment adviser and administrator and sub-adviser reimbursed certain operating expenses (equal to 0.01% and 0.70% of average daily net assets for the years ended October 31, 2020 and 2019, respectively). Absent this reimbursement, total return would be lower. |
| (4) | Includes a reduction by the investment adviser of a portion of its adviser and administration fee due to the Fund’s investment in the Liquidity Fund (equal to 0.01% and less than 0.005% of average daily net assets for the years ended October 31, 2023 and 2022, respectively). |
30
See Notes to Financial Statements.
Eaton Vance
Multi-Asset Credit Fund
October 31, 2023
Financial Highlights — continued
| | Class C |
| | Year Ended October 31, |
| | 2023 | 2022 | 2021 | 2020 | 2019 |
| Net asset value — Beginning of year | $ 9.410 | $10.690 | $ 10.220 | $ 10.770 | $ 10.620 |
| Income (Loss) From Operations | | | | | |
| Net investment income(1) | $ 0.558 | $ 0.352 | $ 0.315 | $ 0.353 | $ 0.411 |
| Net realized and unrealized gain (loss) | 0.121 | (1.246) | 0.489 | (0.508) | 0.154 |
| Total income (loss) from operations | $ 0.679 | $ (0.894) | $ 0.804 | $ (0.155) | $ 0.565 |
| Less Distributions | | | | | |
| From net investment income | $ (0.579) | $ (0.386) | $ (0.334) | $ (0.395) | $ (0.415) |
| Total distributions | $(0.579) | $ (0.386) | $ (0.334) | $ (0.395) | $ (0.415) |
| Net asset value — End of year | $ 9.510 | $ 9.410 | $10.690 | $10.220 | $10.770 |
| Total Return(2) | 7.32% | (8.48)% | 7.92% | (1.40)% (3) | 5.43% (3) |
| Ratios/Supplemental Data | | | | | |
| Net assets, end of year (000’s omitted) | $ 3,870 | $ 8,267 | $ 23,956 | $ 34,273 | $ 1,259 |
| Ratios (as a percentage of average daily net assets): | | | | | |
| Expenses | 1.71% (4) | 1.72% (4) | 1.71% | 1.74% (3) | 1.75% (3) |
| Net investment income | 5.82% | 3.47% | 2.95% | 3.45% | 3.85% |
| Portfolio Turnover | 54% | 80% | 76% | 93% | 96% |
| (1) | Computed using average shares outstanding. |
| (2) | Returns are historical and are calculated by determining the percentage change in net asset value with all distributions reinvested and do not reflect the effect of sales charges. |
| (3) | The investment adviser and administrator and sub-adviser reimbursed certain operating expenses (equal to 0.01% and 0.70% of average daily net assets for the years ended October 31, 2020 and 2019, respectively). Absent this reimbursement, total return would be lower. |
| (4) | Includes a reduction by the investment adviser of a portion of its adviser and administration fee due to the Fund’s investment in the Liquidity Fund (equal to 0.01% and less than 0.005% of average daily net assets for the years ended October 31, 2023 and 2022, respectively). |
31
See Notes to Financial Statements.
Eaton Vance
Multi-Asset Credit Fund
October 31, 2023
Financial Highlights — continued
| | Class I |
| | Year Ended October 31, |
| | 2023 | 2022 | 2021 | 2020 | 2019 |
| Net asset value — Beginning of year | $ 9.430 | $ 10.710 | $ 10.240 | $ 10.790 | $ 10.650 |
| Income (Loss) From Operations | | | | | |
| Net investment income(1) | $ 0.661 | $ 0.461 | $ 0.420 | $ 0.449 | $ 0.526 |
| Net realized and unrealized gain (loss) | 0.115 | (1.253) | 0.491 | (0.499) | 0.146 |
| Total income (loss) from operations | $ 0.776 | $ (0.792) | $ 0.911 | $ (0.050) | $ 0.672 |
| Less Distributions | | | | | |
| From net investment income | $ (0.676) | $ (0.488) | $ (0.441) | $ (0.500) | $ (0.532) |
| Total distributions | $ (0.676) | $ (0.488) | $ (0.441) | $ (0.500) | $ (0.532) |
| Net asset value — End of year | $ 9.530 | $ 9.430 | $ 10.710 | $ 10.240 | $10.790 |
| Total Return(2) | 8.40% | (7.53)% | 8.99% | (0.40)% (3) | 6.48% (3) |
| Ratios/Supplemental Data | | | | | |
| Net assets, end of year (000’s omitted) | $180,663 | $205,778 | $345,990 | $304,389 | $ 68,533 |
| Ratios (as a percentage of average daily net assets): | | | | | |
| Expenses | 0.70% (4) | 0.72% (4) | 0.71% | 0.74% (3) | 0.75% (3) |
| Net investment income | 6.88% | 4.56% | 3.93% | 4.38% | 4.90% |
| Portfolio Turnover | 54% | 80% | 76% | 93% | 96% |
| (1) | Computed using average shares outstanding. |
| (2) | Returns are historical and are calculated by determining the percentage change in net asset value with all distributions reinvested. |
| (3) | The investment adviser and administrator and sub-adviser reimbursed certain operating expenses (equal to 0.01% and 0.70% of average daily net assets for the years ended October 31, 2020 and 2019, respectively). Absent this reimbursement, total return would be lower. |
| (4) | Includes a reduction by the investment adviser of a portion of its adviser and administration fee due to the Fund’s investment in the Liquidity Fund (equal to 0.01% and less than 0.005% of average daily net assets for the years ended October 31, 2023 and 2022, respectively). |
32
See Notes to Financial Statements.
Eaton Vance
Multi-Asset Credit Fund
October 31, 2023
Financial Highlights — continued
| | Class R6 | |
| | Year Ended October 31, | Period Ended
October 31,
2019(1) | |
| | 2023 | 2022 | 2021 | 2020 | |
| Net asset value — Beginning of period | $ 9.420 | $ 10.710 | $ 10.230 | $ 10.790 | $ 10.820 | |
| Income (Loss) From Operations | | | | | | |
| Net investment income(2) | $ 0.671 | $ 0.483 | $ 0.418 | $ 0.443 | $ 0.059 | |
| Net realized and unrealized gain (loss) | 0.109 | (1.281) | 0.507 | (0.501) | (0.011) | |
| Total income (loss) from operations | $ 0.780 | $ (0.798) | $ 0.925 | $ (0.058) | $ 0.048 | |
| Less Distributions | | | | | | |
| From net investment income | $ (0.680) | $ (0.492) | $ (0.445) | $ (0.502) | $ (0.078) | |
| Total distributions | $ (0.680) | $ (0.492) | $ (0.445) | $ (0.502) | $ (0.078) | |
| Net asset value — End of period | $ 9.520 | $ 9.420 | $10.710 | $10.230 | $10.790 | |
| Total Return(3) | 8.44% | (7.58)% | 9.13% | (0.47)% (4) | 0.44% (4)(5) | |
| Ratios/Supplemental Data | | | | | | |
| Net assets, end of period (000’s omitted) | $247,781 | $143,633 | $ 42,319 | $ 3,089 | $ 10 | |
| Ratios (as a percentage of average daily net assets): | | | | | | |
| Expenses | 0.65% (6) | 0.66% (6) | 0.65% | 0.69% (4) | 0.75% (4)(7) | |
| Net investment income | 6.97% | 4.90% | 3.90% | 4.34% | 3.40% (7) | |
| Portfolio Turnover | 54% | 80% | 76% | 93% | 96% (8) | |
| (1) | For the period from the commencement of operations, September 3, 2019, to October, 31, 2019. |
| (2) | Computed using average shares outstanding. |
| (3) | Returns are historical and are calculated by determining the percentage change in net asset value with all distributions reinvested. |
| (4) | The investment adviser and administrator and sub-adviser reimbursed certain operating expenses (equal to 0.01% and 0.68% of average daily net assets for the year ended October 31, 2020 and the period ended 2019, respectively). Absent this reimbursement, total return would be lower. |
| (5) | Not annualized. |
| (6) | Includes a reduction by the investment adviser of a portion of its adviser and administration fee due to the Fund’s investment in the Liquidity Fund (equal to 0.01% and less than 0.005% of average daily net assets for the years ended October 31, 2023 and 2022, respectively). |
| (7) | Annualized. |
| (8) | For the year ended October 31, 2019. |
33
See Notes to Financial Statements.
Eaton Vance
Multi-Asset Credit Fund
October 31, 2023
Notes to Financial Statements
1 Significant Accounting Policies
Eaton Vance Multi-Asset Credit Fund (the Fund) is a diversified series of Eaton Vance Mutual Funds Trust (the Trust). The Trust is a Massachusetts business trust registered under the Investment Company Act of 1940, as amended (the 1940 Act), as an open-end management investment company. The Fund’s investment objective is to seek total return. The Fund offers four classes of shares. Class A shares are generally sold subject to a sales charge imposed at time of purchase. Class C shares are sold at net asset value and are generally subject to a contingent deferred sales charge (see Note 6). Effective November 5, 2020, Class C shares automatically convert to Class A shares eight years after their purchase as described in the Fund’s prospectus. Class I and Class R6 shares are sold at net asset value and are not subject to a sales charge. Each class represents a pro rata interest in the Fund, but votes separately on class-specific matters and (as noted below) is subject to different expenses. Realized and unrealized gains and losses are allocated daily to each class of shares based on the relative net assets of each class to the total net assets of the Fund. Net investment income, other than class-specific expenses, is allocated daily to each class of shares based upon the ratio of the value of each class’s paid shares to the total value of all paid shares. Sub-accounting, recordkeeping and similar administrative fees payable to financial intermediaries, which are a component of transfer and dividend disbursing agent fees on the Statement of Operations, are not allocated to Class R6 shares. Each class of shares differs in its distribution plan and certain other class-specific expenses.
The following is a summary of significant accounting policies of the Fund. The policies are in conformity with accounting principles generally accepted in the United States of America (U.S. GAAP). The Fund is an investment company and follows accounting and reporting guidance in the Financial Accounting Standards Board (FASB) Accounting Standards Codification Topic 946.
A Investment Valuation—The following methodologies are used to determine the market value or fair value of investments.
Debt Obligations. Debt obligations are generally valued on the basis of valuations provided by third party pricing services, as derived from such services’ pricing models. Inputs to the models may include, but are not limited to, reported trades, executable bid and ask prices, broker/dealer quotations, prices or yields of securities with similar characteristics, interest rates, anticipated prepayments, benchmark curves or information pertaining to the issuer, as well as industry and economic events. The pricing services may use a matrix approach, which considers information regarding securities with similar characteristics to determine the valuation for a security. Short-term debt obligations purchased with a remaining maturity of sixty days or less for which a valuation from a third party pricing service is not readily available may be valued at amortized cost, which approximates fair value.
Senior Floating-Rate Loans. Interests in senior floating-rate loans (Senior Loans) are valued generally at the average mean of bid and ask quotations obtained from a third party pricing service. Senior Loans, for which a valuation is not available or deemed unreliable, are fair valued by the investment adviser utilizing one or more of the valuation techniques described below to assess the likelihood that the borrower will make a full repayment of the loan underlying such Senior Loan. If the investment adviser believes that there is a reasonable likelihood of full repayment, the investment adviser will determine fair value using a matrix pricing approach that considers the yield on the Senior Loan relative to yields on other Senior Loans issued by companies of comparable credit quality. If the investment adviser believes there is not a reasonable likelihood of full repayment, the investment adviser will determine fair value using analyses that include, but are not limited to: (i) a comparison of the value of the borrower’s outstanding equity and debt to that of comparable public companies; (ii) a discounted cash flow analysis; or (iii) when the investment adviser believes it is likely that a borrower will be liquidated or sold, an analysis of the terms of such liquidation or sale. In certain cases, the investment adviser will use a combination of analytical methods to determine fair value, such as when only a portion of a borrower’s assets are likely to be sold. In conducting its assessment and analyses for purposes of determining fair value of a Senior Loan, the investment adviser will use its discretion and judgment in considering and appraising relevant factors. Junior Loans (i.e., subordinated loans and second lien loans) are valued in the same manner as Senior Loans.
Equity Securities. Equity securities listed on a U.S. securities exchange generally are valued at the last sale or closing price on the day of valuation or, if no sales took place on such date, at the mean between the closing bid and ask prices on the exchange where such securities are principally traded. Equity securities listed on the NASDAQ National Market System are valued at the NASDAQ official closing price. Unlisted or listed securities for which closing sales prices or closing quotations are not available are valued at the mean between the latest available bid and ask prices or, in the case of preferred equity securities that are not listed or traded in the over-the-counter market, by a third party pricing service that uses various techniques that consider factors including, but not limited to, prices or yields of securities with similar characteristics, benchmark yields, broker/dealer quotes, quotes of underlying common stock, issuer spreads, as well as industry and economic events.
Derivatives. Forward foreign currency exchange contracts are generally valued at the mean of the average bid and average ask prices that are reported by currency dealers to a third party pricing service at the valuation time. Such third party pricing service valuations are supplied for specific settlement periods and the Fund’s forward foreign currency exchange contracts are valued at an interpolated rate between the closest preceding and subsequent settlement period reported by the third party pricing service.
Foreign Securities and Currencies. Foreign securities and currencies are valued in U.S. dollars, based on foreign currency exchange rate quotations supplied by a third party pricing service. The pricing service uses a proprietary model to determine the exchange rate. Inputs to the model include reported trades and implied bid/ask spreads.
Other. Investments in management investment companies (including money market funds) that do not trade on an exchange are valued at the net asset value as of the close of each business day.
Eaton Vance
Multi-Asset Credit Fund
October 31, 2023
Notes to Financial Statements — continued
Fair Valuation. In connection with Rule 2a-5 of the 1940 Act, the Trustees have designated the Fund’s investment adviser as its valuation designee. Investments for which valuations or market quotations are not readily available or are deemed unreliable are valued by the investment adviser, as valuation designee, at fair value using methods that most fairly reflect the security’s “fair value”, which is the amount that the Fund might reasonably expect to receive for the security upon its current sale in the ordinary course. Each such determination is based on a consideration of relevant factors, which are likely to vary from one pricing context to another. These factors may include, but are not limited to, the type of security, the existence of any contractual restrictions on the security’s disposition, the price and extent of public trading in similar securities of the issuer or of comparable companies or entities, quotations or relevant information obtained from broker/dealers or other market participants, information obtained from the issuer, analysts, and/or the appropriate stock exchange (for exchange-traded securities), an analysis of the company’s or entity’s financial statements, and an evaluation of the forces that influence the issuer and the market(s) in which the security is purchased and sold.
B Investment Transactions—Investment transactions for financial statement purposes are accounted for on a trade date basis. Realized gains and losses on investments sold are determined on the basis of identified cost.
C Income—Interest income is recorded on the basis of interest accrued, adjusted for amortization of premium or accretion of discount. Fees associated with loan amendments are recognized immediately. Dividend income is recorded on the ex-dividend date for dividends received in cash and/or securities. Distributions from investment companies are recorded as dividend income, capital gains or return of capital based on the nature of the distribution.
D Federal Taxes—The Fund's policy is to comply with the provisions of the Internal Revenue Code applicable to regulated investment companies and to distribute to shareholders each year substantially all of its net investment income, and all or substantially all of its net realized capital gains. Accordingly, no provision for federal income or excise tax is necessary.
As of October 31, 2023, the Fund had no uncertain tax positions that would require financial statement recognition, de-recognition, or disclosure. The Fund files a U.S. federal income tax return annually after its fiscal year-end, which is subject to examination by the Internal Revenue Service for a period of three years from the date of filing.
E Expenses—The majority of expenses of the Trust are directly identifiable to an individual fund. Expenses which are not readily identifiable to a specific fund are allocated taking into consideration, among other things, the nature and type of expense and the relative size of the funds.
F Foreign Currency Translation—Investment valuations, other assets, and liabilities initially expressed in foreign currencies are translated each business day into U.S. dollars based upon current exchange rates. Purchases and sales of foreign investment securities and income and expenses denominated in foreign currencies are translated into U.S. dollars based upon currency exchange rates in effect on the respective dates of such transactions. Recognized gains or losses on investment transactions attributable to changes in foreign currency exchange rates are recorded for financial statement purposes as net realized gains and losses on investments. That portion of unrealized gains and losses on investments that results from fluctuations in foreign currency exchange rates is not separately disclosed.
G Unfunded Loan Commitments—The Fund may enter into certain loan agreements all or a portion of which may be unfunded. The Fund is obligated to fund these commitments at the borrower's discretion. These commitments, if any, are disclosed in the accompanying Portfolio of Investments.
H Use of Estimates—The preparation of the financial statements in conformity with U.S. GAAP requires management to make estimates and assumptions that affect the reported amounts of assets and liabilities at the date of the financial statements and the reported amounts of income and expense during the reporting period. Actual results could differ from those estimates.
I Indemnifications—Under the Trust’s organizational documents, its officers and Trustees may be indemnified against certain liabilities and expenses arising out of the performance of their duties to the Fund. Under Massachusetts law, if certain conditions prevail, shareholders of a Massachusetts business trust (such as the Trust) could be deemed to have personal liability for the obligations of the Trust. However, the Trust’s Declaration of Trust contains an express disclaimer of liability on the part of Fund shareholders and the By-laws provide that the Trust shall assume, upon request by the shareholder, the defense on behalf of any Fund shareholders. Moreover, the By-laws also provide for indemnification out of Fund property of any shareholder held personally liable solely by reason of being or having been a shareholder for all loss or expense arising from such liability. Additionally, in the normal course of business, the Fund enters into agreements with service providers that may contain indemnification clauses. The Fund’s maximum exposure under these arrangements is unknown as this would involve future claims that may be made against the Fund that have not yet occurred.
J Forward Foreign Currency Exchange Contracts—The Fund may enter into forward foreign currency exchange contracts for the purchase or sale of a specific foreign currency at a fixed price on a future date. The forward foreign currency exchange contracts are adjusted by the daily exchange rate of the underlying currency and any gains or losses are recorded as unrealized until such time as the contracts have been closed. Risks may arise upon entering these contracts from the potential inability of counterparties to meet the terms of their contracts and from movements in the value of a foreign currency relative to the U.S. dollar.
Eaton Vance
Multi-Asset Credit Fund
October 31, 2023
Notes to Financial Statements — continued
2 Distributions to Shareholders and Income Tax Information
The Fund declares dividends daily to shareholders of record at the time of declaration. Distributions are generally paid monthly. Distributions of realized capital gains (if any) are made annually. Distributions to shareholders are recorded on the ex-dividend date. Distributions are declared separately for each class of shares. Shareholders may reinvest income and capital gain distributions in additional shares of the same class of the Fund at the net asset value as of the ex-dividend date or, at the election of the shareholder, receive distributions in cash. Distributions to shareholders are determined in accordance with income tax regulations, which may differ from U.S. GAAP. As required by U.S. GAAP, only distributions in excess of tax basis earnings and profits are reported in the financial statements as a return of capital. Permanent differences between book and tax accounting relating to distributions are reclassified to paid-in capital. For tax purposes, distributions from short-term capital gains are considered to be from ordinary income.
The tax character of distributions declared for the years ended October 31, 2023 and October 31, 2022 was as follows:
| | Year Ended October 31, |
| | 2023 | 2022 |
| Ordinary income | $30,304,019 | $20,075,356 |
During the year ended October 31, 2023, accumulated loss was increased by $306,846 and paid-in capital was increased by $306,846 due to the Fund’s use of equalization accounting. Tax equalization accounting allows the Fund to treat as a distribution that portion of redemption proceeds representing a redeeming shareholder’s portion of undistributed taxable income and net capital gains. These reclassifications had no effect on the net assets or net asset value per share of the Fund.
As of October 31, 2023, the components of distributable earnings (accumulated loss) on a tax basis were as follows:
| Undistributed ordinary income | $ 1,438,658 |
| Deferred capital losses | (235,077,003) |
| Net unrealized depreciation | (24,952,250) |
| Distributions payable | (91,654) |
| Accumulated loss | $(258,682,249) |
At October 31, 2023, the Fund, for federal income tax purposes, had deferred capital losses of $235,077,003 which would reduce its taxable income arising from future net realized gains on investment transactions, if any, to the extent permitted by the Internal Revenue Code, and thus would reduce the amount of distributions to shareholders, which would otherwise be necessary to relieve the Fund of any liability for federal income or excise tax. The deferred capital losses are treated as arising on the first day of the Fund’s next taxable year and retain the same short-term or long-term character as when originally deferred. Of the deferred capital losses at October 31, 2023, $5,196,025 are short-term and $229,880,978 are long-term.
The cost and unrealized appreciation (depreciation) of investments, including open derivative contracts, of the Fund at October 31, 2023, as determined on a federal income tax basis, were as follows:
| Aggregate cost | $ 503,573,337 |
| Gross unrealized appreciation | $ 3,381,936 |
| Gross unrealized depreciation | (28,308,252) |
| Net unrealized depreciation | $ (24,926,316) |
Eaton Vance
Multi-Asset Credit Fund
October 31, 2023
Notes to Financial Statements — continued
3 Investment Adviser and Administration Fee and Other Transactions with Affiliates
The investment adviser and administration fee is earned by Eaton Vance Management (EVM), an indirect, wholly-owned subsidiary of Morgan Stanley, as compensation for investment advisory and administrative services rendered to the Fund. The investment adviser and administration fee is computed at an annual rate as a percentage of the Fund’s average daily net assets that are not invested in other investment companies for which EVM or its affiliates serve as investment adviser and receive an advisory fee as follows and is payable monthly:
| Average Daily Net Assets | Annual Fee Rate |
| Up to $1 billion | 0.550% |
| $1 billion but less than $2.5 billion | 0.530% |
| $2.5 billion but less than $5 billion | 0.510% |
| $5 billion and over | 0.500% |
For the year ended October 31, 2023, the investment adviser and administration fee amounted to $2,370,074 or 0.55% of the Fund’s average daily net assets. Pursuant to an investment sub-advisory agreement, EVM has delegated a portion of the investment management of the Fund to Eaton Vance Advisers International Ltd. (EVAIL), an affiliate of EVM. EVM pays EVAIL a portion of its investment adviser and administration fee for sub-advisory services provided to the Fund.
The Fund may invest in a money market fund, the Institutional Class of the Morgan Stanley Institutional Liquidity Funds - Government Portfolio (the "Liquidity Fund"), an open-end management investment company managed by Morgan Stanley Investment Management Inc., a wholly-owned subsidiary of Morgan Stanley. The investment adviser and administration fee paid by the Fund is reduced by an amount equal to its pro rata share of the advisory and administration fees paid by the Fund due to its investment in the Liquidity Fund. For the year ended October 31, 2023, the investment adviser and administration fee paid was reduced by $50,799 relating to the Fund's investment in the Liquidity Fund.
Prior to March 1, 2023, EVM and EVAIL agreed to reimburse the Fund’s expenses to the extent that total annual operating expenses (relating to ordinary operating expenses only and excluding such expenses as acquired fund fees and expenses of unaffiliated funds, borrowing costs, taxes or litigation expenses) exceeded 0.99%, 1.74%, 0.74% and 0.69% of the Fund’s average daily net assets for Class A, Class C, Class I and Class R6, respectively. This agreement expired effective March 1, 2023. Pursuant to this agreement, no operating expenses were allocated to EVM and EVAIL for the year ended October 31, 2023.
EVM provides sub-transfer agency and related services to the Fund pursuant to a Sub-Transfer Agency Support Services Agreement. For the year ended October 31, 2023, EVM earned $12,054 from the Fund pursuant to such agreement, which is included in transfer and dividend disbursing agent fees on the Statement of Operations. The Fund was informed that Eaton Vance Distributors, Inc. (EVD), an affiliate of EVM and the Fund’s principal underwriter, received $803 as its portion of the sales charges on sales of Class A shares for the year ended October 31, 2023. EVD also received distribution and service fees from Class A and Class C shares (see Note 5) and contingent deferred sales charges (see Note 6).
Trustees and officers of the Fund who are members of EVM’s organization receive remuneration for their services to the Fund out of the investment adviser and administration fee. Trustees of the Fund who are not affiliated with EVM may elect to defer receipt of all or a percentage of their annual fees in accordance with the terms of the Trustees Deferred Compensation Plan. Certain officers and Trustees of the Fund are officers of EVM.
4 Purchases and Sales of Investments
Purchases and sales of investments, other than short-term obligations and including maturities, paydowns and principal repayments on Senior Loans, for the year ended October 31, 2023 were as follows:
| | Purchases | Sales |
| Investments (non-U.S. Government) | $ 244,815,148 | $ 176,079,938 |
| U.S. Government and Agency Securities | 20,241,876 | 40,949,792 |
| | $265,057,024 | $217,029,730 |
Eaton Vance
Multi-Asset Credit Fund
October 31, 2023
Notes to Financial Statements — continued
5 Distribution Plans
The Fund has in effect a distribution plan for Class A shares (Class A Plan) pursuant to Rule 12b-1 under the 1940 Act. Pursuant to the Class A Plan, the Fund pays EVD a distribution and service fee of 0.25% per annum of its average daily net assets attributable to Class A shares for distribution services and facilities provided to the Fund by EVD, as well as for personal services and/or the maintenance of shareholder accounts. Distribution and service fees paid or accrued to EVD for the year ended October 31, 2023 amounted to $107,403 for Class A shares.
The Fund also has in effect a distribution plan for Class C shares (Class C Plan) pursuant to Rule 12b-1 under the 1940 Act. Pursuant to the Class C Plan, the Fund pays EVD amounts equal to 0.75% per annum of its average daily net assets attributable to Class C shares for providing ongoing distribution services and facilities to the Fund. For the year ended October 31, 2023, the Fund paid or accrued to EVD $40,719 for Class C shares.
Pursuant to the Class C Plan, the Fund also makes payments of service fees to EVD, financial intermediaries and other persons in amounts equal to 0.25% per annum of its average daily net assets attributable to that class. Service fees paid or accrued are for personal services and/or the maintenance of shareholder accounts. They are separate and distinct from the sales commissions and distribution fees payable to EVD. Service fees paid or accrued for the year ended October 31, 2023 amounted to $13,573 for Class C shares.
Distribution and service fees are subject to the limitations contained in the Financial Industry Regulatory Authority Rule 2341(d).
6 Contingent Deferred Sales Charges
A contingent deferred sales charge (CDSC) of 1% generally is imposed on redemptions of Class C shares made within 12 months of purchase. Class A shares may be subject to a 0.75% CDSC if redeemed within 12 months of purchase (depending on the circumstances of purchase). Generally, the CDSC is based upon the lower of the net asset value at date of redemption or date of purchase. No charge is levied on shares acquired by reinvestment of dividends or capital gain distributions. For the year ended October 31, 2023, the Fund was informed that EVD received less than $100 of CDSCs paid by Class C shareholders and no CDSCs paid by Class A shareholders.
7 Shares of Beneficial Interest
The Fund’s Declaration of Trust permits the Trustees to issue an unlimited number of full and fractional shares of beneficial interest (without par value). Such shares may be issued in a number of different series (such as the Fund) and classes. Transactions in Fund shares, including direct exchanges pursuant to share class conversions, were as follows:
| | Year Ended
October 31, 2023 | | Year Ended
October 31, 2022 |
| | Shares | Amount | | Shares | Amount |
| Class A | | | | | |
| Sales | 491,044 | $ 4,697,337 | | 1,174,963 | $ 11,607,550 |
| Issued to shareholders electing to receive payments of distributions in Fund shares | 263,567 | 2,529,515 | | 187,456 | 1,857,405 |
| Redemptions | (1,244,833) | (11,913,567) | | (2,343,927) | (24,095,164) |
| Net decrease | (490,222) | $ (4,686,715) | | (981,508) | $ (10,630,209) |
| Class C | | | | | |
| Sales | 19,519 | $ 187,835 | | 28,523 | $ 287,396 |
| Issued to shareholders electing to receive payments of distributions in Fund shares | 32,545 | 312,531 | | 60,321 | 603,965 |
| Redemptions | (523,577) | (5,010,635) | | (1,450,989) | (14,425,883) |
| Net decrease | (471,513) | $ (4,510,269) | | (1,362,145) | $ (13,534,522) |
Eaton Vance
Multi-Asset Credit Fund
October 31, 2023
Notes to Financial Statements — continued
| | Year Ended
October 31, 2023 | | Year Ended
October 31, 2022 |
| | Shares | Amount | | Shares | Amount |
| Class I | | | | | |
| Sales | 2,693,183 | $ 25,833,259 | | 6,164,379 | $ 63,453,436 |
| Issued to shareholders electing to receive payments of distributions in Fund shares | 1,367,503 | 13,159,874 | | 1,194,356 | 11,928,833 |
| Redemptions | (6,925,581) | (66,552,037) | | (17,836,543) | (184,257,080) |
| Net decrease | (2,864,895) | $ (27,558,904) | | (10,477,808) | $(108,874,811) |
| Class R6 | | | | | |
| Sales | 10,881,327 | $ 103,837,241 | | 11,166,945 | $ 113,062,124 |
| Issued to shareholders electing to receive payments of distributions in Fund shares | 1,393,936 | 13,411,166 | | 509,601 | 4,956,821 |
| Redemptions | (1,497,869) | (14,344,827) | | (389,300) | (4,051,541) |
| Net increase | 10,777,394 | $102,903,580 | | 11,287,246 | $ 113,967,404 |
At October 31, 2023, donor advised and pooled income funds (established and maintained by a public charity) managed by EVM owned in the aggregate 22.8% of the value of the outstanding shares of the Fund.
8 Financial Instruments
The Fund may trade in financial instruments with off-balance sheet risk in the normal course of its investing activities. These financial instruments may include forward foreign currency exchange contracts and may involve, to a varying degree, elements of risk in excess of the amounts recognized for financial statement purposes. The notional or contractual amounts of these instruments represent the investment the Fund has in particular classes of financial instruments and do not necessarily represent the amounts potentially subject to risk. The measurement of the risks associated with these instruments is meaningful only when all related and offsetting transactions are considered. A summary of obligations under these financial instruments at October 31, 2023 is included in the Portfolio of Investments. At October 31, 2023, the Fund had sufficient cash and/or securities to cover commitments under these contracts.
The Fund is subject to foreign exchange risk in the normal course of pursuing its investment objective. Because the Fund holds foreign currency denominated investments, the value of these investments and related receivables and payables may change due to future changes in foreign currency exchange rates. To hedge against this risk, the Fund enters into forward foreign currency exchange contracts.
The Fund enters into forward foreign currency exchange contracts that may contain provisions whereby the counterparty may terminate the contract under certain conditions, including but not limited to a decline in the Fund's net assets below a certain level over a certain period of time, which would trigger a payment by the Fund for those derivatives in a liability position. At October 31, 2023, the fair value of derivatives with credit-related contingent features in a net liability position was $2,444. At October 31, 2023 there were no assets pledged by the Fund for such liability.
The over-the-counter (OTC) derivatives in which the Fund invests are subject to the risk that the counterparty to the contract fails to perform its obligations under the contract. To mitigate this risk, the Fund has entered into an International Swaps and Derivatives Association, Inc. Master Agreement (“ISDA Master Agreement”) or similar agreement with substantially all its derivative counterparties. An ISDA Master Agreement is a bilateral agreement between the Fund and a counterparty that governs certain OTC derivatives and typically contains, among other things, set-off provisions in the event of a default and/or termination event as defined under the relevant ISDA Master Agreement. Under an ISDA Master Agreement, the Fund may, under certain circumstances, offset with the counterparty certain derivative financial instruments’ payables and/or receivables with collateral held and/or posted and create one single net payment. The provisions of the ISDA Master Agreement typically permit a single net payment in the event of default including the bankruptcy or insolvency of the counterparty. However, bankruptcy or insolvency laws of a particular jurisdiction may impose restrictions on or prohibitions against the right of offset in bankruptcy or insolvency. Certain ISDA Master Agreements allow counterparties to OTC derivatives to terminate derivative contracts prior to maturity in the event the Fund’s net assets decline by a stated percentage or the Fund fails to meet the terms of its ISDA Master Agreements, which would cause the counterparty to accelerate payment by the Fund of any net liability owed to it.
The collateral requirements for derivatives traded under an ISDA Master Agreement are governed by a Credit Support Annex to the ISDA Master Agreement. Collateral requirements are determined at the close of business each day and are typically based on changes in market values for each transaction under an ISDA Master Agreement and netted into one amount for such agreement. Generally, the amount of collateral due from or to a counterparty is subject to a minimum transfer threshold amount before a transfer is required, which may vary by counterparty. Collateral pledged for the benefit of the Fund and/or
Eaton Vance
Multi-Asset Credit Fund
October 31, 2023
Notes to Financial Statements — continued
counterparty is held in segregated accounts by the Fund’s custodian and cannot be sold, re-pledged, assigned or otherwise used while pledged. The portion of such collateral representing cash, if any, is reflected as deposits for derivatives collateral and, in the case of cash pledged by a counterparty for the benefit of the Fund, a corresponding liability on the Statement of Assets and Liabilities. Securities pledged by the Fund as collateral, if any, are identified as such in the Portfolio of Investments. The carrying amount of the liability for cash collateral due to brokers at October 31, 2023 approximated its fair value. If measured at fair value, such liability would have been considered as Level 2 in the fair value hierarchy (see Note 11) at October 31, 2023.
The fair value of open derivative instruments (not considered to be hedging instruments for accounting disclosure purposes) and whose primary underlying risk exposure is foreign exchange risk at October 31, 2023 was as follows:
| | Fair Value |
| Derivative | Asset Derivative | Liability Derivative |
| Forward foreign currency exchange contracts | $51,662 (1) | $(2,444) (2) |
| (1) | Statement of Assets and Liabilities location: Receivable for open forward foreign currency exchange contracts. |
| (2) | Statement of Assets and Liabilities location: Payable for open forward foreign currency exchange contracts. |
The Fund’s derivative assets and liabilities at fair value by type, which are reported gross in the Statement of Assets and Liabilities, are presented in the table above. The following tables present the Fund’s derivative assets and liabilities by counterparty, net of amounts available for offset under a master netting agreement and net of the related collateral received by the Fund for such assets and pledged by the Fund for such liabilities as of October 31, 2023.
| Counterparty | Derivative
Assets Subject to
Master Netting
Agreement | Derivatives
Available
for Offset | Non-cash
Collateral
Received(a) | Cash
Collateral
Received(a) | Net Amount
of Derivative
Assets(b) |
| Bank of America, N.A. | $ 51,056 | $ — | $ — | $ — | $ 51,056 |
| State Street Bank and Trust Company | 606 | (606) | — | — | — |
| | $51,662 | $(606) | $ — | $ — | $51,056 |
| Counterparty | Derivative
Liabilities Subject to
Master Netting
Agreement | Derivatives
Available
for Offset | Non-cash
Collateral
Pledged(a) | Cash
Collateral
Pledged(a) | Net Amount
of Derivative
Liabilities(c) |
| State Street Bank and Trust Company | $(2,444) | $606 | $ — | $ — | $(1,838) |
| (a) | In some instances, the total collateral received and/or pledged may be more than the amount shown due to overcollateralization. |
| (b) | Net amount represents the net amount due from the counterparty in the event of default. |
| (c) | Net amount represents the net amount payable to the counterparty in the event of default. |
Eaton Vance
Multi-Asset Credit Fund
October 31, 2023
Notes to Financial Statements — continued
The effect of derivative instruments (not considered to be hedging instruments for accounting disclosure purposes) on the Statement of Operations and whose primary underlying risk exposure is foreign exchange risk for the year ended October 31, 2023 was as follows:
| Derivative | Realized Gain (Loss)
on Derivatives Recognized
in Income(1) | Change in Unrealized
Appreciation (Depreciation) on
Derivatives Recognized in Income(2) |
| Forward foreign currency exchange contracts | $(1,818,054) | $(523,486) |
| (1) | Statement of Operations location: Net realized gain (loss): Forward foreign currency exchange contracts. |
| (2) | Statement of Operations location: Change in unrealized appreciation (depreciation): Forward foreign currency exchange contracts. |
The average notional amount of forward foreign currency exchange contracts (based on the absolute value of notional amounts of currency purchased and currency sold) outstanding during the year ended October 31, 2023, which is indicative of the volume of this derivative type, was approximately $60,018,000.
9 Line of Credit
The Fund participates with other portfolios and funds managed by EVM and its affiliates in a $650 million unsecured revolving line of credit agreement with a group of banks, which is in effect through October 22, 2024. In connection with the renewal of the agreement on October 24, 2023, the borrowing limit was decreased from $725 million. Borrowings are made by the Fund solely for temporary purposes related to redemptions and other short-term cash needs. Interest is charged to the Fund based on its borrowings at an amount above either the Secured Overnight Financing Rate (SOFR) or Federal Funds rate. In addition, a fee computed at an annual rate of 0.15% on the daily unused portion of the line of credit is allocated among the participating portfolios and funds at the end of each quarter. In connection with the renewal of the agreement in October 2023, an arrangement fee totaling $150,000 was incurred that was allocated to the participating portfolios and funds. Because the line of credit is not available exclusively to the Fund, it may be unable to borrow some or all of its requested amounts at any particular time. The Fund did not have any significant borrowings or allocated fees during the year ended October 31, 2023.
10 Affiliated Investments
At October 31, 2023, the value of the Fund's investment in issuers and funds that may be deemed to be affiliated was $45,509,811, which represents 9.6% of the Fund's net assets. Transactions in such investments by the Fund for the year ended October 31, 2023 were as follows:
| Name | Value,
beginning
of period | Purchases | Sales
proceeds | Net
realized
gain (loss) | Change in
unrealized
appreciation
(depreciation) | Value, end
of period | Interest/
Dividend
income | Principal
amount/
Shares, end
of period |
| Commercial Mortgage-Backed Securities | | | | | | | | |
| Morgan Stanley Capital I Trust, Series 2019-BPR, Class A, 7.307%, (1 mo. SOFR + 1.992%), 5/15/36 | $ 420,332 | $ — | $ (59,445) | $ — | $ 2,300 | $ 366,998 | $ 31,123 | $ 378,948 |
| Short-Term Investments |
| Liquidity Fund | 31,492,053 | 307,643,352 | (293,992,592) | — | — | 45,142,813 | 1,621,766 | 45,142,813 |
| Total | | | | $ — | $2,300 | $45,509,811 | $1,652,889 | |
Eaton Vance
Multi-Asset Credit Fund
October 31, 2023
Notes to Financial Statements — continued
11 Fair Value Measurements
Under generally accepted accounting principles for fair value measurements, a three-tier hierarchy to prioritize the assumptions, referred to as inputs, is used in valuation techniques to measure fair value. The three-tier hierarchy of inputs is summarized in the three broad levels listed below.
| • | Level 1 – quoted prices in active markets for identical investments |
| • | Level 2 – other significant observable inputs (including quoted prices for similar investments, interest rates, prepayment speeds, credit risk, etc.) |
| • | Level 3 – significant unobservable inputs (including a fund's own assumptions in determining the fair value of investments) |
In cases where the inputs used to measure fair value fall in different levels of the fair value hierarchy, the level disclosed is determined based on the lowest level input that is significant to the fair value measurement in its entirety. The inputs or methodology used for valuing securities are not necessarily an indication of the risk associated with investing in those securities.
At October 31, 2023, the hierarchy of inputs used in valuing the Fund's investments and open derivative instruments and open derivative instruments, which are carried at fair value, were as follows:
| Asset Description | Level 1 | Level 2 | Level 3* | Total |
| Asset-Backed Securities | $ — | $ 19,568,266 | $ — | $ 19,568,266 |
| Collateralized Mortgage Obligations | — | 1,045,996 | — | 1,045,996 |
| Commercial Mortgage-Backed Securities | — | 10,060,484 | — | 10,060,484 |
| Common Stocks | 254,117 | — | — | 254,117 |
| Convertible Bonds | — | 1,974,720 | — | 1,974,720 |
| Corporate Bonds | — | 218,862,790 | — | 218,862,790 |
| Foreign Corporate Bonds | — | 759,726 | — | 759,726 |
| Preferred Stocks | 963,119 | — | — | 963,119 |
| Senior Floating-Rate Loans | — | 180,005,540 | — | 180,005,540 |
| Miscellaneous | — | 9,450 | 0 | 9,450 |
| Short-Term Investments | 45,142,813 | — | — | 45,142,813 |
| Total Investments | $ 46,360,049 | $ 432,286,972 | $ — | $ 478,647,021 |
| Forward Foreign Currency Exchange Contracts | $ — | $ 51,662 | $ — | $ 51,662 |
| Total | $ 46,360,049 | $ 432,338,634 | $ — | $ 478,698,683 |
| Liability Description | | | | |
| Forward Foreign Currency Exchange Contracts | $ — | $ (2,444) | $ — | $ (2,444) |
| Total | $ — | $ (2,444) | $ — | $ (2,444) |
| * | None of the unobservable inputs for Level 3 assets, individually or collectively, had a material impact on the Fund. |
Level 3 investments at the beginning and/or end of the period in relation to net assets were not significant and accordingly, a reconciliation of Level 3 assets for the year ended October 31, 2023 is not presented.
Eaton Vance
Multi-Asset Credit Fund
October 31, 2023
Report of Independent Registered Public Accounting Firm
To the Trustees of Eaton Vance Mutual Funds Trust and Shareholders of Eaton Vance Multi-Asset Credit Fund:
Opinion on the Financial Statements and Financial Highlights
We have audited the accompanying statement of assets and liabilities of Eaton Vance Multi-Asset Credit Fund (the "Fund") (one of the funds constituting Eaton Vance Mutual Funds Trust), including the portfolio of investments, as of October 31, 2023, the related statement of operations for the year then ended, the statements of changes in net assets for each of the two years in the period then ended, the financial highlights for each of the five years in the period then ended, and the related notes. In our opinion, the financial statements and financial highlights present fairly, in all material respects, the financial position of the Fund as of October 31, 2023, and the results of its operations for the year then ended, the changes in its net assets for each of the two years in the period then ended, and the financial highlights for each of the five years in the period then ended in conformity with accounting principles generally accepted in the United States of America.
Basis for Opinion
These financial statements and financial highlights are the responsibility of the Fund's management. Our responsibility is to express an opinion on the Fund's financial statements and financial highlights based on our audits. We are a public accounting firm registered with the Public Company Accounting Oversight Board (United States) (PCAOB) and are required to be independent with respect to the Fund in accordance with the U.S. federal securities laws and the applicable rules and regulations of the Securities and Exchange Commission and the PCAOB.
We conducted our audits in accordance with the standards of the PCAOB. Those standards require that we plan and perform the audit to obtain reasonable assurance about whether the financial statements and financial highlights are free of material misstatement, whether due to error or fraud. The Fund is not required to have, nor were we engaged to perform, an audit of its internal control over financial reporting. As part of our audits, we are required to obtain an understanding of internal control over financial reporting but not for the purpose of expressing an opinion on the effectiveness of the Fund’s internal control over financial reporting. Accordingly, we express no such opinion.
Our audits included performing procedures to assess the risks of material misstatement of the financial statements and financial highlights, whether due to error or fraud, and performing procedures that respond to those risks. Such procedures included examining, on a test basis, evidence regarding the amounts and disclosures in the financial statements and financial highlights. Our audits also included evaluating the accounting principles used and significant estimates made by management, as well as evaluating the overall presentation of the financial statements and financial highlights. Our procedures included confirmation of securities and senior loans owned as of October 31, 2023, by correspondence with the custodian, brokers and agent banks; when replies were not received from brokers, and agent banks, we performed other auditing procedures. We believe that our audits provide a reasonable basis for our opinion.
/s/ Deloitte & Touche LLP
Boston, Massachusetts
December 19, 2023
We have served as the auditor of one or more Eaton Vance investment companies since 1959.
Eaton Vance
Multi-Asset Credit Fund
October 31, 2023
Federal Tax Information (Unaudited)
The Form 1099-DIV you receive in February 2024 will show the tax status of all distributions paid to your account in calendar year 2023. Shareholders are advised to consult their own tax adviser with respect to the tax consequences of their investment in the Fund. As required by the Internal Revenue Code and/or regulations, shareholders must be notified regarding the status of qualified dividend income for individuals and 163(j) interest dividends.
Qualified Dividend Income. For the fiscal year ended October 31, 2023, the Fund designates approximately $96,254, or up to the maximum amount of such dividends allowable pursuant to the Internal Revenue Code, as qualified dividend income eligible for the reduced tax rate of 15%.
163(j) Interest Dividends. For the fiscal year ended October 31, 2023, the Fund designates 55.37% of distributions from net investment income as a 163(j) interest dividend.
Eaton Vance
Multi-Asset Credit Fund
October 31, 2023
Board of Trustees’ Contract Approval
Overview of the Contract Review Process
The Investment Company Act of 1940, as amended (the “1940 Act”), provides, in substance, that the investment advisory agreement between a fund and its investment adviser will continue in effect from year-to-year only if its continuation is approved on an annual basis by a vote of the fund’s board of trustees, including a majority of the trustees who are not “interested persons” of the fund (“independent trustees”), cast in person at a meeting called for the purpose of considering such approval.
At a meeting held on June 8, 2023, the Boards of Trustees/Directors (collectively, the “Board”) that oversee the registered investment companies advised by Eaton Vance Management or its affiliate, Boston Management and Research (the “Eaton Vance Funds”), including a majority of the independent trustees (the “Independent Trustees”), voted to approve the continuation of existing investment advisory agreements and sub-advisory agreements1 for each of the Eaton Vance Funds for an additional one-year period. The Board relied upon the affirmative recommendation of its Contract Review Committee, which is a committee exclusively comprised of Independent Trustees. Prior to making its recommendation, the Contract Review Committee reviewed information furnished by the adviser and sub-adviser to each of the Eaton Vance Funds (including information specifically requested by the Board) for a series of formal meetings held between April and June 2023, as well as certain additional information provided in response to specific requests from the Independent Trustees as members of the Contract Review Committee. Members of the Contract Review Committee also considered information received at prior meetings of the Board and its committees, to the extent such information was relevant to the Contract Review Committee’s annual evaluation of the investment advisory agreements and sub-advisory agreements.
In connection with its evaluation of the investment advisory agreements and sub-advisory agreements, the Board considered various information relating to the Eaton Vance Funds. This included information applicable to all or groups of Eaton Vance Funds, which is referenced immediately below, and information applicable to the particular Eaton Vance Fund covered by this report (each “Eaton Vance Fund” is referred to below as a “fund”). (For funds that invest through one or more underlying portfolios, references to “each fund” in this section may include information that was considered at the portfolio-level.)
Information about Fees, Performance and Expenses
• A report from an independent data provider comparing advisory and other fees paid by each fund to such fees paid by comparable funds, as identified by the independent data provider (“comparable funds”);
• A report from an independent data provider comparing each fund’s total expense ratio (and its components) to those of comparable funds;
• A report from an independent data provider comparing the investment performance of each fund (including, as relevant, total return data, income data, Sharpe ratios and information ratios) to the investment performance of comparable funds and, as applicable, benchmark indices, over various time periods;
• In certain instances, data regarding investment performance relative to customized groups of peer funds and blended indices identified by the adviser in consultation with the Portfolio Management Committee of the Board (a committee exclusively comprised of Independent Trustees);
• Comparative information concerning the fees charged and services provided by the adviser and sub-adviser to each fund in managing other accounts (which may include other mutual funds, collective investment funds and institutional accounts) using investment strategies and techniques similar to those used in managing such fund(s), if any;
• Profitability analyses with respect to the adviser and sub-adviser to each of the funds;
Information about Portfolio Management and Trading
• Descriptions of the investment management services provided to each fund, as well as each of the funds’ investment strategies and policies;
• The procedures and processes used to determine the value of fund assets, including, when necessary, the determination of “fair value” and actions taken to monitor and test the effectiveness of such procedures and processes;
• Information about the policies and practices of each fund’s adviser and sub-adviser with respect to trading, including their processes for seeking best execution of portfolio transactions;
• Information about the allocation of brokerage transactions and the benefits, if any, received by the adviser and sub-adviser to each fund as a result of brokerage allocation, including, as applicable, information concerning the acquisition of research through client commission arrangements and policies with respect to “soft dollars”;
• Data relating to the portfolio turnover rate of each fund and related information regarding active management in the context of particular strategies;
Information about each Adviser and Sub-adviser
• Reports detailing the financial results and condition of the adviser and sub-adviser to each fund;
1 Not all Eaton Vance Funds have entered into a sub-advisory agreement with a sub-adviser. Accordingly, references to “sub-adviser” or “sub-advisory agreement” in this “Overview” section may not be applicable to the particular Eaton Vance Fund covered by this report.
Eaton Vance
Multi-Asset Credit Fund
October 31, 2023
Board of Trustees’ Contract Approval — continued
• Information regarding the individual investment professionals whose responsibilities include portfolio management and investment research for the funds, and, for portfolio managers and certain other investment professionals, information relating to their responsibilities with respect to managing other mutual funds and investment accounts, as applicable;
• Information regarding the adviser’s and its parent company’s (Morgan Stanley’s) efforts to retain and attract talented investment professionals, including in the context of a competitive marketplace for talent, as well as the ongoing unique environment presented by hybrid, remote and other alternative work arrangements;
• Information regarding the adviser’s compensation methodology for its investment professionals and the incentives and accountability it creates, along with investment professionals’ investments in the fund(s) they manage;
• The Code of Ethics of the adviser and its affiliates and the sub-adviser of each fund, together with information relating to compliance with, and the administration of, such codes;
• Policies and procedures relating to proxy voting, including regular reporting with respect to fund proxy voting activities;
• Information regarding the handling of corporate actions and class actions, as well as information regarding litigation and other regulatory matters;
• Information concerning the resources devoted to compliance efforts undertaken by the adviser and its affiliates and the sub-adviser of each fund, if any, including descriptions of their various compliance programs and their record of compliance;
• Information concerning the business continuity and disaster recovery plans of the adviser and its affiliates and the sub-adviser of each fund, if any;
• A description of Eaton Vance Management’s and Boston Management and Research’s oversight of sub-advisers, including with respect to regulatory and compliance issues, investment management and other matters;
Other Relevant Information
• Information regarding ongoing initiatives to further integrate and harmonize, where applicable, the investment management and other departments of the adviser and its affiliates with the overall investment management infrastructure of Morgan Stanley, in light of Morgan Stanley’s acquisition of Eaton Vance Corp. on March 1, 2021;
• Information concerning the nature, cost and character of the administrative and other non-investment advisory services provided by Eaton Vance Management and its affiliates;
• Information concerning oversight of the relationship with the custodian, subcustodians, fund accountants, and other third-party service providers by the adviser and/or administrator to each of the funds;
• Information concerning efforts to implement policies and procedures with respect to various recently adopted regulations applicable to the funds, including Rule 12d1-4 (the Fund-of-Funds Rule), Rule 18f-4 (the Derivatives Rule) and Rule 2a-5 (the Fair Valuation Rule);
• For an Eaton Vance Fund structured as an exchange-listed closed-end fund, information concerning the benefits of the closed-end fund structure, as well as, where relevant, the closed-end fund’s market prices (including as compared to the closed-end fund’s net asset value (NAV)), trading volume data, continued use of auction preferred shares (where applicable), distribution rates and other relevant matters;
• The risks which the adviser and/or its affiliates incur in connection with the management and operation of the funds, including, among others, litigation, regulatory, entrepreneurial, and other business risks (and the associated costs of such risks); and
• The terms of each investment advisory agreement and sub-advisory agreement.
During the various meetings of the Board and its committees over the course of the year leading up to the June 8, 2023 meeting, the Board received information from portfolio managers and other investment professionals of the advisers and sub-advisers of the funds regarding investment and performance matters, and considered various investment and trading strategies used in pursuing the funds’ investment objectives. The Board also received information regarding risk management techniques employed in connection with the management of the funds. The Board and its committees evaluated issues pertaining to industry and regulatory developments, compliance procedures, fund governance and other issues with respect to the funds, and received and participated in reports and presentations provided by Eaton Vance Management, Boston Management and Research and fund sub-advisers, with respect to such matters. In addition to the formal meetings of the Board and its committees, the Independent Trustees held regular teleconferences to discuss, among other topics, matters relating to the continuation of investment advisory agreements and sub-advisory agreements.
The Contract Review Committee was advised throughout the contract review process by Goodwin Procter LLP, independent legal counsel for the Independent Trustees. The members of the Contract Review Committee, with the advice of such counsel, exercised their own business judgment in determining the material factors to be considered in evaluating each investment advisory agreement and sub-advisory agreement and the weight to be given to each such factor. The conclusions reached with respect to each investment advisory agreement and sub-advisory agreement were based on a comprehensive evaluation of all the information provided and not any single factor. Moreover, each member of the Contract Review Committee may have placed varying emphasis on particular factors in reaching conclusions with respect to each investment advisory agreement and sub-advisory agreement. In evaluating each investment advisory agreement and sub-advisory agreement, including the fee structures and other terms contained in such agreements, the members of the Contract Review Committee were also informed by multiple years of analysis and discussion with the adviser and sub-adviser to each of the Eaton Vance Funds.
Eaton Vance
Multi-Asset Credit Fund
October 31, 2023
Board of Trustees’ Contract Approval — continued
Results of the Contract Review Process
Based on its consideration of the foregoing, and such other information it deemed relevant, including the factors and conclusions described below, the Contract Review Committee concluded that the continuation of the investment advisory and administrative agreement between Eaton Vance Multi-Asset Credit Fund (the “Fund”) and Eaton Vance Management (the “Adviser”), and the sub-advisory agreement between the Adviser and Eaton Vance Advisers International Ltd. (the “Sub-adviser”), an affiliate of the Adviser, with respect to the Fund, including their respective fee structures, are in the interests of shareholders and, therefore, recommended to the Board approval of each agreement. Based on the recommendation of the Contracts Review Committee, the Board, including a majority of the Independent Trustees, voted to approve continuation of the investment advisory and administrative agreement and the sub-advisory agreement for the Fund.
Nature, Extent and Quality of Services
In considering whether to approve the investment advisory and administrative agreement and the sub-advisory agreement for the Fund, the Board evaluated the nature, extent and quality of services provided to the Fund by the Adviser and the Sub-adviser.
The Board considered the Adviser’s and the Sub-adviser’s management capabilities and investment processes in light of the types of investments held by the Fund, including the education, experience and number of investment professionals and other personnel who provide portfolio management, investment research, and similar services to the Fund. Regarding the Adviser, the Board considered the Adviser’s responsibilities with respect to oversight of the Sub-adviser and coordinating activities in implementing the investment strategies of the Fund. With respect to the Sub-adviser, the Board considered the resources available to the Sub-adviser in fulfilling its duties under the sub-advisory agreement. The Board also considered the abilities and experience of the Adviser’s and the Sub-adviser’s investment professionals in analyzing factors relevant to investing in credit-related investments, including fixed income, variable-rate, and floating-rate debt investments as well as derivatives that provide exposure to such investments. The Board considered the international investment capabilities of the Sub-adviser, which is based in London, and the benefits to the Fund of having portfolio management services involving investments in international equities provided by investment professionals located abroad. The Board also took into account the resources dedicated to portfolio management and other services, the compensation methods of the Adviser and other factors, including the reputation and resources of the Adviser to recruit and retain highly qualified research, advisory and supervisory investment professionals. In addition, the Board considered the time and attention devoted to the Eaton Vance Funds, including the Fund, by senior management, as well as the infrastructure, operational capabilities and support staff in place to assist in the portfolio management and operations of the Fund, including the provision of administrative services. The Board also considered the business-related and other risks to which the Adviser or its affiliates may be subject in managing the Fund.
The Board considered the compliance programs of the Adviser and relevant affiliates thereof, including the Sub-adviser. The Board considered compliance and reporting matters regarding, among other things, personal trading by investment professionals, disclosure of portfolio holdings, late trading, frequent trading, portfolio valuation, business continuity and the allocation of investment opportunities. The Board also considered the responses of the Adviser and its affiliates to requests in recent years from regulatory authorities, such as the Securities and Exchange Commission and the Financial Industry Regulatory Authority.
The Board considered other administrative services provided or overseen by the Adviser and its affiliates, including transfer agency and accounting services. The Board evaluated the benefits to shareholders of investing in a fund that is a part of a large fund complex offering exposure to a variety of asset classes and investment disciplines, as well as the ability, in many cases, to exchange an investment among different funds without incurring additional sales charges.
After consideration of the foregoing factors, among others, the Board concluded that the nature, extent and quality of services provided by the Adviser and the Sub-adviser, taken as a whole, are appropriate and consistent with the terms of the investment advisory and administrative agreement and the sub-advisory agreement.
Fund Performance
The Board compared the Fund’s investment performance to that of comparable funds identified by an independent data provider (the peer group), as well as appropriate benchmark indices and a custom peer group of similarly managed funds. The Board’s review included comparative performance data with respect to the Fund for the one-, three-, five- and ten-year periods ended December 31, 2022. In this regard, the Board noted that the performance of the Fund was consistent with the median performance of the Fund’s peer group and custom peer group for the three-year period. The Board also noted that the performance of the Fund was lower than its primary benchmark and custom benchmark indexes for the three-year period. The Board concluded that the performance of the Fund was satisfactory.
Management Fees and Expenses
The Board considered contractual fee rates payable by the Fund for advisory and administrative services (referred to collectively as “management fees”). As part of its review, the Board considered the Fund’s management fees and total expense ratio for the one-year period ended December 31, 2022, as compared to those of comparable funds, before and after giving effect to any undertaking to waive fees or reimburse expenses. The Board also received and considered information about the services offered and the fee rates charged by the Adviser and/or Sub-adviser to other types of accounts with investment objectives and strategies that are substantially similar to and/or managed in a similar investment style as the Fund. In this regard, the Board received information about the differences in the nature and scope of services the Adviser and/or Sub-adviser provide to the Fund as compared to other types of
Eaton Vance
Multi-Asset Credit Fund
October 31, 2023
Board of Trustees’ Contract Approval — continued
accounts and the material differences in compliance, reporting and other legal burdens and risks to the Adviser and/or Sub-adviser as between the Fund and other types of accounts. The Board also considered factors that had an impact on the Fund’s total expense ratio relative to comparable funds. The Board also considered that the management fees paid by the Fund are for services that are in addition to, and are not duplicative of, services provided under the advisory contract(s) of the exchange traded funds in which the Fund may invest.
After considering the foregoing information, and in light of the nature, extent and quality of the services provided by the Adviser and the Sub-adviser, the Board concluded that the management fees charged for advisory and related services are reasonable.
Profitability and “Fall-Out” Benefits
The Board considered the level of profits realized by the Adviser and relevant affiliates thereof, including the Sub-adviser, in providing investment advisory and administrative services to the Fund and to all Eaton Vance Funds as a group. The Board considered the level of profits realized without regard to marketing support or other payments by the Adviser and its affiliates to third parties in respect of distribution or other services.
The Board concluded that, in light of the foregoing factors and the nature, extent and quality of the services rendered, the profits realized by the Adviser and its affiliates are deemed not to be excessive.
The Board also considered direct or indirect fall-out benefits received by the Adviser and its affiliates, including the Sub-adviser, in connection with their respective relationships with the Fund, including the benefits of research services that may be available to the Adviser or the Sub-adviser as a result of securities transactions effected for the Fund and other investment advisory clients.
Economies of Scale
In reviewing management fees and profitability, the Board also considered the extent to which the Adviser and its affiliates, on the one hand, and the Fund, on the other hand, can expect to realize benefits from economies of scale as the assets of the Fund increase. The Board acknowledged the difficulty in accurately measuring the benefits resulting from economies of scale, if any, with respect to the management of any specific fund or group of funds. The Board reviewed data summarizing the increases and decreases in the assets of the Fund and of all Eaton Vance Funds as a group over various time periods, and evaluated the extent to which the total expense ratio of the Fund and the profitability of the Adviser and its affiliates may have been affected by such increases or decreases. Based upon the foregoing, the Board concluded that the Fund currently shares in the benefits from economies of scale, if any, when they are realized by the Adviser. The Board also concluded that the structure of the advisory fee, which includes breakpoints at several asset levels, will allow the Fund to continue to benefit from any economies of scale in the future.
Eaton Vance
Multi-Asset Credit Fund
October 31, 2023
Liquidity Risk Management Program
The Fund has implemented a written liquidity risk management program (Program) and related procedures to manage its liquidity in accordance with Rule 22e-4 under the Investment Company Act of 1940, as amended (Liquidity Rule). The Liquidity Rule defines “liquidity risk” as the risk that a fund could not meet requests to redeem shares issued by the fund without significant dilution of the remaining investors’ interests in the fund. The Fund’s Board of Trustees/Directors has designated the investment adviser to serve as the administrator of the Program and the related procedures. The administrator has established a Liquidity Risk Management Oversight Committee (Committee) to perform the functions necessary to administer the Program. As part of the Program, the administrator is responsible for identifying illiquid investments and categorizing the relative liquidity of the Fund’s investments in accordance with the Liquidity Rule. Under the Program, the administrator assesses, manages, and periodically reviews the Fund’s liquidity risk, and is responsible for making certain reports to the Fund’s Board of Trustees/Directors and the Securities and Exchange Commission (SEC) regarding the liquidity of the Fund’s investments, and to notify the Board of Trustees/Directors and the SEC of certain liquidity events specified in the Liquidity Rule. The liquidity of the Fund’s portfolio investments is determined based on a number of factors including, but not limited to, relevant market, trading and investment-specific considerations under the Program.
At a meeting of the Fund’s Board of Trustees/Directors on June 7, 2023, the Committee provided a written report to the Fund’s Board of Trustees/
Directors pertaining to the operation, adequacy, and effectiveness of implementation of the Program, as well as the operation of the highly liquid investment minimum (if applicable) for the period January 1, 2022 through December 31, 2022 (Review Period). The Program operated effectively during the Review Period, supporting the administrator’s ability to assess, manage and monitor Fund liquidity risk, including during periods of market volatility and net redemptions. During the Review Period, the Fund met redemption requests on a timely basis.
There can be no assurance that the Program will achieve its objectives in the future. Please refer to the Fund’s prospectus for more information regarding the Fund’s exposure to liquidity risk and other principal risks to which an investment in the Fund may be subject.
Eaton Vance
Multi-Asset Credit Fund
October 31, 2023
Management and Organization
Fund Management. The Trustees of Eaton Vance Mutual Funds Trust (the Trust) are responsible for the overall management and supervision of the Trust's affairs. The Board members and officers of the Trust are listed below. Except as indicated, each individual has held the office shown or other offices in the same company for the last five years. Board members hold indefinite terms of office. Each Trustee holds office until his or her successor is elected and qualified, subject to a prior death, resignation, retirement, disqualification or removal. Under the terms of the Fund’s current Trustee retirement policy, an Independent Trustee must retire and resign as a Trustee on the earlier of: (i) the first day of July following his or her 74th birthday; or (ii), with limited exception, December 31st of the 20th year in which he or she has served as a Trustee. However, if such retirement and resignation would cause the Fund to be out of compliance with Section 16 of the 1940 Act or any other regulations or guidance of the SEC, then such retirement and resignation will not become effective until such time as action has been taken for the Fund to be in compliance therewith. The “noninterested Trustees” consist of those Trustees who are not “interested persons” of the Trust, as that term is defined under the 1940 Act. The business address of each Board member and officer is Two International Place, Boston, Massachusetts 02110. As used below, “BMR” refers to Boston Management and Research, “EV” refers to EV LLC, “EVM” refers to Eaton Vance Management, “MSIM" refers to Morgan Stanley Investment Management Inc. and “EVD” refers to Eaton Vance Distributors, Inc. EV is the trustee of each of EVM and BMR. Each of EVM, BMR, EVD and EV are indirect, wholly owned subsidiaries of Morgan Stanley. Each officer affiliated with EVM may hold a position with other EVM affiliates that is comparable to his or her position with EVM listed below. Each Trustee oversees
127 funds in the Eaton Vance fund complex (including both funds and portfolios in a hub and spoke structure).
| Name and Year of Birth | Trust
Position(s) | Length of Service | Principal Occupation(s) and Other Directorships
During Past Five Years and Other Relevant Experience |
| Interested Trustee |
Anchal Pachnanda(1)
1980 | Trustee | Since 2023 | Co-Head of Strategy of MSIM (since 2019). Formerly, Head of Strategy of MSIM (2017-2019). Ms. Pachnanda is an interested person because of her position with MSIM, which is an affiliate of the Trust.
Other Directorships. None. |
| Noninterested Trustees |
Alan C. Bowser
1962 | Trustee | Since 2022 | Private investor. Formerly, Chief Diversity Officer, Partner and a member of the Operating Committee, and formerly served as Senior Advisor on Diversity and Inclusion for the firm’s chief executive officer, Co-Head of the Americas Region, and Senior Client Advisor of Bridgewater Associates, an asset management firm (2011- 2023).
Other Directorships. Independent Director of Stout Risius Ross (a middle market professional services advisory firm) (since 2021). |
Mark R. Fetting
1954 | Trustee | Since 2016 | Private investor. Formerly held various positions at Legg Mason, Inc. (investment management firm) (2000-2012), including President, Chief Executive Officer, Director and Chairman (2008-2012), Senior Executive Vice President (2004-2008) and Executive Vice President (2001-2004). Formerly, President of Legg Mason family of funds (2001-2008). Formerly, Division President and Senior Officer of Prudential Financial Group, Inc. and related companies (investment management firm) (1991-2000).
Other Directorships. None. |
Cynthia E. Frost
1961 | Trustee | Since 2014 | Private investor. Formerly, Chief Investment Officer of Brown University (university endowment) (2000-2012). Formerly, Portfolio Strategist for Duke Management Company (university endowment manager) (1995-2000). Formerly, Managing Director, Cambridge Associates (investment consulting company) (1989-1995). Formerly, Consultant, Bain and Company (management consulting firm) (1987-1989). Formerly, Senior Equity Analyst, BA Investment Management Company (1983-1985).
Other Directorships. None. |
George J. Gorman
1952 | Chairperson
of the Board
and Trustee | Since 2021
(Chairperson) and
2014 (Trustee) | Principal at George J. Gorman LLC (consulting firm). Formerly, Senior Partner at Ernst & Young LLP (a registered public accounting firm) (1974-2009).
Other Directorships. None. |
Eaton Vance
Multi-Asset Credit Fund
October 31, 2023
Management and Organization — continued
| Name and Year of Birth | Trust
Position(s) | Length of Service | Principal Occupation(s) and Other Directorships
During Past Five Years and Other Relevant Experience |
| Noninterested Trustees (continued) |
Valerie A. Mosley
1960 | Trustee | Since 2014 | Chairwoman and Chief Executive Officer of Valmo Ventures (a consulting and investment firm). Founder of Upward Wealth, Inc., dba BrightUp, a fintech platform. Formerly, Partner and Senior Vice President, Portfolio Manager and Investment Strategist at Wellington Management Company, LLP (investment management firm) (1992-2012). Formerly, Chief Investment Officer, PG Corbin Asset Management (1990-1992). Formerly worked in institutional corporate bond sales at Kidder Peabody (1986-1990).
Other Directorships. Director of DraftKings, Inc. (digital sports entertainment and gaming company) (since September 2020). Director of Envestnet, Inc. (provider of intelligent systems for wealth management and financial wellness) (since 2018). Formerly, Director of Dynex Capital, Inc. (mortgage REIT) (2013-2020) and Director of Groupon, Inc. (e-commerce provider) (2020-2022). |
Keith Quinton
1958 | Trustee | Since 2018 | Private investor, researcher and lecturer. Formerly, Independent Investment Committee Member at New Hampshire Retirement System (2017-2021). Formerly, Portfolio Manager and Senior Quantitative Analyst at Fidelity Investments (investment management firm) (2001-2014).
Other Directorships. Formerly, Director (2016-2021) and Chairman (2019-2021) of New Hampshire Municipal Bond Bank. |
Marcus L. Smith
1966 | Trustee | Since 2018 | Private investor and independent corporate director. Formerly, Chief Investment Officer, Canada (2012-2017), Chief Investment Officer, Asia (2010-2012), Director of Asian Research (2004-2010) and portfolio manager (2001-2017) at MFS Investment Management (investment management firm).
Other Directorships. Director of First Industrial Realty Trust, Inc. (an industrial REIT) (since 2021). Director of MSCI Inc. (global provider of investment decision support tools) (since 2017). Formerly, Director of DCT Industrial Trust Inc. (logistics real estate company) (2017-2018). |
Susan J. Sutherland
1957 | Trustee | Since 2015 | Private investor. Director of Ascot Group Limited and certain of its subsidiaries (insurance and reinsurance) (since 2017). Formerly, Director of Hagerty Holding Corp. (insurance) (2015-2018) and Montpelier Re Holdings Ltd. (insurance and reinsurance) (2013-2015). Formerly, Associate, Counsel and Partner at Skadden, Arps, Slate, Meagher & Flom LLP (law firm) (1982-2013).
Other Directorships. Formerly, Director of Kairos Acquisition Corp. (insurance/InsurTech acquisition company) (2021-2023). |
Scott E. Wennerholm
1959 | Trustee | Since 2016 | Private investor. Formerly, Trustee at Wheelock College (postsecondary institution) (2012-2018). Formerly, Consultant at GF Parish Group (executive recruiting firm) (2016-2017). Formerly, Chief Operating Officer and Executive Vice President at BNY Mellon Asset Management (investment management firm) (2005-2011). Formerly, Chief Operating Officer and Chief Financial Officer at Natixis Global Asset Management (investment management firm) (1997-2004). Formerly, Vice President at Fidelity Investments Institutional Services (investment management firm) (1994-1997).
Other Directorships. None. |
Nancy A. Wiser
1967 | Trustee | Since 2022 | Formerly, Executive Vice President and the Global Head of Operations at Wells Fargo Asset Management (2011-2021).
Other Directorships. None. |
| Name and Year of Birth | Trust
Position(s) | Length of Service | Principal Occupation(s)
During Past Five Years |
| Principal Officers who are not Trustees |
Kenneth A. Topping
1966 | President | Since 2023 | Vice President and Chief Administrative Officer of EVM and BMR and Chief Operating Officer for Public Markets at MSIM. Also Vice President of Calvert Research and Management (“CRM”) since 2021. Formerly, Chief Operating Officer for Goldman Sachs Asset Management `Classic' (2009-2020). |
Deidre E. Walsh
1971 | Vice President and
Chief Legal Officer | Since 2009 | Vice President of EVM and BMR. Also Vice President of CRM. |
James F. Kirchner
1967 | Treasurer | Since 2007 | Vice President of EVM and BMR. Also Vice President of CRM. |
Eaton Vance
Multi-Asset Credit Fund
October 31, 2023
Management and Organization — continued
| Name and Year of Birth | Trust
Position(s) | Length of Service | Principal Occupation(s)
During Past Five Years |
| Principal Officers who are not Trustees (continued) |
Nicholas S. Di Lorenzo
1987 | Secretary | Since 2022 | Formerly, associate (2012-2021) and counsel (2022) at Dechert LLP. |
Richard F. Froio
1968 | Chief Compliance
Officer | Since 2017 | Vice President of EVM and BMR since 2017. Formerly, Deputy Chief Compliance Officer (Adviser/Funds) and Chief Compliance Officer (Distribution) at PIMCO (2012-2017) and Managing Director at BlackRock/Barclays Global Investors (2009-2012). |
(1) Ms. Pachnanda began serving as Trustee effective April 1, 2023.
The SAI for the Fund includes additional information about the Trustees and officers of the Fund and can be obtained without charge on Eaton Vance’s website at www.eatonvance.com or by calling 1-800-262-1122.
| FACTS | WHAT DOES EATON VANCE DO WITH YOUR
PERSONAL INFORMATION? |
| Why? | Financial companies choose how they share your personal information. Federal law gives consumers the right to limit some but not all sharing. Federal law also requires us to tell you how we collect, share, and protect your personal information. Please read this notice carefully to understand what we do. |
| |
| What? | The types of personal information we collect and share depend on the product or service you have with us. This information can include:■ Social Security number and income
■ investment experience and risk tolerance
■ checking account number and wire transfer instructions |
| |
| How? | All financial companies need to share customers’ personal information to run their everyday business. In the section below, we list the reasons financial companies can share their customers’ personal information; the reasons Eaton Vance chooses to share; and whether you can limit this sharing. |
Reasons we can share your
personal information | Does Eaton Vance
share? | Can you limit
this sharing? |
| For our everyday business purposes — such as to process your transactions, maintain your account(s), respond to court orders and legal investigations, or report to credit bureaus | Yes | No |
| For our marketing purposes — to offer our products and services to you | Yes | No |
| For joint marketing with other financial companies | No | We don’t share |
| For our investment management affiliates’ everyday business purposes — information about your transactions, experiences, and creditworthiness | Yes | Yes |
| For our affiliates’ everyday business purposes — information about your transactions and experiences | Yes | No |
| For our affiliates’ everyday business purposes — information about your creditworthiness | No | We don’t share |
| For our investment management affiliates to market to you | Yes | Yes |
| For our affiliates to market to you | No | We don’t share |
| For nonaffiliates to market to you | No | We don’t share |
To limit our
sharing | Call toll-free 1-800-262-1122 or email: EVPrivacy@eatonvance.comPlease note:If you are a new customer, we can begin sharing your information 30 days from the date we sent this notice. When you are no longer our customer, we continue to share your information as described in this notice. However, you can contact us at any time to limit our sharing. |
| Questions? | Call toll-free 1-800-262-1122 or email: EVPrivacy@eatonvance.com |
| Privacy Notice — continued | April 2021 |
| Who we are |
| Who is providing this notice? | Eaton Vance Management, Eaton Vance Distributors, Inc., Eaton Vance Trust Company, Eaton Vance Management (International) Limited, Eaton Vance Advisers International Ltd., Eaton Vance Global Advisors Limited, Eaton Vance Management’s Real Estate Investment Group, Boston Management and Research, Calvert Research and Management, Eaton Vance and Calvert Fund Families and our investment advisory affiliates (“Eaton Vance”) (see Investment Management Affiliates definition below) |
| What we do |
How does Eaton Vance
protect my personal
information? | To protect your personal information from unauthorized access and use, we use security measures that comply with federal law. These measures include computer safeguards and secured files and buildings. We have policies governing the proper handling of customer information by personnel and requiring third parties that provide support to adhere to appropriate security standards with respect to such information. |
How does Eaton Vance
collect my personal
information? | We collect your personal information, for example, when you■ open an account or make deposits or withdrawals from your account
■ buy securities from us or make a wire transfer
■ give us your contact informationWe also collect your personal information from others, such as credit bureaus, affiliates, or other companies. |
| Why can’t I limit all sharing? | Federal law gives you the right to limit only■ sharing for affiliates’ everyday business purposes — information about your creditworthiness
■ affiliates from using your information to market to you
■ sharing for nonaffiliates to market to youState laws and individual companies may give you additional rights to limit sharing. See below for more on your rights under state law. |
| Definitions |
Investment Management
Affiliates | Eaton Vance Investment Management Affiliates include registered investment advisers, registered broker- dealers, and registered and unregistered funds. Investment Management Affiliates does not include entities associated with Morgan Stanley Wealth Management, such as Morgan Stanley Smith Barney LLC and Morgan Stanley & Co. |
| Affiliates | Companies related by common ownership or control. They can be financial and nonfinancial companies.■ Our affiliates include companies with a Morgan Stanley name and financial companies such as Morgan Stanley Smith Barney LLC and Morgan Stanley & Co. |
| Nonaffiliates | Companies not related by common ownership or control. They can be financial and nonfinancial companies.■ Eaton Vance does not share with nonaffiliates so they can market to you. |
| Joint marketing | A formal agreement between nonaffiliated financial companies that together market financial products or services to you.■ Eaton Vance doesn’t jointly market. |
| Other important information |
| Vermont: Except as permitted by law, we will not share personal information we collect about Vermont residents with Nonaffiliates unless you provide us with your written consent to share such information.California: Except as permitted by law, we will not share personal information we collect about California residents with Nonaffiliates and we will limit sharing such personal information with our Affiliates to comply with California privacy laws that apply to us. |
Delivery of Shareholder Documents. The Securities and Exchange Commission (SEC) permits funds to deliver only one copy of shareholder documents, including prospectuses, proxy statements and shareholder reports, to fund investors with multiple accounts at the same residential or post office box address. This practice is often called “householding” and it helps eliminate duplicate mailings to shareholders. Eaton Vance, or your financial intermediary, may household the mailing of your documents indefinitely unless you instruct Eaton Vance, or your financial intermediary, otherwise. If you would prefer that your Eaton Vance documents not be householded, please contact Eaton Vance at 1-800-262-1122, or contact your financial intermediary. Your instructions that householding not apply to delivery of your Eaton Vance documents will typically be effective within 30 days of receipt by Eaton Vance or your financial intermediary.
Portfolio Holdings. Each Eaton Vance Fund and its underlying Portfolio(s) (if applicable) files a schedule of portfolio holdings on Part F to Form N-PORT with the SEC. Certain information filed on Form N-PORT may be viewed on the Eaton Vance website at www.eatonvance.com, by calling Eaton Vance at 1-800-262-1122 or in the EDGAR database on the SEC’s website at www.sec.gov.
Proxy Voting. From time to time, funds are required to vote proxies related to the securities held by the funds. The Eaton Vance Funds or their underlying Portfolios (if applicable) vote proxies according to a set of policies and procedures approved by the Funds’ and Portfolios’ Boards. You may obtain a description of these policies and procedures and information on how the Funds or Portfolios voted proxies relating to portfolio securities during the most recent 12-month period ended June 30, without charge, upon request, by calling 1-800-262-1122 and by accessing the SEC’s website at www.sec.gov.
Tailored Shareholder Reports. Effective January 24, 2023, the SEC adopted rule and form amendments to require open-end mutual funds and ETFs to transmit concise and visually engaging streamlined annual and semiannual reports to shareholders that highlight key information. Other information, including financial statements, will no longer appear in a streamlined shareholder report but must be available online, delivered free of charge upon request, and filed on a semiannual basis on Form N-CSR. The rule and form amendments have a compliance date of July 24, 2024. At this time, management is evaluating the impact of these amendments on the shareholder reports for the Eaton Vance Funds.
This Page Intentionally Left Blank
Investment Adviser and Administrator
Eaton Vance Management
Two International Place
Boston, MA 02110
Investment Sub-Adviser
Eaton Vance Advisers International Ltd.
125 Old Broad Street
London, EC2N 1AR
United Kingdom
Principal Underwriter*
Eaton Vance Distributors, Inc.
Two International Place
Boston, MA 02110
(617) 482-8260
Custodian
State Street Bank and Trust Company
One Congress Street, Suite 1
Boston, MA 02114-2016
Transfer Agent
BNY Mellon Investment Servicing (US) Inc.
Attn: Eaton Vance Funds
P.O. Box 534439
Pittsburgh, PA 15253-4439
(800) 262-1122
Independent Registered Public Accounting Firm
Deloitte & Touche LLP
200 Berkeley Street
Boston, MA 02116-5022
Fund Offices
Two International Place
Boston, MA 02110
* FINRA BrokerCheck. Investors may check the background of their Investment Professional by contacting the Financial Industry Regulatory Authority (FINRA). FINRA BrokerCheck is a free tool to help investors check the professional background of current and former FINRA-registered securities firms and brokers. FINRA BrokerCheck is available by calling 1-800-289-9999 and at www.FINRA.org. The FINRA BrokerCheck brochure describing this program is available to investors at www.FINRA.org.
Eaton Vance
Short Duration High Income Fund
Annual Report
October 31, 2023
Commodity Futures Trading Commission Registration. The Commodity Futures Trading Commission (“CFTC”) has adopted regulations that subject registered investment companies and advisers to regulation by the CFTC if a fund invests more than a prescribed level of its assets in certain CFTC-regulated instruments (including futures, certain options and swap agreements) or markets itself as providing investment exposure to such instruments. The investment adviser has claimed an exclusion from the definition of “commodity pool operator” under the Commodity Exchange Act with respect to its management of the Fund. Accordingly, neither the Fund nor the adviser with respect to the operation of the Fund is subject to CFTC regulation. Because of its management of other strategies, the Fund's adviser is registered with the CFTC as a commodity pool operator. The adviser is also registered as a commodity trading advisor.
Fund shares are not insured by the FDIC and are not deposits or other obligations of, or guaranteed by, any depository institution. Shares are subject to investment risks, including possible loss of principal invested.
This report must be preceded or accompanied by a current summary prospectus or prospectus. Before investing, investors should consider carefully the investment objective, risks, and charges and expenses of a mutual fund. This and other important information is contained in the summary prospectus and prospectus, which can be obtained from a financial intermediary. Prospective investors should read the prospectus carefully before investing. For further information, please call 1-800-262-1122.
Annual Report October 31, 2023
Eaton Vance
Short Duration High Income Fund
Eaton Vance
Short Duration High Income Fund
October 31, 2023
Management’s Discussion of Fund Performance†
Economic and Market Conditions
U.S. and global high yield bond markets got off to a strong start during the 12-month period ended October 31, 2023. At the outset, investors hoped inflation would subside and the U.S. Federal Reserve (the Fed) would ease off federal funds rate hikes to pursue a soft economic landing.
However, bond markets weakened toward the end of 2022 as the Fed indicated its long-term interest rate target was higher than investors expected. For the remainder of the period, the high yield market rose and fell as prospects for a soft landing alternately brightened and dimmed.
In the first few months of 2023, returns remained healthy, but were dampened by concerns over the failures of Silicon Valley Bank and Signature Bank, as well as the general health of regional U.S. banks. Returns softened further during the second quarter of 2023 over concerns that the U.S. Congress might not pass legislation to meet the country’s looming debt ceiling, and fears of a resurgence in inflation fueled by persistently strong consumer spending and jobs growth data.
Toward the end of the period, the high yield bond market cooled as global interest rates moved sharply higher in response to hawkish monetary policy rhetoric by the Fed and the European Central Bank.
For the period as a whole, the ICE BofA U.S. High Yield Index returned 5.82%, while the Bloomberg U.S. Aggregate Bond Index returned 0.36%.
High yield issuance totaled $157.6 billion (source: J.P. Morgan) during the period, up from $139 billion in the prior one-year period. Refinancing accounted for approximately 60% of new issuances, and acquisition financing accounted for about 20%. According to preliminary Lipper estimates, U.S. high yield retail funds experienced a net outflow of $22.8 billion during the period.
The trailing 12-month par-weighted default rate increased to 1.76%, up from 0.84% at the end of the prior one-year period.
Fund Performance
For the 12-month period ended October 31, 2023, Eaton Vance Short Duration High Income Fund (the Fund) returned 5.96% for Class A shares at net asset value (NAV), underperforming its benchmark, the ICE BofA U.S. High Yield Cash Pay BB-B 1-3 Year Index, (the Index), which returned 6.64%.
Security selections in the retail, diversified financial services, and chemicals sectors detracted from returns relative to the Index during the period. However, selections by sector overall contributed to Index-relative performance. In particular, selections in the health care, leisure, and air transportation sectors were beneficial.
An underweight exposure to the diversified financial services sector, and an overweight exposure to the paper sector detracted from Index-relative performance. However, allocations by sector overall contributed. In particular, overweight exposures to the steel and chemicals sectors enhanced relative performance during the period.
Allocation and security selections by credit-rating categories contributed to overall performance. Selections in CCC-rated and BB-rated securities contributed, while selections in B-rated securities detracted from Index-relative returns. An underweight exposure to BB-rated bonds, and an out-of-Index allocation to CC-rated credits were especially beneficial. Overweight allocations to CCC-rated credits, an underweight exposure to B-rated credits, and an out-of-Index allocation to nonrated credits detracted from Index-relative returns during the period.
Security selections by duration category detracted from Index-relative returns during the period. Selections in securities with durations of 0-2 years particularly dragged on relative performance, while selections in securities with durations of 2-5 years contributed to Index-relative returns. Allocations by duration had a positive impact on performance relative to the Index. An overweight exposure to securities with durations of 2-5 years particularly contributed to Index-relative returns during the period.
See Endnotes and Additional Disclosures in this report.
Past performance is no guarantee of future results. Returns are historical and are calculated by determining the percentage change in net asset value (NAV) or offering price (as applicable) with all distributions reinvested. Furthermore, returns do not reflect the deduction of taxes that shareholders may have to pay on Fund distributions or upon the redemption of Fund shares. Investment return and principal value will fluctuate so that shares, when redeemed, may be worth more or less than their original cost. Performance for periods less than or equal to one year is cumulative. Performance is for the stated time period only; due to market volatility, current Fund performance may be lower or higher than the quoted return. For performance as of the most recent month-end, please refer to eatonvance.com.
Eaton Vance
Short Duration High Income Fund
October 31, 2023
Performance
Portfolio Manager(s) Kelley Gerrity and Stephen C. Concannon, CFA
| % Average Annual Total Returns1,2 | Class
Inception Date | Performance
Inception Date | One Year | Five Years | Ten Years |
| Class A at NAV | 11/01/2013 | 02/21/2012 | 5.96% | 3.08% | 3.14% |
| Class A with 3.25% Maximum Sales Charge | — | — | 2.57 | 2.40 | 2.80 |
| Class I at NAV | 11/01/2013 | 02/21/2012 | 6.23 | 3.32 | 3.40 |
|
| ICE BofA U.S. High Yield Cash Pay BB-B 1–3 Year Index | — | — | 6.64% | 3.54% | 3.88% |
| % Total Annual Operating Expense Ratios3 | Class A | Class I |
| Gross | 1.14% | 0.89% |
| Net | 0.91 | 0.66 |
Growth of $10,0002
This graph shows the change in value of a hypothetical investment of $10,000 in Class A of the Fund for the period indicated. For comparison, the same investment is shown in the indicated index.
| Growth of Investment2 | Amount Invested | Period Beginning | At NAV | With Maximum Sales Charge |
| Class I, at minimum investment | $1,000,000 | 10/31/2013 | $1,397,812 | N.A. |
See Endnotes and Additional Disclosures in this report.
Past performance is no guarantee of future results. Returns are historical and are calculated by determining the percentage change in net asset value (NAV) or offering price (as applicable) with all distributions reinvested. Furthermore, returns do not reflect the deduction of taxes that shareholders may have to pay on Fund distributions or upon the redemption of Fund shares. Investment return and principal value will fluctuate so that shares, when redeemed, may be worth more or less than their original cost. Performance for periods less than or equal to one year is cumulative. Performance is for the stated time period only; due to market volatility, current Fund performance may be lower or higher than the quoted return. For performance as of the most recent month-end, please refer to eatonvance.com.
Eaton Vance
Short Duration High Income Fund
October 31, 2023
| Credit Quality (% of total investments)1 |
Footnotes:
| 1 | Ratings are based on Moody’s Investors Service, Inc. (“Moody’s”), S&P Global Ratings (“S&P”) or Fitch Ratings (“Fitch”), as applicable. The breakdown assigns a numeric equivalent to the ratings from the aforementioned agencies and the mean is rounded to the nearest integer and converted to an equivalent S&P major rating category. Ratings, which are subject to change, apply to the creditworthiness of the issuers of the underlying securities and not to the Fund or its shares. Credit ratings measure the quality of a bond based on the issuer’s creditworthiness, with ratings ranging from AAA, being the highest, to D, being the lowest based on S&P’s measures. Ratings of BBB or higher by S&P or Fitch (Baa or higher by Moody’s) are considered to be investment-grade quality. Credit ratings are based largely on the ratings agency’s analysis at the time of rating. The rating assigned to any particular security is not necessarily a reflection of the issuer’s current financial condition and does not necessarily reflect its assessment of the volatility of a security’s market value or of the liquidity of an investment in the security. Holdings designated as “Not Rated” (if any) are not rated by the national ratings agencies stated above. |
Eaton Vance
Short Duration High Income Fund
October 31, 2023
Endnotes and Additional Disclosures
| † | The views expressed in this report are those of the portfolio manager(s) and are current only through the date stated at the top of this page. These views are subject to change at any time based upon market or other conditions, and Eaton Vance and the Fund(s) disclaim any responsibility to update such views. These views may not be relied upon as investment advice and, because investment decisions are based on many factors, may not be relied upon as an indication of trading intent on behalf of any Eaton Vance fund. This commentary may contain statements that are not historical facts, referred to as “forward-looking statements.” The Fund’s actual future results may differ significantly from those stated in any forward-looking statement, depending on factors such as changes in securities or financial markets or general economic conditions, the volume of sales and purchases of Fund shares, the continuation of investment advisory, administrative and service contracts, and other risks discussed from time to time in the Fund’s filings with the Securities and Exchange Commission. |
| | |
| 1 | ICE BofA U.S. High Yield Cash Pay BB-B 1–3 Year Index is an unmanaged index of U.S. corporate bonds currently paying a coupon, rated BB1 through B3, and having a maturity less than 3 years. ICE® BofA® indices are not for redistribution or other uses; provided “as is”, without warranties, and with no liability. Eaton Vance has prepared this report and ICE Data Indices, LLC does not endorse it, or guarantee, review, or endorse Eaton Vance’s products. BofA® is a licensed registered trademark of Bank of America Corporation in the United States and other countries. Unless otherwise stated, index returns do not reflect the effect of any applicable sales charges, commissions, expenses, taxes or leverage, as applicable. It is not possible to invest directly in an index. |
| 2 | Total Returns at NAV do not include applicable sales charges. If sales charges were deducted, the returns would be lower. Total Returns shown with maximum sales charge reflect the stated maximum sales charge. Unless otherwise stated, performance does not reflect the deduction of taxes on Fund distributions or redemptions of Fund shares.Performance prior to the inception date of Class A and Class I is linked to the performance of Short Duration High Income Portfolio (the Portfolio), the Portfolio that the Fund invested in prior to June 15, 2020. This linked performance is adjusted for any applicable sales charge, but is not adjusted for class expense differences. If adjusted for such differences, the performance would be different. Performance presented in the Financial Highlights included in the financial statements is not linked. |
| 3 | Source: Fund prospectus. Net expense ratios reflect a contractual expense reimbursement that continues through 2/29/24. The expense ratios for the current reporting period can be found in the Financial Highlights section of this report. Performance reflects expenses waived and/or reimbursed, if applicable. Without such waivers and/or reimbursements, performance would have been lower. |
| | Fund profile subject to change due to active management. |
| | Additional Information |
| | ICE BofA U.S. High Yield Index is an unmanaged index of below-investment grade U.S. corporate bonds. Bloomberg
U.S. Aggregate Bond Index is an unmanaged index of domestic investment-grade bonds, including corporate, government and mortgage-backed securities. |
| | Duration is a measure of the expected change in price of a bond — in percentage terms — given a one percent change in interest rates, all else being constant. Securities with lower durations tend to be less sensitive to interest rate changes. |
Eaton Vance
Short Duration High Income Fund
October 31, 2023
Example
As a Fund shareholder, you incur two types of costs: (1) transaction costs, including sales charges (loads) on purchases; and (2) ongoing costs, including management fees; distribution and/or service fees; and other Fund expenses. This Example is intended to help you understand your ongoing costs (in dollars) of Fund investing and to compare these costs with the ongoing costs of investing in other mutual funds. The Example is based on an investment of $1,000 invested at the beginning of the period and held for the entire period (May 1, 2023 to October 31, 2023).
Actual Expenses
The first section of the table below provides information about actual account values and actual expenses. You may use the information in this section, together with the amount you invested, to estimate the expenses that you paid over the period. Simply divide your account value by $1,000 (for example, an $8,600 account value divided by $1,000 = 8.6), then multiply the result by the number in the first section under the heading entitled “Expenses Paid During Period” to estimate the expenses you paid on your account during this period.
Hypothetical Example for Comparison Purposes
The second section of the table below provides information about hypothetical account values and hypothetical expenses based on the actual Fund expense ratio and an assumed rate of return of 5% per year (before expenses), which is not the actual Fund return. The hypothetical account values and expenses may not be used to estimate the actual ending account balance or expenses you paid for the period. You may use this information to compare the ongoing costs of investing in your Fund and other funds. To do so, compare this 5% hypothetical example with the 5% hypothetical examples that appear in the shareholder reports of the other funds.
Please note that the expenses shown in the table are meant to highlight your ongoing costs only and do not reflect any transactional costs, such as sales charges (loads). Therefore, the second section of the table is useful in comparing ongoing costs only, and will not help you determine the relative total costs of owning different funds. In addition, if these transactional costs were included, your costs would be higher.
| | Beginning
Account Value
(5/1/23) | Ending
Account Value
(10/31/23) | Expenses Paid
During Period*
(5/1/23 – 10/31/23) | Annualized
Expense
Ratio |
| Actual | | | | |
| Class A | $1,000.00 | $1,017.50 | $4.53** | 0.89% |
| Class I | $1,000.00 | $1,017.60 | $3.25** | 0.64% |
| |
| Hypothetical | | | | |
| (5% return per year before expenses) | | | | |
| Class A | $1,000.00 | $1,020.72 | $4.53** | 0.89% |
| Class I | $1,000.00 | $1,021.98 | $3.26** | 0.64% |
| * | Expenses are equal to the Fund's annualized expense ratio for the indicated Class, multiplied by the average account value over the period, multiplied by 184/365 (to reflect the one-half year period). The Example assumes that the $1,000 was invested at the net asset value per share determined at the close of business on April 30, 2023. |
| ** | Absent an allocation of certain expenses to affiliate(s), expenses would be higher. |
Eaton Vance
Short Duration High Income Fund
October 31, 2023
| Security | Principal
Amount
(000's omitted) | Value |
| Containers — 0.4% |
| CryoPort, Inc., 0.75%, 12/1/26(1) | $ | 437 | $ 344,400 |
| | | | $ 344,400 |
| Homebuilders & Real Estate — 0.3% |
| HAT Holdings I, LLC/HAT Holdings II, LLC, 0.00%, 5/1/25(1) | $ | 200 | $ 190,063 |
| | | | $ 190,063 |
| Leisure — 0.4% |
| Peloton Interactive, Inc., 0.00%, 2/15/26 | $ | 398 | $ 295,545 |
| | | | $ 295,545 |
| Telecommunications — 0.4% |
| Liberty Latin America, Ltd., 2.00%, 7/15/24 | $ | 330 | $ 313,913 |
| | | | $ 313,913 |
| Utility — 0.2% |
| NextEra Energy Partners, L.P., 2.50%, 6/15/26(1) | $ | 214 | $ 185,538 |
| | | | $ 185,538 |
Total Convertible Bonds
(identified cost $1,409,300) | | | $ 1,329,459 |
| Security | Principal
Amount*
(000's omitted) | Value |
| Aerospace — 3.4% |
| Bombardier, Inc.: | | | |
| 7.125%, 6/15/26(1) | | 463 | $ 446,057 |
| 7.50%, 3/15/25(1) | | 216 | 215,989 |
| Rolls-Royce PLC, 3.625%, 10/14/25(1) | | 500 | 469,154 |
| Spirit AeroSystems, Inc., 7.50%, 4/15/25(1) | | 600 | 599,192 |
| TransDigm, Inc., 6.25%, 3/15/26(1) | | 910 | 889,893 |
| | | | $ 2,620,285 |
| Air Transportation — 3.3% |
| Air Canada Pass-Through Trust, 10.50%, 7/15/26(1) | | 250 | $ 269,085 |
| American Airlines, Inc., 7.25%, 2/15/28(1) | | 150 | 139,653 |
| American Airlines, Inc./AAdvantage Loyalty IP, Ltd., 5.50%, 4/20/26(1) | | 1,000 | 973,434 |
| Security | Principal
Amount*
(000's omitted) | Value |
| Air Transportation (continued) |
| Delta Air Lines, Inc.: | | | |
| 2.90%, 10/28/24 | | 275 | $ 264,278 |
| 7.375%, 1/15/26 | | 400 | 404,394 |
| VistaJet Malta Finance PLC/Vista Management Holding, Inc., 7.875%, 5/1/27(1) | | 675 | 519,861 |
| | | | $ 2,570,705 |
| Automotive & Auto Parts — 2.9% |
| Ford Motor Credit Co., LLC: | | | |
| 3.37%, 11/17/23 | | 200 | $ 199,942 |
| 3.375%, 11/13/25 | | 650 | 607,203 |
| 3.664%, 9/8/24 | | 663 | 646,052 |
| 5.125%, 6/16/25 | | 850 | 827,839 |
| | | | $ 2,281,036 |
| Broadcasting — 1.3% |
| CCO Holdings, LLC/CCO Holdings Capital Corp., 5.50%, 5/1/26(1) | | 377 | $ 359,908 |
| Townsquare Media, Inc., 6.875%, 2/1/26(1) | | 262 | 242,424 |
| Univision Communications, Inc., 5.125%, 2/15/25(1) | | 384 | 375,360 |
| | | | $ 977,692 |
| Capital Goods — 0.5% |
| Patrick Industries, Inc., 7.50%, 10/15/27(1) | | 400 | $ 381,446 |
| | | | $ 381,446 |
| Chemicals — 2.4% |
| Avient Corp., 5.75%, 5/15/25(1) | | 500 | $ 490,436 |
| Compass Minerals International, Inc., 6.75%, 12/1/27(1) | | 360 | 339,444 |
| International Flavors & Fragrances, Inc., 1.23%, 10/1/25(1) | | 210 | 189,402 |
| NOVA Chemicals Corp., 4.875%, 6/1/24(1) | | 819 | 805,752 |
| | | | $ 1,825,034 |
| Consumer Products — 0.9% |
| CD&R Smokey Buyer, Inc., 6.75%, 7/15/25(1) | | 328 | $ 313,794 |
| Mattel, Inc., 3.375%, 4/1/26(1) | | 400 | 369,861 |
| | | | $ 683,655 |
| Containers — 5.9% |
| Ardagh Packaging Finance PLC/Ardagh Holdings USA, Inc., 2.125%, 8/15/26(2) | EUR | 1,200 | $ 1,101,016 |
| Ball Corp.: | | | |
| 4.00%, 11/15/23 | | 342 | 341,524 |
| 5.25%, 7/1/25 | | 384 | 378,462 |
| Berry Global, Inc., 4.50%, 2/15/26(1) | | 610 | 575,306 |
7
See Notes to Financial Statements.
Eaton Vance
Short Duration High Income Fund
October 31, 2023
Portfolio of Investments — continued
| Security | Principal
Amount*
(000's omitted) | Value |
| Containers (continued) |
| Canpack S.A./Canpack US, LLC, 3.125%, 11/1/25(1) | | 400 | $ 367,148 |
| Crown Americas, LLC/Crown Americas Capital Corp. VI, 4.75%, 2/1/26 | | 500 | 481,398 |
| Graphic Packaging International, LLC, 4.125%, 8/15/24 | | 575 | 561,273 |
| Owens-Brockway Glass Container, Inc., 6.375%, 8/15/25(1) | | 500 | 488,400 |
| Trivium Packaging Finance B.V., 5.50%, 8/15/26(1) | | 350 | 317,826 |
| | | | $ 4,612,353 |
| Diversified Financial Services — 1.1% |
| Ally Financial, Inc., 5.75%, 11/20/25 | | 400 | $ 382,204 |
| PRA Group, Inc., 7.375%, 9/1/25(1) | | 136 | 127,299 |
| Rocket Mortgage, LLC/Rocket Mortgage Co.-Issuer, Inc., 2.875%, 10/15/26(1) | | 415 | 361,760 |
| | | | $ 871,263 |
| Diversified Media — 1.4% |
| Arches Buyer, Inc.: | | | |
| 4.25%, 6/1/28(1) | | 200 | $ 165,866 |
| 6.125%, 12/1/28(1) | | 200 | 161,743 |
| Clear Channel International B.V., 6.625%, 8/1/25(1) | | 275 | 269,154 |
| TripAdvisor, Inc., 7.00%, 7/15/25(1) | | 500 | 495,486 |
| | | | $ 1,092,249 |
| Energy — 9.2% |
| Aethon United BR, L.P./Aethon United Finance Corp., 8.25%, 2/15/26(1) | | 630 | $ 626,327 |
| Antero Midstream Partners, L.P./Antero Midstream Finance Corp., 7.875%, 5/15/26(1) | | 350 | 352,822 |
| Callon Petroleum Co., 6.375%, 7/1/26 | | 226 | 220,926 |
| CITGO Petroleum Corp., 6.375%, 6/15/26(1) | | 537 | 528,103 |
| CrownRock, L.P./CrownRock Finance, Inc., 5.625%, 10/15/25(1) | | 845 | 831,989 |
| CVR Energy, Inc., 5.25%, 2/15/25(1) | | 300 | 294,553 |
| EQM Midstream Partners, L.P.: | | | |
| 4.00%, 8/1/24 | | 262 | 255,018 |
| 7.50%, 6/1/27(1) | | 500 | 495,702 |
| Matador Resources Co., 5.875%, 9/15/26 | | 400 | 385,805 |
| Neptune Energy Bondco PLC, 6.625%, 5/15/25(1) | | 720 | 713,465 |
| New Fortress Energy, Inc.: | | | |
| 6.50%, 9/30/26(1) | | 400 | 358,651 |
| 6.75%, 9/15/25(1) | | 400 | 371,468 |
| Permian Resources Operating, LLC: | | | |
| 5.375%, 1/15/26(1) | | 303 | 291,190 |
| 7.75%, 2/15/26(1) | | 360 | 360,066 |
| Security | Principal
Amount*
(000's omitted) | Value |
| Energy (continued) |
| Precision Drilling Corp., 7.125%, 1/15/26(1) | | 200 | $ 197,254 |
| Southwestern Energy Co., 5.70%, 1/23/25 | | 200 | 197,778 |
| Transocean, Inc., 7.25%, 11/1/25(1) | | 225 | 219,743 |
| Venture Global LNG, Inc.: | | | |
| 8.125%, 6/1/28(1) | | 300 | 291,476 |
| 9.50%, 2/1/29(1) | | 165 | 167,733 |
| | | | $ 7,160,069 |
| Entertainment & Film — 0.7% |
| Cinemark USA, Inc., 8.75%, 5/1/25(1) | | 180 | $ 182,074 |
| Live Nation Entertainment, Inc., 4.875%, 11/1/24(1) | | 325 | 318,379 |
| | | | $ 500,453 |
| Environmental — 1.5% |
| GFL Environmental, Inc., 3.75%, 8/1/25(1) | | 1,190 | $ 1,126,838 |
| | | | $ 1,126,838 |
| Food & Drug Retail — 0.6% |
| Albertsons Cos., Inc./Safeway, Inc./New Albertsons, L.P./Albertsons, LLC: | | | |
| 3.25%, 3/15/26(1) | | 150 | $ 138,705 |
| 7.50%, 3/15/26(1) | | 350 | 355,901 |
| | | | $ 494,606 |
| Food, Beverage & Tobacco — 3.4% |
| Chobani, LLC/Chobani Finance Corp., Inc., 7.50%, 4/15/25(1) | | 857 | $ 842,635 |
| Darling Ingredients, Inc., 5.25%, 4/15/27(1) | | 600 | 571,479 |
| Herbalife Nutrition, Ltd./HLF Financing, Inc., 7.875%, 9/1/25(1) | | 298 | 280,713 |
| Performance Food Group, Inc., 6.875%, 5/1/25(1) | | 752 | 748,966 |
| U.S. Foods, Inc., 6.875%, 9/15/28(1) | | 230 | 225,081 |
| | | | $ 2,668,874 |
| Gaming — 4.8% |
| Caesars Entertainment, Inc.: | | | |
| 6.25%, 7/1/25(1) | | 751 | $ 739,496 |
| 8.125%, 7/1/27(1) | | 380 | 376,838 |
| International Game Technology PLC, 6.50%, 2/15/25(1) | | 447 | 444,413 |
| Light & Wonder International, Inc., 7.00%, 5/15/28(1) | | 300 | 292,722 |
| MGM Resorts International, 5.75%, 6/15/25 | | 700 | 685,127 |
8
See Notes to Financial Statements.
Eaton Vance
Short Duration High Income Fund
October 31, 2023
Portfolio of Investments — continued
| Security | Principal
Amount*
(000's omitted) | Value |
| Gaming (continued) |
| Raptor Acquisition Corp./Raptor Co.-Issuer, LLC, 4.875%, 11/1/26(1) | | 650 | $ 605,485 |
| Wynn Las Vegas, LLC/Wynn Las Vegas Capital Corp., 5.50%, 3/1/25(1) | | 580 | 569,948 |
| | | | $ 3,714,029 |
| Healthcare — 5.5% |
| Endo DAC/Endo Finance, LLC/Endo Finco, Inc., 5.875%, 10/15/24(1)(3) | | 260 | $ 174,850 |
| IQVIA, Inc., 5.00%, 10/15/26(1) | | 500 | 477,196 |
| ModivCare, Inc., 5.875%, 11/15/25(1) | | 392 | 370,855 |
| P&L Development, LLC/PLD Finance Corp., 7.75%, 11/15/25(1) | | 299 | 201,124 |
| Perrigo Finance Unlimitd Co., 3.90%, 12/15/24 | | 527 | 511,685 |
| RegionalCare Hospital Partners Holdings, Inc./LifePoint Health, Inc., 9.75%, 12/1/26(1) | | 856 | 801,225 |
| Team Health Holdings, Inc., 6.375%, 2/1/25(1) | | 250 | 198,367 |
| Tenet Healthcare Corp., 4.875%, 1/1/26 | | 758 | 727,168 |
| Teva Pharmaceutical Finance Netherlands III B.V., 7.125%, 1/31/25 | | 460 | 456,389 |
| US Acute Care Solutions, LLC, 6.375%, 3/1/26(1) | | 416 | 354,326 |
| | | | $ 4,273,185 |
| Homebuilders & Real Estate — 3.8% |
| Brundage-Bone Concrete Pumping Holdings, Inc., 6.00%, 2/1/26(1) | | 271 | $ 256,510 |
| HAT Holdings I, LLC/HAT Holdings II, LLC: | | | |
| 3.375%, 6/15/26(1) | | 342 | 301,416 |
| 6.00%, 4/15/25(1) | | 300 | 291,831 |
| Meritage Homes Corp., 6.00%, 6/1/25 | | 187 | 183,539 |
| Outfront Media Capital, LLC/Outfront Media Capital Corp., 6.25%, 6/15/25(1) | | 403 | 397,845 |
| Starwood Property Trust, Inc., 3.75%, 12/31/24(1) | | 964 | 911,920 |
| VICI Properties, L.P./VICI Note Co., Inc., 3.50%, 2/15/25(1) | | 619 | 590,942 |
| | | | $ 2,934,003 |
| Insurance — 1.6% |
| AssuredPartners, Inc., 7.00%, 8/15/25(1) | | 342 | $ 335,817 |
| HUB International, Ltd., 7.00%, 5/1/26(1) | | 387 | 377,068 |
| USI, Inc., 6.875%, 5/1/25(1) | | 530 | 525,705 |
| | | | $ 1,238,590 |
| Leisure — 4.7% |
| Life Time, Inc., 8.00%, 4/15/26(1) | | 445 | $ 434,244 |
| NCL Corp., Ltd.: | | | |
| 3.625%, 12/15/24(1) | | 1,152 | 1,090,623 |
| Security | Principal
Amount*
(000's omitted) | Value |
| Leisure (continued) |
| NCL Corp., Ltd.: (continued) | | | |
| 5.875%, 3/15/26(1) | | 245 | $ 220,106 |
| Royal Caribbean Cruises, Ltd.: | | | |
| 5.50%, 8/31/26(1) | | 250 | 236,190 |
| 11.625%, 8/15/27(1) | | 225 | 244,247 |
| Speedway Motorsports, LLC/Speedway Funding II, Inc., 4.875%, 11/1/27(1) | | 300 | 268,060 |
| Vail Resorts, Inc., 6.25%, 5/15/25(1) | | 450 | 447,613 |
| Viking Cruises, Ltd., 6.25%, 5/15/25(1) | | 727 | 711,084 |
| | | | $ 3,652,167 |
| Metals & Mining — 1.6% |
| Constellium SE, 5.875%, 2/15/26(1) | | 250 | $ 239,877 |
| First Quantum Minerals, Ltd., 6.875%, 3/1/26(1) | | 500 | 440,000 |
| Hudbay Minerals, Inc., 4.50%, 4/1/26(1) | | 400 | 372,700 |
| New Gold, Inc., 7.50%, 7/15/27(1) | | 210 | 197,254 |
| | | | $ 1,249,831 |
| Paper — 0.7% |
| Clearwater Paper Corp., 5.375%, 2/1/25(1) | | 187 | $ 188,800 |
| Enviva Partners, L.P./Enviva Partners Finance Corp., 6.50%, 1/15/26(1) | | 520 | 365,869 |
| | | | $ 554,669 |
| Publishing & Printing — 0.5% |
| LABL, Inc., 10.50%, 7/15/27(1) | | 250 | $ 216,693 |
| McGraw-Hill Education, Inc., 5.75%, 8/1/28(1) | | 191 | 161,185 |
| | | | $ 377,878 |
| Railroad — 0.5% |
| Watco Cos., LLC/Watco Finance Corp., 6.50%, 6/15/27(1) | | 400 | $ 373,118 |
| | | | $ 373,118 |
| Restaurant — 2.1% |
| 1011778 B.C. Unlimited Liability Company/New Red Finance, Inc., 5.75%, 4/15/25(1) | | 356 | $ 353,426 |
| Dave & Buster's, Inc., 7.625%, 11/1/25(1) | | 518 | 514,638 |
| IRB Holding Corp., 7.00%, 6/15/25(1) | | 753 | 748,064 |
| | | | $ 1,616,128 |
| Services — 4.2% |
| Allied Universal Holdco, LLC/Allied Universal Finance Corp.: | | | |
| 6.625%, 7/15/26(1) | | 442 | $ 414,298 |
| 9.75%, 7/15/27(1) | | 200 | 173,953 |
9
See Notes to Financial Statements.
Eaton Vance
Short Duration High Income Fund
October 31, 2023
Portfolio of Investments — continued
| Security | Principal
Amount*
(000's omitted) | Value |
| Services (continued) |
| GEMS MENASA Cayman, Ltd./GEMS Education Delaware, LLC, 7.125%, 7/31/26(1) | | 827 | $ 796,914 |
| Hertz Corp. (The), 4.625%, 12/1/26(1) | | 279 | 233,964 |
| Korn Ferry, 4.625%, 12/15/27(1) | | 380 | 346,033 |
| WASH Multifamily Acquisition, Inc., 5.75%, 4/15/26(1) | | 400 | 370,364 |
| WESCO Distribution, Inc., 7.125%, 6/15/25(1) | | 899 | 899,354 |
| | | | $ 3,234,880 |
| Steel — 1.1% |
| Allegheny Ludlum, LLC, 6.95%, 12/15/25 | | 515 | $ 513,393 |
| Cleveland-Cliffs, Inc., 6.75%, 3/15/26(1) | | 376 | 374,260 |
| | | | $ 887,653 |
| Super Retail — 1.5% |
| Bath & Body Works, Inc., 9.375%, 7/1/25(1) | | 309 | $ 318,540 |
| Evergreen AcqCo 1, L.P./TVI, Inc., 9.75%, 4/26/28(1) | | 256 | 258,553 |
| Hanesbrands, Inc., 4.875%, 5/15/26(1) | | 158 | 145,343 |
| Kohl's Corp., 4.25%, 7/17/25 | | 270 | 252,430 |
| William Carter Co. (The), 5.625%, 3/15/27(1) | | 185 | 175,478 |
| | | | $ 1,150,344 |
| Technology — 4.3% |
| CDK Global II, LLC, 6.50%, 10/15/24 | | 500 | $ 451,860 |
| Clarios Global, L.P., 6.75%, 5/15/25(1) | | 299 | 296,914 |
| Clarios Global, L.P./Clarios US Finance Co., 8.50%, 5/15/27(1) | | 750 | 739,837 |
| Gen Digital, Inc.: | | | |
| 5.00%, 4/15/25(1) | | 322 | 312,079 |
| 6.75%, 9/30/27(1) | | 500 | 487,266 |
| Seagate HDD Cayman, 4.75%, 1/1/25 | | 410 | 401,490 |
| Sensata Technologies B.V., 5.00%, 10/1/25(1) | | 650 | 632,686 |
| | | | $ 3,322,132 |
| Telecommunications — 2.0% |
| Connect Finco S.a.r.l./Connect US Finco, LLC, 6.75%, 10/1/26(1) | | 285 | $ 265,987 |
| Iliad Holding SASU, 6.50%, 10/15/26(1) | | 460 | 430,262 |
| LCPR Senior Secured Financing DAC, 6.75%, 10/15/27(1) | | 600 | 543,612 |
| Viasat, Inc., 5.625%, 9/15/25(1) | | 300 | 278,962 |
| | | | $ 1,518,823 |
| Transport Excluding Air & Rail — 0.7% |
| Fenix Marine Service Holdings, Ltd., 8.00%, 1/15/24 | | 562 | $ 565,378 |
| | | | $ 565,378 |
| Security | Principal
Amount*
(000's omitted) | Value |
| Utility — 2.2% |
| Calpine Corp., 5.25%, 6/1/26(1) | | 350 | $ 335,297 |
| Ferrellgas, L.P./Ferrellgas Finance Corp., 5.375%, 4/1/26(1) | | 400 | 374,776 |
| NextEra Energy Operating Partners, L.P., 4.25%, 7/15/24(1) | | 741 | 727,415 |
| NRG Energy, Inc., 6.625%, 1/15/27 | | 300 | 291,445 |
| | | | $ 1,728,933 |
Total Corporate Bonds
(identified cost $63,870,731) | | | $62,258,299 |
| Senior Floating-Rate Loans — 11.8%(4) |
| Borrower/Description | Principal
Amount
(000's omitted) | Value |
| Aerospace — 1.4% |
| TransDigm, Inc., Term Loan, 8.64%, (SOFR + 3.25%), 8/24/28 | $ | 1,097 | $ 1,097,032 |
| | | | $ 1,097,032 |
| Air Transportation — 1.1% |
| Mileage Plus Holdings, LLC, Term Loan, 10.798%, (SOFR + 5.25%), 6/21/27 | $ | 795 | $ 820,582 |
| | | | $ 820,582 |
| Capital Goods — 0.4% |
| EMRLD Borrower, L.P., Term Loan, 8.38%, (SOFR + 3.00%), 5/31/30 | $ | 311 | $ 310,751 |
| | | | $ 310,751 |
| Chemicals — 0.5% |
| Olympus Water US Holding Corporation, Term Loan, 9.402%, (SOFR + 3.75%), 11/9/28 | $ | 388 | $ 379,101 |
| | | | $ 379,101 |
| Gaming — 0.8% |
| Spectacle Gary Holdings, LLC, Term Loan, 9.674%, (SOFR + 4.25%), 12/10/28 | $ | 604 | $ 590,560 |
| | | | $ 590,560 |
| Healthcare — 1.8% |
| Jazz Financing Lux S.a.r.l., Term Loan, 8.939%, (SOFR + 3.50%), 5/5/28 | $ | 718 | $ 718,699 |
10
See Notes to Financial Statements.
Eaton Vance
Short Duration High Income Fund
October 31, 2023
Portfolio of Investments — continued
| Borrower/Description | Principal
Amount
(000's omitted) | Value |
| Healthcare (continued) |
| Pluto Acquisition I, Inc., Term Loan, 9.684%, (SOFR + 4.00%), 6/22/26 | $ | 288 | $ 244,438 |
| Verscend Holding Corp., Term Loan, 9.439%, (SOFR + 4.00%), 8/27/25 | | 433 | 433,090 |
| | | | $ 1,396,227 |
| Restaurant — 1.3% |
| Dave & Buster's, Inc., Term Loan, 9.188%, (SOFR + 3.75%), 6/29/29 | $ | 768 | $ 768,288 |
| IRB Holding Corp., Term Loan, 12/15/27(5) | | 244 | 242,011 |
| | | | $ 1,010,299 |
| Services — 1.1% |
| AlixPartners, LLP, Term Loan, 8.189%, (SOFR + 2.75%), 2/4/28 | $ | 873 | $ 873,158 |
| | | | $ 873,158 |
| Super Retail — 1.8% |
| Mavis Tire Express Services Corp., Term Loan, 9.439%, (SOFR + 4.00%), 5/4/28 | $ | 168 | $ 165,372 |
| Michaels Companies, Inc., Term Loan, 9.902%, (SOFR + 4.25%), 4/15/28 | | 243 | 203,456 |
| PetSmart, Inc., Term Loan, 9.174%, (SOFR + 3.75%), 2/11/28 | | 1,065 | 1,054,113 |
| | | | $ 1,422,941 |
| Technology — 1.6% |
| Clarios Global, L.P., Term Loan, 9.074%, (SOFR + 3.75%), 5/6/30 | $ | 65 | $ 64,980 |
| GoTo Group, Inc., Term Loan, 10.283%, (SOFR + 4.75%), 8/31/27 | | 2 | 1,110 |
| Presidio Holdings, Inc., Term Loan, 8.981%, (SOFR + 3.50%), 1/22/27(6) | | 832 | 831,695 |
| Riverbed Technology, Inc., Term Loan, 9.89%, (SOFR + 4.50%), 7/1/28 | | 21 | 13,917 |
| Travelport Finance (Luxembourg) S.a.r.l., Term Loan, 12.652%, (SOFR + 7.00%), 2/28/25 | | 384 | 365,789 |
| | | | $ 1,277,491 |
Total Senior Floating-Rate Loans
(identified cost $9,230,800) | | | $ 9,178,142 |
| Short-Term Investments — 6.3% |
| Security | Shares | Value |
| Morgan Stanley Institutional Liquidity Funds - Government Portfolio, Institutional Class, 5.25%(7) | | 4,875,056 | $ 4,875,056 |
Total Short-Term Investments
(identified cost $4,875,056) | | | $ 4,875,056 |
Total Investments — 100.1%
(identified cost $79,385,887) | | | $77,640,956 |
| Other Assets, Less Liabilities — (0.1)% | | | $ (40,644) |
| Net Assets — 100.0% | | | $77,600,312 |
| The percentage shown for each investment category in the Portfolio of Investments is based on net assets. |
| * | In U.S. dollars unless otherwise indicated. |
| (1) | Security exempt from registration under Rule 144A of the Securities Act of 1933, as amended. These securities may be sold in certain transactions in reliance on an exemption from registration (normally to qualified institutional buyers). At October 31, 2023, the aggregate value of these securities is $50,683,284 or 65.3% of the Fund's net assets. |
| (2) | Security exempt from registration under Regulation S of the Securities Act of 1933, as amended, which exempts from registration securities offered and sold outside the United States. Security may not be offered or sold in the United States except pursuant to an exemption from, or in a transaction not subject to, the registration requirements of the Securities Act of 1933, as amended. At October 31, 2023, the aggregate value of these securities is $1,101,016 or 1.4% of the Fund's net assets. |
| (3) | Issuer is in default with respect to interest and/or principal payments. |
| (4) | Senior floating-rate loans (Senior Loans) often require prepayments from excess cash flows or permit the borrowers to repay at their election. The degree to which borrowers repay, whether as a contractual requirement or at their election, cannot be predicted with accuracy. As a result, the actual remaining maturity may be substantially less than the stated maturities shown. However, Senior Loans will typically have an expected average life of approximately two to four years. Senior Loans typically have rates of interest which are redetermined periodically by reference to a base lending rate, plus a spread. These base lending rates are primarily the Secured Overnight Financing Rate (“SOFR”) (or the London Interbank Offered Rate (“LIBOR”) for those loans whose rates reset prior to the discontinuance of LIBOR on June 30, 2023) and secondarily, the prime rate offered by one or more major United States banks (the “Prime Rate”). Base lending rates may be subject to a floor, or minimum rate. Rates for SOFR are generally 1 or 3-month tenors and may also be subject to a credit spread adjustment. Senior Loans are generally subject to contractual restrictions that must be satisfied before they can be bought or sold. |
| (5) | This Senior Loan will settle after October 31, 2023, at which time the interest rate will be determined. |
| (6) | The stated interest rate represents the weighted average interest rate at October 31, 2023 of contracts within the senior loan facility. Interest rates on contracts are primarily redetermined either monthly or quarterly by reference to the indicated base lending rate and spread and the reset period. |
11
See Notes to Financial Statements.
Eaton Vance
Short Duration High Income Fund
October 31, 2023
Portfolio of Investments — continued
| (7) | May be deemed to be an affiliated investment company. The rate shown is the annualized seven-day yield as of October 31, 2023. |
| Forward Foreign Currency Exchange Contracts (OTC) |
| Currency Purchased | Currency Sold | Counterparty | Settlement
Date | Unrealized
Appreciation | Unrealized
(Depreciation) |
| USD | 519,994 | EUR | 489,056 | State Street Bank and Trust Company | 1/31/24 | $ 310 | $ — |
| USD | 587,343 | EUR | 552,908 | State Street Bank and Trust Company | 1/31/24 | — | (192) |
| | | | | | | $ 310 | $(192) |
| Abbreviations: |
| OTC | – Over-the-counter |
| SOFR | – Secured Overnight Financing Rate |
| Currency Abbreviations: |
| EUR | – Euro |
| USD | – United States Dollar |
12
See Notes to Financial Statements.
Eaton Vance
Short Duration High Income Fund
October 31, 2023
Statement of Assets and Liabilities
| | October 31, 2023 |
| Assets | |
| Unaffiliated investments, at value (identified cost $74,510,831) | $ 72,765,900 |
| Affiliated investments, at value (identified cost $4,875,056) | 4,875,056 |
| Foreign currency, at value (identified cost $1,019) | 1,020 |
| Interest receivable | 1,112,090 |
| Dividends receivable from affiliated investments | 17,858 |
| Receivable for investments sold | 1,258,107 |
| Receivable for Fund shares sold | 456,727 |
| Receivable for open forward foreign currency exchange contracts | 310 |
| Receivable from affiliates | 3,565 |
| Trustees' deferred compensation plan | 5,621 |
| Total assets | $80,496,254 |
| Liabilities | |
| Payable for investments purchased | $ 2,483,245 |
| Payable for Fund shares redeemed | 200,192 |
| Payable for open forward foreign currency exchange contracts | 192 |
| Distributions payable | 5,719 |
| Due to custodian | 50,935 |
| Payable to affiliates: | |
| Investment adviser and administration fee | 34,945 |
| Distribution and service fees | 2,456 |
| Trustees' fees | 434 |
| Trustees' deferred compensation plan | 5,621 |
| Accrued expenses | 112,203 |
| Total liabilities | $ 2,895,942 |
| Net Assets | $77,600,312 |
| Sources of Net Assets | |
| Paid-in capital | $ 83,890,615 |
| Accumulated loss | (6,290,303) |
| Net Assets | $77,600,312 |
| Class A Shares | |
| Net Assets | $ 11,663,930 |
| Shares Outstanding | 1,337,900 |
Net Asset Value and Redemption Price Per Share
(net assets ÷ shares of beneficial interest outstanding) | $ 8.72 |
Maximum Offering Price Per Share
(100 ÷ 96.75 of net asset value per share) | $ 9.01 |
| Class I Shares | |
| Net Assets | $ 65,936,382 |
| Shares Outstanding | 7,553,810 |
Net Asset Value, Offering Price and Redemption Price Per Share
(net assets ÷ shares of beneficial interest outstanding) | $ 8.73 |
| On sales of $100,000 or more, the offering price of Class A shares is reduced. |
13
See Notes to Financial Statements.
Eaton Vance
Short Duration High Income Fund
October 31, 2023
| | Year Ended |
| | October 31, 2023 |
| Investment Income | |
| Dividend income | $ 9,177 |
| Dividend income from affiliated investments | 147,611 |
| Interest and other income | 4,726,351 |
| Total investment income | $ 4,883,139 |
| Expenses | |
| Investment adviser and administration fee | $ 401,293 |
| Distribution and service fees: | |
| Class A | 19,856 |
| Trustees’ fees and expenses | 5,036 |
| Custodian fee | 36,984 |
| Transfer and dividend disbursing agent fees | 69,513 |
| Legal and accounting services | 75,018 |
| Printing and postage | 11,219 |
| Registration fees | 40,148 |
| Miscellaneous | 13,055 |
| Total expenses | $ 672,122 |
| Deduct: | |
| Waiver and/or reimbursement of expenses by affiliates | $ 180,938 |
| Total expense reductions | $ 180,938 |
| Net expenses | $ 491,184 |
| Net investment income | $ 4,391,955 |
| Realized and Unrealized Gain (Loss) | |
| Net realized gain (loss): | |
| Investment transactions | $ (1,387,608) |
| Foreign currency transactions | (3,234) |
| Forward foreign currency exchange contracts | (10,453) |
| Net realized loss | $(1,401,295) |
| Change in unrealized appreciation (depreciation): | |
| Investments | $ 1,244,999 |
| Foreign currency | 150 |
| Forward foreign currency exchange contracts | (7,345) |
| Net change in unrealized appreciation (depreciation) | $ 1,237,804 |
| Net realized and unrealized loss | $ (163,491) |
| Net increase in net assets from operations | $ 4,228,464 |
14
See Notes to Financial Statements.
Eaton Vance
Short Duration High Income Fund
October 31, 2023
Statements of Changes in Net Assets
| | Year Ended October 31, |
| | 2023 | 2022 |
| Increase (Decrease) in Net Assets | | |
| From operations: | | |
| Net investment income | $ 4,391,955 | $ 2,686,084 |
| Net realized loss | (1,401,295) | (917,213) |
| Net change in unrealized appreciation (depreciation) | 1,237,804 | (3,752,930) |
| Net increase (decrease) in net assets from operations | $ 4,228,464 | $ (1,984,059) |
| Distributions to shareholders: | | |
| Class A | $ (492,054) | $ (278,639) |
| Class I | (4,152,190) | (2,549,762) |
| Total distributions to shareholders | $ (4,644,244) | $ (2,828,401) |
| Transactions in shares of beneficial interest: | | |
| Class A | $ 5,040,226 | $ 164,876 |
| Class I | (3,032,600) | 11,717,543 |
| Net increase in net assets from Fund share transactions | $ 2,007,626 | $11,882,419 |
| Net increase in net assets | $ 1,591,846 | $ 7,069,959 |
| Net Assets | | |
| At beginning of year | $ 76,008,466 | $ 68,938,507 |
| At end of year | $77,600,312 | $76,008,466 |
15
See Notes to Financial Statements.
Eaton Vance
Short Duration High Income Fund
October 31, 2023
| | Class A |
| | Year Ended October 31, |
| | 2023 | 2022 | 2021 | 2020 | 2019 |
| Net asset value — Beginning of year | $ 8.750 | $ 9.500 | $ 9.120 | $ 9.540 | $ 9.470 |
| Income (Loss) From Operations | | | | | |
| Net investment income(1) | $ 0.515 | $ 0.355 | $ 0.356 | $ 0.394 | $ 0.432 |
| Net realized and unrealized gain (loss) | (0.003) | (0.730) | 0.401 | (0.387) | 0.070 |
| Total income (loss) from operations | $ 0.512 | $(0.375) | $ 0.757 | $ 0.007 | $ 0.502 |
| Less Distributions | | | | | |
| From net investment income | $ (0.542) | $ (0.375) | $ (0.377) | $ (0.414) | $ (0.432) |
| Tax return of capital | — | — | — | (0.013) | — |
| Total distributions | $ (0.542) | $(0.375) | $(0.377) | $(0.427) | $(0.432) |
| Net asset value — End of year | $ 8.720 | $ 8.750 | $ 9.500 | $ 9.120 | $ 9.540 |
| Total Return(2)(3) | 5.96% | (4.00)% | 8.39% | 0.15% | 5.41% |
| Ratios/Supplemental Data | | | | | |
| Net assets, end of year (000’s omitted) | $11,664 | $ 6,683 | $ 7,059 | $ 6,537 | $ 6,914 |
| Ratios (as a percentage of average daily net assets):(4) | | | | | |
| Expenses (3) | 0.90% (5) | 0.90% (5) | 0.90% | 0.90% | 0.90% |
| Net investment income | 5.84% | 3.89% | 3.76% | 4.29% | 4.54% |
| Portfolio Turnover of the Portfolio(6) | — | — | — | 50% | 63% |
| Portfolio Turnover of the Fund | 70% | 96% | 75% | 34% (7) | — |
| (1) | Computed using average shares outstanding. |
| (2) | Returns are historical and are calculated by determining the percentage change in net asset value with all distributions reinvested and do not reflect the effect of sales charges. |
| (3) | The investment adviser and administrator of the Fund and/or the investment adviser of the Portfolio reimbursed certain operating expenses (equal to 0.24%, 0.23%, 0.30%, 0.31% and 0.39% of average daily net assets for the years ended October 31, 2023, 2022, 2021, 2020 and 2019, respectively). Absent this reimbursement, total return would be lower. |
| (4) | Includes the Fund’s share of the Portfolio’s allocated expenses for the period while the Fund was investing in the Portfolio. |
| (5) | Includes a reduction by the investment adviser and administrator of a portion of its investment adviser and administration fee due to the Fund’s investment in the Liquidity Fund (equal to less than 0.01% and less than 0.005% of average daily net assets for the years ended October 31, 2023 and 2022, respectively). |
| (6) | Portfolio turnover represents the rate of portfolio activity for the period while the Fund was investing in the Portfolio. |
| (7) | For the period from June 15, 2020 through October 31, 2020 when the Fund was making investments directly in securities. |
| References to Portfolio herein are to Short Duration High Income Portfolio, a Massachusetts business trust in which the Fund invested all of its investable assets prior to the close of business on June 12, 2020 and which had the same investment objective and policies as the Fund during such period. |
16
See Notes to Financial Statements.
Eaton Vance
Short Duration High Income Fund
October 31, 2023
Financial Highlights — continued
| | Class I |
| | Year Ended October 31, |
| | 2023 | 2022 | 2021 | 2020 | 2019 |
| Net asset value — Beginning of year | $ 8.760 | $ 9.510 | $ 9.130 | $ 9.560 | $ 9.490 |
| Income (Loss) From Operations | | | | | |
| Net investment income(1) | $ 0.533 | $ 0.381 | $ 0.375 | $ 0.417 | $ 0.457 |
| Net realized and unrealized gain (loss) | 0.002 (2) | (0.733) | 0.407 | (0.396) | 0.069 |
| Total income (loss) from operations | $ 0.535 | $ (0.352) | $ 0.782 | $ 0.021 | $ 0.526 |
| Less Distributions | | | | | |
| From net investment income | $ (0.565) | $ (0.398) | $ (0.402) | $ (0.437) | $ (0.456) |
| Tax return of capital | — | — | — | (0.014) | — |
| Total distributions | $ (0.565) | $ (0.398) | $ (0.402) | $ (0.451) | $ (0.456) |
| Net asset value — End of year | $ 8.730 | $ 8.760 | $ 9.510 | $ 9.130 | $ 9.560 |
| Total Return(3)(4) | 6.23% | (3.75)% | 8.65% | 0.30% | 5.67% |
| Ratios/Supplemental Data | | | | | |
| Net assets, end of year (000’s omitted) | $65,936 | $69,325 | $61,879 | $41,585 | $49,780 |
| Ratios (as a percentage of average daily net assets):(5) | | | | | |
| Expenses (4) | 0.65% (6) | 0.65% (6) | 0.65% | 0.65% | 0.65% |
| Net investment income | 6.04% | 4.18% | 3.95% | 4.53% | 4.79% |
| Portfolio Turnover of the Portfolio(7) | — | — | — | 50% | 63% |
| Portfolio Turnover of the Fund | 70% | 96% | 75% | 34% (8) | — |
| (1) | Computed using average shares outstanding. |
| (2) | The per share amount is not in accord with the net realized and unrealized gain (loss) for the period because of the timing of Fund share transactions and the amount of the per share realized and unrealized gains and losses at such time. |
| (3) | Returns are historical and are calculated by determining the percentage change in net asset value with all distributions reinvested. |
| (4) | The investment adviser and administrator of the Fund and/or the investment adviser of the Portfolio reimbursed certain operating expenses (equal to 0.24%, 0.23%, 0.30%, 0.31% and 0.39% of average daily net assets for the years ended October 31, 2023, 2022, 2021, 2020 and 2019, respectively). Absent this reimbursement, total return would be lower. |
| (5) | Includes the Fund’s share of the Portfolio’s allocated expenses for the period while the Fund was investing in the Portfolio. |
| (6) | Includes a reduction by the investment adviser and administrator of a portion of its investment adviser and administration fee due to the Fund’s investment in the Liquidity Fund (equal to less than 0.01% and less than 0.005% of average daily net assets for the years ended October 31, 2023 and 2022, respectively). |
| (7) | Portfolio turnover represents the rate of portfolio activity for the period while the Fund was investing in the Portfolio. |
| (8) | For the period from June 15, 2020 through October 31, 2020 when the Fund was making investments directly in securities. |
| References to Portfolio herein are to Short Duration High Income Portfolio, a Massachusetts business trust in which the Fund invested all of its investable assets prior to the close of business on June 12, 2020 and which had the same investment objective and policies as the Fund during such period. |
17
See Notes to Financial Statements.
Eaton Vance
Short Duration High Income Fund
October 31, 2023
Notes to Financial Statements
1 Significant Accounting Policies
Eaton Vance Short Duration High Income Fund (the Fund) is a diversified series of Eaton Vance Mutual Funds Trust (the Trust). The Trust is a Massachusetts business trust registered under the Investment Company Act of 1940, as amended (the 1940 Act), as an open-end management investment company. The Fund’s investment objective is total return. The Fund offers two classes of shares. Class A shares are generally sold subject to a sales charge imposed at time of purchase. Class A shares may be subject to a 0.75% contingent deferred sales charge (CDSC) if redeemed within 12 months of purchase (depending on the circumstances of purchase). Class I shares are sold at net asset value and are not subject to a sales charge. Each class represents a pro rata interest in the Fund, but votes separately on class-specific matters and (as noted below) is subject to different expenses. Realized and unrealized gains and losses are allocated daily to each class of shares based on the relative net assets of each class to the total net assets of the Fund. Net investment income, other than class-specific expenses, is allocated daily to each class of shares based upon the ratio of the value of each class’s paid shares to the total value of all paid shares. Each class of shares differs in its distribution plan and certain other class-specific expenses.
The following is a summary of significant accounting policies of the Fund. The policies are in conformity with accounting principles generally accepted in the United States of America (U.S. GAAP). The Fund is an investment company and follows accounting and reporting guidance in the Financial Accounting Standards Board (FASB) Accounting Standards Codification Topic 946.
A Investment Valuation—The following methodologies are used to determine the market value or fair value of investments.
Debt Obligations. Debt obligations are generally valued on the basis of valuations provided by third party pricing services, as derived from such services’ pricing models. Inputs to the models may include, but are not limited to, reported trades, executable bid and ask prices, broker/dealer quotations, prices or yields of securities with similar characteristics, interest rates, anticipated prepayments, benchmark curves or information pertaining to the issuer, as well as industry and economic events. The pricing services may use a matrix approach, which considers information regarding securities with similar characteristics to determine the valuation for a security. Short-term debt obligations purchased with a remaining maturity of sixty days or less for which a valuation from a third party pricing service is not readily available may be valued at amortized cost, which approximates fair value.
Senior Floating-Rate Loans. Interests in senior floating-rate loans (Senior Loans) are valued generally at the average mean of bid and ask quotations obtained from a third party pricing service. Senior Loans, for which a valuation is not available or deemed unreliable, are fair valued by the investment adviser utilizing one or more of the valuation techniques described below to assess the likelihood that the borrower will make a full repayment of the loan underlying such Senior Loan. If the investment adviser believes that there is a reasonable likelihood of full repayment, the investment adviser will determine fair value using a matrix pricing approach that considers the yield on the Senior Loan relative to yields on other Senior Loans issued by companies of comparable credit quality. If the investment adviser believes there is not a reasonable likelihood of full repayment, the investment adviser will determine fair value using analyses that include, but are not limited to: (i) a comparison of the value of the borrower's outstanding equity and debt to that of comparable public companies; (ii) a discounted cash flow analysis; or (iii) when the investment adviser believes it is likely that a borrower will be liquidated or sold, an analysis of the terms of such liquidation or sale. In certain cases, the investment adviser will use a combination of analytical methods to determine fair value, such as when only a portion of a borrower's assets are likely to be sold. In conducting its assessment and analyses for purposes of determining fair value of a Senior Loan, the investment adviser will use its discretion and judgment in considering and appraising relevant factors. Junior Loans (i.e., subordinated loans and second lien loans) are valued in the same manner as Senior Loans.
Equity Securities. Equity securities listed on a U.S. securities exchange generally are valued at the last sale or closing price on the day of valuation or, if no sales took place on such date, at the mean between the closing bid and ask prices on the exchange where such securities are principally traded. Equity securities listed on the NASDAQ National Market System are valued at the NASDAQ official closing price. Unlisted or listed securities for which closing sales prices or closing quotations are not available are valued at the mean between the latest available bid and ask prices or, in the case of preferred equity securities that are not listed or traded in the over-the-counter market, by a third party pricing service that uses various techniques that consider factors including, but not limited to, prices or yields of securities with similar characteristics, benchmark yields, broker/dealer quotes, quotes of underlying common stock, issuer spreads, as well as industry and economic events.
Derivatives. Forward foreign currency exchange contracts are generally valued at the mean of the average bid and average ask prices that are reported by currency dealers to a third party pricing service at the valuation time. Such third party pricing service valuations are supplied for specific settlement periods and the Fund’s forward foreign currency exchange contracts are valued at an interpolated rate between the closest preceding and subsequent settlement period reported by the third party pricing service.
Foreign Securities and Currencies. Foreign securities and currencies are valued in U.S. dollars, based on foreign currency exchange rate quotations supplied by a third party pricing service. The pricing service uses a proprietary model to determine the exchange rate. Inputs to the model include reported trades and implied bid/ask spreads.
Other. Investments in management investment companies (including money market funds) that do not trade on an exchange are valued at the net asset value as of the close of each business day.
Fair Valuation. In connection with Rule 2a-5 of the 1940 Act, the Trustees have designated the Fund’s investment adviser as its valuation designee. Investments for which valuations or market quotations are not readily available or are deemed unreliable are valued by the investment adviser, as valuation designee, at fair value using methods that most fairly reflect the security’s “fair value”, which is the amount that the Fund might reasonably expect to receive for the security upon its current sale in the ordinary course. Each such determination is based on a consideration of relevant factors, which are
Eaton Vance
Short Duration High Income Fund
October 31, 2023
Notes to Financial Statements — continued
likely to vary from one pricing context to another. These factors may include, but are not limited to, the type of security, the existence of any contractual restrictions on the security’s disposition, the price and extent of public trading in similar securities of the issuer or of comparable companies or entities, quotations or relevant information obtained from broker/dealers or other market participants, information obtained from the issuer, analysts, and/or the appropriate stock exchange (for exchange-traded securities), an analysis of the company’s or entity’s financial statements, and an evaluation of the forces that influence the issuer and the market(s) in which the security is purchased and sold.
B Investment Transactions—Investment transactions for financial statement purposes are accounted for on a trade date basis. Realized gains and losses on investments sold are determined on the basis of identified cost.
C Income—Interest income is recorded on the basis of interest accrued, adjusted for amortization of premium or accretion of discount. Fees associated with loan amendments are recognized immediately. Dividend income is recorded on the ex-dividend date for dividends received in cash and/or securities. Distributions from investment companies are recorded as dividend income, capital gains or return of capital based on the nature of the distribution.
D Federal Taxes—The Fund’s policy is to comply with the provisions of the Internal Revenue Code applicable to regulated investment companies and to distribute to shareholders each year substantially all of its net investment income, and all or substantially all of its net realized capital gains. Accordingly, no provision for federal income or excise tax is necessary.
As of October 31, 2023, the Fund had no uncertain tax positions that would require financial statement recognition, de-recognition, or disclosure. The Fund files a U.S. federal income tax return annually after its fiscal year-end, which is subject to examination by the Internal Revenue Service for a period of three years from the date of filing.
E Expenses—The majority of expenses of the Trust are directly identifiable to an individual fund. Expenses which are not readily identifiable to a specific fund are allocated taking into consideration, among other things, the nature and type of expense and the relative size of the funds.
F Foreign Currency Translation—Investment valuations, other assets, and liabilities initially expressed in foreign currencies are translated each business day into U.S. dollars based upon current exchange rates. Purchases and sales of foreign investment securities and income and expenses denominated in foreign currencies are translated into U.S. dollars based upon currency exchange rates in effect on the respective dates of such transactions. Recognized gains or losses on investment transactions attributable to changes in foreign currency exchange rates are recorded for financial statement purposes as net realized gains and losses on investments. That portion of unrealized gains and losses on investments that results from fluctuations in foreign currency exchange rates is not separately disclosed.
G Use of Estimates—The preparation of the financial statements in conformity with U.S. GAAP requires management to make estimates and assumptions that affect the reported amounts of assets and liabilities at the date of the financial statements and the reported amounts of income and expense during the reporting period. Actual results could differ from those estimates.
H Indemnifications—Under the Trust’s organizational documents, its officers and Trustees may be indemnified against certain liabilities and expenses arising out of the performance of their duties to the Fund. Under Massachusetts law, if certain conditions prevail, shareholders of a Massachusetts business trust (such as the Trust) could be deemed to have personal liability for the obligations of the Trust. However, the Trust’s Declaration of Trust contains an express disclaimer of liability on the part of Fund shareholders and the By-laws provide that the Trust shall assume, upon request by the shareholder, the defense on behalf of any Fund shareholders. Moreover, the By-laws also provide for indemnification out of Fund property of any shareholder held personally liable solely by reason of being or having been a shareholder for all loss or expense arising from such liability. Additionally, in the normal course of business, the Fund enters into agreements with service providers that may contain indemnification clauses. The Fund's maximum exposure under these arrangements is unknown as this would involve future claims that may be made against the Fund that have not yet occurred.
I Forward Foreign Currency Exchange Contracts—The Fund may enter into forward foreign currency exchange contracts for the purchase or sale of a specific foreign currency at a fixed price on a future date. The forward foreign currency exchange contracts are adjusted by the daily exchange rate of the underlying currency and any gains or losses are recorded as unrealized until such time as the contracts have been closed. Risks may arise upon entering these contracts from the potential inability of counterparties to meet the terms of their contracts and from movements in the value of a foreign currency relative to the U.S. dollar.
2 Distributions to Shareholders and Income Tax Information
The Fund declares dividends daily to shareholders of record at the time of declaration. Distributions are generally paid monthly. Distributions of realized capital gains are made at least annually. Distributions are declared separately for each class of shares. Shareholders may reinvest income and capital gain distributions in additional shares of the same class of the Fund at the net asset value as of the reinvestment date or, at the election of the shareholder, receive distributions in cash. Distributions to shareholders are determined in accordance with income tax regulations, which may differ from U.S. GAAP. As required by U.S. GAAP, only distributions in excess of tax basis earnings and profits are reported in the financial statements as a return of capital. Permanent differences between book and tax accounting relating to distributions are reclassified to paid-in capital. For tax purposes, distributions from short-term capital gains are considered to be from ordinary income.
Eaton Vance
Short Duration High Income Fund
October 31, 2023
Notes to Financial Statements — continued
The tax character of distributions declared for the years ended October 31, 2023 and October 31, 2022 was as follows:
| | Year Ended October 31, |
| | 2023 | 2022 |
| Ordinary income | $4,644,244 | $2,828,401 |
During the year ended October 31, 2023, accumulated loss was decreased by $32,972 and paid-in capital was decreased by $32,972 due to differences between book and tax accounting. These reclassifications had no effect on the net assets or net asset value per share of the Fund.
As of October 31, 2023, the components of distributable earnings (accumulated loss) on a tax basis were as follows:
| Deferred capital losses | $ (4,306,245) |
| Net unrealized depreciation | (1,978,339) |
| Distributions payable | (5,719) |
| Accumulated loss | $(6,290,303) |
At October 31, 2023, the Fund, for federal income tax purposes, had deferred capital losses of $4,306,245 which would reduce its taxable income arising from future net realized gains on investment transactions, if any, to the extent permitted by the Internal Revenue Code, and thus would reduce the amount of distributions to shareholders, which would otherwise be necessary to relieve the Fund of any liability for federal income or excise tax. The deferred capital losses are treated as arising on the first day of the Fund’s next taxable year and retain the same short-term or long-term character as when originally deferred. Of the deferred capital losses at October 31, 2023, $2,169,815 are short-term and $2,136,430 are long-term.
The cost and unrealized appreciation (depreciation) of investments, including open derivative contracts, of the Fund at October 31, 2023, as determined on a federal income tax basis, were as follows:
| Aggregate cost | $ 79,619,184 |
| Gross unrealized appreciation | $ 157,601 |
| Gross unrealized depreciation | (2,135,829) |
| Net unrealized depreciation | $ (1,978,228) |
3 Investment Adviser and Administration Fee and Other Transactions with Affiliates
The investment adviser and administration fee is earned by Eaton Vance Management (EVM), an indirect, wholly-owned subsidiary of Morgan Stanley, as compensation for investment advisory and administrative services rendered to the Fund. The investment adviser and administration fee is computed at an annual rate as a percentage of the Fund’s average daily net assets as follows and is payable monthly:
| Average Daily Net Assets | Annual Fee Rate |
| Up to $1 billion | 0.550% |
| $1 billion but less than $2.5 billion | 0.525% |
| $2.5 billion but less than $5 billion | 0.505% |
| $5 billion and over | 0.490% |
For the year ended October 31, 2023, the Fund's investment adviser and administration fee amounted to $401,293 or 0.55% of the Fund’s average daily net assets. The Fund may invest in a money market fund, the Institutional Class of the Morgan Stanley Institutional Liquidity Funds - Government Portfolio (the "Liquidity Fund"), an open-end management investment company managed by Morgan Stanley Investment Management Inc., a wholly-owned subsidiary of Morgan Stanley. The investment adviser and administration fee paid by the Fund is reduced by an amount equal to its pro rata share of the advisory and administration fees paid by the Fund due to its investment in the Liquidity Fund. For the year ended October 31, 2023, the investment adviser and administration fee paid was reduced by $4,684 relating to the Fund's investment in the Liquidity Fund.
Eaton Vance
Short Duration High Income Fund
October 31, 2023
Notes to Financial Statements — continued
EVM has agreed to reimburse the Fund’s expenses to the extent that total annual operating expenses (relating to ordinary operating expenses only and excluding such expenses as brokerage commissions, acquired fund fees and expenses of unaffiliated funds, borrowing costs, taxes or litigation expenses) exceed 0.90% and 0.65% of the Fund’s average daily net assets for Class A and Class I, respectively. This agreement may be changed or terminated after February 29, 2024. Pursuant to this agreement, EVM was allocated $176,254 of the Fund’s operating expenses for the year ended October 31, 2023.
EVM provides sub-transfer agency and related services to the Fund pursuant to a Sub-Transfer Agency Support Services Agreement. For the year ended October 31, 2023, EVM earned $2,796 from the Fund pursuant to such agreement, which is included in transfer and dividend disbursing agent fees on the Statement of Operations. The Fund was informed that Eaton Vance Distributors, Inc. (EVD), an affiliate of EVM and the Fund's principal underwriter, received $1,462 as its portion of the sales charge on sales of Class A shares and no CDSCs paid by Class A shareholders for the year ended October 31, 2023. EVD also received distribution and service fees from Class A shares (see Note 4).
Trustees and officers of the Fund who are members of EVM’s organization receive remuneration for their services to the Fund out of the investment adviser and administration fee. Trustees of the Fund who are not affiliated with EVM may elect to defer receipt of all or a percentage of their annual fees in accordance with the terms of the Trustees Deferred Compensation Plan. Certain officers and Trustees of the Fund are officers of EVM.
4 Distribution Plan
The Fund has in effect a distribution plan for Class A shares (Class A Plan) pursuant to Rule 12b-1 under the 1940 Act. Pursuant to the Class A Plan, the Fund pays EVD a distribution and service fee of 0.25% per annum of its average daily net assets attributable to Class A shares for distribution services and facilities provided to the Fund by EVD, as well as for personal services and/or the maintenance of shareholder accounts. Distribution and service fees paid or accrued to EVD for the year ended October 31, 2023 amounted to $19,856 for Class A shares.
Distribution and service fees are subject to the limitations contained in the Financial Industry Regulatory Authority Rule 2341(d).
5 Purchases and Sales of Investments
Purchases and sales of investments, other than short-term obligations and including maturities, paydowns and principal repayments on Senior Loans, aggregated $49,984,926 and $48,642,400, respectively, for the year ended October 31, 2023.
6 Shares of Beneficial Interest
The Fund’s Declaration of Trust permits the Trustees to issue an unlimited number of full and fractional shares of beneficial interest (without par value). Such shares may be issued in a number of different series (such as the Fund) and classes. Transactions in Fund shares were as follows:
| | Year Ended
October 31, 2023 | | Year Ended
October 31, 2022 |
| | Shares | Amount | | Shares | Amount |
| Class A | | | | | |
| Sales | 831,920 | $ 7,311,993 | | 156,200 | $ 1,414,154 |
| Issued to shareholders electing to receive payments of distributions in Fund shares | 54,543 | 480,324 | | 29,979 | 270,963 |
| Redemptions | (312,285) | (2,752,091) | | (165,322) | (1,520,241) |
| Net increase | 574,178 | $ 5,040,226 | | 20,857 | $ 164,876 |
| Class I | | | | | |
| Sales | 5,714,700 | $ 50,433,326 | | 6,766,427 | $ 60,662,464 |
| Issued to shareholders electing to receive payments of distributions in Fund shares | 464,178 | 4,094,270 | | 278,621 | 2,518,053 |
| Redemptions | (6,538,541) | (57,560,196) | | (5,636,745) | (51,462,974) |
| Net increase (decrease) | (359,663) | $ (3,032,600) | | 1,408,303 | $ 11,717,543 |
Eaton Vance
Short Duration High Income Fund
October 31, 2023
Notes to Financial Statements — continued
7 Financial Instruments
The Fund may trade in financial instruments with off-balance sheet risk in the normal course of its investing activities. These financial instruments may include forward foreign currency exchange contracts and may involve, to a varying degree, elements of risk in excess of the amounts recognized for financial statement purposes. The notional or contractual amounts of these instruments represent the investment the Fund has in particular classes of financial instruments and do not necessarily represent the amounts potentially subject to risk. The measurement of the risks associated with these instruments is meaningful only when all related and offsetting transactions are considered. A summary of obligations under these financial instruments at October 31, 2023 is included in the Portfolio of Investments. At October 31, 2023, the Fund had sufficient cash and/or securities to cover commitments under these contracts.
The Fund is subject to foreign exchange risk in the normal course of pursuing its investment objective. Because the Fund holds foreign currency denominated investments, the value of these investments and related receivables and payables may change due to future changes in foreign currency exchange rates. To hedge against this risk, the Fund enters into forward foreign currency exchange contracts.
The Fund enters into forward foreign currency exchange contracts that may contain provisions whereby the counterparty may terminate the contract under certain conditions, including but not limited to a decline in the Fund’s net assets below a certain level over a certain period of time, which would trigger a payment by the Fund for those derivatives in a liability position. At October 31, 2023, the fair value of derivatives with credit-related contingent features in a net liability position was $192. At October 31, 2023, there were no assets pledged by the Portfolio for such liability.
The over-the-counter (OTC) derivatives in which the Fund invests are subject to the risk that the counterparty to the contract fails to perform its obligations under the contract. To mitigate this risk, the Fund has entered into an International Swaps and Derivatives Association, Inc. Master Agreement (“ISDA Master Agreement”) or similar agreement with substantially all its derivative counterparties. An ISDA Master Agreement is a bilateral agreement between the Fund and a counterparty that governs certain OTC derivatives and typically contains, among other things, set-off provisions in the event of a default and/or termination event as defined under the relevant ISDA Master Agreement. Under an ISDA Master Agreement, the Fund may, under certain circumstances, offset with the counterparty certain derivative financial instruments’ payables and/or receivables with collateral held and/or posted and create one single net payment. The provisions of the ISDA Master Agreement typically permit a single net payment in the event of default including the bankruptcy or insolvency of the counterparty. However, bankruptcy or insolvency laws of a particular jurisdiction may impose restrictions on or prohibitions against the right of offset in bankruptcy or insolvency. Certain ISDA Master Agreements allow counterparties to OTC derivatives to terminate derivative contracts prior to maturity in the event the Fund’s net assets decline by a stated percentage or the Fund fails to meet the terms of its ISDA Master Agreements, which would cause the counterparty to accelerate payment by the Fund of any net liability owed to it.
The collateral requirements for derivatives traded under an ISDA Master Agreement are governed by a Credit Support Annex to the ISDA Master Agreement. Collateral requirements are determined at the close of business each day and are typically based on changes in market values for each transaction under an ISDA Master Agreement and netted into one amount for such agreement. Generally, the amount of collateral due from or to a counterparty is subject to a minimum transfer threshold amount before a transfer is required, which may vary by counterparty. Collateral pledged for the benefit of the Fund and/or counterparty is held in segregated accounts by the Fund’s custodian and cannot be sold, re-pledged, assigned or otherwise used while pledged. The portion of such collateral representing cash, if any, is reflected as deposits for derivatives collateral and, in the case of cash pledged by a counterparty for the benefit of the Fund, a corresponding liability on the Statement of Assets and Liabilities. Securities pledged by the Fund as collateral, if any, are identified as such in the Portfolio of Investments.
The fair value of open derivative instruments (not considered to be hedging instruments for accounting disclosure purposes) and whose primary underlying risk exposure is foreign exchange risk at October 31, 2023 was as follows:
| | Fair Value |
| Derivative | Asset Derivative | Liability Derivative |
| Forward foreign currency exchange contracts | $310 (1) | $(192) (2) |
| (1) | Statement of Assets and Liabilities location: Receivable for open forward foreign currency exchange contracts. |
| (2) | Statement of Assets and Liabilities location: Payable for open forward foreign currency exchange contracts. |
Eaton Vance
Short Duration High Income Fund
October 31, 2023
Notes to Financial Statements — continued
The Fund's derivative assets and liabilities at fair value by type, which are reported gross in the Statement of Assets and Liabilities, are presented in the table above. The following tables present the Fund's derivative assets and liabilities by counterparty, net of amounts available for offset under a master netting agreement and net of the related collateral received by the Fund for such assets and pledged by the Fund for such liabilities as of October 31, 2023.
| Counterparty | Derivative
Assets Subject to
Master Netting
Agreement | Derivatives
Available
for Offset | Non-cash
Collateral
Received(a) | Cash
Collateral
Received(a) | Net Amount
of Derivative
Assets(b) |
| State Street Bank and Trust Company | $310 | $(192) | $ — | $ — | $118 |
| Counterparty | Derivative
Liabilities Subject to
Master Netting
Agreement | Derivatives
Available
for Offset | Non-cash
Collateral
Pledged(a) | Cash
Collateral
Pledged(a) | Net Amount
of Derivative
Liabilities(c) |
| State Street Bank and Trust Company | $(192) | $192 | $ — | $ — | $ — |
| (a) | In some instances, the total collateral received and/or pledged may be more than the amount shown due to overcollateralization. |
| (b) | Net amount represents the net amount due from the counterparty in the event of default. |
| (c) | Net amount represents the net amount payable to the counterparty in the event of default. |
The effect of derivative instruments (not considered to be hedging instruments for accounting disclosure purposes) on the Statement of Operations and whose primary underlying risk exposure is foreign exchange risk for the year ended October 31, 2023 was as follows:
| Derivative | Realized Gain (Loss)
on Derivatives Recognized
in Income(1) | Change in Unrealized
Appreciation (Depreciation) on
Derivatives Recognized in Income(2) |
| Forward foreign currency exchange contracts | $(10,453) | $(7,345) |
| (1) | Statement of Operations location: Net realized gain (loss): Forward foreign currency exchange contracts. |
| (2) | Statement of Operations location: Change in unrealized appreciation (depreciation): Forward foreign currency exchange contracts. |
The average notional amount of forward foreign currency exchange contracts (based on the absolute value of notional amounts of currency purchased and currency sold) outstanding during the year ended October 31, 2023, which is indicative of the volume of this derivative type, was approximately $1,003,000.
8 Line of Credit
The Fund participates with other portfolios and funds managed by EVM and its affiliates in a $650 million unsecured revolving line of credit agreement with a group of banks, which is in effect through October 22, 2024. In connection with the renewal of the agreement on October 24, 2023, the borrowing limit was decreased from $725 million. Borrowings are made by the Fund solely for temporary purposes related to redemptions and other short-term cash needs. Interest is charged to the Fund based on its borrowings at an amount above either the Secured Overnight Financing Rate (SOFR) or Federal Funds rate. In addition, a fee computed at an annual rate of 0.15% on the daily unused portion of the line of credit is allocated among the participating portfolios and funds at the end of each quarter. In connection with the renewal of the agreement in October 2023, an arrangement fee totaling $150,000 was incurred that was allocated to the participating portfolios and funds. Because the line of credit is not available exclusively to the Fund, it may be unable to borrow some or all of its requested amounts at any particular time. The Fund did not have any significant borrowings or allocated fees during the year ended October 31, 2023.
Eaton Vance
Short Duration High Income Fund
October 31, 2023
Notes to Financial Statements — continued
9 Affiliated Investments
At October 31, 2023, the value of the Fund's investment in funds that may be deemed to be affiliated was $4,875,056, which represents 6.3% of the Fund's net assets. Transactions in such investments by the Fund for the year ended October 31, 2023 were as follows:
| Name | Value,
beginning
of period | Purchases | Sales
proceeds | Net
realized
gain (loss) | Change in
unrealized
appreciation
(depreciation) | Value, end
of period | Dividend
income | Shares,
end of period |
| Short-Term Investments |
| Liquidity Fund | $4,521,527 | $55,634,287 | $(55,280,758) | $ — | $ — | $4,875,056 | $147,611 | 4,875,056 |
10 Fair Value Measurements
Under generally accepted accounting principles for fair value measurements, a three-tier hierarchy to prioritize the assumptions, referred to as inputs, is used in valuation techniques to measure fair value. The three-tier hierarchy of inputs is summarized in the three broad levels listed below.
| • | Level 1 – quoted prices in active markets for identical investments |
| • | Level 2 – other significant observable inputs (including quoted prices for similar investments, interest rates, prepayment speeds, credit risk, etc.) |
| • | Level 3 – significant unobservable inputs (including a fund's own assumptions in determining the fair value of investments) |
In cases where the inputs used to measure fair value fall in different levels of the fair value hierarchy, the level disclosed is determined based on the lowest level input that is significant to the fair value measurement in its entirety. The inputs or methodology used for valuing securities are not necessarily an indication of the risk associated with investing in those securities.
At October 31, 2023, the hierarchy of inputs used in valuing the Fund's investments and open derivative instruments, which are carried at fair value, were as follows:
| Asset Description | Level 1 | Level 2 | Level 3 | Total |
| Convertible Bonds | $ — | $ 1,329,459 | $ — | $ 1,329,459 |
| Corporate Bonds | — | 62,258,299 | — | 62,258,299 |
| Senior Floating-Rate Loans | — | 9,178,142 | — | 9,178,142 |
| Short-Term Investments | 4,875,056 | — | — | 4,875,056 |
| Total Investments | $ 4,875,056 | $ 72,765,900 | $ — | $ 77,640,956 |
| Forward Foreign Currency Exchange Contracts | $ — | $ 310 | $ — | $ 310 |
| Total | $ 4,875,056 | $ 72,766,210 | $ — | $ 77,641,266 |
| Liability Description | | | | |
| Forward Foreign Currency Exchange Contracts | $ — | $ (192) | $ — | $ (192) |
| Total | $ — | $ (192) | $ — | $ (192) |
11 Risks and Uncertainties
Credit Risk
The Fund primarily invests in lower rated and comparable quality unrated high yield securities. These investments have different risks than investments in debt securities rated investment grade. Risk of loss upon default by the borrower is significantly greater with respect to such debt than with other debt securities because these securities are generally unsecured and are more sensitive to adverse economic conditions, such as recession or increasing interest rates, than are investment grade issuers.
Eaton Vance
Short Duration High Income Fund
October 31, 2023
Report of Independent Registered Public Accounting Firm
To the Trustees of Eaton Vance Mutual Funds Trust and Shareholders of Eaton Vance Short Duration High Income Fund:
Opinion on the Financial Statements and Financial Highlights
We have audited the accompanying statement of assets and liabilities of Eaton Vance Short Duration High Income Fund (the “Fund”) (one of the funds constituting Eaton Vance Mutual Funds Trust), including the portfolio of investments, as of October 31, 2023, the related statement of operations for the year then ended, the statements of changes in net assets for each of the two years in the period then ended, the financial highlights for each of the five years in the period then ended, and the related notes. In our opinion, the financial statements and financial highlights present fairly, in all material respects, the financial position of the Fund as of October 31, 2023, and the results of its operations for the year then ended, the changes in its net assets for each of the two years in the period then ended, and the financial highlights for each of the five years in the period then ended, in conformity with accounting principles generally accepted in the United States of America.
Basis for Opinion
These financial statements and financial highlights are the responsibility of the Fund's management. Our responsibility is to express an opinion on the Fund's financial statements and financial highlights based on our audits. We are a public accounting firm registered with the Public Company Accounting Oversight Board (United States) (PCAOB) and are required to be independent with respect to the Fund in accordance with the U.S. federal securities laws and the applicable rules and regulations of the Securities and Exchange Commission and the PCAOB.
We conducted our audits in accordance with the standards of the PCAOB. Those standards require that we plan and perform the audit to obtain reasonable assurance about whether the financial statements and financial highlights are free of material misstatement, whether due to error or fraud. The Fund is not required to have, nor were we engaged to perform, an audit of its internal control over financial reporting. As part of our audits, we are required to obtain an understanding of internal control over financial reporting but not for the purpose of expressing an opinion on the effectiveness of the Fund’s internal control over financial reporting. Accordingly, we express no such opinion.
Our audits included performing procedures to assess the risks of material misstatement of the financial statements and financial highlights, whether due to error or fraud, and performing procedures that respond to those risks. Such procedures included examining, on a test basis, evidence regarding the amounts and disclosures in the financial statements and financial highlights. Our audits also included evaluating the accounting principles used and significant estimates made by management, as well as evaluating the overall presentation of the financial statements and financial highlights. Our procedures included confirmation of securities and senior loans owned as of October 31, 2023, by correspondence with the custodian, brokers and agent banks; when replies were not received from brokers and agent banks, we performed other auditing procedures. We believe that our audits provide a reasonable basis for our opinion.
/s/ Deloitte & Touche LLP
Boston, Massachusetts
December 19, 2023
We have served as the auditor of one or more Eaton Vance investment companies since 1959.
Eaton Vance
Short Duration High Income Fund
October 31, 2023
Federal Tax Information (Unaudited)
The Form 1099-DIV you receive in February 2024 will show the tax status of all distributions paid to your account in calendar year 2023. Shareholders are advised to consult their own tax adviser with respect to the tax consequences of their investment in the Fund. As required by the Internal Revenue Code and/or regulations, shareholders must be notified regarding the status of qualified dividend income for individuals and 163(j) interest dividends.
Qualified Dividend Income. For the fiscal year ended October 31, 2023, the Fund designates approximately $5,358, or up to the maximum amount of such dividends allowable pursuant to the Internal Revenue Code, as qualified dividend income eligible for the reduced tax rate of 15%.
163(j) Interest Dividends. For the fiscal year ended October 31, 2023, the Fund designates 83.87% of distributions from net investment income as a 163(j) interest dividend.
Eaton Vance
Short Duration High Income Fund
October 31, 2023
Board of Trustees’ Contract Approval
Overview of the Contract Review Process
The Investment Company Act of 1940, as amended (the “1940 Act”), provides, in substance, that the investment advisory agreement between a fund and its investment adviser will continue in effect from year-to-year only if its continuation is approved on an annual basis by a vote of the fund’s board of trustees, including a majority of the trustees who are not “interested persons” of the fund (“independent trustees”), cast in person at a meeting called for the purpose of considering such approval.
At a meeting held on June 8, 2023, the Boards of Trustees/Directors (collectively, the “Board”) that oversee the registered investment companies advised by Eaton Vance Management or its affiliate, Boston Management and Research (the “Eaton Vance Funds”), including a majority of the independent trustees (the “Independent Trustees”), voted to approve the continuation of existing investment advisory agreements and sub-advisory agreements1 for each of the Eaton Vance Funds for an additional one-year period. The Board relied upon the affirmative recommendation of its Contract Review Committee, which is a committee exclusively comprised of Independent Trustees. Prior to making its recommendation, the Contract Review Committee reviewed information furnished by the adviser and sub-adviser to each of the Eaton Vance Funds (including information specifically requested by the Board) for a series of formal meetings held between April and June 2023, as well as certain additional information provided in response to specific requests from the Independent Trustees as members of the Contract Review Committee. Members of the Contract Review Committee also considered information received at prior meetings of the Board and its committees, to the extent such information was relevant to the Contract Review Committee’s annual evaluation of the investment advisory agreements and sub-advisory agreements.
In connection with its evaluation of the investment advisory agreements and sub-advisory agreements, the Board considered various information relating to the Eaton Vance Funds. This included information applicable to all or groups of Eaton Vance Funds, which is referenced immediately below, and information applicable to the particular Eaton Vance Fund covered by this report (each “Eaton Vance Fund” is referred to below as a “fund”). (For funds that invest through one or more underlying portfolios, references to “each fund” in this section may include information that was considered at the portfolio-level.)
Information about Fees, Performance and Expenses
• A report from an independent data provider comparing advisory and other fees paid by each fund to such fees paid by comparable funds, as identified by the independent data provider (“comparable funds”);
• A report from an independent data provider comparing each fund’s total expense ratio (and its components) to those of comparable funds;
• A report from an independent data provider comparing the investment performance of each fund (including, as relevant, total return data, income data, Sharpe ratios and information ratios) to the investment performance of comparable funds and, as applicable, benchmark indices, over various time periods;
• In certain instances, data regarding investment performance relative to customized groups of peer funds and blended indices identified by the adviser in consultation with the Portfolio Management Committee of the Board (a committee exclusively comprised of Independent Trustees);
• Comparative information concerning the fees charged and services provided by the adviser and sub-adviser to each fund in managing other accounts (which may include other mutual funds, collective investment funds and institutional accounts) using investment strategies and techniques similar to those used in managing such fund(s), if any;
• Profitability analyses with respect to the adviser and sub-adviser to each of the funds;
Information about Portfolio Management and Trading
• Descriptions of the investment management services provided to each fund, as well as each of the funds’ investment strategies and policies;
• The procedures and processes used to determine the value of fund assets, including, when necessary, the determination of “fair value” and actions taken to monitor and test the effectiveness of such procedures and processes;
• Information about the policies and practices of each fund’s adviser and sub-adviser with respect to trading, including their processes for seeking best execution of portfolio transactions;
• Information about the allocation of brokerage transactions and the benefits, if any, received by the adviser and sub-adviser to each fund as a result of brokerage allocation, including, as applicable, information concerning the acquisition of research through client commission arrangements and policies with respect to “soft dollars”;
• Data relating to the portfolio turnover rate of each fund and related information regarding active management in the context of particular strategies;
Information about each Adviser and Sub-adviser
• Reports detailing the financial results and condition of the adviser and sub-adviser to each fund;
• Information regarding the individual investment professionals whose responsibilities include portfolio management and investment research for the funds, and, for portfolio managers and certain other investment professionals, information relating to their responsibilities with respect to managing other mutual funds and investment accounts, as applicable;
1 Not all Eaton Vance Funds have entered into a sub-advisory agreement with a sub-adviser. Accordingly, references to “sub-adviser” or “sub-advisory agreement” in this “Overview” section may not be applicable to the particular Eaton Vance Fund covered by this report.
Eaton Vance
Short Duration High Income Fund
October 31, 2023
Board of Trustees’ Contract Approval — continued
• Information regarding the adviser’s and its parent company’s (Morgan Stanley’s) efforts to retain and attract talented investment professionals, including in the context of a competitive marketplace for talent, as well as the ongoing unique environment presented by hybrid, remote and other alternative work arrangements;
• Information regarding the adviser’s compensation methodology for its investment professionals and the incentives and accountability it creates, along with investment professionals’ investments in the fund(s) they manage;
• The Code of Ethics of the adviser and its affiliates and the sub-adviser of each fund, together with information relating to compliance with, and the administration of, such codes;
• Policies and procedures relating to proxy voting, including regular reporting with respect to fund proxy voting activities;
• Information regarding the handling of corporate actions and class actions, as well as information regarding litigation and other regulatory matters;
• Information concerning the resources devoted to compliance efforts undertaken by the adviser and its affiliates and the sub-adviser of each fund, if any, including descriptions of their various compliance programs and their record of compliance;
• Information concerning the business continuity and disaster recovery plans of the adviser and its affiliates and the sub-adviser of each fund, if any;
• A description of Eaton Vance Management’s and Boston Management and Research’s oversight of sub-advisers, including with respect to regulatory and compliance issues, investment management and other matters;
Other Relevant Information
• Information regarding ongoing initiatives to further integrate and harmonize, where applicable, the investment management and other departments of the adviser and its affiliates with the overall investment management infrastructure of Morgan Stanley, in light of Morgan Stanley’s acquisition of Eaton Vance Corp. on March 1, 2021;
• Information concerning the nature, cost and character of the administrative and other non-investment advisory services provided by Eaton Vance Management and its affiliates;
• Information concerning oversight of the relationship with the custodian, subcustodians, fund accountants, and other third-party service providers by the adviser and/or administrator to each of the funds;
• Information concerning efforts to implement policies and procedures with respect to various recently adopted regulations applicable to the funds, including Rule 12d1-4 (the Fund-of-Funds Rule), Rule 18f-4 (the Derivatives Rule) and Rule 2a-5 (the Fair Valuation Rule);
• For an Eaton Vance Fund structured as an exchange-listed closed-end fund, information concerning the benefits of the closed-end fund structure, as well as, where relevant, the closed-end fund’s market prices (including as compared to the closed-end fund’s net asset value (NAV)), trading volume data, continued use of auction preferred shares (where applicable), distribution rates and other relevant matters;
• The risks which the adviser and/or its affiliates incur in connection with the management and operation of the funds, including, among others, litigation, regulatory, entrepreneurial, and other business risks (and the associated costs of such risks); and
• The terms of each investment advisory agreement and sub-advisory agreement.
During the various meetings of the Board and its committees over the course of the year leading up to the June 8, 2023 meeting, the Board received information from portfolio managers and other investment professionals of the advisers and sub-advisers of the funds regarding investment and performance matters, and considered various investment and trading strategies used in pursuing the funds’ investment objectives. The Board also received information regarding risk management techniques employed in connection with the management of the funds. The Board and its committees evaluated issues pertaining to industry and regulatory developments, compliance procedures, fund governance and other issues with respect to the funds, and received and participated in reports and presentations provided by Eaton Vance Management, Boston Management and Research and fund sub-advisers, with respect to such matters. In addition to the formal meetings of the Board and its committees, the Independent Trustees held regular teleconferences to discuss, among other topics, matters relating to the continuation of investment advisory agreements and sub-advisory agreements.
The Contract Review Committee was advised throughout the contract review process by Goodwin Procter LLP, independent legal counsel for the Independent Trustees. The members of the Contract Review Committee, with the advice of such counsel, exercised their own business judgment in determining the material factors to be considered in evaluating each investment advisory agreement and sub-advisory agreement and the weight to be given to each such factor. The conclusions reached with respect to each investment advisory agreement and sub-advisory agreement were based on a comprehensive evaluation of all the information provided and not any single factor. Moreover, each member of the Contract Review Committee may have placed varying emphasis on particular factors in reaching conclusions with respect to each investment advisory agreement and sub-advisory agreement. In evaluating each investment advisory agreement and sub-advisory agreement, including the fee structures and other terms contained in such agreements, the members of the Contract Review Committee were also informed by multiple years of analysis and discussion with the adviser and sub-adviser to each of the Eaton Vance Funds.
Results of the Contract Review Process
Based on its consideration of the foregoing, and such other information it deemed relevant, including the factors and conclusions described below, the Contract Review Committee concluded that the continuation of the investment advisory and administrative agreement between Eaton Vance Short Duration High Income Fund (the “Fund”) and Eaton Vance Management (the “Adviser”), including its fee structure, is in the interests of shareholders and, therefore, recommended to the Board approval of the agreement. Based on the recommendation of the Contract Review Committee, the Board, including a majority of the Independent Trustees, voted to approve continuation of the investment advisory and administrative agreement for the Fund.
Eaton Vance
Short Duration High Income Fund
October 31, 2023
Board of Trustees’ Contract Approval — continued
Nature, Extent and Quality of Services
In considering whether to approve the investment advisory and administrative agreement for the Fund, the Board evaluated the nature, extent and quality of services provided to the Fund by the Adviser.
The Board considered the Adviser’s management capabilities and investment processes in light of the types of investments held by the Fund, including the education, experience and number of investment professionals and other personnel who provide portfolio management, investment research, and similar services to the Fund. The Board considered the abilities and experience of each Adviser’s investment professionals in making investments in fixed-income securities, including those with below-investment grade ratings and durations of three years or less. The Board also took into account the resources dedicated to portfolio management and other services, the compensation methods of the Adviser and other factors, including the reputation and resources of the Adviser to recruit and retain highly qualified research, advisory and supervisory investment professionals. In addition, the Board considered the time and attention devoted to the Eaton Vance Funds, including the Fund, by senior management, as well as the infrastructure, operational capabilities and support staff in place to assist in the portfolio management and operations of the Fund, including the provision of administrative services. The Board also considered the business-related and other risks to which the Adviser or its affiliates may be subject in managing the Fund.
The Board considered the compliance programs of the Adviser and relevant affiliates thereof. The Board considered compliance and reporting matters regarding, among other things, personal trading by investment professionals, disclosure of portfolio holdings, late trading, frequent trading, portfolio valuation, business continuity and the allocation of investment opportunities. The Board also considered the responses of the Adviser and its affiliates to requests in recent years from regulatory authorities, such as the Securities and Exchange Commission and the Financial Industry Regulatory Authority.
The Board considered other administrative services provided or overseen by Eaton Vance Management and its affiliates, including transfer agency and accounting services. The Board evaluated the benefits to shareholders of investing in a fund that is a part of a large fund complex offering exposure to a variety of asset classes and investment disciplines, as well as the ability, in many cases, to exchange an investment among different funds without incurring additional sales charges.
After consideration of the foregoing factors, among others, the Board concluded that the nature, extent and quality of services provided by the Adviser, taken as a whole, are appropriate and consistent with the terms of the investment advisory and administrative agreement.
Fund Performance
The Board compared the Fund’s investment performance to that of comparable funds identified by an independent data provider (the peer group), as well as an appropriate benchmark index and a custom peer group of similarly managed funds. The Board’s review included comparative performance data with respect to the Fund for the one-, three- and five-year periods ended December 31, 2022. In this regard, the Board noted that the performance of the Fund was higher than the median performance of the Fund’s peer group and consistent with the median performance of the Fund’s custom peer group for the three-year period. The Board also noted that the performance of the Fund was lower than its benchmark index for the three-year period. The Board concluded that the performance of the Fund was satisfactory.
Management Fees and Expenses
The Board considered contractual fee rates payable by the Fund for advisory and administrative services (referred to collectively as “management fees”). As part of its review, the Board considered the Fund’s management fees and total expense ratio for the one-year period ended December 31, 2022, as compared to those of comparable funds, before and after giving effect to any undertaking to waive fees or reimburse expenses. The Board also considered factors that had an impact on the Fund’s total expense ratio relative to comparable funds.
After considering the foregoing information, and in light of the nature, extent and quality of the services provided by the Adviser, the Board concluded that the management fees charged for advisory and related services are reasonable.
Profitability and “Fall-Out” Benefits
The Board considered the level of profits realized by the Adviser and relevant affiliates thereof in providing investment advisory and administrative services to the Fund and to all Eaton Vance Funds as a group. The Board considered the level of profits realized without regard to marketing support or other payments by the Adviser and its affiliates to third parties in respect of distribution or other services.
The Board concluded that, in light of the foregoing factors and the nature, extent and quality of the services rendered, the profits realized by the Adviser and its affiliates are deemed not to be excessive.
The Board also considered direct or indirect fall-out benefits received by the Adviser and its affiliates in connection with their respective relationships with the Fund, including the benefits of research services that may be available to the Adviser as a result of securities transactions effected for the Fund and other investment advisory clients.
Eaton Vance
Short Duration High Income Fund
October 31, 2023
Board of Trustees’ Contract Approval — continued
Economies of Scale
In reviewing management fees and profitability, the Board also considered the extent to which the Adviser and its affiliates, on the one hand, and the Fund, on the other hand, can expect to realize benefits from economies of scale as the assets of the Fund increase. The Board acknowledged the difficulty in accurately measuring the benefits resulting from economies of scale, if any, with respect to the management of any specific fund or group of funds. The Board reviewed data summarizing the increases and decreases in the assets of the Fund and of all Eaton Vance Funds as a group over various time periods, and evaluated the extent to which the total expense ratio of the Fund and the profitability of the Adviser and its affiliates may have been affected by such increases or decreases. Based upon the foregoing, the Board concluded that the Fund currently shares in the benefits from economies of scale, if any, when they are realized by the Adviser. The Board also concluded that the structure of the advisory fee, which includes breakpoints at several asset levels, will allow the Fund to continue to benefit from any economies of scale in the future.
Eaton Vance
Short Duration High Income Fund
October 31, 2023
Liquidity Risk Management Program
The Fund has implemented a written liquidity risk management program (Program) and related procedures to manage its liquidity in accordance with Rule 22e-4 under the Investment Company Act of 1940, as amended (Liquidity Rule). The Liquidity Rule defines “liquidity risk” as the risk that a fund could not meet requests to redeem shares issued by the fund without significant dilution of the remaining investors’ interests in the fund. The Fund’s Board of Trustees/Directors has designated the investment adviser to serve as the administrator of the Program and the related procedures. The administrator has established a Liquidity Risk Management Oversight Committee (Committee) to perform the functions necessary to administer the Program. As part of the Program, the administrator is responsible for identifying illiquid investments and categorizing the relative liquidity of the Fund’s investments in accordance with the Liquidity Rule. Under the Program, the administrator assesses, manages, and periodically reviews the Fund’s liquidity risk, and is responsible for making certain reports to the Fund’s Board of Trustees/Directors and the Securities and Exchange Commission (SEC) regarding the liquidity of the Fund’s investments, and to notify the Board of Trustees/Directors and the SEC of certain liquidity events specified in the Liquidity Rule. The liquidity of the Fund’s portfolio investments is determined based on a number of factors including, but not limited to, relevant market, trading and investment-specific considerations under the Program.
At a meeting of the Fund’s Board of Trustees/Directors on June 7, 2023, the Committee provided a written report to the Fund’s Board of Trustees/
Directors pertaining to the operation, adequacy, and effectiveness of implementation of the Program, as well as the operation of the highly liquid investment minimum (if applicable) for the period January 1, 2022 through December 31, 2022 (Review Period). The Program operated effectively during the Review Period, supporting the administrator’s ability to assess, manage and monitor Fund liquidity risk, including during periods of market volatility and net redemptions. During the Review Period, the Fund met redemption requests on a timely basis.
There can be no assurance that the Program will achieve its objectives in the future. Please refer to the Fund’s prospectus for more information regarding the Fund’s exposure to liquidity risk and other principal risks to which an investment in the Fund may be subject.
Eaton Vance
Short Duration High Income Fund
October 31, 2023
Management and Organization
Fund Management. The Trustees of Eaton Vance Mutual Funds Trust (the Trust) are responsible for the overall management and supervision of the Trust's affairs. The Board members and officers of the Trust are listed below. Except as indicated, each individual has held the office shown or other offices in the same company for the last five years. Board members hold indefinite terms of office. Each Trustee holds office until his or her successor is elected and qualified, subject to a prior death, resignation, retirement, disqualification or removal. Under the terms of the Fund’s current Trustee retirement policy, an Independent Trustee must retire and resign as a Trustee on the earlier of: (i) the first day of July following his or her 74th birthday; or (ii), with limited exception, December 31st of the 20th year in which he or she has served as a Trustee. However, if such retirement and resignation would cause the Fund to be out of compliance with Section 16 of the 1940 Act or any other regulations or guidance of the SEC, then such retirement and resignation will not become effective until such time as action has been taken for the Fund to be in compliance therewith. The “noninterested Trustees” consist of those Trustees who are not “interested persons” of the Trust, as that term is defined under the 1940 Act. The business address of each Board member and officer is Two International Place, Boston, Massachusetts 02110. As used below, “BMR” refers to Boston Management and Research, “EV” refers to EV LLC, “EVM” refers to Eaton Vance Management, “MSIM" refers to Morgan Stanley Investment Management Inc. and “EVD” refers to Eaton Vance Distributors, Inc. EV is the trustee of each of EVM and BMR. Each of EVM, BMR, EVD and EV are indirect, wholly owned subsidiaries of Morgan Stanley. Each officer affiliated with EVM may hold a position with other EVM affiliates that is comparable to his or her position with EVM listed below. Each Trustee oversees
127 funds in the Eaton Vance fund complex (including both funds and portfolios in a hub and spoke structure).
| Name and Year of Birth | Trust
Position(s) | Length of Service | Principal Occupation(s) and Other Directorships
During Past Five Years and Other Relevant Experience |
| Interested Trustee |
Anchal Pachnanda(1)
1980 | Trustee | Since 2023 | Co-Head of Strategy of MSIM (since 2019). Formerly, Head of Strategy of MSIM (2017-2019). Ms. Pachnanda is an interested person because of her position with MSIM, which is an affiliate of the Trust.
Other Directorships. None. |
| Noninterested Trustees |
Alan C. Bowser
1962 | Trustee | Since 2022 | Private investor. Formerly, Chief Diversity Officer, Partner and a member of the Operating Committee, and formerly served as Senior Advisor on Diversity and Inclusion for the firm’s chief executive officer, Co-Head of the Americas Region, and Senior Client Advisor of Bridgewater Associates, an asset management firm (2011- 2023).
Other Directorships. Independent Director of Stout Risius Ross (a middle market professional services advisory firm) (since 2021). |
Mark R. Fetting
1954 | Trustee | Since 2016 | Private investor. Formerly held various positions at Legg Mason, Inc. (investment management firm) (2000-2012), including President, Chief Executive Officer, Director and Chairman (2008-2012), Senior Executive Vice President (2004-2008) and Executive Vice President (2001-2004). Formerly, President of Legg Mason family of funds (2001-2008). Formerly, Division President and Senior Officer of Prudential Financial Group, Inc. and related companies (investment management firm) (1991-2000).
Other Directorships. None. |
Cynthia E. Frost
1961 | Trustee | Since 2014 | Private investor. Formerly, Chief Investment Officer of Brown University (university endowment) (2000-2012). Formerly, Portfolio Strategist for Duke Management Company (university endowment manager) (1995-2000). Formerly, Managing Director, Cambridge Associates (investment consulting company) (1989-1995). Formerly, Consultant, Bain and Company (management consulting firm) (1987-1989). Formerly, Senior Equity Analyst, BA Investment Management Company (1983-1985).
Other Directorships. None. |
George J. Gorman
1952 | Chairperson
of the Board
and Trustee | Since 2021
(Chairperson) and
2014 (Trustee) | Principal at George J. Gorman LLC (consulting firm). Formerly, Senior Partner at Ernst & Young LLP (a registered public accounting firm) (1974-2009).
Other Directorships. None. |
Eaton Vance
Short Duration High Income Fund
October 31, 2023
Management and Organization — continued
| Name and Year of Birth | Trust
Position(s) | Length of Service | Principal Occupation(s) and Other Directorships
During Past Five Years and Other Relevant Experience |
| Noninterested Trustees (continued) |
Valerie A. Mosley
1960 | Trustee | Since 2014 | Chairwoman and Chief Executive Officer of Valmo Ventures (a consulting and investment firm). Founder of Upward Wealth, Inc., dba BrightUP, a fintech platform. Formerly, Partner and Senior Vice President, Portfolio Manager and Investment Strategist at Wellington Management Company, LLP (investment management firm) (1992-2012). Formerly, Chief Investment Officer, PG Corbin Asset Management (1990-1992). Formerly worked in institutional corporate bond sales at Kidder Peabody (1986-1990).
Other Directorships. Director of DraftKings, Inc. (digital sports entertainment and gaming company) (since September 2020). Director of Envestnet, Inc. (provider of intelligent systems for wealth management and financial wellness) (since 2018). Formerly, Director of Dynex Capital, Inc. (mortgage REIT) (2013-2020) and Director of Groupon, Inc. (ecommerce provider) (2020-2022). |
Keith Quinton
1958 | Trustee | Since 2018 | Private investor, researcher and lecturer. Formerly, Independent Investment Committee Member at New Hampshire Retirement System (2017-2021). Formerly, Portfolio Manager and Senior Quantitative Analyst at Fidelity Investments (investment management firm) (2001-2014).
Other Directorships. Formerly, Director (2016-2021) and Chairman (2019-2021) of New Hampshire Municipal Bond Bank. |
Marcus L. Smith
1966 | Trustee | Since 2018 | Private investor and independent corporate director. Formerly, Chief Investment Officer, Canada (2012-2017), Chief Investment Officer, Asia (2010-2012), Director of Asian Research (2004-2010) and portfolio manager (2001-2017) at MFS Investment Management (investment management firm).
Other Directorships. Director of First Industrial Realty Trust, Inc. (an industrial REIT) (since 2021). Director of MSCI Inc. (global provider of investment decision support tools) (since 2017). Formerly, Director of DCT Industrial Trust Inc. (logistics real estate company) (2017-2018). |
Susan J. Sutherland
1957 | Trustee | Since 2015 | Private investor. Director of Ascot Group Limited and certain of its subsidiaries (insurance and reinsurance) (since 2017). Formerly, Director of Hagerty Holding Corp. (insurance) (2015-2018) and Montpelier Re Holdings Ltd. (insurance and reinsurance) (2013-2015). Formerly, Associate, Counsel and Partner at Skadden, Arps, Slate, Meagher & Flom LLP (law firm) (1982-2013).
Other Directorships. Formerly, Director of Kairos Acquisition Corp. (insurance/InsurTech acquisition company) (2021-2023). |
Scott E. Wennerholm
1959 | Trustee | Since 2016 | Private investor. Formerly, Trustee at Wheelock College (postsecondary institution) (2012-2018). Formerly, Consultant at GF Parish Group (executive recruiting firm) (2016-2017). Formerly, Chief Operating Officer and Executive Vice President at BNY Mellon Asset Management (investment management firm) (2005-2011). Formerly, Chief Operating Officer and Chief Financial Officer at Natixis Global Asset Management (investment management firm) (1997-2004). Formerly, Vice President at Fidelity Investments Institutional Services (investment management firm) (1994-1997).
Other Directorships. None. |
Nancy A. Wiser
1967 | Trustee | Since 2022 | Formerly, Executive Vice President and the Global Head of Operations at Wells Fargo Asset Management (2011-2021).
Other Directorships. None. |
| Name and Year of Birth | Trust
Position(s) | Length of Service | Principal Occupation(s)
During Past Five Years |
| Principal Officers who are not Trustees |
Kenneth A. Topping
1966 | President | Since 2023 | Vice President and Chief Administrative Officer of EVM and BMR and Chief Operating Officer for Public Markets at MSIM. Also Vice President of Calvert Research and Management (“CRM”) since 2021. Formerly, Chief Operating Officer for Goldman Sachs Asset Management `Classic' (2009-2020). |
Deidre E. Walsh
1971 | Vice President and
Chief Legal Officer | Since 2009 | Vice President of EVM and BMR. Also Vice President of CRM. |
James F. Kirchner
1967 | Treasurer | Since 2007 | Vice President of EVM and BMR. Also Vice President of CRM. |
Eaton Vance
Short Duration High Income Fund
October 31, 2023
Management and Organization — continued
| Name and Year of Birth | Trust
Position(s) | Length of Service | Principal Occupation(s)
During Past Five Years |
| Principal Officers who are not Trustees (continued) |
Nicholas S. Di Lorenzo
1987 | Secretary | Since 2022 | Formerly, associate (2012-2021) and counsel (2022) at Dechert LLP. |
Richard F. Froio
1968 | Chief Compliance
Officer | Since 2017 | Vice President of EVM and BMR since 2017. Formerly Deputy Chief Compliance Officer (Adviser/Funds) and Chief Compliance Officer (Distribution) at PIMCO (2012-2017) and Managing Director at BlackRock/Barclays Global Investors (2009-2012). |
(1) Ms. Pachnanda began serving as Trustee effective April 1, 2023.
The SAI for the Fund includes additional information about the Trustees and officers of the Fund and can be obtained without charge on Eaton Vance’s website at www.eatonvance.com or by calling 1-800-262-1122.
| FACTS | WHAT DOES EATON VANCE DO WITH YOUR
PERSONAL INFORMATION? |
| Why? | Financial companies choose how they share your personal information. Federal law gives consumers the right to limit some but not all sharing. Federal law also requires us to tell you how we collect, share, and protect your personal information. Please read this notice carefully to understand what we do. |
| |
| What? | The types of personal information we collect and share depend on the product or service you have with us. This information can include:■ Social Security number and income
■ investment experience and risk tolerance
■ checking account number and wire transfer instructions |
| |
| How? | All financial companies need to share customers’ personal information to run their everyday business. In the section below, we list the reasons financial companies can share their customers’ personal information; the reasons Eaton Vance chooses to share; and whether you can limit this sharing. |
Reasons we can share your
personal information | Does Eaton Vance
share? | Can you limit
this sharing? |
| For our everyday business purposes — such as to process your transactions, maintain your account(s), respond to court orders and legal investigations, or report to credit bureaus | Yes | No |
| For our marketing purposes — to offer our products and services to you | Yes | No |
| For joint marketing with other financial companies | No | We don’t share |
| For our investment management affiliates’ everyday business purposes — information about your transactions, experiences, and creditworthiness | Yes | Yes |
| For our affiliates’ everyday business purposes — information about your transactions and experiences | Yes | No |
| For our affiliates’ everyday business purposes — information about your creditworthiness | No | We don’t share |
| For our investment management affiliates to market to you | Yes | Yes |
| For our affiliates to market to you | No | We don’t share |
| For nonaffiliates to market to you | No | We don’t share |
To limit our
sharing | Call toll-free 1-800-262-1122 or email: EVPrivacy@eatonvance.comPlease note:If you are a new customer, we can begin sharing your information 30 days from the date we sent this notice. When you are no longer our customer, we continue to share your information as described in this notice. However, you can contact us at any time to limit our sharing. |
| Questions? | Call toll-free 1-800-262-1122 or email: EVPrivacy@eatonvance.com |
| Privacy Notice — continued | April 2021 |
| Who we are |
| Who is providing this notice? | Eaton Vance Management, Eaton Vance Distributors, Inc., Eaton Vance Trust Company, Eaton Vance Management (International) Limited, Eaton Vance Advisers International Ltd., Eaton Vance Global Advisors Limited, Eaton Vance Management’s Real Estate Investment Group, Boston Management and Research, Calvert Research and Management, Eaton Vance and Calvert Fund Families and our investment advisory affiliates (“Eaton Vance”) (see Investment Management Affiliates definition below) |
| What we do |
How does Eaton Vance
protect my personal
information? | To protect your personal information from unauthorized access and use, we use security measures that comply with federal law. These measures include computer safeguards and secured files and buildings. We have policies governing the proper handling of customer information by personnel and requiring third parties that provide support to adhere to appropriate security standards with respect to such information. |
How does Eaton Vance
collect my personal
information? | We collect your personal information, for example, when you■ open an account or make deposits or withdrawals from your account
■ buy securities from us or make a wire transfer
■ give us your contact informationWe also collect your personal information from others, such as credit bureaus, affiliates, or other companies. |
| Why can’t I limit all sharing? | Federal law gives you the right to limit only■ sharing for affiliates’ everyday business purposes — information about your creditworthiness
■ affiliates from using your information to market to you
■ sharing for nonaffiliates to market to youState laws and individual companies may give you additional rights to limit sharing. See below for more on your rights under state law. |
| Definitions |
Investment Management
Affiliates | Eaton Vance Investment Management Affiliates include registered investment advisers, registered broker- dealers, and registered and unregistered funds. Investment Management Affiliates does not include entities associated with Morgan Stanley Wealth Management, such as Morgan Stanley Smith Barney LLC and Morgan Stanley & Co. |
| Affiliates | Companies related by common ownership or control. They can be financial and nonfinancial companies.■ Our affiliates include companies with a Morgan Stanley name and financial companies such as Morgan Stanley Smith Barney LLC and Morgan Stanley & Co. |
| Nonaffiliates | Companies not related by common ownership or control. They can be financial and nonfinancial companies.■ Eaton Vance does not share with nonaffiliates so they can market to you. |
| Joint marketing | A formal agreement between nonaffiliated financial companies that together market financial products or services to you.■ Eaton Vance doesn’t jointly market. |
| Other important information |
| Vermont: Except as permitted by law, we will not share personal information we collect about Vermont residents with Nonaffiliates unless you provide us with your written consent to share such information.California: Except as permitted by law, we will not share personal information we collect about California residents with Nonaffiliates and we will limit sharing such personal information with our Affiliates to comply with California privacy laws that apply to us. |
Delivery of Shareholder Documents. The Securities and Exchange Commission (SEC) permits funds to deliver only one copy of shareholder documents, including prospectuses, proxy statements and shareholder reports, to fund investors with multiple accounts at the same residential or post office box address. This practice is often called “householding” and it helps eliminate duplicate mailings to shareholders. Eaton Vance, or your financial intermediary, may household the mailing of your documents indefinitely unless you instruct Eaton Vance, or your financial intermediary, otherwise. If you would prefer that your Eaton Vance documents not be householded, please contact Eaton Vance at 1-800-262-1122, or contact your financial intermediary. Your instructions that householding not apply to delivery of your Eaton Vance documents will typically be effective within 30 days of receipt by Eaton Vance or your financial intermediary.
Portfolio Holdings. Each Eaton Vance Fund and its underlying Portfolio(s) (if applicable) files a schedule of portfolio holdings on Part F to Form N-PORT with the SEC. Certain information filed on Form N-PORT may be viewed on the Eaton Vance website at www.eatonvance.com, by calling Eaton Vance at 1-800-262-1122 or in the EDGAR database on the SEC’s website at www.sec.gov.
Proxy Voting. From time to time, funds are required to vote proxies related to the securities held by the funds. The Eaton Vance Funds or their underlying Portfolios (if applicable) vote proxies according to a set of policies and procedures approved by the Funds’ and Portfolios’ Boards. You may obtain a description of these policies and procedures and information on how the Funds or Portfolios voted proxies relating to portfolio securities during the most recent 12-month period ended June 30, without charge, upon request, by calling 1-800-262-1122 and by accessing the SEC’s website at www.sec.gov.
Tailored Shareholder Reports. Effective January 24, 2023, the SEC adopted rule and form amendments to require open-end mutual funds and ETFs to transmit concise and visually engaging streamlined annual and semiannual reports to shareholders that highlight key information. Other information, including financial statements, will no longer appear in a streamlined shareholder report but must be available online, delivered free of charge upon request, and filed on a semiannual basis on Form N-CSR. The rule and form amendments have a compliance date of July 24, 2024. At this time, management is evaluating the impact of these amendments on the shareholder reports for the Eaton Vance Funds.
This Page Intentionally Left Blank
This Page Intentionally Left Blank
This Page Intentionally Left Blank
Investment Adviser and Administrator
Eaton Vance Management
Two International Place
Boston, MA 02110
Principal Underwriter*
Eaton Vance Distributors, Inc.
Two International Place
Boston, MA 02110
(617) 482-8260
Custodian
State Street Bank and Trust Company
One Congress Street, Suite 1
Boston, MA 02114-2016
Transfer Agent
BNY Mellon Investment Servicing (US) Inc.
Attn: Eaton Vance Funds
P.O. Box 534439
Pittsburgh, PA 15253-4439
(800) 262-1122
Independent Registered Public Accounting Firm
Deloitte & Touche LLP
200 Berkeley Street
Boston, MA 02116-5022
Fund Offices
Two International Place
Boston, MA 02110
* FINRA BrokerCheck. Investors may check the background of their Investment Professional by contacting the Financial Industry Regulatory Authority (FINRA). FINRA BrokerCheck is a free tool to help investors check the professional background of current and former FINRA-registered securities firms and brokers. FINRA BrokerCheck is available by calling 1-800-289-9999 and at www.FINRA.org. The FINRA BrokerCheck brochure describing this program is available to investors at www.FINRA.org.
Eaton Vance
Emerging and Frontier Countries Equity Fund
Annual Report
October 31, 2023
Commodity Futures Trading Commission Registration. The Commodity Futures Trading Commission (“CFTC”) has adopted regulations that subject registered investment companies and advisers to regulation by the CFTC if a fund invests more than a prescribed level of its assets in certain CFTC-regulated instruments (including futures, certain options and swap agreements) or markets itself as providing investment exposure to such instruments. The investment adviser has claimed an exclusion from the definition of “commodity pool operator” under the Commodity Exchange Act with respect to its management of the Fund. Accordingly, neither the Fund nor the adviser with respect to the operation of the Fund is subject to CFTC regulation. Because of its management of other strategies, the Fund's adviser is registered with the CFTC as a commodity pool operator. The adviser is also registered as a commodity trading advisor.
Fund shares are not insured by the FDIC and are not deposits or other obligations of, or guaranteed by, any depository institution. Shares are subject to investment risks, including possible loss of principal invested.
This report must be preceded or accompanied by a current summary prospectus or prospectus. Before investing, investors should consider carefully the investment objective, risks, and charges and expenses of a mutual fund. This and other important information is contained in the summary prospectus and prospectus, which can be obtained from a financial intermediary. Prospective investors should read the prospectus carefully before investing. For further information, please call 1-800-262-1122.
Annual Report October 31, 2023
Eaton Vance
Emerging and Frontier Countries Equity Fund
Eaton Vance
Emerging and Frontier Countries Equity Fund
October 31, 2023
Management’s Discussion of Fund Performance†
Economic and Market Conditions
For global equity investors, the 12-month period ended October 31, 2023, was a roller-coaster ride, driven largely by shifting perceptions of whether the U.S. Federal Reserve (the Fed) could bring the world’s largest economy in for a soft landing, and changing expectations of how long interest rates might remain high.
During the opening month of the period, stocks rallied on strong corporate earnings, attractive valuations, and hope the Fed might slow the pace of its interest rate hikes. But in December 2022, equities lost ground as “higher for longer” interest rate fears returned. A continuing irony throughout the period was that good economic news -- record low unemployment, strong job creation, and robust consumer spending -- was viewed as bad news for inflation and fuel for future rate hikes that could weigh on stock prices.
In January 2023, however, global equities began a rally that lasted through July. The initial tailwind was ChatGPT, an artificial intelligence (AI) application that led investors to perceive AI might become the next big innovation to drive the information technology (IT) sector. As a result, IT -- one of the worst-performing sectors in 2022 -- became the standout sector of the first half of 2023.
Earlier recession fears that had weighed on stock prices receded as many investors came around to the view that the U.S. and global economies were doing surprisingly well. European equities received an additional boost as feared continent-wide energy shortages failed to materialize during the winter.
But in the final three months of the period, the bond market halted the stock market’s momentum. As it became clear the Fed would keep rates higher for longer than investors had anticipated just a few months earlier, longer-term bond interest rates rose sharply. Given the potential for relatively attractive returns with lower risk than stocks, many investors shifted from equity assets to bonds. In the final two days of the period, however, signs of a stock rally emerged as investors began to believe the Fed might have reached the end of its monetary tightening cycle.
For the period as a whole, global equity performance was strong. The MSCI ACWI Index®, a broad measure of global equities, returned 10.50%; the MSCI EAFE Index® of developed-market international equities returned 14.40%; the MSCI Emerging Markets Index, a broad measure of emerging-market equities, returned 10.80%; and the S&P 500® Index, a broad measure of U.S. stocks, returned 10.14%.
Meanwhile, in the world’s second-largest economy, the MSCI Golden Dragon Index®, a measure of Chinese large-cap and mid-cap stocks, returned 21.11%. The strong 12-month performance, however, masked the significant decline in Chinese stock prices since early 2023. China ended its onerous zero-COVID policy in December 2022, triggering a brief rebound in economic activity. However, by mid-2023 the rebound fizzled, as Chinese equities were dogged by an ailing real estate sector -- the major investment area for millions of Chinese citizens -- and the failure of many Chinese industries to bounce back from COVID restrictions.
Fund Performance
For the 12-month period ended October 31, 2023, Eaton Vance Emerging and Frontier Countries Equity Fund (the Fund) returned 15.84% for Class A shares at net asset value (NAV), outperforming its primary benchmark, the MSCI Emerging Markets Equal Country Weighted Index (the Primary Index), which returned 11.20%; and outperforming its secondary benchmark, the MSCI Frontier Markets Index (the Secondary Index), which returned 4.82%.
The Fund also outperformed the 8.04% return of its blended benchmark consisting of 50% Primary Index and 50% Secondary Index (the Blended Index).
The Fund seeks to invest in emerging and frontier equity markets where management believes macroeconomic fundamentals and economic policies are likely to improve. Investment decisions are focused on broad country-level exposures, rather than individual stocks.
The Fund’s overweight position in Greece, and out-of-Index positions in Cyprus, Slovenia, and Georgia contributed to Fund performance versus the Primary Index during the period.
Greece was the Fund’s largest country position and one of the best-performing countries within the Primary Index during the period, supported by strong economic growth and the re-election of its reform-minded government during the summer of 2023. Greek companies benefitted from the dual tailwinds of strong earnings growth and a business-friendly government that allowed companies to retain earnings, rather than subject them to the windfall taxes that have gained popularity in Europe.
Similarly, the Fund’s Cypriot and Slovenian bank stocks rallied on strong earnings growth, as their balance sheets increased in value amid rising European Central Bank rates, while interest rates paid on deposits remained near zero percent during the period.
Georgia was an unintended beneficiary of the war in Ukraine. Georgian stock prices rose as well-to-do Russians -- who relocated to their southern neighbor to avoid conscription, sanctions, or in protest of their country’s aggression -- helped drive strong economic growth in Georgia.
See Endnotes and Additional Disclosures in this report.
Past performance is no guarantee of future results. Returns are historical and are calculated by determining the percentage change in net asset value (NAV) or offering price (as applicable) with all distributions reinvested. Furthermore, returns do not reflect the deduction of taxes that shareholders may have to pay on Fund distributions or upon the redemption of Fund shares. Investment return and principal value will fluctuate so that shares, when redeemed, may be worth more or less than their original cost. Performance for periods less than or equal to one year is cumulative. Performance is for the stated time period only; due to market volatility, current Fund performance may be lower or higher than the quoted return. For performance as of the most recent month-end, please refer to eatonvance.com.
Eaton Vance
Emerging and Frontier Countries Equity Fund
October 31, 2023
Management’s Discussion of Fund Performance† — continued
In contrast, positioning in China, along with underweight positions in Egypt and Poland, detracted from performance relative to the Primary Index during the period.
The Fund had no exposure to China as of late 2022, when Chinese stocks rallied after the government abruptly ended its zero-COVID policy. Anticipating further economic liberalization and strong growth following the reopening of the economy, the Fund then entered an overweight position in China. However, Chinese stocks subsequently delivered weak performance -- hampered by an ailing real estate sector, a weaker-than-expected economic recovery, and continued challenges for private businesses. By period-end, the Fund sold most of its China position as the outlook and growth expectations for Chinese equities turned negative.
The Fund’s underweight position in Egyptian stocks was due to anticipated challenges to the value of the Egyptian pound. However, Egyptian stocks rallied during the period, more than offsetting foreign-exchange losses related to the pound.
The Fund was significantly underweight in Poland because of its government’s policies, but high interest rates and robust economic growth produced strong corporate earnings, and Polish equities outperformed the Primary Index during the period.
The Fund’s use of derivatives -- primarily by hedging its euro and Chinese yuan foreign-exchange exposures -- was also a minor detractor from Fund performance relative to the Primary Index during the period.
See Endnotes and Additional Disclosures in this report.
Past performance is no guarantee of future results. Returns are historical and are calculated by determining the percentage change in net asset value (NAV) or offering price (as applicable) with all distributions reinvested. Furthermore, returns do not reflect the deduction of taxes that shareholders may have to pay on Fund distributions or upon the redemption of Fund shares. Investment return and principal value will fluctuate so that shares, when redeemed, may be worth more or less than their original cost. Performance for periods less than or equal to one year is cumulative. Performance is for the stated time period only; due to market volatility, current Fund performance may be lower or higher than the quoted return. For performance as of the most recent month-end, please refer to eatonvance.com.
Eaton Vance
Emerging and Frontier Countries Equity Fund
October 31, 2023
Performance
Portfolio Manager(s) Marshall L. Stocker, Ph.D., CFA and Steven Vanne, CFA
| % Average Annual Total Returns1,2 | Class
Inception Date | Performance
Inception Date | One Year | Five Years | Since
Inception |
| Class A at NAV | 11/03/2014 | 11/01/2013 | 15.84% | 6.10% | 3.06% |
| Class A with 5.25% Maximum Sales Charge | — | — | 9.78 | 4.96 | 2.45 |
| Class I at NAV | 11/03/2014 | 11/01/2013 | 16.11 | 6.37 | 3.29 |
|
| MSCI Emerging Markets Equal Country Weighted Index | — | — | 11.20% | 2.37% | 0.25% |
| MSCI Frontier Markets Index | — | — | 4.82 | 1.15 | 1.39 |
| Blended Index | — | — | 8.04 | 1.96 | 0.99 |
| % Total Annual Operating Expense Ratios3 | Class A | Class I |
| Gross | 1.67% | 1.42% |
| Net | 1.42 | 1.17 |
Growth of $10,000
This graph shows the change in value of a hypothetical investment of $10,000 in Class A of the Fund for the period indicated. For comparison, the same investment is shown in the indicated index.
| Growth of Investment | Amount Invested | Period Beginning | At NAV | With Maximum Sales Charge |
| Class I, at minimum investment | $1,000,000 | 11/01/2013 | $1,382,729 | N.A. |
See Endnotes and Additional Disclosures in this report.
Past performance is no guarantee of future results. Returns are historical and are calculated by determining the percentage change in net asset value (NAV) or offering price (as applicable) with all distributions reinvested. Furthermore, returns do not reflect the deduction of taxes that shareholders may have to pay on Fund distributions or upon the redemption of Fund shares. Investment return and principal value will fluctuate so that shares, when redeemed, may be worth more or less than their original cost. Performance for periods less than or equal to one year is cumulative. Performance is for the stated time period only; due to market volatility, current Fund performance may be lower or higher than the quoted return. For performance as of the most recent month-end, please refer to eatonvance.com.
Eaton Vance
Emerging and Frontier Countries Equity Fund
October 31, 2023
| Sector Allocation (% of net assets)1,2 |
| Country Allocation (% of net assets)1 |
Fund invests in an affiliated investment company (Portfolio) with the same objective(s) and policies as the Fund. References to investments are to the Portfolio’s holdings.
Footnotes:
| 1 | Depiction does not reflect the Fund’s derivatives positions. |
| 2 | Excludes cash and cash equivalents. |
Eaton Vance
Emerging and Frontier Countries Equity Fund
October 31, 2023
Endnotes and Additional Disclosures
| † | The views expressed in this report are those of the portfolio manager(s) and are current only through the date stated at the top of this page. These views are subject to change at any time based upon market or other conditions, and Eaton Vance and the Fund(s) disclaim any responsibility to update such views. These views may not be relied upon as investment advice and, because investment decisions are based on many factors, may not be relied upon as an indication of trading intent on behalf of any Eaton Vance fund. This commentary may contain statements that are not historical facts, referred to as “forward-looking statements.” The Fund’s actual future results may differ significantly from those stated in any forward-looking statement, depending on factors such as changes in securities or financial markets or general economic conditions, the volume of sales and purchases of Fund shares, the continuation of investment advisory, administrative and service contracts, and other risks discussed from time to time in the Fund’s filings with the Securities and Exchange Commission. |
| | |
| 1 | MSCI Emerging Markets Equal Country Weighted Index is an unmanaged index of emerging markets common stock where each country within the index has the same weight. MSCI Frontier Markets Index is an unmanaged index that measures the performance of stock markets with less-developed economies and financial markets than emerging markets, and that typically have more restrictions on foreign stock ownership. MSCI indexes are net of foreign withholding taxes. Source: MSCI. MSCI data may not be reproduced or used for any other purpose. MSCI provides no warranties, has not prepared or approved this report, and has no liability hereunder. The Blended Index consists of 50% MSCI Emerging Markets Equal Country Weighted Index and 50% MSCI Frontier Markets Index, rebalanced monthly. Unless otherwise stated, index returns do not reflect the effect of any applicable sales charges, commissions, expenses, taxes or leverage, as applicable. It is not possible to invest directly in an index. |
| 2 | Total Returns at NAV do not include applicable sales charges. If sales charges were deducted, the returns would be lower. Total Returns shown with maximum sales charge reflect the stated maximum sales charge. Unless otherwise stated, performance does not reflect the deduction of taxes on Fund distributions or redemptions of Fund shares.Performance prior to the inception date of Class A and Class I is linked to the performance of Global Macro Capital Opportunities Portfolio (the Portfolio) in which the Fund invests. This linked performance is adjusted for any applicable sales charge, but is not adjusted for class expense differences. If adjusted for such differences, the performance would be different. Performance since inception for an index, if presented, is the performance since the Portfolio’s inception. Performance presented in the Financial Highlights included in the financial statements is not linked. |
| 3 | Source: Fund prospectus. Net expense ratios reflect a contractual expense reimbursement that continues through 2/29/24. The expense ratios for the current reporting period can be found in the Financial Highlights section of this report. Performance reflects expenses waived and/or reimbursed, if applicable. Without such waivers and/or reimbursements, performance would have been lower. |
| | Fund profile subject to change due to active management. |
| | Additional Information |
| | S&P 500® Index is an unmanaged index of large-cap stocks commonly used as a measure of U.S. stock market performance. S&P Dow Jones Indices are a product of S&P Dow Jones Indices LLC (“S&P DJI”) and have been licensed for use. S&P® and S&P 500® are registered trademarks of S&P DJI; Dow Jones is a registered trademark of Dow Jones Trademark Holdings LLC (“Dow Jones”); S&P DJI, Dow Jones and their respective affiliates do not sponsor, endorse, sell or promote the Fund, will not have any liability with respect thereto and do not have any liability for any errors, omissions, or interruptions of the S&P Dow Jones Indices. MSCI Golden Dragon Index is an unmanaged index of common stocks traded in China, Hong Kong and Taiwan. MSCI ACWI Index is an unmanaged free-float-adjusted, market-capitalization-weighted index designed to measure the equity market performance of developed and emerging markets. MSCI EAFE Index is an unmanaged index of equities in the developed markets, excluding the U.S. and Canada. MSCI Emerging Markets Index is an unmanaged index of emerging markets common stocks. |
Eaton Vance
Emerging and Frontier Countries Equity Fund
October 31, 2023
Example
As a Fund shareholder, you incur two types of costs: (1) transaction costs, including sales charges (loads) on purchases; and (2) ongoing costs, including management fees; distribution and/or service fees; and other Fund expenses. This Example is intended to help you understand your ongoing costs (in dollars) of Fund investing and to compare these costs with the ongoing costs of investing in other mutual funds. The Example is based on an investment of $1,000 invested at the beginning of the period and held for the entire period (May 1, 2023 to October 31, 2023).
Actual Expenses
The first section of the table below provides information about actual account values and actual expenses. You may use the information in this section, together with the amount you invested, to estimate the expenses that you paid over the period. Simply divide your account value by $1,000 (for example, an $8,600 account value divided by $1,000 = 8.6), then multiply the result by the number in the first section under the heading entitled “Expenses Paid During Period” to estimate the expenses you paid on your account during this period.
Hypothetical Example for Comparison Purposes
The second section of the table below provides information about hypothetical account values and hypothetical expenses based on the actual Fund expense ratio and an assumed rate of return of 5% per year (before expenses), which is not the actual Fund return. The hypothetical account values and expenses may not be used to estimate the actual ending account balance or expenses you paid for the period. You may use this information to compare the ongoing costs of investing in your Fund and other funds. To do so, compare this 5% hypothetical example with the 5% hypothetical examples that appear in the shareholder reports of the other funds.
Please note that the expenses shown in the table are meant to highlight your ongoing costs only and do not reflect any transactional costs, such as sales charges (loads). Therefore, the second section of the table is useful in comparing ongoing costs only, and will not help you determine the relative total costs of owning different funds. In addition, if these transactional costs were included, your costs would be higher.
| | Beginning
Account Value
(5/1/23) | Ending
Account Value
(10/31/23) | Expenses Paid
During Period*
(5/1/23 – 10/31/23) | Annualized
Expense
Ratio |
| Actual | | | | |
| Class A | $1,000.00 | $1,004.40 | $7.07** | 1.40% |
| Class I | $1,000.00 | $1,006.10 | $5.81** | 1.15% |
| |
| Hypothetical | | | | |
| (5% return per year before expenses) | | | | |
| Class A | $1,000.00 | $1,018.15 | $7.12** | 1.40% |
| Class I | $1,000.00 | $1,019.41 | $5.85** | 1.15% |
| * | Expenses are equal to the Fund's annualized expense ratio for the indicated Class, multiplied by the average account value over the period, multiplied by 184/365 (to reflect the one-half year period). The Example assumes that the $1,000 was invested at the net asset value per share determined at the close of business on April 30, 2023. The Example reflects the expenses of both the Fund and the Portfolio. |
| ** | Absent an allocation of certain expenses to affiliate(s), expenses would be higher. |
Eaton Vance
Emerging and Frontier Countries Equity Fund
October 31, 2023
Statement of Assets and Liabilities
| | October 31, 2023 |
| Assets | |
| Investment in Global Macro Capital Opportunities Portfolio, at value (identified cost $347,706,695) | $ 376,408,663 |
| Receivable for Fund shares sold | 3,795,795 |
| Receivable from affiliates | 146,478 |
| Total assets | $380,350,936 |
| Liabilities | |
| Payable for Fund shares redeemed | $ 406,005 |
| Payable to affiliates: | |
| Distribution and service fees | 1,349 |
| Trustees' fees | 43 |
| Accrued expenses | 104,364 |
| Total liabilities | $ 511,761 |
| Net Assets | $379,839,175 |
| Sources of Net Assets | |
| Paid-in capital | $ 364,021,804 |
| Distributable earnings | 15,817,371 |
| Net Assets | $379,839,175 |
| Class A Shares | |
| Net Assets | $ 6,275,816 |
| Shares Outstanding | 544,254 |
Net Asset Value and Redemption Price Per Share
(net assets ÷ shares of beneficial interest outstanding) | $ 11.53 |
Maximum Offering Price Per Share
(100 ÷ 94.75 of net asset value per share) | $ 12.17 |
| Class I Shares | |
| Net Assets | $ 373,563,359 |
| Shares Outstanding | 32,143,452 |
Net Asset Value, Offering Price and Redemption Price Per Share
(net assets ÷ shares of beneficial interest outstanding) | $ 11.62 |
| On sales of $50,000 or more, the offering price of Class A shares is reduced. |
8
See Notes to Financial Statements.
Eaton Vance
Emerging and Frontier Countries Equity Fund
October 31, 2023
| | Year Ended |
| | October 31, 2023 |
| Investment Income | |
| Dividend income allocated from Portfolio (net of foreign taxes withheld of $589,827) | $ 7,744,394 |
| Interest income allocated from Portfolio (net of foreign taxes withheld of $35) | 1,080,988 |
| Expenses allocated from Portfolio | (2,929,363) |
| Total investment income from Portfolio | $ 5,896,019 |
| Expenses | |
| Distribution and service fees: | |
| Class A | $ 10,648 |
| Trustees’ fees and expenses | 501 |
| Custodian fee | 26,699 |
| Transfer and dividend disbursing agent fees | 185,421 |
| Legal and accounting services | 28,915 |
| Printing and postage | 22,420 |
| Registration fees | 102,739 |
| Miscellaneous | 9,700 |
| Total expenses | $ 387,043 |
| Deduct: | |
| Waiver and/or reimbursement of expenses by affiliates | $ 376,395 |
| Total expense reductions | $ 376,395 |
| Net expenses | $ 10,648 |
| Net investment income | $ 5,885,371 |
| Realized and Unrealized Gain (Loss) from Portfolio | |
| Net realized gain (loss): | |
| Investment transactions (net of foreign capital gains taxes of $346,973) | $ (6,873,680) |
| Written options | (2,041) |
| Futures contracts | (3,748,902) |
| Swap contracts | 468,679 |
| Foreign currency transactions | 388,647 |
| Forward foreign currency exchange contracts | 1,886,899 |
| Net realized loss | $ (7,880,398) |
| Change in unrealized appreciation (depreciation): | |
| Investments (including net increase in accrued foreign capital gains taxes of $40,000) | $ 26,784,480 |
| Futures contracts | (728,445) |
| Swap contracts | (2,227,316) |
| Foreign currency | 33,568 |
| Forward foreign currency exchange contracts | (1,343,720) |
| Net change in unrealized appreciation (depreciation) | $22,518,567 |
| Net realized and unrealized gain | $14,638,169 |
| Net increase in net assets from operations | $20,523,540 |
9
See Notes to Financial Statements.
Eaton Vance
Emerging and Frontier Countries Equity Fund
October 31, 2023
Statements of Changes in Net Assets
| | Year Ended October 31, |
| | 2023 | 2022 |
| Increase (Decrease) in Net Assets | | |
| From operations: | | |
| Net investment income | $ 5,885,371 | $ 3,945,419 |
| Net realized loss | (7,880,398) | (1,544,189) |
| Net change in unrealized appreciation (depreciation) | 22,518,567 | (36,582,070) |
| Net increase (decrease) in net assets from operations | $ 20,523,540 | $ (34,180,840) |
| Distributions to shareholders: | | |
| Class A | $ (150,490) | $ (30,411) |
| Class I | (10,163,031) | (5,228,045) |
| Total distributions to shareholders | $ (10,313,521) | $ (5,258,456) |
| Transactions in shares of beneficial interest: | | |
| Class A | $ 3,802,805 | $ 1,245,692 |
| Class I | 182,063,035 | 31,510,639 |
| Net increase in net assets from Fund share transactions | $185,865,840 | $ 32,756,331 |
| Net increase (decrease) in net assets | $196,075,859 | $ (6,682,965) |
| Net Assets | | |
| At beginning of year | $ 183,763,316 | $ 190,446,281 |
| At end of year | $379,839,175 | $183,763,316 |
10
See Notes to Financial Statements.
Eaton Vance
Emerging and Frontier Countries Equity Fund
October 31, 2023
| | Class A |
| | Year Ended October 31, |
| | 2023 | 2022 | 2021 | 2020 | 2019 |
| Net asset value — Beginning of year | $ 10.510 | $ 12.990 | $ 9.610 | $10.100 | $ 9.700 |
| Income (Loss) From Operations | | | | | |
| Net investment income(1) | $ 0.262 | $ 0.221 | $ 0.073 | $ 0.040 | $ 0.091 |
| Net realized and unrealized gain (loss) | 1.344 | (2.387) | 3.307 | (0.349) | 0.571 |
| Total income (loss) from operations | $ 1.606 | $ (2.166) | $ 3.380 | $ (0.309) | $ 0.662 |
| Less Distributions | | | | | |
| From net investment income | $ (0.586) | $ (0.096) | $ — | $ (0.181) | $ (0.262) |
| From net realized gain | — | (0.218) | — | — | — |
| Total distributions | $ (0.586) | $ (0.314) | $ — | $ (0.181) | $ (0.262) |
| Net asset value — End of year | $11.530 | $10.510 | $12.990 | $ 9.610 | $10.100 |
| Total Return(2) | 15.84% (3) | (17.13)% (3) | 35.17% | (3.20)% (3) | 7.05% (3) |
| Ratios/Supplemental Data | | | | | |
| Net assets, end of year (000’s omitted) | $ 6,276 | $ 2,340 | $ 1,387 | $ 1,572 | $ 2,328 |
| Ratios (as a percentage of average daily net assets):(4) | | | | | |
| Expenses | 1.40% (3)(5) | 1.56% (3)(5) | 1.64% | 1.65% (3) | 1.66% (3)(6) |
| Net investment income | 2.22% | 1.90% | 0.60% | 0.43% | 0.91% |
| Portfolio Turnover of the Portfolio | 69% | 67% | 70% | 44% | 43% |
| (1) | Computed using average shares outstanding. |
| (2) | Returns are historical and are calculated by determining the percentage change in net asset value with all distributions reinvested and do not reflect the effect of sales charges. |
| (3) | The investment adviser reimbursed certain operating expenses (equal to 0.15%, 0.09%, 0.08% and 0.07% of average daily net assets for the years ended October 31, 2023, 2022, 2020 and 2019, respectively). Absent this reimbursement, total return would be lower. |
| (4) | Includes the Fund’s share of the Portfolio’s allocated expenses. |
| (5) | Includes a reduction by the investment adviser of a portion of the Portfolio's adviser fee due to the Portfolio’s investment in the Liquidity Fund (equal to less than 0.005% of average daily net assets for the years ended October 31, 2023 and 2022). |
| (6) | Includes interest expense of 0.01% of average daily net assets for the year ended October 31, 2019. |
11
See Notes to Financial Statements.
Eaton Vance
Emerging and Frontier Countries Equity Fund
October 31, 2023
Financial Highlights — continued
| | Class I |
| | Year Ended October 31, |
| | 2023 | 2022 | 2021 | 2020 | 2019 |
| Net asset value — Beginning of year | $ 10.580 | $ 13.080 | $ 9.660 | $ 10.150 | $ 9.740 |
| Income (Loss) From Operations | | | | | |
| Net investment income(1) | $ 0.272 | $ 0.252 | $ 0.111 | $ 0.067 | $ 0.117 |
| Net realized and unrealized gain (loss) | 1.371 | (2.398) | 3.321 | (0.348) | 0.572 |
| Total income (loss) from operations | $ 1.643 | $ (2.146) | $ 3.432 | $ (0.281) | $ 0.689 |
| Less Distributions | | | | | |
| From net investment income | $ (0.603) | $ (0.136) | $ (0.012) | $ (0.209) | $ (0.279) |
| From net realized gain | — | (0.218) | — | — | — |
| Total distributions | $ (0.603) | $ (0.354) | $ (0.012) | $ (0.209) | $ (0.279) |
| Net asset value — End of year | $ 11.620 | $ 10.580 | $ 13.080 | $ 9.660 | $ 10.150 |
| Total Return(2) | 16.11% (3) | (16.91)% (3) | 35.54% | (2.93)% (3) | 7.31% (3) |
| Ratios/Supplemental Data | | | | | |
| Net assets, end of year (000’s omitted) | $373,563 | $181,423 | $189,060 | $143,908 | $176,468 |
| Ratios (as a percentage of average daily net assets):(4) | | | | | |
| Expenses | 1.15% (3)(5) | 1.31% (3)(5) | 1.39% | 1.40% (3) | 1.41% (3)(6) |
| Net investment income | 2.30% | 2.12% | 0.89% | 0.71% | 1.17% |
| Portfolio Turnover of the Portfolio | 69% | 67% | 70% | 44% | 43% |
| (1) | Computed using average shares outstanding. |
| (2) | Returns are historical and are calculated by determining the percentage change in net asset value with all distributions reinvested. |
| (3) | The investment adviser reimbursed certain operating expenses (equal to 0.15%, 0.09%, 0.08% and 0.07% of average daily net assets for the years ended October 31, 2023, 2022, 2020 and 2019, respectively). Absent this reimbursement, total return would be lower. |
| (4) | Includes the Fund’s share of the Portfolio’s allocated expenses. |
| (5) | Includes a reduction by the investment adviser of a portion of the Portfolio's adviser fee due to the Portfolio’s investment in the Liquidity Fund (equal to less than 0.005% of average daily net assets for the years ended October 31, 2023 and 2022). |
| (6) | Includes interest expense of 0.01% of average daily net assets for the year ended October 31, 2019. |
12
See Notes to Financial Statements.
Eaton Vance
Emerging and Frontier Countries Equity Fund
October 31, 2023
Notes to Financial Statements
1 Significant Accounting Policies
Eaton Vance Emerging and Frontier Countries Equity Fund (the Fund) is a diversified series of Eaton Vance Mutual Funds Trust (the Trust). The Trust is a Massachusetts business trust registered under the Investment Company Act of 1940, as amended (the 1940 Act), as an open-end management investment company. The Fund offers two classes of shares. Class A shares are generally sold subject to a sales charge imposed at time of purchase. Class I shares are sold at net asset value and are not subject to a sales charge. Each class represents a pro rata interest in the Fund, but votes separately on class-specific matters and (as noted below) is subject to different expenses. Realized and unrealized gains and losses and net investment income and losses, other than class-specific expenses, are allocated daily to each class of shares based on the relative net assets of each class to the total net assets of the Fund. Each class of shares differs in its distribution plan and certain other class-specific expenses. The Fund invests its assets in interests in Global Macro Capital Opportunities Portfolio (the Portfolio), a Massachusetts business trust, having the same investment objective and policies as the Fund. The value of the Fund’s investment in the Portfolio reflects the Fund’s proportionate interest in the net assets of the Portfolio (approximately 100% at October 31, 2023). The performance of the Fund is directly affected by the performance of the Portfolio. The financial statements of the Portfolio, including the portfolio of investments, are included elsewhere in this report and should be read in conjunction with the Fund’s financial statements.
The following is a summary of significant accounting policies of the Fund. The policies are in conformity with accounting principles generally accepted in the United States of America (U.S. GAAP). The Fund is an investment company and follows accounting and reporting guidance in the Financial Accounting Standards Board (FASB) Accounting Standards Codification Topic 946.
A Investment Valuation—Valuation of securities by the Portfolio is discussed in Note 1A of the Portfolio's Notes to Financial Statements, which are included elsewhere in this report.
B Income—The Fund's net investment income or loss consists of the Fund's pro rata share of the net investment income or loss of the Portfolio, less all actual and accrued expenses of the Fund.
C Federal and Other Taxes—The Fund’s policy is to comply with the provisions of the Internal Revenue Code applicable to regulated investment companies and to distribute to shareholders each year substantially all of its net investment income, and all or substantially all of its net realized capital gains. Accordingly, no provision for federal income or excise tax is necessary.
In addition to the requirements of the Internal Revenue Code, the Fund may also be required to recognize its pro rata share of the capital gains taxes incurred by the Portfolio. In doing so, the daily net asset value would reflect the Fund’s pro rata share of the estimated reserve for such taxes incurred by the Portfolio.
As of October 31, 2023, the Fund had no uncertain tax positions that would require financial statement recognition, de-recognition, or disclosure. The Fund files a U.S. federal income tax return annually after its fiscal year-end, which is subject to examination by the Internal Revenue Service for a period of three years from the date of filing.
D Expenses—The majority of expenses of the Trust are directly identifiable to an individual fund. Expenses which are not readily identifiable to a specific fund are allocated taking into consideration, among other things, the nature and type of expense and the relative size of the funds.
E Use of Estimates—The preparation of the financial statements in conformity with U.S. GAAP requires management to make estimates and assumptions that affect the reported amounts of assets and liabilities at the date of the financial statements and the reported amounts of income and expense during the reporting period. Actual results could differ from those estimates.
F Indemnifications—Under the Trust's organizational documents, its officers and Trustees may be indemnified against certain liabilities and expenses arising out of the performance of their duties to the Fund. Under Massachusetts law, if certain conditions prevail, shareholders of a Massachusetts business trust (such as the Fund) could be deemed to have personal liability for the obligations of the Trust. However, the Trust’s Declaration of Trust contains an express disclaimer of liability on the part of Fund shareholders and the By-laws provide that the Trust shall assume, upon request by the shareholder, the defense on behalf of any Fund shareholders. Moreover, the By-laws also provide for indemnification out of Fund property of any shareholder held personally liable solely by reason of being or having been a shareholder for all loss or expense arising from such liability. Additionally, in the normal course of business, the Fund enters into agreements with service providers that may contain indemnification clauses. The Fund’s maximum exposure under these arrangements is unknown as this would involve future claims that may be made against the Fund that have not yet occurred.
G Other—Investment transactions are accounted for on a trade date basis.
Eaton Vance
Emerging and Frontier Countries Equity Fund
October 31, 2023
Notes to Financial Statements — continued
2 Distributions to Shareholders and Income Tax Information
It is the present policy of the Fund to make at least one distribution annually (normally in December) of all or substantially all of its net investment income and to distribute annually all or substantially all of its net realized capital gains. Distributions to shareholders are recorded on the ex-dividend date. Distributions are declared separately for each class of shares. Shareholders may reinvest income and capital gain distributions in additional shares of the same class of the Fund at the net asset value as of the ex-dividend date or, at the election of the shareholder, receive distributions in cash. Distributions to shareholders are determined in accordance with income tax regulations, which may differ from U.S. GAAP. As required by U.S. GAAP, only distributions in excess of tax basis earnings and profits are reported in the financial statements as a return of capital. Permanent differences between book and tax accounting relating to distributions are reclassified to paid-in capital. For tax purposes, distributions from short-term capital gains are considered to be from ordinary income.
The tax character of distributions declared for the years ended October 31, 2023 and October 31, 2022 was as follows:
| | Year Ended October 31, |
| | 2023 | 2022 |
| Ordinary income | $10,313,521 | $2,016,467 |
| Long-term capital gains | $ — | $3,241,989 |
During the year ended October 31, 2023, distributable earnings was decreased by $1,629,690 and paid-in capital was increased by $1,629,690 due to the Fund’s use of equalization accounting. Tax equalization accounting allows the Fund to treat as a distribution that portion of redemption proceeds representing a redeeming shareholder’s portion of undistributed taxable income and net capital gains. These reclassifications had no effect on the net assets or net asset value per share of the Fund.
As of October 31, 2023, the components of distributable earnings (accumulated loss) on a tax basis were as follows:
| Undistributed ordinary income | $ 9,048,176 |
| Deferred capital losses | (15,528,009) |
| Net unrealized appreciation | 22,297,204 |
| Distributable earnings | $ 15,817,371 |
At October 31, 2023, the Fund, for federal income tax purposes, had deferred capital losses of $15,528,009 which would reduce its taxable income arising from future net realized gains on investment transactions, if any, to the extent permitted by the Internal Revenue Code, and thus would reduce the amount of distributions to shareholders, which would otherwise be necessary to relieve the Fund of any liability for federal income or excise tax. The deferred capital losses are treated as arising on the first day of the Fund’s next taxable year and retain the same short-term or long-term character as when originally deferred. Of the deferred capital losses at October 31, 2023, $15,528,009 are short-term.
3 Investment Adviser Fee and Other Transactions with Affiliates
The investment adviser fee is earned by Eaton Vance Management (EVM), an indirect, wholly-owned subsidiary of Morgan Stanley, as compensation for investment advisory services rendered to the Fund. The investment adviser fee is computed at an annual rate as a percentage of the Fund’s average daily net assets that are not invested in other investment companies for which EVM or its affiliates serve as investment adviser and receive an advisory fee as follows and is payable monthly:
| Average Daily Net Assets | Annual Fee Rate |
| Up to $500 million | 1.000% |
| $500 million but less than $1 billion | 0.950% |
| $1 billion but less than $2.5 billion | 0.925% |
| $2.5 billion but less than $5 billion | 0.900% |
| $5 billion and over | 0.880% |
For the year ended October 31, 2023, the Fund incurred no investment adviser fee on such assets. Pursuant to an investment sub-advisory agreement effective January 1, 2023, EVM has delegated a portion of the investment management of the Fund to Eaton Vance Advisers International Ltd. (EVAIL), an
Eaton Vance
Emerging and Frontier Countries Equity Fund
October 31, 2023
Notes to Financial Statements — continued
affiliate of EVM and an indirect, wholly-owned subsidiary of Morgan Stanley. EVM pays EVAIL a portion of its investment adviser fee for sub-advisory services provided to the Fund. To the extent the Fund’s assets are invested in the Portfolio, the Fund is allocated its share of the Portfolio’s investment adviser fee. The Portfolio has engaged Boston Management and Research (BMR) to render investment advisory services. See Note 2 of the Portfolio’s Notes to Financial Statements which are included elsewhere in this report. EVM also serves as the administrator of the Fund, but receives no compensation.
EVM has agreed to reimburse the Fund’s expenses to the extent that total annual operating expenses (relating to ordinary operating expenses only and excluding such expenses as brokerage commissions, acquired fund fees of unaffiliated funds, borrowing costs, taxes or litigation expenses) exceed 1.40% and 1.15% of the Fund’s average daily net assets for Class A and Class I, respectively. This agreement may be changed or terminated after February 29, 2024. Pursuant to this agreement, $376,395 of operating expenses were allocated to EVM for the year ended October 31, 2023.
EVM provides sub-transfer agency and related services to the Fund pursuant to a Sub-Transfer Agency Support Services Agreement. For the year ended October 31, 2023, EVM earned $6,518 from the Fund pursuant to such agreement, which is included in transfer and dividend disbursing agent fees on the Statement of Operations. The Fund was informed that Eaton Vance Distributors, Inc. (EVD), an affiliate of EVM and the Fund’s principal underwriter, received $989 as its portion of the sales charge on sales of Class A shares for the year ended October 31, 2023. EVD also received distribution and service fees from Class A shares (see Note 4).
Trustees and officers of the Fund who are members of EVM’s or BMR's organizations receive remuneration for their services to the Fund out of the investment adviser fee. Certain officers and Trustees of the Fund and the Portfolio are officers of the above organizations.
4 Distribution Plan
The Fund has in effect a distribution plan for Class A shares (Class A Plan) pursuant to Rule 12b-1 under the 1940 Act. Pursuant to the Class A Plan, the Fund pays EVD a distribution and service fee of 0.25% per annum of its average daily net assets attributable to Class A shares for distribution services and facilities provided to the Fund by EVD, as well as for personal services and/or the maintenance of shareholder accounts. Distribution and service fees paid or accrued to EVD for the year ended October 31, 2023 amounted to $10,648 for Class A shares.
Distribution and service fees are subject to the limitations contained in the Financial Industry Regulatory Authority Rule 2341(d).
5 Contingent Deferred Sales Charges
Class A shares may be subject to a 1% contingent deferred sales charge (CDSC) if redeemed within 12 months of purchase (depending on the circumstances of purchase). Generally, the CDSC is based upon the lower of the net asset value at date of redemption or date of purchase. No charge is levied on shares acquired by reinvestment of dividends or capital gain distributions. For the year ended October 31, 2023, the Fund was informed that EVD received no CDSCs paid by Class A shareholders.
6 Investment Transactions
For the year ended October 31, 2023, increases and decreases in the Fund's investment in the Portfolio aggregated $190,449,338 and $18,206,673, respectively.
7 Shares of Beneficial Interest
The Fund’s Declaration of Trust permits the Trustees to issue an unlimited number of full and fractional shares of beneficial interest (without par value). Such shares may be issued in a number of different series (such as the Fund) and classes. Transactions in Fund shares were as follows:
| | Year Ended
October 31, 2023 | | Year Ended
October 31, 2022 |
| | Shares | Amount | | Shares | Amount |
| Class A | | | | | |
| Sales | 392,007 | $ 4,637,046 | | 144,260 | $ 1,595,090 |
| Issued to shareholders electing to receive payments of distributions in Fund shares | 7,187 | 75,324 | | 2,259 | 29,187 |
| Redemptions | (77,602) | (909,565) | | (30,591) | (378,585) |
| Net increase | 321,592 | $ 3,802,805 | | 115,928 | $ 1,245,692 |
Eaton Vance
Emerging and Frontier Countries Equity Fund
October 31, 2023
Notes to Financial Statements — continued
| | Year Ended
October 31, 2023 | | Year Ended
October 31, 2022 |
| | Shares | Amount | | Shares | Amount |
| Class I | | | | | |
| Sales | 18,978,983 | $ 229,309,289 | | 4,906,903 | $ 57,594,274 |
| Issued to shareholders electing to receive payments of distributions in Fund shares | 964,078 | 10,161,384 | | 402,704 | 5,227,095 |
| Redemptions | (4,947,577) | (57,407,638) | | (2,618,985) | (31,310,730) |
| Net increase | 14,995,484 | $182,063,035 | | 2,690,622 | $ 31,510,639 |
At October 31, 2023, donor advised and pooled income funds (established and maintained by a public charity) managed by EVM owned in the aggregate 9.5% of the value of the outstanding shares of the Fund.
Eaton Vance
Emerging and Frontier Countries Equity Fund
October 31, 2023
Report of Independent Registered Public Accounting Firm
To the Trustees of Eaton Vance Mutual Funds Trust and Shareholders of Eaton Vance Emerging and Frontier Countries Equity Fund:
Opinion on the Financial Statements and Financial Highlights
We have audited the accompanying statement of assets and liabilities of Eaton Vance Emerging and Frontier Countries Equity Fund (the “Fund”) (one of the funds constituting Eaton Vance Mutual Funds Trust), as of October 31, 2023, the related statement of operations for the year then ended, the statements of changes in net assets for each of the two years in the period then ended, the financial highlights for each of the five years in the period then ended, and the related notes. In our opinion, the financial statements and financial highlights present fairly, in all material respects, the financial position of the Fund as of October 31, 2023, and the results of its operations for the year then ended, the changes in its net assets for each of the two years in the period then ended, and the financial highlights for each of the five years in the period then ended, in conformity with accounting principles generally accepted in the United States of America.
Basis for Opinion
These financial statements and financial highlights are the responsibility of the Fund's management. Our responsibility is to express an opinion on the Fund's financial statements and financial highlights based on our audits. We are a public accounting firm registered with the Public Company Accounting Oversight Board (United States) (PCAOB) and are required to be independent with respect to the Fund in accordance with the U.S. federal securities laws and the applicable rules and regulations of the Securities and Exchange Commission and the PCAOB.
We conducted our audits in accordance with the standards of the PCAOB. Those standards require that we plan and perform the audit to obtain reasonable assurance about whether the financial statements and financial highlights are free of material misstatement, whether due to error or fraud. The Fund is not required to have, nor were we engaged to perform, an audit of its internal control over financial reporting. As part of our audits, we are required to obtain an understanding of internal control over financial reporting but not for the purpose of expressing an opinion on the effectiveness of the Fund’s internal control over financial reporting. Accordingly, we express no such opinion.
Our audits included performing procedures to assess the risks of material misstatement of the financial statements and financial highlights, whether due to error or fraud, and performing procedures that respond to those risks. Such procedures included examining, on a test basis, evidence regarding the amounts and disclosures in the financial statements and financial highlights. Our audits also included evaluating the accounting principles used and significant estimates made by management, as well as evaluating the overall presentation of the financial statements and financial highlights. We believe that our audits provide a reasonable basis for our opinion.
/s/ Deloitte & Touche LLP
Boston, Massachusetts
December 19, 2023
We have served as the auditor of one or more Eaton Vance investment companies since 1959.
Eaton Vance
Emerging and Frontier Countries Equity Fund
October 31, 2023
Federal Tax Information (Unaudited)
The Form 1099-DIV you receive in February 2024 will show the tax status of all distributions paid to your account in calendar year 2023. Shareholders are advised to consult their own tax adviser with respect to the tax consequences of their investment in the Fund. As required by the Internal Revenue Code and/or regulations, shareholders must be notified regarding the status of qualified dividend income for individuals, the foreign tax credit and 163(j) interest dividends.
Qualified Dividend Income. For the fiscal year ended October 31, 2023, the Fund designates approximately $5,633,132, or up to the maximum amount of such dividends allowable pursuant to the Internal Revenue Code, as qualified dividend income eligible for the reduced tax rate of 15%.
Foreign Tax Credit. For the fiscal year ended October 31, 2023, the Fund paid foreign taxes of $567,575 and recognized foreign source income of $8,623,141.
163(j) Interest Dividends. For the fiscal year ended October 31, 2023, the Fund designates 0.87% of distributions from net investment income as a 163(j) interest dividend.
Global Macro Capital Opportunities Portfolio
October 31, 2023
| Security | Shares | Value |
| Belgium — 0.1% |
| Cenergy Holdings S.A. | | 60,106 | $ 404,299 |
| | | | $ 404,299 |
| Bulgaria — 0.2% |
| Eurohold Bulgaria AD(1) | | 978,120 | $ 899,482 |
| | | | $ 899,482 |
| China — 0.0%(2) |
| Ganfeng Lithium Group Co., Ltd., Class H(3) | | 2,800 | $ 10,057 |
| | | | $ 10,057 |
| Cyprus — 3.0% |
| Bank of Cyprus Holdings PLC(4) | | 45,800 | $ 141,568 |
| Bank of Cyprus Holdings PLC(4) | | 2,841,093 | 8,759,831 |
| Optima bank S.A.(1) | | 339,741 | 2,552,308 |
| | | | $ 11,453,707 |
| Georgia — 7.2% |
| Bank of Georgia Group PLC | | 206,490 | $ 8,360,204 |
| Georgia Capital PLC(1) | | 1,014,117 | 11,368,973 |
| TBC Bank Group PLC | | 227,322 | 7,429,109 |
| | | | $ 27,158,286 |
| Greece — 19.3% |
| Aegean Airlines S.A.(1) | | 74,253 | $ 812,719 |
| Alpha Services and Holdings S.A.(1) | | 4,593,637 | 6,876,365 |
| Athens Water Supply & Sewage Co. S.A. | | 87,668 | 520,945 |
| Autohellas Tourist & Trading S.A. | | 39,638 | 534,040 |
| Ellaktor S.A.(1) | | 179,472 | 353,790 |
| Eurobank Ergasias Services and Holdings S.A.(1) | | 5,488,394 | 8,970,910 |
| GEK Terna Holding Real Estate Construction S.A. | | 119,525 | 1,670,550 |
| Hellenic Telecommunications Organization S.A. | | 396,797 | 5,561,661 |
| Helleniq Energy Holdings S.A. | | 121,665 | 893,288 |
| Holding Co. ADMIE IPTO S.A. | | 239,157 | 506,844 |
| Ideal Holdings S.A.(1) | | 23,943 | 147,479 |
| JUMBO S.A. | | 243,322 | 6,401,937 |
| LAMDA Development S.A.(1) | | 144,089 | 927,660 |
| Motor Oil (Hellas) Corinth Refineries S.A. | | 139,914 | 3,332,414 |
| Mytilineos S.A. | | 221,742 | 8,214,299 |
| National Bank of Greece S.A.(1) | | 1,136,445 | 6,508,819 |
| OPAP S.A. | | 374,475 | 6,342,966 |
| Piraeus Financial Holdings S.A.(1) | | 2,058,570 | 6,101,898 |
| Security | Shares | Value |
| Greece (continued) |
| Public Power Corp. S.A.(1) | | 422,686 | $ 4,314,378 |
| Sarantis S.A. | | 62,205 | 516,797 |
| Terna Energy S.A. | | 109,639 | 1,645,224 |
| Titan Cement International S.A. | | 78,547 | 1,471,063 |
| | | | $ 72,626,046 |
| India — 7.8% |
| Adani Energy Solutions, Ltd.(1) | | 12,259 | $ 112,995 |
| Adani Green Energy, Ltd.(1) | | 14,178 | 154,523 |
| Affle India, Ltd.(1) | | 36,000 | 455,429 |
| Angel One, Ltd. | | 23,000 | 714,679 |
| Apollo Hospitals Enterprise, Ltd. | | 4,774 | 277,697 |
| Asian Paints, Ltd. | | 1,872 | 67,506 |
| Avenue Supermarts, Ltd.(1)(3) | | 7,154 | 312,277 |
| Bajaj Finance, Ltd. | | 24,417 | 2,198,796 |
| Bajaj Finserv, Ltd. | | 16,719 | 315,047 |
| Bharti Airtel, Ltd. | | 95,293 | 1,046,165 |
| Brightcom Group, Ltd.(1) | | 899,000 | 181,823 |
| Cholamandalam Investment & Finance Co., Ltd. | | 14,109 | 193,403 |
| Cipla, Ltd. | | 3,388 | 48,965 |
| Divi's Laboratories, Ltd. | | 6,252 | 254,934 |
| Dr. Reddy's Laboratories, Ltd. | | 739 | 47,667 |
| Easy Trip Planners, Ltd.(1) | | 321,000 | 152,895 |
| Eicher Motors, Ltd. | | 1,090 | 43,146 |
| FSN E-Commerce Ventures, Ltd.(1) | | 442,000 | 740,167 |
| GAIL (India), Ltd. | | 88,026 | 126,760 |
| Grasim Industries, Ltd. | | 11,746 | 266,507 |
| Happiest Minds Technologies, Ltd. | | 50,000 | 492,412 |
| Havells India, Ltd. | | 9,907 | 148,662 |
| HCL Technologies, Ltd. | | 4,848 | 74,332 |
| HDFC Bank, Ltd. | | 10,936 | 193,857 |
| HDFC Life Insurance Co., Ltd.(3) | | 6,699 | 49,970 |
| Hindalco Industries, Ltd. | | 57,847 | 319,683 |
| Hindustan Unilever, Ltd. | | 3,395 | 101,318 |
| ICICI Securities, Ltd.(3) | | 60,000 | 462,761 |
| IndiaMart InterMesh, Ltd.(3) | | 20,000 | 636,728 |
| Indian Energy Exchange, Ltd.(3) | | 362,000 | 547,895 |
| Indian Railway Catering & Tourism Corp., Ltd. | | 122,683 | 981,190 |
| Info Edge India, Ltd. | | 22,581 | 1,112,437 |
| Infosys, Ltd. | | 11,970 | 197,122 |
| Intellect Design Arena, Ltd. | | 52,000 | 425,968 |
| ITC, Ltd. | | 14,140 | 72,795 |
| Jindal Steel & Power, Ltd. | | 13,591 | 103,484 |
| Jio Financial Services, Ltd.(1) | | 162,358 | 425,401 |
| JSW Steel, Ltd. | | 31,961 | 282,505 |
| Jubilant FoodWorks, Ltd. | | 142,996 | 857,758 |
19
See Notes to Financial Statements.
Global Macro Capital Opportunities Portfolio
October 31, 2023
Portfolio of Investments — continued
| Security | Shares | Value |
| India (continued) |
| Larsen & Toubro, Ltd. | | 25,733 | $ 903,697 |
| LTIMindtree, Ltd.(3) | | 3,328 | 202,582 |
| Mahindra & Mahindra, Ltd. | | 36,818 | 647,634 |
| Maruti Suzuki India, Ltd. | | 596 | 74,410 |
| Mphasis, Ltd. | | 3,178 | 81,082 |
| Nazara Technologies, Ltd.(1) | | 23,000 | 224,086 |
| Nestle India, Ltd. | | 193 | 56,241 |
| NTPC, Ltd. | | 22,489 | 63,836 |
| One 97 Communications, Ltd.(1) | | 79,000 | 870,310 |
| PB Fintech, Ltd.(1) | | 91,000 | 764,962 |
| Petronet LNG, Ltd. | | 28,740 | 68,682 |
| PI Industries, Ltd. | | 2,863 | 116,646 |
| Power Grid Corp. of India, Ltd. | | 23,545 | 57,043 |
| Reliance Industries, Ltd. | | 163,358 | 4,494,142 |
| Route Mobile, Ltd. | | 19,000 | 354,117 |
| SBI Cards & Payment Services, Ltd. | | 9,055 | 81,515 |
| SBI Life Insurance Co., Ltd.(3) | | 2,822 | 46,420 |
| SRF, Ltd. | | 5,781 | 151,931 |
| Sun Pharmaceutical Industries, Ltd. | | 5,217 | 67,982 |
| Tanla Platforms, Ltd. | | 47,000 | 539,187 |
| Tata Consultancy Services, Ltd. | | 3,464 | 140,362 |
| Tata Consumer Products, Ltd. | | 26,081 | 282,059 |
| Tata Elxsi, Ltd. | | 1,296 | 119,071 |
| Tata Motors, Ltd. | | 11,778 | 89,080 |
| Tata Steel, Ltd. | | 327,127 | 467,396 |
| Tech Mahindra, Ltd. | | 3,441 | 46,888 |
| Titan Co., Ltd. | | 15,533 | 596,281 |
| Trent, Ltd. | | 6,864 | 178,107 |
| Tube Investments of India, Ltd. | | 4,113 | 155,806 |
| UltraTech Cement, Ltd. | | 4,517 | 458,102 |
| UPL, Ltd. | | 18,027 | 117,070 |
| Varun Beverages, Ltd. | | 17,020 | 187,079 |
| Wipro, Ltd. | | 7,963 | 36,661 |
| Zomato, Ltd.(1) | | 1,246,000 | 1,570,723 |
| | | | $ 29,508,849 |
| Indonesia — 3.7% |
| Adaro Energy Indonesia Tbk PT | | 2,449,800 | $ 395,273 |
| Astra International Tbk PT | | 3,027,700 | 1,101,415 |
| Bank Central Asia Tbk PT | | 5,995,400 | 3,302,989 |
| Bank Jago Tbk PT(1) | | 626,600 | 62,214 |
| Bank Mandiri Persero Tbk PT | | 4,386,800 | 1,567,193 |
| Bank Negara Indonesia Persero Tbk PT | | 2,419,400 | 730,142 |
| Bank Rakyat Indonesia Persero Tbk PT | | 7,475,184 | 2,337,370 |
| Barito Pacific Tbk PT | | 4,808,843 | 340,772 |
| Charoen Pokphand Indonesia Tbk PT(1) | | 1,315,900 | 480,552 |
| Security | Shares | Value |
| Indonesia (continued) |
| Kalbe Farma Tbk PT | | 3,818,800 | $ 406,147 |
| Merdeka Copper Gold Tbk PT(1) | | 2,079,800 | 291,704 |
| Sumber Alfaria Trijaya Tbk PT | | 2,968,200 | 540,203 |
| Telkom Indonesia Persero Tbk PT | | 6,925,700 | 1,518,222 |
| Unilever Indonesia Tbk PT | | 1,221,400 | 278,490 |
| United Tractors Tbk PT | | 284,400 | 450,065 |
| | | | $ 13,802,751 |
| Nigeria — 0.0%(2) |
| Airtel Africa PLC(3) | | 40,000 | $ 55,101 |
| | | | $ 55,101 |
| Philippines — 2.1% |
| Aboitiz Equity Ventures, Inc. | | 345,400 | $ 278,852 |
| Ayala Corp. | | 62,300 | 666,097 |
| Ayala Land, Inc. | | 1,379,700 | 678,883 |
| Bank of the Philippine Islands | | 416,200 | 737,907 |
| BDO Unibank, Inc. | | 477,200 | 1,074,164 |
| International Container Terminal Services, Inc. | | 210,600 | 746,161 |
| JG Summit Holdings, Inc. | | 542,300 | 351,757 |
| Jollibee Foods Corp. | | 92,300 | 333,646 |
| Manila Electric Co. | | 58,200 | 364,325 |
| Metropolitan Bank & Trust Co. | | 380,300 | 350,674 |
| PLDT, Inc. | | 15,700 | 335,478 |
| SM Investments Corp. | | 50,100 | 708,078 |
| SM Prime Holdings, Inc. | | 2,083,000 | 1,102,073 |
| Universal Robina Corp. | | 175,000 | 337,371 |
| | | | $ 8,065,466 |
| Poland — 6.3% |
| Alior Bank S.A.(1) | | 27,900 | $ 439,223 |
| Allegro.eu S.A.(1)(3) | | 78,300 | 561,668 |
| Asseco Poland S.A. | | 31,200 | 571,265 |
| Bank Millennium S.A.(1) | | 204,300 | 355,477 |
| Bank Polska Kasa Opieki S.A. | | 64,200 | 1,950,857 |
| Budimex S.A. | | 7,500 | 839,576 |
| CCC S.A.(1) | | 24,200 | 229,040 |
| CD Projekt S.A. | | 37,000 | 923,768 |
| Cyfrowy Polsat S.A.(1) | | 148,600 | 463,327 |
| Dino Polska S.A.(1)(3) | | 8,400 | 795,945 |
| Enea S.A.(1) | | 150,300 | 260,521 |
| Eurocash S.A. | | 48,400 | 161,013 |
| Grupa Azoty S.A.(1) | | 28,800 | 150,689 |
| Grupa Kety S.A. | | 5,700 | 961,496 |
| Jastrzebska Spolka Weglowa S.A.(1) | | 30,500 | 362,326 |
| KGHM Polska Miedz S.A. | | 81,700 | 2,180,187 |
20
See Notes to Financial Statements.
Global Macro Capital Opportunities Portfolio
October 31, 2023
Portfolio of Investments — continued
| Security | Shares | Value |
| Poland (continued) |
| KRUK S.A. | | 5,500 | $ 608,435 |
| LPP S.A. | | 700 | 2,255,022 |
| mBank S.A.(1) | | 5,000 | 618,116 |
| Orange Polska S.A. | | 374,400 | 694,472 |
| ORLEN S.A. | | 105,600 | 1,669,949 |
| PGE S.A.(1) | | 512,000 | 889,199 |
| Powszechna Kasa Oszczednosci Bank Polski S.A.(1) | | 163,200 | 1,690,550 |
| Powszechny Zaklad Ubezpieczen S.A. | | 202,500 | 2,291,465 |
| Santander Bank Polska S.A.(1) | | 6,500 | 705,945 |
| Tauron Polska Energia S.A.(1) | | 616,500 | 542,191 |
| Text S.A. | | 10,700 | 288,280 |
| Warsaw Stock Exchange | | 8,800 | 81,726 |
| XTB S.A.(3) | | 15,200 | 118,173 |
| | | | $ 23,659,901 |
| Saudi Arabia — 3.2% |
| Advanced Petrochemical Co. | | 48,600 | $ 483,867 |
| Al Hammadi Holding | | 35,300 | 508,377 |
| Almarai Co. JSC | | 17,800 | 265,228 |
| Arabian Contracting Services Co. | | 15,600 | 838,702 |
| Arabian Internet & Communications Services Co. | | 7,100 | 592,619 |
| Ataa Educational Co. | | 29,094 | 477,606 |
| Dallah Healthcare Co. | | 11,603 | 457,775 |
| Dr Sulaiman Al Habib Medical Services Group Co. | | 5,100 | 342,559 |
| Etihad Etisalat Co. | | 65,000 | 799,009 |
| Jarir Marketing Co. | | 121,000 | 467,001 |
| National Co. for Learning & Education | | 17,800 | 467,760 |
| SABIC Agri-Nutrients Co. | | 11,200 | 399,874 |
| Saudi Arabian Mining Co.(1) | | 57,900 | 554,751 |
| Saudi Arabian Oil Co.(3) | | 116,710 | 1,036,893 |
| Saudi Basic Industries Corp. | | 40,600 | 834,299 |
| Saudi Electricity Co. | | 49,600 | 235,488 |
| Saudi Industrial Investment Group | | 93,300 | 596,771 |
| Saudi Telecom Co. | | 68,400 | 700,697 |
| Savola Group (The) | | 80,200 | 778,378 |
| Theeb Rent A Car Co. | | 25,800 | 419,947 |
| United International Transportation Co. | | 33,200 | 595,562 |
| | | | $ 11,853,163 |
| Serbia — 0.3% |
| Metalac AD(1) | | 67,357 | $ 940,419 |
| | | | $ 940,419 |
| Slovenia — 1.9% |
| Nova Ljubljanska Banka dd(3) | | 72,121 | $ 5,711,221 |
| Security | Shares | Value |
| Slovenia (continued) |
| Nova Ljubljanska Banka dd GDR(5) | | 60,052 | $ 919,056 |
| Petrol DD Ljubljana | | 18,600 | 456,816 |
| | | | $ 7,087,093 |
| South Korea — 7.4% |
| AMOREPACIFIC Corp. | | 1,140 | $ 107,007 |
| Celltrion Healthcare Co., Ltd. | | 4,463 | 220,765 |
| Celltrion, Inc. | | 4,945 | 549,159 |
| CJ CheilJedang Corp. | | 339 | 71,019 |
| Cosmo AM&T Co., Ltd.(1) | | 900 | 93,701 |
| Coway Co., Ltd. | | 2,186 | 69,954 |
| DB Insurance Co., Ltd. | | 2,673 | 173,902 |
| Doosan Enerbility Co., Ltd.(1) | | 21,359 | 212,821 |
| Ecopro BM Co., Ltd. | | 2,248 | 328,876 |
| Hana Financial Group, Inc. | | 13,526 | 393,292 |
| Hanwha Aerospace Co., Ltd. | | 1,500 | 112,772 |
| Hanwha Galleria Corp.(1) | | 4,611 | 3,451 |
| Hanwha Solutions Corp.(1) | | 4,088 | 87,075 |
| HD Korea Shipbuilding & Offshore Engineering Co., Ltd.(1) | | 2,316 | 155,364 |
| HLB, Inc.(1) | | 4,453 | 95,944 |
| HMM Co., Ltd. | | 9,451 | 102,366 |
| HYBE Co., Ltd.(1) | | 432 | 70,357 |
| Hyundai Engineering & Construction Co., Ltd. | | 3,379 | 83,802 |
| Hyundai Glovis Co., Ltd. | | 762 | 96,706 |
| Hyundai Mobis Co., Ltd. | | 2,890 | 447,559 |
| Hyundai Motor Co. | | 5,831 | 734,613 |
| Hyundai Steel Co. | | 2,500 | 60,796 |
| Kakao Corp. | | 13,862 | 390,712 |
| KB Financial Group, Inc. | | 16,629 | 633,868 |
| Kia Corp. | | 11,114 | 634,959 |
| Korea Aerospace Industries, Ltd. | | 2,870 | 94,436 |
| Korea Electric Power Corp.(1) | | 9,138 | 114,380 |
| Korea Investment Holdings Co., Ltd. | | 1,239 | 46,318 |
| Korea Zinc Co., Ltd. | | 330 | 114,681 |
| Korean Air Lines Co., Ltd. | | 6,673 | 101,531 |
| Krafton, Inc.(1) | | 869 | 105,785 |
| KT&G Corp. | | 5,085 | 320,779 |
| L&F Co., Ltd. | | 839 | 81,612 |
| LG Chem, Ltd. | | 2,023 | 663,022 |
| LG Corp. | | 4,829 | 276,407 |
| LG Display Co., Ltd.(1) | | 9,346 | 84,569 |
| LG Electronics, Inc. | | 5,323 | 394,876 |
| LG Energy Solution, Ltd.(1) | | 1,583 | 453,796 |
| LG H&H Co., Ltd. | | 316 | 74,084 |
| LG Innotek Co., Ltd. | | 522 | 86,638 |
| Lotte Chemical Corp. | | 607 | 65,918 |
21
See Notes to Financial Statements.
Global Macro Capital Opportunities Portfolio
October 31, 2023
Portfolio of Investments — continued
| Security | Shares | Value |
| South Korea (continued) |
| Meritz Financial Group, Inc. | | 5,370 | $ 199,859 |
| Naver Corp. | | 6,088 | 851,121 |
| NCSoft Corp. | | 575 | 99,341 |
| Pearl Abyss Corp.(1) | | 890 | 32,606 |
| POSCO Chemical Co., Ltd. | | 1,555 | 274,027 |
| POSCO Holdings, Inc. | | 3,243 | 992,764 |
| Posco International Corp. | | 2,974 | 110,931 |
| Samsung Biologics Co., Ltd.(1)(3) | | 802 | 421,617 |
| Samsung C&T Corp. | | 4,209 | 332,787 |
| Samsung Electro-Mechanics Co., Ltd. | | 2,692 | 248,905 |
| Samsung Electronics Co., Ltd. | | 195,999 | 9,755,826 |
| Samsung Engineering Co., Ltd.(1) | | 8,539 | 150,497 |
| Samsung Fire & Marine Insurance Co., Ltd. | | 1,547 | 295,821 |
| Samsung Heavy Industries Co., Ltd.(1) | | 31,961 | 162,026 |
| Samsung Life Insurance Co., Ltd. | | 4,061 | 217,423 |
| Samsung SDI Co., Ltd. | | 2,388 | 756,124 |
| Samsung SDS Co., Ltd. | | 2,013 | 206,342 |
| Shinhan Financial Group Co., Ltd. | | 19,340 | 497,120 |
| SK Bioscience Co., Ltd.(1) | | 942 | 42,397 |
| SK Hynix, Inc. | | 26,391 | 2,291,850 |
| SK Innovation Co., Ltd.(1) | | 2,937 | 267,574 |
| SK Square Co., Ltd.(1) | | 3,831 | 121,052 |
| SK, Inc. | | 1,234 | 130,102 |
| S-Oil Corp. | | 1,757 | 86,712 |
| Woori Financial Group, Inc. | | 30,239 | 267,094 |
| Yuhan Corp. | | 2,980 | 127,032 |
| | | | $ 27,948,622 |
| Spain — 0.1% |
| AmRest Holdings SE(1) | | 46,500 | $ 294,937 |
| | | | $ 294,937 |
| Sri Lanka — 2.3% |
| Browns Investments PLC(1) | | 19,464,638 | $ 303,320 |
| Commercial Bank of Ceylon PLC(1) | | 4,535,356 | 1,136,504 |
| Dialog Axiata PLC(1) | | 11,855,734 | 340,402 |
| Expolanka Holdings PLC | | 2,214,372 | 862,260 |
| Hatton National Bank PLC(1) | | 1,859,171 | 928,991 |
| John Keells Holdings PLC | | 5,860,590 | 3,440,265 |
| LOLC Holdings PLC(1) | | 488,858 | 579,131 |
| Sampath Bank PLC | | 6,019,065 | 1,185,117 |
| | | | $ 8,775,990 |
| Taiwan — 2.3% |
| Taiwan Semiconductor Manufacturing Co., Ltd. | | 533,000 | $ 8,705,226 |
| | | | $ 8,705,226 |
| Security | Shares | Value |
| Turkey — 3.8% |
| Akbank T.A.S. | | 1,139,909 | $ 1,187,504 |
| Aselsan Elektronik Sanayi Ve Ticaret AS | | 412,502 | 602,407 |
| BIM Birlesik Magazalar AS | | 151,352 | 1,455,592 |
| Eregli Demir ve Celik Fabrikalari TAS(1) | | 444,378 | 594,897 |
| Ford Otomotiv Sanayi AS | | 23,111 | 642,180 |
| Haci Omer Sabanci Holding AS | | 358,830 | 678,629 |
| Hektas Ticaret TAS(1) | | 374,632 | 290,687 |
| KOC Holding AS | | 256,572 | 1,241,059 |
| Koza Altin Isletmeleri AS | | 328,999 | 255,454 |
| Pegasus Hava Tasimaciligi AS(1) | | 14,498 | 361,236 |
| Sasa Polyester Sanayi AS(1) | | 350,238 | 530,454 |
| Tofas Turk Otomobil Fabrikasi AS | | 38,195 | 324,743 |
| Turk Hava Yollari AO(1) | | 180,099 | 1,382,781 |
| Turkcell Iletisim Hizmetleri AS(1) | | 396,563 | 672,499 |
| Turkiye Is Bankasi AS, Class C | | 1,238,331 | 920,469 |
| Turkiye Petrol Rafinerileri AS | | 317,638 | 1,593,601 |
| Turkiye Sise ve Cam Fabrikalari AS | | 439,174 | 735,825 |
| Yapi ve Kredi Bankasi AS | | 1,247,407 | 761,308 |
| | | | $ 14,231,325 |
| United Arab Emirates — 8.0% |
| Abu Dhabi Commercial Bank PJSC | | 552,750 | $ 1,207,913 |
| Abu Dhabi Islamic Bank PJSC | | 329,659 | 923,750 |
| Abu Dhabi National Oil Co. for Distribution PJSC | | 470,000 | 429,988 |
| Agthia Group PJSC | | 1,296,034 | 1,571,483 |
| Air Arabia PJSC | | 2,257,172 | 1,610,863 |
| Al Ansari Financial Services PJSC(1) | | 1,805,311 | 564,998 |
| Al Waha Capital PJSC | | 4,117,465 | 2,131,484 |
| Al Yah Satellite Communications Co. PJSC (Yahsat) | | 2,242,854 | 1,551,145 |
| Aldar Properties PJSC | | 1,739,556 | 2,464,176 |
| Amanat Holdings PJSC | | 6,091,633 | 1,650,143 |
| Americana Restaurants International PLC | | 494,400 | 499,514 |
| Aramex PJSC | | 454,227 | 284,828 |
| Deyaar Development PJSC(1) | | 9,480,540 | 1,519,723 |
| Dubai Electricity & Water Authority PJSC | | 1,686,287 | 1,092,440 |
| Dubai Islamic Bank PJSC | | 584,077 | 858,704 |
| Emaar Properties PJSC | | 1,589,891 | 2,896,437 |
| Emirates Central Cooling Systems Corp. | | 3,502,706 | 1,706,314 |
| Emirates NBD Bank PJSC | | 100,660 | 464,674 |
| Emirates Telecommunications Group Co. PJSC | | 353,100 | 1,774,668 |
| First Abu Dhabi Bank PJSC | | 448,554 | 1,548,699 |
| Multiply Group PJSC(1) | | 345,100 | 319,772 |
| National Central Cooling Co. PJSC | | 689,840 | 657,451 |
| Q Holding PJSC(1) | | 227,300 | 190,672 |
22
See Notes to Financial Statements.
Global Macro Capital Opportunities Portfolio
October 31, 2023
Portfolio of Investments — continued
| Security | Shares | Value |
| United Arab Emirates (continued) |
| Ras Al Khaimah Ceramics | | 3,202,255 | $ 2,118,691 |
| Taaleem Holdings PJSC(1) | | 29,300 | 31,012 |
| | | | $ 30,069,542 |
| United Kingdom — 0.1% |
| Pepco Group N.V.(1)(5) | | 102,800 | $ 416,660 |
| | | | $ 416,660 |
| Vietnam — 5.7% |
| Digiworld Corp. | | 1,064,800 | $ 1,828,762 |
| Duc Giang Chemicals JSC | | 712,600 | 2,297,874 |
| FPT Corp. | | 1,838,970 | 6,430,313 |
| FPT Digital Retail JSC | | 663,860 | 2,359,157 |
| Gemadept Corp. | | 745,200 | 1,795,166 |
| Mobile World Investment Corp. | | 1,041,098 | 1,602,134 |
| Novaland Investment Group Corp.(1) | | 7,524 | 3,975 |
| Phat Dat Real Estate Development Corp.(1) | | 3,271 | 2,804 |
| Phu Nhuan Jewelry JSC | | 1,185,066 | 3,478,690 |
| Refrigeration Electrical Engineering Corp. | | 629,803 | 1,442,824 |
| | | | $ 21,241,699 |
Total Common Stocks
(identified cost $289,792,424) | | | $319,208,621 |
| Loan Participation Notes — 2.7% |
| Security | Principal
Amount
(000's omitted) | Value |
| Uzbekistan — 2.7% |
| Daryo Finance BV (borrower - Uzbek Industrial and Construction Bank ATB), 18.75%, 6/15/25(5)(6)(7) | UZS | 48,512,190 | $ 3,876,468 |
| Europe Asia Investment Finance BV (borrower - Joint Stock Commercial Bank "Asaka"), 18.70%, 7/21/26(5)(6)(7) | UZS | 81,043,560 | 6,175,859 |
Total Loan Participation Notes
(identified cost $10,780,060) | | | $ 10,052,327 |
| Security | Shares | Value |
| South Korea — 0.4% |
| Hanwha Galleria Co., Ltd.(1) | | 45 | $ 95 |
| Hanwha Solutions Corp.(1) | | 40 | 581 |
| Hyundai Motor Co., Ltd. | | 1,499 | 111,364 |
| Security | Shares | Value |
| South Korea (continued) |
| LG Chem, Ltd. | | 400 | $ 83,542 |
| Samsung Electronics Co., Ltd. | | 36,110 | 1,441,681 |
Total Preferred Stocks
(identified cost $1,614,418) | | | $ 1,637,263 |
| Security | Shares | Value |
| South Korea — 0.0%(2) |
| Cosmo AM&T Co., Ltd., Exp. 11/7/23(1) | | 47 | $ 578 |
Total Rights
(identified cost $0) | | | $ 578 |
| Sovereign Government Bonds — 0.1% |
| Security | Principal
Amount
(000's omitted) | Value |
| Greece — 0.1% |
| Hellenic Republic Government Bond, 0.00%, GDP-Linked, 10/15/42 | EUR | 79,360 | $ 264,073 |
Total Sovereign Government Bonds
(identified cost $335,579) | | | $ 264,073 |
| Short-Term Investments — 8.1% |
| Security | Shares | Value |
| Morgan Stanley Institutional Liquidity Funds - Government Portfolio, Institutional Class, 5.25%(8) | | 28,891,215 | $ 28,891,215 |
Total Affiliated Fund
(identified cost $28,891,215) | | | $ 28,891,215 |
| U.S. Treasury Obligations — 0.4% |
| Security | Principal
Amount
(000's omitted) | Value |
| U.S. Treasury Bills, 0.00%, 11/30/23(9) | $ | 1,500 | $ 1,493,615 |
Total U.S. Treasury Obligations
(identified cost $1,493,566) | | | $ 1,493,615 |
Total Short-Term Investments
(identified cost $30,384,781) | | | $ 30,384,830 |
23
See Notes to Financial Statements.
Global Macro Capital Opportunities Portfolio
October 31, 2023
Portfolio of Investments — continued
| | | Value |
Total Investments — 96.1%
(identified cost $332,907,262) | | | $361,547,692 |
| Other Assets, Less Liabilities — 3.9% | | | $ 14,862,366 |
| Net Assets — 100.0% | | | $376,410,058 |
| The percentage shown for each investment category in the Portfolio of Investments is based on net assets. |
| (1) | Non-income producing security. |
| (2) | Amount is less than 0.05%. |
| (3) | Security exempt from registration under Rule 144A of the Securities Act of 1933, as amended. These securities may be sold in certain transactions in reliance on an exemption from registration (normally to qualified institutional buyers). At October 31, 2023, the aggregate value of these securities is $10,969,308 or 2.9% of the Portfolio's net assets. |
| (4) | Securities are traded on separate exchanges for the same entity. |
| (5) | Security exempt from registration under Regulation S of the Securities Act of 1933, as amended, which exempts from registration securities offered and sold outside the United States. Security may not be offered or sold in the United States except pursuant to an exemption from, or in a transaction not subject to, the registration requirements of the Securities Act of 1933, as amended. At October 31, 2023, the aggregate value of these securities is $11,388,043 or 3.0% of the Portfolio's net assets. |
| (6) | For fair value measurement disclosure purposes, security is categorized as Level 3 (see Note 8). |
| (7) | Limited recourse note whose payments by the issuer are limited to amounts received by the issuer from the borrower pursuant to a loan agreement with the borrower. |
| (8) | May be deemed to be an affiliated investment company. The rate shown is the annualized seven-day yield as of October 31, 2023. |
| (9) | Security (or a portion thereof) has been pledged to cover collateral requirements on open derivative contracts. |
| Sector Classification of Portfolio |
| Sector | Percentage
of Net Assets | Value |
| Financials | 34.5% | $129,992,422 |
| Industrials | 10.5 | 39,522,327 |
| Consumer Discretionary | 9.8 | 37,050,392 |
| Information Technology | 9.7 | 36,320,976 |
| Communication Services | 5.5 | 20,799,013 |
| Materials | 4.5 | 17,026,431 |
| Energy | 3.8 | 14,288,593 |
| Utilities | 3.6 | 13,364,857 |
| Real Estate | 2.6 | 9,595,731 |
| Consumer Staples | 2.4 | 9,069,030 |
| Health Care | 1.0 | 3,869,017 |
| Government | 0.1 | 264,073 |
| Short-Term Investments | 8.1 | 30,384,830 |
| Total Investments | 96.1% | $361,547,692 |
| Forward Foreign Currency Exchange Contracts (Centrally Cleared) |
| Currency Purchased | Currency Sold | Settlement
Date | Value/Unrealized
Appreciation
(Depreciation) |
| EUR | 1,296,988 | USD | 1,388,841 | 12/20/23 | $ (13,438) |
| EUR | 19,062,884 | USD | 20,412,917 | 12/20/23 | (197,517) |
| INR | 971,000,000 | USD | 11,702,687 | 12/20/23 | (59,255) |
| INR | 980,000,000 | USD | 11,810,658 | 12/20/23 | (59,306) |
| KRW | 15,124,000,000 | USD | 11,408,657 | 12/20/23 | (200,203) |
| KRW | 18,376,000,000 | USD | 13,867,109 | 12/20/23 | (248,586) |
| USD | 7,326,391 | EUR | 6,841,851 | 12/20/23 | 70,891 |
| USD | 4,441,849 | EUR | 4,148,082 | 12/20/23 | 42,980 |
| USD | 3,832,413 | EUR | 3,578,952 | 12/20/23 | 37,083 |
| USD | 2,299,163 | EUR | 2,147,105 | 12/20/23 | 22,247 |
| USD | 2,263,434 | EUR | 2,113,739 | 12/20/23 | 21,901 |
| USD | 1,659,771 | EUR | 1,550,000 | 12/20/23 | 16,060 |
| USD | 22,900,292 | EUR | 21,700,000 | 12/20/23 | (111,661) |
| | | | | | $ (678,804) |
24
See Notes to Financial Statements.
Global Macro Capital Opportunities Portfolio
October 31, 2023
Portfolio of Investments — continued
| Forward Foreign Currency Exchange Contracts (OTC) |
| Currency Purchased | Currency Sold | Counterparty | Settlement
Date | Unrealized
Appreciation | Unrealized
(Depreciation) |
| USD | 23,639,464 | CNH | 168,000,000 | BNP Paribas | 11/24/23 | $ 720,769 | $ — |
| USD | 22,319,552 | CNH | 155,348,700 | HSBC Bank USA, N.A. | 11/24/23 | 1,126,756 | — |
| USD | 15,175,804 | EUR | 14,250,000 | HSBC Bank USA, N.A. | 12/20/23 | 64,268 | — |
| | | | | | | $1,911,793 | $ — |
| Futures Contracts |
| Description | Number of
Contracts | Position | Expiration
Date | Notional
Amount | Value/Unrealized
Appreciation
(Depreciation) |
| Equity Futures | | | | | |
| MSCI Emerging Markets Index | 240 | Long | 12/15/23 | $11,030,400 | $ (729,771) |
| | | | | | $(729,771) |
| Total Return Swaps (OTC) |
| Counterparty | Notional Amount
(000's omitted) | Portfolio Receives | Portfolio Pays | Termination
Date | Value/Unrealized
Appreciation
(Depreciation) |
| Citibank, N.A. | KRW | 103,250 | Positive Return on KOSPI 200 Index Futures 12/2023 (pays upon termination) | Negative Return on KOSPI 200 Index Futures 12/2023 (pays upon termination) | 12/14/23 | $ (2,227,335) |
| | | | | | | $(2,227,335) |
| Abbreviations: |
| GDP | – Gross Domestic Product |
| GDR | – Global Depositary Receipt |
| OTC | – Over-the-counter |
| Currency Abbreviations: |
| CNH | – Yuan Renminbi Offshore |
| EUR | – Euro |
| INR | – Indian Rupee |
| KRW | – South Korean Won |
| USD | – United States Dollar |
| UZS | – Uzbekistani Som |
25
See Notes to Financial Statements.
Global Macro Capital Opportunities Portfolio
October 31, 2023
Statement of Assets and Liabilities
| | October 31, 2023 |
| Assets | |
| Unaffiliated investments, at value (identified cost $304,016,047) | $ 332,656,477 |
| Affiliated investments, at value (identified cost $28,891,215) | 28,891,215 |
| Cash | 94,390 |
| Deposits for derivatives collateral: | |
| Futures contracts | 319,754 |
| Centrally cleared derivatives | 2,962,242 |
| OTC derivatives | 2,986,310 |
| Foreign currency, at value (identified cost $3,462,469) | 3,454,161 |
| Interest and dividends receivable | 749,802 |
| Dividends receivable from affiliated investments | 74,038 |
| Receivable for investments sold | 5,451,889 |
| Receivable for variation margin on open futures contracts | 484,160 |
| Receivable for open forward foreign currency exchange contracts | 1,911,793 |
| Tax reclaims receivable | 12,723 |
| Receivable from affiliates | 106,333 |
| Trustees' deferred compensation plan | 10,628 |
| Other assets | 307,980 |
| Total assets | $380,473,895 |
| Liabilities | |
| Cash collateral due to brokers | $ 710,000 |
| Payable for investments purchased | 435,453 |
| Payable for variation margin on open centrally cleared derivatives | 27,970 |
| Payable for open swap contracts | 2,227,335 |
| Payable to affiliates: | |
| Investment adviser fee | 311,855 |
| Trustees' fees | 1,462 |
| Trustees' deferred compensation plan | 10,628 |
| Accrued foreign capital gains taxes | 50,898 |
| Accrued expenses | 288,236 |
| Total liabilities | $ 4,063,837 |
| Net Assets applicable to investors' interest in Portfolio | $376,410,058 |
26
See Notes to Financial Statements.
Global Macro Capital Opportunities Portfolio
October 31, 2023
| | Year Ended |
| | October 31, 2023 |
| Investment Income | |
| Dividend income (net of foreign taxes withheld of $589,830) | $ 7,357,741 |
| Dividend income from affiliated investments | 386,696 |
| Interest income (net of foreign taxes withheld of $36) | 1,080,994 |
| Total investment income | $ 8,825,431 |
| Expenses | |
| Investment adviser fee | $ 2,549,271 |
| Trustees’ fees and expenses | 15,306 |
| Custodian fee | 392,142 |
| Legal and accounting services | 80,058 |
| Miscellaneous | 30,403 |
| Total expenses | $ 3,067,180 |
| Deduct: | |
| Waiver and/or reimbursement of expenses by affiliates | $ 137,801 |
| Total expense reductions | $ 137,801 |
| Net expenses | $ 2,929,379 |
| Net investment income | $ 5,896,052 |
| Realized and Unrealized Gain (Loss) | |
| Net realized gain (loss): | |
| Investment transactions (net of foreign capital gains taxes of $346,976) | $ (6,873,724) |
| Written options | (2,041) |
| Futures contracts | (3,748,918) |
| Swap contracts | 468,682 |
| Foreign currency transactions | 388,649 |
| Forward foreign currency exchange contracts | 1,886,910 |
| Net realized loss | $ (7,880,442) |
| Change in unrealized appreciation (depreciation): | |
| Investments (including net increase in accrued foreign capital gains taxes of $40,000) | $ 26,784,711 |
| Futures contracts | (728,448) |
| Swap contracts | (2,227,335) |
| Foreign currency | 33,568 |
| Forward foreign currency exchange contracts | (1,343,729) |
| Net change in unrealized appreciation (depreciation) | $22,518,767 |
| Net realized and unrealized gain | $14,638,325 |
| Net increase in net assets from operations | $20,534,377 |
27
See Notes to Financial Statements.
Global Macro Capital Opportunities Portfolio
October 31, 2023
Statements of Changes in Net Assets
| | Year Ended October 31, |
| | 2023 | 2022 |
| Increase (Decrease) in Net Assets | | |
| From operations: | | |
| Net investment income | $ 5,896,052 | $ 4,053,926 |
| Net realized loss | (7,880,442) | (1,544,196) |
| Net change in unrealized appreciation (depreciation) | 22,518,767 | (36,582,335) |
| Net increase (decrease) in net assets from operations | $ 20,534,377 | $ (34,072,605) |
| Capital transactions: | | |
| Contributions | $ 190,449,338 | $ 40,153,386 |
| Withdrawals | (18,206,673) | (12,951,136) |
| Net increase in net assets from capital transactions | $172,242,665 | $ 27,202,250 |
| Net increase (decrease) in net assets | $192,777,042 | $ (6,870,355) |
| Net Assets | | |
| At beginning of year | $ 183,633,016 | $ 190,503,371 |
| At end of year | $376,410,058 | $183,633,016 |
28
See Notes to Financial Statements.
Global Macro Capital Opportunities Portfolio
October 31, 2023
| | Year Ended
October 31, |
| | 2023 | 2022 | 2021 | 2020 | 2019 |
| Ratios/Supplemental Data | | | | | |
| Ratios (as a percentage of average daily net assets): | | | | | |
| Expenses | 1.15% (1)(2) | 1.26% (1) | 1.24% | 1.28% | 1.29% (3) |
| Net investment income | 2.30% | 2.17% | 1.04% | 0.84% | 1.29% |
| Portfolio Turnover | 69% | 67% | 70% | 44% | 43% |
| Total Return | 16.11% (2) | (16.87)% | 35.70% | (2.84)% | 7.44% |
| Net assets, end of year (000’s omitted) | $376,410 | $183,633 | $190,503 | $145,694 | $179,334 |
| (1) | Includes a reduction by the investment adviser of a portion of its adviser fee due to the Portfolio’s investment in the Liquidity Fund (equal to less than 0.005% of average daily net assets for the years ended October 31, 2023 and 2022). |
| (2) | The investment adviser reimbursed certain operating expenses (equal to 0.05% of average daily net assets for the year ended October 31, 2023). Absent this reimbursement, total return would be lower. |
| (3) | Includes interest expense of 0.01% of average daily net assets for the year ended October 31, 2019. |
29
See Notes to Financial Statements.
Global Macro Capital Opportunities Portfolio
October 31, 2023
Notes to Financial Statements
1 Significant Accounting Policies
Global Macro Capital Opportunities Portfolio (the Portfolio) is a Massachusetts business trust registered under the Investment Company Act of 1940, as amended (the 1940 Act), as a diversified, open-end management investment company. The Portfolio’s investment objective is total return. The Declaration of Trust permits the Trustees to issue interests in the Portfolio. At October 31, 2023, Eaton Vance Emerging and Frontier Countries Equity Fund held an interest of approximately 100% in the Portfolio.
The following is a summary of significant accounting policies of the Portfolio. The policies are in conformity with accounting principles generally accepted in the United States of America (U.S. GAAP). The Portfolio is an investment company and follows accounting and reporting guidance in the Financial Accounting Standards Board (FASB) Accounting Standards Codification Topic 946.
A Investment Valuation—The following methodologies are used to determine the market value or fair value of investments.
Equity Securities. Equity securities listed on a U.S. securities exchange generally are valued at the last sale or closing price on the day of valuation or, if no sales took place on such date, at the mean between the closing bid and ask prices on the exchange where such securities are principally traded. Equity securities listed on the NASDAQ National Market System are valued at the NASDAQ official closing price. Unlisted or listed securities for which closing sales prices or closing quotations are not available are valued at the mean between the latest available bid and ask prices or, in the case of preferred equity securities that are not listed or traded in the over-the-counter market, by a third party pricing service that uses various techniques that consider factors including, but not limited to, prices or yields of securities with similar characteristics, benchmark yields, broker/dealer quotes, quotes of underlying common stock, issuer spreads, as well as industry and economic events.
Debt Obligations. Debt obligations are generally valued on the basis of valuations provided by third party pricing services, as derived from such services’ pricing models. Inputs to the models may include, but are not limited to, reported trades, executable bid and ask prices, broker/dealer quotations, prices or yields of securities with similar characteristics, interest rates, anticipated prepayments, benchmark curves or information pertaining to the issuer, as well as industry and economic events. The pricing services may use a matrix approach, which considers information regarding securities with similar characteristics to determine the valuation for a security. Short-term debt obligations purchased with a remaining maturity of sixty days or less for which a valuation from a third party pricing service is not readily available may be valued at amortized cost, which approximates fair value.
Derivatives. Futures contracts are valued at the closing settlement price established by the board of trade or exchange on which they are traded, with adjustments for fair valuation for certain foreign futures contracts as described below. Forward foreign currency exchange contracts are generally valued at the mean of the average bid and average ask prices that are reported by currency dealers to a third party pricing service at the valuation time. Such third party pricing service valuations are supplied for specific settlement periods and the Portfolio’s forward foreign currency exchange contracts are valued at an interpolated rate between the closest preceding and subsequent settlement period reported by the third party pricing service. Total return swaps are valued using valuations provided by a third party pricing service based on the value of the underlying index or instrument and reference interest rate. Future cash flows on swaps are discounted to their present value using swap rates provided by electronic data services or by broker/dealers.
Foreign Securities, Futures Contracts and Currencies. Foreign securities, futures contracts and currencies are valued in U.S. dollars, based on foreign currency exchange rate quotations supplied by a third party pricing service. The pricing service uses a proprietary model to determine the exchange rate. Inputs to the model include reported trades and implied bid/ask spreads. The daily valuation of exchange-traded foreign securities and certain exchange-traded foreign futures contracts generally is determined as of the close of trading on the principal exchange on which such securities and contracts trade. Foreign ownership of shares of certain Indian companies may be subject to limitations. When foreign ownership of such an Indian company’s shares approaches the limitation, foreign investors may be willing to pay a premium to the local share price to acquire shares from other foreign investors. Such shares are valued at the closing price for foreign investors as provided by the exchange on which they trade. Events occurring after the close of trading on foreign exchanges may result in adjustments to the valuation of foreign securities and certain foreign futures contracts to more accurately reflect their fair value as of the close of regular trading on the New York Stock Exchange. When valuing foreign equity securities and foreign futures contracts that meet certain criteria, the Portfolio’s Trustees have approved the use of a fair value service that values such securities and foreign futures contracts to reflect market trading that occurs after the close of the applicable foreign markets of comparable securities or other instruments that have a strong correlation to the fair-valued securities and foreign futures contracts.
Other. Investments in management investment companies (including money market funds) that do not trade on an exchange are valued at the net asset value as of the close of each business day.
Fair Valuation. In connection with Rule 2a-5 of the 1940 Act, the Trustees have designated the Portfolio’s investment adviser as its valuation designee. Investments for which valuations or market quotations are not readily available or are deemed unreliable are valued by the investment adviser, as valuation designee, at fair value using methods that most fairly reflect the security’s “fair value”, which is the amount that the Portfolio might reasonably expect to receive for the security upon its current sale in the ordinary course. Each such determination is based on a consideration of relevant factors, which are likely to vary from one pricing context to another. These factors may include, but are not limited to, the type of security, the existence of any contractual restrictions on the security’s disposition, the price and extent of public trading in similar securities of the issuer or of comparable companies or entities, quotations or relevant information obtained from broker/dealers or other market participants, information obtained from the issuer, analysts, and/or the appropriate stock exchange (for exchange-traded securities), an analysis of the company’s or entity’s financial statements, and an evaluation of the forces that influence the issuer and the market(s) in which the security is purchased and sold.
Global Macro Capital Opportunities Portfolio
October 31, 2023
Notes to Financial Statements — continued
B Investment Transactions—Investment transactions for financial statement purposes are accounted for on a trade date basis. Realized gains and losses on investments sold are determined on the basis of identified cost.
C Income—Dividend income is recorded on the ex-dividend date for dividends received in cash and/or securities. However, if the ex-dividend date has passed, certain dividends from foreign securities are recorded as the Portfolio is informed of the ex-dividend date. Withholding taxes on foreign dividends, interest and capital gains have been provided for in accordance with the Portfolio's understanding of the applicable countries’ tax rules and rates. Interest income is recorded on the basis of interest accrued, adjusted for amortization of premium or accretion of discount.
D Federal and Other Taxes—The Portfolio has elected to be treated as a partnership for federal tax purposes. No provision is made by the Portfolio for federal or state taxes on any taxable income of the Portfolio because each investor in the Portfolio is ultimately responsible for the payment of any taxes on its share of taxable income. Since at least one of the Portfolio’s investors is a regulated investment company that invests all or substantially all of its assets in the Portfolio, the Portfolio normally must satisfy the applicable source of income and diversification requirements (under the Internal Revenue Code) in order for its investors to satisfy them. The Portfolio will allocate, at least annually among its investors, each investor’s distributive share of the Portfolio’s net investment income, net realized capital gains and losses and any other items of income, gain, loss, deduction or credit.
In addition to the requirements of the Internal Revenue Code, the Portfolio may also be subject to local taxes on the recognition of capital gains in India. In determining the daily net asset value, the Portfolio estimates the accrual for such taxes, if any, based on the unrealized appreciation on certain portfolio securities, the holding period of such securities, the related tax rates, and the availability of any realized losses in excess of gains that may be carried forward to offset future gains. Taxes attributable to unrealized appreciation are included in the change in unrealized appreciation (depreciation) on investments. Capital gains taxes on certain Indian securities sold at a gain are included in net realized gain (loss) on investments.
As of October 31, 2023, the Portfolio had no uncertain tax positions that would require financial statement recognition, de-recognition, or disclosure. The Portfolio files a U.S. federal income tax return annually after its fiscal year-end, which is subject to examination by the Internal Revenue Service for a period of three years from the date of filing.
E Foreign Currency Translation—Investment valuations, other assets, and liabilities initially expressed in foreign currencies are translated each business day into U.S. dollars based upon current exchange rates. Purchases and sales of foreign investment securities and income and expenses denominated in foreign currencies are translated into U.S. dollars based upon currency exchange rates in effect on the respective dates of such transactions. Recognized gains or losses on investment transactions attributable to changes in foreign currency exchange rates are recorded for financial statement purposes as net realized gains and losses on investments. That portion of unrealized gains and losses on investments that results from fluctuations in foreign currency exchange rates is not separately disclosed.
F Use of Estimates—The preparation of the financial statements in conformity with U.S. GAAP requires management to make estimates and assumptions that affect the reported amounts of assets and liabilities at the date of the financial statements and the reported amounts of income and expense during the reporting period. Actual results could differ from those estimates.
G Indemnifications—Under the Portfolio’s organizational documents, its officers and Trustees may be indemnified against certain liabilities and expenses arising out of the performance of their duties to the Portfolio. Under Massachusetts law, if certain conditions prevail, interestholders in the Portfolio could be deemed to have personal liability for the obligations of the Portfolio. However, the Portfolio’s Declaration of Trust contains an express disclaimer of liability on the part of Portfolio interestholders. Additionally, in the normal course of business, the Portfolio enters into agreements with service providers that may contain indemnification clauses. The Portfolio’s maximum exposure under these arrangements is unknown as this would involve future claims that may be made against the Portfolio that have not yet occurred.
H Futures Contracts—Upon entering into a futures contract, the Portfolio is required to deposit with the broker, either in cash or securities, an amount equal to a certain percentage of the contract amount (initial margin). Subsequent payments, known as variation margin, are made or received by the Portfolio each business day, depending on the daily fluctuations in the value of the underlying security or index, and are recorded as unrealized gains or losses by the Portfolio. Gains (losses) are realized upon the expiration or closing of the futures contracts. Should market conditions change unexpectedly, the Portfolio may not achieve the anticipated benefits of the futures contracts and may realize a loss. Futures contracts have minimal counterparty risk as they are exchange traded and the clearinghouse for the exchange is substituted as the counterparty, guaranteeing counterparty performance.
I Forward Foreign Currency Exchange Contracts—The Portfolio may enter into forward foreign currency exchange contracts for the purchase or sale of a specific foreign currency at a fixed price on a future date. The forward foreign currency exchange contracts are adjusted by the daily exchange rate of the underlying currency and any gains or losses are recorded as unrealized until such time as the contracts have been closed. While forward foreign currency exchange contracts are privately negotiated agreements between the Portfolio and a counterparty, certain contracts may be “centrally cleared”, whereby all payments made or received by the Portfolio pursuant to the contract are with a central clearing party (CCP) rather than the original counterparty. The CCP guarantees the performance of the original parties to the contract. Upon entering into centrally cleared contracts, the Portfolio is required to deposit with the CCP, either in cash or securities, an amount of initial margin determined by the CCP, which is subject to adjustment. For centrally cleared contracts, the daily change in valuation is recorded as a receivable or payable for variation margin and settled in cash with the CCP daily. Risks may arise upon entering these contracts from the potential inability of counterparties to meet the terms of their contracts and from movements in the value of a foreign currency relative to the U.S. dollar. In the case of centrally cleared contracts, counterparty risk is minimal due to protections provided by the CCP.
Global Macro Capital Opportunities Portfolio
October 31, 2023
Notes to Financial Statements — continued
J Purchased Options—Upon the purchase of a call or put option, the premium paid by the Portfolio is included in the Statement of Assets and Liabilities as an investment. The amount of the investment is subsequently marked-to-market to reflect the current market value of the option purchased, in accordance with the Portfolio’s policies on investment valuations discussed above. Premiums paid for purchasing options that expire are treated as realized losses. Premiums paid for purchasing options that are exercised or closed are added to the amounts paid or offset against the proceeds on the underlying investment transaction to determine the realized gain or loss. The risk associated with purchasing options is limited to the premium originally paid. Purchased options traded over-the-counter involve risk that the issuer or counterparty will fail to perform its contractual obligations.
K Written Options—Upon the writing of a call or a put option, the premium received by the Portfolio is included in the Statement of Assets and Liabilities as a liability. The amount of the liability is subsequently marked-to-market to reflect the current market value of the option written, in accordance with the Portfolio’s policies on investment valuations discussed above. Premiums received from writing options that expire are treated as realized gains. Premiums received from writing options that are exercised or are closed are added to or offset against the proceeds or amount paid on the transaction to determine the realized gain or loss. The Portfolio, as a writer of an option, may have no control over whether the underlying instrument may be sold (call) or purchased (put) and, as a result, bears the market risk of an unfavorable change in the price of the instrument underlying the written option. The Portfolio may also bear the risk of not being able to enter into a closing transaction if a liquid secondary market does not exist.
L Total Return Swaps—In a total return swap, the buyer receives a periodic return equal to the total return of a specified security, securities or index for a specified period of time. In return, the buyer pays the counterparty a fixed or variable stream of payments, typically based upon short-term interest rates, possibly plus or minus an agreed upon spread. During the term of the outstanding swap agreement, changes in the underlying value of the swap are recorded as unrealized gains and losses. Periodic payments received or made are recorded as realized gains or losses. The Portfolio is exposed to credit loss in the event of nonperformance by the swap counterparty. Risk may also arise from the unanticipated movements in value of exchange rates, interest rates, securities, or the index.
2 Investment Adviser Fee and Other Transactions with Affiliates
The investment adviser fee is earned by Boston Management and Research (BMR), an indirect, wholly-owned subsidiary of Morgan Stanley, as compensation for investment advisory services rendered to the Portfolio. The investment adviser fee is computed at an annual rate as a percentage of the Portfolio’s average daily net assets as follows and is payable monthly:
| Average Daily Net Assets | Annual Fee Rate |
| Up to $500 million | 1.000% |
| $500 million but less than $1 billion | 0.950% |
| $1 billion but less than $2.5 billion | 0.925% |
| $2.5 billion but less than $5 billion | 0.900% |
| $5 billion and over | 0.880% |
For the year ended October 31, 2023, the Portfolio’s investment adviser fee amounted to $2,549,271 or 1.00% of the Portfolio’s average daily net assets. Pursuant to an expense reimbursement, BMR was allocated $125,974 of the Portfolio’s operating expenses for the year ended October 31, 2023. Pursuant to an investment sub-advisory agreement effective January 1, 2023, BMR has delegated a portion of the investment management of the Portfolio to Eaton Vance Advisers International Ltd. (EVAIL), an affiliate of BMR and an indirect, wholly-owned subsidiary of Morgan Stanley. BMR pays EVAIL a portion of its investment adviser fee for sub-advisory services provided to the Portfolio.
The Portfolio may invest in a money market fund, the Institutional Class of the Morgan Stanley Institutional Liquidity Funds - Government Portfolio (the “Liquidity Fund”), an open-end management investment company managed by Morgan Stanley Investment Management Inc., a wholly-owned subsidiary of Morgan Stanley. The investment adviser fee paid by the Portfolio is reduced by an amount equal to its pro rata share of the advisory and administration fees paid by the Portfolio due to its investment in the Liquidity Fund. For the year ended October 31, 2023, the investment adviser fee paid was reduced by $11,827 relating to the Portfolio’s investment in the Liquidity Fund.
Trustees and officers of the Portfolio who are members of BMR’s organization receive remuneration for their services to the Portfolio out of the investment adviser fee. Trustees of the Portfolio who are not affiliated with the investment adviser may elect to defer receipt of all or a percentage of their annual fees in accordance with the terms of the Trustees Deferred Compensation Plan. Certain officers and Trustees of the Portfolio are officers of the above organization.
3 Purchases and Sales of Investments
Purchases and sales of investments, other than short-term obligations, aggregated $301,467,725 and $164,592,011, respectively, for the year ended October 31, 2023.
Global Macro Capital Opportunities Portfolio
October 31, 2023
Notes to Financial Statements — continued
4 Federal Income Tax Basis of Investments
The cost and unrealized appreciation (depreciation) of investments, including open derivative contracts, of the Portfolio at October 31, 2023, as determined on a federal income tax basis, were as follows:
| Aggregate cost | $ 339,004,767 |
| Gross unrealized appreciation | $ 38,593,994 |
| Gross unrealized depreciation | (18,278,404) |
| Net unrealized appreciation | $ 20,315,590 |
5 Financial Instruments
The Portfolio may trade in financial instruments with off-balance sheet risk in the normal course of its investing activities. These financial instruments may include written options, forward foreign currency exchange contracts, futures contracts and swap contracts and may involve, to a varying degree, elements of risk in excess of the amounts recognized for financial statement purposes. The notional or contractual amounts of these instruments represent the investment the Portfolio has in particular classes of financial instruments and do not necessarily represent the amounts potentially subject to risk. The measurement of the risks associated with these instruments is meaningful only when all related and offsetting transactions are considered. A summary of obligations under these financial instruments at October 31, 2023 is included in the Portfolio of Investments. At October 31, 2023, the Portfolio had sufficient cash and/or securities to cover commitments under these contracts.
In the normal course of pursuing its investment objective, the Portfolio is subject to the following risks:
Equity Price Risk: During the year ended October 31, 2023, the Portfolio entered into equity futures contracts and total return swaps to enhance total return, to manage certain investment risks and/or as a substitute for the purchase of securities.
Foreign Exchange Risk: The Portfolio engages in forward foreign currency exchange contracts and currency options to enhance total return, to seek to hedge against fluctuations in currency exchange rates and/or as a substitute for the purchase or sale of securities or currencies.
The Portfolio enters into over-the-counter (OTC) derivatives that may contain provisions whereby the counterparty may terminate the contract under certain conditions, including but not limited to a decline in the Portfolio’s net assets below a certain level over a certain period of time, which would trigger a payment by the Portfolio for those derivatives in a liability position. At October 31, 2023, the fair value of derivatives with credit-related contingent features in a net liability position was $2,227,335. The aggregate fair value of assets pledged as collateral by the Portfolio for such liability was $3,771,673 at October 31, 2023.
The OTC derivatives in which the Portfolio invests (except for written options as the Portfolio, not the counterparty, is obligated to perform) are subject to the risk that the counterparty to the contract fails to perform its obligations under the contract. To mitigate this risk, the Portfolio has entered into an International Swaps and Derivatives Association, Inc. Master Agreement (“ISDA Master Agreement”) or similar agreement with substantially all its derivative counterparties. An ISDA Master Agreement is a bilateral agreement between the Portfolio and a counterparty that governs certain OTC derivatives and typically contains, among other things, set-off provisions in the event of a default and/or termination event as defined under the relevant ISDA Master Agreement. Under an ISDA Master Agreement, the Portfolio may, under certain circumstances, offset with the counterparty certain derivative financial instruments’ payables and/or receivables with collateral held and/or posted and create one single net payment. The provisions of the ISDA Master Agreement typically permit a single net payment in the event of default including the bankruptcy or insolvency of the counterparty. However, bankruptcy or insolvency laws of a particular jurisdiction may impose restrictions on or prohibitions against the right of offset in bankruptcy or insolvency. Certain ISDA Master Agreements allow counterparties to OTC derivatives to terminate derivative contracts prior to maturity in the event the Portfolio’s net assets decline by a stated percentage or the Portfolio fails to meet the terms of its ISDA Master Agreements, which would cause the counterparty to accelerate payment by the Portfolio of any net liability owed to it.
The collateral requirements for derivatives traded under an ISDA Master Agreement are governed by a Credit Support Annex to the ISDA Master Agreement. Collateral requirements are determined at the close of business each day and are typically based on changes in market values for each transaction under an ISDA Master Agreement and netted into one amount for such agreement. Generally, the amount of collateral due from or to a counterparty is subject to a minimum transfer threshold amount before a transfer is required, which may vary by counterparty. Collateral pledged for the benefit of the Portfolio and/or counterparty is held in segregated accounts by the Portfolio’s custodian and cannot be sold, re-pledged, assigned or otherwise used while pledged. The portion of such collateral representing cash, if any, is reflected as deposits for derivatives collateral and, in the case of cash pledged by a counterparty for the benefit of the Portfolio, a corresponding liability on the Statement of Assets and Liabilities. Securities pledged by the Portfolio as collateral, if any, are identified as such in the Portfolio of Investments. The carrying amount of the liability for cash collateral due to brokers at October 31, 2023 approximated its fair value. If measured at fair value, such liability would have been considered as Level 2 in the fair value hierarchy (see Note 8) at October 31, 2023.
Global Macro Capital Opportunities Portfolio
October 31, 2023
Notes to Financial Statements — continued
The fair value of open derivative instruments (not considered to be hedging instruments for accounting disclosure purposes) by risk exposure at October 31, 2023 was as follows:
| | Fair Value |
| Statement of Assets and Liabilities Caption | Equity
Price | Foreign
Exchange | Total |
| Not applicable | $ — | $ 211,162* | $ 211,162 |
| Receivable for open forward foreign currency exchange contracts | — | 1,911,793 | 1,911,793 |
| Total Asset Derivatives | $ — | $2,122,955 | $ 2,122,955 |
| Derivatives not subject to master netting or similar agreements | $ — | $ 211,162 | $ 211,162 |
| Total Asset Derivatives subject to master netting or similar agreements | $ — | $1,911,793 | $ 1,911,793 |
| Not applicable | $ (729,771)* | $ (889,966)* | $ (1,619,737) |
| Payable for open swap contracts | (2,227,335) | — | (2,227,335) |
| Total Liability Derivatives | $(2,957,106) | $ (889,966) | $(3,847,072) |
| Derivatives not subject to master netting or similar agreements | $ (729,771) | $ (889,966) | $(1,619,737) |
| Total Liability Derivatives subject to master netting or similar agreements | $(2,227,335) | $ — | $(2,227,335) |
| * | Only the current day’s variation margin on open futures contracts and centrally cleared derivatives is reported within the Statement of Assets and Liabilities as Receivable or Payable for variation margin on open futures contracts and centrally cleared derivatives, as applicable. |
The Portfolio’s derivative assets and liabilities at fair value by risk, which are reported gross in the Statement of Assets and Liabilities, are presented in the table above. The following tables present the Portfolio’s derivative assets and liabilities by counterparty, net of amounts available for offset under a master netting agreement and net of the related collateral received by the Portfolio for such assets and pledged by the Portfolio for such liabilities as of October 31, 2023.
| Counterparty | Derivative
Assets Subject to
Master Netting
Agreement | Derivatives
Available
for Offset | Non-cash
Collateral
Received(a) | Cash
Collateral
Received(a) | Net Amount
of Derivative
Assets(b) | Total Cash
Collateral
Received |
| BNP Paribas | $ 720,769 | $ — | $ — | $ (710,000) | $ 10,769 | $ 710,000 |
| HSBC Bank USA, N.A. | 1,191,024 | — | (1,051,762) | — | 139,262 | — |
| | $1,911,793 | $ — | $(1,051,762) | $(710,000) | $150,031 | $710,000 |
| Counterparty | Derivative
Liabilities Subject to
Master Netting
Agreement | Derivatives
Available
for Offset | Non-cash
Collateral
Pledged(a) | Cash
Collateral
Pledged(a) | Net Amount
of Derivative
Liabilities(c) | Total Cash
Collateral
Pledged |
| Citibank, N.A. | $(2,227,335) | $ — | $1,493,615 | $733,720 | $ — | $2,278,058 |
| (a) | In some instances, the total collateral received and/or pledged may be more than the amount shown due to overcollateralization. |
| (b) | Net amount represents the net amount due from the counterparty in the event of default. |
| (c) | Net amount represents the net amount payable to the counterparty in the event of default. |
Global Macro Capital Opportunities Portfolio
October 31, 2023
Notes to Financial Statements — continued
The effect of derivative instruments (not considered to be hedging instruments for accounting disclosure purposes) on the Statement of Operations by risk exposure for the year ended October 31, 2023 was as follows:
| Statement of Operations Caption | Equity
Price | Foreign
Exchange | Total |
| Net realized gain (loss): | | | |
| Investment transactions | $ — | $ 401,503(1) | $ 401,503 |
| Written options | — | (2,041) | (2,041) |
| Futures contracts | (3,748,918) | — | (3,748,918) |
| Swap contracts | 468,682 | — | 468,682 |
| Forward foreign currency exchange contracts | — | 1,886,910 | 1,886,910 |
| Total | $(3,280,236) | $ 2,286,372 | $ (993,864) |
| Change in unrealized appreciation (depreciation): | | | |
| Futures contracts | $ (728,448) | $ — | $ (728,448) |
| Swap contracts | (2,227,335) | — | (2,227,335) |
| Forward foreign currency exchange contracts | — | (1,343,729) | (1,343,729) |
| Total | $(2,955,783) | $(1,343,729) | $(4,299,512) |
| (1) | Relates to purchased options. |
The average notional cost of futures contracts and average notional amounts of other derivative contracts outstanding during the year ended October 31, 2023, which are indicative of the volume of these derivative types, were approximately as follows:
Futures
Contracts — Long | Forward
Foreign Currency
Exchange Contracts* | Swap
Contracts |
| $24,801,000 | $140,989,000 | $13,214,000 |
| * | The average notional amount for forward foreign currency exchange contracts is based on the absolute value of notional amounts of currency purchased and currency sold. |
The average principal amount of purchased and written currency options contracts outstanding during the year ended October 31, 2023, which are indicative of the volume of these derivative types, were approximately $10,431,000 and $10,431,000, respectively.
6 Line of Credit
The Portfolio participates with other portfolios and funds managed by BMR and its affiliates in a $650 million unsecured revolving line of credit agreement with a group of banks, which is in effect through October 22, 2024. In connection with the renewal of the agreement on October 24, 2023, the borrowing limit was decreased from $725 million. Borrowings are made by the Portfolio solely for temporary purposes related to redemptions and other short-term cash needs. Interest is charged to the Portfolio based on its borrowings at an amount above either the Secured Overnight Financing Rate (SOFR) or Federal Funds rate. In addition, a fee computed at an annual rate of 0.15% on the daily unused portion of the line of credit is allocated among the participating portfolios and funds at the end of each quarter. In connection with the renewal of the agreement in October 2023, an arrangement fee totaling $150,000 was incurred that was allocated to the participating portfolios and funds. Because the line of credit is not available exclusively to the Portfolio, it may be unable to borrow some or all of its requested amounts at any particular time. The Portfolio did not have any significant borrowings or allocated fees during the year ended October 31, 2023.
Global Macro Capital Opportunities Portfolio
October 31, 2023
Notes to Financial Statements — continued
7 Affiliated Investments
At October 31, 2023, the value of the Portfolio's investment in funds that may be deemed to be affiliated was $28,891,215, which represents 7.7% of the Portfolio's net assets. Transactions in such investments by the Portfolio for the year ended October 31, 2023 were as follows:
| Name | Value,
beginning
of period | Purchases | Sales
proceeds | Net
realized
gain (loss) | Change in
unrealized
appreciation
(depreciation) | Value, end
of period | Dividend
income | Shares,
end of period |
| Short-Term Investments |
| Liquidity Fund | $2,240,401 | $238,000,029 | $(211,349,215) | $ — | $ — | $28,891,215 | $386,696 | 28,891,215 |
8 Fair Value Measurements
Under generally accepted accounting principles for fair value measurements, a three-tier hierarchy to prioritize the assumptions, referred to as inputs, is used in valuation techniques to measure fair value. The three-tier hierarchy of inputs is summarized in the three broad levels listed below.
| • | Level 1 – quoted prices in active markets for identical investments |
| • | Level 2 – other significant observable inputs (including quoted prices for similar investments, interest rates, prepayment speeds, credit risk, etc.) |
| • | Level 3 – significant unobservable inputs (including a fund's own assumptions in determining the fair value of investments) |
In cases where the inputs used to measure fair value fall in different levels of the fair value hierarchy, the level disclosed is determined based on the lowest level input that is significant to the fair value measurement in its entirety. The inputs or methodology used for valuing securities are not necessarily an indication of the risk associated with investing in those securities.
At October 31, 2023, the hierarchy of inputs used in valuing the Portfolio’s investments and open derivative instruments, which are carried at fair value, were as follows:
| Asset Description | Level 1 | Level 2 | Level 3 | Total |
| Common Stocks: | | | | |
| Asia/Pacific | $ 425,401 | $ 117,633,259 | $ — | $ 118,058,660 |
| Developed Europe | — | 1,115,896 | — | 1,115,896 |
| Emerging Europe | 2,552,308 | 155,503,951 | — | 158,056,259 |
| Middle East/Africa | — | 41,977,806 | — | 41,977,806 |
| Total Common Stocks | $ 2,977,709 | $ 316,230,912* | $ — | $ 319,208,621 |
| Loan Participation Notes | $ — | $ — | $ 10,052,327 | $ 10,052,327 |
| Preferred Stocks | — | 1,637,263 | — | 1,637,263 |
| Rights | — | 578 | — | 578 |
| Sovereign Government Bonds | — | 264,073 | — | 264,073 |
| Short-Term Investments: | | | | |
| Affiliated Fund | 28,891,215 | — | — | 28,891,215 |
| U.S. Treasury Obligations | — | 1,493,615 | — | 1,493,615 |
| Total Investments | $ 31,868,924 | $ 319,626,441 | $ 10,052,327 | $ 361,547,692 |
| Forward Foreign Currency Exchange Contracts | $ — | $ 2,122,955 | $ — | $ 2,122,955 |
| Total | $ 31,868,924 | $ 321,749,396 | $ 10,052,327 | $ 363,670,647 |
| Liability Description | | | | |
| Forward Foreign Currency Exchange Contracts | $ — | $ (889,966) | $ — | $ (889,966) |
Global Macro Capital Opportunities Portfolio
October 31, 2023
Notes to Financial Statements — continued
| Liability Description (continued) | Level 1 | Level 2 | Level 3 | Total |
| Futures Contracts | $ (729,771) | $ — | $ — | $ (729,771) |
| Swap Contracts | — | (2,227,335) | — | (2,227,335) |
| Total | $ (729,771) | $ (3,117,301) | $ — | $ (3,847,072) |
| * | Includes foreign equity securities whose values were adjusted to reflect market trading of comparable securities or other correlated instruments that occurred after the close of trading in their applicable foreign markets. |
The following is a reconciliation of Level 3 investments for which significant unobservable inputs were used to determine fair value:
| | Loan
Participation
Notes |
| Balance as of October 31, 2022 | $ — |
| Realized gains (losses) | — |
| Change in net unrealized appreciation (depreciation) | (727,733) |
| Cost of purchases | 10,718,814 |
| Proceeds from sales, including return of capital | — |
| Accrued discount (premium) | 61,246 |
| Transfers to Level 3 | — |
| Transfers from Level 3 | — |
| Balance as of October 31, 2023 | $10,052,327 |
| Change in net unrealized appreciation (depreciation) on investments still held as of October 31, 2023 | $ (727,733) |
The following is a summary of quantitative information about significant unobservable valuation inputs for Level 3 investments held as of October 31, 2023:
| Type of Investment | Fair Value as of
October 31, 2023 | Valuation Technique | Unobservable Input | Range of Unobservable Input | Impact to
Valuation from an
Increase to Input* |
| Loan Participation Notes | $10,052,327 | Matrix Pricing | Adjusted Credit Spread to the Central Bank of Uzbekistan Quoted Policy Rate | 5.46% - 9.79%** | Decrease |
| * | Represents the directional change in the fair value of the Level 3 investments that would result from an increase to the corresponding unobservable input. A decrease to the unobservable input would have the opposite effect. |
| ** | The weighted average of the unobservable input is 8.17% based on relative principal amounts. |
9 Risks and Uncertainties
Risks Associated with Foreign Investments
Foreign investments can be adversely affected by political, economic and market developments abroad, including the imposition of economic and other sanctions by the United States or another country. There may be less publicly available information about foreign issuers because they may not be subject to reporting practices, requirements or regulations comparable to those to which United States companies are subject. Foreign markets may be smaller, less liquid and more volatile than the major markets in the United States. Trading in foreign markets typically involves higher expense than trading in the United States. The Portfolio may have difficulties enforcing its legal or contractual rights in a foreign country. Securities that trade or are denominated in currencies other than the U.S. dollar may be adversely affected by fluctuations in currency exchange rates.
Global Macro Capital Opportunities Portfolio
October 31, 2023
Notes to Financial Statements — continued
Emerging market securities often involve greater risks than developed market securities. Investment markets within emerging market countries are typically smaller, less liquid, less developed and more volatile than those in more developed markets like the United States, and may be focused in certain economic sectors. The information available about an emerging market issuer may be less reliable than for comparable issuers in more developed capital markets. Governmental actions can have a significant effect on the economic conditions in emerging market countries. It may be more difficult to make a claim or obtain a judgment in the courts of these countries than it is in the United States. The possibility of fraud, negligence, undue influence being exerted by an issuer or refusal to recognize ownership exists in some emerging markets. Disruptions due to work stoppages and trading improprieties in foreign securities markets have caused such markets to close. Emerging market securities are also subject to speculative trading, which contributes to their volatility.
Frontier markets are among the smallest and least mature investment markets. Frontier market countries may have greater political or economic instability and may also be subject to trade barriers, adjustments in currency values and developing or changing securities laws and other regulations. Investments in frontier market countries generally are less liquid and subject to greater price volatility than investments in developed markets or emerging markets.
Global Macro Capital Opportunities Portfolio
October 31, 2023
Report of Independent Registered Public Accounting Firm
To the Trustees and Investors of Global Macro Capital Opportunities Portfolio:
Opinion on the Financial Statements and Financial Highlights
We have audited the accompanying statement of assets and liabilities of Global Macro Capital Opportunities Portfolio (the “Portfolio"), including the portfolio of investments, as of October 31, 2023, the related statement of operations for the year then ended, the statements of changes in net assets for each of the two years in the period then ended, the financial highlights for each of the five years in the period then ended, and the related notes. In our opinion, the financial statements and financial highlights present fairly, in all material respects, the financial position of the Portfolio as of October 31, 2023, and the results of its operations for the year then ended, the changes in its net assets for each of the two years in the period then ended, and the financial highlights for each of the five years in the period then ended, in conformity with accounting principles generally accepted in the United States of America.
Basis for Opinion
These financial statements and financial highlights are the responsibility of the Portfolio’s management. Our responsibility is to express an opinion on the Portfolio’s financial statements and financial highlights based on our audits. We are a public accounting firm registered with the Public Company Accounting Oversight Board (United States) (PCAOB) and are required to be independent with respect to the Portfolio in accordance with the U.S. federal securities laws and the applicable rules and regulations of the Securities and Exchange Commission and the PCAOB.
We conducted our audits in accordance with the standards of the PCAOB. Those standards require that we plan and perform the audit to obtain reasonable assurance about whether the financial statements and financial highlights are free of material misstatement, whether due to error or fraud. The Portfolio is not required to have, nor were we engaged to perform, an audit of its internal control over financial reporting. As part of our audits, we are required to obtain an understanding of internal control over financial reporting but not for the purpose of expressing an opinion on the effectiveness of the Portfolio’s internal control over financial reporting. Accordingly, we express no such opinion.
Our audits included performing procedures to assess the risks of material misstatement of the financial statements and financial highlights, whether due to error or fraud, and performing procedures that respond to those risks. Such procedures included examining, on a test basis, evidence regarding the amounts and disclosures in the financial statements and financial highlights. Our audits also included evaluating the accounting principles used and significant estimates made by management, as well as evaluating the overall presentation of the financial statements and financial highlights. Our procedures included confirmation of securities owned as of October 31, 2023, by correspondence with the custodian and brokers; when replies were not received from brokers, we performed other auditing procedures. We believe that our audits provide a reasonable basis for our opinion.
/s/ Deloitte & Touche LLP
Boston, Massachusetts
December 19, 2023
We have served as the auditor of one or more Eaton Vance investment companies since 1959.
Eaton Vance
Emerging and Frontier Countries Equity Fund
October 31, 2023
Board of Trustees’ Contract Approval
Overview of the Contract Review Process
The Investment Company Act of 1940, as amended (the “1940 Act”), provides, in substance, that the investment advisory agreement between a fund and its investment adviser will continue in effect from year-to-year only if its continuation is approved on an annual basis by a vote of the fund’s board of trustees, including a majority of the trustees who are not “interested persons” of the fund (“independent trustees”), cast in person at a meeting called for the purpose of considering such approval.
At a meeting held on June 8, 2023, the Boards of Trustees/Directors (collectively, the “Board”) that oversee the registered investment companies advised by Eaton Vance Management or its affiliate, Boston Management and Research (the “Eaton Vance Funds”), including a majority of the independent trustees (the “Independent Trustees”), voted to approve the continuation of existing investment advisory agreements and sub-advisory agreements1 for each of the Eaton Vance Funds for an additional one-year period. The Board relied upon the affirmative recommendation of its Contract Review Committee, which is a committee exclusively comprised of Independent Trustees. Prior to making its recommendation, the Contract Review Committee reviewed information furnished by the adviser and sub-adviser to each of the Eaton Vance Funds (including information specifically requested by the Board) for a series of formal meetings held between April and June 2023, as well as certain additional information provided in response to specific requests from the Independent Trustees as members of the Contract Review Committee. Members of the Contract Review Committee also considered information received at prior meetings of the Board and its committees, to the extent such information was relevant to the Contract Review Committee’s annual evaluation of the investment advisory agreements and sub-advisory agreements.
In connection with its evaluation of the investment advisory agreements and sub-advisory agreements, the Board considered various information relating to the Eaton Vance Funds. This included information applicable to all or groups of Eaton Vance Funds, which is referenced immediately below, and information applicable to the particular Eaton Vance Fund covered by this report (each “Eaton Vance Fund” is referred to below as a “fund”). (For funds that invest through one or more underlying portfolios, references to “each fund” in this section may include information that was considered at the portfolio-level.)
Information about Fees, Performance and Expenses
• A report from an independent data provider comparing advisory and other fees paid by each fund to such fees paid by comparable funds, as identified by the independent data provider (“comparable funds”);
• A report from an independent data provider comparing each fund’s total expense ratio (and its components) to those of comparable funds;
• A report from an independent data provider comparing the investment performance of each fund (including, as relevant, total return data, income data, Sharpe ratios and information ratios) to the investment performance of comparable funds and, as applicable, benchmark indices, over various time periods;
• In certain instances, data regarding investment performance relative to customized groups of peer funds and blended indices identified by the adviser in consultation with the Portfolio Management Committee of the Board (a committee exclusively comprised of Independent Trustees);
• Comparative information concerning the fees charged and services provided by the adviser and sub-adviser to each fund in managing other accounts (which may include other mutual funds, collective investment funds and institutional accounts) using investment strategies and techniques similar to those used in managing such fund(s), if any;
• Profitability analyses with respect to the adviser and sub-adviser to each of the funds;
Information about Portfolio Management and Trading
• Descriptions of the investment management services provided to each fund, as well as each of the funds’ investment strategies and policies;
• The procedures and processes used to determine the value of fund assets, including, when necessary, the determination of “fair value” and actions taken to monitor and test the effectiveness of such procedures and processes;
• Information about the policies and practices of each fund’s adviser and sub-adviser with respect to trading, including their processes for seeking best execution of portfolio transactions;
• Information about the allocation of brokerage transactions and the benefits, if any, received by the adviser and sub-adviser to each fund as a result of brokerage allocation, including, as applicable, information concerning the acquisition of research through client commission arrangements and policies with respect to “soft dollars”;
• Data relating to the portfolio turnover rate of each fund and related information regarding active management in the context of particular strategies;
Information about each Adviser and Sub-adviser
• Reports detailing the financial results and condition of the adviser and sub-adviser to each fund;
1 Not all Eaton Vance Funds have entered into a sub-advisory agreement with a sub-adviser. Accordingly, references to “sub-adviser” or “sub-advisory agreement” in this “Overview” section may not be applicable to the particular Eaton Vance Fund covered by this report.
Eaton Vance
Emerging and Frontier Countries Equity Fund
October 31, 2023
Board of Trustees’ Contract Approval — continued
• Information regarding the individual investment professionals whose responsibilities include portfolio management and investment research for the funds, and, for portfolio managers and certain other investment professionals, information relating to their responsibilities with respect to managing other mutual funds and investment accounts, as applicable;
• Information regarding the adviser’s and its parent company’s (Morgan Stanley’s) efforts to retain and attract talented investment professionals, including in the context of a competitive marketplace for talent, as well as the ongoing unique environment presented by hybrid, remote and other alternative work arrangements;
• Information regarding the adviser’s compensation methodology for its investment professionals and the incentives and accountability it creates, along with investment professionals’ investments in the fund(s) they manage;
• The Code of Ethics of the adviser and its affiliates and the sub-adviser of each fund, together with information relating to compliance with, and the administration of, such codes;
• Policies and procedures relating to proxy voting, including regular reporting with respect to fund proxy voting activities;
• Information regarding the handling of corporate actions and class actions, as well as information regarding litigation and other regulatory matters;
• Information concerning the resources devoted to compliance efforts undertaken by the adviser and its affiliates and the sub-adviser of each fund, if any, including descriptions of their various compliance programs and their record of compliance;
• Information concerning the business continuity and disaster recovery plans of the adviser and its affiliates and the sub-adviser of each fund, if any;
• A description of Eaton Vance Management’s and Boston Management and Research’s oversight of sub-advisers, including with respect to regulatory and compliance issues, investment management and other matters;
Other Relevant Information
• Information regarding ongoing initiatives to further integrate and harmonize, where applicable, the investment management and other departments of the adviser and its affiliates with the overall investment management infrastructure of Morgan Stanley, in light of Morgan Stanley’s acquisition of Eaton Vance Corp. on March 1, 2021;
• Information concerning the nature, cost and character of the administrative and other non-investment advisory services provided by Eaton Vance Management and its affiliates;
• Information concerning oversight of the relationship with the custodian, subcustodians, fund accountants, and other third-party service providers by the adviser and/or administrator to each of the funds;
• Information concerning efforts to implement policies and procedures with respect to various recently adopted regulations applicable to the funds, including Rule 12d1-4 (the Fund-of-Funds Rule), Rule 18f-4 (the Derivatives Rule) and Rule 2a-5 (the Fair Valuation Rule);
• For an Eaton Vance Fund structured as an exchange-listed closed-end fund, information concerning the benefits of the closed-end fund structure, as well as, where relevant, the closed-end fund’s market prices (including as compared to the closed-end fund’s net asset value (NAV)), trading volume data, continued use of auction preferred shares (where applicable), distribution rates and other relevant matters;
• The risks which the adviser and/or its affiliates incur in connection with the management and operation of the funds, including, among others, litigation, regulatory, entrepreneurial, and other business risks (and the associated costs of such risks); and
• The terms of each investment advisory agreement and sub-advisory agreement.
During the various meetings of the Board and its committees over the course of the year leading up to the June 8, 2023 meeting, the Board received information from portfolio managers and other investment professionals of the advisers and sub-advisers of the funds regarding investment and performance matters, and considered various investment and trading strategies used in pursuing the funds’ investment objectives. The Board also received information regarding risk management techniques employed in connection with the management of the funds. The Board and its committees evaluated issues pertaining to industry and regulatory developments, compliance procedures, fund governance and other issues with respect to the funds, and received and participated in reports and presentations provided by Eaton Vance Management, Boston Management and Research and fund sub-advisers, with respect to such matters. In addition to the formal meetings of the Board and its committees, the Independent Trustees held regular teleconferences to discuss, among other topics, matters relating to the continuation of investment advisory agreements and sub-advisory agreements.
The Contract Review Committee was advised throughout the contract review process by Goodwin Procter LLP, independent legal counsel for the Independent Trustees. The members of the Contract Review Committee, with the advice of such counsel, exercised their own business judgment in determining the material factors to be considered in evaluating each investment advisory agreement and sub-advisory agreement and the weight to be given to each such factor. The conclusions reached with respect to each investment advisory agreement and sub-advisory agreement were based on a comprehensive evaluation of all the information provided and not any single factor. Moreover, each member of the Contract Review Committee may have placed varying emphasis on particular factors in reaching conclusions with respect to each investment advisory agreement and sub-advisory agreement. In evaluating each investment advisory agreement and sub-advisory agreement, including the fee structures and other terms contained in such agreements, the members of the Contract Review Committee were also informed by multiple years of analysis and discussion with the adviser and sub-adviser to each of the Eaton Vance Funds.
Eaton Vance
Emerging and Frontier Countries Equity Fund
October 31, 2023
Board of Trustees’ Contract Approval — continued
Results of the Contract Review Process
Based on its consideration of the foregoing, and such other information it deemed relevant, including the factors and conclusions described below, the Contract Review Committee concluded that the continuation of the investment advisory agreement between Eaton Vance Emerging and Frontier Countries Equity Fund (the “Fund”) and Eaton Vance Management (“EVM”), as well as the investment advisory agreement between Global Macro Capital Opportunities Portfolio (the “Portfolio”), the portfolio in which the Fund invests, and Boston Management and Research (“BMR”) (EVM, with respect to the Fund, and BMR, with respect to the Portfolio, are each referred to herein as the “Adviser”), including their respective fee structures, are in the interests of shareholders and, therefore, recommended to the Board approval of each agreement. Based on the recommendation of the Contract Review Committee, the Board, including a majority of the Independent Trustees, voted to approve continuation of the investment advisory agreement for the Fund and the investment advisory agreement for the Portfolio (together, the “investment advisory agreements”). Eaton Vance Advisors International Ltd., an affiliate of each Adviser (the “Sub-adviser”), began serving as the sub-adviser to the Fund and the Portfolio on January 1, 2023. Accordingly, each investment sub-advisory agreement with the Sub-adviser was in its initial two-year term, and the Board was not required to approve each agreement at its meeting on June 8, 2023.
Nature, Extent and Quality of Services
In considering whether to approve the investment advisory agreements for the Fund and the Portfolio, the Board evaluated the nature, extent and quality of services provided to the Fund and the Portfolio by the applicable Adviser.
The Board considered each Adviser’s management capabilities and investment processes in light of the types of investments held by the Fund and the Portfolio, including the education, experience and number of investment professionals and other personnel who provide portfolio management, investment research, and similar services to the Fund and the Portfolio. In this regard, the Board considered each Adviser’s responsibilities with respect to oversight of the Sub-adviser. In particular, the Board considered the abilities and experience of each Adviser’s and the Sub-adviser’s investment professionals in investing in equity securities traded in developed, emerging, frontier, and off-index markets. The Board considered the international investment capabilities of the Sub-adviser, which is based in London, and the benefits to the Fund and the Portfolio of having portfolio management services involving investments in international equities provided by investment professionals located abroad. The Board also took into account the resources dedicated to portfolio management and other services, the compensation methods of each Adviser and other factors, including the reputation and resources of the Adviser to recruit and retain highly qualified research, advisory and supervisory investment professionals. In addition, the Board considered the time and attention devoted to the Eaton Vance Funds, including the Fund and the Portfolio, by senior management, as well as the infrastructure, operational capabilities and support staff in place to assist in the portfolio management and operations of the Fund and the Portfolio, including the provision of administrative services. The Board also considered the business-related and other risks to which each Adviser or its affiliates may be subject in managing the Fund and the Portfolio.
The Board noted that, under the terms of the investment advisory agreement of the Fund, EVM may invest assets of the Fund directly in securities, for which it would receive a fee, or in the Portfolio, for which it receives no separate fee but for which BMR receives an advisory fee from the Portfolio.
The Board considered the compliance programs of each Adviser and relevant affiliates thereof. The Board considered compliance and reporting matters regarding, among other things, personal trading by investment professionals, disclosure of portfolio holdings, late trading, frequent trading, portfolio valuation, business continuity and the allocation of investment opportunities. The Board also considered the responses of each Adviser and its affiliates to requests in recent years from regulatory authorities, such as the Securities and Exchange Commission and the Financial Industry Regulatory Authority.
The Board considered other administrative services provided or overseen by EVM and its affiliates, including transfer agency and accounting services. The Board evaluated the benefits to shareholders of investing in a fund that is a part of a large fund complex offering exposure to a variety of asset classes and investment disciplines, as well as the ability, in many cases, to exchange an investment among different funds without incurring additional sales charges.
After consideration of the foregoing factors, among others, the Board concluded that the nature, extent and quality of services provided by each Adviser, taken as a whole, are appropriate and consistent with the terms of the applicable investment advisory agreement.
Fund Performance
The Board compared the Fund’s investment performance to that of comparable funds identified by an independent data provider (the peer group), as well as appropriate benchmark indices. The Board’s review included comparative performance data with respect to the Fund for the one-, three- and five-year periods ended December 31, 2022. In this regard, the Board noted that the performance of the Fund was higher than the median performance of the Fund’s peer group for the three-year period. The Board also noted that the performance of the Fund was higher than its primary, secondary and custom benchmark indexes for the three-year period. The Board concluded that the performance of the Fund was satisfactory.
Eaton Vance
Emerging and Frontier Countries Equity Fund
October 31, 2023
Board of Trustees’ Contract Approval — continued
Management Fees and Expenses
The Board considered contractual fee rates payable by the Fund and by the Portfolio for advisory and administrative services (referred to collectively as “management fees”). As part of its review, the Board considered the Fund’s management fees and total expense ratio for the one-year period ended December 31, 2022, as compared to those of comparable funds, before and after giving effect to any undertaking to waive fees or reimburse expenses. The Board also considered certain Fund specific factors that had an impact on the Fund’s total expense ratio relative to comparable funds, as identified by management in response to inquiries from the Contract Review Committee.
After considering the foregoing information, and in light of the nature, extent and quality of the services provided by each Adviser, the Board concluded that the management fees charged for advisory and related services are reasonable.
Profitability and “Fall-Out” Benefits
The Board considered the level of profits realized by each Adviser and relevant affiliates thereof in providing investment advisory and administrative services to the Fund, to the Portfolio and to all Eaton Vance Funds as a group. The Board considered the level of profits realized without regard to marketing support or other payments by each Adviser and its affiliates to third parties in respect of distribution or other services.
The Board concluded that, in light of the foregoing factors and the nature, extent and quality of the services rendered, the profits realized by each Adviser and its affiliates are deemed not to be excessive.
The Board also considered direct or indirect fall-out benefits received by each Adviser and its affiliates in connection with their respective relationships with the Fund and the Portfolio, including the benefits of research services that may be available to each Adviser as a result of securities transactions effected for the Fund and the Portfolio and other investment advisory clients.
Economies of Scale
In reviewing management fees and profitability, the Board also considered the extent to which the applicable Adviser and its affiliates, on the one hand, and the Fund and the Portfolio, on the other hand, can expect to realize benefits from economies of scale as the assets of the Fund and the Portfolio increase. The Board acknowledged the difficulty in accurately measuring the benefits resulting from economies of scale, if any, with respect to the management of any specific fund or group of funds. The Board reviewed data summarizing the increases and decreases in the assets of the Fund and of all Eaton Vance Funds as a group over various time periods, and evaluated the extent to which the total expense ratio of the Fund and the profitability of each Adviser and its affiliates may have been affected by such increases or decreases. Based upon the foregoing, the Board concluded that the Fund currently shares in the benefits from economies of scale, if any, when they are realized by the Adviser. The Board also concluded that the structure of the advisory fees, which include breakpoints at several asset levels, will allow the Fund and the Portfolio to continue to benefit from any economies of scale in the future.
Eaton Vance
Emerging and Frontier Countries Equity Fund
October 31, 2023
Liquidity Risk Management Program
The Fund has implemented a written liquidity risk management program (Program) and related procedures to manage its liquidity in accordance with Rule 22e-4 under the Investment Company Act of 1940, as amended (Liquidity Rule). The Liquidity Rule defines “liquidity risk” as the risk that a fund could not meet requests to redeem shares issued by the fund without significant dilution of the remaining investors’ interests in the fund. The Fund’s Board of Trustees/Directors has designated the investment adviser to serve as the administrator of the Program and the related procedures. The administrator has established a Liquidity Risk Management Oversight Committee (Committee) to perform the functions necessary to administer the Program. As part of the Program, the administrator is responsible for identifying illiquid investments and categorizing the relative liquidity of the Fund’s investments in accordance with the Liquidity Rule. Under the Program, the administrator assesses, manages, and periodically reviews the Fund’s liquidity risk, and is responsible for making certain reports to the Fund’s Board of Trustees/Directors and the Securities and Exchange Commission (SEC) regarding the liquidity of the Fund’s investments, and to notify the Board of Trustees/Directors and the SEC of certain liquidity events specified in the Liquidity Rule. The liquidity of the Fund’s portfolio investments is determined based on a number of factors including, but not limited to, relevant market, trading and investment-specific considerations under the Program.
At a meeting of the Fund’s Board of Trustees/Directors on June 7, 2023, the Committee provided a written report to the Fund’s Board of Trustees/
Directors pertaining to the operation, adequacy, and effectiveness of implementation of the Program, as well as the operation of the highly liquid investment minimum (if applicable) for the period January 1, 2022 through December 31, 2022 (Review Period). The Program operated effectively during the Review Period, supporting the administrator’s ability to assess, manage and monitor Fund liquidity risk, including during periods of market volatility and net redemptions. During the Review Period, the Fund met redemption requests on a timely basis.
There can be no assurance that the Program will achieve its objectives in the future. Please refer to the Fund’s prospectus for more information regarding the Fund’s exposure to liquidity risk and other principal risks to which an investment in the Fund may be subject.
Eaton Vance
Emerging and Frontier Countries Equity Fund
October 31, 2023
Management and Organization
Fund Management. The Trustees of Eaton Vance Mutual Funds Trust (the Trust) and Global Macro Capital Opportunities Portfolio (the Portfolio) are responsible for the overall management and supervision of the Trust's and the Portfolio’s affairs. The Board members and officers of the Trust and the Portfolio are listed below. Except as indicated, each individual has held the office shown or other offices in the same company for the last five years. Board members hold indefinite terms of office. Each Trustee holds office until his or her successor is elected and qualified, subject to a prior death, resignation, retirement, disqualification or removal. Under the terms of the Fund's and the Portfolio's current Trustee retirement policy, an Independent Trustee must retire and resign as a Trustee on the earlier of: (i) the first day of July following his or her 74th birthday; or (ii), with limited exception, December 31st of the 20th year in which he or she has served as a Trustee. However, if such retirement and resignation would cause the Fund and the Portfolio to be out of compliance with Section 16 of the 1940 Act or any other regulations or guidance of the SEC, then such retirement and resignation will not become effective until such time as action has been taken for the Fund and the Portfolio to be in compliance therewith. The “noninterested Trustees” consist of those Trustees who are not “interested persons” of the Trust and the Portfolio, as that term is defined under the 1940 Act. The business address of each Board member and officer is Two International Place, Boston, Massachusetts 02110. As used below, “BMR” refers to Boston Management and Research, “EV” refers to EV LLC, “EVM” refers to Eaton Vance Management, “MSIM” refers to Morgan Stanley Investment Management Inc. and “EVD” refers to Eaton Vance Distributors, Inc. EV is the trustee of each of EVM and BMR. Each of EVM, BMR, EVD and EV are indirect, wholly owned subsidiaries of Morgan Stanley. Each officer affiliated with EVM may hold a position with other EVM affiliates that is comparable to his or her position with EVM listed below. Each Trustee oversees 127 funds in the Eaton Vance fund complex (including both funds and portfolios in a hub and spoke structure).
| Name and Year of Birth | Trust/Portfolio
Position(s) | Length of Service | Principal Occupation(s) and Other Directorships
During Past Five Years and Other Relevant Experience |
| Interested Trustee |
Anchal Pachnanda(1)
1980 | Trustee | Since 2023 | Co-Head of Strategy of MSIM (since 2019). Formerly, Head of Strategy of MSIM (2017-2019). Ms. Pachnanda is an interested person because of her position with MSIM, which is an affiliate of the Trust.
Other Directorships. None. |
| Noninterested Trustees |
Alan C. Bowser
1962 | Trustee | Since 2022 | Private investor. Formerly, Chief Diversity Officer, Partner and a member of the Operating Committee, and formerly served as Senior Advisor on Diversity and Inclusion for the firm’s chief executive officer, Co-Head of the Americas Region, and Senior Client Advisor of Bridgewater Associates, an asset management firm (2011- 2023).
Other Directorships. Independent Director of Stout Risius Ross (a middle market professional services advisory firm) (since 2021). |
Mark R. Fetting
1954 | Trustee | Since 2016 | Private investor. Formerly held various positions at Legg Mason, Inc. (investment management firm) (2000-2012), including President, Chief Executive Officer, Director and Chairman (2008-2012), Senior Executive Vice President (2004-2008) and Executive Vice President (2001-2004). Formerly, President of Legg Mason family of funds (2001-2008). Formerly, Division President and Senior Officer of Prudential Financial Group, Inc. and related companies (investment management firm) (1991-2000).
Other Directorships. None. |
Cynthia E. Frost
1961 | Trustee | Since 2014 | Private investor. Formerly, Chief Investment Officer of Brown University (university endowment) (2000-2012). Formerly, Portfolio Strategist for Duke Management Company (university endowment manager) (1995-2000). Formerly, Managing Director, Cambridge Associates (investment consulting company) (1989-1995). Formerly, Consultant, Bain and Company (management consulting firm) (1987-1989). Formerly, Senior Equity Analyst, BA Investment Management Company (1983-1985).
Other Directorships. None. |
George J. Gorman
1952 | Chairperson
of the Board
and Trustee | Since 2021
(Chairperson) and
2014 (Trustee) | Principal at George J. Gorman LLC (consulting firm). Formerly, Senior Partner at Ernst & Young LLP (a registered public accounting firm) (1974-2009).
Other Directorships. None. |
Eaton Vance
Emerging and Frontier Countries Equity Fund
October 31, 2023
Management and Organization — continued
| Name and Year of Birth | Trust/Portfolio
Position(s) | Length of Service | Principal Occupation(s) and Other Directorships
During Past Five Years and Other Relevant Experience |
| Noninterested Trustees (continued) |
Valerie A. Mosley
1960 | Trustee | Since 2014 | Chairwoman and Chief Executive Officer of Valmo Ventures (a consulting and investment firm). Founder of Upward Wealth, Inc., dba BrightUp, a fintech platform. Formerly, Partner and Senior Vice President, Portfolio Manager and Investment Strategist at Wellington Management Company, LLP (investment management firm) (1992-2012). Formerly, Chief Investment Officer, PG Corbin Asset Management (1990-1992). Formerly worked in institutional corporate bond sales at Kidder Peabody (1986-1990).
Other Directorships. Director of DraftKings, Inc. (digital sports entertainment and gaming company) (since September 2020). Director of Envestnet, Inc. (provider of intelligent systems for wealth management and financial wellness) (since 2018). Formerly, Director of Dynex Capital, Inc. (mortgage REIT) (2013-2020) and Director of Groupon, Inc. (e-commerce provider) (2020-2022). |
Keith Quinton
1958 | Trustee | Since 2018 | Private investor, researcher and lecturer. Formerly, Independent Investment Committee Member at New Hampshire Retirement System (2017-2021). Formerly, Portfolio Manager and Senior Quantitative Analyst at Fidelity Investments (investment management firm) (2001-2014).
Other Directorships. Formerly, Director (2016-2021) and Chairman (2019-2021) of New Hampshire Municipal Bond Bank. |
Marcus L. Smith
1966 | Trustee | Since 2018 | Private investor and independent corporate director. Formerly, Chief Investment Officer, Canada (2012-2017), Chief Investment Officer, Asia (2010-2012), Director of Asian Research (2004-2010) and portfolio manager (2001-2017) at MFS Investment Management (investment management firm).
Other Directorships. Director of First Industrial Realty Trust, Inc. (an industrial REIT) (since 2021). Director of MSCI Inc. (global provider of investment decision support tools) (since 2017). Formerly, Director of DCT Industrial Trust Inc. (logistics real estate company) (2017-2018). |
Susan J. Sutherland
1957 | Trustee | Since 2015 | Private investor. Director of Ascot Group Limited and certain of its subsidiaries (insurance and reinsurance) (since 2017). Formerly, Director of Hagerty Holding Corp. (insurance) (2015-2018) and Montpelier Re Holdings Ltd. (insurance and reinsurance) (2013-2015). Formerly, Associate, Counsel and Partner at Skadden, Arps, Slate, Meagher & Flom LLP (law firm) (1982-2013).
Other Directorships. Formerly, Director of Kairos Acquisition Corp. (insurance/InsurTech acquisition company) (2021-2023). |
Scott E. Wennerholm
1959 | Trustee | Since 2016 | Private investor. Formerly, Trustee at Wheelock College (postsecondary institution) (2012-2018). Formerly, Consultant at GF Parish Group (executive recruiting firm) (2016-2017). Formerly, Chief Operating Officer and Executive Vice President at BNY Mellon Asset Management (investment management firm) (2005-2011). Formerly, Chief Operating Officer and Chief Financial Officer at Natixis Global Asset Management (investment management firm) (1997-2004). Formerly, Vice President at Fidelity Investments Institutional Services (investment management firm) (1994-1997).
Other Directorships. None. |
Nancy A. Wiser
1967 | Trustee | Since 2022 | Formerly, Executive Vice President and the Global Head of Operations at Wells Fargo Asset Management (2011-2021).
Other Directorships. None. |
| Name and Year of Birth | Trust/Portfolio
Position(s) | Length of Service | Principal Occupation(s)
During Past Five Years |
| Principal Officers who are not Trustees |
Kenneth A. Topping
1966 | President | Since 2023 | Vice President and Chief Administrative Officer of EVM and BMR and Chief Operating Officer for Public Markets at MSIM. Also Vice President of Calvert Research and Management (“CRM”) since 2021. Formerly, Chief Operating Officer for Goldman Sachs Asset Management 'Classic’ (2009-2020). |
Deidre E. Walsh
1971 | Vice President and
Chief Legal Officer | Since 2009 | Vice President of EVM and BMR. Also Vice President of CRM. |
James F. Kirchner
1967 | Treasurer | Since 2007 | Vice President of EVM and BMR. Also Vice President of CRM. |
Eaton Vance
Emerging and Frontier Countries Equity Fund
October 31, 2023
Management and Organization — continued
| Name and Year of Birth | Trust/Portfolio
Position(s) | Length of Service | Principal Occupation(s)
During Past Five Years |
| Principal Officers who are not Trustees (continued) |
Nicholas S. Di Lorenzo
1987 | Secretary | Since 2022 | Formerly, associate (2012-2021) and counsel (2022) at Dechert LLP. |
Richard F. Froio
1968 | Chief Compliance
Officer | Since 2017 | Vice President of EVM and BMR since 2017. Formerly, Deputy Chief Compliance Officer (Adviser/Funds) and Chief Compliance Officer (Distribution) at PIMCO (2012-2017) and Managing Director at BlackRock/Barclays Global Investors (2009-2012). |
(1) Ms. Pachnanda began serving as Trustee effective April 1, 2023.
The SAI for the Fund includes additional information about the Trustees and officers of the Fund and the Portfolio and can be obtained without charge on Eaton Vance’s website at www.eatonvance.com or by calling 1-800-262-1122.
| FACTS | WHAT DOES EATON VANCE DO WITH YOUR
PERSONAL INFORMATION? |
| Why? | Financial companies choose how they share your personal information. Federal law gives consumers the right to limit some but not all sharing. Federal law also requires us to tell you how we collect, share, and protect your personal information. Please read this notice carefully to understand what we do. |
| |
| What? | The types of personal information we collect and share depend on the product or service you have with us. This information can include:■ Social Security number and income
■ investment experience and risk tolerance
■ checking account number and wire transfer instructions |
| |
| How? | All financial companies need to share customers’ personal information to run their everyday business. In the section below, we list the reasons financial companies can share their customers’ personal information; the reasons Eaton Vance chooses to share; and whether you can limit this sharing. |
Reasons we can share your
personal information | Does Eaton Vance
share? | Can you limit
this sharing? |
| For our everyday business purposes — such as to process your transactions, maintain your account(s), respond to court orders and legal investigations, or report to credit bureaus | Yes | No |
| For our marketing purposes — to offer our products and services to you | Yes | No |
| For joint marketing with other financial companies | No | We don’t share |
| For our investment management affiliates’ everyday business purposes — information about your transactions, experiences, and creditworthiness | Yes | Yes |
| For our affiliates’ everyday business purposes — information about your transactions and experiences | Yes | No |
| For our affiliates’ everyday business purposes — information about your creditworthiness | No | We don’t share |
| For our investment management affiliates to market to you | Yes | Yes |
| For our affiliates to market to you | No | We don’t share |
| For nonaffiliates to market to you | No | We don’t share |
To limit our
sharing | Call toll-free 1-800-262-1122 or email: EVPrivacy@eatonvance.comPlease note:If you are a new customer, we can begin sharing your information 30 days from the date we sent this notice. When you are no longer our customer, we continue to share your information as described in this notice. However, you can contact us at any time to limit our sharing. |
| Questions? | Call toll-free 1-800-262-1122 or email: EVPrivacy@eatonvance.com |
| Privacy Notice — continued | April 2021 |
| Who we are |
| Who is providing this notice? | Eaton Vance Management, Eaton Vance Distributors, Inc., Eaton Vance Trust Company, Eaton Vance Management (International) Limited, Eaton Vance Advisers International Ltd., Eaton Vance Global Advisors Limited, Eaton Vance Management’s Real Estate Investment Group, Boston Management and Research, Calvert Research and Management, Eaton Vance and Calvert Fund Families and our investment advisory affiliates (“Eaton Vance”) (see Investment Management Affiliates definition below) |
| What we do |
How does Eaton Vance
protect my personal
information? | To protect your personal information from unauthorized access and use, we use security measures that comply with federal law. These measures include computer safeguards and secured files and buildings. We have policies governing the proper handling of customer information by personnel and requiring third parties that provide support to adhere to appropriate security standards with respect to such information. |
How does Eaton Vance
collect my personal
information? | We collect your personal information, for example, when you■ open an account or make deposits or withdrawals from your account
■ buy securities from us or make a wire transfer
■ give us your contact informationWe also collect your personal information from others, such as credit bureaus, affiliates, or other companies. |
| Why can’t I limit all sharing? | Federal law gives you the right to limit only■ sharing for affiliates’ everyday business purposes — information about your creditworthiness
■ affiliates from using your information to market to you
■ sharing for nonaffiliates to market to youState laws and individual companies may give you additional rights to limit sharing. See below for more on your rights under state law. |
| Definitions |
Investment Management
Affiliates | Eaton Vance Investment Management Affiliates include registered investment advisers, registered broker- dealers, and registered and unregistered funds. Investment Management Affiliates does not include entities associated with Morgan Stanley Wealth Management, such as Morgan Stanley Smith Barney LLC and Morgan Stanley & Co. |
| Affiliates | Companies related by common ownership or control. They can be financial and nonfinancial companies.■ Our affiliates include companies with a Morgan Stanley name and financial companies such as Morgan Stanley Smith Barney LLC and Morgan Stanley & Co. |
| Nonaffiliates | Companies not related by common ownership or control. They can be financial and nonfinancial companies.■ Eaton Vance does not share with nonaffiliates so they can market to you. |
| Joint marketing | A formal agreement between nonaffiliated financial companies that together market financial products or services to you.■ Eaton Vance doesn’t jointly market. |
| Other important information |
| Vermont: Except as permitted by law, we will not share personal information we collect about Vermont residents with Nonaffiliates unless you provide us with your written consent to share such information.California: Except as permitted by law, we will not share personal information we collect about California residents with Nonaffiliates and we will limit sharing such personal information with our Affiliates to comply with California privacy laws that apply to us. |
Delivery of Shareholder Documents. The Securities and Exchange Commission (SEC) permits funds to deliver only one copy of shareholder documents, including prospectuses, proxy statements and shareholder reports, to fund investors with multiple accounts at the same residential or post office box address. This practice is often called “householding” and it helps eliminate duplicate mailings to shareholders. Eaton Vance, or your financial intermediary, may household the mailing of your documents indefinitely unless you instruct Eaton Vance, or your financial intermediary, otherwise. If you would prefer that your Eaton Vance documents not be householded, please contact Eaton Vance at 1-800-262-1122, or contact your financial intermediary. Your instructions that householding not apply to delivery of your Eaton Vance documents will typically be effective within 30 days of receipt by Eaton Vance or your financial intermediary.
Portfolio Holdings. Each Eaton Vance Fund and its underlying Portfolio(s) (if applicable) files a schedule of portfolio holdings on Part F to Form N-PORT with the SEC. Certain information filed on Form N-PORT may be viewed on the Eaton Vance website at www.eatonvance.com, by calling Eaton Vance at 1-800-262-1122 or in the EDGAR database on the SEC’s website at www.sec.gov.
Proxy Voting. From time to time, funds are required to vote proxies related to the securities held by the funds. The Eaton Vance Funds or their underlying Portfolios (if applicable) vote proxies according to a set of policies and procedures approved by the Funds’ and Portfolios’ Boards. You may obtain a description of these policies and procedures and information on how the Funds or Portfolios voted proxies relating to portfolio securities during the most recent 12-month period ended June 30, without charge, upon request, by calling 1-800-262-1122 and by accessing the SEC’s website at www.sec.gov.
Tailored Shareholder Reports. Effective January 24, 2023, the SEC adopted rule and form amendments to require open-end mutual funds and ETFs to transmit concise and visually engaging streamlined annual and semiannual reports to shareholders that highlight key information. Other information, including financial statements, will no longer appear in a streamlined shareholder report but must be available online, delivered free of charge upon request, and filed on a semiannual basis on Form N-CSR. The rule and form amendments have a compliance date of July 24, 2024. At this time, management is evaluating the impact of these amendments on the shareholder reports for the Eaton Vance Funds.
This Page Intentionally Left Blank
This Page Intentionally Left Blank
Investment Adviser of Global Macro Capital Opportunities Portfolio
Boston Management and Research
Two International Place
Boston, MA 02110
Investment Adviser and Administrator of Eaton Vance
Emerging and Frontier Countries Equity Fund
Eaton Vance Management
Two International Place
Boston, MA 02110
Investment Sub-Adviser
Eaton Vance Advisers International Ltd.
125 Old Broad Street
London, EC2N 1AR
United Kingdom
Principal Underwriter*
Eaton Vance Distributors, Inc.
Two International Place
Boston, MA 02110
(617) 482-8260
Custodian
State Street Bank and Trust Company
One Congress Street, Suite 1
Boston, MA 02114-2016
Transfer Agent
BNY Mellon Investment Servicing (US) Inc.
Attn: Eaton Vance Funds
P.O. Box 534439
Pittsburgh, PA 15253-4439
(800) 262-1122
Independent Registered Public Accounting Firm
Deloitte & Touche LLP
200 Berkeley Street
Boston, MA 02116-5022
Fund Offices
Two International Place
Boston, MA 02110
* FINRA BrokerCheck. Investors may check the background of their Investment Professional by contacting the Financial Industry Regulatory Authority (FINRA). FINRA BrokerCheck is a free tool to help investors check the professional background of current and former FINRA-registered securities firms and brokers. FINRA BrokerCheck is available by calling 1-800-289-9999 and at www.FINRA.org. The FINRA BrokerCheck brochure describing this program is available to investors at www.FINRA.org.
Item 2. Code of Ethics
The registrant (sometimes referred to as the “Fund”) has adopted a code of ethics applicable to its Principal Executive Officer, Principal Financial Officer and Principal Accounting Officer. The registrant undertakes to provide a copy of such code of ethics to any person upon request, without charge, by calling 1-800-262-1122. The registrant has not amended the code of ethics as described in Form N-CSR during the period covered by this report. The registrant has not granted any waiver, including an implicit waiver, from a provision of the code of ethics as described in Form N-CSR during the period covered by this report.
Item 3. Audit Committee Financial Expert
The registrant’s Board of Trustees (the “Board”) has designated George J. Gorman and Scott E. Wennerholm, each an independent trustee, as audit committee financial experts. Mr. Gorman is a certified public accountant who is the Principal at George J. Gorman LLC (a consulting firm). Previously, Mr. Gorman served in various capacities at Ernst & Young LLP (a registered public accounting firm), including as Senior Partner. Mr. Gorman also has experience serving as an independent trustee and audit committee financial expert of other mutual fund complexes. Mr. Wennerholm is a private investor. Previously, Mr. Wennerholm served as a Trustee at Wheelock College (postsecondary institution), as a Consultant at GF Parish Group (executive recruiting firm), Chief Operating Officer and Executive Vice President at BNY Mellon Asset Management (investment management firm), Chief Operating Officer and Chief Financial Officer at Natixis Global Asset Management (investment management firm), and Vice President at Fidelity Investments Institutional Services (investment management firm).
Item 4. Principal Accountant Fees and Services
Eaton Vance Emerging and Frontier Countries Equity Fund, Eaton Vance Emerging Markets Local Income Fund, Eaton Vance Floating-Rate Fund, Eaton Vance Floating-Rate Advantage Fund, Eaton Vance Floating-Rate & High Income Fund, Eaton Vance Global Sovereign Opportunities Fund (formerly, Eaton Vance Global Bond Fund), Eaton Vance Global Income Builder Fund, Eaton Vance Global Macro Absolute Return Fund, Eaton Vance Global Macro Absolute Return Advantage Fund, Eaton Vance Government Opportunities Fund, Eaton Vance High Income Opportunities Fund, Eaton Vance Multi-Asset Credit Fund, Eaton Vance Short Duration Government Income Fund, Eaton Vance Short Duration High Income Fund, Eaton Vance Short Duration Strategic Income Fund, Eaton Vance Tax-Managed Equity Asset Allocation Fund, Eaton Vance Tax-Managed Global Dividend Income Fund, Eaton Vance Tax-Managed Multi-Cap Growth Fund, Eaton Vance Tax-Managed Small-Cap Fund, Eaton Vance Tax-Managed Value Fund and Parametric Tax-Managed International Equity Fund (the “Fund(s)”) are series of Eaton Vance Mutual Funds Trust (the “Trust”), a Massachusetts business trust, which, including the Funds, contains a total of 31 series (the “Series”). The Trust is registered under the Investment Company Act of 1940 as an open-end management investment company. This Form N-CSR relates to the Funds’ annual reports.
(a)-(d)
The following table presents the aggregate fees billed to the fund for the fund’s fiscal years ended October 31, 2022 and October 31, 2023 by the Fund’s principal accountant, Deloitte and Touche LLP (“D&T”), for professional services rendered for the audit of the fund’s annual financial statements and fees billed for other services rendered by D&T during such periods.
| | | | | | | | |
| Eaton Vance Emerging and Frontier Countries Equity Fund | | | | |
Fiscal Years Ended | | 10/31/22 | | | 10/31/23 | |
Audit Fees | | $ | 17,850 | | | $ | 18,300 | |
Audit-Related Fees(1) | | $ | 0 | | | $ | 0 | |
Tax Fees(2) | | $ | 350 | | | $ | 0 | |
All Other Fees(3) | | $ | 0 | | | $ | 0 | |
| | | | | | | | |
Total | | $ | 18,200 | | | $ | 18,300 | |
| | | | | | | | |
| | | | | | | | |
| Eaton Vance Emerging Markets Local Income Fund | | | | | | |
Fiscal Years Ended | | 10/31/22 | | | 10/31/23 | |
Audit Fees | | $ | 24,550 | | | $ | 25,000 | |
Audit-Related Fees(1) | | $ | 0 | | | $ | 0 | |
Tax Fees(2) | | $ | 3,350 | | | $ | 0 | |
All Other Fees(3) | | $ | 0 | | | $ | 0 | |
| | | | | | | | |
Total | | $ | 27,900 | | | $ | 25,000 | |
| | | | | | | | |
| | | | | | | | |
| Eaton Vance Floating-Rate Fund | | | | | | |
Fiscal Years Ended | | 10/31/22 | | | 10/31/23 | |
Audit Fees | | $ | 30,650 | | | $ | 31,100 | |
Audit-Related Fees(1) | | $ | 0 | | | $ | 0 | |
Tax Fees(2) | | $ | 1,650 | | | $ | 0 | |
All Other Fees(3) | | $ | 0 | | | $ | 0 | |
| | | | | | | | |
Total | | $ | 32,300 | | | $ | 31,100 | |
| | | | | | | | |
| | | | | | | | |
| Eaton Vance Floating-Rate Advantage Fund | | | | | | |
Fiscal Years Ended | | 10/31/22 | | | 10/31/23 | |
Audit Fees | | $ | 30,450 | | | $ | 30,900 | |
Audit-Related Fees(1) | | $ | 0 | | | $ | 0 | |
Tax Fees(2) | | $ | 1,650 | | | $ | 0 | |
All Other Fees(3) | | $ | 0 | | | $ | 0 | |
| | | | | | | | |
Total | | $ | 32,100 | | | $ | 30,900 | |
| | | | | | | | |
| | | | | | | | |
| Eaton Vance Floating-Rate & High Income Fund | | | | | | |
Fiscal Years Ended | | 10/31/22 | | | 10/31/23 | |
Audit Fees | | $ | 34,700 | | | $ | 35,200 | |
Audit-Related Fees(1) | | $ | 0 | | | $ | 0 | |
Tax Fees(2) | | $ | 1,650 | | | $ | 0 | |
All Other Fees(3) | | $ | 0 | | | $ | 0 | |
| | | | | | | | |
Total | | $ | 36,350 | | | $ | 35,200 | |
| | | | | | | | |
| | | | | | | | |
Eaton Vance Global Sovereign Opportunities Fund (formerly, Eaton Vance Global Bond
Fund) | | | | | | |
Fiscal Years Ended | | 10/31/22 | | | 10/31/23 | |
Audit Fees | | $ | 26,050 | | | $ | 26,500 | |
Audit-Related Fees(1) | | $ | 0 | | | $ | 0 | |
Tax Fees(2) | | $ | 350 | | | $ | 0 | |
All Other Fees(3) | | $ | 0 | | | $ | 0 | |
| | | | | | | | |
Total | | $ | 26,400 | | | $ | 26,500 | |
| | | | | | | | |
| | | | | | | | |
| Eaton Vance Global Income Builder Fund | | | | | | |
Fiscal Years Ended | | 10/31/22 | | | 10/31/23 | |
Audit Fees | | $ | 17,650 | | | $ | 57,600 | |
Audit-Related Fees(1) | | $ | 0 | | | $ | 0 | |
Tax Fees(2) | | $ | 1,650 | | | $ | 0 | |
All Other Fees(3) | | $ | 0 | | | $ | 0 | |
| | | | | | | | |
Total | | $ | 19,300 | | | $ | 57,600 | |
| | | | | | | | |
| | | | | | | | |
| Eaton Vance Global Macro Absolute Return Fund | | | | | | |
Fiscal Years Ended | | 10/31/22 | | | 10/31/23 | |
Audit Fees | | $ | 30,650 | | | $ | 31,100 | |
Audit-Related Fees(1) | | $ | 0 | | | $ | 0 | |
Tax Fees(2) | | $ | 3,450 | | | $ | 0 | |
All Other Fees(3) | | $ | 0 | | | $ | 0 | |
| | | | | | | | |
Total | | $ | 34,100 | | | $ | 31,100 | |
| | | | | | | | |
| | | | | | | | |
| Eaton Vance Global Macro Absolute Return Advantage Fund | | | | | | |
Fiscal Years Ended | | 10/31/22 | | | 10/31/23 | |
Audit Fees | | $ | 29,050 | | | $ | 29,500 | |
Audit-Related Fees(1) | | $ | 0 | | | $ | 0 | |
Tax Fees(2) | | $ | 3,450 | | | $ | 0 | |
All Other Fees(3) | | $ | 0 | | | $ | 0 | |
| | | | | | | | |
Total | | $ | 32,500 | | | $ | 29,500 | |
| | | | | | | | |
| | | | | | | | |
| Eaton Vance Government Opportunities Fund | | | | | | |
Fiscal Years Ended | | 10/31/22 | | | 10/31/23 | |
Audit Fees | | $ | 61,433 | | | $ | 61,300 | |
Audit-Related Fees(1) | | $ | 0 | | | $ | 0 | |
Tax Fees(2) | | $ | 350 | | | $ | 0 | |
All Other Fees(3) | | $ | 0 | | | $ | 1,033 | |
| | | | | | | | |
Total | | $ | 61,783 | | | $ | 62,333 | |
| | | | | | | | |
| | | | | | | | |
| Eaton Vance High Income Opportunities Fund | | | | | | |
Fiscal Years Ended | | 10/31/22 | | | 10/31/23 | |
Audit Fees | | $ | 28,350 | | | $ | 28,800 | |
Audit-Related Fees(1) | | $ | 0 | | | $ | 0 | |
Tax Fees(2) | | $ | 350 | | | $ | 0 | |
All Other Fees(3) | | $ | 0 | | | $ | 833 | |
| | | | | | | | |
Total | | $ | 28,700 | | | $ | 29,633 | |
| | | | | | | | |
| | | | | | | | |
| Eaton Vance Multi-Asset Credit Fund | | | | | | |
Fiscal Years Ended | | 10/31/22 | | | 10/31/23 | |
Audit Fees | | $ | 81,233 | | | $ | 80,100 | |
Audit-Related Fees(1) | | $ | 0 | | | $ | 0 | |
Tax Fees(2) | | $ | 4,750 | | | $ | 0 | |
All Other Fees(3) | | $ | 0 | | | $ | 533 | |
| | | | | | | | |
Total | | $ | 85,983 | | | $ | 80,633 | |
| | | | | | | | |
| | | | | | | | |
| Eaton Vance Short Duration Government Income Fund | | | | | | |
Fiscal Years Ended | | 10/31/22 | | | 10/31/23 | |
Audit Fees | | $ | 95,367 | | | $ | 92,900 | |
Audit-Related Fees(1) | | $ | 0 | | | $ | 0 | |
Tax Fees(2) | | $ | 350 | | | $ | 0 | |
All Other Fees(3) | | $ | 0 | | | $ | 2,167 | |
| | | | | | | | |
Total | | $ | 95,717 | | | $ | 95,067 | |
| | | | | | | | |
| | | | | | | | |
| Eaton Vance Short Duration High Income Fund | | | | | | |
Fiscal Years Ended | | 10/31/22 | | | 10/31/23 | |
Audit Fees | | $ | 58,650 | | | $ | 59,100 | |
Audit-Related Fees(1) | | $ | 0 | | | $ | 0 | |
Tax Fees(2) | | $ | 350 | | | $ | 0 | |
All Other Fees(3) | | $ | 0 | | | $ | 0 | |
| | | | | | | | |
Total | | $ | 59,000 | | | $ | 59,100 | |
| | | | | | | | |
| | | | | | | | |
| Eaton Vance Short Duration Strategic Income Fund | | | | | | |
Fiscal Years Ended | | 10/31/22 | | | 10/31/23 | |
Audit Fees | | $ | 53,650 | | | $ | 54,100 | |
Audit-Related Fees(1) | | $ | 0 | | | $ | 0 | |
Tax Fees(2) | | $ | 2,150 | | | $ | 0 | |
All Other Fees(3) | | $ | 0 | | | $ | 0 | |
| | | | | | | | |
Total | | $ | 55,800 | | | $ | 54,100 | |
| | | | | | | | |
| | | | | | | | |
| Eaton Vance Tax-Managed Equity Asset Allocation Fund | | | | | | |
Fiscal Years Ended | | 10/31/22 | | | 10/31/23 | |
Audit Fees | | $ | 43,650 | | | $ | 44,100 | |
Audit-Related Fees(1) | | $ | 0 | | | $ | 0 | |
Tax Fees(2) | | $ | 3,150 | | | $ | 0 | |
All Other Fees(3) | | $ | 0 | | | $ | 0 | |
| | | | | | | | |
Total | | $ | 46,800 | | | $ | 44,100 | |
| | | | | | | | |
| | | | | | | | |
| Eaton Vance Tax-Managed Global Dividend Income Fund | | | | | | |
Fiscal Years Ended | | 10/31/22 | | | 10/31/23 | |
Audit Fees | | $ | 43,950 | | | $ | 44,400 | |
Audit-Related Fees(1) | | $ | 0 | | | $ | 0 | |
Tax Fees(2) | | $ | 6,200 | | | $ | 0 | |
All Other Fees(3) | | $ | 0 | | | $ | 1,000 | |
| | | | | | | | |
Total | | $ | 50,150 | | | $ | 45,400 | |
| | | | | | | | |
| | | | | | | | |
| Eaton Vance Tax-Managed Multi-Cap Growth Fund | | | | | | |
Fiscal Years Ended | | 10/31/22 | | | 10/31/23 | |
Audit Fees | | $ | 17,550 | | | $ | 18,000 | |
Audit-Related Fees(1) | | $ | 0 | | | $ | 0 | |
Tax Fees(2) | | $ | 1,650 | | | $ | 0 | |
All Other Fees(3) | | $ | 0 | | | $ | 0 | |
| | | | | | | | |
Total | | $ | 19,200 | | | $ | 18,000 | |
| | | | | | | | |
| | | | | | | | |
| Eaton Vance Tax-Managed Small-Cap Fund | | | | | | |
Fiscal Years Ended | | 10/31/22 | | | 10/31/23 | |
Audit Fees | | $ | 19,750 | | | $ | 20,200 | |
Audit-Related Fees(1) | | $ | 0 | | | $ | 0 | |
Tax Fees(2) | | $ | 1,650 | | | $ | 0 | |
All Other Fees(3) | | $ | 0 | | | $ | 0 | |
| | | | | | | | |
Total | | $ | 21,400 | | | $ | 20,200 | |
| | | | | | | | |
| | | | | | | | |
| Eaton Vance Tax-Managed Value Fund | | | | | | |
Fiscal Years Ended | | 10/31/22 | | | 10/31/23 | |
Audit Fees | | $ | 21,550 | | | $ | 22,000 | |
Audit-Related Fees(1) | | $ | 0 | | | $ | 0 | |
Tax Fees(2) | | $ | 1,300 | | | $ | 0 | |
All Other Fees(3) | | $ | 0 | | | $ | 0 | |
| | | | | | | | |
Total | | $ | 22,850 | | | $ | 22,000 | |
| | | | | | | | |
| | | | | | | | |
| Parametric Tax-Managed International Equity Fund | | | | | | |
Fiscal Years Ended | | 10/31/22 | | | 10/31/23 | |
Audit Fees | | $ | 17,650 | | | $ | 18,100 | |
Audit-Related Fees(1) | | $ | 0 | | | $ | 0 | |
Tax Fees(2) | | $ | 1,650 | | | $ | 0 | |
All Other Fees(3) | | $ | 0 | | | $ | 0 | |
| | | | | | | | |
Total | | $ | 19,300 | | | $ | 18,100 | |
| | | | | | | | |
| (1) | Audit-related fees consist of the aggregate fees billed for assurance and related services that are reasonably related to the performance of the audit of financial statements and are not reported under the category of audit fees. |
| (2) | Tax fees consist of the aggregate fees billed for professional services rendered by the principal accountant relating to tax compliance, tax advice, and tax planning and specifically include fees for tax return preparation and other related tax compliance/planning matters. |
| (3) | All other fees consist of the aggregate fees billed for products and services provided by the principal accountant other than audit, audit-related, and tax services. |
The various Series comprising the Trust have differing fiscal year ends (January 31, February 28, July 31, September 30, October 31, November 30, or December 31). The following table presents the aggregate audit, audit-related, tax, and other fees billed to all of the Series in the Trust by D&T for the last two fiscal years of each Series.
| | | | | | | | | | | | | | | | | | | | | | | | | | | | | | | | | | | | | | | | | | | | | | | | |
Fiscal Years Ended | | 11/30/21 | | | 12/31/21 | | | 1/31/22 | | | 2/28/22 | | | 9/30/22 | | | 10/31/22 | | | 11/30/22 | | | 12/31/22 | | | 1/31/23 | | | 2/28/23 | | | 9/30/23 | | | 10/31/23 | |
Audit Fees | | $ | 37,050 | | | $ | 111,700 | | | $ | 198,900 | | | $ | 24,050 | | | $ | 104,200 | | | $ | 816,633 | | | $ | 41,150 | | | $ | 130,600 | | | $ | 172,250 | | | $ | 27,150 | | | $ | 117,600 | | | $ | 828,300 | |
Audit-Related Fees(1) | | $ | 0 | | | $ | 0 | | | $ | 0 | | | $ | 0 | | | $ | 0 | | | $ | 0 | | | $ | 0 | | | $ | 0 | | | $ | 0 | | | $ | 0 | | | $ | 0 | | | $ | 0 | |
Tax Fees(2) | | $ | 13,000 | | | $ | 61,738 | | | $ | 78,353 | | | $ | 8,478 | | | $ | 5,000 | | | $ | 44,100 | | | $ | 0 | | | $ | 16,150 | | | $ | 14,695 | | | $ | 1,650 | | | $ | 0 | | | $ | 0 | |
All Other Fees(3) | | $ | 0 | | | $ | 0 | | | $ | 0 | | | $ | 0 | | | $ | 0 | | | $ | 0 | | | $ | 0 | | | $ | 0 | | | $ | 0 | | | $ | 0 | | | $ | 0 | | | $ | 5,566 | |
| | | | | | | | | | | | | | | | | | | | | | | | | | | | | | | | | | | | | | | | | | | | | | | | |
Total | | $ | 50,050 | | | $ | 173,438 | | | $ | 277,253 | | | $ | 32,528 | | | $ | 109,200 | | | $ | 860,733 | | | $ | 41,150 | | | $ | 146,750 | | | $ | 186,945 | | | $ | 28,800 | | | $ | 117,600 | | | $ | 833,866 | |
| | | | | | | | | | | | | | | | | | | | | | | | | | | | | | | | | | | | | | | | | | | | | | | | |
| (1) | Audit-related fees consist of the aggregate fees billed for assurance and related services that are reasonably related to the performance of the audit of the registrant’s financial statements and are not reported under the category of audit fees. Includes consent fee for N-14 registration statements related to fund mergers. |
| (2) | Tax fees consist of the aggregate fees billed for professional services rendered by the principal accountant relating to tax compliance, tax advice, and tax planning and specifically include fees for tax return preparation and other related tax compliance/planning matters. |
| (3) | All other fees consist of the aggregate fees billed for products and services provided by the principal accountant other than audit, audit-related, and tax services. |
(e)(1) The registrant’s audit committee has adopted policies and procedures relating to the pre-approval of services provided by the registrant’s principal accountant (the “Pre-Approval Policies”). The Pre-Approval Policies establish a framework intended to assist the audit committee in the proper discharge of its pre-approval responsibilities. As a general matter, the Pre-Approval Policies (i) specify certain types of audit, audit-related, tax, and other services determined to be pre-approved by the audit committee; and (ii) delineate specific procedures governing the mechanics of the pre-approval process, including the approval and monitoring of audit and non-audit service fees. Unless a service is specifically pre-approved under the Pre-Approval Policies, it must be separately pre-approved by the audit committee.
The Pre-Approval Policies and the types of audit and non-audit services pre-approved therein must be reviewed and ratified by the registrant’s audit committee at least annually. The registrant’s audit committee maintains full responsibility for the appointment, compensation, and oversight of the work of the registrant’s principal accountant.
(e)(2) No services described in paragraphs (b)-(d) above were approved by the registrant’s audit committee pursuant to the “de minimis exception” set forth in Rule 2-01(c)(7)(i)(C) of Regulation S-X.
(f) Not applicable.
(g) The following table presents (i) the aggregate non-audit fees (i.e., fees for audit-related, tax, and other services) billed for services rendered to all of the Series in the Trust by D&T for the last two fiscal years of each Series; and (ii) the aggregate non-audit fees (i.e., fees for audit-related, tax, and other services) billed to the Eaton Vance organization by D&T for the last two fiscal years of each Series.
| | | | | | | | | | | | | | | | | | | | | | | | | | | | | | | | | | | | | | | | |
Fiscal Years Ended | | 12/31/21 | | | 1/31/22 | | | 2/28/22 | | | 9/30/22 | | | 10/31/22 | | | 12/31/22 | | | 1/31/23 | | | 2/28/23 | | | 9/30/23 | | | 10/31/23 | |
Registrant(1) | | $ | 61,738 | | | $ | 78,353 | | | $ | 8,478 | | | $ | 5,000 | | | $ | 44,100 | | | $ | 16,150 | | | $ | 14,695 | | | $ | 4,350 | | | $ | 0 | | | $ | 5,566 | |
Eaton Vance(2) | | $ | 51,800 | | | $ | 51,800 | | | $ | 51,800 | | | $ | 52,836 | | | $ | 52,836 | | | $ | 0 | | | $ | 0 | | | $ | 0 | | | $ | 52,836 | | | $ | 0 | |
| (1) | Includes all of the Series of the Trust. During the fiscal years reported above, certain of the Funds were “feeder” funds in a “master-feeder” fund structure or funds of funds. |
| (2) | Various subsidiaries of Morgan Stanley. act in either an investment advisory and/or service provider capacity with respect to the Series and/or their respective “master” funds (if applicable). |
(h) The registrant’s audit committee has considered whether the provision by the registrant’s principal accountant of non-audit services to the registrant’s investment adviser and any entity controlling, controlled by, or under common control with the adviser that provides ongoing services to the registrant that were not pre-approved pursuant to Rule 2-01(c)(7)(ii) of Regulation S-X is compatible with maintaining the principal accountant’s independence.
(i) Not applicable.
(j) Not applicable.
Item 5. Audit Committee of Listed Registrants
Not applicable.
Item 6. Schedule of Investments
Please see schedule of investments contained in the Report to Stockholders included under Item 1 of this Form N-CSR.
Item 7. Disclosure of Proxy Voting Policies and Procedures for Closed-End Management Investment Companies
Not applicable.
Item 8. Portfolio Managers of Closed-End Management Investment Companies
Not applicable.
Item 9. Purchases of Equity Securities by Closed-End Management Investment Company and Affiliated Purchasers
Not applicable.
Item 10. Submission of Matters to a Vote of Security Holders
No material changes.
Item 11. Controls and Procedures
(a) It is the conclusion of the registrant’s principal executive officer and principal financial officer that the effectiveness of the registrant’s current disclosure controls and procedures (such disclosure controls and procedures having been evaluated within 90 days of the date of this filing) provide reasonable assurance that the information required to be disclosed by the registrant has been recorded, processed, summarized and reported within the time period specified in the Commission’s rules and forms and that the information required to be disclosed by the registrant has been accumulated and communicated to the registrant’s principal executive officer and principal financial officer in order to allow timely decisions regarding required disclosure.
(b) There have been no changes in the registrant’s internal controls over financial reporting during the period covered by this report that has materially affected, or is reasonably likely to materially affect, the registrant’s internal control over financial reporting.
Item 12. Disclosure of Securities Lending Activities for Closed-End Management Investment Companies
Not applicable.
Item 13. Exhibits
Signatures
Pursuant to the requirements of the Securities Exchange Act of 1934 and the Investment Company Act of 1940, the registrant has duly caused this report to be signed on its behalf by the undersigned, thereunto duly authorized.
| | |
| Eaton Vance Mutual Funds Trust |
| |
| By: | | /s/ Kenneth A. Topping |
| | Kenneth A. Topping |
| | President |
Date: December 22, 2023
Pursuant to the requirements of the Securities Exchange Act of 1934 and the Investment Company Act of 1940, this report has been signed below by the following persons on behalf of the registrant and in the capacities and on the dates indicated.
| | |
| By: | | /s/ James F. Kirchner |
| | James F. Kirchner |
| | Treasurer |
Date: December 22, 2023
| | |
| By: | | /s/ Kenneth A. Topping |
| | Kenneth A. Topping |
| | President |
Date: December 22, 2023