UNITED STATES
SECURITIES AND EXCHANGE COMMISSION
Washington, D.C. 20549
FORM N-CSR
CERTIFIED SHAREHOLDER REPORT OF REGISTERED MANAGEMENT
INVESTMENT COMPANIES
Investment Company Act file number 811-04014
Meridian Fund, Inc.®
(Exact name of registrant as specified in charter)
100 Fillmore St., Suite 325
Denver, CO 80206
(Address of principal executive offices) (Zip code)
David J. Corkins
100 Fillmore St., Suite 325
Denver, CO 80206
(Name and address of agent for service)
Registrant’s telephone number, including area code: 303-398-2929
Date of fiscal year end: June 30
Date of reporting period: December 31, 2021
| Item 1. | Reports to Stockholders. |
| (a) | Include a copy of the report transmitted to stockholders pursuant to Rule 30e-1 under the Act (17 CFR 270.30e-1). |
The Report to Shareholders is attached herewith.


Portfolio Performance and Composition (Unaudited)
| • | ON Semiconductor Corp. is a semiconductor manufacturer with a diverse product portfolio and high exposure to the attractive automotive and industrials end markets. ON Semi’s exposure to the auto end market is particularly attractive as advanced driver assistance systems and self-driving features have led to strong demand for the semiconductors that power these technologies. The company is also well-positioned in the industrials end market, where it benefits from low pricing pressure due to the longer lifecycle of industrials products relative to consumer products. ON continued to benefit from a global semiconductor shortage driven by a combination of strong demand across a wide range of industries and supply chain disruptions. Investors bid shares higher as the company grew revenues 32%, expanded gross margins by over 300 bps, and grew adjusted EPS in excess of 200%. We were pleased with ON’s execution during the period and are optimistic that it will hit the long-term financial goals set out by management earlier in the year. Although we trimmed the stock during the period, the Fund continues to hold a meaningful position. |
| • | Rivian Automotive, Inc. manufactures electric vehicles (EV) for the consumer and commercial markets. We initially invested the Fund in the company when it was privately owned and were excited to see its value rise to $90 billion during its initial public offering in November. One of the things that differentiates this startup is its substantial financial backing: Amazon.com, Ford Motor Co., and other companies with considerable financial resources have made large investments in the EV manufacturer. Rivian has 71,000 preorders for its R1 pickup truck |
| Meridian Funds | 4 | www.meridianfund.com |
Portfolio Performance and Composition (Unaudited) (continued)
| and SUV and has a contract with Amazon.com to deliver 100,000 delivery vans over the next few years. With its healthy balance sheet, we expect the company to expand capacity from 200,000 units today to a much larger number as they build new manufacturing facilities globally. During the period we maintained the Fund's position in the stock. | |
| • | Matson, Inc. is a provider of ocean transportation and logistics services. The company transports freight between the continental U.S. and ports in Alaska, Hawaii, and China. One of the things that attracted us to Matson is its position as one of the leading shipping companies operating under the Jones Act, a federal statute that allows only American-owned and-built vessels crewed by Americans to transport goods between U.S. ports. In addition, we also like Matson’s expedited China service, which has a large time advantage over traditional steamship lines. The company also has its own terminal operations in west coast ports which provides a further transit advantage due to the current backlog of ships waiting to be unloaded. The stock’s strong performance during the period was driven by pandemic-related disruptions and delays in air freight shipping between China and the U.S., which led to increased demand for ocean transportation and drove shipping container rates higher. These dynamics supported substantial earnings growth for Matson, which, for the third quarter, reported a 300% year-over-year increase in earnings. During the period, we trimmed the Fund's exposure in the stock, but maintained a sizeable position in Matson. |
| • | Vroom, Inc. operates an end-to-end e-commerce platform for the used car industry. We believe Vroom is well-positioned to benefit from a growing trend in which used car customers are choosing the online shopping experience over the traditional car lot experience. We believe only a few e-commerce platforms will be able to take significant market share from traditional used car dealers due to inventory, sourcing, and operational challenges that most online sellers will be unable to overcome. We are confident Vroom, which is currently the second-largest player in this space, will be among the ultimate winners. Although Vroom’s revenue growth remained strong, its cash burn continued to worry investors. A couple of operational missteps also reduced investors’ confidence in Vroom. We believe management will correct recent operational mistakes and begin demonstrating better conversion of revenue growth to profitability over time. As such, we maintained the Fund's position in the stock. |
| • | 2U, Inc. is an educational technology firm that partners with leading nonprofit colleges and universities to offer online degree programs. 2U has many of the qualities that we believe define a good business including long-term contracts and recurring revenue; attractive unit economics that should deliver strong EBITDA margins at scale; and strong brand recognition with marquee university partners to drive continued growth. However, the stock drifted lower as investors became concerned about the rising cost of lead generation – money 2U is spending to attract new students – and digested news of 2U’s acquisition of edX, an online course provider created by Harvard and MIT. We believe 2U is skillfully navigating these challenges and that its merger with edX will expand 2U’s access to affordable, high-quality online education globally. The company reported third-quarter revenues that were up 16%, and issued strong full-year guidance, adding to our conviction in its long-term growth potential. During the period, we maintained the Fund's position in the company. |
| • | 8x8, Inc. is a cloud communications provider that offers businesses a unified voice, contact center, video, and chat platform. The company hired a new CEO in late ’20 who has since refocused the company on areas of the market where 8x8 has competitive advantages and the potential to earn higher margins. In conjunction with this change in strategy, the company exited low growth and low margin product lines which has led to what we believe is a temporary slowdown in revenue growth. This deceleration in revenue growth has pressured the stock along with 8x8’s proposed $250 million buyout of cloud-based communications firm Fuze which will increase leverage on the balance sheet. Our research suggests 8x8’s financial rationale for buying Fuze is solid, as it should allow 8x8 to generate immediate free cash flow and improved profitability. We feel confident that these headwinds will reverse in 2022 and are comfortable with the Fund's position in the stock. We believe 8x8 has the potential to accelerate growth, improve margins, and that the stock trades at an attractive valuation relative to other cloud communication companies. |
| Meridian Funds | 5 | www.meridianfund.com |
Portfolio Performance and Composition (Unaudited) (continued)
| Meridian Funds | 6 | www.meridianfund.com |
Portfolio Performance and Composition (Unaudited) (continued)

| Inception | 6 Month | 1 Year | 5 Year | 10 Year | Since Inception | |
| Legacy Class (MERDX) | 8/1/84 | (0.39)% | 15.12% | 16.50% | 14.07% | 12.88% |
| Institutional Class (MRRGX) | 12/24/14 | (0.34)% | 15.16% | 16.53% | — | 13.01% |
| Class A (MRAGX) w/o sales charge | 11/15/13 | (0.53)% | 14.76% | 16.14% | — | 12.54% |
| Class A (MRAGX) with sales charge1 | 11/15/13 | (6.25)% | 8.16% | 14.78% | — | 11.72% |
| Class C (MRCGX) | 7/1/15 | (0.88)% | 13.94% | 15.31% | — | 12.30% |
| Investor Class (MRIGX) | 11/15/13 | (0.41)% | 15.01% | 16.45% | — | 12.88% |
| Russell 2500® Growth Index | 8/1/84 2 | (3.34)% | 5.04% | 17.65% | 15.75% | N/A 3 |
| 1 | Assuming maximum sales charge, if any. Class A Shares are subject to a maximum initial sales charge of 5.75%. |
| 2 | Inception date of Legacy Class Shares. |
| 3 | Inception date of Legacy Class precedes the inception date of Russell 2500® Growth Index. |
| Meridian Funds | 7 | www.meridianfund.com |
Portfolio Composition (Unaudited)
| STERIS Plc | 3.4% |
| Ziff Davis, Inc. | 2.7% |
| Matson, Inc. | 2.7% |
| Rhino (E) Investment Holdings, LLC Acquisition Date: 7/10/20, Cost $10,236,000 | 2.7% |
| Skechers U.S.A., Inc. Class A | 2.6% |
| ON Semiconductor Corp. | 2.5% |
| Sensata Technologies Holding Plc | 2.4% |
| TriNet Group, Inc. | 2.3% |
| Sally Beauty Holdings, Inc. | 2.3% |
| Ritchie Bros. Auctioneers, Inc. (Canada) | 2.0% |

| Meridian Funds | 8 | www.meridianfund.com |
Portfolio Performance and Composition (Unaudited)
| • | Smart Global Holdings, Inc. is a diversified technology company with leading market positions in memory, LEDs, high-performance computing (HPC), and the internet of things (IoT). SMART Global Holdings hit a rough patch in 2019-early 2020 when earnings declined due to a combination of volatility in its memory business caused by |
| Meridian Funds | 9 | www.meridianfund.com |
Portfolio Performance and Composition (Unaudited) (continued)
| weakness in Brazil and inventory corrections; growth investments the company had made in new products ahead of revenue; and order delays in its HPC business. While none of these developments is particularly unusual, it is uncommon for all three to turn negative at the same time. Our thesis was that the company’s new management team could not only smooth out some of the volatility in the business but also drive growth through superior capital allocation and organic investment. With the stock trading at less than 8x earnings at the time of the Fund's investment (Q3 2020), we felt the risk/reward was excellent. During the period, the stock rallied following news of the company’s seventh consecutive earnings beat. Estimates for 2021 were up 100% over 2020 and estimates for 2022 are up 74% since the Fund's original purchase. Despite the strong stock performance, SMART Global Holdings trades at less than 10x price-to-earnings on fiscal 2022 estimates. We believe this is excellent value for a well-managed company with strong secular tailwinds and double-digit earnings growth potential. While we modestly trimmed the Fund's position to manage overall risk in the portfolio, SMART Global Holdings remains a large portfolio position. | |
| • | ON Semiconductor Corp. is a semiconductor manufacturer with a diverse product portfolio and high exposure to the attractive automotive and industrial end markets. ON Semi’s exposure to the auto end market is particularly attractive as advanced driver assistance systems and self-driving features have led to strong demand for the semiconductors that power these technologies. We believe the company is also well-positioned in the industrials end market, where it benefits from low pricing pressure due to the longer lifecycle of industrials products relative to consumer products. ON continued to benefit from a global chip shortage driven by a combination of strong demand across a wide range of industries and supply chain disruptions. Investors bid shares higher as the chipmaker grew revenues +32%, gross margins expanded over 300 bps, and EPS growth increased over 200%. We were pleased with the chip maker’s execution during the period and are optimistic about its longer-term performance goals. Although we trimmed the stock, the Fund continues to hold a meaningful position in the Fund. |
| • | Ambarella, Inc. designs system-on-a-chip semiconductor solutions specializing in visual processing for the security, industrial and automotive markets. We began building a position in Ambarella in the third quarter of 2017, following a decline in the chipmaker’s earnings caused by sales shortfalls at camera company GoPro, which is one of Ambarella’s larger customers. Our investment thesis was that emerging artificial intelligence (AI), automotive, industrial, and security markets would soon dwarf the declining consumer market. Ambarella’s stock gained during the period, driven by robust demand for AI-enabled computer vision chips in applications such as advanced driver assistance, self-driving vehicles, industrial automation, and security systems. Earnings expectations for 2022 doubled over 2021, with revenue estimates up 29%. Although we trimmed the Fund's position following the stock’s strong performance, it remains a sizeable holding in the Fund, as we believe Ambarella’s strength in the automotive market will drive strong earnings growth for several years and that potential for sales in industrial and robotics markets are underappreciated. The company is also an attractive acquisition target for a larger semiconductor company. |
| • | Deciphera Pharmaceuticals, Inc. is a clinical-stage biopharmaceutical firm focused on tackling key mechanisms of drug resistance that limit the effectiveness of many cancer therapies. We were drawn to this company for its promising pipeline of developmental drugs. The disappointing commercial launch of Deciphera’s lead drug (Qinlock), a treatment for patients with advanced gastrointestinal stromal tumors (GIST), pressured the stock earlier this year. GIST is a rare type of cancer, leading some investors to question the market opportunity in this space. We were optimistic that phase III clinical trials for expanded applications for Qinlock would lead to approval of the drug as a second-line treatment for GIST. To our disappointment, Deciphera announced in November that Qinlock did not meet its primary endpoint in the clinical trials, sending shares sharply lower. During the period, we sold the Fund's position in the stock. |
| • | Sabre Corp. provides technology system connections and support to the global travel industry. The company’s software and solutions enable airlines, hoteliers, agencies, and online travel marketplaces to manage airline scheduling and revenue systems internally and to easily connect with other travel industry providers. The Fund's investment in Sabre was motivated by a new management team’s commitment to strategically realign the business. Specifically, management was focused on replacing legacy technology systems managed internally with hybrid cloud-based systems that would reduce costs and speed up the development of new products. The final |
| Meridian Funds | 10 | www.meridianfund.com |
Portfolio Performance and Composition (Unaudited) (continued)
| stages of the upgrades occurred in late 2020, which set up this travel-sensitive business as a strong recovery play with internal catalysts and strong potential to gain share among the market in which Sabre operates. Most of the stock’s underperformance occurred prior to the Omicron outbreak, as Sabre lost part of a key contract with Expedia. We liquidated the Fund's position in the stock, as our process is focused on businesses that have strong enough competitive advantages to improve their own results. Internally driven cost improvements at Sabre have not been evident in 2021, despite a partial recovery in travel volumes. While Sabre’s new systems have led to several product launches and new partners in 2021, these gains have been offset by losses from long-time partners that have impeded Sabre’s cash flow recovery. Additionally, the travel industry shows continued strains of COVID disruptions in international and business travel, which historically have been Sabre’s most profitable business lines. | |
| • | Heron Therapeutics, Inc. is a biotechnology company. Its product portfolio includes two treatments for cancer patients suffering from nausea as a result of chemotherapy, both of which currently are already on the market. We invested the Fund in Heron due to the large market opportunity for the company’s investigational post-operative pain-management drug Zynrelef. Since the Fund's initial investment, the FDA has approved Zynrelef for pain associated with bunion surgery, open inguinal herniorrhaphy (hernia), and total knee arthroplasty – a narrower label than investors had originally hoped for, which caused the stock to decline in the period. Adding to the market’s disappointment were weak sales of Heron’s anti-nausea drugs. Late in the period, however, the FDA reviewed a new application for the expanded use of Znyrelef and approved the drug for use in adults for soft-tissue or periarticular instillation following foot or ankle surgery, small-to-medium open abdominal surgery and lower extremity total joint arthroplasty surgery. We believe there is an opportunity for Zynrelef’s label and use to be expanded even further and maintained the Fund's position in the stock. Notably, because Zynrelef is a non-opioid drug, it could help to stem opioid abuse. |
| Meridian Funds | 11 | www.meridianfund.com |
Portfolio Performance and Composition (Unaudited) (continued)
| Meridian Funds | 12 | www.meridianfund.com |
Portfolio Performance and Composition (Unaudited) (continued)
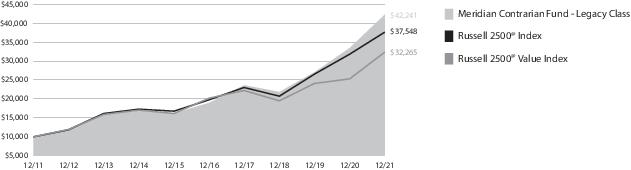
| Inception | 6 Month | 1 Year | 5 Year | 10 Year | Since Inception | |
| Legacy Class (MVALX) | 2/10/94 | 4.72% | 26.12% | 17.43% | 15.50% | 13.52% |
| Class A (MFCAX) w/o sales charge | 11/15/13 | 4.57% | 25.72% | 16.99% | — | 12.86% |
| Class A (MFCAX) with sales charge1 | 11/15/13 | (1.45)% | 18.49% | 15.61% | — | 12.04% |
| Class C (MFCCX) | 7/1/15 | 4.20% | 24.83% | 16.24% | — | 13.30% |
| Investor Class (MFCIX) | 11/15/13 | 4.70% | 26.06% | 17.29% | — | 13.16% |
| Russell 2500® Index | 2/10/94 2 | 1.04% | 18.18% | 13.75% | 14.15% | 10.84% |
| Russell 2500® Value Index | 2/10/94 2 | 4.16% | 27.78% | 9.88% | 12.43% | 10.72% |
| 1 | Assuming maximum sales charge, if any. Class A Shares are subject to a maximum initial sales charge of 5.75%. |
| 2 | Inception date of Legacy Class Shares. |
| Meridian Funds | 13 | www.meridianfund.com |
Portfolio Composition (Unaudited)
| SMART Global Holdings, Inc. | 3.8% |
| CNH Industrial, N.V. (United Kingdom) | 3.1% |
| DigitalBridge Group, Inc. | 2.8% |
| Axis Capital Holdings Ltd. | 2.7% |
| Juniper Networks, Inc. | 2.6% |
| First Horizon Corp. | 2.5% |
| Alexander & Baldwin, Inc. | 2.3% |
| U.S. Bancorp | 2.3% |
| Acadia Healthcare Co., Inc. | 2.3% |
| AMERCO | 2.2% |
| Meridian Funds | 14 | www.meridianfund.com |
Portfolio Performance and Composition (Unaudited)
| • | An owner and operator of mission critical broadband architecture in key markets across the U.S., Altice retreated as it contended with a decelerating customer addition rate while it ramped up investments in its network and services. Given the company’s assertion that it possesses best-in-class operating capabilities, the developments |
| Meridian Funds | 15 | www.meridianfund.com |
Portfolio Performance and Composition (Unaudited) (continued)
| have been frustrating. Furthermore, Altice’s leverage profile remains stretched following a number of acquisitions, and competitive concerns continue to escalate. Although the stock is languishing near what should be a floor, especially given its potential appeal as a buyout candidate, we are re-evaluating the Fund's investment thesis in the company. | |
| • | As of the date of this report we’re standing by Alkami, which faltered during the period in the wake of an IPO-fueled spike during the second quarter. A developer of cloud-based digital banking and software services for U.S.-based banks and credit unions, Alkami allows its customers to outsource a non-core function, software development, while benefiting from an enterprise grade software suite. The company is capturing share within a sizeable addressable market, provides a mission critical service to its client base, and benefits from highly attractive unit economics. During the period, it acquired MK Decision, a developer of digital account and loan origination services, and brought on a new CEO. We continue to believe in its essential role as a digital enabler for community and regional banks. |
| • | Vroom also struggled during the second half of 2021 despite encouraging unit growth and topline metrics. The automobile e-commerce ecosystem has been challenged by high demand and low supply dynamics as ongoing semiconductor chip shortages have hindered new vehicle inventories. Uncertainties around Vroom’s underlying economics have weighed on its stock price, although we’re encouraged that management has initiated operational changes to drive consistent and sustained improvements in performance while capitalizing on steadily increasing growth. |
| • | With more than 500 million downloads of its software worldwide, Duolingo is a leading language learning platform. It offers courses in 40 different languages, and we are attracted to the company’s success at reducing barriers to access and learning, the efficiency and affordability facilitated by its mobile app, and the fun inherent in its gamification of content. A digital native company, Duolingo fits well within the Fund's strategy of finding companies that are successfully using emerging technology to change legacy systems and industries. During the third quarter, the company went public and reported impressive quarterly results, especially in comparison to its strong second quarter of 2020, when we were all learning to live with lockdowns. In the wake of the stock’s sharp rise and implications for valuation, we exited the Fund's position. |
| • | The Fund participated in the fourth-quarter IPO of Rivian Automotive and it immediately proved advantageous. An emerging leader within the burgeoning electric vehicle (EV) space, Rivian is built upon the combination of visionary leadership and more than a decade of effort in building a leading edge platform infrastructure. The company’s differentiated product targets the large and currently underserved sport utility vehicle and light truck markets; it has a strategic alignment with the likes of Amazon for last mile delivery vehicles, and its highly scalable chassis provides flexibility to launch new vehicle offerings. Ultimately, we view the company as well positioned to be a market share gainer among both incumbent auto manufacturers and “pretenders” within the EV market. Due to ArrowMark’s effort to build a relationship with company leadership over the last two years, the Fund was able to build on this momentum when it went public. |
| • | Apple, Inc. continues to set a high bar for the consumer electronics industry, developing and refining hardware, software, and services that leverage significant brand equity while being deeply embedded in customers’ daily professional and leisure experiences. Although supply chain constraints kept the company from meeting revenue expectations, it still posted gains across its diverse product lines. A notable bright spot was the 26% year-over-year growth in the services division, which includes the App Store and music and video subscriptions. Apple closed 2021 on a strong note amid high holiday sales expectations, especially for its iPhone 13 and AirPods, and reports that it was targeting 2025 to bring an EV to market. |
| Meridian Funds | 16 | www.meridianfund.com |
Portfolio Performance and Composition (Unaudited) (continued)
| Meridian Funds | 17 | www.meridianfund.com |
Portfolio Performance and Composition (Unaudited) (continued)

| Inception | 6 Month | 1 Year | 5 Year | 10 Year | Since Inception | |
| Legacy Class (MEIFX) | 1/31/05 | 4.33% | 14.92% | 21.73% | 15.98% | 11.01% |
| Class A (MRAEX) w/o sales charge | 11/15/13 | 4.18% | 14.61% | 21.31% | — | 14.86% |
| Class A (MRAEX) with sales charge1 | 11/15/13 | (1.83)% | 8.01% | 19.88% | — | 14.02% |
| Class C (MRCEX) | 7/1/15 | 3.86% | 14.05% | 20.79% | — | 16.41% |
| Investor Class (MRIEX) | 11/15/13 | 4.35% | 15.11% | 21.63% | — | 15.15% |
| S&P 500® Index | 1/31/05 2 | 11.67% | 28.71% | 18.47% | 16.55% | 10.82% |
| 1 | Assuming maximum sales charge, if any. Class A Shares are subject to a maximum initial sales charge of 5.75%. |
| 2 | Inception date of Legacy Class Shares. |
| Meridian Funds | 18 | www.meridianfund.com |
Portfolio Composition (Unaudited)
| ON Semiconductor Corp. | 7.1% |
| Wells Fargo & Co. | 6.3% |
| Lamb Weston Holdings, Inc. | 6.0% |
| Coty, Inc. Class A | 5.2% |
| Spectrum Brands Holdings, Inc. | 5.1% |
| Sally Beauty Holdings, Inc. | 5.1% |
| Skechers U.S.A., Inc. Class A | 4.9% |
| Live Nation Entertainment, Inc. | 4.7% |
| UiPath, Inc. Class A | 4.1% |
| Dole Plc | 4.0% |
| Meridian Funds | 19 | www.meridianfund.com |
Portfolio Performance and Composition (Unaudited)
| • | Echo Global Logistics, Inc. is an asset-light transportation company providing technology-enabled transportation and supply chain management solutions. We believe Echo’s proprietary technology platforms for truckload quoting and transit times fulfill a growing need within the commercial trucking industry. By helping link supply and demand between smaller shippers and carriers, Echo’s solutions enable both parties to increase productivity and efficiency. As a result, smaller carriers can reduce the number of empty miles and improve profitability while shippers can gain access to a significant amount of trucking capacity among smaller carriers. The company’s stock soared during the period after The Jordan Company, a private equity firm, offered to buy Echo at more than a 50% premium to its stock price. The acquisition was completed in November, and we were pleased to see our investment thesis validated. |
| • | Mimecast Ltd. is a cybersecurity company focused primarily on email security. The company’s customers consist predominantly of mid-sized businesses, but in recent years Mimecast has been successfully expanding into the large enterprise market. Despite continued investments in products and the sales force, we believe management has done an exceptional job balancing growth with profitability. As one of the largest providers of email security, Mimecast has been able to build a database of potential threats that is more robust than that of many competitors. As a result, the company is able to capture and quarantine a higher number of harmful emails while avoiding capturing and quarantining emails that are benevolent. Demand for cybersecurity solutions such as those provided by Mimecast continues to rise, as 90%+ of advanced threats are propagated via email. During the quarter, the stock rallied after Mimecast announced that private equity firm Permira had made an offer to purchase the company. The deal is expected to close in the first half of 2022. |
| • | Matson, Inc. is a provider of ocean transportation and logistics services. The company transports freight between the continental U.S. and ports in Alaska, Hawaii, and China. One of the things that attracted us to Matson is its |
| Meridian Funds | 20 | www.meridianfund.com |
Portfolio Performance and Composition (Unaudited) (continued)
| position as one of the leading shipping companies operating under the Jones Act, a federal statute that allows only American-owned and-built vessels crewed by Americans to transport goods between U.S. ports. In addition, we also like Matson’s expedited China service, which has a large time advantage over traditional steamship lines. The company also has its own terminal operations in west coast ports which provides a further transit advantage due to the current backlog of ships waiting to be unloaded. The stock’s strong performance during the period was driven by pandemic-related disruptions and delays in air freight shipping between China and the U.S., which led to increased demand for ocean transportation and drove shipping container rates higher. These dynamics supported substantial earnings growth for Matson, which, for the third quarter, reported a 300% year-over-year increase in earnings. During the period, we trimmed the Fund's exposure in the stock, but maintain a sizeable position in Matson. |
| • | 2U, Inc. is an educational technology firm that partners with leading nonprofit colleges and universities to offer online degree programs. 2U has many of the qualities that we believe define a good business including long-term contracts and recurring revenue; attractive unit economics that should deliver strong EBITDA margins at scale; and strong brand recognition with marquee university partners to drive continued growth. However, the stock drifted lower as investors became concerned about the rising cost of lead generation – money 2U is spending to attract new students – and digested news of 2U’s acquisition of edX, an online course provider created by Harvard and MIT. We believe 2U is skillfully navigating these challenges and that its merger with edX will expand 2U’s access to affordable, high-quality online education globally. The company reported third-quarter revenues that were up 16%, and issued strong full-year guidance, adding to our conviction in its long-term growth potential. During the period, we maintained the Fund's position in the company. |
| • | 8x8, Inc. is a cloud communications provider that offers businesses a unified voice, contact center, video, and chat platform. The company hired a new CEO in late ’20 who has since refocused the company on areas of the market where 8x8 has competitive advantages and the potential to earn higher margins. In conjunction with this change in strategy, the company exited low growth and low margin product lines which has led to what we believe is a temporary slowdown in revenue growth. This deceleration in revenue growth has pressured the stock along with 8x8’s proposed $250 million buyout of cloud-based communications firm Fuze which will increase leverage on the balance sheet. Our research suggests 8x8’s financial rationale for buying Fuze is solid, as it should allow 8x8 to generate immediate free cash flow and improved profitability. We feel confident that these headwinds will reverse in 2022 and are comfortable with the Fund's position in the stock. We believe 8x8 has the potential to accelerate growth, improve margins, and that the stock trades at an attractive valuation relative to other cloud communication companies. |
| • | Neximmune, Inc. is a clinical-stage biotechnology firm. Our excitement for Neximmune is based on its proprietary nanotechnology platform Artificial Immune Modulation (AIM), which employs natural biology to direct specific T-cell mediated immune responses capable of treating a variety of diseases. The stock traded lower during the period following news that data from clinical trials for AIM would not be available in late 2021 as expected. The company expects trial results will now be available sometime in the first half of 2022. Given the delay and increased uncertainty, we reduced the Fund's position in the stock. |
| Meridian Funds | 21 | www.meridianfund.com |
Portfolio Performance and Composition (Unaudited) (continued)
| Meridian Funds | 22 | www.meridianfund.com |
Portfolio Performance and Composition (Unaudited) (continued)

| Inception | 6 Month | 1 Year | 5 Year | Since Inception | |
| Legacy Class (MSGGX) | 12/16/13 | (6.64)% | 7.85% | 15.26% | 14.03% |
| Institutional Class (MSGRX) | 12/24/14 | (6.65)% | 7.85% | 15.32% | 12.62% |
| Class A (MSGAX) w/o sales charge | 12/16/13 | (6.84)% | 7.46% | 14.89% | 13.65% |
| Class A (MSGAX) with sales charge1 | 12/16/13 | (12.20)% | 1.26% | 13.53% | 12.81% |
| Class C (MSGCX) | 7/1/15 | (7.14)% | 6.75% | 14.08% | 11.43% |
| Investor Class (MISGX) | 12/16/13 | (6.68)% | 7.79% | 15.17% | 13.95% |
| Russell 2000® Growth Index | 12/16/13 2 | (5.64)% | 2.84% | 14.53% | 11.41% |
| 1 | Assuming maximum sales charge, if any. Class A Shares are subject to a maximum initial sales charge of 5.75%. |
| 2 | Inception date of Legacy Class Shares. |
| Meridian Funds | 23 | www.meridianfund.com |
Portfolio Composition (Unaudited)
| Heritage-Crystal Clean, Inc. | 3.3% |
| Skechers U.S.A., Inc. Class A | 2.8% |
| Matson, Inc. | 2.8% |
| Sally Beauty Holdings, Inc. | 2.7% |
| TriNet Group, Inc. | 2.4% |
| Mimecast Ltd. | 2.3% |
| Momentive Global, Inc. | 2.2% |
| Ritchie Bros. Auctioneers, Inc. (Canada) | 2.1% |
| Frontdoor, Inc. | 2.1% |
| Tennant Co. | 1.7% |
| Meridian Funds | 24 | www.meridianfund.com |
| Meridian Funds | 25 | www.meridianfund.com |
| Actual | Annualized Expense Ratio | Beginning Account Value July 1, 2021 | Ending Account Value December 31, 2021 | Expenses Paid During the Period 1 |
| Legacy Class (MERDX) | 0.84% | $1,000.00 | $996.10 | $4.23 |
| Institutional Class (MRRGX) | 0.82% | $1,000.00 | $996.60 | $4.13 |
| Class A (MRAGX) | 1.16% | $1,000.00 | $994.70 | $5.83 |
| Class C (MRCGX) | 1.86% | $1,000.00 | $991.20 | $9.34 |
| Investor Class (MRIGX) | 0.91% | $1,000.00 | $995.90 | $4.58 |
| Hypothetical 2 | Annualized Expense Ratio | Beginning Account Value July 1, 2021 | Ending Account Value December 31, 2021 | Expenses Paid During the Period 1 |
| Legacy Class (MERDX) | 0.84% | $1,000.00 | $1,020.97 | $4.28 |
| Institutional Class (MRRGX) | 0.82% | $1,000.00 | $1,021.07 | $4.18 |
| Class A (MRAGX) | 1.16% | $1,000.00 | $1,019.36 | $5.90 |
| Class C (MRCGX) | 1.86% | $1,000.00 | $1,015.83 | $9.45 |
| Investor Class (MRIGX) | 0.91% | $1,000.00 | $1,020.62 | $4.63 |
| 1 | Expenses are equal to the Fund’s annualized expense ratio multiplied by the average account value over the period, multiplied by 184 days, the number of days in the most recent fiscal half-year, then divided by 365. |
| 2 | Hypothetical 5% return before expenses. |
| Meridian Funds | 26 | www.meridianfund.com |
| Actual | Annualized Expense Ratio | Beginning Account Value July 1, 2021 | Ending Account Value December 31, 2021 | Expenses Paid During the Period 1 |
| Legacy Class (MVALX) | 1.11% | $1,000.00 | $1,047.20 | $ 5.73 |
| Class A (MFCAX) | 1.46% | $1,000.00 | $1,045.70 | $ 7.53 |
| Class C (MFCCX) | 2.15% | $1,000.00 | $1,042.00 | $11.07 |
| Investor Class (MFCIX) | 1.17% | $1,000.00 | $1,047.00 | $ 6.04 |
| Hypothetical 2 | Annualized Expense Ratio | Beginning Account Value July 1, 2021 | Ending Account Value December 31, 2021 | Expenses Paid During the Period 1 |
| Legacy Class (MVALX) | 1.11% | $1,000.00 | $1,019.61 | $ 5.65 |
| Class A (MFCAX) | 1.46% | $1,000.00 | $1,017.85 | $ 7.43 |
| Class C (MFCCX) | 2.15% | $1,000.00 | $1,014.37 | $10.92 |
| Investor Class (MFCIX) | 1.17% | $1,000.00 | $1,019.31 | $ 5.96 |
| 1 | Expenses are equal to the Fund’s annualized expense ratio multiplied by the average account value over the period, multiplied by 184 days, the number of days in the most recent fiscal half-year, then divided by 365. |
| 2 | Hypothetical 5% return before expenses. |
| Meridian Funds | 27 | www.meridianfund.com |
| Actual | Annualized Expense Ratio | Beginning Account Value July 1, 2021 | Ending Account Value December 31, 2021 | Expenses Paid During the Period 1 |
| Legacy Class (MEIFX) | 1.19% | $1,000.00 | $1,043.30 | $ 6.13 |
| Class A (MRAEX) | 1.53% | $1,000.00 | $1,041.80 | $ 7.87 |
| Class C (MRCEX) | 2.00% | $1,000.00 | $1,038.60 | $10.28 |
| Investor Class (MRIEX) | 1.18% | $1,000.00 | $1,043.50 | $ 6.08 |
| Hypothetical 2 | Annualized Expense Ratio | Beginning Account Value July 1, 2021 | Ending Account Value December 31, 2021 | Expenses Paid During the Period 1 |
| Legacy Class (MEIFX) | 1.19% | $1,000.00 | $1,019.21 | $ 6.06 |
| Class A (MRAEX) | 1.53% | $1,000.00 | $1,017.49 | $ 7.78 |
| Class C (MRCEX) | 2.00% | $1,000.00 | $1,015.12 | $10.16 |
| Investor Class (MRIEX) | 1.18% | $1,000.00 | $1,019.26 | $ 6.01 |
| 1 | Expenses are equal to the Fund’s annualized expense ratio multiplied by the average account value over the period, multiplied by 184 days, the number of days in the most recent fiscal half-year, then divided by 365. |
| 2 | Hypothetical 5% return before expenses. |
| Meridian Funds | 28 | www.meridianfund.com |
| Actual | Annualized Expense Ratio | Beginning Account Value July 1, 2021 | Ending Account Value December 31, 2021 | Expenses Paid During the Period 1 |
| Legacy Class (MSGGX) | 1.13% | $1,000.00 | $933.60 | $ 5.51 |
| Institutional Class (MSGRX) | 1.09% | $1,000.00 | $933.50 | $ 5.31 |
| Class A (MSGAX) | 1.48% | $1,000.00 | $931.60 | $ 7.21 |
| Class C (MSGCX) | 2.16% | $1,000.00 | $928.60 | $10.50 |
| Investor Class (MISGX) | 1.20% | $1,000.00 | $933.20 | $ 5.85 |
| Hypothetical 2 | Annualized Expense Ratio | Beginning Account Value July 1, 2021 | Ending Account Value December 31, 2021 | Expenses Paid During the Period 1 |
| Legacy Class (MSGGX) | 1.13% | $1,000.00 | $1,019.51 | $ 5.75 |
| Institutional Class (MSGRX) | 1.09% | $1,000.00 | $1,019.71 | $ 5.55 |
| Class A (MSGAX) | 1.48% | $1,000.00 | $1,017.74 | $ 7.53 |
| Class C (MSGCX) | 2.16% | $1,000.00 | $1,014.32 | $10.97 |
| Investor Class (MISGX) | 1.20% | $1,000.00 | $1,019.16 | $ 6.11 |
| 1 | Expenses are equal to the Fund’s annualized expense ratio multiplied by the average account value over the period, multiplied by 184 days, the number of days in the most recent fiscal half-year, then divided by 365. |
| 2 | Hypothetical 5% return before expenses. |
| Meridian Funds | 29 | www.meridianfund.com |
Performance Disclosure
| Meridian Funds | 30 | www.meridianfund.com |
Schedule of Investments
| Shares | Value | |
| Common Stocks - 92.8% | ||
| Communication Services - 4.2% | ||
| Interactive Media & Services - 4.2% | ||
| Cargurus, Inc.1 | 469,272 | $ 15,786,310 |
| Ziff Davis, Inc.1,2 | 517,951 | 57,420,048 |
| ZipRecruiter, Inc. Class A1,2 | 600,213 | 14,969,312 |
| Total Communication Services | 88,175,670 | |
| Consumer Discretionary - 17.0% | ||
| Auto Components - 0.5% | ||
| Fox Factory Holding Corp.1 | 61,739 | 10,501,804 |
| Diversified Consumer Services - 4.8% | ||
| 2U, Inc.1,2 | 1,394,070 | 27,978,985 |
| Frontdoor, Inc.1 | 1,176,088 | 43,103,625 |
| Grand Canyon Education, Inc.1 | 346,357 | 29,686,258 |
| 100,768,868 | ||
| Hotels, Restaurants & Leisure - 0.6% | ||
| Sportradar Holding AG Class A (Switzerland)1,2 | 727,689 | 12,785,496 |
| Internet & Direct Marketing Retail - 1.6% | ||
| Farfetch Ltd. (United Kingdom)1 | 298,057 | 9,964,046 |
| Shutterstock, Inc. | 87,145 | 9,662,638 |
| Xometry, Inc. Class A1,2 | 274,226 | 14,054,082 |
| 33,680,766 | ||
| Leisure Products - 0.4% | ||
| Polaris, Inc.2 | 70,477 | 7,746,127 |
| Specialty Retail - 2.7% | ||
| Sally Beauty Holdings, Inc.1 | 2,580,020 | 47,627,169 |
| Vroom, Inc.1,2 | 902,353 | 9,736,389 |
| 57,363,558 | ||
| Textiles, Apparel & Luxury Goods - 6.4% | ||
| Canada Goose Holdings, Inc. (Canada)1 | 432,709 | 16,036,196 |
| Carter's, Inc. | 103,430 | 10,469,185 |
| Hanesbrands, Inc.2 | 2,331,228 | 38,978,132 |
| Skechers U.S.A., Inc. Class A1 | 1,268,093 | 55,035,236 |
| Under Armour, Inc. Class C1 | 781,009 | 14,089,402 |
| 134,608,151 | ||
| Total Consumer Discretionary | 357,454,770 | |
| Financials - 2.6% | ||
| Banks - 0.6% | ||
| Bank OZK2 | 265,133 | 12,336,638 |
| Capital Markets - 2.0% | ||
| LPL Financial Holdings, Inc. | 154,483 | 24,731,184 |
| WisdomTree Investments, Inc.2 | 2,989,317 | 18,294,620 |
| 43,025,804 | ||
| Total Financials | 55,362,442 | |
| Shares | Value | |
| Health Care - 23.2% | ||
| Biotechnology - 5.2% | ||
| Adagio Therapeutics, Inc. Acquisition Date: 4/16/21, Cost $5,699,9501,3 | 364,980 | $ 2,252,292 |
| Agios Pharmaceuticals, Inc.1,2 | 313,180 | 10,294,227 |
| C4 Therapeutics, Inc.1 | 301,582 | 9,710,940 |
| CareDx, Inc.1 | 334,553 | 15,215,470 |
| Exact Sciences Corp.1 | 72,098 | 5,611,387 |
| Heron Therapeutics, Inc.1,2 | 964,892 | 8,809,464 |
| Kodiak Sciences, Inc.1 | 136,714 | 11,590,613 |
| Precision BioSciences, Inc.1 | 305,314 | 2,259,324 |
| Relay Therapeutics, Inc.1,2 | 350,097 | 10,751,479 |
| SpringWorks Therapeutics, Inc.1 | 113,945 | 7,062,311 |
| Veracyte, Inc.1 | 466,650 | 19,225,980 |
| Viking Therapeutics, Inc.1,2 | 1,248,659 | 5,743,831 |
| 108,527,318 | ||
| Health Care Equipment & Supplies - 9.5% | ||
| ABIOMED, Inc.1 | 29,635 | 10,644,003 |
| Axogen, Inc.1 | 960,631 | 9,001,112 |
| Cooper Cos., Inc. (The) | 23,635 | 9,901,647 |
| Hologic, Inc. 1 | 330,130 | 25,274,753 |
| Merit Medical Systems, Inc.1 | 585,197 | 36,457,773 |
| Nevro Corp. 1 | 142,801 | 11,576,877 |
| Quidel Corp.1 | 171,412 | 23,138,906 |
| STERIS Plc4 | 288,997 | 70,344,760 |
| Talis Biomedical Corp.1,2 | 626,462 | 2,512,113 |
| 198,851,944 | ||
| Health Care Providers & Services - 4.8% | ||
| AMN Healthcare Services, Inc.1 | 193,311 | 23,647,735 |
| Cano Health, Inc.1,2 | 1,567,136 | 13,963,182 |
| HealthEquity, Inc.1 | 400,706 | 17,727,233 |
| Henry Schein, Inc.1 | 248,202 | 19,243,101 |
| MEDNAX, Inc.1,2 | 485,221 | 13,202,863 |
| Privia Health Group, Inc.1,2 | 522,717 | 13,522,689 |
| 101,306,803 | ||
| Health Care Technology - 0.7% | ||
| Omnicell, Inc.1 | 87,299 | 15,752,232 |
| Life Sciences Tools & Services - 2.5% | ||
| Sotera Health Co.1 | 813,640 | 19,161,222 |
| Syneos Health, Inc.1 | 323,281 | 33,194,493 |
| 52,355,715 | ||
| Pharmaceuticals - 0.5% | ||
| Arvinas, Inc.1 | 127,746 | 10,493,056 |
| Total Health Care | 487,287,068 | |
| Industrials - 25.5% | ||
| Aerospace & Defense - 0.4% | ||
| Rocket Lab U.S.A., Inc.1,2 | 793,060 | 9,738,777 |
| Meridian Funds | 31 | www.meridianfund.com |
Schedule of Investments (continued)
| Shares | Value | |
| Air Freight & Logistics - 3.3% | ||
| CH Robinson Worldwide, Inc.2 | 379,679 | $ 40,864,851 |
| Forward Air Corp. | 230,097 | 27,862,445 |
| 68,727,296 | ||
| Commercial Services & Supplies - 6.1% | ||
| ABM Industries, Inc. | 456,231 | 18,637,036 |
| ACV Auctions, Inc. Class A1,2 | 1,535,114 | 28,921,548 |
| Cimpress Plc (Ireland)1 | 183,376 | 13,131,555 |
| Clean Harbors, Inc.1 | 253,932 | 25,334,796 |
| Ritchie Bros. Auctioneers, Inc. (Canada)2 | 709,922 | 43,454,326 |
| 129,479,261 | ||
| Electrical Equipment - 4.2% | ||
| Generac Holdings, Inc.1 | 105,764 | 37,220,467 |
| Sensata Technologies Holding Plc1,4 | 825,869 | 50,947,858 |
| 88,168,325 | ||
| Machinery - 4.0% | ||
| John Bean Technologies Corp. | 65,320 | 10,030,539 |
| Middleby Corp. (The)1,2 | 172,557 | 33,952,316 |
| Tennant Co. | 358,506 | 29,053,326 |
| Woodward, Inc. | 98,070 | 10,734,742 |
| 83,770,923 | ||
| Marine - 4.1% | ||
| Kirby Corp.1 | 480,264 | 28,537,287 |
| Matson, Inc. | 632,160 | 56,913,365 |
| 85,450,652 | ||
| Professional Services - 3.0% | ||
| Alight, Inc. Class A1 | 431,258 | 4,661,899 |
| Sterling Check Corp.1,2 | 506,703 | 10,392,478 |
| TriNet Group, Inc.1 | 502,457 | 47,864,054 |
| 62,918,431 | ||
| Road & Rail - 0.4% | ||
| Heartland Express, Inc. | 486,413 | 8,181,467 |
| Total Industrials | 536,435,132 | |
| Information Technology - 19.8% | ||
| Electronic Equipment, Instruments & Components - 2.2% | ||
| Belden, Inc. | 273,951 | 18,006,799 |
| Trimble, Inc.1 | 322,205 | 28,093,054 |
| 46,099,853 | ||
| IT Services - 1.6% | ||
| Euronet Worldwide, Inc.1 | 210,975 | 25,141,891 |
| SolarWinds Corp.2 | 652,882 | 9,264,396 |
| 34,406,287 | ||
| Semiconductors & Semiconductor Equipment - 3.9% | ||
| GLOBALFOUNDRIES, Inc.1,2 | 446,320 | 28,997,410 |
| Shares | Value | |
| ON Semiconductor Corp.1 | 763,590 | $ 51,863,033 |
| 80,860,443 | ||
| Software - 12.1% | ||
| 8x8, Inc.1 | 1,600,105 | 26,817,760 |
| Anaplan, Inc.1 | 269,926 | 12,376,107 |
| ChannelAdvisor Corp.1 | 333,208 | 8,223,573 |
| Consensus Cloud Solutions, Inc.1 | 172,649 | 9,991,198 |
| KnowBe4, Inc. Class A1 | 496,999 | 11,401,157 |
| Mandiant, Inc.1 | 626,453 | 10,987,986 |
| Mimecast Ltd.1 | 264,331 | 21,032,818 |
| Momentive Global, Inc.1 | 1,178,582 | 24,927,009 |
| N-able, Inc.1,2 | 1,568,540 | 17,410,794 |
| New Relic, Inc.1 | 281,006 | 30,899,420 |
| Smartsheet, Inc. Class A1 | 202,394 | 15,675,415 |
| Sumo Logic, Inc.1,2 | 982,385 | 13,321,141 |
| Tenable Holdings, Inc.1 | 244,262 | 13,451,508 |
| Zendesk, Inc.1 | 363,053 | 37,862,797 |
| 254,378,683 | ||
| Total Information Technology | 415,745,266 | |
| Materials - 0.5% | ||
| Containers & Packaging - 0.5% | ||
| Graphic Packaging Holding Co. | 537,626 | 10,483,707 |
| Total Materials | 10,483,707 | |
| Total Common Stocks - 92.8% (Cost $1,376,972,173) | 1,950,944,055 | |
| Preferred Stocks - 2.8% | ||
| Consumer Discretionary - 0.8% | ||
| Internet & Direct Marketing Retail - 0.7% | ||
| Evolve Vacation Rental Network, Inc. Series 9 Acquisition Date: 5/29/20, Cost $4,499,9991,3,5 | 776,451 | 15,459,139 |
| Specialty Retail - 0.1% | ||
| Capsule Corp. Series D Acquisition Date: 4/8/21, Cost $2,999,9931,3,5 | 207,016 | 2,974,820 |
| Total Consumer Discretionary | 18,433,959 | |
| Health Care - 0.4% | ||
| Health Care Equipment & Supplies - 0.4% | ||
| Binx Health, Inc. Series E Acquisition Date: 5/26/21, Cost $8,500,1361,3,5 | 31,619 | 8,500,136 |
| Total Health Care | 8,500,136 | |
| Meridian Funds | 32 | www.meridianfund.com |
Schedule of Investments (continued)
| Shares | Value | |
| Information Technology - 1.2% | ||
| Communications Equipment - 0.5% | ||
| Starry, Inc. Series C Acquisition Date: 5/14/18, Cost $4,220,0001,3,5 | 4,577,007 | $ 7,918,222 |
| Starry, Inc. Series D Acquisition Date: 3/6/19, Cost $1,835,0001,3,5 | 1,283,217 | 2,219,966 |
| 10,138,188 | ||
| Software - 0.7% | ||
| Dataminr, Inc. Series F Acquisition Date: 3/22/21, Cost $7,369,6921,3,5 | 167,493 | 7,562,309 |
| Skyryse, Inc. Series B Acquisition Date: 10/21/21, Cost $7,164,9901,3,5 | 290,316 | 7,164,990 |
| 14,727,299 | ||
| Total Information Technology | 24,865,487 | |
| Real Estate - 0.4% | ||
| Real Estate Management & Development - 0.4% | ||
| Apartment List, Inc. Series D Acquisition Date: 11/2/20 - 12/21/20, Cost $8,399,9971,3,5 | 2,299,479 | 8,163,150 |
| Total Real Estate | 8,163,150 | |
| Total Preferred Stocks - 2.8% (Cost $44,989,808) | 59,962,732 | |
| Private Investment Funds - 2.9% | ||
| Quail Investment Holdings, LLC Acquisition Date: 9/1/20, Cost $4,037,8821,3,6 | 4,038 | 3,873,540 |
| Rhino (E) Investment Holdings, LLC Acquisition Date: 7/10/20, Cost $10,236,0001,3,7 | 645,578 | 56,898,986 |
| Total Private Investment Funds - 2.9% (Cost $14,273,882) | 60,772,526 | |
| Shares/ Principal Amount | ||
| Short-Term Investments - 4.0%8 | ||
| Money Market Funds - 1.7% | ||
| BlackRock Liquidity Funds, FedFund, Institutional Class, 0.03% | 6,680,000 | 6,680,000 |
| Shares/ Principal Amount | Value | |
| Federated Treasury Obligations Fund, Institutional Class, 0.03% | 5,490,000 | $ 5,490,000 |
| Fidelity Investments Money Market Government Portfolio, Institutional Class, 0.01% | 3,418,000 | 3,418,000 |
| Goldman Sachs Financial Square Government Fund, Institutional Class, 0.03% | 4,430,000 | 4,430,000 |
| Invesco Short Term Investments, Government & Agency Portfolio, Institutional Class, 0.03% | 7,110,000 | 7,110,000 |
| JPMorgan U.S. Government Money Market Fund, Institutional Class, 0.03% | 6,400,000 | 6,400,000 |
| Morgan Stanley Institutional Liquidity Funds, Government Portfolio, Institutional Class, 0.03% | 3,418,000 | 3,418,000 |
| Total Money Market Funds (Cost $36,946,000) | 36,946,000 | |
| Repurchase Agreements - 2.3% | ||
| Bank of America Securities, Inc., dated 12/31/21, due 1/3/22, 0.05% total to be received $19,728,276 (collateralized by various U.S. Government Sponsored Agency, 1.00% - 5.00%, 9/1/28 - 1/1/61, totaling $20,122,758) | $ 19,728,194 | 19,728,194 |
| Meridian Funds | 33 | www.meridianfund.com |
Schedule of Investments (continued)
| Shares/ Principal Amount | Value | |
| Citigroup Global Markets, Inc., dated 12/31/21, due 1/3/22, 0.06% total to be received $8,358,893 (collateralized by various U.S. Government Sponsored Agency and U.S. Treasury Obligations, 0.00% - 3.50%, 2/15/22 - 12/20/51, totaling $8,526,028) | $ 8,358,851 | $ 8,358,851 |
| RBC Dominion Securities, Inc., dated 12/31/21, due 1/3/22, 0.05% total to be received $19,728,276 (collateralized by various U.S. Government Sponsored Agency and U.S. Treasury Obligations, 0.00% - 6.50%, 5/15/22 - 12/1/51, totaling $20,122,758) | 19,728,194 | 19,728,194 |
| Total Repurchase Agreements (Cost $47,815,239) | 47,815,239 | |
| Total Short-Term Investments - 4.0% (Cost $84,761,239) | 84,761,239 | |
| Total Investments - 102.5% (Cost $1,520,997,102) | 2,156,440,552 | |
| Liabilities in Excess of Other Assets - (2.5)% | (53,477,132) | |
| Net Assets - 100.0% | $2,102,963,420 |
| Shares | Value | |
| Securities Sold Short - (0.9)% | ||
| Consumer Discretionary - (0.9)% | ||
| Automobiles - (0.9)% | ||
| Rivian Automotive, Inc. Class A1 | (180,000) | $ (18,664,200) |
| Total Consumer Discretionary | (18,664,200) | |
| Total Securities Sold Short - (0.9%) (Proceeds $(23,794,994)) | $ (18,664,200) | |
| Meridian Funds | 34 | www.meridianfund.com |
Schedule of Investments (continued)
| Plc—Public Limited Company |
| 1 | Non-income producing securities. |
| 2 | All or portion of this security is on loan at December 31, 2021. Total value of such securities at period-end amounts to $133,259,464 and represents 6.34% of net assets. |
| 3 | Restricted security; cannot be offered for public resale without first being registered under the Securities Act of 1933 and related rules and agreements. Acquisition date represents the date on which an enforceable right to acquire such security is obtained and is presented along with related cost in the security description. The Fund has registration rights for certain restricted securities. Any costs related to such registration are borne by the issuer. The aggregate value of restricted securities at period-end amounts to $122,987,550 and represents 5.85% of net assets. |
| 4 | Securities, or a portion thereof, were pledged as collateral for securities sold short by the fund. |
| 5 | Security is valued using significant unobservable inputs in good faith in accordance with procedures approved by the Board of Directors. See Note 1 in Notes to financial statements. |
| 6 | Quail Investment Holdings, LLC is a limited liability company that was organized to invest solely in Qumulo, Inc Series E Preferred Stock. The value of Qumulo, Inc. is substantially the same as Quail Investment Holdings, LLC. |
| 7 | Rhino (E) Investment Holdings, LLC is a limited liability company that was organized to invest solely in Rivian Automotive, Inc. Series E Preferred Stock. The value of Rivian Automotive, Inc. is substantially the same as Rhino (E) Investment Holdings, LLC. |
| 8 | Collateral received from brokers for securities lending was invested in short-term investments. |
| Meridian Funds | 35 | www.meridianfund.com |
Schedule of Investments
| Shares | Value | |
| Common Stocks - 92.3% | ||
| Communication Services - 1.3% | ||
| Interactive Media & Services - 1.3% | ||
| Cars.com, Inc.1 | 610,000 | $ 9,814,900 |
| Total Communication Services | 9,814,900 | |
| Consumer Discretionary - 8.4% | ||
| Auto Components - 1.5% | ||
| Aptiv Plc1 | 66,000 | 10,886,700 |
| Diversified Consumer Services - 1.8% | ||
| Frontdoor, Inc.1 | 358,397 | 13,135,250 |
| Hotels, Restaurants & Leisure - 0.2% | ||
| PlayAGS, Inc.1 | 285,000 | 1,935,150 |
| Household Durables - 1.7% | ||
| Newell Brands, Inc. | 593,000 | 12,951,120 |
| Specialty Retail - 3.2% | ||
| Monro, Inc. | 224,000 | 13,052,480 |
| Sally Beauty Holdings, Inc.1 | 585,000 | 10,799,100 |
| 23,851,580 | ||
| Total Consumer Discretionary | 62,759,800 | |
| Consumer Staples - 2.2% | ||
| Beverages - 2.2% | ||
| Molson Coors Beverage Co. Class B | 164,000 | 7,601,400 |
| Vintage Wine Estates, Inc.1,2 | 740,000 | 8,746,800 |
| Total Consumer Staples | 16,348,200 | |
| Energy - 3.6% | ||
| Oil, Gas & Consumable Fuels - 3.6% | ||
| APA Corp. | 278,000 | 7,475,420 |
| California Resources Corp. | 130,000 | 5,552,300 |
| Cameco Corp. (Canada) | 342,000 | 7,459,020 |
| Coterra Energy, Inc. | 338,635 | 6,434,065 |
| Total Energy | 26,920,805 | |
| Financials - 11.5% | ||
| Banks - 6.9% | ||
| Comerica, Inc. | 178,000 | 15,486,000 |
| First Horizon Corp. | 1,126,000 | 18,387,580 |
| U.S. Bancorp | 309,000 | 17,356,530 |
| 51,230,110 | ||
| Insurance - 4.6% | ||
| American International Group, Inc. | 247,000 | 14,044,420 |
| Axis Capital Holdings Ltd. | 366,000 | 19,936,020 |
| 33,980,440 | ||
| Total Financials | 85,210,550 | |
| Shares | Value | |
| Health Care - 8.0% | ||
| Biotechnology - 2.7% | ||
| Albireo Pharma, Inc.1 | 120,750 | $ 2,812,267 |
| Heron Therapeutics, Inc.1,2 | 703,000 | 6,418,390 |
| Legend Biotech Corp. ADR1,2 | 87,821 | 4,093,337 |
| ORIC Pharmaceuticals, Inc.1 | 390,000 | 5,733,000 |
| Precision BioSciences, Inc.1 | 139,000 | 1,028,600 |
| 20,085,594 | ||
| Health Care Equipment & Supplies - 0.9% | ||
| Merit Medical Systems, Inc.1 | 108,810 | 6,778,863 |
| Health Care Providers & Services - 2.3% | ||
| Acadia Healthcare Co., Inc.1 | 280,000 | 16,996,000 |
| Health Care Technology - 2.0% | ||
| Change Healthcare, Inc.1 | 695,000 | 14,859,100 |
| Pharmaceuticals - 0.1% | ||
| Osmotica Pharmaceuticals Plc1 | 1,000,000 | 1,080,000 |
| Total Health Care | 59,799,557 | |
| Industrials - 21.2% | ||
| Aerospace & Defense - 0.5% | ||
| Rocket Lab U.S.A., Inc.1,2 | 290,732 | 3,570,189 |
| Building Products - 1.4% | ||
| Advanced Drainage Systems, Inc. | 76,611 | 10,429,055 |
| Commercial Services & Supplies - 3.5% | ||
| ACV Auctions, Inc. Class A1 | 292,833 | 5,516,974 |
| Driven Brands Holdings, Inc.1 | 438,500 | 14,742,370 |
| VSE Corp. | 90,000 | 5,484,600 |
| 25,743,944 | ||
| Construction & Engineering - 2.1% | ||
| API Group Corp.1 | 591,000 | 15,230,070 |
| Electrical Equipment - 0.6% | ||
| American Superconductor Corp.1 | 415,000 | 4,515,200 |
| Machinery - 4.1% | ||
| CNH Industrial, N.V. (United Kingdom)2 | 1,194,000 | 23,199,420 |
| Evoqua Water Technologies Corp.1 | 158,000 | 7,386,500 |
| 30,585,920 | ||
| Marine - 1.7% | ||
| Matson, Inc. | 140,000 | 12,604,200 |
| Professional Services - 2.3% | ||
| Alight, Inc. Class A1 | 363,363 | 3,927,954 |
| CACI International, Inc. Class A1 | 50,000 | 13,460,500 |
| 17,388,454 | ||
| Road & Rail - 2.2% | ||
| AMERCO | 23,000 | 16,703,290 |
| Meridian Funds | 36 | www.meridianfund.com |
Schedule of Investments (continued)
| Shares | Value | |
| Trading Companies & Distributors - 2.8% | ||
| Custom Truck One Source, Inc.1,2 | 975,000 | $ 7,800,000 |
| Univar Solutions, Inc.1 | 462,000 | 13,097,700 |
| 20,897,700 | ||
| Total Industrials | 157,668,022 | |
| Information Technology - 22.9% | ||
| Communications Equipment - 2.6% | ||
| Juniper Networks, Inc. | 545,000 | 19,461,950 |
| Electronic Equipment, Instruments & Components - 1.4% | ||
| Trimble, Inc.1 | 123,156 | 10,737,971 |
| Semiconductors & Semiconductor Equipment - 15.8% | ||
| Advanced Micro Devices, Inc.1 | 100,000 | 14,390,000 |
| Allegro MicroSystems, Inc. (Japan)1 | 108,000 | 3,907,440 |
| Ambarella, Inc.1 | 65,000 | 13,187,850 |
| GLOBALFOUNDRIES, Inc.1 | 125,000 | 8,121,250 |
| Micron Technology, Inc. | 177,000 | 16,487,550 |
| NVIDIA Corp. | 18,000 | 5,293,980 |
| ON Semiconductor Corp.1 | 242,000 | 16,436,640 |
| PDF Solutions, Inc.1 | 123,000 | 3,910,170 |
| Photronics, Inc.1 | 431,000 | 8,124,350 |
| SMART Global Holdings, Inc.1,2 | 396,000 | 28,112,040 |
| 117,971,270 | ||
| Software - 3.1% | ||
| Cerence, Inc.1,2 | 30,250 | 2,318,360 |
| Clear Secure, Inc. Class A1,2 | 41,200 | 1,292,444 |
| Cognyte Software Ltd. (Israel)1 | 242,000 | 3,792,140 |
| Sumo Logic, Inc.1 | 378,396 | 5,131,050 |
| Zuora, Inc. Class A1 | 544,000 | 10,161,920 |
| 22,695,914 | ||
| Total Information Technology | 170,867,105 | |
| Materials - 2.0% | ||
| Chemicals - 2.0% | ||
| Olin Corp. | 255,000 | 14,667,600 |
| Total Materials | 14,667,600 | |
| Real Estate - 9.0% | ||
| Equity Real Estate Investment Trusts (REITS) - 9.0% | ||
| Alexander & Baldwin, Inc. | 695,000 | 17,437,550 |
| DigitalBridge Group, Inc.1 | 2,507,000 | 20,883,310 |
| NETSTREIT Corp. | 540,000 | 12,366,000 |
| VICI Properties, Inc.2 | 548,000 | 16,500,280 |
| Total Real Estate | 67,187,140 | |
| Utilities - 2.2% | ||
| Electric Utilities - 1.3% | ||
| Avangrid, Inc.2 | 196,000 | 9,776,480 |
| Shares | Value | |
| Independent Power & Renewable Electricity Producers - 0.9% | ||
| Brookfield Renewable Corp. Class A | 168,697 | $ 6,213,111 |
| Total Utilities | 15,989,591 | |
| Total Common Stocks - 92.3% (Cost $436,658,356) | 687,233,270 | |
| Warrants - 0.0% | ||
| Information Technology - 0.0% | ||
| Software - 0.0% | ||
| KLDiscovery, Inc., Strike Price $11.50, Expires 12/19/241 | 450,000 | 125,640 |
| Total Information Technology | 125,640 | |
| Total Warrants - 0.0% (Cost $250,695) | 125,640 | |
| Preferred Stocks - 0.4% | ||
| Information Technology - 0.4% | ||
| Software - 0.4% | ||
| Casters Holdings, Inc. dba Fyllo Compliance Cloud Series C Acquisition Date: 10/25/21, Cost $3,000,0001,3,4 | 2,821,405 | 3,000,000 |
| Total Information Technology | 3,000,000 | |
| Total Preferred Stocks - 0.4% (Cost $3,000,000) | 3,000,000 | |
| Shares/ Principal Amount | ||
| Short-Term Investments - 2.2%5 | ||
| Money Market Funds - 0.8% | ||
| BlackRock Liquidity Funds, FedFund, Institutional Class, 0.03% | 1,063,000 | 1,063,000 |
| Federated Treasury Obligations Fund, Institutional Class, 0.03% | 1,063,000 | 1,063,000 |
| Fidelity Investments Money Market Government Portfolio, Institutional Class, 0.01% | 483,000 | 483,000 |
| Goldman Sachs Financial Square Government Fund, Institutional Class, 0.03% | 1,063,000 | 1,063,000 |
| Meridian Funds | 37 | www.meridianfund.com |
Schedule of Investments (continued)
| Shares/ Principal Amount | Value | |
| Invesco Short Term Investments, Government & Agency Portfolio, Institutional Class, 0.03% | 1,063,000 | $ 1,063,000 |
| JPMorgan U.S. Government Money Market Fund, Institutional Class, 0.03% | 1,063,000 | 1,063,000 |
| Morgan Stanley Institutional Liquidity Funds, Government Portfolio, Institutional Class, 0.03% | 483,000 | 483,000 |
| Total Money Market Funds (Cost $6,281,000) | 6,281,000 | |
| Repurchase Agreements - 1.4% | ||
| Bank of America Securities, Inc., dated 12/31/21, due 1/3/22, 0.05% total to be received $3,855,652 (collateralized by various U.S. Government Sponsored Agency, 1.00% - 5.00%, 9/1/28 - 1/1/61, totaling $3,932,749) | $ 3,855,636 | 3,855,636 |
| Daiwa Capital Markets America, Inc., dated 12/31/21, due 1/3/22, 0.05% total to be received $2,573,288 (collateralized by various U.S. Government Sponsored Agency and U.S. Treasury Obligations, 0.00% - 6.50%, 2/10/22 - 1/1/52, totaling $2,624,743) | 2,573,277 | 2,573,277 |
| Shares/ Principal Amount | Value | |
| RBC Dominion Securities, Inc., dated 12/31/21, due 1/3/22, 0.05% total to be received $3,855,652 (collateralized by various U.S. Government Sponsored Agency and U.S. Treasury Obligations, 0.00% - 6.50%, 5/15/22 - 12/1/51, totaling $3,932,749) | $ 3,855,636 | $ 3,855,636 |
| Total Repurchase Agreements (Cost $10,284,549) | 10,284,549 | |
| Total Short-Term Investments - 2.2% (Cost $16,565,549) | 16,565,549 | |
| Total Investments - 94.9% (Cost $456,474,600) | 706,924,459 | |
| Cash and Other Assets, Less Liabilities - 5.1% | 37,982,484 | |
| Net Assets - 100.0% | $744,906,943 |
| Meridian Funds | 38 | www.meridianfund.com |
Schedule of Investments (continued)
| ADR—American Depositary Receipt |
| N.V.—Naamloze Vennootschap is the Dutch term for limited liability company |
| Plc—Public Limited Company |
| 1 | Non-income producing securities. |
| 2 | All or portion of this security is on loan at December 31, 2021. Total value of such securities at period-end amounts to $39,218,096 and represents 5.26% of net assets. |
| 3 | Restricted security; cannot be offered for public resale without first being registered under the Securities Act of 1933 and related rules and agreements. Acquisition date represents the date on which an enforceable right to acquire such security is obtained and is presented along with related cost in the security description. The Fund has registration rights for certain restricted securities. Any costs related to such registration are borne by the issuer. The aggregate value of restricted securities at period-end amounts to $3,000,000 and represents 0.40% of net assets. |
| 4 | Security is valued using significant unobservable inputs in good faith in accordance with procedures approved by the Board of Directors. See Note 1 in Notes to financial statements. |
| 5 | Collateral received from brokers for securities lending was invested in short-term investments. |
| Meridian Funds | 39 | www.meridianfund.com |
Schedule of Investments
| Shares | Value | |
| Common Stocks - 128.0% | ||
| Communication Services - 14.8% | ||
| Diversified Telecommunication Services - 1.2% | ||
| Liberty Global Plc Class A (United Kingdom)1,2 | 16,800 | $ 466,032 |
| Verizon Communications, Inc. | 5,657 | 293,938 |
| 759,970 | ||
| Entertainment - 7.3% | ||
| Live Nation Entertainment, Inc.1,2 | 24,500 | 2,932,405 |
| Madison Square Garden Entertainment Corp.2,3 | 5,447 | 383,142 |
| Walt Disney Co. (The)2 | 7,764 | 1,202,566 |
| 4,518,113 | ||
| Interactive Media & Services - 0.5% | ||
| IAC/InterActiveCorp. 2 | 2,105 | 275,145 |
| Media - 5.8% | ||
| Boston Omaha Corp. Class A2 | 9,070 | 260,581 |
| Liberty Broadband Corp. Class C2 | 7,553 | 1,216,788 |
| Liberty Media Corp.-Liberty SiriusXM Class A2 | 11,000 | 559,350 |
| Liberty Media Corp.-Liberty SiriusXM Class C2 | 799 | 40,629 |
| ViacomCBS, Inc. Class B1 | 49,400 | 1,490,892 |
| 3,568,240 | ||
| Total Communication Services | 9,121,468 | |
| Consumer Discretionary - 22.2% | ||
| Automobiles - 0.4% | ||
| Rivian Automotive, Inc. Class A2,3 | 2,709 | 280,896 |
| Internet & Direct Marketing Retail - 1.9% | ||
| Amazon.com, Inc.2 | 352 | 1,173,688 |
| Leisure Products - 0.3% | ||
| Clarus Corp. | 5,926 | 164,269 |
| Multiline Retail - 1.1% | ||
| Target Corp. | 2,885 | 667,704 |
| Specialty Retail - 8.2% | ||
| Advance Auto Parts, Inc. | 1,640 | 393,403 |
| Home Depot, Inc. (The) | 1,647 | 683,522 |
| Lowe's Cos., Inc. | 3,000 | 775,440 |
| Sally Beauty Holdings, Inc.1,2 | 170,000 | 3,138,200 |
| Vroom, Inc.2,3 | 7,837 | 84,561 |
| 5,075,126 | ||
| Textiles, Apparel & Luxury Goods - 10.3% | ||
| Hanesbrands, Inc.1 | 129,500 | 2,165,240 |
| NIKE, Inc. Class B | 7,139 | 1,189,857 |
| Skechers U.S.A., Inc. Class A1,2 | 69,400 | 3,011,960 |
| 6,367,057 | ||
| Total Consumer Discretionary | 13,728,740 | |
| Shares | Value | |
| Consumer Staples - 21.1% | ||
| Food & Staples Retailing - 0.8% | ||
| Costco Wholesale Corp. | 868 | $ 492,764 |
| Food Products - 10.0% | ||
| Dole Plc1 | 184,200 | 2,453,544 |
| Lamb Weston Holdings, Inc.1 | 58,500 | 3,707,730 |
| 6,161,274 | ||
| Household Products - 5.1% | ||
| Spectrum Brands Holdings, Inc.1 | 30,900 | 3,143,148 |
| Personal Products - 5.2% | ||
| Coty, Inc. Class A1,2 | 308,000 | 3,234,000 |
| Total Consumer Staples | 13,031,186 | |
| Financials - 11.2% | ||
| Banks - 8.0% | ||
| Bank of America Corp.1 | 1,500 | 66,735 |
| U.S. Bancorp | 17,777 | 998,534 |
| Wells Fargo & Co.1 | 80,900 | 3,881,582 |
| 4,946,851 | ||
| Capital Markets - 3.2% | ||
| Intercontinental Exchange, Inc. | 9,694 | 1,325,848 |
| Tishman Speyer Innovation Corp. II Class A2 | 30,000 | 292,500 |
| Yellowstone Acquisition Co. Class A2 | 34,800 | 353,916 |
| 1,972,264 | ||
| Total Financials | 6,919,115 | |
| Health Care - 0.2% | ||
| Biotechnology - 0.2% | ||
| Heron Therapeutics, Inc.2 | 16,635 | 151,878 |
| Total Health Care | 151,878 | |
| Industrials - 12.1% | ||
| Aerospace & Defense - 3.0% | ||
| Boeing Co. (The)1,2 | 7,800 | 1,570,296 |
| Rocket Lab U.S.A., Inc.2,3 | 21,593 | 265,162 |
| 1,835,458 | ||
| Commercial Services & Supplies - 0.5% | ||
| ACV Auctions, Inc. Class A2 | 15,432 | 290,739 |
| Construction & Engineering - 3.2% | ||
| WillScot Mobile Mini Holdings Corp.1,2 | 47,900 | 1,956,236 |
| Industrial Conglomerates - 2.2% | ||
| General Electric Co.1 | 14,775 | 1,395,794 |
| Professional Services - 3.2% | ||
| Alight, Inc. Class A2,3 | 33,940 | 366,891 |
| CACI International, Inc. Class A2 | 1,300 | 349,973 |
| Dun & Bradstreet Holdings, Inc.2 | 17,063 | 349,621 |
| Meridian Funds | 40 | www.meridianfund.com |
Schedule of Investments (continued)
| Shares | Value | |
| IHS Markit Ltd. (United Kingdom) | 5,739 | $ 762,828 |
| Legalzoom.com, Inc.2,3 | 9,308 | 149,580 |
| 1,978,893 | ||
| Total Industrials | 7,457,120 | |
| Information Technology - 37.4% | ||
| IT Services - 2.7% | ||
| PayPal Holdings, Inc.2 | 1,667 | 314,363 |
| SolarWinds Corp. | 10,000 | 141,900 |
| Visa, Inc. Class A3 | 5,462 | 1,183,670 |
| 1,639,933 | ||
| Semiconductors & Semiconductor Equipment - 16.3% | ||
| Allegro MicroSystems, Inc. (Japan)2 | 11,599 | 419,652 |
| Ambarella, Inc.1,2 | 9,400 | 1,907,166 |
| GLOBALFOUNDRIES, Inc.2 | 10,106 | 656,587 |
| NVIDIA Corp. | 2,064 | 607,043 |
| ON Semiconductor Corp.1,2 | 64,400 | 4,374,048 |
| QUALCOMM, Inc.1 | 11,700 | 2,139,579 |
| 10,104,075 | ||
| Software - 16.0% | ||
| Alkami Technology, Inc.2 | 17,923 | 359,535 |
| Consensus Cloud Solutions, Inc.2 | 33 | 1,910 |
| KnowBe4, Inc. Class A1,2 | 82,800 | 1,899,432 |
| Latch, Inc. Acquisition Date: 6/1/21, Cost $325,0002,4 | 32,500 | 246,025 |
| Microsoft Corp. | 4,685 | 1,575,659 |
| N-able, Inc.2,3 | 33,634 | 373,337 |
| salesforce.com, Inc.2 | 2,184 | 555,020 |
| Splunk, Inc.1,2 | 11,800 | 1,365,496 |
| UiPath, Inc. Class A1,2 | 58,200 | 2,510,166 |
| Zuora, Inc. Class A1,2 | 53,600 | 1,001,248 |
| 9,887,828 | ||
| Technology Hardware, Storage & Peripherals - 2.4% | ||
| Apple, Inc. | 8,469 | 1,503,840 |
| Total Information Technology | 23,135,676 | |
| Materials - 4.2% | ||
| Chemicals - 4.1% | ||
| Huntsman Corp.1 | 25,600 | 892,928 |
| Valvoline, Inc.1 | 43,700 | 1,629,573 |
| 2,522,501 | ||
| Containers & Packaging - 0.1% | ||
| Ball Corp.1 | 700 | 67,389 |
| Total Materials | 2,589,890 | |
| Real Estate - 2.8% | ||
| Equity Real Estate Investment Trusts (REITS) - 2.8% | ||
| American Tower Corp. | 2,378 | 695,565 |
| Shares | Value | |
| Equinix, Inc. | 1,196 | $ 1,011,625 |
| Total Real Estate | 1,707,190 | |
| Utilities - 2.0% | ||
| Independent Power & Renewable Electricity Producers - 2.0% | ||
| Vistra Corp.1 | 54,399 | 1,238,665 |
| Total Utilities | 1,238,665 | |
| Total Common Stocks - 128.0% (Cost $64,784,576) | 79,080,928 | |
| Warrants - 0.0% | ||
| Financials - 0.0% | ||
| Capital Markets - 0.0% | ||
| Executive Network Partnering Corp. Class A, Strike Price $11.50, Expires 9/25/282 | 4,325 | 2,937 |
| Tishman Speyer Innovation Corp. II Class A, Strike Price $11.50, Expires 12/31/272 | 6,000 | 4,627 |
| Yellowstone Acquisition Co. Class A, Strike Price $11.50, Expires 10/21/252 | 17,400 | 14,271 |
| Total Financials | 21,835 | |
| Total Warrants - 0.0% (Cost $22,739) | 21,835 | |
| Shares/ Principal Amount | ||
| Short-Term Investments - 0.6%5 | ||
| Repurchase Agreements - 0.6% | ||
| Daiwa Capital Markets America, Inc., dated 12/31/21, due 1/3/22, 0.05% total to be received $149,562 (collateralized by various U.S. Government Sponsored Agency and U.S. Treasury Obligations, 0.00% - 6.50%, 2/10/22 - 1/1/52, totaling $152,552) | $ 149,561 | 149,561 |
| Meridian Funds | 41 | www.meridianfund.com |
Schedule of Investments (continued)
| Shares/ Principal Amount | Value | |
| RBC Dominion Securities, Inc., dated 12/31/21, due 1/3/22, 0.05% total to be received $250,001 (collateralized by various U.S. Government Sponsored Agency and U.S. Treasury Obligations, 0.00% - 6.50%, 5/15/22 - 12/1/51, totaling $255,000) | $ 250,000 | $ 250,000 |
| Total Repurchase Agreements (Cost $399,561) | 399,561 | |
| Total Short-Term Investments - 0.6% (Cost $399,561) | 399,561 | |
| Total Investments - 128.6% (Cost $65,206,876) | 79,502,324 | |
| Liabilities in Excess of Other Assets - (28.6)% | (17,695,700) | |
| Net Assets - 100.0% | $61,806,624 |
| Value | ||
| Call Options Written - (31.3)% | ||
| Total Call Options Written - (31.3)% (Premium received $(14,937,550)) | $(19,334,963) | |
| Plc—Public Limited Company |
| 1 | Securities, or a portion thereof, were pledged as collateral for written options by the fund. |
| 2 | Non-income producing securities. |
| 3 | All or portion of this security is on loan at December 31, 2021. Total value of such securities at period-end amounts to $2,414,617 and represents 3.91% of net assets. |
| 4 | Restricted security; cannot be offered for public resale without first being registered under the Securities Act of 1933 and related rules and agreements. Acquisition date represents the date on which an enforceable right to acquire such security is obtained and is presented along with related cost in the security description. The Fund has registration rights for certain restricted securities. Any costs related to such registration are borne by the issuer. The aggregate value of restricted securities at period-end amounts to $246,025 and represents 0.40% of net assets. |
| 5 | Collateral received from brokers for securities lending was invested in short-term investments. |
| Meridian Funds | 42 | www.meridianfund.com |
Schedule of Investments (continued)
| Exchange-Traded Options Written | ||||||||||||
| Description | Strike Price | Expiration Date | Number of Contracts | Notional Amount | Premium Received | Value | ||||||
| Call | ||||||||||||
| Ball Corp. | 70.00 | 1/21/22 | 7 | $ 67,389 | $ (12,152) | $ (18,900) | ||||||
| Bank of America Corp. | 25.00 | 1/21/22 | 15 | 66,735 | (8,613) | (29,100) | ||||||
| General Electric Co. | 10.00 | 1/21/22 | 750 | 7,085,250 | (207,156) | (142,500) | ||||||
| Hanesbrands, Inc. | 15.00 | 1/21/22 | 635 | 1,061,720 | (297,100) | (104,775) | ||||||
| Huntsman Corp. | 25.00 | 1/21/22 | 26 | 90,688 | (16,056) | (27,820) | ||||||
| Liberty Global Plc Class A (United Kingdom) | 22.50 | 1/21/22 | 167 | 463,258 | (73,003) | (111,890) | ||||||
| Live Nation Entertainment, Inc. | 57.50 | 1/21/22 | 245 | 2,932,405 | (521,646) | (1,528,800) | ||||||
| Skechers U.S.A., Inc. Class A | 28.00 | 1/21/22 | 694 | 3,011,960 | (737,160) | (1,138,160) | ||||||
| Valvoline, Inc. | 30.00 | 1/21/22 | 105 | 391,545 | (51,622) | (78,750) | ||||||
| Vistra Corp. | 13.00 | 1/21/22 | 7 | 15,939 | (2,514) | (6,930) | ||||||
| Zuora, Inc. Class A | 5.00 | 1/21/22 | 536 | 1,001,248 | (481,969) | (782,560) | ||||||
| Spectrum Brands Holdings, Inc. | 85.00 | 4/14/22 | 114 | 1,159,608 | (156,604) | (208,620) | ||||||
| Valvoline, Inc. | 30.00 | 4/14/22 | 332 | 1,238,028 | (189,647) | (288,840) | ||||||
| Boeing Co. (The) | 200.00 | 6/17/22 | 78 | 1,570,296 | (352,660) | (162,786) | ||||||
| Spectrum Brands Holdings, Inc. | 85.00 | 7/15/22 | 195 | 1,983,540 | (336,431) | (388,050) | ||||||
| WillScot Mobile Mini Holdings Corp. | 30.00 | 7/15/22 | 382 | 1,560,088 | (223,285) | (496,600) | ||||||
| Dole Plc | 12.50 | 12/16/22 | 411 | 547,452 | (114,418) | (98,640) | ||||||
| Dole Plc | 10.00 | 12/16/22 | 1,431 | 1,906,092 | (588,605) | (586,710) | ||||||
| KnowBe4, Inc. Class A | 17.50 | 12/16/22 | 828 | 1,899,432 | (684,693) | (654,120) | ||||||
| Ambarella, Inc. | 130.00 | 1/20/23 | 94 | 1,907,166 | (682,814) | (864,800) | ||||||
| Coty, Inc. Class A | 7.00 | 1/20/23 | 3,080 | 3,234,000 | (1,383,614) | (1,296,680) | ||||||
| General Electric Co. | 7.00 | 1/20/23 | 417 | 3,939,399 | (222,082) | (206,415) | ||||||
| Hanesbrands, Inc. | 13.00 | 1/20/23 | 660 | 1,103,520 | (310,038) | (330,000) | ||||||
| Huntsman Corp. | 27.00 | 1/20/23 | 230 | 802,240 | (170,965) | (218,500) | ||||||
| ON Semiconductor Corp. | 32.00 | 1/20/23 | 644 | 4,374,048 | (937,437) | (2,498,720) | ||||||
| QUALCOMM, Inc. | 160.00 | 1/20/23 | 117 | 2,139,579 | (500,609) | (443,079) | ||||||
| ViacomCBS, Inc. Class B | 37.00 | 1/20/23 | 494 | 1,490,892 | (848,468) | (129,922) | ||||||
| Wells Fargo & Co. | 42.50 | 1/20/23 | 246 | 1,180,308 | (223,606) | (217,710) | ||||||
| Wells Fargo & Co. | 27.50 | 1/20/23 | 563 | 2,701,274 | (478,993) | (1,177,796) | ||||||
| Lamb Weston Holdings, Inc. | 45.00 | 1/19/24 | 585 | 3,707,730 | (994,441) | (1,398,150) | ||||||
| Sally Beauty Holdings, Inc. | 12.50 | 1/19/24 | 1,700 | 3,138,200 | (1,342,714) | (1,785,000) | ||||||
| Splunk, Inc. | 90.00 | 1/19/24 | 118 | 1,365,496 | (440,686) | (516,840) | ||||||
| UiPath, Inc. Class A | 25.00 | 1/19/24 | 582 | 2,510,166 | (1,345,749) | (1,396,800) | ||||||
| Total | $(14,937,550) | $(19,334,963) | ||||||||||
| Meridian Funds | 43 | www.meridianfund.com |
Schedule of Investments
| Shares | Value | |
| Common Stocks - 93.7% | ||
| Communication Services - 1.6% | ||
| Entertainment - 0.6% | ||
| Reservoir Media, Inc.1,2 | 840,927 | $ 6,651,733 |
| Interactive Media & Services - 1.0% | ||
| Actua Corp.1 | 1,232,871 | 12,329 |
| ZipRecruiter, Inc. Class A1 | 457,424 | 11,408,154 |
| 11,420,483 | ||
| Total Communication Services | 18,072,216 | |
| Consumer Discretionary - 16.9% | ||
| Auto Components - 1.2% | ||
| Cooper-Standard Holdings, Inc.1 | 324,008 | 7,261,019 |
| Stoneridge, Inc.1 | 363,844 | 7,182,281 |
| 14,443,300 | ||
| Diversified Consumer Services - 5.0% | ||
| 2U, Inc.1,2 | 814,369 | 16,344,386 |
| Frontdoor, Inc.1 | 667,605 | 24,467,723 |
| Grand Canyon Education, Inc.1 | 203,079 | 17,405,901 |
| 58,218,010 | ||
| Hotels, Restaurants & Leisure - 0.7% | ||
| PlayAGS, Inc.1 | 1,148,392 | 7,797,582 |
| Internet & Direct Marketing Retail - 1.4% | ||
| Shutterstock, Inc. | 53,012 | 5,877,970 |
| Xometry, Inc. Class A1 | 198,676 | 10,182,145 |
| 16,060,115 | ||
| Leisure Products - 1.3% | ||
| Clarus Corp. | 376,023 | 10,423,358 |
| Malibu Boats, Inc. Class A1 | 74,088 | 5,092,068 |
| 15,515,426 | ||
| Specialty Retail - 2.7% | ||
| Sally Beauty Holdings, Inc.1 | 1,709,824 | 31,563,351 |
| Textiles, Apparel & Luxury Goods - 4.6% | ||
| Carter's, Inc. | 70,324 | 7,118,195 |
| Hanesbrands, Inc. | 791,590 | 13,235,385 |
| Skechers U.S.A., Inc. Class A1 | 746,115 | 32,381,391 |
| 52,734,971 | ||
| Total Consumer Discretionary | 196,332,755 | |
| Consumer Staples - 1.2% | ||
| Food & Staples Retailing - 0.5% | ||
| BJ's Wholesale Club Holdings, Inc.1 | 92,048 | 6,164,455 |
| Tobacco - 0.7% | ||
| Turning Point Brands, Inc.2 | 208,194 | 7,865,569 |
| Total Consumer Staples | 14,030,024 | |
| Shares | Value | |
| Energy - 0.1% | ||
| Energy Equipment & Services - 0.1% | ||
| NCS Multistage Holdings, Inc.1,2 | 45,835 | $ 1,329,215 |
| Total Energy | 1,329,215 | |
| Financials - 2.7% | ||
| Capital Markets - 2.7% | ||
| Build Acquisition Corp.1 | 248,849 | 2,451,163 |
| FinServ Acquisition Corp.1 | 816,667 | 8,052,336 |
| FinServ Acquisition Corp. Founder Shares Acquisition Date: 2/22/21, Cost $01,3 | 83,333 | 410,832 |
| FinServ Acquisition Corp. Private Placement Units Acquisition Date: 2/12/21, Cost $208,3301,3 | 20,833 | 102,707 |
| Tishman Speyer Innovation Corp. II1 | 380,576 | 3,748,673 |
| Warrior Technologies Acquisition Co.1 | 746,752 | 7,534,728 |
| WisdomTree Investments, Inc. | 1,484,966 | 9,087,992 |
| Total Financials | 31,388,431 | |
| Health Care - 24.5% | ||
| Biotechnology - 9.9% | ||
| 4D Molecular Therapeutics, Inc.1 | 288,745 | 6,335,065 |
| AbSci Corp. Acquisition Date: 10/19/20 - 3/18/21, Cost $3,839,6711,3 | 523,148 | 3,646,342 |
| Adagio Therapeutics, Inc. Acquisition Date: 4/16/21, Cost $3,299,9831,3 | 211,305 | 1,303,963 |
| Albireo Pharma, Inc.1 | 208,174 | 4,848,372 |
| C4 Therapeutics, Inc.1 | 178,806 | 5,757,553 |
| CareDx, Inc.1 | 190,990 | 8,686,225 |
| Centrexion Therapeutics Corp. (Dividend Shares) Acquisition Date: 3/14/19, Cost $01,3,4 | 17,318 | 1,732 |
| Erasca, Inc.1,2 | 211,544 | 3,295,856 |
| Heron Therapeutics, Inc.1,2 | 608,728 | 5,557,687 |
| Inhibrx, Inc.1,2 | 257,771 | 11,256,860 |
| Instil Bio, Inc.1,2 | 285,105 | 4,878,147 |
| Kiniksa Pharmaceuticals Ltd. Class A1 | 608,152 | 7,157,949 |
| Kodiak Sciences, Inc.1 | 88,603 | 7,511,762 |
| NexImmune, Inc. 1,2 | 477,189 | 2,199,841 |
| Meridian Funds | 44 | www.meridianfund.com |
Schedule of Investments (continued)
| Shares | Value | |
| Olema Pharmaceuticals, Inc.1,2 | 160,475 | $ 1,502,046 |
| ORIC Pharmaceuticals, Inc.1 | 491,920 | 7,231,224 |
| PMV Pharmaceuticals, Inc.1,2 | 209,213 | 4,832,820 |
| Precision BioSciences, Inc.1 | 192,601 | 1,425,247 |
| Relay Therapeutics, Inc.1,2 | 241,907 | 7,428,964 |
| SpringWorks Therapeutics, Inc.1 | 84,820 | 5,257,144 |
| TCR2 Therapeutics, Inc.1 | 92,977 | 433,273 |
| Veracyte, Inc.1,2 | 240,181 | 9,895,457 |
| Viking Therapeutics, Inc.1,2 | 848,247 | 3,901,936 |
| 114,345,465 | ||
| Health Care Equipment & Supplies - 6.3% | ||
| Axogen, Inc.1 | 552,170 | 5,173,833 |
| Cardiovascular Systems, Inc.1 | 397,044 | 7,456,486 |
| CryoLife, Inc.1,2 | 230,789 | 4,696,556 |
| Merit Medical Systems, Inc.1 | 295,551 | 18,412,827 |
| Nevro Corp. 1 | 80,266 | 6,507,165 |
| Paragon 28, Inc.1,2 | 352,263 | 6,231,532 |
| Quidel Corp.1 | 96,540 | 13,031,935 |
| Sight Sciences, Inc.1,2 | 312,419 | 5,489,202 |
| Sonendo, Inc.1,2 | 403,623 | 2,324,869 |
| Sonendo, Inc. Acquisition Date: 12/10/19 Cost $4,999,9801,3 | 249,065 | 1,219,422 |
| Talis Biomedical Corp.1 | 535,053 | 2,145,563 |
| 72,689,390 | ||
| Health Care Providers & Services - 4.3% | ||
| AMN Healthcare Services, Inc.1 | 115,009 | 14,069,051 |
| Cano Health, Inc.1,2 | 785,161 | 6,995,784 |
| Castle Biosciences, Inc.1 | 106,531 | 4,566,984 |
| HealthEquity, Inc.1 | 227,067 | 10,045,444 |
| MEDNAX, Inc.1 | 249,610 | 6,791,888 |
| Privia Health Group, Inc.1,2 | 299,019 | 7,735,622 |
| 50,204,773 | ||
| Health Care Technology - 1.3% | ||
| Omnicell, Inc.1 | 49,075 | 8,855,093 |
| Vocera Communications, Inc.1 | 87,360 | 5,664,422 |
| 14,519,515 | ||
| Life Sciences Tools & Services - 1.8% | ||
| Codex DNA, Inc.1,2 | 335,143 | 3,619,544 |
| MaxCyte, Inc.1,2 | 504,888 | 5,144,809 |
| Syneos Health, Inc.1 | 118,789 | 12,197,255 |
| 20,961,608 | ||
| Pharmaceuticals - 0.9% | ||
| Arvinas, Inc.1 | 78,972 | 6,486,760 |
| DICE Therapeutics, Inc.1,2 | 170,799 | 4,322,923 |
| 10,809,683 | ||
| Total Health Care | 283,530,434 | |
| Shares | Value | |
| Industrials - 29.5% | ||
| Aerospace & Defense - 1.2% | ||
| Byrna Technologies, Inc.1,2 | 444,220 | $ 5,930,337 |
| Rocket Lab U.S.A., Inc.1,2 | 638,004 | 7,834,689 |
| 13,765,026 | ||
| Air Freight & Logistics - 1.1% | ||
| Forward Air Corp. | 107,450 | 13,011,121 |
| Commercial Services & Supplies - 10.7% | ||
| ABM Industries, Inc. | 267,909 | 10,944,083 |
| ACV Auctions, Inc. Class A1 | 862,857 | 16,256,226 |
| Cimpress Plc (Ireland)1 | 130,010 | 9,310,016 |
| Clean Harbors, Inc.1 | 148,956 | 14,861,340 |
| Heritage-Crystal Clean, Inc.1 | 1,190,805 | 38,129,576 |
| Ritchie Bros. Auctioneers, Inc. (Canada)2 | 402,733 | 24,651,287 |
| SP Plus Corp.1 | 360,599 | 10,176,104 |
| 124,328,632 | ||
| Machinery - 3.5% | ||
| Graham Corp. | 289,598 | 3,602,599 |
| John Bean Technologies Corp.2 | 37,401 | 5,743,298 |
| Middleby Corp. (The)1 | 59,825 | 11,771,167 |
| Tennant Co. | 246,360 | 19,965,014 |
| 41,082,078 | ||
| Marine - 4.2% | ||
| Kirby Corp.1 | 272,449 | 16,188,919 |
| Matson, Inc. | 355,325 | 31,989,910 |
| 48,178,829 | ||
| Professional Services - 7.5% | ||
| Alight, Inc. Class A1,2 | 926,915 | 10,019,951 |
| First Advantage Corp.1 | 614,686 | 11,703,621 |
| Forrester Research, Inc.1 | 224,304 | 13,173,374 |
| Legalzoom.com, Inc.1,2 | 375,648 | 6,036,663 |
| TriNet Group, Inc.1 | 289,294 | 27,558,147 |
| TrueBlue, Inc.1 | 683,637 | 18,916,236 |
| 87,407,992 | ||
| Road & Rail - 0.6% | ||
| Heartland Express, Inc. | 390,776 | 6,572,852 |
| Trading Companies & Distributors - 0.7% | ||
| Hudson Technologies, Inc.1 | 1,840,660 | 8,172,530 |
| Total Industrials | 342,519,060 | |
| Information Technology - 16.3% | ||
| Electronic Equipment & Instruments - 1.0% | ||
| CTS Corp. | 316,353 | 11,616,482 |
| IT Services - 0.6% | ||
| International Money Express, Inc.1 | 445,152 | 7,104,626 |
| Meridian Funds | 45 | www.meridianfund.com |
Schedule of Investments (continued)
| Shares | Value | |
| Semiconductors & Semiconductor Equipment - 0.6% | ||
| Allegro MicroSystems, Inc. (Japan)1 | 177,904 | $ 6,436,567 |
| Software - 14.1% | ||
| 8x8, Inc.1 | 907,937 | 15,217,024 |
| Alkami Technology, Inc.1,2 | 390,858 | 7,840,611 |
| Asure Software, Inc.1 | 754,674 | 5,909,097 |
| ChannelAdvisor Corp.1 | 167,309 | 4,129,186 |
| Consensus Cloud Solutions, Inc.1 | 112,065 | 6,485,202 |
| Datto Holding Corp.1,2 | 342,477 | 9,024,269 |
| ForgeRock, Inc. Class A1,2 | 172,764 | 4,611,071 |
| KnowBe4, Inc. Class A1 | 290,637 | 6,667,213 |
| Latch, Inc.1,2 | 689,539 | 5,219,810 |
| Mimecast Ltd.1 | 341,422 | 27,166,949 |
| Model N, Inc.1,2 | 202,255 | 6,073,718 |
| Momentive Global, Inc.1 | 1,196,673 | 25,309,634 |
| Ping Identity Holding Corp.1 | 344,518 | 7,882,572 |
| Sumo Logic, Inc.1 | 431,917 | 5,856,794 |
| Upland Software, Inc.1 | 344,144 | 6,173,943 |
| Vertex, Inc. Class A1,2 | 342,410 | 5,434,047 |
| Weave Communications, Inc.1,2 | 406,786 | 6,175,011 |
| Zuora, Inc. Class A1 | 461,682 | 8,624,220 |
| 163,800,371 | ||
| Total Information Technology | 188,958,046 | |
| Materials - 0.6% | ||
| Containers & Packaging - 0.6% | ||
| Ranpak Holdings Corp.1 | 184,181 | 6,921,522 |
| Total Materials | 6,921,522 | |
| Utilities - 0.3% | ||
| Water Utilities - 0.3% | ||
| Pure Cycle Corp.1 | 236,449 | 3,452,155 |
| Total Utilities | 3,452,155 | |
| Total Common Stocks - 93.7% (Cost $826,375,477) | 1,086,533,858 | |
| Warrants - 0.0% | ||
| Information Technology - 0.0% | ||
| Software - 0.0% | ||
| Latch, Inc. Strike Price $11.50, Expires 12/31/261 | 249,990 | 458,732 |
| Total Information Technology | 458,732 | |
| Total Warrants - 0.0% (Cost $493,585) | 458,732 | |
| Shares | Value | |
| Preferred Stocks - 4.7% | ||
| Consumer Discretionary - 1.0% | ||
| Internet & Direct Marketing Retail - 0.8% | ||
| Evolve Vacation Rental Network, Inc. Series 8 Acquisition Date: 6/15/18, Cost $3,999,9991,3,4 | 470,013 | $ 9,357,959 |
| Specialty Retail - 0.2% | ||
| Capsule Corp. Series D Acquisition Date: 4/8/21, Cost $2,000,0001,3,4 | 138,011 | 1,983,218 |
| Total Consumer Discretionary | 11,341,177 | |
| Health Care - 1.6% | ||
| Biotechnology - 0.4% | ||
| Centrexion Therapeutics Corp. Acquisition Date: 12/18/17, Cost $2,995,0071,3,4 | 1,663,893 | 715,474 |
| DNA Script Series C Acquisition Date: 10/8/21 Cost $3,431,7211,3,4 | 3,955 | 3,431,753 |
| 4,147,227 | ||
| Health Care Equipment & Supplies - 1.2% | ||
| Adagio Medical, Inc. Series E Acquisition Date: 11/9/20, Cost $4,000,0031,3,4 | 176,913 | 4,178,685 |
| Beta Bionics, Inc. Series B Acquisition Date: 10/9/18, Cost $3,999,9761,3,4 | 26,631 | 3,816,489 |
| Binx Health, Inc. Series E Acquisition Date: 5/26/21, Cost $6,500,0411,3,4 | 24,179 | 6,500,040 |
| 14,495,214 | ||
| Total Health Care | 18,642,441 | |
| Information Technology - 1.6% | ||
| Communications Equipment - 0.8% | ||
| Starry, Inc. Series C Acquisition Date: 5/14/18, Cost $3,780,0001,3,4 | 4,099,783 | 7,092,625 |
| Starry, Inc. Series D Acquisition Date: 3/6/19, Cost $1,665,0001,3,4 | 1,164,336 | 2,014,301 |
| 9,106,926 | ||
| Software - 0.8% | ||
| Dataminr, Inc. Series F Acquisition Date: 3/22/21, Cost $5,655,3201,3,4 | 128,530 | 5,803,129 |
| Meridian Funds | 46 | www.meridianfund.com |
Schedule of Investments (continued)
| Shares | Value | |
| Skyryse, Inc. Series B Acquisition Date: 10/21/21 Cost $4,184,9831,3,4 | 169,570 | $ 4,184,983 |
| 9,988,112 | ||
| Total Information Technology | 19,095,038 | |
| Real Estate - 0.5% | ||
| Real Estate Management & Development - 0.5% | ||
| Apartment List, Inc. Series D Acquisition Date: 12/21/20 - 12/24/20 Cost $5,999,9981,3,4 | 1,642,485 | 5,830,822 |
| Total Real Estate | 5,830,822 | |
| Total Preferred Stocks - 4.7% (Cost $48,212,048) | 54,909,478 | |
| Private Investment Fund - 0.3% | ||
| Quail Investment Holdings, LLC Acquisition Date: 9/1/20, Cost $2,917,6951,3,5 | 2,918 | 2,798,945 |
| Total Private Investment Fund - 0.3% (Cost $2,917,695) | 2,798,945 | |
| Shares/ Principal Amount | ||
| Short-Term Investments - 5.9%6 | ||
| Money Market Funds - 2.6% | ||
| BlackRock Liquidity Funds, FedFund, Institutional Class, 0.03% | 5,203,000 | 5,203,000 |
| Federated Treasury Obligations Fund, Institutional Class, 0.03% | 5,203,000 | 5,203,000 |
| Fidelity Investments Money Market Government Portfolio, Institutional Class, 0.01% | 2,313,000 | 2,313,000 |
| Goldman Sachs Financial Square Government Fund, Institutional Class, 0.03% | 5,476,000 | 5,476,000 |
| Shares/ Principal Amount | Value | |
| Invesco Short Term Investments, Government & Agency Portfolio, Institutional Class, 0.03% | 5,000,000 | $ 5,000,000 |
| JPMorgan U.S. Government Money Market Fund, Institutional Class, 0.03% | 5,203,000 | 5,203,000 |
| Morgan Stanley Institutional Liquidity Funds, Government Portfolio, Institutional Class, 0.03% | 2,313,000 | 2,313,000 |
| Total Money Market Funds (Cost $30,711,000) | 30,711,000 | |
| Repurchase Agreements - 3.3% | ||
| Bank of America Securities, Inc., dated 12/31/21, due 1/3/22, 0.05% total to be received $15,957,507 (collateralized by various U.S. Government Sponsored Agency, 1.00% - 5.00%, 9/1/28 - 1/1/61, totaling $16,276,590) | $ 15,957,441 | 15,957,441 |
| Nomura Securities International, Inc., dated 12/31/21, due 1/3/22, 0.05% total to be received $5,934,534 (collateralized by various U.S. Government Sponsored Agency and U.S. Treasury Obligations, 0.00% - 5.00%, 9/6/24 - 9/20/69, totaling $6,053,199) | 5,934,509 | 5,934,509 |
| Meridian Funds | 47 | www.meridianfund.com |
Schedule of Investments (continued)
| Shares/ Principal Amount | Value | |
| RBC Dominion Securities, Inc., dated 12/31/21, due 1/3/22, 0.05% total to be received $15,957,507 (collateralized by various U.S. Government Sponsored Agency and U.S. Treasury Obligations, 0.00% - 6.50%, 5/15/22 - 12/1/51, totaling $16,276,590) | $ 15,957,441 | $ 15,957,441 |
| Total Repurchase Agreements (Cost $37,849,391) | 37,849,391 | |
| Total Short-Term Investments - 5.9% (Cost $68,560,391) | 68,560,391 | |
| Total Investments - 104.6% (Cost $946,559,196) | 1,213,261,404 | |
| Liabilities in Excess of Other Assets - (4.6)% | (52,926,387) | |
| Net Assets - 100.0% | $1,160,335,017 |
| Plc—Public Limited Company |
| 1 | Non-income producing securities. |
| 2 | All or portion of this security is on loan at December 31, 2021. Total value of such securities at period-end amounts to $92,443,488 and represents 7.97% of net assets. Securities loaned with a value of $114,613 are pending settlement as of December 31, 2021. |
| 3 | Restricted security; cannot be offered for public resale without first being registered under the Securities Act of 1933 and related rules and agreements. Acquisition date represents the date on which an enforceable right to acquire such security is obtained and is presented along with related cost in the security description. The Fund has registration rights for certain restricted securities. Any costs related to such registration are borne by the issuer. The aggregate value of restricted securities at period-end amounts to $64,393,421 and represents 5.55% of net assets. |
| 4 | Security is valued using significant unobservable inputs in good faith in accordance with procedures approved by the Board of Directors. See Note 1 in Notes to financial statements. |
| 5 | Quail Investment Holdings, LLC is a limited liability company that was organized to invest solely in Qumulo, Inc Series E Preferred Stock. The value of Qumulo, Inc. is substantially the same as Quail Investment Holdings, LLC. |
| 6 | Collateral received from brokers for securities lending was invested in short-term investments. |
| Meridian Funds | 48 | www.meridianfund.com |
Statements of Assets and Liabilities
| December 31, 2021 (Unaudited) | Meridian Growth Fund | Meridian Contrarian Fund | Meridian Enhanced Equity Fund | Meridian Small Cap Growth Fund |
| Assets | ||||
Investments, at value1,2 | $2,108,625,313 | $696,639,910 | $79,102,763 | $1,175,412,013 |
Repurchase agreements3 | 47,815,239 | 10,284,549 | 399,561 | 37,849,391 |
Cash | 31,583,963 | 50,219,140 | 2,075,961 | 21,909,692 |
Due from broker | 23,959,529 | 6,943,387 | — | — |
| Receivables and other assets: | ||||
Fund shares purchased | 560,809 | 175,241 | 200 | 1,533,503 |
Investments sold | 274,867 | 1,554,423 | — | 629,112 |
Dividends | 265,967 | 1,015,780 | 26,476 | 65,066 |
Securities lending interest | 25,331 | 9,817 | 447 | 32,358 |
Prepaid expenses | 76,620 | 48,144 | 31,329 | 76,479 |
Total Assets | 2,213,187,638 | 766,890,391 | 81,636,737 | 1,237,507,614 |
| Liabilities | ||||
Securities sold short4 | 18,664,200 | — | — | — |
Collateral held for securities on loan | 84,761,239 | 16,565,549 | 399,561 | 68,560,391 |
| Payables and other accrued expenses: | ||||
Options written at value5 | — | — | 19,334,963 | — |
Fund shares sold | 1,224,208 | 53,426 | — | 6,815,781 |
Investments purchased | 3,871,065 | 4,612,593 | — | 334,709 |
Investment management fees | 1,352,153 | 618,243 | 45,356 | 1,002,071 |
Distribution and service plan fees | 3,476 | 857 | 502 | 12,732 |
Professional fees | 78,779 | 30,547 | 17,175 | 62,832 |
Directors' fees | 4,344 | 1,562 | 133 | 2,561 |
Transfer agent fees | 130,664 | 66,244 | 6,516 | 213,310 |
Other | 134,090 | 34,427 | 25,907 | 168,210 |
Total Liabilities | 110,224,218 | 21,983,448 | 19,830,113 | 77,172,597 |
Net Assets | $2,102,963,420 | $744,906,943 | $61,806,624 | $1,160,335,017 |
| Net Assets Consist of | ||||
Paid-in capital | $1,388,532,453 | $467,936,593 | $49,914,090 | $ 841,053,587 |
Accumulated earnings | 714,430,967 | 276,970,350 | 11,892,534 | 319,281,430 |
Net Assets | $2,102,963,420 | $744,906,943 | $61,806,624 | $1,160,335,017 |
1 Investments at cost | $1,473,181,863 | $446,190,051 | $64,807,315 | $908,709,805 |
| 2 | Including securities on loan valued at $133,259,464, $39,218,096, $2,414,617 and $92,443,488 respectively. See Note 4 in Notes to Financial Statements. |
| 3 | Repurchase agreements at cost are $47,815,239, $10,284,549, $399,561 and $37,849,391, respectively. |
| 4 | Proceeds received from securities sold short $23,794,994, $—, $— and $—, respectively. |
| 5 | Written options, premium received of $—, $—, $14,937,550 and $—, respectively. |
| Meridian Funds | 49 | www.meridianfund.com |
Statements of Assets and Liabilities (continued)
| December 31, 2021 (Unaudited) | Meridian Growth Fund | Meridian Contrarian Fund | Meridian Enhanced Equity Fund | Meridian Small Cap Growth Fund |
| Net Asset Value | ||||
| Legacy Class | ||||
Net Assets | $1,426,374,274 | $732,045,686 | $57,658,814 | $ 32,395,938 |
Shares outstanding6 | 29,856,592 | 15,961,873 | 3,897,830 | 1,984,957 |
Net Asset value per share (offering and redemption price) | $ 47.77 | $ 45.86 | $ 14.79 | $ 16.32 |
| Institutional Class | ||||
Net Assets | $ 609,091,212 | $ — | $ — | $453,912,150 |
Shares outstanding6 | 12,749,143 | — | — | 27,588,440 |
Net Asset value per share (offering and redemption price) | $ 47.78 | $ — | $ — | $ 16.45 |
| Class A | ||||
Net Assets | $ 5,886,455 | $ 2,604,278 | $ 2,155,790 | $ 31,368,011 |
Shares outstanding6 | 129,859 | 58,704 | 149,445 | 2,005,488 |
Net Asset value per share (offering and redemption price) | $ 45.33 | $ 44.36 | $ 14.43 | $ 15.64 |
| Class C | ||||
Net Assets | $ 2,603,933 | $ 407,902 | $ 40,063 | $ 6,960,957 |
Shares outstanding6 | 59,917 | 9,565 | 2,860 | 473,629 |
Net Asset value per share (offering and redemption price) | $ 43.46 | $ 42.65 | $ 14.01 | $ 14.70 |
| Investor Class | ||||
Net Assets | $ 59,007,546 | $ 9,849,077 | $ 1,951,957 | $635,697,961 |
Shares outstanding6 | 1,252,736 | 216,979 | 132,381 | 39,265,230 |
Net Asset value per share (offering and redemption price) | $ 47.10 | $ 45.39 | $ 14.757 | $ 16.19 |
| 6 | 500,000,000 shares authorized, $0.01 par value. |
| 7 | Calculated NAV may not equal actual NAV shown due to rounding of the net assets and shares. |
| Meridian Funds | 50 | www.meridianfund.com |
Statements of Operations
| For the Six Months Ended December 31, 2021 (Unaudited) | Meridian Growth Fund | Meridian Contrarian Fund | Meridian Enhanced Equity Fund | Meridian Small Cap Growth Fund |
| Investment Income | ||||
Dividends | $ 4,720,925 | $ 4,123,885 | $ 273,353 | $ 1,572,449 |
Foreign taxes withheld | (58,157) | (19,821) | — | (34,687) |
Interest income | — | — | — | 4,532 |
Securities lending | 181,681 | 220,840 | 7,623 | 369,240 |
Total investment income | 4,844,449 | 4,324,904 | 280,976 | 1,911,534 |
| Expenses | ||||
Investment management fees | 8,430,652 | 3,680,499 | 274,399 | 6,936,470 |
Custodian fees | 99,477 | 35,014 | 9,980 | 78,866 |
| Distribution and service plan fees: | ||||
Class A | 7,569 | 3,527 | 2,752 | 43,427 |
Class C | 14,321 | 1,299 | 126 | 39,781 |
Directors' fees | 98,947 | 32,526 | 2,890 | 62,985 |
Pricing fees | 106,025 | 39,631 | 12,618 | 82,343 |
Audit and tax fees | 17,261 | 13,223 | 12,652 | 17,449 |
Legal fees | 48,554 | 6,324 | 617 | 39,976 |
Registration and filing fees | 56,833 | 43,040 | 41,796 | 56,555 |
Shareholder communications fees | 59,315 | 22,433 | 8,876 | 80,442 |
Transfer agent fees | 388,733 | 193,120 | 18,015 | 604,356 |
Recoupment of investment advisory fees previously waived | — | — | 127 | 6,831 |
Miscellaneous expenses | 55,398 | 20,512 | 8,046 | 41,453 |
Total expenses excluding interest expenses | 9,383,085 | 4,091,148 | 392,894 | 8,090,934 |
Interest expenses | — | — | 403 | — |
Total expenses | 9,383,085 | 4,091,148 | 393,297 | 8,090,934 |
Less waivers and/or reimbursements (Note 6) | — | — | (20) | — |
Net expenses | 9,383,085 | 4,091,148 | 393,277 | 8,090,934 |
Net investment income (loss) | (4,538,636) | 233,756 | (112,301) | (6,179,400) |
| Realized and Unrealized Gain (Loss) | ||||
Net realized gain on investments and foreign currency transactions | 174,689,743 | 38,127,693 | 5,622,228 | 202,491,988 |
Net realized loss on written options | — | — | (357,544) | — |
Net change in unrealized depreciation on investments | (183,166,271) | (4,607,567) | (1,098,011) | (285,874,977) |
Net change in unrealized appreciation on securities sold short | 5,130,794 | — | — | — |
Net change in unrealized appreciation/(depreciation) on written options | — | 128,926 | (1,312,571) | — |
Total realized and unrealized gain/(loss) | (3,345,734) | 33,649,052 | 2,854,102 | (83,382,989) |
Net increase/(decrease) in net assets resulting from operations | $ (7,884,370) | $33,882,808 | $ 2,741,801 | $ (89,562,389) |
| Meridian Funds | 51 | www.meridianfund.com |
Statements of Changes in Net Assets
| Meridian Growth Fund | Meridian Contrarian Fund | ||||
| Changes in Net Assets From: | Six Months Ended December 31, 2021 (Unaudited) | Year Ended June 30, 2021 | Six Months Ended December 31, 2021 (Unaudited) | Year Ended June 30, 2021 | |
| Operations | |||||
Net investment income/(loss) | $ (4,538,636) | $ (10,597,759) | $ 233,756 | $ (706,723) | |
Net realized gain on investments | 174,689,743 | 304,073,283 | 38,127,693 | 120,376,063 | |
Net change in unrealized appreciation/(depreciation) on investments, securities sold short and written options | (178,035,477) | 661,320,758 | (4,478,641) | 186,950,015 | |
Net increase/(decrease) in net assets from operations | (7,884,370) | 954,796,282 | 33,882,808 | 306,619,355 | |
| Distributions to Shareholders: | |||||
Legacy Class | (194,054,079) | (11,923,723) | (91,794,387) | (29,590,465) | |
Institutional Class | (81,802,242) | (4,705,276) | — | — | |
Class A | (837,322) | (49,734) | (361,504) | (89,267) | |
Class C | (378,203) | (25,185) | (50,641) | (7,188) | |
Investor Class | (8,081,485) | (3,292,390) | (1,202,076) | (106,172) | |
Decrease in net assets from distributions | (285,153,331) | (19,996,308) | (93,408,608) | (29,793,092) | |
| Fund Share Transactions | |||||
Net increase/(decrease) in net assets resulting from fund share transactions (Note 2) | 160,905,798 | (537,735,273) | 64,434,308 | (24,033,444) | |
Total increase/(decrease) in net assets | (132,131,903) | 397,064,701 | 4,908,508 | 252,792,819 | |
| Net Assets | |||||
Beginning of Period | 2,235,095,323 | 1,838,030,622 | 739,998,435 | 487,205,616 | |
End of Period | $2,102,963,420 | $2,235,095,323 | $744,906,943 | $739,998,435 | |
| Meridian Funds | 52 | www.meridianfund.com |
Statements of Changes in Net Assets (continued)
| Meridian Enhanced Equity Fund | Meridian Small Cap Growth Fund | ||||
| Changes in Net Assets From: | Six Months Ended December 31, 2021 (Unaudited) | Year Ended June 30, 2021 | Six Months Ended December 31, 2021 (Unaudited) | Year Ended June 30, 2021 | |
| Operations | |||||
Net investment loss | $ (112,301) | $ (188,865) | $ (6,179,400) | $ (11,960,077) | |
Net realized gain on investments, forward foreign currency exchange contracts and written options | 5,264,684 | 14,249,180 | 202,491,988 | 33,604,815 | |
Net change in unrealized appreciation/(depreciation) on investments and written options | (2,410,582) | 2,706,922 | (285,874,977) | (95,782,762) | |
Net increase/(decrease) in net assets from operations | 2,741,801 | 16,767,237 | (89,562,389) | 716,845,176 | |
| Distributions to Shareholders: | |||||
Legacy Class | (12,274,693) | (6,719,285) | (9,963,768) | (597,274) | |
Institutional Class | — | — | (112,922,343) | (12,486,518) | |
Class A | (463,710) | (248,148) | (8,338,772) | (671,223) | |
Class C | (8,835) | (4,202) | (1,873,342) | (164,935) | |
Investor Class | (413,786) | (261,508) | (162,733,487) | (17,279,229) | |
Decrease in net assets from distributions | (13,161,024) | (7,233,143) | (295,831,712) | (31,199,179) | |
| Fund Share Transactions | |||||
Net increase/(decrease) in net assets resulting from fund share transactions (Note 2) | 7,576,917 | 3,302,816 | (71,514,683) | (390,012,892) | |
Total increase/(decrease) in net assets | (2,842,306) | 12,836,910 | (456,908,784) | 295,633,105 | |
| Net Assets | |||||
Beginning of Period | 64,648,930 | 51,812,020 | 1,617,243,801 | 1,321,610,696 | |
End of Period | $ 61,806,624 | $64,648,930 | $1,160,335,017 | $1,617,243,801 | |
| Meridian Funds | 53 | www.meridianfund.com |
Financial Highlights
| For the Six Months Ended December 31, | For the Fiscal Year Ended June 30, | |||||
| Legacy Class | 2021 (Unaudited) | 2021 | 2020 | 2019 | 2018 | 2017 |
| Per Share Operating Performance | ||||||
Net asset value, beginning of period | $ 55.49 | $ 35.86 | $ 39.69 | $ 45.05 | $ 40.15 | $ 32.70 |
| Income (loss) from investment operations: | ||||||
Net investment loss1 | (0.11) | (0.24) | (0.05) | (0.03) | (0.10) | (0.09) |
Net realized and unrealized gain (loss) | (0.21) | 20.29 | (0.23) | 0.12 | 7.94 | 7.74 |
Net increase (decrease) from investment operations | (0.32) | 20.05 | (0.28) | 0.09 | 7.84 | 7.65 |
| Less distributions to shareholders: | ||||||
Distributions from net investment income | 0.00 | 0.00 | 0.00 | (0.02) | 0.00 | 0.00 |
Distributions from net realized capital gains | (7.40) | (0.42) | (3.55) | (5.43) | (2.94) | (0.20) |
Total distributions to shareholders | (7.40) | (0.42) | (3.55) | (5.45) | (2.94) | (0.20) |
Redemption fees | 0.00 2 | 0.00 2 | 0.00 2 | 0.00 2 | 0.00 2 | 0.00 2 |
Net asset value, end of period | $ 47.77 | $ 55.49 | $ 35.86 | $ 39.69 | $ 45.05 | $ 40.15 |
Total return | (0.39)% 3 | 56.11% | (1.40)% 4 | 2.98% 4 | 20.14% | 23.46% |
| Ratios to Average Net Assets | ||||||
Ratio of net investment loss to average net assets | (0.41)% 5,6 | (0.51)% 5 | (0.12)% | (0.06)% | (0.23)% | (0.24)% |
Ratio of expenses to average net assets | 0.84% 5,6 | 0.84% 5 | 0.85% | 0.85% | 0.86% | 0.87% |
| Supplemental Data | ||||||
Net Assets, End of Period (000's) | $1,426,374 | $1,503,022 | $1,095,062 | $1,307,172 | $1,400,431 | $1,270,753 |
Portfolio Turnover Rate | 20% 3 | 30% | 47% | 35% | 47% | 34% |
| 1 | Per share net investment loss has been calculated using the average daily shares method. |
| 2 | Less than $0.005 per share. |
| 3 | Not Annualized. |
| 4 | The total return is based on beginning and ending Financial Statement Net Asset Value as shown above, which may differ from the traded Net Asset Value, due to rounding. |
| 5 | These ratios exclude the impact of expenses of the underlying private investment funds in which the Fund invests as represented in the Schedule of Investments. |
| 6 | Annualized. |
| Meridian Funds | 54 | www.meridianfund.com |
Financial Highlights
| For the Six Months Ended December 31, | For the Fiscal Year Ended June 30, | |||||
| Institutional Class | 2021 (Unaudited) | 2021 | 2020 | 2019 | 2018 | 2017 |
| Per Share Operating Performance | ||||||
Net asset value, beginning of period | $ 55.48 | $ 35.85 | $ 39.67 | $ 45.03 | $ 40.13 | $ 32.68 |
| Income (loss) from investment operations: | ||||||
Net investment loss1 | (0.11) | (0.23) | (0.03) | (0.02) | (0.11) | (0.09) |
Net realized and unrealized gain (loss) | (0.19) | 20.28 | (0.24) | 0.12 | 7.95 | 7.74 |
Net increase (decrease) from investment operations | (0.30) | 20.05 | (0.27) | 0.10 | 7.84 | 7.65 |
| Less distributions to shareholders: | ||||||
Distributions from net investment income | 0.00 | 0.00 | 0.00 | (0.03) | 0.00 | 0.00 |
Distributions from net realized capital gains | (7.40) | (0.42) | (3.55) | (5.43) | (2.94) | (0.20) |
Total distributions to shareholders | (7.40) | (0.42) | (3.55) | (5.46) | (2.94) | (0.20) |
Redemption fees | 0.00 2 | 0.00 2 | 0.00 2 | 0.00 2 | 0.00 2 | 0.00 2 |
Net asset value, end of period | $ 47.78 | $ 55.48 | $ 35.85 | $ 39.67 | $ 45.03 | $ 40.13 |
Total return | (0.34)% 3 | 56.13% | (1.38)% | 3.00% | 20.18% | 23.48% |
| Ratios to Average Net Assets | ||||||
Ratio of net investment loss to average net assets | (0.38)% 4,5 | (0.49)% 4 | (0.09)% | (0.05)% | (0.25)% | (0.24)% |
Ratio of expenses to average net assets | 0.82% 4,5 | 0.82% 4 | 0.82% | 0.83% | 0.85% | 0.87% |
| Supplemental Data | ||||||
Net Assets, End of Period (000's) | $609,091 | $660,985 | $455,636 | $367,627 | $311,019 | $ 92,203 |
Portfolio Turnover Rate | 20% 3 | 30% | 47% | 35% | 47% | 34% |
| 1 | Per share net investment loss has been calculated using the average daily shares method. |
| 2 | Less than $0.005 per share. |
| 3 | Not Annualized. |
| 4 | These ratios exclude the impact of expenses of the underlying private investment funds in which the Fund invests as represented in the Schedule of Investments. |
| 5 | Annualized. |
| Meridian Funds | 55 | www.meridianfund.com |
Financial Highlights
| For the Six Months Ended December 31, | For the Fiscal Year Ended June 30, | |||||
| Class A | 2021 (Unaudited) | 2021 | 2020 | 2019 | 2018 | 2017 |
| Per Share Operating Performance | ||||||
Net asset value, beginning of period | $ 53.12 | $ 34.45 | $ 38.38 | $ 43.88 | $ 39.29 | $ 32.10 |
| Income (loss) from investment operations: | ||||||
Net investment loss1 | (0.19) | (0.37) | (0.16) | (0.13) | (0.21) | (0.20) |
Net realized and unrealized gain (loss) | (0.20) | 19.46 | (0.22) | 0.06 | 7.74 | 7.59 |
Net increase (decrease) from investment operations | (0.39) | 19.09 | (0.38) | (0.07) | 7.53 | 7.39 |
| Less distributions to shareholders: | ||||||
Distributions from net realized capital gains | (7.40) | (0.42) | (3.55) | (5.43) | (2.94) | (0.20) |
Total distributions to shareholders | (7.40) | (0.42) | (3.55) | (5.43) | (2.94) | (0.20) |
Redemption fees | 0.00 | 0.00 2 | 0.00 2 | 0.00 | 0.00 2 | 0.00 2 |
Net asset value, end of period | $ 45.33 | $ 53.12 | $ 34.45 | $ 38.38 | $ 43.88 | $ 39.29 |
Total return | (0.53)% 3 | 55.62% | (1.72)% 4 | 2.64% 4 | 19.81% | 23.09% |
| Ratios to Average Net Assets | ||||||
Ratio of net investment loss to average net assets | (0.73)% 5,6 | (0.82)% 5 | (0.45)% | (0.32)% | (0.51)% | (0.56)% |
Ratio of expenses to average net assets | 1.16% 5,6 | 1.16% 5 | 1.17% | 1.15% | 1.15% | 1.18% |
| Supplemental Data | ||||||
Net Assets, End of Period (000's) | $ 5,886 | $ 6,045 | $ 4,731 | $ 6,707 | $ 15,701 | $ 17,287 |
Portfolio Turnover Rate | 20% 3 | 30% | 47% | 35% | 47% | 34% |
| 1 | Per share net investment loss has been calculated using the average daily shares method. |
| 2 | Less than $0.005 per share. |
| 3 | Not Annualized. |
| 4 | The total return is based on beginning and ending Financial Statement Net Asset Value as shown above, which may differ from the traded Net Asset Value, due to rounding. |
| 5 | These ratios exclude the impact of expenses of the underlying private investment funds in which the Fund invests as represented in the Schedule of Investments. |
| 6 | Annualized. |
| Meridian Funds | 56 | www.meridianfund.com |
Financial Highlights
| For the Six Months Ended December 31, | For the Fiscal Year Ended June 30, | |||||
| Class C | 2021 (Unaudited) | 2021 | 2020 | 2019 | 2018 | 2017 |
| Per Share Operating Performance | ||||||
Net asset value, beginning of period | $ 51.42 | $ 33.60 | $ 37.76 | $ 43.56 | $ 39.30 | $ 32.34 |
| Income (loss) from investment operations: | ||||||
Net investment loss1 | (0.37) | (0.66) | (0.40) | (0.43) | (0.52) | (0.48) |
Net realized and unrealized gain(loss) | (0.19) | 18.90 | (0.21) | 0.06 | 7.72 | 7.64 |
Net increase (decrease) from investment operations | (0.56) | 18.24 | (0.61) | (0.37) | 7.20 | 7.16 |
| Less distributions to shareholders: | ||||||
Distributions from net realized capital gains | (7.40) | (0.42) | (3.55) | (5.43) | (2.94) | (0.20) |
Total distributions to shareholders | (7.40) | (0.42) | (3.55) | (5.43) | (2.94) | (0.20) |
Redemption fees | 0.00 | 0.00 | 0.00 | 0.00 | 0.00 2 | 0.00 |
Net asset value, end of period | $ 43.46 | $ 51.42 | $ 33.60 | $ 37.76 | $ 43.56 | $ 39.30 |
Total return | (0.88)% 3 | 54.49% | (2.40)% 4 | 1.94% 4 | 18.90% | 22.20% |
| Ratios to Average Net Assets | ||||||
Ratio of net investment loss to average net assets | (1.43)% 5,6 | (1.53)% 5 | (1.15)% | (1.08)% | (1.27)% | (1.33)% |
Ratio of expenses to average net assets | 1.86% 5,6 | 1.87% 5 | 1.87% | 1.87% | 1.90% | 1.92% |
| Supplemental Data | ||||||
Net Assets, End of Period (000's) | $ 2,604 | $ 2,899 | $ 2,188 | $ 2,914 | $ 3,384 | $ 3,095 |
Portfolio Turnover Rate | 20% 3 | 30% | 47% | 35% | 47% | 34% |
| 1 | Per share net investment loss has been calculated using the average daily shares method. |
| 2 | Less than $0.005 per share. |
| 3 | Not Annualized. |
| 4 | The total return is based on beginning and ending Financial Statement Net Asset Value as shown above, which may differ from the traded Net Asset Value, due to rounding. |
| 5 | These ratios exclude the impact of expenses of the underlying private investment funds in which the Fund invests as represented in the Schedule of Investments. |
| 6 | Annualized. |
| Meridian Funds | 57 | www.meridianfund.com |
Financial Highlights
| For the Six Months Ended December 31, | For the Fiscal Year Ended June 30, | |||||
| Investor Class | 2021 (Unaudited) | 2021 | 2020 | 2019 | 2018 | 2017 |
| Per Share Operating Performance | ||||||
Net asset value, beginning of period | $ 54.83 | $ 35.46 | $ 39.29 | $ 44.66 | $ 39.86 | $ 32.48 |
| Income (loss) from investment operations: | ||||||
Net investment loss1 | (0.13) | (0.20) | (0.05) | (0.06) | (0.13) | (0.12) |
Net realized and unrealized gain(loss) | (0.20) | 19.99 | (0.23) | 0.13 | 7.87 | 7.69 |
Net increase (decrease) from investment operations | (0.33) | 19.79 | (0.28) | 0.07 | 7.74 | 7.57 |
| Less distributions to shareholders: | ||||||
Distributions from net investment income | 0.00 | 0.00 | 0.00 | (0.01) | 0.00 | 0.00 |
Distributions from net realized capital gains | (7.40) | (0.42) | (3.55) | (5.43) | (2.94) | (0.20) |
Total distributions to shareholders | (7.40) | (0.42) | (3.55) | (5.44) | (2.94) | (0.20) |
Redemption fees | 0.00 | 0.00 2 | 0.00 2 | 0.00 2 | 0.00 | 0.01 |
Net asset value, end of period | $ 47.10 | $ 54.83 | $ 35.46 | $ 39.29 | $ 44.66 | $ 39.86 |
Total return | (0.41)% 3 | 56.01% | (1.42)% 4 | 2.95% 4 | 20.06% | 23.41% |
| Ratios to Average Net Assets | ||||||
Ratio of net investment loss to average net assets | (0.48)% 5,6 | (0.47)% 5 | (0.13)% | (0.14)% | (0.31)% | (0.34)% |
Ratio of expenses to average net assets | 0.91% 5,6 | 0.87% 5 | 0.86% | 0.87% | 0.95% | 0.94% |
| Supplemental Data | ||||||
Net Assets, End of Period (000's) | $ 59,008 | $ 62,145 | $280,414 | $362,613 | $103,643 | $ 89,177 |
Portfolio Turnover Rate | 20% 3 | 30% | 47% | 35% | 47% | 34% |
| 1 | Per share net investment loss has been calculated using the average daily shares method. |
| 2 | Less than $0.005 per share. |
| 3 | Not Annualized. |
| 4 | The total return is based on beginning and ending Financial Statement Net Asset Value as shown above, which may differ from the traded Net Asset Value, due to rounding. |
| 5 | These ratios exclude the impact of expenses of the underlying private investment funds in which the Fund invests as represented in the Schedule of Investments. |
| 6 | Annualized. |
| Meridian Funds | 58 | www.meridianfund.com |
Financial Highlights
| For the Six Months Ended December 31, | For the Fiscal Year Ended June 30, | |||||
| Legacy Class | 2021 (Unaudited) | 2021 | 2020 | 2019 | 2018 | 2017 |
| Per Share Operating Performance | ||||||
Net asset value, beginning of period | $ 50.21 | $ 31.63 | $ 35.91 | $ 45.23 | $ 39.79 | $ 32.42 |
| Income (loss) from investment operations: | ||||||
Net investment income (loss)1 | 0.02 | (0.04) | 0.16 | 0.20 | 0.46 | (0.02) |
Net realized and unrealized gain (loss) | 2.12 | 20.68 | (1.64) | (1.63) | 9.39 | 7.58 |
Net increase (decrease) from investment operations | 2.14 | 20.64 | (1.48) | (1.43) | 9.85 | 7.56 |
| Less distributions to shareholders: | ||||||
Distributions from net investment income | 0.00 | (0.94) | (0.31) | (0.49) | 0.00 | (0.01) |
Distributions from net realized capital gains | (6.49) | (1.12) | (2.49) | (7.40) | (4.41) | (0.18) |
Total distributions to shareholders | (6.49) | (2.06) | (2.80) | (7.89) | (4.41) | (0.19) |
Redemption fees | 0.00 | 0.00 2 | 0.00 2 | 0.00 2 | 0.00 2 | 0.00 2 |
Net asset value, end of period | $ 45.86 | $ 50.21 | $ 31.63 | $ 35.91 | $ 45.23 | $ 39.79 |
Total return | 4.72% 3 | 66.77% | (4.90)% | (0.05)% | 25.73% | 23.36% |
| Ratios to Average Net Assets | ||||||
Ratio of net investment income (loss) to average net assets | 0.07% 4 | (0.11)% | 0.47% | 0.51% | 1.07% | (0.05)% |
Ratio of expenses to average net assets | 1.11% 4 | 1.11% | 1.13% | 1.12% | 1.12% | 1.13% |
| Supplemental Data | ||||||
Net Assets, End of Period (000's) | $732,046 | $730,712 | $483,573 | $592,899 | $672,035 | $588,906 |
Portfolio Turnover Rate | 29% 3 | 72% | 76% | 57% | 49% | 54% |
| 1 | Per share net investment income (loss) has been calculated using the average daily shares method. |
| 2 | Less than $0.005 per share. |
| 3 | Not Annualized. |
| 4 | Annualized. |
| Meridian Funds | 59 | www.meridianfund.com |
Financial Highlights
| For the Six Months Ended December 31, | For the Fiscal Year Ended June 30, | |||||
| Class A | 2021 (Unaudited) | 2021 | 2020 | 2019 | 2018 | 2017 |
| Per Share Operating Performance | ||||||
Net asset value, beginning of period | $ 48.85 | $ 30.83 | $ 34.94 | $ 44.26 | $ 39.19 | $ 32.08 |
| Income (loss) from investment operations: | ||||||
Net investment income (loss)1 | (0.08) | (0.21) | 0.01 | 0.05 | 0.04 | (0.19) |
Net realized and unrealized gain (loss) | 2.07 | 20.17 | (1.57) | (1.60) | 9.44 | 7.48 |
Net increase (decrease) from investment operations | 1.99 | 19.96 | (1.56) | (1.55) | 9.48 | 7.29 |
| Less distributions to shareholders: | ||||||
Distributions from net investment income | 0.00 | (0.82) | (0.06) | (0.37) | 0.00 | 0.00 |
Distributions from net realized capital gains | (6.49) | (1.12) | (2.49) | (7.40) | (4.41) | (0.18) |
Total distributions to shareholders | (6.49) | (1.94) | (2.55) | (7.77) | (4.41) | (0.18) |
Redemption fees | 0.01 | 0.00 2 | 0.00 2 | 0.00 2 | 0.00 2 | 0.00 |
Net asset value, end of period | $ 44.36 | $ 48.85 | $ 30.83 | $ 34.94 | $ 44.26 | $ 39.19 |
Total return | 4.57% 3 | 66.22% | (5.22)% | (0.42)% | 25.17% | 22.76% |
| Ratios to Average Net Assets | ||||||
Ratio of net investment income (loss) to average net assets | (0.31)% 4 | (0.51)% | 0.04% | 0.12% | 0.09% | (0.53)% |
| Ratio of expenses to average net assets: | ||||||
Total expenses | 1.46% 4 | 1.43% | 1.48% | 1.48% | 1.60% | 1.60% |
Excluding recoupment of past waived fees | 1.46% 4 | 1.43% | 1.48% | 1.48% | 1.41% | 1.42% |
| Supplemental Data | ||||||
Net Assets, End of Period (000's) | $ 2,604 | $ 3,403 | $ 1,648 | $ 4,572 | $ 7,097 | $ 583 |
Portfolio Turnover Rate | 29% 3 | 72% | 76% | 57% | 49% | 54% |
| 1 | Per share net investment income (loss) has been calculated using the average daily shares method. |
| 2 | Less than $0.005 per share. |
| 3 | Not Annualized. |
| 4 | Annualized. |
| Meridian Funds | 60 | www.meridianfund.com |
Financial Highlights
| For the Six Months Ended December 31, | For the Fiscal Year Ended June 30, | |||||
| Class C | 2021 (Unaudited) | 2021 | 2020 | 2019 | 2018 | 2017 |
| Per Share Operating Performance | ||||||
Net asset value, beginning of period | $ 47.38 | $ 30.13 | $ 34.37 | $ 43.77 | $ 39.00 | $ 32.09 |
| Income (loss) from investment operations: | ||||||
Net investment loss1 | (0.21) | (0.53) | (0.17) | (0.18) | (0.05) | (0.39) |
Net realized and unrealized gain(loss) | 1.97 | 19.69 | (1.58) | (1.60) | 9.23 | 7.48 |
Net increase (decrease) from investment operations | 1.76 | 19.16 | (1.75) | (1.78) | 9.18 | 7.09 |
| Less distributions to shareholders: | ||||||
Distributions from net investment income | 0.00 | (0.79) | 0.00 | (0.22) | 0.00 | 0.00 |
Distributions from net realized capital gains | (6.49) | (1.12) | (2.49) | (7.40) | (4.41) | (0.18) |
Total distributions to shareholders | (6.49) | (1.91) | (2.49) | (7.62) | (4.41) | (0.18) |
Redemption fees | 0.00 | 0.00 | 0.00 | 0.00 | 0.00 | 0.00 |
Net asset value, end of period | $ 42.65 | $ 47.38 | $ 30.13 | $ 34.37 | $ 43.77 | $ 39.00 |
Total return | 4.20% 2 | 65.03% | (5.86)% 3 | (1.06)% 3 | 24.46% | 22.12% |
| Ratios to Average Net Assets | ||||||
Ratio of net investment loss to average net assets | (0.90)% 4 | (1.27)% | (0.55)% | (0.50)% | (0.13)% | (1.05)% |
Ratio of expenses to average net assets | 2.15% 4 | 2.16% | 2.17% | 2.14% | 2.14% | 2.13% |
| Supplemental Data | ||||||
Net Assets, End of Period (000's) | $ 408 | $ 193 | $ 49 | $ 49 | $ 25 | $ 43 |
Portfolio Turnover Rate | 29% 2 | 72% | 76% | 57% | 49% | 54% |
| 1 | Per share net investment income (loss) has been calculated using the average daily shares method. |
| 2 | Not Annualized. |
| 3 | The total return is based on beginning and ending Financial Statement Net Asset Value as shown above, which may differ from the traded Net Asset Value, due to rounding. |
| 4 | Annualized. |
| Meridian Funds | 61 | www.meridianfund.com |
Financial Highlights
| For the Six Months Ended December 31, | For the Fiscal Year Ended June 30, | |||||
| Investor Class | 2021 (Unaudited) | 2021 | 2020 | 2019 | 2018 | 2017 |
| Per Share Operating Performance | ||||||
Net asset value, beginning of period | $ 49.77 | $ 31.37 | $ 35.63 | $ 44.90 | $ 39.61 | $ 32.34 |
| Income (loss) from investment operations: | ||||||
Net investment income (loss)1 | 0.01 | (0.11) | 0.12 | 0.18 | 0.35 | (0.10) |
Net realized and unrealized gain(loss) | 2.10 | 20.54 | (1.61) | (1.63) | 9.35 | 7.55 |
Net increase (decrease) from investment operations | 2.11 | 20.43 | (1.49) | (1.45) | 9.70 | 7.45 |
| Less distributions to shareholders: | ||||||
Distributions from net investment income | 0.00 | (0.91) | (0.28) | (0.42) | 0.00 | 0.00 |
Distributions from net realized capital gains | (6.49) | (1.12) | (2.49) | (7.40) | (4.41) | (0.18) |
Total distributions to shareholders | (6.49) | (2.03) | (2.77) | (7.82) | (4.41) | (0.18) |
Redemption fees | 0.00 2 | 0.00 2 | 0.00 2 | 0.00 | 0.00 | 0.00 |
Net asset value, end of period | $ 45.39 | $ 49.77 | $ 31.37 | $ 35.63 | $ 44.90 | $ 39.61 |
Total return | 4.70% 3 | 66.65% | (4.96)% | (0.11)% | 25.44% | 23.07% |
| Ratios to Average Net Assets | ||||||
Ratio of net investment income (loss) to average net assets | 0.06% 4 | (0.28)% | 0.37% | 0.45% | 0.81% | (0.27)% |
| Ratio of expenses to average net assets: | ||||||
Total expenses | 1.17% 4 | 1.19% | 1.19% | 1.18% | 1.35% | 1.35% |
Excluding recoupment of past waived fees | 1.17% 4 | 1.19% | 1.19% | 1.18% | 1.18% | 1.23% |
| Supplemental Data | ||||||
Net Assets, End of Period (000's) | $ 9,849 | $ 5,690 | $ 1,936 | $ 3,484 | $ 3,916 | $ 2,743 |
Portfolio Turnover Rate | 29% 3 | 72% | 76% | 57% | 49% | 54% |
| 1 | Per share net investment income (loss) has been calculated using the average daily shares method. |
| 2 | Less than $0.005 per share. |
| 3 | Not Annualized. |
| 4 | Annualized. |
| Meridian Funds | 62 | www.meridianfund.com |
Financial Highlights
| For the Six Months Ended December 31, | For the Fiscal Year Ended June 30, | |||||
| Legacy Class | 2021 (Unaudited) | 2021 | 2020 | 2019 | 2018 | 2017 |
| Per Share Operating Performance | ||||||
Net asset value, beginning of period | $ 17.80 | $ 15.17 | $ 18.42 | $ 18.64 | $ 13.59 | $ 11.60 |
| Income from investment operations: | ||||||
Net investment income (loss)1 | (0.03) | (0.05) | (0.02) | (0.13) | 0.06 | 0.17 |
Net realized and unrealized gain | 0.78 | 4.82 | 2.65 | 1.55 | 5.18 | 1.92 |
Net increase from investment operations | 0.75 | 4.77 | 2.63 | 1.42 | 5.24 | 2.09 |
| Less distributions to shareholders: | ||||||
Distributions from net investment income | 0.00 | 0.00 | 0.00 | (0.09) | (0.19) | (0.10) |
Distributions from net realized capital gains | (3.76) | (2.14) | (5.88) | (1.55) | 0.00 | 0.00 |
Total distributions to shareholders | (3.76) | (2.14) | (5.88) | (1.64) | (0.19) | (0.10) |
Redemption fees | 0.00 | 0.00 | 0.00 2 | 0.00 | 0.00 2 | 0.00 2 |
Net asset value, end of period | $ 14.79 | $ 17.80 | $ 15.17 | $ 18.42 | $ 18.64 | $ 13.59 |
Total return | 4.33% 3 | 33.17% | 15.86% 4 | 11.20% 4 | 38.78% | 18.06% |
| Ratios to Average Net Assets | ||||||
Ratio of net investment income (loss) to average net assets | (0.33)% 5 | (0.31)% | (0.12)% | (0.79)% | 0.36% | 1.35% |
| Ratio of expenses to average net assets: | ||||||
Total expenses | 1.19% 5 | 1.25% | 1.28% | 1.58% | 1.44% | 1.38% |
Before fees waived and excluding recoupment of past waived fees | 1.19% 5 | 1.24% | 1.28% | 1.58% | 1.40% | 1.33% |
After fees waived and excluding recoupment of past waived fees6 | 1.19% 5 | 1.24% | 1.26% | 1.58% | 1.40% | 1.33% |
After fees waived and Excluding recoupment of past waived fees and interest and dividend expenses | 1.19% 5 | 1.24% | 1.25% | 1.19% | 1.17% | 1.20% |
| Supplemental Data | ||||||
Net Assets, End of Period (000's) | $ 57,659 | $ 60,565 | $ 48,332 | $ 60,306 | $ 56,631 | $ 46,120 |
Portfolio Turnover Rate | 43% 3 | 96% | 140% | 47% | 49% | 44% |
| 1 | Per share net investment income (loss) has been calculated using the average daily shares method. |
| 2 | Less than $0.005 per share. |
| 3 | Not Annualized. |
| 4 | The total return is based on beginning and ending Financial Statement Net Asset Value as shown above, which may differ from the traded Net Asset Value, due to rounding. |
| 5 | Annualized. |
| 6 | See Note 6 to Financial Statements. |
| Meridian Funds | 63 | www.meridianfund.com |
Financial Highlights
| For the Six Months Ended December 31, | For the Fiscal Year Ended June 30, | |||||
| Class A | 2021 (Unaudited) | 2021 | 2020 | 2019 | 2018 | 2017 |
| Per Share Operating Performance | ||||||
Net asset value, beginning of period | $ 17.48 | $ 14.97 | $ 18.31 | $ 18.48 | $ 13.52 | $ 11.54 |
| Income from investment operations: | ||||||
Net investment income (loss)1 | (0.06) | (0.11) | (0.08) | (0.21) | (0.02) | 0.16 |
Net realized and unrealized gain | 0.77 | 4.76 | 2.61 | 1.59 | 5.16 | 1.88 |
Net increase from investment operations | 0.71 | 4.65 | 2.53 | 1.38 | 5.14 | 2.04 |
| Less distributions to shareholders: | ||||||
Distributions from net investment income | 0.00 | 0.00 | 0.00 | 0.00 | (0.18) | (0.06) |
Distributions from net realized capital gains | (3.76) | (2.14) | (5.88) | (1.55) | 0.00 | 0.00 |
Total distributions to shareholders | (3.76) | (2.14) | (5.88) | (1.55) | (0.18) | (0.06) |
Redemption fees | 0.00 2 | 0.00 2 | 0.01 | 0.00 2 | 0.00 2 | 0.00 |
Net asset value, end of period | $ 14.43 | $ 17.48 | $ 14.97 | $ 18.31 | $ 18.48 | $ 13.52 |
Total return | 4.18% 3 | 32.78% | 15.39% 4 | 10.87% 4 | 38.24% | 17.69% |
| Ratios to Average Net Assets | ||||||
Ratio of net investment income (loss) to average net assets | (0.67)% 5 | (0.66)% | (0.50)% | (1.27)% | (0.11)% | 1.25% |
| Ratio of expenses to average net assets: | ||||||
Total expenses | 1.53% 5 | 1.60% | 1.64% | 2.00% | 1.84% | 1.73% |
Before fees waived and Excluding recoupment of past waived fees | 1.52% 5 | 1.57% | 1.64% | 2.00% | 1.78% | 1.69% |
After fees waived and excluding recoupment of past waived fees6 | 1.52% 5 | 1.57% | 1.61% | 2.00% | 1.78% | 1.69% |
After fees waived and excluding recoupment of past waived fees and interest and dividend expenses | 1.52% 5 | 1.57% | 1.60% | 1.55% | 1.55% | 1.56% |
| Supplemental Data | ||||||
Net Assets, End of Period (000's) | $ 2,156 | $ 2,117 | $ 1,770 | $ 3,200 | $ 5,730 | $ 3,321 |
Portfolio Turnover Rate | 43% 3 | 96% | 140% | 47% | 49% | 44% |
| 1 | Per share net investment income (loss) has been calculated using the average daily shares method. |
| 2 | Less than $0.005 per share. |
| 3 | Not Annualized. |
| 4 | The total return is based on beginning and ending Financial Statement Net Asset Value as shown above, which may differ from the traded Net Asset Value, due to rounding. |
| 5 | Annualized. |
| 6 | See Note 6 to Financial Statements. |
| Meridian Funds | 64 | www.meridianfund.com |
Financial Highlights
| For the Six Months Ended December 31, | For the Fiscal Year Ended June 30, | |||||
| Class C | 2021 (Unaudited) | 2021 | 2020 | 2019 | 2018 | 2017 |
| Per Share Operating Performance | ||||||
Net asset value, beginning of period | $ 17.13 | $ 14.76 | $ 18.17 | $ 18.44 | $ 13.47 | $ 11.50 |
| Income from investment operations: | ||||||
Net investment income (loss)1 | (0.10) | (0.17) | (0.11) | (0.27) | (0.09) | 0.07 |
Net realized and unrealized gain | 0.74 | 4.68 | 2.58 | 1.55 | 5.14 | 1.91 |
Net increase from investment operations | 0.64 | 4.51 | 2.47 | 1.28 | 5.05 | 1.98 |
| Less distributions to shareholders: | ||||||
Distributions from net investment income | 0.00 | 0.00 | 0.00 | 0.00 | (0.08) | (0.01) |
Distributions from net realized capital gains | (3.76) | (2.14) | (5.88) | (1.55) | 0.00 | 0.00 |
Total distributions to shareholders | (3.76) | (2.14) | (5.88) | (1.55) | (0.08) | (0.01) |
Redemption fees | 0.00 | 0.00 | 0.00 | 0.00 | 0.00 2 | 0.00 |
Net asset value, end of period | $ 14.01 | $ 17.13 | $ 14.76 | $ 18.17 | $ 18.44 | $ 13.47 |
Total return | 3.86% 3 | 32.27% | 15.08% | 10.31% | 37.61% | 17.26% |
| Ratios to Average Net Assets | ||||||
Ratio of net investment income (loss) to average net assets | (1.20)% 4 | (1.05)% | (0.77)% | (1.60)% | (0.55)% | 0.59% |
| Ratio of expenses to average net assets: | ||||||
Total expenses | 2.16% 4 | 2.20% | 2.25% | 2.35% | 2.24% | 2.33% |
Before fees waived and Excluding recoupment of past waived fees | 2.16% 4 | 2.20% | 2.25% | 2.32% | 2.25% | 2.33% |
After fees waived and excluding recoupment of past waived fees5 | 2.00% 4 | 2.00% | 2.02% | 2.32% | 2.24% | 2.13% |
After fees waived and excluding recoupment of past waived fees and interest and dividend expenses | 2.00% 4 | 2.00% | 2.00% | 1.97% | 2.00% | 2.00% |
| Supplemental Data | ||||||
Net Assets, End of Period (000's) | $ 40 | $ 10 | $ 30 | $ 2 | $ 2 | $ 1 |
Portfolio Turnover Rate | 43% 3 | 96% | 140% | 47% | 49% | 44% |
| 1 | Per share net investment income (loss) has been calculated using the average daily shares method. |
| 2 | Less than $0.005 per share. |
| 3 | Not Annualized. |
| 4 | Annualized. |
| 5 | See Note 6 to Financial Statements. |
| Meridian Funds | 65 | www.meridianfund.com |
Financial Highlights
| For the Six Months Ended December 31, | For the Fiscal Year Ended June 30, | |||||
| Investor Class | 2021 (Unaudited) | 2021 | 2020 | 2019 | 2018 | 2017 |
| Per Share Operating Performance | ||||||
Net asset value, beginning of period | $ 17.76 | $ 15.12 | $ 18.40 | $ 18.61 | $ 13.60 | $ 11.60 |
| Income from investment operations: | ||||||
Net investment income (loss)1 | (0.03) | (0.04) | (0.03) | (0.18) | 0.09 | 0.16 |
Net realized and unrealized gain | 0.78 | 4.81 | 2.62 | 1.60 | 5.10 | 1.92 |
Net increase from investment operations | 0.75 | 4.77 | 2.59 | 1.42 | 5.19 | 2.08 |
| Less distributions to shareholders: | ||||||
Distributions from net investment income | 0.00 | 0.00 | 0.00 | (0.08) | (0.18) | (0.08) |
Distributions from net realized capital gains | (3.76) | (2.14) | (5.88) | (1.55) | 0.00 | 0.00 |
Total distributions to shareholders | (3.76) | (2.14) | (5.88) | (1.63) | (0.18) | (0.08) |
Redemption fees | 0.00 | 0.01 | 0.01 | 0.00 2 | 0.00 2 | 0.00 |
Net asset value, end of period | $ 14.75 | $ 17.76 | $ 15.12 | $ 18.40 | $ 18.61 | $ 13.60 |
Total return | 4.35% 3 | 33.37% | 15.65% | 11.22% 4 | 38.34% | 17.98% |
| Ratios to Average Net Assets | ||||||
Ratio of net investment income (loss) to average net assets | (0.32)% 5 | (0.26)% | (0.17)% | (1.05)% | 0.58% | 1.24% |
| Ratio of expenses to average net assets: | ||||||
Total expenses | 1.18% 5 | 1.20% | 1.35% | 1.70% | 1.59% | 1.48% |
Excluding recoupment of past waived fees | 1.18% 5 | 1.20% | 1.35% | 1.70% | 1.47% | 1.39% |
Excluding recoupment of past waived fees and interest and dividend expenses | 1.18% 5 | 1.20% | 1.34% | 1.22% | 1.24% | 1.26% |
| Supplemental Data | ||||||
Net Assets, End of Period (000's) | $ 1,952 | $ 1,957 | $ 1,681 | $ 1,014 | $ 1,060 | $ 246 |
Portfolio Turnover Rate | 43% 3 | 96% | 140% | 47% | 49% | 44% |
| 1 | Per share net investment income (loss) has been calculated using the average daily shares method. |
| 2 | Less than $0.005 per share. |
| 3 | Not Annualized. |
| 4 | The total return is based on beginning and ending Financial Statement Net Asset Value as shown above, which may differ from the traded Net Asset Value, due to rounding. |
| 5 | Annualized. |
| Meridian Funds | 66 | www.meridianfund.com |
Financial Highlights
| For the Six Months Ended December 31, | For the Fiscal Year Ended June 30, | |||||
| Legacy Class | 2021 (Unaudited) | 2021 | 2020 | 2019 | 2018 | 2017 |
| Per Share Operating Performance | ||||||
Net asset value, beginning of period | $ 23.30 | $ 14.71 | $ 15.74 | $ 18.03 | $ 15.07 | $ 11.87 |
| Income (loss) from investment operations: | ||||||
Net investment loss1 | (0.10) | (0.15) | (0.06) | (0.07) | (0.09) | (0.09) |
Net realized and unrealized gain (loss) | (1.52) | 9.13 | (0.04) | (0.44) | 3.72 | 3.29 |
Net increase (decrease) from investment operations | (1.62) | 8.98 | (0.10) | (0.51) | 3.63 | 3.20 |
| Less distributions to shareholders: | ||||||
Distributions from net realized capital gains | (5.36) | (0.39) | (0.93) | (1.78) | (0.67) | 0.00 |
Total distributions to shareholders | (5.36) | (0.39) | (0.93) | (1.78) | (0.67) | 0.00 |
Redemption fees | 0.00 | 0.00 | 0.00 2 | 0.00 2 | 0.00 2 | 0.00 2 |
Net asset value, end of period | $ 16.32 | $ 23.30 | $ 14.71 | $ 15.74 | $ 18.03 | $ 15.07 |
Total return | (6.64)% 3 | 61.51% | (1.17)% | (1.49)% | 24.66% | 26.96% |
| Ratios to Average Net Assets | ||||||
Ratio of net investment loss to average net assets | (0.86)% 4,5 | (0.75)% 4 | (0.42)% | (0.41)% | (0.55)% | (0.63)% |
| Ratio of expenses to average net assets: | ||||||
Total expenses | 1.13% 4,5 | 1.12% 4 | 1.13% | 1.12% | 1.15% | 1.20% |
Excluding recoupment of past waived fees | 1.13% 4,5 | 1.12% 4 | 1.13% | 1.12% | 1.13% | 1.14% |
| Supplemental Data | ||||||
Net Assets, End of Period (000's) | $ 32,396 | $ 41,481 | $ 27,080 | $ 41,637 | $ 54,856 | $ 66,777 |
Portfolio Turnover Rate | 23% 3 | 32% | 40% | 43% | 44% | 39% |
| 1 | Per share net investment loss has been calculated using the average daily shares method. |
| 2 | Less than $0.005 per share. |
| 3 | Not Annualized. |
| 4 | These ratios exclude the impact of expenses of the underlying private investment funds in which the Fund invests as represented in the Schedule of Investments. |
| 5 | Annualized. |
| Meridian Funds | 67 | www.meridianfund.com |
Financial Highlights
| For the Six Months Ended December 31, | For the Fiscal Year Ended June 30, | |||||
| Institutional Class | 2021 (Unaudited) | 2021 | 2020 | 2019 | 2018 | 2017 |
| Per Share Operating Performance | ||||||
Net asset value, beginning of period | $ 23.44 | $ 14.79 | $ 15.81 | $ 18.09 | $ 15.11 | $ 11.88 |
| Income (loss) from investment operations: | ||||||
Net investment loss1 | (0.09) | (0.14) | (0.06) | (0.07) | (0.08) | (0.07) |
Net realized and unrealized gain (loss) | (1.54) | 9.18 | (0.04) | (0.43) | 3.73 | 3.30 |
Net increase (decrease) from investment operations | (1.63) | 9.04 | (0.10) | (0.50) | 3.65 | 3.23 |
| Less distributions to shareholders: | ||||||
Distributions from net realized capital gains | (5.36) | (0.39) | (0.93) | (1.78) | (0.67) | 0.00 |
Total distributions to shareholders | (5.36) | (0.39) | (0.93) | (1.78) | (0.67) | 0.00 |
Redemption fees | 0.00 2 | 0.00 2 | 0.01 | 0.00 2 | 0.00 2 | 0.00 2 |
Net asset value, end of period | $ 16.45 | $ 23.44 | $ 14.79 | $ 15.81 | $ 18.09 | $ 15.11 |
Total return | (6.65)% 3 | 61.59% | (1.09)% | (1.42)% | 24.73% | 27.19% |
| Ratios to Average Net Assets | ||||||
Ratio of net investment loss to average net assets | (0.82)% 4,5 | (0.72)% 4 | (0.40)% | (0.41)% | (0.50)% | (0.52)% |
| Ratio of expenses to average net assets: | ||||||
Total expenses | 1.09% 4,5 | 1.10% 4 | 1.10% | 1.10% | 1.10% | 1.14% |
Before fees waived and excluding recoupment of past waived fees | 1.09% 4,5 | 1.09% 4 | 1.10% | 1.10% | 1.11% | 1.14% |
After fees waived and excluding recoupment of past waived fees 6 | 1.09% 4,5 | 1.09% 4 | 1.10% | 1.09% | 1.10% | 1.10% |
| Supplemental Data | ||||||
Net Assets, End of Period (000's) | $453,912 | $611,787 | $587,095 | $728,123 | $728,538 | $253,447 |
Portfolio Turnover Rate | 23% 3 | 32% | 40% | 43% | 44% | 39% |
| 1 | Per share net investment loss has been calculated using the average daily shares method. |
| 2 | Less than $0.005 per share. |
| 3 | Not Annualized. |
| 4 | These ratios exclude the impact of expenses of the underlying private investment funds in which the Fund invests as represented in the Schedule of Investments. |
| 5 | Annualized. |
| 6 | See Note 6 to Financial Statements. |
| Meridian Funds | 68 | www.meridianfund.com |
Financial Highlights
| For the Six Months Ended December 31, | For the Fiscal Year Ended June 30, | |||||
| Class A | 2021 (Unaudited) | 2021 | 2020 | 2019 | 2018 | 2017 |
| Per Share Operating Performance | ||||||
Net asset value, beginning of period | $ 22.62 | $ 14.33 | $ 15.42 | $ 17.76 | $ 14.89 | $ 11.76 |
| Income (loss) from investment operations: | ||||||
Net investment loss1 | (0.13) | (0.20) | (0.11) | (0.12) | (0.13) | (0.12) |
Net realized and unrealized gain (loss) | (1.49) | 8.88 | (0.05) | (0.44) | 3.67 | 3.25 |
Net increase (decrease) from investment operations | (1.62) | 8.68 | (0.16) | (0.56) | 3.54 | 3.13 |
| Less distributions to shareholders: | ||||||
Distributions from net realized capital gains | (5.36) | (0.39) | (0.93) | (1.78) | (0.67) | 0.00 |
Total distributions to shareholders | (5.36) | (0.39) | (0.93) | (1.78) | (0.67) | 0.00 |
Redemption fees | 0.00 2 | 0.00 | 0.00 2 | 0.00 2 | 0.00 2 | 0.00 2 |
Net asset value, end of period | $ 15.64 | $ 22.62 | $ 14.33 | $ 15.42 | $ 17.76 | $ 14.89 |
Total return | (6.84)% 3 | 61.05% | (1.59)% | (1.81)% 4 | 24.34% | 26.62% |
| Ratios to Average Net Assets | ||||||
Ratio of net investment loss to average net assets | (1.20)% 5,6 | (1.10)% 5 | (0.80)% | (0.74)% | (0.82)% | (0.92)% |
| Ratio of expenses to average net assets: | ||||||
Total expenses | 1.48% 5,6 | 1.48% 5 | 1.49% | 1.44% | 1.41% | 1.49% |
Excluding recoupment of past waived fees | 1.48% 5,6 | 1.48% 5 | 1.49% | 1.44% | 1.41% | 1.45% |
| Supplemental Data | ||||||
Net Assets, End of Period (000's) | $ 31,368 | $ 35,335 | $ 33,878 | $ 45,376 | $ 89,306 | $ 82,031 |
Portfolio Turnover Rate | 23% 3 | 32% | 40% | 43% | 44% | 39% |
| 1 | Per share net investment loss has been calculated using the average daily shares method. |
| 2 | Less than $0.005 per share. |
| 3 | Not Annualized. |
| 4 | The total return is based on beginning and ending Financial Statement Net Asset Value as shown above, which may differ from the traded Net Asset Value, due to rounding. |
| 5 | These ratios exclude the impact of expenses of the underlying private investment funds in which the Fund invests as represented in the Schedule of Investments. |
| 6 | Annualized. |
| Meridian Funds | 69 | www.meridianfund.com |
Financial Highlights
| For the Six Months Ended December 31, | For the Fiscal Year Ended June 30, | |||||
| Class C | 2021 (Unaudited) | 2021 | 2020 | 2019 | 2018 | 2017 |
| Per Share Operating Performance | ||||||
Net asset value, beginning of period | $ 21.68 | $ 13.84 | $ 15.02 | $ 17.46 | $ 14.76 | $ 11.74 |
| Income (loss) from investment operations: | ||||||
Net investment loss1 | (0.20) | (0.32) | (0.21) | (0.24) | (0.25) | (0.22) |
Net realized and unrealized gain(loss) | (1.42) | 8.55 | (0.04) | (0.42) | 3.62 | 3.24 |
Net increase (decrease) from investment operations | (1.62) | 8.23 | (0.25) | (0.66) | 3.37 | 3.02 |
| Less distributions to shareholders: | ||||||
Distributions from net realized capital gains | (5.36) | (0.39) | (0.93) | (1.78) | (0.67) | 0.00 |
Total distributions to shareholders | (5.36) | (0.39) | (0.93) | (1.78) | (0.67) | 0.00 |
Redemption fees | 0.00 | 0.00 | 0.00 2 | 0.00 2 | 0.00 | 0.00 2 |
Net asset value, end of period | $ 14.70 | $ 21.68 | $ 13.84 | $ 15.02 | $ 17.46 | $ 14.76 |
Total return | (7.14)% 3 | 59.94% | (2.25)% | (2.45)% | 23.39% | 25.72% |
| Ratios to Average Net Assets | ||||||
Ratio of net investment loss to average net assets | (1.89)% 4,5 | (1.78)% 4 | (1.47)% | (1.45)% | (1.56)% | (1.60)% |
| Ratio of expenses to average net assets: | ||||||
Total expenses | 2.16% 4,5 | 2.16% 4 | 2.18% | 2.16% | 2.15% | 2.17% |
Excluding recoupment of past waived fees | 2.16% 4,5 | 2.16% 4 | 2.18% | 2.16% | 2.15% | 2.16% |
| Supplemental Data | ||||||
Net Assets, End of Period (000's) | $ 6,961 | $ 8,324 | $ 6,922 | $ 13,255 | $ 31,174 | $ 44,593 |
Portfolio Turnover Rate | 23% 3 | 32% | 40% | 43% | 44% | 39% |
| 1 | Per share net investment loss has been calculated using the average daily shares method. |
| 2 | Less than $0.005 per share. |
| 3 | Not Annualized. |
| 4 | These ratios exclude the impact of expenses of the underlying private investment funds in which the Fund invests as represented in the Schedule of Investments. |
| 5 | Annualized. |
| Meridian Funds | 70 | www.meridianfund.com |
Financial Highlights
| For the Six Months Ended December 31, | For the Fiscal Year Ended June 30, | |||||
| Investor Class | 2021 (Unaudited) | 2021 | 2020 | 2019 | 2018 | 2017 |
| Per Share Operating Performance | ||||||
Net asset value, beginning of period | $ 23.17 | $ 14.63 | $ 15.70 | $ 17.99 | $ 15.05 | $ 11.85 |
| Income (loss) from investment operations: | ||||||
Net investment loss1 | (0.11) | (0.15) | (0.09) | (0.09) | (0.09) | (0.09) |
Net realized and unrealized gain(loss) | (1.51) | 9.08 | (0.05) | (0.42) | 3.70 | 3.29 |
Net increase (decrease) from investment operations | (1.62) | 8.93 | (0.14) | (0.51) | 3.61 | 3.20 |
| Less distributions to shareholders: | ||||||
Distributions from net realized capital gains | (5.36) | (0.39) | (0.93) | (1.78) | (0.67) | 0.00 |
Total distributions to shareholders | (5.36) | (0.39) | (0.93) | (1.78) | (0.67) | 0.00 |
Redemption fees | 0.00 2 | 0.00 | 0.00 2 | 0.00 2 | 0.00 2 | 0.00 2 |
Net asset value, end of period | $ 16.19 | $ 23.17 | $ 14.63 | $ 15.70 | $ 17.99 | $ 15.05 |
Total return | (6.68)% 3 | 61.51% | (1.43)% 4 | (1.50)% 4 | 24.56% | 27.00% |
| Ratios to Average Net Assets | ||||||
Ratio of net investment loss to average net assets | (0.92)% 5,6 | (0.80)% 5 | (0.59)% | (0.53)% | (0.57)% | (0.69)% |
Ratio of expenses to average net assets | 1.20% 5,6 | 1.17% 5 | 1.29% | 1.22% | 1.16% | 1.26% |
| Supplemental Data | ||||||
Net Assets, End of Period (000's) | $635,698 | $920,317 | $666,635 | $844,975 | $853,794 | $450,402 |
Portfolio Turnover Rate | 23% 3 | 32% | 40% | 43% | 44% | 39% |
| 1 | Per share net investment loss has been calculated using the average daily shares method. |
| 2 | Less than $0.005 per share. |
| 3 | Not Annualized. |
| 4 | The total return is based on beginning and ending Financial Statement Net Asset Value as shown above, which may differ from the traded Net Asset Value, due to rounding. |
| 5 | These ratios exclude the impact of expenses of the underlying private investment funds in which the Fund invests as represented in the Schedule of Investments. |
| 6 | Annualized. |
| Meridian Funds | 71 | www.meridianfund.com |
Notes to Financial Statements
| 1. | Organization and Significant Accounting Policies: Meridian Fund, Inc. (the “Meridian Funds” or the “Company”) comprises the following separate series: the Meridian Growth Fund (the “Growth Fund”), the Meridian Contrarian Fund (the “Contrarian Fund”), the Meridian Enhanced Equity Fund (the “Enhanced Equity Fund”) (formerly Meridian Equity Income Fund), and the Meridian Small Cap Growth Fund (the “Small Cap Growth Fund”) (each a “Fund” and collectively, the “Funds”). The Company is registered as an open-end investment company under the Investment Company Act of 1940 and is organized as a Maryland corporation. Each Fund is classified as a "diversified" management investment company. |
| Meridian Funds offer five share classes: Legacy Class Shares, Investor Class Shares, Class A Shares, Class C Shares and Institutional Class Shares. Prior to July 1, 2015, Class A Shares were known as Advisor Class Shares. As of December 31, 2021, Institutional Class Shares of the Enhanced Equity Fund and Contrarian Fund are not currently being offered for sale. Effective June 15, 2017, Investor Class, Class A, and Class C Shares of the Growth Fund are closed to new investors. Effective June 29, 2018, Investor Class, Class A, and Class C Shares of the Small Cap Growth Fund are closed to new investors. Legacy Class Shares are available to investors who have continuously held an investment in any Meridian Fund prior to November 15, 2013. Effective November 1, 2018, direct initial purchases of Legacy Class Shares are permitted in the Enhanced Equity Fund. Institutional Class Shares are available to certain eligible investors including endowments, foundations and qualified retirement plans. Class A, Class C and Investor Class Shares are available for purchase through financial intermediary platforms. Legacy Class, Investor Class, Class A and Institutional Class Shares are subject to a 2% redemption fee on shares redeemed or exchanged that have been held for 60 days or less. The redemption fees are collected and retained by the Fund for the benefit of the remaining shareholders. The redemption fees are recorded as a credit to paid-in capital. Class A Shares are subject to a maximum initial sales charge (front-end load) of 5.75%. Class C Shares are subject to a 1.00% contingent deferred sales charge ("CDSC") if redeemed within one year of purchase. Investor Class Shares are not subject to front-end load or CDSC and require a higher minimum initial investment. All Classes have identical rights and privileges with respect to the Fund in general, and exclusive voting rights with respect to Class specific matters. Net Asset Value ("NAV") per share may differ by class due to each class having its own expenses directly attributable to that class. Investor Class, Class A and Class C Shares are subject to sub-transfer agent fees. Class A and Class C Shares are also subject to certain expenses related to the distribution of these shares. See Note 6 for further information on additional share classes. | |
| The primary investment objectives of the Growth Fund, Contrarian Fund, and Enhanced Equity Fund are to seek long-term growth of capital. | |
| The primary investment objective of the Small Cap Growth Fund is to seek long-term growth of capital by investing primarily in equity securities of small capitalization companies. | |
| The following significant accounting policies are consistently followed by the Funds in the preparation of their financial statements in conformity with U.S. GAAP. Each Fund is considered an investment company under U.S. GAAP and follows the accounting and reporting guidance in the Financial Accounting Standards Board (FASB) Accounting Standards Codification Topic 946, Financial Services - Investment Companies. |
| a. | Cash & Cash Equivalents: Each Fund considers its investment in a FDIC insured interest bearing account to be cash and cash equivalents. Cash and cash equivalents are valued at cost plus any accrued interest. The Funds maintain cash balances, which, at times may exceed federally insured limits. The Funds maintain these balances with a high quality financial institution. The Funds may incur charges on cash overdrafts. |
| b. | Share Valuation: The NAV of each Fund is calculated by dividing the sum of the value of the securities held by each Fund, plus cash or other assets, minus all liabilities (including estimated accrued expenses), by the total number of shares outstanding of each Fund. The result is rounded to the nearest cent. Each Fund’s shares will not be priced on the days in which the New York Stock Exchange ("NYSE") is closed for trading. |
| c. | Investment Valuations: Equity securities are valued at the closing price or last sales price on the principal exchange or market on which they are traded; or, if there were no sales that day, at the last reported bid price. |
| Fixed income (debt) securities are valued on the basis of last available bid prices or current market quotations provided by dealers or pricing services. In determining the value of a particular investment, pricing services may |
| Meridian Funds | 72 | www.meridianfund.com |
Notes to Financial Statements (continued)
| use certain information with respect to transactions in such investments, quotations from dealers, pricing matrixes, market transactions in comparable investments, various relationships observed in the market between investments and calculated yield measures. | |
| Investments in open-end U.S. mutual funds are valued at NAV each business day. | |
| The market value of the Funds' investments in exchange traded funds is based on the published NAV of each fund computed as of the close of regular trading on the NYSE on days when the NYSE is open. | |
| Exchange-traded options are valued at the most recent sale price at the close of the options market in which the options trade. An exchange-traded option for which there is no close price is valued at the last bid (long positions) or ask (short positions) price. If no bid or ask price is available, the prior day’s price will be used, unless it is determined that the prior day’s price no longer reflects the fair value of the option. | |
| Securities and other assets for which reliable market quotations are not readily available or for which a significant event has occurred since the time of the most recent market quotation, will be valued based upon other available factors deemed relevant by ArrowMark Colorado Holdings, LLC (the “Adviser”) under the guidelines established by, and under the general supervision and responsibility of, the Funds’ Board of Directors (the “Board”). These factors include but are not limited to (i) attributes specific to the investment; (ii) the principal market for the investment; (iii) the customary participants in the principal market for the investment; (iv) data assumptions by market participants for the investment, if reasonably available; (v) quoted prices for similar investments in active markets; and (vi) other factors, such as future cash flows, interest rates, yield curves, volatilities, prepayment speeds, loss severities, credit risks and/or default rates. Valuations based on such factors are reported to the Board on a quarterly basis. | |
| The Fund’s investment in an unregistered pooled investment vehicle (“Private Investment Fund”) is valued, as a practical expedient, at the most recent net asset value determined by the Private Investment Fund manager according to such manager’s policies and procedures based on valuation information reasonably available to the Private Investment Fund manager at that time; provided, however, that the Valuation Committee may consider whether it is appropriate, in light of relevant circumstances, to adjust such valuation in accordance with the Fund’s valuation procedures. If the Private Investment Fund does not report a value to the Fund on a timely basis, the fair value of the Private Investment Fund shall be based on the most recent value reported by the Private Investment Fund, as well as any other relevant information available at the time the Fund values its portfolio. The frequency and timing of receiving valuations for the Private Investment Fund investment is subject to change at any time, without notice to investors, at the discretion of the Private Investment Fund manager or the Fund. | |
| d. | Fair Value Measurements: As described in Note 1.c. above, the Funds utilize various methods to determine and measure the fair value of investment securities on a recurring basis. The objective of a fair value measurement is to determine the price that would be received to sell an asset or paid to transfer a liability in an orderly transaction between market participants at the measurement date (an exit price). Accordingly, the fair value hierarchy gives the highest priority to quoted prices (unadjusted) in active markets for identical assets or liabilities (Level 1) and the lowest priority to unobservable inputs (Level 3) that are significant to the fair value instrument. The three levels of the fair value hierarchy are described below: |
| Level 1 - quoted prices in active markets for identical securities; | |
| Level 2 - other significant observable inputs (including quoted prices for similar securities, interest rates, prepayment speeds, credit risk, etc.); and | |
| Level 3 - significant unobservable inputs (including the Funds' determinations as to the fair value of investments). | |
| The inputs or methodology used for valuing securities are not necessarily an indication of the risks associated with investing in those securities. The summary of inputs used to value the Funds’ securities as of December 31, 2021 is as follows: | |
| Meridian Funds | 73 | www.meridianfund.com |
Notes to Financial Statements (continued)
| Level 1 | Level 2 | Level 3 | Practical Expedient1 | Total | |||||
| Growth Fund | |||||||||
| Assets: | |||||||||
Common Stocks2 | $ 1,948,691,763 | $ 2,252,292 | — | — | $ 1,950,944,055 | ||||
Preferred Stocks2 | — | — | $ 59,962,732 | — | 59,962,732 | ||||
Private Investment Funds | — | — | — | $ 60,772,526 | 60,772,526 | ||||
Short-Term Investments | 36,946,000 | 47,815,239 | — | — | 84,761,239 | ||||
Total Investments - Assets | $ 1,985,637,763 | $ 50,067,531 | $ 59,962,732 | $ 60,772,526 | $ 2,156,440,552 | ||||
| Liabilities: | |||||||||
Securities Sold Short2 | $ (18,664,200) | — | — | — | $ (18,664,200) | ||||
Total Investments - Liabilities | $ (18,664,200) | — | — | — | $ (18,664,200) | ||||
| Contrarian Fund | |||||||||
Common Stocks2 | $ 687,233,270 | — | — | — | $ 687,233,270 | ||||
Warrants2 | — | $ 125,640 | — | — | 125,640 | ||||
Preferred Stocks2 | — | — | $ 3,000,000 | — | 3,000,000 | ||||
Short-Term Investments | 6,281,000 | 10,284,549 | — | — | 16,565,549 | ||||
Total Investments | $ 693,514,270 | $ 10,410,189 | $ 3,000,000 | — | $ 706,924,459 | ||||
| Enhanced Equity Fund | |||||||||
| Assets: | |||||||||
Common Stocks2 | $ 78,834,903 | $ 246,025 | — | — | $ 79,080,928 | ||||
Warrants2 | 17,208 | 4,627 | — | — | 21,835 | ||||
Short-Term Investments | — | 399,561 | — | — | 399,561 | ||||
Total Investments - Assets | $ 78,852,111 | $ 650,213 | — | — | $ 79,502,324 | ||||
| Liabilities: | |||||||||
Call Options Written | $ (4,227,903) | $ (15,107,060) | — | — | $ (19,334,963) | ||||
Total Investments - Liabilities | $ (4,227,903) | $ (15,107,060) | — | — | $ (19,334,963) | ||||
| Meridian Funds | 74 | www.meridianfund.com |
Notes to Financial Statements (continued)
| Level 1 | Level 2 | Level 3 | Practical Expedient1 | Total | |||||
| Small Cap Growth Fund | |||||||||
Common Stocks2 | $ 1,077,385,368 | $ 9,146,758 | $ 1,732 | — | $ 1,086,533,858 | ||||
Warrants2 | 458,732 | — | — | — | 458,732 | ||||
Preferred Stocks2 | — | — | 54,909,478 | — | 54,909,478 | ||||
Private Investment Fund | — | — | — | $ 2,798,945 | 2,798,945 | ||||
Short-Term Investments | 30,711,000 | 37,849,391 | — | — | 68,560,391 | ||||
Total Investments | $ 1,108,555,100 | $ 46,996,149 | $ 54,911,210 | $ 2,798,945 | $ 1,213,261,404 |
| 1 | Certain investments that are measured at fair value using the NAV Per Share (or its equivalent) practical expedient have not been categorized in the fair value hierarchy. The fair value amounts presented in this table are intended to permit reconciliation of the fair value hierarchy to the amounts presented in the Schedule of Investments. |
| 2 | See above Schedule of Investments for values in each industry. |
| Growth Fund | ||||||||||
| Security Description | Investment Category | Value | Unfunded Commitments | Redemption Frequency | Redemption Notice Period | |||||
| Quail Investment Holdings, LLC | Private Investment Funds1 | $ 3,873,540 | — | Subject to advisor approval | N/A | |||||
| Rhino (E) Investment Holdings, LLC | Private Investment Funds1 | $ 56,898,986 | — | Subject to advisor approval | N/A | |||||
| Small Cap Growth Fund | ||||||||||
| Security Description | Investment Category | Value | Unfunded Commitments | Redemption Frequency | Redemption Notice Period | |||||
| Quail Investment Holdings, LLC | Private Investment Funds1 | $ 2,798,945 | — | Subject to advisor approval | N/A | |||||
| 1 | Private Investment Fund investing generally consists of private partnerships which directly invest in various strategies to generate capital appreciation and/or income yield. These strategies may span across the capital stock and may include Private Equity, Private Credit, Venture Capital, Collateralized Loan Obligations, Asset-Backed Securities, Master Limited Partners and Direct Real Estate. |
| Meridian Funds | 75 | www.meridianfund.com |
Notes to Financial Statements (continued)
| Growth Fund | Preferred Stocks | Total Level 3 | |
| Investments in Securities | |||
Beginning Balance 07/01/21 | $ 56,034,920 | $ 56,034,920 | |
Total Purchase | 7,164,990 | 7,164,990 | |
Transfers out1 | (5,699,950) | (5,699,950) | |
Change in unrealized Gain (Loss) | 2,462,772 | 2,462,772 | |
Ending Balance 12/31/21 | $ 59,962,732 | $ 59,962,732 | |
Change in unrealized Gain (Loss) on investments still held at 12/31/21 | $ 2,462,772 | $ 2,462,772 |
| 1 | During the six months ended December 31, 2021, certain investments were transferred into or out of Level 3 in the fair value hierarchy as a result of an initial public offering or as a result of being valued at the time of purchase utilizing significant unobservable inputs and valued utilizing observable inputs at the end of the period. Investments transferred out of Level 3 as a result of an initial public offering were transferred out at fair value prior to the initial public offering, and therefore unrealized gains and losses are not reflective within. |
| Contrarian Fund | Preferred Stocks | Total Level 3 | |
| Investments in Securities | |||
Beginning Balance 07/01/21 | $ — | $ — | |
Total Purchase | 3,000,000 | 3,000,000 | |
Transfers out | — | — | |
Change in unrealized Gain (Loss) | — | — | |
Ending Balance 12/31/21 | $ 3,000,000 | $ 3,000,000 | |
Change in unrealized Gain (Loss) on investments still held at 12/31/21 | $ — | $ — |
| Small Cap Growth Fund | Common Stocks | Preferred Stocks | Convertible Corporate Bonds | Total Level 3 | |||
| Investments in Securities | |||||||
Beginning Balance 07/01/21 | $ 5,195 | $ 58,948,566 | $ 1,312,500 | $ 60,266,261 | |||
Total Purchase | — | 7,616,704 | — | 7,616,704 | |||
Transfers out1 | — | (10,799,977) | (1,312,500) | (12,112,477) | |||
Change in unrealized Gain (Loss) | (3,463) | (855,815) | — | (859,278) | |||
Ending Balance 12/31/21 | $ 1,732 | $ 54,909,478 | $ — | $ 54,911,210 | |||
Change in unrealized Gain (Loss) on investments still held at 12/31/21 | $ (3,463) | $ (208,143) | $ — | $ (211,606) |
| 1 | During the six months ended December 31, 2021, certain investments were transferred into or out of Level 3 in the fair value hierarchy as a result of an initial public offering or as a result of being valued at the time of purchase utilizing significant unobservable inputs and valued utilizing observable inputs at the end of the period. Investments transferred out of Level 3 as a result of an initial public offering were transferred out at fair value prior to the initial public offering, and therefore unrealized gains and losses are not reflective within. |
| Meridian Funds | 76 | www.meridianfund.com |
Notes to Financial Statements (continued)
| Growth Fund | ||||
| Asset Class | Market Value | Valuation Technique | Unobservable Input | Value/Range (Weighted Average)1,2 |
| Preferred Stocks | $36,735,297 | Market Approach | Revenue Multiple | 3.00x to 10.75x (6.01x) |
| Preferred Stocks | $23,227,435 | Cost | N/A | N/A |
| Contrarian Fund | ||||
| Asset Class | Market Value | Valuation Technique | Unobservable Input | Value/Range (Weighted Average)1,2 |
| Preferred Stocks | $3,000,000 | Cost | N/A | N/A |
| Small Cap Growth Fund | ||||
| Asset Class | Market Value | Valuation Technique | Unobservable Input | Value/Range (Weighted Average)1,2 |
| Common Stocks | $ 1,732 | Option Pricing Method | Industry Volatility, Time to Exit | 80%, 24 months |
| Fully Diluted Method | Enterprise Value Adjustment | -87.5% | ||
| Preferred Stocks | $ 8,710,648 | Option Pricing Method | Industry Volatility, Time to Exit | 60%-80%, 24-36 months (70.41%, 35.01 months) |
| Fully Diluted Method | Enterprise Value Adjustment | -87.5% - 5% (-9.17%) | ||
| Preferred Stocks | $32,082,054 | Market Approach | Revenue Multiple | 3.00x to 31.25x (10.90x) |
| Preferred Stocks | $14,116,776 | Cost | N/A | N/A |
| 1 | A significant change in an unobservable input would have resulted in a correlated significant change to value. |
| 2 | Unobservable inputs were weighted by the fair value of the investments. |
| Unobservable Input | Impact to Value if Input Increases | Impact to Value if Input Decreases | |
| Industry Volatility | Decrease | Increase | |
| Time to Exit | Decrease | Increase | |
| Revenue Multiple | Increase | Decrease | |
| Enterprise Value Adjustment | Increase | Decrease |
| e. | Investment Transactions and Investment Income: Security transactions are accounted for on the date the securities are purchased or sold (trade date). Realized gains and losses on security transactions are determined on the basis of specific identification for both financial statement and federal income tax purposes. Dividend income is recorded on the ex-dividend date. Under the applicable foreign tax laws, a withholding tax at various rates may be imposed on capital gains, dividends and interest. Interest income, including amortization and accretion of premiums and discounts on debt securities, is accrued daily. Discounts and premiums on securities purchased are |
| Meridian Funds | 77 | www.meridianfund.com |
Notes to Financial Statements (continued)
| accreted and amortized over the lives of the respective securities using the effective interest method. Distributions from Private Investment Funds that represent returns of capital in excess of cumulative profits and losses are credited to investment cost rather than income. | |
| f. | Option writing: When the Fund writes an option, an amount equal to the premium received by the Fund is recorded as a liability and subsequently adjusted to the current fair value of the option written. Premiums received from writing options that expire unexercised are treated by the Fund on the expiration date as realized gains from investments. The difference between the premium and amount paid on effecting a closing purchase transaction, including brokerage commissions, is also treated as a realized gain or, if the premium is less than the amount paid for the closing purchase transaction, as a realized loss. If a call option is exercised, the premium is added to the proceeds from the sale of the underlying security or currency in determining whether the Fund has realized a gain or loss. If a put option is exercised, the premium reduces the cost basis of the securities purchased by the Fund. The Fund as writer of an option bears the market risk of an unfavorable change in the price of the security underlying the written option. |
| g. | Allocation of Income, Expenses, Gains and Losses: Income, gains and losses are allocated on a daily basis to each share class based on the relative proportion of the net assets of the class to each Fund’s total net assets. Expenses are allocated on the basis of relative net assets of the class to the Fund, or if an expense is specific to a share class, to that specific share class. |
| h. | Use of Estimates: The preparation of financial statements in accordance with U.S. GAAP requires management to make estimates and assumptions that affect the reported amount of assets and liabilities and disclosure of contingent assets and liabilities at the date of the financial statements and the reported amounts of increases and decreases in net assets from operations during the reporting period. Actual amounts could differ from those estimates, and such differences could be significant. |
| i. | Distributions to Shareholders: The Funds record distributions to shareholders on the ex-dividend date. The amount of distributions from net investment income and net realized capital gains are determined in accordance with federal income tax regulations which may differ from U.S. GAAP. These “book/tax” differences are either considered temporary or permanent in nature. To the extent these differences are permanent in nature, such amounts are reclassified within the capital accounts based on their federal tax-basis treatment; temporary differences do not require reclassification. |
| Distributions which exceed net investment income and net realized capital gains are reported as distributions in excess of net investment income or distributions in excess of net realized capital gains for financial reporting purposes but not for tax purposes. To the extent they exceed net investment income and net realized capital gains for tax purposes, they are reported as distributions of paid-in capital. | |
| j. | Guarantees and Indemnification: Under the Funds’ organizational documents, its Officers and Directors are indemnified against certain liability arising out of the performance of their duties to the Funds. Additionally, in the normal course of business, the Funds enter into contracts with service providers that contain general indemnification clauses, subject to applicable law. The Funds’ maximum exposure under these arrangements is unknown, as this would involve future claims that may be made against the Funds that have not yet occurred. However, based on experience, the Funds expect the risk of loss to be remote. |
| Meridian Funds | 78 | www.meridianfund.com |
Notes to Financial Statements (continued)
| 2. | Capital Shares Transactions: Transactions in capital shares were as follows: |
| Six Months Ended December 31, 2021 | Year Ended June 30, 2021 | ||||||
| Shares | Amount | Shares | Amount | ||||
| Growth Fund: | |||||||
| Legacy Class | |||||||
Shares sold | 179,464 | $ 9,709,711 | 428,659 | $ 20,634,848 | |||
Shares issued from reinvestment of distributions | 3,999,593 | 188,260,839 | 244,157 | 11,597,439 | |||
Redemption fees | — | 4,823 | — | 25,465 | |||
Shares redeemed | (1,410,534) | (75,415,971) | (4,121,565) | (185,922,502) | |||
Net increase/(decrease) | 2,768,523 | $122,559,402 | (3,448,749) | $(153,664,750) | |||
| Institutional Class | |||||||
Shares sold | 592,241 | $ 33,079,664 | 3,509,616 | $ 168,866,561 | |||
Shares issued from reinvestment of distributions | 1,724,946 | 81,193,187 | 98,320 | 4,669,236 | |||
Redemption fees | — | 417 | — | 11,522 | |||
Shares redeemed | (1,481,879) | (81,905,527) | (4,404,282) | (201,376,494) | |||
Net increase/(decrease) | 835,308 | $ 32,367,741 | (796,346) | $ (27,829,175) | |||
| Class A | |||||||
Shares sold | 5,787 | $ 305,395 | 6,137 | $ 305,778 | |||
Shares issued from reinvestment of distributions | 18,085 | 807,835 | 1,081 | 49,230 | |||
Redemption fees | — | — | — | 160 | |||
Shares redeemed | (7,824) | (407,493) | (30,742) | (1,290,397) | |||
Net increase/(decrease) | 16,048 | $ 705,737 | (23,524) | $ (935,229) | |||
| Class C | |||||||
Shares sold | 728 | $ 35,609 | 715 | $ 30,200 | |||
Shares issued from reinvestment of distributions | 8,830 | 378,203 | 569 | 25,185 | |||
Shares redeemed | (6,012) | (303,332) | (10,045) | (417,337) | |||
Net increase/(decrease) | 3,546 | $ 110,480 | (8,761) | $ (361,952) | |||
| Investor Class | |||||||
Shares sold | 65,506 | $ 3,476,050 | 1,053,556 | $ 44,340,843 | |||
Shares issued from reinvestment of distributions | 154,977 | 7,192,465 | 68,924 | 3,237,366 | |||
Redemption fees | — | — | — | 304 | |||
Shares redeemed | (101,117) | (5,506,077) | (7,896,526) | (402,522,680) | |||
Net increase/(decrease) | 119,366 | $ 5,162,438 | (6,774,046) | $(354,944,167) | |||
| Meridian Funds | 79 | www.meridianfund.com |
Notes to Financial Statements (continued)
| Six Months Ended December 31, 2021 | Year Ended June 30, 2021 | ||||||
| Shares | Amount | Shares | Amount | ||||
| Contrarian Fund: | |||||||
| Legacy Class | |||||||
Shares sold | 23,964 | $ 1,188,788 | 74,298 | $ 3,333,191 | |||
Shares issued from reinvestment of distributions | 2,008,273 | 88,986,567 | 706,046 | 28,700,767 | |||
Redemption fees | — | — | — | 10,603 | |||
Shares redeemed | (624,657) | (30,362,200) | (1,513,844) | (59,692,315) | |||
Net increase/(decrease) | 1,407,580 | $ 59,813,155 | (733,500) | $(27,647,754) | |||
| Class A | |||||||
Shares sold | 8,200 | $ 396,572 | 30,492 | $ 1,435,842 | |||
Shares issued from reinvestment of distributions | 4,644 | 199,023 | 995 | 39,410 | |||
Redemption fees | — | 499 | — | 1 | |||
Shares redeemed | (23,795) | (1,136,179) | (15,270) | (590,916) | |||
Net increase/(decrease) | (10,951) | $ (540,085) | 16,217 | $ 884,337 | |||
| Class C | |||||||
Shares sold | 4,272 | $ 196,165 | 2,273 | $ 92,016 | |||
Shares issued from reinvestment of distributions | 1,215 | 50,087 | 182 | 7,026 | |||
Shares redeemed | — | — | — | — | |||
Net increase | 5,487 | $ 246,252 | 2,455 | $ 99,042 | |||
| Investor Class | |||||||
Shares sold | 101,776 | $ 5,022,444 | 68,648 | $ 3,281,268 | |||
Shares issued from reinvestment of distributions | 26,887 | 1,178,997 | 2,574 | 103,740 | |||
Redemption fees | — | 91 | — | 160 | |||
Shares redeemed | (26,019) | (1,286,546) | (18,596) | (754,237) | |||
Net increase | 102,644 | $ 4,914,986 | 52,626 | $ 2,630,931 | |||
| Meridian Funds | 80 | www.meridianfund.com |
Notes to Financial Statements (continued)
| Six Months Ended December 31, 2021 | Year Ended June 30, 2021 | ||||||
| Shares | Amount | Shares | Amount | ||||
| Enhanced Equity Fund: | |||||||
| Legacy Class | |||||||
Shares sold | 14,105 | $ 254,500 | 62,350 | $ 1,047,325 | |||
Shares issued from reinvestment of distributions | 784,030 | 11,540,921 | 414,399 | 6,584,808 | |||
Shares redeemed | (302,001) | (4,995,727) | (262,029) | (4,327,423) | |||
Net increase | 496,134 | $ 6,799,694 | 214,720 | $ 3,304,710 | |||
| Class A | |||||||
Shares sold | 6,407 | $ 113,024 | 47,241 | $ 791,640 | |||
Shares issued from reinvestment of distributions | 32,033 | 459,994 | 15,741 | 246,032 | |||
Redemption fees | — | 3 | — | 21 | |||
Shares redeemed | (10,115) | (158,242) | (60,058) | (988,668) | |||
Net increase | 28,325 | $ 414,779 | 2,924 | $ 49,025 | |||
| Class C | |||||||
Shares sold | 1,744 | $ 30,000 | 310 | $ 5,000 | |||
Shares issued from reinvestment of distributions | 512 | 7,131 | 62 | 952 | |||
Shares redeemed | — | — | (1,779) | (28,175) | |||
Net increase/(decrease) | 2,256 | $ 37,131 | (1,407) | $ (22,223) | |||
| Investor Class | |||||||
Shares sold | 5,444 | $ 98,480 | 35,560 | $ 593,081 | |||
Shares issued from reinvestment of distributions | 28,161 | 413,127 | 16,321 | 258,366 | |||
Redemption fees | — | — | — | 867 | |||
Shares redeemed | (11,397) | (186,294) | (52,885) | (881,010) | |||
Net increase/(decrease) | 22,208 | $ 325,313 | (1,004) | $ (28,696) | |||
| Meridian Funds | 81 | www.meridianfund.com |
Notes to Financial Statements (continued)
| Six Months Ended December 31, 2021 | Year Ended June 30, 2021 | ||||||
| Shares | Amount | Shares | Amount | ||||
| Small Cap Growth Fund: | |||||||
| Legacy Class | |||||||
Shares sold | 182,627 | $ 4,097,328 | 432,151 | $ 8,977,034 | |||
Shares issued from reinvestment of distributions | 617,979 | 9,943,280 | 29,813 | 595,665 | |||
Shares redeemed | (595,614) | (10,272,171) | (523,472) | (8,977,143) | |||
Net increase/(decrease) | 204,992 | $ 3,768,437 | (61,508) | $ 595,556 | |||
| Institutional Class | |||||||
Shares sold | 1,814,267 | $ 41,169,066 | 5,281,775 | $ 103,935,707 | |||
Shares issued from reinvestment of distributions | 6,471,753 | 104,971,834 | 589,316 | 11,839,351 | |||
Redemption fees | — | 7,304 | — | 2,129 | |||
Shares redeemed | (6,796,057) | (157,679,002) | (19,474,051) | (371,565,411) | |||
Net increase/(decrease) | 1,489,963 | $ (11,530,798) | (13,602,960) | $(255,788,224) | |||
| Class A | |||||||
Shares sold | 211,446 | $ 4,406,500 | 326,559 | $ 6,549,450 | |||
Shares issued from reinvestment of distributions | 449,971 | 6,938,550 | 30,007 | 582,752 | |||
Redemption fees | — | 212 | — | — | |||
Shares redeemed | (218,341) | (4,616,649) | (1,157,908) | (20,795,244) | |||
Net increase/(decrease) | 443,076 | $ 6,728,613 | (801,342) | $ (13,663,042) | |||
| Class C | |||||||
Shares sold | 6,265 | $ 131,742 | 25,959 | $ 444,825 | |||
Shares issued from reinvestment of distributions | 127,851 | 1,852,562 | 8,708 | 162,666 | |||
Shares redeemed | (44,503) | (913,755) | (150,773) | (2,625,482) | |||
Net increase/(decrease) | 89,613 | $ 1,070,549 | (116,106) | $ (2,017,991) | |||
| Investor Class | |||||||
Shares sold | 1,603,206 | $ 34,348,531 | 5,470,724 | $ 103,925,394 | |||
Shares issued from reinvestment of distributions | 8,942,682 | 142,725,214 | 797,312 | 15,842,579 | |||
Redemption fees | — | 2,296 | — | — | |||
Shares redeemed | (10,996,918) | (248,627,525) | (12,103,324) | (238,907,164) | |||
Net decrease | (451,030) | $ (71,551,484) | (5,835,288) | $(119,139,191) | |||
| Meridian Funds | 82 | www.meridianfund.com |
Notes to Financial Statements (continued)
| 3. | Investment Transactions: The cost of investments purchased and the proceeds from sales of investments, excluding short-term securities and U.S. government obligations, for the six months ended December 31, 2021, were as follows: |
| Purchases | Proceeds from Sales | ||
Growth Fund | $417,596,990 | $495,086,157 | |
Contrarian Fund | $202,288,525 | $260,732,448 | |
Enhanced Equity Fund | $ 36,213,733 | $ 42,123,468 | |
Small Cap Growth Fund | $306,031,958 | $651,955,436 | |
| 4. | Other Investment Transactions |
| a. | Restricted Securities: Restricted securities for which quotations are not readily available are valued at fair value, as determined by the board of directors. Restricted securities issued by publicly traded companies are generally valued at a discount to similar publicly traded securities. Restricted securities issued by nonpublic entities may be valued by reference to comparable public entities or fundamental data relating to the issuer, or both. Depending on the relative significance of valuation inputs, these instruments may be classified in either level 2 or level 3 of the fair value hierarchy. Refer to the Schedules of Investments for information about restricted securities held as of December 31, 2021 for Growth, Contrarian, Enhanced Equity and Small Cap Growth Funds. |
| b. | Private Placement Securities: Privately issued securities are restricted securities that are offered in a private placement and are generally not registered with the SEC or any federal or state regulatory authority. Securities issued in a private placement are generally "restricted securities" as that term is defined under Rule 144 promulgated under the Securities Act of 1933, and may not be resold without registration with the Securities and Exchange Commission or the availability of an exemption therefrom. There is generally no public trading market for privately offered securities and it is generally not anticipated that a public trading market will develop. There are substantial restrictions on the transfer of privately offered securities. Such securities have limited liquidity that makes it difficult or impossible to sell. An investment in privately issued securities often requires a long-term investment horizon and it may be many years before an investor receives significant distributions from such investment. Due to the lack of public market for privately offered securities, it may be difficult to value the investment. |
| c. | Securities Lending: The Funds have entered into an agreement with The Bank of New York Mellon (the “Lending Agent”), dated September 23, 2015 (“Securities Lending Agreement”), to provide securities lending services to the Funds. Under this program, the proceeds (cash collateral) received from borrowers are used to invest in money market funds or joint repurchase agreements. Under the Securities Lending Agreement, the borrowers may pay the Funds negotiated lender fees and the Funds receive cash and/or securities as collateral in an amount equal to not less than 102% of the market value of loaned securities. The market value of the loaned securities is determined at the close of each business day of the Fund and any additional required collateral is delivered to the Fund, or excess collateral is returned by the Fund, on the next business day. The borrower pays fees at the Funds’ direction to the Lending Agent. Although the risk of lending is generally mitigated by the collateral, the Funds could experience a delay in recovering securities and a possible loss of income or value if the borrower fails to return them. Loans of securities are terminable at any time and the borrower, after notice, is required to return borrowed securities within the standard time period for settlement of securities transactions. |
| The following table summarizes the securities received as collateral for securities lending: |
| Collateral Type | Coupon Range | Maturity Date Range | Market Value | ||||
Growth Fund | U.S. Government Obligations | 0.00% - 7.50% | 1/31/22 - 11/15/51 | $53,344,576 | |||
Contrarian Fund | U.S. Government Obligations | 0.00% - 7.50% | 1/31/22 - 8/15/51 | 23,853,095 | |||
Enhanced Equity Fund | U.S. Government Obligations | 0.00% - 7.50% | 1/31/22 - 11/15/51 | 2,084,933 | |||
Small Cap Growth Fund | U.S. Government Obligations | 0.00% - 7.50% | 1/31/22 - 11/15/51 | 26,958,851 |
| Meridian Funds | 83 | www.meridianfund.com |
Notes to Financial Statements (continued)
| d. | Repurchase Agreements and Joint Repurchase Agreements: The Funds may enter into repurchase agreements for temporary cash management purposes provided that the value of the underlying collateral, including accrued interest, will equal or exceed the value of the repurchase agreement during the term of the agreement. The underlying collateral for all repurchase agreements is held in safekeeping by the Funds' custodian or at the Federal Reserve Bank. If the seller defaults and the value of the collateral declines, or if bankruptcy proceedings commence with respect to the seller of the security, realization of the collateral by the Funds may be delayed or limited. |
| Additionally, the Funds may enter into joint repurchase agreements for reinvestment of cash collateral on securities lending transactions under the securities lending program offered by the Lending Agent (the “Program”), provided that the value of the underlying collateral, including accrued interest will equal or exceed the value of the joint repurchase agreement during the term of the agreement. The Funds participate on a pro rata basis with other clients of the Lending Agent in its share of the underlying collateral under such joint repurchase agreements and in its share of proceeds from any repurchase or other disposition of the underlying collateral. The underlying collateral for joint repurchase agreements is held in safekeeping by the Funds’ custodian or at the Federal Reserve Bank. If the seller defaults and the value of the collateral declines, or if bankruptcy proceedings commence with respect to the seller of the security, realization of the collateral by the Funds may be delayed or limited. Pursuant to the Program, the Funds are indemnified for such losses by the Lending Agent. | |
| At December 31, 2021, the market value of repurchase agreements or joint repurchase agreements outstanding for the Growth Fund, Contrarian Fund, Enhanced Equity Fund, and the Small Cap Growth Fund were $47,815,239, $10,284,549, $399,561 and $37,849,391, respectively. | |
| e. | Master Netting Arrangements: The Funds may enter into master netting agreements with their counterparties for the repurchase agreements, which provide the right, in the event of default (including bankruptcy or insolvency) for the non-defaulting party to liquidate the collateral and calculate net exposure to the defaulting party or request additional collateral. For financial reporting purposes, the Funds do not offset financial assets and financial liabilities that are subject to master netting agreements in the Statements of Assets and Liabilities. |
| Meridian Funds | 84 | www.meridianfund.com |
Notes to Financial Statements (continued)
| The following table is a summary of the Funds’ open repurchase agreements that are subject to a master netting arrangement as of December 31, 2021: |
| Assets | |||||
| Gross Amounts Presented in Statements of Assets and Liabilities | Collateral Received | Net Amount | |||
Growth Fund | |||||
Repurchase agreement | $47,815,239 | $(47,815,239) 1 | $— | ||
Contrarian Fund | |||||
Repurchase agreement | $10,284,549 | $(10,284,549) 1 | $— | ||
Enhanced Equity Fund | |||||
Repurchase agreement | $ 399,561 | $ (399,561)1 | $— | ||
Small Cap Growth Fund | |||||
Repurchase agreement | $37,849,391 | $(37,849,391) 1 | $— | ||
| 1 | The amount of collateral presented is limited such that the net amount cannot be less than zero. Collateral received in excess of the market value of repurchase agreements is not presented in this table. |
| f. | Options: Certain Funds purchase and write call and put options to increase or decrease their exposure to underlying instruments (including equity risk, interest rate risk and/or commodity price risk) and/or, in the case of options written, to generate gains from options premiums. A call option gives the purchaser (holder) of the option the right (but not the obligation) to buy, and obligates the seller (writer) to sell (when the option is exercised) the underlying instrument at the exercise or strike price at any time or at a specified time during the option period. A put option gives the holder the right to sell and obligates the writer to buy the underlying instrument at the exercise or strike price at any time or at a specified time during the option period. When the Funds purchase (write) an option, an amount equal to the premium paid (received) by the Funds is reflected as an asset (liability). The amount of the asset (liability) is subsequently marked-to-market to reflect the current market value of the option purchased (written). When an instrument is purchased or sold through an exercise of an option, the related premium paid (or received) is added to (or deducted from) the basis of the instrument acquired or deducted from (or added to) the proceeds of the instrument sold. When an option expires (or the Funds enter into a closing transaction), the Funds realize a gain or loss on the option to the extent of the premiums received or paid (or gain or loss to the extent the cost of the closing transaction exceeds the premiums received or paid). When the Funds write a call option, such option is “covered,” meaning that the Funds hold the underlying instrument subject to being called by the option counterparty. When the Funds write a put option, such option is covered by cash in an amount sufficient to cover the obligation. |
| In purchasing and writing options, the Funds bear the risk of an unfavorable change in the value of the underlying instrument or the risk that the Funds may not be able to enter into a closing transaction due to an illiquid market. Exercise of a written option could result in the Funds purchasing or selling a security when it otherwise would not, or at a price different from the current market value. | |
| Average quarterly balances of outstanding derivative financial instruments were as follows. |
| Contrarian Fund | |
| Options: | |
Average value of option contracts purchased | $228,000 |
Average value of option contracts written | $ 61,000 |
| Enhanced Equity Fund | |
| Options: | |
Average value of option contracts written | $16,191,821 |
| Meridian Funds | 85 | www.meridianfund.com |
Notes to Financial Statements (continued)
| Meridian Funds | 86 | www.meridianfund.com |
Notes to Financial Statements (continued)
| 5. | Market and Debt Securities Risk |
| In the normal course of business, each Fund's investment activities expose it to various types of risk associated with the financial instruments and markets in which it invests. The significant types of financial risks each Fund is exposed to include market risk and debt securities risk. Each Fund’s prospectus provides details of these and other types of risk. | |
| Market Risk: Market risk refers to the possibility that the market values of securities or other investments that a Fund holds will fall, sometimes rapidly or unpredictably, or fail to rise. Security values may fall or fail to rise because of a variety of factors affecting (or the market’s perception of) individual companies or other issuers (e.g., an unfavorable earnings report), industries or sectors, or the market as a whole, reducing the value of an investment in a Fund. Accordingly, an investment in the Fund could lose money over short or even long periods. The market values of the securities the Fund holds also can be affected by changes (or perceived changes) in U.S. or foreign economies and financial markets, and the liquidity of these securities, among other factors. In general, equity securities tend to have greater price volatility than debt securities. In addition, stock prices may be sensitive to rising interest rates, as the cost of capital rises and borrowing costs increase. As a result, the value of your investments in a Fund may be more or less than the value of your purchase price. | |
| Debt Securities Risk: Each Fund may invest in debt securities of both government and corporate issuers. A decline in prevailing levels of interest rates generally increases the value of debt securities in a Fund’s portfolio, while an increase in rates usually reduces the value of those securities. The value of a Fund’s debt securities, including bonds and convertible securities, are affected by movements in interest rates; if interest rates rise, the value of these securities may fall. Generally, the longer the average maturity of a debt security, the greater the change in its value. As a result, to the extent that a Fund invests in debt securities, interest rate fluctuations will affect the Fund’s net asset value, but not the income it receives from debt securities it owns. Debt securities are also subject to credit, liquidity risk and prepayment and extension risk. Credit risk is the risk that the entity that issued a debt security may become unable to make payments of principal and interest, and includes the risk of default. Liquidity risk is the risk that a Fund may not be able to sell portfolio securities because there are too few buyers for them. Prepayment and extension risk is the risk that a loan, bond or other security might be called or otherwise converted, prepaid or redeemed before maturity. If a loan or security is converted, prepaid or redeemed before maturity, particularly during a time of declining interest rates or spreads, the portfolio managers may not be able to invest the proceeds in securities or loans providing as high a level of income, resulting in a reduced yield to a Fund. Conversely, as interest rates rise or spreads widen, the likelihood of prepayment decreases. The portfolio managers may be unable to capitalize on securities with higher interest rates or wider spreads because a Fund’s investments are locked in at a lower rate for a longer period of time. | |
| Options Risk: Investments in options involve risks different from, and possibly greater than, investing directly in the underlying security, asset or other reference, including, among others, the risk that the counterparty to an option may not perform or may be unable to perform in accordance with the terms of the instrument, the potential that, at times, there may not be a liquid secondary market for the options (as described above), and the risk of imperfect correlation between any movement in the price or value of options and their underlying security, asset or other reference. Such events, as well as circumstances under which a Fund is required to purchase the underlying asset at a disadvantageous price, may result in losses to the Fund. In addition, options also may involve a small initial investment relative to the risk assumed, which could result in losses that are greater than the amount originally invested. Special risks are presented by internationally traded options. Because of time differences between the United States and various foreign countries, and because different holidays are observed in different countries, foreign options markets may be open for trading during hours or on days when U.S. markets are closed. As a result, option premiums may not reflect the current prices of the underlying interest in the United States. | |
| Private Investment Funds (PIF) Risk: PIFs are subject to management and other expenses, which will be directly or indirectly paid by the Funds. As a result, the cost of investing in the Fund will be higher than the cost of investing directly in PIFs and also may be higher than other funds that invest directly in stocks and bonds. Each PIF is subject to specific risks, depending on the nature of its investment strategy. The Fund may invest in private investment funds |
| Meridian Funds | 87 | www.meridianfund.com |
Notes to Financial Statements (continued)
| and/or hedge funds, which may pursue alternative investment strategies. Hedge funds often engage in speculative investment practices such as leverage, short-selling, arbitrage, hedging, derivatives, and other strategies that may increase investment loss. |
| 6. | Affiliate Transactions and Fees |
| Investment Management Fees: Under the Investment Management Agreement, the Adviser receives the following fees for providing certain investment management and other services necessary for managing each Fund. The fee is paid monthly in arrears and calculated based on that month’s daily average net assets. |
| Growth Fund: | Contrarian and Small Cap Growth Funds: | |||||
| Average Daily Net Assets | Investment Management Fee | Average Daily Net Assets | Investment Management Fee | |||
Up to $50,000,000 | 1.00% | Greater than $0 | 1.00% | |||
Greater than $50,000,000 | 0.75% | |||||
| Enhanced Equity Fund: | ||
| Average Daily Net Assets | Investment Management Fee | |
Up to $10,000,000 | 1.00% | |
$10,000,001 to $30,000,000 | 0.90% | |
$30,000,001 to $50,000,000 | 0.80% | |
Greater than $50,000,000 | 0.70% | |
| Expense Limitation | Total Waivers and Reimbursements for the six months ended December 31, 2021 | ||
| Growth Fund | |||
Institutional Class | 0.90% | $ — | |
Class A | 1.55% | $ — | |
Class C | 2.25% | $ — | |
Investor Class | 1.30% | $ — | |
| Contrarian Fund | |||
Class A | 1.60% | $ — | |
Class C | 2.20% | $ — | |
Investor Class | 1.35% | $ — |
| Meridian Funds | 88 | www.meridianfund.com |
Notes to Financial Statements (continued)
| Enhanced Equity Fund | ||
Legacy Class | 1.25% | $ — |
Class A | 1.60% | $ — |
Class C | 2.00% | $20 |
Investor Class | 1.35% | $ — |
| Small Cap Growth Fund | ||
Legacy Class | 1.20% | $ — |
Institutional Class | 1.10% | $ — |
Class A | 1.60% | $ — |
Class C | 2.25% | $ — |
Investor Class | 1.35% | $ — |
| Expiration June 30, | |||||
| 2023 | 2024 | 2025 | |||
Growth Fund | $ — | $ — | $ — | ||
Contrarian Fund | — | — | — | ||
Enhanced Equity Fund | 49 | 48 | 20 | ||
Small Cap Growth Fund | — | — | — | ||
| 7. | Directors and Officers: Certain Officers of the Funds are also Officers of the Adviser. Officers of the Funds who are Officers of the Adviser receive no compensation from the Funds. Each Non-Interested Director is paid an annual fee set at $40,000. An additional $5,000 is paid to each Non-Interested Director for attendance at each in-person meeting of the Board and an additional $1,000 is paid to each Non-Interested Director for participating in a telephonic meeting of the Board. An additional $3,000 is paid to each member of the Audit or Governance Committee of the Board for attendance at an in-person Audit or Governance Committee meeting and an additional $1,000 is paid to each member of the Audit or Governance Committee of the Board for participating in a telephonic Audit or Governance Committee meeting. |
| An additional $10,000 is paid to the Chairman of the Board and the Chairman of a Committee of the Board. The Chairman of the Board also receives an additional $2,500 for attending each in-person meeting of the Board. The Chairman of a Committee receives an additional $2,000 for attending each in-person Committee meeting. |
| Meridian Funds | 89 | www.meridianfund.com |
Notes to Financial Statements (continued)
| 8. | Distribution Information: Income and long-term capital gains distributions are determined in accordance with federal income tax regulations, which may differ from U.S. GAAP. The tax character of distributions made during the fiscal year ended June 30, 2021, is as follows: |
| 2021 Taxable Distributions | |||||
| Ordinary Income | Net Long-Term Capital Gain | Total Distributions | |||
Growth Fund | $19,996,308 | $ — | $19,996,308 | ||
Contrarian Fund | 2,166,314 | 27,626,778 | 29,793,092 | ||
Enhanced Equity Fund | 2,257,676 | 4,975,467 | 7,233,143 | ||
Small Cap Growth Fund | 5,279,434 | 25,919,745 | 31,199,179 | ||
| 9. | Federal Income Taxes Information: It is the Funds’ policy to comply with the requirements of Subchapter M of the Internal Revenue Code of 1986, as amended, applicable to regulated investment companies and to distribute all of their taxable income to their shareholders; therefore, no federal income tax provision is required. Management has analyzed the Funds’ tax positions taken on federal income tax returns for all open tax years (current and prior three tax years), and has concluded that no provision for federal income tax is required in the Funds’ financial statements. The Funds’ federal and state income and federal excise tax returns for tax years for which the applicable statutes of limitations have not expired are subject to examination by the Internal Revenue Service and state departments of revenue. The Funds are not aware of any tax positions for which it is reasonably possible that the total amounts of unrecognized tax benefits will significantly change in the next 12 months. The Funds recognize interest and penalties, if any, related to unrecognized tax benefits as income tax expense in the Statements of Operations. During the six months ended December 31, 2021, the Funds did not incur any interest or penalties. |
| The aggregate cost of investments and unrealized appreciation and depreciation, for federal income tax purposes, at December 31, 2021 is as follows: |
| Aggregrate Cost | Aggregrate Gross Unrealized Appreciation | Aggregrate Gross Unrealized Depreciation | Net Unrealized Appreciation | ||||
Growth Fund | $1,535,137,108 | $715,224,424 | $(93,920,980) | $621,303,444 | |||
Contrarian Fund | 459,820,744 | 255,791,855 | (8,688,140) | 247,103,715 | |||
Enhanced Equity Fund | 65,708,841 | 16,818,547 | (3,025,064) | 13,793,483 | |||
Small Cap Growth Fund | 965,008,493 | 330,519,067 | (82,266,156) | 248,252,911 |
| 10. | Subsequent Events: Management has evaluated the impact of all subsequent events on the Funds through the date the financial statements were issued, and has noted no additional events that require recognition or disclosure in the financial statements. |
| Meridian Funds | 90 | www.meridianfund.com |
| Meridian Funds | 91 | www.meridianfund.com |
| Meridian Funds | 92 | www.meridianfund.com |
| Meridian Funds | 93 | www.meridianfund.com |
Glossary of Terms Used in this Report (Unaudited)
| Meridian Funds | 94 | www.meridianfund.com |
| • | Applications or other forms |
| • | Transactions with us, our affiliates, or others |
P.O. Box 9792
1-800-446-6662
| • | By electronic request at the following E-mail address: publicinfo@sec.gov |
| • | Free from the Commission’s Website at http://www.sec.gov. |
Other Information (Unaudited)
(800) 446-6662
(303) 398-2929
(877) 796-3434
ArrowMark Colorado Holdings, LLC
100 Fillmore Street, Suite 325
Denver, CO 80206
ALPS Distributors, Inc.
1290 Broadway, Suite 1000
Denver, CO 80203
BNY Mellon Investment Servicing (US) Inc.
103 Bellevue Parkway
Wilmington, DE 19809
The Bank of New York Mellon
One Wall Street
New York, NY 10286
Davis Graham & Stubbs LLP
1550 17th Street, Suite 500
Denver, CO 80202
Cohen & Company, Ltd.
1350 Euclid Ave., Suite 800
Cleveland, OH 44115
James Bernard Glavin, Chairman
Guy M. Arnold
John S. Emrich
Michael S. Erickson
Edward F. Keely
Michael Stolper*
David Corkins, President
Katie Jones, Chief Financial Officer and Treasurer
Richard Grove, Vice President, Secretary and Chief
Compliance Officer
| (b) | Not applicable |
| Item 2. | Code of Ethics. |
Not applicable.
| Item 3. | Audit Committee Financial Expert. |
Not applicable.
| Item 4. | Principal Accountant Fees and Services. |
Not applicable.
| Item 5. | Audit Committee of Listed Registrants. |
Not applicable.
| Item 6. | Investments. |
| (a) | Schedule of Investments in securities of unaffiliated issuers as of the close of the reporting period is included as part of the report to shareholders filed under Item 1(a) of this form. |
| (b) | Not applicable. |
| Item 7. | Disclosure of Proxy Voting Policies and Procedures for Closed-End Management Investment Companies. |
Not applicable.
| Item 8. | Portfolio Managers of Closed-End Management Investment Companies. |
Not applicable.
| Item 9. | Purchases of Equity Securities by Closed-End Management Investment Company and Affiliated Purchasers. |
Not applicable.
| Item 10. | Submission of Matters to a Vote of Security Holders. |
There have been no material changes to the procedures by which the shareholders may recommend nominees to the registrant’s board of directors, where those changes were implemented after the registrant last provided disclosure in response to the requirements of Item 407(c)(2)(iv) of Regulation S-K (17 CFR 229.407) (as required by Item 22(b)(15) of Schedule 14A (17 CFR 240.14a-101)), or this Item.
| Item 11. | Controls and Procedures. |
| (a) | The registrant’s principal executive and principal financial officers, or persons performing similar functions, have concluded that the registrant’s disclosure controls and procedures (as defined in Rule 30a-3(c) under the Investment Company Act of 1940, as amended (the “1940 Act”) (17 CFR 270.30a-3(c))) are effective, as of a date within 90 days of the filing date of the report that includes the disclosure required by this paragraph, based on their evaluation of these controls and procedures required by Rule 30a-3(b) under the 1940 Act (17 CFR 270.30a-3(b)) and Rules 13a-15(b) or 15d-15(b) under the Securities Exchange Act of 1934, as amended (17 CFR 240.13a-15(b) or 240.15d-15(b)). |
| (b) | There were no changes in the registrant’s internal control over financial reporting (as defined in Rule 30a-3(d) under the 1940 Act (17 CFR 270.30a-3(d))) that occurred during the period covered by this report that has materially affected, or is reasonably likely to materially affect, the registrant’s internal control over financial reporting. |
| Item 12. | Disclosure of Securities Lending Activities for Closed-End Management Investment Companies. |
Not applicable. |
| Item 13. | Exhibits. |
(a)(1) | Not applicable. |
(a)(2) | ||
(a)(3) | Not applicable. | |
(a)(4) | Not applicable. | |
(b) | ||
SIGNATURES
Pursuant to the requirements of the Securities Exchange Act of 1934 and the Investment Company Act of 1940, the registrant has duly caused this report to be signed on its behalf by the undersigned, thereunto duly authorized.
(Registrant) | Meridian Fund, Inc.® |
By (Signature and Title)* | /s/ David J. Corkins | |
David J. Corkins | ||
Principal Executive Officer and President |
Date | 03/03/2022 |
Pursuant to the requirements of the Securities Exchange Act of 1934 and the Investment Company Act of 1940, this report has been signed below by the following persons on behalf of the registrant and in the capacities and on the dates indicated.
By (Signature and Title)* | /s/ David J. Corkins | |
David J. Corkins | ||
Principal Executive Officer and President |
Date | 03/03/2022 |
By (Signature and Title)* | /s/ Katie Jones | |
Katie Jones | ||
Principal Financial Officer and Treasurer |
Date | 03/03/2022 |
* Print the name and title of each signing officer under his or her signature.