Table of Contents
UNITED STATES
SECURITIES AND EXCHANGE COMMISSION
Washington, D.C. 20549
FORMN-CSR
CERTIFIED SHAREHOLDER REPORT OF REGISTERED MANAGEMENT
INVESTMENT COMPANIES
Investment Company Act file number 811-04014
Meridian Fund, Inc.®
(Exact name of registrant as specified in charter)
100 Fillmore St., Suite 325
Denver, CO 80206
(Address of principal executive offices) (Zip code)
David J. Corkins
100 Fillmore St., Suite 325
Denver, CO 80206
(Name and address of agent for service)
Registrant’s telephone number, including area code:303-398-2929
Date of fiscal year end: June 30
Date of reporting period: December 31, 2018
Table of Contents
Item 1. Reports to Stockholders.
The Report to Shareholders is attached herewith.
Table of Contents


Table of Contents
Table of Contents
Table of Contents
Portfolio Performance and Composition (Unaudited)
| • | Monro, Inc. (MNRO) specializes in automotive repair and tire services. Although Monro is categorized within the consumer discretionary sector, we have long believed the non-discretionary nature of its car and tire services results in characteristics more reflective of a consumer staples company. We were also attracted to Monro’s long-term success consolidating its market, which has created significant earnings growth as the company leverages its purchasing power to improve margins at acquired businesses. During the period, Monro’s stock advanced on signs that initiatives put in place by the company’s new management team are resulting in improved store performance. Specifically, same-store sales rose 3.2% during the most recently reported quarter, while earnings per share grew 25%. Favorable weather and an aging car fleet were both tailwinds to store level performance. We are pleased to have participated in this stock’s strong run but liquidated our position when it reached our price target. |
| • | Euronet Worldwide, Inc. (EEFT) is a global electronic payments service provider comprised of three primary business segments: electronic financial transactions (EFT) processing, prepaid mobile (epay), and money transfer. Among the many things we like about this company are its strong global presence, dominant position as a low-cost provider, and attractive business model. Euronet has more than 40,000 ATMs across Western, Central and Eastern Europe and continues to build out its money transfer business, which is taking market share from competitors such as Western Union and MoneyGram. Continued execution of its business plan enabled the company to deliver strong financial results during the period, particularly in its EFT and money transfer businesses. In addition, the company maintains a strong balance sheet. We reduced our exposure but maintain a position in the stock. |
| • | CyberArk Software Ltd. (CYBR) is a provider of information technology security solutions that protect organizations from cyberattacks. Its core privileged access security products prevent hackers from accessing a company’s critical enterprise assets, acting as a last line of defense after a company’s systems have been |
| Meridian Funds | 4 | www.meridianfund.com |
Table of Contents
Portfolio Performance and Composition (Unaudited) (continued)
| penetrated. CyberArk’s software was designed to integrate with a multitude of mission critical systems, creating a barrier to entry for any competitors. Enhancements to the company’s sales strategy made in late 2017 resulted in accelerating growth through 2018, culminating in a 29% increase in third-quarter license revenue. As the stock appreciated, we felt its risk-reward profile was less favorable and pared back our position. |
| • | Hanesbrand, Inc. (HBI) designs, makes, and sells basic and intimate apparel and activewear under brand names such as Hanes, Champion, Bali and Playtex. Among the many things we like about this company are its low-cost global supply chain, which allows it to generate healthy margins and returns, and a unique business model that enables it to produce more than 90% of its goods through its own manufacturing facilities. During the period, the stock was pressured by news of Sears’ bankruptcy and continued anxiety over Target’s announcement in August that it is phasing out its C9 by Champion line of activewear. We held a steady position in this stock, as we believe the continued global strength of Champion activewear will enable the company to make up for the loss of revenue. |
| • | Multi-Color Corp. (LABL) produces printed labels for product manufacturers in markets such as home and personal care, wine and spirits, food and beverage, and specialty consumer goods. Our initial investment in the company was inspired by its key position in a fragmented market and the opportunity to gain market share at attractive margins and returns. The stock traded lower during the period after management reduced guidance for organic revenue growth from 5% to 3%. Expectations are that volume and pricing declines will continue to pressure near-term growth as the company works through some larger contract negotiations. However, we are confident that Multi-Color will work through these issues and that the business will stabilize and improve. As such, we held our position size steady. |
| • | Polaris Industries, Inc. (PII) designs, engineers, and manufactures power sports vehicles, including off-road, all-terrain, and side-by-side vehicles. Polaris has an attractive business model characterized by an asset-light manufacturing footprint and limited working capital dynamics. Although the company delivered strong financial results for the year, its near-term financial outlook is being constrained by higher tariffs and raw materials. We remain impressed with the company’s ability to generate strong free cash flow, launch new products, and gain market share and maintained our position in the stock. |
| Meridian Funds | 5 | www.meridianfund.com |
Table of Contents
Portfolio Performance and Composition (Unaudited) (continued)
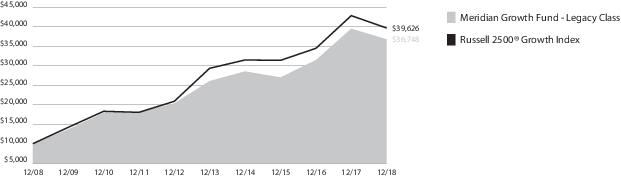
| Inception | 6 Month | 1 Year | 5 Year | 10 Year | Since Inception | |
| Legacy Class (MERDX) | 8/1/84 | (13.96)% | (6.91)% | 7.09% | 13.90% | 12.08% |
| Institutional Class (MRRGX) | 12/24/14 | (13.96)% | (6.88)% | — | — | 6.44% |
| Class A (MRAGX) w/o sales charge | 11/15/13 | (14.10)% | (7.18)% | 6.61% | — | 7.33% |
| Class A (MRAGX) with sales charge1 | 11/15/13 | (19.04)% | (12.52)% | 5.35% | — | 6.09% |
| Class C (MRCGX) | 7/1/15 | (14.39)% | (7.85)% | — | — | 5.21% |
| Investor Class (MRIGX) | 11/15/13 | (13.98)% | (6.96)% | 6.94% | — | 7.66% |
| Russell 2500® Growth Index | 8/1/842 | (14.35)% | (7.47)% | 6.19% | 14.76% | N/A3 |
| 1 | Assuming maximum sales charge, if any. Class A Shares are subject to a maximum initial sales charge of 5.75%. |
| 2 | Inception date of Legacy Class Shares. |
| 3 | Inception date of Legacy Class precedes the inception date of Russell 2500® Growth Index. |
| Meridian Funds | 6 | www.meridianfund.com |
Table of Contents
Portfolio Performance and Composition (Unaudited) (continued)
12.31.18
| LogMeIn, Inc. | 2.78% |
| Sensata Technologies Holding Plc | 2.58% |
| Grand Canyon Education, Inc. | 2.31% |
| Skechers U.S.A., Inc. Class A | 2.24% |
| Sally Beauty Holdings, Inc. | 2.20% |
| Trimble, Inc. | 2.14% |
| Kirby Corp. | 2.12% |
| Carter's, Inc. | 2.01% |
| MSC Industrial Direct Co., Inc. Class A | 2.01% |
| Hanesbrands, Inc. | 1.98% |
| Meridian Funds | 7 | www.meridianfund.com |
Table of Contents
Portfolio Performance and Composition (Unaudited)
| • | LiveRamp Holdings, Inc. (RAMP) formerly known as Acxiom, operates a data onboarding platform that allows marketers to use their customer database in their choice of online advertising platforms. Shares outperformed during the period due to the sale of the company’s legacy Acxiom Marketing Solutions business to worldwide advertising agency Interpublic Group of Companies (IPG). At $2.3 billion, the deal generated a much higher price than expected – nearly equal to the company’s entire market cap at the time of the announcement. The sale is part of the company’s longer-term strategy to transition from a traditional marketing services company to a digital data model and is what prompted us to invest in 2016. We trimmed our position as the stock approached our target price but are optimistic that the company’s digital business will continue to grow. |
| • | Advanced Micro Devices, Inc. (AMD) is a global semiconductor company that manufactures central processing units (CPUs) for desktop computers and servers and graphics processing unit chips (GPUs) for video games. We saw an opportunity to invest in AMD earlier this year when investor concerns over declining demand for GPUs used for mining cryptocurrencies resulted in a 30% decline in the company’s share price. At the time, we had developed a viewpoint that AMD’s next-generation CPU would gain significant market share against Intel in the data center server market, providing a tailwind to outsized earnings growth. During the period, evidence that data center customers have begun to embrace AMD’s newest chip supported stock gains. Although we reduced our position in the stock substantially as a means of managing portfolio risk, we believe the company will continue to innovate with smaller and faster microprocessors. |
| • | Iridium Communications, Inc. (IRDM) operates a global satellite communications network capable of reaching some of the most remote areas of the world. When we first purchased shares of Iridium in 2014, the stock was pressured by concerns of high capital expenditures (and the required debt) related to the upgrade of the company’s aging satellite fleet. Despite these concerns, we were impressed with the company’s stable cash flow and the slow, but steady, growth of the business. In anticipation of greater satellite coverage and broadband capabilities, a larger market opportunity, and a massive decline in capital spending upon completion of Iridium’s |
| Meridian Funds | 8 | www.meridianfund.com |
Table of Contents
Portfolio Performance and Composition (Unaudited) (continued)
| fleet upgrade (January 2019), the stock rallied. Stronger-than-expected financial results and an increase in network subscribers also supported stock gains during the period. We are pleased to see our thesis is playing out and slightly reduced our position in Iridium as the stock neared our target price. |
| • | Graphic Packaging Holding Co. (GPK) is a leading supplier of folded cartons and paper cups in the U.S. and Europe. The company is vertically integrated in that it manufactures its products from its own paperboard mills. When we first invested in Graphic Packaging in 3Q17 margins were pressured by several developments, including planned facility outages to allow for plant upgrades designed to increase capacity and reduce costs and atypical input costs. At the time, we were confident facility upgrades would result in substantial cost benefits and that higher input costs would normalize. We also were impressed with the company’s capital allocation into its share buyback program. Our thesis largely played out and GPK grew earnings in 2018. However, this improvement was not reflected in stock performance as rising inflation created headwinds for companies with exposure to commodities in 2018. During the quarter, GPK consequently reduced full-year 2018 guidance and experienced a sharp correction in its stock price. We used the downturn as an opportunity to increase our position, as we believe the stock’s low valuation indicates the market under-appreciates the business’s cash-flow generation potential. We also believe the company’s efforts to offset inflation will pay off, enabling it to continue growing earnings. |
| • | Umpqua Holdings Corp. (UMPQ) is a commercial and retail bank operating in two segments: Community Banking and Home Lending. Its primary markets are California, Nevada, Idaho, Oregon, and Washington. We saw an attractive buying opportunity after earnings were pressured due to an acquisition that proved to take much longer to integrate than originally forecast. We liked a change in management and the new team’s plan to generate stronger earnings growth by rationalizing overlapping branches and pursuing technology investments to better integrate the two banks and modernize the company’s operating footprint. Although Umpqua exceeded third-quarter earnings estimates, its stock declined in tandem with other regional banks during the period due to concerns that lower long-term interest rates would cause net interest margins to compress and that slower economic growth would hurt loan growth and credit quality. Umpqua has internal controls in place that we believe will continue to support the solid performance of the business. We consequently used the downturn in the stock price to marginally increase our position. |
| • | Agios Pharmaceuticals, Inc. (AGIO) is a clinical-stage biopharmaceutical company focusing on treatments for cancer and rare genetic metabolic disorders. Our original investment in Agios was motivated by our optimism for its developmental therapy to treat acute myeloid leukemia (AML) in patients with specific genetic mutation. We believed the drug represented more than a $500 million revenue opportunity for Agios. In July, the U.S. Food & Drug Administration (FDA) approved the drug, branded as TIBSOVO, which has proven very successful in treating this rare form of cancer. Despite these positive developments, Agios was unable to sidestep a selloff in the broader biotechnology industry during the fourth quarter. Further pressuring the stock were investor concerns that recent FDA approvals for competing AML drugs would diminish the market opportunity for TIBSOVO. We believe Agios is well-positioned to meet our original sales forecast as a combination therapy with other AML drugs and, therefore, do not see any significant competitive threat. We took advantage of the recent weakness in the stock price and added to our position. |
| Meridian Funds | 9 | www.meridianfund.com |
Table of Contents
Portfolio Performance and Composition (Unaudited) (continued)
| Meridian Funds | 10 | www.meridianfund.com |
Table of Contents
Portfolio Performance and Composition (Unaudited) (continued)
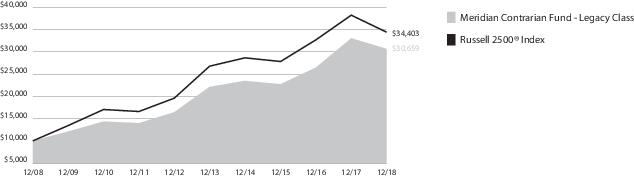
| Inception | 6 Month | 1 Year | 5 Year | 10 Year | Since Inception | |
| Legacy Class (MVALX) | 2/10/94 | (13.99)% | (7.31)% | 6.70% | 11.86% | 12.26% |
| Class A (MFCAX) w/o sales charge | 11/15/13 | (14.13)% | (7.65)% | 6.22% | — | 6.77% |
| Class A (MFCAX) with sales charge1 | 11/15/13 | (19.07)% | (12.95)% | 4.97% | — | 5.55% |
| Class C (MFCCX) | 7/1/15 | (14.42)% | (8.23)% | — | — | 5.42% |
| Investor Class (MFCIX) | 11/15/13 | (14.02)% | (7.44)% | 6.49% | — | 7.04% |
| Russell 2500® Index | 2/10/942 | (14.66)% | (10.00)% | 5.15% | 13.15% | 9.57% |
| 1 | Assuming maximum sales charge, if any. Class A Shares are subject to a maximum initial sales charge of 5.75%. |
| 2 | Inception date of Legacy Class Shares. |
| Meridian Funds | 11 | www.meridianfund.com |
Table of Contents
Portfolio Composition (Unaudited)
12.31.18
| Graphic Packaging Holding Co. | 3.24% |
| CVS Health Corp. | 3.16% |
| Nomad Foods Ltd. (United Kingdom) | 2.62% |
| Verint Systems, Inc. | 2.61% |
| Brinker International, Inc. | 2.46% |
| FireEye, Inc. | 2.39% |
| Umpqua Holdings Corp. | 2.37% |
| Kohl's Corp. | 2.36% |
| Nutrien Ltd. (Canada) | 2.33% |
| Iridium Communications, Inc. | 2.30% |
| Meridian Funds | 12 | www.meridianfund.com |
Table of Contents
Portfolio Performance and Composition (Unaudited)
| • | SPDR S&P 500 ETF Trust (SPY) 12/31/18 P280 are put options on an exchange-traded fund (ETF) that tracks the S&P 500 Index. The ETF consists of a portfolio representing all 500 stocks in the S&P 500 Index. Purchase of the put options in the fourth quarter was part of our strategy to hedge downside risk in extreme market volatility. This investment delivered substantial gains when the market sold off sharply in December. We have since closed out the position. |
| • | Apple, Inc. (AAPL) designs, manufactures and markets the most advanced and elegant personal computing devices in the world. In each of the past three fiscal years, AAPL has sold an average of 215 million iPhones per year, while the average selling price has climbed from $645, to $652 to most recently $766 with the iPhone X product cycle. On September 22, 2017, we bought out–of–the–money call options on AAPL to express our bullish view on the stock. We chose options to express this bullishness given the low valuation of the stock. In 2018, Warren Buffett revealed that he was a supporter of AAPL as an undervalued consumer products company and that Berkshire Hathaway was one of the largest holders of the stock. AAPL shares appreciated from $150s to over $200, and we sold our position for a significant profit. |
| • | Netflix (NFLX) is one of the world’s leading entertainment companies with 139 million subscribers worldwide for its subscription video on demand service. In recent years, NFLX market capitalization has increased substantially, but the company has relied on debt capital to fund its strategy of attracting and maintaining large subscriber |
| Meridian Funds | 13 | www.meridianfund.com |
Table of Contents
Portfolio Performance and Composition (Unaudited) (continued)
| bases by continuously investing in original content. Despite NFLX’s attractiveness for its rapidly growing consumer subscription business, we shorted this stock believing that its high valuation and high growth expectations would provide a logical short to pair against a long holding, such as Roku, Inc (ROKU). We closed the short position in NFLX, and wish the company well. |
| • | California Resources Corp. (CRC) operates exclusively in the state of California, which is a structurally attractive energy market. California is the 7th largest economy in the world, and the state has an energy deficit. Refiners import half of the state’s oil through barge and rail transportation, which can add as much as $10 per barrel in costs, creating a price umbrella for local producers. CRC was spun out of Occidental Petroleum on October 2016, only weeks before the Organization of the Petroleum Exporting Countries (OPEC) price war. Under the steadfast leadership of the management team, CRC successfully navigated tight liquidity conditions and even paid down debt during this challenging period of low oil prices. To shepherd capital, the company catalogued its project portfolio, prioritizing high return on investment opportunities with a focus on lowering operating costs. Longer term, the world-class resource base offers optionality for a higher price environment. |
| • | Nvidia (NVDA) designs and develops the most advanced graphics processors (GPUs) in the world. NVDA invented the graphics processor in 1999 which offered a substantial boost to computer graphics rendering capability for avid gamers. NVDA’s famed GeForce product family is built on a parallel processing architecture which is vastly more powerful for mathematical calculations versus general purpose central processing units (CPUs). In 2007, NVDA released CUDA, which is a programming language and interface designed to allow programmers to harness the mathematical computation capability of NVDA’s most powerful GPUs in applications outside of gaming. Today, the gaming market continues to grow with demographics and advances in photorealistic environments. Meanwhile, market demand for GPUs is increasingly driven by users demanding the number crunching capability of GPUs to power advanced computation in emerging applications including machine learning, artificial intelligence and autonomous driving. In late 2018, the shares sold off sharply when the company lowered its earnings outlook due to near-term headwinds. For the year, NVDA increased revenues by 20% but in Q4, the company reported a double-digit revenue decline due to excess channel inventory and a slower than expected launch of its data center GPUs. NVDA has been a long term holding in the Fund for its growth prospects and we maintained a position in the stock. |
| • | Roku, Inc. (ROKU) pioneered streaming television in 2008 with the launch of its first-generation Roku Player. The U.S. television (TV) advertising market generates $75 billion annually. The rapid adoption of TV streaming has disrupted the traditional linear TV distribution model, and an estimated $75 billion in advertising. As television viewing is increasingly streamed, television advertising will be increasingly streamed, and ROKU has developed a sophisticated over-the-top (OTT) advertising platform that enables advertisers to serve targeted, relevant ads to ROKU’s growing user base. ROKU acquires active accounts in two ways. ROKU acquires accounts directly through the sales of the Roku Player, an affordable hardware device which plugs into the display. Increasingly, Roku is acquiring users through licensed sources, including the Roku TV licensing program with TV manufacturers. We remain positive about the long-term prospects for Roku as it continues to increase market share. |
| Meridian Funds | 14 | www.meridianfund.com |
Table of Contents
Portfolio Performance and Composition (Unaudited) (continued)
| Inception | 6 Month | 1 Year | 5 Year | 10 Year | Since Inception | |
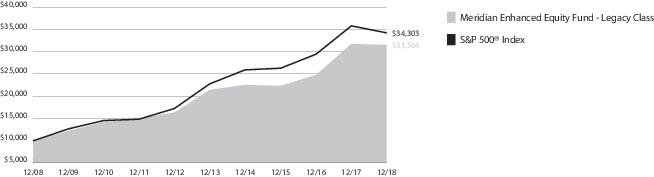
| Legacy Class (MEIFX) | 1/31/05 | (14.88)% | (0.65)% | 8.05% | 12.18% | 7.63% |
| Class A (MRAEX) w/o sales charge | 11/15/13 | (15.05)% | (1.01)% | 7.69% | — | 7.94% |
| Class A (MRAEX) with sales charge1 | 11/15/13 | (19.94)% | (6.72)% | 6.42% | — | 6.69% |
| Class C (MRCEX) | 7/1/15 | (15.25)% | (1.46)% | — | — | 7.91% |
| Investor Class (MRIEX) | 11/15/13 | (14.91)% | (0.96)% | 7.91% | — | 8.16% |
| S&P 500® Index | 1/31/052 | (6.85)% | (4.38)% | 8.49% | 13.11% | 7.78% |
| 1 | Assuming maximum sales charge, if any. Class A Shares are subject to a maximum initial sales charge of 5.75%. |
| 2 | Inception date of Legacy Class Shares. |
| Meridian Funds | 15 | www.meridianfund.com |
Table of Contents
Portfolio Performance and Composition (Unaudited) (continued)
| Meridian Funds | 16 | www.meridianfund.com |
Table of Contents
Portfolio Composition (Unaudited)
12.31.18
| Roku, Inc. | 4.61% |
| Microsoft Corp. | 4.13% |
| Royal Gold, Inc. | 4.13% |
| Amazon.com, Inc. | 4.06% |
| Exact Sciences Corp. | 3.52% |
| Vertex Pharmaceuticals, Inc. | 3.52% |
| Alphabet, Inc. Class A | 3.36% |
| Cheniere Energy, Inc. | 3.24% |
| Best Buy Co., Inc. | 3.23% |
| California Resources Corp. | 3.10% |
| Meridian Funds | 17 | www.meridianfund.com |
Table of Contents
Portfolio Performance and Composition (Unaudited)
| • | CareDx, Inc. (CDNA) is a molecular diagnostics company focused on the development of diagnostic surveillance solutions for organ transplant patients. Our investment in CareDx was motivated by our conviction in its kidney transplant rejection test AlloSure, which, since launching in October of 2017, has enjoyed rapid adoption. We believe AlloSure will follow the same successful path as AlloMap, a heart transplant rejection test brought to market by CareDx in 2005 that is now routinely used by heart transplant centers across the U.S. The kidney transplant market represents a multi-billion-dollar opportunity and AlloSure currently has low single-digit penetration which creates a long runway for growth. During the period, CareDx reported financial results that exceeded analysts’ expectations and raised forward-looking guidance. |
| • | Pacific Biosciences of California, Inc. (PACB) is a leader in the field of next-generation gene sequencing technology. Our initial investment in this company was motivated by our enthusiasm for the company’s long-read gene sequencing instruments, which utilize proprietary technology to deliver higher throughput at a lower price. In November, news that competitor Illumina would acquire PACB at approximately a 77% premium triggered a rally in PACB stock. The transaction is expected to close in mid-2019, therefore we maintained our position. |
| • | ConvergeOne Holdings, Inc. (CVON) is an information technology service provider specializing in collaboration, enterprise networking, data center, cloud, and security solutions. We purchased shares of ConvergeOne in a private stock offering during the first quarter of 2018. At the time, we believed the company could accelerate organic revenue growth, continue to source acquisitions at very attractive prices, and increase the percentage of revenues from recurring services and subscriptions. We were able to acquire the position at a significant discount to our estimate of fair value. In November, ConvergeOne announced it had entered into an agreement to be acquired by private equity firm CVC Advisors in an all-cash transaction representing a 33% premium to the company’s stock price on the day of the announcement and a 56% premium to our original purchase price. |
| Meridian Funds | 18 | www.meridianfund.com |
Table of Contents
Portfolio Performance and Composition (Unaudited) (continued)
| • | InnerWorkings, Inc. (INWK) provides print procurement solutions to corporate clients. The company’s proprietary software tracks the production capabilities and real-time pricing of its supplier network which allows its clients to realize material savings. Our initial investment was motivated by their unique offering and low market penetration among Fortune 500 companies which should position it for significant growth. Management had also shifted its focus to organic growth with a newfound focus on improving return on invested capital. During the period, the company reported a decline in third-quarter sales to smaller transactional clients and lowered revenue guidance for the year, resulting in a significant decline in its share price. Despite this setback, we continue to like the business and believe that recently implemented cost-cutting will lead to improved financial performance in the near term. We also are encouraged by healthy levels of new sales to larger clients which should result in faster growth in 2019 and improved visibility. |
| • | Multi-Color Corp. (LABL) produces printed labels for product manufacturers in markets such as home and personal care, wine and spirits, food and beverage, and specialty consumer goods. Our initial investment in the company was inspired by its key position in a fragmented market and the opportunity to gain market share at attractive margins and returns. The stock traded lower during the period after management reduced guidance for organic revenue growth from 5% to 3%. Expectations are that volume and pricing declines will continue to pressure near-term growth as the company works through some larger contract negotiations. However, we are confident that Multi-Color will work through these issues and that the business will stabilize and improve. As such, we held our position size steady. |
| • | TriNet Group, Inc. (TNET) is a cloud-based professional employer organization (PEO) providing human resources services to small- and medium-sized businesses. We believe the company’s significant investment in technology and new products over the past year will allow it to continue to differentiate itself within the marketplace and increase market share. TriNet has continued to exceed quarterly expectations driven by better than expected performance in its insurance segment. We reduced our position in the third quarter when a better-than-expected earnings report sent the shares to all-time highs making the risk-reward profile less favorable. The stock declined through the fourth quarter on concerns that margins in its insurance businesses had peaked, potentially creating a headwind for 2019 earnings growth. Continued declines in TriNet clients’ worksite employees added to investor concerns. As a result, it was one of our largest detractors during the six-month period. |
| Meridian Funds | 19 | www.meridianfund.com |
Table of Contents
Portfolio Performance and Composition (Unaudited) (continued)
| Inception | 6 Month | 1 Year | 5 Year | 10 Year | Since Inception | |
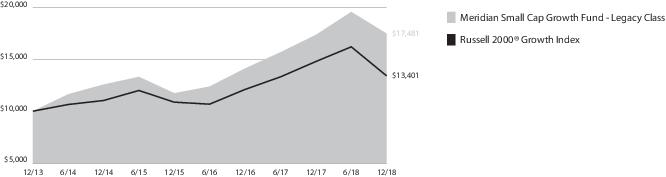
| Legacy Class (MSGGX) | 12/16/13 | (10.69)% | 0.71% | 10.84% | — | 11.72% |
| Institutional Class (MSGRX) | 12/24/14 | (10.66)% | 0.70% | — | — | 8.70% |
| Class A (MSGAX) w/o sales charge | 12/16/13 | (10.80)% | 0.40% | 10.48% | — | 11.36% |
| Class A (MSGAX) with sales charge1 | 12/16/13 | (15.92)% | (5.37)% | 9.17% | — | 10.06% |
| Class C (MSGCX) | 7/1/15 | (11.16)% | (0.37)% | — | — | 7.01% |
| Investor Class (MISGX) | 12/16/13 | (10.66)% | 0.71% | 10.80% | — | 11.68% |
| Russell 2000® Growth Index | 12/16/132 | (17.33)% | (9.31)% | 5.13% | 13.52% | 5.98% |
| 1 | Assuming maximum sales charge, if any. Class A Shares are subject to a maximum initial sales charge of 5.75%. |
| 2 | Inception date of Legacy Class Shares. |
| Meridian Funds | 20 | www.meridianfund.com |
Table of Contents
Portfolio Composition (Unaudited)
12.31.18
| LogMeIn, Inc. | 2.70% |
| Grand Canyon Education, Inc. | 2.31% |
| ConvergeOne Holdings, Inc. | 2.25% |
| Skechers U.S.A., Inc. Class A | 2.20% |
| Heritage-Crystal Clean, Inc. | 2.18% |
| Sally Beauty Holdings, Inc. | 2.10% |
| Carter's, Inc. | 1.89% |
| Clean Harbors, Inc. | 1.73% |
| Kirby Corp. | 1.64% |
| Carbonite, Inc. | 1.56% |
| Meridian Funds | 21 | www.meridianfund.com |
Table of Contents
| Actual | Annualized Expense Ratio | Beginning Account Value July 1, 2018 | Ending Account Value December 31, 2018 | Expenses Paid During the Period 1 |
| Legacy Class (MERDX) | 0.85% | $1,000.00 | $860.40 | $3.99 |
| Institutional Class (MRRGX) | 0.83% | $1,000.00 | $860.40 | $3.89 |
| Class A (MRAGX) | 1.17% | $1,000.00 | $859.00 | $5.48 |
| Class C (MRCGX) | 1.87% | $1,000.00 | $856.10 | $8.75 |
| Investor Class (MRIGX) | 0.88% | $1,000.00 | $860.20 | $4.13 |
| Hypothetical2 | Annualized Expense Ratio | Beginning Account Value July 1, 2018 | Ending Account Value December 31, 2018 | Expenses Paid During the Period 1 |
| Legacy Class (MERDX) | 0.85% | $1,000.00 | $1,020.92 | $4.33 |
| Institutional Class (MRRGX) | 0.83% | $1,000.00 | $1,021.02 | $4.23 |
| Class A (MRAGX) | 1.17% | $1,000.00 | $1,019.31 | $5.96 |
| Class C (MRCGX) | 1.87% | $1,000.00 | $1,015.78 | $9.50 |
| Investor Class (MRIGX) | 0.88% | $1,000.00 | $1,020.77 | $4.48 |
| 1 | Expenses are equal to the Fund’s annualized expense ratio multiplied by the average account value over the period, multiplied by 184 days, the number of days in the most recent fiscal half-year, then divided by 365. |
| 2 | Hypothetical 5% return before expenses. |
| Meridian Funds | 22 | www.meridianfund.com |
Table of Contents
| Actual | Annualized Expense Ratio | Beginning Account Value July 1, 2018 | Ending Account Value December 31, 2018 | Expenses Paid During the Period 1 |
| Legacy Class (MVALX) | 1.12% | $1,000.00 | $860.10 | $5.25 |
| Class A (MFCAX) | 1.44% | $1,000.00 | $858.70 | $6.75 |
| Class C (MFCCX) | 2.14% | $1,000.00 | $855.80 | $10.01 |
| Investor Class (MFCIX) | 1.19% | $1,000.00 | $859.80 | $5.58 |
| Hypothetical2 | Annualized Expense Ratio | Beginning Account Value July 1, 2018 | Ending Account Value December 31, 2018 | Expenses Paid During the Period 1 |
| Legacy Class (MVALX) | 1.12% | $1,000.00 | $1,019.56 | $5.70 |
| Class A (MFCAX) | 1.44% | $1,000.00 | $1,017.95 | $7.32 |
| Class C (MFCCX) | 2.14% | $1,000.00 | $1,014.42 | $10.87 |
| Investor Class (MFCIX) | 1.19% | $1,000.00 | $1,019.21 | $6.06 |
| 1 | Expenses are equal to the Fund’s annualized expense ratio multiplied by the average account value over the period, multiplied by 184 days, the number of days in the most recent fiscal half-year, then divided by 365. |
| 2 | Hypothetical 5% return before expenses. |
| Meridian Funds | 23 | www.meridianfund.com |
Table of Contents
| Actual | Annualized Expense Ratio | Beginning Account Value July 1, 2018 | Ending Account Value December 31, 2018 | Expenses Paid During the Period 1 |
| Legacy Class (MEIFX) | 1.44% | $1,000.00 | $851.20 | $6.72 |
| Class A (MRAEX) | 1.82% | $1,000.00 | $849.50 | $8.48 |
| Class C (MRCEX) | 2.30% | $1,000.00 | $847.50 | $10.71 |
| Investor Class (MRIEX) | 1.48% | $1,000.00 | $850.90 | $6.90 |
| Hypothetical2 | Annualized Expense Ratio | Beginning Account Value July 1, 2018 | Ending Account Value December 31, 2018 | Expenses Paid During the Period 1 |
| Legacy Class (MEIFX) | 1.44% | $1,000.00 | $1,017.95 | $7.32 |
| Class A (MRAEX) | 1.82% | $1,000.00 | $1,016.03 | $9.25 |
| Class C (MRCEX) | 2.30% | $1,000.00 | $1,013.61 | $11.67 |
| Investor Class (MRIEX) | 1.48% | $1,000.00 | $1,017.74 | $7.53 |
| 1 | Expenses are equal to the Fund’s annualized expense ratio multiplied by the average account value over the period, multiplied by 184 days, the number of days in the most recent fiscal half-year, then divided by 365. |
| 2 | Hypothetical 5% return before expenses. |
| Meridian Funds | 24 | www.meridianfund.com |
Table of Contents
| Actual | Annualized Expense Ratio | Beginning Account Value July 1, 2018 | Ending Account Value December 31, 2018 | Expenses Paid During the Period 1 |
| Legacy Class (MSGGX) | 1.13% | $1,000.00 | $893.10 | $5.39 |
| Institutional Class (MSGRX) | 1.10% | $1,000.00 | $893.40 | $5.25 |
| Class A (MSGAX) | 1.43% | $1,000.00 | $892.00 | $6.82 |
| Class C (MSGCX) | 2.18% | $1,000.00 | $888.40 | $10.38 |
| Investor Class (MISGX) | 1.14% | $1,000.00 | $893.40 | $5.44 |
| Hypothetical2 | Annualized Expense Ratio | Beginning Account Value July 1, 2018 | Ending Account Value December 31, 2018 | Expenses Paid During the Period1 |
| Legacy Class (MSGGX) | 1.13% | $1,000.00 | $1,019.51 | $5.75 |
| Institutional Class (MSGRX) | 1.10% | $1,000.00 | $1,019.66 | $5.60 |
| Class A (MSGAX) | 1.43% | $1,000.00 | $1,018.00 | $7.27 |
| Class C (MSGCX) | 2.18% | $1,000.00 | $1,014.22 | $11.07 |
| Investor Class (MISGX) | 1.14% | $1,000.00 | $1,019.46 | $5.80 |
| 1 | Expenses are equal to the Fund’s annualized expense ratio multiplied by the average account value over the period, multiplied by 184 days, the number of days in the most recent fiscal half-year, then divided by 365. |
| 2 | Hypothetical 5% return before expenses. |
| Meridian Funds | 25 | www.meridianfund.com |
Table of Contents
Performance and Expense Disclosures
| Meridian Funds | 26 | www.meridianfund.com |
Table of Contents
Schedule of Investments
| Shares | Value | |
| Common Stocks - 98.5% | ||
| Communication Services - 2.0% | ||
| Entertainment - 1.3% | ||
| Cinemark Holdings, Inc.1 | 598,231 | $21,416,670 |
| Media - 0.7% | ||
| National CineMedia, Inc. | 1,836,706 | 11,901,855 |
| Total Communication Services | 33,318,525 | |
| Consumer Discretionary - 18.5% | ||
| Diversified Consumer Services - 4.8% | ||
| Frontdoor, Inc.2 | 758,365 | 20,180,093 |
| Grand Canyon Education, Inc.2 | 398,274 | 38,290,062 |
| ServiceMaster Global Holdings, Inc.2 | 572,637 | 21,038,683 |
| 79,508,838 | ||
| Hotels, Restaurants & Leisure - 0.5% | ||
| Dunkin' Brands Group, Inc.1 | 133,027 | 8,529,691 |
| Internet & Direct Marketing Retail - 1.3% | ||
| Shutterstock, Inc.1 | 600,420 | 21,621,124 |
| Leisure Products - 1.2% | ||
| Polaris Industries, Inc.1 | 260,869 | 20,003,435 |
| Specialty Retail - 2.7% | ||
| Dick's Sporting Goods, Inc.1 | 270,158 | 8,428,930 |
| Sally Beauty Holdings, Inc.1,2 | 2,140,960 | 36,503,368 |
| 44,932,298 | ||
| Textiles, Apparel & Luxury Goods - 8.0% | ||
| Carter's, Inc.1 | 409,799 | 33,447,794 |
| Hanesbrands, Inc.1 | 2,617,782 | 32,800,809 |
| Skechers U.S.A., Inc. Class A1,2 | 1,622,653 | 37,142,527 |
| Under Armour, Inc. Class C1,2 | 738,985 | 11,949,388 |
| Wolverine World Wide, Inc. | 520,687 | 16,604,708 |
| 131,945,226 | ||
| Total Consumer Discretionary | 306,540,612 | |
| Consumer Staples - 0.6% | ||
| Food & Staples Retailing - 0.6% | ||
| Casey's General Stores, Inc.1 | 75,962 | 9,733,771 |
| Total Consumer Staples | 9,733,771 | |
| Energy - 0.5% | ||
| Energy Equipment & Services - 0.5% | ||
| RigNet, Inc.2 | 635,695 | 8,035,185 |
| Total Energy | 8,035,185 | |
| Financials - 4.1% | ||
| Banks - 0.3% | ||
| Bank OZK1 | 230,616 | 5,264,963 |
| Capital Markets - 3.8% | ||
| Legacy Acquisition Corp.2 | 1,708,725 | 17,394,820 |
| LPL Financial Holdings, Inc. | 509,998 | 31,150,678 |
| Shares | Value | |
| WisdomTree Investments, Inc.1 | 2,039,584 | $13,563,234 |
| 62,108,732 | ||
| Total Financials | 67,373,695 | |
| Health Care - 18.8% | ||
| Biotechnology - 4.8% | ||
| Agios Pharmaceuticals, Inc.1,2 | 166,207 | 7,663,805 |
| Atara Biotherapeutics, Inc.2 | 260,889 | 9,063,284 |
| DBV Technologies SA ADR (France)1,2 | 667,742 | 4,286,904 |
| Exact Sciences Corp.1,2 | 144,189 | 9,098,326 |
| Forte Biosciences, Inc. Acquisition Date: 12/31/18, Cost $4,000,0002,3,4 | 5,571,807 | 4,000,000 |
| Heron Therapeutics, Inc.1,2 | 407,529 | 10,571,302 |
| Immunomedics, Inc.1,2 | 613,110 | 8,749,080 |
| Moderna, Inc.1,2 | 56,294 | 859,609 |
| Moderna, Inc. Acquisition Date: 8/8/16-1/26/18, Cost $7,760,2482,3,4 | 392,174 | 5,090,226 |
| Neurocrine Biosciences, Inc.1,2 | 89,415 | 6,385,125 |
| Precision BioSciences, Inc. Acquisition Date: 5/25/18, Cost $3,130,0432,3,4 | 624,759 | 3,130,043 |
| Spectrum Pharmaceuticals, Inc.1,2 | 814,150 | 7,123,812 |
| Viking Therapeutics, Inc.1,2 | 557,981 | 4,268,555 |
| 80,290,071 | ||
| Health Care Equipment & Supplies - 6.9% | ||
| AxoGen, Inc.1,2 | 594,363 | 12,142,836 |
| Cooper Cos., Inc. (The) | 55,990 | 14,249,455 |
| DexCom, Inc.2 | 69,596 | 8,337,601 |
| Endologix, Inc.2 | 1,697,775 | 1,215,607 |
| Insulet Corp.1,2 | 104,449 | 8,284,895 |
| Integra LifeSciences Holdings Corp.2 | 187,690 | 8,464,819 |
| Masimo Corp.2 | 84,739 | 9,098,426 |
| Nevro Corp.2 | 347,345 | 13,508,247 |
| Quidel Corp.2 | 259,457 | 12,666,691 |
| STERIS Plc | 254,897 | 27,235,744 |
| 115,204,321 | ||
| Health Care Providers & Services - 1.5% | ||
| HealthEquity, Inc.1,2 | 110,419 | 6,586,493 |
| MEDNAX, Inc.2 | 584,412 | 19,285,596 |
| 25,872,089 | ||
| Health Care Technology - 1.9% | ||
| athenahealth, Inc.2 | 119,792 | 15,804,159 |
| Meridian Funds | 27 | www.meridianfund.com |
Table of Contents
Schedule of Investments (continued)
| Shares | Value | |
| Medidata Solutions, Inc.1,2 | 226,874 | $15,295,845 |
| 31,100,004 | ||
| Life Sciences Tools & Services - 1.2% | ||
| Syneos Health, Inc.1,2 | 495,626 | 19,502,883 |
| Pharmaceuticals - 2.5% | ||
| Catalent Inc.2 | 273,179 | 8,517,721 |
| Kiniksa Pharmaceuticals Ltd. Acquisition Date: 2/9/18, Cost $3,515,5792,3,4 | 224,727 | 6,312,568 |
| Prestige Consumer Healthcare, Inc.1,2 | 520,480 | 16,072,422 |
| Revance Therapeutics, Inc.2 | 494,153 | 9,947,300 |
| 40,850,011 | ||
| Total Health Care | 312,819,379 | |
| Industrials - 27.2% | ||
| Aerospace & Defense - 0.8% | ||
| HEICO Corp. Class A | 214,370 | 13,505,310 |
| Air Freight & Logistics - 1.2% | ||
| Forward Air Corp. | 367,337 | 20,148,434 |
| Building Products - 1.1% | ||
| Allegion Plc1 | 218,997 | 17,456,251 |
| Commercial Services & Supplies - 6.3% | ||
| ABM Industries, Inc.1 | 884,159 | 28,390,346 |
| Cimpress, N.V. (Netherlands)2 | 122,449 | 12,663,676 |
| Clean Harbors, Inc.2 | 613,107 | 30,256,830 |
| Multi-Color Corp.1 | 492,786 | 17,291,861 |
| Ritchie Bros. Auctioneers, Inc. (Canada) | 509,159 | 16,659,682 |
| 105,262,395 | ||
| Electrical Equipment - 2.6% | ||
| Sensata Technologies Holding Plc1,2 | 956,830 | 42,904,257 |
| Machinery - 8.0% | ||
| Evoqua Water Technologies Corp.1,2 | 799,956 | 7,679,578 |
| John Bean Technologies Corp.1 | 292,478 | 21,002,845 |
| Kennametal, Inc. | 579,758 | 19,294,346 |
| Middleby Corp. (The)1,2 | 224,173 | 23,029,292 |
| Proto Labs, Inc.1,2 | 64,381 | 7,261,533 |
| Tennant Co. | 401,352 | 20,914,453 |
| Wabtec Corp.1 | 130,134 | 9,141,914 |
| Woodward, Inc. | 335,142 | 24,897,699 |
| 133,221,660 | ||
| Marine - 2.1% | ||
| Kirby Corp.1,2 | 521,565 | 35,132,618 |
| Professional Services - 1.6% | ||
| TriNet Group, Inc.2 | 613,330 | 25,729,193 |
| Shares | Value | |
| Road & Rail - 1.5% | ||
| Heartland Express, Inc.1 | 1,374,706 | $25,157,120 |
| Trading Companies & Distributors - 2.0% | ||
| MSC Industrial Direct Co., Inc. Class A | 432,805 | 33,291,361 |
| Total Industrials | 451,808,599 | |
| Information Technology - 24.9% | ||
| Communications Equipment - 0.2% | ||
| Starry, Inc. Acquisition Date: 5/14/18, Cost $4,220,0002,3,4 | 4,577,007 | 4,220,000 |
| Electronic Equipment & Instruments - 4.5% | ||
| Belden, Inc.1 | 358,523 | 14,975,506 |
| CDW Corp. | 308,892 | 25,035,696 |
| Trimble, Inc.2 | 1,076,992 | 35,443,807 |
| 75,455,009 | ||
| IT Services - 5.3% | ||
| Carbonite, Inc.2 | 752,346 | 19,004,260 |
| Euronet Worldwide, Inc.1,2 | 225,279 | 23,064,064 |
| Gartner, Inc.1,2 | 85,750 | 10,962,280 |
| Presidio, Inc. | 1,483,630 | 19,361,371 |
| Switch, Inc. Class A1 | 2,137,402 | 14,961,814 |
| 87,353,789 | ||
| Semiconductors & Semiconductor Equipment - 0.6% | ||
| ON Semiconductor Corp.2 | 563,077 | 9,296,401 |
| Software - 13.9% | ||
| 2U, Inc.2 | 469,477 | 23,342,396 |
| ChannelAdvisor Corp.2 | 677,299 | 7,687,344 |
| Cornerstone OnDemand, Inc.2 | 228,135 | 11,504,848 |
| CyberArk Software Ltd. (Israel)2 | 313,330 | 23,230,286 |
| Descartes Systems Group, Inc. (The) (Canada)2 | 295,425 | 7,816,946 |
| DraftKings, Inc. Acquisition Date: 8/17/18, Cost $7,399,9982,3,4 | 2,902,461 | 7,399,999 |
| FireEye, Inc.1,2 | 748,179 | 12,127,982 |
| j2 Global, Inc.1 | 356,393 | 24,726,546 |
| LogMeIn, Inc. | 566,700 | 46,225,719 |
| RealPage, Inc.2 | 228,934 | 11,032,329 |
| SolarWinds Corp.1,2 | 1,478,880 | 20,452,910 |
| SS&C Technologies Holdings, Inc. | 505,307 | 22,794,399 |
| Zendesk, Inc.2 | 201,191 | 11,743,519 |
| 230,085,223 | ||
| Technology Hardware, Storage & Peripherals - 0.4% | ||
| 3D Systems Corp.1,2 | 723,922 | 7,362,287 |
| Total Information Technology | 413,772,709 | |
| Meridian Funds | 28 | www.meridianfund.com |
Table of Contents
Schedule of Investments (continued)
| Shares | Value | |
| Materials - 1.3% | ||
| Containers & Packaging - 1.3% | ||
| Graphic Packaging Holding Co.1 | 2,058,350 | $21,900,844 |
| Total Materials | 21,900,844 | |
| Real Estate - 0.6% | ||
| Equity Real Estate Investment Trusts (REITS) - 0.6% | ||
| National Storage Affiliates Trust | 377,773 | 9,995,874 |
| Total Real Estate | 9,995,874 | |
| Total Common Stocks - 98.5% (Cost $1,664,878,192) | 1,635,299,193 | |
| Shares/ Principal Amount | ||
| Short-Term Investments - 1.3%5 | ||
| Repurchase Agreements - 1.3% | ||
| BNP Paribas S.A., dated 12/31/18, due 1/2/19, 2.95% total to be received $1,453,903 (collateralized by various U.S. Treasury Obligations, 0.00% - 8.13%, 1/10/19 - 9/9/49, totaling $1,482,738) | $1,453,665 | 1,453,665 |
| Daiwa Capital Markets America, Inc., dated 12/31/18, due 1/2/19, 3.05% total to be received $4,917,473 (collateralized by various U.S. Government Sponsored Agency, 2.00% - 6.50%, 1/25/19 - 2/1/49, totaling $5,014,973) | 4,916,640 | 4,916,640 |
| Shares/ Principal Amount | Value | |
| Merrill Lynch Pierce Fenner & Smith, Inc., dated 12/31/18, due 1/2/19, 3.00% total to be received $4,917,459 (collateralized by various U.S. Government Sponsored Agency, 2.73% - 5.50%, 1/1/34 - 1/1/49, totaling $5,014,973) | $4,916,640 | $4,916,640 |
| Nomura Securities International, Inc., dated 12/31/18, due 1/2/19, 3.00% total to be received $4,917,459 (collateralized by various U.S. Government Sponsored Agency and U.S. Treasury Obligations, 0.00% - 7.50%, 1/3/19 - 11/20/68, totaling $5,014,973) | 4,916,640 | 4,916,640 |
| RBC Dominion Securities Inc., dated 12/31/18, due 1/2/19, 3.02% total to be received $4,917,465 (collateralized by various U.S. Government Sponsored Agency, 3.00% - 7.00%, 10/1/25 - 10/20/48, totaling $5,014,973) | 4,916,640 | 4,916,640 |
| Total Repurchase Agreements | 21,120,225 | |
| Total Short-Term Investments - 1.3% (Cost $21,120,225) | 21,120,225 | |
| Total Investments -99.8% (Cost $1,685,998,417) | 1,656,419,418 | |
| Cash and Other Assets, Less Liabilities - 0.2% | 3,692,408 | |
| Net Assets - 100.0% | $1,660,111,826 |
| Meridian Funds | 29 | www.meridianfund.com |
Table of Contents
Schedule of Investments (continued)
| ADR—American Depositary Receipt |
| N.V.—Naamloze Vennootschap is the Dutch term for limited liability company |
| Plc—Public Limited Company |
| 1 | All or portion of this security is on loan at December 31, 2018. Total value of such securities at period-end amounts to $357,069,072 and represents 21.51% of net assets. |
| 2 | Non-income producing securities. |
| 3 | Level 3 security. See Note 1 in Notes to Financial Statements. |
| 4 | Restricted security; cannot be offered for public resale without first being registered under the Securities Act of 1933 and related rules. Acquisition date represents the date on which an enforceable right to acquire such security is obtained and is presented along with related cost in the security description. The Fund has registration rights for certain restricted securities. Any costs related to such registration are borne by the issuer. The aggregate value of restricted securities at period-end amounts to $30,152,836 and represents 1.82% of net assets. |
| 5 | Collateral received from brokers for securities lending was invested in these joint repurchase agreements. |
| Meridian Funds | 30 | www.meridianfund.com |
Table of Contents
Schedule of Investments
| Shares | Value | |
| Common Stocks - 92.5% | ||
| Communication Services - 3.3% | ||
| Diversified Telecommunication Services - 2.3% | ||
| Iridium Communications, Inc.1 | 680,515 | $12,555,502 |
| Entertainment - 1.0% | ||
| Lions Gate Entertainment Corp. Class B | 385,589 | 5,737,564 |
| Total Communication Services | 18,293,066 | |
| Consumer Discretionary - 8.8% | ||
| Hotels, Restaurants & Leisure - 2.5% | ||
| Brinker International, Inc.2 | 305,000 | 13,413,900 |
| Leisure Products - 1.1% | ||
| Polaris Industries, Inc.2 | 77,000 | 5,904,360 |
| Multiline Retail - 2.4% | ||
| Kohl's Corp.2 | 194,000 | 12,869,960 |
| Textiles, Apparel & Luxury Goods - 2.8% | ||
| Gildan Activewear, Inc. (Canada) | 280,000 | 8,500,800 |
| Skechers U.S.A., Inc. Class A1,2 | 310,000 | 7,095,900 |
| 15,596,700 | ||
| Total Consumer Discretionary | 47,784,920 | |
| Consumer Staples - 2.6% | ||
| Food Products - 2.6% | ||
| Nomad Foods Ltd. (United Kingdom)1 | 854,000 | 14,278,880 |
| Total Consumer Staples | 14,278,880 | |
| Energy - 3.8% | ||
| Energy Equipment & Services - 0.9% | ||
| Liberty Oilfield Services, Inc. Class A2 | 407,000 | 5,270,650 |
| Oil, Gas & Consumable Fuels - 2.9% | ||
| California Resources Corp.1,2 | 150,271 | 2,560,618 |
| EOG Resources, Inc. | 51,826 | 4,519,745 |
| TOTAL SA ADR (France) | 165,000 | 8,609,700 |
| 15,690,063 | ||
| Total Energy | 20,960,713 | |
| Financials - 10.5% | ||
| Banks - 6.7% | ||
| Bank of Hawaii Corp.2 | 185,968 | 12,519,366 |
| Citizens Financial Group, Inc. | 379,409 | 11,279,829 |
| Umpqua Holdings Corp. | 814,000 | 12,942,600 |
| 36,741,795 | ||
| Capital Markets - 2.6% | ||
| Oaktree Capital Group LLC2 | 229,000 | 9,102,750 |
| Schultze Special Purpose Acquisition Corp.1 | 500,000 | 4,975,000 |
| 14,077,750 | ||
| Shares | Value | |
| Insurance - 1.2% | ||
| American International Group | 158,000 | $6,226,780 |
| Total Financials | 57,046,325 | |
| Health Care - 11.5% | ||
| Biotechnology - 6.5% | ||
| Agios Pharmaceuticals, Inc.1,2 | 135,000 | 6,224,850 |
| Audentes Therapeutics, Inc.1,2 | 131,000 | 2,792,920 |
| Celgene Corp.1 | 159,000 | 10,190,310 |
| Chimerix, Inc.1 | 325,000 | 835,250 |
| Heron Therapeutics, Inc.1,2 | 136,000 | 3,527,840 |
| ImmunoGen, Inc.1 | 675,000 | 3,240,000 |
| Immunomedics, Inc.1,2 | 400,000 | 5,708,000 |
| Ultragenyx Pharmaceutical, Inc.1,2 | 64,000 | 2,782,720 |
| 35,301,890 | ||
| Health Care Providers & Services - 3.1% | ||
| CVS Health Corp. | 263,000 | 17,231,760 |
| Life Sciences Tools & Services - 0.4% | ||
| Accelerate Diagnostics, Inc.1,2 | 180,000 | 2,070,000 |
| Pharmaceuticals - 1.5% | ||
| Nektar Therapeutics1,2 | 246,997 | 8,118,792 |
| Total Health Care | 62,722,442 | |
| Industrials - 9.7% | ||
| Building Products - 1.3% | ||
| Advanced Drainage Systems, Inc. | 287,000 | 6,959,750 |
| Commercial Services & Supplies - 3.1% | ||
| ABM Industries, Inc.2 | 293,059 | 9,410,125 |
| HNI Corp. | 210,000 | 7,440,300 |
| 16,850,425 | ||
| Industrial Conglomerates - 1.7% | ||
| Carlisle Cos. Inc. | 95,000 | 9,549,400 |
| Machinery - 1.7% | ||
| Xylem, Inc. | 141,610 | 9,448,219 |
| Road & Rail - 1.9% | ||
| Genesee & Wyoming, Inc. Class A1,2 | 137,000 | 10,140,740 |
| Total Industrials | 52,948,534 | |
| Information Technology - 23.9% | ||
| Electronic Equipment & Instruments - 1.5% | ||
| Trimble, Inc.1 | 257,156 | 8,463,004 |
| IT Services - 5.1% | ||
| CACI International, Inc. Class A1 | 72,800 | 10,485,384 |
| Cardtronics Plc Class A1 | 140,000 | 3,640,000 |
| LiveRamp Holdings, Inc.1,2 | 222,645 | 8,600,776 |
| Switch, Inc. Class A2 | 707,656 | 4,953,592 |
| 27,679,752 | ||
| Meridian Funds | 31 | www.meridianfund.com |
Table of Contents
Schedule of Investments (continued)
| Shares | Value | |
| Semiconductors & Semiconductor Equipment - 6.6% | ||
| Advanced Micro Devices, Inc.1,2 | 237,000 | $4,375,020 |
| Ambarella, Inc.1,2 | 80,000 | 2,798,400 |
| Mellanox Technologies Ltd. (Israel)1 | 92,000 | 8,498,960 |
| Micron Technology, Inc.1 | 168,772 | 5,355,136 |
| NVIDIA Corp. | 26,742 | 3,570,057 |
| Synaptics, Inc.1,2 | 304,000 | 11,311,840 |
| 35,909,413 | ||
| Software - 10.7% | ||
| Benefitfocus, Inc.1,2 | 205,335 | 9,387,916 |
| FireEye, Inc.1,2 | 803,000 | 13,016,630 |
| Microsoft Corp. | 122,700 | 12,462,639 |
| Nuance Communications, Inc.1,2 | 695,000 | 9,194,850 |
| Verint Systems, Inc.1 | 337,000 | 14,258,470 |
| 58,320,505 | ||
| Total Information Technology | 130,372,674 | |
| Materials - 10.3% | ||
| Chemicals - 2.3% | ||
| Nutrien Ltd. (Canada) | 270,882 | 12,731,454 |
| Construction Materials - 0.9% | ||
| U.S. Concrete, Inc.1,2 | 139,200 | 4,910,976 |
| Containers & Packaging - 4.9% | ||
| Graphic Packaging Holding Co.2 | 1,660,000 | 17,662,400 |
| Owens-Illinois, Inc.1 | 521,200 | 8,985,488 |
| 26,647,888 | ||
| Metals & Mining - 2.2% | ||
| Newmont Mining Corp. | 341,000 | 11,815,650 |
| Total Materials | 56,105,968 | |
| Real Estate - 5.8% | ||
| Equity Real Estate Investment Trusts (REITS) - 3.7% | ||
| Alexander & Baldwin, Inc.1,2 | 254,000 | 4,668,520 |
| Rayonier, Inc. | 186,080 | 5,152,555 |
| VICI Properties, Inc. | 559,493 | 10,507,279 |
| 20,328,354 | ||
| Real Estate Management & Development - 2.1% | ||
| Kennedy-Wilson Holdings, Inc.2 | 620,000 | 11,265,400 |
| Total Real Estate | 31,593,754 | |
| Utilities - 2.3% | ||
| Independent Power & Renewable Electricity Producers - 1.4% | ||
| TerraForm Power, Inc. Class A2 | 705,000 | 7,910,100 |
| Shares | Value | |
| Water Utilities - 0.9% | ||
| AquaVenture Holdings Ltd.1,2 | 255,000 | $4,816,950 |
| Total Utilities | 12,727,050 | |
| Total Common Stocks - 92.5% (Cost $463,626,192) | 504,834,326 | |
| Shares/ Principal Amount | ||
| Short-Term Investments - 6.7%3 | ||
| Repurchase Agreements - 6.7% | ||
| BNP Paribas S.A., dated 12/31/18, due 1/2/19, 2.95% total to be received $2,504,907 (collateralized by various U.S. Treasury Obligations, 0.00% - 8.13%, 1/10/19 - 9/9/49, totaling $2,554,587) | $2,504,497 | 2,504,497 |
| Daiwa Capital Markets America, Inc., dated 12/31/18, due 1/2/19, 3.05% total to be received $8,475,602 (collateralized by various U.S. Government Sponsored Agency, 2.00% - 6.50%, 1/25/19 - 2/1/49, totaling $8,643,649) | 8,474,166 | 8,474,166 |
| Merrill Lynch Pierce Fenner & Smith, Inc., dated 12/31/18, due 1/2/19, 3.00% total to be received $8,475,578 (collateralized by various U.S. Government Sponsored Agency, 2.73% - 5.50%, 1/1/34 - 1/1/49, totaling $8,643,649) | 8,474,166 | 8,474,166 |
| Nomura Securities International, Inc., dated 12/31/18, due 1/2/19, 3.00% total to be received $8,475,578 (collateralized by various U.S. Government Sponsored Agency and U.S. Treasury Obligations, 0.00% - 7.50%, 1/3/19 - 11/20/68, totaling $8,643,649) | 8,474,166 | 8,474,166 |
| Meridian Funds | 32 | www.meridianfund.com |
Table of Contents
Schedule of Investments (continued)
| Shares/ Principal Amount | Value | |
| RBC Dominion Securities Inc., dated 12/31/18, due 1/2/19, 3.02% total to be received $8,475,588 (collateralized by various U.S. Government Sponsored Agency, 3.00% - 7.00%, 10/1/25 - 10/20/48, totaling $8,643,649) | $8,474,166 | $8,474,166 |
| Total Repurchase Agreements | 36,401,161 | |
| Total Short-Term Investments - 6.7% (Cost $36,401,161) | 36,401,161 | |
| Total Investments -99.2% (Cost $500,027,353) | 541,235,487 | |
| Cash and Other Assets, Less Liabilities - 0.8% | 4,527,308 | |
| Net Assets - 100.0% | $545,762,795 |
| ADR—American Depositary Receipt |
| Plc—Public Limited Company |
| 1 | Non-income producing securities. |
| 2 | All or portion of this security is on loan at December 31, 2018. Total value of such securities at period-end amounts to $131,979,417 and represents 24.18% of net assets. |
| 3 | Collateral received from brokers for securities lending was invested in short-term investments. |
| Meridian Funds | 33 | www.meridianfund.com |
Table of Contents
Schedule of Investments
| Shares | Value | |
| Common Stocks - 69.7% | ||
| Communication Services - 8.3% | ||
| Entertainment - 1.9% | ||
| Activision Blizzard, Inc.1 | 9,489 | $441,903 |
| Take-Two Interactive Software, Inc.1,2 | 4,744 | 488,347 |
| 930,250 | ||
| Interactive Media & Services - 5.1% | ||
| Alphabet, Inc. Class A1,2 | 1,580 | 1,651,037 |
| Snap, Inc. Class A1,2,3 | 152,500 | 840,275 |
| 2,491,312 | ||
| Wireless Telecommunication Services - 1.3% | ||
| T-Mobile US, Inc.1,2 | 10,437 | 663,898 |
| Total Communication Services | 4,085,460 | |
| Consumer Discretionary - 11.9% | ||
| Household Durables - 4.6% | ||
| Roku, Inc.1,2 | 74,017 | 2,267,881 |
| Internet & Direct Marketing Retail - 4.1% | ||
| Amazon.com, Inc.1,2 | 1,329 | 1,996,118 |
| Specialty Retail - 3.2% | ||
| Best Buy Co., Inc. | 30,000 | 1,588,800 |
| Total Consumer Discretionary | 5,852,799 | |
| Consumer Staples - 1.9% | ||
| Food & Staples Retailing - 1.9% | ||
| Costco Wholesale Corp.1 | 4,483 | 913,232 |
| Total Consumer Staples | 913,232 | |
| Energy - 8.8% | ||
| Energy Equipment & Services - 1.2% | ||
| Liberty Oilfield Services, Inc. Class A1 | 47,446 | 614,425 |
| Oil, Gas & Consumable Fuels - 7.6% | ||
| California Resources Corp.1,2 | 89,562 | 1,526,137 |
| Cheniere Energy, Inc.1,2 | 26,896 | 1,591,974 |
| Cimarex Energy Co.1 | 10,000 | 616,500 |
| 3,734,611 | ||
| Total Energy | 4,349,036 | |
| Financials - 1.2% | ||
| Capital Markets - 1.2% | ||
| Intercontinental Exchange, Inc.1 | 7,591 | 571,830 |
| Total Financials | 571,830 | |
| Health Care - 15.7% | ||
| Biotechnology - 10.4% | ||
| Alnylam Pharmaceuticals, Inc.2,3 | 16,000 | 1,166,560 |
| Exact Sciences Corp.1,2 | 27,412 | 1,729,697 |
| Heron Therapeutics, Inc.1,2 | 18,978 | 492,290 |
| Shares | Value | |
| Vertex Pharmaceuticals, Inc.1,2 | 10,438 | $1,729,681 |
| 5,118,228 | ||
| Health Care Equipment & Supplies - 0.4% | ||
| AxoGen, Inc.2,3 | 10,000 | 204,300 |
| Health Care Providers & Services - 1.9% | ||
| Guardant Health, Inc.2,3 | 25,000 | 939,750 |
| Health Care Technology - 1.9% | ||
| Teladoc Health, Inc.1,2 | 18,978 | 940,739 |
| Life Sciences Tools & Services - 1.1% | ||
| Accelerate Diagnostics, Inc.1,2 | 47,446 | 545,629 |
| Total Health Care | 7,748,646 | |
| Information Technology - 17.0% | ||
| IT Services - 5.5% | ||
| Mastercard, Inc. Class A1 | 4,687 | 884,202 |
| Switch, Inc. Class A1,3 | 110,720 | 775,040 |
| Visa, Inc. Class A1 | 7,870 | 1,038,368 |
| 2,697,610 | ||
| Semiconductors & Semiconductor Equipment - 4.5% | ||
| Ambarella, Inc.1,2 | 19,927 | 697,046 |
| NVIDIA Corp.1 | 11,387 | 1,520,165 |
| 2,217,211 | ||
| Software - 4.1% | ||
| Microsoft Corp. | 20,000 | 2,031,400 |
| Technology Hardware, Storage & Peripherals - 2.9% | ||
| Apple, Inc. | 8,966 | 1,414,297 |
| Total Information Technology | 8,360,518 | |
| Materials - 4.9% | ||
| Chemicals - 0.8% | ||
| DowDuPont, Inc.1 | 6,799 | 363,610 |
| Metals & Mining - 4.1% | ||
| Royal Gold, Inc.1 | 23,695 | 2,029,477 |
| Total Materials | 2,393,087 | |
| Total Common Stocks - 69.7% (Cost $26,001,980) | 34,274,608 | |
| Call Options Purchased - 3.8% | ||
| Total Call Options Purchased - 3.8% (Cost $5,421,864) | 1,880,261 | |
| Put Options Purchased - 0.1% | ||
| Total Put Options Purchased - 0.1% (Cost $754,738) | 70,800 | |
| Meridian Funds | 34 | www.meridianfund.com |
Table of Contents
Schedule of Investments (continued)
| Shares/ Principal Amount | Value | |
| Short-Term Investments - 2.1%4 | ||
| Repurchase Agreements - 2.1% | ||
| Citigroup Global Markets, Inc., dated 12/31/18, due 1/2/19, 3.02% total to be received $250,042 (collateralized by various U.S. Government Sponsored Agency and U.S. Treasury Obligations, 2.50% - 8.00%, 1/25/19 - 7/15/60, totaling $255,000) | $250,000 | $250,000 |
| JP Morgan Securities LLC, dated 12/31/18, due 1/2/19, 2.96% total to be received $13,274 (collateralized by U.S. Treasury Obligation, 1.13%, 2/28/21, $13,537) | 13,272 | 13,272 |
| Merrill Lynch Pierce Fenner & Smith, Inc., dated 12/31/18, due 1/2/19, 3.00% total to be received $250,042 (collateralized by various U.S. Government Sponsored Agency, 2.73% - 5.50%, 1/1/34 - 1/1/49, totaling $255,000) | 250,000 | 250,000 |
| Nomura Securities International, Inc., dated 12/31/18, due 1/2/19, 3.00% total to be received $250,042 (collateralized by various U.S. Government Sponsored Agency and U.S. Treasury Obligations, 0.00% - 7.50%, 1/3/19 - 11/20/68, totaling $255,000) | 250,000 | 250,000 |
| Shares/ Principal Amount | Value | |
| RBC Dominion Securities Inc., dated 12/31/18, due 1/2/19, 3.02% total to be received $250,042 (collateralized by various U.S. Government Sponsored Agency, 3.00% - 7.00%, 10/1/25 - 10/20/48, totaling $255,000) | $250,000 | $250,000 |
| Total Repurchase Agreements | 1,013,272 | |
| Total Short-Term Investments - 2.1% (Cost $1,013,272) | 1,013,272 | |
| Total Investments -75.7% (Cost $33,191,854) | 37,238,941 | |
| Cash and Other Assets, Less Liabilities - 24.3% | 11,952,857 | |
| Net Assets - 100.0% | $49,191,798 |
| Value | ||
| Call Options Written - (0.0)% | ||
| Total Call Options Written - (0.0)% (Premium received $(162,964)) | $(4,000) | |
| 1 | Securities, or a portion thereof, were pledged as collateral for written options by the fund. |
| 2 | Non-income producing securities. |
| 3 | All or portion of this security is on loan at December 31, 2018. Total value of such securities at period-end amounts to $1,094,921 and represents 2.23% of net assets. |
| 4 | Collateral received from brokers for securities lending was invested in short-term investments. |
| Meridian Funds | 35 | www.meridianfund.com |
Table of Contents
Schedule of Investments (continued)
| Exchange-Traded Options Purchased | ||||||||||||
| Description | Strike Price | Expiration Date | Number of Contracts | Notional Amount | Cost | Value | ||||||
| Call | ||||||||||||
| Alnylam Pharmaceuticals, Inc. | 165.00 | 1/18/19 | 200 | $1,458,200 | $225,279 | $2,500 | ||||||
| Best Buy Co., Inc. | 110.00 | 1/18/19 | 2,000 | 10,592,000 | 73,788 | 2,000 | ||||||
| Dominion Energy, Inc. | 85.00 | 1/18/19 | 800 | 5,716,800 | 193,859 | 4,000 | ||||||
| Dominion Energy, Inc. | 80.00 | 1/18/19 | 1,200 | 8,575,200 | 362,292 | 6,000 | ||||||
| Dominion Energy, Inc. | 90.00 | 1/18/19 | 2,000 | 14,292,000 | 109,186 | 5,000 | ||||||
| Nektar Therapeutics | 100.00 | 1/18/19 | 500 | 1,643,500 | 70,282 | 1,250 | ||||||
| NXP Semiconductors N.V. | 130.00 | 1/18/19 | 1,011 | 7,408,608 | 81,591 | 1,011 | ||||||
| Snap, Inc. | 18.00 | 1/18/19 | 2,500 | 1,377,500 | 174,483 | 1,250 | ||||||
| JPMorgan Chase & Co. | 125.00 | 6/21/19 | 500 | 4,881,000 | 140,896 | 14,500 | ||||||
| Cimarex Energy Co. | 120.00 | 12/20/19 | 500 | 3,082,500 | 420,897 | 32,500 | ||||||
| CBS Corp. | 55.00 | 1/17/20 | 500 | 2,186,000 | 489,397 | 92,500 | ||||||
| Constellation Brands, Inc. | 270.00 | 1/17/20 | 250 | 4,020,500 | 296,849 | 2,500 | ||||||
| Nucor Corp. | 100.00 | 1/17/20 | 3,000 | 15,543,000 | 572,571 | 61,500 | ||||||
| Royal Gold, Inc. | 85.00 | 1/17/20 | 300 | 2,569,500 | 501,088 | 354,000 | ||||||
| Royal Gold, Inc. | 100.00 | 1/17/20 | 2,000 | 17,130,000 | 1,390,629 | 1,200,000 | ||||||
| Take-Two Interactive Software, Inc. | 165.00 | 1/17/20 | 350 | 3,602,900 | 318,777 | 99,750 | ||||||
| Total | $5,421,864 | $1,880,261 | ||||||||||
| Put | ||||||||||||
| Intel Corp. | 40.00 | 1/18/19 | 2,000 | $9,386,000 | $188,398 | $20,000 | ||||||
| Procter & Gamble Co. (The) | 80.00 | 1/18/19 | 200 | 1,838,400 | 56,984 | 4,000 | ||||||
| Procter & Gamble Co. (The) | 85.00 | 1/18/19 | 200 | 1,838,400 | 89,159 | 10,800 | ||||||
| Procter & Gamble Co. (The) | 90.00 | 1/18/19 | 200 | 1,838,400 | 108,158 | 29,000 | ||||||
| Procter & Gamble Co. (The) | 70.00 | 1/18/19 | 1,000 | 9,192,000 | 157,841 | 3,000 | ||||||
| Procter & Gamble Co. (The) | 65.00 | 1/18/19 | 2,000 | 18,384,000 | 154,198 | 4,000 | ||||||
| Total | $754,738 | $70,800 | ||||||||||
| Exchange-Traded Options Written | ||||||||||||
| Description | Strike Price | Expiration Date | Number of Contracts | Notional Amount | Premium Received | Value | ||||||
| Call | ||||||||||||
| Amazon.com, Inc. | 2,000.00 | 1/18/19 | 100 | $15,019,700 | $(138,040) | $(2,000) | ||||||
| Vertex Pharmaceuticals, Inc. | 210.00 | 1/18/19 | 100 | 1,657,100 | (24,924) | (2,000) | ||||||
| Total | $(162,964) | $(4,000) | ||||||||||
| Meridian Funds | 36 | www.meridianfund.com |
Table of Contents
Schedule of Investments
| Shares | Value | |
| Common Stocks - 92.1% | ||
| Communication Services - 2.4% | ||
| Entertainment - 0.9% | ||
| Cinemark Holdings, Inc.1 | 387,641 | $13,877,548 |
| Internet Software & Services - 0.5% | ||
| TrueCar, Inc.2 | 898,748 | 8,142,657 |
| Media - 1.0% | ||
| National CineMedia, Inc.1 | 1,204,622 | 7,805,951 |
| TechTarget, Inc.2 | 635,797 | 7,763,081 |
| 15,569,032 | ||
| Total Communication Services | 37,589,237 | |
| Consumer Discretionary - 14.7% | ||
| Auto Components - 0.5% | ||
| Cooper-Standard Holdings, Inc.2 | 131,394 | 8,162,195 |
| Diversified Consumer Services - 2.3% | ||
| Grand Canyon Education, Inc.2 | 370,335 | 35,604,007 |
| Hotels, Restaurants & Leisure - 2.2% | ||
| Chuy's Holdings, Inc.1,2 | 432,343 | 7,669,765 |
| Playa Hotels & Resorts, N.V.2 | 954,763 | 6,864,746 |
| PlayAGS, Inc.1,2 | 860,051 | 19,781,173 |
| 34,315,684 | ||
| Internet & Direct Marketing Retail - 1.6% | ||
| Evolve Vacation Rental Network, Inc. Acquisition Date: 6/15/18, Cost $3,999,9992,3,4 | 470,013 | 3,999,811 |
| Shutterstock, Inc.1 | 558,588 | 20,114,754 |
| 24,114,565 | ||
| Leisure Products - 0.4% | ||
| Malibu Boats, Inc. Class A2 | 194,083 | 6,754,088 |
| Specialty Retail - 2.6% | ||
| Dick's Sporting Goods, Inc.1 | 218,727 | 6,824,283 |
| Sally Beauty Holdings, Inc.1,2 | 1,898,284 | 32,365,742 |
| 39,190,025 | ||
| Textiles, Apparel & Luxury Goods - 5.1% | ||
| Carter's, Inc.1 | 358,042 | 29,223,388 |
| Skechers U.S.A., Inc. Class A2 | 1,486,981 | 34,036,995 |
| Wolverine World Wide, Inc. | 484,243 | 15,442,509 |
| 78,702,892 | ||
| Total Consumer Discretionary | 226,843,456 | |
| Consumer Staples - 1.1% | ||
| Food & Staples Retailing - 1.1% | ||
| BJ's Wholesale Club Holdings, Inc.2 | 381,645 | 8,457,253 |
| Shares | Value | |
| Casey's General Stores, Inc.1 | 70,865 | $9,080,641 |
| Total Consumer Staples | 17,537,894 | |
| Energy - 0.8% | ||
| Energy Equipment & Services - 0.5% | ||
| NCS Multistage Holdings, Inc.1,2 | 910,079 | 4,632,302 |
| RigNet, Inc.2 | 198,980 | 2,515,107 |
| 7,147,409 | ||
| Oil, Gas & Consumable Fuels - 0.3% | ||
| Evolution Petroleum Corp. | 751,575 | 5,125,742 |
| Total Energy | 12,273,151 | |
| Financials - 4.7% | ||
| Capital Markets - 4.3% | ||
| GS Acquisition Holdings Corp.2 | 988,564 | 10,132,781 |
| Legacy Acquisition Corp.2 | 1,257,692 | 12,803,305 |
| One Madison Corp.2 | 1,432,912 | 14,873,627 |
| PennantPark Investment Corp. | 1,053,576 | 6,711,279 |
| TPG Pace Holdings Corp.1,2 | 851,989 | 8,877,725 |
| WisdomTree Investments, Inc.1 | 1,832,615 | 12,186,890 |
| 65,585,607 | ||
| Insurance - 0.4% | ||
| Trupanion, Inc.1,2 | 255,620 | 6,508,085 |
| Total Financials | 72,093,692 | |
| Health Care - 21.7% | ||
| Biotechnology - 10.2% | ||
| 4D Molecular Therapeutics, Inc. Acquisition Date: 8/27/18, Cost $3,999,9992,3,4 | 229,095 | 3,999,999 |
| Albireo Pharma, Inc.2 | 339,472 | 8,327,248 |
| Argenx SE ADR (Netherlands)1,2 | 99,305 | 9,540,231 |
| Atara Biotherapeutics, Inc.2 | 247,787 | 8,608,120 |
| CareDx, Inc.1,2 | 496,905 | 12,492,192 |
| Centrexion Therapeutics Corp. Acquisition Date: 12/18/17, Cost $2,995,0072,3,4 | 1,663,893 | 2,995,007 |
| Chimerix, Inc.2 | 2,456,954 | 6,314,372 |
| DBV Technologies SA ADR (France)1,2 | 620,885 | 3,986,082 |
| Deciphera Pharmaceuticals, Inc.1,2 | 166,950 | 3,504,280 |
| Meridian Funds | 37 | www.meridianfund.com |
Table of Contents
Schedule of Investments (continued)
| Shares | Value | |
| Forte Biosciences, Inc. Acquisition Date: 11/27/18, Cost $4,000,0002,3,4 | 5,571,807 | $4,000,000 |
| Heron Therapeutics, Inc.1,2 | 329,656 | 8,551,277 |
| ImmunoGen, Inc.2 | 1,692,992 | 8,126,362 |
| Immunomedics, Inc.1,2 | 495,953 | 7,077,249 |
| Inhibrx, Inc. Acquisition Date: 10/1/18, Cost $3,999,9942,3,4 | 573,065 | 3,999,994 |
| Kiniksa Pharmaceuticals Ltd. Class A2 | 303,228 | 8,517,679 |
| Kodiak Sciences, Inc.2 | 478,238 | 3,395,490 |
| Kodiak Sciences, Inc. Acquisition Date: 2/2/18, Cost $4,166,3052,3,4 | 520,788 | 3,142,956 |
| Lyra Therapeutics, Inc. Acquisition Date: 7/30/18, Cost $4,000,0002,3,4 | 13,333,334 | 4,000,000 |
| Mersana Therapeutics, Inc.1,2 | 871,145 | 3,554,272 |
| Metacrine, Inc. Acquisition Date: 6/5/18, Cost $2,785,0022,3,4 | 1,313,680 | 2,785,002 |
| Neon Therapeutics, Inc.2 | 337,077 | 1,695,497 |
| NexImmune, Inc. Acquisition Date: 12/28/17, Cost $3,000,0002,3,4 | 10,166,045 | 3,000,000 |
| Orchard Therapeutics Ltd. Acquisition Date: 8/2/18, Cost $2,095,9502,3,4 | 194,819 | 2,604,822 |
| Orchard Therapeutics Plc ADR (United Kingdom)1,2 | 263,765 | 4,149,023 |
| Precision BioSciences, Inc. Acquisition Date: 5/25/18, Cost $2,799,8642,3,4 | 558,855 | 2,799,864 |
| Rhythm Pharmaceuticals, Inc.1,2 | 281,789 | 7,574,488 |
| TCR2 Therapeutics, Inc. Acquisition Date: 2/28/18, Cost $4,305,0002,3,4 | 2,152,500 | 4,305,000 |
| Viking Therapeutics, Inc.1,2 | 897,379 | 6,864,949 |
| Xencor, Inc.1,2 | 228,079 | 8,247,337 |
| 158,158,792 | ||
| Health Care Equipment & Supplies - 4.3% | ||
| AxoGen, Inc.1,2 | 549,532 | 11,226,939 |
| Beta Bionics, Inc. Acquisition Date: 10/9/18, Cost $3,999,9762,3,4 | 26,631 | 3,999,976 |
| CryoLife, Inc.2 | 301,220 | 8,548,624 |
| Endologix, Inc.2 | 1,465,804 | 1,049,516 |
| Insulet Corp.1,2 | 109,335 | 8,672,452 |
| Merit Medical Systems, Inc.1,2 | 155,675 | 8,688,222 |
| Shares | Value | |
| Nevro Corp.2 | 317,790 | $12,358,853 |
| Quidel Corp.1,2 | 237,586 | 11,598,948 |
| 66,143,530 | ||
| Health Care Providers & Services - 1.0% | ||
| BioTelemetry, Inc.1,2 | 127,664 | 7,624,094 |
| Guardant Health, Inc.2 | 40,200 | 1,511,118 |
| HealthEquity, Inc.1,2 | 105,457 | 6,290,510 |
| 15,425,722 | ||
| Health Care Technology - 0.9% | ||
| Medidata Solutions, Inc.2 | 203,655 | 13,730,420 |
| Life Sciences Tools & Services - 2.2% | ||
| Accelerate Diagnostics, Inc.1,2 | 310,496 | 3,570,704 |
| Pacific Biosciences of California, Inc.2 | 2,098,993 | 15,532,548 |
| Syneos Health, Inc.1,2 | 393,249 | 15,474,348 |
| 34,577,600 | ||
| Pharmaceuticals - 3.1% | ||
| Liquidia Technologies, Inc.2 | 394,134 | 8,536,943 |
| Prestige Consumer Healthcare, Inc.1,2 | 483,968 | 14,944,932 |
| Revance Therapeutics, Inc.1,2 | 355,439 | 7,154,987 |
| WaVe Life Sciences Ltd.1,2 | 247,909 | 10,422,094 |
| Xeris Pharmaceuticals, Inc.2 | 368,789 | 6,269,413 |
| 47,328,369 | ||
| Total Health Care | 335,364,433 | |
| Industrials - 25.7% | ||
| Air Freight & Logistics - 1.2% | ||
| Forward Air Corp. | 344,307 | 18,885,239 |
| Commercial Services & Supplies - 9.4% | ||
| ABM Industries, Inc.1 | 697,878 | 22,408,863 |
| Cimpress, N.V. (Netherlands)2 | 99,329 | 10,272,605 |
| Clean Harbors, Inc.2 | 539,857 | 26,641,943 |
| Heritage-Crystal Clean, Inc.2 | 1,460,028 | 33,595,244 |
| Hudson Technologies, Inc.1,2 | 2,284,533 | 2,033,234 |
| Multi-Color Corp.1 | 422,220 | 14,815,700 |
| Ritchie Bros. Auctioneers, Inc. (Canada) | 399,525 | 13,072,458 |
| SP Plus Corp.2 | 748,927 | 22,123,304 |
| 144,963,351 | ||
| Construction & Engineering - 0.6% | ||
| Construction Partners, Inc. Class A2 | 1,110,568 | 9,806,315 |
| Machinery - 4.5% | ||
| Graham Corp. | 390,304 | 8,914,544 |
| John Bean Technologies Corp.1 | 294,125 | 21,121,116 |
| Kennametal, Inc. | 505,105 | 16,809,895 |
| Meridian Funds | 38 | www.meridianfund.com |
Table of Contents
Schedule of Investments (continued)
| Shares | Value | |
| Proto Labs, Inc.2 | 62,832 | $7,086,821 |
| Tennant Co. | 308,384 | 16,069,890 |
| 70,002,266 | ||
| Marine - 2.9% | ||
| Kirby Corp.1,2 | 376,225 | 25,342,516 |
| Matson , Inc. | 593,522 | 19,004,574 |
| 44,347,090 | ||
| Professional Services - 4.6% | ||
| Forrester Research, Inc. | 300,943 | 13,452,152 |
| InnerWorkings, Inc.1,2 | 3,636,381 | 13,600,065 |
| TriNet Group, Inc.2 | 538,219 | 22,578,287 |
| TrueBlue, Inc.2 | 938,732 | 20,886,787 |
| 70,517,291 | ||
| Road & Rail - 1.4% | ||
| Heartland Express, Inc.1 | 1,182,586 | 21,641,324 |
| Trading Companies & Distributors - 1.1% | ||
| MSC Industrial Direct Co., Inc. Class A | 220,749 | 16,980,013 |
| Total Industrials | 397,142,889 | |
| Information Technology - 19.9% | ||
| Communications Equipment - 0.3% | ||
| Starry, Inc. Acquisition Date: 5/14/18, Cost $3,780,0002,3,4 | 4,099,783 | 3,780,000 |
| Electronic Equipment & Instruments - 0.5% | ||
| CTS Corp. | 315,259 | 8,162,055 |
| IT Services - 6.2% | ||
| Carbonite, Inc.1,2 | 953,456 | 24,084,299 |
| ConvergeOne Holdings, Inc. | 2,806,098 | 34,739,493 |
| Euronet Worldwide, Inc.1,2 | 205,588 | 21,048,099 |
| Presidio, Inc.1 | 1,222,394 | 15,952,242 |
| 95,824,133 | ||
| Semiconductors & Semiconductor Equipment - 0.2% | ||
| Cabot Microelectronics Corp. | 28,125 | 2,681,719 |
| Software - 12.3% | ||
| 2U, Inc.1,2 | 427,745 | 21,267,481 |
| Actua Corp. | 1,117,791 | 469,472 |
| American Software, Inc.1 | 546,885 | 5,714,948 |
| Asure Software, Inc.1,2 | 1,014,984 | 5,156,119 |
| Benefitfocus, Inc.1,2 | 197,072 | 9,010,132 |
| ChannelAdvisor Corp.2 | 632,085 | 7,174,165 |
| Cornerstone OnDemand, Inc.2 | 201,994 | 10,186,557 |
| CyberArk Software Ltd. (Israel)2 | 246,583 | 18,281,664 |
| Descartes Systems Group, Inc. (The) (Canada)2 | 278,148 | 7,359,796 |
| Domo, Inc. Class B1,2 | 747,630 | 14,675,977 |
| Shares | Value | |
| DraftKings, Inc. Acquisition Date: 8/17/18, Cost $6,599,9982,3,4 | 2,588,681 | $6,599,998 |
| Envestnet, Inc.1,2 | 185,215 | 9,110,726 |
| Everbridge, Inc.1,2 | 158,215 | 8,980,283 |
| LivePerson, Inc.2 | 431,738 | 8,142,579 |
| LogMeIn, Inc.1 | 510,233 | 41,619,706 |
| Model N, Inc.2 | 604,236 | 7,994,042 |
| QAD, Inc. Class A | 209,524 | 8,240,579 |
| 189,984,224 | ||
| Technology Hardware, Storage & Peripherals - 0.4% | ||
| 3D Systems Corp.1,2 | 625,203 | 6,358,314 |
| Total Information Technology | 306,790,445 | |
| Real Estate - 1.1% | ||
| Equity Real Estate Investment Trusts (REITS) - 1.1% | ||
| Jernigan Capital, Inc. | 434,424 | 8,610,283 |
| National Storage Affiliates Trust | 280,143 | 7,412,584 |
| Total Real Estate | 16,022,867 | |
| Total Common Stocks - 92.1% (Cost $1,420,239,871) | 1,421,658,064 | |
| Warrants - 0.1% | ||
| Energy - 0.1% | ||
| Oil, Gas & Consumable Fuels - 0.1% | ||
| Magnolia Oil & Gas Corp., Strike Price $11.50, Expires 7/31/232 | 401,457 | 1,216,414 |
| Total Energy | 1,216,414 | |
| Total Warrants - 0.1% (Cost $956,065) | 1,216,414 | |
| Preferred Stocks - 0.2% | ||
| Health Care - 0.2% | ||
| Biotechnology - 0.2% | ||
| SlipChip Corp. Acquisition Date: 10/6/17, Cost $4,000,0002,3,4 | 1,462,202 | 4,000,000 |
| Total Health Care | 4,000,000 | |
| Total Preferred Stocks - 0.2% (Cost $4,000,000) | 4,000,000 | |
| Meridian Funds | 39 | www.meridianfund.com |
Table of Contents
Schedule of Investments (continued)
| Shares/ Principal Amount | Value | |
| Short-Term Investments - 1.9%5 | ||
| Repurchase Agreements - 1.9% | ||
| BNP Paribas S.A., dated 12/31/18, due 1/2/19, 2.95% total to be received $1,996,411 (collateralized by various U.S. Treasury Obligations, 0.00% - 8.13%, 1/10/19 - 9/9/49, totaling $2,036,006) | $1,996,084 | $1,996,084 |
| Daiwa Capital Markets America, Inc., dated 12/31/18, due 1/2/19, 3.05% total to be received $6,753,405 (collateralized by various U.S. Government Sponsored Agency, 2.00% - 6.50%, 1/25/19 - 2/1/49, totaling $6,887,306) | 6,752,261 | 6,752,261 |
| Merrill Lynch Pierce Fenner & Smith, Inc., dated 12/31/18, due 1/2/19, 3.00% total to be received $6,753,386 (collateralized by various U.S. Government Sponsored Agency, 2.73% - 5.50%, 1/1/34 - 1/1/49, totaling $6,887,306) | 6,752,261 | 6,752,261 |
| Nomura Securities International, Inc., dated 12/31/18, due 1/2/19, 3.00% total to be received $6,753,386 (collateralized by various U.S. Government Sponsored Agency and U.S. Treasury Obligations, 0.00% - 7.50%, 1/3/19 - 11/20/68, totaling $6,887,306) | 6,752,261 | 6,752,261 |
| Shares/ Principal Amount | Value | |
| RBC Dominion Securities Inc., dated 12/31/18, due 1/2/19, 3.02% total to be received $6,753,394 (collateralized by various U.S. Government Sponsored Agency, 3.00% - 7.00%, 10/1/25 - 10/20/48, totaling $6,887,306) | $6,752,261 | $6,752,261 |
| Total Repurchase Agreements | 29,005,128 | |
| Total Short-Term Investments - 1.9% (Cost $29,005,128) | 29,005,128 | |
| Total Investments -94.3% (Cost $1,454,201,064) | 1,455,879,606 | |
| Cash and Other Assets, Less Liabilities - 5.7% | 87,810,447 | |
| Net Assets - 100.0% | $1,543,690,053 |
| Meridian Funds | 40 | www.meridianfund.com |
Table of Contents
Schedule of Investments (continued)
| ADR—American Depositary Receipt |
| N.V.—Naamloze Vennootschap is the Dutch term for limited liability company |
| Plc—Public Limited Company |
| 1 | All or portion of this security is on loan at December 31, 2018. Total value of such securities at period-end amounts to $225,822,967 and represents 14.63% of net assets. |
| 2 | Non-income producing securities. |
| 3 | Level 3 security. See Note 1 in Notes to Financial Statements. |
| 4 | Restricted security; cannot be offered for public resale without first being registered under the Securities Act of 1933 and related rules. Acquisition date represents the date on which an enforceable right to acquire such security is obtained and is presented along with related cost in the security description. The Fund has registration rights for certain restricted securities. Any costs related to such registration are borne by the issuer. The aggregate value of restricted securities at period-end amounts to $60,012,429 and represents 3.89% of net assets. |
| 5 | Collateral received from brokers for securities lending was invested in short-term investments. |
| Meridian Funds | 41 | www.meridianfund.com |
Table of Contents
Statements of Assets and Liabilities
| December 31, 2018 (Unaudited) | Meridian Growth Fund | Meridian Contrarian Fund | Meridian Enhanced Equity Fund | Meridian Small Cap Growth Fund |
| Assets | ||||
Investments, at value1,2 | $1,635,299,193 | $504,834,326 | $36,225,669 | $1,426,874,478 |
Repurchase agreements3 | 21,120,225 | 36,401,161 | 1,013,272 | 29,005,128 |
Cash | 77,539,903 | 28,809,527 | 12,562,338 | 136,133,860 |
Due from broker | — | 13,222,005 | — | — |
| Receivables and other assets: | ||||
Fund shares purchased | 2,169,244 | 34,455 | 5,025 | 11,300,571 |
Investments sold | — | — | 475,540 | 495,780 |
Dividends | 357,334 | 877,782 | 1,905 | 547,598 |
Securities lending interest | 46,842 | 28,776 | 575 | 58,170 |
Prepaid expenses | 126,700 | 35,545 | 32,681 | 66,019 |
Other | — | — | 3,303 | — |
Total Assets | 1,736,659,441 | 584,243,577 | 50,320,308 | 1,604,481,604 |
| Liabilities | ||||
Collateral held for securities on loan | 21,120,225 | 36,401,161 | 1,013,272 | 29,005,128 |
Due to broker | — | — | 54,818 | — |
| Payables and other accrued expenses: | ||||
Options written at value4 | — | — | 4,000 | — |
Fund shares sold | 3,124,029 | 1,497,868 | 16,405 | 3,175,941 |
Investments purchased | 50,882,636 | — | — | 27,010,678 |
Investment management fees | 1,125,560 | 492,170 | 35,590 | 1,355,357 |
Distribution fees | 32,625 | — | — | 19,901 |
Service plan fees | 3,882 | 970 | 832 | 26,732 |
Professional fees | 91,807 | 34,888 | 1,217 | 57,034 |
Directors' fees | 6,459 | 2,606 | 224 | 4,940 |
Transfer agent fees | 95,946 | 39,887 | 2,152 | 113,157 |
Other | 64,446 | 11,232 | — | 22,683 |
Total Liabilities | 76,547,615 | 38,480,782 | 1,128,510 | 60,791,551 |
Net Assets | $1,660,111,826 | $545,762,795 | $49,191,798 | $1,543,690,053 |
| Net Assets Consist of | ||||
Paid in capital | $1,676,828,406 | $498,844,852 | $39,613,634 | $1,516,974,346 |
Accumulated earnings (loss) | (16,716,580) | 46,917,943 | 9,578,164 | 26,715,707 |
Net Assets | $1,660,111,826 | $545,762,795 | $49,191,798 | $1,543,690,053 |
1 Investments at cost | $1,664,878,192 | $463,626,192 | $32,178,582 | $1,425,195,936 |
| 2 | Including securities on loan valued at $357,069,072, $131,979,417, $1,094,921 and $225,822,967 respectively. See Note 4 in Notes to Financial Statements. |
| 3 | Repurchase agreements at cost $21,120,225, $36,401,161, $1,013,272 and $29,005,128, respectively. |
| 4 | Written options, premium received of $—, $—, $162,964, and $—, respectively. |
| Meridian Funds | 42 | www.meridianfund.com |
Table of Contents
Statements of Assets and Liabilities (continued)
| December 31, 2018 (Unaudited) | Meridian Growth Fund | Meridian Contrarian Fund | Meridian Enhanced Equity Fund | Meridian Small Cap Growth Fund |
| Net Asset Value | ||||
| Legacy Class | ||||
Net Assets | $1,137,698,932 | $538,848,892 | $45,596,322 | $37,272,920 |
Shares outstanding6 | 34,304,305 | 17,438,096 | 3,233,147 | 2,612,544 |
Net Asset value per share (offering and redemption price) | $33.16 | $30.90 | $14.10 | $14.27 |
| Institutional Class | ||||
Net Assets | $286,592,631 | $— | $— | $675,190,184 |
Shares outstanding6 | 8,648,089 | — | — | 47,144,590 |
Net Asset value per share (offering and redemption price) | $33.14 | $— | $— | $14.32 |
| Class A | ||||
Net Assets | $6,193,529 | $3,972,333 | $2,853,520 | $52,950,768 |
Shares outstanding6 | 192,849 | 131,847 | 203,354 | 3,782,916 |
Net Asset value per share (offering and redemption price) | $32.12 | $30.13 | $14.03 | $14.00 |
| Class C | ||||
Net Assets | $2,742,509 | $42,385 | $1,306 | $17,490,289 |
Shares outstanding6 | 86,480 | 1,426 | 94 | 1,278,806 |
Net Asset value per share (offering and redemption price) | $31.71 | $29.737 | $13.967 | $13.68 |
| Investor Class | ||||
Net Assets | $226,884,225 | $2,899,185 | $740,650 | $760,785,892 |
Shares outstanding6 | 6,910,905 | 94,534 | 52,632 | 53,441,977 |
Net Asset value per share (offering and redemption price) | $32.83 | $30.67 | $14.07 | $14.24 |
| 6 | 500,000,000 shares authorized, $0.01 par value. |
| 7 | The NAV reported above represents the traded NAV at December 31, 2018 and does not recalculate due to rounding. |
| Meridian Funds | 43 | www.meridianfund.com |
Table of Contents
Statements of Operations
| For the Six Months Ended December 31, 2018 (Unaudited) | Meridian Growth Fund | Meridian Contrarian Fund | Meridian Enhanced Equity Fund | Meridian Small Cap Growth Fund |
| Investment Income | ||||
Dividends | $8,471,391 | $5,231,519 | $25,534 | $6,433,389 |
Foreign taxes withheld | (24,743) | (102,129) | — | (23,061) |
Interest income | — | — | — | 151,049 |
Securities lending | 335,664 | 196,215 | 8,413 | 546,846 |
Total investment income | 8,782,312 | 5,325,605 | 33,947 | 7,108,223 |
| Expenses | ||||
Investment management fees | 7,244,824 | 3,346,617 | 254,437 | 8,900,834 |
Custodian fees | 88,573 | 34,045 | 8,852 | 74,745 |
| Distribution and service plan fees: | ||||
Class A | 15,101 | 8,802 | 7,085 | 91,982 |
Class C | 16,843 | 177 | 7 | 123,649 |
Directors' fees | 88,247 | 31,669 | 2,887 | 80,999 |
Pricing fees | 87,078 | 36,918 | 12,387 | 81,633 |
Audit and tax fees | 27,965 | 10,427 | 968 | 25,823 |
Legal fees | 23,104 | 8,710 | 765 | 19,649 |
Registration and filing fees | 61,993 | 43,410 | 41,916 | 70,097 |
Shareholder communications | 62,769 | 23,684 | 2,022 | 118,821 |
Transfer agent fees | 399,886 | 183,494 | 16,475 | 525,533 |
Recoupment of investment advisory fees previously waived | — | — | 214 | 57,670 |
Miscellaneous expenses | 66,367 | 29,355 | 6,601 | 55,897 |
Total expenses excluding dividend expense | 8,182,750 | 3,757,308 | 354,616 | 10,227,332 |
Dividend expense | — | — | 88,507 | — |
Total expense | 8,182,750 | 3,757,308 | 443,123 | 10,227,332 |
Less waivers and/or reimbursements (Note 6) | — | — | — | — |
Net expenses | 8,182,750 | 3,757,308 | 443,123 | 10,227,332 |
Net investment income (loss) | 599,562 | 1,568,297 | (409,176) | (3,119,109) |
| Realized and Unrealized Gain (Loss) | ||||
Net realized gain on investments and foreign currency transactions | 88,654,947 | 33,343,833 | 12,750,899 | 93,797,503 |
Net realized loss on securities sold short | — | — | (25,346) | — |
Net realized loss on written options | — | — | (3,118,168) | — |
Net change in unrealized depreciation on investments and foreign currency translations | (374,062,741) | (127,322,884) | (17,842,692) | (276,511,870) |
Net change in unrealized depreciation on securities sold short | — | — | (144,205) | — |
Net change in unrealized depreciation on written options | — | — | (1,378,804) | — |
Total realized and unrealized loss | (285,407,794) | (93,979,051) | (9,758,316) | (182,714,367) |
Net decrease in net assets resulting from operations | $(284,808,232) | $(92,410,754) | $(10,167,492) | $(185,833,476) |
| Meridian Funds | 44 | www.meridianfund.com |
Table of Contents
Statements of Changes in Net Assets
| Meridian Growth Fund | Meridian Contrarian Fund | ||||
| Changes in Net Assets From: | Six Months Ended December 31, 2018 (Unaudited) | Year Ended June 30, 2018 | Six Months Ended December 31, 2018 (Unaudited) | Year Ended June 30, 2018 | |
| Operations | |||||
Net investment income/(loss) | $599,562 | $(3,915,061) | $1,568,297 | $6,891,615 | |
Net realized gain on investments, written options, and foriegn currency transactions | 88,654,947 | 245,625,574 | 33,343,833 | 91,016,903 | |
Net change in unrealized appreciation/(depreciation) on investments, written options, and foreign currency translations | (374,062,741) | 60,250,061 | (127,322,884) | 48,552,211 | |
Net increase/(decrease) in net assets resulting from operations | (284,808,232) | 301,960,574 | (92,410,754) | 146,460,729 | |
| Distributions to Shareholders: | |||||
Legacy Class | (164,331,013) | (89,771,951)1 | (112,950,429) | (62,903,160)2 | |
Institutional Class | (40,378,205) | (14,571,915)1 | — | — | |
Class A | (922,162) | (1,175,172)1 | (892,832) | (61,424)1 | |
Class C | (412,514) | (224,281)1 | (8,621) | (2,415)1 | |
Investor Class | (32,458,365) | (6,562,237)1 | (595,138) | (299,488)1 | |
Decrease in net assets from distributions | (238,502,259) | (112,305,556) | (114,447,020) | (63,266,487) | |
| Fund Share Transactions | |||||
Net increase in net assets resulting from fund share transactions (Note 2) | 349,243,591 | 172,007,485 | 69,546,698 | 7,604,373 | |
Total increase (decrease) in net assets | (174,066,900) | 361,662,503 | (137,311,076) | 90,798,615 | |
| Net Assets | |||||
Beginning of Period | 1,834,178,726 | 1,472,516,223 | 683,073,871 | 592,275,256 | |
End of Period3 | $1,660,111,826 | $1,834,178,726 | $545,762,795 | $683,073,871 | |
| 1 | For the year ended June 30, 2018, distributions were from net realized gains. |
| 2 | For the year ended June 30, 2018, Legacy class distributed $42,862 from net investment income and $62,860,298 from realized gains. |
| 3 | Undistributed net investment income at June 30, 2018, was $0 for the Meridian Growth Fund and $7,055,137 for the Meridian Contrarian Fund. |
| Meridian Funds | 45 | www.meridianfund.com |
Table of Contents
Statements of Changes in Net Assets (continued)
| Meridian Enhanced Equity Fund | Meridian Small Cap Growth Fund | ||||
| Changes in Net Assets From: | Six Months Ended December 31, 2018 (Unaudited) | Year Ended June 30, 2018 | Six Months Ended December 31, 2018 (Unaudited) | Year Ended June 30, 2018 | |
| Operations | |||||
Net investment income/(loss) | $(409,176) | $176,141 | $(3,119,109) | $(7,718,576) | |
Net realized gain on investments, written options, securities sold short, and foreign currency transactions | 9,607,385 | 6,218,156 | 93,797,503 | 153,908,733 | |
Net change in unrealized appreciation/(depreciation) on investments, written options, securities sold short, and foreign currency translations | (19,365,701) | 11,684,660 | (276,511,870) | 156,315,166 | |
Net increase/(decrease) in net assets resulting from operations | (10,167,492) | 18,078,957 | (185,833,476) | 302,505,323 | |
| Distributions to Shareholders: | |||||
Legacy Class | (4,804,655) | (599,181)1 | (4,188,569) | (2,783,183)2 | |
Institutional Class | — | — | (74,909,184) | (17,222,385)2 | |
Class A | (283,192) | (53,696)1 | (5,728,384) | (3,734,054)2 | |
Class C | (130) | (7)1 | (2,049,385) | (1,761,834)2 | |
Investor Class | (77,060) | (3,042)1 | (85,087,846) | (27,649,877)2 | |
Decrease in net assets from distributions | (5,165,037) | (655,926) | (171,963,368) | (53,151,333) | |
| Fund Share Transactions | |||||
Net increase (decrease) in net assets resulting from fund share transactions (Note 2) | 1,101,874 | (3,689,049) | 143,819,808 | 611,063,733 | |
Total increase (decrease) in net assets | (14,230,655) | 13,733,982 | (213,977,036) | 860,417,723 | |
| Net Assets | |||||
Beginning of Period | 63,422,453 | 49,688,471 | 1,757,667,089 | 897,249,366 | |
End of Period3 | $49,191,798 | $63,422,453 | $1,543,690,053 | $1,757,667,089 | |
| 1 | For the year ended June 30, 2018, distributions were from net investment income. |
| 2 | For the year ended June 30, 2018, distributions were from net realized gains. |
| 3 | Undistributed (distributions in excess of) net investment income at June 30, 2018, was $186,515 for Meridian Enhanced Equity Fund and $(686,245) for the Meridian Small Cap Growth Fund. |
| Meridian Funds | 46 | www.meridianfund.com |
Table of Contents
Financial Highlights
| For the Six Months Ended December 31, | For the Fiscal Year Ended June 30, | |||||
| Legacy Class | 2018 (Unaudited) | 2018 | 2017 | 2016 | 2015 | 2014 |
| Per Share Operating Performance | ||||||
Net asset value - beginning of period | $45.05 | $40.15 | $32.70 | $37.80 | $37.86 | $44.31 |
| Income (loss) from investment operations | ||||||
Net investment income (loss)1 | 0.02 | (0.10) | (0.09) | (0.10) | (0.15) | (0.11) |
Net realized and unrealized gain (loss) | (6.46) | 7.94 | 7.74 | (1.26) | 4.37 | 6.89 |
Net increase (decrease) from investment operations | (6.44) | 7.84 | 7.65 | (1.36) | 4.22 | 6.78 |
| Less distributions to shareholders: | ||||||
Distributions from net investment income | (0.02) | 0.00 | 0.00 | 0.00 | 0.00 | (0.00)2 |
Distributions from net realized capital gains | (5.43) | (2.94) | (0.20) | (3.74) | (4.28) | (13.23) |
Total distributions to shareholders | (5.45) | (2.94) | (0.20) | (3.74) | (4.28) | (13.23) |
Redemption fees | 0.002 | 0.002 | 0.002 | 0.002 | 0.002 | 0.00 |
Net asset value, end of period | $33.16 | $45.05 | $40.15 | $32.70 | $37.80 | $37.86 |
Total return | (13.96)%3 | 20.14% | 23.46% | (2.94)% | 11.85% | 17.31%3 |
| Ratios to Average Net Assets | ||||||
Ratio of net investment income (loss) to average net assets | 0.07%4 | (0.23)% | (0.24)% | (0.30)% | (0.41)% | (0.27)% |
Ratio of expenses to average net assets: | 0.85%4 | 0.86% | 0.87% | 0.86% | 0.84% | 0.86% |
| Supplemental Data | ||||||
Net Assets, End of Period (000's) | $1,137,699 | $1,400,431 | $1,270,753 | $1,161,981 | $1,937,346 | $2,021,197 |
Portfolio Turnover Rate | 14%3 | 47% | 34% | 67% | 46% | 96% |
| 1 | Per share net investment income has been calculated using the average daily shares method. |
| 2 | Less than $0.005 per share. |
| 3 | Not Annualized. |
| 4 | Annualized. |
| Meridian Funds | 47 | www.meridianfund.com |
Table of Contents
Financial Highlights
| For the Six Months Ended December 31, | For the Fiscal Year Ended June 30, | For the Period Ended June 30, | ||||
| Institutional Class | 2018 (Unaudited) | 2018 | 2017 | 2016 | 20151 | |
| Per Share Operating Performance | ||||||
Net asset value, beginning of period | $45.03 | $40.13 | $32.68 | $37.79 | $36.44 | |
| Income (loss) from investment operations | ||||||
Net investment income (loss)2 | 0.02 | (0.11) | (0.09) | (0.13) | (0.04) | |
Net realized and unrealized gain (loss) | (6.45) | 7.95 | 7.74 | (1.24) | 1.39 | |
Net increase (decrease) from investment operations | (6.43) | 7.84 | 7.65 | (1.37) | 1.35 | |
| Less distributions to shareholders: | ||||||
Distributions from net investment income | (0.03) | 0.00 | 0.00 | 0.00 | 0.00 | |
Distributions from net realized capital gains | (5.43) | (2.94) | (0.20) | (3.74) | 0.00 | |
Total distributions to shareholders | (5.46) | (2.94) | (0.20) | (3.74) | 0.00 | |
Redemption fees | 0.00 | 0.003 | 0.003 | 0.003 | 0.00 | |
Net asset value, end of period | $33.14 | $45.03 | $40.13 | $32.68 | $37.79 | |
Total return | (13.96)%4 | 20.18% | 23.48% | (2.97)% | 3.70%4 | |
| Ratios to Average Net Assets | ||||||
Ratio of net investment income (loss) to average net assets | 0.10%5 | (0.25)% | (0.24)% | (0.40)% | (0.21)%5 | |
| Ratio of expenses to average net assets: | ||||||
Total expense | 0.83%5 | 0.85% | 0.87% | 0.90% | 1.15%5 | |
Before fees waived and excluding recoupment of past waived fees | 0.83%5 | 0.85% | 0.87% | 0.87% | 1.15%5 | |
After fees waived and excluding recoupment of past waived fees6 | 0.83%5 | 0.85% | 0.87% | 0.87% | 0.90%5 | |
| Supplemental Data | ||||||
Net Assets, End of Period (000's) | $286,593 | $311,019 | $92,203 | $45,687 | $19,575 | |
Portfolio Turnover Rate | 14%4 | 47% | 34% | 67% | 46%4 | |
| 1 | Commenced operations on December 24, 2014. |
| 2 | Per share net investment income has been calculated using the average daily shares method. |
| 3 | Less than $0.005 per share. |
| 4 | Not Annualized. |
| 5 | Annualized. |
| 6 | See Note 6 to Financial Statements. |
| Meridian Funds | 48 | www.meridianfund.com |
Table of Contents
Financial Highlights
| For the Six Months Ended December 31, | For the Fiscal Year Ended June 30, | For the Period Ended June 30, | |||||
| Class A | 2018 (Unaudited) | 2018 | 2017 | 20161 | 2015 | 20142 | |
| Per Share Operating Performance | |||||||
Net asset value, beginning of period | $43.88 | $39.29 | $32.10 | $37.37 | $37.72 | $35.67 | |
| Income (loss) from investment operations | |||||||
Net investment loss3 | (0.05) | (0.21) | (0.20) | (0.29) | (0.41) | (0.21) | |
Net realized and unrealized gain (loss) | (6.28) | 7.74 | 7.59 | (1.24) | 4.33 | 2.26 | |
Net increase (decrease) from investment operations | (6.33) | 7.53 | 7.39 | (1.53) | 3.92 | 2.05 | |
| Less distributions to shareholders: | |||||||
Distributions from net realized capital gains | (5.43) | (2.94) | (0.20) | (3.74) | (4.28) | (0.00)4 | |
Total distributions to shareholders | (5.43) | (2.94) | (0.20) | (3.74) | (4.28) | (0.00)4 | |
Redemption fees | 0.00 | 0.004 | 0.004 | 0.004 | 0.01 | 0.00 | |
Net asset value, end of period | $32.12 | $43.88 | $39.29 | $32.10 | $37.37 | $37.72 | |
Total return | (14.10)%5 | 19.81% | 23.09% | (3.45)% | 11.08% | 5.75%5 | |
| Ratios to Average Net Assets | |||||||
Ratio of net investment loss to average net assets | (0.22)%6 | (0.51)% | (0.56)% | (0.89)% | (1.11)% | (0.93)%6 | |
| Ratio of expenses to average net assets: | |||||||
Total expense | 1.17%6 | 1.15% | 1.18% | 1.40% | 1.69% | 2.00%6 | |
Before fees waived and excluding recoupment of past waived fees | 1.17%6 | 1.15% | 1.18% | 1.22% | 1.69% | 2.00%6 | |
After fees waived and excluding recoupment of past waived fees7 | 1.17%6 | 1.15% | 1.18% | 1.22% | 1.55% | 1.55%6 | |
| Supplemental Data | |||||||
Net Assets, End of Period (000's) | $6,194 | $15,701 | $17,287 | $8,832 | $8,812 | $4,904 | |
Portfolio Turnover Rate | 14%5 | 47% | 34% | 67% | 46% | 96%5 | |
| 1 | On July 1, 2015, the Fund's Advisor Class Shares were redesignated as Class A Shares. |
| 2 | Commenced operations on November 15, 2013. |
| 3 | Per share net investment income has been calculated using the average daily shares method. |
| 4 | Less than $0.005 per share. |
| 5 | Not Annualized. |
| 6 | Annualized. |
| 7 | See Note 6 to Financial Statements. |
| Meridian Funds | 49 | www.meridianfund.com |
Table of Contents
Financial Highlights
| For the Six Months Ended December 31, | For the Fiscal Year Ended June 30, | For the Period Ended June 30, | |||
| Class C | 2018 (Unaudited) | 2018 | 2017 | 20161 | |
| Per Share Operating Performance | |||||
Net asset value, beginning of period | $43.56 | $39.30 | $32.34 | $37.80 | |
| Income (loss) from investment operations | |||||
Net investment loss2 | (0.20) | (0.52) | (0.48) | (0.52) | |
Net realized and unrealized gain (loss) | (6.22) | 7.72 | 7.64 | (1.20) | |
Net increase (decrease) from investment operations | (6.42) | 7.20 | 7.16 | (1.72) | |
| Less distributions to shareholders: | |||||
Distributions from net realized capital gains | (5.43) | (2.94) | (0.20) | (3.74) | |
Total distributions to shareholders | (5.43) | (2.94) | (0.20) | (3.74) | |
Redemption fees | 0.00 | 0.003 | 0.00 | 0.00 | |
Net asset value, end of period | $31.71 | $43.56 | $39.30 | $32.34 | |
Total return | (14.39)%4 | 18.90% | 22.20% | (3.95)%4 | |
| Ratios to Average Net Assets | |||||
Ratio of net investment loss to average net assets | (0.95)%5 | (1.27)% | (1.33)% | (1.68)%5 | |
Ratio of expenses to average net assets: | 1.87%5 | 1.90% | 1.92% | 1.95%5 | |
| Supplemental Data | |||||
Net Assets, End of Period (000's) | $2,743 | $3,384 | $3,095 | $804 | |
Portfolio Turnover Rate | 14%4 | 47% | 34% | 67%4 | |
| 1 | Commenced operations on July 1, 2015. |
| 2 | Per share net investment income has been calculated using the average daily shares method. |
| 3 | Less than $0.005 per share. |
| 4 | Not Annualized. |
| 5 | Annualized. |
| Meridian Funds | 50 | www.meridianfund.com |
Table of Contents
Financial Highlights
| For the Six Months Ended December 31, | For the Fiscal Year Ended June 30, | For the Period Ended June 30, | |||||
| Investor Class | 2018 (Unaudited) | 2018 | 2017 | 2016 | 2015 | 20141 | |
| Per Share Operating Performance | |||||||
Net asset value, beginning of period | $44.66 | $39.86 | $32.48 | $37.61 | $37.78 | $35.67 | |
| Income (loss) from investment operations | |||||||
Net investment loss2 | (0.01) | (0.13) | (0.12) | (0.14) | (0.27) | (0.16) | |
Net realized and unrealized gain (loss) | (6.38) | 7.87 | 7.69 | (1.26) | 4.37 | 2.27 | |
Net increase (decrease) from investment operations | (6.39) | 7.74 | 7.57 | (1.40) | 4.10 | 2.11 | |
| Less distributions to shareholders: | |||||||
Distributions from net investment income | (0.01) | 0.00 | 0.00 | 0.00 | 0.00 | 0 | |
Distributions from net realized capital gains | (5.43) | (2.94) | (0.20) | (3.74) | (4.28) | (0.00)3 | |
Total distributions to shareholders | (5.44) | (2.94) | (0.20) | (3.74) | (4.28) | (0.00)3 | |
Redemption fees | 0.003 | 0.00 | 0.01 | 0.01 | 0.01 | 0.00 | |
Net asset value, end of period | $32.83 | $44.66 | $39.86 | $32.48 | $37.61 | $37.78 | |
Total return | (13.98)%4 | 20.06% | 23.41% | (3.04)% | 11.56% | 5.92%4 | |
| Ratios to Average Net Assets | |||||||
Ratio of net investment loss to average net assets | (0.03)%5 | (0.31)% | (0.34)% | (0.43)% | (0.73)% | (0.70)%5 | |
| Ratio of expenses to average net assets: | |||||||
Total expense | 0.88%5 | 0.95% | 0.94% | 0.97% | 1.16% | 1.30%5 | |
Before fees waived and excluding recoupment of past waived fees | 0.88%5 | 0.95% | 0.94% | 0.97% | 1.16% | 1.30%5 | |
After fees waived and excluding recoupment of past waived fees6 | 0.88%5 | 0.95% | 0.94% | 0.97% | 1.16% | 1.30%5 | |
| Supplemental Data | |||||||
Net Assets, End of Period (000's) | $226,884 | $103,643 | $89,177 | $31,714 | $42,062 | $18,749 | |
Portfolio Turnover Rate | 14%4 | 47% | 34% | 67% | 46% | 96%4 | |
| 1 | Commenced operations on November 15, 2013. |
| 2 | Per share net investment income has been calculated using the average daily shares method. |
| 3 | Less than $0.005 per share. |
| 4 | Not Annualized. |
| 5 | Annualized. |
| 6 | See Note 6 to Financial Statements. |
| Meridian Funds | 51 | www.meridianfund.com |
Table of Contents
Financial Highlights
| For the Six Months Ended December 31, | For the Fiscal Year Ended June 30, | |||||
| Legacy Class | 2018 (Unaudited) | 2018 | 2017 | 2016 | 2015 | 2014 |
| Per Share Operating Performance | ||||||
Net asset value - beginning of period | $45.23 | $39.79 | $32.42 | $40.44 | $45.52 | $37.20 |
| Income (loss) from investment operations | ||||||
Net investment income (loss)1 | 0.11 | 0.46 | (0.02) | (0.05) | (0.00)2 | 0.01 |
Net realized and unrealized gain (loss) | (6.55) | 9.39 | 7.58 | (2.60) | 2.66 | 8.63 |
Net increase (decrease) from investment operations | (6.44) | 9.85 | 7.56 | (2.65) | 2.66 | 8.64 |
| Less distributions to shareholders: | ||||||
Distributions from net investment income | (0.49) | 0.00 | (0.01) | (0.02) | (0.09) | (0.18) |
Distributions from net realized capital gains | (7.40) | (4.41) | (0.18) | (5.35) | (7.65) | (0.14) |
Total distributions to shareholders | (7.89) | (4.41) | (0.19) | (5.37) | (7.74) | (0.32) |
Redemption fees | 0.002 | 0.00 | 0.002 | 0.002 | 0.002 | 0.00 |
Net asset value, end of period | $30.90 | $45.23 | $39.79 | $32.42 | $40.44 | $45.52 |
Total return | (13.99)%3 | 25.73% | 23.36% | (6.33)% | 6.84% | 23.31%3 |
| Ratios to Average Net Assets | ||||||
Ratio of net investment income (loss) to average net assets | 0.47%4 | 1.07% | (0.05)% | (0.14)% | (0.01)% | 0.01% |
Ratio of expenses to average net assets: | 1.12%4 | 1.12% | 1.13% | 1.13% | 1.11% | 1.13% |
| Supplemental Data | ||||||
Net Assets, End of Period (000's) | $538,849 | $672,035 | $588,906 | $536,799 | $677,138 | $764,882 |
Portfolio Turnover Rate | 26%3 | 49% | 54% | 73% | 76% | 67% |
| 1 | Per share net investment income has been calculated using the average daily shares method. |
| 2 | Less than $0.005 per share. |
| 3 | Not Annualized. |
| 4 | Annualized. |
| Meridian Funds | 52 | www.meridianfund.com |
Table of Contents
Financial Highlights
| For the Six Months Ended December 31, | For the Fiscal Year Ended June 30, | For the Period Ended June 30, | |||||
| Class A | 2018 (Unaudited) | 2018 | 2017 | 20161 | 2015 | 20142 | |
| Per Share Operating Performance | |||||||
Net asset value, beginning of period | $44.26 | $39.19 | $32.08 | $40.22 | $45.41 | $42.64 | |
| Income (loss) from investment operations | |||||||
Net investment income (loss)3 | 0.03 | 0.04 | (0.19) | (0.21) | (0.22) | (0.08) | |
Net realized and unrealized gain (loss) | (6.39) | 9.44 | 7.48 | (2.58) | 2.68 | 3.02 | |
Net increase (decrease) from investment operations | (6.36) | 9.48 | 7.29 | (2.79) | 2.46 | 2.94 | |
| Less distributions to shareholders: | |||||||
Distributions from net investment income | (0.37) | 0.00 | 0.00 | 0.00 | 0.00 | (0.17) | |
Distributions from net realized capital gains | (7.40) | (4.41) | (0.18) | (5.35) | (7.65) | 0.00 | |
Total distributions to shareholders | (7.77) | (4.41) | (0.18) | (5.35) | (7.65) | (0.17) | |
Redemption fees | 0.004 | 0.00 | 0.00 | 0.00 | 0.00 | 0.00 | |
Net asset value, end of period | $30.13 | $44.26 | $39.19 | $32.08 | $40.22 | $45.41 | |
Total return | (14.13)%5 | 25.17% | 22.76% | (6.75)% | 6.38% | 6.91%5 | |
| Ratios to Average Net Assets | |||||||
Ratio of net investment income (loss) to average net assets | 0.12%6 | 0.09% | (0.53)% | (0.60)% | (0.52)% | (0.30)%6 | |
| Ratio of expenses to average net assets: | |||||||
Total expense | 1.44%6 | 1.60% | 1.60% | 1.60% | 3.46% | 7.46%6 | |
Before fees waived and excluding recoupment of past waived fees | 1.44%6 | 1.41% | 1.42% | 1.46% | 3.46% | 7.46%6 | |
After fees waived and excluding recoupment of past waived fees7 | 1.44%6 | 1.41% | 1.42% | 1.46% | 1.60% | 1.60%6 | |
| Supplemental Data | |||||||
Net Assets, End of Period (000's) | $3,972 | $7,097 | $583 | $431 | $622 | $462 | |
Portfolio Turnover Rate | 26%5 | 49% | 54% | 73% | 76% | 67%5 | |
| 1 | On July 1, 2015, the Fund's Advisor Class Shares were redesignated as Class A Shares. |
| 2 | Commenced operations on November 15, 2013. |
| 3 | Per share net investment income has been calculated using the average daily shares method. |
| 4 | Less than $0.005 per share. |
| 5 | Not Annualized. |
| 6 | Annualized. |
| 7 | See Note 6 to Financial Statements. |
| Meridian Funds | 53 | www.meridianfund.com |
Table of Contents
Financial Highlights
| For the Six Months Ended December 31, | For the Fiscal Year Ended June 30, | For the Period Ended June 30, | |||
| Class C | 2018 (Unaudited) | 2018 | 2017 | 20161 | |
| Per Share Operating Performance | |||||
Net asset value, beginning of period | $43.77 | $39.00 | $32.09 | $40.54 | |
| Income (loss) from investment operations | |||||
Net investment loss2 | (0.11) | (0.05) | (0.39) | (0.36) | |
Net realized and unrealized gain (loss) | (6.31) | 9.23 | 7.48 | (2.74) | |
Net increase (decrease) from investment operations | (6.42) | 9.18 | 7.09 | (3.10) | |
| Less distributions to shareholders: | |||||
Distributions from net investment income | (0.22) | 0.00 | 0.00 | 0.00 | |
Distributions from net realized capital gains | (7.40) | (4.41) | (0.18) | (5.35) | |
Total distributions to shareholders | (7.62) | (4.41) | (0.18) | (5.35) | |
Redemption fees | 0.00 | 0.00 | 0.00 | 0.00 | |
Net asset value, end of period | $29.73 | $43.77 | $39.00 | $32.09 | |
Total return | (14.42)%3 | 24.46% | 22.12% | (7.50)%3 | |
| Ratios to Average Net Assets | |||||
Ratio of net investment loss to average net assets | (0.54)%4 | (0.13)% | (1.05)% | (1.11)%4 | |
Ratio of expenses to average net assets: | 2.14%4 | 2.14% | 2.13% | 2.19%4 | |
| Supplemental Data | |||||
Net Assets, End of Period (000's) | $42 | $25 | $43 | $14 | |
Portfolio Turnover Rate | 26%3 | 49% | 54% | 73%3 | |
| 1 | Commenced operations on July 1, 2015. |
| 2 | Per share net investment income has been calculated using the average daily shares method. |
| 3 | Not Annualized. |
| 4 | Annualized. |
| Meridian Funds | 54 | www.meridianfund.com |
Table of Contents
Financial Highlights
| For the Six Months Ended December 31, | For the Fiscal Year Ended June 30, | For the Period Ended June 30, | |||||
| Investor Class | 2018 (Unaudited) | 2018 | 2017 | 2016 | 2015 | 20141 | |
| Per Share Operating Performance | |||||||
Net asset value, beginning of period | $44.90 | $39.61 | $32.34 | $40.40 | $45.47 | $42.64 | |
| Income (loss) from investment operations | |||||||
Net investment income (loss)2 | 0.09 | 0.35 | (0.10) | (0.13) | (0.09) | (0.02) | |
Net realized and unrealized gain (loss) | (6.50) | 9.35 | 7.55 | (2.59) | 2.66 | 3.03 | |
Net increase (decrease) from investment operations | (6.41) | 9.70 | 7.45 | (2.72) | 2.57 | 3.01 | |
| Less distributions to shareholders: | |||||||
Distributions from net investment income | (0.42) | 0.00 | 0.00 | 0.00 | 0.00 | (0.18) | |
Distributions from net realized capital gains | (7.40) | (4.41) | (0.18) | (5.35) | (7.65) | 0.00 | |
Total distributions to shareholders | (7.82) | (4.41) | (0.18) | (5.35) | (7.65) | (0.18) | |
Redemption fees | 0.00 | 0.00 | 0.00 | 0.01 | 0.01 | 0.00 | |
Net asset value, end of period | $30.67 | $44.90 | $39.61 | $32.34 | $40.40 | $45.47 | |
Total return | (14.02)%3 | 25.44% | 23.07% | (6.50)% | 6.67% | 7.08%3 | |
| Ratios to Average Net Assets | |||||||
Ratio of net investment income (loss) to average net assets | 0.40%4 | 0.81% | (0.27)% | (0.40)% | (0.21)% | (0.09)%4 | |
| Ratio of expenses to average net assets: | |||||||
Total expense | 1.19%4 | 1.35% | 1.35% | 1.35% | 2.34% | 3.51%4 | |
Before fees waived and excluding recoupment of past waived fees | 1.19%4 | 1.18% | 1.23% | 1.24% | 2.34% | 3.51%4 | |
After fees waived and excluding recoupment of past waived fees5 | 1.19%4 | 1.18% | 1.23% | 1.24% | 1.35% | 1.35%4 | |
| Supplemental Data | |||||||
Net Assets, End of Period (000's) | $2,899 | $3,916 | $2,743 | $1,471 | $1,008 | $1,564 | |
Portfolio Turnover Rate | 26%3 | 49% | 54% | 73% | 76% | 67%3 | |
| 1 | Commenced operations on November 15, 2013. |
| 2 | Per share net investment income has been calculated using the average daily shares method. |
| 3 | Not Annualized. |
| 4 | Annualized. |
| 5 | See Note 6 to Financial Statements. |
| Meridian Funds | 55 | www.meridianfund.com |
Table of Contents
Financial Highlights
| For the Six Months Ended December 31, | For the Fiscal Year Ended June 30, | |||||
| Legacy Class | 2018 (Unaudited) | 2018 | 2017 | 2016 | 2015 | 2014 |
| Per Share Operating Performance | ||||||
Net asset value - beginning of period | $18.64 | $13.59 | $11.60 | $12.51 | $14.59 | $12.35 |
| Income (loss) from investment operations | ||||||
Net investment income (loss)1 | (0.12) | 0.06 | 0.17 | 0.09 | 0.12 | 0.24 |
Net realized and unrealized gain (loss) | (2.78) | 5.18 | 1.92 | (0.51) | 0.47 | 2.22 |
Net increase (decrease) from investment operations | (2.90) | 5.24 | 2.09 | (0.42) | 0.59 | 2.46 |
| Less distributions to shareholders: | ||||||
Distributions from net investment income | (0.09) | (0.19) | (0.10) | 0.00 | (0.25) | (0.22) |
Distributions from net realized capital gains | (1.55) | 0.00 | 0.00 | (0.49) | (2.42) | 0.00 |
Total distributions to shareholders | (1.64) | (0.19) | (0.10) | (0.49) | (2.67) | (0.22) |
Redemption fees | 0.00 | 0.002 | 0.002 | 0.002 | 0.002 | 0.002 |
Net asset value, end of period | $14.10 | $18.64 | $13.59 | $11.60 | $12.51 | $14.59 |
Total return | (14.88)%3 | 38.78% | 18.06% | (3.35)% | 4.46% | 20.04%3 |
| Ratios to Average Net Assets | ||||||
Ratio of net investment income (loss) to average net assets | (1.33)%4 | 0.36% | 1.35% | 0.82% | 0.88% | 1.75% |
Ratio of expenses to average net assets: | ||||||
Total expense | 1.44%4 | 1.44% | 1.38% | 1.29% | 1.33% | 1.37% |
Before fees waived and excluding recoupment of past waived fees | 1.44%4 | 1.40% | 1.33% | 1.27% | 1.33% | 1.37% |
After fees waived and excluding recoupment of past waived fees5 | 1.44%4 | 1.40% | 1.33% | 1.27% | 1.25% | 1.25% |
After fees waived and excluding recoupment of past waived fees and dividend expenses | 1.15%4 | 1.17% | 1.20% | 1.23% | 1.25% | 1.25% |
| Supplemental Data | ||||||
Net Assets, End of Period (000's) | $45,596 | $56,631 | $46,120 | $45,251 | $53,125 | $33,649 |
Portfolio Turnover Rate | 21%3 | 49% | 44% | 57% | 266% | 35% |
| 1 | Per share net investment income has been calculated using the average daily shares method. |
| 2 | Less than $0.005 per share. |
| 3 | Not Annualized. |
| 4 | Annualized. |
| 5 | See Note 6 to Financial Statements. |
| Meridian Funds | 56 | www.meridianfund.com |
Table of Contents
Financial Highlights
| For the Six Months Ended December 31, | For the Fiscal Year Ended June 30, | For the Period Ended June 30, | |||||
| Class A | 2018 (Unaudited) | 2018 | 2017 | 20161 | 2015 | 20142 | |
| Per Share Operating Performance | |||||||
Net asset value, beginning of period | $18.48 | $13.52 | $11.54 | $12.50 | $14.58 | $13.87 | |
| Income (loss) from investment operations | |||||||
Net investment income (loss)3 | (0.15) | (0.02) | 0.16 | 0.06 | (0.02) | 0.13 | |
Net realized and unrealized gain (loss) | (2.75) | 5.16 | 1.88 | (0.53) | 0.58 | 0.78 | |
Net increase (decrease) from investment operations | (2.90) | 5.14 | 2.04 | (0.47) | 0.56 | 0.91 | |
| Less distributions to shareholders: | |||||||
Distributions from net investment income | 0.00 | (0.18) | (0.06) | 0.00 | (0.22) | (0.20) | |
Distributions from net realized capital gains | (1.55) | 0.00 | 0.00 | (0.49) | (2.42) | 0.00 | |
Total distributions to shareholders | (1.55) | (0.18) | (0.06) | (0.49) | (2.64) | (0.20) | |
Redemption fees | 0.004 | 0.004 | 0.00 | 0.00 | 0.00 | 0.00 | |
Net asset value, end of period | $14.03 | $18.48 | $13.52 | $11.54 | $12.50 | $14.58 | |
Total return | (15.05)%5 | 38.24% | 17.69% | (3.76)% | 4.24% | 6.69%5 | |
| Ratios to Average Net Assets | |||||||
Ratio of net investment income (loss) to average net assets | (1.69)%6 | (0.11)% | 1.25% | 0.50% | (0.11)% | 1.55%6 | |
| Ratio of expenses to average net assets: | |||||||
Total expense | 1.82%6 | 1.84% | 1.73% | 1.69% | 7.46% | 132.38%6 | |
Before fees waived and excluding recoupment of past waived fees | 1.82%6 | 1.78% | 1.69% | 1.69% | 7.46% | 132.38%6 | |
After fees waived and excluding recoupment of past waived fees7 | 1.82%6 | 1.78% | 1.69% | 1.64% | 1.60% | 1.60%6 | |
After fees waived and excluding recoupment of past waived fees and dividend expenses | 1.52%6 | 1.55% | 1.56% | 1.60% | 1.60% | 1.60%6 | |
| Supplemental Data | |||||||
Net Assets, End of Period (000's) | $2,854 | $5,730 | $3,321 | $502 | $501 | $13 | |
Portfolio Turnover Rate | 21%5 | 49% | 44% | 57% | 266% | 35%5 | |
| 1 | On July 1, 2015, the Fund's Advisor Class Shares were redesignated as Class A Shares. |
| 2 | Commenced operations on November 15, 2013. |
| 3 | Per share net investment income has been calculated using the average daily shares method. |
| 4 | Less than $0.005 per share. |
| 5 | Not Annualized. |
| 6 | Annualized. |
| 7 | See Note 6 to Financial Statements. |
| Meridian Funds | 57 | www.meridianfund.com |
Table of Contents
Financial Highlights
| For the Six Months Ended December 31, | For the Fiscal Year Ended June 30, | For the Period Ended June 30, | |||
| Class C | 2018 (Unaudited) | 2018 | 2017 | 20161 | |
| Per Share Operating Performance | |||||
Net asset value, beginning of period | $18.44 | $13.47 | $11.50 | $12.56 | |
| Income (loss) from investment operations | |||||
Net investment income (loss)2 | (0.19) | (0.09) | 0.07 | 0.00 | |
Net realized and unrealized gain (loss) | (2.74) | 5.14 | 1.91 | (0.57) | |
Net increase (decrease) from investment operations | (2.93) | 5.05 | 2.00 | (0.57) | |
| Less distributions to shareholders: | |||||
Distributions from net investment income | 0.00 | (0.08) | (0.01) | 0.00 | |
Distributions from net realized capital gains | (1.55) | 0.00 | 0.00 | (0.49) | |
Total distributions to shareholders | (1.55) | (0.08) | (0.01) | (0.49) | |
Redemption fees | 0.00 | 0.003 | 0.00 | 0.00 | |
Net asset value, end of period | $13.96 | $18.44 | $13.47 | $11.50 | |
Total return | (15.25)%4 | 37.61% | 17.26% | (4.55)%4 | |
| Ratios to Average Net Assets | |||||
Ratio of net investment income (loss) to average net assets | (2.18)%5 | (0.55)% | 0.59% | 0.04%5 | |
| Ratio of expenses to average net assets: | |||||
Total expense | 2.30%5 | 2.24% | 2.33% | 2.33%5 | |
Before fees waived and excluding recoupment of past waived fees | 2.22%5 | 2.25% | 2.33% | 2.33%5 | |
After fees waived and excluding recoupment of past waived fees6 | 2.22%5 | 2.24% | 2.13% | 2.04%5 | |
After fees waived and excluding recoupment of past waived fees and dividend expenses | 1.93%5 | 2.00% | 2.00% | 2.00%5 | |
| Supplemental Data | |||||
Net Assets, End of Period (000's) | $1 | $2 | $1 | $1 | |
Portfolio Turnover Rate | 21%4 | 49% | 44% | 57%4 | |
| 1 | Commenced operations on July 1, 2015. |
| 2 | Per share net investment income has been calculated using the average daily shares method. |
| 3 | Less than $0.005 per share. |
| 4 | Not Annualized. |
| 5 | Annualized. |
| 6 | See Note 6 to Financial Statements. |
| Meridian Funds | 58 | www.meridianfund.com |
Table of Contents
Financial Highlights
| For the Six Months Ended December 31, | For the Fiscal Year Ended June 30, | For the Period Ended June 30, | |||||
| Investor Class | 2018 (Unaudited) | 2018 | 2017 | 2016 | 2015 | 20141 | |
| Per Share Operating Performance | |||||||
Net asset value, beginning of period | $18.61 | $13.60 | $11.60 | $12.53 | $14.60 | $13.87 | |
| Income (loss) from investment operations | |||||||
Net investment income (loss)2 | (0.13) | 0.09 | 0.16 | 0.08 | (0.02) | 0.15 | |
Net realized and unrealized gain (loss) | (2.78) | 5.10 | 1.92 | (0.52) | 0.61 | 0.79 | |
Net increase (decrease) from investment operations | (2.91) | 5.19 | 2.08 | (0.44) | 0.59 | 0.94 | |
| Less distributions to shareholders: | |||||||
Distributions from net investment income | (0.08) | (0.18) | (0.08) | 0.00 | (0.24) | (0.21) | |
Distributions from net realized capital gains | (1.55) | 0.00 | 0.00 | (0.49) | (2.42) | 0.00 | |
Total distributions to shareholders | (1.63) | (0.18) | (0.08) | (0.49) | (2.66) | (0.21) | |
Redemption fees | 0.003 | 0.003 | 0.00 | 0.003 | 0.00 | 0.00 | |
Net asset value, end of period | $14.07 | $18.61 | $13.60 | $11.60 | $12.53 | $14.60 | |
Total return | (14.91)%4 | 38.34% | 17.98% | (3.51)% | 4.44% | 6.87%4 | |
| Ratios to Average Net Assets | |||||||
Ratio of net investment income (loss) to average net assets | (1.46)%5 | 0.58% | 1.24% | 0.68% | (0.13)% | 1.72%5 | |
| Ratio of expenses to average net assets: | |||||||
Total expense | 1.48%5 | 1.59% | 1.48% | 1.39% | 16.83% | 39.23%5 | |
Before fees waived and excluding recoupment of past waived fees | 1.48%5 | 1.47% | 1.39% | 1.37% | 16.83% | 39.23%5 | |
After fees waived and excluding recoupment of past waived fees6 | 1.48%5 | 1.47% | 1.39% | 1.37% | 1.35% | 1.35%5 | |
After fees waived and excluding recoupment of past waived fees and dividend expenses | 1.18%5 | 1.24% | 1.26% | 1.32% | 1.35% | 1.35%5 | |
| Supplemental Data | |||||||
Net Assets, End of Period (000's) | $741 | $1,060 | $246 | $252 | $335 | $45 | |
Portfolio Turnover Rate | 21%4 | 49% | 44% | 57% | 266% | 35%4 | |
| 1 | Commenced operations on November 15, 2013. |
| 2 | Per share net investment income has been calculated using the average daily shares method. |
| 3 | Less than $0.005 per share. |
| 4 | Not Annualized. |
| 5 | Annualized. |
| 6 | See Note 6 to Financial Statements. |
| Meridian Funds | 59 | www.meridianfund.com |
Table of Contents
Financial Highlights
| For the Six Months Ended December 31, | For the Fiscal Year Ended June 30, | For the Period Ended June 30, | |||||
| Legacy Class | 2018 (Unaudited) | 2018 | 2017 | 2016 | 2015 | 20141 | |
| Per Share Operating Performance | |||||||
Net asset value, beginning of period | $18.03 | $15.07 | $11.87 | $12.98 | $11.65 | $10.00 | |
| Income (loss) from investment operations | |||||||
Net investment loss2 | (0.03) | (0.09) | (0.09) | (0.06) | (0.09) | (0.04) | |
Net realized and unrealized gain (loss) | (1.95) | 3.72 | 3.29 | (0.87) | 1.72 | 1.69 | |
Net increase (decrease) from investment operations | (1.98) | 3.63 | 3.20 | (0.93) | 1.63 | 1.65 | |
| Less distributions to shareholders: | |||||||
Distributions from net realized capital gains | (1.78) | (0.67) | 0.00 | (0.18) | (0.30) | 0.00 | |
Total distributions to shareholders | (1.78) | (0.67) | 0.00 | (0.18) | (0.30) | 0.00 | |
Redemption fees | 0.003 | 0.003 | 0.003 | 0.003 | 0.003 | 0.00 | |
Net asset value, end of period | $14.27 | $18.03 | $15.07 | $11.87 | $12.98 | $11.65 | |
Total return | (10.69)%4 | 24.66% | 26.96% | (7.06)% | 14.23% | 16.50%4 | |
| Ratios to Average Net Assets | |||||||
Ratio of net investment loss to average net assets | (0.30)%5 | (0.55)% | (0.63)% | (0.52)% | (0.69)% | (0.61)%5 | |
Ratio of expenses to average net assets: | |||||||
Total expense | 1.13%5 | 1.15% | 1.20% | 1.20% | 1.24% | 2.35%5 | |
Before fees waived and excluding recoupment of past waived fees | 1.13%5 | 1.13% | 1.14% | 1.20% | 1.24% | 2.35%5 | |
After fees waived and excluding recoupment of past waived fees6 | 1.13%5 | 1.13% | 1.14% | 1.20% | 1.20% | 1.20%5 | |
| Supplemental Data | |||||||
Net Assets, End of Period (000's) | $37,273 | $54,856 | $66,777 | $44,001 | $59,459 | $9,839 | |
Portfolio Turnover Rate | 23%4 | 44% | 39% | 62% | 45% | 78%4 | |
| 1 | Commenced operations on December 16, 2013. |
| 2 | Per share net investment income has been calculated using the average daily shares method. |
| 3 | Less than $0.005 per share. |
| 4 | Not Annualized. |
| 5 | Annualized. |
| 6 | See Note 6 to Financial Statements. |
| Meridian Funds | 60 | www.meridianfund.com |
Table of Contents
Financial Highlights
| For the Six Months Ended December 31, | For the Fiscal Year Ended June 30, | For the Period Ended June 30, | ||||
| Institutional Class | 2018 (Unaudited) | 2018 | 2017 | 2016 | 20151 | |
| Per Share Operating Performance | ||||||
Net asset value, beginning of period | $18.09 | $15.11 | $11.88 | $12.98 | $12.23 | |
| Income (loss) from investment operations | ||||||
Net investment loss2 | (0.03) | (0.08) | (0.07) | (0.05) | (0.02) | |
Net realized and unrealized gain (loss) | (1.96) | 3.73 | 3.30 | (0.87) | 0.77 | |
Net increase (decrease) from investment operations | (1.99) | 3.65 | 3.23 | (0.92) | 0.75 | |
| Less distributions to shareholders: | ||||||
Distributions from net realized capital gains | (1.78) | (0.67) | 0.00 | (0.18) | 0.00 | |
Total distributions to shareholders | (1.78) | (0.67) | 0.00 | (0.18) | 0.00 | |
Redemption fees | 0.003 | 0.003 | 0.003 | 0.003 | 0.00 | |
Net asset value, end of period | $14.32 | $18.09 | $15.11 | $11.88 | $12.98 | |
Total return | (10.66)%4 | 24.73% | 27.19% | (6.98)% | 6.13%4 | |
| Ratios to Average Net Assets | ||||||
Ratio of net investment loss to average net assets | (0.30)%5 | (0.50)% | (0.52)% | (0.45)% | (0.29)%5 | |
| Ratio of expenses to average net assets: | ||||||
Total expense | 1.10%5 | 1.10% | 1.14% | 1.22% | 2.03%5 | |
Before fees waived and excluding recoupment of past waived fees | 1.08%5 | 1.11% | 1.14% | 1.22% | 2.03%5 | |
After fees waived and excluding recoupment of past waived fees6 | 1.08%5 | 1.10% | 1.10% | 1.10% | 1.10%5 | |
| Supplemental Data | ||||||
Net Assets, End of Period (000's) | $675,190 | $728,538 | $253,447 | $52,784 | $13,035 | |
Portfolio Turnover Rate | 23%4 | 44% | 39% | 62% | 44%4 | |
| 1 | Commenced operations on December 24, 2014. |
| 2 | Per share net investment income has been calculated using the average daily shares method. |
| 3 | Less than $0.005 per share. |
| 4 | Not Annualized. |
| 5 | Annualized. |
| 6 | See Note 6 to Financial Statements. |
| Meridian Funds | 61 | www.meridianfund.com |
Table of Contents
Financial Highlights
| For the Six Months Ended December 31, | For the Fiscal Year Ended June 30, | For the Period Ended June 30, | |||||
| Class A | 2018 (Unaudited) | 2018 | 2017 | 20161 | 2015 | 20142 | |
| Per Share Operating Performance | |||||||
Net asset value, beginning of period | $17.76 | $14.89 | $11.76 | $12.91 | $11.63 | $10.00 | |
| Income (loss) from investment operations | |||||||
Net investment loss3 | (0.06) | (0.13) | (0.12) | (0.10) | (0.13) | (0.06) | |
Net realized and unrealized gain (loss) | (1.92) | 3.67 | 3.25 | (0.87) | 1.71 | 1.69 | |
Net increase (decrease) from investment operations | (1.98) | 3.54 | 3.13 | (0.97) | 1.58 | 1.63 | |
| Less distributions to shareholders: | |||||||
Distributions from net realized capital gains | (1.78) | (0.67) | 0.00 | (0.18) | (0.30) | 0.00 | |
Total distributions to shareholders | (1.78) | (0.67) | 0.00 | (0.18) | (0.30) | 0.00 | |
Redemption fees | 0.004 | 0.004 | 0.004 | 0.004 | 0.004 | 0.00 | |
Net asset value, end of period | $14.00 | $17.76 | $14.89 | $11.76 | $12.91 | $11.63 | |
Total return | (10.80)%5 | 24.34% | 26.62% | (7.41)% | 13.82% | 16.30%5 | |
| Ratios to Average Net Assets | |||||||
Ratio of net investment loss to average net assets | (0.62)%6 | (0.82)% | (0.92)% | (0.89)% | (1.09)% | (1.01)%6 | |
| Ratio of expenses to average net assets: | |||||||
Total expense | 1.43%6 | 1.41% | 1.49% | 1.60% | 1.69% | 2.99%6 | |
Before fees waived and excluding recoupment of past waived fees | 1.43%6 | 1.41% | 1.45% | 1.56% | 1.69% | 2.99%6 | |
After fees waived and excluding recoupment of past waived fees7 | 1.43%6 | 1.41% | 1.45% | 1.56% | 1.60% | 1.60%6 | |
| Supplemental Data | |||||||
Net Assets, End of Period (000's) | $52,951 | $89,306 | $82,031 | $52,173 | $45,186 | $6,524 | |
Portfolio Turnover Rate | 23%5 | 44% | 39% | 62% | 44% | 78%5 | |
| 1 | On July 1, 2015, the Fund's Advisor Class Shares were redesignated as Class A Shares. |
| 2 | Commenced operations on November 15, 2013. |
| 3 | Per share net investment income has been calculated using the average daily shares method. |
| 4 | Less than $0.005 per share. |
| 5 | Not Annualized. |
| 6 | Annualized. |
| 7 | See Note 6 to Financial Statements. |
| Meridian Funds | 62 | www.meridianfund.com |
Table of Contents
Financial Highlights
| For the Six Months Ended December 31, | For the Fiscal Year Ended June 30, | For the Period Ended June 30, | |||
| Class C | 2018 (Unaudited) | 2018 | 2017 | 20161 | |
| Per Share Operating Performance | |||||
Net asset value, beginning of period | $17.46 | $14.76 | $11.74 | $12.97 | |
| Income (loss) from investment operations | |||||
Net investment loss2 | (0.12) | (0.25) | (0.22) | (0.17) | |
Net realized and unrealized gain (loss) | (1.88) | 3.62 | 3.24 | (0.88) | |
Net increase (decrease) from investment operations | (2.00) | 3.37 | 3.02 | (1.05) | |
| Less distributions to shareholders: | |||||
Distributions from net realized capital gains | (1.78) | (0.67) | 0.00 | (0.18) | |
Total distributions to shareholders | (1.78) | (0.67) | 0.00 | (0.18) | |
Redemption fees | 0.003 | 0.00 | 0.003 | 0.003 | |
Net asset value, end of period | $13.68 | $17.46 | $14.76 | $11.74 | |
Total return | (11.16)%4 | 23.39% | 25.72% | (8.00)%4 | |
| Ratios to Average Net Assets | |||||
Ratio of net investment loss to average net assets | (1.39)%5 | (1.56)% | (1.60)% | (1.50)%5 | |
| Ratio of expenses to average net assets: | |||||
Total expense | 2.18%5 | 2.15% | 2.17% | 2.28%5 | |
Before fees waived and excluding recoupment of past waived fees | 2.18%5 | 2.15% | 2.16% | 2.28%5 | |
After fees waived and excluding recoupment of past waived fees6 | 2.18%5 | 2.15% | 2.16% | 2.25%5 | |
| Supplemental Data | |||||
Net Assets, End of Period (000's) | $17,490 | $31,174 | $44,593 | $23,689 | |
Portfolio Turnover Rate | 23%4 | 44% | 39% | 62%4 | |
| 1 | Commenced operations on July 1, 2015. |
| 2 | Per share net investment income has been calculated using the average daily shares method. |
| 3 | Less than $0.005 per share. |
| 4 | Not Annualized. |
| 5 | Annualized. |
| 6 | See Note 6 to Financial Statements. |
| Meridian Funds | 63 | www.meridianfund.com |
Table of Contents
Financial Highlights
| For the Six Months Ended December 31, | For the Fiscal Year Ended June 30, | For the Period Ended June 30, | |||||
| Investor Class | 2018 (Unaudited) | 2018 | 2017 | 2016 | 2015 | 20141 | |
| Per Share Operating Performance | |||||||
Net asset value, beginning of period | $17.99 | $15.05 | $11.85 | $12.97 | $11.65 | $10.00 | |
| Income (loss) from investment operations | |||||||
Net investment loss2 | (0.03) | (0.09) | (0.09) | (0.07) | (0.10) | (0.04) | |
Net realized and unrealized gain (loss) | (1.94) | 3.70 | 3.29 | (0.87) | 1.73 | 1.69 | |
Net increase (decrease) from investment operations | (1.97) | 3.61 | 3.20 | (0.94) | 1.63 | 1.65 | |
| Less distributions to shareholders: | |||||||
Distributions from net investment income | 0.00 | 0.00 | 0.00 | 0.00 | (0.01) | 0.00 | |
Distributions from net realized capital gains | (1.78) | (0.67) | 0.00 | (0.18) | (0.30) | 0.00 | |
Total distributions to shareholders | (1.78) | (0.67) | 0.00 | (0.18) | (0.31) | 0.00 | |
Redemption fees | 0.003 | 0.003 | 0.003 | 0.003 | 0.00 | 0.00 | |
Net asset value, end of period | $14.24 | $17.99 | $15.05 | $11.85 | $12.97 | $11.65 | |
Total return | (10.66)%4 | 24.56% | 27.00% | (7.15)% | 14.14% | 16.50%4 | |
| Ratios to Average Net Assets | |||||||
Ratio of net investment loss to average net assets | (0.35)%5 | (0.57)% | (0.69)% | (0.61)% | (0.83)% | (0.70)%5 | |
| Ratio of expenses to average net assets: | |||||||
Total expense | 1.14%5 | 1.16% | 1.26% | 1.32% | 1.33% | 3.63%5 | |
Before fees waived and excluding recoupment of past waived fees | 1.14%5 | 1.16% | 1.26% | 1.32% | 1.33% | 3.63%5 | |
After fees waived and excluding recoupment of past waived fees6 | 1.14%5 | 1.16% | 1.26% | 1.32% | 1.33% | 1.35%5 | |
| Supplemental Data | |||||||
Net Assets, End of Period (000's) | $760,786 | $853,794 | $450,402 | $162,096 | $131,211 | $2,135 | |
Portfolio Turnover Rate | 23%4 | 44% | 39% | 62% | 44% | 78%4 | |
| 1 | Commenced operations on November 15, 2013. |
| 2 | Per share net investment income has been calculated using the average daily shares method. |
| 3 | Less than $0.005 per share. |
| 4 | Not Annualized. |
| 5 | Annualized. |
| 6 | See Note 6 to Financial Statements. |
| Meridian Funds | 64 | www.meridianfund.com |
Table of Contents
Notes to Financial Statements
| 1. | Organization and Significant Accounting Policies:Meridian Fund, Inc. (the “Meridian Funds” or the “Company”) comprises the following separate series: the Meridian Growth Fund (the “Growth Fund”), the Meridian Contrarian Fund (the “Contrarian Fund”), the Meridian Enhanced Equity Fund (the “Enhanced Equity Fund”) (formerly Meridian Equity Income Fund), and the Meridian Small Cap Growth Fund (the “Small Cap Growth Fund”) (each a “Fund” and collectively, the “Funds”). The Company is registered as an open-end investment company under the Investment Company Act of 1940 and is organized as a Maryland corporation. Each Fund is classified as a "diversified" management investment company. |
| Meridian Funds offer five share classes: Legacy Class Shares, Investor Class Shares, Class A Shares, Class C Shares and Institutional Class Shares. Prior to July 1, 2015, Class A Shares were known as Advisor Class Shares. As of December 31, 2018, Institutional Class Shares of the Enhanced Equity Fund and Contrarian Fund are not currently being offered for sale. Effective June 15, 2017, Investor Class, Class A, and Class C Shares of the Growth Fund are closed to new investors. Effective June 29, 2018, Investor Class, Class A, and Class C Shares of the Small Cap Growth Fund are closed to new investors. Legacy Class Shares are available to investors who have continuously held an investment in any Meridian Fund prior to November 15, 2013. Effective November 1, 2018, direct initial purchases of Legacy Class Shares are permitted in the Meridian Enhanced Equity Fund. Institutional Class Shares are available to certain eligible investors including endowments, foundations and qualified retirement plans. Class A, Class C and Investor Class Shares are available for purchase through financial intermediary platforms. Class A Shares are subject to a maximum initial sales charge (front-end load) of 5.75%. Class C Shares are subject to a 1.00% contingent deferred sales charge ("CDSC") if redeemed within one year of purchase. Investor Class Shares are not subject to frond-end load or CDSC and require a higher minimum initial investment. All Classes have identical rights and privileges with respect to the Fund in general, and exclusive voting rights with respect to Class specific matters. Net Asset Value ("NAV") per share may differ by class due to each class having its own expenses directly attributable to that class. Investor Class, Class A and Class C Shares are subject to shareholder servicing and sub-transfer agent fees. Class A and Class C Shares are also subject to certain expenses related to the distribution of these shares. See Note 6 for further information on additional share classes. | |
| The primary investment objectives of the Growth Fund, Contrarian Fund, and Enhanced Equity Fund are to seek long-term growth of capital. Prior to November 1, 2018, the primary objective of the Enhanced Equity Fund was to seek long-term growth of capital along with income as a component of total return. | |
| The primary investment objective of the Small Cap Growth Fund is to seek long-term growth of capital by investing primarily in equity securities of small capitalization companies. | |
| The following significant accounting policies are consistently followed by the Funds in the preparation of their financial statements in conformity with accounting principles generally accepted in the United States of America (“U.S. GAAP”). Each Fund is considered an investment company under U.S. GAAP and follows the accounting and reporting guidance in the Financial Accounting Standards Board (FASB)Accounting Standards Codification Topic 946, Financial Services - Investment Companies. |
| a. | Cash & Cash Equivalents: Each Fund considers its investment in a FDIC insured interest bearing account to be cash and cash equivalents. Cash and cash equivalents are valued at cost plus any accrued interest. The Funds maintain cash balances, which, at times may exceed federally insured limits. The Funds maintain these balances with a high quality financial institution. |
| b. | Share Valuation: The NAV of each Fund is calculated by dividing the sum of the value of the securities held by each Fund, plus cash or other assets, minus all liabilities (including estimated accrued expenses), by the total number of shares outstanding of each Fund. The result is rounded to the nearest cent. Each Fund’s shares will not be priced on the days in which the New York Stock Exchange ("NYSE") is closed for trading. |
| c. | Investment Valuations: Equity securities are valued at the closing price or last sales price on the principal exchange or market on which they are traded; or, if there were no sales that day, at the last reported bid price. |
| Fixed income (debt) securities are valued on the basis of last available bid prices or current market quotations provided by dealers or pricing services. In determining the value of a particular investment, pricing services may |
| Meridian Funds | 65 | www.meridianfund.com |
Table of Contents
Notes to Financial Statements (continued)
| use certain information with respect to transactions in such investments, quotations from dealers, pricing matrixes, market transactions in comparable investments, various relationships observed in the market between investments and calculated yield measures. | |
| Investments in open-end U.S. mutual funds are valued at NAV each business day. | |
| The market value of the Funds' investments in exchange traded funds is based on the published NAV of each fund computed as of the close of regular trading on the NYSE on days when the NYSE is open. | |
| Exchange-traded options are valued at the mean between the last bid and ask prices at the close of the options market in which the options trade. An exchange-traded option for which there is no mean price is valued at the last bid (long positions) or ask (short positions) price. If no bid or ask price is available, the prior day’s price will be used, unless it is determined that the prior day’s price no longer reflects the fair value of the option. | |
| Securities and other assets for which reliable market quotations are not readily available or for which a significant event has occurred since the time of the most recent market quotation, will be valued based upon other available factors deemed relevant by ArrowMark Colorado Holdings, LLC (the “Adviser”) under the guidelines established by, and under the general supervision and responsibility of, the Funds’ Board of Directors (the “Board”). These factors include but are not limited to (i) attributes specific to the investment; (ii) the principal market for the investment; (iii) the customary participants in the principal market for the investment; (iv) data assumptions by market participants for the investment, if reasonably available; (v) quoted prices for similar investments in active markets; and (vi) other factors, such as future cash flows, interest rates, yield curves, volatilities, prepayment speeds, loss severities, credit risks and/or default rates. Valuations based on such factors are reported to the Board on a quarterly basis. | |
| d. | Fair Value Measurements: As described in Note 1.c. above, the Funds utilize various methods to determine and measure the fair value of investment securities on a recurring basis. The objective of a fair value measurement is to determine the price that would be received to sell an asset or paid to transfer a liability in an orderly transaction between market participants at the measurement date (an exit price). Accordingly, the fair value hierarchy gives the highest priority to quoted prices (unadjusted) in active markets for identical assets or liabilities (Level 1) and the lowest priority to unobservable inputs (Level 3) that are significant to the fair value instrument. The three levels of the fair value hierarchy are described below: |
| Level 1 - quoted prices in active markets for identical securities; | |
| Level 2 - other significant observable inputs (including quoted prices for similar securities, interest rates, prepayment speeds, credit risk, etc.); and | |
| Level 3 - significant unobservable inputs (including the Funds' determinations as to the fair value of investments). |
| Meridian Funds | 66 | www.meridianfund.com |
Table of Contents
Notes to Financial Statements (continued)
| The inputs or methodology used for valuing securities are not necessarily an indication of the risks associated with investing in those securities. The summary of inputs used to value the Funds’ securities as of December 31, 2018 is as follows: |
| Level 1 | Level 2 | Level 3 | Total | ||||
| Growth Fund | |||||||
Common Stocks1 | $1,605,146,357 | $— | $30,152,836 | $1,635,299,193 | |||
Short-Term Investments | — | 21,120,225 | — | 21,120,225 | |||
Total Investments | $1,605,146,357 | $21,120,225 | $30,152,836 | $1,656,419,418 | |||
| Contrarian Fund | |||||||
Common Stocks1 | $504,834,326 | $— | $— | $504,834,326 | |||
Short-Term Investments | — | 36,401,161 | — | 36,401,161 | |||
Total Investments | $504,834,326 | $36,401,161 | $— | $541,235,487 | |||
| Enhanced Equity Fund | |||||||
| Assets: | |||||||
Common Stocks1 | $34,274,608 | $— | $— | $34,274,608 | |||
Call Options Purchased | 1,880,261 | — | — | 1,880,261 | |||
Put Options Purchased | 70,800 | — | — | 70,800 | |||
Short-Term Investments | — | 1,013,272 | — | 1,013,272 | |||
Total Investments - Assets | $36,225,669 | $1,013,272 | $— | $37,238,941 | |||
| Liabilities: | |||||||
Call Options Written | (4,000) | — | — | (4,000) | |||
Total Investments - Liabilities | $(4,000) | $— | $— | $(4,000) | |||
| Small Cap Growth Fund | |||||||
Common Stocks1 | $1,365,176,163 | $469,472 | $56,012,429 | $1,421,658,064 | |||
Warrants | 1,216,414 | — | — | 1,216,414 | |||
Preferred Stocks | — | — | 4,000,000 | 4,000,000 | |||
Short-Term Investments | — | 29,005,128 | — | 29,005,128 | |||
Total Investments | $1,366,392,577 | $29,474,600 | $60,012,429 | $1,455,879,606 | |||
| Meridian Funds | 67 | www.meridianfund.com |
Table of Contents
Notes to Financial Statements (continued)
| Growth Fund | |||||||||
| Beginning Balance 07/01/18 | Total Purchases | Total Sales | Unrealized Gain (Loss) | Ending Balance 12/31/18 | |||||
| Investments in Securities | |||||||||
Common Stocks | $10,664,198 | $19,160,247 | $— | $328,391 | $30,152,836 | ||||
Preferred Stocks | 8,600,696 | — | $(7,760,248) | $(840,448) | — | ||||
Total Level 3 | $19,264,894 | $19,160,247 | $(7,760,248) | $(512,057) | $30,152,836 | ||||
| Small Cap Growth Fund | |||||||||
| Beginning Balance 07/01/18 | Total Purchases | Total Sales | Unrealized Gain (Loss) | Ending Balance 12/31/18 | |||||
| Investments in Securities | |||||||||
Common Stocks | $51,342,935 | $32,864,299 | $(23,008,731) | $(5,186,074) | $56,012,429 | ||||
Convertible Corporate Bonds | 4,000,000 | — | (4,000,000) | — | — | ||||
Preferred Stocks | 4,000,000 | — | — | — | 4,000,000 | ||||
Total Level 3 | $59,342,935 | $32,864,299 | $(27,008,731) | $(5,186,074) | $60,012,429 | ||||
| Growth Fund | ||||
Asset Class | Market Value | Valuation Technique | Unobservable Input | Value/Range |
Common Stock | $5,090,226 | Market comparable | Illiquidity adjustment (%) | (15)% |
Common Stock | 18,750,042 | Cost | N/A | N/A |
Common Stock | 6,312,568 | Market comparable | Broker quote | N/A |
| Small Cap Growth Fund | ||||
Asset Class | Market Value | Valuation Technique | Unobservable Input | Value/Range |
Common Stock | $5,747,778 | Market comparable | Illiquidity adjustment (%) | (15)% |
Common Stock | $50,264,651 | Cost | N/A | N/A |
Preferred Stocks | $4,000,000 | Cost | N/A | N/A |
| e. | Investment Transactions and Investment Income: Security transactions are accounted for on the date the securities are purchased or sold (trade date). Realized gains and losses on security transactions are determined on the basis of specific identification for both financial statement and federal income tax purposes. Dividend income is recorded on the ex-dividend date. Under the applicable foreign tax laws, a withholding tax at various rates may be imposed on capital gains, dividends and interest. Interest income, including amortization and accretion of premiums and discounts on debt securities, is accrued daily. Discounts and premiums on securities purchased are accreted and amortized over the lives of the respective securities using the effective interest method. |
| f. | Option writing: When the Fund writes an option, an amount equal to the premium received by the Fund is recorded as a liability and subsequently adjusted to the current fair value of the option written. Premiums received from writing options that expire unexercised are treated by the Fund on the expiration date as realized gains from investments. The difference between the premium and amount paid on effecting a closing purchase transaction, including brokerage commissions, is also treated as a realized gain or, if the premium is less than the amount paid for the closing purchase transaction, as a realized loss. If a call option is exercised, the premium is |
| Meridian Funds | 68 | www.meridianfund.com |
Table of Contents
Notes to Financial Statements (continued)
| added to the proceeds from the sale of the underlying security or currency in determining whether the Fund has realized a gain or loss. If a put option is exercised, the premium reduces the cost basis of the securities purchased by the Fund. The Fund as writer of an option bears the market risk of an unfavorable change in the price of the security underlying the written option. | |
| g. | Allocation of Income, Expenses, Gains and Losses: Income, gains and losses are allocated on a daily basis to each share class based on the relative proportion of the net assets of the class to each Fund’s total net assets. Expenses are allocated on the basis of relative net assets of the class to the Fund, or if an expense is specific to a share class, to that specific share class. |
| h. | Use of Estimates: The preparation of financial statements in accordance with accounting principals generally accepted in the U.S. (“GAAP”) requires management to make estimates and assumptions that affect the reported amount of assets and liabilities and revenue and expenses at the date of the financial statements. Actual amounts could differ from those estimates, and such differences could be significant. |
| i. | Foreign Currency Translation: Securities denominated in foreign currencies are converted into U.S. dollars using the spot market rate of exchange at the time of valuation. Purchases and sales of such securities and related dividend and interest income are converted into U.S. dollars using the spot market rate of exchange prevailing on the respective dates of such translations. The Funds do not separately report the effect of changes in foreign exchange rates from changes in market prices on securities held. Such changes are included in net realized and unrealized gain or loss from investments as reported in the Statements of Operations. |
| j. | Distributions to Shareholders: The Funds record distributions to shareholders on the ex-dividend date. The amount of distributions from net investment income and net realized capital gains are determined in accordance with federal income tax regulations which may differ from GAAP. These “book/tax” differences are either considered temporary or permanent in nature. To the extent these differences are permanent in nature, such amounts are reclassified within the capital accounts based on their federal tax-basis treatment; temporary differences do not require reclassification. |
| Distributions which exceed net investment income and net realized capital gains are reported as distributions in excess of net investment income or distributions in excess of net realized capital gains for financial reporting purposes but not for tax purposes. To the extent they exceed net investment income and net realized capital gains for tax purposes, they are reported as distributions of paid-in-capital. | |
| k. | Guarantees and Indemnification: Under the Funds’ organizational documents, its Officers and Directors are indemnified against certain liability arising out of the performance of their duties to the Funds. Additionally, in the normal course of business, the Funds enter into contracts with service providers that contain general indemnification clauses, subject to applicable law. The Funds’ maximum exposure under these arrangements is unknown, as this would involve future claims that may be made against the Funds that have not yet occurred. However, based on experience, the Funds expect the risk of loss to be remote. |
| Meridian Funds | 69 | www.meridianfund.com |
Table of Contents
Notes to Financial Statements (continued)
| 2. | Capital Shares Transactions: Transactions in capital shares were as follows: |
| Six Months Ended December 31, 2018 | Year Ended June 30, 2018 | ||||||
| Shares | Amount | Shares | Amount | ||||
| Growth Fund: | |||||||
| Legacy Class | |||||||
Shares sold | 317,978 | $13,936,483 | 746,846 | $31,643,957 | |||
Shares issued from reinvestment of distributions | 4,934,235 | 159,474,931 | 2,111,870 | 87,558,159 | |||
Redemption fees | — | 2,927 | — | 8,358 | |||
Shares redeemed | (2,035,383) | (80,903,795) | (3,423,076) | (145,053,689) | |||
Net increase/(decrease) | 3,216,830 | $92,510,546 | (564,360) | $(25,843,215) | |||
| Institutional Class | |||||||
Shares sold | 1,385,590 | $59,848,644 | 5,113,914 | $220,007,162 | |||
Shares issued from reinvestment of distributions | 1,246,850 | 40,245,595 | 351,639 | 14,571,915 | |||
Redemption fees | — | 1,487 | — | 1,577 | |||
Shares redeemed | (891,290) | (37,483,480) | (856,334) | (36,507,199) | |||
Net increase | 1,741,150 | $62,612,246 | 4,609,219 | $198,073,455 | |||
| Class A | |||||||
Shares sold | 12,071 | $533,287 | 30,480 | $1,262,774 | |||
Shares issued from reinvestment of distributions | 26,606 | 832,766 | 25,410 | 1,027,827 | |||
Redemption fees | — | — | — | 42 | |||
Shares redeemed | (203,632) | (9,066,563) | (138,078) | (5,707,970) | |||
Net decrease | (164,955) | $(7,700,510) | (82,188) | $(3,417,327) | |||
| Class C | |||||||
Shares sold | 1,277 | $55,021 | 1,681 | $69,103 | |||
Shares issued from reinvestment of distributions | 13,312 | 411,474 | 5,517 | 222,398 | |||
Redemption fees | — | — | — | 11 | |||
Shares redeemed | (5,808) | (212,359) | (8,266) | (348,488) | |||
Net increase/(decrease) | 8,781 | $254,136 | (1,068) | $(56,976) | |||
| Investor Class | |||||||
Shares sold | 4,259,956 | $197,615,756 | 415,842 | $17,508,521 | |||
Shares issued from reinvestment of distributions | 986,674 | 31,559,060 | 147,893 | 6,082,835 | |||
Redemption fees | — | 1,105 | — | — | |||
Shares redeemed | (656,467) | (27,608,748) | (480,415) | (20,339,808) | |||
Net increase | 4,590,163 | $201,567,173 | 83,320 | $3,251,548 | |||
| Meridian Funds | 70 | www.meridianfund.com |
Table of Contents
Notes to Financial Statements (continued)
| Six Months Ended December 31, 2018 | Year Ended June 30, 2018 | ||||||
| Shares | Amount | Shares | Amount | ||||
| Contrarian Fund: | |||||||
| Legacy Class | |||||||
Shares sold | 62,877 | $2,662,654 | 92,762 | $4,023,673 | |||
Shares issued from reinvestment of distributions | 3,607,264 | 109,952,807 | 1,478,283 | 61,422,664 | |||
Redemption fees | — | 3,975 | — | 2,300 | |||
Shares redeemed | (1,091,545) | (41,771,163) | (1,513,056) | (65,157,316) | |||
Net increase | 2,578,596 | $70,848,273 | 57,989 | $291,321 | |||
| Class A | |||||||
Shares sold | 31,964 | $1,355,004 | 149,116 | $6,682,005 | |||
Shares issued from reinvestment of distributions | 24,866 | 739,024 | 753 | 30,696 | |||
Redemption fees | — | 316 | — | 87 | |||
Shares redeemed | (85,335) | (3,448,252) | (4,404) | (180,593) | |||
Net increase/(decrease) | (28,505) | $(1,353,908) | 145,465 | $6,532,195 | |||
| Class C | |||||||
Shares sold | 557 | $25,001 | — | $— | |||
Shares issued from reinvestment of distributions | 294 | 8,621 | 60 | 2,415 | |||
Redemption fees | — | — | — | — | |||
Shares redeemed | — | — | (589) | (23,678) | |||
Net increase/(decrease) | 851 | $33,622 | (529) | $(21,263) | |||
| Investor Class | |||||||
Shares sold | 10,877 | $489,750 | 25,012 | $1,109,123 | |||
Shares issued from reinvestment of distributions | 19,165 | 579,747 | 6,696 | 276,556 | |||
Redemption fees | — | — | — | — | |||
Shares redeemed | (22,737) | (1,050,786) | (13,730) | (583,559) | |||
Net increase | 7,305 | $18,711 | 17,978 | $802,120 | |||
| Meridian Funds | 71 | www.meridianfund.com |
Table of Contents
Notes to Financial Statements (continued)
| Six Months Ended December 31, 2018 | Year Ended June 30, 2018 | ||||||
| Shares | Amount | Shares | Amount | ||||
| Enhanced Equity Fund: | |||||||
| Legacy Class | |||||||
Shares sold | 27,894 | $445,974 | 25,202 | $412,949 | |||
Shares issued from reinvestment of distributions | 326,231 | 4,283,419 | 33,878 | 539,682 | |||
Redemption fees | — | — | — | — | |||
Shares redeemed | (158,394) | (2,614,653) | (414,577) | (6,370,022) | |||
Net increase/(decrease) | 195,731 | $2,114,740 | (355,497) | $(5,417,391) | |||
| Class A | |||||||
Shares sold | 44,431 | $832,758 | 65,214 | $1,007,574 | |||
Shares issued from reinvestment of distributions | 21,580 | 282,055 | 3,351 | 53,040 | |||
Redemption fees | — | 134 | — | — | |||
Shares redeemed | (172,676) | (2,469,340) | (4,124) | (66,650) | |||
Net increase/(decrease) | (106,665) | $(1,354,393) | 64,441 | $993,964 | |||
| Class C | |||||||
Shares sold | — | $— | — | $— | |||
Shares issued from reinvestment of distributions | 10 | 130 | —1 | 7 | |||
Redemption fees | — | — | — | — | |||
Shares redeemed | — | — | — | — | |||
Net increase | 10 | $130 | — | $7 | |||
| Investor Class | |||||||
Shares sold | 121,511 | $2,322,145 | 54,380 | $987,000 | |||
Shares issued from reinvestment of distributions | 5,545 | 72,698 | 191 | 3,042 | |||
Redemption fees | — | 176 | — | — | |||
Shares redeemed | (131,386) | (2,053,622) | (15,703) | (255,671) | |||
Net increase/(decrease) | (4,330) | $341,397 | 38,868 | $734,371 | |||
| 1 | Less than one share. |
| Meridian Funds | 72 | www.meridianfund.com |
Table of Contents
Notes to Financial Statements (continued)
| Six Months Ended December 31, 2018 | Year Ended June 30, 2018 | ||||||
| Shares | Amount | Shares | Amount | ||||
| Small Cap Growth Fund: | |||||||
| Legacy Class | |||||||
Shares sold | 831,626 | $14,173,225 | 798,357 | $12,937,312 | |||
Shares issued from reinvestment of distributions | 249,305 | 3,455,366 | 157,763 | 2,513,161 | |||
Redemption fees | — | 407 | — | 224 | |||
Shares redeemed | (1,510,834) | (27,942,693) | (2,343,784) | (38,873,193) | |||
Net decrease | (429,903) | $(10,313,695) | (1,387,664) | $(23,422,496) | |||
| Institutional Class | |||||||
Shares sold | 10,629,353 | $191,661,027 | 28,001,860 | $464,545,976 | |||
Shares issued from reinvestment of distributions | 4,970,014 | 69,132,900 | 1,021,360 | 16,311,116 | |||
Redemption fees | — | 14,032 | — | 22,819 | |||
Shares redeemed | (8,735,905) | (156,469,624) | (5,514,217) | (91,208,599) | |||
Net increase | 6,863,462 | $104,338,335 | 23,509,003 | $389,671,312 | |||
| Class A | |||||||
Shares sold | 465,381 | $7,453,469 | 2,079,247 | $33,150,819 | |||
Shares issued from reinvestment of distributions | 396,619 | 5,394,014 | 222,019 | 3,488,257 | |||
Redemption fees | — | 2,142 | — | 9,460 | |||
Shares redeemed | (2,108,713) | (38,306,958) | (2,780,531) | (45,116,576) | |||
Net decrease | (1,246,713) | $(25,457,333) | (479,265) | $(8,468,040) | |||
| Class C | |||||||
Shares sold | 18,924 | $327,730 | 305,564 | $4,901,526 | |||
Shares issued from reinvestment of distributions | 149,666 | 1,989,059 | 110,815 | 1,718,744 | |||
Redemption fees | — | 222 | — | — | |||
Shares redeemed | (675,163) | (11,954,191) | (1,651,535) | (26,361,279) | |||
Net decrease | (506,573) | $(9,637,180) | (1,235,156) | $(19,741,009) | |||
| Investor Class | |||||||
Shares sold | 8,165,127 | $146,942,716 | 25,519,864 | $404,556,023 | |||
Shares issued from reinvestment of distributions | 5,603,699 | 77,479,831 | 1,592,623 | 25,306,772 | |||
Redemption fees | — | 3,381 | — | 67,756 | |||
Shares redeemed | (7,774,555) | (139,536,247) | (9,597,423) | (156,906,585) | |||
Net increase | 5,994,271 | $84,889,681 | 17,515,064 | $273,023,966 | |||
| Meridian Funds | 73 | www.meridianfund.com |
Table of Contents
Notes to Financial Statements (continued)
| 3. | Investment Transactions: The cost of investments purchased and the proceeds from sales of investments, excluding short-term securities and U.S. government obligations, for the six months ended December 31, 2018, were as follows: |
| Purchases | Proceeds from Sales | ||
Growth Fund | $486,088,013 | $237,733,331 | |
Contrarian Fund | $156,433,905 | $193,135,940 | |
Enhanced Equity Fund | $10,384,326 | $16,481,922 | |
Small Cap Growth Fund | $424,794,176 | $359,549,751 | |
| 4. | Other Investment Transactions |
| a. | Restricted Securities:Restricted securities for which quotations are not readily available are valued at fair value, as determined by the board of directors. Restricted securities issued by publicly traded companies are generally valued at a discount to similar publicly traded securities. Restricted securities issued by nonpublic entities may be valued by reference to comparable public entities or fundamental data relating to the issuer, or both. Depending on the relative significance of valuation inputs, these instruments may be classified in either level 2 or level 3 of the fair value hierarchy. As of December 31, 2018, Contrarian and Enhanced Equity Funds don’t hold any restricted securities. |
| b. | Private Placement Securities: Privately issued securities are restricted securities that are offered in a private placement and are generally not registered with the SEC or any federal or state regulatory authority. Securities issued in a private placement are generally "restricted securities" as that term is defined under Rule 144 promulgated under the Securities Act of 1933, and may not be resold without registration with the Securities and Exchange Commission or the availability of an exemption therefrom. There is generally no public trading market for privately offered securities and it is generally not anticipated that a public trading market will develop. There are substantial restrictions on the transfer of privately offered securities. Such securities have limited liquidity that makes it difficult or impossible to sell. An investment in privately issued securities often requires a long-term investment horizon and it may be many years before an investor receives significant distributions from such investment. Due to the lack of public market for privately offered securities, it may be difficult to value the investment. |
| c. | Securities Lending: The Funds have entered into an agreement with The Bank of New York Mellon (the “Lending Agent”), dated September 23, 2015 (“Securities Lending Agreement”), to provide securities lending services to the Funds. Under this program, the proceeds (cash collateral) received from borrowers are used to invest in money market funds or joint repurchase agreements. Under the Securities Lending Agreement, the borrowers may pay the Funds negotiated lender fees and the Funds receive cash and/or securities as collateral in an amount equal to not less than 102% of the market value of loaned securities. The market value of the loaned securities is determined at the close of each business day of the Fund and any additional required collateral is delivered to the Fund, or excess collateral is returned by the Fund, on the next business day. The borrower pays fees at the Funds’ direction to the Lending Agent. Although the risk of lending is generally mitigated by the collateral, the Funds could experience a delay in recovering securities and a possible loss of income or value if the borrower fails to return them. |
| The following table summarizes the securities received as collateral for securities lending: |
| Collateral Type | Coupon Range | Maturity Date Range | Market Value | ||||
Growth Fund | U.S. Government Obligations | 0.00% - 8.75% | 1/10/19 - 8/15/47 | $ 337,989,389 | |||
Contrarian Fund | U.S. Government Obligations | 0.00% - 8.75% | 1/10/19 - 2/15/48 | 98,528,369 | |||
Enhanced Equity Fund | U.S. Government Obligations | 0.00% - 8.75% | 1/10/19 - 8/15/47 | 152,346 | |||
Small Cap Growth Fund | U.S. Government Obligations | 0.00% - 8.75% | 1/10/19 - 8/15/47 | 197,442,850 |
| Meridian Funds | 74 | www.meridianfund.com |
Table of Contents
Notes to Financial Statements (continued)
| d. | Repurchase Agreements and Joint Repurchase Agreements:The Funds may enter into repurchase agreements for temporary cash management purposes provided that the value of the underlying collateral, including accrued interest, will equal or exceed the value of the repurchase agreement during the term of the agreement. The underlying collateral for all repurchase agreements is held in safekeeping by the Funds' custodian or at the Federal Reserve Bank. If the seller defaults and the value of the collateral declines, or if bankruptcy proceedings commence with respect to the seller of the security, realization of the collateral by the Funds may be delayed or limited. |
| Additionally, the Funds may enter into joint repurchase agreements for reinvestment of cash collateral on securities lending transactions under the securities lending program offered by the Lending Agent (the “Program”), provided that the value of the underlying collateral, including accrued interest will equal or exceed the value of the joint repurchase agreement during the term of the agreement. The Funds participate on a pro rata basis with other clients of the Lending Agent in its share of the underlying collateral under such joint repurchase agreements and in its share of proceeds from any repurchase or other disposition of the underlying collateral. The underlying collateral for joint repurchase agreements is held in safekeeping by the Funds’ custodian or at the Federal Reserve Bank. If the seller defaults and the value of the collateral declines, or if bankruptcy proceedings commence with respect to the seller of the security, realization of the collateral by the Funds may be delayed or limited. Pursuant to the Program, the Funds are indemnified for such losses by the Lending Agent. | |
| At December 31, 2018, the market value of repurchase agreements or joint repurchase agreements outstanding for the Growth Fund, Contrarian Fund, Enhanced Equity Fund, and the Small Cap Growth Fund were $21,120,225, $36,401,161, $1,013,272 and $29,005,128, respectively. | |
| e. | Master Netting Arrangements: The Funds may enter into master netting agreements with their counterparties for the securities lending program and repurchase agreements, which provide the right, in the event of default (including bankruptcy or insolvency) for the non-defaulting party to liquidate the collateral and calculate net exposure to the defaulting party or request additional collateral. For financial reporting purposes, the Funds do not offset financial assets and financial liabilities that are subject to master netting agreements in the Statements of Assets and Liabilities. For securities lending transactions see Note 4.c. |
| The following table is a summary of the Funds’ open repurchase agreements that are subject to a master netting arrangement as of December 31, 2018: |
| Assets | |||||
| Gross Amounts Presented in Statements of Assets and Liabilities | Collateral Received | Net Amount | |||
| Growth Fund | |||||
Repurchase agreement | $ 21,120,225 | $ (21,120,225)1 | $ — | ||
| Contrarian Fund | |||||
Repurchase agreement | 36,401,161 | (36,401,161)1 | — | ||
| Enhanced Equity Fund | |||||
Repurchase agreement | 1,013,272 | (1,013,272)1 | — | ||
| Small Cap Growth Fund | |||||
Repurchase agreement | 29,005,128 | (29,005,1281 | — | ||
| 1 The amount of collateral presented is limited such that the net amount cannot be less than zero. Collateral received in excess of the market value of securities on loan is not presented in this table. | |||||
| Meridian Funds | 75 | www.meridianfund.com |
Table of Contents
Notes to Financial Statements (continued)
| f. | Options: Certain Funds purchase and write call and put options to increase or decrease their exposure to underlying instruments (including equity risk, interest rate risk and/or commodity price risk) and/or, in the case of options written, to generate gains from options premiums. A call option gives the purchaser (holder) of the option the right (but not the obligation) to buy, and obligates the seller (writer) to sell (when the option is exercised) the underlying instrument at the exercise or strike price at any time or at a specified time during the option period. A put option gives the holder the right to sell and obligates the writer to buy the underlying instrument at the exercise or strike price at any time or at a specified time during the option period. When the Funds purchase (write) an option, an amount equal to the premium paid (received) by the Funds is reflected as an asset (liability). The amount of the asset (liability) is subsequently marked-to-market to reflect the current market value of the option purchased (written). When an instrument is purchased or sold through an exercise of an option, the related premium paid (or received) is added to (or deducted from) the basis of the instrument acquired or deducted from (or added to) the proceeds of the instrument sold. When an option expires (or the Funds enter into a closing transaction), the Funds realize a gain or loss on the option to the extent of the premiums received or paid (or gain or loss to the extent the cost of the closing transaction exceeds the premiums received or paid). When the Funds write a call option, such option is “covered,” meaning that the Funds hold the underlying instrument subject to being called by the option counterparty. When the Funds write a put option, such option is covered by cash in an amount sufficient to cover the obligation. |
| In purchasing and writing options, the Funds bear the risk of an unfavorable change in the value of the underlying instrument or the risk that the Funds may not be able to enter into a closing transaction due to an illiquid market. Exercise of a written option could result in the Funds purchasing or selling a security when it otherwise would not, or at a price different from the current market value. | |
| Average quarterly balances of outstanding derivative financial instruments were as follows. |
| Enhanced Equity Fund | |
| Options: | |
Average value of option contracts purchased | $3,450,686 |
Average value of option contracts written | $1,601,325 |
| g. | Warrants: The Company can invest in warrants and stock purchase rights of companies of any market capitalization. A warrant gives the Company the right to buy stock, typically from the issuer. The warrant specifies the amount of underlying stock, the purchase (or "exercise") price, and the date the warrant expires. Certain warrants may permit, without legal obligation, net settlement for stock or cash. The Company has no obligation to exercise the warrant and buy the stock. |
| h. | Short Sales: The Funds may enter into short sales. A short sale occurs when a fund sells a security it generally does not own (the security is borrowed), in anticipation of a decline in the security’s price. The initial amount of a short sale is recorded as a liability which is marked-to-market daily. Fluctuations in the value of the short liability are recorded as unrealized gains or losses. If a Fund shorts a security when also holding a long position in the security (a “short against the box”), as the security’s price declines, the short position increases in value, offsetting the long position’s decrease in value. The opposite effect occurs if the security’s price rises. A Fund realizes a gain or loss upon closing of the short sale (returning the security to the counterparty by way of purchase or delivery of a long position owned). Possible losses from short sales may be unlimited, whereas losses from security purchases |
| Meridian Funds | 76 | www.meridianfund.com |
Table of Contents
Notes to Financial Statements (continued)
| cannot exceed the total amount invested. The Funds are liable to the buyer for any dividends payable on securities while those securities are in a short position. These dividends are an expense of the Funds. The Funds designate collateral consisting of cash, U.S. government securities or other liquid assets sufficient to collateralize the market value of short positions. |
| 5. | Market and Debt Securities Risk |
| In the normal course of business, each Fund's investment activities expose it to various types of risk associated with the financial instruments and markets in which it invests. The significant types of financial risks each Fund is exposed to include market risk and debt securities risk. Each Fund’s prospectus provides details of these and other types of risk. | |
| Market Risk:Market risk refers to the possibility that the market values of securities or other investments that a Fund holds will fall, sometimes rapidly or unpredictably, or fail to rise. Security values may fall or fail to rise because of a variety of factors affecting (or the market’s perception of) individual companies or other issuers (e.g., an unfavorable earnings report), industries or sectors, or the market as a whole, reducing the value of an investment in a Fund. Accordingly, an investment in the Fund could lose money over short or even long periods. The market values of the securities the Fund holds also can be affected by changes (or perceived changes) in U.S. or foreign economies and financial markets, and the liquidity of these securities, among other factors. In general, equity securities tend to have greater price volatility than debt securities. In addition, stock prices may be sensitive to rising interest rates, as the cost of capital rises and borrowing costs increase. As a result, the value of your investments in a Fund may be more or less than the value of your purchase price. | |
| Debt Securities Risk:Each Fund may invest in debt securities of both government and corporate issuers. A decline in prevailing levels of interest rates generally increases the value of debt securities in a Fund’s portfolio, while an increase in rates usually reduces the value of those securities. The value of a Fund’s debt securities, including bonds and convertible securities, are affected by movements in interest rates; if interest rates rise, the value of these securities may fall. Generally, the longer the average maturity of a debt security, the greater the change in its value. As a result, to the extent that a Fund invests in debt securities, interest rate fluctuations will affect the Fund’s net asset value, but not the income it receives from debt securities it owns. Debt securities are also subject to credit, liquidity risk and prepayment and extension risk. Credit risk is the risk that the entity that issued a debt security may become unable to make payments of principal and interest, and includes the risk of default. Liquidity risk is the risk that a Fund may not be able to sell portfolio securities because there are too few buyers for them. Prepayment and extension risk is the risk that a loan, bond or other security might be called or otherwise converted, prepaid or redeemed before maturity. If a loan or security is converted, prepaid or redeemed before maturity, particularly during a time of declining interest rates or spreads, the portfolio managers may not be able to invest the proceeds in securities or loans providing as high a level of income, resulting in a reduced yield to a Fund. Conversely, as interest rates rise or spreads widen, the likelihood of prepayment decreases. The portfolio managers may be unable to capitalize on securities with higher interest rates or wider spreads because a Fund’s investments are locked in at a lower rate for a longer period of time. | |
| Options Risk: Investments in options involve risks different from, and possibly greater than, investing directly in the underlying security, asset or other reference, including, among others, the risk that the counterparty to an option may not perform or may be unable to perform in accordance with the terms of the instrument, the potential that, at times, there may not be a liquid secondary market for the options (as described above), and the risk of imperfect correlation between any movement in the price or value of options and their underlying security, asset or other reference. Such events, as well as circumstances under which a Fund is required to purchase the underlying asset at a disadvantageous price, may result in losses to the Fund. In addition, options also may involve a small initial investment relative to the risk assumed, which could result in losses that are greater than the amount originally invested. Special risks are presented by internationally traded options. Because of time differences between the United States and various foreign countries, and because different holidays are observed in different countries, foreign options markets may be open for trading during hours or on days when U.S. markets are closed. As a result, option premiums may not reflect the current prices of the underlying interest in the United States. |
| Meridian Funds | 77 | www.meridianfund.com |
Table of Contents
Notes to Financial Statements (continued)
| 6. | Affiliate Transactions and Fees |
| Management Fees: Under the Investment Management Agreement, the Adviser receives the following fees for providing certain investment management and other services necessary for managing each Fund. The fee is paid monthly in arrears and calculated based on that month’s daily average net assets. |
| Growth Fund: | Contrarian and Small Cap Growth Funds: | |||||
| Average Daily Net Assets | Investment Management Fee | Average Daily Net Assets | Investment Management Fee | |||
Up to $50,000,000 | 1.00% | Greater than $0 | 1.00% | |||
Greater than $50,000,000 | 0.75% | |||||
| Enhanced Equity Fund: | ||
| Average Daily Net Assets | Investment Management Fee | |
Up to $10,000,000 | 1.00% | |
$10,000,001 to $30,000,000 | 0.90% | |
$30,000,001 to $50,000,000 | 0.80% | |
Greater than $50,000,000 | 0.70% | |
| Meridian Funds | 78 | www.meridianfund.com |
Table of Contents
Notes to Financial Statements (continued)
| Expense Limitation | Total Waivers and Reimbursements for the six months ended December 31, 2018 | ||
| Growth Fund | |||
Institutional Class | 0.90% | $— | |
Class A | 1.55% | $— | |
Class C | 2.25% | $— | |
Investor Class | 1.30% | $— | |
| Contrarian Fund | |||
Class A | 1.60% | $— | |
Class C | 2.20% | $— | |
Investor Class | 1.35% | $— | |
| Enhanced Equity Fund | |||
Legacy Class | 1.25% | $— | |
Class A | 1.60% | $— | |
Class C | 2.00% | $— | |
Investor Class | 1.35% | $— | |
| Small Cap Growth Fund | |||
Legacy Class | 1.20% | $— | |
Institutional Class | 1.10% | $— | |
Class A | 1.60% | $— | |
Class C | 2.25% | $— | |
Investor Class | 1.35% | $— | |
| Expiration June 30, | |||||
| 2019 | 2020 | 2021 | |||
Growth Fund | — | — | — | ||
Contrarian Fund | — | — | — | ||
Enhanced Equity Fund | $3 | $2 | — | ||
Small Cap Growth Fund | — | 28,508 | $42,960 | ||
| Meridian Funds | 79 | www.meridianfund.com |
Table of Contents
Notes to Financial Statements (continued)
| 7. | Directors and Officers:Certain Directors and/or Officers of the Funds are also Directors and/or Officers of the Adviser. Directors and Officers of the Funds who are Directors and/or Officers of the Adviser receive no compensation from the Funds. Each Non-Interested Director is paid an annual fee set at $40,000. An additional $5,000 is paid to each Non-Interested Director for attendance at each in-person meeting of the Board and an additional $1,000 is paid to each Non-Interested Director for participating in a telephonic meeting of the Board. An additional $3,000 is paid to each member of the Audit or Governance Committee of the Board for attendance at an in-person Audit or Governance Committee meeting and an additional $1,000 is paid to each member of the Audit or Governance Committee of the Board for participating in a telephonic Audit or Governance Committee meeting. |
| An additional $10,000 is paid to the Chairman of the Board and the Chairman of a Committee of the Board. The Chairman of the Board also receives an additional $2,500 for attending each in-person meeting of the Board. The Chairman of a Committee receives an additional $2,000 for attending each in-person Committee meeting. |
| 8. | Distribution Information: Income and long-term capital gains distributions are determined in accordance with federal income tax regulations, which may differ from GAAP. The tax character of distributions made during the fiscal year ended June 30, 2018, is as follows: |
| 2018 Taxable Distributions | |||||
| Ordinary Income | Net Long-Term Capital Gain | Total Distributions | |||
Growth Fund | 31,839,842 | 80,465,714 | 112,305,556 | ||
Contrarian Fund | 187,947 | 63,078,540 | 63,266,487 | ||
Enhanced Equity Fund | 655,926 | — | 655,926 | ||
Small Cap Growth Fund | 32,280,436 | 20,870,897 | 53,151,333 | ||
| 9. | Federal Income Taxes Information: It is the Funds’ policy to comply with the requirements of Subchapter M of the Internal Revenue Code of 1986, as amended, applicable to regulated investment companies and to distribute all of their taxable income to their shareholders; therefore, no federal income tax provision is required. Management has analyzed the Funds’ tax positions taken on federal income tax returns for all open tax years (current and prior three tax years), and has concluded that no provision for federal income tax is required in the Funds’ financial statements. The Funds’ federal and state income and federal excise tax returns for tax years for which the applicable statutes of limitations have not expired are subject to examination by the Internal Revenue Service and state departments of revenue. The Funds are not aware of any tax positions for which it is reasonably possible that the total amounts of unrecognized tax benefits will significantly change in the next 12 months. The Funds recognize interest and penalties, if any, related to unrecognized tax benefits as income tax expense in the Statements of Operations. During the six months ended December 31, 2018, the Funds did not incur any interest or penalties. |
| The aggregate cost of investments, securities sold short, and options, unrealized appreciation and depreciation, for federal income tax purposes, at December 31, 2018 is as follows: |
| Aggregrate Cost | Aggregrate Gross Unrealized Appreciation | Aggregrate Gross Unrealized Depreciation | Net Unrealized Appreciation /(Depreciation) | ||||
Growth Fund | $ 1,689,171,084 | $ 236,214,141 | $ (268,965,807) | $ (32,751,666) | |||
Contrarian Fund | 501,526,192 | 81,466,649 | (41,757,354) | 39,709,295 | |||
Enhanced Equity Fund | 33,745,781 | 11,351,570 | (7,862,410) | 3,489,160 | |||
Small Cap Growth Fund | 1,457,580,997 | 195,757,591 | (197,458,982) | (1,701,391) |
| Meridian Funds | 80 | www.meridianfund.com |
Table of Contents
| Meridian Funds | 81 | www.meridianfund.com |
Table of Contents
| Meridian Funds | 82 | www.meridianfund.com |
Table of Contents
| Meridian Funds | 83 | www.meridianfund.com |
Table of Contents
Glossary of Terms Used in this Report (Unaudited)
| Meridian Funds | 84 | www.meridianfund.com |
Table of Contents
| • | Applications or other forms |
| • | Transactions with us, our affiliates, or others |
Table of Contents
P.O. Box 9792
1-800-446-6662
| • | For a fee, by writing the Public Reference Section of the Commission, Washington, D.C. 20549-1520, by electronic request at the following E-mail address: publicinfo@sec.gov, or by calling 202-551-8090 |
| • | Free from the Commission’s Website at http://www.sec.gov. |
Table of Contents
Table of Contents
Other Information (Unaudited)
(800) 446-6662
(303) 398-2929
(877) 796-3434
ArrowMark Colorado Holdings, LLC
100 Fillmore Street, Suite 325
Denver, CO 80206
ALPS Distributors, Inc.
1290 Broadway, Suite 1100
Denver, CO 80203
BNY Mellon Investment Servicing (US) Inc.
760 Moore Road
King of Prussia, PA 19406
The Bank of New York Mellon
One Wall Street
New York, NY 10286
Davis Graham & Stubbs LLP
1550 17th Street, Suite 500
Denver, CO 80202
Cohen & Company, Ltd.
1350 Euclid Ave., Suite 800
Cleveland, OH 44115
James Bernard Glavin, Chairman
Guy M. Arnold
John S. Emrich
Michael S. Erickson
Edward F. Keely
Michael Stolper*
David Corkins, President
Katie Jones, Chief Financial Officer and Treasurer
Richard Grove, Vice President, Secretary and Chief
Compliance Officer
Table of Contents
Item 2. Code of Ethics.
Not applicable.
Item 3. Audit Committee Financial Expert.
Not applicable.
Item 4. Principal Accountant Fees and Services.
Not applicable.
Item 5. Audit Committee of Listed Registrants.
Not applicable.
Item 6. Investments.
| (a) | Schedule of Investments in securities of unaffiliated issuers as of the close of the reporting period is included as part of the report to shareholders filed under Item 1 of this form. |
| (b) | Not applicable. |
| Item 7. | Disclosure of Proxy Voting Policies and Procedures forClosed-End Management Investment Companies. |
Not applicable.
Item 8. Portfolio Managers ofClosed-End Management Investment Companies.
Not applicable.
| Item 9. | Purchases of Equity Securities byClosed-End Management Investment Company and Affiliated Purchasers. |
Table of Contents
Not applicable.
Item 10. Submission of Matters to a Vote of Security Holders.
There have been no material changes to the procedures by which the shareholders may recommend nominees to the registrant’s board of directors, where those changes were implemented after the registrant last provided disclosure in response to the requirements of Item 407(c)(2)(iv) of RegulationS-K (17 CFR 229.407) (as required by Item 22(b)(15) of Schedule 14A (17 CFR240.14a-101)), or this Item.
Item 11. Controls and Procedures.
| (a) | The registrant’s principal executive and principal financial officers, or persons performing similar functions, have concluded that the registrant’s disclosure controls and procedures (as defined in Rule30a-3(c) under the Investment Company Act of 1940, as amended (the “1940 Act”) (17 CFR270.30a-3(c))) are effective, as of a date within 90 days of the filing date of the report that includes the disclosure required by this paragraph, based on their evaluation of these controls and procedures required by Rule30a-3(b) under the 1940 Act (17 CFR270.30a-3(b)) and Rules13a-15(b) or15d-15(b) under the Securities Exchange Act of 1934, as amended (17 CFR240.13a-15(b) or240.15d-15(b)). |
| (b) | There were no changes in the registrant’s internal control over financial reporting (as defined in Rule30a-3(d) under the 1940 Act (17 CFR270.30a-3(d))) that occurred during the registrant’s last fiscal quarter that has materially affected, or is reasonably likely to materially affect, the registrant’s internal control over financial reporting. |
Item 12. Disclosure of Securities Lending Activities forClosed-End Management Investment Companies.
Not applicable.
Item 13. Exhibits.
| (a)(1) | Not applicable. | ||
(a)(2) | Certifications pursuant to Rule 30a-2(a) under the 1940 Act and Section 302 of the Sarbanes-Oxley Act of 2002 are attached hereto. | |||
(a)(3) | Not applicable. | |||
(a)(4) | Not applicable. | |||
(b) | Certifications pursuant to Rule 30a-2(b) under the 1940 Act and Section 906 of the Sarbanes Oxley Act of 2002 are attached hereto. | |||
Table of Contents
SIGNATURES
Pursuant to the requirements of the Securities Exchange Act of 1934 and the Investment Company Act of 1940, the registrant has duly caused this report to be signed on its behalf by the undersigned, thereunto duly authorized.
| (Registrant) Meridian Fund, Inc.® | ||
By (Signature and Title)* |
/s/ David J. Corkins | |
David J. Corkins | ||
Principal Executive Officer and President | ||
Date 3/1/2019 | ||
Pursuant to the requirements of the Securities Exchange Act of 1934 and the Investment Company Act of 1940, this report has been signed below by the following persons on behalf of the registrant and in the capacities and on the dates indicated.
By (Signature and Title)* | /s/ David J. Corkins | |
David J. Corkins | ||
Principal Executive Officer and President | ||
Date 3/1/2019 | ||
By (Signature and Title)* |
/s/ Katie Jones | |
Katie Jones | ||
Principal Financial Officer and Treasurer | ||
Date 3/1/2019 | ||
| * | Print the name and title of each signing officer under his or her signature. |