Table of Contents
UNITED STATES
SECURITIES AND EXCHANGE COMMISSION
Washington, D.C. 20549
FORM N-CSR
CERTIFIED SHAREHOLDER REPORT OF REGISTERED
MANAGEMENT INVESTMENT COMPANIES
Investment Company Act file number 811-04014
Meridian Fund, Inc.®
(Exact name of registrant as specified in charter)
��
100 Fillmore St., Suite 325
Denver, CO 80206
(Address of principal executive offices) (Zip code)
David J. Corkins
100 Fillmore St., Suite 325
Denver, CO 80206
(Name and address of agent for service)
Registrant’s telephone number, including area code: 303-398-2929
Date of fiscal year end: June 30
Date of reporting period: December 31, 2017
Table of Contents
| Item 1. | Reports to Stockholders. |
The Report to Shareholders is attached herewith.
Table of Contents


Table of Contents
Table of Contents
Table of Contents
Portfolio Performance and Composition (Unaudited)
| • | TriNet Group, Inc. (TNET) is a cloud-based professional employer organization (PEO) servicing small and medium-sized businesses in the United States. The company continued to benefit during the period from benign health and worker’s comp claims experience and past price increases. This combination resulted in 28% growth in net service revenues, 77% growth in earnings before interest, taxes, depreciation & amortization (EBITDA), and 93% growth in adjusted earnings per share (EPS). With only 1.5% market share, we expect TriNet to continue growing at a healthy pace as it begins to take increasing amounts of market share. The company has invested heavily in technology and new products over the past year which should begin to differentiate TriNet from competitors. Additionally, the new U.S. tax bill should be a material benefit for both the company and its small and medium-sized business customers. We maintained our position during the period. |
| • | LPL Financial Holdings, Inc. (LPLA) is a leading financial services provider to independent advisors and RIAs. Among the things that originally attracted us to this company are its recurring revenue stream and disciplined approach to managing costs. Because it is highly levered to rising interest rates, LPL benefited from the positive movement in rates during the period. A strong market backdrop and subsequent growth in assets under management also provided a powerful tailwind for LPL, which is paid a percentage of assets. The company is |
| Meridian Funds | 4 | www.meridianfund.com |
Table of Contents
Portfolio Performance and Composition (Unaudited) (continued)
| expected to benefit significantly from corporate tax reform, providing additional momentum to the stock. We scaled back our position as LPL’s share price increased, but remain invested due to expectations for additional rate increases in 2018 and for a more favorable regulatory environment. | |
| • | ServiceMaster Global Holdings, Inc. (SERV) operates a pest control business under the Terminix brand as well as a home appliance warranties business under the American Home Shield brand. Both business segments offer non-discretionary services that are generally immune to economic downturns. Due to the non-discretionary nature of the company’s services and a fragmented competitive landscape, ServiceMaster is able to routinely raise prices. During the period, the market responded positively to news that the company plans to spin off its American Home Shield business while also hiring a new CEO to lead the spin off. We trimmed our position as the stock appreciated. Nonetheless, we remain optimistic about the long-term potential of this company and it remains a large position in the portfolio. |
| • | 3D Systems Corp. (DDD) is a provider of 3D printing solutions. An increasing number of businesses, including automobile manufacturers, medical device firms, and aerospace companies are using 3D printers to make parts and products more efficiently. With no debt, strong free cash flow and a robust product portfolio, we think 3D Systems is well positioned to benefit from this trend. During the period, quality issues with printers and a subsequent decline in printer sales led management to reduce revenue and earnings guidance. Despite the reduction in printer sales, the company’s more profitable materials and services revenue remained healthy. We believe the introduction of a new printer in late 2017 will be a catalyst for the stock, stimulating overall printer sales. As such we maintained our position. |
| • | Evolent Health, Inc. (EVH) develops proprietary software and services that enable health providers to migrate from fee-for-service reimbursement to value-based payment models. Evolent helps reengineer its customers’ operations and provide coordinated health care at a lower cost to the overall system. The stock fell on news that Evolent planned to acquire their customer Premier Health Plan, a Medicare Advantage and commercial health plan in Ohio. We viewed the deal with Premier Health as an unexpected change in Evolent’s strategy and were also concerned with the slower pace of adoption among clients of Evolent’s value-based payment model. We consequently liquidated our position in the stock. |
| • | Syneos Health, Inc. (SYNH), formerly INC Research Holdings, Inc., is a contract research organization operating primarily in the clinical development market. We believe Syneos has the potential to significantly increase its market share given the company’s competitive global network, single-digit market share, and a growing trend in which drug companies outsource their clinical trial management. The company was challenged during the period as its commercial segment fell short of expectations as a result of a strategic reset by a large customer. Syneos consequently lowered full-year revenue and earnings guidance. We believe this is only a short-term setback and are optimistic the company can expand its commercial business with additional clients. Importantly, the company also continues to execute on its legacy clinical business with record bookings and backlog. We maintained our position. |
| Meridian Funds | 5 | www.meridianfund.com |
Table of Contents
Portfolio Performance and Composition (Unaudited) (continued)
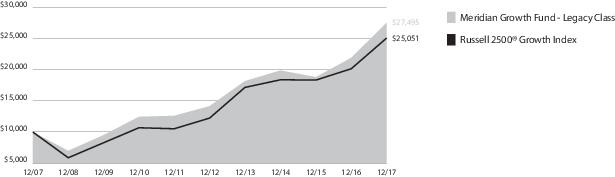
| Inception | 6 Month | 1 Year | 5 Year | 10 Year | Since Inception | |
| Legacy Class (MERDX) | 8/1/84 | 11.05% | 25.63% | 14.23% | 10.64% | 12.71% |
| Institutional Class (MRRGX) | 12/24/14 | 11.05% | 25.64% | — | — | 11.25% |
| Class A (MRAGX) w/o sales charge | 11/15/13 | 10.88% | 25.25% | — | — | 11.17% |
| Class A (MRAGX) with sales charge1 | 11/15/13 | 4.50% | 18.06% | — | — | 9.58% |
| Class C (MRCGX) | 7/1/15 | 10.46% | 24.32% | — | — | 10.94% |
| Investor Class (MRIGX) | 11/15/13 | 11.00% | 25.55% | — | — | 11.54% |
| Russell 2500® Growth Index | 8/1/84 2 | 12.49% | 24.46% | 15.47% | 9.62% | N/A 3 |
| 1 | Assuming maximum sales charge, if any. Class A Shares are subject to a maximum initial sales charge of 5.75%. |
| 2 | Inception date of Legacy Class Shares. |
| 3 | Inception date of Russell 2500® Growth Index is July 1, 1995. |
| Meridian Funds | 6 | www.meridianfund.com |
Table of Contents
Portfolio Performance and Composition (Unaudited) (continued)
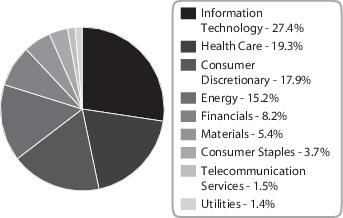
12.31.17
| TriNet Group, Inc. | 2.63% |
| LPL Financial Holdings, Inc. | 2.50% |
| Sensata Technologies Holding N.V. (Netherlands) | 2.50% |
| ServiceMaster Global Holdings, Inc. | 2.31% |
| Sally Beauty Holdings, Inc. | 2.27% |
| MSC Industrial Direct Co., Inc. Class A | 2.01% |
| Kirby Corp. | 1.90% |
| STERIS Plc (United Kingdom) | 1.86% |
| SS&C Technologies Holdings, Inc. | 1.81% |
| Carter's, Inc. | 1.76% |
| Meridian Funds | 7 | www.meridianfund.com |
Table of Contents
Portfolio Performance and Composition (Unaudited)
| • | Nektar Therapeutics (NKTR) is a biopharmaceutical company with a growing focus on oncology and immunology. We initially invested in this company during a period of investor disinterest related to Nektar’s business model, which investors perceived as relying heavily on partnering programs. While many of those programs were unexciting, they did support valuation that allowed us to invest in the company early in its pivot to oncology focused drugs. During the period, the stock advanced on news that Nektar’s lead oncology drug (NKT-214) may be highly synergistic with checkpoint inhibitors—the largest class of immune-oncology drugs in the market today. In clinical trials, NKT-214 showed the potential to increase both the efficacy and safety of checkpoint drugs, thus pointing to a multi-billion dollar market opportunity for Nektar. Based on this large opportunity, as well as other emerging applications for Nektar’s oncology products, we remain very optimistic about our investment in the company. |
| • | California Resources Corp. (CRC) is an oil and gas exploration and drilling company operating exclusively in California. We like CRC for its high free cash flow, world-class resource base, and flexible operating methods. Investor skepticism about the ability of oil producers to profitably drill for oil in California has led the market to significantly underappreciate CRC for a period. However, investors bid the stock higher due to strengthening oil |
| Meridian Funds | 8 | www.meridianfund.com |
Table of Contents
Portfolio Performance and Composition (Unaudited) (continued)
| prices and after the company executed a favorable refinancing agreement that gives it more balance sheet flexibility, loosens some of its financial covenants, and pushes out loan repayment terms. Although we trimmed our position as part of our risk-management discipline, CRC remains one of the portfolio’s core energy holdings. | |
| • | H&E Equipment Services, Inc. (HEES) is an integrated equipment services company focused on heavy construction and industrial equipment. Our initial investment in this stock was based on our theory that a decline in the company’s oil and gas-related business had run its course and that stabilizing oil prices and infrastructure demand in the U.S. would lead to a recovery in the business. During the period, H&E rallied on evidence that the market for heavy equipment is strengthening. We trimmed our position slightly, but believe there is additional upside to this story. |
| • | Celgene Corp. (CELG) is a biopharmaceutical company engaged primarily in the development of innovative therapies for the treatment of cancer and inflammatory diseases. While many investors are concerned Celgene will not be able to replace lost revenue when its key drug Revlimid goes generic in 2023, we are confident a burgeoning pipeline of drugs currently in clinical trails will bode well for the company. During the period, the stock declined after Celgene announced it had abandoned further development of a leading compound to treat Crohn’s disease and that the commercialization of another drug had been delayed by a year. Our conviction in Celgene remains high so we used the downturn in the stock as an opportunity to increase our position. |
| • | Nokia Corp. (NOK) is a global communications company and manufacturer of telecommunications infrastructure. We took advantage of the cyclical downturn in the telecommunications equipment industry and purchased shares of Nokia at what we felt was an attractive price. Our investment thesis is that, while other companies wait for wireless service carriers to upgrade their infrastructure to 5g, Nokia’s increased focus on licensing its intellectual property portfolio will continue to drive earnings growth. However, during the period industry weakness prompted management to lower its guidance for future earnings. Although we were not surprised by the announcement, the market was caught off guard and punished the stock. Seeing no near-term catalyst to turn the stock around, we liquidated our position. |
| • | Dick’s Sporting Goods, Inc. (DKS) operates a chain of retail stores across the U.S., featuring sporting goods and apparel. We purchased the stock on our belief that the beleaguered sporting goods industry presented opportunities for this well-managed company to create value. As competitors have closed their doors and filed for bankruptcy, Dick’s has increased market share and reported flat-to-positive same-store-sales. During the period, a price war broke out as other players in this space cut prices in an attempt to boost sales. Dick’s matched competitors’ pricing and, as a result, experienced a decline in same-store-sales and margins. Although we liquidated our position, we will continue to watch for a catalyst that may warrant investing in this company again. |
| Meridian Funds | 9 | www.meridianfund.com |
Table of Contents
Portfolio Performance and Composition (Unaudited) (continued)
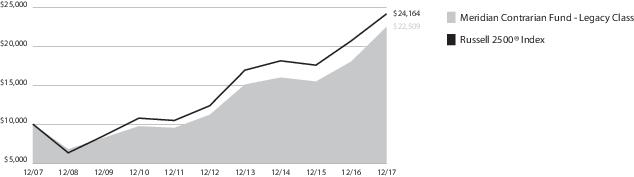
| Inception | 6 Month | 1 Year | 5 Year | 10 Year | Since Inception | |
| Legacy Class (MVALX) | 2/10/94 | 16.67% | 24.82% | 14.99% | 8.45% | 13.16% |
| Class A (MFCAX) w/o sales charge | 11/15/13 | 16.37% | 24.20% | — | — | 10.59% |
| Class A (MFACX) with sales charge1 | 11/15/13 | 9.69% | 17.06% | — | — | 9.02% |
| Class C (MFCCX) | 7/1/15 | 16.07% | 23.58% | — | — | 11.44% |
| Investor Class (MFCIX) | 11/15/13 | 16.53% | 24.51% | — | — | 10.88% |
| Russell 2500® Index | 2/10/94 2 | 10.23% | 16.81% | 14.33% | 9.22% | 10.48% |
| 1 | Assuming maximum sales charge, if any. Class A Shares are subject to a maximum initial sales charge of 5.75%. |
| 2 | Inception date of Legacy Class Shares. |
| Meridian Funds | 10 | www.meridianfund.com |
Table of Contents
Portfolio Composition (Unaudited)
12.31.17
| Nektar Therapeutics | 3.91% |
| Microsoft Corp. | 3.50% |
| EOG Resources, Inc. | 3.12% |
| Xylem, Inc. | 2.66% |
| Verint Systems, Inc. | 2.65% |
| Nomad Foods Ltd. (United Kingdom) | 2.63% |
| Lions Gate Entertainment Corp. Class B (Canada) | 2.58% |
| Graphic Packaging Holding Co. | 2.55% |
| Citizens Financial Group, Inc. | 2.52% |
| Umpqua Holdings Corp. | 2.50% |

| Meridian Funds | 11 | www.meridianfund.com |
Table of Contents
Portfolio Performance and Composition (Unaudited)
| • | Nvidia Corp. (NVDA) is a global leader in visual computing technologies and a key holding within the portfolio’s digital world allocation. Through its development of cutting-edge technology, particularly pascal architecture, the chipmaker is building an ecosystem around advanced computing. It has easily kept pace with evolving computational needs resulting from shrinking demand for personal computers, rising demand for smart phones, and the increasing pervasiveness of artificial intelligence (AI). Notably, with AI still in its infancy, we expect to see an increase in demand for the chips that Nvidia develops to support this technology. Rapid expansion of data centers by cloud service providers and the need for microprocessors to power these data centers should also create growth opportunities for Nvidia. Consequently, we are comfortable with our position in this top holding. |
| • | Roku, Inc. (ROKU) manufactures and distributes purpose-built television operating systems that provide customers with access to internet-streamed video or audio services. Roku has continued to gain market share by offering users the same access to premium channels as competing platforms using hardware that enables a better user experience at a lower price. The company is able to sell its hardware at a lower price by streaming content |
| Meridian Funds | 12 | www.meridianfund.com |
Table of Contents
Portfolio Performance and Composition (Unaudited) (continued)
| that is ad-supported—a strategy that has attracted 16.5 million cost-conscious customers. In its first earnings report since going public in September of 2017, Roku surpassed revenue estimates. We are bullish on the company’s ability to increase advertising revenue and gain pricing power and therefore maintained a position in the stock. | |
| • | Alnylam Pharmaceuticals, Inc. (ALNY) is a biopharmaceutical company focused on the development of RNA interference (RNAi), a method of suppressing gene expressions that can cause genetically inherited diseases. We believe that its pioneering RNAi research will allow it to be first-to-market with a number of life-changing therapies. We initiated a position in the stock during a period of negative market sentiment following its decision to halt the development of a key drug, fitusiran. A recent rally in the stock was triggered by news that the company received breakthrough therapy designation from the U.S. Food and Drug Administration (FDA) for patisiran. Because Alnylam’s RNAi methodology is precise and repeatable, we expect the company to be successful in its development of orphan drugs for a number of rare diseases. Furthermore, we are optimistic that cash flow generated by treatments Alnylam plans to bring to market in the coming year will provide additional funding for research. |
| • | Netflix, Inc. (NFLX) is an entertainment company specializing in streaming media and video-on-demand. We purchased a short position in this company based on our belief that its business model is flawed and that recent growth is unsustainable. In an effort to increase its subscriber base, the negative-free-cash-flow company has been borrowing millions of dollars to produce its own content and to buy the temporary rights of content produced by other companies. Although this strategy proved effective during the period (management reported stronger-than-expected fourth-quarter earnings driven by subscriber growth), we believe it is unsustainable and that margins will eventually come under pressure. We maintained our position. |
| • | Celgene, Inc. (CELG) is a biopharmaceutical company engaged in the development of innovative therapies for the treatment of cancer and inflammatory diseases. The commercial success of Revlimid, Celgene’s treatment for multiple myeloma, is one of the many things that initially attracted us to this company. Revlimid generates significant free cash flow, providing Celgene with ample capital to research and develop other drugs. In addition, the company owns controlling or blocking stakes in a number of good biotech companies, some of which we invest in. The stock traded lower during the period on news that several analysts had reduced revenue projections for some of Celgene’s primary drugs. We continue to believe Revlimid is a strong franchise and that Celgene has pricing power. We consequently used the downturn in the stock as an opportunity to increase our position. |
| • | Grubhub, Inc. (GRUB) is an online and mobile food ordering company that connects diners with local restaurants. We established a short position in Grubhub based on our belief that it faces a significant competitive threat from new players in the industry, primarily Amazon. However, the company’s impressive near-term financial metrics, including top-line growth of 20%, overshadowed longer-term concerns related to competition, sending Grubhub’s share price higher. The market’s enthusiasm over Grubhub’s purchase of Eat24, an online ordering and delivery platform owned by business search-and-review website Yelp, also supported stock gains. Although our analysis indicates there is not a compelling growth story here and that the stock is overvalued, we sold our short position in order to invest in other higher-conviction ideas. |
| Meridian Funds | 13 | www.meridianfund.com |
Table of Contents
Portfolio Performance and Composition (Unaudited) (continued)
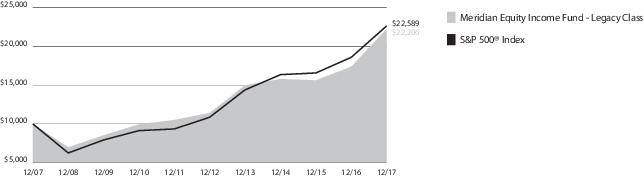
| Inception | 6 Month | 1 Year | 5 Year | 10 Year | Since Inception | |
| Legacy Class (MEIFX) | 1/31/05 | 18.91% | 27.94% | 14.19% | 8.30% | 8.30% |
| Class A (MRAEX) w/o sales charge | 11/15/13 | 18.64% | 27.41% | — | — | 10.23% |
| Class A (MRAEX) with sales charge1 | 11/15/13 | 11.86% | 20.07% | — | — | 8.65% |
| Class C (MRCEX) | 7/1/15 | 18.35% | 26.83% | — | — | 11.90% |
| Investor Class (MRIEX) | 11/15/13 | 18.79% | 27.71% | — | — | 10.49% |
| S&P 500® Index | 1/31/05 2 | 11.42% | 21.82% | 15.78% | 8.49% | 8.78% |
| 1 | Assuming maximum sales charge, if any. Class A Shares are subject to a maximum initial sales charge of 5.75%. |
| 2 | Inception date of Legacy Class Shares. |
| Meridian Funds | 14 | www.meridianfund.com |
Table of Contents
Portfolio Composition (Unaudited)
12.31.17
| California Resources Corp. 8.00%, 12/15/22 | 6.77% |
| Roku, Inc. | 5.52% |
| Microsoft Corp. | 4.26% |
| NVIDIA Corp. | 4.13% |
| Celgene Corp. | 3.86% |
| Royal Gold, Inc. | 3.65% |
| Alnylam Pharmaceuticals, Inc. | 3.61% |
| California Resources Corp. | 3.26% |
| Facebook, Inc. Class A | 3.14% |
| Alphabet, Inc. Class A | 3.12% |
| Meridian Funds | 15 | www.meridianfund.com |
Table of Contents
Portfolio Performance and Composition (Unaudited)
| • | Exa Corporation (EXA) develops simulation software used primarily by automobile and truck manufacturers. Exa’s software enhances performance and reduces costs by eliminating the need for expensive prototypes, the existing method used to test and optimize vehicles’ aerodynamic, thermal, and acoustic properties. The company recently expanded into the oil and gas industry with a solution that can help exploration and production (E&P) companies lower costs and better understand critical flow related rock properties. Among the many things we like about Exa is the recurring revenue stream generated through its consumption based term license revenue model. In September, the company announced it would be acquired by French software maker Dassault Systèmes for a 43% premium. Our position was liquidated. |
| • | Heritage-Crystal Clean, Inc (HCCI) is an environmental services company focused on parts cleaning, used oil collection, oil re-refining, and hazardous and non-hazardous waste services. We like this company for its strong recurring revenue stream and substantial growth opportunities in the re-refinery and used oil collection segments. The stock gained on news of improved growth in the company’s environmental services segment, specifically its parts cleaning, containerized waste, vacuum services, antifreeze recycling, and field services businesses. Hurricanes in the third quarter provided an additional tailwind to the stock, curtailing U.S. oil production and firming pricing for oil refiners. We added to our position during the period and see considerable opportunities for growth. We are excited about the new leadership, which we believe has a more aggressive and creative long-term outlook for the company. |
| • | Ignyta, Inc. (RXDX) focuses on precision medicine in oncology with the goal of eradicating cancer tumors in targeted patient populations. Our initial investment in this company was based on our conviction that Entrectinib, |
| Meridian Funds | 16 | www.meridianfund.com |
Table of Contents
Portfolio Performance and Composition (Unaudited) (continued)
| its non-small cell lung cancer drug candidate, would be a best-in-class therapeutic option with a $500mm market potential. In December, Roche announced they would acquire Ignyta for a 74% premium. Stock gains also were supported by positive updated clinical data on Entrectinib, which showed a 78% response rate in certain patients with advanced lung cancer. We maintained our position in Ignyta. |
| • | 3D Systems Corp. (DDD) is a provider of 3D printing solutions. An increasing number of businesses, including automobile manufacturers, medical device firms, and aerospace companies are using 3D printers to make parts and products more efficiently. With no debt, strong free cash flow and a robust product portfolio, we think 3D Systems is well positioned to benefit from this trend. During the period, quality issues with printers and a subsequent decline in printer sales led management to reduce revenue and earnings guidance. Despite the reduction in printer sales, the company’s more profitable materials and services revenue remained healthy. We believe the introduction of a new printer in late 2017 will be a catalyst for the stock, stimulating overall printer sales. As such we maintained our position. |
| • | Evolent Health, Inc. (EVH) develops proprietary software and services that enable health providers to migrate from fee-for-service reimbursement to value-based payment models. Evolent helps reengineer its customers’ operations and provide coordinated health care at a lower cost to the overall system. The stock fell on news that Evolent planned to acquire their customer Premier Health Plan, a Medicare Advantage and commercial health plan in Ohio. We viewed the deal with Premier Health as an unexpected change in Evolent’s strategy and were also concerned with the slower pace of adoption among clients of Evolent’s value-based payment model. We consequently liquidated our position in the stock. |
| • | Versartis, Inc. (VSAR) is a biopharmaceutical firm that is developing a long-acting human growth hormone used in the treatment of growth hormone deficiency. We invested in this company due to our optimism that its drug could potentially replace the standard of care for this deficiency. While the current treatment involves daily injections, Versartis’ long-acting growth hormone requires only twice monthly injections. Although trial data through phase II indicated that the efficacy of Versartis’ treatment was equal to that of the current treatment, the drug did not meet important endpoints in the phase III trial. The stock suffered a steep decline and we liquidated our position. |
| Meridian Funds | 17 | www.meridianfund.com |
Table of Contents
Portfolio Performance and Composition (Unaudited) (continued)
| Inception | 6 Month | 1 Year | 3 Year | 5 Year | 10 Year | Since Inception | |
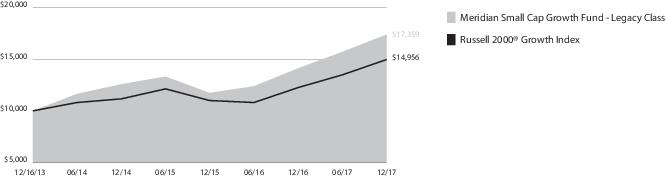
| Legacy Class (MSGGX) | 12/16/13 | 10.55% | 22.86% | 11.36% | — | — | 14.62% |
| Institutional Class (MSGRX) | 12/24/14 | 10.59% | 22.96% | 11.47% | — | — | 11.49% |
| Class A (MSGAX) w/o sales charge | 12/16/13 | 10.41% | 22.60% | 11.00% | — | — | 14.25% |
| Class A (MSGAX) with sales charge1 | 12/16/13 | 4.05% | 15.53% | 8.81% | — | — | 12.59% |
| Class C (MSGCX) | 7/1/15 | 10.03% | 21.65% | — | — | — | 10.12% |
| Investor Class (MISGX) | 12/16/13 | 10.50% | 22.83% | 11.30% | — | — | 14.57% |
| Russell 2000® Growth Index | 12/16/13 2 | 11.09% | 22.17% | 11.32% | 15.21% | 9.19% | 10.47% |
| 1 | Assuming maximum sales charge, if any. Class A Shares are subject to a maximum initial sales charge of 5.75%. |
| 2 | Inception date of Legacy Class Shares. |
| Meridian Funds | 18 | www.meridianfund.com |
Table of Contents
Portfolio Composition (Unaudited)
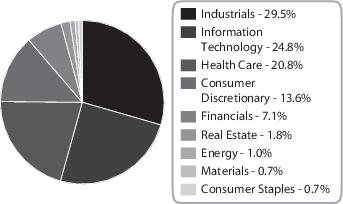
12.31.17
| TriNet Group, Inc. | 2.56% |
| Sally Beauty Holdings, Inc. | 2.31% |
| Heritage-Crystal Clean, Inc. | 2.07% |
| Kirby Corp. | 2.01% |
| Heartland Express, Inc. | 1.88% |
| SP Plus Corp. | 1.83% |
| Carter's, Inc. | 1.82% |
| Multi-Color Corp. | 1.75% |
| InnerWorkings, Inc. | 1.74% |
| Wolverine World Wide, Inc. | 1.71% |
| Meridian Funds | 19 | www.meridianfund.com |
Table of Contents
| Actual | Annualized Expense Ratio | Beginning Account Value July 1, 2017 | Ending Account Value December 31, 2017 | Expenses Paid During the Period 1 |
| Legacy Class (MERDX) | 0.85% | $1,000.00 | $1,110.50 | $4.52 |
| Institutional Class (MRRGX) | 0.85% | $1,000.00 | $1,110.50 | $4.52 |
| Class A(MRAGX) | 1.16% | $1,000.00 | $1,108.80 | $6.17 |
| Class C(MRCGX) | 1.88% | $1,000.00 | $1,104.60 | $9.97 |
| Investor Class (MRIGX) | 0.92% | $1,000.00 | $1,110.00 | $4.89 |
| Hypothetical 2 | Annualized Expense Ratio | Beginning Account Value July 1, 2017 | Ending Account Value December 31, 2017 | Expenses Paid During the Period 1 |
| Legacy Class (MERDX) | 0.85% | $1,000.00 | $1,020.92 | $4.33 |
| Institutional Class (MRRGX) | 0.85% | $1,000.00 | $1,020.92 | $4.33 |
| Class A(MRAGX) | 1.16% | $1,000.00 | $1,019.36 | $5.90 |
| Class C(MRCGX) | 1.88% | $1,000.00 | $1,015.73 | $9.55 |
| Investor Class (MRIGX) | 0.92% | $1,000.00 | $1,020.57 | $4.69 |
| 1 | Expenses are equal to the Fund’s annualized expense ratio multiplied by the average account value over the period, multiplied by 184 days, the number of days in the most recent fiscal half-year, then divided by 365. |
| 2 | Hypothetical 5% return before expenses. |
| Meridian Funds | 20 | www.meridianfund.com |
Table of Contents
| Actual | Annualized Expense Ratio | Beginning Account Value July 1, 2017 | Ending Account Value December 31, 2017 | Expenses Paid During the Period 1 |
| Legacy Class(MVALX) | 1.11% | $1,000.00 | $1,166.70 | $ 6.06 |
| Class A(MFCAX) | 1.60% | $1,000.00 | $1,163.70 | $ 8.73 |
| Class C(MFCCX) | 2.13% | $1,000.00 | $1,160.70 | $11.60 |
| Investor Class(MFCIX) | 1.35% | $1,000.00 | $1,165.30 | $ 7.37 |
| Hypothetical 2 | Annualized Expense Ratio | Beginning Account Value July 1, 2017 | Ending Account Value December 31, 2017 | Expenses Paid During the Period 1 |
| Legacy Class(MVALX) | 1.11% | $1,000.00 | $1,019.61 | $ 5.65 |
| Class A(MFCAX) | 1.60% | $1,000.00 | $1,017.14 | $ 8.13 |
| Class C(MFCCX) | 2.13% | $1,000.00 | $1,014.47 | $10.82 |
| Investor Class(MFCIX) | 1.35% | $1,000.00 | $1,018.40 | $ 6.87 |
| 1 | Expenses are equal to the Fund’s annualized expense ratio multiplied by the average account value over the period, multiplied by 184 days, the number of days in the most recent fiscal half-year, then divided by 365. |
| 2 | Hypothetical 5% return before expenses. |
| Meridian Funds | 21 | www.meridianfund.com |
Table of Contents
| Actual | Annualized Expense Ratio | Beginning Account Value July 1, 2017 | Ending Account Value December 31, 2017 | Expenses Paid During the Period 1 |
| Legacy Class (MEIFX) | 1.24% | $1,000.00 | $1,189.10 | $ 6.84 |
| Class A(MRAEX) | 1.60% | $1,000.00 | $1,186.40 | $ 8.82 |
| Class C(MRCEX) | 2.00% | $1,000.00 | $1,183.50 | $11.01 |
| Investor Class (MRIEX) | 1.35% | $1,000.00 | $1,187.90 | $ 7.44 |
| Hypothetical 2 | Annualized Expense Ratio | Beginning Account Value July 1, 2017 | Ending Account Value December 31, 2017 | Expenses Paid During the Period 1 |
| Legacy Class (MEIFX) | 1.24% | $1,000.00 | $1,018.95 | $ 6.31 |
| Class A(MRAEX) | 1.60% | $1,000.00 | $1,017.14 | $ 8.13 |
| Class C(MRCEX) | 2.00% | $1,000.00 | $1,015.12 | $10.16 |
| Investor Class (MRIEX) | 1.35% | $1,000.00 | $1,018.40 | $ 6.87 |
| 1 | Expenses are equal to the Fund’s annualized expense ratio multiplied by the average account value over the period, multiplied by 184 days, the number of days in the most recent fiscal half-year, then divided by 365. |
| 2 | Hypothetical 5% return before expenses. |
| Meridian Funds | 22 | www.meridianfund.com |
Table of Contents
| Actual | Annualized Expense Ratio | Beginning Account Value July 1, 2017 | Ending Account Value December 31, 2017 | Expenses Paid During the Period 1 |
| Legacy Class (MSGGX) | 1.15% | $1,000.00 | $1,105.50 | $ 6.10 |
| Institutional Class (MSGRX) | 1.10% | $1,000.00 | $1,105.90 | $ 5.84 |
| Class A(MSGAX) | 1.39% | $1,000.00 | $1,104.10 | $ 7.37 |
| Class C(MSGCX) | 2.12% | $1,000.00 | $1,100.30 | $11.22 |
| Investor Class (MISGX) | 1.15% | $1,000.00 | $1,105.00 | $ 6.10 |
| Hypothetical 2 | Annualized Expense Ratio | Beginning Account Value July 1, 2017 | Ending Account Value December 31, 2017 | Expenses Paid During the Period 1 |
| Legacy Class (MSGGX) | 1.15% | $1,000.00 | $1,019.41 | $ 5.85 |
| Institutional Class (MSGRX) | 1.10% | $1,000.00 | $1,019.66 | $ 5.60 |
| Class A(MSGAX) | 1.39% | $1,000.00 | $1,018.20 | $ 7.07 |
| Class C(MSGCX) | 2.12% | $1,000.00 | $1,014.52 | $10.76 |
| Investor Class (MISGX) | 1.15% | $1,000.00 | $1,019.41 | $ 5.85 |
| 1 | Expenses are equal to the Fund’s annualized expense ratio multiplied by the average account value over the period, multiplied by 184 days, the number of days in the most recent fiscal half-year, then divided by 365. |
| 2 | Hypothetical 5% return before expenses. |
| Meridian Funds | 23 | www.meridianfund.com |
Table of Contents
Performance and Expense Disclosures
| Meridian Funds | 24 | www.meridianfund.com |
Table of Contents
Schedule of Investments
| Shares | Value | |
| Common Stocks - 91.1% | ||
| Consumer Discretionary - 18.4% | ||
| Diversified Consumer Services - 3.5% | ||
| Grand Canyon Education, Inc.1 | 228,022 | $ 20,414,810 |
| ServiceMaster Global Holdings, Inc.1 | 762,576 | 39,097,271 |
| 59,512,081 | ||
| Hotels, Restaurants & Leisure - 1.6% | ||
| Dunkin' Brands Group, Inc.2 | 424,350 | 27,357,845 |
| Household Durables - 0.6% | ||
| Helen of Troy Ltd.1 | 107,087 | 10,317,832 |
| Leisure Products - 1.7% | ||
| Polaris Industries, Inc.2 | 226,076 | 28,031,163 |
| Media - 0.7% | ||
| National CineMedia, Inc. | 1,844,374 | 12,652,406 |
| Specialty Retail - 4.0% | ||
| Dick's Sporting Goods, Inc.2 | 281,914 | 8,102,209 |
| Monro Muffler Brake, Inc.2 | 361,593 | 20,592,721 |
| Sally Beauty Holdings, Inc.1,2 | 2,045,403 | 38,371,760 |
| 67,066,690 | ||
| Textiles, Apparel & Luxury Goods - 6.3% | ||
| Carter's, Inc.2 | 253,395 | 29,771,378 |
| Hanesbrands, Inc.2 | 797,269 | 16,670,895 |
| Lululemon Athletica, Inc.1 | 215,949 | 16,971,432 |
| Under Armour, Inc. Class C1,2 | 1,117,053 | 14,879,146 |
| Wolverine World Wide, Inc. | 897,412 | 28,609,495 |
| 106,902,346 | ||
| Total Consumer Discretionary | 311,840,363 | |
| Consumer Staples - 0.7% | ||
| Food & Staples Retailing - 0.7% | ||
| Casey's General Stores, Inc.2 | 98,606 | 11,037,956 |
| Total Consumer Staples | 11,037,956 | |
| Energy - 0.6% | ||
| Energy Equipment & Services - 0.6% | ||
| RigNet, Inc.1 | 658,963 | 9,851,497 |
| Total Energy | 9,851,497 | |
| Financials - 6.7% | ||
| Capital Markets - 5.7% | ||
| Financial Engines, Inc.2 | 644,508 | 19,528,593 |
| Legacy Acquisition Corp.1 | 1,422,226 | 14,136,927 |
| LPL Financial Holdings, Inc. | 741,281 | 42,356,796 |
| WisdomTree Investments, Inc.2 | 1,575,684 | 19,774,834 |
| 95,797,150 | ||
| Commercial Banks - 1.0% | ||
| Bank of the Ozarks, Inc. | 354,327 | 17,167,143 |
| Total Financials | 112,964,293 | |
| Shares | Value | |
| Health Care - 16.8% | ||
| Biotechnology - 5.0% | ||
| Alnylam Pharmaceuticals, Inc.1,2 | 61,947 | $ 7,870,366 |
| Atara Biotherapeutics, Inc. 1,2 | 532,958 | 9,646,540 |
| Bluebird Bio, Inc.1 | 55,574 | 9,897,729 |
| DBV Technologies SA ADR (France)1,2 | 325,039 | 7,995,959 |
| Dyax Corp. CVR1 | 316,946 | 351,810 |
| Exact Sciences Corp.1,2 | 275,359 | 14,467,362 |
| Immunomedics, Inc.1,2 | 811,990 | 13,121,759 |
| Juno Therapeutics, Inc.1 | 214,789 | 9,818,005 |
| Neurocrine Biosciences, Inc.1,2 | 147,413 | 11,437,775 |
| 84,607,305 | ||
| Health Care Equipment & Supplies - 5.4% | ||
| ABIOMED, Inc.1 | 40,288 | 7,550,374 |
| Cooper Cos., Inc. (The) | 62,455 | 13,607,695 |
| DexCom, Inc.1,2 | 223,119 | 12,804,799 |
| Endologix, Inc.1,2 | 1,762,070 | 9,427,075 |
| Insulet Corp.1,2 | 112,716 | 7,777,404 |
| Nevro Corp. 1,2 | 135,198 | 9,334,070 |
| STERIS Plc (United Kingdom) | 360,223 | 31,508,706 |
| 92,010,123 | ||
| Health Care Providers & Services - 1.6% | ||
| Healthequity, Inc.1,2 | 145,245 | 6,777,132 |
| MEDNAX 1 | 363,179 | 19,408,286 |
| 26,185,418 | ||
| Health Care Technology - 1.5% | ||
| athenahealth, Inc.1,2 | 122,168 | 16,253,231 |
| Medidata Solutions, Inc.1,2 | 135,847 | 8,608,624 |
| 24,861,855 | ||
| Life Sciences Tools & Services - 1.1% | ||
| INC Research Holdings, Inc. Class A1,2 | 428,148 | 18,667,253 |
| Pharmaceuticals - 2.2% | ||
| Catalent Inc. 1 | 182,821 | 7,510,287 |
| Moderna Therapeutics , Inc. Acquisition Date: 8/8/16, Cost $5,764,9481,3,4 | 656,600 | 5,764,948 |
| Prestige Brands Holdings, Inc.1,2 | 277,470 | 12,322,443 |
| Revance Therapeutics, Inc.1,2 | 324,910 | 11,615,532 |
| 37,213,210 | ||
| Total Health Care | 283,545,164 | |
| Industrials - 26.5% | ||
| Aerospace & Defense - 1.2% | ||
| HEICO Corp. Class A | 247,394 | 19,556,496 |
| Meridian Funds | 25 | www.meridianfund.com |
Table of Contents
Schedule of Investments (continued)
| Shares | Value | |
| Air Freight & Logistics - 1.3% | ||
| Forward Air Corp. | 368,870 | $ 21,187,893 |
| Building Products - 1.0% | ||
| ALLEGION Plc (Ireland) | 219,951 | 17,499,301 |
| Commercial Services & Supplies - 4.7% | ||
| ABM Industries, Inc. | 253,856 | 9,575,449 |
| Clean Harbors, Inc.1 | 542,439 | 29,400,194 |
| Multi-Color Corp. | 378,285 | 28,314,632 |
| Ritchie Bros. Auctioneers, Inc. (Canada)2 | 434,368 | 13,000,634 |
| 80,290,909 | ||
| Electrical Equipment - 2.5% | ||
| Sensata Technologies Holding N.V. (Netherlands)1,2 | 826,560 | 42,245,482 |
| Machinery - 7.6% | ||
| John Bean Technologies Corp. | 106,811 | 11,834,659 |
| Kennametal, Inc. | 549,958 | 26,623,467 |
| Middleby Corp. (The)1,2 | 108,444 | 14,634,518 |
| Proto Labs, Inc.1,2 | 200,189 | 20,619,467 |
| Tennant Co.2 | 348,711 | 25,333,854 |
| Wabtec Corp.2 | 260,646 | 21,224,404 |
| Woodward, Inc. | 107,560 | 8,232,642 |
| 128,503,011 | ||
| Marine - 1.9% | ||
| Kirby Corp.1,2 | 482,273 | 32,215,836 |
| Professional Services - 2.6% | ||
| TriNet Group, Inc.1 | 1,004,116 | 44,522,503 |
| Road & Rail - 1.7% | ||
| Heartland Express, Inc.2 | 1,244,551 | 29,047,820 |
| Roadrunner Transportation Systems, Inc.1 | 2,835 | 21,858 |
| 29,069,678 | ||
| Trading Companies & Distributors - 2.0% | ||
| MSC Industrial Direct Co., Inc. Class A | 351,928 | 34,017,360 |
| Total Industrials | 449,108,469 | |
| Information Technology - 19.0% | ||
| Electronic Equipment & Instruments - 2.4% | ||
| CDW Corp. | 310,182 | 21,554,547 |
| Trimble Navigation Ltd.1 | 460,884 | 18,730,326 |
| 40,284,873 | ||
| Internet Software & Services - 5.1% | ||
| 2U, Inc.1,2 | 282,533 | 18,226,204 |
| ChannelAdvisor Corp.1 | 757,064 | 6,813,576 |
| Cimpress, N.V. (Netherlands)1,2 | 173,892 | 20,846,173 |
| CoStar Group, Inc.1 | 27,613 | 8,199,680 |
| New Relic, Inc. 1 | 157,911 | 9,122,518 |
| Shares | Value | |
| Shutterstock, Inc.1,2 | 534,816 | $ 23,013,133 |
| 86,221,284 | ||
| IT Services - 3.7% | ||
| Euronet Worldwide, Inc.1 | 96,436 | 8,126,662 |
| Gartner, Inc.1 | 86,108 | 10,604,200 |
| MAXIMUS, Inc. | 183,704 | 13,149,532 |
| Presidio, Inc.1,2 | 770,397 | 14,768,511 |
| Switch, Inc. Class A2 | 873,937 | 15,896,914 |
| 62,545,819 | ||
| Software - 6.5% | ||
| Barracuda Networks, Inc.1 | 482,725 | 13,274,937 |
| Cadence Design Systems, Inc.1 | 342,408 | 14,319,503 |
| Callidus Software, Inc.1 | 485,750 | 13,916,737 |
| CyberArk Software Ltd.1 | 227,099 | 9,399,628 |
| Descartes Systems Group, Inc. (The) (Canada)1 | 529,777 | 15,045,667 |
| RealPage, Inc.1 | 287,911 | 12,754,457 |
| SS&C Technologies Holdings, Inc. | 757,339 | 30,657,083 |
| 109,368,012 | ||
| Technology Hardware, Storage & Peripherals - 1.3% | ||
| 3D Systems1,2 | 931,878 | 8,051,426 |
| Stratasys Ltd.1,2 | 713,053 | 14,232,538 |
| 22,283,964 | ||
| Total Information Technology | 320,703,952 | |
| Materials - 1.0% | ||
| Containers & Packaging - 1.0% | ||
| Graphic Packaging Holding Co. | 1,107,161 | 17,105,637 |
| Total Materials | 17,105,637 | |
| Real Estate - 0.9% | ||
| Equity Real Estate Investment Trusts (REITS) - 0.9% | ||
| National Storage Affiliates Trust | 567,898 | 15,480,899 |
| Total Real Estate | 15,480,899 | |
| Utilities - 0.5% | ||
| Water Utilities - 0.5% | ||
| Evoqua Water Technologies Corp.1 | 354,282 | 8,400,026 |
| Total Utilities | 8,400,026 | |
| Total Common Stocks - 91.1% (Cost $1,188,064,449) | 1,540,038,256 | |
| Meridian Funds | 26 | www.meridianfund.com |
Table of Contents
Schedule of Investments (continued)
| Shares/ Principal Amount | Value | |
| Short-Term Investments - 11.8%5 | ||
| Money Market Funds - 1.6% | ||
| BlackRock Liquidity Funds FedFund Portfolio, 1.17% | 8,870,000 | $ 8,870,000 |
| Invesco Short Term Investments, Government & Agency Portfolio, 1.18% | 8,928,000 | 8,928,000 |
| Morgan Stanley Liquidity Funds, Government Portfolio, Institutional Class, 1.20% | 8,657,000 | 8,657,000 |
| Total Money Market Funds | 26,455,000 | |
| Repurchase Agreements - 10.2% | ||
| Citigroup Global Markets, Inc., dated 12/29/17, due 1/2/18, 1.41% total to be received $46,551,468 (collateralized by various U.S. Government Sponsored Agency and U.S. Treasury Obligations, 0.00% - 9.00%, 4/1/18 - 8/20/67, totaling $47,475,059) | $ 46,544,176 | 46,544,176 |
| Daiwa Capital Markets America, Inc., dated 12/29/17, due 1/2/18, 1.43% total to be received $46,551,571 (collateralized by various U.S. Government Sponsored Agency and U.S. Treasury Obligations, 0.00% - 6.50%, 1/11/18 - 12/1/51, totaling $47,475,061) | 46,544,176 | 46,544,176 |
| Shares/ Principal Amount | Value | |
| HSBC Securities, Inc., dated 12/29/17, due 1/2/18, 1.36% total to be received $33,884,657 (collateralized by various U.S. Treasury Obligations, 0.00% - 9.13%, 12/31/17 - 5/15/47, totaling $34,557,400) | $ 33,879,537 | $ 33,879,537 |
| RBC Dominion Securities, Inc., dated 12/29/17, due 1/2/18, 1.40% total to be received $46,551,416 (collateralized by various U.S. Government Sponsored Agency and U.S. Treasury Obligations, 1.88% - 8.88%, 2/15/19 - 12/20/47, totaling $47,475,060) | 46,544,176 | 46,544,176 |
| Total Repurchase Agreements | 173,512,065 | |
| Total Short-Term Investments - 11.8% (Cost $199,967,065) | 199,967,065 | |
| Total Investments - 102.9% (Cost $1,388,031,514) | 1,740,005,321 | |
| Liabilities in Excess of Other Assets - (2.9)% | (48,543,192) | |
| Net Assets - 100.0% | $1,691,462,129 |
| Meridian Funds | 27 | www.meridianfund.com |
Table of Contents
Schedule of Investments (continued)
| ADR—American Depositary Receipt |
| CVR—Contingent Value Rights |
| N.V.—Naamloze Vennootschap is the Dutch term for limited liability company |
| Plc—Public Limited Company |
| 1 | Non-income producing securities. |
| 2 | All or portion of this security is on loan at December 31, 2017. Total value of such securities at period-end amounts to $247,244,191 and represents 14.62% of net assets. |
| 3 | Level 3 security. See Note 1 in Notes to Financial Statements. |
| 4 | Restricted security; cannot be offered for public resale without first being registered under the Securities Act of 1933 and related rules. Acquisition date represents the date on which an enforceable right to acquire such security is obtained and is presented along with related cost in the security description. The Fund has registration rights for certain restricted securities. Any costs related to such registration are borne by the issuer. The aggregate value of restricted securities at period-end amounts to $5,764,948 and represents 0.34% of net assets. |
| 5 | Collateral received from brokers for securities lending was invested in short-term investments. |
| Meridian Funds | 28 | www.meridianfund.com |
Table of Contents
Schedule of Investments
| Shares | Value | |
| Common Stocks - 93.2% | ||
| Consumer Discretionary - 8.9% | ||
| Auto Components - 1.1% | ||
| Ford Motor Co. | 250,000 | $ 3,122,500 |
| Superior Industries International, Inc.1 | 285,000 | 4,232,250 |
| 7,354,750 | ||
| Diversified Consumer Services - 0.7% | ||
| Regis Corp.2 | 305,601 | 4,694,031 |
| Hotels, Restaurants & Leisure - 1.5% | ||
| Brinker International, Inc.1 | 255,000 | 9,904,200 |
| Leisure Products - 1.5% | ||
| Polaris Industries, Inc.1 | 77,000 | 9,547,230 |
| Media - 2.6% | ||
| Lions Gate Entertainment Corp. Class B (Canada)2 | 534,000 | 16,949,160 |
| Multiline Retail - 1.5% | ||
| Kohl's Corp.1 | 184,000 | 9,978,320 |
| Total Consumer Discretionary | 58,427,691 | |
| Consumer Staples - 4.6% | ||
| Beverages - 2.0% | ||
| Diageo Plc ADR (United Kingdom) | 88,512 | 12,925,407 |
| Food Products - 2.6% | ||
| Nomad Foods Ltd. (United Kingdom)2 | 1,024,000 | 17,315,840 |
| Total Consumer Staples | 30,241,247 | |
| Energy - 8.0% | ||
| Energy Equipment & Services - 0.8% | ||
| Core Laboratories N.V. (Netherlands)1 | 52,000 | 5,696,600 |
| Oil, Gas & Consumable Fuels - 7.2% | ||
| California Resources Corp.1,2 | 531,271 | 10,327,908 |
| EOG Resources, Inc. | 189,826 | 20,484,124 |
| TOTAL SA ADR (France)1 | 296,000 | 16,362,880 |
| 47,174,912 | ||
| Total Energy | 52,871,512 | |
| Financials - 7.5% | ||
| Commercial Banks - 7.5% | ||
| Bank of Hawaii Corp.1 | 73,968 | 6,339,058 |
| Citizens Financial Group, Inc. | 395,409 | 16,599,270 |
| U.S. Bancorp | 182,000 | 9,751,560 |
| Umpqua Holdings Corp.1 | 791,000 | 16,452,800 |
| Total Financials | 49,142,688 | |
| Shares | Value | |
| Health Care - 13.4% | ||
| Biotechnology - 8.2% | ||
| Achillion Pharmaceuticals, Inc.1,2 | 925,000 | $ 2,664,000 |
| Agios Pharmaceuticals, Inc.1,2 | 137,000 | 7,832,290 |
| Celgene Corp.2 | 155,000 | 16,175,800 |
| Immunomedics, Inc.1,2 | 400,000 | 6,464,000 |
| Juno Therapeutics, Inc.1,2 | 216,796 | 9,909,745 |
| Neurocrine Biosciences, Inc.1,2 | 139,022 | 10,786,717 |
| 53,832,552 | ||
| Life Sciences Tools & Services - 1.3% | ||
| Accelerate Diagnostics, Inc.1,2 | 317,769 | 8,325,548 |
| Pharmaceuticals - 3.9% | ||
| Nektar Therapeutics1,2 | 429,997 | 25,679,421 |
| Total Health Care | 87,837,521 | |
| Industrials - 9.9% | ||
| Aerospace & Defense - 1.2% | ||
| KLX, Inc.2 | 117,000 | 7,985,250 |
| Building Products - 0.9% | ||
| Advanced Drainage Systems, Inc.1 | 241,000 | 5,747,850 |
| Commercial Services & Supplies - 0.7% | ||
| HNI Corp. | 120,000 | 4,628,400 |
| Machinery - 2.7% | ||
| Xylem, Inc. | 256,610 | 17,500,802 |
| Road & Rail - 1.0% | ||
| Genesee & Wyoming, Inc. Class A1,2 | 84,000 | 6,613,320 |
| Trading Companies & Distributors - 3.4% | ||
| H&E Equipment Services, Inc. | 295,100 | 11,995,815 |
| WESCO International, Inc.2 | 155,000 | 10,563,250 |
| 22,559,065 | ||
| Total Industrials | 65,034,687 | |
| Information Technology - 23.3% | ||
| Electronic Equipment & Instruments - 1.5% | ||
| Trimble Navigation Ltd.2 | 247,156 | 10,044,420 |
| Internet Software & Services - 2.1% | ||
| Benefitfocus, Inc.1,2 | 185,000 | 4,995,000 |
| Nutanix, Inc. Class A1,2 | 245,000 | 8,643,600 |
| 13,638,600 | ||
| IT Services - 3.7% | ||
| Acxiom Corp.2 | 401,645 | 11,069,336 |
| CACI International, Inc. Class A2 | 100,800 | 13,340,880 |
| 24,410,216 | ||
| Semiconductors - 6.4% | ||
| Ambarella, Inc.1,2 | 65,000 | 3,818,750 |
| Mellanox Technologies Ltd. (Israel)1,2 | 110,000 | 7,117,000 |
| Meridian Funds | 29 | www.meridianfund.com |
Table of Contents
Schedule of Investments (continued)
| Shares | Value | |
| Micron Technology, Inc.2 | 311,772 | $ 12,820,065 |
| NVIDIA Corp. | 45,742 | 8,851,077 |
| Synaptics, Inc.2 | 230,000 | 9,186,200 |
| 41,793,092 | ||
| Software - 7.7% | ||
| FireEye, Inc.1,2 | 731,049 | 10,380,896 |
| Microsoft Corp. | 269,200 | 23,027,368 |
| Verint Systems, Inc.2 | 417,000 | 17,451,450 |
| 50,859,714 | ||
| Technology Hardware, Storage & Peripherals - 1.9% | ||
| Apple, Inc. | 75,000 | 12,692,250 |
| Total Information Technology | 153,438,292 | |
| Materials - 10.3% | ||
| Chemicals - 1.8% | ||
| Agrium, Inc. (Canada)1 | 105,777 | 12,164,355 |
| Construction Materials - 2.4% | ||
| Summit Materials Inc. Class A1,2 | 168,421 | 5,295,156 |
| U.S. Concrete, Inc.1,2 | 127,200 | 10,640,280 |
| 15,935,436 | ||
| Containers & Packaging - 4.2% | ||
| Graphic Packaging Holding Co. | 1,084,000 | 16,747,800 |
| Owens-Illinois, Inc.2 | 492,200 | 10,912,074 |
| 27,659,874 | ||
| Metals & Mining - 1.9% | ||
| Newmont Mining Corp. | 326,000 | 12,231,520 |
| Total Materials | 67,991,185 | |
| Real Estate - 4.9% | ||
| Equity Real Estate Investment Trusts (REITS) - 2.0% | ||
| Rayonier, Inc. | 406,080 | 12,844,310 |
| Real Estate Management & Development - 2.9% | ||
| Alexander & Baldwin, Inc. | 446,677 | 12,390,820 |
| Kennedy-Wilson Holdings, Inc. 1 | 400,000 | 6,940,000 |
| 19,330,820 | ||
| Total Real Estate | 32,175,130 | |
| Telecommunication Services - 1.7% | ||
| Diversified Telecommunications - 1.7% | ||
| Iridium Communications, Inc.1,2 | 935,515 | 11,039,077 |
| Total Telecommunication Services | 11,039,077 | |
| Utilities - 0.7% | ||
| Water Utilities - 0.7% | ||
| AquaVenture Holdings Ltd.1,2 | 300,000 | 4,656,000 |
| Total Utilities | 4,656,000 | |
| Total Common Stocks - 93.2% (Cost $429,016,150) | 612,855,030 | |
| Shares/ Principal Amount | Value | |
| Short-Term Investments - 17.5%3 | ||
| Money Market Funds - 2.2% | ||
| BlackRock Liquidity Funds FedFund Portfolio, 1.17% | 4,865,000 | $ 4,865,000 |
| Invesco Short Term Investments, Government & Agency Portfolio, 1.18% | 4,897,000 | 4,897,000 |
| Morgan Stanley Liquidity Funds, Government Portfolio, Institutional Class, 1.20% | 4,747,000 | 4,747,000 |
| Total Money Market Funds | 14,509,000 | |
| Repurchase Agreements - 15.3% | ||
| Citigroup Global Markets, Inc., dated 12/29/17, due 1/2/18, 1.41% total to be received $26,782,456 (collateralized by various U.S. Government Sponsored Agency and U.S. Treasury Obligations, 0.00% - 9.00%, 4/1/18 - 8/20/67, totaling $27,313,826) | $ 26,778,261 | 26,778,261 |
| Daiwa Capital Markets America, Inc., dated 12/29/17, due 1/2/18, 1.43% total to be received $26,782,516 (collateralized by various U.S. Government Sponsored Agency and U.S. Treasury Obligations, 0.00% - 6.50%, 1/11/18 - 12/1/51, totaling $27,313,827) | 26,778,261 | 26,778,261 |
| HSBC Securities, Inc., dated 12/29/17, due 1/2/18, 1.36% total to be received $20,206,598 (collateraized by various U.S. Treasury Obligations, 0.00% - 9.13%, 12/31/17 - 5/15/47, totaling $20,607,778) | 20,203,545 | 20,203,545 |
| Meridian Funds | 30 | www.meridianfund.com |
Table of Contents
Schedule of Investments (continued)
| Shares/ Principal Amount | Value | |
| RBC Dominion Securities, Inc., dated 12/29/17, due 1/2/18, 1.40% total to be received $26,782,427 (collateralized by various U.S. Government Sponsored Agency and U.S. Treasury Obligations, 1.88% - 8.88%, 2/15/19 - 12/20/47, totaling $27,313,826) | $ 26,778,261 | $ 26,778,261 |
| Total Repurchase Agreements | 100,538,328 | |
| Total Short-Term Investments - 17.5% (Cost $115,047,328) | 115,047,328 | |
| Total Investments - 110.7% (Cost $544,063,478) | 727,902,358 | |
| Liabilities in Excess of Other Assets - (10.7)% | (70,383,283) | |
| Net Assets - 100.0% | $ 657,519,075 |
| Value | ||
| Call Option Written - (0.3)% | ||
| Total Call Option Written - (0.3)% (Premium received $(161,283)) | $(2,169,000) | |
| ADR—American Depositary Receipt |
| N.V.—Naamloze Vennootschap is the Dutch term for limited liability company |
| Plc—Public Limited Company |
| 1 | All or portion of this security is on loan at December 31, 2017. Total value of such securities at period-end amounts to $134,728,043 and represents 20.49% of net assets. |
| 2 | Non-income producing securities. |
| 3 | Collateral received from brokers for securities lending was invested in short-term investments. |
| Exchange-Traded Options Written | ||||||||||||
| Description | Strike Price | Expiration Date | Number of Contracts | Notional Amount | Premium Received | Value | ||||||
| Call | ||||||||||||
| Nektar Therapeutics | 35.00 | 1/19/18 | (900) | $5,374,800 | $(161,283) | $(2,169,000) | ||||||
| Meridian Funds | 31 | www.meridianfund.com |
Table of Contents
Schedule of Investments
| Shares | Value | |
| Common Stocks - 77.3% | ||
| Consumer Discretionary - 15.1% | ||
| Hotels, Restaurants & Leisure - 4.6% | ||
| Las Vegas Sands Corp. | 25,000 | $ 1,737,250 |
| Starbucks Corp. | 14,172 | 813,898 |
| 2,551,148 | ||
| Internet & Direct Marketing Retail - 2.9% | ||
| Amazon.com, Inc.1 | 1,400 | 1,637,258 |
| Media - 6.4% | ||
| Roku, Inc.1,2 | 60,000 | 3,106,800 |
| Walt Disney Co. (The)2 | 4,724 | 507,877 |
| 3,614,677 | ||
| Specialty Retail - 1.2% | ||
| Best Buy Co., Inc. | 10,000 | 684,700 |
| Total Consumer Discretionary | 8,487,783 | |
| Consumer Staples - 3.1% | ||
| Food & Staples Retailing - 1.5% | ||
| Costco Wholesale Corp.2 | 4,724 | 879,231 |
| Tobacco - 1.6% | ||
| Altria Group, Inc. | 12,440 | 888,340 |
| Total Consumer Staples | 1,767,571 | |
| Energy - 6.0% | ||
| Oil, Gas & Consumable Fuels - 6.0% | ||
| California Resources Corp.1,3 | 94,383 | 1,834,805 |
| Cheniere Energy, Inc.1 | 28,344 | 1,526,041 |
| Total Energy | 3,360,846 | |
| Financials - 6.9% | ||
| Capital Markets - 1.0% | ||
| Intercontinental Exchange, Inc. | 8,000 | 564,480 |
| Commercial Banks - 5.9% | ||
| Citigroup, Inc. | 14,267 | 1,061,607 |
| JPMorgan Chase & Co. | 9,570 | 1,023,416 |
| U.S. Bancorp | 23,232 | 1,244,771 |
| 3,329,794 | ||
| Total Financials | 3,894,274 | |
| Health Care - 16.2% | ||
| Biotechnology - 15.1% | ||
| Alnylam Pharmaceuticals, Inc.1,3 | 16,000 | 2,032,800 |
| Celgene Corp.1 | 20,820 | 2,172,775 |
| Exact Sciences Corp.1,3 | 28,888 | 1,517,776 |
| Juno Therapeutics, Inc.1 | 25,000 | 1,142,750 |
| Vertex Pharmaceuticals, Inc.1 | 11,000 | 1,648,460 |
| 8,514,561 | ||
| Life Sciences Tools & Services - 1.1% | ||
| Accelerate Diagnostics, Inc.1,3 | 22,724 | 595,369 |
| Total Health Care | 9,109,930 | |
| Shares | Value | |
| Information Technology - 23.1% | ||
| Internet Software & Services - 6.3% | ||
| Alphabet, Inc. Class A1,2 | 1,665 | $ 1,753,911 |
| Facebook, Inc. Class A1 | 10,000 | 1,764,600 |
| 3,518,511 | ||
| IT Services - 5.6% | ||
| MasterCard, Inc. Class A | 4,939 | 747,567 |
| Switch, Inc. Class A3 | 80,000 | 1,455,200 |
| Visa, Inc. Class A | 8,294 | 945,682 |
| 3,148,449 | ||
| Semiconductors - 4.1% | ||
| NVIDIA Corp. | 12,000 | 2,322,000 |
| Software - 4.3% | ||
| Microsoft Corp.2 | 28,000 | 2,395,120 |
| Technology Hardware, Storage & Peripherals - 2.8% | ||
| Apple, Inc.2 | 9,448 | 1,598,885 |
| Total Information Technology | 12,982,965 | |
| Materials - 4.6% | ||
| Chemicals - 0.9% | ||
| DowDuPont, Inc. | 7,166 | 510,363 |
| Metals & Mining - 3.7% | ||
| Royal Gold, Inc. | 24,971 | 2,050,618 |
| Total Materials | 2,560,981 | |
| Telecommunication Services - 1.2% | ||
| Wireless Telecommunication Services - 1.2% | ||
| T-Mobile US, Inc.1 | 11,000 | 698,610 |
| Total Telecommunication Services | 698,610 | |
| Utilities - 1.1% | ||
| Multi-Utilities - 1.1% | ||
| Dominion Resources, Inc. | 8,000 | 648,480 |
| Total Utilities | 648,480 | |
| Total Common Stocks - 77.3% (Cost $25,676,523) | 43,511,440 | |
| Principal Amount | ||
| Corporate Bonds - 6.8% | ||
| Energy - 6.8% | ||
| Oil, Gas & Consumable Fuels - 6.8% | ||
| California Resources Corp., 8.00%, 12/15/223,4 | $4,616,000 | 3,808,200 |
| Total Corporate Bonds - 6.8% (Cost $2,806,708) | 3,808,200 | |
| Meridian Funds | 32 | www.meridianfund.com |
Table of Contents
Schedule of Investments (continued)
| Value | ||
| Call Options Purchased - 12.8% | ||
| Total Call Options Purchased - 12.8% (Cost $5,702,351) | $ 7,192,055 | |
| Put Options Purchased - 2.4% | ||
| Total Put Options Purchased - 2.4% (Cost $2,196,515) | 1,335,125 | |
| Shares/ Principal Amount | ||
| Short-Term Investments - 14.8%5 | ||
| Money Market Funds - 1.9% | ||
| BlackRock Liquidity Funds FedFund Portfolio, 1.17% | 366,000 | 366,000 |
| Invesco Short Term Investments, Government & Agency Portfolio, 1.18% | 368,000 | 368,000 |
| Morgan Stanley Liquidity Funds, Government Portfolio, Institutional Class, 1.20% | 357,000 | 357,000 |
| Total Money Market Funds | 1,091,000 | |
| Repurchase Agreements - 12.9% | ||
| Citigroup Global Markets, Inc., dated 12/29/17, due 1/2/18, 1.41% total to be received $1,938,884 (collateralized by various U.S. Government Sponsored Agency and U.S. Treasury Obligations, 0.00% - 9.00%, 4/1/18 - 8/20/67, totaling $1,977,351) | $ 1,938,580 | 1,938,580 |
| Daiwa Capital Markets America, Inc., dated 12/29/17, due 1/2/18, 1.43% total to be received $1,938,888 (collateralized by various U.S. Government Sponsored Agency and U.S. Treasury Obligations, 0.00% - 6.50%, 1/11/18 - 12/1/51, totaling $1,977,352) | 1,938,580 | 1,938,580 |
| Shares/ Principal Amount | Value | |
| HSBC Securities, Inc., dated 12/29/17, due 1/2/18, 1.36% total to be received $1,422,208 (collateraized by various U.S. Treasury Obligations, 0.00% - 9.13%, 12/31/17 - 5/15/47, totaling $1,450,444) | $ 1,421,993 | $ 1,421,993 |
| RBC Dominion Securities, Inc., dated 12/29/17, due 1/2/18, 1.40% total to be received $1,938,882 (collateralized by various U.S. Government Sponsored Agency and U.S. Treasury Obligations, 1.88% - 8.88%, 2/15/19 - 12/20/47, totaling $1,977,352) | 1,938,580 | 1,938,580 |
| Total Repurchase Agreements | 7,237,733 | |
| Total Short-Term Investments - 14.8% (Cost $8,328,733) | 8,328,733 | |
| Total Investments - 114.1% (Cost $44,710,830) | 64,175,553 | |
| Liabilities in Excess of Other Assets - (14.1)% | (7,926,689) | |
| Net Assets - 100.0% | $56,248,864 |
| Shares | ||
| Securities Sold Short - (8.1)% | ||
| Telecommunication Services - (4.1)% | ||
| Diversified Telecommunications - (4.1)% | ||
| AT&T , Inc. | (25,000) | (972,000) |
| Verizon Communications, Inc. | (25,000) | (1,323,250) |
| Total Telecommunication Services | (2,295,250) | |
| Consumer Discretionary - (2.5)% | ||
| Household Products - (2.5)% | ||
| Procter & Gamble Co. (The) | (15,000) | (1,378,200) |
| Total Consumer Discretionary | (1,378,200) | |
| Meridian Funds | 33 | www.meridianfund.com |
Table of Contents
Schedule of Investments (continued)
| Shares | Value | |
| Consumer Staples - (1.5)% | ||
| Food & Staples Retailing - (1.5)% | ||
| Wal-Mart Stores, Inc. | (8,800) | $ (869,000) |
| Total Consumer Staples | (869,000) | |
| Total Securities - (8.1%) (Proceeds $(3,891,989)) | $ (4,542,450) | |
| Value | ||
| Put Options Written - (0.3)% | ||
| Total Put Options Written - (0.3)% (Premium received $(263,055)) | $(183,150) | |
| 1 | Non-income producing securities. |
| 2 | Securities, or a portion thereof, were pledged as collateral for securities sold short by the fund. |
| 3 | All or portion of this security is on loan at December 31, 2017. Total value of such securities at period-end amounts to $7,587,208 and represents 13.49% of net assets. |
| 4 | Security is exempt from registration pursuant to Rule 144A under the Securities Act of 1933. This security may be resold in transactions that are exempt from registration, normally to qualified institutional buyers. |
| 5 | Collateral received from brokers for securities lending was invested in short-term investments. |
| Exchange-Traded Options Purchased | ||||||||||||
| Description | Strike Price | Expiration Date | Number of Contracts | Notional Amount | Cost | Value | ||||||
| Call | ||||||||||||
| Best Buy Co., Inc. | 65.00 | 1/19/18 | 500 | $ 3,423,500 | $ 12,397 | $ 203,000 | ||||||
| Royal Gold, Inc. | 100.00 | 1/19/18 | 1,500 | 12,318,000 | 92,815 | 3,750 | ||||||
| SPDR Gold Shares | 155.00 | 1/19/18 | 2,300 | 28,439,500 | 39,724 | 1,150 | ||||||
| Twitter, Inc. | 30.00 | 1/19/18 | 250 | 600,250 | 47,617 | 750 | ||||||
| Best Buy Co., Inc. | 70.00 | 3/16/18 | 1,000 | 6,847,000 | 54,793 | 370,000 | ||||||
| SPDR Gold Shares | 139.00 | 3/16/18 | 900 | 11,128,500 | 13,314 | 11,700 | ||||||
| SPDR Gold Shares | 144.00 | 3/16/18 | 4,100 | 50,696,500 | 40,152 | 24,600 | ||||||
| Switch, Inc. | 20.00 | 5/18/18 | 500 | 909,500 | 50,847 | 52,500 | ||||||
| SPDR Gold Shares | 150.00 | 6/15/18 | 2,000 | 24,730,000 | 141,586 | 46,000 | ||||||
| Alnylam Pharmaceuticals, Inc. | 165.00 | 1/18/19 | 200 | 2,541,000 | 225,279 | 244,000 | ||||||
| Apple, Inc. | 180.00 | 1/18/19 | 100 | 1,692,300 | 95,624 | 126,000 | ||||||
| Apple, Inc. | 200.00 | 1/18/19 | 100 | 1,692,300 | 53,579 | 67,900 | ||||||
| Best Buy Co., Inc. | 70.00 | 1/18/19 | 1,000 | 6,847,000 | 329,298 | 860,000 | ||||||
| Best Buy Co., Inc. | 90.00 | 1/18/19 | 1,000 | 6,847,000 | 95,433 | 275,000 | ||||||
| Celgene Corp. | 150.00 | 1/18/19 | 500 | 5,218,000 | 95,537 | 90,000 | ||||||
| Costco Wholesale Corp. | 160.00 | 1/18/19 | 105 | 1,954,260 | 117,283 | 350,805 | ||||||
| Costco Wholesale Corp. | 180.00 | 1/18/19 | 105 | 1,954,260 | 53,098 | 209,475 | ||||||
| Dominion Energy, Inc. | 80.00 | 1/18/19 | 320 | 2,593,920 | 110,414 | 164,480 | ||||||
| Dominion Energy, Inc. | 85.00 | 1/18/19 | 320 | 2,593,920 | 75,474 | 92,800 | ||||||
| Dominion Energy, Inc. | 90.00 | 1/18/19 | 800 | 6,484,800 | 86,634 | 96,000 | ||||||
| NVIDIA Corp. | 200.00 | 1/18/19 | 100 | 1,935,000 | 136,079 | 284,500 | ||||||
| Royal Gold, Inc. | 100.00 | 1/18/19 | 150 | 1,231,800 | 113,029 | 53,550 | ||||||
| Royal Gold, Inc. | 120.00 | 1/18/19 | 400 | 3,284,800 | 156,517 | 40,000 | ||||||
| Starbucks Corp. | 70.00 | 1/18/19 | 1,000 | 5,743,000 | 72,603 | 112,000 | ||||||
| Facebook, Inc. | 200.00 | 12/20/19 | 100 | 1,764,600 | 242,989 | 211,300 | ||||||
| Facebook, Inc. | 240.00 | 12/20/19 | 500 | 8,823,000 | 661,967 | 527,500 | ||||||
| Meridian Funds | 34 | www.meridianfund.com |
Table of Contents
Schedule of Investments (continued)
| Exchange-Traded Options Purchased | ||||||||||||
| Description | Strike Price | Expiration Date | Number of Contracts | Notional Amount | Cost | Value | ||||||
| Apple, Inc. | 200.00 | 1/17/20 | 500 | $ 8,461,500 | $ 475,396 | $ 690,000 | ||||||
| CBS Corp. | 55.00 | 1/17/20 | 500 | 2,950,000 | 489,397 | 535,000 | ||||||
| NIKE, Inc. | 55.00 | 1/17/20 | 409 | 2,558,295 | 230,159 | 513,295 | ||||||
| Royal Gold, Inc. | 85.00 | 1/17/20 | 300 | 2,463,600 | 501,088 | 345,000 | ||||||
| Royal Gold, Inc. | 100.00 | 1/17/20 | 500 | 4,106,000 | 545,886 | 315,000 | ||||||
| Starbucks Corp. | 70.00 | 1/17/20 | 1,000 | 5,743,000 | 246,343 | 275,000 | ||||||
| Total | $5,702,351 | $7,192,055 | ||||||||||
| Put | ||||||||||||
| Netflix, Inc. | 100.00 | 1/19/18 | 100 | $ 1,919,600 | $ 60,942 | $ 100 | ||||||
| Netflix, Inc. | 150.00 | 1/19/18 | 100 | 1,919,600 | 50,079 | 1,200 | ||||||
| Netflix, Inc. | 195.00 | 1/19/18 | 200 | 3,839,200 | 220,159 | 122,600 | ||||||
| Tesla, Inc. | 320.00 | 1/19/18 | 50 | 1,556,750 | 130,540 | 79,650 | ||||||
| Tesla, Inc. | 300.00 | 1/19/18 | 50 | 1,556,750 | 109,540 | 31,500 | ||||||
| Tesla, Inc. | 250.00 | 1/19/18 | 250 | 7,783,750 | 80,038 | 11,250 | ||||||
| Wal-Mart Stores, Inc. | 70.00 | 1/19/18 | 450 | 4,443,750 | 37,390 | 225 | ||||||
| Netflix, Inc. | 150.00 | 3/16/18 | 100 | 1,919,600 | 51,579 | 13,700 | ||||||
| Tesla, Inc. | 350.00 | 3/16/18 | 50 | 1,556,750 | 151,040 | 234,250 | ||||||
| Tesla, Inc. | 290.00 | 3/16/18 | 50 | 1,556,750 | 109,735 | 66,650 | ||||||
| Equifax, Inc. | 100.00 | 4/20/18 | 100 | 1,179,200 | 107,089 | 11,500 | ||||||
| Netflix, Inc. | 170.00 | 4/20/18 | 300 | 5,758,800 | 257,573 | 171,300 | ||||||
| Tesla, Inc. | 325.00 | 4/20/18 | 40 | 1,245,400 | 116,047 | 132,200 | ||||||
| Procter & Gamble Co. (The) | 80.00 | 1/18/19 | 400 | 3,675,200 | 134,667 | 84,000 | ||||||
| Procter & Gamble Co. (The) | 85.00 | 1/18/19 | 400 | 3,675,200 | 192,317 | 132,000 | ||||||
| Procter & Gamble Co. (The) | 90.00 | 1/18/19 | 400 | 3,675,200 | 245,317 | 208,000 | ||||||
| Wal-Mart Stores, Inc. | 60.00 | 1/18/19 | 1,000 | 9,875,000 | 142,463 | 35,000 | ||||||
| Total | $2,196,515 | $1,335,125 | ||||||||||
| Exchange-Traded Options Written | ||||||||||||
| Description | Strike Price | Expiration Date | Number of Contracts | Notional Amount | Premium Received | Value | ||||||
| Put | ||||||||||||
| Netflix, Inc. | 65.00 | 1/19/18 | 100 | $ 987,500 | $ (13,319) | $ (150) | ||||||
| Roku, Inc. | 35.00 | 1/18/19 | 96 | 497,088 | (96,585) | (74,880) | ||||||
| Roku, Inc. | 30.00 | 1/18/19 | 204 | 1,056,312 | (153,151) | (108,120) | ||||||
| Total | $ (263,055) | $(183,150) | ||||||||||
| Meridian Funds | 35 | www.meridianfund.com |
Table of Contents
Schedule of Investments
| Shares | Value | |
| Common Stocks - 92.4% | ||
| Consumer Discretionary - 12.6% | ||
| Diversified Consumer Services - 1.2% | ||
| Grand Canyon Education, Inc.1 | 179,438 | $ 16,065,084 |
| Hotels, Restaurants & Leisure - 0.7% | ||
| Playa Hotels & Resorts, N.V.1,2 | 897,075 | 9,679,439 |
| Household Durables - 0.7% | ||
| Helen of Troy Ltd.1 | 90,479 | 8,717,652 |
| Leisure Products - 1.0% | ||
| Malibu Boats, Inc. Class A1 | 422,787 | 12,569,458 |
| Media - 0.6% | ||
| National CineMedia, Inc. | 1,131,837 | 7,764,402 |
| Specialty Retail - 4.0% | ||
| Dick's Sporting Goods, Inc.2 | 250,964 | 7,212,705 |
| Monro Muffler Brake, Inc.2 | 276,518 | 15,747,700 |
| Sally Beauty Holdings, Inc.1,2 | 1,626,085 | 30,505,355 |
| 53,465,760 | ||
| Textiles, Apparel & Luxury Goods - 4.4% | ||
| Carter's, Inc. | 203,998 | 23,967,725 |
| Under Armour, Inc. Class C1,2 | 876,229 | 11,671,370 |
| Wolverine World Wide, Inc.2 | 708,001 | 22,571,072 |
| 58,210,167 | ||
| Total Consumer Discretionary | 166,471,962 | |
| Consumer Staples - 0.6% | ||
| Food & Staples Retailing - 0.6% | ||
| Casey's General Stores, Inc.2 | 71,927 | 8,051,508 |
| Total Consumer Staples | 8,051,508 | |
| Energy - 0.9% | ||
| Energy Equipment & Services - 0.2% | ||
| RigNet, Inc.1 | 206,009 | 3,079,834 |
| Oil, Gas & Consumable Fuels - 0.7% | ||
| Evolution Petroleum Corp. | 1,330,481 | 9,113,795 |
| Total Energy | 12,193,629 | |
| Financials - 6.5% | ||
| Capital Markets - 6.1% | ||
| Avista Healthcare Public Acquisition Corp. Class A1 | 991,546 | 9,836,136 |
| Financial Engines, Inc.2 | 520,006 | 15,756,182 |
| Legacy Acquisition Corp.1 | 1,173,524 | 11,664,829 |
| PennantPark Investment Corp. | 989,916 | 6,840,320 |
| TPG Pace Energy Holdings Corp.1 | 1,204,372 | 12,224,376 |
| TPG Pace Holdings Corp.1 | 712,866 | 7,285,490 |
| Shares | Value | |
| WisdomTree Investments, Inc.2 | 1,328,008 | $ 16,666,500 |
| 80,273,833 | ||
| Insurance - 0.4% | ||
| Trupanion, Inc. 1,2 | 189,151 | 5,536,450 |
| Total Financials | 85,810,283 | |
| Health Care - 19.3% | ||
| Biotechnology - 7.8% | ||
| Argenx SE Class A ADR (Netherlands)1,2 | 117,909 | 7,444,774 |
| Atara Biotherapeutics, Inc. 1,2 | 480,529 | 8,697,575 |
| Centrexion Therapeutics Corp. Acquisition Date: 12/18/17, Cost $2,995,0071,3,4 | 1,663,893 | 2,995,007 |
| Chimerix, Inc. 1 | 1,603,648 | 7,424,890 |
| DBV Technologies SA ADR (France)1,2 | 319,127 | 7,850,524 |
| Deciphera Pharmaceuticals, Inc.1 | 118,873 | 2,694,851 |
| Heron Therapeutics, Inc.1,2 | 417,420 | 7,555,302 |
| Ignyta, Inc.1 | 579,289 | 15,467,016 |
| Immunomedics, Inc.1,2 | 708,963 | 11,456,842 |
| Mersana Therapeutics, Inc.1,2 | 440,508 | 7,237,547 |
| Neon Therapeutics, Inc. Acquisition Date: 12/1/17, Cost $3,000,0011,3,4 | 1,067,616 | 3,000,001 |
| NexImmune, Inc. Acquisition Date: 12/28/17, Cost $3,000,0001,3,4 | 10,166,045 | 3,000,000 |
| Rhythm Pharmaceuticals, Inc.1,2 | 272,957 | 7,932,131 |
| SlipChip Corp. Acquisition Date: 10/6/17, Cost $4,000,0001,3,4 | 1,462,202 | 4,000,000 |
| Xencor, Inc. 1,2 | 307,898 | 6,749,124 |
| 103,505,584 | ||
| Health Care Equipment & Supplies - 5.3% | ||
| CryoLife, Inc.1 | 422,990 | 8,100,259 |
| DexCom, Inc.1,2 | 152,206 | 8,735,102 |
| Endologix, Inc.1,2 | 1,438,294 | 7,694,873 |
| Entellus Medical, Inc.1,2 | 561,592 | 13,697,229 |
| Insulet Corp.1 | 102,661 | 7,083,609 |
| Merit Medical Systems, Inc.1 | 159,635 | 6,896,232 |
| Natus Medical, Inc.1,2 | 240,184 | 9,175,029 |
| Nevro Corp. 1,2 | 115,207 | 7,953,891 |
| 69,336,224 | ||
| Health Care Providers & Services - 0.5% | ||
| Healthequity, Inc.1,2 | 153,782 | 7,175,468 |
| Meridian Funds | 36 | www.meridianfund.com |
Table of Contents
Schedule of Investments (continued)
| Shares | Value | |
| Health Care Technology - 1.1% | ||
| HealthStream, Inc.1 | 309,511 | $ 7,168,275 |
| Medidata Solutions, Inc.1 | 108,244 | 6,859,422 |
| 14,027,697 | ||
| Life Sciences Tools & Services - 2.3% | ||
| Accelerate Diagnostics, Inc.1,2 | 259,324 | 6,794,289 |
| INC Research Holdings, Inc. Class A1,2 | 369,488 | 16,109,676 |
| Pacific Biosciences of California, Inc.1,2 | 2,586,789 | 6,829,123 |
| 29,733,088 | ||
| Pharmaceuticals - 2.3% | ||
| Kiniksa Pharmaceuticals Ltd. Acquisition Date: 3/8/17, Cost $2,008,7331,3,4 | 790,000 | 2,008,733 |
| Prestige Brands Holdings, Inc.1,2 | 239,887 | 10,653,382 |
| Revance Therapeutics, Inc.1,2 | 261,503 | 9,348,732 |
| WaVe Life Sciences Ltd.1 | 239,107 | 8,392,656 |
| 30,403,503 | ||
| Total Health Care | 254,181,564 | |
| Industrials - 27.2% | ||
| Aerospace & Defense - 1.1% | ||
| Axon Enterprise, Inc.1,2 | 559,397 | 14,824,020 |
| Air Freight & Logistics - 1.4% | ||
| Forward Air Corp. | 323,505 | 18,582,127 |
| Commercial Services & Supplies - 10.2% | ||
| ABM Industries, Inc. | 199,292 | 7,517,294 |
| Clean Harbors, Inc.1 | 215,735 | 11,692,837 |
| Heritage-Crystal Clean, Inc.1 | 1,254,302 | 27,281,068 |
| Hudson Technologies, Inc.1 | 1,313,698 | 7,974,147 |
| InnerWorkings, Inc.1 | 2,289,500 | 22,963,685 |
| Multi-Color Corp.2 | 308,257 | 23,073,036 |
| Ritchie Bros. Auctioneers, Inc. (Canada)2 | 348,249 | 10,423,093 |
| SP Plus Corp.1 | 649,307 | 24,089,290 |
| 135,014,450 | ||
| Machinery - 5.9% | ||
| Graham Corp. | 385,302 | 8,064,371 |
| John Bean Technologies Corp.2 | 84,592 | 9,372,794 |
| Kennametal, Inc. | 446,792 | 21,629,201 |
| Proto Labs, Inc.1 | 156,499 | 16,119,397 |
| Tennant Co. | 301,116 | 21,876,077 |
| 77,061,840 | ||
| Marine - 2.0% | ||
| Kirby Corp.1 | 396,804 | 26,506,507 |
| Shares | Value | |
| Professional Services - 3.3% | ||
| TriNet Group, Inc.1 | 761,004 | $ 33,742,917 |
| TrueBlue, Inc.1 | 364,677 | 10,028,618 |
| 43,771,535 | ||
| Road & Rail - 2.0% | ||
| Heartland Express, Inc.2 | 1,061,411 | 24,773,333 |
| Roadrunner Transportation Systems, Inc.1 | 139,345 | 1,074,350 |
| 25,847,683 | ||
| Trading Companies & Distributors - 1.3% | ||
| MSC Industrial Direct Co., Inc. Class A | 182,468 | 17,637,357 |
| Total Industrials | 359,245,519 | |
| Information Technology - 23.0% | ||
| Electronic Equipment & Instruments - 1.4% | ||
| CTS Corp. | 547,563 | 14,099,747 |
| Mesa Laboratories, Inc. 2 | 36,414 | 4,526,260 |
| 18,626,007 | ||
| Internet Software & Services - 11.8% | ||
| 2U, Inc.1,2 | 224,233 | 14,465,271 |
| Actua Corp.1 | 1,117,791 | 17,437,540 |
| Benefitfocus, Inc.1,2 | 286,710 | 7,741,170 |
| Carbonite, Inc.1,2 | 790,483 | 19,841,123 |
| ChannelAdvisor Corp.1 | 646,584 | 5,819,256 |
| Cimpress, N.V. (Netherlands)1,2 | 136,924 | 16,414,449 |
| comScore, Inc.1 | 331,323 | 9,442,706 |
| Envestnet, Inc.1 | 263,968 | 13,158,805 |
| LivePerson, Inc.1 | 1,030,227 | 11,847,610 |
| New Relic, Inc. 1 | 118,447 | 6,842,683 |
| Shutterstock, Inc.1,2 | 388,800 | 16,730,064 |
| XO Group, Inc.1 | 868,043 | 16,024,074 |
| 155,764,751 | ||
| IT Services - 2.4% | ||
| Euronet Worldwide, Inc.1 | 83,711 | 7,054,326 |
| Forrester Research, Inc. | 174,190 | 7,699,198 |
| Presidio, Inc.1,2 | 863,727 | 16,557,647 |
| 31,311,171 | ||
| Software - 5.9% | ||
| American Software, Inc. | 440,322 | 5,120,945 |
| Barracuda Networks, Inc.1 | 355,253 | 9,769,457 |
| Blackline, Inc.1,2 | 78,294 | 2,568,043 |
| Callidus Software, Inc.1 | 536,400 | 15,367,860 |
| CyberArk Software Ltd.1 | 226,768 | 9,385,928 |
| Descartes Systems Group, Inc. (The) (Canada)1 | 320,098 | 9,090,783 |
| Everbridge, Inc.1 | 270,487 | 8,038,874 |
| QAD, Inc. Class A | 279,998 | 10,877,922 |
| Meridian Funds | 37 | www.meridianfund.com |
Table of Contents
Schedule of Investments (continued)
| Shares | Value | |
| RealPage, Inc.1,2 | 173,229 | $ 7,674,045 |
| 77,893,857 | ||
| Technology Hardware, Storage & Peripherals - 1.5% | ||
| 3D Systems1,2 | 803,414 | 6,941,497 |
| Stratasys Ltd.1,2 | 612,046 | 12,216,438 |
| 19,157,935 | ||
| Total Information Technology | 302,753,721 | |
| Materials - 0.6% | ||
| Chemicals - 0.6% | ||
| KMG Chemicals, Inc. | 125,483 | 8,291,917 |
| Total Materials | 8,291,917 | |
| Real Estate - 1.7% | ||
| Equity Real Estate Investment Trusts (REITS) - 1.1% | ||
| Jernigan Capital, Inc.2 | 349,670 | 6,647,227 |
| National Storage Affiliates Trust | 284,341 | 7,751,135 |
| 14,398,362 | ||
| Real Estate Management & Development - 0.6% | ||
| FirstService Corp. (Canada) | 103,065 | 7,206,305 |
| Total Real Estate | 21,604,667 | |
| Total Common Stocks - 92.4% (Cost $1,028,884,154) | 1,218,604,770 | |
| Warrants - 0.0% | ||
| Financials - 0.0% | ||
| Capital Markets - 0.0% | ||
| Avista Healthcare Public Acquisition Corp. Class A, Strike Price $11.50, Expires 12/2/211 | 898,585 | 251,693 |
| Total Financials | 251,693 | |
| Total Warrants - 0.0% (Cost $273,528) | 251,693 | |
| Shares/ Principal Amount | ||
| Short-Term Investments - 9.8%5 | ||
| Money Market Funds - 1.3% | ||
| BlackRock Liquidity Funds FedFund Portfolio, 1.17% | 5,726,000 | 5,726,000 |
| Invesco Short Term Investments, Government & Agency Portfolio, 1.18% | 5,764,000 | 5,764,000 |
| Shares/ Principal Amount | Value | |
| Morgan Stanley Liquidity Funds, Government Portfolio, Institutional Class, 1.20% | 5,588,000 | $ 5,588,000 |
| Total Money Market Funds | 17,078,000 | |
| Repurchase Agreements - 8.5% | ||
| Citigroup Global Markets, Inc., dated 12/29/17, due 1/2/18, 1.41% total to be received $30,209,986 (collateralized by various U.S. Government Sponsored Agency and U.S. Treasury Obligations, 0.00% - 9.00%, 4/1/18 - 8/20/67, totaling $30,809,359) | $ 30,205,254 | 30,205,254 |
| Daiwa Capital Markets America, Inc., dated 12/29/17, due 1/2/18, 1.43% total to be received $30,210,053 (collateralized by various U.S. Government Sponsored Agency and U.S. Treasury Obligations, 0.00% - 6.50%, 1/11/18 - 12/1/51, totaling $30,809,360) | 30,205,254 | 30,205,254 |
| HSBC Securities, Inc., dated 12/29/17, due 1/2/18, 1.36% total to be received $22,080,119 (collateraized by various U.S. Treasury Obligations, 0.00% - 9.13%, 12/31/17 - 5/15/47, totaling $22,518,496) | 22,076,783 | 22,076,783 |
| Meridian Funds | 38 | www.meridianfund.com |
Table of Contents
Schedule of Investments (continued)
| Shares/ Principal Amount | Value | |
| RBC Dominion Securities, Inc., dated 12/29/17, due 1/2/18, 1.40% total to be received $30,209,953 (collateralized by various U.S. Government Sponsored Agency and U.S. Treasury Obligations, 1.88% - 8.88%, 2/15/19 - 12/20/47, totaling $30,809,359) | $ 30,205,254 | $ 30,205,254 |
| Total Repurchase Agreements | 112,692,545 | |
| Total Short-Term Investments - 9.8% (Cost $129,770,545) | 129,770,545 | |
| Total Investments - 102.2% (Cost $1,158,928,227) | 1,348,627,008 | |
| Liabilities in Excess of Other Assets - (2.2)% | (29,384,693) | |
| Net Assets - 100.0% | $1,319,242,315 |
| ADR—American Depositary Receipt |
| N.V.—Naamloze Vennootschap is the Dutch term for limited liability company |
| 1 | Non-income producing securities. |
| 2 | All or portion of this security is on loan at December 31, 2017. Total value of such securities at period-end amounts to $166,731,156 and represents 12.64% of net assets. |
| 3 | Level 3 security. See Note 1 in Notes to Financial Statements. |
| 4 | Restricted security; cannot be offered for public resale without first being registered under the Securities Act of 1933 and related rules. Acquisition date represents the date on which an enforceable right to acquire such security is obtained and is presented along with related cost in the security description. The Fund has registration rights for certain restricted securities. Any costs related to such registration are borne by the issuer. The aggregate value of restricted securities at period-end amounts to $15,003,741 and represents 1.14% of net assets. |
| 5 | Collateral received from brokers for securities lending was invested in short-term investments. |
| Meridian Funds | 39 | www.meridianfund.com |
Table of Contents
Statements of Assets and Liabilities
| December 31, 2017 (Unaudited) | Meridian Growth Fund | Meridian Contrarian Fund | Meridian Equity Income Fund | Meridian Small Cap Growth Fund |
| Assets | ||||
Investments, at value1,2 | $1,566,493,256 | $627,364,030 | $56,937,820 | $1,235,934,463 |
Repurchase agreements3 | 173,512,065 | 100,538,328 | 7,237,733 | 112,692,545 |
Cash and cash equivalents | 159,067,173 | 28,613,754 | 1,529,238 | 118,632,672 |
Cash held as collateral | — | 10,023,686 | 3,573,360 | — |
| Receivables and other assets: | ||||
Fund shares purchased | 420,974 | 132,740 | 2,818 | 3,045,608 |
Investments sold | 64,404 | 1,306,368 | — | 8,472,204 |
Dividends and interest | 229,406 | 7,725,584 | 37,873 | 454,117 |
Securities lending interest | 141,362 | 218,987 | 11,918 | 236,053 |
Prepaid expenses | 84,502 | 47,815 | 33,354 | 94,937 |
Total Assets | 1,900,013,142 | 775,971,292 | 69,364,114 | 1,479,562,599 |
| Liabilities | ||||
Securities sold short4 | — | — | 4,542,450 | — |
Collateral held for securities on loan | 199,967,065 | 115,047,328 | 8,328,733 | 129,770,545 |
| Payables and other accrued expenses: | ||||
Options written at value5 | — | 2,169,000 | 183,150 | — |
Fund shares sold | 1,100,083 | 155,310 | — | 1,168,476 |
Investments purchased | 6,192,315 | 422,176 | — | 28,087,282 |
Investment advisory fees | 1,001,793 | 520,522 | 39,535 | 1,035,465 |
Distribution fees | — | — | — | 1,199 |
Service plan fees | 5,991 | 135 | 941 | 51,635 |
Professional fees | 76,899 | 35,372 | 7,896 | 48,114 |
Directors' fees | 3,700 | 1,663 | 135 | 394 |
Transfer agent fees | 100,947 | 48,003 | 3,555 | 125,820 |
Other | 102,220 | 52,708 | 8,855 | 31,354 |
Total Liabilities | 208,551,013 | 118,452,217 | 13,115,250 | 160,320,284 |
Net Assets | $1,691,462,129 | $657,519,075 | $56,248,864 | $1,319,242,315 |
| Net Assets Consist of | ||||
Paid in capital | $1,324,376,284 | $453,820,055 | $40,422,371 | $1,116,568,017 |
Accumulated net realized gain/(loss) on investments, written options, and foreign currency transactions | 16,295,692 | 14,287,274 | (3,366,680) | 17,892,967 |
Net unrealized appreciation on investments and foreign currency translations | 351,973,807 | 183,838,880 | 18,814,262 | 189,698,781 |
Net unrealized appreciation/(depreciation) on written options | — | (2,007,717) | 79,905 | — |
Undistributed (distributions in excess of) net investment income | (1,183,654) | 7,580,583 | 299,006 | (4,917,450) |
Net Assets | $1,691,462,129 | $657,519,075 | $56,248,864 | $1,319,242,315 |
1 Investments at cost | $1,188,064,449 | $429,016,150 | $36,382,097 | $1,029,157,682 |
| 2 | Including securities on loan valued at $247,244,191, $134,728,043, $7,587,208 and $166,731,156, respectively. See Note 4 in Notes to Financial Statements. |
| 3 | Repurchase agreements at cost $173,512,065, $100,538,328, $7,237,733 and $112,692,545, respectively. |
| 4 | Proceeds received from securities sold short $—, $—, $3,891,989 and $—, respectively. |
| 5 | Written options, premium received of $—, $161,283, $263,055, and $—, respectively. |
| Meridian Funds | 40 | www.meridianfund.com |
Table of Contents
Statements of Assets and Liabilities (continued)
| December 31, 2017 | Meridian Growth Fund | Meridian Contrarian Fund | Meridian Equity Income Fund | Meridian Small Cap Growth Fund |
| Net Asset Value | ||||
| Legacy Class | ||||
Net Assets | $1,352,361,714 | $653,559,792 | $51,196,070 | $ 66,754,089 |
Shares outstanding6 | 32,484,624 | 15,575,154 | 3,206,206 | 4,173,325 |
Net Asset value per share (offering and redemption price) | $ 41.63 | $ 41.96 | $ 15.97 | $ 16.00 |
| Institutional Class | ||||
Net Assets | $ 220,456,196 | $ — | $ — | $431,602,911 |
Shares outstanding6 | 5,298,032 | — | — | 26,904,714 |
Net Asset value per share (offering and redemption price) | $ 41.61 | $ — | $ — | $ 16.04 |
| Class A | ||||
Net Assets | $ 17,177,255 | $ 817,695 | $ 4,771,299 | $ 88,373,424 |
Shares outstanding6 | 422,970 | 19,869 | 300,770 | 5,602,377 |
Net Asset value per share (offering and redemption price) | $ 40.61 | $ 41.15 | $ 15.86 | $ 15.77 |
| Class C | ||||
Net Assets | $ 3,307,861 | $ 24,764 | $ 1,325 | $ 42,670,354 |
Shares outstanding6 | 81,746 | 607 | 84 | 2,740,091 |
Net Asset value per share (offering and redemption price) | $ 40.47 | $ 40.81 | $ 15.867 | $ 15.57 |
| Investor Class | ||||
Net Assets | $ 98,159,103 | $ 3,116,824 | $ 280,170 | $689,841,537 |
Shares outstanding6 | 2,377,134 | 74,741 | 17,531 | 43,212,764 |
Net Asset value per share (offering and redemption price) | $ 41.29 | $ 41.70 | $ 15.98 | $ 15.96 |
| 6 | 500,000,000 shares authorized, $0.01 par value. |
| 7 | The NAV reported above represents the traded NAV at December 31, 2017. |
| Meridian Funds | 41 | www.meridianfund.com |
Table of Contents
Statements of Operations
| For the Six Months Ended December 31, 2017 (Unaudited) | Meridian Growth Fund | Meridian Contrarian Fund | Meridian Equity Income Fund | Meridian Small Cap Growth Fund |
| Investment Income | ||||
Dividends | $ 4,867,513 | $10,468,525 | $ 230,778 | $ 2,829,522 |
Foreign taxes withheld | (21,458) | (92,649) | — | (18,021) |
Interest income | — | — | 365,543 | — |
Securities lending | 514,735 | 688,666 | 61,672 | 683,425 |
Total investment income | 5,360,790 | 11,064,542 | 657,993 | 3,494,926 |
| Expenses | ||||
Investment advisory fees | 5,743,892 | 3,086,974 | 225,625 | 5,541,502 |
Custodian fees | 68,365 | 29,276 | 4,147 | 45,989 |
| Distribution and service plan fees: | ||||
Class A | 21,182 | 694 | 4,819 | 107,924 |
Class C | 15,765 | 155 | 6 | 220,284 |
Directors' fees | 94,653 | 38,877 | 3,247 | 64,052 |
Pricing fees | 74,942 | 36,392 | 12,093 | 57,443 |
Audit and tax fees | 35,170 | 13,926 | 1,160 | 21,667 |
Legal fees | 28,083 | 11,854 | 986 | 15,118 |
Registration and filing fees | 49,725 | 40,805 | 39,284 | 65,147 |
Shareholder communications | 62,120 | 27,062 | 1,843 | 47,734 |
Transfer agent fees | 301,415 | 128,938 | 9,412 | 389,472 |
Recoupment of investment advisory fees previously waived | — | 2,997 | 19,080 | 22,523 |
Miscellaneous expenses | 49,132 | 23,147 | 4,645 | 22,253 |
Total expenses excluding dividend expense | 6,544,444 | 3,441,097 | 326,347 | 6,621,108 |
Dividend expense | — | — | 22,768 | — |
Total expense | 6,544,444 | 3,441,097 | 349,115 | 6,621,108 |
Less waivers and/or reimbursements (Note 6) | — | — | — | — |
Net expenses | 6,544,444 | 3,441,097 | 349,115 | 6,621,108 |
Net investment income (loss) | (1,183,654) | 7,623,445 | 308,878 | (3,126,182) |
| Realized and Unrealized Gain (Loss) | ||||
Net realized gain on investments and foreign currency transactions | 95,896,439 | 26,548,919 | 2,860,262 | 55,973,123 |
Net realized loss on securities sold short | — | — | (1,130,884) | — |
Net realized gain/(loss) on written options | — | 319,764 | (50,574) | — |
Net change in unrealized appreciation on investments and foreign currency translations | 67,740,126 | 63,860,171 | 7,261,200 | 67,823,535 |
Net change in unrealized depreciation on securities sold short | — | — | (321,811) | — |
Net change in unrealized appreciation/(depreciation) on written options | — | (2,007,815) | 67,686 | — |
Total realized and unrealized gain | 163,636,565 | 88,721,039 | 8,685,879 | 123,796,658 |
Net increase in net assets resulting from operations | $162,452,911 | $96,344,484 | $ 8,994,757 | $120,670,476 |
| Meridian Funds | 42 | www.meridianfund.com |
Table of Contents
Statements of Changes in Net Assets
| Meridian Growth Fund | Meridian Contrarian Fund | ||||
| Changes in Net Assets From: | Six Months Ended December 31, 2017 (Unaudited) | Year Ended June 30, 2017 | Six Months Ended December 31, 2017 (Unaudited) | Year Ended June 30, 2017 | |
| Operations | |||||
Net investment income/(loss) | $ (1,183,654) | $ (3,315,476) | $ 7,623,445 | $ (318,010) | |
Net realized gain on investments, written options, and foreign currency transactions | 95,896,439 | 87,209,658 | 26,868,683 | 67,020,433 | |
Net change in unrealized appreciation on investments | 67,740,126 | 199,845,882 | 61,852,356 | 53,353,256 | |
Net increase in net assets resulting from operations and foreign currency translations | 162,452,911 | 283,740,064 | 96,344,484 | 120,055,679 | |
| Distributions to Shareholders From: | |||||
| Net Investment income: | |||||
Legacy Class | — | — | (42,862) | (176,151) | |
Institutional Class | — | — | — | — | |
Class A | — | — | — | — | |
Class C | — | — | — | — | |
Investor Class | — | — | — | — | |
| Net Realized Gains: | |||||
Legacy Class | (89,772,354) | (6,721,792) | (62,858,517) | (2,817,023) | |
Institutional Class | (14,571,915) | (338,118) | — | — | |
Class A | (1,175,172) | (72,390) | (61,424) | (2,356) | |
Class C | (224,281) | (6,716) | (2,415) | (178) | |
Investor Class | (6,562,237) | (301,770) | (299,488) | (8,820) | |
Decrease in net assets from distributions | (112,305,959) | (7,440,786) | (63,264,706) | (3,004,528) | |
| Fund Share Transactions | |||||
Net increase (decrease) in net assets resulting from fund share transactions (Note 2) | 168,798,954 | (52,801,022) | 32,164,041 | (63,490,549) | |
Total increase in net assets | 218,945,906 | 223,498,256 | 65,243,819 | 53,560,602 | |
| Net Assets | |||||
Beginning of Period | 1,472,516,223 | 1,249,017,967 | 592,275,256 | 538,714,654 | |
End of Period* | $1,691,462,129 | $1,472,516,223 | $657,519,075 | $592,275,256 | |
*Includes accumulated undistributed (distributions in excess of) net investment income | $ (1,183,654) | $ — | $ 7,580,583 | $ — | |
| Meridian Funds | 43 | www.meridianfund.com |
Table of Contents
Statements of Changes in Net Assets (continued)
| Meridian Equity Income Fund | Meridian Small Cap Growth Fund | ||||
| Changes in Net Assets From: | Six Months Ended December 31, 2017 (Unaudited) | Year Ended June 30, 2017 | Six Months Ended December 31, 2017 (Unaudited) | Year Ended June 30, 2017 | |
| Operations | |||||
Net investment income/(loss) | $ 308,878 | $ 646,070 | $ (3,126,182) | $ (4,448,894) | |
Net realized gain/(loss) on investments and foreign currency transactions | 1,678,804 | (1,772,254) | 55,973,123 | 29,193,583 | |
Net change in unrealized appreciation on investments, written options, securities sold short, and foreign currency translations | 7,007,075 | 9,103,798 | 67,823,535 | 111,454,640 | |
Net increase in net assets resulting from operations and foreign currency translations | 8,994,757 | 7,977,614 | 120,670,476 | 136,199,329 | |
| Distributions to Shareholders From: | |||||
| Net Investment income: | |||||
Legacy Class | (599,181) | (362,896) | — | — | |
Institutional Class | — | — | — | — | |
Class A | (53,696) | (2,557) | — | — | |
Class C | (7) | (1) | — | — | |
Investor Class | (3,042) | (1,454) | — | — | |
| Net Realized Gains: | |||||
Legacy Class | — | — | (2,783,183) | — | |
Institutional Class | — | — | (17,222,385) | — | |
Class A | — | — | (3,734,054) | — | |
Class C | — | — | (1,761,834) | — | |
Investor Class | — | — | (27,653,283) | — | |
Decrease in net assets from distributions | (655,926) | (366,908) | (53,154,739) | — | |
| Fund Share Transactions | |||||
Net increase (decrease) in net assets resulting from fund share transactions (Note 2) | (1,778,438) | (3,928,458) | 354,477,212 | 426,306,691 | |
Total increase in net assets | 6,560,393 | 3,682,248 | 421,992,949 | 562,506,020 | |
| Net Assets | |||||
Beginning of Period | 49,688,471 | 46,006,223 | 897,249,366 | 334,743,346 | |
End of Period* | $56,248,864 | $49,688,471 | $1,319,242,315 | $897,249,366 | |
*Includes accumulated undistributed (distributions in excess of) net investment income | $ 299,006 | $ 646,054 | $ (4,917,450) | $ (1,791,268) | |
| Meridian Funds | 44 | www.meridianfund.com |
Table of Contents
Financial Highlights
| For the Six Months Ended December 31, | For the Fiscal Year Ended June 30, | |||||
| Legacy Class | 2017 (Unaudited) | 2017 | 2016 | 2015 | 2014 | 2013 |
| Per Share Operating Performance | ||||||
Net asset value, beginning of period | $ 40.15 | $ 32.70 | $ 37.80 | $ 37.86 | $ 44.31 | $ 45.06 |
| Income (loss) from investment operations | ||||||
Net investment income (loss)1 | (0.03) | (0.09) | (0.10) | (0.15) | (0.11) | 0.05 |
Net realized and unrealized gain(loss) | 4.45 | 7.74 | (1.26) | 4.37 | 6.89 | 6.23 |
Net increase(decrease) from investment operations | 4.42 | 7.65 | (1.36) | 4.22 | 6.78 | 6.28 |
| Less distributions to shareholders: | ||||||
Distributions from net investment income | 0.00 | 0.00 | 0.00 | 0.00 | (0.00) 2 | (0.15) |
Distributions from net realized capital gains | (2.94) | (0.20) | (3.74) | (4.28) | (13.23) | (6.88) |
Total distributions to shareholders | (2.94) | (0.20) | (3.74) | (4.28) | (13.23) | (7.03) |
Redemption fees | 0.00 2 | 0.00 2 | 0.00 2 | 0.00 2 | 0.00 | 0.00 |
Net asset value, end of period | $ 41.63 | $ 40.15 | $ 32.70 | $ 37.80 | $ 37.86 | $ 44.31 |
Total return | 11.05% 3 | 23.46% | (2.94)% | 11.85% | 17.31% | 15.54% |
| Ratios to Average Net Assets | ||||||
Ratio of net investment income (loss) to average net assets | (0.15)% 4 | (0.24)% | (0.30)% | (0.41)% | (0.27)% | 0.11% |
Ratio of expenses to average net assets: | 0.85% 4 | 0.87% | 0.86% | 0.84% | 0.86% | 0.87% |
| Supplemental Data | ||||||
Net Assets, End of Period (000's) | $1,352,362 | $1,270,753 | $1,161,981 | $1,937,346 | $2,021,197 | $2,112,945 |
Portfolio Turnover Rate | 22% 3 | 34% | 67% | 46% | 96% | 37% |
| 1 | Per share net investment income has been calculated using the average daily shares method. |
| 2 | Less than $0.005 per share. |
| 3 | Not Annualized. |
| 4 | Annualized. |
| Meridian Funds | 45 | www.meridianfund.com |
Table of Contents
Financial Highlights
| Institutional Class | For the Six Months Ended December 31,2017 (Unaudited) | For the Fiscal Year Ended June 30,2017 | For the Fiscal Year Ended June 30,2016 | For the Period Ended June 30,20151 | |||
| Per Share Operating Performance | |||||||
Net asset value, beginning of period | $ 40.13 | $ 32.68 | $ 37.79 | $ 36.44 | |||
| Income (loss) from investment operations | |||||||
Net investment loss2 | (0.03) | (0.09) | (0.13) | (0.04) | |||
Net realized and unrealized gain(loss) | 4.44 | 7.74 | (1.24) | 1.39 | |||
Net increase(decrease) from investment operations | 4.41 | 7.65 | (1.37) | 1.35 | |||
| Less distributions to shareholders: | |||||||
Distributions from net realized capital gains | (2.94) | (0.20) | (3.74) | 0.00 | |||
Total distributions to shareholders | (2.94) | (0.20) | (3.74) | 0.00 | |||
Redemption fees | 0.01 | 0.00 3 | 0.00 3 | 0.00 | |||
Net asset value, end of period | $ 41.61 | $ 40.13 | $ 32.68 | $ 37.79 | |||
Total return | 11.05% 4 | 23.48% | (2.97)% | 3.70% 4 | |||
| Ratios to Average Net Assets | |||||||
Ratio of net investment loss to average net assets | (0.15)% 5 | (0.24)% | (0.40)% | (0.21)% 5 | |||
| Ratio of expenses to average net assets: | |||||||
Total expense | 0.85% 5 | 0.87% | 0.90% | 1.15% 5 | |||
Before fees waived and excluding recoupment of past waived fees | 0.85% 5 | 0.87% | 0.87% | 1.15% 5 | |||
After fees waived and excluding recoupment of past waived fees6 | 0.85% 5 | 0.87% | 0.87% | 0.90% 5 | |||
| Supplemental Data | |||||||
Net Assets, End of Period (000's) | $220,456 | $ 92,203 | $ 45,687 | $ 19,575 | |||
Portfolio Turnover Rate | 22% 4 | 34% | 67% | 46% 4 | |||
| 1 | Commenced operations on December 24, 2014. |
| 2 | Per share net investment income has been calculated using the average daily shares method. |
| 3 | Less than $0.005 per share. |
| 4 | Not Annualized. |
| 5 | Annualized. |
| 6 | See note 6 to Financial Statements. |
| Meridian Funds | 46 | www.meridianfund.com |
Table of Contents
Financial Highlights
| For the Six Months Ended December 31, | For the Fiscal Year Ended June 30, | For the Period Ended June 30, | ||||
| Class A | 2017 (Unaudited) | 2017 | 2016 1 | 2015 | 2014 2 | |
| Per Share Operating Performance | ||||||
Net asset value, beginning of period | $ 39.29 | $ 32.10 | $ 37.37 | $ 37.72 | $ 35.67 | |
| Income (loss) from investment operations | ||||||
Net investment loss3 | (0.09) | (0.20) | (0.29) | (0.41) | (0.21) | |
Net realized and unrealized gain(loss) | 4.35 | 7.59 | (1.24) | 4.33 | 2.26 | |
Net increase(decrease) from investment operations | 4.26 | 7.39 | (1.53) | 3.92 | 2.05 | |
| Less distributions to shareholders: | ||||||
Distributions from net realized capital gains | (2.94) | (0.20) | (3.74) | (4.28) | (0.00) 4 | |
Total distributions to shareholders | (2.94) | (0.20) | (3.74) | (4.28) | (0.00) 4 | |
Redemption fees | 0.00 4 | 0.00 4 | 0.00 4 | 0.01 | 0.00 | |
Net asset value, end of period | $ 40.61 | $ 39.29 | $ 32.10 | $ 37.37 | $ 37.72 | |
Total return | 10.88% 5 | 23.09% | (3.45)% | 11.08% | 5.75% 5 | |
| Ratios to Average Net Assets | ||||||
Ratio of net investment loss to average net assets | (0.45)% 6 | (0.56)% | (0.89)% | (1.11)% | (0.93)% 6 | |
| Ratio of expenses to average net assets: | ||||||
Total expense | 1.16% 6 | 1.18% | 1.40% | 1.69% | 2.00% 6 | |
Before fees waived and excluding recoupment of past waived fees | 1.16% 6 | 1.18% | 1.22% | 1.69% | 2.00% 6 | |
After fees waived and excluding recoupment of past waived fees7 | 1.16% 6 | 1.18% | 1.22% | 1.55% | 1.55% 6 | |
| Supplemental Data | ||||||
Net Assets, End of Period (000's) | $ 17,177 | $ 17,287 | $ 8,832 | $ 8,812 | $ 4,904 | |
Portfolio Turnover Rate | 22% 5 | 34% | 67% | 46% | 96% 5 | |
| 1 | On July 1, 2015, the Fund's Advisor Class Shares were redesignated as Class A Shares. |
| 2 | Commenced operations on November 15, 2013. |
| 3 | Per share net investment income has been calculated using the average daily shares method. |
| 4 | Less than $0.005 per share. |
| 5 | Not Annualized. |
| 6 | Annualized. |
| 7 | See note 6 to Financial Statements. |
| Meridian Funds | 47 | www.meridianfund.com |
Table of Contents
Financial Highlights
| Class C | For the Six Months Ended December 31,2017 (Unaudited) | For the Fiscal Year Ended June 30,2017 | For the Fiscal Year Ended June 30,20161 | ||
| Per Share Operating Performance | |||||
Net asset value, beginning of period | $ 39.30 | $ 32.34 | $ 37.80 | ||
| Income (loss) from investment operations | |||||
| Net investment loss2 | (0.24) | (0.48) | (0.52) | ||
Net realized and unrealized loss | 4.35 | 7.64 | (1.20) | ||
Net increase(decrease) from investment operations | 4.11 | 7.16 | (1.72) | ||
| Less distributions to shareholders: | |||||
Distributions from net realized capital gains | (2.94) | (0.20) | (3.74) | ||
Total distributions to shareholders | (2.94) | (0.20) | (3.74) | ||
Redemption fees | 0.00 | 0.00 | 0.00 | ||
Net asset value, end of period | $ 40.47 | $ 39.30 | $ 32.34 | ||
Total return | 10.46% 3 | 22.20% | (3.95)% 3 | ||
| Ratios to Average Net Assets | |||||
Ratio of net investment loss to average net assets | (1.18)% 4 | (1.33)% | (1.68)% 4 | ||
Ratio of expenses to average net assets: | 1.88% 4 | 1.92% | 1.95% 4 | ||
| Supplemental Data | |||||
Net Assets, End of Period (000's) | $ 3,308 | $ 3,095 | $ 804 | ||
Portfolio Turnover Rate | 22% 3 | 34% | 67% 3 | ||
| 1 | Commenced operations on July 1, 2015. |
| 2 | Per share net investment income has been calculated using the average daily shares method. |
| 3 | Not Annualized. |
| 4 | Annualized. |
| Meridian Funds | 48 | www.meridianfund.com |
Table of Contents
Financial Highlights
| For the Six Months Ended December 31, | For the Fiscal Year Ended June 30, | For the Period Ended June 30, | ||||
| Investor Class | 2017 (Unaudited) | 2017 | 2016 | 2015 | 2014 1 | |
| Per Share Operating Performance | ||||||
Net asset value, beginning of period | $ 39.86 | $ 32.48 | $ 37.61 | $ 37.78 | $ 35.67 | |
| Income (loss) from investment operations | ||||||
Net investment loss2 | (0.04) | (0.12) | (0.14) | (0.27) | (0.16) | |
Net realized and unrealized gain/(loss) | 4.41 | 7.69 | (1.26) | 4.37 | 2.27 | |
Net increase(decrease) from investment operations | 4.37 | 7.57 | (1.40) | 4.10 | 2.11 | |
| Less distributions to shareholders: | ||||||
Distributions from net realized capital gains | (2.94) | (0.20) | (3.74) | (4.28) | (0.00) 3 | |
Total distributions to shareholders | (2.94) | (0.20) | (3.74) | (4.28) | (0.00) 3 | |
Redemption fees | 0.00 | 0.01 | 0.01 | 0.01 | 0.00 | |
Net asset value, end of period | $ 41.29 | $ 39.86 | $ 32.48 | $ 37.61 | $ 37.78 | |
Total return | 11.00% 4 | 23.41% | (3.04)% | 11.56% | 5.92% 4 | |
| Ratios to Average Net Assets | ||||||
Ratio of net investment loss to average net assets | (0.21)% 5 | (0.34)% | (0.43)% | (0.73)% | (0.70)% 5 | |
| Ratio of expenses to average net assets: | ||||||
Total expense | 0.92% 5 | 0.94% | 0.97% | 1.16% | 1.30% 5 | |
Before fees waived and excluding recoupment of past waived fees | 0.92% 5 | 0.94% | 0.97% | 1.16% | 1.30% 5 | |
After fees waived and excluding recoupment of past waived fees6 | 0.92% 5 | 0.94% | 0.97% | 1.16% | 1.30% 5 | |
| Supplemental Data | ||||||
Net Assets, End of Period (000's) | $ 98,159 | $ 89,177 | $ 31,714 | $ 42,062 | $ 18,749 | |
Portfolio Turnover Rate | 22% 4 | 34% | 67% | 46% | 96% 4 | |
| 1 | Commenced operations on November 15, 2013. |
| 2 | Per share net investment income has been calculated using the average daily shares method. |
| 3 | Less than $0.005 per share. |
| 4 | Not Annualized. |
| 5 | Annualized. |
| 6 | See note 6 to Financial Statements. |
| Meridian Funds | 49 | www.meridianfund.com |
Table of Contents
Financial Highlights
| For the Six Months Ended December 31, | For the Fiscal Year Ended June 30, | |||||
| Legacy Class | 2017 (Unaudited) | 2017 | 2016 | 2015 | 2014 | 2013 |
| Per Share Operating Performance | ||||||
Net asset value, beginning of period | $ 39.79 | $ 32.42 | $ 40.44 | $ 45.52 | $ 37.20 | $ 30.60 |
| Income (loss) from investment operations | ||||||
Net investment income (loss)1 | 0.52 | (0.02) | (0.05) | (0.00) 2 | 0.01 | 0.14 |
Net realized and unrealized gain(loss) | 6.06 | 7.58 | (2.60) | 2.66 | 8.63 | 6.57 |
Net increase(decrease) from investment operations | 6.58 | 7.56 | (2.65) | 2.66 | 8.64 | 6.71 |
| Less distributions to shareholders: | ||||||
Distributions from net investment income | 0.00 2 | (0.01) | (0.02) | (0.09) | (0.18) | (0.11) |
Distributions from net realized capital gains | (4.41) | (0.18) | (5.35) | (7.65) | (0.14) | 0.00 |
Total distributions to shareholders | (4.41) | (0.19) | (5.37) | (7.74) | (0.32) | (0.11) |
Redemption fees | 0.00 2 | 0.00 2 | 0.00 2 | 0.00 2 | 0.00 | 0.00 |
Net asset value, end of period | $ 41.96 | $ 39.79 | $ 32.42 | $ 40.44 | $ 45.52 | $ 37.20 |
Total return | 16.67% 3 | 23.36% | (6.33)% | 6.84% | 23.31% | 21.98% |
| Ratios to Average Net Assets | ||||||
Ratio of net investment income (loss) to average net assets | 2.47% 4 | (0.05)% | (0.14)% | (0.01)% | 0.01% | 0.41% |
Ratio of expenses to average net assets: | 1.11% 4 | 1.13% | 1.13% | 1.11% | 1.13% | 1.16% |
| Supplemental Data | ||||||
Net Assets, End of Period (000's) | $653,560 | $588,906 | $536,799 | $677,138 | $764,882 | $704,523 |
Portfolio Turnover Rate | 27% 3 | 54% | 73% | 76% | 67% | 55% |
| 1 | Per share net investment income has been calculated using the average daily shares method. |
| 2 | Less than $0.005 per share. |
| 3 | Not Annualized. |
| 4 | Annualized. |
| Meridian Funds | 50 | www.meridianfund.com |
Table of Contents
Financial Highlights
| For the Six Months Ended December 31, | For the Fiscal Year Ended June 30, | For the Period Ended June 30, | ||||
| Class A | 2017 (Unaudited) | 2017 | 2016 1 | 2015 | 2014 2 | |
| Per Share Operating Performance | ||||||
Net asset value, beginning of period | $ 39.19 | $ 32.08 | $ 40.22 | $ 45.41 | $ 42.64 | |
| Income (loss) from investment operations | ||||||
Net investment income (loss)3 | 0.38 | (0.19) | (0.21) | (0.22) | (0.08) | |
Net realized and unrealized gain(loss) | 5.99 | 7.48 | (2.58) | 2.68 | 3.02 | |
Net increase(decrease) from investment operations | 6.37 | 7.29 | (2.79) | 2.46 | 2.94 | |
| Less distributions to shareholders: | ||||||
Distributions from net investment income | 0.00 | 0.00 | 0.00 | 0.00 | (0.17) | |
Distributions from net realized capital gains | (4.41) | (0.18) | (5.35) | (7.65) | 0.00 | |
Total distributions to shareholders | (4.41) | (0.18) | (5.35) | (7.65) | (0.17) | |
Redemption fees | 0.00 | 0.00 | 0.00 | 0.00 | 0.00 | |
Net asset value, end of period | $ 41.15 | $ 39.19 | $ 32.08 | $ 40.22 | $ 45.41 | |
Total return | 16.37% 4 | 22.76% | (6.75)% | 6.38% | 6.91% 4 | |
| Ratios to Average Net Assets | ||||||
Ratio of net investment income(loss) to average net assets | 1.86% 5 | (0.53)% | (0.60)% | (0.52)% | (0.30)% 5 | |
| Ratio of expenses to average net assets: | ||||||
Total expense | 1.60% 5 | 1.60% | 1.60% | 3.46% | 7.46% 5 | |
Before fees waived and excluding recoupment of past waived fees | 1.41% 5 | 1.42% | 1.46% | 3.46% | 7.46% 5 | |
After fees waived and excluding recoupment of past waived fees6 | 1.41% 5 | 1.42% | 1.46% | 1.60% | 1.60% 5 | |
| Supplemental Data | ||||||
Net Assets, End of Period (000's) | $ 818 | $ 583 | $ 431 | $ 622 | $ 462 | |
Portfolio Turnover Rate | 27% 4 | 54% | 73% | 76% | 67% 4 | |
| 1 | On July 1, 2015, the Fund's Advisor Class Shares were redesignated as Class A Shares. |
| 2 | Commenced operations on November 15, 2013. |
| 3 | Per share net investment income has been calculated using the average daily shares method. |
| 4 | Not Annualized. |
| 5 | Annualized. |
| 6 | See Note 6 to Financial Statements. |
| Meridian Funds | 51 | www.meridianfund.com |
Table of Contents
Financial Highlights
| Class C | For the Six Months Ended December 31,2017 (Unaudited) | For the Fiscal Year Ended June 30,2017 | For the Fiscal Year Ended June 30,20161 | ||
| Per Share Operating Performance | |||||
Net asset value, beginning of period | $ 39.00 | $ 32.09 | $ 40.54 | ||
| Income (loss) from investment operations | |||||
| Net investment income (loss)2 | 0.16 | (0.39) | (0.36) | ||
Net realized and unrealized loss | 6.06 | 7.48 | (2.74) | ||
Net increase(decrease) from investment operations | 6.22 | 7.09 | (3.10) | ||
| Less distributions to shareholders: | |||||
Distributions from net realized capital gains | (4.41) | (0.18) | (5.35) | ||
Total distributions to shareholders | (4.41) | (0.18) | (5.35) | ||
Redemption fees | 0.00 | 0.00 | 0.00 | ||
Net asset value, end of period | $ 40.81 | $ 39.00 | $ 32.09 | ||
Total return | 16.07% 3 | 22.12% | (7.50)% 3 | ||
| Ratios to Average Net Assets | |||||
Ratio of net investment income(loss) to average net assets | 0.77% 4 | (1.05)% | (1.11)% 4 | ||
Ratio of expenses to average net assets: | 2.13% 4 | 2.13% | 2.19% 4 | ||
| Supplemental Data | |||||
Net Assets, End of Period (000's) | $ 25 | $ 43 | $ 14 | ||
Portfolio Turnover Rate | 27% 3 | 54% | 73% 3 | ||
| 1 | Commenced operations on July 1, 2015. |
| 2 | Per share net investment income has been calculated using the average daily shares method. |
| 3 | Not Annualized. |
| 4 | Annualized. |
| Meridian Funds | 52 | www.meridianfund.com |
Table of Contents
Financial Highlights
| For the Six Months Ended December 31, | For the Fiscal Year Ended June 30, | For the Period Ended June 30, | ||||
| Investor Class | 2017 (Unaudited) | 2017 | 2016 | 2015 | 2014 1 | |
| Per Share Operating Performance | ||||||
Net asset value, beginning of period | $ 39.61 | $ 32.34 | $ 40.40 | $ 45.47 | $ 42.64 | |
| Income (loss) from investment operations | ||||||
Net investment income (loss)2 | 0.47 | (0.10) | (0.13) | (0.09) | (0.02) | |
Net realized and unrealized gain/(loss) | 6.03 | 7.55 | (2.59) | 2.66 | 3.03 | |
Net increase(decrease) from investment operations | 6.50 | 7.45 | (2.72) | 2.57 | 3.01 | |
| Less distributions to shareholders: | ||||||
Distributions from net investment income | 0.00 | 0.00 | 0.00 | 0.00 | (0.18) | |
Distributions from net realized capital gains | (4.41) | (0.18) | (5.35) | (7.65) | 0.00 | |
Total distributions to shareholders | (4.41) | (0.18) | (5.35) | (7.65) | (0.18) | |
Redemption fees | 0.00 | 0.00 | 0.01 | 0.01 | 0.00 | |
Net asset value, end of period | $ 41.70 | $ 39.61 | $ 32.34 | $ 40.40 | $ 45.47 | |
Total return | 16.53% 3 | 23.07% | (6.50)% | 6.67% | 7.08% 3 | |
| Ratios to Average Net Assets | ||||||
Ratio of net investment income(loss) to average net assets | 2.26% 4 | (0.27)% | (0.40)% | (0.21)% | (0.09)% 4 | |
| Ratio of expenses to average net assets: | ||||||
Total expense | 1.35% 4 | 1.35% | 1.35% | 2.34% | 3.51% 4 | |
Before fees waived and excluding recoupment of past waived fees | 1.18% 4 | 1.23% | 1.24% | 2.34% | 3.51% 4 | |
After fees waived and excluding recoupment of past waived fees5 | 1.18% 4 | 1.23% | 1.24% | 1.35% | 1.35% 4 | |
| Supplemental Data | ||||||
Net Assets, End of Period (000's) | $ 3,117 | $ 2,743 | $ 1,471 | $ 1,008 | $ 1,564 | |
Portfolio Turnover Rate | 27% 3 | 54% | 73% | 76% | 67% 3 | |
| 1 | Commenced operations on November 15, 2013. |
| 2 | Per share net investment income has been calculated using the average daily shares method. |
| 3 | Not Annualized. |
| 4 | Annualized. |
| 5 | See Note 6 to Financial Statements. |
| Meridian Funds | 53 | www.meridianfund.com |
Table of Contents
Financial Highlights
| For the Six Months Ended December 31, | For the Fiscal Year Ended June 30, | |||||
| Legacy Class | 2017 (Unaudited) | 2017 | 2016 | 2015 | 2014 | 2013 |
| Per Share Operating Performance | ||||||
Net asset value, beginning of period | $ 13.59 | $ 11.60 | $ 12.51 | $ 14.59 | $ 12.35 | $ 10.71 |
| Income (loss) from investment operations | ||||||
Net investment income1 | 0.09 | 0.17 | 0.09 | 0.12 | 0.24 | 0.24 |
Net realized and unrealized gain(loss) | 2.48 | 1.92 | (0.51) | 0.47 | 2.22 | 1.68 |
Net increase(decrease) from investment operations | 2.57 | 2.09 | (0.42) | 0.59 | 2.46 | 1.92 |
| Less distributions to shareholders: | ||||||
Distributions from net investment income | (0.19) | (0.10) | 0.00 | (0.25) | (0.22) | (0.28) |
Distributions from net realized capital gains | 0.00 | 0.00 | (0.49) | (2.42) | 0.00 | 0.00 |
Total distributions to shareholders | (0.19) | (0.10) | (0.49) | (2.67) | (0.22) | (0.28) |
Redemption fees | 0.00 | 0.00 2 | 0.00 2 | 0.00 2 | 0.00 2 | 0.00 |
Net asset value, end of period | $ 15.97 | $ 13.59 | $ 11.60 | $ 12.51 | $ 14.59 | $ 12.35 |
Total return | 18.91% 3 | 18.06% | (3.35)% | 4.46% | 20.04% | 18.28% |
| Ratios to Average Net Assets | ||||||
Ratio of net investment income to average net assets | 1.22% 4 | 1.35% | 0.82% | 0.88% | 1.75% | 2.08% |
Ratio of expenses to average net assets: | ||||||
Total expense | 1.32% 4 | 1.38% | 1.29% | 1.33% | 1.37% | 1.53% |
Before fees waived and excluding recoupment of past waived fees | 1.25% 4 | 1.33% | 1.27% | 1.33% | 1.37% | 1.53% |
After fees waived and excluding recoupment of past waived fees5 | 1.25% 4 | 1.33% | 1.27% | 1.25% | 1.25% | 1.25% |
After fees waived and excluding recoupment of past waived fess and dividend expenses | 1.16% 4 | 1.20% | 1.23% | 1.25% | 1.25% | 1.25% |
| Supplemental Data | ||||||
Net Assets, End of Period (000's) | $ 51,196 | $ 46,120 | $ 45,251 | $53,125 | $ 33,649 | $ 28,697 |
Portfolio Turnover Rate | 19% 3 | 44% | 57% | 266% | 35% | 44% |
| 1 | Per share net investment income has been calculated using the average daily shares method. |
| 2 | Less than $0.005 per share. |
| 3 | Not Annualized. |
| 4 | Annualized. |
| 5 | See Note 6 to Financial Statements. |
| Meridian Funds | 54 | www.meridianfund.com |
Table of Contents
Financial Highlights
| For the Six Months Ended December 31, | For the Fiscal Year Ended June 30, | For the Period Ended June 30, | ||||
| Class A | 2017 (Unaudited) | 2017 | 2016 1 | 2015 | 2014 2 | |
| Per Share Operating Performance | ||||||
Net asset value, beginning of period | $ 13.52 | $ 11.54 | $ 12.50 | $ 14.58 | $ 13.87 | |
| Income (loss) from investment operations | ||||||
Net investment income (loss)3 | 0.06 | 0.16 | 0.06 | (0.02) | 0.13 | |
Net realized and unrealized gain(loss) | 2.46 | 1.88 | (0.53) | 0.58 | 0.78 | |
Net increase(decrease) from investment operations | 2.52 | 2.04 | (0.47) | 0.56 | 0.91 | |
| Less distributions to shareholders: | ||||||
Distributions from net investment income | (0.18) | (0.06) | 0.00 | (0.22) | (0.20) | |
Distributions from net realized capital gains | 0.00 | 0.00 | (0.49) | (2.42) | 0.00 | |
Total distributions to shareholders | (0.18) | (0.06) | (0.49) | (2.64) | (0.20) | |
Redemption fees | 0.00 | 0.00 | 0.00 | 0.00 | 0.00 | |
Net asset value, end of period | $ 15.86 | $ 13.52 | $ 11.54 | $ 12.50 | $ 14.58 | |
Total return | 18.64% 4 | 17.69% | (3.76)% | 4.24% | 6.69% 4 | |
| Ratios to Average Net Assets | ||||||
Ratio of net investment income(loss) to average net assets | 0.88% 5 | 1.25% | 0.50% | (0.11)% | 1.55% 5 | |
| Ratio of expenses to average net assets: | ||||||
Total expense | 1.69% 5 | 1.73% | 1.69% | 7.46% | 132.38% 5 | |
Before fees waived and excluding recoupment of past waived fees | 1.61% 5 | 1.69% | 1.69% | 7.46% | 132.38% 5 | |
After fees waived and excluding recoupment of past waived fees6 | 1.61% 5 | 1.69% | 1.64% | 1.60% | 1.60% 5 | |
After fees waived and excluding recoupment of past waived fess and dividend expenses | 1.53% 5 | 1.56% | 1.60% | 1.60% | 1.60% 5 | |
| Supplemental Data | ||||||
Net Assets, End of Period (000's) | $ 4,771 | $ 3,321 | $ 502 | $ 501 | $ 13 | |
Portfolio Turnover Rate | 19% 4 | 44% | 57% | 266% | 35% 4 | |
| 1 | On July 1, 2015, the Fund's Advisor Class Shares were redesignated as Class A Shares. |
| 2 | Commenced operations on November 15, 2013. |
| 3 | Per share net investment income has been calculated using the average daily shares method. |
| 4 | Not Annualized. |
| 5 | Annualized. |
| 6 | See Note 6 to Financial Statements. |
| Meridian Funds | 55 | www.meridianfund.com |
Table of Contents
Financial Highlights
| Class C | For the Six Months Ended December 31,2017 (Unaudited) | For the Fiscal Year Ended June 30,2017 | For the Fiscal Year Ended June 30,20161 | ||
| Per Share Operating Performance | |||||
Net asset value, beginning of period | $ 13.47 | $ 11.50 | $ 12.56 | ||
| Income (loss) from investment operations | |||||
| Net investment income2 | 0.03 | 0.07 | 0.00 | ||
Net realized and unrealized loss | 2.44 | 1.91 | (0.57) | ||
Net increase(decrease) from investment operations | 2.47 | 2.00 | (0.57) | ||
| Less distributions to shareholders: | |||||
Distributions from net investment income | (0.08) | (0.01) | 0.00 | ||
Distributions from net realized capital gains | 0.00 | 0.00 | (0.49) | ||
Total distributions to shareholders | (0.08) | (0.01) | (0.49) | ||
Redemption fees | 0.00 | 0.00 | 0.00 | ||
Net asset value, end of period | $ 15.86 | $ 13.47 | $ 11.50 | ||
Total return | 18.35% 3 | 17.26% | (4.55)% 3 | ||
| Ratios to Average Net Assets | |||||
Ratio of net investment income to average net assets | 0.35% 4 | 0.59% | 0.04% 4 | ||
| Ratio of expenses to average net assets: | |||||
Total expense | 2.09% 4 | 2.33% | 2.33% 4 | ||
Before fees waived and excluding recoupment of past waived fees | 2.16% 4, 5 | 2.33% | 2.33% 4 | ||
After fees waived and excluding recoupment of past waived fees6 | 2.09% 4 | 2.13% | 2.04% 4 | ||
After fees waived and excluding recoupment of past waived fess and dividend expenses | 2.00% 4 | 2.00% | 2.00% 4 | ||
| Supplemental Data | |||||
Net Assets, End of Period (000's) | $ 1 | $ 1 | $ 1 | ||
Portfolio Turnover Rate | 19% 3 | 44% | 57% 3 | ||
| 1 | Commenced operations on July 1, 2015. |
| 2 | Per share net investment income has been calculated using the average daily shares method. |
| 3 | Not Annualized. |
| 4 | Annualized. |
| 5 | High ratio due to waiver and small net average assets. |
| 6 | See Note 6 to Financial Statements. |
| Meridian Funds | 56 | www.meridianfund.com |
Table of Contents
Financial Highlights
| For the Six Months Ended December 31, | For the Fiscal Year Ended June 30, | For the Period Ended June 30, | ||||
| Investor Class | 2017 (Unaudited) | 2017 | 2016 | 2015 | 2014 1 | |
| Per Share Operating Performance | ||||||
Net asset value, beginning of period | $ 13.60 | $ 11.60 | $ 12.53 | $ 14.60 | $ 13.87 | |
| Income (loss) from investment operations | ||||||
Net investment income (loss)2 | 0.08 | 0.16 | 0.08 | (0.02) | 0.15 | |
Net realized and unrealized gain/(loss) | 2.48 | 1.92 | (0.52) | 0.61 | 0.79 | |
Net increase(decrease) from investment operations | 2.56 | 2.08 | (0.44) | 0.59 | 0.94 | |
| Less distributions to shareholders: | ||||||
Distributions from net investment income | (0.18) | (0.08) | 0.00 | (0.24) | (0.21) | |
Distributions from net realized capital gains | 0.00 | 0.00 | (0.49) | (2.42) | 0.00 | |
Total distributions to shareholders | (0.18) | (0.08) | (0.49) | (2.66) | (0.21) | |
Redemption fees | 0.00 | 0.00 | 0.00 3 | 0.00 | 0.00 | |
Net asset value, end of period | $ 15.98 | $ 13.60 | $ 11.60 | $ 12.53 | $ 14.60 | |
Total return | 18.79% 4 | 17.98% | (3.51)% | 4.44% | 6.87% 4 | |
| Ratios to Average Net Assets | ||||||
Ratio of net investment income(loss) to average net assets | 1.11% 5 | 1.24% | 0.68% | (0.13)% | 1.72% 5 | |
| Ratio of expenses to average net assets: | ||||||
Total expense | 1.44% 5 | 1.48% | 1.39% | 16.83% | 39.23% 5 | |
Before fees waived and excluding recoupment of past waived fees | 1.30% 5 | 1.39% | 1.37% | 16.83% | 39.23% 5 | |
After fees waived and excluding recoupment of past waived fees6 | 1.30% 5 | 1.39% | 1.37% | 1.35% | 1.35% 5 | |
After fees waived and excluding recoupment of past waived fess and dividend expenses | 1.21% 5 | 1.26% | 1.32% | 1.35% | 1.35% 5 | |
| Supplemental Data | ||||||
Net Assets, End of Period (000's) | $ 280 | $ 246 | $ 252 | $ 335 | $ 45 | |
Portfolio Turnover Rate | 19% 4 | 44% | 57% | 266% | 35% 4 | |
| 1 | Commenced operations on November 15, 2013. |
| 2 | Per share net investment income has been calculated using the average daily shares method. |
| 3 | Less than $0.005 per share. |
| 4 | Not Annualized. |
| 5 | Annualized. |
| 6 | See Note 6 to Financial Statements. |
| Meridian Funds | 57 | www.meridianfund.com |
Table of Contents
Financial Highlights
| For the Six Months Ended December 31, | For the Fiscal Year Ended June 30, | For the Period Ended June 30, | ||||
| Legacy Class | 2017 (Unaudited) | 2017 | 2016 | 2015 | 2014 1 | |
| Per Share Operating Performance | ||||||
Net asset value, beginning of period | $ 15.07 | $ 11.87 | $ 12.98 | $ 11.65 | $ 10.00 | |
| Income (loss) from investment operations | ||||||
Net investment loss2 | (0.04) | (0.09) | (0.06) | (0.09) | (0.04) | |
Net realized and unrealized gain(loss) | 1.64 | 3.29 | (0.87) | 1.72 | 1.69 | |
Net increase(decrease) from investment operations | 1.60 | 3.20 | (0.93) | 1.63 | 1.65 | |
| Less distributions to shareholders: | ||||||
Distributions from net realized capital gains | (0.67) | 0.00 | (0.18) | (0.30) | 0.00 | |
Total distributions to shareholders | (0.67) | 0.00 | (0.18) | (0.30) | 0.00 | |
Redemption fees | 0.00 | 0.00 3 | 0.00 3 | 0.00 3 | 0.00 | |
Net asset value, end of period | $ 16.00 | $ 15.07 | $ 11.87 | $ 12.98 | $ 11.65 | |
Total return | 10.55% 4 | 26.96% | (7.06)% | 14.23% | 16.50% 4 | |
| Ratios to Average Net Assets | ||||||
Ratio of net investment loss to average net assets | (0.54)% 5 | (0.63)% | (0.52)% | (0.69)% | (0.61)% 5 | |
Ratio of expenses to average net assets: | ||||||
Total expense | 1.15% 5 | 1.20% | 1.20% | 1.24% | 2.35% 5 | |
Before fees waived and excluding recoupment of past waived fees | 1.10% 5 | 1.14% | 1.20% | 1.24% | 2.35% 5 | |
After fees waived and excluding recoupment of past waived fees6 | 1.10% 5 | 1.14% | 1.20% | 1.20% | 1.20% 5 | |
| Supplemental Data | ||||||
Net Assets, End of Period (000's) | $ 66,754 | $ 66,777 | $ 44,001 | $ 59,459 | $ 9,839 | |
Portfolio Turnover Rate | 25% 4 | 39% | 62% | 45% | 78% 4 | |
| 1 | Commenced operations on December 16, 2013. |
| 2 | Per share net investment income has been calculated using the average daily shares method. |
| 3 | Less than $0.005 per share. |
| 4 | Not Annualized. |
| 5 | Annualized. |
| 6 | See Note 6 to Financial Statements. |
| Meridian Funds | 58 | www.meridianfund.com |
Table of Contents
Financial Highlights
| Institutional Class | For the Six Months Ended December 31,2017 (Unaudited) | For the Fiscal Year Ended June 30,2017 | For the Fiscal Year Ended June 30,2016 | For the Period Ended June 30,20151 | |||
| Per Share Operating Performance | |||||||
Net asset value, beginning of period | $ 15.11 | $ 11.88 | $ 12.98 | $ 12.23 | |||
| Income (loss) from investment operations | |||||||
Net investment loss2 | (0.04) | (0.07) | (0.05) | (0.02) | |||
Net realized and unrealized gain(loss) | 1.64 | 3.30 | (0.87) | 0.77 | |||
Net increase(decrease) from investment operations | 1.60 | 3.23 | (0.92) | 0.75 | |||
| Less distributions to shareholders: | |||||||
Distributions from net realized capital gains | (0.67) | 0.00 | (0.18) | 0.00 | |||
Total distributions to shareholders | (0.67) | 0.00 | (0.18) | 0.00 | |||
Redemption fees | 0.00 3 | 0.00 3 | 0.00 3 | 0.00 | |||
Net asset value, end of period | $ 16.04 | $ 15.11 | $ 11.88 | $ 12.98 | |||
Total return | 10.59% 4 | 27.19% | (6.98)% | 6.13% 4 | |||
| Ratios to Average Net Assets | |||||||
Ratio of net investment loss to average net assets | (0.45)% 5 | (0.52)% | (0.45)% | (0.29)% 5 | |||
| Ratio of expenses to average net assets: | |||||||
Total expense | 1.10% 5 | 1.14% | 1.22% | 2.03% 5 | |||
Before fees waived and excluding recoupment of past waived fees | 1.10% 5 | 1.14% | 1.22% | 2.03% 5 | |||
After fees waived and excluding recoupment of past waived fees6 | 1.10% 5 | 1.10% | 1.10% | 1.10% 5 | |||
| Supplemental Data | |||||||
Net Assets, End of Period (000's) | $431,603 | $253,447 | $ 52,784 | $ 13,035 | |||
Portfolio Turnover Rate | 25% 4 | 39% | 62% | 44% 4 | |||
| 1 | Commenced operations on December 24, 2014. |
| 2 | Per share net investment income has been calculated using the average daily shares method. |
| 3 | Less than $0.005 per share. |
| 4 | Not Annualized. |
| 5 | Annualized. |
| 6 | See Note 6 to Financial Statements. |
| Meridian Funds | 59 | www.meridianfund.com |
Table of Contents
Financial Highlights
| For the Six Months Ended December 31, | For the Fiscal Year Ended June 30, | For the Period Ended June 30, | ||||
| Class A | 2017 (Unaudited) | 2017 | 2016 1 | 2015 | 2014 2 | |
| Per Share Operating Performance | ||||||
Net asset value, beginning of period | $ 14.89 | $ 11.76 | $ 12.91 | $ 11.63 | $ 10.00 | |
| Income (loss) from investment operations | ||||||
Net investment loss3 | (0.06) | (0.12) | (0.10) | (0.13) | (0.06) | |
Net realized and unrealized gain(loss) | 1.61 | 3.25 | (0.87) | 1.71 | 1.69 | |
Net increase(decrease) from investment operations | 1.55 | 3.13 | (0.97) | 1.58 | 1.63 | |
| Less distributions to shareholders: | ||||||
Distributions from net realized capital gains | (0.67) | 0.00 | (0.18) | (0.30) | 0.00 | |
Total distributions to shareholders | (0.67) | 0.00 | (0.18) | (0.30) | 0.00 | |
Redemption fees | 0.00 4 | 0.00 4 | 0.00 4 | 0.00 4 | 0.00 | |
Net asset value, end of period | $ 15.77 | $ 14.89 | $ 11.76 | $ 12.91 | $ 11.63 | |
Total return | 10.41% 5 | 26.62% | (7.41)% | 13.82% | 16.30% 5 | |
| Ratios to Average Net Assets | ||||||
Ratio of net investment loss to average net assets | (0.78)% 6 | (0.92)% | (0.89)% | (1.09)% | (1.01)% 6 | |
| Ratio of expenses to average net assets: | ||||||
Total expense | 1.39% 6 | 1.49% | 1.60% | 1.69% | 2.99% 6 | |
Before fees waived and excluding recoupment of past waived fees | 1.39% 6 | 1.45% | 1.56% | 1.69% | 2.99% 6 | |
After fees waived and excluding recoupment of past waived fees7 | 1.39% 6 | 1.45% | 1.56% | 1.60% | 1.60% 6 | |
| Supplemental Data | ||||||
Net Assets, End of Period (000's) | $ 88,373 | $ 82,031 | $ 52,173 | $ 45,186 | $ 6,524 | |
Portfolio Turnover Rate | 25% 5 | 39% | 62% | 44% | 78% 5 | |
| 1 | On July 1, 2015, the Fund's Advisor Class Shares were redesignated as Class A Shares. |
| 2 | Commenced operations on November 15, 2013. |
| 3 | Per share net investment income has been calculated using the average daily shares method. |
| 4 | Less than $0.005 per share. |
| 5 | Not Annualized. |
| 6 | Annualized. |
| 7 | See Note 6 to Financial Statements. |
| Meridian Funds | 60 | www.meridianfund.com |
Table of Contents
Financial Highlights
| Class C | For the Six Months Ended December 31,2017 (Unaudited) | For the Fiscal Year Ended June 30,2017 | For the Fiscal Year Ended June 30,20161 | ||
| Per Share Operating Performance | |||||
Net asset value, beginning of period | $ 14.76 | $ 11.74 | $ 12.97 | ||
| Income (loss) from investment operations | |||||
| Net investment loss2 | (0.12) | (0.22) | (0.17) | ||
Net realized and unrealized loss | 1.60 | 3.24 | (0.88) | ||
Net increase(decrease) from investment operations | 1.48 | 3.02 | (1.05) | ||
| Less distributions to shareholders: | |||||
Distributions from net realized capital gains | (0.67) | 0.00 | (0.18) | ||
Total distributions to shareholders | (0.67) | 0.00 | (0.18) | ||
Redemption fees | 0.00 | 0.00 3 | 0.00 3 | ||
Net asset value, end of period | $ 15.57 | $ 14.76 | $ 11.74 | ||
Total return | 10.03% 4 | 25.72% | (8.00)% 4 | ||
| Ratios to Average Net Assets | |||||
Ratio of net investment loss to average net assets | (1.52)% 5 | (1.60)% | (1.50)% 5 | ||
| Ratio of expenses to average net assets: | |||||
Total expense | 2.12% 5 | 2.17% | 2.28% 5 | ||
Before fees waived and excluding recoupment of past waived fees | 2.12% 5 | 2.16% | 2.28% 5 | ||
After fees waived and excluding recoupment of past waived fees6 | 2.12% 5 | 2.16% | 2.25% 5 | ||
| Supplemental Data | |||||
Net Assets, End of Period (000's) | $ 42,670 | $ 44,593 | $ 23,689 | ||
Portfolio Turnover Rate | 25% 4 | 39% | 62% 4 | ||
| 1 | Commenced operations on July 1, 2015. |
| 2 | Per share net investment income has been calculated using the average daily shares method. |
| 3 | Less than $0.005 per share. |
| 4 | Not Annualized. |
| 5 | Annualized. |
| 6 | See Note 6 to Financial Statements. |
| Meridian Funds | 61 | www.meridianfund.com |
Table of Contents
Financial Highlights
| For the Six Months Ended December 31, | For the Fiscal Year Ended June 30, | For the Period Ended June 30, | ||||
| Investor Class | 2017 (Unaudited) | 2017 | 2016 | 2015 | 2014 1 | |
| Per Share Operating Performance | ||||||
Net asset value, beginning of period | $ 15.05 | $ 11.85 | $ 12.97 | $ 11.65 | $ 10.00 | |
| Income (loss) from investment operations | ||||||
Net investment loss2 | (0.04) | (0.09) | (0.07) | (0.10) | (0.04) | |
Net realized and unrealized gain/(loss) | 1.62 | 3.29 | (0.87) | 1.73 | 1.69 | |
Net increase(decrease) from investment operations | 1.58 | 3.20 | (0.94) | 1.63 | 1.65 | |
| Less distributions to shareholders: | ||||||
Distributions from net investment income | 0.00 | 0.00 | 0.00 | (0.01) | 0.00 | |
Distributions from net realized capital gains | (0.67) | 0.00 | (0.18) | (0.30) | 0.00 | |
Total distributions to shareholders | (0.67) | 0.00 | (0.18) | (0.31) | 0.00 | |
Redemption fees | 0.00 3 | 0.00 3 | 0.00 3 | 0.00 | 0.00 | |
Net asset value, end of period | $ 15.96 | $ 15.05 | $ 11.85 | $ 12.97 | $ 11.65 | |
Total return | 10.50% 4 | 27.00% | (7.15)% | 14.14% | 16.50% 4 | |
| Ratios to Average Net Assets | ||||||
Ratio of net investment loss to average net assets | (0.53)% 5 | (0.69)% | (0.61)% | (0.83)% | (0.70)% 5 | |
| Ratio of expenses to average net assets: | ||||||
Total expense | 1.15% 5 | 1.26% | 1.32% | 1.33% | 3.63% 5 | |
Before fees waived and excluding recoupment of past waived fees | 1.15% 5 | 1.26% | 1.32% | 1.33% | 3.63% 5 | |
After fees waived and excluding recoupment of past waived fees6 | 1.15% 5 | 1.26% | 1.32% | 1.33% | 1.35% 5 | |
| Supplemental Data | ||||||
Net Assets, End of Period (000's) | $689,842 | $450,402 | $162,096 | $131,211 | $ 2,135 | |
Portfolio Turnover Rate | 25% 4 | 39% | 62% | 44% | 78% 4 | |
| 1 | Commenced operations on November 15, 2013. |
| 2 | Per share net investment income has been calculated using the average daily shares method. |
| 3 | Less than $0.005 per share. |
| 4 | Not Annualized. |
| 5 | Annualized. |
| 6 | See Note 6 to Financial Statements. |
| Meridian Funds | 62 | www.meridianfund.com |
Table of Contents
Notes to Financial Statements
| 1. | Organization and Significant Accounting Policies: Meridian Fund, Inc. (the “Meridian Funds” or the “Company”) comprises the following separate series: the Meridian Growth Fund (the “Growth Fund”), the Meridian Contrarian Fund (the “Contrarian Fund”), the Meridian Equity Income Fund (the “Equity Income Fund”), and the Meridian Small Cap Growth Fund (the “Small Cap Growth Fund”) (each a “Fund” and collectively, the “Funds”). The Company is registered as an open-end investment company under the Investment Company Act of 1940 and is organized as a Maryland corporation. Each Fund is classified as a "diversified" management investment company. |
| Meridian Funds offer five share classes: Legacy Class Shares, Investor Class Shares, Class A Shares, Class C Shares and Institutional Class Shares. Prior to July 1, 2015, Class A Shares were known as Advisor Class Shares. As of December 31, 2017, Institutional Class Shares of the Meridian Equity Income Fund and Meridian Contrarian Fund are not currently being offered for sale. Effective June 15, 2017, Investor Class, Class A, and Class C Shares of the Meridian Growth Fund are closed to new investors. Legacy Class Shares are available to investors who have continuously held an investment in any Meridian Fund prior to November 15, 2013. Institutional Class Shares are available to certain eligible investors including endowments, foundations and qualified retirement plans. Class A, Class C and Investor Class Shares are available for purchase through financial intermediary platforms. Class A Shares are subject to a maximum initial sales charge (front-end load) of 5.75%. Class C Shares are subject to a 1.00% contingent deferred sales charge ("CDSC") if redeemed within one year of purchase. Investor Class Shares are not subject to frond-end load or CDSC and require a higher minimum initial investment. All Classes have identical rights and privileges with respect to the Fund in general, and exclusive voting rights with respect to Class specific matters. Net Asset Value ("NAV") per share may differ by class due to each class having its own expenses directly attributable to that class. Investor Class, Class A and Class C Shares are subject to shareholder servicing and sub-transfer agent fees. Class A and Class C Shares are also subject to certain expenses related to the distribution of these shares. See Note 6 for further information on additional share classes and changes to shareholder servicing and distribution plans. | |
| The primary investment objectives of the Growth Fund and Contrarian Fund are to seek long-term growth of capital. | |
| The primary investment objective of the Equity Income Fund is to seek long-term growth of capital along with income as a component of total return. | |
| The primary investment objective of the Small Cap Growth Fund is to seek long-term growth of capital by investing primarily in equity securities of small capitalization companies. | |
| The following significant accounting policies are consistently followed by the Funds in the preparation of their financial statements in conformity with accounting principles generally accepted in the United States of America (“U.S. GAAP”). Each Fund is considered an investment company under U.S. GAAP and follows the accounting and reporting guidance applicable to investment companies. |
| a. | Share Valuation: The NAV of each Fund is calculated by dividing the sum of the value of the securities held by each Fund, plus cash or other assets, minus all liabilities (including estimated accrued expenses), by the total number of shares outstanding of each Fund. The result is rounded to the nearest cent. Each Funds’ shares will not be priced on the days in which the New York Stock Exchange ("NYSE") is closed for trading. |
| b. | Investment Valuations: Equity securities are valued at the closing price or last sales price on the principal exchange or market on which they are traded; or, if there were no sales that day, at the last reported bid price. |
| Fixed income (debt) are valued on the basis of last available bid prices or current market quotations provided by dealers or pricing services. In determining the value of a particular investment, pricing services may use certain information with respect to transactions in such investments, quotations from dealers, pricing matrixes, market transactions in comparable investments, various relationships observed in the market between investments and calculated yield measures. | |
| Investments in open-end U.S. mutual funds are valued at NAV each business day. | |
| The market value of the Fund’s investments in the exchange traded funds is based on the published NAV of each fund computed as of the close of regular trading on the NYSE on days when the NYSE is open. | |
| Exchange-traded options are valued at the mean between the last bid and ask prices at the close of the options market in which the options trade. An exchange-traded option for which there is no mean price is valued at the |
| Meridian Funds | 63 | www.meridianfund.com |
Table of Contents
Notes to Financial Statements (continued)
| last bid (long positions) or ask (short positions) price. If no bid or ask price is available, the prior day’s price will be used, unless it is determined that the prior day’s price no longer reflects the fair value of the option. | |
| Securities and other assets for which reliable market quotations are not readily available or for which a significant event has occurred since the time of the most recent market quotation, will be valued based upon other available factors deemed relevant by ArrowMark Colorado Holdings, LLC (the “Adviser”) under the guidelines established by, and under the general supervision and responsibility of, the Funds’ Board of Directors (the “Board”). Effective March 31, 2017, Arrowpoint Asset Management, LLC changed its name to ArrowMark Colorado Holdings, LLC. These factors include but are not limited to (i) attributes specific to the investment; (ii) the principal market for the investment; (iii) the customary participants in the principal market for the investment; (iv) data assumptions by market participants for the investment, if reasonably available; (v) quoted prices for similar investments in active markets; and (vi) other factors, such as future cash flows, interest rates, yield curves, volatilities, prepayment speeds, loss severities, credit risks and/or default rates. Valuations based on such factors are reported to the Board on a quarterly basis. | |
| c. | Fair Value Measurements: As described in Note 1.b. above, the Funds utilize various methods to determine and measure the fair value of investment securities on a recurring basis. The objective of a fair value measurement is to determine the price that would be received to sell an asset or paid to transfer a liability in an orderly transaction between market participants at the measurement date (an exit price). Accordingly, the fair value hierarchy gives the highest priority to quoted prices (unadjusted) in active markets for identical assets or liabilities (Level 1) and the lowest priority to unobservable inputs (Level 3) that are significant to the fair value instrument. The three levels of the fair value hierarchy are described below: |
| Level 1 - quoted prices in active markets for identical securities; | |
| Level 2 - other significant observable inputs (including quoted prices for similar securities, interest rates, prepayment speeds, credit risk, etc.); and | |
| Level 3 - significant unobservable inputs (including the Fund’s determinations as to the fair value of investments). | |
| The inputs or methodology used for valuing securities are not necessarily an indication of the risks associated with investing in those securities. Cost approach is used to value Level 3 holdings. The summary of inputs used to value the Funds’ securities as of December 31, 2017 is as follows: |
| Level 1 | Level 2 | Level 3 | Total | ||||
| Meridian Growth Fund | |||||||
Common Stocks1 | $ 1,533,921,498 | $ 351,810 | $ 5,764,948 | $ 1,540,038,256 | |||
Short-Term Investments | 26,455,000 | 173,512,065 | — | 199,967,065 | |||
Total Investments | $ 1,560,376,498 | $ 173,863,875 | $ 5,764,948 | $ 1,740,005,321 | |||
| Meridian Contrarian Fund | |||||||
| Assets: | |||||||
Common Stocks1 | $ 612,855,030 | $ — | $ — | $ 612,855,030 | |||
Short-Term Investments | 14,509,000 | 100,538,328 | — | 115,047,328 | |||
Total Investments - Assets | $ 627,364,030 | $ 100,538,328 | $ — | $ 727,902,358 | |||
| Liabilities: | |||||||
Call Option Written | (2,169,000) | — | — | (2,169,000) | |||
Total Investments - Liabilities | $ (2,169,000) | $ — | $ — | $ (2,169,000) | |||
| Meridian Funds | 64 | www.meridianfund.com |
Table of Contents
Notes to Financial Statements (continued)
| Level 1 | Level 2 | Level 3 | Total | ||||
| Meridian Equity Income Fund | |||||||
| Assets: | |||||||
Common Stocks1 | $ 43,511,440 | $ — | $ — | $ 43,511,440 | |||
Corporate Bonds | — | 3,808,200 | — | 3,808,200 | |||
Call Options Purchased | 7,192,055 | — | — | 7,192,055 | |||
Put Options Purchased | 1,335,125 | — | — | 1,335,125 | |||
Short-Term Investments | 1,091,000 | 7,237,733 | — | 8,328,733 | |||
Total Investments - Assets | $ 53,129,620 | $ 11,045,933 | $ — | $ 64,175,553 | |||
| Liabilities: | |||||||
Securities Sold Short | (4,542,450) | — | — | (4,542,450) | |||
Put Options Written | (183,150) | — | — | (183,150) | |||
Total Investments - Liabilities | $ (4,725,600) | $ — | $ — | $ (4,725,600) | |||
| Meridian Small Cap Growth Fund | |||||||
Common Stocks1 | $ 1,203,601,029 | $ — | $ 15,003,741 | $ 1,218,604,770 | |||
Warrants | 251,693 | — | — | 251,693 | |||
Short-Term Investments | 17,078,000 | 112,692,545 | — | 129,770,545 | |||
Total Investments | $ 1,220,930,722 | $ 112,692,545 | $ 15,003,741 | $ 1,348,627,008 |
| Meridian Growth Fund | |||||||||
| Beginning Balance 07/01/17 | Total Purchases | Total Sales | Transfer Out | Ending Balance 12/31/17 | |||||
| Investments in Securities | |||||||||
Common Stocks | $ 5,764,948 | $— | $— | $— | $ 5,764,948 | ||||
Total Level 3 | $ 5,764,948 | $— | $— | $— | $ 5,764,948 | ||||
| Meridian Small Cap Growth Fund | |||||||||
| Beginning Balance 07/01/17 | Total Purchases | Total Sales | Transfer Out | Ending Balance 12/31/17 | |||||
| Investments in Securities | |||||||||
Common Stocks | $ 2,008,733 | $ 12,995,008 | $— | $— | $ 15,003,741 | ||||
Total Level 3 | $ 2,008,733 | $ 12,995,008 | $— | $— | $ 15,003,741 | ||||
| Meridian Funds | 65 | www.meridianfund.com |
Table of Contents
Notes to Financial Statements (continued)
| d. | Investment Transactions and Investment Income: Security transactions are accounted for on the date the securities are purchased or sold (trade date). Realized gains and losses on security transactions are determined on the basis of specific identification for both financial statement and federal income tax purposes. Dividend income is recorded on the ex-dividend date. Interest income is accrued daily. |
| e. | Option writing: When the Fund writes an option, an amount equal to the premium received by the Fund is recorded as a liability and subsequently adjusted to the current fair value of the option written. Premiums received from writing options that expire unexercised are treated by the Fund on the expiration date as realized gains from investments. The difference between the premium and amount paid on effecting a closing purchase transaction, including brokerage commissions, is also treated as a realized gain or, if the premium is less than the amount paid for the closing purchase transaction, as a realized loss. If a call option is exercised, the premium is added to the proceeds from the sale of the underlying security or currency in determining whether the Fund has realized a gain or loss. If a put option is exercised, the premium reduces the cost basis of the securities purchased by the Fund. The Fund as writer of an option bears the market risk of an unfavorable change in the price of the security underlying the written option. |
| f. | Allocation of Income, Expenses, Gains and Losses: Income, gains and losses are allocated on a daily basis to each share class based on the relative proportion of the net assets of the class to each Fund’s total net assets. Expenses are allocated on the basis of relative net assets of the class to the Fund, or if an expense is specific to a share class, to that specific share class. |
| g. | Use of Estimates: The preparation of financial statements in accordance with accounting principals generally accepted in the U.S. (“GAAP”) requires management to make estimates and assumptions that affect the reported amount of assets and liabilities and revenue and expenses at the date of the financial statements. Actual amounts could differ from those estimates, and such differences could be significant. |
| h. | Foreign Currency Translation: Securities denominated in foreign currencies are converted into U.S. dollars using the spot market rate of exchange at the time of valuation. Purchases and sales of such securities and related dividend and interest income are converted into U.S. dollars using the spot market rate of exchange prevailing on the respective dates of such translations. The Funds do not separately report the effect of changes in foreign exchange rates from changes in market prices on securities held. Such changes are included in net realized and unrealized gain or loss from investments as reported in the Statement of Operations. |
| i. | Federal Income Taxes: It is the Funds’ policy to comply with the requirements of Subchapter M of the Internal Revenue Code of 1986, as amended, applicable to regulated investment companies and to distribute all of their taxable income to their shareholders; therefore, no federal income tax provision is required. |
| j. | Distributions to Shareholders: The Funds record distributions to shareholders on the ex-dividend date. The amount of distributions from net investment income and net realized capital gains are determined in accordance with federal income tax regulations which may differ from GAAP. These “book/tax” differences are either considered temporary or permanent in nature. To the extent these differences are permanent in nature, such amounts are reclassified within the capital accounts based on their federal tax-basis treatment; temporary differences do not require reclassification. |
| Distributions which exceed net investment income and net realized capital gains are reported as distributions in excess of net investment income or distributions in excess of net realized capital gains for financial reporting purposes but not for tax purposes. To the extent they exceed net investment income and net realized capital gains for tax purposes, they are reported as distributions of paid-in-capital. | |
| k. | Guarantees and Indemnification: Under the Funds’ organizational documents, its Officers and Directors are indemnified against certain liability arising out of the performance of their duties to the Funds. Additionally, in the normal course of business, the Funds enter into contracts with service providers that contain general indemnification clauses, subject to applicable law. The Funds’ maximum exposure under these arrangements is unknown, as this would involve future claims that may be made against the Funds that have not yet occurred. However, based on experience, the Funds expect the risk of loss to be remote. |
| Meridian Funds | 66 | www.meridianfund.com |
Table of Contents
Notes to Financial Statements (continued)
| 2. | Capital Shares Transactions: Transactions in capital shares were as follows: |
| Six Months Ended December 31, 2017 | Year Ended June 30, 2017 | ||||||
| Shares | Amount | Shares | Amount | ||||
| Growth Fund: | |||||||
| Legacy Class | |||||||
Shares sold | 367,510 | $ 15,246,301 | 743,062 | $ 27,027,734 | |||
Shares issued from reinvestment of distributions | 2,111,871 | 87,558,159 | 181,191 | 6,579,306 | |||
Redemption fees | — | 2,665 | — | 4,157 | |||
Shares redeemed | (1,646,592) | (68,362,336) | (4,809,111) | (173,476,960) | |||
Net increase/(decrease) | 832,789 | $ 34,444,789 | (3,884,858) | $(139,865,763) | |||
| Institutional Class | |||||||
Shares sold | 3,145,604 | $135,630,451 | 974,564 | $ 36,511,151 | |||
Shares issued from reinvestment of distributions | 351,639 | 14,571,915 | 9,317 | 338,118 | |||
Redemption fees | — | 15,300 | — | 3,569 | |||
Shares redeemed | (496,931) | (21,040,181) | (84,158) | (3,084,938) | |||
Net increase | 3,000,312 | $129,177,485 | 899,723 | $ 33,767,900 | |||
| Class A | |||||||
Shares sold | 11,120 | $ 447,616 | 247,639 | $ 8,914,746 | |||
Shares issued from reinvestment of distributions | 25,410 | 1,027,828 | 1,656 | 58,915 | |||
Redemption fees | — | 3 | — | 870 | |||
Shares redeemed | (53,552) | (2,162,058) | (84,440) | (3,111,088) | |||
Net increase/(decrease) | (17,022) | $ (686,611) | 164,855 | $ 5,863,443 | |||
| Class C | |||||||
Shares sold | 376 | $ 14,915 | 57,906 | $ 2,114,227 | |||
Shares issued from reinvestment of distributions | 5,517 | 222,398 | 184 | 6,582 | |||
Redemption fees | — | — | — | — | |||
Shares redeemed | (2,914) | (120,122) | (4,178) | (151,005) | |||
Net increase | 2,979 | $ 117,191 | 53,912 | $ 1,969,804 | |||
| Investor Class | |||||||
Shares sold | 168,748 | $ 6,936,627 | 1,584,043 | $ 57,278,946 | |||
Shares issued from reinvestment of distributions | 147,893 | 6,082,835 | 7,681 | 276,949 | |||
Redemption fees | — | — | — | 11,812 | |||
Shares redeemed | (176,929) | (7,273,362) | (330,738) | (12,104,113) | |||
Net increase | 139,712 | $ 5,746,100 | 1,260,986 | $ 45,463,594 | |||
| Meridian Funds | 67 | www.meridianfund.com |
Table of Contents
Notes to Financial Statements (continued)
| Six Months Ended December 31, 2017 | Year Ended June 30, 2017 | ||||||
| Shares | Amount | Shares | Amount | ||||
| Contrarian Fund: | |||||||
| Legacy Class | |||||||
Shares sold | 33,460 | $ 1,431,062 | 113,954 | $ 4,240,515 | |||
Shares issued from reinvestment of distributions | 1,478,240 | 61,420,883 | 76,996 | 2,909,671 | |||
Redemption fees | — | 1,343 | — | 5,023 | |||
Shares redeemed | (738,056) | (31,111,661) | (1,945,884) | (71,620,471) | |||
Net increase/(decrease) | 773,644 | $ 31,741,627 | (1,754,934) | $(64,465,262) | |||
| Class A | |||||||
Shares sold | 7,745 | $ 324,055 | 3,476 | $ 133,084 | |||
Shares issued from reinvestment of distributions | 753 | 30,696 | 32 | 1,187 | |||
Redemption fees | — | — | — | — | |||
Shares redeemed | (3,516) | (142,751) | (2,046) | (75,268) | |||
Net increase | 4,982 | $ 212,000 | 1,462 | $ 59,003 | |||
| Class C | |||||||
Shares sold | — | $ — | 671 | $ 23,274 | |||
Shares issued from reinvestment of distributions | 60 | 2,415 | 5 | 178 | |||
Redemption fees | — | — | — | — | |||
Shares redeemed | (557) | (22,297) | — | — | |||
Net increase/(decrease) | (497) | $ (19,882) | 676 | $ 23,452 | |||
| Investor Class | |||||||
Shares sold | 8,590 | $ 363,842 | 32,595 | $ 1,213,260 | |||
Shares issued from reinvestment of distributions | 6,697 | 276,556 | 234 | 8,820 | |||
Redemption fees | — | — | — | — | |||
Shares redeemed | (9,797) | (410,102) | (9,059) | (329,821) | |||
Net increase | 5,490 | $ 230,296 | 23,770 | $ 892,259 | |||
| Meridian Funds | 68 | www.meridianfund.com |
Table of Contents
Notes to Financial Statements (continued)
| Six Months Ended December 31, 2017 | Year Ended June 30, 2017 | ||||||
| Shares | Amount | Shares | Amount | ||||
| Equity Income Fund: | |||||||
| Legacy Class | |||||||
Shares sold | 5,387 | $ 81,270 | 18,313 | $ 230,016 | |||
Shares issued from reinvestment of distributions | 33,878 | 539,689 | 27,689 | 353,312 | |||
Redemption fees | — | — | — | 2,223 | |||
Shares redeemed | (225,972) | (3,234,531) | (555,322) | (7,109,593) | |||
Net decrease | (186,707) | $(2,613,572) | (509,320) | $(6,524,042) | |||
| Class A | |||||||
Shares sold | 52,714 | $ 803,508 | 204,121 | $ 2,665,000 | |||
Shares issued from reinvestment of distributions | 3,351 | 53,040 | 201 | 2,557 | |||
Redemption fees | — | — | — | — | |||
Shares redeemed | (873) | (13,824) | (2,264) | (27,878) | |||
Net increase | 55,192 | $ 842,724 | 202,058 | $ 2,639,679 | |||
| Class C | |||||||
Shares sold | — | $ — | 81 | $ 1,000 | |||
Shares issued from reinvestment of distributions | — | — | — | 1 | |||
Redemption fees | — | — | — | — | |||
Shares redeemed | — | — | (81) | (991) | |||
Net increase | — | $ — | — | $ 10 | |||
| Investor Class | |||||||
Shares sold | — | $ — | 97 | $ 1,200 | |||
Shares issued from reinvestment of distributions | 191 | 3,042 | 114 | 1,454 | |||
Redemption fees | — | — | — | — | |||
Shares redeemed | (754) | (10,632) | (3,830) | (46,759) | |||
Net decrease | (563) | $ (7,590) | (3,619) | $ (44,105) | |||
| Meridian Funds | 69 | www.meridianfund.com |
Table of Contents
Notes to Financial Statements (continued)
| Six Months Ended December 31, 2017 | Year Ended June 30, 2017 | ||||||
| Shares | Amount | Shares | Amount | ||||
| Small Cap Growth Fund: | |||||||
| Legacy Class | |||||||
Shares sold | 173,887 | $ 2,726,506 | 1,164,941 | $ 15,473,251 | |||
Shares issued from reinvestment of distributions | 157,763 | 2,513,161 | — | — | |||
Redemption fees | — | — | — | 252 | |||
Shares redeemed | (588,436) | (9,438,492) | (442,884) | (5,950,537) | |||
Net increase/(decrease) | (256,786) | $ (4,198,825) | 722,057 | $ 9,522,966 | |||
| Institutional Class | |||||||
Shares sold | 11,069,696 | $174,774,536 | 15,125,423 | $210,620,628 | |||
Shares issued from reinvestment of distributions | 1,018,208 | 16,260,782 | — | — | |||
Redemption fees | — | 9,963 | — | 9,654 | |||
Shares redeemed | (1,955,315) | (31,040,478) | (2,795,913) | (38,248,463) | |||
Net increase | 10,132,589 | $160,004,803 | 12,329,510 | $172,381,819 | |||
| Class A | |||||||
Shares sold | 977,597 | $ 15,085,868 | 2,567,205 | $ 33,980,919 | |||
Shares issued from reinvestment of distributions | 222,019 | 3,488,257 | — | — | |||
Redemption fees | — | 6,697 | — | 5,957 | |||
Shares redeemed | (1,106,133) | (17,206,846) | (1,496,360) | (20,425,585) | |||
Net increase | 93,483 | $ 1,373,976 | 1,070,845 | $ 13,561,291 | |||
| Class C | |||||||
Shares sold | 129,531 | $ 1,982,914 | 1,153,901 | $ 15,102,239 | |||
Shares issued from reinvestment of distributions | 110,815 | 1,718,743 | — | — | |||
Redemption fees | — | — | — | 1,358 | |||
Shares redeemed | (520,790) | (8,021,191) | (151,870) | (2,048,859) | |||
Net increase/(decrease) | (280,444) | $ (4,319,534) | 1,002,031 | $ 13,054,738 | |||
| Investor Class | |||||||
Shares sold | 15,508,450 | $236,061,891 | 21,832,528 | $294,481,749 | |||
Shares issued from reinvestment of distributions | 1,592,623 | 25,306,772 | — | — | |||
Redemption fees | — | 3,140 | — | 13,821 | |||
Shares redeemed | (3,820,951) | (59,755,011) | (5,577,330) | (76,709,693) | |||
Net increase | 13,280,122 | $201,616,792 | 16,255,198 | $217,785,877 | |||
| Meridian Funds | 70 | www.meridianfund.com |
Table of Contents
Notes to Financial Statements (continued)
| 3. | Investment Transactions: The cost of investments purchased and the proceeds from sales of investments, excluding short-term securities and U.S. government obligations, for the six months ended December 31, 2017, were as follows: |
| Purchases | Proceeds from Sales | ||
Growth Fund | $319,362,791 | $306,114,089 | |
Contrarian Fund | $154,454,074 | $172,979,233 | |
Equity Income Fund | $ 9,609,294 | $ 14,246,810 | |
Small Cap Growth Fund | $536,137,243 | $245,824,210 | |
| 4. | Other Investment Transactions |
| a. | Restricted Securities: The Funds may invest in securities that are subject to legal or contractual restrictions on resale. Prompt sale of such securities at an acceptable price may be difficult and may involve substantial delays and additional costs. |
| b. | Private Placement Securities: Privately issued securities are restricted securities that are offered in a private placement and are generally not registered with the SEC or any federal or state regulatory authority. Securities issued in a private placement are generally "restricted securities" as that term is defined under Rule 144 promulgated under the Securities Act, and may not be resold without registration with the SEC or the availability of an exemption therefrom. There is generally no public trading market for privately offered securities and it is generally not anticipated that a public trading market will develop. There are substantial restrictions on the transfer of privately offered securities. Such securities have limited liquidity that makes it difficult or impossible to sell. An investment in privately issued securities often requires a long-term investment horizon and it may be many years before an investor receives significant distributions from such investment. Due to the lack of public market for privately offered securities, it may be difficult to value the investment. |
| c. | Securities Lending: The Funds have entered into an agreement with The Bank of New York Mellon (the “Lending Agent”), dated September 23, 2015, (“Securities Lending Agreement”), to provide securities lending services to the Funds. Under this program, the proceeds (cash collateral) received from borrowers are used to invest in money market funds or joint repurchase agreements. Under the Securities Lending Agreement, the borrowers may pay the Funds negotiated lender fees and the Funds receive cash and/or securities as collateral in an amount equal to not less than 102% of the market value of loaned securities. The market value of the loaned securities is determined at the close of each business day of the Fund and any additional required collateral is delivered to the Fund, or excess collateral is returned by the Fund, on the next business day. The borrower pays fees at the Funds’ direction to the Lending Agent. Although the risk of lending is generally mitigated by the collateral, the Funds could experience a delay in recovering securities and a possible loss of income or value if the borrower fails to return them. |
| The following table summarizes the securities received as collateral for securities lending: |
| Collateral Type | Coupon Range | Maturity Date Range | Market Value | ||||
Growth Fund | U.S. Government Obligations | 0.00% - 5.38% | 1/11/18 - 2/15/47 | $55,136,323 | |||
Contrarian Fund | U.S. Government Obligations | 0.00% - 6.50% | 1/11/18 - 2/15/47 | 24,352,263 | |||
Equity Income Fund | U.S. Government Obligations | 0.00% - 5.38% | 1/31/18 - 2/15/47 | 2,125,985 | |||
Small Cap Growth Fund | U.S. Government Obligations | 0.00% - 5.38% | 1/11/18 - 2/15/47 | 42,387,034 |
| Meridian Funds | 71 | www.meridianfund.com |
Table of Contents
Notes to Financial Statements (continued)
| d. | Repurchase Agreements and Joint Repurchase Agreements: The Funds may enter into repurchase agreements for temporary cash management purposes provided that the value of the underlying collateral, including accrued interest, will equal or exceed the value of the repurchase agreement during the term of the agreement. The underlying collateral for all repurchase agreements is held in safekeeping by the Fund’s custodian or at the Federal Reserve Bank. If the seller defaults and the value of the collateral declines, or if bankruptcy proceedings commence with respect to the seller of the security, realization of the collateral by the Funds may be delayed or limited. |
| Additionally, the Funds may enter into joint repurchase agreements for reinvestment of cash collateral on securities lending transactions under the securities lending program offered by the Lending Agent (the “Program”), provided that the value of the underlying collateral, including accrued interest will equal or exceed the value of the joint repurchase agreement during the term of the agreement. The Funds participate on a pro rata basis with other clients of the Lending Agent in its share of the underlying collateral under such joint repurchase agreements and in its share of proceeds from any repurchase or other disposition of the underlying collateral. The underlying collateral for joint repurchase agreements is held in safekeeping by the Fund’s custodian or at the Federal Reserve Bank. If the seller defaults and the value of the collateral declines, or if bankruptcy proceedings commence with respect to the seller of the security, realization of the collateral by the Funds may be delayed or limited. Pursuant to the Program, the Funds are indemnified for such losses by the Lending Agent. | |
| At December 31, 2017, the market value of repurchase agreements or joint repurchase agreements outstanding for the Meridian Growth Fund, Meridian Contrarian Fund, Meridian Equity Income Fund, and the Meridian Small Cap Growth Fund were $173,512,065, $100,538,328, $7,237,733 and $112,692,545, respectively. | |
| e. | Master Netting Arrangements: The Funds may enter into master netting agreements with their counterparties for the securities lending program and repurchase agreements, which provide the right, in the event of default (including bankruptcy or insolvency) for the non-defaulting party to liquidate the collateral and calculate net exposure to the defaulting party or request additional collateral. For financial reporting purposes, the Funds do not offset financial assets and financial liabilities that are subject to master netting agreements in the Statement of Assets and Liabilities. For securities lending transactions see Note 4.b. |
| The following table is a summary of the Funds’ open repurchase agreements that are subject to a master netting arrangement as of December 31, 2017: |
| Assets | |||||
| Gross Amounts Presented in Statements of Assets and Liabilities | Collateral Received | Net Amount | |||
| Growth Fund | |||||
Repurchase agreement | $ 173,512,065 | $ (173,512,065)1 | $ — | ||
| Contrarian Fund | |||||
Repurchase agreement | 100,538,328 | (100,538,328) 1 | — | ||
| Equity Income Fund | |||||
Repurchase agreement | 7,237,733 | (7,237,733) 1 | — | ||
| Small Cap Growth Fund | |||||
Repurchase agreement | 112,692,545 | (112,692,545) 1 | — | ||
| 1 The amount of collateral presented is limited such that the net amount cannot be less than zero. Collateral received in excess of the market value of securities on loan is not presented in this table. | |||||
| f. | Options: Certain Funds purchase and write call and put options to increase or decrease their exposure to underlying instruments (including equity risk, interest rate risk and/or commodity price risk) and/or, in the case of options written, to generate gains from options premiums. A call option gives the purchaser (holder) of the option the right (but not the obligation) to buy, and obligates the seller (writer) to sell (when the option is exercised) the |
| Meridian Funds | 72 | www.meridianfund.com |
Table of Contents
Notes to Financial Statements (continued)
| underlying instrument at the exercise or strike price at any time or at a specified time during the option period. A put option gives the holder the right to sell and obligates the writer to buy the underlying instrument at the exercise or strike price at any time or at a specified time during the option period. When the Funds purchase (write) an option, an amount equal to the premium paid (received) by the Funds is reflected as an asset (liability). The amount of the asset (liability) is subsequently marked-to-market to reflect the current market value of the option purchased (written). When an instrument is purchased or sold through an exercise of an option, the related premium paid (or received) is added to (or deducted from) the basis of the instrument acquired or deducted from (or added to) the proceeds of the instrument sold. When an option expires (or the Funds enter into a closing transaction), the Funds realize a gain or loss on the option to the extent of the premiums received or paid (or gain or loss to the extent the cost of the closing transaction exceeds the premiums received or paid). When the Funds write a call option, such option is “covered,” meaning that the Funds hold the underlying instrument subject to being called by the option counterparty. When the Funds write a put option, such option is covered by cash in an amount sufficient to cover the obligation. | |
| In purchasing and writing options, the Funds bear the risk of an unfavorable change in the value of the underlying instrument or the risk that the Funds may not be able to enter into a closing transaction due to an illiquid market. Exercise of a written option could result in the Funds purchasing or selling a security when it otherwise would not, or at a price different from the current market value. | |
| Average quarterly balances of outstanding derivative financial instruments were as follows. |
| Meridian Contrarian Fund | |
| Options: | |
Average value of option contracts purchased | $ 1,595 |
Average value of option contracts written | $1,084,500 |
| Meridian Equity Income Fund | |
| Options: | |
Average value of option contracts purchased | $6,117,055 |
Average value of option contracts written | $ 61,250 |
| g. | Short Sales: The Funds may enter into short sales. A short sale occurs when a fund sells a security it generally does not own (the security is borrowed), in anticipation of a decline in the security’s price. The initial amount of a short sale is recorded as a liability which is marked-to-market daily. Fluctuations in the value of the short liability are recorded as unrealized gains or losses. If a Fund shorts a security when also holding a long position in the security (a “short against the box”), as the security’s price declines, the short position increases in value, offsetting the long position’s decrease in value. The opposite effect occurs if the security’s price rises. A Fund realizes a gain or loss upon closing of the short sale (returning the security to the counterparty by way of purchase or delivery of a long position owned). Possible losses from short sales may be unlimited, whereas losses from security purchases cannot exceed the total amount invested. The Funds are liable to the buyer for any dividends payable on securities while those securities are in a short position. These dividends are an expense of the Funds. The Funds designate collateral consisting of cash, U.S. government securities or other liquid assets sufficient to collateralize the market value of short positions. |
| 5. | Market and Debt Securities Risk |
| In the normal course of business, each Funds’ investment activities expose it to various types of risk associated with the financial instruments and markets in which it invests. The significant types of financial risks each Fund is exposed to include market risk and debt securities risk. Each Fund’s prospectus provides details of these and other types of risk. | |
| Market Risk: Market risk refers to the possibility that the market values of securities or other investments that a Fund holds will fall, sometimes rapidly or unpredictably, or fail to rise. Security values may fall or fail to rise because of a |
| Meridian Funds | 73 | www.meridianfund.com |
Table of Contents
Notes to Financial Statements (continued)
| variety of factors affecting (or the market’s perception of) individual companies or other issuers (e.g., an unfavorable earnings report), industries or sectors, or the market as a whole, reducing the value of an investment in a Fund. Accordingly, an investment in the Fund could lose money over short or even long periods. The market values of the securities the Fund holds also can be affected by changes (or perceived changes) in U.S. or foreign economies and financial markets, and the liquidity of these securities, among other factors. In general, equity securities tend to have greater price volatility than debt securities. In addition, stock prices may be sensitive to rising interest rates, as the cost of capital rises and borrowing costs increase. As a result, the value of your investments in a Fund may be more or less than the value of your purchase price. | |
| Debt Securities Risk: Each Fund may invest in debt securities of both government and corporate issuers. A decline in prevailing levels of interest rates generally increases the value of debt securities in a Fund’s portfolio, while an increase in rates usually reduces the value of those securities. The value of a Fund’s debt securities, including bonds and convertible securities, are affected by movements in interest rates; if interest rates rise, the value of these securities may fall. Generally, the longer the average maturity of a debt security, the greater the change in its value. As a result, to the extent that a Fund invests in debt securities, interest rate fluctuations will affect the Fund’s net asset value, but not the income it receives from debt securities it owns. Debt securities are also subject to credit, liquidity risk and prepayment and extension risk. Credit risk is the risk that the entity that issued a debt security may become unable to make payments of principal and interest, and includes the risk of default. Liquidity risk is the risk that a Fund may not be able to sell portfolio securities because there are too few buyers for them. Prepayment and extension risk is the risk that a loan, bond or other security might be called or otherwise converted, prepaid or redeemed before maturity. If a loan or security is converted, prepaid or redeemed before maturity, particularly during a time of declining interest rates or spreads, the portfolio managers may not be able to invest the proceeds in securities or loans providing as high a level of income, resulting in a reduced yield to a Fund. Conversely, as interest rates rise or spreads widen, the likelihood of prepayment decreases. The portfolio managers may be unable to capitalize on securities with higher interest rates or wider spreads because a Fund’s investments are locked in at a lower rate for a longer period of time. |
| 6. | Affiliate Transactions and Fees |
| Management Fees: Under the Investment Management Agreement, the Adviser receives the following fees for providing certain investment management and other services necessary for managing each Fund. The fee is paid monthly in arrears and calculated based on that month’s daily average net assets. |
| Growth Fund: | Contrarian and Small Cap Growth Funds: | |||||
| Average Daily Net Assets | Investment Management Fee | Average Daily Net Assets | Investment Management Fee | |||
Up to $50,000,000 | 1.00% | Greater than $0 | 1.00% | |||
Greater than $50,000,000 | 0.75% | |||||
| Equity Income Fund: | ||
| Average Daily Net Assets | Investment Management Fee | |
Up to $10,000,000 | 1.00% | |
$10,000,001 to $30,000,000 | 0.90% | |
$30,000,001 to $50,000,000 | 0.80% | |
Greater than $50,000,000 | 0.70% | |
| Meridian Funds | 74 | www.meridianfund.com |
Table of Contents
Notes to Financial Statements (continued)
| Expense Limitation | Total Waivers and Reimbursements for the six months ended December 31, 2017 | ||
| Growth Fund | |||
Institutional Class | 0.90% | $— | |
Class A | 1.55% | $— | |
Class C | 2.25% | $— | |
Investor Class | 1.30% | $— | |
| Contrarian Fund | |||
Class A | 1.60% | $— | |
Class C | 2.20% | $— | |
Investor Class | 1.35% | $— | |
| Equity Income Fund | |||
Legacy Class | 1.25% | $— | |
Class A | 1.60% | $— | |
Class C | 2.00% | $— | |
Investor Class | 1.35% | $— | |
| Small Cap Growth Fund | |||
Legacy Class | 1.20% | $— | |
Institutional Class | 1.10% | $— | |
Class A | 1.49% | $— | |
Class C | 2.25% | $— | |
Investor Class | 1.35% | $— | |
| Meridian Funds | 75 | www.meridianfund.com |
Table of Contents
Notes to Financial Statements (continued)
| Expiration June 30, | |||||
| 2018 | 2019 | 2020 | |||
Growth Fund | — | — | — | ||
Contrarian Fund | 20,429 | — | — | ||
Equity Income Fund | 25,419 | 216 | 3 | ||
Small Cap Growth Fund | 6,441 | 34,831 | 51,347 | ||
| 7. | Directors and Officers: Certain Directors and/or Officers of the Funds are also Directors and/or Officers of the Adviser. Directors and Officers of the Funds who are Directors and/or Officers of the Adviser receive no compensation from the Funds. Each Non-Interested Director is paid an annual fee set at $40,000. An additional $5,000 is paid to each Non-Interested Director for attendance at each in-person meeting of the Board and an additional $1,000 is paid to each Non-Interested Director for participating in a telephonic meeting of the Board. An additional $3,000 is paid to each member of the Audit or Governance Committee of the Board for attendance at an in-person Audit or Governance Committee meeting and an additional $1,000 is paid to each member of the Audit or Governance Committee of the Board for participating in a telephonic Audit or Governance Committee meeting. |
| An additional $10,000 is paid to the Chairman of the Board and the Chairman of a Committee of the Board. The Chairman of the Board also receives an additional $2,500 for attending each in-person meeting of the Board. The Chairman of a Committee receives an additional $2,000 for attending each in-person Committee meeting. |
| 8. | Distribution Information: Income and long-term capital gains distributions are determined in accordance with federal income tax regulations, which may differ from GAAP. The tax character of distributions made during the fiscal year ended June 30, 2017, is as follows: |
| 2017 Taxable Distributions | |||||
| Ordinary Income | Net Long-Term Capital Gain | Total Distributions | |||
Growth Fund | 7,440,786 | — | 7,440,786 | ||
Contrarian Fund | — | 3,004,528 | 3,004,528 | ||
Equity Income Fund | 366,908 | — | 366,908 | ||
Small Cap Growth Fund | — | — | — | ||
| 9. | Federal Income Taxes Information: Management has analyzed the Funds’ tax positions taken on federal income tax returns for all open tax years (current and prior three tax years), and has concluded that no provision for federal income tax is required in the Funds’ financial statements. The Funds’ federal and state income and federal excise tax returns for tax years for which the applicable statutes of limitations have not expired are subject to examination by the Internal Revenue Service and state departments of revenue. The Funds are not aware of any tax positions for which it is reasonably possible that the total amounts of unrecognized tax benefits will significantly change in the next 12-months. The Funds recognize interest and penalties, if any, related to unrecognized tax benefits as income tax expense in the Statements of Operations. During the six months ended December 31, 2017, the Funds did not incur any interest or penalties. |
| The aggregate cost of investments, unrealized appreciation and depreciation, for federal income tax purposes, at December 31, 2017 is as follows: | |
| Meridian Funds | 76 | www.meridianfund.com |
Table of Contents
Notes to Financial Statements (continued)
| Aggregrate Cost | Aggregrate Gross Unrealized Appreciation | Aggregrate Gross Unrealized Depreciation | Net Unrealized Appreciation | ||||
Growth Fund | $1,391,659,198 | $417,655,023 | $(69,308,900) | $348,346,123 | |||
Contrarian Fund | 546,569,529 | 186,011,421 | (6,686,309) | 179,325,112 | |||
Equity Income Fund | 45,209,852 | 21,232,285 | (2,837,140) | 18,395,145 | |||
Small Cap Growth Fund | 1,163,039,196 | 217,684,111 | (32,096,299) | 185,587,812 |
| The Growth Fund and the Small Cap Growth Fund utilized capital loss carryover of $36,672,291 and $8,965,770, respectively. |
| 10. | Subsequent Events: Management’s evaluation of the impact of all subsequent events on the Funds’ financial statements was completed through the date the financial statements were issued and the following items were noted: |
| Effective February 13, 2018, PricewaterhouseCoopers LLP (“PwC”) ceased serving as the independent registered public accounting firm to the Funds. The Audit Committee of the Board participated in, and approved, the decision to change the independent registered public accounting firm. PwC’s reports on the Funds’ financial statements for the fiscal periods ended June 30, 2017 and June 30, 2016 contained no adverse opinion or disclaimer of opinion nor were they qualified or modified as to uncertainty, audit scope or accounting principle. During the Funds’ fiscal periods ended June 30, 2017 and June 30, 2016 and the subsequent interim period through February 13, 2018, (i) there were no disagreements with PwC on any matter of accounting principles or practices, financial statement disclosure or auditing scope or procedure, which disagreements, if not resolved to the satisfaction of PwC, would have caused them to make reference to the subject matter of the disagreements in connection with their reports on the Funds’ financial statements for such periods, and (ii) there were no “reportable events” of the kind described in Item 304(a)(1)(v) of Regulation S-K under the Securities Exchange Act of 1934, as amended. | |
| The Audit Committee of the Board approved the engagement of Cohen and Co. (“Cohen”) as the Funds’ independent registered public accounting firm for the fiscal year ending June 30, 2018. The selection of Cohen does not reflect any disagreements with or dissatisfaction by the Funds or the Board with the performance of the Funds’ prior independent registered public accounting firm, PwC. During the Funds’ fiscal periods ended June 30, 2017 and June 30, 2016 and the subsequent interim period through February 13, 2018, neither the Funds, nor anyone on its behalf, consulted with Cohen on items which: (i) concerned the application of accounting principles to a specified transaction, either completed or proposed, or the type of audit opinion that might be rendered on the Funds’ financial statements; or (ii) concerned the subject of a disagreement (as defined in paragraph (a)(1)(iv) of Item 304 of Regulation S-K) or reportable events (as described in paragraph (a)(1)(v) of said Item 304). |
| Meridian Funds | 77 | www.meridianfund.com |
Table of Contents
| Meridian Funds | 78 | www.meridianfund.com |
Table of Contents
| Meridian Funds | 79 | www.meridianfund.com |
Table of Contents
| Meridian Funds | 80 | www.meridianfund.com |
Table of Contents
Glossary of Terms Used in this Report (Unaudited)
| Meridian Funds | 81 | www.meridianfund.com |
Table of Contents
| • | Applications or other forms |
| • | Transactions with us, our affiliates, or others |
Table of Contents
P.O. Box 9792
1-800-446-6662
| • | For a fee, by writing the Public Reference Section of the Commission, Washington, D.C. 20549-1520, by electronic request at the following E-mail address: publicinfo@sec.gov, or by calling 202-551-8090 |
| • | Free from the Commission’s Website at http://www.sec.gov. |
Table of Contents
Other Information (Unaudited)
(800) 446-6662
(303) 398-2929
(877) 796-3434
ArrowMark Colorado Holdings, LLC
100 Fillmore Street, Suite 325
Denver, CO 80206
ALPS Distributors, Inc.
1290 Broadway, Suite 1100
Denver, CO 80203
BNY Mellon Investment Servicing (US) Inc.
760 Moore Road
King of Prussia, PA 19406
The Bank of New York Mellon
One Wall Street
New York, NY 10286
Davis Graham & Stubbs LLP
1550 17th Street, Suite 500
Denver, CO 80202
Cohen and Co.
1350 Euclid Ave., Suite 800
Cleveland, OH 44115
James Bernard Glavin, Chairman
Guy M. Arnold
John S. Emrich
Michael S. Erickson
Edward F. Keely
Michael Stolper*
David Corkins, President
Derek Mullins, Chief Financial Officer and Treasurer
Richard Grove, Vice President, Secretary and Chief
Compliance Officer
Table of Contents
| Item 2. | Code of Ethics. |
Not applicable.
| Item 3. | Audit Committee Financial Expert. |
Not applicable.
| Item 4. | Principal Accountant Fees and Services. |
Not applicable.
| Item 5. | Audit Committee of Listed Registrants. |
Not applicable.
| Item 6. | Investments. |
| (a) | Schedule of Investments in securities of unaffiliated issuers as of the close of the reporting period is included as part of the report to shareholders filed under Item 1 of this form. |
| Item 7. | Disclosure of Proxy Voting Policies and Procedures for Closed-End Management Investment Companies. |
Not applicable.
| Item 8. | Portfolio Managers of Closed-End Management Investment Companies. |
Not applicable.
| Item 9. | Purchases of Equity Securities by Closed-End Management Investment Company and Affiliated Purchasers. |
Not applicable.
| Item 10. | Submission of Matters to a Vote of Security Holders. |
Table of Contents
There have been no material changes to the procedures by which the shareholders may recommend nominees to the registrant’s board of directors, where those changes were implemented after the registrant last provided disclosure in response to the requirements of Item 407(c)(2)(iv) of Regulation S-K (17 CFR 229.407) (as required by Item 22(b)(15) of Schedule 14A (17 CFR 240.14a-101)), or this Item.
| Item 11. | Controls and Procedures. |
| (a) | The registrant’s principal executive and principal financial officers, or persons performing similar functions, have concluded that the registrant’s disclosure controls and procedures (as defined in Rule 30a-3(c) under the Investment Company Act of 1940, as amended (the “1940 Act”) (17 CFR 270.30a-3(c))) are effective, as of a date within 90 days of the filing date of the report that includes the disclosure required by this paragraph, based on their evaluation of these controls and procedures required by Rule 30a-3(b) under the 1940 Act (17 CFR 270.30a-3(b)) and Rules 13a-15(b) or 15d-15(b) under the Securities Exchange Act of 1934, as amended (17 CFR 240.13a-15(b) or 240.15d-15(b)). |
| (b) | There were no changes in the registrant’s internal control over financial reporting (as defined in Rule 30a-3(d) under the 1940 Act (17 CFR 270.30a-3(d))) that occurred during the registrant’s last fiscal quarter that has materially affected, or is reasonably likely to materially affect, the registrant’s internal control over financial reporting. |
| Item 12. | Disclosure of Securities Lending Activities for Closed-End Management Investment Companies. |
Not applicable.
| Item 13. | Exhibits. |
| (a)(1) | Not applicable. |
| (a)(2) | Certifications pursuant to Rule 30a-2(a) under the 1940 Act and Section 302 of the Sarbanes-Oxley Act of 2002 are attached hereto. |
| (a)(3) | Not applicable. |
| (a)(4) | Not applicable. |
| (b) | Certifications pursuant to Rule 30a-2(b) under the 1940 Act and Section 906 of the Sarbanes Oxley Act of 2002 are attached hereto. |
Table of Contents
SIGNATURES
Pursuant to the requirements of the Securities Exchange Act of 1934 and the Investment Company Act of 1940, the registrant has duly caused this report to be signed on its behalf by the undersigned, thereunto duly authorized.
| (Registrant) Meridian Fund, Inc.® | ||||
| By (Signature and Title)* | /s/ David J. Corkins | |||
| David J. Corkins | ||||
| Principal Executive Officer and President | ||||
| Date March 2, 2018 | ||||
Pursuant to the requirements of the Securities Exchange Act of 1934 and the Investment Company Act of 1940, this report has been signed below by the following persons on behalf of the registrant and in the capacities and on the dates indicated.
| By (Signature and Title)* | /s/ David J. Corkins | |||
| David J. Corkins | ||||
| Principal Executive Officer and President | ||||
| Date March 2, 2018 | ||||
| By (Signature and Title)* | /s/ Derek J. Mullins | |||
| Derek J. Mullins | ||||
| Principal Financial Officer and Treasurer | ||||
| Date March 2, 2018 | ||||
| * | Print the name and title of each signing officer under his or her signature. |