Table of Contents
UNITED STATES
SECURITIES AND EXCHANGE COMMISSION
Washington, D.C. 20549
FORM N-CSR
CERTIFIED SHAREHOLDER REPORT OF REGISTERED
MANAGEMENT INVESTMENT COMPANIES
Investment Company Act file number 811-04014
Meridian Fund, Inc.®
(Exact name of registrant as specified in charter)
100 Fillmore St., Suite 325
Denver, CO 80206
(Address of principal executive offices) (Zip code)
David J. Corkins
100 Fillmore St., Suite 325
Denver, CO 80206
(Name and address of agent for service)
Registrant’s telephone number, including area code: 303-398-2929
Date of fiscal year end: June 30
Date of reporting period: December 31, 2015
Table of Contents
| Item 1. | Reports to Stockholders. |
The Report to Shareholders is attached herewith.
Table of Contents


Table of Contents
Table of Contents
Table of Contents
Portfolio Performance and Composition (Unaudited)
| • | SolarWinds, Inc. (SWI) accepted a $4.5 billion offer to be acquired by two private equity firms, turning it into a home run for investors. In October, the developer of IT infrastructure management software agreed to be purchased at nearly a 20% premium by Silver Lake Partners and Thoma Bravo. We initiated a position in SolarWinds in 2013 based on our belief that the company would benefit from an increasingly large market opportunity created by a pervasiveness of performance-driven IT infrastructures. We opportunistically added to the position when the stock pulled back and were rewarded by the takeout. |
| • | Solera Holdings, Inc. (SLH) is a company we’ve owned for several years. As a provider of risk and asset management software and services to the global automotive industry, Solera is a stable business that is both predictable and defensive in nature. The majority of the company’s revenues are recurring, and it has a strong competitive position, particularly outside of the U.S. where it generates over half of its revenue. In August, Solera’s management announced the sale of the company to private equity firm Vista Equity Partners for $6.5 billion, causing the stock to appreciate. We viewed the increase in Solera’s share price as an opportunity to take profits and trimmed our position. |
| • | Dyax Corp. (DYAX) is a biopharmaceutical company focused on novel therapeutics for patients with rare diseases. One of the things that initially attracted us to this company was its development of a promising new drug for hereditary angioedema, a rare and potentially life-threatening disease that causes swelling. Ireland-based biopharmaceutical company Shire also recognized the potential of this experimental drug and, in November, offered to purchase Dyax in an all-cash deal valued at approximately $5.9 billion—a premium of about 35%. We were pleased to be among the investors who benefited from this lucrative deal. |
| • | Roadrunner Transportation Systems, Inc. (RRTS), a leading transportation and logistics service provider, declined along with other transportation service providers. Weak freight markets, a more competitive pricing environment, and an increase in accidents worked against Roadrunner, causing it to miss third-quarter earnings expectations. The company also took a one-time charge after discontinuing a lease-guarantee program designed |
| Meridian Funds | 4 | www.meridianfund.com |
Table of Contents
Portfolio Performance and Composition (Unaudited) (continued)
| to attract owner-operators. We believe Roadrunner’s position as the low-cost provider in this space will enable it to successfully weather the competitive pricing environment, which we expect will be short-lived. In addition, the company is gaining market share and enjoying double-digit returns on acquisitions. We opted to hold onto this stock while closely monitoring fundamentals. | |
| • | Wolverine Worldwide, Inc. (WWW) is the leading manufacturer of non-athletic footwear in the U.S. Like many other retail companies during the period, Wolverine struggled against a bleak consumer backdrop. The company announced an 18% decline in third-quarter earnings due to inconsistent retail traffic and disappointing re-order patterns from its retail partners. Wolverine owns a broad portfolio of footwear brands including Sperry, Merrell, Keds, and Saucony and manufactures work boots for the military and construction workers. We believe an unusually warm winter and exposure to the oil and gas industry will create headwinds for Wolverine’s winter and work boots. Although we maintain a position in the stock, we are continuing to closely monitor fundamentals. |
| • | Clean Harbors, Inc. (CLH) is a provider of environmental, energy, and industrial services, including hazardous waste disposal for companies. The rapid deterioration of oil prices during the period caused Clean Harbors’ re-refining business to suffer. However, we believe the company’s hazardous waste disposal business is its greatest asset. It is extremely difficult for companies to meet Environmental Protection Agency (EPA) requirements and to obtain permitting for new hazardous waste incinerators, giving Clean Harbors a competitive advantage. This business has benefitted from a steady increase in the types of waste classified by the EPA as hazardous. Given the industry’s limited capacity and Clean Harbors’ dominant position in this space, the company has been able to consistently raise prices. We believe investors are too focused on the short-term movement of crude oil prices and not focused enough on the long-term growth potential of this company. We consequently increased our position in the stock. |
| Meridian Funds | 5 | www.meridianfund.com |
Table of Contents
Portfolio Performance and Composition (Unaudited) (continued)

| Share Class | Inception | 6 Month | 1 Year | 5 Year | 10 Year | Since Inception |
| Legacy Class (MERDX) | 8/1/84 | (8.90)% | (5.32)% | 8.60% | 8.67% | 12.20% |
| Institutional Class (MRRGX) | 12/24/14 | (8.94)% | (5.41)% | — | — | (5.46)% |
| Class A (MRAGX) | 11/15/13 | (9.23)% | (5.98)% | — | — | 3.07% |
| Class C (MRCGX) | 7/1/15 | — | — | — | — | (9.39)% |
| Investor Class (MRIGX) | 11/15/13 | (8.95)% | (5.51)% | — | — | 3.50% |
| Russell 2500® Growth Index | 8/1/84 | (7.66)% | (0.19)% | 11.43% | 8.49% | N/A |
| Meridian Funds | 6 | www.meridianfund.com |
Table of Contents
Portfolio Performance and Composition (Unaudited) (continued)
12.31.15
| ServiceMaster Global Holdings, Inc. | 3.14% |
| Sally Beauty Holdings, Inc. | 3.13% |
| Cadence Design Systems, Inc. | 3.05% |
| SolarWinds, Inc. | 3.02% |
| National CineMedia, Inc. | 2.62% |
| Clean Harbors, Inc. | 2.60% |
| Trimble Navigation Ltd. | 2.55% |
| LPL Financial Holdings, Inc. | 2.36% |
| HEICO Corp. Class A | 2.32% |
| Solera Holdings, Inc. | 2.21% |

| Meridian Funds | 7 | www.meridianfund.com |
Table of Contents
Portfolio Performance and Composition (Unaudited)
| • | NVIDIA Corp. (NVDA) is the dominant provider of visual computing technologies used for PC based video games and is expanding into new markets in enterprise computing and automotive. We originally invested in the company after management significantly increased R&D spending in order to enter the mobile, automotive, and enterprise markets. These investments depressed earnings, and investors were initially disappointed with failed |
| Meridian Funds | 8 | www.meridianfund.com |
Table of Contents
Portfolio Performance and Composition (Unaudited) (continued)
| product launches in cell phones and tablets. However, we view NVIDIA’s technology as highly differentiated, and feel that there are excellent opportunities outside of mobile devices. Stock performance this quarter was driven by another solid earnings report, supported by continued growth in the traditional PC gaming industry and sales of chips for automotive infotainment systems. Based on the market opportunities in auto, and enterprise computing, we continue to hold shares. | |
| • | Microsoft Corp. (MSFT) is a global leader in software for PC’s and enterprise computing. The company had struggled for a number of years to find growth outside of its traditional markets, missing out on large opportunities in the social and mobile markets. Last year, shares were hit hard due to weak end markets related to PC’s as well as foreign exchange headwinds. Based on our research, we felt new management was reinvigorating innovation and the company was well positioned to offer compelling cloud-based computing services. In 2015, we began to see the signs of progress in this transformation, with shares propelled by an 80% increase in cloud computing revenue during the September quarter. We continue to hold our shares as the cloud transformation is in its early innings and we think the company has the potential to generate $4 of free cash flow per share within the next 2-3 years. |
| • | Old Republic International Corp. (ORI) is a 100+ year old insurance underwriter focused on commercial casualty lines and title insurance. We originally invested in the company after earnings suffered due to (1) higher losses in its workers’ compensation line of business due to medical cost inflation and poorly underwritten policies, and (2) the title insurance segment declined against difficult comparisons relative to the 2012-2013 refinancing boom. The stock performed well for us in 2015 as the company returned to more traditional workers’ comp loss ratios by shifting its book of business to more risk sharing with insureds and away from more competitive coastal geographies, and as the title business enjoyed close to double digit growth in premiums. We continue to hold shares in Old Republic due to its 4% dividend yield and steady results, but have reduced our position due to significant stock price appreciation. |
| • | Verint Systems, Inc. (VRNT) technologies provide collection and analysis of unstructured data including voice, video, email, internet and other data transmissions. Solutions are used for security, interception, surveillance, defense, and customer service and enterprise intelligence. The company is a leader in its markets with competitive advantages derived from a core analytical technology platform that can be applied to different products and end markets. We invested when earnings declined due to significant investment by the company in new products to re-accelerate product development and sales. Verint has been a strong performer for the Contrarian Fund over the 3 years since our original investment. This year the stock has suffered from adverse foreign exchange and cautious guidance due to macro factors. We believe Verint’s end markets remain attractive, and that the company continues to have leading technology and a significant market opportunity for its new cyber-security products. As such we continue to own Verint shares while we confirm this thesis. |
| • | Dick’s Sporting Goods, Inc. (DKS) is the largest full-line, omni-channel sporting goods store in the US with over 700 stores and an expanding online presence selling an extensive selection of equipment, apparel, footwear and accessories. We invested in Dick’s after the company’s earnings growth slowed due to weakness in its golf business combined with a slowdown in guns and ammunition sales. We believed the company had finally accepted that there is a secular decline in golf and had a solid plan to improve profitability by allocating square footage from golf to more popular product lines and closing many of its specialty golf locations as their leases come up. Gun and ammunition sales were weak against a tough comparable period that had seen strong demand due to worries about increased gun control. Industry data indicated to us that gun and ammunition sales were picking up as the tough comparable period passed. This thesis played out quickly and we initially had gains in our investment and held on to the stock as the company continued to post solid earnings results. During the quarter, however, the company announced that historically warm weather would hurt sales of outerwear and reduce earnings. We continue to hold shares of Dick’s Sporting Goods as we believe it is the best merchandiser in its category, has a compelling and improving online presence, and will benefit from strong market share gains in brick and mortar retail as weaker competitors succumb to the pressure of online competition. |
| • | Clean Harbors, Inc. (CLH) provides a variety of environmental remediation and industrial waste management services. The business has high regulatory barriers to entry and roughly three fourths of revenues are recurring in |
| Meridian Funds | 9 | www.meridianfund.com |
Table of Contents
Portfolio Performance and Composition (Unaudited) (continued)
| nature. Clean Harbors came across our contrarian screens due to tough comparisons in its comparatively volatile event-driven business and a poorly timed oil recycling acquisition. While our investment thesis largely played out as these businesses have improved, the company has suffered due to significant declines in its oil and gas related businesses. We continue to hold Clean Harbors’ shares due to the defensive nature of its core business and an attractive valuation that ascribes little value to the most energy exposed areas. We expect earnings growth to resume late in 2016 and see this as a potential catalyst for the stock. |
| Meridian Funds | 10 | www.meridianfund.com |
Table of Contents
Portfolio Performance and Composition (Unaudited) (continued)

| Share Class | Inception | 6 Month | 1 Year | 5 Year | 10 Year | Since Inception |
| Legacy Class (MVALX) | 2/10/94 | (7.37)% | (3.42)% | 9.63% | 7.06% | 12.50% |
| Class A (MFCAX) | 11/15/13 | (7.59)% | (3.92)% | — | — | 2.37% |
| Class C (MFCCX) | 7/1/15 | — | — | — | — | (8.08)% |
| Investor Class (MFCIX) | 11/15/13 | (7.49)% | (3.67)% | — | — | 2.63% |
| Russell 2500® Index | 2/10/94 | (7.36)% | (2.90)% | 10.32% | 7.56% | 9.82% |
| S&P 500® Index | 2/10/94 | 0.15% | 1.39% | 12.55% | 7.30% | 8.91% |
| Meridian Funds | 11 | www.meridianfund.com |
Table of Contents
Portfolio Composition (Unaudited)
12.31.15
| CACI International, Inc. Class A | 3.59% |
| Microsoft Corp. | 3.57% |
| LKQ Corp. | 3.24% |
| NVIDIA Corp. | 3.14% |
| EOG Resources, Inc. | 3.05% |
| Xylem, Inc. | 2.70% |
| Old Republic International Corp. | 2.66% |
| Alexander & Baldwin, Inc. | 2.62% |
| Gildan Activewear, Inc. (Canada) | 2.56% |
| Celgene Corp. | 2.18% |

| Meridian Funds | 12 | www.meridianfund.com |
Table of Contents
Portfolio Performance and Composition (Unaudited)
| • | NVIDIA Corp. (NVDA) has evolved its business by radically changing its product mix. Originally known as a supplier of graphics chips to original equipment manufacturers and the broader PC market, NVIDIA now also offers solutions that cater to higher-margin business segments such as gaming, high-performance computing and cloud computing. In its most recently reported quarter, NVIDIA stated that sales of these products accounted for more than 70% of the company’s revenue base. A significant win for the chipmaker was Facebook’s decision to power its Big Sur computing platform with NVIDIA’s Tesla M40 GPU. Also contributing to the company’s strength is a competitive advantage gained through programming languages that enable better, faster and easier programming for developers creating next-generation scientific, engineering, and enterprise applications. As virtual reality, driverless cars and other life-changing technologies continue to emerge, we believe demand for NVIDIA’s smart, fast chips will increase. |
| • | Amazon.com, Inc. (AMZN) continues to move the needle on many fronts, including cloud computing. Amazon Web Services (AWS), which rents computing power and storage for corporate customers, is the leader in this space and continues to strengthen its competitive advantage through major feature releases, more data centers, and price cuts for several of its services. Although AWS recently announced annual revenue growth of approximately 60% and a profit margin of greater than 50%, we believe this segment of the business has much more room to |
| Meridian Funds | 13 | www.meridianfund.com |
Table of Contents
Portfolio Performance and Composition (Unaudited) (continued)
| grow. Another positive development for the stock was a significant shift in consumer buying trends during the holiday season as more people chose to do their shopping in the e-commerce marketplace rather than in bricks-and-mortar stores. This shift helped Amazon exceed earning expectations during the third quarter. | |
| • | Microsoft Corp. (MSFT) is a leader in the cloud computing business, second only to Amazon. Lower cost, higher security, and a host of other benefits are convincing more and more companies to move their businesses to the cloud. Microsoft AZURE, the company’s cloud-based services platform, is a beneficiary of this trend and is steadily growing market share. The company’s cloud business has grown by triple digits over the past two years, due in part to new CEO Satya Nadella, who is positioning Microsoft for 21st century cloud computing. |
| • | California Resources Corp. (CRC) is focused solely on oil and natural gas exploration and drilling in California. Our investment in this stock was based on the expectation that U.S. production would soon taper off, resulting in higher domestic oil prices. However, production continued to increase for much longer than we anticipated, forcing management to make production cutbacks, slash capital spending plans, and reduce the number of wells it plans to operate. Another negative for the company was its elevated debt load, which tends to fuel greater volatility in the stock when oil prices fall. We continue to believe California Resources Group is positioned for a rebound when U.S. oil production slows and therefore maintained a position in the stock. |
| • | Exact Sciences Corp. (EXAC) declined after an independent panel of health care experts excluded the company’s colon cancer-screening test from a list of recommended tests in the U.S. Instead, the panel defined the product as “alternative testing that may be useful in select clinical circumstances.” Marketed as Cologuard, the product is a non-invasive, FDA-approved colorectal cancer-screening test covered by Medicare. It has proven effective at detecting early-stage colon cancer as well as precancerous lesions. When detected early, colon cancer is highly curable. However, Cologuard’s exclusion from the panel’s list of recommended tests may make it more difficult to win favorable reimbursement from private insurers. We consequently liquidated our position in Exact Sciences and used proceeds from the sale to invest in other, more attractive investment opportunities. |
| • | Royal Gold, Inc. (RGLD) is a precious metals company with royalty claims on gold, silver, copper, lead, and zinc at mines in over 20 countries. While gold performed better than other commodities during the period, the precious metal declined as U.S. monetary policy tightened and the dollar appreciated. Another setback for the company was the deferral of gold from a mine in Chile operated by Barrick Gold, which temporarily stopped construction at the mine. However, we believe Royal Gold has an exceptional business model and we view our investment in the company as a great way to get exposure to gold. The company essentially pays miners upfront for the right to buy their metals later at reduced prices. It has no operational risk because it owns no mines, is a beneficiary of ounces growth, has pricing power, and typically earns an 8% return on a flat price. We have decided to be patient with Royal Gold and maintained a position in the stock. |
| Meridian Funds | 14 | www.meridianfund.com |
Table of Contents
Portfolio Performance and Composition (Unaudited) (continued)
| Share Class | Inception | 6 Month | 1 Year | 5 Year | 10 Year | Since Inception |
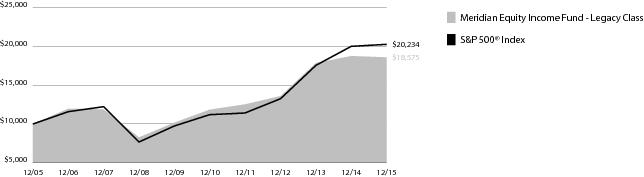
| Legacy Class (MEIFX) | 1/31/05 | (4.60)% | (0.96)% | 9.39% | 6.39% | 6.40% |
| Class A (MRAEX) | 11/15/13 | (4.76)% | (1.20)% | — | — | 2.74% |
| Class C (MRCEX) | 7/1/15 | — | — | — | — | (5.29)% |
| Investor Class (MRIEX) | 11/15/13 | (4.67)% | (1.04)% | — | — | 2.96% |
| S&P 500® Index | 1/31/05 | 0.15% | 1.39% | 12.55% | 7.30% | 7.38% |
| Meridian Funds | 15 | www.meridianfund.com |
Table of Contents
Portfolio Composition (Unaudited)
12.31.15
| Microsoft Corp. | 5.47% |
| Apple, Inc. | 4.42% |
| Equifax, Inc. | 4.05% |
| Facebook, Inc. Class A | 3.80% |
| NVIDIA Corp. | 3.77% |
| Gilead Sciences, Inc. | 3.26% |
| Alphabet, Inc. Class A | 3.23% |
| Amazon.com, Inc. | 3.09% |
| Perrigo Co., Plc | 3.01% |
| Starbucks Corp. | 2.81% |

| Meridian Funds | 16 | www.meridianfund.com |
Table of Contents
Portfolio Performance and Composition (Unaudited)
| • | SolarWinds, Inc. (SWI) accepted a $4.5 billion offer to be acquired by two private equity firms, turning it into a homerun for investors. In October, the developer of IT infrastructure management software agreed to be purchased at nearly a 20% premium by Silver Lake Partners and Thoma Bravo. We initiated a position in SolarWinds in 2013 based on our belief that the company would benefit from an increasingly large market opportunity created by a pervasiveness of performance-driven IT infrastructures. We opportunistically added to the position when the stock pulled back and were rewarded by the takeout. |
| • | Solera Holdings, Inc. (SLH) is a company we’ve followed for several years but were unable to purchase due to the fact that it remained just above the portfolio’s market-capitalization range. However, in July the company’s market cap declined, making it a viable investment for the portfolio. As a provider of risk and asset management software and services to the global automotive industry, Solera is a stable business that is both predictable and defensive in nature. The majority of the company’s revenues are recurring, and it has a strong competitive position, particularly outside of the U.S. where it generates over half of its revenue. In August, Solera’s management announced the sale of the company to private equity firm Vista Equity Partners for $6.5 billion, causing the stock to appreciate. We viewed the increase in Solera’s share price as an opportunity to take profits and trimmed our position. |
| • | Pacific Biosciences of California, Inc. (PACB) is a leader in the field of next-generation gene sequencing technology. In October, the company unveiled the Sequel™ System, a gene-sequencing platform that is smaller and less expensive than the Pacific Bioscience’s former gene sequencer. This groundbreaking technology enables longer and more accurate reads of genomes, and is the result of collaboration with Roche, a health care company with interests in human in vitro diagnostics. Late in the period, Pacific Biosciences received a $20 million milestone payment from Roche for completing the project. We believe this new platform will enable the company to penetrate a larger portion of the broader sequencing market. |
| • | Roadrunner Transportation Systems, Inc. (RRTS), a leading transportation and logistics service provider, declined along with other transportation service providers. Weak freight markets, a more competitive pricing environment, and an increase in accidents worked against Roadrunner, causing it to miss third-quarter earnings expectations. The company also took a one-time charge after discontinuing a lease-guarantee program designed |
| Meridian Funds | 17 | www.meridianfund.com |
Table of Contents
Portfolio Performance and Composition (Unaudited) (continued)
| to attract owner-operators. We believe Roadrunner’s position as the low-cost provider in this space will enable it to successfully weather the competitive pricing environment, which we expect will be short-lived. In addition, the company is gaining market share and enjoying double-digit returns on acquisitions. We opted to hold onto this stock while closely monitoring fundamentals. | |
| • | Wolverine Worldwide, Inc. (WWW) is the leading manufacturer of non-athletic footwear in the U.S. Like many other retail companies during the period, Wolverine struggled against a bleak consumer backdrop. The company announced an 18% decline in third-quarter earnings due to inconsistent retail traffic and disappointing re-order patterns from its retail partners. Wolverine owns a broad portfolio of footwear brands including Sperry, Merrell, Keds, and Saucony and manufactures work boots for the military and construction workers. We believe an unusually warm winter and exposure to the oil and gas industry will create headwinds for Wolverine’s winter and work boots. Although we maintain a position in the stock, we are continuing to closely monitor fundamentals. |
| • | Heritage-Crystal Clean, Inc. (HCCI) has been a solid, long-term performer, but pulled back during the period in response to declining oil prices. One of the reasons we were originally attracted to this environmental services company is the recurring revenue stream generated by its parts cleaning business. However, Heritage-Crystal Clean also provides a used oil collection service and operates an oil re-refinery. The company is successfully lowering input costs in this business, recently transitioning from paying customers to collect and dispose of used oil to charging for this service. Heritage then re-processes the used oil it collects and sells it as new motor oil. We believe this segment of the business shows considerable promise, and have been adding to the position. |
| Meridian Funds | 18 | www.meridianfund.com |
Table of Contents
Portfolio Performance and Composition (Unaudited) (continued)
| Share Class | Inception | 6 Month | 1 Year | Since Inception |
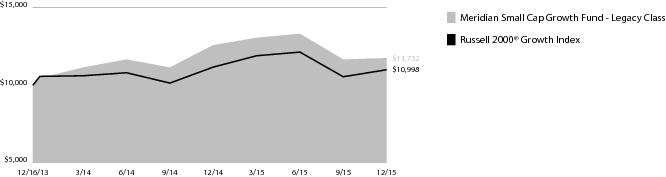
| Legacy Class (MSGGX) | 12/16/13 | (11.84)% | (6.66)% | 8.14% |
| Institutional Class (MSGRX) | 12/24/14 | (11.76)% | (6.58)% | (6.23)% |
| Class A (MSGAX) | 12/16/13 | (11.98)% | (7.01)% | 7.77% |
| Class C (MSGCX) | 7/1/15 | — | — | (12.23)% |
| Investor Class (MISGX) | 12/16/13 | (11.85)% | (6.74)% | 8.09% |
| Russell 2000® Growth Index | 12/16/13 | (9.31)% | (1.38)% | 4.15% |
| Meridian Funds | 19 | www.meridianfund.com |
Table of Contents
Portfolio Composition (Unaudited)
12.31.15
| SolarWinds, Inc. | 2.79% |
| National CineMedia, Inc. | 2.55% |
| Clean Harbors, Inc. | 2.55% |
| Heartland Express, Inc. | 2.01% |
| Solera Holdings, Inc. | 1.96% |
| SP Plus Corp. | 1.93% |
| Heritage-Crystal Clean, Inc. | 1.90% |
| CEB, Inc. | 1.81% |
| ChannelAdvisor Corp. | 1.58% |
| Wolverine World Wide, Inc. | 1.54% |

| Meridian Funds | 20 | www.meridianfund.com |
Table of Contents
| Actual | Annualized Expense Ratio | Beginning Account Value July 1,2015 | Ending Account Value December 31, 2015 | Expenses Paid During the Period |
| Legacy Class (MERDX) | 0.85% | $1,000.00 | $911.00 | $4.08 1 |
| Institutional Class (MRRGX) | 0.90% | $1,000.00 | $910.60 | $4.32 1 |
| Class A (MRAGX) 2 | 1.55% | $1,000.00 | $907.70 | $7.43 1 |
| Class C (MRCGX) 3 | 1.94% | $1,000.00 | $906.10 | $9.24 4 |
| Investor Class (MRIGX) | 0.93% | $1,000.00 | $910.50 | $4.47 1 |
| Hypothetical 5 | Annualized Expense Ratio | Beginning Account Value July 1,2015 | Ending Account Value December 31, 2015 | Expenses Paid During the Period |
| Legacy Class (MERDX) | 0.85% | $1,000.00 | $1,020.86 | $4.32 1 |
| Institutional Class (MRRGX) | 0.90% | $1,000.00 | $1,020.61 | $4.57 1 |
| Class A (MRAGX) 2 | 1.55% | $1,000.00 | $1,017.34 | $7.86 1 |
| Class C (MRCGX) 3 | 1.94% | $1,000.00 | $1,015.30 | $9.77 4 |
| Investor Class (MRIGX) | 0.93% | $1,000.00 | $1,020.46 | $4.72 1 |
| 1 | Expenses are equal to the Fund’s annualized expense ratio multiplied by the average account value over the period, multiplied by 184 days, the number of days in the most recent fiscal half-year, then divided by 365. |
| 2 | On July 1, 2015, the Fund’s Advisor Class Shares were redesignated as Class A Shares. |
| 3 | Commenced operations on July 1, 2015. |
| 4 | Expenses are equal to the Fund’s annualized expense ratio multiplied by the average account value over the period, multiplied by 183 days, the number of days since inception of the Class C. |
| 5 | Hypothetical 5% return before expenses. |
| Meridian Funds | 21 | www.meridianfund.com |
Table of Contents
| Actual | Annualized Expense Ratio | Beginning Account Value July 1,2015 | Ending Account Value December 31, 2015 | Expenses Paid During the Period |
| Legacy Class (MVALX) | 1.13% | $1,000.00 | $926.30 | $ 5.47 1 |
| Class A (MFCAX) 2 | 1.60% | $1,000.00 | $924.10 | $ 7.74 1 |
| Class C (MFCCX) 3 | 2.15% | $1,000.00 | $919.20 | $10.32 4 |
| Investor Class (MFCIX) | 1.35% | $1,000.00 | $925.10 | $ 6.53 1 |
| Hypothetical 5 | Annualized Expense Ratio | Beginning Account Value July 1,2015 | Ending Account Value December 31, 2015 | Expenses Paid During the Period |
| Legacy Class (MVALX) | 1.13% | $1,000.00 | $1,019.46 | $ 5.74 1 |
| Class A (MFCAX) 2 | 1.60% | $1,000.00 | $1,017.09 | $ 8.11 1 |
| Class C (MFCCX) 3 | 2.15% | $1,000.00 | $1,014.25 | $10.83 4 |
| Investor Class (MFCIX) | 1.35% | $1,000.00 | $1,018.35 | $ 6.85 1 |
| 1 | Expenses are equal to the Fund’s annualized expense ratio multiplied by the average account value over the period, multiplied by 184 days, the number of days in the most recent fiscal half-year, then divided by 365. |
| 2 | On July 1, 2015, the Fund’s Advisor Class Shares were redesignated as Class A Shares. |
| 3 | Commenced operations on July 1, 2015. |
| 4 | Expenses are equal to the Fund’s annualized expense ratio multiplied by the average account value over the period, multiplied by 183 days, the number of days since inception of the Class C. |
| 5 | Hypothetical 5% return before expenses. |
| Meridian Funds | 22 | www.meridianfund.com |
Table of Contents
| Actual | Annualized Expense Ratio | Beginning Account Value July 1,2015 | Ending Account Value December 31, 2015 | Expenses Paid During the Period |
| Legacy Class (MEIFX) | 1.27% | $1,000.00 | $954.00 | $6.24 1 |
| Class A (MRAEX) 2 | 1.62% | $1,000.00 | $952.40 | $7.95 1 |
| Class C (MRCEX) 3 | 1.95% | $1,000.00 | $947.10 | $9.49 4 |
| Investor Class (MRIEX) | 1.37% | $1,000.00 | $953.30 | $6.73 1 |
| Hypothetical 5 | Annualized Expense Ratio | Beginning Account Value July 1,2015 | Ending Account Value December 31, 2015 | Expenses Paid During the Period |
| Legacy Class (MEIFX) | 1.27% | $1,000.00 | $1,018.75 | $6.44 1 |
| Class A (MRAEX) 2 | 1.62% | $1,000.00 | $1,016.99 | $8.21 1 |
| Class C (MRCEX) 3 | 1.95% | $1,000.00 | $1,015.25 | $9.82 4 |
| Investor Class (MRIEX) | 1.37% | $1,000.00 | $1,018.25 | $6.95 1 |
| 1 | Expenses are equal to the Fund’s annualized expense ratio multiplied by the average account value over the period, multiplied by 184 days, the number of days in the most recent fiscal half-year, then divided by 365. |
| 2 | On July 1, 2015, the Fund’s Advisor Class Shares were redesignated as Class A Shares. |
| 3 | Commenced operations on July 1, 2015. |
| 4 | Expenses are equal to the Fund’s annualized expense ratio multiplied by the average account value over the period, multiplied by 183 days, the number of days since inception of the Class C. |
| 5 | Hypothetical 5% return before expenses. |
| Meridian Funds | 23 | www.meridianfund.com |
Table of Contents
| Actual | Annualized Expense Ratio | Beginning Account Value July 1,2015 | Ending Account Value December 31, 2015 | Expenses Paid During the Period |
| Legacy Class (MSGGX) | 1.20% | $1,000.00 | $881.60 | $ 5.68 1 |
| Institutional Class (MSGRX) | 1.10% | $1,000.00 | $882.40 | $ 5.20 1 |
| Class A (MSGAX) 2 | 1.60% | $1,000.00 | $880.20 | $ 7.56 1 |
| Class C (MSGCX) 3 | 2.23% | $1,000.00 | $877.70 | $10.47 4 |
| Investor Class (MISGX) | 1.26% | $1,000.00 | $881.50 | $ 5.96 1 |
| Hypothetical 5 | Annualized Expense Ratio | Beginning Account Value July 1,2015 | Ending Account Value December 31, 2015 | Expenses Paid During the Period |
| Legacy Class (MSGGX) | 1.20% | $1,000.00 | $1,019.10 | $ 6.09 1 |
| Institutional Class (MSGRX) | 1.10% | $1,000.00 | $1,019.61 | $ 5.58 1 |
| Class A (MSGAX) 2 | 1.60% | $1,000.00 | $1,017.09 | $ 8.11 1 |
| Class C (MSGCX) 3 | 2.23% | $1,000.00 | $1,013.85 | $11.23 4 |
| Investor Class (MISGX) | 1.26% | $1,000.00 | $1,018.80 | $ 6.39 1 |
| 1 | Expenses are equal to the Fund’s annualized expense ratio multiplied by the average account value over the period, multiplied by 184 days, the number of days in the most recent fiscal half-year, then divided by 365. |
| 2 | On July 1, 2015, the Fund’s Advisor Class Shares were redesignated as Class A Shares. |
| 3 | Commenced operations on July 1, 2015. |
| 4 | Expenses are equal to the Fund’s annualized expense ratio multiplied by the average account value over the period, multiplied by 183 days, the number of days since inception of the Class C. |
| 5 | Hypothetical 5% return before expenses. |
| Meridian Funds | 24 | www.meridianfund.com |
Table of Contents
Performance and Expense Disclosures
| Meridian Funds | 25 | www.meridianfund.com |
Table of Contents
Schedule of Investments
| Shares | Value | |
| Common Stocks - 92.9% | ||
| Consumer Discretionary - 22.8% | ||
| Distributors - 1.7% | ||
| LKQ Corp.1 | 729,135 | $ 21,604,270 |
| Diversified Consumer Services - 5.8% | ||
| 2U, Inc.1,2 | 642,021 | 17,963,748 |
| Grand Canyon Education, Inc.1 | 389,446 | 15,624,573 |
| ServiceMaster Global Holdings, Inc.1 | 1,004,022 | 39,397,823 |
| 72,986,144 | ||
| Hotels, Restaurants & Leisure - 1.4% | ||
| Dunkin' Brands Group, Inc.2 | 394,326 | 16,794,344 |
| Leisure Equipment & Products - 0.7% | ||
| Polaris Industries, Inc.2 | 102,045 | 8,770,768 |
| Media - 2.6% | ||
| National CineMedia, Inc. | 2,094,478 | 32,904,249 |
| Specialty Retail - 6.4% | ||
| DSW, Inc. Class A2 | 286,208 | 6,828,923 |
| Five Below, Inc.1,2 | 346,723 | 11,129,808 |
| Hibbett Sports, Inc.1,2 | 414,416 | 12,531,940 |
| Monro Muffler Brake, Inc.2 | 156,627 | 10,371,840 |
| Sally Beauty Holdings, Inc.1 | 1,411,122 | 39,356,193 |
| 80,218,704 | ||
| Textiles, Apparel & Luxury Goods - 4.2% | ||
| Carter's, Inc. | 304,789 | 27,135,365 |
| Tumi Holdings, Inc.1,2 | 415,090 | 6,902,947 |
| Wolverine World Wide, Inc. | 1,115,758 | 18,644,316 |
| 52,682,628 | ||
| Total Consumer Discretionary | 285,961,107 | |
| Consumer Staples - 0.5% | ||
| Beverages - 0.5% | ||
| Boston Beer Co., Inc. (The) Class A1,2 | 33,386 | 6,740,967 |
| Total Consumer Staples | 6,740,967 | |
| Energy - 3.0% | ||
| Energy Equipment & Services - 3.0% | ||
| Core Laboratories N.V. (Netherlands)2 | 109,297 | 11,884,956 |
| Dril-Quip, Inc.1 | 102,847 | 6,091,628 |
| RigNet, Inc.1,2 | 930,845 | 19,259,183 |
| Total Energy | 37,235,767 | |
| Financials - 6.1% | ||
| Capital Markets - 4.2% | ||
| Financial Engines, Inc.2 | 380,610 | 12,815,139 |
| LPL Financial Holdings, Inc.2 | 694,488 | 29,619,913 |
| WisdomTree Investments, Inc.2 | 638,331 | 10,009,030 |
| 52,444,082 | ||
| Shares | Value | |
| Commercial Banks - 1.0% | ||
| Bank of the Ozarks, Inc. | 255,739 | $ 12,648,851 |
| Real Estate Investment Trusts - 0.9% | ||
| National Storage Affiliates Trust | 638,429 | 10,936,289 |
| Total Financials | 76,029,222 | |
| Health Care - 15.2% | ||
| Biotechnology - 5.0% | ||
| Alnylam Pharmaceuticals, Inc.1 | 73,965 | 6,963,065 |
| Atara Biotherapeutics, Inc. 1,2 | 272,351 | 7,192,790 |
| Bluebird Bio, Inc.1,2 | 101,523 | 6,519,807 |
| Chimerix, Inc. 1,2 | 180,367 | 1,614,285 |
| DBV Technologies SA ADR (France)1 | 189,347 | 6,875,190 |
| Dyax Corp.1 | 316,946 | 11,923,509 |
| Juno Therapeutics, Inc. 1,2 | 175,387 | 7,711,766 |
| Neurocrine Biosciences, Inc.1,2 | 124,497 | 7,042,795 |
| OvaScience, Inc. 1,2 | 768,086 | 7,504,200 |
| 63,347,407 | ||
| Health Care Equipment & Supplies - 2.5% | ||
| Align Technology, Inc.1 | 250,918 | 16,522,950 |
| LDR Holding Corp. 1 | 579,496 | 14,551,145 |
| 31,074,095 | ||
| Health Care Providers & Services - 3.9% | ||
| Cooper Cos., Inc. (The) | 111,412 | 14,951,491 |
| Endologix, Inc.1,2 | 1,451,606 | 14,370,899 |
| Insulet Corp.1 | 175,180 | 6,623,556 |
| Novadaq Technologies, Inc.1,2 | 534,958 | 6,815,365 |
| Quidel Corp.1,2 | 302,372 | 6,410,286 |
| 49,171,597 | ||
| Health Care Technology - 2.5% | ||
| athenahealth, Inc.1,2 | 59,995 | 9,657,395 |
| Medidata Solutions, Inc.1 | 155,496 | 7,664,398 |
| Spectranetics Corp. (The)1 | 951,977 | 14,336,773 |
| 31,658,566 | ||
| Pharmaceuticals - 1.3% | ||
| Prestige Brands Holdings, Inc.1 | 128,267 | 6,603,185 |
| Revance Therapeutics, Inc.1,2 | 243,910 | 8,331,966 |
| Syndax Pharmaceuticals, Inc. Series C Preferred, Acquisition Date: 8/18/15, Cost $1,116,7441,3,4 | 99,727 | 1,116,244 |
| 16,051,395 | ||
| Total Health Care | 191,303,060 | |
| Industrials - 23.8% | ||
| Aerospace & Defense - 2.3% | ||
| HEICO Corp. Class A | 592,439 | 29,147,999 |
| Air Freight & Logistics - 1.5% | ||
| Forward Air Corp.2 | 429,113 | 18,456,150 |
| Meridian Funds | 26 | www.meridianfund.com |
Table of Contents
Schedule of Investments (continued)
| Shares | Value | |
| Commercial Services & Supplies - 3.6% | ||
| Clean Harbors, Inc.1 | 784,731 | $ 32,684,046 |
| Ritchie Bros. Auctioneers, Inc. (Canada)2 | 517,100 | 12,467,281 |
| 45,151,327 | ||
| Electrical Equipment - 1.3% | ||
| Sensata Technologies Holding N.V. (Netherlands)1 | 364,169 | 16,773,624 |
| Machinery - 6.0% | ||
| Donaldson Co., Inc.2 | 355,705 | 10,194,505 |
| Kennametal, Inc.2 | 238,365 | 4,576,608 |
| Proto Labs, Inc.1,2 | 215,502 | 13,725,322 |
| Tennant Co. | 318,148 | 17,899,006 |
| Wabtec Corp. | 177,199 | 12,602,393 |
| Woodward, Inc.2 | 323,272 | 16,053,688 |
| 75,051,522 | ||
| Marine - 1.0% | ||
| Kirby Corp.1 | 236,302 | 12,434,211 |
| Professional Services - 2.6% | ||
| CEB, Inc. | 373,787 | 22,946,784 |
| TriNet Group, Inc.1 | 531,379 | 10,282,184 |
| 33,228,968 | ||
| Road & Rail - 3.3% | ||
| Heartland Express, Inc.2 | 1,506,892 | 25,647,302 |
| Roadrunner Transportation Systems, Inc.1 | 618,554 | 5,832,964 |
| Saia, Inc.1 | 435,168 | 9,682,488 |
| 41,162,754 | ||
| Trading Companies & Distributors - 2.2% | ||
| MSC Industrial Direct Co., Inc. Class A | 381,344 | 21,458,227 |
| WESCO International, Inc.1,2 | 141,504 | 6,180,895 |
| 27,639,122 | ||
| Total Industrials | 299,045,677 | |
| Information Technology - 21.5% | ||
| Electronic Equipment & Instruments - 2.5% | ||
| Trimble Navigation Ltd.1 | 1,492,303 | 32,009,899 |
| Internet Software & Services - 5.1% | ||
| ChannelAdvisor Corp.1 | 977,248 | 13,534,885 |
| Cimpress, N.V. (Netherlands)1,2 | 167,289 | 13,573,829 |
| CoStar Group, Inc.1 | 42,443 | 8,772,544 |
| Demandware, Inc.1,2 | 190,845 | 10,299,905 |
| Shutterstock, Inc.1,2 | 233,407 | 7,548,382 |
| SPS Commerce, Inc.1 | 152,192 | 10,685,400 |
| 64,414,945 | ||
| IT Services - 2.5% | ||
| Euronet Worldwide, Inc.1 | 86,087 | 6,235,281 |
| Gartner, Inc.1 | 271,861 | 24,657,793 |
| 30,893,074 | ||
| Shares | Value | |
| Software - 10.9% | ||
| Cadence Design Systems, Inc.1 | 1,838,564 | $ 38,260,517 |
| Descartes Systems Group, Inc. (The)1 | 366,523 | 7,359,782 |
| Fleetmatics Group Plc (Ireland)1,2 | 121,900 | 6,191,301 |
| RealPage, Inc.1 | 277,820 | 6,237,059 |
| SolarWinds, Inc.1 | 644,246 | 37,946,090 |
| Solera Holdings, Inc. | 506,688 | 27,781,703 |
| SS&C Technologies Holdings, Inc. | 188,638 | 12,878,316 |
| 136,654,768 | ||
| Technology Hardware, Storage & Peripherals - 0.5% | ||
| Stratasys Ltd.1,2 | 274,191 | 6,438,005 |
| Total Information Technology | 270,410,691 | |
| Total Common Stocks - 92.9% (Cost $1,133,920,316) | 1,166,726,491 | |
| Principal Amount | Value | |
| Short-Term Investments - 11.8% | ||
| Repurchase Agreements - 11.8%5 | ||
| Citigroup Global Market, Inc., dated 12/31/15, due 1/4/16, 0.34%, total to be received $34,545,513 (collateralized by various U.S. Government Agency Obligations, 0.00% - 11.50%, 1/15/16 - 4/1/51, totaling $35,235,092) | $34,544,208 | $ 34,544,208 |
| HSBC Securities, Inc., dated 12/31/15, due 1/4/16, 0.28%, total to be received $34,545,283 (collateralized by various U.S. Government Agency Obligations, 0.00% - 7.25%, 1/15/16 - 11/15/43, totaling $35,235,191) | 34,544,208 | 34,544,208 |
| Merrill Lynch Pierce Fenner & Smith, Inc., dated 12/31/15, due 1/4/16, 0.31%, total to be received $34,545,398 (collateralized by various U.S. Government Agency Obligations, 3.00% - 4.50%, 11/15/42 - 2/20/45, totaling $35,235,092) | 34,544,208 | 34,544,208 |
| Meridian Funds | 27 | www.meridianfund.com |
Table of Contents
Schedule of Investments (continued)
| Principal Amount | Value | |
| Mizuho Securities USA, Inc., dated 12/31/15, due 1/4/16, 0.30%, total to be received $34,545,359 (collateralized by various U.S. Government Agency Obligations, 0.00% - 9.00%, 6/13/16 - 3/1/44, totaling $35,235,092) | $34,544,208 | $ 34,544,208 |
| RBC Capital Markets LLC, dated 12/31/15, due 1/4/16, 0.28%, total to be received $10,239,865 (collateralized by various U.S. Government Agency Obligations, 0.00% - 7.00%, 4/20/25 - 3/20/65, totaling $10,444,337) | 10,239,546 | 10,239,546 |
| Total Repurchase Agreements | 148,416,378 | |
| Total Investments - 104.7% (Cost $1,283,336,694) | 1,315,142,869 | |
| Cash and Other Assets, Less Liabilities - (4.7)% | (59,111,239) | |
| Net Assets - 100.0% | $1,256,031,630 |
| ADR—American Depositary Receipt. |
| N.V.—Naamloze Vennootschap is the Dutch term for limited liability company |
| Plc—Public Limited Company |
| 1 | Non-income producing securities |
| 2 | All or portion of this security is on loan at December 31, 2015. Total value of such securities at period-end amounts to $206,630,219 and represents 16.45% of net assets. |
| 3 | Level 3 security. See Note 1 in Notes to Financial Statements. |
| 4 | Restricted security; cannot be offered for public resale without first being registered under the Securities Act of 1933 and related rules. Acquisition date represents the date on which an enforceable right to acquire such security is obtained and is presented along with related cost in the security description. The Fund has registration rights for certain restricted securities. Any costs related to such registration are borne by the issuer. The aggregate value of restricted securities at period-end amounts to $1,116,244 and represents 0.09% of net assets. |
| 5 | Collateral received from brokers for securities lending was invested in these joint repurchase agreements. |
| Meridian Funds | 28 | www.meridianfund.com |
Table of Contents
Schedule of Investments
| Shares | Value | |
| Common Stocks - 93.8% | ||
| Consumer Discretionary - 19.2% | ||
| Distributors - 3.2% | ||
| LKQ Corp.1 | 635,080 | $ 18,817,420 |
| Diversified Consumer Services - 2.8% | ||
| Regis Corp.1 | 527,601 | 7,465,554 |
| ServiceMaster Global Holdings, Inc.1 | 223,912 | 8,786,307 |
| 16,251,861 | ||
| Food & Staples Retailing - 1.6% | ||
| Fresh Market, Inc. (The) 1,2 | 124,664 | 2,919,631 |
| United Natural Foods, Inc.1 | 157,502 | 6,199,279 |
| 9,118,910 | ||
| Hotels, Restaurants & Leisure - 0.5% | ||
| Las Vegas Sands Corp.2 | 65,433 | 2,868,583 |
| Leisure Equipment & Products - 0.9% | ||
| Polaris Industries, Inc.2 | 59,247 | 5,092,280 |
| Multiline Retail - 1.4% | ||
| Fred's, Inc. Class A | 514,253 | 8,418,322 |
| Specialty Retail - 6.2% | ||
| Cabela's, Inc1,2 | 187,927 | 8,781,829 |
| Children's Place, Inc. (The) | 173,161 | 9,558,487 |
| Dick's Sporting Goods, Inc. | 155,446 | 5,495,016 |
| Five Below, Inc.1,2 | 205,702 | 6,603,034 |
| Select Comfort Corp.1 | 260,878 | 5,585,398 |
| 36,023,764 | ||
| Textiles, Apparel & Luxury Goods - 2.6% | ||
| Gildan Activewear, Inc. (Canada) | 523,184 | 14,868,889 |
| Total Consumer Discretionary | 111,460,029 | |
| Consumer Staples - 1.7% | ||
| Beverages - 1.7% | ||
| Diageo Plc ADR | 92,500 | 10,088,975 |
| Total Consumer Staples | 10,088,975 | |
| Energy - 7.5% | ||
| Energy Equipment & Services - 1.7% | ||
| Core Laboratories N.V. (Netherlands) | 62,900 | 6,839,746 |
| Helmerich & Payne, Inc. 2 | 55,697 | 2,982,575 |
| 9,822,321 | ||
| Oil, Gas & Consumable Fuels - 5.8% | ||
| Cameco Corp. | 710,999 | 8,766,618 |
| EOG Resources, Inc. | 250,993 | 17,767,794 |
| TOTAL SA ADR2 | 120,000 | 5,394,000 |
| Whiting Petroleum Corp. 1 | 212,491 | 2,005,915 |
| 33,934,327 | ||
| Total Energy | 43,756,648 | |
| Financials - 16.8% | ||
| Capital Markets - 1.7% | ||
| Oaktree Capital Group LLC 2 | 202,654 | 9,670,649 |
| Shares | Value | |
| Commercial Banks - 7.0% | ||
| Bank of Hawaii Corp. | 145,754 | $ 9,167,927 |
| Citigroup, Inc. | 179,069 | 9,266,821 |
| Citizens Financial Group Inc. | 426,545 | 11,171,213 |
| Synchrony Financial 1 | 371,791 | 11,306,164 |
| 40,912,125 | ||
| Insurance - 4.0% | ||
| MetLife, Inc. | 167,820 | 8,090,602 |
| Old Republic International Corp. | 829,351 | 15,450,809 |
| 23,541,411 | ||
| Real Estate Investment Trusts - 1.5% | ||
| Rayonier, Inc. | 386,538 | 8,581,144 |
| Real Estate Management & Development - 2.6% | ||
| Alexander & Baldwin, Inc. | 431,677 | 15,242,515 |
| Total Financials | 97,947,844 | |
| Health Care - 10.3% | ||
| Biotechnology - 4.0% | ||
| Agios Pharmaceuticals, Inc.1,2 | 59,500 | 3,862,740 |
| Celgene Corp.1 | 106,000 | 12,694,560 |
| Neurocrine Biosciences, Inc.1 | 119,022 | 6,733,074 |
| 23,290,374 | ||
| Health Care Equipment & Supplies - 3.5% | ||
| CR Bard, Inc. | 52,801 | 10,002,622 |
| Hologic, Inc. 1 | 270,270 | 10,456,746 |
| 20,459,368 | ||
| Life Sciences Tools & Services - 0.6% | ||
| Accelerate Diagnostics, Inc. 1 | 165,769 | 3,562,376 |
| Pharmaceuticals - 2.2% | ||
| Impax Laboratories, Inc.1 | 146,376 | 6,259,038 |
| Nektar Therapeutics 1,2 | 380,605 | 6,413,194 |
| 12,672,232 | ||
| Total Health Care | 59,984,350 | |
| Industrials - 7.2% | ||
| Commercial Services & Supplies - 1.9% | ||
| Clean Harbors, Inc.1 | 264,200 | 11,003,930 |
| Machinery - 3.3% | ||
| Lindsay Corp.2 | 49,503 | 3,584,017 |
| Xylem, Inc. | 430,500 | 15,713,250 |
| 19,297,267 | ||
| Marine - 1.0% | ||
| Kirby Corp.1 | 105,694 | 5,561,618 |
| Road & Rail - 1.0% | ||
| Union Pacific Corp. | 76,000 | 5,943,200 |
| Total Industrials | 41,806,015 | |
| Meridian Funds | 29 | www.meridianfund.com |
Table of Contents
Schedule of Investments (continued)
| Shares | Value | |
| Information Technology - 27.2% | ||
| Communications Equipment - 2.7% | ||
| Motorola Solutions, Inc. | 59,364 | $ 4,063,466 |
| QUALCOMM, Inc. | 233,000 | 11,646,505 |
| 15,709,971 | ||
| Electronic Equipment & Instruments - 2.6% | ||
| Fitbit, Inc. Class A1,2 | 198,973 | 5,887,611 |
| Trimble Navigation Ltd.1 | 445,299 | 9,551,663 |
| 15,439,274 | ||
| Internet Software & Services - 3.8% | ||
| Bankrate, Inc.1 | 559,522 | 7,441,643 |
| Marketo, Inc.1 | 329,035 | 9,446,595 |
| Twitter, Inc. 1,2 | 239,645 | 5,545,385 |
| 22,433,623 | ||
| IT Services - 3.6% | ||
| CACI International, Inc. Class A1 | 224,800 | 20,856,944 |
| Semiconductors - 6.1% | ||
| Mellanox Technologies Ltd.1 | 208,126 | 8,770,430 |
| NVIDIA Corp. | 553,927 | 18,257,434 |
| Power Integrations, Inc. | 169,837 | 8,259,173 |
| 35,287,037 | ||
| Software - 8.4% | ||
| Barracuda Networks, Inc.1,2 | 175,239 | 3,273,465 |
| CommVault Systems, Inc.1 | 60,000 | 2,361,000 |
| Fortinet, Inc.1 | 143,826 | 4,483,056 |
| Microsoft Corp. | 373,823 | 20,739,700 |
| Silver Spring Networks, Inc.1 | 500,303 | 7,209,366 |
| Verint Systems, Inc.1 | 261,700 | 10,614,552 |
| 48,681,139 | ||
| Total Information Technology | 158,407,988 | |
| Materials - 0.8% | ||
| Metals & Mining - 0.8% | ||
| Newmont Mining Corp. | 244,000 | 4,389,560 |
| Total Materials | 4,389,560 | |
| Telecommunication Services - 1.4% | ||
| Diversified Telecommunications - 1.4% | ||
| Iridium Communications, Inc.1,2 | 935,515 | 7,867,681 |
| Total Telecommunication Services | 7,867,681 | |
| Utilities - 1.7% | ||
| Electric Utilities - 1.7% | ||
| MDU Resources Group, Inc. | 528,198 | 9,676,587 |
| Total Utilities | 9,676,587 | |
| Total Common Stocks - 93.8% (Cost $495,653,325) | 545,385,677 | |
| Principal Amount | Value | |
| Short-Term Investments - 7.6% | ||
| Repurchase Agreements - 7.6%3 | ||
| Citigroup Global Market, Inc., dated 12/31/15, due 1/4/16, 0.34%, total to be received $10,323,367 (collateralized by various U.S. Government Agency Obligations, 0.00% - 11.50%, 1/15/16 - 4/1/51, totaling $10,529,437) | $10,322,977 | $ 10,322,977 |
| HSBC Securities, Inc., dated 12/31/15, due 1/4/16, 0.28%, total to be received $10,323,298 (collateralized by various U.S. Government Agency Obligations, 0.00% - 7.25%, 1/15/16 - 11/15/43, totaling $10,529,466) | 10,322,977 | 10,322,977 |
| Merrill Lynch Pierce Fenner & Smith, Inc., dated 12/31/15, due 1/4/16, 0.31%, total to be received $10,323,333 (collateralized by various U.S. Government Agency Obligations, 3.00% - 4.50%, 11/15/42 - 2/20/45, totaling $10,529,437) | 10,322,977 | 10,322,977 |
| Mizuho Securities USA, Inc., dated 12/31/15, due 1/4/16, 0.30%, total to be received $10,323,321 (collateralized by various U.S. Government Agency Obligations, 0.00% - 9.00%, 6/13/16 - 3/1/44, totaling $10,529,437) | 10,322,977 | 10,322,977 |
| RBC Capital Markets LLC, dated 12/31/15, due 1/4/16, 0.28%, total to be received $3,060,034 (collateralized by various U.S. Government Agency Obligations, 0.00% - 7.00%, 4/20/25 - 3/20/65, totaling $3,121,138) | 3,059,939 | 3,059,939 |
| Total Repurchase Agreements | 44,351,847 | |
| Meridian Funds | 30 | www.meridianfund.com |
Table of Contents
Schedule of Investments (continued)
| Principal Amount | Value | |
| Total Investments - 101.4% (Cost $540,005,172) | $589,737,524 | |
| Cash and Other Assets, Less Liabilities - (1.4)% | (8,390,965) | |
| Net Assets - 100.0% | $581,346,559 |
| ADR—American Depositary Receipt. |
| N.V.—Naamloze Vennootschap is the Dutch term for limited liability company |
| Plc—Public Limited Company |
| 1 | Non-income producing securities |
| 2 | All or portion of this security is on loan at December 31, 2015. Total value of such securities at period-end amounts to $57,056,315 and represents 9.81% of net assets. |
| 3 | Collateral received from brokers for securities lending was invested in these joint repurchase agreements. |
| Meridian Funds | 31 | www.meridianfund.com |
Table of Contents
Schedule of Investments
| Shares | Value | |
| Common Stocks - 95.5% | ||
| Consumer Discretionary - 15.8% | ||
| Hotels, Restaurants & Leisure - 4.4% | ||
| Las Vegas Sands Corp. | 17,500 | $ 767,200 |
| Starbucks Corp.1 | 22,500 | 1,350,675 |
| 2,117,875 | ||
| Internet & Catalog Retail - 3.1% | ||
| Amazon.com, Inc.2 | 2,200 | 1,486,958 |
| Media - 2.7% | ||
| Walt Disney Co. (The) | 12,500 | 1,313,500 |
| Specialty Retail - 2.4% | ||
| TJX Companies, Inc. (The) | 16,000 | 1,134,560 |
| Textiles, Apparel & Luxury Goods - 3.2% | ||
| NIKE, Inc. Class B1 | 10,000 | 625,000 |
| VF Corp. | 15,000 | 933,750 |
| 1,558,750 | ||
| Total Consumer Discretionary | 7,611,643 | |
| Consumer Staples - 6.7% | ||
| Beverages - 1.8% | ||
| Brown-Forman Corp. Class B | 9,000 | 893,520 |
| Food & Staples Retailing - 2.7% | ||
| Costco Wholesale Corp. | 7,930 | 1,280,695 |
| Tobacco - 2.2% | ||
| Altria Group, Inc. | 18,000 | 1,047,780 |
| Total Consumer Staples | 3,221,995 | |
| Energy - 4.9% | ||
| Energy Equipment & Services - 1.7% | ||
| National Oilwell Varco, Inc. | 25,000 | 837,250 |
| Oil, Gas & Consumable Fuels - 3.2% | ||
| California Resources Corp. | 250,000 | 582,500 |
| Cameco Corp. | 21,500 | 265,095 |
| EOG Resources, Inc. | 7,000 | 495,530 |
| Kinder Morgan, Inc. | 12,000 | 179,040 |
| 1,522,165 | ||
| Total Energy | 2,359,415 | |
| Financials - 5.0% | ||
| Commercial Banks - 3.7% | ||
| U.S. Bancorp | 25,500 | 1,088,085 |
| Wells Fargo & Co. | 12,919 | 702,277 |
| 1,790,362 | ||
| Diversified Financial Services - 1.3% | ||
| Intercontinental Exchange, Inc. | 2,500 | 640,650 |
| Total Financials | 2,431,012 | |
| Shares | Value | |
| Health Care - 11.8% | ||
| Biotechnology - 6.3% | ||
| Alnylam Pharmaceuticals, Inc.2 | 6,250 | $ 588,375 |
| Gilead Sciences, Inc. | 15,500 | 1,568,445 |
| OvaScience, Inc. 2,3 | 30,000 | 293,100 |
| Vertex Pharmaceuticals, Inc. 1,2 | 4,500 | 566,235 |
| 3,016,155 | ||
| Life Sciences Tools & Services - 1.3% | ||
| Accelerate Diagnostics, Inc. 2 | 30,000 | 644,700 |
| Pharmaceuticals - 4.2% | ||
| Novartis AG ADR | 6,660 | 573,027 |
| Perrigo Co., Plc | 10,000 | 1,447,000 |
| 2,020,027 | ||
| Total Health Care | 5,680,882 | |
| Industrials - 9.4% | ||
| Aerospace & Defense - 2.3% | ||
| Lockheed Martin Corp. | 5,000 | 1,085,750 |
| Air Freight & Logistics - 1.4% | ||
| United Parcel Service, Inc. Class B | 7,000 | 673,610 |
| Professional Services - 4.0% | ||
| Equifax, Inc. | 17,500 | 1,948,975 |
| Road & Rail - 1.7% | ||
| Union Pacific Corp. | 10,500 | 821,100 |
| Total Industrials | 4,529,435 | |
| Information Technology - 36.6% | ||
| Communications Equipment - 2.6% | ||
| QUALCOMM, Inc. | 25,000 | 1,249,625 |
| Electronic Equipment & Instruments - 1.8% | ||
| Fitbit, Inc. Class A2,3 | 30,000 | 887,700 |
| Internet Software & Services - 11.2% | ||
| Alphabet, Inc. Class A2 | 2,000 | 1,556,020 |
| Facebook, Inc. Class A2 | 17,500 | 1,831,550 |
| LinkedIn Corp. Class A2 | 3,000 | 675,240 |
| Twitter, Inc. 2,3 | 24,500 | 566,930 |
| Yahoo! Inc. 2 | 23,000 | 764,980 |
| 5,394,720 | ||
| IT Services - 4.5% | ||
| Black Knight Financial Services, Inc. Class A2,3 | 19,000 | 628,140 |
| International Business Machines Corp. | 4,250 | 584,885 |
| Visa, Inc. Class A | 12,000 | 930,600 |
| 2,143,625 | ||
| Semiconductors - 3.8% | ||
| NVIDIA Corp. | 55,000 | 1,812,800 |
| Meridian Funds | 32 | www.meridianfund.com |
Table of Contents
Schedule of Investments (continued)
| Shares | Value | |
| Software - 8.3% | ||
| Atlassian Corp. Plc Class A2 | 10,000 | $ 300,800 |
| Microsoft Corp. | 47,500 | 2,635,300 |
| Workday, Inc. Class A2 | 13,250 | 1,055,760 |
| 3,991,860 | ||
| Technology Hardware, Storage & Peripherals - 4.4% | ||
| Apple, Inc. | 20,205 | 2,126,778 |
| Total Information Technology | 17,607,108 | |
| Materials - 4.2% | ||
| Chemicals - 2.2% | ||
| Dow Chemical Co. (The) | 10,027 | 516,190 |
| Mosaic Co. (The) | 20,000 | 551,800 |
| 1,067,990 | ||
| Metals & Mining - 2.0% | ||
| Royal Gold, Inc. | 25,500 | 929,985 |
| Total Materials | 1,997,975 | |
| Utilities - 1.1% | ||
| Multi-Utilities - 1.1% | ||
| Dominion Resources, Inc. | 7,660 | 518,122 |
| Total Utilities | 518,122 | |
| Total Common Stocks - 95.5% (Cost $44,184,789) | 45,957,587 | |
| Principal Value | ||
| Corporate Bonds - 0.8% | ||
| Energy - 0.8% | ||
| Oil, Gas & Consumable Fuels - 0.8% | ||
| California Resources Corp., 6.00%, 11/15/24 | $230,000 | 70,150 |
| California Resources Corp., 8.00%, 12/15/22 | 616,000 | 324,170 |
| Total Corporate Bonds - 0.8% (Cost $691,627) | 394,320 | |
| Number of Contracts | Value | |
| Call Options Purchased - 0.1% | ||
| Continental Resources, Inc. Expiring January 20, 2017 at $40.00 | 150 | $21,000 |
| Halliburton Co. Expiring January 20, 2017 at $50.00 | 150 | 10,500 |
| Microsoft Corp. Expiring January 15, 2016 at $50.00 | 50 | 28,750 |
| Twitter, Inc. Expiring January 20, 2017 at $50.00 | 25 | 1,050 |
| Total Call Options Purchased - 0.1% (Cost $240,848) | 61,300 | |
| Principal Amount | Value | |
| Short-Term Investments - 0.6% | ||
| Repurchase Agreements - 0.6%4 | ||
| Merrill Lynch Pierce Fenner & Smith, Inc., dated 12/31/15, due 1/4/16, 0.31%, total to be received $250,009 (collateralized by various U.S. Government Agency Obligations, 3.00% - 4.50%, 11/15/42 - 2/20/45, totaling $255,000) | $250,000 | $ 250,000 |
| Royal Bank of Scotland Plc, dated 12/31/15, due 1/4/16, 0.30%, total to be received $43,755 (collateralized by various U.S. Government Agency Obligations, 0.07% - 3.25%, 7/31/16 - 11/15/23, totaling $44,629) | 43,754 | 43,754 |
| Total Repurchase Agreements | 293,754 | |
| Total Investments - 97.0% (Cost $45,411,018) | 46,706,961 | |
| Cash and Other Assets, Less Liabilities - 3.0% | 1,422,251 | |
| Net Assets - 100.0% | $48,129,212 | |
| Shares | Value | |
| Securities Sold Short - (3.1)% | ||
| Consumer Discretionary - (1.8)% | ||
| Hotels, Restaurants & Leisure - (1.8)% | ||
| McDonald's Corp. | (7,500) | $ (886,050) |
| Total Consumer Discretionary | (886,050) | |
| Health Care - (1.3)% | ||
| Health Care Providers & Services - (1.3)% | ||
| Laboratory Corp. of America Holdings2 | (5,000) | (618,200) |
| Total Health Care | (618,200) | |
| Total Securities Sold Short - (3.1%) (Proceeds $(1,310,321)) | $(1,504,250) | |
| Meridian Funds | 33 | www.meridianfund.com |
Table of Contents
Schedule of Investments (continued)
| Number of Contracts | Value | |
| Call Options Written - (0.0)% | ||
| NIKE, Inc. Class B Expiring January 15, 2016 at $62.50 | (100) | $(12,800) |
| Starbucks Corp. Expiring January 15, 2016 at $65.00 | (50) | (150) |
| Vertex Pharmaceuticals, Inc. Expiring January 15, 2016 at $150.00 | (20) | (500) |
| Total Call Options Written - (0.0)% (Premium received $(23,635)) | $(13,450) | |
| ADR—American Depositary Receipt. |
| Plc—Public Limited Company |
| 1 | Securities, or a portion thereof, were pledged as collateral for call options written by the fund. |
| 2 | Non-income producing securities |
| 3 | All or portion of this security is on loan at December 31, 2015. Total value of such securities at period-end amounts to $852,788 and represents 1.77% of net assets. |
| 4 | Collateral received from brokers for securities lending was invested in these joint repurchase agreements. |
| Meridian Funds | 34 | www.meridianfund.com |
Table of Contents
Schedule of Investments
| Shares | Value | |
| Common Stocks - 90.1% | ||
| Consumer Discretionary - 22.4% | ||
| Auto Components - 0.9% | ||
| Dorman Products, Inc.1,2 | 49,682 | $ 2,358,404 |
| Distributors - 0.6% | ||
| Fenix Parts, Inc.1,2 | 222,120 | 1,508,195 |
| Diversified Consumer Services - 4.6% | ||
| 2U, Inc.1,2 | 130,939 | 3,663,673 |
| Easterly Acquisition Corp.1 | 276,799 | 2,773,526 |
| Grand Canyon Education, Inc.1 | 81,908 | 3,286,149 |
| Pace Holdings Corp. | 258,485 | 2,610,699 |
| 12,334,047 | ||
| Hotels, Restaurants & Leisure - 4.3% | ||
| Del Frisco's Restaurant Group, Inc.1 | 242,318 | 3,881,934 |
| Dunkin' Brands Group, Inc.2 | 78,194 | 3,330,282 |
| Papa Murphy's Holdings, Inc.1,2 | 198,465 | 2,234,716 |
| Texas Roadhouse, Inc. | 55,875 | 1,998,649 |
| 11,445,581 | ||
| Leisure Equipment & Products - 1.2% | ||
| Arctic Cat, Inc. | 63,465 | 1,039,557 |
| Malibu Boats, Inc. Class A1 | 138,392 | 2,265,477 |
| 3,305,034 | ||
| Media - 3.2% | ||
| National CineMedia, Inc. | 434,970 | 6,833,379 |
| Rentrak Corp.1,2 | 36,103 | 1,715,975 |
| 8,549,354 | ||
| Specialty Retail - 5.6% | ||
| Boot Barn Holdings, Inc. 1,2 | 216,943 | 2,666,230 |
| Five Below, Inc.1,2 | 95,304 | 3,059,258 |
| Hibbett Sports, Inc.1,2 | 86,432 | 2,613,704 |
| Monro Muffler Brake, Inc.2 | 30,608 | 2,026,862 |
| Sally Beauty Holdings, Inc.1 | 118,634 | 3,308,702 |
| Winmark Corp. | 14,133 | 1,314,510 |
| 14,989,266 | ||
| Textiles, Apparel & Luxury Goods - 2.0% | ||
| Tumi Holdings, Inc.1 | 83,726 | 1,392,363 |
| Wolverine World Wide, Inc. | 247,039 | 4,128,022 |
| 5,520,385 | ||
| Total Consumer Discretionary | 60,010,266 | |
| Energy - 3.4% | ||
| Energy Equipment & Services - 2.0% | ||
| Era Group, Inc. 1 | 129,341 | 1,442,152 |
| RigNet, Inc.1 | 194,342 | 4,020,936 |
| 5,463,088 | ||
| Oil, Gas & Consumable Fuels - 1.4% | ||
| Evolution Petroleum Corp. | 777,416 | 3,739,371 |
| Total Energy | 9,202,459 | |
| Shares | Value | |
| Financials - 4.8% | ||
| Capital Markets - 2.5% | ||
| Financial Engines, Inc.2 | 97,972 | $ 3,298,717 |
| PennantPark Investment Corp.2 | 225,644 | 1,394,480 |
| WisdomTree Investments, Inc.2 | 125,060 | 1,960,941 |
| 6,654,138 | ||
| Commercial Banks - 1.0% | ||
| Bank of the Ozarks, Inc.2 | 53,623 | 2,652,194 |
| Real Estate Investment Trusts - 1.3% | ||
| Jernigan Capital, Inc.2 | 88,065 | 1,316,572 |
| National Storage Affiliates Trust | 122,727 | 2,102,313 |
| 3,418,885 | ||
| Total Financials | 12,725,217 | |
| Health Care - 15.1% | ||
| Biotechnology - 4.8% | ||
| Atara Biotherapeutics, Inc. 1,2 | 55,981 | 1,478,458 |
| Bluebird Bio, Inc.1,2 | 20,847 | 1,338,794 |
| Chimerix, Inc. 1 | 37,621 | 336,708 |
| DBV Technologies SA ADR (France)1 | 38,444 | 1,395,902 |
| Neurocrine Biosciences, Inc.1 | 26,104 | 1,476,703 |
| OvaScience, Inc. 1,2 | 148,582 | 1,451,646 |
| Repligen Corp.1 | 53,392 | 1,510,460 |
| Spark Therapeutics, Inc. 1,2 | 20,811 | 942,946 |
| Versartis, Inc.1,2 | 123,840 | 1,534,378 |
| Xencor, Inc. 1 | 97,774 | 1,429,456 |
| 12,895,451 | ||
| Health Care Equipment & Supplies - 4.9% | ||
| Endologix, Inc.1,2 | 295,513 | 2,925,579 |
| Insulet Corp.1 | 36,731 | 1,388,799 |
| LDR Holding Corp. 1 | 121,430 | 3,049,107 |
| Novadaq Technologies, Inc.1,2 | 112,169 | 1,429,033 |
| Quidel Corp.1 | 63,592 | 1,348,150 |
| Spectranetics Corp. (The)1 | 200,211 | 3,015,178 |
| 13,155,846 | ||
| Health Care Providers & Services - 0.9% | ||
| National Research Corp. Class A2 | 63,034 | 1,011,065 |
| Trupanion, Inc. 1,2 | 122,586 | 1,196,440 |
| 2,207,505 | ||
| Health Care Technology - 1.1% | ||
| Castlight Health, Inc. Class B1,2 | 353,699 | 1,510,295 |
| Medidata Solutions, Inc.1 | 30,282 | 1,492,600 |
| 3,002,895 | ||
| Life Sciences Tools & Services - 1.1% | ||
| Accelerate Diagnostics, Inc. 1 | 66,582 | 1,430,847 |
| Pacific Biosciences of California, Inc.1,2 | 104,793 | 1,375,932 |
| 2,806,779 | ||
| Meridian Funds | 35 | www.meridianfund.com |
Table of Contents
Schedule of Investments (continued)
| Shares | Value | |
| Pharmaceuticals - 2.3% | ||
| Marinus Pharmaceuticals, Inc.1 | 215,427 | $ 1,645,862 |
| NeuroDerm Ltd.1,2 | 81,836 | 1,395,304 |
| Prestige Brands Holdings, Inc.1 | 26,851 | 1,382,290 |
| Revance Therapeutics, Inc.1,2 | 45,558 | 1,556,261 |
| Syndax Pharmaceuticals, Inc. Series C Preferred, Acquisition Date: 8/18/15, Cost $1,116,7441,3,4 | 18,851 | 210,999 |
| 6,190,716 | ||
| Total Health Care | 40,259,192 | |
| Industrials - 23.8% | ||
| Aerospace & Defense - 1.5% | ||
| HEICO Corp. Class A | 79,982 | 3,935,114 |
| Air Freight & Logistics - 2.2% | ||
| Forward Air Corp. | 89,637 | 3,855,287 |
| Park-Ohio Holdings Corp. | 53,737 | 1,976,447 |
| 5,831,734 | ||
| Commercial Services & Supplies - 8.2% | ||
| Clean Harbors, Inc.1 | 163,731 | 6,819,396 |
| Heritage-Crystal Clean, Inc.1 | 478,965 | 5,077,029 |
| InnerWorkings, Inc.1,2 | 272,563 | 2,044,223 |
| Ritchie Bros. Auctioneers, Inc. (Canada)2 | 113,846 | 2,744,827 |
| SP Plus Corp.1 | 216,601 | 5,176,764 |
| 21,862,239 | ||
| Electrical Equipment - 0.4% | ||
| Power Solutions International, Inc.1,2 | 67,555 | 1,232,879 |
| Machinery - 3.0% | ||
| Kennametal, Inc. | 70,441 | 1,352,467 |
| Proto Labs, Inc.1,2 | 43,479 | 2,769,178 |
| Tennant Co. | 70,169 | 3,947,708 |
| 8,069,353 | ||
| Professional Services - 3.5% | ||
| CEB, Inc. | 79,094 | 4,855,581 |
| TriNet Group, Inc.1 | 142,535 | 2,758,052 |
| TrueBlue, Inc.1 | 69,077 | 1,779,423 |
| 9,393,056 | ||
| Road & Rail - 3.3% | ||
| Heartland Express, Inc.2 | 315,761 | 5,374,252 |
| Roadrunner Transportation Systems, Inc.1 | 142,081 | 1,339,824 |
| Saia, Inc.1 | 91,138 | 2,027,820 |
| 8,741,896 | ||
| Shares | Value | |
| Trading Companies & Distributors - 1.7% | ||
| MSC Industrial Direct Co., Inc. Class A | 59,358 | $ 3,340,075 |
| WESCO International, Inc.1,2 | 31,234 | 1,364,301 |
| 4,704,376 | ||
| Total Industrials | 63,770,647 | |
| Information Technology - 19.7% | ||
| Electronic Equipment & Instruments - 1.1% | ||
| DTS, Inc.1 | 58,783 | 1,327,320 |
| Mesa Laboratories, Inc. | 15,763 | 1,568,419 |
| 2,895,739 | ||
| Internet Software & Services - 7.2% | ||
| Carbonite, Inc.1 | 275,887 | 2,703,693 |
| ChannelAdvisor Corp.1 | 306,013 | 4,238,280 |
| Cimpress, N.V. (Netherlands)1,2 | 34,526 | 2,801,440 |
| Demandware, Inc.1,2 | 39,725 | 2,143,958 |
| LivePerson, Inc.1 | 373,055 | 2,518,121 |
| SciQuest, Inc.1 | 102,561 | 1,330,216 |
| Shutterstock, Inc.1,2 | 48,171 | 1,557,850 |
| SPS Commerce, Inc.1 | 29,987 | 2,105,387 |
| 19,398,945 | ||
| IT Services - 1.9% | ||
| Cass Information Systems, Inc. | 50,191 | 2,582,829 |
| Euronet Worldwide, Inc.1 | 17,713 | 1,282,952 |
| Forrester Research, Inc. | 46,493 | 1,324,121 |
| 5,189,902 | ||
| Software - 8.8% | ||
| Callidus Software, Inc.1 | 147,607 | 2,741,062 |
| Descartes Systems Group, Inc. (The)1 | 81,978 | 1,646,118 |
| Exa Corp.1 | 320,572 | 3,721,841 |
| Fleetmatics Group Plc (Ireland)1,2 | 26,547 | 1,348,322 |
| RealPage, Inc.1 | 58,253 | 1,307,780 |
| SolarWinds, Inc.1 | 126,575 | 7,455,267 |
| Solera Holdings, Inc. | 95,444 | 5,233,195 |
| 23,453,585 | ||
| Technology Hardware, Storage & Peripherals - 0.7% | ||
| Stratasys Ltd.1,2 | 78,501 | 1,843,204 |
| Total Information Technology | 52,781,375 | |
| Meridian Funds | 36 | www.meridianfund.com |
Table of Contents
Schedule of Investments (continued)
| Shares | Value | |
| Materials - 0.9% | ||
| Chemicals - 0.9% | ||
| Balchem Corp. | 40,245 | $ 2,446,896 |
| Total Materials | 2,446,896 | |
| Total Common Stocks - 90.1% (Cost $250,612,713) | 241,196,052 | |
| Principal Amount | Value | |
| Short-Term Investments - 15.0% | ||
| Repurchase Agreements - 15.0%5 | ||
| Citigroup Global Market, Inc., dated 12/31/15, due 1/4/16, 0.34%, total to be received $9,313,471 (collateralized by various U.S. Government Agency Obligations, 0.00% - 11.50%, 1/15/16 - 4/1/51, totaling $9,499,381) | $9,313,119 | $ 9,313,119 |
| HSBC Securities, Inc., dated 12/31/15, due 1/4/16, 0.28%, total to be received $9,313,409 (collateralized by various U.S. Government Agency Obligations, 0.00% - 7.25%, 1/15/16 - 11/15/43, totaling $9,499,408) | 9,313,119 | 9,313,119 |
| Merrill Lynch Pierce Fenner & Smith, Inc., dated 12/31/15, due 1/4/16, 0.31%, total to be received $9,313,440 (collateralized by various U.S. Government Agency Obligations, 3.00% - 4.50%, 11/15/42 - 2/20/45, totaling $9,499,381) | 9,313,119 | 9,313,119 |
| Principal Amount | Value | |
| Mizuho Securities USA, Inc., dated 12/31/15, due 1/4/16, 0.30%, total to be received $9,313,429 (collateralized by various U.S. Government Agency Obligations, 0.00% - 9.00%, 6/13/16 - 3/1/44, totaling $9,499,381) | $9,313,119 | $ 9,313,119 |
| RBC Capital Markets LLC, dated 12/31/15, due 1/4/16, 0.28%, total to be received $2,760,641 (collateralized by various U.S. Government Agency Obligations, 0.00% - 7.00%, 4/20/25 - 3/20/65, totaling $2,815,766) | 2,760,555 | 2,760,555 |
| Total Repurchase Agreements | 40,013,031 | |
| Total Investments - 105.1% (Cost $290,625,744) | 281,209,083 | |
| Cash and Other Assets, Less Liabilities - (5.1)% | (13,553,358) | |
| Net Assets - 100.0% | $267,655,725 |
| ADR—American Depositary Receipt. |
| N.V.—Naamloze Vennootschap is the Dutch term for limited liability company |
| Plc—Public Limited Company |
| 1 | Non-income producing securities |
| 2 | All or portion of this security is on loan at December 31, 2015. Total value of such securities at period-end amounts to $48,964,259 and represents 18.29% of net assets. |
| 3 | Level 3 security. See Note 1 in Notes to Financial Statements. |
| 4 | Restricted security; cannot be offered for public resale without first being registered under the Securities Act of 1933 and related rules. Acquisition date represents the date on which an enforceable right to acquire such security is obtained and is presented along with related cost in the security description. The Fund has registration rights for certain restricted securities. Any costs related to such registration are borne by the issuer. The aggregate value of restricted securities at period-end amounts to $210,999 and represents 0.08% of net assets. |
| 5 | Collateral received from brokers for securities lending was invested in these joint repurchase agreements. |
| Meridian Funds | 37 | www.meridianfund.com |
Table of Contents
Statements of Assets and Liabilities
| December 31, 2015 (Unaudited) | Meridian Growth Fund | Meridian Contrarian Fund | Meridian Equity Income Fund | Meridian Small Cap Growth Fund |
| Assets | ||||
Investments, at value1,2 | $1,166,726,491 | $545,385,677 | $46,413,207 | $241,196,052 |
Repurchase agreements | 148,416,378 | 44,351,847 | 293,754 | 40,013,031 |
Cash and cash equivalents | 94,465,031 | 42,508,086 | 127,271 | 25,941,873 |
Cash held as collateral | — | — | 3,074,783 | — |
| Receivables and other assets: | ||||
Fund shares purchased | 258,501 | 568,261 | 5,217 | 1,846,910 |
Investments sold | — | 6,313,873 | — | — |
Dividends and interest | 165,476 | 298,126 | 45,025 | 208,257 |
Securities lending interest | 170,026 | 53,391 | 6,309 | 4,933 |
Prepaid expenses | 88,640 | 56,182 | 34,997 | 55,199 |
Total Assets | 1,410,290,543 | 639,535,443 | 50,000,563 | 309,266,255 |
| Liabilities | ||||
| Payables and other accrued expenses: | ||||
Call options written3 | — | — | 13,450 | — |
Securities sold short | — | — | 1,504,250 | — |
Upon return of securities loaned | 148,416,378 | 44,351,847 | 293,754 | 40,013,031 |
Fund shares sold | 3,001,099 | 334,350 | — | 1,011,496 |
Investments purchased | 1,556,323 | 12,871,292 | — | 265,978 |
Investment advisory fees | 966,658 | 503,082 | 38,673 | 235,564 |
Distribution fees | 331 | — | 216 | 31 |
Service plan fees | 4,389 | 309 | 294 | 34,690 |
Professional fees | 119,675 | 44,287 | 5,345 | 14,757 |
Directors' fees | 6,608 | 2,174 | 91 | 83 |
Transfer agent fees | 88,667 | 54,721 | 1,915 | 24,767 |
Other | 98,785 | 26,822 | 13,363 | 10,133 |
Total Liabilities | 154,258,913 | 58,188,884 | 1,871,351 | 41,610,530 |
Net Assets | $1,256,031,630 | $581,346,559 | $48,129,212 | $267,655,725 |
| Net Assets Consist of | ||||
Paid in capital | $1,190,960,309 | $534,125,292 | $48,678,705 | $285,451,386 |
Accumulated net realized gain (loss) on investments, written options, and foreign currency transactions | 33,758,286 | (1,274,806) | (1,773,124) | (7,630,755) |
Net unrealized appreciation (depreciation) on investments and foreign currency translations | 32,806,175 | 49,732,352 | 1,295,943 | (9,416,661) |
Net unrealized depreciation on securities sold short | — | — | (193,929) | — |
Net unrealized appreciation on written options | — | — | 10,185 | — |
Undistributed (distributions in excess of) net investment income | (1,493,140) | (1,236,279) | 111,432 | (748,245) |
Net Assets | $1,256,031,630 | $581,346,559 | $48,129,212 | $267,655,725 |
1 Investments at cost | 1,133,920,316 | 495,653,325 | 45,117,264 | 250,612,713 |
| 2 | Including securities on loan valued at $206,630,219, $57,056,315, $852,788, $48,964,259, respectively. |
| 3 | Written options, premium received of $—, $—, $23,635, and $—, respectively. |
| Meridian Funds | 38 | www.meridianfund.com |
Table of Contents
Statements of Assets and Liabilities (continued)
| December 31, 2015 (Unaudited) | Meridian Growth Fund | Meridian Contrarian Fund | Meridian Equity Income Fund | Meridian Small Cap Growth Fund |
| Net Asset Value | ||||
| Legacy Class | ||||
Net Assets | $1,175,268,982 | $579,488,897 | $47,350,150 | $ 36,196,276 |
Shares outstanding4 | 38,297,966 | 18,075,965 | 4,134,620 | 3,214,289 |
Net Asset value per share (offering and redemption price) | $ 30.69 | $ 32.06 | $ 11.45 | $ 11.26 |
| Institutional Class | ||||
Net Assets | $ 41,256,398 | $ — | $ — | $ 24,335,826 |
Shares outstanding4 | 1,344,979 | — | — | 2,159,334 |
Net Asset value per share (offering and redemption price) | $ 30.67 | $ — | $ — | $ 11.27 |
| Class A5 | ||||
Net Assets | $ 8,154,969 | $ 478,831 | $ 555,726 | $ 48,083,581 |
Shares outstanding4 | 270,197 | 15,061 | 48,681 | 4,302,211 |
Net Asset value per share (offering and redemption price) | $ 30.18 | $ 31.79 | $ 11.42 | $ 11.18 |
| Class C6 | ||||
Net Assets | $ 204,261 | $ 13,658 | $ 947 | $ 18,141,859 |
Shares outstanding4 | 6,694 | 428 | 83 | 1,620,454 |
Net Asset value per share (offering and redemption price) | $ 30.51 | $ 31.91 | $ 11.41 | $ 11.20 |
| Investor Class | ||||
Net Assets | $ 31,147,020 | $ 1,365,173 | $ 222,389 | $140,898,183 |
Shares outstanding4 | 1,021,047 | 42,662 | 19,403 | 12,519,183 |
Net Asset value per share (offering and redemption price) | $ 30.50 | $ 32.00 | $ 11.46 | $ 11.25 |
| 4 | 500,000,000 shares authorized, $0.01 par value. |
| 5 | On July 1, 2015, the Fund's Advisor Class Shares were redesignated as Class A Shares. |
| 6 | Commenced operations on July 1, 2015. |
| Meridian Funds | 39 | www.meridianfund.com |
Table of Contents
Statements of Operations
| For the Six Months Ended December 31, 2015 (Unaudited) | Meridian Growth Fund | Meridian Contrarian Fund | Meridian Equity Income Fund | Meridian Small Cap Growth Fund |
| Investment Income | ||||
Dividends | $ 5,668,864 | $ 3,227,855 | $ 371,981 | $ 917,151 |
Foreign taxes withheld | (64,043) | (47,654) | (802) | (6,360) |
Interest income | — | — | 52,607 | — |
Securities lending | 673,970 | 265,894 | 11,852 | 123,451 |
Total investment income | 6,278,791 | 3,446,095 | 435,638 | 1,034,242 |
| Expenses | ||||
Investment advisory fees | 6,849,240 | 3,134,109 | 223,455 | 1,342,249 |
Custodian fees | 92,302 | 35,999 | 5,361 | 16,096 |
| Distribution and service plan fees: | ||||
Investor Class | 9,878 | 228 | 84 | 35,494 |
Class A1 | 13,205 | 825 | 810 | 70,089 |
Class C2 | 421 | 29 | 5 | 49,282 |
Directors' fees | 141,643 | 47,979 | 3,819 | 19,307 |
Pricing fees | 95,483 | 39,425 | 11,568 | 20,700 |
Audit and tax fees | 57,691 | 19,448 | 1,558 | 7,832 |
Legal fees | 55,658 | 19,411 | 822 | 4,291 |
Registration and filing fees | 57,812 | 41,898 | 40,295 | 58,093 |
Shareholder communications | 81,253 | 29,787 | 1,393 | 12,072 |
Transfer agent fees | 245,277 | 142,463 | 7,440 | 130,665 |
Recoupment of investment advisory fees previously waived | 17,644 | 1,022 | 19,495 | 19,596 |
Miscellaneous expenses | 54,424 | 21,384 | 3,651 | 4,973 |
Total expenses excluding dividend expense | 7,771,931 | 3,534,007 | 319,756 | 1,790,739 |
Dividend expense | — | — | 4,450 | — |
Total expense | 7,771,931 | 3,534,007 | 324,206 | 1,790,739 |
Less waivers and/or reimbursements (Note 6) | — | — | — | (8,252) |
Net expenses | 7,771,931 | 3,534,007 | 324,206 | 1,782,487 |
Net investment income (loss) | (1,493,140) | (87,912) | 111,432 | (748,245) |
| Realized and Unrealized Gain (Loss) | ||||
Net realized gain/(loss) on investments and foreign currency transactions | (2,411,068) 3 | 5,315,709 | (1,938,822) | (7,246,844) |
Net realized gain on written options | — | — | 224,912 | — |
Net change in unrealized depreciation on investments and foreign currency translations | (175,665,248) | (54,686,371) | (566,237) | (25,318,511) |
Net change in unrealized depreciation on securities sold short | — | — | (193,929) | — |
Net change in unrealized depreciaton on written options | — | — | (27,256) | — |
Total realized and unrealized loss | (178,076,316) | (49,370,662) | (2,501,332) | (32,565,355) |
Net decrease in net assets resulting from operations | $(179,569,456) | $(49,458,574) | $(2,389,900) | $(33,313,600) |
| 1 | On July 1, 2015, the Fund's Advisor Class Shares were redesignated as Class A Shares. |
| 2 | Commenced operations on July 1, 2015. |
| 3 | Including in-kind redemptions gain of $61,338,763, $—, $—, and $—, respectively. |
| Meridian Funds | 40 | www.meridianfund.com |
Table of Contents
Statements of Changes in Net Assets
| Meridian Growth Fund | Meridian Contrarian Fund | ||||
| Changes in Net Assets From: | Six Months Ended December 31, 2015 (Unaudited) | Year Ended June 30, 2015 | Six Months Ended December 31, 2015 (Unaudited) | Year Ended June 30, 2015 | |
| Operations | |||||
Net investment loss | $ (1,493,140) | $ (8,327,330) | $ (87,912) | $ (43,632) | |
Net realized gain/(loss) on investments and foreign currency transactions | (2,411,068) | 256,624,172 | 5,315,709 | 98,718,841 | |
Net change in unrealized depreciation on investments | (175,665,248) | (15,775,934) | (54,686,371) | (53,402,467) | |
Net increase (decrease) in net assets resulting from operations and foreign currency translations | (179,569,456) | 232,520,908 | (49,458,574) | 45,272,742 | |
| Distributions to Shareholders From: | |||||
| Net Investment income: | |||||
Legacy Class | — | — | (371,062) | (1,287,678) | |
Institutional Class | — | — | — | — | |
Class A1 | — | — | — | — | |
Class C2 | — | — | — | — | |
Investor Class | — | — | — | — | |
| Net Realized Gains: | |||||
Legacy Class | (131,257,246) | (219,516,396) | (84,718,718) | (115,863,711) | |
Institutional Class | (4,467,337) | — | — | — | |
Class A1 | (897,194) | (595,614) | (76,522) | (155,510) | |
Class C2 | (15,809) | — | (1,961) | — | |
Investor Class | (3,547,289) | (3,083,406) | (122,913) | (174,302) | |
Decrease in net assets from distributions | (140,184,875) | (223,195,416) | (85,291,176) | (117,481,201) | |
| Fund Share Transactions | |||||
Net increase (decrease) in net assets resulting from fund share transactions (Note 2) | (432,009,342) | (46,379,756) | 37,328,408 | (15,931,502) | |
Total decrease in net assets | (751,763,673) | (37,054,264) | (97,421,342) | (88,139,961) | |
| Net Assets | |||||
Beginning of Period | 2,007,795,303 | 2,044,849,567 | 678,767,901 | 766,907,862 | |
End of Period* | $1,256,031,630 | $2,007,795,303 | $581,346,559 | $ 678,767,901 | |
*Includes accumulated distributions in excess of net investment income | $ (1,493,140) | $ — | $ (1,236,279) | $ (777,304) | |
| Meridian Funds | 41 | www.meridianfund.com |
Table of Contents
Statements of Changes in Net Assets (continued)
| Meridian Equity Income Fund | Meridian Small Cap Growth Fund | ||||
| Changes in Net Assets From: | Six Months Ended December 31, 2015 (Unaudited) | Year Ended June 30, 2015 | Six Months Ended December 31, 2015 (Unaudited) | Year Ended June 30, 2015 | |
| Operations | |||||
Net investment income/(loss) | $ 111,432 | $ 201,787 | $ (748,245) | $ (1,038,384) | |
Net realized gain/(loss) on investments and foreign currency transactions | (1,713,910) | 7,912,090 | (7,246,844) | 6,225,848 | |
Net change in unrealized depreciation on investments, written options, securities sold short, and foreign currency translations | (787,422) | (6,155,478) | (25,318,511) | 15,017,109 | |
Net increase (decrease) in net assets resulting from operations and foreign currency translations | (2,389,900) | 1,958,399 | (33,313,600) | 20,204,573 | |
| Distributions to Shareholders From: | |||||
| Net Investment income: | |||||
Legacy Class | — | (664,498) | — | — | |
Institutional Class | — | — | — | — | |
Class A1 | — | (2,071) | — | — | |
Class C2 | — | — | — | — | |
Investor Class | — | (876) | — | — | |
| Net Realized Gains: | |||||
Legacy Class | (1,933,942) | (5,535,693) | (625,851) | (836,030) | |
Institutional Class | — | — | (380,054) | — | |
Class A1 | (22,470) | (19,039) | (766,627) | (556,328) | |
Class C2 | (39) | — | (267,924) | — | |
Investor Class | (9,061) | (7,536) | (2,271,100) | (939,505) | |
Decrease in net assets from distributions | (1,965,512) | (6,229,713) | (4,311,556) | (2,331,863) | |
| Fund Share Transactions | |||||
Net increase (decrease) in net assets resulting from fund share transactions (Note 2) | (1,476,721) | 24,525,359 | 56,390,262 | 212,520,461 | |
Total increase (decrease) in net assets | (5,832,133) | 20,254,045 | 18,765,106 | 230,393,171 | |
| Net Assets | |||||
Beginning of Period | 53,961,345 | 33,707,300 | 248,890,619 | 18,497,448 | |
End of Period* | $48,129,212 | $53,961,345 | $267,655,725 | $248,890,619 | |
*Includes accumulated undistributed (distributions in excess of) net investment income | $ 111,432 | $ — | $ (748,245) | $ — | |
| 1 | On July 1, 2015, the Fund's Advisor Class Shares were redesignated as Class A Shares. |
| 2 | Commenced operations on July 1, 2015. |
| Meridian Funds | 42 | www.meridianfund.com |
Table of Contents
Financial Highlights
| For the Six Months Ended December 31, | For the Fiscal Year Ended June 30, | |||||
| Legacy Class | 2015 (Unaudited) | 2015 | 2014 | 2013 | 2012 | 2011 |
| Per Share Operating Performance | ||||||
Net asset value, beginning of period | $ 37.80 | $ 37.86 | $ 44.31 | $ 45.06 | $ 47.61 | $ 33.94 |
| Income (loss) from investment operations | ||||||
Net investment income (loss)1 | (0.03) | (0.15) | (0.11) | 0.05 | 0.10 | 0.08 |
Net realized and unrealized gain(loss) | (3.34) | 4.37 | 6.89 | 6.23 | 0.69 | 13.67 |
Net increase(decrease) from investment operations | (3.37) | 4.22 | 6.78 | 6.28 | 0.79 | 13.75 |
| Less distributions to shareholders: | ||||||
Distributions from net investment income | 0.00 | 0.00 | (0.00) 2 | (0.15) | (0.07) | (0.07) |
Distributions from net realized capital gains | (3.74) | (4.28) | (13.23) | (6.88) | (3.27) | (0.01) |
Total distributions to shareholders | (3.74) | (4.28) | (13.23) | (7.03) | (3.34) | (0.08) |
Redemption fees | 0.00 2 | 0.00 2 | 0.00 | 0.00 | 0.00 | 0.00 |
Net asset value, end of period | $ 30.69 | $ 37.80 | $ 37.86 | $ 44.31 | $ 45.06 | $ 47.61 |
Total return | (8.90)% 3 | 11.85% | 17.31% | 15.54% | 2.45% | 40.51% |
| Ratios to Average Net Assets | ||||||
Ratio of net investment income (loss) to average net assets | (0.16)% 4 | (0.41)% | (0.27)% | 0.11% | 0.22% | 0.18% |
Ratio of expenses to average net assets: | 0.85% 4 | 0.84% | 0.86% | 0.87% | 0.85% | 0.81% |
| Supplemental Data | ||||||
Net Assets, End of Period (000's) | $1,175,269 | $1,937,346 | $2,021,197 | $2,112,945 | $2,484,084 | $2,615,082 |
Portfolio Turnover Rate | 40% 3 | 46% | 96% | 37% | 25% | 26% |
| 1 | Per share net investment income has been calculated using the average daily shares method. |
| 2 | Less than $0.005 per share. |
| 3 | Not Annualized. |
| 4 | Annualized. |
| Meridian Funds | 43 | www.meridianfund.com |
Table of Contents
Financial Highlights
| Institutional Class | For the Six Months Ended December 31,2015 (Unaudited) | For the Period Ended June 30,20151 | |
| Per Share Operating Performance | |||
Net asset value, beginning of period | $ 37.79 | $ 36.44 | |
| Income (loss) from investment operations | |||
Net investment loss2 | (0.03) | (0.04) | |
Net realized and unrealized gain(loss) | (3.35) | 1.39 | |
Net increase(decrease) from investment operations | (3.38) | 1.35 | |
| Less distributions to shareholders: | |||
Distributions from net realized capital gains | (3.74) | 0.00 | |
Total distributions to shareholders | (3.74) | 0.00 | |
Redemption fees | 0.00 3 | 0.00 | |
Net asset value, end of period | $ 30.67 | $ 37.79 | |
Total return | (8.94)% 4 | 3.70% 4 | |
| Ratios to Average Net Assets | |||
Ratio of net investment loss to average net assets | (0.17)% 5 | (0.21)% 5 | |
Ratio of expenses to average net assets: | |||
Before fees waived and excluding recoupment of past waived fees | 0.87% 5 | 1.15% 5 | |
After fees waived and excluding recoupment of past waived fees6 | 0.87% 5 | 0.90% 5 | |
Including recoupment of past waived fees6 | 0.90% 5 | 0.90% 5 | |
| Supplemental Data | |||
Net Assets, End of Period (000's) | $ 41,256 | $ 19,575 | |
Portfolio Turnover Rate | 40% 4 | 46% 4 | |
| 1 | Commenced operations on December 24, 2014. |
| 2 | Per share net investment income has been calculated using the average daily shares method. |
| 3 | Less than $0.005 per share. |
| 4 | Not Annualized. |
| 5 | Annualized. |
| 6 | See Note 6 to Financial Statements. |
| Meridian Funds | 44 | www.meridianfund.com |
Table of Contents
Financial Highlights
| Class A | For the Six Months Ended December 31,20151 (Unaudited) | For the Fiscal Year Ended June 30,2015 | For the Period Ended June 30,20142 | ||
| Per Share Operating Performance | |||||
Net asset value, beginning of period | $ 37.37 | $ 37.72 | $ 35.67 | ||
| Income (loss) from investment operations | |||||
Net investment loss3 | (0.15) | (0.41) | (0.21) | ||
Net realized and unrealized gain(loss) | (3.30) | 4.33 | 2.26 | ||
Net increase(decrease) from investment operations | (3.45) | 3.92 | 2.05 | ||
| Less distributions to shareholders: | |||||
Distributions from net realized capital gains | (3.74) | (4.28) | 0.00 4 | ||
Total distributions to shareholders | (3.74) | (4.28) | 0.00 4 | ||
Redemption fees | 0.00 4 | 0.01 | 0.00 | ||
Net asset value, end of period | $ 30.18 | $ 37.37 | $ 37.72 | ||
Total return | (9.23)% 5 | 11.08% | 5.75% 5 | ||
| Ratios to Average Net Assets | |||||
Ratio of net investment loss to average net assets | (0.86)% 6 | (1.11)% | (0.93)% 6 | ||
Ratio of expenses to average net assets: | |||||
Before fees waived and excluding recoupment of past waived fees | 1.25% 6 | 1.69% | 2.00% 6 | ||
After fees waived and excluding recoupment of past waived fees7 | 1.25% 6 | 1.55% | 1.55% 6 | ||
Including recoupment of past waived fees7 | 1.55% 6 | 1.55% | 1.55% 6 | ||
| Supplemental Data | |||||
Net Assets, End of Period (000's) | $ 8,155 | $ 8,812 | $ 4,904 | ||
Portfolio Turnover Rate | 40% 5 | 46% | 96% 5 | ||
| 1 | On July 1, 2015, the Fund's Advisor Class Shares were redesignated as Class A Shares. |
| 2 | Commenced operations on November 15, 2013. |
| 3 | Per share net investment income has been calculated using the average daily shares method. |
| 4 | Less than $0.005 per share. |
| 5 | Not Annualized. |
| 6 | Annualized. |
| 7 | See Note 6 to Financial Statements. |
| Meridian Funds | 45 | www.meridianfund.com |
Table of Contents
Financial Highlights
| Class C | For the Six Months Ended December 31,20151 (Unaudited) |
| Per Share Operating Performance | |
Net asset value, beginning of period | $ 37.80 |
| Income (loss) from investment operations | |
Net investment loss2 | (0.21) |
Net realized and unrealized loss | (3.34) |
Net increase from investment operations | (3.55) |
| Less distributions to shareholders: | |
Distributions from net realized capital gains | (3.74) |
Total distributions to shareholders | (3.74) |
Net asset value, end of period | $ 30.51 |
Total return | (9.39)% 3 |
| Ratios to Average Net Assets | |
Ratio of net investment loss to average net assets | (1.23)% 4 |
Ratio of expenses to average net assets: | |
Before fees waived and excluding recoupment of past waived fees | 1.94% 4 |
After fees waived and excluding recoupment of past waived fees5 | 1.94% 4 |
Including recoupment of past waived fees5 | 1.94% 4 |
| Supplemental Data | |
Net Assets, End of Period (000's) | $ 204 |
Portfolio Turnover Rate | 40% 3 |
| 1 | Commenced operations on July 1, 2015. |
| 2 | Per share net investment income has been calculated using the average daily shares method. |
| 3 | Not Annualized. |
| 4 | Annualized. |
| 5 | See Note 6 to Financial Statements. |
| Meridian Funds | 46 | www.meridianfund.com |
Table of Contents
Financial Highlights
| Investor Class | For the Six Months Ended December 31,2015 (Unaudited) | For the Fiscal Year Ended June 30,2015 | For the Period Ended June 30,20141 | ||
| Per Share Operating Performance | |||||
Net asset value, beginning of period | $ 37.61 | $ 37.78 | $ 35.67 | ||
| Income (loss) from investment operations | |||||
Net investment loss2 | (0.04) | (0.27) | (0.16) | ||
Net realized and unrealized gain/(loss) | (3.33) | 4.37 | 2.27 | ||
Net increase(decrease) from investment operations | (3.37) | 4.10 | 2.11 | ||
| Less distributions to shareholders: | |||||
Distributions from net realized capital gains | (3.74) | (4.28) | 0.00 3 | ||
Total distributions to shareholders | (3.74) | (4.28) | 0.00 3 | ||
Redemption fees | 0.00 3 | 0.01 | 0.00 | ||
Net asset value, end of period | $ 30.50 | $ 37.61 | $ 37.78 | ||
Total return | (8.95)% 4 | 11.56% | 5.92% 4 | ||
| Ratios to Average Net Assets | |||||
Ratio of net investment loss to average net assets | (0.23)% 5 | (0.73)% | (0.70)% 5 | ||
Ratio of expenses to average net assets: | |||||
Before fees waived and excluding recoupment of past waived fees | 0.93% 5 | 1.16% | 1.30% 5 | ||
After fees waived and excluding recoupment of past waived fees6 | 0.93% 5 | 1.16% | 1.30% 5 | ||
Including recoupment of past waived fees6 | 0.93% 5 | 1.16% | 1.30% 5 | ||
| Supplemental Data | |||||
Net Assets, End of Period (000's) | $ 31,147 | $ 42,062 | $ 18,749 | ||
Portfolio Turnover Rate | 40% 4 | 46% | 96% 4 | ||
| 1 | Commenced operations on November 15, 2013. |
| 2 | Per share net investment income has been calculated using the average daily shares method. |
| 3 | Less than $0.005 per share. |
| 4 | Not Annualized. |
| 5 | Annualized. |
| 6 | See Note 6 to Financial Statements. |
| Meridian Funds | 47 | www.meridianfund.com |
Table of Contents
Financial Highlights
| For the Six Months Ended December 31, | For the Fiscal Year Ended June 30, | |||||
| Legacy Class | 2015 (Unaudited) | 2015 | 2014 | 2013 | 2012 | 2011 |
| Per Share Operating Performance | ||||||
Net asset value, beginning of period | $ 40.44 | $ 45.52 | $ 37.20 | $ 30.60 | $ 29.59 | $ 22.80 |
| Income (loss) from investment operations | ||||||
Net investment income (loss)1 | (0.01) | (0.00) 2 | 0.01 | 0.14 | 0.09 | 0.10 |
Net realized and unrealized gain(loss) | (3.00) | 2.66 | 8.63 | 6.57 | 1.05 3 | 6.77 |
Net increase(decrease) from investment operations | (3.01) | 2.66 | 8.64 | 6.71 | 1.14 | 6.87 |
| Less distributions to shareholders: | ||||||
Distributions from net investment income | (0.02) | (0.09) | (0.18) | (0.11) | (0.13) | (0.08) |
Distributions from net realized capital gains | (5.35) | (7.65) | (0.14) | 0.00 | 0.00 | 0.00 |
Total distributions to shareholders | (5.37) | (7.74) | (0.32) | (0.11) | (0.13) | (0.08) |
Redemption fees | 0.00 2 | 0.00 2 | 0.00 | 0.00 | 0.00 | 0.00 |
Net asset value, end of period | $ 32.06 | $ 40.44 | $ 45.52 | $ 37.20 | $ 30.60 | $ 29.59 |
Total return | (7.37)% 4 | 6.84% | 23.31% | 21.98% | 3.89% 3 | 30.13% |
| Ratios to Average Net Assets | ||||||
Ratio of net investment income (loss) to average net assets | (0.03)% 5 | (0.01)% | 0.01% | 0.41% | 0.31% | 0.37% |
Ratio of expenses to average net assets: | 1.13% 5 | 1.11% | 1.13% | 1.16% | 1.14% | 1.09% |
| Supplemental Data | ||||||
Net Assets, End of Period (000's) | $579,489 | $677,138 | $764,882 | $704,523 | $688,467 | $869,312 |
Portfolio Turnover Rate | 45% 4 | 76% | 67% | 55% | 20% | 38% |
| 1 | Per share net investment income has been calculated using the average daily shares method. |
| 2 | Less than $0.005 per share. |
| 3 | Includes a gain resulting from litigation payments on securities owned in a prior year. Without these gains, the net realized gains on investments per share would have been $0.99, and the total return would have been 3.69%. |
| 4 | Not Annualized. |
| 5 | Annualized. |
| Meridian Funds | 48 | www.meridianfund.com |
Table of Contents
Financial Highlights
| Class A | For the Six Months Ended December 31,20151 (Unaudited) | For the Fiscal Year Ended June 30,2015 | For the Period Ended June 30,20142 | ||
| Per Share Operating Performance | |||||
Net asset value, beginning of period | $ 40.22 | $ 45.41 | $ 42.64 | ||
| Income (loss) from investment operations | |||||
Net investment loss3 | (0.09) | (0.22) | (0.08) | ||
Net realized and unrealized gain(loss) | (2.99) | 2.68 | 3.02 | ||
Net increase(decrease) from investment operations | (3.08) | 2.46 | 2.94 | ||
| Less distributions to shareholders: | |||||
Distributions from net investment income | 0.00 | 0.00 | (0.17) | ||
Distributions from net realized capital gains | (5.35) | (7.65) | 0.00 | ||
Total distributions to shareholders | (5.35) | (7.65) | (0.17) | ||
Redemption fees | 0.00 | 0.00 | 0.00 | ||
Net asset value, end of period | $ 31.79 | $ 40.22 | $ 45.41 | ||
Total return | (7.59)% 4 | 6.38% | 6.91% 4 | ||
| Ratios to Average Net Assets | |||||
Ratio of net investment loss to average net assets | (0.50)% 5 | (0.52)% | (0.30)% 5 | ||
Ratio of expenses to average net assets: | |||||
Before fees waived and excluding recoupment of past waived fees | 1.47% 5 | 3.46% | 7.46% 5 | ||
After fees waived and excluding recoupment of past waived fees6 | 1.47% 5 | 1.60% | 1.60% 5 | ||
Including recoupment of past waived fees6 | 1.60% 5 | 1.60% | 1.60% 5 | ||
| Supplemental Data | |||||
Net Assets, End of Period (000's) | $ 479 | $ 622 | $ 462 | ||
Portfolio Turnover Rate | 45% 4 | 76% | 67% 4 | ||
| 1 | On July 1, 2015, the Fund's Advisor Class Shares were redesignated as Class A Shares. |
| 2 | Commenced operations on November 15, 2013. |
| 3 | Per share net investment income has been calculated using the average daily shares method. |
| 4 | Not Annualized. |
| 5 | Annualized. |
| 6 | See Note 6 to Financial Statements. |
| Meridian Funds | 49 | www.meridianfund.com |
Table of Contents
Financial Highlights
| Class C | For the Six Months Ended December 31,20151 (Unaudited) |
| Per Share Operating Performance | |
Net asset value, beginning of period | $ 40.54 |
| Income (loss) from investment operations | |
Net investment loss2 | (0.12) |
Net realized and unrealized loss | (3.16) |
Net increase from investment operations | (3.28) |
| Less distributions to shareholders: | |
Distributions from net realized capital gains | (5.35) |
Total distributions to shareholders | (5.35) |
Net asset value, end of period | $ 31.91 |
Total return | (8.08)% 3 |
| Ratios to Average Net Assets | |
Ratio of net investment loss to average net assets | (0.58)% 4 |
Ratio of expenses to average net assets: | |
Before fees waived and excluding recoupment of past waived fees | 2.15% 4 |
After fees waived and excluding recoupment of past waived fees5 | 2.15% 4 |
Including recoupment of past waived fees5 | 2.15% 4 |
| Supplemental Data | |
Net Assets, End of Period (000's) | $ 14 |
Portfolio Turnover Rate | 45% 3 |
| 1 | Commenced operations on July 1, 2015. |
| 2 | Per share net investment income has been calculated using the average daily shares method. |
| 3 | Not Annualized. |
| 4 | Annualized. |
| 5 | See Note 6 to Financial Statements. |
| Meridian Funds | 50 | www.meridianfund.com |
Table of Contents
Financial Highlights
| Investor Class | For the Six Months Ended December 31,2015 (Unaudited) | For the Fiscal Year Ended June 30,2015 | For the Period Ended June 30,20141 | ||
| Per Share Operating Performance | |||||
Net asset value, beginning of period | $ 40.40 | $ 45.47 | $ 42.64 | ||
| Income (loss) from investment operations | |||||
Net investment loss2 | (0.05) | (0.09) | (0.02) | ||
Net realized and unrealized gain/(loss) | (3.00) | 2.66 | 3.03 | ||
Net increase(decrease) from investment operations | (3.05) | 2.57 | 3.01 | ||
| Less distributions to shareholders: | |||||
Distributions from net investment income | 0.00 | 0.00 | (0.18) | ||
Distributions from net realized capital gains | (5.35) | (7.65) | 0.00 | ||
Total distributions to shareholders | (5.35) | (7.65) | (0.18) | ||
Redemption fees | 0.00 3 | 0.01 | 0.00 | ||
Net asset value, end of period | $ 32.00 | $ 40.40 | $ 45.47 | ||
Total return | (7.49)% 4 | 6.67% | 7.08% 4 | ||
| Ratios to Average Net Assets | |||||
Ratio of net investment loss to average net assets | (0.25)% 5 | (0.21)% | (0.09)% 5 | ||
Ratio of expenses to average net assets: | |||||
Before fees waived and excluding recoupment of past waived fees | 1.21% 5 | 2.34% | 3.51% 5 | ||
After fees waived and excluding recoupment of past waived fees6 | 1.21% 5 | 1.35% | 1.35% 5 | ||
Including recoupment of past waived fees6 | 1.35% 5 | 1.35% | 1.35% 5 | ||
| Supplemental Data | |||||
Net Assets, End of Period (000's) | $ 1,365 | $ 1,008 | $ 1,564 | ||
Portfolio Turnover Rate | 45% 4 | 76% | 67% 4 | ||
| 1 | Commenced operations on November 15, 2013. |
| 2 | Per share net investment income has been calculated using the average daily shares method. |
| 3 | Less than $0.005 per share. |
| 4 | Not Annualized. |
| 5 | Annualized. |
| 6 | See Note 6 to Financial Statements. |
| Meridian Funds | 51 | www.meridianfund.com |
Table of Contents
Financial Highlights
| For the Six Months Ended December 31, | For the Fiscal Year Ended June 30, | |||||
| Legacy Class | 2015 (Unaudited) | 2015 | 2014 | 2013 | 2012 | 2011 |
| Per Share Operating Performance | ||||||
Net asset value, beginning of period | $ 12.51 | $ 14.59 | $ 12.35 | $ 10.71 | $ 10.61 | $ 8.51 |
| Income (loss) from investment operations | ||||||
Net investment income1 | 0.03 | 0.12 | 0.24 | 0.24 | 0.22 | 0.20 |
Net realized and unrealized gain(loss) | (0.60) | 0.47 | 2.22 | 1.68 | 0.09 | 2.11 |
Net increase(decrease) from investment operations | (0.57) | 0.59 | 2.46 | 1.92 | 0.31 | 2.31 |
| Less distributions to shareholders: | ||||||
Distributions from net investment income | 0.00 | (0.25) | (0.22) | (0.28) | (0.21) | (0.21) |
Distributions from net realized capital gains | (0.49) | (2.42) | 0.00 | 0.00 | 0.00 | 0.00 |
Total distributions to shareholders | (0.49) | (2.67) | (0.22) | (0.28) | (0.21) | (0.21) |
Redemption fees | 0.00 2 | 0.00 2 | 0.00 2 | 0.00 | 0.00 | 0.00 |
Net asset value, end of period | $ 11.45 | $ 12.51 | $ 14.59 | $ 12.35 | $ 10.71 | $ 10.61 |
Total return | (4.60)% 3 | 4.46% | 20.04% | 18.28% | 3.09% | 27.30% |
| Ratios to Average Net Assets | ||||||
Ratio of net investment income to average net assets | 0.44% 4 | 0.88% | 1.75% | 2.08% | 2.17% | 2.04% |
Ratio of expenses to average net assets: | ||||||
Before fees waived and excluding recoupment of past waived fees | 1.17% 4 | 1.33% | 1.37% | 1.53% | 1.41% | 1.25% |
After fees waived and excluding recoupment of past waived fees5 | 1.17% 4 | 1.25% | 1.25% | 1.25% | 1.25% | 1.25% 6 |
Including recoupment of past waived fees5 | 1.25% 4 | 1.25% | 1.25% | 1.25% | 1.25% | 1.25% |
| Supplemental Data | ||||||
Net Assets, End of Period (000's) | $ 47,350 | $53,125 | $ 33,649 | $ 28,697 | $30,744 | $ 35,644 |
Portfolio Turnover Rate | 21% 3 | 266% | 35% | 44% | 31% | 29% |
| 1 | Per share net investment income has been calculated using the average daily shares method. |
| 2 | Less than $0.005 per share. |
| 3 | Not Annualized. |
| 4 | Annualized. |
| 5 | See Note 6 to Financial Statements. |
| 6 | Includes fees waived, which were less than 0.01%. |
| Meridian Funds | 52 | www.meridianfund.com |
Table of Contents
Financial Highlights
| Class A | For the Six Months Ended December 31,20151 (Unaudited) | For the Fiscal Year Ended June 30,2015 | For the Period Ended June 30,20142 | ||
| Per Share Operating Performance | |||||
Net asset value, beginning of period | $ 12.50 | $ 14.58 | $ 13.87 | ||
| Income (loss) from investment operations | |||||
Net investment income (loss)3 | 0.01 | (0.02) | 0.13 | ||
Net realized and unrealized gain(loss) | (0.60) | 0.58 | 0.78 | ||
Net increase(decrease) from investment operations | (0.59) | 0.56 | 0.91 | ||
| Less distributions to shareholders: | |||||
Distributions from net investment income | 0.00 | (0.22) | (0.20) | ||
Distributions from net realized capital gains | (0.49) | (2.42) | 0.00 | ||
Total distributions to shareholders | (0.49) | (2.64) | (0.20) | ||
Redemption fees | 0.00 | 0.00 | 0.00 | ||
Net asset value, end of period | $ 11.42 | $ 12.50 | $ 14.58 | ||
Total return | (4.76)% 4 | 4.24% | 6.69% 4 | ||
| Ratios to Average Net Assets | |||||
Ratio of net investment income(loss) to average net assets | 0.11% 5 | (0.11)% | 1.55% 5 | ||
Ratio of expenses to average net assets: | |||||
Before fees waived and excluding recoupment of past waived fees | 1.58% 5 | 7.46% | 132.38% 5 | ||
After fees waived and excluding recoupment of past waived fees6 | 1.58% 5 | 1.60% | 1.60% 5 | ||
Including recoupment of past waived fees6 | 1.60% 5 | 1.60% | 1.60% 5 | ||
| Supplemental Data | |||||
Net Assets, End of Period (000's) | $ 556 | $ 501 | $ 13 | ||
Portfolio Turnover Rate | 21% 4 | 266% | 35% 4 | ||
| 1 | On July 1, 2015, the Fund's Advisor Class Shares were redesignated as Class A Shares. |
| 2 | Commenced operations on November 15, 2013. |
| 3 | Per share net investment income has been calculated using the average daily shares method. |
| 4 | Not Annualized. |
| 5 | Annualized. |
| 6 | See Note 6 to Financial Statements. |
| Meridian Funds | 53 | www.meridianfund.com |
Table of Contents
Financial Highlights
| Class C | For the Six Months Ended December 31,20151 (Unaudited) |
| Per Share Operating Performance | |
Net asset value, beginning of period | $ 12.56 |
| Income (loss) from investment operations | |
Net investment loss2 | (0.01) |
Net realized and unrealized loss | (0.65) |
Net increase from investment operations | (0.66) |
| Less distributions to shareholders: | |
Distributions from net realized capital gains | (0.49) |
Total distributions to shareholders | (0.49) |
Redemption fees | 0.00 |
Net asset value, end of period | $ 11.41 |
Total return | (5.29)% 3 |
| Ratios to Average Net Assets | |
Ratio of net investment loss to average net assets | (0.37)% 4 |
Ratio of expenses to average net assets: | |
Before fees waived and excluding recoupment of past waived fees | 1.93% 4 |
After fees waived and excluding recoupment of past waived fees5 | 1.93% 4 |
Including recoupment of past waived fees5 | 1.93% 4 |
| Supplemental Data | |
Net Assets, End of Period (000's) | $ 1 |
Portfolio Turnover Rate | 21% 3 |
| 1 | Commenced operations on July 1, 2015. |
| 2 | Per share net investment income has been calculated using the average daily shares method. |
| 3 | Not Annualized. |
| 4 | Annualized. |
| 5 | See Note 6 to Financial Statements. |
| Meridian Funds | 54 | www.meridianfund.com |
Table of Contents
Financial Highlights
| Investor Class | For the Six Months Ended December 31,2015 (Unaudited) | For the Fiscal Year Ended June 30,2015 | For the Period Ended June 30,20141 | ||
| Per Share Operating Performance | |||||
Net asset value, beginning of period | $ 12.53 | $ 14.60 | $ 13.87 | ||
| Income (loss) from investment operations | |||||
Net investment income (loss)2 | 0.02 | (0.02) | 0.15 | ||
Net realized and unrealized gain/(loss) | (0.60) | 0.61 | 0.79 | ||
Net increase(decrease) from investment operations | (0.58) | 0.59 | 0.94 | ||
| Less distributions to shareholders: | |||||
Distributions from net investment income | 0.00 | (0.24) | (0.21) | ||
Distributions from net realized capital gains | (0.49) | (2.42) | 0.00 | ||
Total distributions to shareholders | (0.49) | (2.66) | (0.21) | ||
Redemption fees | 0.00 3 | 0.00 | 0.00 | ||
Net asset value, end of period | $ 11.46 | $ 12.53 | $ 14.60 | ||
Total return | (4.67)% 4 | 4.44% | 6.87% 4 | ||
| Ratios to Average Net Assets | |||||
Ratio of net investment income(loss) to average net assets | 0.34% 5 | (0.13)% | 1.72% 5 | ||
Ratio of expenses to average net assets: | |||||
Before fees waived and excluding recoupment of past waived fees | 1.25% 5 | 16.83% | 39.23% 5 | ||
After fees waived and excluding recoupment of past waived fees6 | 1.25% 5 | 1.35% | 1.35% 5 | ||
Including recoupment of past waived fees6 | 1.35% 5 | 1.35% | 1.35% 5 | ||
| Supplemental Data | |||||
Net Assets, End of Period (000's) | $ 222 | $ 335 | $ 45 | ||
Portfolio Turnover Rate | 21% 4 | 266% | 35% 4 | ||
| 1 | Commenced operations on November 15, 2013. |
| 2 | Per share net investment income has been calculated using the average daily shares method. |
| 3 | Less than $0.005 per share. |
| 4 | Not Annualized. |
| 5 | Annualized. |
| 6 | See Note 6 to Financial Statements. |
| Meridian Funds | 55 | www.meridianfund.com |
Table of Contents
Financial Highlights
| Legacy Class | For the Six Months Ended December 31,2015 (Unaudited) | For the Fiscal Year Ended June 30,2015 | For the Period Ended June 30,20141 | ||
| Per Share Operating Performance | |||||
Net asset value, beginning of period | $ 12.98 | $ 11.65 | $ 10.00 | ||
| Income (loss) from investment operations | |||||
Net investment loss2 | (0.03) | (0.09) | (0.04) | ||
Net realized and unrealized gain(loss) | (1.51) | 1.72 | 1.69 | ||
Net increase(decrease) from investment operations | (1.54) | 1.63 | 1.65 | ||
| Less distributions to shareholders: | |||||
Distributions from net realized capital gains | (0.18) | (0.30) | 0.00 | ||
Total distributions to shareholders | (0.18) | (0.30) | 0.00 | ||
Redemption fees | 0.00 3 | 0.00 3 | 0.00 | ||
Net asset value, end of period | $ 11.26 | $ 12.98 | $ 11.65 | ||
Total return | (11.84)% 4 | 14.23% | 16.50% 4 | ||
| Ratios to Average Net Assets | |||||
Ratio of net investment loss to average net assets | (0.49)% 5 | (0.69)% | (0.61)% 5 | ||
Ratio of expenses to average net assets: | |||||
Before fees waived and excluding recoupment of past waived fees | 1.17% 5 | 1.24% | 2.35% 5 | ||
After fees waived and excluding recoupment of past waived fees6 | 1.17% 5 | 1.20% | 1.20% 5 | ||
Including recoupment of past waived fees6 | 1.20% 5 | 1.20% | 1.20% | ||
| Supplemental Data | |||||
Net Assets, End of Period (000's) | $ 36,196 | $ 59,459 | $ 9,839 | ||
Portfolio Turnover Rate | 45% 4 | 45% | 78% 4 | ||
| 1 | Commenced operations on December 16, 2013. |
| 2 | Per share net investment income has been calculated using the average daily shares method. |
| 3 | Less than $0.005 per share. |
| 4 | Not Annualized. |
| 5 | Annualized. |
| 6 | See Note 6 to Financial Statements. |
| Meridian Funds | 56 | www.meridianfund.com |
Table of Contents
Financial Highlights
| Institutional Class | For the Six Months Ended December 31,2015 (Unaudited) | For the Period Ended June 30,20151 | |
| Per Share Operating Performance | |||
Net asset value, beginning of period | $ 12.98 | $ 12.23 | |
| Income (loss) from investment operations | |||
Net investment loss2 | (0.02) | (0.02) | |
Net realized and unrealized gain(loss) | (1.51) | 0.77 | |
Net increase(decrease) from investment operations | (1.53) | 0.75 | |
| Less distributions to shareholders: | |||
Distributions from net realized capital gains | (0.18) | 0.00 | |
Total distributions to shareholders | (0.18) | 0.00 | |
Redemption fees | 0.00 3 | 0.00 | |
Net asset value, end of period | $ 11.27 | $ 12.98 | |
Total return | (11.76)% 4 | 6.13% 4 | |
| Ratios to Average Net Assets | |||
Ratio of net investment loss to average net assets | (0.30)% 5 | (0.29)% 5 | |
Ratio of expenses to average net assets: | |||
Before fees waived and excluding recoupment of past waived fees | 1.17% 5 | 2.03% 5 | |
After fees waived and excluding recoupment of past waived fees6 | 1.10% 5 | 1.10% 5 | |
Including recoupment of past waived fees6 | 1.10% 5 | 1.10% 5 | |
| Supplemental Data | |||
Net Assets, End of Period (000's) | $ 24,336 | $ 13,035 | |
Portfolio Turnover Rate | 45% 4 | 44% 4 | |
| 1 | Commenced operations on December 24, 2014. |
| 2 | Per share net investment income has been calculated using the average daily shares method. |
| 3 | Less than $0.005 per share. |
| 4 | Not Annualized. |
| 5 | Annualized. |
| 6 | See Note 6 to Financial Statements. |
| Meridian Funds | 57 | www.meridianfund.com |
Table of Contents
Financial Highlights
| Class A | For the Six Months Ended December 31,20151 (Unaudited) | For the Fiscal Year Ended June 30,2015 | For the Period Ended June 30,20142 | ||
| Per Share Operating Performance | |||||
Net asset value, beginning of period | $ 12.91 | $ 11.63 | $ 10.00 | ||
| Income (loss) from investment operations | |||||
Net investment loss3 | (0.05) | (0.13) | (0.06) | ||
Net realized and unrealized gain(loss) | (1.50) | 1.71 | 1.69 | ||
Net increase(decrease) from investment operations | (1.55) | 1.58 | 1.63 | ||
| Less distributions to shareholders: | |||||
Distributions from net realized capital gains | (0.18) | (0.30) | 0.00 | ||
Total distributions to shareholders | (0.18) | (0.30) | 0.00 | ||
Redemption fees | 0.00 4 | 0.00 4 | 0.00 | ||
Net asset value, end of period | $ 11.18 | $ 12.91 | $ 11.63 | ||
Total return | (11.98)% 5 | 13.82% | 16.30% 5 | ||
| Ratios to Average Net Assets | |||||
Ratio of net investment loss to average net assets | (0.83)% 6 | (1.09)% | (1.01)% 6 | ||
Ratio of expenses to average net assets: | |||||
Before fees waived and excluding recoupment of past waived fees | 1.55% 6 | 1.69% | 2.99% 6 | ||
After fees waived and excluding recoupment of past waived fees7 | 1.55% 6 | 1.60% | 1.60% 6 | ||
Including recoupment of past waived fees7 | 1.60% 6 | 1.60% | 1.60% 6 | ||
| Supplemental Data | |||||
Net Assets, End of Period (000's) | $ 48,084 | $ 45,186 | $ 6,524 | ||
Portfolio Turnover Rate | 45% 5 | 44% | 78% 5 | ||
| 1 | On July 1, 2015, the Fund's Advisor Class Shares were redesignated as Class A Shares. |
| 2 | Commenced operations on November 15, 2013. |
| 3 | Per share net investment income has been calculated using the average daily shares method. |
| 4 | Less than $0.005 per share. |
| 5 | Not Annualized. |
| 6 | Annualized. |
| 7 | See Note 6 to Financial Statements. |
| Meridian Funds | 58 | www.meridianfund.com |
Table of Contents
Financial Highlights
| Class C | For the Six Months Ended December 31,20151 (Unaudited) |
| Per Share Operating Performance | |
Net asset value, beginning of period | $ 12.97 |
| Income (loss) from investment operations | |
Net investment loss2 | (0.07) |
Net realized and unrealized loss | (1.52) |
Net increase from investment operations | (1.59) |
| Less distributions to shareholders: | |
Distributions from net realized capital gains | (0.18) |
Total distributions to shareholders | (0.18) |
Redemption fees | 0.00 3 |
Net asset value, end of period | $ 11.20 |
Total return | (12.23)% 4 |
| Ratios to Average Net Assets | |
Ratio of net investment loss to average net assets | (1.25)% 5 |
Ratio of expenses to average net assets: | |
Before fees waived and excluding recoupment of past waived fees | 2.23% 5 |
After fees waived and excluding recoupment of past waived fees6 | 2.23% 5 |
Including recoupment of past waived fees6 | 2.23% 5 |
| Supplemental Data | |
Net Assets, End of Period (000's) | $ 18,142 |
Portfolio Turnover Rate | 45% 4 |
| 1 | Commenced operations on July 1, 2015. |
| 2 | Per share net investment income has been calculated using the average daily shares method. |
| 3 | Less than $0.005 per share. |
| 4 | Not Annualized. |
| 5 | Annualized. |
| 6 | See Note 6 to Financial Statements. |
| Meridian Funds | 59 | www.meridianfund.com |
Table of Contents
Financial Highlights
| Investor Class | For the Six Months Ended December 31,2015 (Unaudited) | For the Fiscal Year Ended June 30,2015 | For the Period Ended June 30,20141 | ||
| Per Share Operating Performance | |||||
Net asset value, beginning of period | $ 12.97 | $ 11.65 | $ 10.00 | ||
| Income (loss) from investment operations | |||||
Net investment loss2 | (0.03) | (0.10) | (0.04) | ||
Net realized and unrealized gain/(loss) | (1.51) | 1.73 | 1.69 | ||
Net increase(decrease) from investment operations | (1.54) | 1.63 | 1.65 | ||
| Less distributions to shareholders: | |||||
Distributions from net investment income | 0.00 | (0.01) | 0.00 | ||
Distributions from net realized capital gains | (0.18) | (0.30) | 0.00 | ||
Total distributions to shareholders | (0.18) | (0.31) | 0.00 | ||
Redemption fees | 0.00 3 | 0.00 | 0.00 | ||
Net asset value, end of period | $ 11.25 | $ 12.97 | $ 11.65 | ||
Total return | (11.85)% 4 | 14.14% | 16.50% 4 | ||
| Ratios to Average Net Assets | |||||
Ratio of net investment loss to average net assets | (0.49)% 5 | (0.83)% | (0.70)% 5 | ||
Ratio of expenses to average net assets: | |||||
Before fees waived and excluding recoupment of past waived fees | 1.26% 5 | 1.33% | 3.63% 5 | ||
After fees waived and excluding recoupment of past waived fees6 | 1.26% 5 | 1.33% | 1.35% 5 | ||
Including recoupment of past waived fees6 | 1.26% 5 | 1.33% | 1.35% 5 | ||
| Supplemental Data | |||||
Net Assets, End of Period (000's) | $ 140,898 | $131,211 | $ 2,135 | ||
Portfolio Turnover Rate | 45% 4 | 44% | 78% 4 | ||
| 1 | Commenced operations on November 15, 2013. |
| 2 | Per share net investment income has been calculated using the average daily shares method. |
| 3 | Less than $0.005 per share. |
| 4 | Not Annualized. |
| 5 | Annualized. |
| 6 | See Note 6 to Financial Statements. |
| Meridian Funds | 60 | www.meridianfund.com |
Table of Contents
Notes to Financial Statements
| 1. | Organization and Significant Accounting Policies: Meridian Fund, Inc. (the “Meridian Funds” or the “Company”) comprises the following separate series: the Meridian Growth Fund (the “Growth Fund”), the Meridian Contrarian Fund (the “Contrarian Fund”), the Meridian Equity Income Fund (the “Equity Income Fund”), and the Meridian Small Cap Growth Fund (the “Small Cap Growth Fund”) (each a “Fund” and collectively, the “Funds”). The Company is registered as an open-end investment company under the Investment Company Act of 1940 and is organized as a Maryland corporation. |
| Meridian Funds offer five share classes: Legacy Class Shares, Investor Class Shares, Class A Shares, Class C Shares and Institutional Class Shares. Prior to July 1, 2015, Class A Shares were known as Advisor Class Shares. As of December 31, 2015, Institutional Class Shares of the Meridian Equity Income Fund and Meridian Contrarian Fund are not currently being offered for sale. Legacy Class Shares are available to investors who have continuously held an investment in any Meridian Fund prior to November 15, 2013. Institutional Class Shares are available to certain eligible investors including endowments, foundations and qualified retirement plans. Class A, Class C and Investor Class Shares are available for purchase through financial intermediary platforms. Class A Shares are subject to a maximum initial sales charge (frontend load) of 5.75%. Class C Shares are subject to a 1.00% contingent deferred sales charge if redeemed within one year of purchase. All Classes have identical rights and privileges with respect to the Fund in general, and exclusive voting rights with respect to Class specific matters. Net Asset Value per share may differ by class due to each class having its own expenses directly attributable to that class. Investor Class, Class A and Class C Shares are subject to shareholder servicing and sub-transfer agent fees. Class A and Class C Shares are also subject to certain expenses related to the distribution of these shares. See Note 6 for further information on additional share classes and changes to shareholder servicing and distribution plans. | |
| The primary investment objectives of the Growth Fund and Contrarian Fund are to seek long-term growth of capital. | |
| The primary investment objective of the Equity Income Fund is to seek long-term growth of capital along with income as a component of total return. | |
| The primary investment objective of the Small Cap Growth Fund is to seek long-term growth of capital by investing primarily in equity securities of small capitalization companies. |
| a. | Share Valuation: The NAV of each Fund is calculated by dividing the sum of the value of the securities held by each Fund, plus cash or other assets, minus all liabilities (including estimated accrued expenses), by the total number of shares outstanding of each Fund. The result is rounded to the nearest cent. Each Funds’ shares will not be priced on the days in which the New York Stock Exchange (NYSE) is closed for trading. |
| b. | Investment Valuations: Equity securities are valued at the closing price or last sales price on the principal exchange or market on which they are traded; or, if there were no sales that day, at the last reported bid price. |
| Fixed income (debt) securities with original or remaining maturities in excess of 60 days are valued at the mean of their quoted bid and asked prices. Short-term debt securities with 60 days or less to maturity are valued at amortized cost which approximates fair market value. | |
| Exchange-traded options are valued at the mean between the last bid and ask prices at the close of the options market in which the options trade. An exchange-traded option for which there is no mean price is valued at the last bid (long positions) or ask (short positions) price. If no bid or ask price is available, the prior day’s price will be used, unless it is determined that the prior day’s price no longer reflects the fair value of the option. | |
| Securities and other assets for which reliable market quotations are not readily available or for which a significant event has occurred since the time of the most recent market quotation, will be valued based upon other available factors deemed relevant by the Adviser under the guidelines established by, and under the general supervision and responsibility of, the Board. These factors include but are not limited to (i) attributes specific to the investment; (ii) the principal market for the investment; (iii) the customary participants in the principal market for |
| Meridian Funds | 61 | www.meridianfund.com |
Table of Contents
Notes to Financial Statements (continued)
| the investment; (iv) data assumptions by market participants for the investment, if reasonably available; (v) quoted prices for similar investments in active markets; and (vi) other factors, such as future cash flows, interest rates, yield curves, volatilities, prepayment speeds, loss severities, credit risks and/or default rates. Valuations based on such factors are reported to the Board on a quarterly basis. | |
| c. | Fair Value Measurements: As described in Note 1.b. above, the Funds utilize various methods to determine and measure the fair value of investment securities on a recurring basis. The objective of a fair value measurement is to determine the price that would be received to sell an asset or paid to transfer a liability in an orderly transaction between market participants at the measurement date (an exit price). Accordingly, the fair value hierarchy gives the highest priority to quoted prices (unadjusted) in active markets for identical assets or liabilities (Level 1) and the lowest priority to unobservable inputs (Level 3) that are significant to the fair value instrument. The three levels of the fair value hierarchy are described below: |
| Level 1 - quoted prices in active markets for identical securities; | |
| Level 2 - other significant observable inputs (including quoted prices for similar securities, interest rates, prepayment speeds, credit risk, etc.); and | |
| Level 3 - significant unobservable inputs (including the Fund’s determinations as to the fair value of investments). | |
| The inputs or methodology used for valuing securities are not necessarily an indication of the risks associated with investing in those securities. The summary of inputs used to value the Funds’ securities as of December 31, 2015 is as follows: | |
| Level 1 | Level 2 | Level 3 | Total | ||||
| Meridian Growth Fund | |||||||
| Common Stocks | |||||||
Consumer Discretionary | $ 285,961,107 | — | — | $ 285,961,107 | |||
Consumer Staples | 6,740,967 | — | — | 6,740,967 | |||
Energy | 37,235,767 | — | — | 37,235,767 | |||
Financials | 76,029,222 | — | — | 76,029,222 | |||
Health Care | 190,186,816 | — | $ 1,116,244 | 191,303,060 | |||
Industrials | 299,045,677 | — | — | 299,045,677 | |||
Information Technology | 270,410,691 | — | — | 270,410,691 | |||
| Short-Term Investments | |||||||
Repurchase Agreements | — | $ 148,416,378 | — | 148,416,378 | |||
Total Investments | $ 1,165,610,247 | $ 148,416,378 | $ 1,116,244 | $ 1,315,142,869 | |||
| Meridian Contrarian Fund | |||||||
Common Stocks1 | $ 545,385,677 | — | — | $ 545,385,677 | |||
Short-Term Investments | — | $ 44,351,847 | — | 44,351,847 | |||
Total Investments | $ 545,385,677 | $ 44,351,847 | — | $ 589,737,524 | |||
| Meridian Equity Income Fund | |||||||
| Assets: | |||||||
Common Stocks1 | $ 45,957,587 | — | — | $ 45,957,587 | |||
Corporate Bonds | — | $ 394,320 | — | 394,320 | |||
Call Options Purchased | 61,300 | — | — | 61,300 | |||
Short-Term Investments | — | 293,754 | — | 293,754 | |||
Total Investments - Assets | $ 46,018,887 | $ 688,074 | — | $ 46,706,961 | |||
| Meridian Funds | 62 | www.meridianfund.com |
Table of Contents
Notes to Financial Statements (continued)
| Level 1 | Level 2 | Level 3 | Total | ||||
| Meridian Equity Income Fund (continued) | |||||||
| Liabilities: | |||||||
Securities Sold Short | $ (1,504,250) | — | — | $ (1,504,250) | |||
Call Options Written | (13,450) | — | — | (13,450) | |||
Total Investments - Liabilities | $ (1,517,700) | — | — | $ (1,517,700) | |||
| Meridian Small Cap Growth Fund | |||||||
| Common Stocks | |||||||
Consumer Discretionary | $ 60,010,266 | — | — | $ 60,010,266 | |||
Energy | 9,202,459 | — | — | 9,202,459 | |||
Financials | 12,725,217 | — | — | 12,725,217 | |||
Health Care | 40,048,193 | — | $ 210,999 | 40,259,192 | |||
Industrials | 63,770,647 | — | — | 63,770,647 | |||
Information Technology | 52,781,375 | — | — | 52,781,375 | |||
Materials | 2,446,896 | — | — | 2,446,896 | |||
| Short-Term Investments | |||||||
Repurchase Agreements | — | $ 40,013,031 | — | 40,013,031 | |||
Total Investments | $ 240,985,053 | $ 40,013,031 | $ 210,999 | $ 281,209,083 | |||
| Meridian Growth Fund | |||||||||||
| Beginning Balance 07/01/15 | Total Purchases | Total Sales | Transfers Into Level 3 | Transfers Out of Level 3 | Ending Balance 12/31/15 | ||||||
| Investments in Securities | |||||||||||
| Common Stocks | $ — | $ 1,489,005 | $ (372,761)1 | $ — | $ — | $ 1,116,244 | |||||
| Total Level 3 | $ — | $ 1,489,005 | $ (372,761) | $ — | $ — | $ 1,116,244 | |||||
| 1 Amount decrease due to in-kind redemptions. | |||||||||||
| Meridian Small Cap Growth Fund | |||||||||||
| Beginning Balance 07/01/15 | Total Purchases | Total Sales | Transfers Into Level 3 | Transfers Out of Level 3 | Ending Balance 12/31/15 | ||||||
| Investments in Securities | |||||||||||
| Common Stocks | $ — | $ 210,999 | $ — | $ — | $ — | $ 210,999 | |||||
| Meridian Funds | 63 | www.meridianfund.com |
Table of Contents
Notes to Financial Statements (continued)
| Meridian Small Cap Growth Fund (continued) | |||||||||||
| Beginning Balance 07/01/15 | Total Purchases | Total Sales | Transfers Into Level 3 | Transfers Out of Level 3 | Ending Balance 12/31/15 | ||||||
| Total Level 3 | $ — | $ 210,999 | $ — | $ — | $ — | $ 210,999 | |||||
| d. | Investment Transactions and Investment Income: Security transactions are accounted for on the date the securities are purchased or sold (trade date). Realized gains and losses on security transactions are determined on the basis of specific identification for both financial statement and federal income tax purposes. Dividend income is recorded on the ex-dividend date. Interest income is accrued daily. |
| e. | Option writing: When the Fund writes an option, an amount equal to the premium received by the Fund is recorded as a liability and subsequently adjusted to the current fair value of the option written. Premiums received from writing options that expire unexercised are treated by the Fund on the expiration date as realized gains from investments. The difference between the premium and amount paid on effecting a closing purchase transaction, including brokerage commissions, is also treated as a realized gain or, if the premium is less than the amount paid for the closing purchase transaction, as a realized loss. If a call option is exercised, the premium is added to the proceeds from the sale of the underlying security or currency in determining whether the Fund has realized a gain or loss. If a put option is exercised, the premium reduces the cost basis of the securities purchased by the Fund. The Fund as writer of an option bears the market risk of an unfavorable change in the price of the security underlying the written option. |
| f. | Allocation of Income, Expenses, Gains and Losses: Income, gains and losses are allocated on a daily basis to each share class based on the relative proportion of the net assets of the class to each Fund’s total net assets. Expenses are allocated on the basis of relative net assets of the class to the Fund, or if an expense is specific to a share class, to that specific share class. |
| g. | Use of Estimates: The preparation of financial statements in accordance with accounting principals generally accepted in the U.S. (“GAAP”) requires management to make estimates and assumptions that affect the reported amount of assets and liabilities and revenue and expenses at the date of the financial statements. Actual amounts could differ from those estimates, and such differences could be significant. |
| h. | Foreign Currency Translation: Securities denominated in foreign currencies are converted into U.S. dollars using the spot market rate of exchange at the time of valuation. Purchases and sales of such securities and related dividend and interest income are converted into U.S. dollars using the spot market rate of exchange prevailing on the respective dates of such translations. The Funds do not separately report the effect of changes in foreign exchange rates from changes in market prices on securities held. Such changes are included in net realized and unrealized gain or loss from investments as reported in the Statement of Operations. |
| i. | Federal Income Taxes: It is the Funds’ policy to comply with the requirements of Subchapter M of the Internal Revenue Code of 1986, as amended, applicable to regulated investment companies and to distribute all of their taxable income to their shareholders; therefore, no federal income tax provision is required. |
| j. | Distributions to Shareholders: The Funds record distributions to shareholders on the ex-dividend date. The amount of distributions from net investment income and net realized capital gains are determined in accordance with federal income tax regulations which may differ from GAAP. These “book/tax” differences are either considered temporary or permanent in nature. To the extent these differences are permanent in nature, such amounts are reclassified within the capital accounts based on their federal tax-basis treatment; temporary differences do not require reclassification. |
| Distributions which exceed net investment income and net realized capital gains are reported as distributions in excess of net investment income or distributions in excess of net realized capital gains for financial reporting purposes but not for tax purposes. To the extent they exceed net investment income and net realized capital gains for tax purposes, they are reported as distributions of paid-in-capital. |
| Meridian Funds | 64 | www.meridianfund.com |
Table of Contents
Notes to Financial Statements (continued)
| k. | Guarantees and Indemnification: Under the Funds’ organizational documents, its Officers and Directors are indemnified against certain liability arising out of the performance of their duties to the Funds. Additionally, in the normal course of business, the Funds enter into contracts with service providers that contain general indemnification clauses. The Funds’ maximum exposure under these arrangements is unknown, as this would involve future claims that may be made against the Funds that have not yet occurred. However, based on experience, the Funds expect the risk of loss to be remote. |
| j. | In-Kind Redemptions: The Fund transferred securities and cash to shareholders in connection with an in-kind redemption transaction. For purposes of U.S. GAAP, these transactions were treated as a sale of securities and the resulting gains and losses were recognized based on the market value of the securities on the date of the transfer. For the six months ended December 31, 2015, the Growth Fund transacted in-kind redemptions of $379,639,733. |
| 2. | Capital Shares Transactions: Transactions in capital shares were as follows: |
| Six Months Ended December 31, 2015 | Year Ended June 30, 20151 | |||||
| Shares | Amount | Shares | Amount | |||
| Growth Fund: | ||||||
| Legacy Class | ||||||
Shares sold | 435,533 | $ 15,260,353 | 6,497,797 | $ 240,532,008 | ||
Shares issued from reinvestment of distributions | 4,193,907 | 128,417,422 | 6,062,601 | 215,889,243 | ||
Redemption fees | — | 21,844 | — | 20,823 | ||
Shares redeemed | (17,582,298) | (601,411,471) | (14,697,527) | (549,202,740) | ||
Net decrease | (12,952,858) | $(457,711,852) | (2,137,129) | $ (92,760,666) | ||
| Institutional Class | ||||||
Shares sold | 683,060 | $ 23,635,315 | 521,290 | $ 19,592,273 | ||
Shares issued from reinvestment of distributions | 145,944 | 4,467,337 | — | — | ||
Redemption fees | — | 266 | — | — | ||
Shares redeemed | (1,949) | (67,769) | (3,366) | (127,000) | ||
Net increase | 827,055 | $ 28,035,149 | 517,924 | $ 19,465,273 | ||
| Class A2 | ||||||
Shares sold | 70,080 | $ 2,420,347 | 176,885 | $ 6,547,088 | ||
Shares issued from reinvestment of distributions | 23,866 | 718,845 | 15,188 | 536,592 | ||
Redemption fees | — | 560 | — | 1,509 | ||
Shares redeemed | (59,566) | (2,037,767) | (86,276) | (3,194,129) | ||
Net increase | 34,380 | $ 1,101,985 | 105,797 | $ 3,891,060 | ||
| Class C3 | ||||||
Shares sold | 6,175 | $ 208,660 | — | $ — | ||
Shares issued from reinvestment of distributions | 519 | 15,809 | — | — | ||
Shares redeemed | — | — | — | — | ||
Net increase | 6,694 | $ 224,469 | — | $ — | ||
| Investor Class | ||||||
Shares sold | 267,072 | $ 9,265,785 | 920,727 | $ 34,143,889 | ||
Shares issued from reinvestment of distributions | 104,065 | 3,167,743 | 83,780 | 2,973,367 | ||
Redemption fees | — | 4,817 | — | 9,917 | ||
Shares redeemed | (468,495) | (16,097,438) | (382,401) | (14,102,596) | ||
Net increase/(decrease) | (97,358) | $ (3,659,093) | 622,106 | $ 23,024,577 | ||
| Meridian Funds | 65 | www.meridianfund.com |
Table of Contents
Notes to Financial Statements (continued)
| Six Months Ended December 31, 2015 | Year Ended June 30, 20151 | |||||
| Shares | Amount | Shares | Amount | |||
| Contrarian Fund: | ||||||
| Legacy Class | ||||||
Shares sold | 47,679 | $ 1,770,479 | 126,877 | $ 5,277,730 | ||
Shares issued from reinvestment of distributions | 2,597,453 | 82,832,782 | 2,985,897 | 113,941,819 | ||
Redemption fees | — | 1,901 | — | 8,643 | ||
Shares redeemed | (1,313,445) | (47,826,636) | (3,171,397) | (134,972,919) | ||
Net increase/(decrease) | 1,331,687 | $ 36,778,526 | (58,623) | $ (15,744,727) | ||
| Class A2 | ||||||
Shares sold | 411 | $ 15,800 | 13,232 | $ 582,725 | ||
Shares issued from reinvestment of distributions | 1,350 | 42,706 | 2,821 | 107,325 | ||
Shares redeemed | (2,159) | (78,449) | (10,759) | (433,410) | ||
Net increase/(decrease) | (398) | $ (19,943) | 5,294 | $ 256,640 | ||
| Class C3 | ||||||
Shares sold | 366 | $ 13,770 | — | $ — | ||
Shares issued from reinvestment of distributions | 62 | 1,960 | — | — | ||
Shares redeemed | — | — | — | — | ||
Net increase | 428 | $ 15,730 | — | $ — | ||
| Investor Class | ||||||
Shares sold | 17,315 | $ 554,073 | 3,360 | $ 141,443 | ||
Shares issued from reinvestment of distributions | 3,099 | 98,671 | 3,732 | 142,308 | ||
Redemption fees | — | 9 | — | 139 | ||
Shares redeemed | (2,695) | (98,658) | (16,549) | (727,305) | ||
Net increase/(decrease) | 17,719 | $ 554,095 | (9,457) | $ (443,415) | ||
| Meridian Funds | 66 | www.meridianfund.com |
Table of Contents
Notes to Financial Statements (continued)
| Six Months Ended December 31, 2015 | Year Ended June 30, 20151 | |||||
| Shares | Amount | Shares | Amount | |||
| Equity Income Fund: | ||||||
| Legacy Class | ||||||
Shares sold | 36,723 | $ 439,619 | 3,698,867 | $ 45,005,167 | ||
Shares issued from reinvestment of distributions | 164,032 | 1,881,451 | 490,554 | 6,112,916 | ||
Redemption fees | — | 106 | — | 198 | ||
Shares redeemed | (311,311) | (3,812,275) | (2,249,917) | (27,399,494) | ||
Net increase/(decrease) | (110,556) | $(1,491,099) | 1,939,504 | $ 23,718,787 | ||
| Class A2 | ||||||
Shares sold | 6,740 | $ 81,187 | 48,390 | $ 634,811 | ||
Shares issued from reinvestment of distributions | 1,966 | 22,468 | 1,696 | 21,110 | ||
Shares redeemed | (84) | (1,062) | (10,910) | (149,718) | ||
Net increase | 8,622 | $ 102,593 | 39,176 | $ 506,203 | ||
| Class C3 | ||||||
Shares sold | 80 | $ 1,000 | — | $ — | ||
Shares issued from reinvestment of distributions | 3 | 39 | — | — | ||
Shares redeemed | — | — | — | — | ||
Net increase | 83 | $ 1,039 | — | $ — | ||
| Investor Class | ||||||
Shares sold | 1,682 | $ 21,100 | 22,979 | $ 291,957 | ||
Shares issued from reinvestment of distributions | 739 | 8,487 | 674 | 8,412 | ||
Redemption fees | — | 2 | — | — | ||
Shares redeemed | (9,780) | (118,843) | — | — | ||
Net increase/(decrease) | (7,359) | $ (89,254) | 23,653 | $ 300,369 | ||
| Meridian Funds | 67 | www.meridianfund.com |
Table of Contents
Notes to Financial Statements (continued)
| Six Months Ended December 31, 2015 | Year Ended June 30, 20151 | |||||
| Shares | Amount | Shares | Amount | |||
| Small Cap Growth Fund: | ||||||
| Legacy Class | ||||||
Shares sold | 460,530 | $ 5,617,997 | 3,852,242 | $ 46,370,426 | ||
Shares issued from reinvestment of distributions | 55,931 | 625,306 | 70,018 | 835,314 | ||
Redemption fees | — | 1,855 | — | 1,241 | ||
Shares redeemed | (1,883,308) | (22,904,951) | (185,662) | (2,261,922) | ||
Net increase/(decrease) | (1,366,847) | $(16,659,793) | 3,736,598 | $ 44,945,059 | ||
| Institutional Class | ||||||
Shares sold | 1,188,759 | $ 14,930,148 | 1,008,763 | $ 12,908,934 | ||
Shares issued from reinvestment of distributions | 26,609 | 297,754 | — | — | ||
Redemption fees | — | 4 | — | — | ||
Shares redeemed | (60,000) | (697,838) | (4,797) | (59,239) | ||
Net increase | 1,155,368 | $ 14,530,068 | 1,003,966 | $ 12,849,695 | ||
| Class A2 | ||||||
Shares sold | 1,705,782 | $ 20,429,268 | 3,469,892 | $ 41,768,471 | ||
Shares issued from reinvestment of distributions | 65,916 | 731,663 | 45,993 | 546,859 | ||
Redemption fees | — | 2,519 | — | 4,039 | ||
Shares redeemed | (970,068) | (11,520,387) | (576,238) | (7,063,995) | ||
Net increase | 801,630 | $ 9,643,063 | 2,939,647 | $ 35,255,374 | ||
| Class C3 | ||||||
Shares sold | 1,597,420 | $ 19,283,606 | — | $ — | ||
Shares issued from reinvestment of distributions | 23,521 | 261,553 | — | — | ||
Redemption fees | — | 96 | — | — | ||
Shares redeemed | (487) | (5,701) | — | — | ||
Net increase | 1,620,454 | $ 19,539,554 | — | $ — | ||
| Investor Class | ||||||
Shares sold | 4,657,385 | $ 55,809,891 | 11,475,007 | $138,940,112 | ||
Shares issued from reinvestment of distributions | 166,693 | 1,863,626 | 65,822 | 784,601 | ||
Redemption fees | — | 16,288 | — | 58,412 | ||
Shares redeemed | (2,418,506) | (28,352,435) | (1,610,523) | (20,312,792) | ||
Net increase | 2,405,572 | $ 29,337,370 | 9,930,306 | $119,470,333 | ||
| 1 | For the twelve months ending June 30, 2015 for Legacy, Investor, and Advisor Class Shares of all Funds. For the period from December 24, 2014 for the Institutional Class Shares for the Growth and Small Cap Growth Funds. |
| 2 | On July 1, 2015, the Fund's Advisor Class Shares were redesignated as Class A Shares. |
| 3 | Commenced operations on July 1, 2015. |
| Meridian Funds | 68 | www.meridianfund.com |
Table of Contents
Notes to Financial Statements (continued)
| 3. | Investment Transactions: The cost of investments purchased and the proceeds from sales of investments, excluding short-term securities and U.S. government obligations, for the six months ended December 31, 2015, were as follows: |
| Purchases | Proceeds from Sales | ||
Growth Fund | $634,831,527 | $729,901,487 | |
Contrarian Fund | $257,760,189 | $283,686,336 | |
Equity Income Fund | $ 16,298,911 | $ 9,520,704 | |
Small Cap Growth Fund | $152,457,824 | $102,762,530 |
| 4. | Other Investment Transactions |
| a. | Restricted Securities: The Funds may invest in securities that are subject to legal or contractual restrictions on resale. Prompt sale of such securities at an acceptable price may be difficult and may involve substantial delays and additional costs. |
| b. | Securities Lending: The Funds have entered into an agreement with The Bank of New York Mellon (the “Lending Agent”), dated September 23, 2015, (“Securities Lending Agreement”), to provide securities lending services to the Funds. Under this program, the proceeds (cash collateral) received from borrowers are used to invest in money market funds or joint repurchase agreements. Under the Securities Lending Agreement, the borrowers may pay the Funds negotiated lender fees and the Funds receive cash and/or securities as collateral in an amount equal to not less than 102% of the market value of loaned securities. The borrower pays fees at the Funds’ direction to the Lending Agent. Although the risk of lending is generally mitigated by the collateral, the Funds could experience a delay in recovering securities and a possible loss of income or value if the borrower fails to return them. |
| The following table summarizes the securities received as collateral for securities lending: | |
| Collateral Type | Coupon Range | Maturity Date Range | Market Value | ||||
Growth Fund | U.S. Government Obligations | 0.00% - 5.25% | 1/7/16 - 5/15/45 | $64,995,171 | |||
Contrarian Fund | U.S. Government Obligations | 0.00% - 5.25% | 1/7/16 - 5/15/45 | 13,900,571 | |||
Equity Income Fund | U.S. Government Obligations | 0.00% - 5.25% | 1/7/16 - 5/15/45 | 555,562 | |||
Small Cap Growth Fund | U.S. Government Obligations | 0.00% - 5.38% | 1/7/16 - 5/15/45 | 10,523,160 |
| c. | Repurchase Agreements and Joint Repurchase Agreements: The Funds may enter into repurchase agreements for temporary cash management purposes provided that the value of the underlying collateral, including accrued interest, will equal or exceed the value of the repurchase agreement during the term of the agreement. The underlying collateral for all repurchase agreements is held in safekeeping by the Fund’s custodian or at the Federal Reserve Bank. If the seller defaults and the value of the collateral declines, or if bankruptcy proceedings commence with respect to the seller of the security, realization of the collateral by the Funds may be delayed or limited. |
| Additionally, the Funds may enter into joint repurchase agreements for reinvestment of cash collateral on securities lending transactions under the securities lending program offered by the Lending Agent (the “Program”), provided that the value of the underlying collateral, including accrued interest will equal or exceed the value of the joint repurchase agreement during the term of the agreement. The Funds participate on a pro rata basis with other clients of the Lending Agent in its share of the underlying collateral under such joint repurchase agreements and in its share of proceeds from any repurchase or other disposition of the underlying collateral. The underlying collateral for joint repurchase agreements is held in safekeeping by the Fund’s custodian or at the Federal Reserve Bank. If the seller defaults and the value of the collateral declines, or if bankruptcy proceedings |
| Meridian Funds | 69 | www.meridianfund.com |
Table of Contents
Notes to Financial Statements (continued)
| commence with respect to the seller of the security, realization of the collateral by the Funds may be delayed or limited. Pursuant to the Program, the Funds are indemnified for such losses by the Lending Agent. | |
| At December 31, 2015, the market value of repurchase agreements or joint repurchase agreements outstanding for the Meridian Growth Fund, Meridian Contrarian Fund, Meridian Equity Income Fund, and the Meridian Small Cap Growth Fund were $148,416,378, $44,351,847, $293,754 and $40,013,031, respectively. | |
| d. | Master Netting Arrangements: The Funds may enter into master netting agreements with their counterparties for the securities lending program and repurchase agreements, which provide the right, in the event of default (including bankruptcy or insolvency) for the non-defaulting party to liquidate the collateral and calculate net exposure to the defaulting party or request additional collateral. For financial reporting purposes, the Funds do not offset financial assets and financial liabilities that are subject to master netting agreements in the Statement of Assets and Liabilities. For securities lending transactions see Note 4.b. |
| The following table is a summary of the Funds’ open repurchase agreements that are subject to a master netting arrangement as of December 31, 2015: | |
| Assets | |||||
| Gross Amounts Presented in Statements of Assets and Liabilities | Collateral Received | Net Amount | |||
| Growth Fund | |||||
Repurchase agreement | $ 148,416,378 | $ (148,416,378)1 | $ — | ||
| Contrarian Fund | |||||
Repurchase agreement | 44,351,847 | (44,351,847) 1 | — | ||
| Equity Income Fund | |||||
Repurchase agreement | 293,754 | (293,754) 1 | — | ||
| Small Cap Growth Fund | |||||
Repurchase agreement | 40,013,031 | (40,013,031) 1 | — | ||
| 1 The amount of collateral presented is limited such that the net amount cannot be less than zero. | |||||
| e. | Options: Certain Funds purchase and write call and put options to increase or decrease their exposure to underlying instruments (including equity risk, interest rate risk and/or commodity price risk) and/or, in the case of options written, to generate gains from options premiums. A call option gives the purchaser (holder) of the option the right (but not the obligation) to buy, and obligates the seller (writer) to sell (when the option is exercised) the underlying instrument at the exercise or strike price at any time or at a specified time during the option period. A put option gives the holder the right to sell and obligates the writer to buy the underlying instrument at the exercise or strike price at any time or at a specified time during the option period. When the Funds purchase (write) an option, an amount equal to the premium paid (received) by the Funds is reflected as an asset (liability). The amount of the asset (liability) is subsequently marked-to-market to reflect the current market value of the option purchased (written). When an instrument is purchased or sold through an exercise of an option, the related premium paid (or received) is added to (or deducted from) the basis of the instrument acquired or deducted from (or added to) the proceeds of the instrument sold. When an option expires (or the Funds enter into a closing transaction), the Funds realize a gain or loss on the option to the extent of the premiums received or paid (or gain or loss to the extent the cost of the closing transaction exceeds the premiums received or paid). When the Funds write a call option, such option is “covered,” meaning that the Funds hold the underlying instrument subject to being called by the option counterparty. When the Funds write a put option, such option is covered by cash in an amount sufficient to cover the obligation. |
| In purchasing and writing options, the Funds bear the risk of an unfavorable change in the value of the underlying instrument or the risk that the Funds may not be able to enter into a closing transaction due to an illiquid market. Exercise of a written option could result in the Funds purchasing or selling a security when it otherwise would not, or at a price different from the current market value. |
| Meridian Funds | 70 | www.meridianfund.com |
Table of Contents
Notes to Financial Statements (continued)
| Transactions in options written during the six months ended December 31, 2015, were as follows: | |
| Meridian Equity Income Fund | Number of Contracts | Premiums Received | |
Options outstanding at June 30, 2015 | 72 | $ 55,831 | |
Options written | 2,023 | 290,140 | |
Options terminated in closing purchase transactions | (1,445) | (264,968) | |
Options expired | (280) | (36,623) | |
Options exercised | (200) | (20,745) | |
Options outstanding at December 31, 2015 | 170 | $ 23,635 |
| f. | Short Sales: The Funds may enter into short sales. A short sale occurs when a fund sells a security it generally does not own (the security is borrowed), in anticipation of a decline in the security’s price. The initial amount of a short sale is recorded as a liability which is marked-to-market daily. Fluctuations in the value of the short liability are recorded as unrealized gains or losses. If a Fund shorts a security when also holding a long position in the security (a “short against the box”), as the security’s price declines, the short position increases in value, offsetting the long position’s decrease in value. The opposite effect occurs if the security’s price rises. A Fund realizes a gain or loss upon closing of the short sale (returning the security to the counterparty by way of purchase or delivery of a long position owned). Possible losses from short sales may be unlimited, whereas losses from security purchases cannot exceed the total amount invested. The Funds are liable to the buyer for any dividends payable on securities while those securities are in a short position. These dividends are an expense of the Funds. The Funds designate collateral consisting of cash, U.S. government securities or other liquid assets sufficient to collateralize the market value of short positions. |
| 5. | Market and Debt Securities Risk |
| In the normal course of business, each Funds’ investment activities expose it to various types of risk associated with the financial instruments and markets in which it invests. The significant types of financial risks each Fund is exposed to include market risk and debt securities risk. Each Fund’s prospectus provides details of these and other types of risk. | |
| Market Risk: Market risk refers to the possibility that the market values of securities or other investments that a Fund holds will fall, sometimes rapidly or unpredictably, or fail to rise. Security values may fall or fail to rise because of a variety of factors affecting (or the market’s perception of) individual companies or other issuers (e.g., an unfavorable earnings report), industries or sectors, or the market as a whole, reducing the value of an investment in a Fund. Accordingly, an investment in the Fund could lose money over short or even long periods. The market values of the securities the Fund holds also can be affected by changes (or perceived changes) in U.S. or foreign economies and financial markets, and the liquidity of these securities, among other factors. In general, equity securities tend to have greater price volatility than debt securities. In addition, stock prices may be sensitive to rising interest rates, as the cost of capital rises and borrowing costs increase. As a result, the value of your investments in a Fund may be more or less than the value of your purchase price. | |
| Debt Securities Risk: Each Fund may invest in debt securities of both government and corporate issuers. A decline in prevailing levels of interest rates generally increases the value of debt securities in a Fund’s portfolio, while an increase in rates usually reduces the value of those securities. The value of a Fund’s debt securities, including bonds and convertible securities, are affected by movements in interest rates; if interest rates rise, the value of these securities may fall. Generally, the longer the average maturity of a debt security, the greater the change in its value. As a result, to the extent that a Fund invests in debt securities, interest rate fluctuations will affect the Fund’s net asset value, but not the income it receives from debt securities it owns. Debt securities are also subject to credit, liquidity risk and prepayment and extension risk. Credit risk is the risk that the entity that issued a debt security may become unable to make payments of principal and interest, and includes the risk of default. Liquidity risk is the risk that a Fund may not be able |
| Meridian Funds | 71 | www.meridianfund.com |
Table of Contents
Notes to Financial Statements (continued)
| to sell portfolio securities because there are too few buyers for them. Prepayment and extension risk is the risk that a loan, bond or other security might be called or otherwise converted, prepaid or redeemed before maturity. If a loan or security is converted, prepaid or redeemed before maturity, particularly during a time of declining interest rates or spreads, the portfolio managers may not be able to invest the proceeds in securities or loans providing as high a level of income, resulting in a reduced yield to a Fund. Conversely, as interest rates rise or spreads widen, the likelihood of prepayment decreases. The portfolio managers may be unable to capitalize on securities with higher interest rates or wider spreads because a Fund’s investments are locked in at a lower rate for a longer period of time. |
| 6. | Affiliate Transactions and Fees |
| Management Fees: Under the Investment Management Agreement, the Adviser receives the following fees for providing certain investment management and other services necessary for managing each Fund. The fee is paid monthly in arrears and calculated based on that month’s daily average net assets. | |
| Growth Fund: | Contrarian and Small Cap Growth Funds: | |||||
| Average Daily Net Assets | Investment Management Fee | Average Daily Net Assets | Investment Management Fee | |||
Up to $50,000,000 | 1.00% | Greater than $0 | 1.00% | |||
Greater than $50,000,000 | 0.75% | |||||
| Equity Income Fund: | ||
| Average Daily Net Assets | Investment Management Fee | |
Up to $10,000,000 | 1.00% | |
$10,000,001 to $30,000,000 | 0.90% | |
$30,000,001 to $50,000,000 | 0.80% | |
Greater than $50,000,000 | 0.70% | |
| Meridian Funds | 72 | www.meridianfund.com |
Table of Contents
Notes to Financial Statements (continued)
| Expense Limitation | Total Waivers and Reimbursements for the six months ended December 31, 2015 | ||
| Growth Fund | |||
Institutional Class | 0.90% | $ — | |
Class A | 1.55% | $ — | |
Class C | 2.25% | $ — | |
Investor Class | 1.30% | $ — | |
| Contrarian Fund | |||
Class A | 1.60% | $ — | |
Class C | 2.20% | $ — | |
Investor Class | 1.35% | $ — | |
| Equity Income Fund | |||
Legacy Class | 1.25% | $ — | |
Class A | 1.60% | $ — | |
Class C | 2.00% | $ — | |
Investor Class | 1.35% | $ — | |
| Small Cap Growth Fund | |||
Legacy Class | 1.20% | $ — | |
Institutional Class | 1.10% | $8,252 | |
Class A | 1.60% | $ — | |
Class C | 2.25% | $ — | |
Investor Class | 1.35% | $ — |
| Expiration June 30, | |||||||
| 2016 | 2017 | 2018 | 2019 | ||||
Growth Fund | — | — | $ 7,832 | — | |||
Contrarian Fund | — | $15,772 | 23,426 | — | |||
Equity Income Fund | $56,657 | 54,266 | 44,499 | — | |||
Small Cap Growth Fund | — | 57,740 | 51,290 | $8,252 | |||
| 7. | Directors and Officers: Certain Directors and/or Officers of the Funds are also Directors and/or Officers of the Adviser. Directors and Officers of the Funds who are Directors and/or Officers of the Adviser receive no compensation from the Funds. Each Non-Interested Director is paid an annual fee set at $40,000. An additional $5,000 is paid to each Non-Interested Director for attendance at each in-person meeting of the Board and an additional $1,000 is paid to each Non-Interested Director for participating in a telephonic meeting of the Board. An additional $3,000 is paid to each member of the Audit or Governance Committee of the Board for attendance at an in-person Audit or Governance |
| Meridian Funds | 73 | www.meridianfund.com |
Table of Contents
Notes to Financial Statements (continued)
| Committee meeting and an additional $1,000 is paid to each member of the Audit or Governance Committee of the Board for participating in a telephonic Audit or Governance Committee meeting. | |
| An additional $10,000 is paid to the Chairman of the Board and the Chairman of a Committee of the Board. The Chairman of the Board also receives an additional $2,500 for attending each in-person meeting of the Board. The Chairman of a Committee receives an additional $2,000 for attending each in person Committee meeting. |
| 8. | Distribution Information: Income and long-term capital gains distributions are determined in accordance with federal income tax regulations, which may differ from GAAP. The tax character of distributions made during the fiscal year ended June 30, 2015 is as follows: |
| 2015 Taxable Distributions | |||||
| Ordinary Income | Net Long-Term Capital Gain | Total Distributions | |||
Growth Fund | $77,347,939 | $145,847,477 | $223,195,416 | ||
Contrarian Fund | 880,964 | 116,600,237 | 117,481,201 | ||
Equity Income Fund | 635,031 | 5,594,682 | 6,229,713 | ||
Small Cap Growth Fund | 2,331,863 | — | 2,331,863 | ||
| 9. | Federal Income Taxes Information: Management has analyzed the Funds’ tax positions taken on federal income tax returns for all open tax years (current and prior three tax years), and has concluded that no provision for federal income tax is required in the Funds’ financial statements. The Funds’ federal and state income and federal excise tax returns for tax years for which the applicable statutes of limitations have not expired are subject to examination by the Internal Revenue Service and state departments of revenue. The Funds are not aware of any tax positions for which it is reasonably possible that the total amounts of unrecognized tax benefits will significantly change in the next 12 months. The Funds recognize interest and penalties, if any, related to unrecognized tax benefits as income tax expense in the Statements of Operations. During the six months ended December 31, 2015, the Funds did not incur any interest or penalties. |
| The aggregate cost of investments, unrealized appreciation and depreciation, for federal income tax purposes, at December 31, 2015 is as follows: | |
| Aggregrate Cost | Aggregrate Gross Unrealized Appreciation | Aggregrate Gross Unrealized Depreciation | Net Unrealized Appreciation/(Depreciation) | ||||
Growth Fund | $1,287,479,097 | $149,700,008 | $(122,036,236) | $27,663,772 | |||
Contrarian Fund | 540,610,343 | 78,161,296 | (29,034,114) | 49,127,182 | |||
Equity Income Fund | 45,462,107 | 5,457,450 | (4,212,596) | 1,244,854 | |||
Small Cap Growth Fund | 291,009,303 | 18,482,955 | (28,283,175) | (9,800,220) |
| 10. | Other Matters: As of April 9, 2010, the Adviser and certain affiliated entities became defendants in a lawsuit brought by another company alleging trademark infringement, unfair competition and related claims. The complaint alleges that the Adviser’s and affiliated entities’ use of their Arrowpoint trademark and the Arrowpoint logo infringes the rights of the plaintiff in various trademarks that it uses. The complaint seeks injunctive relief requiring the Adviser and the affiliated entities to cease use of the Arrowpoint trademark and logo and unspecified monetary damages, which the plaintiff claims to be unable to quantify. The Adviser has responded to the lawsuit in the United States District Court for the District of Delaware by denying the material allegations of the compliant and opposing the plaintiff’s motion for a preliminary injunction, which is now pending before the Court. |
| The Adviser believes the complaint to be without legal merit and intends to defend against it vigorously. Any legal costs associated with the compliant will be borne by the Adviser, and not the Meridian Funds. While an outcome |
| Meridian Funds | 74 | www.meridianfund.com |
Table of Contents
Notes to Financial Statements (continued)
| regarding the complaint is unknown at this time, the Adviser believes that this complaint should not have a material effect on its operations or impair its ability to perform its duties to the Meridian Funds. |
| 11. | Subsequent Events: Management has evaluated the impact of all subsequent events on the Funds through the date the financial statements were issued, and has noted no additional events that require recognition or disclosure in the financial statements. |
| Meridian Funds | 75 | www.meridianfund.com |
Table of Contents
| Meridian Funds | 76 | www.meridianfund.com |
Table of Contents
| Meridian Funds | 77 | www.meridianfund.com |
Table of Contents
Glossary of Terms Used in this Report (Unaudited)
| Meridian Funds | 78 | www.meridianfund.com |
Table of Contents
| • | Applications or other forms |
| • | Transactions with us, our affiliates, or others |
Table of Contents
P.O. Box 9792
1-800-446-6662
| • | For a fee, by writing the Public Reference Section of the Commission, Washington, D.C. 20549-1520, by electronic request at the following E-mail address: publicinfo@sec.gov, or by calling 202-551-8090 |
| • | Free from the Commission’s Website at http://www.sec.gov. |
Table of Contents
Table of Contents
Other Information (Unaudited)
(800) 446-6662
(303) 398-2929
(877) 796-3434
Arrowpoint Asset Management LLC
100 Fillmore Street, Suite 325
Denver, CO 80206
Destra Capital Investments LLC
One North Wacker Drive, 48th Floor
Chicago, IL 60606
BNY Mellon Investment Servicing (US) Inc.
760 Moore Road
King of Prussia, PA 19406
The Bank of New York Mellon
One Wall Street
New York, NY 10286
Davis Graham & Stubbs LLP
1550 Seventeenth Street, Suite 500
Denver, CO 80202
PricewaterhouseCoopers LLP
Three Embarcadero Center
San Francisco, CA 94111
James B. Glavin, Chairman
Guy M. Arnold
John S. Emrich
Michael S. Erickson
Edward F. Keely
Michael Stolper*
David Corkins, President
Derek Mullins, Treasurer
Richard Grove, Vice President, Secretary & Chief
Compliance Officer
Katie Jones, Assistant Treasurer
Table of Contents
| Item 2. | Code of Ethics. |
Not applicable.
| Item 3. | Audit Committee Financial Expert. |
Not applicable.
| Item 4. | Principal Accountant Fees and Services. |
Not applicable.
| Item 5. | Audit Committee of Listed Registrants. |
Not applicable.
| Item 6. | Investments. |
| (a) | Schedule of Investments in securities of unaffiliated issuers as of the close of the reporting period is included as part of the report to shareholders filed under Item 1 of this form. |
| Item 7. | Disclosure of Proxy Voting Policies and Procedures for Closed-End Management Investment Companies. |
Not applicable.
| Item 8. | Portfolio Managers of Closed-End Management Investment Companies. |
Not applicable.
| Item 9. | Purchases of Equity Securities by Closed-End Management Investment Company and Affiliated Purchasers. |
Not applicable.
| Item 10. | Submission of Matters to a Vote of Security Holders. |
Table of Contents
There have been no material changes to the procedures by which the shareholders may recommend nominees to the registrant’s board of directors, where those changes were implemented after the registrant last provided disclosure in response to the requirements of Item 407(c)(2)(iv) of Regulation S-K (17 CFR 229.407) (as required by Item 22(b)(15) of Schedule 14A (17 CFR 240.14a-101)), or this Item.
| Item 11. | Controls and Procedures. |
| (a) | The registrant’s principal executive and principal financial officers, or persons performing similar functions, have concluded that the registrant’s disclosure controls and procedures (as defined in Rule 30a-3(c) under the Investment Company Act of 1940, as amended (the “1940 Act”) (17 CFR 270.30a-3(c))) are effective, as of a date within 90 days of the filing date of the report that includes the disclosure required by this paragraph, based on their evaluation of these controls and procedures required by Rule 30a-3(b) under the 1940 Act (17 CFR 270.30a-3(b)) and Rules 13a-15(b) or 15d-15(b) under the Securities Exchange Act of 1934, as amended (17 CFR 240.13a-15(b) or 240.15d-15(b)). |
| (b) | There were no changes in the registrant’s internal control over financial reporting (as defined in Rule 30a-3(d) under the 1940 Act (17 CFR 270.30a-3(d)) that occurred during the registrant’s second fiscal quarter of the period covered by this report that has materially affected, or is reasonably likely to materially affect, the registrant’s internal control over financial reporting. |
| Item 12. | Exhibits. |
| (a)(1) | Not applicable. | |
| (a)(2) | Certifications pursuant to Rule 30a-2(a) under the 1940 Act and Section 302 of the Sarbanes-Oxley Act of 2002 are attached hereto. | |
| (a)(3) | Not applicable. | |
| (b) | Certifications pursuant to Rule 30a-2(b) under the 1940 Act and Section 906 of the Sarbanes Oxley Act of 2002 are attached hereto. | |
Table of Contents
SIGNATURES
Pursuant to the requirements of the Securities Exchange Act of 1934 and the Investment Company Act of 1940, the registrant has duly caused this report to be signed on its behalf by the undersigned, thereunto duly authorized.
| (Registrant) | Meridian Fund, Inc.® |
| By (Signature and Title)* | /s/ David J. Corkins | |
| David J. Corkins | ||
| Principal Executive Officer and President |
| Date | March 4, 2016 |
Pursuant to the requirements of the Securities Exchange Act of 1934 and the Investment Company Act of 1940, this report has been signed below by the following persons on behalf of the registrant and in the capacities and on the dates indicated.
| By (Signature and Title)* | /s/ David J. Corkins | |
| David J. Corkins | ||
| Principal Executive Officer and President |
| Date | March 4, 2016 |
| By (Signature and Title)* | /s/ Derek J. Mullins | |
| Derek J. Mullins | ||
| Principal Financial Officer and Treasurer |
| Date | March 4, 2016 |
| * | Print the name and title of each signing officer under his or her signature. |