Table of Contents
UNITED STATES
SECURITIES AND EXCHANGE COMMISSION
Washington, D.C. 20549
FORM N-CSR
CERTIFIED SHAREHOLDER REPORT OF REGISTERED
MANAGEMENT INVESTMENT COMPANIES
Investment Company Act file number 811-04014
Meridian Fund, Inc.®
(Exact name of registrant as specified in charter)
100 Fillmore St., Suite 325
Denver, CO 80206
(Address of principal executive offices) (Zip code)
David J. Corkins
100 Fillmore St., Suite 325
Denver, CO 80206
(Name and address of agent for service)
Registrant’s telephone number, including area code: 303-398-2929
Date of fiscal year end: June 30
Date of reporting period: December 31, 2016
Table of Contents
Item 1. Reports to Stockholders.
The Report to Shareholders is attached herewith.
Table of Contents


Table of Contents
Table of Contents
Table of Contents
Portfolio Performance and Composition (Unaudited)
| • | LPL Financial Holdings, Inc. (LPLA) is a leading financial services provider to independent advisors and RIAs. After making a significant investment in compliance technology in the first half of the year to conform to new U.S. Department of Labor (DOL) fiduciary regulations, LPL recommitted to keeping costs down in the second half of the year, leading to better than expected margins. A rising interest rate environment also supported stock gains. Although there has been recent speculation that President-elect Donald Trump may roll back the DOL rule changes, we are confident that LPL will succeed regardless of the regulatory environment. As the stock appreciated during the period, we trimmed our position. |
| • | Grand Canyon Education, Inc. (LOPE) operates Grand Canyon University, a for-profit Christian university in Phoenix, Arizona. Through its highly efficient education delivery model, the university serves more than 17,000 students at its physical campus and 75,000 students online. We like the company’s strong, mid-to-high single digit top line growth and solid operating margins. Moving forward, we see opportunities for margins to scale higher, particularly as the company nears the completion of its most recent campus expansion project. As the project winds down, capital expenditures will decline, allowing the company to substantially increase free cash flow. We expect more of the same going forward and maintained our position. |
| • | RigNet, Inc. (RNET) is a communications service provider to offshore oil rigs. With one of the better balance sheets in the small cap energy space, RigNet successfully weathered the collapse in oil prices over the last two years. A recent recovery in oil prices and stabilization in the offshore rig count during the second half of the year contributed to positive gains in the stock. We trimmed our position in the company. |
| Meridian Funds | 4 | www.meridianfund.com |
Table of Contents
Portfolio Performance and Composition (Unaudited) (continued)
| • | Endologix, Inc. (ELGX) is a medical device company that develops, manufactures, and markets minimally invasive treatments for vascular diseases. We invested in Endologix based on our belief that the company’s innovative technologies will allow it to capture an increasingly larger portion of the $2 billion market for vascular devices. Endologix lost ground after the FDA announced the need for additional follow-up data from patients in clinical trials for Nellix, its endovascular aneurysm sealing system. Other negative developments included a manufacturing issue with an endovascular device in the U.S. and the suspension of a similar device in Europe. We believe these setbacks are only temporary and the long-term potential for the company’s products remains strong. We consequently maintained our position in the stock. |
| • | Diplomat Pharmacy, Inc. (DPLO) is the nation’s largest independent specialty pharmacy. We invested in Diplomat because it was an opportunity to participate in new biotechnology discoveries without committing to a specific drug. We felt the company was well positioned to benefit from a trend in which manufacturers of specialty drugs are increasingly moving toward limited distribution. The stock sold off on news of higher than expected direct and indirect remuneration (DIR) fees charged by pharmacy benefit managers (PBMs). We exited the stock based on our discomfort with Diplomat’s lack of control over its economic destiny. |
| • | Carter’s Inc. (CRI) is the largest U.S. manufacturer of children’s apparel. Its scale advantage, strong distribution, and customer loyalty are just a few of the reasons we invest in this company. Management lowered its forward guidance during the period as reorder patterns came in slightly lower than expected. Further pressuring the stock was a decline in international shoppers at the company’s outlet stores, driven most notably by a strengthening U.S. dollar. We believe these recent issues are related to macroeconomic events, not internal execution issues, and that the stock will bounce back when consumer spending picks up. We consequently added to our position in Carter’s. |
| Meridian Funds | 5 | www.meridianfund.com |
Table of Contents
Portfolio Performance and Composition (Unaudited) (continued)
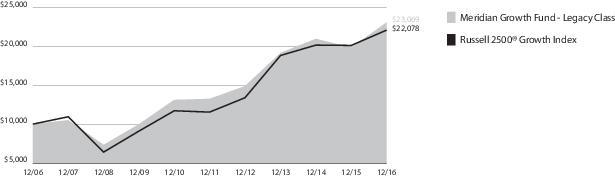
| Inception | 6 Month | 1 Year | 5 Year | 10 Year | Since Inception | |
| Legacy Class (MERDX) | 8/1/84 | 9.13% | 16.28% | 11.69% | 8.72% | 12.33% |
| Institutional Class (MRRGX) | 12/24/14 | 9.14% | 16.29% | — | — | 4.75% |
| Class A (MRAGX) w/o sales charge | 11/15/13 | 8.96% | 15.89% | — | — | 7.01% |
| Class A (MRAGX) with sales charge1 | 11/15/13 | 2.69% | 9.23% | — | — | 5.00% |
| Class C (MRCGX) | 7/1/15 | 8.58% | 15.10% | — | — | 2.84% |
| Investor Class (MRIGX) | 11/15/13 | 9.10% | 16.19% | — | — | 7.40% |
| Russell 2500® Growth Index | 8/1/84 | 9.76% | 9.73% | 13.88% | 8.24% | N/A 2 |
| 1 | Assuming maximum sales charge, if any. Class A Shares are subject to a maximum initial sales charge of 5.75%. |
| 2 | Inception date of Russell 2500® Growth Index is July 1, 1995. |
| Meridian Funds | 6 | www.meridianfund.com |
Table of Contents
Portfolio Performance and Composition (Unaudited) (continued)
12.31.16
| ServiceMaster Global Holdings, Inc. | 2.89% |
| Sally Beauty Holdings, Inc. | 2.81% |
| CEB, Inc. | 2.32% |
| Cadence Design Systems, Inc. | 2.25% |
| LPL Financial Holdings, Inc. | 2.25% |
| Sensata Technologies Holding N.V. (Netherlands) | 2.24% |
| Clean Harbors, Inc. | 2.22% |
| INC Research Holdings, Inc. Class A | 2.19% |
| TriNet Group, Inc. | 2.05% |
| HEICO Corp. Class A | 2.03% |
| Meridian Funds | 7 | www.meridianfund.com |
Table of Contents
Portfolio Performance and Composition (Unaudited)
| • | Nvidia Corp. (NVDA) is the dominant provider of visual computing technologies used for PC based video games and is expanding into new markets in enterprise computing and automotive. We originally invested in the company after management significantly increased research & development spending in order to enter the mobile, automotive, and enterprise markets. These investments depressed earnings, and investors were initially disappointed with failed product launches in cell phones and tablets. However, we viewed Nvidia’s technology as highly differentiated, and felt that there were excellent opportunities outside of mobile devices. Stock performance during the period was driven by another solid earnings report, supported by exceptional demand for computing platforms used in artificial intelligence and deep learning, continued growth in PC gaming industry and sales of chips for automotive infotainment systems. Based on the market opportunities in auto and deep learning, we continue to hold shares. |
| • | Citizens Financial Group, Inc. (CFG) is a commercial bank in the northeastern United States with $150 billion in total assets. As a subsidiary of the Royal Bank of Scotland, Citizens had over extended its home equity portfolio and experienced credit issues during the housing crisis. However, at the time of its spinoff, the credit issues had run their course and the bank had a number of meaningful levers to drive earnings growth, including an over capitalized balance sheet, a plan to reduce expenses, and growing fee based businesses in wealth management. |
| Meridian Funds | 8 | www.meridianfund.com |
Table of Contents
Portfolio Performance and Composition (Unaudited) (continued)
| In addition, Citizen’s positioning as an asset sensitive bank provided an opportunity for earnings upside should interest rates move higher off historically low levels. Over the past few years, Citizens has made steady progress deploying capital and improving its cost structure, but during the period shares performed especially well due to the significant jump in interest rates. We continue to hold shares in Citizens as the company is in the early innings of its turn and still has room to improve its capital deployment, expense structure, and net interest margin. | |
| • | CACI International, Inc. (CACI) is a $3.5 billion provider of IT services for US government agencies, with a particular focus on defense and intelligence. Strong share performance over the past year continued as the company emerges from multiple years of revenue and earnings pressure caused by flat defense budgets and military drawdowns in the Middle East. CACI is benefitting from both an improving federal government spending environment, especially for the defense and intelligence programs, as well as the company’s own internal initiative that is focused on winning larger value contracts. This strategy has been successful, evidenced by a significant increase in new contract wins, resulting in a nearly 50% growth in the value of revenue backlog. We believe CACI’s return to growth is in the early stages - CACI should continue to win share in new contract awards, and defense and intelligence spending is budgeted to grow for the first time since 2011. |
| • | Endologix, Inc. (ELGX) is a medical device manufacturer focused on the abdominal aortic aneurism (AAA) market. We originally invested when the company was experiencing the simultaneous problems of slowing sales for its legacy product called AFX and high investment of its next generation product called Nellix. We liked the company’s growing position in the AAA market and felt that Nellix had the potential to be a game changing solution for AAA patients, resulting in the a potential doubling of the company’s revenue over the next 5 years. During the period shares underperformed as Nellix clinical trial data pointed to a much narrower market opportunity for the product and investors reacted accordingly. As we evaluated the change in long-term potential for the Nellix as well as signs of a continued slowdown for the AFX product, we felt the shares do not reflect a compelling risk/reward at this time. We will continue to monitor Endologix for signs of Nellix sales traction upon product approval. |
| • | Pacific Biosciences of California, Inc. (PACB) is a manufacturer of DNA sequencing technology used to analyze the genetic composition of everything from humans to viruses. The company offers unique form of sequencing called “long read” that is able to examine areas of the genome previously left unexplored by industry leader Illumina. However, the technology has traditionally been expensive, and scientists are unsure about how to exploit the company’s capabilities. We purchased the shares because of a new product cycle that drastically reduces the costs of PACB technology as well as a rising recognition that long read sequencing yields valuable information to both researchers who want to develop a more detailed map of genomes, and in clinical areas such as HLA testing for organ transplants. During the period, shares underperformed due to the termination of a distribution relationship with global diagnostics leader Roche. While the termination of this relationship raises concerns, we think the secular tailwind behind long read sequencing in the academic research market is strong, and PACB now has a tremendous opportunity to expand its reach into the clinical settings that had previously been Roche domain. We added slightly to our position during the period and are looking for confirmation of continued growth to purchase more shares. |
| • | Juno Therapeutics, Inc. (JUNO) is an innovative biotech company that focuses on an immune-oncology process called CAR-T therapy, which engineers a patient’s own t-cells to attack cancer. We invested in Juno after a series of patient deaths occurred in Juno’s clinical trial for acute lymphoblastic leukemia (ALL), resulting in a sharp correction in the shares. Despite these unfortunate events, we invested in Juno due to the company’s approach to using a newer technology which has demonstrated much promise. The new approach has also shown higher efficacy and less side effects than similar therapies currently being developed. Unfortunately, during the period, shares were hit again as two more patients from the ALL trial experienced lethal toxicity. We continue to hold shares in Juno due to the promise of its next generation product, currently being tested in non-Hodgkin lymphoma (NHL). Recent preliminary trial results in NHL point to extremely promising efficacy, and we think that Juno is well positioned to gain significant share in NHL therapy. We also believe Juno’s work in other blood cancers and solid tumors provides a significant free option opportunity for the shares. |
| Meridian Funds | 9 | www.meridianfund.com |
Table of Contents
Portfolio Performance and Composition (Unaudited) (continued)

| Inception | 6 Month | 1 Year | 5 Year | 10 Year | Since Inception | |
| Legacy Class (MVLAX) | 2/10/94 | 15.30% | 16.59% | 13.60% | 6.87% | 12.68% |
| Class A (MFCAX) w/o sales charge | 11/15/13 | 15.02% | 16.07% | — | — | 6.56% |
| Class A (MFCAX) with sales charge1 | 11/15/13 | 8.40% | 9.39% | — | — | 4.56% |
| Class C (MFCCX) | 7/1/15 | 14.70% | 15.43% | — | — | 4.02% |
| Investor Class (MFCIX) | 11/15/13 | 15.18% | 16.40% | — | — | 6.85% |
| Russell 2500® Index | 2/10/94 | 13.09% | 17.59% | 14.54% | 7.69% | 10.21% |
| S&P 500® Index | 2/10/94 | 7.82% | 11.94% | 14.65% | 6.94% | 9.14% |
| 1 | Assuming maximum sales charge, if any. Class A Shares are subject to a maximum initial sales charge of 5.75%. |
| Meridian Funds | 10 | www.meridianfund.com |
Table of Contents
Portfolio Performance and Composition (Unaudited) (continued)
12.31.16
| NVIDIA Corp. | 5.81% |
| Microsoft Corp. | 4.09% |
| Citizens Financial Group Inc. | 3.82% |
| Alexander & Baldwin, Inc. | 3.44% |
| EOG Resources, Inc. | 3.30% |
| CACI International, Inc. Class A | 3.28% |
| U.S. Bancorp | 3.11% |
| Xylem, Inc. | 2.69% |
| TOTAL SA ADR | 2.59% |
| Verint Systems, Inc. | 2.53% |
| Meridian Funds | 11 | www.meridianfund.com |
Table of Contents
Portfolio Performance and Composition (Unaudited)
| • | Nvidia Corp. (NVDA) is a global leader in visual computing technologies and a key holding within the portfolio’s digital world allocation. What we like most about the chipmaker is its cutting-edge technology and dominant share in a small but rapidly growing enterprise market. In recent years Nvidia has built out its product road map and broadened the applications for its graphics processing units (GPUs), which quickly compute large volumes of information in parallel, or simultaneously. Today, the company’s GPUs are the preferred technology for machine learning, big data, and artificial intelligence. We continue to hold a sizable position in the company due to our confidence in the accelerative growth opportunities for Nvidia. |
| • | CRC 8% 12/15/22 are second lien notes for California Resources Corporation (CRC), an oil and natural gas exploration and drilling company in which we also own stock. Our investment in CRC’s debt was driven by our desire to diversify the portfolio through a high-quality, income-producing investment. We believed that, when oil prices rebounded, the liens would recover to par value. In 2016, oil prices increased 45.95%, and the liens |
| Meridian Funds | 12 | www.meridianfund.com |
Table of Contents
Portfolio Performance and Composition (Unaudited) (continued)
| recovered to 89.00% of par value from a low in February of 19.94%. Our success with CRC demonstrates our team’s ability to work across the capital structure to understand both the equity and debt used to finance a business and to identify what we believe are the best investment opportunities available through a company. | |
| • | Microsoft Corp. (MSFT) is the leader in cloud computing, second only to Amazon.com (which we own). It also is a top holding among the on-demand ubiquitous computing companies we own. Lower costs, higher security, and a host of other benefits are convincing more companies to move their businesses to the cloud. Microsoft AZURE, the company’s cloud-based services platform, is a beneficiary of this trend and is steadily growing market share. During the most recent quarter, the company reported 121% year-over-year growth for AZURE, up from 108% last quarter. Its commercial cloud segment is now generating $13 billion in revenue annually, with a goal of $20 billion in 2018. We are optimistic Microsoft can reach this goal and therefore maintain a large position in the stock. |
| • | VMware, Inc. (VMW) provides virtualization software and services to companies that want to maintain their own data center operations onsite versus in the cloud. We hold a short position in VMware due to our belief that, as companies increasingly move to the cloud for their enterprise applications, demand for VMware’s software and services will decline. In addition, we expect that a new technology from competitor Docker will create challenges for VMware. Our thesis did not play out during the most recent quarter and VMware reported better-than-expected financial results and raised full-year guidance on total and license revenues. The company’s strong results were driven by growth in new products and a slower decline in its virtualization software. We continue to believe that tougher days are ahead for VMware and maintained our short position, which is one of several that provide the portfolio a measure of defense. |
| • | Royal Gold, Inc. (RGLD) is a precious metals company with royalty claims on gold, silver, copper, lead and zinc at mines in over 20 countries. The company has an exceptional business model and provides us with a unique opportunity to get exposure to gold without operational risk (it does not directly own mines). Royal Gold essentially pays miners upfront for the right to buy their metals at reduced prices later and typically gets an 8% return on a flat price. It is a beneficiary of ounces growth and has pricing power. The stock was hurt by a decline in the price of gold, especially post-election, as investor sentiment turned positive and the dollar strengthened. A tightening monetary policy in the U.S. also hurt the performance of the precious metal. Nonetheless, we continue to believe Royal Gold is a good defensive play and will support portfolio performance during periods of market volatility. We consequently maintained our position. |
| • | Gilead Sciences (GILD) is a research-based biopharmaceutical company that discovers, develops, and commercializes therapeutics for patients suffering from life-threatening diseases. The company has a very strong HIV franchise and has developed a cure for Hepatitis-C. However, because patients are cured of Hepatitis-C after only 12-weeks of taking the drug, other drugs developed by Gilead for longer-term treatment of the disease are no longer needed, essentially eliminating the recurring revenue stream they produced. Revenue at the company has consequently declined and growth has slowed. Rhetoric from the U.S. presidential election and drug pricing also weighed heavily on the stock during the period. Despite Gilead’s recent weak performance, it has generated a tremendous amount of free cash flow and is buying back stock and paying larger dividends. We have consequently maintained our position in the stock. |
| Meridian Funds | 13 | www.meridianfund.com |
Table of Contents
Portfolio Performance and Composition (Unaudited) (continued)
| Inception | 6 Month | 1 Year | 5 Year | 10 Year | Since Inception | |
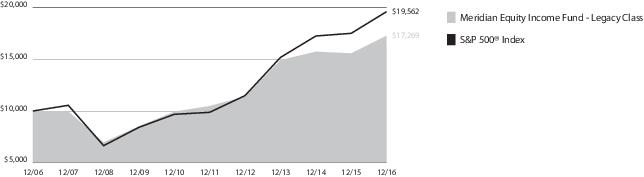
| Legacy Class (MEIFX) | 1/31/05 | 9.72% | 11.15% | 10.51% | 5.62% | 6.79% |
| Class A (MRAEX) w/o sales charge | 11/15/13 | 9.59% | 10.74% | — | — | 5.24% |
| Class A (MRAEX) with sales charge1 | 11/15/13 | 3.33% | 4.35% | — | — | 3.25% |
| Class C (MRCEX) | 7/1/15 | 9.43% | 10.29% | — | — | 2.94% |
| Investor Class (MRIEX) | 11/15/13 | 9.74% | 11.08% | — | — | 5.49% |
| S&P 500® Index | 1/31/05 | 7.82% | 11.94% | 14.65% | 6.94% | 7.76% |
| 1 | Assuming maximum sales charge, if any. Class A Shares are subject to a maximum initial sales charge of 5.75%. |
| Meridian Funds | 14 | www.meridianfund.com |
Table of Contents
Portfolio Composition (Unaudited)
12.31.16
| California Resources Corp. 8.00%, 12/15/22 | 10.08% |
| Apple, Inc. | 4.85% |
| Microsoft Corp. | 4.81% |
| NVIDIA Corp. | 4.47% |
| Equifax, Inc. | 4.06% |
| Royal Gold, Inc. | 3.98% |
| QUALCOMM, Inc. | 3.69% |
| Facebook, Inc. Class A | 3.61% |
| United Parcel Service, Inc. Class B | 3.60% |
| Starbucks Corp. | 3.49% |

| Meridian Funds | 15 | www.meridianfund.com |
Table of Contents
Portfolio Performance and Composition (Unaudited)
| • | Evolution Petroleum Corp. (EPM) is an energy company with royalty and working interests in Louisiana’s Delhi Field, which is controlled by the oil and gas producer Denbury Resources. Evolution’s royalty-based business model translates to low expenses, no debt, and positive free cash flow. As a result, when oil prices increase - as they did during the period - the flow through margin recognized by the company is extremely high. Other positives for the stock included a $28 million payment from Denbury Resources as part of a settlement to end a contract dispute. This strengthened the company’s balance sheet even further. Although we trimmed our position as the stock gained, we remain invested. |
| • | Carbonite, Inc. (CARB) provides individuals and small businesses with data backup, recovery, and archiving solutions. Two of the reasons we like the company are its low cost position in the market and open ended growth in the small business segment. The company’s recent outperformance has been driven by growth in this small business segment, while simultaneously keeping its consumer segment roughly flat. Carbonite’s strategy to shift its business focus away from consumers toward small and micro-sized businesses should be more profitable due to higher subscription renewal rates, higher average selling prices, and improved margins. With low single-digit penetration in these markets thus far, we believe there is room for Carbonite to grow, but recent outperformance led us to trim the position slightly. |
| • | Grand Canyon Education, Inc. (LOPE) operates Grand Canyon University, a for-profit Christian university in Phoenix, Arizona. Through its highly efficient education delivery model, the university serves more than 17,000 students at its physical campus and 75,000 students online. We like the company’s strong, mid-to-high single digit top line growth and solid operating margins. Moving forward, we see opportunities for margins to scale higher, |
| Meridian Funds | 16 | www.meridianfund.com |
Table of Contents
Portfolio Performance and Composition (Unaudited) (continued)
| particularly as the company nears the completion of its most recent campus expansion project. As the project winds down, capital expenditures will decline, allowing the company to substantially increase free cash flow. We expect more of the same going forward and maintained our position. |
| • | Endologix, Inc. (ELGX) is a medical device company that develops, manufactures, and markets minimally invasive treatments for vascular diseases. We invested in Endologix based on our belief that the company’s innovative technologies will allow it to capture an increasingly larger portion of the $2 billion market for vascular devices. Endologix lost ground after the FDA announced the need for additional follow-up data from patients in clinical trials for Nellix, its endovascular aneurysm sealing system. Other negative developments included a manufacturing issue with an endovascular device in the U.S. and the suspension of a similar device in Europe. We believe these setbacks are only temporary and the long-term potential for the company’s products remains strong. We consequently maintained our position in the stock. |
| • | Diplomat Pharmacy, Inc. (DPLO) is a medical device company that develops, manufactures, and markets minimally invasive treatments for vascular diseases. We invested in Endologix based on our belief that the company’s innovative technologies will allow it to capture an increasingly larger portion of the $2 billion market for vascular devices. Endologix lost ground after the FDA announced the need for additional follow-up data from patients in clinical trials for Nellix, its endovascular aneurysm sealing system. Other negative developments included a manufacturing issue with an endovascular device in the U.S. and the suspension of a similar device in Europe. We believe these setbacks are only temporary and the long-term potential for the company’s products remains strong. We consequently maintained our position in the stock. |
| • | Pacific Biosciences of California, Inc. (PACB) is a leader in the field of next-generation gene sequencing technology. Our excitement about this company is tied to its proprietary Single Molecule, Real-Time (SMRT) sequencing technology which provides the longest read lengths and highest accuracy. Through its razor-razorblade business model, the company sells its gene sequencing and benefits longer term from selling the reagents and consumables used to complete the gene readings. The stock declined on news that Roche Diagnostics had terminated its partnership with Pacific Biosciences to commercialize the Sequel™ System for clinical applications. We continue to believe the outlook remains promising as the company continues to improve its throughput and efficiency to lower the overall cost of gene sequencing to penetrate the academic and clinical markets. |
| Meridian Funds | 17 | www.meridianfund.com |
Table of Contents
Portfolio Performance and Composition (Unaudited) (continued)
| Inception | 6 Month | 1 Year | 5 Year | 10 Year | Since Inception | |
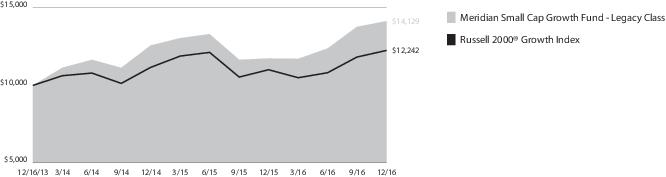
| Legacy Class (MSGGX) | 12/16/13 | 14.24% | 20.43% | — | — | 12.04% |
| Institutional Class (MSGRX) | 12/24/14 | 14.39% | 20.59% | — | — | 6.21% |
| Class A (MSGAX) w/o sales charge | 12/16/13 | 14.03% | 19.95% | — | — | 11.63% |
| Class A (MSGAX) with sales charge1 | 12/16/13 | 7.45% | 13.07% | — | — | 9.48% |
| Class C (MSGCX) | 7/1/15 | 13.71% | 19.20% | — | — | 3.05% |
| Investor Class (MISGX) | 12/16/13 | 14.26% | 20.36% | — | — | 11.98% |
| Russell 2000® Growth Index | 12/16/13 | 13.12% | 11.32% | 13.74% | 7.76% | 6.46% |
| 1 | Assuming maximum sales charge, if any. Class A Shares are subject to a maximum initial sales charge of 5.75%. |
| Meridian Funds | 18 | www.meridianfund.com |
Table of Contents
Portfolio Composition (Unaudited)
12.31.16
| Sally Beauty Holdings, Inc. | 2.72% |
| Heritage-Crystal Clean, Inc. | 2.39% |
| CEB, Inc. | 2.29% |
| INC Research Holdings, Inc. Class A | 2.11% |
| Evolution Petroleum Corp. | 2.01% |
| InnerWorkings, Inc. | 1.88% |
| Grand Canyon Education, Inc. | 1.82% |
| TriNet Group, Inc. | 1.81% |
| Wolverine World Wide, Inc. | 1.61% |
| Bats Global Markets, Inc. | 1.60% |

| Meridian Funds | 19 | www.meridianfund.com |
Table of Contents
| Actual | Annualized Expense Ratio | Beginning Account Value July 1, 2016 | Ending Account Value December 31, 2016 | Expenses Paid During the Period 1 |
| Legacy Class (MERDX) | 0.87% | $1,000.00 | $1,091.30 | $4.56 |
| Institutional Class (MRRGX) | 0.87% | $1,000.00 | $1,091.40 | $4.56 |
| Class A (MRAGX) 2 | 1.18% | $1,000.00 | $1,089.60 | $6.18 |
| Class C (MRCGX) 3 | 1.91% | $1,000.00 | $1,085.80 | $9.99 |
| Investor Class (MRIGX) | 0.94% | $1,000.00 | $1,091.00 | $4.93 |
| Hypothetical 4 | Annualized Expense Ratio | Beginning Account Value July 1, 2016 | Ending Account Value December 31, 2016 | Expenses Paid During the Period 1 |
| Legacy Class (MERDX) | 0.87% | $1,000.00 | $1,020.71 | $4.41 |
| Institutional Class (MRRGX) | 0.87% | $1,000.00 | $1,020.71 | $4.41 |
| Class A (MRAGX) 2 | 1.18% | $1,000.00 | $1,019.15 | $5.97 |
| Class C (MRCGX) 3 | 1.91% | $1,000.00 | $1,015.49 | $9.65 |
| Investor Class (MRIGX) | 0.94% | $1,000.00 | $1,020.36 | $4.76 |
| 1 | Expenses are equal to the Fund’s annualized expense ratio multiplied by the average account value over the period, multiplied by 184 days, the number of days in the most recent fiscal half-year, then divided by 365. |
| 2 | On July 1, 2015, the Fund’s Advisor Class Shares were redesignated as Class A Shares. |
| 3 | Commenced operations on July 1, 2015. |
| 4 | Hypothetical 5% return before expenses. |
| Meridian Funds | 20 | www.meridianfund.com |
Table of Contents
| Actual | Annualized Expense Ratio | Beginning Account Value July 1, 2016 | Ending Account Value December 31, 2016 | Expenses Paid During the Period 1 |
| Legacy Class (MVALX) | 1.13% | $1,000.00 | $1,153.70 | $ 6.10 |
| Class A (MFCAX) 2 | 1.60% | $1,000.00 | $1,150.20 | $ 8.62 |
| Class C (MFCCX) 3 | 2.15% | $1,000.00 | $1,147.00 | $11.57 |
| Investor Class (MFCIX) | 1.35% | $1,000.00 | $1,151.80 | $ 7.28 |
| Hypothetical 4 | Annualized Expense Ratio | Beginning Account Value July 1, 2016 | Ending Account Value December 31, 2016 | Expenses Paid During the Period 1 |
| Legacy Class (MVALX) | 1.13% | $1,000.00 | $1,019.40 | $ 5.72 |
| Class A (MFCAX) 2 | 1.60% | $1,000.00 | $1,017.05 | $ 8.09 |
| Class C (MFCCX) 3 | 2.15% | $1,000.00 | $1,014.29 | $10.86 |
| Investor Class (MFCIX) | 1.35% | $1,000.00 | $1,018.30 | $ 6.83 |
| 1 | Expenses are equal to the Fund’s annualized expense ratio multiplied by the average account value over the period, multiplied by 184 days, the number of days in the most recent fiscal half-year, then divided by 365. |
| 2 | On July 1, 2015, the Fund’s Advisor Class Shares were redesignated as Class A Shares. |
| 3 | Commenced operations on July 1, 2015. |
| 4 | Hypothetical 5% return before expenses. |
| Meridian Funds | 21 | www.meridianfund.com |
Table of Contents
| Actual | Annualized Expense Ratio | Beginning Account Value July 1, 2016 | Ending Account Value December 31, 2016 | Expenses Paid During the Period 1 |
| Legacy Class (MEIFX) | 1.39% | $1,000.00 | $1,097.20 | $ 7.31 |
| Class A (MRAEX) 2 | 1.74% | $1,000.00 | $1,095.90 | $ 9.14 |
| Class C (MRCEX) 3 | 2.14% | $1,000.00 | $1,094.30 | $11.24 |
| Investor Class (MRIEX) | 1.49% | $1,000.00 | $1,097.40 | $ 7.83 |
| Hypothetical 4 | Annualized Expense Ratio | Beginning Account Value July 1, 2016 | Ending Account Value December 31, 2016 | Expenses Paid During the Period 1 |
| Legacy Class (MEIFX) | 1.39% | $1,000.00 | $1,018.10 | $ 7.03 |
| Class A (MRAEX) 2 | 1.74% | $1,000.00 | $1,016.34 | $ 8.80 |
| Class C (MRCEX) 3 | 2.14% | $1,000.00 | $1,014.34 | $10.81 |
| Investor Class (MRIEX) | 1.49% | $1,000.00 | $1,017.60 | $ 7.54 |
| 1 | Expenses are equal to the Fund’s annualized expense ratio multiplied by the average account value over the period, multiplied by 184 days, the number of days in the most recent fiscal half-year, then divided by 365. |
| 2 | On July 1, 2015, the Fund’s Advisor Class Shares were redesignated as Class A Shares. |
| 3 | Commenced operations on July 1, 2015. |
| 4 | Hypothetical 5% return before expenses. |
| Meridian Funds | 22 | www.meridianfund.com |
Table of Contents
| Actual | Annualized Expense Ratio | Beginning Account Value July 1, 2016 | Ending Account Value December 31, 2016 | Expenses Paid During the Period 1 |
| Legacy Class (MSGGX) | 1.20% | $1,000.00 | $1,142.40 | $ 6.44 |
| Institutional Class (MSGRX) | 1.10% | $1,000.00 | $1,143.90 | $ 5.91 |
| Class A (MSGAX) 2 | 1.53% | $1,000.00 | $1,140.30 | $ 8.21 |
| Class C (MSGCX) 3 | 2.19% | $1,000.00 | $1,137.10 | $11.73 |
| Investor Class (MISGX) | 1.18% | $1,000.00 | $1,142.60 | $ 6.34 |
| Hypothetical 4 | Annualized Expense Ratio | Beginning Account Value July 1, 2016 | Ending Account Value December 31, 2016 | Expenses Paid During the Period 1 |
| Legacy Class (MSGGX) | 1.20% | $1,000.00 | $1,019.05 | $ 6.07 |
| Institutional Class (MSGRX) | 1.10% | $1,000.00 | $1,019.55 | $ 5.57 |
| Class A (MSGAX) 2 | 1.53% | $1,000.00 | $1,017.40 | $ 7.74 |
| Class C (MSGCX) 3 | 2.19% | $1,000.00 | $1,014.09 | $11.06 |
| Investor Class (MISGX) | 1.18% | $1,000.00 | $1,019.15 | $ 5.97 |
| 1 | Expenses are equal to the Fund’s annualized expense ratio multiplied by the average account value over the period, multiplied by 184 days, the number of days in the most recent fiscal half-year, then divided by 365. |
| 2 | On July 1, 2015, the Fund’s Advisor Class Shares were redesignated as Class A Shares. |
| 3 | Commenced operations on July 1, 2015. |
| 4 | Hypothetical 5% return before expenses. |
| Meridian Funds | 23 | www.meridianfund.com |
Table of Contents
Performance and Expense Disclosures
| Meridian Funds | 24 | www.meridianfund.com |
Table of Contents
Schedule of Investments
| Shares | Value | |
| Common Stocks - 93.1% | ||
| Consumer Discretionary - 20.7% | ||
| Diversified Consumer Services - 4.6% | ||
| Grand Canyon Education, Inc.1 | 399,055 | $ 23,324,765 |
| ServiceMaster Global Holdings, Inc.1 | 1,006,253 | 37,905,550 |
| 61,230,315 | ||
| Hotels, Restaurants & Leisure - 1.5% | ||
| Dunkin' Brands Group, Inc.2 | 367,173 | 19,254,552 |
| Leisure Products - 1.2% | ||
| Polaris Industries, Inc.2 | 188,960 | 15,568,414 |
| Media - 2.0% | ||
| National CineMedia, Inc. | 1,779,738 | 26,215,541 |
| Specialty Retail - 7.8% | ||
| Dick's Sporting Goods, Inc. | 244,147 | 12,964,206 |
| DSW, Inc. Class A2 | 416,945 | 9,443,804 |
| Five Below, Inc.1,2 | 383,938 | 15,342,163 |
| Hibbett Sports, Inc.1,2 | 505,549 | 18,856,978 |
| Monro Muffler Brake, Inc.2 | 156,627 | 8,959,064 |
| Sally Beauty Holdings, Inc.1,2 | 1,397,026 | 36,909,427 |
| 102,475,642 | ||
| Textiles, Apparel & Luxury Goods - 3.6% | ||
| Carter's, Inc. | 298,261 | 25,766,768 |
| Wolverine World Wide, Inc. | 998,663 | 21,920,653 |
| 47,687,421 | ||
| Total Consumer Discretionary | 272,431,885 | |
| Energy - 1.9% | ||
| Energy Equipment & Services - 1.9% | ||
| Dril-Quip, Inc.1,2 | 102,388 | 6,148,399 |
| RigNet, Inc.1 | 786,525 | 18,208,054 |
| Total Energy | 24,356,453 | |
| Financials - 6.5% | ||
| Capital Markets - 5.7% | ||
| Bats Global Markets, Inc. | 420,992 | 14,107,442 |
| Financial Engines, Inc.2 | 503,166 | 18,491,350 |
| LPL Financial Holdings, Inc.2 | 839,202 | 29,548,302 |
| WisdomTree Investments, Inc.2 | 1,112,333 | 12,391,390 |
| 74,538,484 | ||
| Commercial Banks - 0.8% | ||
| Bank of the Ozarks, Inc.2 | 196,123 | 10,314,109 |
| Total Financials | 84,852,593 | |
| Health Care - 20.3% | ||
| Biotechnology - 3.1% | ||
| Alnylam Pharmaceuticals, Inc.1,2 | 187,441 | 7,017,791 |
| Atara Biotherapeutics, Inc. 1,2 | 307,706 | 4,369,425 |
| Bluebird Bio, Inc.1,2 | 110,990 | 6,848,083 |
| Shares | Value | |
| DBV Technologies SA ADR (France)1,2 | 186,154 | $ 6,539,590 |
| Dyax Corp. CVR1 | 316,946 | 351,810 |
| Exact Sciences Corp.1,2 | 720,361 | 9,624,023 |
| Neurocrine Biosciences, Inc.1 | 166,884 | 6,458,411 |
| 41,209,133 | ||
| Health Care Equipment & Supplies - 8.6% | ||
| ABIOMED, Inc.1 | 63,669 | 7,174,223 |
| Align Technology, Inc.1 | 71,262 | 6,850,416 |
| Cooper Cos., Inc. (The) | 98,688 | 17,263,492 |
| DexCom, Inc.1,2 | 151,815 | 9,063,356 |
| Endologix, Inc.1,2 | 1,480,030 | 8,465,772 |
| Insulet Corp.1 | 217,178 | 8,183,267 |
| Nevro Corp. 1,2 | 100,908 | 7,331,975 |
| Novadaq Technologies, Inc.1,2 | 980,527 | 6,951,936 |
| Quidel Corp.1 | 298,579 | 6,395,562 |
| Spectranetics Corp. (The)1,2 | 602,398 | 14,758,751 |
| STERIS Plc1,2 | 304,007 | 20,487,032 |
| 112,925,782 | ||
| Health Care Providers & Services - 1.9% | ||
| MEDNAX 1 | 210,004 | 13,998,866 |
| Patterson Cos, Inc.2 | 275,393 | 11,299,375 |
| 25,298,241 | ||
| Health Care Technology - 1.6% | ||
| athenahealth, Inc.1,2 | 106,432 | 11,193,453 |
| Medidata Solutions, Inc.1 | 187,404 | 9,308,357 |
| 20,501,810 | ||
| Life Sciences Tools & Services - 2.2% | ||
| INC Research Holdings, Inc. Class A1 | 546,005 | 28,719,863 |
| Pharmaceuticals - 2.9% | ||
| Catalent Inc. 1 | 563,489 | 15,191,664 |
| Moderna Therapeutics , Inc. Acquisition Date: 8/8/16, Cost $5,764,9481,3,4 | 656,600 | 5,764,948 |
| Prestige Brands Holdings, Inc.1 | 144,993 | 7,554,135 |
| Revance Therapeutics, Inc.1,2 | 480,762 | 9,951,773 |
| 38,462,520 | ||
| Total Health Care | 267,117,349 | |
| Industrials - 25.0% | ||
| Aerospace & Defense - 2.0% | ||
| HEICO Corp. Class A | 393,543 | 26,721,570 |
| Air Freight & Logistics - 1.6% | ||
| Forward Air Corp. | 429,113 | 20,331,374 |
| Building Products - 0.6% | ||
| ALLEGION Plc | 114,432 | 7,323,648 |
| Commercial Services & Supplies - 3.2% | ||
| Clean Harbors, Inc.1 | 523,429 | 29,128,824 |
| Meridian Funds | 25 | www.meridianfund.com |
Table of Contents
Schedule of Investments (continued)
| Shares | Value | |
| Multi-Color Corp. | 94,147 | $ 7,305,807 |
| Ritchie Bros. Auctioneers, Inc. (Canada) | 176,871 | 6,013,614 |
| 42,448,245 | ||
| Electrical Equipment - 2.3% | ||
| Sensata Technologies Holding N.V. (Netherlands)1 | 754,595 | 29,391,475 |
| Machinery - 5.5% | ||
| Kennametal, Inc. | 300,854 | 9,404,696 |
| Proto Labs, Inc.1,2 | 271,113 | 13,921,652 |
| Tennant Co. | 276,385 | 19,678,612 |
| Wabtec Corp.2 | 238,237 | 19,778,436 |
| Woodward, Inc. | 143,520 | 9,910,056 |
| 72,693,452 | ||
| Marine - 1.5% | ||
| Kirby Corp.1,2 | 293,055 | 19,488,158 |
| Professional Services - 5.0% | ||
| Advisory Board Co. (The)1 | 238,433 | 7,927,897 |
| CEB, Inc.2 | 503,703 | 30,524,402 |
| TriNet Group, Inc.1 | 1,053,367 | 26,987,263 |
| 65,439,562 | ||
| Road & Rail - 2.3% | ||
| Heartland Express, Inc.2 | 925,369 | 18,840,513 |
| Roadrunner Transportation Systems, Inc.1 | 432,762 | 4,496,397 |
| Saia, Inc.1 | 162,052 | 7,154,596 |
| 30,491,506 | ||
| Trading Companies & Distributors - 1.0% | ||
| MSC Industrial Direct Co., Inc. Class A | 146,201 | 13,507,510 |
| Total Industrials | 327,836,500 | |
| Information Technology - 17.8% | ||
| Electronic Equipment & Instruments - 2.6% | ||
| CDW Corp. | 349,926 | 18,227,646 |
| Trimble Navigation Ltd.1 | 547,515 | 16,507,577 |
| 34,735,223 | ||
| Internet Software & Services - 5.7% | ||
| 2U, Inc.1,2 | 634,360 | 19,125,954 |
| ChannelAdvisor Corp.1 | 887,771 | 12,739,514 |
| Cimpress, N.V. (Netherlands)1,2 | 111,536 | 10,217,813 |
| CoStar Group, Inc.1 | 52,888 | 9,968,859 |
| New Relic, Inc. 1,2 | 340,902 | 9,630,481 |
| Shutterstock, Inc.1,2 | 159,676 | 7,587,803 |
| SPS Commerce, Inc.1 | 89,731 | 6,271,300 |
| 75,541,724 | ||
| IT Services - 3.1% | ||
| Euronet Worldwide, Inc.1 | 93,056 | 6,740,046 |
| Gartner, Inc.1 | 194,712 | 19,679,542 |
| Shares | Value | |
| MAXIMUS, Inc. | 253,492 | $ 14,142,319 |
| 40,561,907 | ||
| Software - 5.8% | ||
| Barracuda Networks, Inc.1 | 317,509 | 6,804,218 |
| Cadence Design Systems, Inc.1 | 1,174,008 | 29,608,482 |
| Descartes Systems Group, Inc. (The)1 | 511,211 | 10,939,915 |
| RealPage, Inc.1 | 277,820 | 8,334,600 |
| SS&C Technologies Holdings, Inc.2 | 699,768 | 20,013,365 |
| 75,700,580 | ||
| Technology Hardware, Storage & Peripherals - 0.6% | ||
| Stratasys Ltd.1,2 | 479,427 | 7,929,722 |
| Total Information Technology | 234,469,156 | |
| Real Estate - 0.9% | ||
| Equity Real Estate Investment Trusts (REITS) - 0.9% | ||
| National Storage Affiliates Trust | 547,996 | 12,094,272 |
| Total Real Estate | 12,094,272 | |
| Total Common Stocks - 93.1% (Cost $1,072,445,862) | 1,223,158,208 | |
| Shares/ Principal Amount | ||
| Short-Term Investments - 11.2%5 | ||
| Money Market Funds - 2.6% | ||
| BlackRock Liquidity Funds FedFund Portfolio, 0.44% | 5,548,000 | 5,548,000 |
| Federated Treasury Obligations Fund, 0.43% | 5,858,000 | 5,858,000 |
| Fidelity Money Market Funds, Government Portfolio, Institutional Class, 0.43% | 5,848,000 | 5,848,000 |
| JP Morgan Money Market Funds, Government Portfolio, 0.44% | 5,978,000 | 5,978,000 |
| Morgan Stanley Liquidity Funds, Government Portfolio, Institutional Class, 0.44% | 5,888,000 | 5,888,000 |
| STIT, Government & Agency Portfolio, 0.43% | 5,678,000 | 5,678,000 |
| Total Money Market Funds | 34,798,000 | |
| Meridian Funds | 26 | www.meridianfund.com |
Table of Contents
Schedule of Investments (continued)
| Shares/ Principal Amount | Value | |
| Repurchase Agreements - 8.6% | ||
| Citigroup Global Markets, Inc., dated 12/30/16, due 1/3/17, 0.53%, total to be received $34,401,000 (collateralized by various U.S. Government Sponsored Agency Obligations, 2.00% - 8.50%, 12/1/17 - 1/1/47, totaling $35,086,954) | $34,398,974 | $ 34,398,974 |
| HSBC Securities, Inc., dated 12/30/16, due 1/3/17, 0.45%, total to be received $23,724,765 (collateralized by various U.S. Government Sponsored Agency Obligations, 0.88% - 3.00%, 5/15/17 - 5/15/46, totaling $24,198,059) | 23,723,579 | 23,723,579 |
| Merrill Lynch Pierce Fenner & Smith, Inc., dated 12/30/16, due 1/3/17, 0.50%, total to be received $20,473,441 (collateralized by various U.S. Government Sponsored Agency Obligations, 1.74% - 6.00%, 8/1/22 - 1/15/49, totaling $20,881,750) | 20,472,304 | 20,472,304 |
| Shares/ Principal Amount | Value | |
| RBC Dominion Securities Inc, dated 12/30/16, due 1/3/17, 0.52%, total to be received $34,400,961 (collateralized by various U.S. Government Agency Obligations, 0.88% - 7.00%, 2/13/17 - 1/1/47, totaling $35,086,953) | $34,398,974 | $ 34,398,974 |
| Total Repurchase Agreements | 112,993,831 | |
| Total Short-Term Investments - 11.2% (Cost $147,791,831) | 147,791,831 | |
| Total Investments - 104.3% (Cost $1,220,237,693) | 1,370,950,039 | |
| Liabilities in Excess of Other Assets - (4.3)% | (57,145,277) | |
| Net Assets - 100.0% | $1,313,804,762 |
| ADR—American Depositary Receipt |
| CVR—Contingent Value Rights |
| N.V.—Naamloze Vennootschap is the Dutch term for limited liability company |
| Plc—Public Limited Company |
| 1 | Non-income producing securities |
| 2 | All or portion of this security is on loan at December 31, 2016. Total value of such securities at period-end amounts to $248,455,013 and represents 18.91% of net assets. |
| 3 | Level 3 security. See Note 1 in Notes to Financial Statements. |
| 4 | Restricted security; cannot be offered for public resale without first being registered under the Securities Act of 1933 and related rules. Acquisition date represents the date on which an enforceable right to acquire such security is obtained and is presented along with related cost in the security description. The Fund has registration rights for certain restricted securities. Any costs related to such registration are borne by the issuer. The aggregate value of restricted securities at period-end amounts to $5,764,948 and represents 0.44% of net assets. |
| 5 | Collateral received from brokers for securities lending was invested in short-term investments. |
| Meridian Funds | 27 | www.meridianfund.com |
Table of Contents
Schedule of Investments
| Shares | Value | |
| Common Stocks - 89.5% | ||
| Consumer Discretionary - 9.9% | ||
| Diversified Consumer Services - 0.8% | ||
| Regis Corp.1 | 322,601 | $ 4,684,166 |
| Hotels, Restaurants & Leisure - 2.0% | ||
| Las Vegas Sands Corp. | 222,433 | 11,880,147 |
| Media - 0.8% | ||
| Lions Gate Entertainment Corp. Class A (Canada)2 | 170,000 | 4,573,000 |
| Multiline Retail - 1.3% | ||
| Fred's, Inc. Class A2 | 409,278 | 7,596,200 |
| Specialty Retail - 2.9% | ||
| Advance Auto Parts, Inc. | 20,000 | 3,382,400 |
| Dick's Sporting Goods, Inc. | 140,068 | 7,437,611 |
| Five Below, Inc.1,2 | 155,511 | 6,214,219 |
| 17,034,230 | ||
| Textiles, Apparel & Luxury Goods - 2.1% | ||
| Gildan Activewear, Inc. (Canada)2 | 470,184 | 11,928,568 |
| Total Consumer Discretionary | 57,696,311 | |
| Consumer Staples - 2.2% | ||
| Beverages - 1.1% | ||
| Diageo Plc ADR2 | 58,870 | 6,118,948 |
| Food Products - 1.1% | ||
| Nomad Foods Ltd.1,2 | 695,366 | 6,654,653 |
| Total Consumer Staples | 12,773,601 | |
| Energy - 7.4% | ||
| Energy Equipment & Services - 0.5% | ||
| Helmerich & Payne, Inc. 2 | 35,887 | 2,777,654 |
| Oil, Gas & Consumable Fuels - 6.9% | ||
| California Resources Corp.1,2 | 271,271 | 5,775,359 |
| EOG Resources, Inc. | 189,826 | 19,191,409 |
| TOTAL SA ADR | 296,000 | 15,087,120 |
| 40,053,888 | ||
| Total Energy | 42,831,542 | |
| Financials - 10.4% | ||
| Capital Markets - 1.3% | ||
| Oaktree Capital Group LLC 2 | 194,970 | 7,311,375 |
| Commercial Banks - 9.1% | ||
| Bank of Hawaii Corp.2 | 145,754 | 12,926,922 |
| Citizens Financial Group Inc. | 624,504 | 22,251,078 |
| U.S. Bancorp | 352,000 | 18,082,240 |
| 53,260,240 | ||
| Total Financials | 60,571,615 | |
| Health Care - 6.7% | ||
| Biotechnology - 4.1% | ||
| Agios Pharmaceuticals, Inc.1,2 | 62,500 | 2,608,125 |
| Shares | Value | |
| Celgene Corp.1 | 121,000 | $ 14,005,750 |
| Juno Therapeutics, Inc. 1,2 | 158,734 | 2,992,136 |
| Neurocrine Biosciences, Inc.1,2 | 119,022 | 4,606,151 |
| 24,212,162 | ||
| Life Sciences Tools & Services - 1.7% | ||
| Accelerate Diagnostics, Inc. 1,2 | 337,769 | 7,008,707 |
| Pacific Biosciences of California, Inc.1,2 | 746,154 | 2,835,385 |
| 9,844,092 | ||
| Pharmaceuticals - 0.9% | ||
| Nektar Therapeutics 1,2 | 427,098 | 5,240,493 |
| Total Health Care | 39,296,747 | |
| Industrials - 9.3% | ||
| Aerospace & Defense - 1.7% | ||
| KLX, Inc.1 | 215,000 | 9,698,650 |
| Electrical Equipment - 1.8% | ||
| EnerSys, Inc. | 136,000 | 10,621,600 |
| Machinery - 2.7% | ||
| Xylem, Inc. | 316,610 | 15,678,527 |
| Road & Rail - 1.1% | ||
| Union Pacific Corp. | 59,370 | 6,155,482 |
| Trading Companies & Distributors - 2.0% | ||
| H&E Equipment Services, Inc. | 243,487 | 5,661,073 |
| MSC Industrial Direct Co., Inc. Class A | 68,345 | 6,314,394 |
| 11,975,467 | ||
| Total Industrials | 54,129,726 | |
| Information Technology - 29.6% | ||
| Electronic Equipment & Instruments - 3.4% | ||
| Trimble Navigation Ltd.1 | 312,156 | 9,411,503 |
| Zebra Technologies Corp. Class A1,2 | 121,000 | 10,376,960 |
| 19,788,463 | ||
| IT Services - 4.8% | ||
| Acxiom Corp.1 | 317,800 | 8,517,040 |
| CACI International, Inc. Class A1 | 153,800 | 19,117,340 |
| 27,634,380 | ||
| Semiconductors - 11.5% | ||
| Mellanox Technologies Ltd.1 | 279,282 | 11,422,634 |
| Micron Technology, Inc.1 | 450,772 | 9,880,922 |
| NVIDIA Corp. | 316,955 | 33,831,777 |
| Power Integrations, Inc. | 46,386 | 3,147,290 |
| QUALCOMM, Inc. | 136,469 | 8,897,779 |
| 67,180,402 | ||
| Software - 8.0% | ||
| Microsoft Corp. | 383,200 | 23,812,048 |
| Silver Spring Networks, Inc.1 | 610,303 | 8,123,133 |
| Meridian Funds | 28 | www.meridianfund.com |
Table of Contents
Schedule of Investments (continued)
| Shares | Value | |
| Verint Systems, Inc.1 | 417,000 | $ 14,699,250 |
| 46,634,431 | ||
| Technology Hardware, Storage & Peripherals - 1.9% | ||
| Apple, Inc. | 93,943 | 10,880,478 |
| Total Information Technology | 172,118,154 | |
| Materials - 6.9% | ||
| Chemicals - 1.2% | ||
| Agrium, Inc.2 | 71,777 | 7,217,177 |
| Construction Materials - 2.1% | ||
| Summit Materials Inc. Class A1 | 291,436 | 6,933,257 |
| U.S. Concrete, Inc.1,2 | 76,000 | 4,978,000 |
| 11,911,257 | ||
| Containers & Packaging - 1.3% | ||
| Owens-Illinois, Inc.1 | 426,186 | 7,419,898 |
| Metals & Mining - 2.3% | ||
| Freeport-McMoRan, Inc.1 | 404,530 | 5,335,751 |
| Newmont Mining Corp. | 236,000 | 8,040,520 |
| 13,376,271 | ||
| Total Materials | 39,924,603 | |
| Real Estate - 5.1% | ||
| Equity Real Estate Investment Trusts (REITS) - 1.7% | ||
| Rayonier, Inc. | 366,080 | 9,737,728 |
| Real Estate Management & Development - 3.4% | ||
| Alexander & Baldwin, Inc. | 446,677 | 20,042,397 |
| Total Real Estate | 29,780,125 | |
| Telecommunication Services - 1.5% | ||
| Diversified Telecommunications - 1.5% | ||
| Iridium Communications, Inc.1,2 | 935,515 | 8,980,944 |
| Total Telecommunication Services | 8,980,944 | |
| Utilities - 0.5% | ||
| Oil, Gas & Consumable Fuels - 0.5% | ||
| Ferrellgas Partners LP2 | 451,794 | 3,058,645 |
| Total Utilities | 3,058,645 | |
| Total Common Stocks - 89.5% (Cost $391,706,526) | 521,162,013 | |
| Number of Contracts | Value | |
| Put Options Purchased - 0.0% | ||
| Fred's, Inc. Expiring January 20, 2017 at $10.00 | 3,000 | $ 15,000 |
| Iridium Communications, Inc. Expiring January 20, 2017 at $7.50 | 9,000 | 90,000 |
| Total Put Options Purchased - 0.0% (Cost $396,488) | 105,000 | |
| Shares/ Principal Amount | ||
| Short-Term Investments - 11.2%3 | ||
| Money Market Funds - 3.0% | ||
| BlackRock Liquidity Funds FedFund Portfolio, 0.44% | 3,119,000 | 3,119,000 |
| Federated Treasury Obligations Fund, 0.43% | 2,678,000 | 2,678,000 |
| Fidelity Money Market Funds, Government Portfolio, Institutional Class, 0.43% | 2,818,000 | 2,818,000 |
| JP Morgan Money Market Funds, Government Portfolio, 0.44% | 2,882,000 | 2,882,000 |
| Morgan Stanley Liquidity Funds, Government Portfolio, Institutional Class, 0.44% | 2,882,000 | 2,882,000 |
| STIT, Government & Agency Portfolio, 0.43% | 2,882,000 | 2,882,000 |
| Total Money Market Funds | 17,261,000 | |
| Repurchase Agreements - 8.2% | ||
| Citigroup Global Markets, Inc., dated 12/30/16, due 1/3/17, 0.53%, total to be received $15,123,921 (collateralized by various U.S. Government Sponsored Agency Obligations, 2.00% - 8.50%, 12/1/17 - 1/1/47, totaling $15,425,490) | $15,123,030 | 15,123,030 |
| Meridian Funds | 29 | www.meridianfund.com |
Table of Contents
Schedule of Investments (continued)
| Shares/ Principal Amount | Value | |
| HSBC Securities, Inc., dated 12/30/16, due 1/3/17, 0.46%, total to be received $15,123,803 (collateralized by various U.S. Government Sponsored Agency Obligations, 1.38% - 3.75%, 11/30/18 - 11/15/43, totaling $15,425,575) | $15,123,030 | $ 15,123,030 |
| JP Morgan Securities LLC, dated 12/30/16, due 1/3/17, 0.50%, total to be received $2,344,647 (collateralized by various U.S. Government Sponsored Agency Obligations, 0.00% - 1.38%, 4/13/17 - 8/31/21, totaling $2,391,422) | 2,344,517 | 2,344,517 |
| RBC Dominion Securities Inc, dated 12/30/16, due 1/3/17, 0.52%, total to be received $15,123,904 (collateralized by various U.S. Government Agency Obligations, 0.88% - 7.00%, 2/13/17 - 1/1/47, totaling $15,425,491) | 15,123,030 | 15,123,030 |
| Total Repurchase Agreements | 47,713,607 | |
| Total Short-Term Investments - 11.2% (Cost $64,974,607) | 64,974,607 | |
| Total Investments - 100.7% (Cost $457,077,621) | 586,241,620 | |
| Liabilities in Excess of Other Assets - (0.7)% | (4,236,087) | |
| Net Assets - 100.0% | $582,005,533 |
| Number of Contracts | Value | |
| Call Option Written - (0.6)% | ||
| NVIDIA Corp. Expiring January 20, 2017 at $70.00 | (1,000) | $(3,740,000) |
| Total Call Option Written - (0.6)% (Premium received $(242,204)) | $(3,740,000) | |
| Put Options Written - (0.0)% | ||
| Mellanox Technologies Ltd. | ||
| Expiring January 20, 2017 at $38.00 | (250) | $ (3,750) |
| Expiring March 17, 2017 at $38.00 | (200) | (26,000) |
| Total Put Options Written - (0.0)% (Premium received $(98,632)) | $(29,750) | |
| ADR—American Depositary Receipt |
| Plc—Public Limited Company |
| 1 | Non-income producing securities |
| 2 | All or portion of this security is on loan at December 31, 2016. Total value of such securities at period-end amounts to $70,789,811 and represents 12.16% of net assets. |
| 3 | Collateral received from brokers for securities lending was invested in short-term investments. |
| Meridian Funds | 30 | www.meridianfund.com |
Table of Contents
Schedule of Investments
| Shares | Value | |
| Common Stocks - 87.2% | ||
| Consumer Discretionary - 15.6% | ||
| Hotels, Restaurants & Leisure - 5.5% | ||
| Las Vegas Sands Corp. | 18,000 | $ 961,380 |
| Starbucks Corp. | 30,000 | 1,665,600 |
| 2,626,980 | ||
| Internet & Direct Marketing Retail - 3.4% | ||
| Amazon.com, Inc.1 | 2,165 | 1,623,469 |
| Media - 2.3% | ||
| Walt Disney Co. (The) | 10,379 | 1,081,699 |
| Specialty Retail - 2.3% | ||
| TJX Companies, Inc. (The) | 15,000 | 1,126,950 |
| Textiles, Apparel & Luxury Goods - 2.1% | ||
| NIKE, Inc. Class B | 20,000 | 1,016,600 |
| Total Consumer Discretionary | 7,475,698 | |
| Consumer Staples - 5.8% | ||
| Beverages - 1.4% | ||
| Brown-Forman Corp. Class B | 14,600 | 655,832 |
| Food & Staples Retailing - 2.3% | ||
| Costco Wholesale Corp. | 7,000 | 1,120,770 |
| Tobacco - 2.1% | ||
| Altria Group, Inc. | 14,946 | 1,010,648 |
| Total Consumer Staples | 2,787,250 | |
| Energy - 4.5% | ||
| Oil, Gas & Consumable Fuels - 4.5% | ||
| California Resources Corp.1,2 | 75,000 | 1,596,750 |
| EOG Resources, Inc. | 5,678 | 574,046 |
| Total Energy | 2,170,796 | |
| Financials - 8.3% | ||
| Capital Markets - 1.2% | ||
| Intercontinental Exchange, Inc. | 10,135 | 571,817 |
| Commercial Banks - 7.1% | ||
| Citigroup, Inc. | 16,353 | 971,859 |
| JPMorgan Chase & Co. | 11,497 | 992,076 |
| U.S. Bancorp | 27,911 | 1,433,788 |
| 3,397,723 | ||
| Total Financials | 3,969,540 | |
| Health Care - 7.0% | ||
| Biotechnology - 5.8% | ||
| Alnylam Pharmaceuticals, Inc.1,2 | 10,500 | 393,120 |
| Celgene Corp.1 | 5,737 | 664,058 |
| Exact Sciences Corp.1,2 | 33,000 | 440,880 |
| Gilead Sciences, Inc. | 12,570 | 900,137 |
| Vertex Pharmaceuticals, Inc. 1 | 5,000 | 368,350 |
| 2,766,545 | ||
| Shares | Value | |
| Life Sciences Tools & Services - 1.2% | ||
| Accelerate Diagnostics, Inc. 1,2 | 27,300 | $ 566,475 |
| Total Health Care | 3,333,020 | |
| Industrials - 10.3% | ||
| Aerospace & Defense - 2.6% | ||
| Lockheed Martin Corp. | 5,000 | 1,249,700 |
| Air Freight & Logistics - 3.6% | ||
| United Parcel Service, Inc. Class B | 15,000 | 1,719,600 |
| Professional Services - 4.1% | ||
| Equifax, Inc. | 16,406 | 1,939,681 |
| Total Industrials | 4,908,981 | |
| Information Technology - 27.7% | ||
| Internet Software & Services - 6.9% | ||
| Alphabet, Inc. Class A1 | 2,000 | 1,584,900 |
| Facebook, Inc. Class A1 | 15,000 | 1,725,750 |
| 3,310,650 | ||
| IT Services - 2.9% | ||
| MasterCard, Inc. Class A | 5,934 | 612,686 |
| Visa, Inc. Class A | 9,964 | 777,392 |
| 1,390,078 | ||
| Semiconductors - 8.2% | ||
| NVIDIA Corp. | 20,000 | 2,134,800 |
| QUALCOMM, Inc. | 27,000 | 1,760,400 |
| 3,895,200 | ||
| Software - 4.8% | ||
| Microsoft Corp. | 37,000 | 2,299,180 |
| Technology Hardware, Storage & Peripherals - 4.9% | ||
| Apple, Inc. | 20,000 | 2,316,400 |
| Total Information Technology | 13,211,508 | |
| Materials - 6.0% | ||
| Chemicals - 2.0% | ||
| Dow Chemical Co. (The) | 8,133 | 465,370 |
| Mosaic Co. (The) | 16,607 | 487,084 |
| 952,454 | ||
| Metals & Mining - 4.0% | ||
| Royal Gold, Inc. | 30,000 | 1,900,500 |
| Total Materials | 2,852,954 | |
| Telecommunication Services - 1.0% | ||
| Wireless Telecommunication Services - 1.0% | ||
| T-Mobile US, Inc.1 | 8,654 | 497,692 |
| Total Telecommunication Services | 497,692 | |
| Meridian Funds | 31 | www.meridianfund.com |
Table of Contents
Schedule of Investments (continued)
| Shares | Value | |
| Utilities - 1.0% | ||
| Multi-Utilities - 1.0% | ||
| Dominion Resources, Inc. | 6,211 | $ 475,700 |
| Total Utilities | 475,700 | |
| Total Common Stocks - 87.2% (Cost $34,897,771) | 41,683,139 | |
| Exchange Traded Funds - 1.5% | ||
| Sprott Physical Gold Trust1,2 | 75,000 | 704,250 |
| Total Exchange Traded Funds - 1.5% (Cost $765,947) | 704,250 | |
| Principal Amount | ||
| Corporate Bonds - 6.7% | ||
| Energy - 6.7% | ||
| Oil, Gas & Consumable Fuels - 6.7% | ||
| California Resources Corp., 8.00%, 12/15/22 | $3,616,000 | 3,218,240 |
| Total Corporate Bonds - 6.7% (Cost $1,714,262) | 3,218,240 | |
| Number of Contracts | ||
| Call Options Purchased - 0.1% | ||
| Royal Gold, Inc. Expiring January 18, 2019 at $100.00 | 50 | 27,500 |
| Twitter, Inc. Expiring January 19, 2018 at $30.00 | 250 | 7,000 |
| Total Call Options Purchased - 0.1% (Cost $96,657) | 34,500 | |
| Shares/ Principal Amount | ||
| Short-Term Investments - 5.6%3 | ||
| Repurchase Agreements - 5.6% | ||
| BNP Paribas S.A., dated 12/30/16, due 1/3/17, 0.50%, total to be received $618,164 (collateralized by various U.S. Government Sponsored Agency and U.S. Treasury Obligations, 0.00% - 7.88%, 4/30/18 - 12/20/46, totaling $630,585) | $618,130 | 618,130 |
| Shares/ Principal Amount | Value | |
| Citigroup Global Markets, Inc., dated 12/30/16, due 1/3/17,0.53%, total to be received $618,166 (collateralized by various U.S. Government Sponsored Agency Obligations, 2.00% - 8.50%, 12/1/17 - 1/1/47, totaling $630,493) | $618,130 | $ 618,130 |
| JP Morgan Securities LLC, dated 12/30/16, due 1/3/17, 0.50%, total to be received $183,219 (collateralized by various U.S. Government Sponsored Agency Obligations, 0.00% - 1.38%, 4/13/17 - 8/31/21, totaling $186,874) | 183,209 | 183,209 |
| Merrill Lynch Pierce Fenner & Smith, Inc., dated 12/30/16, due 1/3/17, 0.50%, total to be received $618,164 (collateralized by various U.S. Government Sponsored Agency Obligations, 1.74% - 6.00%, 8/1/22 - 1/15/49, totaling $630,493) | 618,130 | 618,130 |
| RBC Dominion Securities Inc, dated 12/30/16, due 1/3/17, 0.52%, total to be received $618,166 (collateralized by various U.S. Government Sponsored Agency Obligations, 0.88% - 7.00%, 2/13/17 - 1/1/47, totaling $630,493) | 618,130 | 618,130 |
| Total Repurchase Agreements | 2,655,729 | |
| Total Investments - 101.1% (Cost $40,130,366) | 48,295,858 | |
| Liabilities in Excess of Other Assets - (1.1)% | (524,319) | |
| Net Assets - 100.0% | $47,771,539 |
| Shares | ||
| Securities Sold Short - (7.9)% | ||
| Consumer Discretionary - (3.3)% | ||
| Hotels, Restaurants & Leisure - (2.1)% | ||
| McDonald's Corp. | (8,000) | (973,760) |
| Meridian Funds | 32 | www.meridianfund.com |
Table of Contents
Schedule of Investments (continued)
| Shares | Value | |
| Textiles, Apparel & Luxury Goods - (1.2)% | ||
| Deckers Outdoor Corp.1 | (10,500) | $ (581,595) |
| Total Consumer Discretionary | (1,555,355) | |
| Consumer Staples - (2.5)% | ||
| Household Products - (2.5)% | ||
| Procter & Gamble Co. (The) | (14,000) | (1,177,120) |
| Total Consumer Staples | (1,177,120) | |
| Information Technology - (2.1)% | ||
| Software - (2.1)% | ||
| VMware, Inc. Class A1 | (13,000) | (1,023,490) |
| Total Information Technology | (1,023,490) | |
| Total Securities - (7.9%) (Proceeds $(3,389,550)) | $(3,755,965) | |
| Number of Contracts | Value | |
| Call Option Written - (0.1)% | ||
| NVIDIA Corp. Expiring January 20, 2017 at $105.00 | (40) | $(24,800) |
| Total Call Option Written - (0.1)% (Premium received $(3,928)) | $(24,800) | |
| 1 | Non-income producing securities |
| 2 | All or portion of this security is on loan at December 31, 2016. Total value of such securities at period-end amounts to $3,125,868 and represents 6.54% of net assets. |
| 3 | Collateral received from brokers for securities lending was invested in short-term investments. |
| Meridian Funds | 33 | www.meridianfund.com |
Table of Contents
Schedule of Investments
| Shares | Value | |
| Common Stocks - 88.3% | ||
| Consumer Discretionary - 17.2% | ||
| Distributors - 0.1% | ||
| Fenix Parts, Inc.1 | 277,030 | $ 781,225 |
| Diversified Consumer Services - 4.0% | ||
| Avista Healthcare Public Acquisition Corp.1 | 560,903 | 5,637,075 |
| Easterly Acquisition Corp.1 | 243,726 | 2,400,701 |
| Grand Canyon Education, Inc.1 | 181,945 | 10,634,685 |
| Pace Holdings Corp.1,2 | 495,499 | 5,014,450 |
| 23,686,911 | ||
| Hotels, Restaurants & Leisure - 1.5% | ||
| Del Frisco's Restaurant Group, Inc.1 | 181,805 | 3,090,685 |
| Dunkin' Brands Group, Inc.2 | 108,547 | 5,692,205 |
| 8,782,890 | ||
| Leisure Products - 1.6% | ||
| Arctic Cat, Inc.1,2 | 189,823 | 2,851,141 |
| Malibu Boats, Inc. Class A1 | 340,561 | 6,497,904 |
| 9,349,045 | ||
| Media - 1.4% | ||
| National CineMedia, Inc. | 544,818 | 8,025,169 |
| Specialty Retail - 7.0% | ||
| Boot Barn Holdings, Inc. 1,2 | 264,517 | 3,311,753 |
| Five Below, Inc.1,2 | 163,964 | 6,552,001 |
| Hibbett Sports, Inc.1,2 | 241,474 | 9,006,980 |
| Monro Muffler Brake, Inc. | 46,656 | 2,668,723 |
| Sally Beauty Holdings, Inc.1,2 | 601,448 | 15,890,256 |
| Winmark Corp.2 | 26,478 | 3,340,200 |
| 40,769,913 | ||
| Textiles, Apparel & Luxury Goods - 1.6% | ||
| Wolverine World Wide, Inc.2 | 428,705 | 9,410,075 |
| Total Consumer Discretionary | 100,805,228 | |
| Energy - 2.8% | ||
| Energy Equipment & Services - 0.8% | ||
| RigNet, Inc.1 | 202,087 | 4,678,314 |
| Oil, Gas & Consumable Fuels - 2.0% | ||
| Evolution Petroleum Corp. | 1,178,313 | 11,783,130 |
| Total Energy | 16,461,444 | |
| Financials - 5.1% | ||
| Capital Markets - 4.6% | ||
| Bats Global Markets, Inc. | 279,981 | 9,382,163 |
| Financial Engines, Inc.2 | 211,101 | 7,757,962 |
| PennantPark Investment Corp.1 | 406,219 | 3,111,638 |
| WisdomTree Investments, Inc.2 | 574,939 | 6,404,820 |
| 26,656,583 | ||
| Shares | Value | |
| Insurance - 0.5% | ||
| Trupanion, Inc. 1,2 | 184,349 | $ 2,861,097 |
| Total Financials | 29,517,680 | |
| Health Care - 19.1% | ||
| Biotechnology - 5.0% | ||
| Atara Biotherapeutics, Inc. 1,2 | 133,248 | 1,892,122 |
| Bluebird Bio, Inc.1,2 | 47,723 | 2,944,509 |
| Chimerix, Inc. 1 | 488,497 | 2,247,086 |
| DBV Technologies SA ADR (France)1,2 | 83,002 | 2,915,860 |
| Exact Sciences Corp.1,2 | 309,582 | 4,136,016 |
| Immunomedics, Inc.1,2 | 796,858 | 2,924,469 |
| Neurocrine Biosciences, Inc.1 | 59,417 | 2,299,438 |
| Repligen Corp.1 | 88,593 | 2,730,436 |
| Syndax Pharmaceuticals, Inc.1 | 94,263 | 675,866 |
| Versartis, Inc.1,2 | 230,355 | 3,432,289 |
| Xencor, Inc. 1 | 122,236 | 3,217,252 |
| 29,415,343 | ||
| Health Care Equipment & Supplies - 5.2% | ||
| Endologix, Inc.1,2 | 771,164 | 4,411,058 |
| Entellus Medical, Inc.1,2 | 164,644 | 3,123,297 |
| Insulet Corp.1 | 115,182 | 4,340,058 |
| Merit Medical Systems, Inc.1 | 123,116 | 3,262,574 |
| Nevro Corp. 1,2 | 43,334 | 3,148,648 |
| Novadaq Technologies, Inc.1,2 | 416,456 | 2,952,673 |
| Quidel Corp.1,2 | 133,079 | 2,850,552 |
| Spectranetics Corp. (The)1,2 | 259,136 | 6,348,832 |
| 30,437,692 | ||
| Health Care Providers & Services - 0.2% | ||
| National Research Corp. Class A2 | 63,034 | 1,197,646 |
| Health Care Technology - 2.8% | ||
| athenahealth, Inc.1,2 | 45,827 | 4,819,626 |
| Castlight Health, Inc. Class B1,2 | 732,558 | 3,626,162 |
| HealthStream, Inc.1 | 145,727 | 3,650,461 |
| Medidata Solutions, Inc.1 | 81,963 | 4,071,102 |
| 16,167,351 | ||
| Life Sciences Tools & Services - 2.9% | ||
| Accelerate Diagnostics, Inc. 1,2 | 164,653 | 3,416,550 |
| INC Research Holdings, Inc. Class A1 | 234,378 | 12,328,283 |
| Pacific Biosciences of California, Inc.1,2 | 376,808 | 1,431,870 |
| 17,176,703 | ||
| Pharmaceuticals - 3.0% | ||
| Catalent Inc. 1 | 247,569 | 6,674,460 |
| NeuroDerm Ltd.1,2 | 168,973 | 3,751,201 |
| Prestige Brands Holdings, Inc.1 | 63,524 | 3,309,600 |
| Meridian Funds | 34 | www.meridianfund.com |
Table of Contents
Schedule of Investments (continued)
| Shares | Value | |
| Revance Therapeutics, Inc.1,2 | 185,638 | $ 3,842,707 |
| 17,577,968 | ||
| Total Health Care | 111,972,703 | |
| Industrials - 24.0% | ||
| Aerospace & Defense - 1.4% | ||
| HEICO Corp. Class A | 83,170 | 5,647,243 |
| TASER International, Inc.1,2 | 96,987 | 2,350,965 |
| 7,998,208 | ||
| Air Freight & Logistics - 1.9% | ||
| Forward Air Corp. | 197,936 | 9,378,208 |
| Park-Ohio Holdings Corp.1 | 37,120 | 1,581,312 |
| 10,959,520 | ||
| Commercial Services & Supplies - 8.8% | ||
| Clean Harbors, Inc.1 | 150,355 | 8,367,256 |
| Heritage-Crystal Clean, Inc.1 | 891,956 | 14,003,709 |
| Hudson Technologies, Inc.1 | 398,855 | 3,194,828 |
| InnerWorkings, Inc.1 | 1,117,062 | 11,003,061 |
| Multi-Color Corp. | 40,415 | 3,136,204 |
| Ritchie Bros. Auctioneers, Inc. (Canada) | 75,251 | 2,558,534 |
| SP Plus Corp.1 | 328,472 | 9,246,487 |
| 51,510,079 | ||
| Machinery - 2.9% | ||
| Kennametal, Inc. | 131,581 | 4,113,222 |
| Proto Labs, Inc.1,2 | 116,876 | 6,001,583 |
| Tennant Co. | 96,731 | 6,887,247 |
| 17,002,052 | ||
| Marine - 1.4% | ||
| Kirby Corp.1,2 | 128,392 | 8,538,068 |
| Professional Services - 5.5% | ||
| Advisory Board Co. (The)1 | 102,350 | 3,403,138 |
| CEB, Inc. | 220,894 | 13,386,176 |
| TriNet Group, Inc.1 | 413,033 | 10,581,905 |
| TrueBlue, Inc.1 | 185,784 | 4,579,576 |
| 31,950,795 | ||
| Road & Rail - 2.1% | ||
| Heartland Express, Inc.2 | 398,177 | 8,106,884 |
| Roadrunner Transportation Systems, Inc.1 | 139,345 | 1,447,794 |
| Saia, Inc.1 | 63,835 | 2,818,315 |
| 12,372,993 | ||
| Total Industrials | 140,331,715 | |
| Information Technology - 18.3% | ||
| Electronic Equipment & Instruments - 1.3% | ||
| CTS Corp. | 215,339 | 4,823,594 |
| Mesa Laboratories, Inc. 2 | 23,146 | 2,841,171 |
| 7,664,765 | ||
| Shares | Value | |
| Internet Software & Services - 9.8% | ||
| 2U, Inc.1 | 272,306 | $ 8,210,026 |
| Actua Corp.1 | 388,181 | 5,434,534 |
| Carbonite, Inc.1 | 495,175 | 8,120,870 |
| ChannelAdvisor Corp.1 | 552,141 | 7,923,223 |
| Cimpress, N.V. (Netherlands)1,2 | 48,131 | 4,409,281 |
| comScore, Inc.1 | 122,539 | 3,869,782 |
| Envestnet, Inc.1 | 131,212 | 4,625,223 |
| LivePerson, Inc.1,2 | 592,372 | 4,472,409 |
| New Relic, Inc. 1,2 | 148,071 | 4,183,006 |
| Shutterstock, Inc.1,2 | 65,553 | 3,115,078 |
| SPS Commerce, Inc.1 | 43,351 | 3,029,801 |
| 57,393,233 | ||
| IT Services - 1.0% | ||
| Euronet Worldwide, Inc.1 | 39,945 | 2,893,217 |
| Forrester Research, Inc. | 70,376 | 3,022,649 |
| 5,915,866 | ||
| Software - 5.6% | ||
| Barracuda Networks, Inc.1,2 | 122,206 | 2,618,874 |
| Callidus Software, Inc.1 | 352,572 | 5,923,210 |
| Descartes Systems Group, Inc. (The)1 | 188,077 | 4,024,848 |
| Everbridge, Inc.1,2 | 188,514 | 3,478,083 |
| Exa Corp.1,2 | 595,489 | 9,146,711 |
| QAD, Inc. Class A | 132,707 | 4,034,293 |
| RealPage, Inc.1 | 120,732 | 3,621,960 |
| 32,847,979 | ||
| Technology Hardware, Storage & Peripherals - 0.6% | ||
| Stratasys Ltd.1,2 | 208,541 | 3,449,268 |
| Total Information Technology | 107,271,111 | |
| Real Estate - 1.8% | ||
| Equity Real Estate Investment Trusts (REITS) - 1.3% | ||
| Jernigan Capital, Inc. | 149,395 | 3,144,765 |
| National Storage Affiliates Trust | 198,170 | 4,373,612 |
| 7,518,377 | ||
| Real Estate Management & Development - 0.5% | ||
| FirstService Corp. | 57,618 | 2,735,702 |
| Total Real Estate | 10,254,079 | |
| Total Common Stocks - 88.3% (Cost $464,109,686) | 516,613,960 | |
| Warrants - 0.0% | ||
| Consumer Discretionary - 0.0% | ||
| Diversified Consumer Services - 0.0% | ||
| Easterly Acquisition Corp.1 | 38,714 | 12,466 |
| Pace Holdings Corp.1 | 495,499 | 297,299 |
| Total Consumer Discretionary | 309,765 | |
| Meridian Funds | 35 | www.meridianfund.com |
Table of Contents
Schedule of Investments (continued)
| Shares/ Principal Amount | Value | |
| Short-Term Investments - 11.7%3 | ||
| Money Market Funds - 3.1% | ||
| BlackRock Liquidity Funds FedFund Portfolio, 0.44% | 3,044,000 | $ 3,044,000 |
| Federated Treasury Obligations Fund, 0.43% | 2,917,000 | 2,917,000 |
| Fidelity Money Market Funds, Government Portfolio, Institutional Class, 0.43% | 3,113,000 | 3,113,000 |
| JP Morgan Money Market Funds, Government Portfolio, 0.44% | 3,044,000 | 3,044,000 |
| Morgan Stanley Liquidity Funds, Government Portfolio, Institutional Class, 0.44% | 3,044,000 | 3,044,000 |
| STIT, Government & Agency Portfolio, 0.43% | 3,044,000 | 3,044,000 |
| Total Money Market Funds | 18,206,000 | |
| Repurchase Agreements - 8.6% | ||
| Citigroup Global Markets, Inc., dated 12/30/16, due 1/3/17, 0.53%, total to be received $15,906,033 (collateralized by various U.S. Government Sponsored Agency Obligations, 2.00% - 8.50%, 12/1/17 - 1/1/47, totaling $16,223,198) | $15,905,096 | 15,905,096 |
| HSBC Securities, Inc., dated 12/30/16, due 1/3/17, 0.46%, total to be received $15,905,909 (collateralized by various U.S. Government Sponsored Agency Obligations, 1.38% - 3.75%, 11/30/18 - 11/15/43, totaling $16,223,286) | 15,905,096 | 15,905,096 |
| Shares/ Principal Amount | Value | |
| JP Morgan Securities LLC, dated 12/30/16, due 1/3/17, 0.50%, total to be received $2,413,594 (collateralized by various U.S. Government Sponsored Agency Obligations, 0.00% - 1.38%, 4/13/17 - 8/31/21, totaling $2,461,745) | $ 2,413,460 | $ 2,413,460 |
| RBC Dominion Securities Inc, dated 12/30/16, due 1/3/17, 0.52%, total to be received $15,906,015 (collateralized by various U.S. Government Sponsored Agency Obligations, 0.88% - 7.00%, 2/13/17 - 1/1/47, totaling $16,223,198) | 15,905,096 | 15,905,096 |
| Total Repurchase Agreements | 50,128,748 | |
| Total Short-Term Investments - 11.7% (Cost $68,334,748) | 68,334,748 | |
| Total Investments - 100.0% (Cost $532,668,597) | 585,258,473 | |
| Liabilities in Excess of Other Assets - (0.0)% | (79,124) | |
| Net Assets - 100.0% | $585,179,349 |
| ADR—American Depositary Receipt |
| N.V.—Naamloze Vennootschap is the Dutch term for limited liability company |
| 1 | Non-income producing securities |
| 2 | All or portion of this security is on loan at December 31, 2016. Total value of such securities at period-end amounts to $92,831,588 and represents 15.86% of net assets. |
| 3 | Collateral received from brokers for securities lending was invested in short-term investments. |
| Meridian Funds | 36 | www.meridianfund.com |
Table of Contents
Statements of Assets and Liabilities
| December 31, 2016 (Unaudited) | Meridian Growth Fund | Meridian Contrarian Fund | Meridian Equity Income Fund | Meridian Small Cap Growth Fund |
| Assets | ||||
Investments, at value1,2 | $1,257,956,208 | $538,528,013 | $45,640,129 | $535,129,725 |
Repurchase agreements3 | 112,993,831 | 47,713,607 | 2,655,729 | 50,128,748 |
Cash and cash equivalents | 93,819,687 | 64,247,682 | 625,776 | 66,779,070 |
Cash held as collateral | — | 3,024,482 | 5,328,999 | — |
| Receivables and other assets: | ||||
Fund shares purchased | 717,418 | 105,250 | — | 1,963,255 |
Investments sold | — | — | — | — |
Dividends and interest | 159,433 | 322,528 | 51,546 | 249,442 |
Securities lending interest | 66,142 | 43,921 | 3,588 | 63,356 |
Prepaid expenses | 82,470 | 51,086 | 27,367 | 86,726 |
Transfer agent fees | — | — | — | 18,871 |
Other | — | — | — | 17,841 |
Total Assets | 1,465,795,189 | 654,036,569 | 54,333,134 | 654,437,034 |
| Liabilities | ||||
Securities sold short4 | — | — | 3,755,965 | — |
Collateral held for securities on loan | 147,791,831 | 64,974,607 | 2,655,729 | 68,334,748 |
| Payables and other accrued expenses: | ||||
Options written at value5 | — | 3,769,750 | 24,800 | — |
Fund shares sold | 1,103,181 | 423,686 | 71,393 | 374,502 |
Investments purchased | 2,089,055 | 2,293,107 | — | — |
Investment advisory fees | 836,656 | 483,136 | 37,196 | 486,587 |
Service plan fees | 4,029 | 200 | 211 | 45,193 |
Professional fees | 73,953 | 30,046 | 6,118 | 15,242 |
Directors' fees | 7,466 | 3,052 | 288 | 1,413 |
Transfer agent fees | 72,823 | 44,902 | 2,613 | — |
Other | 11,433 | 8,550 | 7,282 | — |
Total Liabilities | 151,990,427 | 72,031,036 | 6,561,595 | 69,257,685 |
Net Assets | $1,313,804,762 | $582,005,533 | $47,771,539 | $585,179,349 |
| Net Assets Consist of | ||||
Paid in capital | $1,167,359,466 | $451,515,249 | $43,881,161 | $531,571,034 |
Accumulated net realized gain/(loss) on investments, written options, and foreign currency transactions | (880,282) | 5,333,441 | (4,192,727) | 3,239,451 |
Net unrealized appreciation on investments and foreign currency translations | 150,712,346 | 129,163,999 | 7,799,077 | 52,589,876 |
Net unrealized depreciation on written options | — | (3,428,914) | (20,872) | — |
Undistributed (distributions in excess of) net investment income | (3,386,768) | (578,242) | 304,900 | (2,221,012) |
Net Assets | $1,313,804,762 | $582,005,533 | $47,771,539 | $585,179,349 |
1 Investments at cost | 1,107,243,862 | 409,364,014 | 37,474,637 | 482,539,849 |
| 2 | Including securities on loan valued at $248,455,013, $70,789,811, $3,125,868 and $92,831,588, respectively. See Note 4 in Notes to Financial Statements. |
| 3 | Repurchase agreements at cost $112,993,831, $47,713,607, $2,655,729 and $50,128,748, respectively. |
| 4 | Proceeds received from securities sold short $—, $—, $3,389,550 and $—, respectively. |
| 5 | Written options, premium received of $—, $340,836, $3,928, and $—, respectively. |
| Meridian Funds | 37 | www.meridianfund.com |
Table of Contents
Statements of Assets and Liabilities (continued)
| December 31, 2016 (Unaudited) | Meridian Growth Fund | Meridian Contrarian Fund | Meridian Equity Income Fund | Meridian Small Cap Growth Fund |
| Net Asset Value | ||||
| Legacy Class | ||||
Net Assets | $1,186,047,549 | $579,628,558 | $46,979,175 | $ 59,500,161 |
Shares outstanding4 | 33,423,251 | 15,585,304 | 3,718,822 | 4,387,626 |
Net Asset value per share (offering and redemption price) | $ 35.49 | $ 37.19 | $ 12.63 | $ 13.56 |
| Institutional Class | ||||
Net Assets | $ 60,058,914 | $ — | $ — | $ 82,045,940 |
Shares outstanding4 | 1,693,426 | — | — | 6,039,255 |
Net Asset value per share (offering and redemption price) | $ 35.47 | $ — | $ — | $ 13.59 |
| Class A5 | ||||
Net Assets | $ 12,710,348 | $ 522,101 | $ 562,486 | $ 73,041,583 |
Shares outstanding4 | 365,444 | 14,219 | 44,685 | 5,445,816 |
Net Asset value per share (offering and redemption price) | $ 34.78 | $ 36.72 | $ 12.59 | $ 13.41 |
| Class C6 | ||||
Net Assets | $ 1,224,373 | $ 40,444 | $ 1,044 | $ 36,682,215 |
Shares outstanding4 | 35,065 | 1,104 | 83 | 2,748,683 |
Net Asset value per share (offering and redemption price) | $ 34.92 | $ 36.63 | $ 12.587 | $ 13.35 |
| Investor Class | ||||
Net Assets | $ 53,763,578 | $ 1,814,430 | $ 228,834 | $333,909,450 |
Shares outstanding4 | 1,525,528 | 48,950 | 18,094 | 24,655,105 |
Net Asset value per share (offering and redemption price) | $ 35.24 | $ 37.07 | $ 12.65 | $ 13.54 |
| 4 | 500,000,000 shares authorized, $0.01 par value. |
| 5 | On July 1, 2015, the Fund's Advisor Class Shares were redesignated as Class A Shares. |
| 6 | Commenced operations on July 1, 2015. |
| 7 | The NAV reported above represents the traded NAV at December 31, 2016. |
| Meridian Funds | 38 | www.meridianfund.com |
Table of Contents
Statements of Operations
| For the Six Months Ended December 31, 2016 (Unaudited) | Meridian Growth Fund | Meridian Contrarian Fund | Meridian Equity Income Fund | Meridian Small Cap Growth Fund |
| Investment Income | ||||
Dividends | $ 4,788,277 | $ 2,988,445 | $ 300,311 | $ 1,469,402 |
Foreign taxes withheld | (14,101) | (80,059) | — | (7,141) |
Interest income | — | — | 304,718 | — |
Securities lending | 570,371 | 342,778 | 28,209 | 366,904 |
Total investment income | 5,344,547 | 3,251,164 | 633,238 | 1,829,165 |
| Expenses | ||||
Investment advisory fees | 4,982,898 | 2,851,729 | 208,357 | 2,378,751 |
Custodian fees | 59,256 | 28,084 | 4,063 | 18,391 |
| Distribution and service plan fees: | ||||
Investor Class | 4,383 | 191 | 31 | 26,417 |
Class A1 | 14,682 | 595 | 728 | 88,035 |
Class C2 | 4,836 | 136 | 6 | 159,904 |
Directors' fees | 112,843 | 48,803 | 4,084 | 36,269 |
Pricing fees | 67,432 | 34,957 | 12,007 | 24,889 |
Audit and tax fees | 57,239 | 21,408 | 1,845 | 14,639 |
Legal fees | 31,067 | 12,239 | 1,042 | 7,939 |
Registration and filing fees | 53,282 | 44,153 | 41,033 | 57,317 |
Shareholder communications | 74,637 | 33,175 | 2,278 | 21,040 |
Transfer agent fees | 220,600 | 128,486 | 7,082 | 167,140 |
Recoupment of investment advisory fees previously waived | — | 1,701 | 7,328 | 50,348 |
Miscellaneous expenses | 58,053 | 23,734 | 5,389 | 15,220 |
Total expenses excluding dividend expense | 5,741,208 | 3,229,391 | 295,273 | 3,066,299 |
Dividend expense | — | — | 33,050 | — |
Total expense | 5,741,208 | 3,229,391 | 328,323 | 3,066,299 |
Less waivers and/or reimbursements (Note 6) | — | — | (1) | (11,551) |
Net expenses | 5,741,208 | 3,229,391 | 328,322 | 3,054,748 |
Net investment income (loss) | (396,661) | 21,773 | 304,916 | (1,225,583) |
| Realized and Unrealized Gain (Loss) | ||||
Net realized gain/(loss) on investments and foreign currency transactions | 47,318,581 | 20,970,418 | (919,497) | 13,705,396 |
Net realized gain on securities sold short | — | 24,452 | — | — |
Net realized gain on written options | — | 210,704 | — | — |
Net change in unrealized appreciation on investments and foreign currency translations | 66,324,547 | 62,538,447 | 5,207,657 | 42,169,270 |
Net change in unrealized depreciation on securities sold short | — | — | (191,874) | — |
Net change in unrealized depreciaton on written options | — | (3,428,914) | (20,872) | — |
Total realized and unrealized gain | 113,643,128 | 80,315,107 | 4,075,414 | 55,874,666 |
Net increase in net assets resulting from operations | $113,246,467 | $80,336,880 | $4,380,330 | $54,649,083 |
| 1 | On July 1, 2015, the Fund's Advisor Class Shares were redesignated as Class A Shares. |
| 2 | Commenced operations on July 1, 2015. |
| Meridian Funds | 39 | www.meridianfund.com |
Table of Contents
Statements of Changes in Net Assets
| Meridian Growth Fund | Meridian Contrarian Fund | ||||
| Changes in Net Assets From: | Six Months Ended December 31, 2016 (Unaudited) | Year Ended June 30, 2016 | Six Months Ended December 31, 2016 (Unaudited) | Year Ended June 30, 2016 | |
| Operations | |||||
Net investment income/(loss) | $ (396,661) | $ (4,652,504) | $ 21,773 | $ (795,586) | |
Net realized gain/(loss) on investments and foreign currency transactions | 47,318,581 | 25,097,317 | 21,205,574 | (5,981,383) | |
Net change in unrealized appreciation/(depreciation) on investments | 66,324,547 | (124,083,624) | 59,109,533 | (37,793,171) | |
Net increase (decrease) in net assets resulting from operations and foreign currency translations | 113,246,467 | (103,638,811) | 80,336,880 | (44,570,140) | |
| Distributions to Shareholders From: | |||||
| Net Investment income: | |||||
Legacy Class | — | — | (176,151) | (371,096) | |
Institutional Class | — | — | — | — | |
Class A1 | — | — | — | — | |
Class C2 | — | — | — | — | |
Investor Class | — | — | — | — | |
| Net Realized Gains: | |||||
Legacy Class | (6,721,792) | (131,256,915) | (2,817,022) | (84,726,393) | |
Institutional Class | (338,118) | (4,467,337) | — | — | |
Class A1 | (72,390) | (897,195) | (2,356) | (76,522) | |
Class C2 | (6,716) | (15,808) | (178) | (1,960) | |
Investor Class | (301,770) | (3,547,289) | (8,820) | (122,913) | |
Decrease in net assets from distributions | (7,440,786) | (140,184,544) | (3,004,527) | (85,298,884) | |
| Fund Share Transactions | |||||
Net decrease in net assets resulting from fund share transactions (Note 2) | (41,018,886) | (514,953,981) | (34,041,474) | (10,184,223) | |
Total increase (decrease) in net assets | 64,786,795 | (758,777,336) | 43,290,879 | (140,053,247) | |
| Net Assets | |||||
Beginning of Period | 1,249,017,967 | 2,007,795,303 | 538,714,654 | 678,767,901 | |
End of Period* | $1,313,804,762 | $1,249,017,967 | $582,005,533 | $ 538,714,654 | |
*Includes accumulated distributions in excess of net investment income | $ (3,386,768) | $ (2,990,107) | $ (578,242) | $ (423,864) | |
| 1 | On July 1, 2015, the Fund's Advisor Class Shares were redesignated as Class A Shares. |
| 2 | Commenced operations on July 1, 2015. |
| Meridian Funds | 40 | www.meridianfund.com |
Table of Contents
Statements of Changes in Net Assets (continued)
| Meridian Equity Income Fund | Meridian Small Cap Growth Fund | ||||
| Changes in Net Assets From: | Six Months Ended December 31, 2016 (Unaudited) | Year Ended June 30, 2016 | Six Months Ended December 31, 2016 (Unaudited) | Year Ended June 30, 2016 | |
| Operations | |||||
Net investment income/(loss) | $ 304,916 | $ 388,595 | $ (1,225,583) | $ (1,833,189) | |
Net realized gain/(loss) on investments and foreign currency transactions | (919,497) | (3,235,716) | 13,705,396 | (10,082,386) | |
Net change in unrealized appreciation/(depreciation) on investments, written options, securities sold short, and foreign currency translations | 4,994,911 | 883,673 | 42,169,270 | (5,481,244) | |
Net increase (decrease) in net assets resulting from operations and foreign currency translations | 4,380,330 | (1,963,448) | 54,649,083 | (17,396,819) | |
| Distributions to Shareholders From: | |||||
| Net Investment income: | |||||
Legacy Class | (362,896) | — | — | — | |
Institutional Class | — | — | — | — | |
Class A1 | (2,557) | — | — | — | |
Class C2 | (1) | — | — | — | |
Investor Class | (1,454) | — | — | — | |
| Net Realized Gains: | |||||
Legacy Class | — | (1,933,942) | — | (625,851) | |
Institutional Class | — | — | — | (380,054) | |
Class A1 | — | (22,469) | — | (766,627) | |
Class C2 | — | (39) | — | (267,924) | |
Investor Class | — | (9,061) | — | (2,271,069) | |
Decrease in net assets from distributions | (366,908) | (1,965,511) | — | (4,311,525) | |
| Fund Share Transactions | |||||
Net increase (decrease) in net assets resulting from fund share transactions (Note 2) | (2,248,106) | (4,026,163) | 195,786,920 | 107,561,071 | |
Total increase (decrease) in net assets | 1,765,316 | (7,955,122) | 250,436,003 | 85,852,727 | |
| Net Assets | |||||
Beginning of Period | 46,006,223 | 53,961,345 | 334,743,346 | 248,890,619 | |
End of Period* | $47,771,539 | $46,006,223 | $585,179,349 | $334,743,346 | |
*Includes accumulated undistributed (distributions in excess of) net investment income | $ 304,900 | $ 366,892 | $ (2,221,012) | $ (995,429) | |
| 1 | On July 1, 2015, the Fund's Advisor Class Shares were redesignated as Class A Shares. |
| 2 | Commenced operations on July 1, 2015. |
| Meridian Funds | 41 | www.meridianfund.com |
Table of Contents
Financial Highlights
| For the Six Months Ended December 31, | For the Fiscal Year Ended June 30, | |||||
| Legacy Class | 2016 (Unaudited) | 2016 | 2015 | 2014 | 2013 | 2012 |
| Per Share Operating Performance | ||||||
Net asset value, beginning of period | $ 32.70 | $ 37.80 | $ 37.86 | $ 44.31 | $ 45.06 | $ 47.61 |
| Income (loss) from investment operations | ||||||
Net investment income (loss)1 | (0.01) | (0.10) | (0.15) | (0.11) | 0.05 | 0.10 |
Net realized and unrealized gain(loss) | 3.00 | (1.26) | 4.37 | 6.89 | 6.23 | 0.69 |
Net increase(decrease) from investment operations | 2.99 | (1.36) | 4.22 | 6.78 | 6.28 | 0.79 |
| Less distributions to shareholders: | ||||||
Distributions from net investment income | 0.00 | 0.00 | 0.00 | (0.00) 2 | (0.15) | (0.07) |
Distributions from net realized capital gains | (0.20) | (3.74) | (4.28) | (13.23) | (6.88) | (3.27) |
Total distributions to shareholders | (0.20) | (3.74) | (4.28) | (13.23) | (7.03) | (3.34) |
Redemption fees | 0.00 2 | 0.00 2 | 0.00 2 | 0.00 | 0.00 | 0.00 |
Net asset value, end of period | $ 35.49 | $ 32.70 | $ 37.80 | $ 37.86 | $ 44.31 | $ 45.06 |
Total return | 9.13% 3 | (2.94)% | 11.85% | 17.31% | 15.54% | 2.45% |
| Ratios to Average Net Assets | ||||||
Ratio of net investment income (loss) to average net assets | (0.06)% 4 | (0.30)% | (0.41)% | (0.27)% | 0.11% | 0.22% |
Ratio of expenses to average net assets: | 0.87% 4 | 0.86% | 0.84% | 0.86% | 0.87% | 0.85% |
| Supplemental Data | ||||||
Net Assets, End of Period (000's) | $1,186,048 | $1,161,981 | $1,937,346 | $2,021,197 | $2,112,945 | $2,484,084 |
Portfolio Turnover Rate | 18% 3 | 67% | 46% | 96% | 37% | 25% |
| 1 | Per share net investment income has been calculated using the average daily shares method. |
| 2 | Less than $0.005 per share. |
| 3 | Not Annualized. |
| 4 | Annualized. |
| Meridian Funds | 42 | www.meridianfund.com |
Table of Contents
Financial Highlights
| Institutional Class | For the Six Months Ended December 31,2016 (Unaudited) | For the Fiscal Year Ended June 30,2016 | For the Period Ended June 30,20151 | ||
| Per Share Operating Performance | |||||
Net asset value, beginning of period | $ 32.68 | $ 37.79 | $ 36.44 | ||
| Income (loss) from investment operations | |||||
Net investment loss2 | (0.01) | (0.13) | (0.04) | ||
Net realized and unrealized gain(loss) | 3.00 | (1.24) | 1.39 | ||
Net increase(decrease) from investment operations | 2.99 | (1.37) | 1.35 | ||
| Less distributions to shareholders: | |||||
Distributions from net realized capital gains | (0.20) | (3.74) | 0.00 | ||
Total distributions to shareholders | (0.20) | (3.74) | 0.00 | ||
Redemption fees | 0.00 3 | 0.00 3 | 0.00 | ||
Net asset value, end of period | $ 35.47 | $ 32.68 | $ 37.79 | ||
Total return | 9.14% 4 | (2.97)% | 3.70% 4 | ||
| Ratios to Average Net Assets | |||||
Ratio of net investment loss to average net assets | (0.05)% 5 | (0.40)% | (0.21)% 5 | ||
| Ratio of expenses to average net assets: | |||||
Total expense | 0.87% 5 | 0.90% | 1.15% 5 | ||
Before fees waived and excluding recoupment of past waived fees | 0.87% 5 | 0.87% | 1.15% 5 | ||
After fees waived and excluding recoupment of past waived fees6 | 0.87% 5 | 0.87% | 0.90% 5 | ||
| Supplemental Data | |||||
Net Assets, End of Period (000's) | $ 60,059 | $ 45,687 | $ 19,575 | ||
Portfolio Turnover Rate | 18% 4 | 67% | 46% 4 | ||
| 1 | Commenced operations on December 24, 2014. |
| 2 | Per share net investment income has been calculated using the average daily shares method. |
| 3 | Less than $0.005 per share. |
| 4 | Not Annualized. |
| 5 | Annualized. |
| 6 | See Note 6 to Financial Statements. |
| Meridian Funds | 43 | www.meridianfund.com |
Table of Contents
Financial Highlights
| For the Six Months Ended December 31, | For the Fiscal Year Ended June 30, | For the Period Ended June 30, | |||
| Class A | 2016 (Unaudited) | 2016 1 | 2015 | 2014 2 | |
| Per Share Operating Performance | |||||
Net asset value, beginning of period | $ 32.10 | $ 37.37 | $ 37.72 | $ 35.67 | |
| Income (loss) from investment operations | |||||
Net investment loss3 | (0.07) | (0.29) | (0.41) | (0.21) | |
Net realized and unrealized gain(loss) | 2.95 | (1.24) | 4.33 | 2.26 | |
Net increase(decrease) from investment operations | 2.88 | (1.53) | 3.92 | 2.05 | |
| Less distributions to shareholders: | |||||
Distributions from net realized capital gains | (0.20) | (3.74) | (4.28) | (0.00) 4 | |
Total distributions to shareholders | (0.20) | (3.74) | (4.28) | (0.00) 4 | |
Redemption fees | 0.00 4 | 0.00 4 | 0.01 | 0.00 | |
Net asset value, end of period | $ 34.78 | $ 32.10 | $ 37.37 | $ 37.72 | |
Total return | 8.96% 5 | (3.45)% | 11.08% | 5.75% 5 | |
| Ratios to Average Net Assets | |||||
Ratio of net investment loss to average net assets | (0.35)% 6 | (0.89)% | (1.11)% | (0.93)% 6 | |
| Ratio of expenses to average net assets: | |||||
Total expense | 1.18% 6 | 1.40% | 1.69% | 2.00% 6 | |
Before fees waived and excluding recoupment of past waived fees | 1.18% 6 | 1.22% | 1.69% | 2.00% 6 | |
After fees waived and excluding recoupment of past waived fees7 | 1.18% 6 | 1.22% | 1.55% | 1.55% 6 | |
| Supplemental Data | |||||
Net Assets, End of Period (000's) | $ 12,710 | $ 8,832 | $ 8,812 | $ 4,904 | |
Portfolio Turnover Rate | 18% 5 | 67% | 46% | 96% 5 | |
| 1 | On July 1, 2015, the Fund's Advisor Class Shares were redesignated as Class A Shares. |
| 2 | Commenced operations on November 15, 2013. |
| 3 | Per share net investment income has been calculated using the average daily shares method. |
| 4 | Less than $0.005 per share. |
| 5 | Not Annualized. |
| 6 | Annualized. |
| 7 | See Note 6 to Financial Statements. |
| Meridian Funds | 44 | www.meridianfund.com |
Table of Contents
Financial Highlights
| Class C | For the Six Months Ended December 31,2016 (Unaudited) | For the Fiscal Year Ended June 30,20161 | |
| Per Share Operating Performance | |||
Net asset value, beginning of period | $ 32.34 | $ 37.80 | |
| Income (loss) from investment operations | |||
| Net investment loss2 | (0.34) | (0.52) | |
Net realized and unrealized loss | 3.12 | (1.20) | |
Net increase(decrease) from investment operations | 2.78 | (1.72) | |
| Less distributions to shareholders: | |||
Distributions from net realized capital gains | (0.20) | (3.74) | |
Total distributions to shareholders | (0.20) | (3.74) | |
Redemption fees | 0.00 | 0.00 | |
Net asset value, end of period | $ 34.92 | $ 32.34 | |
Total return | 8.58% 3 | (3.95)% 3 | |
| Ratios to Average Net Assets | |||
Ratio of net investment loss to average net assets | (1.09)% 4 | (1.68)% 4 | |
Ratio of expenses to average net assets: | 1.91% 4 | 1.95% 4 | |
| Supplemental Data | |||
Net Assets, End of Period (000's) | $ 1,224 | $ 804 | |
Portfolio Turnover Rate | 18% 3 | 67% 3 | |
| 1 | Commenced operations on July 1, 2015. |
| 2 | Per share net investment income has been calculated using the average daily shares method. |
| 3 | Not Annualized. |
| 4 | Annualized. |
| Meridian Funds | 45 | www.meridianfund.com |
Table of Contents
Financial Highlights
| For the Six Months Ended December 31, | For the Fiscal Year Ended June 30, | For the Period Ended June 30, | |||
| Investor Class | 2016 (Unaudited) | 2016 | 2015 | 2014 1 | |
| Per Share Operating Performance | |||||
Net asset value, beginning of period | $ 32.48 | $ 37.61 | $ 37.78 | $ 35.67 | |
| Income (loss) from investment operations | |||||
Net investment loss2 | (0.02) | (0.14) | (0.27) | (0.16) | |
Net realized and unrealized gain/(loss) | 2.97 | (1.26) | 4.37 | 2.27 | |
Net increase(decrease) from investment operations | 2.95 | (1.40) | 4.10 | 2.11 | |
| Less distributions to shareholders: | |||||
Distributions from net realized capital gains | (0.20) | (3.74) | (4.28) | (0.00) 3 | |
Total distributions to shareholders | (0.20) | (3.74) | (4.28) | (0.00) 3 | |
Redemption fees | 0.01 | 0.01 | 0.01 | 0.00 | |
Net asset value, end of period | $ 35.24 | $ 32.48 | $ 37.61 | $ 37.78 | |
Total return | 9.10% 4 | (3.04)% | 11.56% | 5.92% 4 | |
| Ratios to Average Net Assets | |||||
Ratio of net investment loss to average net assets | (0.08)% 5 | (0.43)% | (0.73)% | (0.70)% 5 | |
| Ratio of expenses to average net assets: | |||||
Total expense | 0.94% 5 | 0.97% | 1.16% | 1.30% 5 | |
Before fees waived and excluding recoupment of past waived fees6 | 0.94% 5 | 0.97% | 1.16% | 1.30% 5 | |
After fees waived and excluding recoupment of past waived fees | 0.94% 5 | 0.97% | 1.16% | 1.30% 5 | |
| Supplemental Data | |||||
Net Assets, End of Period (000's) | $ 53,764 | $ 31,714 | $ 42,062 | $ 18,749 | |
Portfolio Turnover Rate | 18% 4 | 67% | 46% | 96% 4 | |
| 1 | Commenced operations on November 15, 2013. |
| 2 | Per share net investment income has been calculated using the average daily shares method. |
| 3 | Less than $0.005 per share. |
| 4 | Not Annualized. |
| 5 | Annualized. |
| 6 | See Note 6 to Financial Statements. |
| Meridian Funds | 46 | www.meridianfund.com |
Table of Contents
Financial Highlights
| For the Six Months Ended December 31, | For the Fiscal Year Ended June 30, | |||||
| Legacy Class | 2016 (Unaudited) | 2016 | 2015 | 2014 | 2013 | 2012 |
| Per Share Operating Performance | ||||||
Net asset value, beginning of period | $ 32.42 | $ 40.44 | $ 45.52 | $ 37.20 | $ 30.60 | $ 29.59 |
| Income (loss) from investment operations | ||||||
Net investment income (loss)1 | 0.00 | (0.05) | (0.00) 2 | 0.01 | 0.14 | 0.09 |
Net realized and unrealized gain(loss) | 4.96 | (2.60) | 2.66 | 8.63 | 6.57 | 1.05 3 |
Net increase(decrease) from investment operations | 4.96 | (2.65) | 2.66 | 8.64 | 6.71 | 1.14 |
| Less distributions to shareholders: | ||||||
Distributions from net investment income | (0.01) | (0.02) | (0.09) | (0.18) | (0.11) | (0.13) |
Distributions from net realized capital gains | (0.18) | (5.35) | (7.65) | (0.14) | 0.00 | 0.00 |
Total distributions to shareholders | (0.19) | (5.37) | (7.74) | (0.32) | (0.11) | (0.13) |
Redemption fees | 0.00 2 | 0.00 2 | 0.00 2 | 0.00 | 0.00 | 0.00 |
Net asset value, end of period | $ 37.19 | $ 32.42 | $ 40.44 | $ 45.52 | $ 37.20 | $ 30.60 |
Total return | 15.30% 4 | (6.33)% | 6.84% | 23.31% | 21.98% | 3.89% 3 |
| Ratios to Average Net Assets | ||||||
Ratio of net investment income (loss) to average net assets | 0.01% 5 | (0.14)% | (0.01)% | 0.01% | 0.41% | 0.31% |
Ratio of expenses to average net assets: | 1.13% 5 | 1.13% | 1.11% | 1.13% | 1.16% | 1.14% |
| Supplemental Data | ||||||
Net Assets, End of Period (000's) | $579,629 | $536,799 | $677,138 | $764,882 | $704,523 | $688,467 |
Portfolio Turnover Rate | 27% 4 | 73% | 76% | 67% | 55% | 20% |
| 1 | Per share net investment income has been calculated using the average daily shares method. |
| 2 | Less than $0.005 per share. |
| 3 | Includes a gain resulting from litigation payments on securities owned in a prior year. Without these gains, the net realized gains on investments per share would have been $0.99, and the total return would have been 3.69%. |
| 4 | Not Annualized. |
| 5 | Annualized. |
| Meridian Funds | 47 | www.meridianfund.com |
Table of Contents
Financial Highlights
| For the Six Months Ended December 31, | For the Fiscal Year Ended June 30, | For the Period Ended June 30, | |||
| Class A | 2016 (Unaudited) | 2016 1 | 2015 | 2014 2 | |
| Per Share Operating Performance | |||||
Net asset value, beginning of period | $ 32.08 | $ 40.22 | $ 45.41 | $ 42.64 | |
| Income (loss) from investment operations | |||||
Net investment loss3 | (0.07) | (0.21) | (0.22) | (0.08) | |
Net realized and unrealized gain(loss) | 4.89 | (2.58) | 2.68 | 3.02 | |
Net increase(decrease) from investment operations | 4.82 | (2.79) | 2.46 | 2.94 | |
| Less distributions to shareholders: | |||||
Distributions from net investment income | 0.00 | 0.00 | 0.00 | (0.17) | |
Distributions from net realized capital gains | (0.18) | (5.35) | (7.65) | 0.00 | |
Total distributions to shareholders | (0.18) | (5.35) | (7.65) | (0.17) | |
Redemption fees | 0.00 | 0.00 | 0.00 | 0.00 | |
Net asset value, end of period | $ 36.72 | $ 32.08 | $ 40.22 | $ 45.41 | |
Total return | 15.02% 4 | (6.75)% | 6.38% | 6.91% 4 | |
| Ratios to Average Net Assets | |||||
Ratio of net investment loss to average net assets | (0.45)% 5 | (0.60)% | (0.52)% | (0.30)% 5 | |
| Ratio of expenses to average net assets: | |||||
Total expense | 1.60% 5 | 1.60% | 3.46% | 7.46% 5 | |
Before fees waived and excluding recoupment of past waived fees | 1.43% 5 | 1.46% | 3.46% | 7.46% 5 | |
After fees waived and excluding recoupment of past waived fees6 | 1.43% 5 | 1.46% | 1.60% | 1.60% 5 | |
| Supplemental Data | |||||
Net Assets, End of Period (000's) | $ 522 | $ 431 | $ 622 | $ 462 | |
Portfolio Turnover Rate | 27% 4 | 73% | 76% | 67% 4 | |
| 1 | On July 1, 2015, the Fund's Advisor Class Shares were redesignated as Class A Shares. |
| 2 | Commenced operations on November 15, 2013. |
| 3 | Per share net investment income has been calculated using the average daily shares method. |
| 4 | Not Annualized. |
| 5 | Annualized. |
| 6 | See Note 6 to Financial Statements. |
| Meridian Funds | 48 | www.meridianfund.com |
Table of Contents
Financial Highlights
| Class C | For the Six Months Ended December 31,2016 (Unaudited) | For the Fiscal Year Ended June 30,20161 | |
| Per Share Operating Performance | |||
Net asset value, beginning of period | $ 32.09 | $ 40.54 | |
| Income (loss) from investment operations | |||
| Net investment loss2 | (0.29) | (0.36) | |
Net realized and unrealized loss | 5.01 | (2.74) | |
Net increase(decrease) from investment operations | 4.72 | (3.10) | |
| Less distributions to shareholders: | |||
Distributions from net realized capital gains | (0.18) | (5.35) | |
Total distributions to shareholders | (0.18) | (5.35) | |
Redemption fees | 0.00 | 0.00 | |
Net asset value, end of period | $ 36.63 | $ 32.09 | |
Total return | 14.70% 3 | (7.50)% 3 | |
| Ratios to Average Net Assets | |||
Ratio of net investment loss to average net assets | (0.97)% 4 | (1.11)% 4 | |
Ratio of expenses to average net assets: | 2.15% 4 | 2.19% 4 | |
| Supplemental Data | |||
Net Assets, End of Period (000's) | $ 40 | $ 14 | |
Portfolio Turnover Rate | 27% 3 | 73% 3 | |
| 1 | Commenced operations on July 1, 2015. |
| 2 | Per share net investment income has been calculated using the average daily shares method. |
| 3 | Not Annualized. |
| 4 | Annualized. |
| Meridian Funds | 49 | www.meridianfund.com |
Table of Contents
Financial Highlights
| For the Six Months Ended December 31, | For the Fiscal Year Ended June 30, | For the Period Ended June 30, | |||
| Investor Class | 2016 (Unaudited) | 2016 | 2015 | 2014 1 | |
| Per Share Operating Performance | |||||
Net asset value, beginning of period | $ 32.34 | $ 40.40 | $ 45.47 | $ 42.64 | |
| Income (loss) from investment operations | |||||
Net investment loss2 | (0.04) | (0.13) | (0.09) | (0.02) | |
Net realized and unrealized gain/(loss) | 4.95 | (2.59) | 2.66 | 3.03 | |
Net increase(decrease) from investment operations | 4.91 | (2.72) | 2.57 | 3.01 | |
| Less distributions to shareholders: | |||||
Distributions from net investment income | 0.00 | 0.00 | 0.00 | (0.18) | |
Distributions from net realized capital gains | (0.18) | (5.35) | (7.65) | 0.00 | |
Total distributions to shareholders | (0.18) | (5.35) | (7.65) | (0.18) | |
Redemption fees | 0.00 | 0.01 | 0.01 | 0.00 | |
Net asset value, end of period | $ 37.07 | $ 32.34 | $ 40.40 | $ 45.47 | |
Total return | 15.18% 3 | (6.50)% | 6.67% | 7.08% 3 | |
| Ratios to Average Net Assets | |||||
Ratio of net investment loss to average net assets | (0.20)% 4 | (0.40)% | (0.21)% | (0.09)% 4 | |
| Ratio of expenses to average net assets: | |||||
Total expense | 1.35% 4 | 1.35% | 2.34% | 3.51% 4 | |
Before fees waived and excluding recoupment of past waived fees | 1.19% 4 | 1.24% | 2.34% | 3.51% 4 | |
After fees waived and excluding recoupment of past waived fees5 | 1.19% 4 | 1.24% | 1.35% | 1.35% 4 | |
| Supplemental Data | |||||
Net Assets, End of Period (000's) | $ 1,814 | $ 1,471 | $ 1,008 | $ 1,564 | |
Portfolio Turnover Rate | 27% 3 | 73% | 76% | 67% 3 | |
| 1 | Commenced operations on November 15, 2013. |
| 2 | Per share net investment income has been calculated using the average daily shares method. |
| 3 | Not Annualized. |
| 4 | Annualized. |
| 5 | See Note 6 to Financial Statements. |
| Meridian Funds | 50 | www.meridianfund.com |
Table of Contents
Financial Highlights
| For the Six Months Ended December 31, | For the Fiscal Year Ended June 30, | |||||
| Legacy Class | 2016 (Unaudited) | 2016 | 2015 | 2014 | 2013 | 2012 |
| Per Share Operating Performance | ||||||
Net asset value, beginning of period | $ 11.60 | $ 12.51 | $ 14.59 | $ 12.35 | $ 10.71 | $ 10.61 |
| Income (loss) from investment operations | ||||||
Net investment income1 | 0.08 | 0.09 | 0.12 | 0.24 | 0.24 | 0.22 |
Net realized and unrealized gain(loss) | 1.05 | (0.51) | 0.47 | 2.22 | 1.68 | 0.09 |
Net increase(decrease) from investment operations | 1.13 | (0.42) | 0.59 | 2.46 | 1.92 | 0.31 |
| Less distributions to shareholders: | ||||||
Distributions from net investment income | (0.10) | 0.00 | (0.25) | (0.22) | (0.28) | (0.21) |
Distributions from net realized capital gains | 0.00 | (0.49) | (2.42) | 0.00 | 0.00 | 0.00 |
Total distributions to shareholders | (0.10) | (0.49) | (2.67) | (0.22) | (0.28) | (0.21) |
Redemption fees | 0.00 2 | 0.00 2 | 0.00 2 | 0.00 2 | 0.00 | 0.00 |
Net asset value, end of period | $ 12.63 | $ 11.60 | $ 12.51 | $ 14.59 | $ 12.35 | $ 10.71 |
Total return | 9.72% 3 | (3.35)% | 4.46% | 20.04% | 18.28% | 3.09% |
| Ratios to Average Net Assets | ||||||
Ratio of net investment income to average net assets | 1.30% 4 | 0.82% | 0.88% | 1.75% | 2.08% | 2.17% |
Ratio of expenses to average net assets: | ||||||
Total expense | 1.39% 4 | 1.29% | 1.33% | 1.37% | 1.53% | 1.41% |
Before fees waived and excluding recoupment of past waived fees | 1.36% 4 | 1.27% | 1.33% | 1.37% | 1.53% | 1.41% |
After fees waived and excluding recoupment of past waived fees5 | 1.36% 4 | 1.27% | 1.25% | 1.25% | 1.25% | 1.25% |
After fees waived and excluding recoupment of past waived fess and dividend expenses | 1.22% 4 | 1.23% | 1.25% | 1.25% | 1.25% | 1.25% |
| Supplemental Data | ||||||
Net Assets, End of Period (000's) | $46,979 | $ 45,251 | $53,125 | $ 33,649 | $ 28,697 | $30,744 |
Portfolio Turnover Rate | 16% 3 | 57% | 266% | 35% | 44% | 31% |
| 1 | Per share net investment income has been calculated using the average daily shares method. |
| 2 | Less than $0.005 per share. |
| 3 | Not Annualized. |
| 4 | Annualized. |
| 5 | See Note 6 to Financial Statements. |
| Meridian Funds | 51 | www.meridianfund.com |
Table of Contents
Financial Highlights
| For the Six Months Ended December 31, | For the Fiscal Year Ended June 30, | For the Period Ended June 30, | |||
| Class A | 2016 (Unaudited) | 2016 1 | 2015 | 2014 2 | |
| Per Share Operating Performance | |||||
Net asset value, beginning of period | $ 11.54 | $ 12.50 | $ 14.58 | $ 13.87 | |
| Income (loss) from investment operations | |||||
Net investment income (loss)3 | 0.06 | 0.06 | (0.02) | 0.13 | |
Net realized and unrealized gain(loss) | 1.05 | (0.53) | 0.58 | 0.78 | |
Net increase(decrease) from investment operations | 1.11 | (0.47) | 0.56 | 0.91 | |
| Less distributions to shareholders: | |||||
Distributions from net investment income | (0.06) | 0.00 | (0.22) | (0.20) | |
Distributions from net realized capital gains | 0.00 | (0.49) | (2.42) | 0.00 | |
Total distributions to shareholders | (0.06) | (0.49) | (2.64) | (0.20) | |
Redemption fees | 0.00 | 0.00 | 0.00 | 0.00 | |
Net asset value, end of period | $ 12.59 | $ 11.54 | $ 12.50 | $ 14.58 | |
Total return | 9.59% 4 | (3.76)% | 4.24% | 6.69% 4 | |
| Ratios to Average Net Assets | |||||
Ratio of net investment income(loss) to average net assets | 0.96% 5 | 0.50% | (0.11)% | 1.55% 5 | |
| Ratio of expenses to average net assets: | |||||
Total expense | 1.74% 5 | 1.69% | 7.46% | 132.38% 5 | |
Before fees waived and excluding recoupment of past waived fees | 1.73% 5 | 1.69% | 7.46% | 132.38% 5 | |
After fees waived and excluding recoupment of past waived fees6 | 1.73% 5 | 1.64% | 1.60% | 1.60% 5 | |
After fees waived and excluding recoupment of past waived fess and dividend expenses | 1.60% 5 | 1.60% | 1.60% | 1.60% 5 | |
| Supplemental Data | |||||
Net Assets, End of Period (000's) | $ 562 | $ 502 | $ 501 | $ 13 | |
Portfolio Turnover Rate | 16% 4 | 57% | 266% | 35% 4 | |
| 1 | On July 1, 2015, the Fund's Advisor Class Shares were redesignated as Class A Shares. |
| 2 | Commenced operations on November 15, 2013. |
| 3 | Per share net investment income has been calculated using the average daily shares method. |
| 4 | Not Annualized. |
| 5 | Annualized. |
| 6 | See Note 6 to Financial Statements. |
| Meridian Funds | 52 | www.meridianfund.com |
Table of Contents
Financial Highlights
| Class C | For the Six Months Ended December 31,2016 (Unaudited) | For the Fiscal Year Ended June 30,20161 | |
| Per Share Operating Performance | |||
Net asset value, beginning of period | $ 11.50 | $ 12.56 | |
| Income (loss) from investment operations | |||
| Net investment income2 | 0.04 | 0.00 | |
Net realized and unrealized loss | 1.05 | (0.57) | |
Net increase(decrease) from investment operations | 1.09 | (0.57) | |
| Less distributions to shareholders: | |||
Distributions from net investment income | (0.01) | 0.00 | |
Distributions from net realized capital gains | 0.00 | (0.49) | |
Total distributions to shareholders | (0.01) | (0.49) | |
Redemption fees | 0.00 | 0.00 | |
Net asset value, end of period | $ 12.58 | $ 11.50 | |
Total return | 9.43% 3 | (4.55)% 3 | |
| Ratios to Average Net Assets | |||
Ratio of net investment income to average net assets | 0.50% 4 | 0.04% 4 | |
| Ratio of expenses to average net assets: | |||
Total expense | 2.36% 4 | 2.33% 4 | |
Before fees waived and excluding recoupment of past waived fees | 2.36% 4 | 2.33% 4 | |
After fees waived and excluding recoupment of past waived fees5 | 2.14% 4 | 2.04% 4 | |
After fees waived and excluding recoupment of past waived fess and dividend expenses | 2.14% 4 | 2.00% 4 | |
| Supplemental Data | |||
Net Assets, End of Period (000's) | $ 1 | $ 1 | |
Portfolio Turnover Rate | 16% 3 | 57% 3 | |
| 1 | Commenced operations on July 1, 2015. |
| 2 | Per share net investment income has been calculated using the average daily shares method. |
| 3 | Not Annualized. |
| 4 | Annualized. |
| 5 | See Note 6 to Financial Statements. |
| Meridian Funds | 53 | www.meridianfund.com |
Table of Contents
Financial Highlights
| For the Six Months Ended December 31, | For the Fiscal Year Ended June 30, | For the Period Ended June 30, | |||
| Investor Class | 2016 (Unaudited) | 2016 | 2015 | 2014 1 | |
| Per Share Operating Performance | |||||
Net asset value, beginning of period | $ 11.60 | $ 12.53 | $ 14.60 | $ 13.87 | |
| Income (loss) from investment operations | |||||
Net investment income (loss)2 | 0.06 | 0.08 | (0.02) | 0.15 | |
Net realized and unrealized gain/(loss) | 1.07 | (0.52) | 0.61 | 0.79 | |
Net increase(decrease) from investment operations | 1.13 | (0.44) | 0.59 | 0.94 | |
| Less distributions to shareholders: | |||||
Distributions from net investment income | (0.08) | 0.00 | (0.24) | (0.21) | |
Distributions from net realized capital gains | 0.00 | (0.49) | (2.42) | 0.00 | |
Total distributions to shareholders | (0.08) | (0.49) | (2.66) | (0.21) | |
Redemption fees | 0.00 | 0.00 3 | 0.00 | 0.00 | |
Net asset value, end of period | $ 12.65 | $ 11.60 | $ 12.53 | $ 14.60 | |
Total return | 9.74% 4 | (3.51)% | 4.44% | 6.87% 4 | |
| Ratios to Average Net Assets | |||||
Ratio of net investment income(loss) to average net assets | 1.18% 5 | 0.68% | (0.13)% | 1.72% 5 | |
| Ratio of expenses to average net assets: | |||||
Total expense | 1.49% 5 | 1.39% | 16.83% | 39.23% 5 | |
Before fees waived and excluding recoupment of past waived fees | 1.46% 5 | 1.37% | 16.83% | 39.23% 5 | |
After fees waived and excluding recoupment of past waived fees6 | 1.46% 5 | 1.37% | 1.35% | 1.35% 5 | |
After fees waived and excluding recoupment of past waived fess and dividend expenses | 1.32% 5 | 1.32% | 1.35% | 1.35% 5 | |
| Supplemental Data | |||||
Net Assets, End of Period (000's) | $ 229 | $ 252 | $ 335 | $ 45 | |
Portfolio Turnover Rate | 16% 4 | 57% | 266% | 35% 4 | |
| 1 | Commenced operations on November 15, 2013. |
| 2 | Per share net investment income has been calculated using the average daily shares method. |
| 3 | Less than $0.005 per share. |
| 4 | Not Annualized. |
| 5 | Annualized. |
| 6 | See Note 6 to Financial Statements. |
| Meridian Funds | 54 | www.meridianfund.com |
Table of Contents
Financial Highlights
| For the Six Months Ended December 31, | For the Fiscal Year Ended June 30, | For the Period Ended June 30, | |||
| Legacy Class | 2016 (Unaudited) | 2016 | 2015 | 2014 1 | |
| Per Share Operating Performance | |||||
Net asset value, beginning of period | $ 11.87 | $ 12.98 | $ 11.65 | $ 10.00 | |
| Income (loss) from investment operations | |||||
Net investment loss2 | (0.03) | (0.06) | (0.09) | (0.04) | |
Net realized and unrealized gain(loss) | 1.72 | (0.87) | 1.72 | 1.69 | |
Net increase(decrease) from investment operations | 1.69 | (0.93) | 1.63 | 1.65 | |
| Less distributions to shareholders: | |||||
Distributions from net realized capital gains | 0.00 | (0.18) | (0.30) | 0.00 | |
Total distributions to shareholders | 0.00 | (0.18) | (0.30) | 0.00 | |
Redemption fees | 0.00 3 | 0.00 3 | 0.00 3 | 0.00 | |
Net asset value, end of period | $ 13.56 | $ 11.87 | $ 12.98 | $ 11.65 | |
Total return | 14.24% 4 | (7.06)% | 14.23% | 16.50% 4 | |
| Ratios to Average Net Assets | |||||
Ratio of net investment loss to average net assets | (0.44)% 5 | (0.52)% | (0.69)% | (0.61)% 5 | |
Ratio of expenses to average net assets: | |||||
Total expense | 1.20% 5 | 1.20% | 1.24% | 2.35% 5 | |
Before fees waived and excluding recoupment of past waived fees | 1.13% 5 | 1.20% | 1.24% | 2.35% 5 | |
After fees waived and excluding recoupment of past waived fees6 | 1.13% 5 | 1.20% | 1.20% | 1.20% 5 | |
| Supplemental Data | |||||
Net Assets, End of Period (000's) | $ 59,500 | $ 44,001 | $ 59,459 | $ 9,839 | |
Portfolio Turnover Rate | 20% 4 | 62% | 45% | 78% 4 | |
| 1 | Commenced operations on December 16, 2013. |
| 2 | Per share net investment income has been calculated using the average daily shares method. |
| 3 | Less than $0.005 per share. |
| 4 | Not Annualized. |
| 5 | Annualized. |
| 6 | See Note 6 to Financial Statements. |
| Meridian Funds | 55 | www.meridianfund.com |
Table of Contents
Financial Highlights
| Institutional Class | For the Six Months Ended December 31,2016 (Unaudited) | For the Fiscal Year Ended June 30,2016 | For the Period Ended June 30,20151 | ||
| Per Share Operating Performance | |||||
Net asset value, beginning of period | $ 11.88 | $ 12.98 | $ 12.23 | ||
| Income (loss) from investment operations | |||||
Net investment loss2 | (0.03) | (0.05) | (0.02) | ||
Net realized and unrealized gain(loss) | 1.74 | (0.87) | 0.77 | ||
Net increase(decrease) from investment operations | 1.71 | (0.92) | 0.75 | ||
| Less distributions to shareholders: | |||||
Distributions from net realized capital gains | 0.00 | (0.18) | 0.00 | ||
Total distributions to shareholders | 0.00 | (0.18) | 0.00 | ||
Redemption fees | 0.00 3 | 0.00 3 | 0.00 | ||
Net asset value, end of period | $ 13.59 | $ 11.88 | $ 12.98 | ||
Total return | 14.39% 4 | (6.98)% | 6.13% 4 | ||
| Ratios to Average Net Assets | |||||
Ratio of net investment loss to average net assets | (0.34)% 5 | (0.45)% | (0.29)% 5 | ||
| Ratio of expenses to average net assets: | |||||
Total expense | 1.13% 5 | 1.22% | 2.03% 5 | ||
Before fees waived and excluding recoupment of past waived fees | 1.13% 5 | 1.22% | 2.03% 5 | ||
After fees waived and excluding recoupment of past waived fees6 | 1.10% 5 | 1.10% | 1.10% 5 | ||
| Supplemental Data | |||||
Net Assets, End of Period (000's) | $ 82,046 | $ 52,784 | $ 13,035 | ||
Portfolio Turnover Rate | 20% 4 | 62% | 44% 4 | ||
| 1 | Commenced operations on December 24, 2014. |
| 2 | Per share net investment income has been calculated using the average daily shares method. |
| 3 | Less than $0.005 per share. |
| 4 | Not Annualized. |
| 5 | Annualized. |
| 6 | See Note 6 to Financial Statements. |
| Meridian Funds | 56 | www.meridianfund.com |
Table of Contents
Financial Highlights
| For the Six Months Ended December 31, | For the Fiscal Year Ended June 30, | For the Period Ended June 30, | |||
| Class A | 2016 (Unaudited) | 2016 1 | 2015 | 2014 2 | |
| Per Share Operating Performance | |||||
Net asset value, beginning of period | $ 11.76 | $ 12.91 | $ 11.63 | $ 10.00 | |
| Income (loss) from investment operations | |||||
Net investment loss3 | (0.06) | (0.10) | (0.13) | (0.06) | |
Net realized and unrealized gain(loss) | 1.71 | (0.87) | 1.71 | 1.69 | |
Net increase(decrease) from investment operations | 1.65 | (0.97) | 1.58 | 1.63 | |
| Less distributions to shareholders: | |||||
Distributions from net realized capital gains | 0.00 | (0.18) | (0.30) | 0.00 | |
Total distributions to shareholders | 0.00 | (0.18) | (0.30) | 0.00 | |
Redemption fees | 0.00 4 | 0.00 4 | 0.00 4 | 0.00 | |
Net asset value, end of period | $ 13.41 | $ 11.76 | $ 12.91 | $ 11.63 | |
Total return | 14.03% 5 | (7.41)% | 13.82% | 16.30% 5 | |
| Ratios to Average Net Assets | |||||
Ratio of net investment loss to average net assets | (0.77)% 6 | (0.89)% | (1.09)% | (1.01)% 6 | |
| Ratio of expenses to average net assets: | |||||
Total expense | 1.53% 6 | 1.60% | 1.69% | 2.99% 6 | |
Before fees waived and excluding recoupment of past waived fees | 1.44% 6 | 1.56% | 1.69% | 2.99% 6 | |
After fees waived and excluding recoupment of past waived fees7 | 1.44% 6 | 1.56% | 1.60% | 1.60% 6 | |
| Supplemental Data | |||||
Net Assets, End of Period (000's) | $ 73,042 | $ 52,173 | $ 45,186 | $ 6,524 | |
Portfolio Turnover Rate | 20% 5 | 62% | 44% | 78% 5 | |
| 1 | On July 1, 2015, the Fund's Advisor Class Shares were redesignated as Class A Shares. |
| 2 | Commenced operations on November 15, 2013. |
| 3 | Per share net investment income has been calculated using the average daily shares method. |
| 4 | Less than $0.005 per share. |
| 5 | Not Annualized. |
| 6 | Annualized. |
| 7 | See Note 6 to Financial Statements. |
| Meridian Funds | 57 | www.meridianfund.com |
Table of Contents
Financial Highlights
| Class C | For the Six Months Ended December 31,2016 (Unaudited) | For the Fiscal Year Ended June 30,20161 | |
| Per Share Operating Performance | |||
Net asset value, beginning of period | $ 11.74 | $ 12.97 | |
| Income (loss) from investment operations | |||
| Net investment loss2 | (0.13) | (0.17) | |
Net realized and unrealized loss | 1.74 | (0.88) | |
Net increase(decrease) from investment operations | 1.61 | (1.05) | |
| Less distributions to shareholders: | |||
Distributions from net realized capital gains | 0.00 | (0.18) | |
Total distributions to shareholders | 0.00 | (0.18) | |
Redemption fees | 0.00 3 | 0.00 3 | |
Net asset value, end of period | $ 13.35 | $ 11.74 | |
Total return | 13.71% 4 | (8.00)% 4 | |
| Ratios to Average Net Assets | |||
Ratio of net investment loss to average net assets | (1.43)% 5 | (1.50)% 5 | |
| Ratio of expenses to average net assets: | |||
Total expense | 2.19% 5 | 2.28% 5 | |
Before fees waived and excluding recoupment of past waived fees | 2.19% 5 | 2.28% 5 | |
After fees waived and excluding recoupment of past waived fees6 | 2.19% 5 | 2.25% 5 | |
| Supplemental Data | |||
Net Assets, End of Period (000's) | $ 36,682 | $ 23,689 | |
Portfolio Turnover Rate | 20% 4 | 62% 4 | |
| 1 | Commenced operations on July 1, 2015. |
| 2 | Per share net investment income has been calculated using the average daily shares method. |
| 3 | Less than $0.005 per share. |
| 4 | Not Annualized. |
| 5 | Annualized. |
| 6 | See Note 6 to Financial Statements. |
| Meridian Funds | 58 | www.meridianfund.com |
Table of Contents
Financial Highlights
| For the Six Months Ended December 31, | For the Fiscal Year Ended June 30, | For the Period Ended June 30, | |||
| Investor Class | 2016 (Unaudited) | 2016 | 2015 | 2014 1 | |
| Per Share Operating Performance | |||||
Net asset value, beginning of period | $ 11.85 | $ 12.97 | $ 11.65 | $ 10.00 | |
| Income (loss) from investment operations | |||||
Net investment loss2 | (0.04) | (0.07) | (0.10) | (0.04) | |
Net realized and unrealized gain/(loss) | 1.73 | (0.87) | 1.73 | 1.69 | |
Net increase(decrease) from investment operations | 1.69 | (0.94) | 1.63 | 1.65 | |
| Less distributions to shareholders: | |||||
Distributions from net investment income | 0.00 | 0.00 | (0.01) | 0.00 | |
Distributions from net realized capital gains | 0.00 | (0.18) | (0.30) | 0.00 | |
Total distributions to shareholders | 0.00 | (0.18) | (0.31) | 0.00 | |
Redemption fees | 0.00 3 | 0.00 3 | 0.00 | 0.00 | |
Net asset value, end of period | $ 13.54 | $ 11.85 | $ 12.97 | $ 11.65 | |
Total return | 14.26% 4 | (7.15)% | 14.14% | 16.50% 4 | |
| Ratios to Average Net Assets | |||||
Ratio of net investment loss to average net assets | (0.41)% 5 | (0.61)% | (0.83)% | (0.70)% 5 | |
| Ratio of expenses to average net assets: | |||||
Total expense | 1.18% 5 | 1.32% | 1.33% | 3.63% 5 | |
Before fees waived and excluding recoupment of past waived fees | 1.18% 5 | 1.32% | 1.33% | 3.63% 5 | |
After fees waived and excluding recoupment of past waived fees6 | 1.18% 5 | 1.32% | 1.33% | 1.35% 5 | |
| Supplemental Data | |||||
Net Assets, End of Period (000's) | $333,909 | $162,096 | $131,211 | $ 2,135 | |
Portfolio Turnover Rate | 20% 4 | 62% | 44% | 78% 4 | |
| 1 | Commenced operations on November 15, 2013. |
| 2 | Per share net investment income has been calculated using the average daily shares method. |
| 3 | Less than $0.005 per share. |
| 4 | Not Annualized. |
| 5 | Annualized. |
| 6 | See Note 6 to Financial Statements. |
| Meridian Funds | 59 | www.meridianfund.com |
Table of Contents
Notes to Financial Statements
| 1. | Organization and Significant Accounting Policies: Meridian Fund, Inc. (the “Meridian Funds” or the “Company”) comprises the following separate series: the Meridian Growth Fund (the “Growth Fund”), the Meridian Contrarian Fund (the “Contrarian Fund”), the Meridian Equity Income Fund (the “Equity Income Fund”), and the Meridian Small Cap Growth Fund (the “Small Cap Growth Fund”) (each a “Fund” and collectively, the “Funds”). The Company is registered as an open-end investment company under the Investment Company Act of 1940 and is organized as a Maryland corporation. Each Fund is classified as a "diversified" management investment company. |
| Meridian Funds offer five share classes: Legacy Class Shares, Investor Class Shares, Class A Shares, Class C Shares and Institutional Class Shares. Prior to July 1, 2015, Class A Shares were known as Advisor Class Shares. As of December 31, 2016, Institutional Class Shares of the Meridian Equity Income Fund and Meridian Contrarian Fund are not currently being offered for sale. Legacy Class Shares are available to investors who have continuously held an investment in any Meridian Fund prior to November 15, 2013. Institutional Class Shares are available to certain eligible investors including endowments, foundations and qualified retirement plans. Class A, Class C and Investor Class Shares are available for purchase through financial intermediary platforms. Class A Shares are subject to a maximum initial sales charge (front-end load) of 5.75%. Class C Shares are subject to a 1.00% contingent deferred sales charge ("CDSC") if redeemed within one year of purchase. Investor Class Shares are not subject to frond-end load or CDSC and require a higher minimum initial investment. All Classes have identical rights and privileges with respect to the Fund in general, and exclusive voting rights with respect to Class specific matters. Net Asset Value ("NAV") per share may differ by class due to each class having its own expenses directly attributable to that class. Investor Class, Class A and Class C Shares are subject to shareholder servicing and sub-transfer agent fees. Class A and Class C Shares are also subject to certain expenses related to the distribution of these shares. See Note 6 for further information on additional share classes and changes to shareholder servicing and distribution plans. | |
| The primary investment objectives of the Growth Fund and Contrarian Fund are to seek long-term growth of capital. | |
| The primary investment objective of the Equity Income Fund is to seek long-term growth of capital along with income as a component of total return. | |
| The primary investment objective of the Small Cap Growth Fund is to seek long-term growth of capital by investing primarily in equity securities of small capitalization companies. | |
| The following significant accounting policies are consistently followed by the Funds in the preparation of their financial statements in conformity with accounting principles generally accepted in the United States of America (“U.S. GAAP”). Each Fund is considered an investment company under U.S. GAAP and follows the accounting and reporting guidance applicable to investment companies. |
| a. | Share Valuation: The NAV of each Fund is calculated by dividing the sum of the value of the securities held by each Fund, plus cash or other assets, minus all liabilities (including estimated accrued expenses), by the total number of shares outstanding of each Fund. The result is rounded to the nearest cent. Each Funds’ shares will not be priced on the days in which the New York Stock Exchange ("NYSE") is closed for trading. |
| b. | Investment Valuations: Equity securities are valued at the closing price or last sales price on the principal exchange or market on which they are traded; or, if there were no sales that day, at the last reported bid price. |
| Fixed income (debt) securities with original or remaining maturities in excess of 60 days are valued at the mean of their quoted bid and asked prices. Short-term debt securities with 60 days or less to maturity and repurchase agreements are valued at amortized cost which approximates fair market value. | |
| Bond investments are valued on the basis of last available bid prices or current market quotations provided by dealers or pricing services. In determining the value of a particular investment, pricing services may use certain information with respect to transactions in such investments, quotations from dealers, pricing matrixes, market transactions in comparable investments, various relationships observed in the market between investments and calculated yield measures. | |
| Investments in open-end U.S. mutual funds are valued at NAV each business day. | |
| The market value of the Fund’s investments in the exchange traded funds is based on the published NAV of each fund computed as of the close of regular trading on the NYSE on days when the NYSE is open. |
| Meridian Funds | 60 | www.meridianfund.com |
Table of Contents
Notes to Financial Statements (continued)
| Exchange-traded options are valued at the mean between the last bid and ask prices at the close of the options market in which the options trade. An exchange-traded option for which there is no mean price is valued at the last bid (long positions) or ask (short positions) price. If no bid or ask price is available, the prior day’s price will be used, unless it is determined that the prior day’s price no longer reflects the fair value of the option. | |
| Securities and other assets for which reliable market quotations are not readily available or for which a significant event has occurred since the time of the most recent market quotation, will be valued based upon other available factors deemed relevant by the Adviser under the guidelines established by, and under the general supervision and responsibility of, the Board. These factors include but are not limited to (i) attributes specific to the investment; (ii) the principal market for the investment; (iii) the customary participants in the principal market for the investment; (iv) data assumptions by market participants for the investment, if reasonably available; (v) quoted prices for similar investments in active markets; and (vi) other factors, such as future cash flows, interest rates, yield curves, volatilities, prepayment speeds, loss severities, credit risks and/or default rates. Valuations based on such factors are reported to the Board on a quarterly basis. | |
| c. | Fair Value Measurements: As described in Note 1.b. above, the Funds utilize various methods to determine and measure the fair value of investment securities on a recurring basis. The objective of a fair value measurement is to determine the price that would be received to sell an asset or paid to transfer a liability in an orderly transaction between market participants at the measurement date (an exit price). Accordingly, the fair value hierarchy gives the highest priority to quoted prices (unadjusted) in active markets for identical assets or liabilities (Level 1) and the lowest priority to unobservable inputs (Level 3) that are significant to the fair value instrument. The three levels of the fair value hierarchy are described below: |
| Level 1 - quoted prices in active markets for identical securities; | |
| Level 2 - other significant observable inputs (including quoted prices for similar securities, interest rates, prepayment speeds, credit risk, etc.); and | |
| Level 3 - significant unobservable inputs (including the Fund’s determinations as to the fair value of investments). | |
| The inputs or methodology used for valuing securities are not necessarily an indication of the risks associated with investing in those securities. The summary of inputs used to value the Funds’ securities as of December 31, 2016 is as follows: | |
| Level 1 | Level 2 | Level 3 | Total | ||||
| Meridian Growth Fund | |||||||
Common Stocks1 | $ 1,217,041,450 | $ 351,810 | $ 5,764,948 | $ 1,223,158,208 | |||
Short-Term Investments | 34,798,000 | 112,993,831 | — | 147,791,831 | |||
Total Investments | $ 1,251,839,450 | $ 113,345,641 | $ 5,764,948 | $ 1,370,950,039 | |||
| Meridian Contrarian Fund | |||||||
| Assets: | |||||||
Common Stocks1 | $ 521,162,013 | — | — | $ 521,162,013 | |||
Put Options Purchased | — | $ 105,000 | — | 105,000 | |||
Short-Term Investments | 17,261,000 | 47,713,607 | — | 64,974,607 | |||
Total Investments - Assets | $ 538,423,013 | $ 47,818,607 | — | $ 586,241,620 | |||
| Liabilities: | |||||||
Call Option Written | (3,740,000) | — | — | (3,740,000) | |||
Put Options Written | (29,750) | — | — | (29,750) | |||
Total Investments - Liabilities | $ (3,769,750) | — | — | $ (3,769,750) | |||
| Meridian Funds | 61 | www.meridianfund.com |
Table of Contents
Notes to Financial Statements (continued)
| Level 1 | Level 2 | Level 3 | Total | ||||
| Meridian Equity Income Fund | |||||||
| Assets: | |||||||
Common Stocks1 | $ 41,683,139 | — | — | $ 41,683,139 | |||
Corporate Bonds | — | $ 3,218,240 | — | 3,218,240 | |||
Call Options Purchased | 34,500 | — | — | 34,500 | |||
Exchange Traded Funds | 704,250 | — | — | 704,250 | |||
Short-Term Investments | — | 2,655,729 | — | 2,655,729 | |||
Total Investments - Assets | $ 42,421,889 | $ 5,873,969 | — | $ 48,295,858 | |||
| Liabilities: | |||||||
Call Option Written | (24,800) | — | — | (24,800) | |||
Securities Sold Short | (3,755,965) | — | — | (3,755,965) | |||
Total Investments - Liabilities | $ (3,780,765) | — | — | $ (3,780,765) | |||
| Meridian Small Cap Growth Fund | |||||||
Common Stocks1 | $ 516,613,960 | — | — | $ 516,613,960 | |||
Warrants | 309,765 | — | — | 309,765 | |||
Short-Term Investments | 18,206,000 | $ 50,128,748 | — | 68,334,748 | |||
Total Investments | $ 535,129,725 | $ 50,128,748 | — | $ 585,258,473 |
| Meridian Growth Fund | |||||||||
| Beginning Balance 07/01/16 | Total Purchases | Total Sales | Transfer Out | Ending Balance 12/31/16 | |||||
| Investments in Securities | |||||||||
Common Stocks | $ 667,772 | $ 5,764,948 | $ — | $ (667,772) | $ 5,764,948 | ||||
Total Level 3 | $ 667,772 | $ 5,764,948 | $ — | $ (667,772) | $ 5,764,948 | ||||
| Meridian Small Cap Growth Fund | |||||||||
| Beginning Balance 07/01/16 | Total Purchases | Total Sales | Transfer Out | Ending Balance 12/31/16 | |||||
| Investments in Securities | |||||||||
Common Stocks | $ 126,226 | $ — | $ — | $ (126,226) | $ — | ||||
Total Level 3 | $ 126,226 | $ — | $ — | $ (126,226) | $ — | ||||
| Meridian Funds | 62 | www.meridianfund.com |
Table of Contents
Notes to Financial Statements (continued)
| d. | Investment Transactions and Investment Income: Security transactions are accounted for on the date the securities are purchased or sold (trade date). Realized gains and losses on security transactions are determined on the basis of specific identification for both financial statement and federal income tax purposes. Dividend income is recorded on the ex-dividend date. Interest income is accrued daily. |
| e. | Option writing: When the Fund writes an option, an amount equal to the premium received by the Fund is recorded as a liability and subsequently adjusted to the current fair value of the option written. Premiums received from writing options that expire unexercised are treated by the Fund on the expiration date as realized gains from investments. The difference between the premium and amount paid on effecting a closing purchase transaction, including brokerage commissions, is also treated as a realized gain or, if the premium is less than the amount paid for the closing purchase transaction, as a realized loss. If a call option is exercised, the premium is added to the proceeds from the sale of the underlying security or currency in determining whether the Fund has realized a gain or loss. If a put option is exercised, the premium reduces the cost basis of the securities purchased by the Fund. The Fund as writer of an option bears the market risk of an unfavorable change in the price of the security underlying the written option. |
| f. | Allocation of Income, Expenses, Gains and Losses: Income, gains and losses are allocated on a daily basis to each share class based on the relative proportion of the net assets of the class to each Fund’s total net assets. Expenses are allocated on the basis of relative net assets of the class to the Fund, or if an expense is specific to a share class, to that specific share class. |
| g. | Use of Estimates: The preparation of financial statements in accordance with accounting principals generally accepted in the U.S. (“GAAP”) requires management to make estimates and assumptions that affect the reported amount of assets and liabilities and revenue and expenses at the date of the financial statements. Actual amounts could differ from those estimates, and such differences could be significant. |
| h. | Foreign Currency Translation: Securities denominated in foreign currencies are converted into U.S. dollars using the spot market rate of exchange at the time of valuation. Purchases and sales of such securities and related dividend and interest income are converted into U.S. dollars using the spot market rate of exchange prevailing on the respective dates of such translations. The Funds do not separately report the effect of changes in foreign exchange rates from changes in market prices on securities held. Such changes are included in net realized and unrealized gain or loss from investments as reported in the Statement of Operations. |
| i. | Federal Income Taxes: It is the Funds’ policy to comply with the requirements of Subchapter M of the Internal Revenue Code of 1986, as amended, applicable to regulated investment companies and to distribute all of their taxable income to their shareholders; therefore, no federal income tax provision is required. |
| j. | Distributions to Shareholders: The Funds record distributions to shareholders on the ex-dividend date. The amount of distributions from net investment income and net realized capital gains are determined in accordance with federal income tax regulations which may differ from GAAP. These “book/tax” differences are either considered temporary or permanent in nature. To the extent these differences are permanent in nature, such amounts are reclassified within the capital accounts based on their federal tax-basis treatment; temporary differences do not require reclassification. |
| Distributions which exceed net investment income and net realized capital gains are reported as distributions in excess of net investment income or distributions in excess of net realized capital gains for financial reporting purposes but not for tax purposes. To the extent they exceed net investment income and net realized capital gains for tax purposes, they are reported as distributions of paid-in-capital. | |
| k. | Guarantees and Indemnification: Under the Funds’ organizational documents, its Officers and Directors are indemnified against certain liability arising out of the performance of their duties to the Funds. Additionally, in the normal course of business, the Funds enter into contracts with service providers that contain general indemnification clauses, subject to applicable law. The Funds’ maximum exposure under these arrangements is unknown, as this would involve future claims that may be made against the Funds that have not yet occurred. However, based on experience, the Funds expect the risk of loss to be remote. |
| Meridian Funds | 63 | www.meridianfund.com |
Table of Contents
Notes to Financial Statements (continued)
| 2. | Capital Shares Transactions: Transactions in capital shares were as follows: |
| Six Months Ended December 31, 2016 | Year Ended June 30, 2016 | ||||||
| Shares | Amount | Shares | Amount | ||||
| Growth Fund: | |||||||
| Legacy Class | |||||||
Shares sold | 385,737 | $ 13,560,580 | 1,358,601 | $ 42,364,119 | |||
Shares issued from reinvestment of distributions | 181,141 | 6,577,219 | 4,193,907 | 128,417,422 | |||
Redemption fees | — | 7,621 | — | 27,621 | |||
Shares redeemed | (2,680,320) | (93,477,352) | (21,266,639) | (712,564,252) | |||
Net decrease | (2,113,442) | $(73,331,932) | (15,714,131) | $(541,755,090) | |||
| Institutional Class | |||||||
Shares sold | 318,599 | $ 10,727,208 | 745,916 | $ 25,468,717 | |||
Shares issued from reinvestment of distributions | 9,317 | 338,118 | 145,944 | 4,467,337 | |||
Redemption fees | — | 78 | — | 458 | |||
Shares redeemed | (32,487) | (1,125,941) | (11,787) | (366,683) | |||
Net increase | 295,429 | $ 9,939,463 | 880,073 | $ 29,569,829 | |||
| Class A1 | |||||||
Shares sold | 111,267 | $ 3,833,532 | 119,574 | $ 3,907,150 | |||
Shares issued from reinvestment of distributions | 1,656 | 58,915 | 23,866 | 718,845 | |||
Redemption fees | — | 665 | — | 767 | |||
Shares redeemed | (22,616) | (773,987) | (104,120) | (3,341,094) | |||
Net increase | 90,307 | $ 3,119,125 | 39,320 | $ 1,285,668 | |||
| Class C2 | |||||||
Shares sold | 11,741 | $ 411,785 | 24,336 | $ 746,689 | |||
Shares issued from reinvestment of distributions | 184 | 6,582 | 519 | 15,809 | |||
Redemption fees | — | — | — | — | |||
Shares redeemed | (1,715) | (57,818) | — | — | |||
Net increase | 10,210 | $ 360,549 | 24,855 | $ 762,498 | |||
| Investor Class | |||||||
Shares sold | 681,995 | $ 23,522,021 | 455,432 | $ 15,060,609 | |||
Shares issued from reinvestment of distributions | 7,681 | 276,949 | 104,065 | 3,167,743 | |||
Redemption fees | — | 10,965 | — | 5,516 | |||
Shares redeemed | (140,584) | (4,916,026) | (701,466) | (23,050,754) | |||
Net increase/(decrease) | 549,092 | $ 18,893,909 | (141,969) | $ (4,816,886) | |||
| 1 | On July 1, 2015, the Fund's Advisor Class Shares were redesignated as Class A Shares. |
| 2 | Commenced operations on July 1, 2015. |
| Meridian Funds | 64 | www.meridianfund.com |
Table of Contents
Notes to Financial Statements (continued)
| Six Months Ended December 31, 2016 | Year Ended June 30, 2016 | ||||||
| Shares | Amount | Shares | Amount | ||||
| Contrarian Fund: | |||||||
| Legacy Class | |||||||
Shares sold | 50,476 | $ 1,801,757 | 121,771 | $ 4,065,895 | |||
Shares issued from reinvestment of distributions | 76,996 | 2,909,671 | 2,597,565 | 82,836,341 | |||
Redemption fees | — | 1,755 | — | 4,810 | |||
Shares redeemed | (1,098,612) | (38,939,164) | (2,907,170) | (97,653,536) | |||
Net decrease | (971,140) | $(34,225,981) | (187,834) | $(10,746,490) | |||
| Class A1 | |||||||
Shares sold | 1,619 | $ 62,856 | 1,550 | $ 52,224 | |||
Shares issued from reinvestment of distributions | 32 | 1,187 | 1,350 | 42,706 | |||
Redemption fees | — | — | — | — | |||
Shares redeemed | (857) | (30,169) | (4,934) | (168,353) | |||
Net increase/(decrease) | 794 | $ 33,874 | (2,034) | $ (73,423) | |||
| Class C2 | |||||||
Shares sold | 671 | $ 23,274 | 366 | $ 13,770 | |||
Shares issued from reinvestment of distributions | 5 | 178 | 62 | 1,960 | |||
Redemption fees | — | — | — | — | |||
Shares redeemed | — | — | — | — | |||
Net increase | 676 | $ 23,452 | 428 | $ 15,730 | |||
| Investor Class | |||||||
Shares sold | 7,992 | $ 283,055 | 44,349 | $ 1,385,574 | |||
Shares issued from reinvestment of distributions | 234 | 8,819 | 3,099 | 98,671 | |||
Redemption fees | — | — | — | 286 | |||
Shares redeemed | (4,757) | (164,693) | (26,910) | (864,571) | |||
Net increase | 3,469 | $ 127,181 | 20,538 | $ 619,960 | |||
| 1 | On July 1, 2015, the Fund's Advisor Class Shares were redesignated as Class A Shares. |
| 2 | Commenced operations on July 1, 2015. |
| Meridian Funds | 65 | www.meridianfund.com |
Table of Contents
Notes to Financial Statements (continued)
| Six Months Ended December 31, 2016 | Year Ended June 30, 2016 | ||||||
| Shares | Amount | Shares | Amount | ||||
| Equity Income Fund: | |||||||
| Legacy Class | |||||||
Shares sold | 12,237 | $ 151,281 | 61,738 | $ 719,828 | |||
Shares issued from reinvestment of distributions | 27,689 | 353,312 | 164,032 | 1,881,451 | |||
Redemption fees | — | 979 | — | 326 | |||
Shares redeemed | (223,337) | (2,724,518) | (568,713) | (6,608,467) | |||
Net decrease | (183,411) | $(2,218,946) | (342,943) | $(4,006,862) | |||
| Class A1 | |||||||
Shares sold | 2,052 | $ 25,000 | 7,200 | $ 86,187 | |||
Shares issued from reinvestment of distributions | 201 | 2,557 | 1,966 | 22,469 | |||
Redemption fees | — | — | — | — | |||
Shares redeemed | (1,088) | (12,623) | (5,705) | (64,742) | |||
Net increase | 1,165 | $ 14,934 | 3,461 | $ 43,914 | |||
| Class C2 | |||||||
Shares sold | 81 | $ 1,000 | 80 | $ 1,000 | |||
Shares issued from reinvestment of distributions | — | 1 | 3 | 39 | |||
Redemption fees | — | — | — | — | |||
Shares redeemed | (81) | (989) | — | — | |||
Net increase | — | $ 12 | 83 | $ 1,039 | |||
| Investor Class | |||||||
Shares sold | 97 | $ 1,200 | 3,993 | $ 46,100 | |||
Shares issued from reinvestment of distributions | 114 | 1,453 | 739 | 8,487 | |||
Redemption fees | — | — | — | 2 | |||
Shares redeemed | (3,830) | (46,759) | (9,781) | (118,843) | |||
Net decrease | (3,619) | $ (44,106) | (5,049) | $ (64,254) | |||
| 1 | On July 1, 2015, the Fund's Advisor Class Shares were redesignated as Class A Shares. |
| 2 | Commenced operations on July 1, 2015. |
| Meridian Funds | 66 | www.meridianfund.com |
Table of Contents
Notes to Financial Statements (continued)
| Six Months Ended December 31, 2016 | Year Ended June 30, 2016 | ||||||
| Shares | Amount | Shares | Amount | ||||
| Small Cap Growth Fund: | |||||||
| Legacy Class | |||||||
Shares sold | 898,616 | $ 11,723,343 | 1,148,798 | $ 12,656,976 | |||
Shares issued from reinvestment of distributions | — | — | 55,930 | 625,306 | |||
Redemption fees | — | 51 | — | 1,855 | |||
Shares redeemed | (219,044) | (2,815,827) | (2,077,810) | (25,040,437) | |||
Net increase/(decrease) | 679,572 | $ 8,907,567 | (873,082) | $ (11,756,300) | |||
| Institutional Class | |||||||
Shares sold | 2,872,698 | $ 37,308,242 | 3,747,760 | $ 43,537,374 | |||
Shares issued from reinvestment of distributions | — | — | 26,608 | 297,754 | |||
Redemption fees | — | 1,008 | — | 1,061 | |||
Shares redeemed | (1,276,058) | (16,721,061) | (335,719) | (3,814,163) | |||
Net increase | 1,596,640 | $ 20,588,189 | 3,438,649 | $ 40,022,026 | |||
| Class A1 | |||||||
Shares sold | 1,556,921 | $ 19,902,513 | 2,577,458 | $ 29,873,325 | |||
Shares issued from reinvestment of distributions | — | — | 65,916 | 731,663 | |||
Redemption fees | — | 1,756 | — | 8,051 | |||
Shares redeemed | (549,154) | (7,095,465) | (1,705,906) | (19,414,644) | |||
Net increase | 1,007,767 | $ 12,808,804 | 937,468 | $ 11,198,395 | |||
| Class C2 | |||||||
Shares sold | 784,043 | $ 9,972,035 | 2,024,487 | $ 23,963,146 | |||
Shares issued from reinvestment of distributions | — | — | 23,521 | 261,553 | |||
Redemption fees | — | 1,358 | — | 96 | |||
Shares redeemed | (53,864) | (686,543) | (29,504) | (299,994) | |||
Net increase | 730,179 | $ 9,286,850 | 2,018,504 | $ 23,924,801 | |||
| Investor Class | |||||||
Shares sold | 13,325,597 | $174,899,717 | 9,280,681 | $107,156,143 | |||
Shares issued from reinvestment of distributions | — | — | 166,693 | 1,863,626 | |||
Redemption fees | — | 2,338 | — | 45,749 | |||
Shares redeemed | (2,347,936) | (30,706,545) | (5,883,541) | (64,893,369) | |||
Net increase | 10,977,661 | $144,195,510 | 3,563,833 | $ 44,172,149 | |||
| 1 | On July 1, 2015, the Fund's Advisor Class Shares were redesignated as Class A Shares. |
| 2 | Commenced operations on July 1, 2015. |
| Meridian Funds | 67 | www.meridianfund.com |
Table of Contents
Notes to Financial Statements (continued)
| 3. | Investment Transactions: The cost of investments purchased and the proceeds from sales of investments, excluding short-term securities and U.S. government obligations, for the six months ended December 31, 2016, were as follows: |
| Purchases | Proceeds from Sales | ||
Growth Fund | $214,506,296 | $300,336,640 | |
Contrarian Fund | $135,583,208 | $198,778,563 | |
Equity Income Fund | $ 7,834,063 | $ 6,658,775 | |
Small Cap Growth Fund | $244,395,314 | $ 84,518,337 | |
| 4. | Other Investment Transactions |
| a. | Restricted Securities: The Funds may invest in securities that are subject to legal or contractual restrictions on resale. Prompt sale of such securities at an acceptable price may be difficult and may involve substantial delays and additional costs. |
| b. | Securities Lending: The Funds have entered into an agreement with The Bank of New York Mellon (the “Lending Agent”), dated September 23, 2015, (“Securities Lending Agreement”), to provide securities lending services to the Funds. Under this program, the proceeds (cash collateral) received from borrowers are used to invest in money market funds or joint repurchase agreements. Under the Securities Lending Agreement, the borrowers may pay the Funds negotiated lender fees and the Funds receive cash and/or securities as collateral in an amount equal to not less than 102% of the market value of loaned securities. The market value of the loaned securities is determined at the close of each business day of the Fund and any additional required collateral is delivered to the Fund, or excess collateral is returned by the Fund, on the next business day. The borrower pays fees at the Funds’ direction to the Lending Agent. Although the risk of lending is generally mitigated by the collateral, the Funds could experience a delay in recovering securities and a possible loss of income or value if the borrower fails to return them. |
| The following table summarizes the securities received as collateral for securities lending: | |
| Collateral Type | Coupon Range | Maturity Date Range | Market Value | ||||
Growth Fund | U.S. Government Obligations | 0.00% - 7.63% | 01/12/17 - 11/15/46 | $107,787,979 | |||
Contrarian Fund | U.S. Government Obligations | 0.00% - 6.00% | 01/12/17 - 11/15/46 | 8,089,130 | |||
Equity Income Fund | U.S. Government Obligations | 0.00% - 6.00% | 01/12/17 - 11/15/46 | 526,046 | |||
Small Cap Growth Fund | U.S. Government Obligations | 0.00% - 6.00% | 01/12/17 - 11/15/46 | 28,000,527 |
| c. | Repurchase Agreements and Joint Repurchase Agreements: The Funds may enter into repurchase agreements for temporary cash management purposes provided that the value of the underlying collateral, including accrued interest, will equal or exceed the value of the repurchase agreement during the term of the agreement. The underlying collateral for all repurchase agreements is held in safekeeping by the Fund’s custodian or at the Federal Reserve Bank. If the seller defaults and the value of the collateral declines, or if bankruptcy proceedings commence with respect to the seller of the security, realization of the collateral by the Funds may be delayed or limited. |
| Additionally, the Funds may enter into joint repurchase agreements for reinvestment of cash collateral on securities lending transactions under the securities lending program offered by the Lending Agent (the “Program”), provided that the value of the underlying collateral, including accrued interest will equal or exceed the value of the joint repurchase agreement during the term of the agreement. The Funds participate on a pro rata |
| Meridian Funds | 68 | www.meridianfund.com |
Table of Contents
Notes to Financial Statements (continued)
| basis with other clients of the Lending Agent in its share of the underlying collateral under such joint repurchase agreements and in its share of proceeds from any repurchase or other disposition of the underlying collateral. The underlying collateral for joint repurchase agreements is held in safekeeping by the Fund’s custodian or at the Federal Reserve Bank. If the seller defaults and the value of the collateral declines, or if bankruptcy proceedings commence with respect to the seller of the security, realization of the collateral by the Funds may be delayed or limited. Pursuant to the Program, the Funds are indemnified for such losses by the Lending Agent. | |
| At December 31, 2016, the market value of repurchase agreements or joint repurchase agreements outstanding for the Meridian Growth Fund, Meridian Contrarian Fund, Meridian Equity Income Fund, and the Meridian Small Cap Growth Fund were $112,993,831, $47,713,607, $2,655,729 and $50,128,748, respectively. | |
| d. | Master Netting Arrangements: The Funds may enter into master netting agreements with their counterparties for the securities lending program and repurchase agreements, which provide the right, in the event of default (including bankruptcy or insolvency) for the non-defaulting party to liquidate the collateral and calculate net exposure to the defaulting party or request additional collateral. For financial reporting purposes, the Funds do not offset financial assets and financial liabilities that are subject to master netting agreements in the Statement of Assets and Liabilities. For securities lending transactions see Note 4.b. |
| The following table is a summary of the Funds’ open repurchase agreements that are subject to a master netting arrangement as of December 31, 2016: | |
| Assets | |||||
| Gross Amounts Presented in Statements of Assets and Liabilities | Collateral Received | Net Amount | |||
| Growth Fund | |||||
Repurchase agreement | $ 112,993,831 | $ (112,993,831)1 | $ — | ||
| Contrarian Fund | |||||
Repurchase agreement | 47,713,607 | (47,713,607) 1 | — | ||
| Equity Income Fund | |||||
Repurchase agreement | 2,655,729 | (2,655,729) 1 | — | ||
| Small Cap Growth Fund | |||||
Repurchase agreement | 50,128,748 | (50,128,748) 1 | — | ||
| 1 The amount of collateral presented is limited such that the net amount cannot be less than zero. Collateral received in excess of the market value of securities on loan is not presented in this table. | |||||
| e. | Options: Certain Funds purchase and write call and put options to increase or decrease their exposure to underlying instruments (including equity risk, interest rate risk and/or commodity price risk) and/or, in the case of options written, to generate gains from options premiums. A call option gives the purchaser (holder) of the option the right (but not the obligation) to buy, and obligates the seller (writer) to sell (when the option is exercised) the underlying instrument at the exercise or strike price at any time or at a specified time during the option period. A put option gives the holder the right to sell and obligates the writer to buy the underlying instrument at the exercise or strike price at any time or at a specified time during the option period. When the Funds purchase (write) an option, an amount equal to the premium paid (received) by the Funds is reflected as an asset (liability). The amount of the asset (liability) is subsequently marked-to-market to reflect the current market value of the option purchased (written). When an instrument is purchased or sold through an exercise of an option, the related premium paid (or received) is added to (or deducted from) the basis of the instrument acquired or deducted from (or added to) the proceeds of the instrument sold. When an option expires (or the Funds enter into a closing transaction), the Funds realize a gain or loss on the option to the extent of the premiums received or paid (or gain or loss to the extent the cost of the closing transaction exceeds the premiums received or paid). When the Funds write a call option, such option is “covered,” meaning that the Funds hold the underlying instrument subject to being called by the option counterparty. When the Funds write a put option, such option is covered by cash in an amount sufficient to cover the obligation. |
| Meridian Funds | 69 | www.meridianfund.com |
Table of Contents
Notes to Financial Statements (continued)
| In purchasing and writing options, the Funds bear the risk of an unfavorable change in the value of the underlying instrument or the risk that the Funds may not be able to enter into a closing transaction due to an illiquid market. Exercise of a written option could result in the Funds purchasing or selling a security when it otherwise would not, or at a price different from the current market value. | |
| Transactions in options written during the six months ended December 31, 2016, were as follows: | |
| Meridian Contrarian Fund | Number of Contracts | Premiums Received | |
Options outstanding at June 30, 2016 | — | $ — | |
Options written | 3,950 | 573,979 | |
Options terminated in closing purchase transactions | (1,000) | (100,582) | |
Options expired | (1,500) | (132,561) | |
Options exercised | — | — | |
Options outstanding at December 31, 2016 | 1,450 | $ 340,836 |
| Meridian Equity Income Fund | Number of Contracts | Premiums Received | |
Options outstanding at June 30, 2016 | — | $ — | |
Options written | 40 | 3,928 | |
Options terminated in closing purchase transactions | — | — | |
Options expired | — | — | |
Options exercised | — | — | |
Options outstanding at December 31, 2016 | 40 | $3,928 |
| f. | Short Sales: The Funds may enter into short sales. A short sale occurs when a fund sells a security it generally does not own (the security is borrowed), in anticipation of a decline in the security’s price. The initial amount of a short sale is recorded as a liability which is marked-to-market daily. Fluctuations in the value of the short liability are recorded as unrealized gains or losses. If a Fund shorts a security when also holding a long position in the security (a “short against the box”), as the security’s price declines, the short position increases in value, offsetting the long position’s decrease in value. The opposite effect occurs if the security’s price rises. A Fund realizes a gain or loss upon closing of the short sale (returning the security to the counterparty by way of purchase or delivery of a long position owned). Possible losses from short sales may be unlimited, whereas losses from security purchases cannot exceed the total amount invested. The Funds are liable to the buyer for any dividends payable on securities while those securities are in a short position. These dividends are an expense of the Funds. The Funds designate collateral consisting of cash, U.S. government securities or other liquid assets sufficient to collateralize the market value of short positions. |
| 5. | Market and Debt Securities Risk |
| In the normal course of business, each Funds’ investment activities expose it to various types of risk associated with the financial instruments and markets in which it invests. The significant types of financial risks each Fund is exposed to include market risk and debt securities risk. Each Fund’s prospectus provides details of these and other types of risk. | |
| Market Risk: Market risk refers to the possibility that the market values of securities or other investments that a Fund holds will fall, sometimes rapidly or unpredictably, or fail to rise. Security values may fall or fail to rise because of a variety of factors affecting (or the market’s perception of) individual companies or other issuers (e.g., an unfavorable earnings report), industries or sectors, or the market as a whole, reducing the value of an investment in a Fund. Accordingly, an investment in the Fund could lose money over short or even long periods. The market values of the securities the Fund holds also can be affected by changes (or perceived changes) in U.S. or foreign economies and financial markets, and the liquidity of these securities, among other factors. In general, equity securities tend to have |
| Meridian Funds | 70 | www.meridianfund.com |
Table of Contents
Notes to Financial Statements (continued)
| greater price volatility than debt securities. In addition, stock prices may be sensitive to rising interest rates, as the cost of capital rises and borrowing costs increase. As a result, the value of your investments in a Fund may be more or less than the value of your purchase price. | |
| Debt Securities Risk: Each Fund may invest in debt securities of both government and corporate issuers. A decline in prevailing levels of interest rates generally increases the value of debt securities in a Fund’s portfolio, while an increase in rates usually reduces the value of those securities. The value of a Fund’s debt securities, including bonds and convertible securities, are affected by movements in interest rates; if interest rates rise, the value of these securities may fall. Generally, the longer the average maturity of a debt security, the greater the change in its value. As a result, to the extent that a Fund invests in debt securities, interest rate fluctuations will affect the Fund’s net asset value, but not the income it receives from debt securities it owns. Debt securities are also subject to credit, liquidity risk and prepayment and extension risk. Credit risk is the risk that the entity that issued a debt security may become unable to make payments of principal and interest, and includes the risk of default. Liquidity risk is the risk that a Fund may not be able to sell portfolio securities because there are too few buyers for them. Prepayment and extension risk is the risk that a loan, bond or other security might be called or otherwise converted, prepaid or redeemed before maturity. If a loan or security is converted, prepaid or redeemed before maturity, particularly during a time of declining interest rates or spreads, the portfolio managers may not be able to invest the proceeds in securities or loans providing as high a level of income, resulting in a reduced yield to a Fund. Conversely, as interest rates rise or spreads widen, the likelihood of prepayment decreases. The portfolio managers may be unable to capitalize on securities with higher interest rates or wider spreads because a Fund’s investments are locked in at a lower rate for a longer period of time. |
| 6. | Affiliate Transactions and Fees |
| Management Fees: Under the Investment Management Agreement, the Adviser receives the following fees for providing certain investment management and other services necessary for managing each Fund. The fee is paid monthly in arrears and calculated based on that month’s daily average net assets. | |
| Growth Fund: | Contrarian and Small Cap Growth Funds: | |||||
| Average Daily Net Assets | Investment Management Fee | Average Daily Net Assets | Investment Management Fee | |||
Up to $50,000,000 | 1.00% | Greater than $0 | 1.00% | |||
Greater than $50,000,000 | 0.75% | |||||
| Equity Income Fund: | ||
| Average Daily Net Assets | Investment Management Fee | |
Up to $10,000,000 | 1.00% | |
$10,000,001 to $30,000,000 | 0.90% | |
$30,000,001 to $50,000,000 | 0.80% | |
Greater than $50,000,000 | 0.70% | |
| Meridian Funds | 71 | www.meridianfund.com |
Table of Contents
Notes to Financial Statements (continued)
| Expense Limitation | Total Waivers and Reimbursements for the six months ended December 31, 2016 | ||
| Growth Fund | |||
Institutional Class | 0.90% | $ — | |
Class A | 1.55% | $ — | |
Class C | 2.25% | $ — | |
Investor Class | 1.30% | $ — | |
| Contrarian Fund | |||
Class A | 1.60% | $ — | |
Class C | 2.20% | $ — | |
Investor Class | 1.35% | $ — | |
| Equity Income Fund | |||
Legacy Class | 1.25% | $ — | |
Class A | 1.60% | $ — | |
Class C | 2.00% | $ 1 | |
Investor Class | 1.35% | $ — | |
| Small Cap Growth Fund | |||
Legacy Class | 1.20% | $ — | |
Institutional Class | 1.10% | $11,551 | |
Class A | 1.60% | $ — | |
Class C | 2.25% | $ — | |
Investor Class | 1.35% | $ — | |
| Meridian Funds | 72 | www.meridianfund.com |
Table of Contents
Notes to Financial Statements (continued)
| Expiration June 30, | |||||||
| 2017 | 2018 | 2019 | 2020 | ||||
Growth Fund | — | — | — | — | |||
Contrarian Fund | 13,070 | 23,426 | — | — | |||
Equity Income Fund | 47,075 | 44,499 | 216 | 1 | |||
Small Cap Growth Fund | 34,115 | 28,964 | 34,831 | 11,551 | |||
| 7. | Directors and Officers: Certain Directors and/or Officers of the Funds are also Directors and/or Officers of the Adviser. Directors and Officers of the Funds who are Directors and/or Officers of the Adviser receive no compensation from the Funds. Each Non-Interested Director is paid an annual fee set at $40,000. An additional $5,000 is paid to each Non-Interested Director for attendance at each in-person meeting of the Board and an additional $1,000 is paid to each Non-Interested Director for participating in a telephonic meeting of the Board. An additional $3,000 is paid to each member of the Audit or Governance Committee of the Board for attendance at an in-person Audit or Governance Committee meeting and an additional $1,000 is paid to each member of the Audit or Governance Committee of the Board for participating in a telephonic Audit or Governance Committee meeting. |
| An additional $10,000 is paid to the Chairman of the Board and the Chairman of a Committee of the Board. The Chairman of the Board also receives an additional $2,500 for attending each in-person meeting of the Board. The Chairman of a Committee receives an additional $2,000 for attending each in person Committee meeting. |
| 8. | Distribution Information: Income and long-term capital gains distributions are determined in accordance with federal income tax regulations, which may differ from GAAP. The tax character of distributions made during the fiscal year ended June 30, 2016, is as follows: |
| 2016 Taxable Distributions | |||||
| Ordinary Income | Net Long-Term Capital Gain | Total Distributions | |||
Growth Fund | 29,993,917 | 110,190,627 | 140,184,544 | ||
Contrarian Fund | 194,812 | 85,104,072 | 85,298,884 | ||
Equity Income Fund | 9 | 1,965,502 | 1,965,511 | ||
Small Cap Growth Fund | 3,839,325 | 472,200 | 4,311,525 | ||
| 9. | Federal Income Taxes Information: Management has analyzed the Funds’ tax positions taken on federal income tax returns for all open tax years (current and prior three tax years), and has concluded that no provision for federal income tax is required in the Funds’ financial statements. The Funds’ federal and state income and federal excise tax returns for tax years for which the applicable statutes of limitations have not expired are subject to examination by the Internal Revenue Service and state departments of revenue. The Funds are not aware of any tax positions for which it is reasonably possible that the total amounts of unrecognized tax benefits will significantly change in the next 12-months. The Funds recognize interest and penalties, if any, related to unrecognized tax benefits as income tax expense in the Statements of Operations. During the six months ended December 31, 2016, the Funds did not incur any interest or penalties. |
| The aggregate cost of investments, unrealized appreciation and depreciation, for federal income tax purposes, at December 31, 2016 is as follows: | |
| Meridian Funds | 73 | www.meridianfund.com |
Table of Contents
Notes to Financial Statements (continued)
| Aggregrate Cost | Aggregrate Gross Unrealized Appreciation | Aggregrate Gross Unrealized Depreciation | Net Unrealized Appreciation | ||||
Growth Fund | $1,224,323,479 | $204,793,073 | $(58,166,513) | $146,626,560 | |||
Contrarian Fund | 459,630,625 | 135,089,285 | (8,478,290) | 126,610,995 | |||
Equity Income Fund | 40,246,148 | 9,304,966 | (1,255,257) | 8,049,709 | |||
Small Cap Growth Fund | 534,168,772 | 67,814,031 | (16,724,330) | 51,089,701 |
| Under the Regulated Investment Company Modernization Act of 2010, the eight-year limit on the carry forward and use of capital losses was eliminated and capital losses incurred by the Funds after June 30, 2011 will not be subject to expiration. In addition, losses incurred after June 30, 2011 will retain their character as either a short-term or long-term capital loss on the first day of the next taxable year and must be utilized prior to the losses incurred in pre-enactment taxable years. |
| 10. | Other Matters: As of April 9, 2010, the Adviser and certain affiliated entities became defendants in a lawsuit brought by another company alleging trademark infringement, unfair competition and related claims. The complaint alleges that the Adviser’s and affiliated entities’ use of their Arrowpoint trademark and the Arrowpoint logo infringes the rights of the plaintiff in various trademarks that it uses. The complaint seeks injunctive relief requiring the Adviser and the affiliated entities to cease use of the Arrowpoint trademark and logo and unspecified monetary damages, which the plaintiff claims to be unable to quantify. The Adviser has responded to the lawsuit in the United States District Court for the District of Delaware by denying the material allegations of the compliant and opposing the plaintiff’s motion for a preliminary injunction, which is now pending before the Court. |
| The Adviser believes the complaint to be without legal merit and intends to defend against it vigorously. Any legal costs associated with the compliant will be borne by the Adviser, and not the Meridian Funds. While an outcome regarding the complaint is unknown at this time, the Adviser believes that this complaint should not have a material effect on its operations or impair its ability to perform its duties to the Meridian Funds. |
| 11. | Subsequent Events: Management has evaluated the impact of all subsequent events on the Funds through the date the financial statements were available to be issued, and has noted no additional events that require recognition or disclosure in the financial statements. |
| Meridian Funds | 74 | www.meridianfund.com |
Table of Contents
| Meridian Funds | 75 | www.meridianfund.com |
Table of Contents
| Meridian Funds | 76 | www.meridianfund.com |
Table of Contents
Glossary of Terms Used in this Report (Unaudited)
| Meridian Funds | 77 | www.meridianfund.com |
Table of Contents
| • | Applications or other forms |
| • | Transactions with us, our affiliates, or others |
Table of Contents
P.O. Box 9792
1-800-446-6662
| • | For a fee, by writing the Public Reference Section of the Commission, Washington, D.C. 20549-1520, by electronic request at the following E-mail address: publicinfo@sec.gov, or by calling 202-551-8090 |
| • | Free from the Commission’s Website at http://www.sec.gov. |
Table of Contents
Other Information (Unaudited)
(800) 446-6662
(303) 398-2929
(877) 796-3434
Arrowpoint Asset Management LLC
100 Fillmore Street, Suite 325
Denver, CO 80206
ALPS Distributors, Inc.
1290 Broadway, Suite 1100
Denver, CO 80203
BNY Mellon Investment Servicing (US) Inc.
760 Moore Road
King of Prussia, PA 19406
The Bank of New York Mellon
One Wall Street
New York, NY 10286
Davis Graham & Stubbs LLP
1550 17th Street, Suite 500
Denver, CO 80202
PricewaterhouseCoopers LLP
Three Embarcadero Center
San Francisco, CA 94111
James Bernard Glavin, Chairman
Guy M. Arnold
John S. Emrich
Michael S. Erickson
Edward F. Keely
Michael Stolper*
David Corkins, President
Derek Mullins, Chief Financial Officer and Treasurer
Richard Grove, Vice President, Secretary and Chief
Compliance Officer
Table of Contents
Item 2. Code of Ethics.
Not applicable.
Item 3. Audit Committee Financial Expert.
Not applicable.
Item 4. Principal Accountant Fees and Services.
Not applicable.
Item 5. Audit Committee of Listed Registrants.
Not applicable.
Item 6. Investments.
| (a) | Schedule of Investments in securities of unaffiliated issuers as of the close of the reporting period is included as part of the report to shareholders filed under Item 1 of this form. |
Item 7. Disclosure of Proxy Voting Policies and Procedures for Closed-End Management Investment Companies.
Not applicable.
Item 8. Portfolio Managers of Closed-End Management Investment Companies.
Not applicable.
Item 9. Purchases of Equity Securities by Closed-End Management Investment Company and Affiliated Purchasers.
Not applicable.
Item 10. Submission of Matters to a Vote of Security Holders.
Table of Contents
There have been no material changes to the procedures by which the shareholders may recommend nominees to the registrant’s board of directors, where those changes were implemented after the registrant last provided disclosure in response to the requirements of Item 407(c)(2)(iv) of Regulation S-K (17 CFR 229.407) (as required by Item 22(b)(15) of Schedule 14A (17 CFR 240.14a-101)), or this Item.
Item 11. Controls and Procedures.
| (a) | The registrant’s principal executive and principal financial officers, or persons performing similar functions, have concluded that the registrant’s disclosure controls and procedures (as defined in Rule 30a-3(c) under the Investment Company Act of 1940, as amended (the “1940 Act”) (17 CFR 270.30a-3(c))) are effective, as of a date within 90 days of the filing date of the report that includes the disclosure required by this paragraph, based on their evaluation of these controls and procedures required by Rule 30a-3(b) under the 1940 Act (17 CFR 270.30a-3(b)) and Rules 13a-15(b) or 15d-15(b) under the Securities Exchange Act of 1934, as amended (17 CFR 240.13a-15(b) or 240.15d-15(b)). |
| (b) | There were no changes in the registrant’s internal control over financial reporting (as defined in Rule 30a-3(d) under the 1940 Act (17 CFR 270.30a-3(d))) that occurred during the registrant’s second fiscal quarter of the period covered by this report that has materially affected, or is reasonably likely to materially affect, the registrant’s internal control over financial reporting. |
Item 12. Exhibits.
| (a)(1) | Not applicable. |
| (a)(2) | Certifications pursuant to Rule 30a-2(a) under the 1940 Act and Section 302 of the Sarbanes-Oxley Act of 2002 are attached hereto. |
| (a)(3) | Not applicable. |
| (b) | Certifications pursuant to Rule 30a-2(b) under the 1940 Act and Section 906 of the Sarbanes Oxley Act of 2002 are attached hereto. |
Table of Contents
SIGNATURES
Pursuant to the requirements of the Securities Exchange Act of 1934 and the Investment Company Act of 1940, the registrant has duly caused this report to be signed on its behalf by the undersigned, thereunto duly authorized.
| (Registrant) | Meridian Fund, Inc.® | |
| By (Signature and Title)* | /s/ David J. Corkins | |
| David J. Corkins | ||
| Principal Executive Officer and President | ||
Date 3/3/2017
Pursuant to the requirements of the Securities Exchange Act of 1934 and the Investment Company Act of 1940, this report has been signed below by the following persons on behalf of the registrant and in the capacities and on the dates indicated.
| By (Signature and Title)* | /s/ David J. Corkins | |
| David J. Corkins | ||
| Principal Executive Officer and President |
Date 3/3/2017
| By (Signature and Title)* | /s/ Derek J. Mullins | |
| Derek J. Mullins | ||
| Principal Financial Officer and Treasurer |
Date 3/3/2017
| * | Print the name and title of each signing officer under his or her signature. |