UNITED STATES
SECURITIES AND EXCHANGE COMMISSION
Washington, D.C. 20549
FORM N-CSR
CERTIFIED SHAREHOLDER REPORT OF REGISTERED
MANAGEMENT INVESTMENT COMPANIES
Investment Company Act file number 811-04014
Meridian Fund, Inc.®
(Exact name of registrant as specified in charter)
100 Fillmore St., Suite 325
Denver, CO 80206
(Address of principal executive offices) (Zip code)
David J. Corkins
100 Fillmore St., Suite 325
Denver, CO 80206
(Name and address of agent for service)
Registrant’s telephone number, including area code: 303-398-2929
Date of fiscal year end: June 30
Date of reporting period: June 30, 2022
| Item 1. | Reports to Stockholders. |
| | (a) | Include a copy of the report transmitted to stockholders pursuant to Rule 30e-1 under the Act (17 CFR 270.30e-1). |
The Report to Shareholders is attached herewith.
Annual Report
June 30, 2022
Meridian Fund, Inc.
Meridian Growth Fund
Meridian Contrarian Fund
Meridian Enhanced Equity Fund
Meridian Small Cap Growth Fund
MERIDIAN FUND, INC.
Table of Contents
| 4 |
| 24 |
| 29 |
| 30 |
| 48 |
| 50 |
| 51 |
| 53 |
| 71 |
| 91 |
| 92 |
| 93 |
| 94 |
| 96 |
| Meridian Funds | 3 | www.meridianfund.com |
Meridian Growth Fund
Portfolio Performance and Composition (Unaudited)
Market Overview
U.S. equity markets were volatile during the 12-month period as new COVID-19 variants, global supply-chain issues, the war in Ukraine, and a rapid rise in inflation kept investors on edge. An acceleration in inflation, which climbed to a 40-year high, prompted the U.S. Federal Reserve (Fed) to end its ultra-easy monetary policy and raise interest rates 25 basis points in March, the first rate hike in more than three years. Policymakers continued their campaign against inflation in May and June, raising rates 50 basis points and 75 basis points, respectively. June’s rate hike was the largest in 28 years. In the final weeks of the period, heightened fears that rising interest rates and inflation may lead to an economic recession and weaken corporate profits continued to push equity markets lower.
Against this backdrop, large cap stocks outperformed small caps, according to the Russell indices. From a style perspective, value stocks outperformed growth stocks across capitalization categories.
Fund Performance
The Meridian Growth Fund (the “Fund”) Legacy Class Shares returned -29.20% (net) for the 12-month period ended June 30, 2022, outperforming its benchmark, the Russell 2500® Growth Index, which returned -31.81%.
The index decline was broad-based with all sectors except for energy declining during the period. Notable underperformers included the communication services, information technology, healthcare, and consumer discretionary sectors, which were all down in excess of 25%.
Our investment process prioritizes the management of risk over the opportunity for return. We look to build an “enduring” portfolio that can mitigate capital losses during turbulent bear market environments and, secondarily, participate in the upside during strong market environments. This strategy proved effective during the 12-month period, which was exceptionally volatile and included 39 days of 2% or greater declines in Index performance. The Fund outperformed on all but five of these days.
During the period, the Fund benefitted from positive stock selection in the information technology and healthcare sectors. In addition, an overweight position in the industrials sector aided performance, as industrials as a sector outperformed. We maintained the Fund’s overweight to industrials given our focus on commercial and professional service companies, which tend to exhibit strong competitive advantages and generally less macro sensitivity than the broader sector. Conversely, the Fund’s consumer discretionary holdings detracted from relative performance, as several names declined materially. Market factors were generally positive, although larger cap names within the index continued to outperform smaller cap names, creating a headwind to performance.
Market volatility provided us with the opportunity to establish positions in several high-quality growth companies that we believe had declined to attractive levels during the period. In particular, we took advantage of lower valuation multiples for select information technology and healthcare companies. While we are excited about the significant decline in valuations in both of these sectors, we are seeking to be prudent with position sizes in the event multiples contract even further from here. We believe the types of companies we invest in (strong balance sheets, recurring revenue streams, large and growing addressable markets) will create shareholder value over longer periods of time.
The three largest contributors to the Fund’s relative performance during the period were ON Semiconductor Corp., Matson, Inc., and LPL Financial Holdings, Inc.
ON Semiconductor Corp. is a semiconductor manufacturer with a diverse product portfolio and high exposure to the attractive automotive and industrials end markets. We believe ON Semi’s exposure to the auto end market is particularly attractive as advanced driver assistance systems, self-driving features, and the increasing penetration of electric vehicles have led to strong demand for the semiconductors that power these technologies. We believe the company is also well-positioned in the industrials end market, where it benefits from low pricing pressure due to the longer lifecycle of industrials products relative to consumer products. In the most recent period, the company grew revenues 31%, expanded operating margins by over 500 basis points, and grew adjusted EPS in excess of 200%. We were pleased with ON’s execution and are optimistic that it will hit the long-term financial goals set out by management. Although we trimmed the stock, exiting the period the Fund continued to hold a meaningful position.
Matson, Inc. is a provider of ocean transportation and logistics services. The company transports freight between the continental U.S. and ports in Alaska, Hawaii, and China. One of the things that attracted us to Matson is its position as one of
| Meridian Funds | 4 | www.meridianfund.com |
Meridian Growth Fund
Portfolio Performance and Composition (Unaudited) (continued)
the leading shipping companies operating under the Jones Act, a federal statute that allows only American-owned and-built vessels crewed by Americans to transport goods between U.S. ports. We also like Matson’s expedited China service, which has a large time advantage over traditional steamship lines. In addition, the company has its own terminal operations in West Coast ports, which provides a further transit advantage due to the current backlog of ships waiting to be unloaded. Tailwinds for the stock during the reporting period included a strong pricing environment and pandemic-related shutdowns in China, which further disrupted global supply chains. We believe the company’s express service from China and cheaper-than-air freight costs will appeal to shippers even after supply-chain disruptions resolve. We maintain a positive long-term outlook for Matson and trimmed the Fund’s position as the stock appreciated during the trailing 12-months.
LPL Financial Holdings, Inc. is a leading broker/dealer to independent advisors and RIAs. The company is seeing a powerful shift away from its brokerage platform and towards its advisory platform where returns on assets are notably higher. The company continues to attract new advisors to its platform owning partly to its high payout ratios. LPL is able to pay out a higher percentage of revenues to its advisors owing to the company’s sizeable investment in a self-clearing platform that generates a material cost advantage. In the near term, LPL’s results and share price performance have been driven by increasing interest rates which have a powerful impact on margins. We trimmed the Fund’s position in the stock during the period as the risk-reward profile became less favorable due to the market correction and its impact on assets under management.
The three largest detractors from the Fund's relative performance during the period were 2U, Inc., 8x8, Inc., and Vroom, Inc.
2U, Inc. is an educational technology firm that partners with leading nonprofit colleges and universities to offer online degree programs. The company possesses many of the qualities that we believe define a good business, including long-term contracts and recurring revenue; attractive unit economics that should deliver strong EBITDA margins at scale; and strong brand recognition with marquee university partners to drive continued growth. Unfortunately, headwinds from 2U’s recent acquisition of online course provider edX and incremental losses associated with the merger have resulted in a reduced outlook for the company’s 2022 profits. Further pressuring the stock during the past 12 months was weaker demand for higher education degrees due to a tight labor market and high marketing and sales costs to attract new students. We are closely monitoring the Fund’s holding in 2U and trimmed the Fund’s position in the stock during the period.
8x8, Inc. is a cloud communications provider that offers businesses a unified voice, contact center, video, and chat platform. The company hired a new CEO in late 2020 who has since refocused the company on areas of the market where 8x8 has competitive advantages and the potential to earn higher margins. In conjunction with this change in strategy, the company exited low-growth and low-margin product lines, which has led to what we believe is a temporary slowdown in revenue growth. A recent acquisition that depleted 8x8’s cash position also weighed on investor sentiment. We believe the company will overcome these short-term issues and that, at its current price, the stock is attractively valued. We are willing to be patient as the company works through these setbacks and added to the Fund’s position in the stock during the period.
Vroom, Inc. operates an end-to-end e-commerce platform for the used car industry. The company is capitalizing on a growing trend in which used car customers are choosing the online shopping experience over the traditional car lot experience. We believe only a few e-commerce platforms will be able to take significant market share from traditional used car dealers due to inventory, sourcing, and operational challenges that most online sellers will be unable to overcome. During the period, increased reconditioning costs due to labor shortages and strong demand at third-party reconditioning partners pressured Vroom’s margins. The company also suffered from higher shipping expenses incurred as a result of needing to transport cars greater distances to refurbishing facilities. Also pressuring the stock during the past 12 months was news that one of Vroom’s refurbishing partners had agreed to be acquired by competitor Carvana. Due to these and other factors negatively impacting the company, we decided to exit the Fund’s position in Vroom during the period.
Outlook
After raising interest rates 150 basis points in the first half of 2022 and indicating that additional rate increases may be needed, it is clear that Federal Reserve policymakers have become increasingly certain that aggressive action is necessary to tame inflation. They also appear more willing to accept the risk of an economic slowdown in exchange for aggressive monetary tightening and lower inflationary pressures. As a result, investors are wary of potential demand destruction and other consequences the broader economy may suffer in the coming months.
As the Federal Reserve embarks on its tightening path, we expect volatility to increase which we believe will create opportunities for capital deployment and portfolio re-positioning. Following the unprecedented monetary and fiscal stimulus introduced as a response to the pandemic, many growth names in the information technology and healthcare
| Meridian Funds | 5 | www.meridianfund.com |
Meridian Growth Fund
Portfolio Performance and Composition (Unaudited) (continued)
sectors experienced meteoric increases in valuation multiples that have finally begun to reset. Our focus going forward remains on companies that can not only weather the current market downturn, but also participate when the market ultimately rebounds. We believe the current correction continues to present us with opportunities to upgrade the quality of the portfolio while seeking to maintain our strict valuation discipline.
Thank you for your continued partnership with ArrowMark.
Brian Schaub & Chad Meade
Co-Portfolio Managers
The views of the author and information discussed in this commentary are as of June 30, 2022, are subject to change, and may not reflect the writer’s current views. The views expressed represent an assessment of market conditions at a specific point in time, are opinions only and should not be relied upon as investment advice regarding a particular investment or markets in general. Such information does not constitute a recommendation to buy or sell specific securities or investment vehicles. It should not be assumed that any investment will be profitable or will equal the performance of the fund or any securities or any sectors mentioned in this letter. The subject matter contained in this letter had been derived from several sources believed to be reliable and accurate at the time of compilation. To the extent permitted by federal securities laws, ArrowMark Colorado Holdings, LLC, Meridian Fund, Inc., nor the Fund accept any liability for losses either direct or consequential caused by the use of this third party information. Diversification cannot guarantee gain or prevent losses.
| Meridian Funds | 6 | www.meridianfund.com |
Meridian Growth Fund
Portfolio Performance and Composition (Unaudited) (continued)
Total Return Based on a $10,000 investment for the Period Ended June 30, 2022
This graph shows the change in value of a hypothetical investment of $10,000 in Legacy Class Shares of the Fund over the past 10 years (or for the life of the Fund if shorter). Performance calculations are as of the end of June each year. For comparison, the same investment is shown in the indicated index.
Average Annual Total Return as of 6.30.22
| | Inception | 1 Year | 5 Year | 10 Year | Since
Inception |
| Legacy Class (MERDX) | 8/1/84 | (29.20)% | 6.16% | 9.37% | 11.69% |
| Institutional Class (MRRGX) | 12/24/14 | (29.17)% | 6.19% | — | 7.13% |
| Class A (MRAGX) w/o sales charge | 11/15/13 | (29.43)% | 5.82% | — | 7.41% |
| Class A (MRAGX) with sales charge1 | 11/15/13 | (33.49)% | 4.58% | — | 6.68% |
| Class C (MRCGX) | 7/1/15 | (29.91)% | 5.08% | — | 6.00% |
| Investor Class (MRIGX) | 11/15/13 | (29.25)% | 6.11% | — | 7.74% |
| Russell 2500® Growth Index | 8/1/84 2 | (31.81)% | 7.53% | 10.88% | N/A 3 |
| 1 | Assuming maximum sales charge, if any. Class A Shares are subject to a maximum initial sales charge of 5.75%. |
| 2 | Inception date of Legacy Class Shares. |
| 3 | Inception date of Legacy Class precedes the inception date of Russell 2500® Growth Index. |
See “Disclosures Regarding Fund Performance” on page 29 for important information regarding reported performance.
Past performance is not predictive of future performance. The graph and table do not reflect the deduction of taxes that a shareholder would pay on Fund distributions or the redemption of Fund shares and do not reflect the imposition of a 2% redemption fee on shares held 60 days or less to deter market timers. If reflected, the taxes and fees would reduce the performance quoted. Net asset value, investment return and principal value will fluctuate, so shares, when redeemed, may be worth more or less than their original cost.
| Meridian Funds | 7 | www.meridianfund.com |
Meridian Growth Fund
Portfolio Composition (Unaudited)
Top 10 Holdings as of 6.30.22
| Ritchie Bros. Auctioneers, Inc. (Canada) | 3.3% |
| Skechers U.S.A., Inc. Class A | 3.0% |
| Frontdoor, Inc. | 3.0% |
| STERIS Plc | 3.0% |
| Ziff Davis, Inc. | 2.8% |
| ON Semiconductor Corp. | 2.6% |
| Sensata Technologies Holding Plc | 2.4% |
| Generac Holdings, Inc. | 2.1% |
| Sally Beauty Holdings, Inc. | 2.1% |
| QuidelOrtho Corp. | 2.0% |
Portfolio holdings are subject to change and may not reflect the current or future position of the portfolio. Top ten holdings excluding short-term investments are reported as a percentage of net assets.
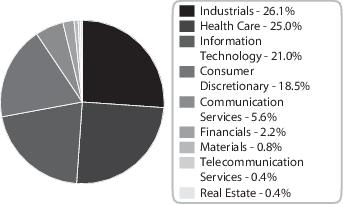
Sector Allocation as of 6.30.22
Sector allocations are subject to change and may not reflect the current or future position of the portfolio. Sector allocations are reported as a percentage of equity investments excluding cash or cash equivalents. As of period end, the Fund invested a significant portion of their assets in securities in the Industrials, Health Care and Information Technology sectors. Changes in economic conditions affecting such sectors would have a greater impact on the Fund and could affect the value, income and/or liquidity of positions in such securities.
For compliance purposes, the Fund’s industry classifications may refer to any one or more of the industry sub-classifications used by one or more widely recognized market indexes or ratings group indexes, and/or as defined by Fund management. This definition may not apply for purposes of this report, which may combine sub-classifications for reporting ease.
| Meridian Funds | 8 | www.meridianfund.com |
Meridian Contrarian Fund
Portfolio Performance and Composition (Unaudited)
Market Overview
U.S. equity markets were volatile during the 12-month period as new COVID-19 variants, global supply-chain issues, the war in Ukraine, and a rapid rise in inflation kept investors on edge. An acceleration in inflation, which climbed to a 40-year high, prompted the U.S. Federal Reserve (Fed) to end its ultra-easy monetary policy and raise interest rates 25 basis points in March, the first rate hike in more than three years. Policymakers continued their campaign against inflation in May and June, raising rates 50 basis points and 75 basis points, respectively. June’s rate hike was the largest in 28 years. In the final weeks of the period, heightened fears that rising interest rates and inflation may lead to an economic recession and weaken corporate profits continued to push equity markets lower. Although market declines were broad-based, high-growth stocks tumbled the hardest as investors shifted into stocks perceived as having more defensive qualities.
Fund Performance
The Meridian Contrarian Fund (the “Fund”) Legacy Class Shares returned -17.18% (net) for the 12-month period ended June 30, 2022, outperforming its benchmark, the Russell 2500® Index, which returned -21.00%. The Fund underperformed its secondary benchmark, the Russell 2500® Value Index, which returned -13.19%.
Our investment process seeks to identify out-of-favor companies that we believe have depressed valuations and visible catalysts for sustainable improvement. Experience has taught us that businesses with the potential for earnings growth and multiple expansion can be a powerful source of outperformance. As such, we employ a fundamental research-driven process that includes screening for companies that have multiple quarters of year-over-year earnings declines, understanding the reason for the declines, then singling out the companies we believe are poised for an earnings rebound via a cohesive turnaround plan, a new management team, or through improvements or changes to the business. The outcome of this process is a concentrated portfolio of 50-75 of our best ideas.
With a process that prioritizes the management of risk over the opportunity for return, we scrutinize the quality of each prospective investment’s business model and its valuation. Our high standards for quality require that a company have what we believe to be a durable competitive advantage, improving return on invested capital and free cash flow, as well as sustainable future earnings growth.
While we manage the Fund from the bottom up based on individual company fundamentals, we augment this by monitoring overall portfolio characteristics as part of our risk-management process. Two of our primary risk measures are beta-adjusted weight and downside capture, both of which we measure on portfolio, sector, and individual company levels. We analyze the beta-adjusted weights of portfolio holdings against the Russell 2500® Index to determine how sensitive each holding is to movement in the broader market and identify where the Fund’s risk exposure lies within the portfolio. Depending on the degree to which a stock correlates closely with market movement (high beta) or inversely to the market (low beta) we may increase or decrease the Fund’s weighting to align with the Fund’s risk parameters, as we prioritize risk before reward. Downside capture measures how much a stock goes down relative to an overall market decline, with lower capture representing lower risk. For both these measures we focus on absolute levels and changes over time. This is part of our ongoing process of recycling capital.
The three largest contributors to the Fund’s relative performance were First Horizon Corp., ON Semiconductor Corp., and APA Corp.
First Horizon Corp. is a Southeastern U.S. regional bank with significant exposure to five of the fastest-growing metro areas in the nation. It also operates one of the leading mortgage broker lending businesses. The Fund initially invested in First Horizon during the third quarter of 2020 following its merger with IBERIABANK. We believed the merger positioned First Horizon to grow earnings faster on recovery due to a combination of defensive qualities (i.e., cost reductions) and more diverse and durable lending growth and commercial fee income opportunities across the Southern U.S. At the time of the Fund’s investment, the company’s historic valuation and valuation relative to its peers was near a 10-year low, suggesting that expectations for a turnaround story had significantly diminished. However, we believed that, as a quality banking franchise located in the fastest growing U.S. region, the outlook for First Horizon was promising. The stock rallied during the first quarter of 2022 following news that First Horizon would be acquired by Canadian bank Toronto-Dominion Bank Group at a 40% premium to its stock price on February 28. In 2021 and early 2022, even before the acquisition announcement, First Horizon’s stock had been strong, with gains in line with its regional bank peers and above the Russell 2500® Index’s gains. We liquidated the Fund’s position in the stock shortly after the acquisition announcement to harvest gains from the takeout
| Meridian Funds | 9 | www.meridianfund.com |
Meridian Contrarian Fund
Portfolio Performance and Composition (Unaudited) (continued)
premium.
ON Semiconductor Corp. is a semiconductor manufacturer with a diverse product portfolio and high exposure to the attractive automotive and industrials end markets. We believe ON Semi’s exposure to the auto end market is particularly attractive, as advanced driver assistance systems and self-driving features have led to strong demand for the semiconductors that power these technologies. We believe the company is also well positioned in the industrials end market, where it benefits from low pricing pressure due to the longer lifecycle of industrials products relative to consumer products. ON continued to benefit from a global chip shortage driven by a combination of strong demand across a wide range of industries and supply chain disruptions. For the quarter ended March 31, 2022, the company reported year-over-year revenue growth of 31%, driven by the solid performance of its intelligent power and sensing solutions in the automotive and industrial end markets. We were pleased with ON’s execution during the period and are optimistic about its longer-term performance goals, however, we reduced our position in the company based on valuation.
APA Corp. is a global energy exploration and production company with operations in Egypt, the U.K., the North Sea, the U.S. Permian Basin, and Suriname, where it has made a significant oil discovery and sizeable additional discoveries are expected. We believe APA’s core global production profile is underappreciated and we view the business as defensive given the low cost to maintain and grow production. APA’s Suriname project – which is moving closer to development with partner TotalEnergies – will provide differentiated low-cost production growth in two to three years, as TotalEnergies carries the majority of the future development cost. This mix allows APA to aggressively allocate capital to pay down debt and buy back stock as opposed to allocating it to capital-intensive production growth. From June 2021 to June 2022, the stock rallied on APA’s announcement of an aggressive stock buyback plan, its increasing production growth profile, and a spike in oil prices. APA outpaced its oil exploration and production peers and the Russell 2500® Index over the period. Late in the second quarter of 2022, we reduced the Fund’s position in APA as we believe the company had largely achieved its operational improvement and financial leverage reduction goals. Exiting the period, the Fund continued to hold a smaller position in APA based on near-term low-cost production growth, aggressive capital return goals, and the differentiated future production growth potential of Suriname.
The three largest detractors from the Fund’s relative performance during the period were Heron Therapeutics, Inc., SMART Global Holdings, Inc., and Micron Technology, Inc.
Heron Therapeutics, Inc. is a biotechnology company. Its product portfolio includes two treatments for cancer patients suffering from nausea as a result of chemotherapy, both of which currently are on the market. The Fund invested in Heron due to the large market opportunity for the company’s investigational post-operative pain-management drug Zynrelef. Since the Fund’s initial investment, the FDA has approved Zynrelef for pain associated with bunion surgery, open inguinal herniorrhaphy (hernia), total knee arthroplasty, foot or ankle surgery, small-to-medium open abdominal surgery and lower extremity total joint arthroplasty surgery. Investors sent shares lower during the period after management announced a restructuring and cost-reduction plan aimed at reducing headcount by 34%. We are optimistic there is opportunity for Zynrelef to grow market share and added to the Fund’s position in the stock during the past 12 months. Notably, because Zynrelef is a non-opioid drug, it could help to stem opioid abuse.
SMART Global Holdings, Inc. is a diversified technology company with leading market positions in memory controllers, LEDs, high-performance computing (HPC), and the internet of things (IoT). The company hit a rough patch in 2019 and early 2020 when earnings declined due to a combination of volatility in its memory business caused by weakness in Brazil and inventory corrections, growth investments the company had made in new products ahead of revenue, and order delays in its HPC business. While none of these developments is particularly unusual, it is uncommon for all three to turn negative at the same time. Our investment thesis was that the company’s impressive new management team could not only smooth out some of the volatility in the business but also drive growth through superior capital allocation and organic investment. We also believed that strong secular trends were in place for memory controllers, driven by the increased importance of memory for computing speeds and increased memory content in devices, and for HPC, driven by artificial intelligence and machine learning. Smart Global’s stock traded lower during the period due to macro concerns and weakness in its Brazil segment, which is highly exposed to a slowdown in consumer demand for mobile devices and PCs. We took advantage of the downturn and increased the Fund’s position. We are comfortable with the volatility of the Brazil business as, over cycles, this segment has been a solid cash generator that helps fund investments in the strong secular growth prospects for memory controllers and HPC.
Micron Technology, Inc. is a leader in the production of DRAM and NAND memory. The Fund invested in the stock in the third quarter of 2019 during a cyclical downturn in the memory industry. Our rationale was that, while the memory industry is cyclical, we believed there are strong secular drivers in place that will lead to higher peaks and long-term growth. Our secular thesis is based on our conviction that the quest for faster computing speeds will increasingly rely on memory to solve bottlenecks and that increased memory content in nearly everything from mobile phones to automobiles will drive
| Meridian Funds | 10 | www.meridianfund.com |
Meridian Contrarian Fund
Portfolio Performance and Composition (Unaudited) (continued)
demand. Micron’s stock traded lower during the period due to macroeconomic concerns that led to lower earnings expectations. We increased the Fund’s stake in the company during the past 12 months, as we believe our secular thesis remains intact. We wanted to take advantage of what we view as temporary cyclical concerns that caused the stock to trade at less than 10x reasonable trough earnings per share (EPS) estimates and less than 7x recent peak EPS.
Outlook
Macroeconomic concerns are front and center for the markets with inflation, interest rate hikes, and recession risk overshadowing long-term company fundamentals. Although we are encouraged by some early signs suggesting that inflation may be decelerating, indications are that second-quarter earnings could be very disappointing. Against this backdrop, we will continue to look for high-quality companies at valuations that offer us an asymmetric risk/reward opportunity and prudently exploit current market conditions in seeking to make attractive long-term investments.
Thank you for your continued partnership with ArrowMark.
Jamie England
Portfolio Manager
The views of the author and information discussed in this commentary are as of June 30, 2022, are subject to change, and may not reflect the writer’s current views. The views expressed represent an assessment of market conditions at a specific point in time, are opinions only and should not be relied upon as investment advice regarding a particular investment or markets in general. Such information does not constitute a recommendation to buy or sell specific securities or investment vehicles. It should not be assumed that any investment will be profitable or will equal the performance of the fund or any securities or any sectors mentioned in this letter. The subject matter contained in this letter had been derived from several sources believed to be reliable and accurate at the time of compilation. To the extent permitted by federal securities laws, ArrowMark Colorado Holdings, LLC, Meridian Fund, Inc., nor the Fund accept any liability for losses either direct or consequential caused by the use of this third party information. Diversification cannot guarantee gain or prevent losses.
| Meridian Funds | 11 | www.meridianfund.com |
Meridian Contrarian Fund
Portfolio Performance and Composition (Unaudited) (continued)
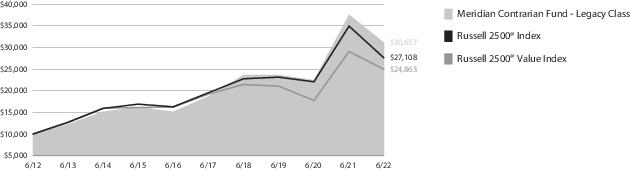
Total Return Based on a $10,000 investment for the Period Ended June 30, 2022
This graph shows the change in value of a hypothetical investment of $10,000 in Legacy Class Shares of the Fund over the past 10 years (or for the life of the Fund if shorter). Performance calculations are as of the end of June each year. For comparison, the same investment is shown in the indicated index.
Average Annual Total Return as of 6.30.22
| | Inception | 1 Year | 5 Year | 10 Year | Since
Inception |
| Legacy Class (MVALX) | 2/10/94 | (17.18)% | 10.55% | 11.85% | 12.33% |
| Class A (MFCAX) w/o sales charge | 11/15/13 | (17.40)% | 10.16% | — | 9.06% |
| Class A (MFCAX) with sales charge1 | 11/15/13 | (22.15)% | 8.86% | — | 8.31% |
| Class C (MFCCX) | 7/1/15 | (18.01)% | 9.42% | — | 8.51% |
| Investor Class (MFCIX) | 11/15/13 | (17.21)% | 10.44% | — | 9.34% |
| Russell 2500® Index | 2/10/94 2 | (21.00)% | 7.04% | 10.49% | 9.68% |
| Russell 2500® Value Index | 2/10/94 2 | (13.19)% | 5.54% | 9.54% | 9.82% |
| 1 | Assuming maximum sales charge, if any. Class A Shares are subject to a maximum initial sales charge of 5.75%. |
| 2 | Inception date of Legacy Class Shares. |
See “Disclosures Regarding Fund Performance” on page 29 for important information regarding reported performance.
Past performance is not predictive of future performance. The graph and table do not reflect the deduction of taxes that a shareholder would pay on Fund distributions or the redemption of Fund shares and do not reflect the imposition of a 2% redemption fee on shares held 60 days or less to deter market timers. If reflected, the taxes and fees would reduce the performance quoted. Net asset value, investment return and principal value will fluctuate, so shares, when redeemed, may be worth more or less than their original cost.
| Meridian Funds | 12 | www.meridianfund.com |
Meridian Contrarian Fund
Portfolio Composition (Unaudited)
Top 10 Holdings as of 6.30.22
| Axis Capital Holdings Ltd. | 3.8% |
| Acadia Healthcare Co., Inc. | 3.5% |
| CACI International, Inc. Class A | 3.4% |
| VICI Properties, Inc. | 3.0% |
| Change Healthcare, Inc. | 2.8% |
| First Citizens BancShares, Inc. Class A | 2.7% |
| SMART Global Holdings, Inc. | 2.6% |
| Photronics, Inc. | 2.4% |
| Molson Coors Beverage Co. Class B | 2.4% |
| Driven Brands Holdings, Inc. | 2.3% |
Portfolio holdings are subject to change and may not reflect the current or future position of the portfolio. Top ten holdings excluding short-term investments are reported as a percentage of net assets.
Sector Allocation as of 6.30.22
Sector allocations are subject to change and may not reflect the current or future position of the portfolio. Sector allocations are reported as a percentage of equity investments excluding cash or cash equivalents.
For compliance purposes, the Fund’s industry classifications may refer to any one or more of the industry sub-classifications used by one or more widely recognized market indexes or ratings group indexes, and/or as defined by Fund management. This definition may not apply for purposes of this report, which may combine sub-classifications for reporting ease.
| Meridian Funds | 13 | www.meridianfund.com |
Meridian Enhanced Equity Fund
Portfolio Performance and Composition (Unaudited)
Market Overview
Investor sentiment soured considerably during the 12-month period ended June 30, 2022, amid sustained generational highs in inflation and a boldly hawkish turn by the U.S. Federal Reserve (the “Fed”). Ongoing supply chain challenges, rising interest rates, Russia’s invasion of Ukraine, and solid wage growth all propelled prices higher, which sparked recession concerns. Many stocks absorbed double-digit losses as interest rates jumped and the U.S. Treasury yield curve flattened.
During the period, the Fed fully transformed its strategy from the accommodative approach implemented in response to the pandemic to an aggressive tightening campaign focused on taming inflation. In addition to wrapping up its pandemic-era bond-buying program, policymakers started reducing the Fed’s balance sheet and implemented the first 50-basis-point hike since 2000, followed by the first 75-basis-point increase in 28 years.
Buoyed by enduring strength in the U.S. labor market, where the unemployment rate lingered at five-decade lows, consumers kept spending through much of the period, although consumer confidence waned in its closing months. Business spending also proved relatively durable, although soaring costs and dimmed economic outlooks ultimately contributed to lowered future corporate profit expectations.
Against this backdrop, value stocks generally outperformed interest rate-sensitive growth stocks, as measured by the Russell family of U.S. indices. Stocks of all market capitalizations endured sizeable setbacks, although large cap names tended to perform better than midcap holdings, which largely outperformed small cap positions.
Fund Performance
The Meridian Enhanced Equity Fund (the “Fund”) Legacy Class Shares declined 13.52% (net) for the 12-month period ended June 30, 2022, underperforming its benchmark, the S&P 500® Index, which retreated 10.62%.
Our investment process prioritizes the management of risk over the opportunity for return. We look to build an “enduring” portfolio that can mitigate capital losses during turbulent bear market environments and offer upside participation during strong bull market environments as well. To achieve that, we seek out quality businesses maintaining considerable competitive advantages and healthy balance sheets that offer robust cash flow characteristics and muted volatility traits.
At any given time, roughly half of the Fund is invested in what we believe to be high quality, larger capitalization companies with promising growth prospects. The balance of the portfolio is invested in equities hedged in a risk-managed approach where more predictable stocks are married with options in an effort to reduce downside risks. Underlying this approach is our commitment to deep fundamental research.
Within the volatile 12-month period, leading detractors included Walt Disney Co. (The), QUALCOMM, Inc., and Liberty Broadband Corp.
Disney’s performance suffered as investor uncertainty remained around the long-term profitability of its streaming business. The sentiment overshadowed recent results featuring ongoing market share gains within the direct-to-consumer streaming offerings and a healthy rebound in park visits and revenue. While disappointed with the stock’s downturn, we intend to stay patient as we believe the company’s broad reservoir of iconic brands and related franchises provide multiple avenues for long-term value creation. In our view, the broader market continues to underestimate Disney’s franchise value and its earnings power.
A leader in the cellular communications technology industry, Qualcomm operates through a hybrid model that combines a high-margin intellectual property (“IP”) licensing business and a “fabless” semiconductor design capability. Its offerings are essential to reliable connectivity for most mobile communication networks, and we remain attracted to Qualcomm’s extensive and defensible IP portfolio, strong financial profile, and continued market share gains in a growing market. Concerns that leading smartphone producer Apple may look to replace Qualcomm’s chips with an in-house design hindered performance during the period. We, however, believe the stock price more than discounts this risk, especially given recent press reports that suggest Apple is struggling to develop an alternative. Given the stock’s seemingly forgiving valuation and the potential for an expansion of the company’s addressable market, Qualcomm remained in the Fund at period-end.
Competitive concerns and a push for investments in riskier technology upgrades dampened returns across the telecommunication services industry during the period, which weighed on Liberty Broadband. The company holds a considerable investment in Charter Communications, a leading broadband provider with dominant share across its markets. Given the resiliency of Liberty Broadband’s subscription-based broadband businesses, its robust free cash flow profile, and
| Meridian Funds | 14 | www.meridianfund.com |
Meridian Enhanced Equity Fund
Portfolio Performance and Composition (Unaudited) (continued)
the mission-critical nature of its fiber-based communications backbone, we believe the potential upside continues to outweigh any further downside. Additionally, we believe Liberty Broadband’s significantly discounted exposure to Charter provides a margin of safety.
Top individual contributors during the period included Duolingo, Inc., On Holding AG, and Ginkgo Bioworks Holdings, Inc., all of which we exited after their stock prices exceeded fundamentals. We reinvested the proceeds in an assortment of mission-critical goods and services providers who are category leaders but sustained what we believed to be overdone declines in sentiment.
With more than 500 million downloads of its software worldwide, Duolingo is a leading language learning platform. It offers courses in 40 different languages, and we were attracted to the company’s success at reducing barriers to access and learning, the efficiency and affordability facilitated by its mobile app, and the fun inherent in its gamification of content. A digital native company, Duolingo fit well within our strategy of finding companies that are successfully using emerging technology to change legacy systems and industries. Early in the 12-month period, the company went public and reported impressive quarterly results, but in the wake of the stock’s subsequent sharp rise and implications for valuation, the Fund sold out of the position.
Similarly, the stock of Switzerland-based On Holding jumped as it went public early in the period and the Fund was rewarded for its participation in the IPO. Our interest in this developer of high-performance athletic shoes was rooted in a deep appreciation for the brand, which is highly regarded in the running community, and a founder-led culture that prioritizes innovation, which tends to lead to technically superior products. Yet, when its valuation exceeded our target, we liquidated the Fund’s stake.
Ginkgo Bioworks rallied after merging with a special purpose acquisition company in the fall of 2021 and the Fund similarly exited the holding when we believed the price was no longer justified by the fundamentals. Ginkgo is a leader in the emerging field of synthetic biology, in which cells are programmed to design, test, and build better products. Synthetic biology applications already drive innovation across the food, fragrance, and pharmaceutical markets, and since we believe Ginkgo will continue to be a key partner in the space, we are monitoring its progress.
Outlook
Looking ahead, we don’t anticipate the path will get any smoother in the coming quarters. Inflation is poised to remain elevated across a broad swath of the economy, which will likely prompt further monetary tightening by the Fed. Geopolitical risks, particularly in Ukraine, remain front of mind, especially in energy markets, which are further hamstrung by structural challenges due to years of underinvestment, and in food supplies, which are seeing material shifts on the supply side. The likelihood of a recession or stagflation has expanded as consumers contend with the competing pressures of the tightening money supply and higher prices on services and goods, especially staples.
Admittedly, our outlook is relatively uninspiring, but we believe that out of volatility, opportunity is born. We typically look to capitalize on market disruptions by buying high-quality businesses that we believe will compound value over the long-term. Regardless of whether conditions are good or poor, we stick to our playbook and prudently work to manage risk by leveraging deep fundamental company-level research rather than macroeconomic assessments. Meanwhile, our charge remains to prioritize risk over return, even if that means trading some incremental market upside for downside protection. Through the combination of stock selection and our covered call strategy, we believe our disciplined and conservative approach to deploying capital is ideal for a market that still appears to have gotten ahead of economic realities.
Thank you for your continued partnership with ArrowMark.
Clay Freeman
Portfolio Manager
The views of the author and information discussed in this commentary are as of June 30, 2022, are subject to change, and may not reflect the writer’s current views. The views expressed represent an assessment of market conditions at a specific point in time, are opinions only and should not be relied upon as investment advice regarding a particular investment or markets in general. Such information does not constitute a recommendation to buy or sell specific securities or investment vehicles. It should not be assumed that any investment will be profitable or will equal the performance of the fund or any securities or any sectors mentioned in this letter. The subject matter contained in this letter had been derived from several sources believed to be reliable and accurate at the time of compilation. To the extent permitted by federal securities laws,
| Meridian Funds | 15 | www.meridianfund.com |
Meridian Enhanced Equity Fund
Portfolio Performance and Composition (Unaudited) (continued)
ArrowMark Colorado Holdings, LLC, Meridian Fund, Inc., nor the Fund accept any liability for losses either direct or consequential caused by the use of this third party information. Diversification cannot guarantee gain or prevent losses.
| Meridian Funds | 16 | www.meridianfund.com |
Meridian Enhanced Equity Fund
Portfolio Performance and Composition (Unaudited) (continued)
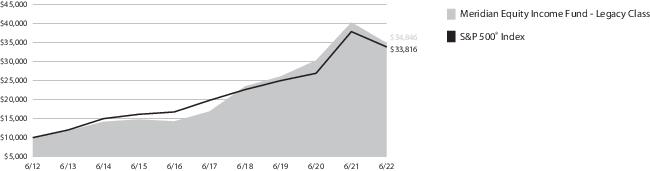
Total Return Based on a $10,000 investment for the Period Ended June 30, 2022
This graph shows the change in value of a hypothetical investment of $10,000 in Legacy Class Shares of the Fund over the past 10 years (or for the life of the Fund if shorter). Performance calculations are as of the end of June each year. For comparison, the same investment is shown in the indicated index.
Average Annual Total Return as of 6.30.22
| | Inception | 1 Year | 5 Year | 10 Year | Since
Inception |
| Legacy Class (MEIFX) | 1/31/05 | (13.52)% | 15.54% | 13.30% | 9.49% |
| Class A (MRAEX) w/o sales charge | 11/15/13 | (13.80)% | 15.15% | — | 11.47% |
| Class A (MRAEX) with sales charge1 | 11/15/13 | (18.77)% | 13.80% | — | 10.70% |
| Class C (MRCEX) | 7/1/15 | (14.23)% | 14.66% | — | 12.05% |
| Investor Class (MRIEX) | 11/15/13 | (13.55)% | 15.46% | — | 11.75% |
| S&P 500® Index | 1/31/05 2 | (10.62)% | 11.31% | 12.96% | 9.10% |
| 1 | Assuming maximum sales charge, if any. Class A Shares are subject to a maximum initial sales charge of 5.75%. |
| 2 | Inception date of Legacy Class Shares. |
See “Disclosures Regarding Fund Performance” on page 29 for important information regarding reported performance.
Past performance is not predictive of future performance. The graph and table do not reflect the deduction of taxes that a shareholder would pay on Fund distributions or the redemption of Fund shares and do not reflect the imposition of a 2% redemption fee on shares held 60 days or less to deter market timers. If reflected, the taxes and fees would reduce the performance quoted. Net asset value, investment return and principal value will fluctuate, so shares, when redeemed, may be worth more or less than their original cost.
| Meridian Funds | 17 | www.meridianfund.com |
Meridian Enhanced Equity Fund
Portfolio Composition (Unaudited)
Top 10 Holdings as of 6.30.22
| Lamb Weston Holdings, Inc. | 8.2% |
| ON Semiconductor Corp. | 6.4% |
| Zoom Video Communications, Inc. Class A | 5.2% |
| Wells Fargo & Co. | 4.9% |
| Coty, Inc. Class A | 4.9% |
| CoStar Group, Inc. | 4.7% |
| Maxar Technologies, Inc. | 4.0% |
| Sally Beauty Holdings, Inc. | 4.0% |
| Spectrum Brands Holdings, Inc. | 3.2% |
| Dole Plc | 3.1% |
Portfolio holdings are subject to change and may not reflect the current or future position of the portfolio. Top ten holdings excluding short-term investments and options written are reported as a percentage of net assets.
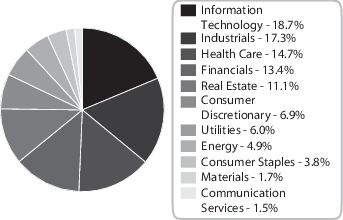
Sector Allocation as of 6.30.22
Sector allocations are subject to change and may not reflect the current or future position of the portfolio. Sector allocations are reported as a percentage of equity investments excluding cash or cash equivalents. As of period end, the Fund invested a significant portion of their assets in securities in the Information Technology sector. Changes in economic conditions affecting such sector would have a greater impact on the Fund and could affect the value, income and/or liquidity of positions in such securities.
For compliance purposes, the Fund’s industry classifications may refer to any one or more of the industry sub-classifications used by one or more widely recognized market indexes or ratings group indexes, and/or as defined by Fund management. This definition may not apply for purposes of this report, which may combine sub-classifications for reporting ease.
| Meridian Funds | 18 | www.meridianfund.com |
Meridian Small Cap Growth Fund
Portfolio Performance and Composition (Unaudited)
Market Overview
U.S. equity markets were volatile during the 12-month period as new COVID-19 variants, global supply-chain issues, the war in Ukraine, and a rapid rise in inflation kept investors on edge. An acceleration in inflation, which climbed to a 40-year high, prompted the U.S. Federal Reserve (Fed) to end its ultra-easy monetary policy and raise interest rates 25 basis points in March, the first rate hike in more than three years. Policymakers continued their campaign against inflation in May and June, raising rates 50 basis points and 75 basis points, respectively. June’s rate hike was the largest in 28 years. In the final weeks of the period, heightened fears that rising interest rates and inflation may lead to an economic recession and weaken corporate profits continued to push equity markets lower.
Against this backdrop, large cap stocks outperformed small caps, according to the Russell indices. From a style perspective, value stocks outperformed growth stocks across capitalization categories.
Fund Performance
The Meridian Small Cap Growth Fund (the “Fund”) Legacy Class Shares returned -32.39% (net) for the 12-month period ended June 30, 2022, outperforming its benchmark, the Russell 2000® Growth Index, which returned -33.43%.
The index decline was broad-based with all sectors except for energy and utilities declining during the period. Notable underperformers included the communication services, information technology, and consumer discretionary sectors, which were all down in excess of 30%.
Our investment process prioritizes the management of risk over the opportunity for return. We look to build an “enduring” portfolio that can mitigate capital losses during turbulent bear market environments and, secondarily, participate in the upside during strong market environments. This strategy proved effective during the 12-month period, which was exceptionally volatile and included 40 days of 2% or greater declines in Index performance. The Fund outperformed on all but two of these days.
During the period, the Fund benefitted from positive stock selection in the information technology and materials sectors. In addition, an overweight position in the industrials sector aided performance, as industrials was one of the top performing sectors in the index. We maintained the Fund’s overweight to industrials given our focus on commercial and professional service companies, which tend to exhibit strong competitive advantages and generally less macro sensitivity than the broader sector. Conversely, select healthcare holdings detracted from relative performance, as several names declined materially. Market factors were generally mixed, although larger cap names within the index continued to outperform smaller cap names, creating a headwind for performance.
Market volatility provided us with the opportunity to establish positions in several high-quality growth companies that we believe had declined to attractive levels during the period. In particular, we took advantage of lower valuation multiples for select information technology and healthcare companies. While we are excited about the significant decline in valuations in both of these sectors, we are seeking to be prudent with position sizes in the event multiples contract even further from here. We believe the types of companies we invest in (strong balance sheets, recurring revenue streams, large and growing addressable markets), will create shareholder value over longer periods of time.
The three largest contributors to the Fund's relative performance during the period were Hudson Technologies, Inc., Echo Global Logistics, Inc., and Mimecast Ltd.
Hudson Technologies, Inc. is the market leader in recycled and reclaimed refrigerants with proprietary reclamation technology and a national distribution network. We have owned shares of the company for several years due to our belief that its leading position would allow the company to capitalize on improving supply-demand dynamics from the Environmental Protection Agency’s (EPA’s) phaseout of R-22 (refrigerant used in air conditioners). The phaseout concluded in 2020 and virgin R-22 is no longer being produced. This has resulted in strong refrigerant pricing given stable demand and more limited supply. As a result, overall fundamentals have accelerated which resulted in 150% revenue growth and 45% operating margins in its most recent quarter. We are optimistic that another catalyst for growth is the AIM Act to reduce the production of hydrofluorocarbons (HFCs). Similar to the phaseout of R-22, we believe this will result in strong supply-demand dynamics for reclaimed HFC refrigerants and allow Hudson to capitalize on its market-leading position. During the period, we trimmed our position in the stock.
Echo Global Logistics, Inc. is an asset-light transportation company providing technology-enabled transportation and
| Meridian Funds | 19 | www.meridianfund.com |
Meridian Small Cap Growth Fund
Portfolio Performance and Composition (Unaudited) (continued)
supply chain management solutions. We believe Echo’s proprietary technology platforms for truckload quoting and transit times fulfill a growing need within the commercial trucking industry. By helping link supply and demand between smaller shippers and carriers, Echo’s solutions enable both parties to increase productivity and efficiency. As a result, smaller carriers can reduce the number of empty miles and improve profitability while shippers can gain access to a significant amount of trucking capacity among smaller carriers. The company’s stock soared during the period after The Jordan Company, a private equity firm, offered to buy Echo at more than a 50% premium to its stock price. The acquisition was completed in November, and we were pleased to see our investment thesis validated.
Mimecast Ltd. is a cybersecurity firm focused primarily on email security. One of the things that initially attracted us to Mimecast was its email threat intelligence, which we believe is more robust than that of many of its competitors. This intelligence enables the company to capture and quarantine a higher number of harmful emails while avoiding capturing and quarantining emails that are benevolent. Demand for cybersecurity solutions, particularly among large enterprises, continues to rise, adding to our excitement for cybersecurity firms in general and Mimecast in particular. We took advantage of an opportunity to build a position in the stock after concerns about a security breach temporarily depressed Mimecast’s share price. Our research indicated the breach impacted a limited number of existing customers and that demand from new customers remained robust. During the period, the stock rallied after Mimecast announced that private equity firm Permira had made an offer to buy it at a premium to its stock price. The deal closed in the first half of 2022.
The three largest detractors from the Fund’s relative performance during the period were 2U, Inc., 8x8, Inc., and Momentive Global, Inc.
2U, Inc. is an educational technology firm that partners with leading nonprofit colleges and universities to offer online degree programs. The company possesses many of the qualities that we believe define a good business, including long-term contracts and recurring revenue; attractive unit economics that should deliver strong EBITDA margins at scale; and strong brand recognition with marquee university partners to drive continued growth. Unfortunately, headwinds from 2U’s recent acquisition of online course provider edX and incremental losses associated with the merger have resulted in a reduced outlook for the company’s 2022 profits. Further pressuring the stock during the past 12 months was weaker demand for higher education degrees due to a tight labor market and high marketing and sales costs to attract new students. We are closely monitoring the Fund’s holding in 2U and trimmed the Fund’s position in the stock during the period.
8x8, Inc. is a cloud communications provider that offers businesses a unified voice, contact center, video, and chat platform. The company hired a new CEO in late 2020 who has since refocused the company on areas of the market where 8x8 has competitive advantages and the potential to earn higher margins. In conjunction with this change in strategy, the company exited low-growth and low-margin product lines, which has led to what we believe is a temporary slowdown in revenue growth. A recent acquisition that depleted 8x8’s cash position also weighed on investor sentiment. We believe the company will overcome these short-term issues and that, at its current price, the stock is attractively valued. We are willing to be patient as the company works through these setbacks and added to the Fund’s position in the stock during the period.
Momentive Global, Inc. develops survey software that enables organizations to collect and analyze feedback and insights. Its most recognized brand is the online survey tool SurveyMonkey. Momentive offers customers a free, self-service software solution and then applies an upsell strategy to convert customers to a more robust, paid version of the product. By investing profits from this self-service business into its enterprise-grade product, Momentive has been able to build an enterprise business that now makes up 35% of total revenues. During the period, the stock declined due mostly to continued disappointment that the Zendesk acquisition was voted down, and that no other potential suitors have subsequently expressed interest. Additionally, there is some level of concern that a slower pace of investment spending will negatively impact revenue growth in future quarters, and that an economic downturn could impact spending on surveys to a larger degree than it will on other segments of software. We believe Momentive will continue to generate a healthy combination of growth and profitability going forward, even during a potential downturn. We also believe the company’s relatively nascent enterprise business can take share in a downturn owing to its position as the low-cost survey solution. During the period, we trimmed the Fund’s position in Momentive Global.
Outlook
After raising interest rates 150 basis points in the first half of 2022 and indicating that additional rate increases may be needed, it is clear that Federal Reserve policymakers have become increasingly certain that aggressive action is necessary to tame inflation. They also appear more willing to accept the risk of an economic slowdown in exchange for aggressive monetary tightening and lower inflationary pressures. As a result, investors are wary of potential demand destruction and other consequences the broader economy may suffer in the coming months.
| Meridian Funds | 20 | www.meridianfund.com |
Meridian Small Cap Growth Fund
Portfolio Performance and Composition (Unaudited) (continued)
As the Federal Reserve embarks on its tightening path, we expect volatility to increase which we believe will create opportunities for capital deployment and portfolio re-positioning. Following the unprecedented monetary and fiscal stimulus introduced as a response to the pandemic, many growth names in the information technology and healthcare sectors experienced meteoric increases in valuation multiples that have finally begun to reset. Our focus going forward remains on companies that can not only weather the current market downturn, but also participate when the market ultimately rebounds. We believe the current correction continues to present us with opportunities to upgrade the quality of the portfolio while seeking to maintain our strict valuation discipline.
Thank you for your continued partnership with ArrowMark.
Brian Schaub & Chad Meade
Co-Portfolio Managers
The views of the author and information discussed in this commentary are as of June 30, 2022, are subject to change, and may not reflect the writer’s current views. The views expressed represent an assessment of market conditions at a specific point in time, are opinions only and should not be relied upon as investment advice regarding a particular investment or markets in general. Such information does not constitute a recommendation to buy or sell specific securities or investment vehicles. It should not be assumed that any investment will be profitable or will equal the performance of the fund or any securities or any sectors mentioned in this letter. The subject matter contained in this letter had been derived from several sources believed to be reliable and accurate at the time of compilation. To the extent permitted by federal securities laws, ArrowMark Colorado Holdings, LLC, Meridian Fund, Inc., nor the Fund accept any liability for losses either direct or consequential caused by the use of this third party information. Diversification cannot guarantee gain or prevent losses.
| Meridian Funds | 21 | www.meridianfund.com |
Meridian Small Cap Growth Fund
Portfolio Performance and Composition (Unaudited) (continued)
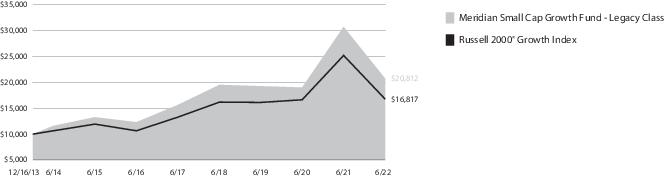
Total Return Based on a $10,000 investment for the Period Ended June 30, 2022
This graph shows the change in value of a hypothetical investment of $10,000 in Legacy Class Shares of the Fund over the past 10 years (or for the life of the Fund if shorter). Performance calculations are as of the end of June each year. For comparison, the same investment is shown in the indicated index.
Average Annual Total Return as of 6.30.22
| | Inception | 1 Year | 5 Year | Since
Inception |
| Legacy Class (MSGGX) | 12/16/13 | (32.39)% | 5.80% | 8.96% |
| Institutional Class (MSGRX) | 12/24/14 | (32.36)% | 5.86% | 7.05% |
| Class A (MSGAX) w/o sales charge | 12/16/13 | (32.63)% | 5.44% | 8.60% |
| Class A (MSGAX) with sales charge1 | 12/16/13 | (36.51)% | 4.20% | 7.85% |
| Class C (MSGCX) | 7/1/15 | (33.10)% | 4.71% | 5.51% |
| Investor Class (MISGX) | 12/16/13 | (32.44)% | 5.70% | 8.89% |
| Russell 2000® Growth Index | 12/16/13 2 | (33.43)% | 4.80% | 6.28% |
| 1 | Assuming maximum sales charge, if any. Class A Shares are subject to a maximum initial sales charge of 5.75%. |
| 2 | Inception date of Legacy Class Shares. |
See “Disclosures Regarding Fund Performance” on page 29 for important information regarding reported performance.
Past performance is not predictive of future performance. The graph and table do not reflect the deduction of taxes that a shareholder would pay on Fund distributions or the redemption of Fund shares and do not reflect the imposition of a 2% redemption fee on shares held 60 days or less to deter market timers. If reflected, the taxes and fees would reduce the performance quoted. Net asset value, investment return and principal value will fluctuate, so shares, when redeemed, may be worth more or less than their original cost.
| Meridian Funds | 22 | www.meridianfund.com |
Meridian Small Cap Growth Fund
Portfolio Composition (Unaudited)
Top 10 Holdings as of 6.30.22
| Heritage-Crystal Clean, Inc. | 3.4% |
| Ritchie Bros. Auctioneers, Inc. (Canada) | 3.3% |
| Frontdoor, Inc. | 3.1% |
| Skechers U.S.A., Inc. Class A | 2.9% |
| QuidelOrtho Corp. | 2.1% |
| Sally Beauty Holdings, Inc. | 2.1% |
| Matson, Inc. | 1.8% |
| Merit Medical Systems, Inc. | 1.8% |
| Forward Air Corp. | 1.7% |
| Hudson Technologies, Inc. | 1.5% |
Portfolio holdings are subject to change and may not reflect the current or future position of the portfolio. Top ten holdings excluding short-term investments are reported as a percentage of net assets.
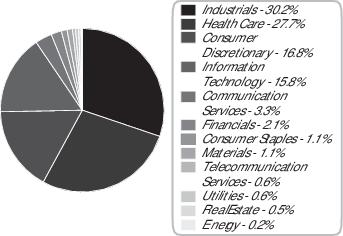
Sector Allocation as of 6.30.22
Sector allocations are subject to change and may not reflect the current or future position of the portfolio. Sector allocations are reported as a percentage of equity investments excluding cash or cash equivalents. As of period end, the Fund invested a significant portion of their assets in securities in the Industrials and Health Care sectors. Changes in economic conditions affecting such sectors would have a greater impact on the Fund and could affect the value, income and/or liquidity of positions in such securities.
For compliance purposes, the Fund’s industry classifications may refer to any one or more of the industry sub-classifications used by one or more widely recognized market indexes or ratings group indexes, and/or as defined by Fund management. This definition may not apply for purposes of this report, which may combine sub-classifications for reporting ease.
| Meridian Funds | 23 | www.meridianfund.com |
Meridian Fund, Inc.
Expense Disclosure
June 30, 2022 (Unaudited)
Disclosures Regarding Fund Expenses
Example
As a shareholder of the Fund, you incur two types of costs: (1) transaction costs, including sales charges (loads) on purchase payments, reinvested dividends, or other distributions; redemption fees; and (2) ongoing costs, including management fees; service and distribution (12b-1) fees; and other Fund expenses. This Example is intended to help you understand your ongoing costs (in dollars) of investing in the Fund and to compare these costs with the ongoing costs of investing in other mutual funds.
The Example is based on an investment of $1,000 invested at the beginning of the period and held for the entire period of January 1, 2022 through June 30, 2022.
Actual Expenses
The first table below provides information about actual account values and actual expenses. You may use the information in this table, together with the amount you invested, to estimate the expenses that you paid over the period. Simply divide your account value by $1,000 (e.g., an $8,600 account value divided by $1,000 = 8.6), then multiply the result by the number reported under “Expenses Paid During the Period” to estimate the expenses you paid on your account during this period.
Hypothetical Example for Comparison Purposes
The second table below provides information about hypothetical account values and hypothetical expenses based on the Fund’s actual expense ratio and an assumed rate of return of 5% per year before expenses, which is not the Fund’s actual return. The hypothetical account values and expenses may not be used to estimate the actual ending account balance or expenses you paid for the period. You may use this information to compare the ongoing costs of investing in the Fund and other funds. To do so, compare this 5% hypothetical example with the 5% hypothetical examples that appear in the shareholder reports of the other funds.
Please note that the expenses shown in the tables are meant to highlight your ongoing costs only and do not reflect any transactional costs, such as sales charges (loads) or redemption fees. Therefore, the second table is useful in comparing ongoing costs only, and will not help you determine the relative total costs of owning different funds. In addition, if these transactional costs were included, your costs would have been higher.
| Meridian Funds | 24 | www.meridianfund.com |
Meridian Growth Fund
Fund Expenses
June 30, 2022 (Unaudited)
Expense Example
| Actual | Annualized
Expense Ratio | Beginning Account
Value January 1, 2022 | Ending Account Value
June 30, 2022 | Expenses Paid During
the Period 1 |
| Legacy Class (MERDX) | 0.87% | $1,000.00 | $710.70 | $3.69 |
| Institutional Class (MRRGX) | 0.83% | $1,000.00 | $710.70 | $3.52 |
| Class A (MRAGX) | 1.17% | $1,000.00 | $709.40 | $4.96 |
| Class C (MRCGX) | 1.87% | $1,000.00 | $707.10 | $7.92 |
| Investor Class (MRIGX) | 0.92% | $1,000.00 | $710.40 | $3.90 |
| Hypothetical 2 | Annualized
Expense Ratio | Beginning Account
Value January 1, 2022 | Ending Account Value
June 30, 2022 | Expenses Paid During
the Period 1 |
| Legacy Class (MERDX) | 0.87% | $1,000.00 | $1,020.48 | $4.36 |
| Institutional Class (MRRGX) | 0.83% | $1,000.00 | $1,020.68 | $4.16 |
| Class A (MRAGX) | 1.17% | $1,000.00 | $1,018.99 | $5.86 |
| Class C (MRCGX) | 1.87% | $1,000.00 | $1,015.52 | $9.35 |
| Investor Class (MRIGX) | 0.92% | $1,000.00 | $1,020.23 | $4.61 |
| 1 | Expenses are equal to the Fund’s annualized expense ratio multiplied by the average account value over the period, multiplied by 181 days, the number of days in the most recent fiscal half-year, then divided by 365. |
| 2 | Hypothetical 5% return before expenses. |
The above “Annualized Expense Ratios” reflect waivers and/or reimbursements of expenses by the Fund’s Adviser. Such waivers and/or reimbursements may not be withdrawn earlier than one year after the date of the current prospectus. The “Financial Highlights” included within the Fund’s financial statements shows the gross expense ratios for each share class.
See “Disclosure Regarding Fund Expenses” on page 24 for further information on how the above examples were calculated.
| Meridian Funds | 25 | www.meridianfund.com |
Meridian Contrarian Fund
Fund Expenses
June 30, 2022 (Unaudited)
Expense Example
| Actual | Annualized
Expense Ratio | Beginning Account
Value January 1, 2022 | Ending Account Value
June 30, 2022 | Expenses Paid During
the Period 1 |
| Legacy Class (MVALX) | 1.14% | $1,000.00 | $790.90 | $5.06 |
| Class A (MFCAX) | 1.46% | $1,000.00 | $789.90 | $6.48 |
| Class C (MFCCX) | 2.21% | $1,000.00 | $786.90 | $9.79 |
| Investor Class (MFCIX) | 1.19% | $1,000.00 | $790.70 | $5.28 |
| Hypothetical 2 | Annualized
Expense Ratio | Beginning Account
Value January 1, 2022 | Ending Account Value
June 30, 2022 | Expenses Paid During
the Period 1 |
| Legacy Class (MVALX) | 1.14% | $1,000.00 | $1,019.14 | $ 5.71 |
| Class A (MFCAX) | 1.46% | $1,000.00 | $1,017.55 | $ 7.30 |
| Class C (MFCCX) | 2.21% | $1,000.00 | $1,013.84 | $11.04 |
| Investor Class (MFCIX) | 1.19% | $1,000.00 | $1,018.89 | $ 5.96 |
| 1 | Expenses are equal to the Fund’s annualized expense ratio multiplied by the average account value over the period, multiplied by 181 days, the number of days in the most recent fiscal half-year, then divided by 365. |
| 2 | Hypothetical 5% return before expenses. |
The above “Annualized Expense Ratios” reflect waivers and/or reimbursements of expenses by the Fund’s Adviser. Such waivers and/or reimbursements may not be withdrawn earlier than one year after the date of the current prospectus. The “Financial Highlights” included within the Fund’s financial statements shows the gross expense ratios for each share class.
See “Disclosure Regarding Fund Expenses” on page 24 for further information on how the above examples were calculated.
| Meridian Funds | 26 | www.meridianfund.com |
Meridian Enhanced Equity Fund
Fund Expenses
June 30, 2022 (Unaudited)
Expense Example
| Actual | Annualized
Expense Ratio | Beginning Account
Value January 1, 2022 | Ending Account Value
June 30, 2022 | Expenses Paid During
the Period 1 |
| Legacy Class (MEIFX) | 1.21% | $1,000.00 | $828.90 | $5.49 |
| Class A (MRAEX) | 1.56% | $1,000.00 | $827.40 | $7.07 |
| Class C (MRCEX) | 2.00% | $1,000.00 | $825.80 | $9.05 |
| Investor Class (MRIEX) | 1.20% | $1,000.00 | $828.50 | $5.44 |
| Hypothetical 2 | Annualized
Expense Ratio | Beginning Account
Value January 1, 2022 | Ending Account Value
June 30, 2022 | Expenses Paid During
the Period 1 |
| Legacy Class (MEIFX) | 1.21% | $1,000.00 | $1,018.79 | $6.06 |
| Class A (MRAEX) | 1.56% | $1,000.00 | $1,017.06 | $7.80 |
| Class C (MRCEX) | 2.00% | $1,000.00 | $1,014.88 | $9.99 |
| Investor Class (MRIEX) | 1.20% | $1,000.00 | $1,018.84 | $6.01 |
| 1 | Expenses are equal to the Fund’s annualized expense ratio multiplied by the average account value over the period, multiplied by 181 days, the number of days in the most recent fiscal half-year, then divided by 365. |
| 2 | Hypothetical 5% return before expenses. |
The above “Annualized Expense Ratios” reflect waivers and/or reimbursements of expenses by the Fund’s Adviser. Such waivers and/or reimbursements may not be withdrawn earlier than one year after the date of the current prospectus. The “Financial Highlights” included within the Fund’s financial statements shows the gross expense ratios for each share class.
See “Disclosure Regarding Fund Expenses” on page 24 for further information on how the above examples were calculated.
| Meridian Funds | 27 | www.meridianfund.com |
Meridian Small Cap Growth Fund
Fund Expenses
June 30, 2022 (Unaudited)
Expense Example
| Actual | Annualized
Expense Ratio | Beginning Account
Value January 1, 2022 | Ending Account Value
June 30, 2022 | Expenses Paid During
the Period 1 |
| Legacy Class (MSGGX) | 1.18% | $1,000.00 | $724.30 | $5.04 |
| Institutional Class (MSGRX) | 1.10% | $1,000.00 | $724.60 | $4.70 |
| Class A (MSGAX) | 1.50% | $1,000.00 | $723.10 | $6.41 |
| Class C (MSGCX) | 2.18% | $1,000.00 | $720.40 | $9.30 |
| Investor Class (MISGX) | 1.25% | $1,000.00 | $723.90 | $5.34 |
| Hypothetical 2 | Annualized
Expense Ratio | Beginning Account
Value January 1, 2022 | Ending Account Value
June 30, 2022 | Expenses Paid During
the Period 1 |
| Legacy Class (MSGGX) | 1.18% | $1,000.00 | $1,018.94 | $ 5.91 |
| Institutional Class (MSGRX) | 1.10% | $1,000.00 | $1,019.34 | $ 5.51 |
| Class A (MSGAX) | 1.50% | $1,000.00 | $1,017.36 | $ 7.50 |
| Class C (MSGCX) | 2.18% | $1,000.00 | $1,013.98 | $10.89 |
| Investor Class (MISGX) | 1.25% | $1,000.00 | $1,018.60 | $ 6.26 |
| 1 | Expenses are equal to the Fund’s annualized expense ratio multiplied by the average account value over the period, multiplied by 181 days, the number of days in the most recent fiscal half-year, then divided by 365. |
| 2 | Hypothetical 5% return before expenses. |
The above “Annualized Expense Ratios” reflect waivers and/or reimbursements of expenses by the Fund’s Adviser. Such waivers and/or reimbursements may not be withdrawn earlier than one year after the date of the current prospectus. The “Financial Highlights” included within the Fund’s financial statements shows the gross expense ratios for each share class.
See “Disclosure Regarding Fund Expenses” on page 24 for further information on how the above examples were calculated.
| Meridian Funds | 28 | www.meridianfund.com |
Meridian Fund, Inc.
Performance Disclosure
June 30, 2022 (Unaudited)
Disclosures Regarding Fund Performance
Past performance is not predictive of future performance. Current performance may be lower or higher than the quoted past performance. Reported performance assumes reinvestment of Fund distributions. Reported performance does not reflect the deduction of taxes that a shareholder would pay on Fund distributions or the redemption of Fund shares, nor does it reflect the 2% redemption fee on shares sold within 60 days of original purchase date. If reflected, the taxes and fees would reduce the performance quoted. Net asset value, investment return and principal value will fluctuate, so shares, when redeemed, may be worth more or less than their original cost. You can obtain the most current month-end performance at www.meridianfund.com.
Performance prior to September 5, 2013 reflects each Fund’s performance under the management of Aster Investment Management Co.
Legacy class shares are no longer offered to the public effective March 1, 2014, except under certain limited circumstances.
Investor Class, Class A, and Class C Shares of the Meridian Growth Fund are closed to new investors effective June 15, 2017. Existing investors may continue to purchase shares.
Investor Class, Class A, and Class C Shares of the Meridian Small Cap Growth Fund are closed to new investors effective June 29, 2018. Existing investors may continue to purchase shares.
Indices are typically unmanaged, and do not reflect deductions for fees or expenses. You cannot invest directly in an index.
Investors should consider the investment objective and policies, risk considerations, charges and ongoing expenses of an investment carefully before investing. The prospectus contains this and other information relevant to an investment in any of the Meridian Funds. Please read the prospectus carefully before you invest. To obtain a prospectus, please contact your investment representative or the Funds' transfer agent at 800.446.6662 or access our website at www.meridianfund.com.
| Meridian Funds | 29 | www.meridianfund.com |
Meridian Growth Fund
Schedule of Investments
June 30, 2022
| | Shares | Value |
| Common Stocks - 95.0% |
| Communication Services - 4.5% |
| Interactive Media & Services - 4.5% |
| Cargurus, Inc.1 | 329,018 | $ 7,070,597 |
| Ziff Davis, Inc.1,2 | 537,370 | 40,050,186 |
| ZipRecruiter, Inc. Class A1,2 | 1,136,827 | 16,847,776 |
| Total Communication Services | | 63,968,559 |
| Consumer Discretionary - 18.1% |
| Auto Components - 0.5% |
| Fox Factory Holding Corp.1 | 96,190 | 7,747,143 |
| Automobiles - 1.2% |
| Rivian Automotive, Inc. Class A1,2 | 645,578 | 16,617,178 |
| Diversified Consumer Services - 5.0% |
| 2U, Inc.1 | 919,054 | 9,622,495 |
| Frontdoor, Inc.1 | 1,771,655 | 42,661,453 |
| Grand Canyon Education, Inc.1 | 207,323 | 19,527,753 |
| | | 71,811,701 |
| Hotels, Restaurants & Leisure - 1.2% |
| Churchill Downs, Inc. | 60,554 | 11,597,907 |
| Sportradar Holding AG Class A (Switzerland)1,2 | 733,871 | 5,797,581 |
| | | 17,395,488 |
| Internet & Direct Marketing Retail - 1.0% |
| Farfetch Ltd. Class A (United Kingdom)1 | 925,865 | 6,629,193 |
| Shutterstock, Inc. | 125,899 | 7,215,272 |
| | | 13,844,465 |
| Leisure Products - 0.5% |
| Polaris, Inc.2 | 68,004 | 6,751,437 |
| Specialty Retail - 2.4% |
| Floor & Decor Holdings, Inc. Class A1 | 81,339 | 5,121,104 |
| Sally Beauty Holdings, Inc.1 | 2,505,295 | 29,863,116 |
| | | 34,984,220 |
| Textiles, Apparel & Luxury Goods - 6.3% |
| Canada Goose Holdings, Inc. (Canada)1,2 | 417,526 | 7,519,643 |
| Carter's, Inc. | 207,382 | 14,616,284 |
| Hanesbrands, Inc.2 | 1,673,641 | 17,221,766 |
| Skechers U.S.A., Inc. Class A1 | 1,200,823 | 42,725,282 |
| Under Armour, Inc. Class C1 | 982,385 | 7,446,478 |
| | | 89,529,453 |
| Total Consumer Discretionary | | 258,681,085 |
| Financials - 2.2% |
| Capital Markets - 2.2% |
| LPL Financial Holdings, Inc. | 94,635 | 17,458,265 |
| | Shares | Value |
| WisdomTree Investments, Inc.2 | 2,799,706 | $ 14,194,509 |
| Total Financials | | 31,652,774 |
| Health Care - 23.9% |
| Biotechnology - 4.5% |
| Agios Pharmaceuticals, Inc.1,2 | 313,180 | 6,943,201 |
| C4 Therapeutics, Inc.1 | 1,032,412 | 7,784,386 |
| CareDx, Inc.1 | 531,352 | 11,413,441 |
| Heron Therapeutics, Inc.1,2 | 964,892 | 2,692,049 |
| Relay Therapeutics, Inc.1,2 | 517,663 | 8,670,855 |
| SpringWorks Therapeutics, Inc.1,2 | 521,130 | 12,830,220 |
| Veracyte, Inc.1 | 714,323 | 14,215,028 |
| | | 64,549,180 |
| Health Care Equipment & Supplies - 11.1% |
| Axogen, Inc.1 | 960,631 | 7,867,568 |
| Cooper Cos., Inc. (The) | 34,891 | 10,925,070 |
| Hologic, Inc. 1 | 199,331 | 13,813,638 |
| Merit Medical Systems, Inc.1 | 435,004 | 23,607,667 |
| Nevro Corp. 1 | 213,358 | 9,351,481 |
| Omnicell, Inc.1 | 102,246 | 11,630,483 |
| QuidelOrtho Corp.1 | 297,763 | 28,936,609 |
| STERIS Plc | 204,820 | 42,223,643 |
| Talis Biomedical Corp.1 | 269,383 | 218,739 |
| Teleflex, Inc. | 42,698 | 10,497,303 |
| | | 159,072,201 |
| Health Care Providers & Services - 3.1% |
| HealthEquity, Inc.1 | 350,154 | 21,495,954 |
| Henry Schein, Inc.1 | 177,945 | 13,655,499 |
| MEDNAX, Inc.1,2 | 468,196 | 9,836,798 |
| | | 44,988,251 |
| Health Care Technology - 1.5% |
| Certara, Inc.1 | 694,388 | 14,901,566 |
| Doximity, Inc. Class A1,2 | 179,240 | 6,241,137 |
| | | 21,142,703 |
| Life Sciences Tools & Services - 3.1% |
| Medpace Holdings, Inc.1 | 45,308 | 6,781,249 |
| Sotera Health Co.1 | 785,092 | 15,379,952 |
| Stevanato Group SpA (Italy) | 323,270 | 5,110,899 |
| Syneos Health, Inc.1 | 232,843 | 16,690,186 |
| | | 43,962,286 |
| Pharmaceuticals - 0.6% |
| Arvinas, Inc.1,2 | 201,637 | 8,486,901 |
| Total Health Care | | 342,201,522 |
| Industrials - 25.5% |
| Aerospace & Defense - 0.8% |
| Rocket Lab U.S.A., Inc.1,2 | 1,166,799 | 4,422,168 |
| Woodward, Inc.2 | 71,035 | 6,570,027 |
| | | 10,992,195 |
The accompanying notes are an integral part of the financial statements.
| Meridian Funds | 30 | www.meridianfund.com |
Meridian Growth Fund
Schedule of Investments (continued)
June 30, 2022
| | Shares | Value |
| Air Freight & Logistics - 3.6% |
| CH Robinson Worldwide, Inc. | 272,173 | $ 27,590,177 |
| Forward Air Corp. | 254,404 | 23,394,992 |
| | | 50,985,169 |
| Commercial Services & Supplies - 6.0% |
| ACV Auctions, Inc. Class A1 | 2,435,584 | 15,928,719 |
| Cimpress Plc (Ireland)1 | 221,501 | 8,616,389 |
| Clean Harbors, Inc.1 | 163,904 | 14,369,464 |
| Ritchie Bros. Auctioneers, Inc. (Canada) | 721,330 | 46,929,730 |
| | | 85,844,302 |
| Electrical Equipment - 4.5% |
| Generac Holdings, Inc.1 | 147,041 | 30,963,894 |
| Sensata Technologies Holding Plc | 825,869 | 34,116,648 |
| | | 65,080,542 |
| Machinery - 3.9% |
| John Bean Technologies Corp. | 107,005 | 11,815,492 |
| Middleby Corp. (The)1 | 150,197 | 18,828,696 |
| Tennant Co. | 290,710 | 17,224,567 |
| Toro Co. (The) | 109,273 | 8,281,801 |
| | | 56,150,556 |
| Marine - 3.0% |
| Kirby Corp.1 | 255,063 | 15,518,033 |
| Matson, Inc. | 368,325 | 26,843,526 |
| | | 42,361,559 |
| Professional Services - 3.2% |
| Alight, Inc. Class A1,2 | 2,671,491 | 18,032,564 |
| Sterling Check Corp.1,2 | 442,007 | 7,209,134 |
| TriNet Group, Inc.1 | 275,019 | 21,346,975 |
| | | 46,588,673 |
| Road & Rail - 0.5% |
| Heartland Express, Inc. | 486,413 | 6,766,005 |
| Total Industrials | | 364,769,001 |
| Information Technology - 19.6% |
| Electronic Equipment, Instruments & Components - 1.9% |
| Trimble, Inc.1 | 462,816 | 26,949,776 |
| IT Services - 2.3% |
| Euronet Worldwide, Inc.1 | 164,445 | 16,541,523 |
| Okta, Inc.1 | 87,692 | 7,927,357 |
| Twilio, Inc. Class A1 | 94,850 | 7,949,378 |
| | | 32,418,258 |
| Semiconductors & Semiconductor Equipment - 4.0% |
| GLOBALFOUNDRIES, Inc.1,2 | 489,755 | 19,756,717 |
| ON Semiconductor Corp.1,2 | 760,422 | 38,256,831 |
| | | 58,013,548 |
| | Shares | Value |
| Software - 11.4% |
| 8x8, Inc.1 | 1,833,381 | $ 9,441,912 |
| Consensus Cloud Solutions, Inc.1 | 172,649 | 7,541,308 |
| DocuSign, Inc.1 | 141,696 | 8,130,517 |
| Dynatrace, Inc.1 | 237,772 | 9,377,728 |
| KnowBe4, Inc. Class A1 | 636,570 | 9,943,223 |
| Mandiant, Inc.1 | 474,054 | 10,343,858 |
| Momentive Global, Inc.1 | 2,114,460 | 18,607,248 |
| Monday.com Ltd.1,2 | 200,403 | 20,673,574 |
| N-able, Inc.1 | 1,761,870 | 15,856,830 |
| Smartsheet, Inc. Class A1 | 433,893 | 13,637,257 |
| Sumo Logic, Inc.1 | 947,916 | 7,099,891 |
| Tenable Holdings, Inc.1 | 131,579 | 5,975,002 |
| Zendesk, Inc.1 | 368,461 | 27,291,906 |
| | | 163,920,254 |
| Total Information Technology | | 281,301,836 |
| Materials - 0.8% |
| Containers & Packaging - 0.8% |
| Graphic Packaging Holding Co. | 553,746 | 11,351,793 |
| Total Materials | | 11,351,793 |
| Telecommunication Services - 0.4% |
| Wireless Telecommunication Services - 0.4% |
Starry, Inc.
Acquisition Date: 3/28/22,
Cost $2,600,0031,3 | 346,667 | 1,428,268 |
Starry, Inc.
Acquisition Date: 5/14/18 - 3/6/19,
Cost $6,054,9921,3 | 1,078,743 | 3,777,758 |
| Total Telecommunication Services | | 5,206,026 |
Total Common Stocks - 95.0%
(Cost $1,390,708,777) | | 1,359,132,596 |
| Preferred Stocks - 2.8% |
| Communication Services - 1.0% |
| Interactive Media & Services - 1.0% |
Evolve Vacation Rental Network, Inc. Series 9
Acquisition Date: 5/29/20,
Cost $4,499,9991,3,4 | 776,451 | 14,457,518 |
| Total Communication Services | | 14,457,518 |
| Health Care - 0.6% |
| Health Care Providers & Services - 0.5% |
Binx Health, Inc. Series E
Acquisition Date: 5/26/21,
Cost $8,500,1361,3,4 | 31,619 | 6,269,415 |
The accompanying notes are an integral part of the financial statements.
| Meridian Funds | 31 | www.meridianfund.com |
Meridian Growth Fund
Schedule of Investments (continued)
June 30, 2022
| | Shares | Value |
| Pharmaceuticals - 0.1% |
Capsule Corp. Series D
Acquisition Date: 4/8/21,
Cost $2,999,9931,3,4 | 207,016 | $ 1,910,758 |
| Total Health Care | | 8,180,173 |
| Information Technology - 0.8% |
| IT Services - 0.5% |
Skyryse, Inc. Series B
Acquisition Date: 10/21/21,
Cost $7,164,9901,3,4 | 290,316 | 7,164,990 |
| Software - 0.3% |
Dataminr, Inc. Series F
Acquisition Date: 3/22/21,
Cost $7,369,6921,3,4 | 167,493 | 4,885,771 |
| Total Information Technology | | 12,050,761 |
| Real Estate - 0.4% |
| Real Estate Management & Development - 0.4% |
Apartment List, Inc. Series D
Acquisition Date: 11/2/20 - 12/21/20,
Cost $8,399,9971,3,4 | 2,299,479 | 5,127,838 |
| Total Real Estate | | 5,127,838 |
Total Preferred Stocks - 2.8%
(Cost $38,934,807) | | 39,816,290 |
| Private Investment Fund - 0.2% |
Quail Investment Holdings, LLC
Acquisition Date: 9/1/20,
Cost $4,037,8821,3,5 | 4,038 | 3,867,766 |
Total Private Investment Fund - 0.2%
(Cost $4,037,882) | | 3,867,766 |
| | Shares/
Principal
Amount | |
| Short-Term Investments - 5.9%6 |
| Money Market Funds - 1.3% |
| BlackRock Liquidity Funds, FedFund, Institutional Class, 1.32% | 1,671,000 | 1,671,000 |
| Dreyfus Institutional Preferred Government Plus Money Market Fund, Institutional Class, 1.46% | 6,598,000 | 6,598,000 |
| | Shares/
Principal
Amount | Value |
| Goldman Sachs Financial Square Government Fund, Institutional Class, 1.36% | 1,671,000 | $ 1,671,000 |
| Invesco Short Term Investments, Government & Agency Portfolio, Institutional Class, 1.39% | 1,671,000 | 1,671,000 |
| Morgan Stanley Institutional Liquidity Funds, Government Portfolio, Institutional Class, 1.38% | 7,148,000 | 7,148,000 |
Total Money Market Funds
(Cost $18,759,000) | | 18,759,000 |
| Repurchase Agreements - 4.6% |
| Bank of America Securities, Inc., dated 6/30/22, due 7/1/22, 1.55% total to be received $19,710,306 (collateralized by various U.S. Government Sponsored Agency, 1.00% - 8.50%, 1/20/24 - 6/20/52, totaling $20,103,646) | $ 19,709,457 | 19,709,457 |
| Citigroup Global Markets, Inc., dated 6/30/22, due 7/1/22, 1.50% total to be received $6,790,346 (collateralized by various U.S. Treasury Obligations, 1.88% - 3.25%, 6/30/24 - 5/15/52, totaling $6,925,864) | 6,790,063 | 6,790,063 |
The accompanying notes are an integral part of the financial statements.
| Meridian Funds | 32 | www.meridianfund.com |
Meridian Growth Fund
Schedule of Investments (continued)
June 30, 2022
| | Shares/
Principal
Amount | Value |
| Daiwa Capital Markets America, Inc., dated 6/30/22, due 7/1/22, 1.55% total to be received $19,710,306 (collateralized by various U.S. Government Sponsored Agency and U.S. Treasury Obligations, 0.00% - 6.50%, 7/31/22 - 7/1/52, totaling $20,103,647) | $ 19,709,457 | $ 19,709,457 |
| RBC Dominion Securities, Inc., dated 6/30/22, due 7/1/22, 1.55% total to be received $19,710,306 (collateralized by various U.S. Government Sponsored Agency and U.S. Treasury Obligations, 0.00% - 6.88%, 8/16/22 - 5/20/52, totaling $20,103,646) | 19,709,457 | 19,709,457 |
Total Repurchase Agreements
(Cost $65,918,434) | | 65,918,434 |
Total Short-Term
Investments - 5.9%
(Cost $84,677,434) | | 84,677,434 |
Total Investments - 103.9%
(Cost $1,518,358,900) | |
1,487,494,086 |
| Liabilities in Excess of Other Assets - (3.9)% | | (56,492,990) |
| Net Assets - 100.0% | | $1,431,001,096 |
The accompanying notes are an integral part of the financial statements.
| Meridian Funds | 33 | www.meridianfund.com |
Meridian Growth Fund
Schedule of Investments (continued)
June 30, 2022
| Plc—Public Limited Company |
| SpA—Società per Azioni |
| 1 | Non-income producing securities. |
| 2 | All or portion of this security is on loan at June 30, 2022. Total value of such securities at year-end amounts to
$145,238,727 and represents 10.15% of net assets. |
| 3 | Restricted security; cannot be offered for public resale without first being registered under the Securities Act of 1933 and related rules and agreements. Acquisition date represents the date on which an enforceable right to acquire such security is obtained and is presented along with related cost in the security description. The Fund has registration rights for certain restricted securities. Any costs related to such registration are borne by the issuer. The aggregate value of restricted securities at year-end amounts to $48,890,082 and represents 3.42% of net assets. |
| 4 | Security is valued using significant unobservable inputs in good faith in accordance with procedures approved by the Board of Directors. See Note 1 in Notes to financial statements. |
| 5 | Quail Investment Holdings, LLC is a limited liability company that was organized to invest solely in Qumulo, Inc Series E Preferred Stock. The value of Qumulo, Inc. is substantially the same as Quail Investment Holdings, LLC. |
| 6 | Collateral received from brokers for securities lending was invested in short-term investments. |
The accompanying notes are an integral part of the financial statements.
| Meridian Funds | 34 | www.meridianfund.com |
Meridian Contrarian Fund
Schedule of Investments
June 30, 2022
| | Shares | Value |
| Common Stocks - 89.9% |
| Communication Services - 1.4% |
| Interactive Media & Services - 1.4% |
| Cars.com, Inc.1 | 825,000 | $ 7,779,750 |
| Total Communication Services | | 7,779,750 |
| Consumer Discretionary - 6.3% |
| Auto Components - 1.0% |
| Aptiv Plc1 | 62,000 | 5,522,340 |
| Diversified Consumer Services - 1.0% |
| Frontdoor, Inc.1 | 231,000 | 5,562,480 |
| Hotels, Restaurants & Leisure - 1.7% |
| Bowlero Corp.1,2 | 670,803 | 7,103,804 |
| PlayAGS, Inc.1 | 503,622 | 2,598,689 |
| | | 9,702,493 |
| Household Durables - 1.0% |
| Newell Brands, Inc. | 300,000 | 5,712,000 |
| Internet & Direct Marketing Retail - 0.6% |
| RumbleON, Inc. Class B1,2 | 250,000 | 3,677,500 |
| Textiles, Apparel & Luxury Goods - 1.0% |
| Skechers U.S.A., Inc. Class A1 | 160,000 | 5,692,800 |
| Total Consumer Discretionary | | 35,869,613 |
| Consumer Staples - 3.4% |
| Beverages - 3.4% |
| Molson Coors Beverage Co. Class B | 253,000 | 13,791,030 |
| Vintage Wine Estates, Inc.1,2 | 760,000 | 5,973,600 |
| Total Consumer Staples | | 19,764,630 |
| Energy - 4.4% |
| Oil, Gas & Consumable Fuels - 4.4% |
| APA Corp. | 245,000 | 8,550,500 |
| California Resources Corp. | 130,000 | 5,005,000 |
| Cameco Corp. (Canada) | 281,000 | 5,906,620 |
| Coterra Energy, Inc. | 232,000 | 5,983,280 |
| Total Energy | | 25,445,400 |
| Financials - 12.1% |
| Banks - 6.5% |
| Comerica, Inc. | 138,000 | 10,126,440 |
| First Citizens BancShares, Inc. Class A | 23,700 | 15,494,586 |
| First Interstate BancSystem, Inc. Class A | 305,000 | 11,623,550 |
| | | 37,244,576 |
| Insurance - 5.6% |
American International Group,
Inc. | 206,000 | 10,532,780 |
| | Shares | Value |
| Axis Capital Holdings Ltd. | 379,000 | $ 21,637,110 |
| | | 32,169,890 |
| Total Financials | | 69,414,466 |
| Health Care - 13.3% |
| Biotechnology - 3.6% |
| Albireo Pharma, Inc.1 | 120,750 | 2,398,095 |
| Heron Therapeutics, Inc.1 | 1,025,000 | 2,859,750 |
| Legend Biotech Corp. ADR1,2 | 162,821 | 8,955,155 |
| ORIC Pharmaceuticals, Inc.1 | 760,000 | 3,404,800 |
| SpringWorks Therapeutics, Inc.1,2 | 110,000 | 2,708,200 |
| | | 20,326,000 |
| Health Care Equipment & Supplies - 1.1% |
| Paragon 28, Inc.1,2 | 217,000 | 3,443,790 |
| Sight Sciences, Inc.1 | 341,000 | 3,065,590 |
| | | 6,509,380 |
| Health Care Providers & Services - 3.9% |
| Acadia Healthcare Co., Inc.1 | 295,000 | 19,950,850 |
| Aveanna Healthcare Holdings, Inc.1 | 1,031,000 | 2,330,060 |
| | | 22,280,910 |
| Health Care Technology - 2.8% |
| Change Healthcare, Inc.1 | 695,000 | 16,026,700 |
| Pharmaceuticals - 1.9% |
| Perrigo Co. Plc | 218,000 | 8,844,260 |
| RVL Pharmaceuticals Plc1 | 1,623,000 | 2,207,280 |
| | | 11,051,540 |
| Total Health Care | | 76,194,530 |
| Industrials - 15.6% |
| Commercial Services & Supplies - 2.6% |
| ACV Auctions, Inc. Class A1 | 251,000 | 1,641,540 |
| Driven Brands Holdings, Inc.1 | 486,500 | 13,398,210 |
| | | 15,039,750 |
| Construction & Engineering - 0.7% |
| API Group Corp.1 | 254,000 | 3,802,380 |
| Electrical Equipment - 0.5% |
| American Superconductor Corp.1 | 545,000 | 2,823,100 |
| Machinery - 2.9% |
| CNH Industrial, N.V. (United Kingdom) | 439,006 | 5,088,080 |
| Evoqua Water Technologies Corp.1 | 183,000 | 5,949,330 |
| Toro Co. (The) | 75,000 | 5,684,250 |
| | | 16,721,660 |
The accompanying notes are an integral part of the financial statements.
| Meridian Funds | 35 | www.meridianfund.com |
Meridian Contrarian Fund
Schedule of Investments (continued)
June 30, 2022
| | Shares | Value |
| Marine - 1.0% |
| Matson, Inc. | 81,000 | $ 5,903,280 |
| Professional Services - 3.4% |
| CACI International, Inc. Class A1 | 70,000 | 19,724,600 |
| Road & Rail - 1.9% |
| AMERCO | 23,000 | 10,999,290 |
| Trading Companies & Distributors - 2.6% |
| Custom Truck One Source, Inc.1,2 | 1,172,000 | 6,563,200 |
| Univar Solutions, Inc.1 | 327,000 | 8,132,490 |
| | | 14,695,690 |
| Total Industrials | | 89,709,750 |
| Information Technology - 16.5% |
| Communications Equipment - 2.1% |
| Juniper Networks, Inc. | 431,000 | 12,283,500 |
| Electronic Equipment, Instruments & Components - 1.2% |
| Trimble, Inc.1 | 123,156 | 7,171,374 |
| Semiconductors & Semiconductor Equipment - 12.5% |
| Advanced Micro Devices, Inc.1 | 107,000 | 8,182,290 |
| Ambarella, Inc.1 | 80,000 | 5,236,800 |
| GLOBALFOUNDRIES, Inc.1,2 | 178,000 | 7,180,520 |
| Micron Technology, Inc. | 182,000 | 10,060,960 |
| NVIDIA Corp. | 16,000 | 2,425,440 |
| ON Semiconductor Corp.1,2 | 124,000 | 6,238,440 |
| PDF Solutions, Inc.1 | 171,000 | 3,678,210 |
| Photronics, Inc.1 | 716,000 | 13,947,680 |
| SMART Global Holdings, Inc.1 | 897,000 | 14,683,890 |
| | | 71,634,230 |
| Software - 0.7% |
| Cerence, Inc.1 | 48,250 | 1,217,347 |
| Clear Secure, Inc. Class A1,2 | 41,200 | 824,000 |
| Sumo Logic, Inc.1 | 233,396 | 1,748,136 |
| | | 3,789,483 |
| Total Information Technology | | 94,878,587 |
| Materials - 1.5% |
| Chemicals - 1.5% |
| Olin Corp. | 183,000 | 8,469,240 |
| Total Materials | | 8,469,240 |
| Real Estate - 10.0% |
| Equity Real Estate Investment Trusts (REITS) - 7.8% |
| Alexander & Baldwin, Inc. | 724,000 | 12,995,800 |
| Farmland Partners, Inc. | 325,000 | 4,485,000 |
| NETSTREIT Corp.2 | 541,000 | 10,208,670 |
| VICI Properties, Inc.2 | 575,000 | 17,129,250 |
| | | 44,818,720 |
| | Shares | Value |
| Real Estate Management & Development - 2.2% |
| DigitalBridge Group, Inc.1 | 2,607,000 | $ 12,722,160 |
| Total Real Estate | | 57,540,880 |
| Utilities - 5.4% |
| Electric Utilities - 3.7% |
| ALLETE, Inc. | 184,000 | 10,815,520 |
| Avangrid, Inc.2 | 227,000 | 10,469,240 |
| | | 21,284,760 |
| Independent Power & Renewable Electricity Producers - 1.7% |
| Brookfield Renewable Corp. Class A | 268,800 | 9,571,968 |
| Total Utilities | | 30,856,728 |
Total Common Stocks - 89.9%
(Cost $448,422,147) | | 515,923,574 |
| Warrants - 0.0% |
| Information Technology - 0.0% |
| Software - 0.0% |
| KLDiscovery, Inc., Strike Price $11.50, Expires 12/19/241 | 450,000 | 77,400 |
| Total Information Technology | | 77,400 |
Total Warrants - 0.0%
(Cost $250,695) | | 77,400 |
| Preferred Stocks - 0.3% |
| Information Technology - 0.3% |
| Software - 0.3% |
Casters Holdings, Inc. dba Fyllo Compliance Cloud Series C
Acquisition Date: 10/25/21,
Cost $3,000,0001,3,4 | 2,821,405 | 2,003,198 |
| Total Information Technology | | 2,003,198 |
Total Preferred Stocks - 0.3%
(Cost $3,000,000) | | 2,003,198 |
| | Shares/
Principal
Amount | |
| Short-Term Investments - 3.8%5 |
| Money Market Funds - 0.8% |
| BlackRock Liquidity Funds, FedFund, Institutional Class, 1.32% | 394,000 | 394,000 |
| Dreyfus Institutional Preferred Government Plus Money Market Fund, Institutional Class, 1.46% | 1,668,000 | 1,668,000 |
The accompanying notes are an integral part of the financial statements.
| Meridian Funds | 36 | www.meridianfund.com |
Meridian Contrarian Fund
Schedule of Investments (continued)
June 30, 2022
| | Shares/
Principal
Amount | Value |
| Goldman Sachs Financial Square Government Fund, Institutional Class, 1.36% | 394,000 | $ 394,000 |
| Invesco Short Term Investments, Government & Agency Portfolio, Institutional Class, 1.39% | 394,000 | 394,000 |
| Morgan Stanley Institutional Liquidity Funds, Government Portfolio, Institutional Class, 1.38% | 1,618,000 | 1,618,000 |
Total Money Market Funds
(Cost $4,468,000) | | 4,468,000 |
| Repurchase Agreements - 3.0% |
| Bank of America Securities, Inc., dated 6/30/22, due 7/1/22, 1.55% total to be received $5,082,031 (collateralized by various U.S. Government Sponsored Agency, 1.00% - 8.50%, 1/20/24 - 6/20/52, totaling $5,183,448) | $ 5,081,812 | 5,081,812 |
| Daiwa Capital Markets America, Inc., dated 6/30/22, due 7/1/22, 1.55% total to be received $5,082,031 (collateralized by various U.S. Government Sponsored Agency and U.S. Treasury Obligations, 0.00% - 6.50%, 7/31/22 - 7/1/52, totaling $5,183,448) | 5,081,812 | 5,081,812 |
| | Shares/
Principal
Amount | Value |
| Nomura Securities International, Inc., dated 6/30/22, due 7/1/22, 1.54% total to be received $2,119,265 (collateralized by various U.S. Government Sponsored Agency, 1.50% - 6.50%, 7/1/27 - 6/1/52, totaling $2,161,558) | $ 2,119,174 | $ 2,119,174 |
| RBC Dominion Securities, Inc., dated 6/30/22, due 7/1/22, 1.55% total to be received $5,082,031 (collateralized by various U.S. Government Sponsored Agency and U.S. Treasury Obligations, 0.00% - 6.88%, 8/16/22 - 5/20/52, totaling $5,183,448) | 5,081,812 | 5,081,812 |
Total Repurchase Agreements
(Cost $17,364,610) | | 17,364,610 |
Total Short-Term
Investments - 3.8%
(Cost $21,832,610) | | 21,832,610 |
Total Investments - 94.0%
(Cost $473,505,452) | |
539,836,782 |
| Cash and Other Assets, Less Liabilities - 6.0% | | 34,265,378 |
| Net Assets - 100.0% | | $574,102,160 |
The accompanying notes are an integral part of the financial statements.
| Meridian Funds | 37 | www.meridianfund.com |
Meridian Contrarian Fund
Schedule of Investments (continued)
June 30, 2022
| ADR—American Depositary Receipt |
| N.V.—Naamloze Vennootschap is the Dutch term for limited liability company |
| Plc—Public Limited Company |
| 1 | Non-income producing securities. |
| 2 | All or portion of this security is on loan at June 30, 2022. Total value of such securities at year-end amounts to
$70,980,100 and represents 12.36% of net assets. |
| 3 | Restricted security; cannot be offered for public resale without first being registered under the Securities Act of 1933 and related rules and agreements. Acquisition date represents the date on which an enforceable right to acquire such security is obtained and is presented along with related cost in the security description. The Fund has registration rights for certain restricted securities. Any costs related to such registration are borne by the issuer. The aggregate value of restricted securities at year-end amounts to $2,003,198 and represents 0.35% of net assets. |
| 4 | Security is valued using significant unobservable inputs in good faith in accordance with procedures approved by the Board of Directors. See Note 1 in Notes to financial statements. |
| 5 | Collateral received from brokers for securities lending was invested in short-term investments. |
The accompanying notes are an integral part of the financial statements.
| Meridian Funds | 38 | www.meridianfund.com |
Meridian Enhanced Equity Fund
Schedule of Investments
June 30, 2022
| | Shares | Value |
| Common Stocks - 122.4% |
| Communication Services - 10.4% |
| Diversified Telecommunication Services - 0.6% |
| Liberty Global Plc Class A (United Kingdom)1 | 100 | $ 2,105 |
| Verizon Communications, Inc. | 5,657 | 287,093 |
| | | 289,198 |
| Entertainment - 2.3% |
| Madison Square Garden Entertainment Corp.1,2 | 7,855 | 413,330 |
| Walt Disney Co. (The)1 | 8,158 | 770,115 |
| | | 1,183,445 |
| Interactive Media & Services - 2.0% |
| IAC/InterActiveCorp. 1 | 3,525 | 267,794 |
| Pinterest, Inc. Class A1,3 | 40,000 | 726,400 |
| | | 994,194 |
| Media - 5.5% |
| Boston Omaha Corp. Class A1 | 9,070 | 187,296 |
| Liberty Broadband Corp. Class C1 | 7,553 | 873,429 |
| Liberty Media Corp.-Liberty SiriusXM Class A1,2 | 12,951 | 466,754 |
| Liberty Media Corp.-Liberty SiriusXM Class C1 | 799 | 28,804 |
| Paramount Global Class B3 | 49,400 | 1,219,192 |
| | | 2,775,475 |
| Total Communication Services | | 5,242,312 |
| Consumer Discretionary - 13.4% |
| Automobiles - 0.1% |
| Rivian Automotive, Inc. Class A1 | 2,709 | 69,729 |
| Internet & Direct Marketing Retail - 1.5% |
| Amazon.com, Inc.1 | 7,100 | 754,091 |
| Multiline Retail - 0.7% |
| Target Corp. | 2,538 | 358,442 |
| Specialty Retail - 6.0% |
| Advance Auto Parts, Inc. | 1,640 | 283,868 |
| Home Depot, Inc. (The) | 1,148 | 314,862 |
| Lowe's Cos., Inc. | 2,433 | 424,972 |
| Sally Beauty Holdings, Inc.1,3 | 170,000 | 2,026,400 |
| | | 3,050,102 |
| Textiles, Apparel & Luxury Goods - 5.1% |
| Hanesbrands, Inc.3 | 66,000 | 679,140 |
| Levi Strauss & Co. Class A3 | 89,000 | 1,452,480 |
| NIKE, Inc. Class B | 4,197 | 428,933 |
| | | 2,560,553 |
| Total Consumer Discretionary | | 6,792,917 |
| | Shares | Value |
| Consumer Staples - 21.8% |
| Food & Staples Retailing - 0.8% |
| Costco Wholesale Corp. | 868 | $ 416,015 |
| Food Products - 12.9% |
| Dole Plc3 | 184,200 | 1,558,332 |
| Lamb Weston Holdings, Inc.3 | 58,500 | 4,180,410 |
| TreeHouse Foods, Inc.1,3 | 19,400 | 811,308 |
| | | 6,550,050 |
| Household Products - 3.2% |
| Spectrum Brands Holdings, Inc.3 | 19,500 | 1,599,390 |
| Personal Products - 4.9% |
| Coty, Inc. Class A1,3 | 308,000 | 2,467,080 |
| Total Consumer Staples | | 11,032,535 |
| Financials - 11.9% |
| Banks - 9.6% |
| Citigroup, Inc.3 | 24,200 | 1,112,958 |
| JPMorgan Chase & Co. | 4,000 | 450,440 |
| U.S. Bancorp | 17,777 | 818,098 |
| Wells Fargo & Co.3 | 63,200 | 2,475,544 |
| | | 4,857,040 |
| Capital Markets - 2.3% |
| Intercontinental Exchange, Inc. | 6,664 | 626,683 |
| S&P Global, Inc. | 690 | 232,571 |
| Tishman Speyer Innovation Corp. II Class A1 | 30,000 | 293,700 |
| | | 1,152,954 |
| Total Financials | | 6,009,994 |
| Health Care - 3.0% |
| Health Care Equipment & Supplies - 2.4% |
| Alcon, Inc. (Switzerland)3 | 17,500 | 1,223,075 |
| Pharmaceuticals - 0.6% |
| Johnson & Johnson | 1,775 | 315,080 |
| Total Health Care | | 1,538,155 |
| Industrials - 15.1% |
| Aerospace & Defense - 5.3% |
| Boeing Co. (The)1 | 3,900 | 533,208 |
| Maxar Technologies, Inc.3 | 78,400 | 2,045,456 |
| Rocket Lab U.S.A., Inc.1 | 21,593 | 81,838 |
| | | 2,660,502 |
| Commercial Services & Supplies - 0.3% |
| ACV Auctions, Inc. Class A1 | 23,389 | 152,964 |
| Construction & Engineering - 2.4% |
| WillScot Mobile Mini Holdings Corp.1,3 | 38,200 | 1,238,444 |
| Industrial Conglomerates - 0.7% |
| General Electric Co.3 | 5,751 | 366,166 |
The accompanying notes are an integral part of the financial statements.
| Meridian Funds | 39 | www.meridianfund.com |
Meridian Enhanced Equity Fund
Schedule of Investments (continued)
June 30, 2022
| | Shares | Value |
| Professional Services - 6.4% |
| Alight, Inc. Class A1 | 33,940 | $ 229,095 |
| CACI International, Inc. Class A1 | 1,143 | 322,074 |
| CoStar Group, Inc.1,3 | 39,600 | 2,392,236 |
| Dun & Bradstreet Holdings, Inc.1 | 18,097 | 271,998 |
| | | 3,215,403 |
| Total Industrials | | 7,633,479 |
| Information Technology - 39.8% |
| IT Services - 6.0% |
| PayPal Holdings, Inc.1,3 | 16,067 | 1,122,119 |
| Twilio, Inc. Class A1,3 | 9,700 | 812,957 |
| Visa, Inc. Class A | 5,462 | 1,075,413 |
| | | 3,010,489 |
| Semiconductors & Semiconductor Equipment - 10.7% |
| Allegro MicroSystems, Inc. (Japan)1 | 11,599 | 239,984 |
| Ambarella, Inc.1,3 | 4,600 | 301,116 |
| GLOBALFOUNDRIES, Inc.1,2 | 10,106 | 407,676 |
| NVIDIA Corp.3 | 2,353 | 356,691 |
| ON Semiconductor Corp.1,3 | 64,400 | 3,239,964 |
| QUALCOMM, Inc.3 | 6,800 | 868,632 |
| | | 5,414,063 |
| Software - 18.9% |
| Alkami Technology, Inc.1 | 17,923 | 248,950 |
| KnowBe4, Inc. Class A1,3 | 82,800 | 1,293,336 |
| Microsoft Corp. | 3,849 | 988,539 |
| Monday.com Ltd.1,3 | 9,900 | 1,021,284 |
| N-able, Inc.1 | 33,634 | 302,706 |
| Salesforce, Inc.1 | 3,229 | 532,914 |
| Splunk, Inc.1,3 | 11,800 | 1,043,828 |
| UiPath, Inc. Class A1,3 | 34,200 | 622,098 |
| Workday, Inc. Class A1,3 | 6,300 | 879,354 |
| Zoom Video Communications, Inc. Class A1,3 | 24,300 | 2,623,671 |
| | | 9,556,680 |
| Technology Hardware, Storage & Peripherals - 4.2% |
| Apple, Inc. | 6,155 | 841,512 |
| Hewlett Packard Enterprise Co.3 | 98,000 | 1,299,480 |
| | | 2,140,992 |
| Total Information Technology | | 20,122,224 |
| Materials - 1.3% |
| Chemicals - 1.3% |
| Huntsman Corp.3 | 23,000 | 652,050 |
| Total Materials | | 652,050 |
| Real Estate - 2.4% |
| Equity Real Estate Investment Trusts (REITS) - 2.4% |
| Alexandria Real Estate Equities, Inc. | 1,970 | 285,709 |
| American Tower Corp. | 1,721 | 439,870 |
| | Shares | Value |
| Equinix, Inc. | 772 | $ 507,220 |
| Total Real Estate | | 1,232,799 |
| Telecommunication Services - 1.4% |
| Wireless Telecommunication Services - 1.4% |
Starry, Inc.
Acquisition Date: 3/28/22,
Cost $1,250,0031,4 | 166,667 | 686,668 |
| Total Telecommunication Services | | 686,668 |
| Utilities - 1.9% |
| Independent Power & Renewable Electricity Producers - 1.9% |
| Vistra Corp. | 41,338 | 944,573 |
| Total Utilities | | 944,573 |
Total Common Stocks - 122.4%
(Cost $69,461,693) | | 61,887,706 |
| Warrants - 0.0% |
| Financials - 0.0% |
| Capital Markets - 0.0% |
| Executive Network Partnering Corp. Class A, Strike Price $11.50, Expires 9/25/281 | 4,325 | 3,956 |
| Tishman Speyer Innovation Corp. II Class A, Strike Price $11.50, Expires 12/31/271 | 6,000 | 786 |
| Total Financials | | 4,742 |
Total Warrants - 0.0%
(Cost $8,659) | | 4,742 |
| | Shares/
Principal
Amount | |
| Short-Term Investments - 0.9%5 |
| Repurchase Agreements - 0.9% |
| Daiwa Capital Markets America, Inc., dated 6/30/22, due 7/1/22, 1.55% total to be received $195,220 (collateralized by various U.S. Government Sponsored Agency and U.S. Treasury Obligations, 0.00% - 6.50%, 7/31/22 - 7/1/52, totaling $199,116) | $ 195,212 | 195,212 |
The accompanying notes are an integral part of the financial statements.
| Meridian Funds | 40 | www.meridianfund.com |
Meridian Enhanced Equity Fund
Schedule of Investments (continued)
June 30, 2022
| | Shares/
Principal
Amount | Value |
| RBC Dominion Securities, Inc., dated 6/30/22, due 7/1/22, 1.55% total to be received $250,011 (collateralized by various U.S. Government Sponsored Agency and U.S. Treasury Obligations, 0.00% - 6.88%, 8/16/22 - 5/20/52, totaling $255,000) | $ 250,000 | $ 250,000 |
Total Repurchase Agreements
(Cost $445,212) | | 445,212 |
Total Short-Term
Investments - 0.9%
(Cost $445,212) | | 445,212 |
Total Investments - 123.3%
(Cost $69,915,564) | |
62,337,660 |
| Liabilities in Excess of Other Assets - (23.3)% | | (11,767,833) |
| Net Assets - 100.0% | | $50,569,827 |
| | | Value |
| Call Options Written - (23.1)% |
Total Call Options Written - (23.1)%
(Premium received $(17,519,635)) | | $(11,684,701) |
| Plc—Public Limited Company |
| 1 | Non-income producing securities. |
| 2 | All or portion of this security is on loan at June 30, 2022. Total value of such securities at year-end amounts to
$1,210,093 and represents 2.39% of net assets. |
| 3 | Securities, or a portion thereof, were pledged as collateral for written options by the fund. |
| 4 | Restricted security; cannot be offered for public resale without first being registered under the Securities Act of 1933 and related rules and agreements. Acquisition date represents the date on which an enforceable right to acquire such security is obtained and is presented along with related cost in the security description. The Fund has registration rights for certain restricted securities. Any costs related to such registration are borne by the issuer. The aggregate value of restricted securities at year-end amounts to $686,668 and represents 1.36% of net assets. |
| 5 | Collateral received from brokers for securities lending was invested in short-term investments. |
The accompanying notes are an integral part of the financial statements.
| Meridian Funds | 41 | www.meridianfund.com |
Meridian Enhanced Equity Fund
Schedule of Investments (continued)
June 30, 2022
| Exchange-Traded Options Written |
| Description | | Strike Price | | Expiration Date | | Number of
Contracts | | Notional
Amount | | Premium
Received | | Value |
| Call | | | | | | | | | | | | |
| Spectrum Brands Holdings, Inc. | | 85.00 | | 7/15/22 | | 195 | | $ 1,599,390 | | $ (336,431) | | $ (28,275) |
| WillScot Mobile Mini Holdings Corp. | | 30.00 | | 7/15/22 | | 382 | | 1,238,444 | | (223,285) | | (171,900) |
| Alcon, Inc. (Switzerland) | | 70.00 | | 8/19/22 | | 97 | | 677,933 | | (100,742) | | (33,950) |
| PayPal Holdings, Inc. | | 85.00 | | 9/16/22 | | 144 | | 1,005,696 | | (626,263) | | (43,344) |
| CoStar Group, Inc. | | 45.00 | | 10/21/22 | | 198 | | 1,196,118 | | (325,256) | | (338,580) |
| CoStar Group, Inc. | | 50.00 | | 10/21/22 | | 198 | | 1,196,118 | | (224,303) | | (251,460) |
| Alcon, Inc. (Switzerland) | | 60.00 | | 11/18/22 | | 78 | | 545,142 | | (81,438) | | (111,540) |
| NVIDIA Corp. | | 125.00 | | 11/18/22 | | 8 | | 121,272 | | (46,633) | | (32,320) |
| Dole Plc | | 12.50 | | 12/16/22 | | 411 | | 347,706 | | (114,418) | | (6,165) |
| Dole Plc | | 10.00 | | 12/16/22 | | 1,431 | | 1,210,626 | | (588,605) | | (93,015) |
| KnowBe4, Inc. Class A | | 17.50 | | 12/16/22 | | 828 | | 1,293,336 | | (684,693) | | (223,560) |
| Monday.com Ltd. | | 90.00 | | 12/16/22 | | 99 | | 1,021,284 | | (609,402) | | (322,740) |
| NVIDIA Corp. | | 110.00 | | 12/16/22 | | 8 | | 121,272 | | (56,793) | | (40,640) |
| TreeHouse Foods, Inc. | | 30.00 | | 12/16/22 | | 194 | | 811,308 | | (180,309) | | (279,360) |
| Ambarella, Inc. | | 130.00 | | 1/20/23 | | 46 | | 301,116 | | (334,143) | | (8,050) |
| Coty, Inc. Class A | | 7.00 | | 1/20/23 | | 3,080 | | 2,467,080 | | (1,383,614) | | (579,040) |
| General Electric Co. | | 7.00 | | 1/20/23 | | 415 | | 2,642,305 | | (221,017) | | (72,210) |
| Hanesbrands, Inc. | | 13.00 | | 1/20/23 | | 660 | | 679,140 | | (310,038) | | (33,000) |
| Huntsman Corp. | | 27.00 | | 1/20/23 | | 230 | | 652,050 | | (170,964) | | (94,300) |
| ON Semiconductor Corp. | | 32.00 | | 1/20/23 | | 644 | | 3,239,964 | | (937,436) | | (1,352,400) |
| Paramount Global Class B | | 37.00 | | 1/20/23 | | 494 | | 1,219,192 | | (848,467) | | (33,098) |
| Pinterest, Inc. Class A | | 10.00 | | 1/20/23 | | 200 | | 363,200 | | (173,896) | | (182,400) |
| QUALCOMM, Inc. | | 160.00 | | 1/20/23 | | 68 | | 868,632 | | (290,952) | | (39,440) |
| Wells Fargo & Co. | | 42.50 | | 1/20/23 | | 246 | | 963,582 | | (223,606) | | (68,634) |
| Wells Fargo & Co. | | 27.50 | | 1/20/23 | | 386 | | 1,511,962 | | (328,404) | | (465,130) |
| Citigroup, Inc. | | 40.00 | | 6/16/23 | | 242 | | 1,112,958 | | (301,331) | | (223,850) |
| Workday, Inc. Class A | | 120.00 | | 6/16/23 | | 63 | | 879,354 | | (330,178) | | (244,755) |
| Hewlett Packard Enterprise Co. | | 15.00 | | 1/19/24 | | 980 | | 1,299,480 | | (381,441) | | (161,700) |
| Lamb Weston Holdings, Inc. | | 45.00 | | 1/19/24 | | 585 | | 4,180,410 | | (994,441) | | (1,901,250) |
| Levi Strauss & Co. Class A | | 20.00 | | 1/19/24 | | 890 | | 1,452,480 | | (612,832) | | (226,950) |
| Maxar Technologies, Inc. | | 17.50 | | 1/19/24 | | 784 | | 2,045,456 | | (974,505) | | (1,003,520) |
| Pinterest, Inc. Class A | | 10.00 | | 1/19/24 | | 200 | | 363,200 | | (190,320) | | (205,000) |
| Sally Beauty Holdings, Inc. | | 12.50 | | 1/19/24 | | 1,700 | | 2,026,400 | | (1,342,714) | | (748,000) |
| Splunk, Inc. | | 90.00 | | 1/19/24 | | 118 | | 1,043,828 | | (440,686) | | (280,250) |
| Twilio, Inc. Class A | | 70.00 | | 1/19/24 | | 97 | | 812,957 | | (485,616) | | (338,530) |
| UiPath, Inc. Class A | | 25.00 | | 1/19/24 | | 342 | | 622,098 | | (790,801) | | (140,220) |
| Zoom Video Communications, Inc. Class A | | 70.00 | | 1/19/24 | | 243 | | 2,623,671 | | (1,253,662) | | (1,306,125) |
| | | | | | | | | Total | | $(17,519,635) | | $(11,684,701) |
The accompanying notes are an integral part of the financial statements.
| Meridian Funds | 42 | www.meridianfund.com |
Meridian Small Cap Growth Fund
Schedule of Investments
June 30, 2022
| | Shares | Value |
| Common Stocks - 88.0% |
| Communication Services - 2.0% |
| Entertainment - 0.7% |
| Reservoir Media, Inc.1,2 | 880,691 | $ 5,742,105 |
| Interactive Media & Services - 1.3% |
| Actua Corp.1 | 1,232,871 | 12,329 |
| ZipRecruiter, Inc. Class A1 | 692,154 | 10,257,722 |
| | | 10,270,051 |
| Total Communication Services | | 16,012,156 |
| Consumer Discretionary - 15.6% |
| Auto Components - 1.0% |
| Stoneridge, Inc.1 | 493,760 | 8,467,984 |
| Diversified Consumer Services - 5.0% |
| 2U, Inc.1,2 | 475,525 | 4,978,747 |
| Frontdoor, Inc.1 | 1,040,531 | 25,055,986 |
| Grand Canyon Education, Inc.1 | 112,938 | 10,637,630 |
| | | 40,672,363 |
| Hotels, Restaurants & Leisure - 0.9% |
| PlayAGS, Inc.1 | 1,498,904 | 7,734,345 |
| Internet & Direct Marketing Retail - 0.5% |
| Shutterstock, Inc. | 71,975 | 4,124,887 |
| Leisure Products - 0.9% |
| Clarus Corp.2 | 186,156 | 3,535,102 |
| Malibu Boats, Inc. Class A1 | 74,088 | 3,905,179 |
| | | 7,440,281 |
| Specialty Retail - 2.1% |
| Sally Beauty Holdings, Inc.1 | 1,408,835 | 16,793,313 |
| Textiles, Apparel & Luxury Goods - 5.2% |
| Canada Goose Holdings, Inc. (Canada)1 | 246,573 | 4,440,780 |
| Carter's, Inc. | 115,394 | 8,132,969 |
| Hanesbrands, Inc. | 558,914 | 5,751,225 |
| Skechers U.S.A., Inc. Class A1 | 665,029 | 23,661,732 |
| | | 41,986,706 |
| Total Consumer Discretionary | | 127,219,879 |
| Consumer Staples - 1.1% |
| Tobacco - 1.1% |
| Turning Point Brands, Inc. | 315,631 | 8,563,069 |
| Total Consumer Staples | | 8,563,069 |
| Energy - 0.2% |
| Energy Equipment & Services - 0.2% |
| NCS Multistage Holdings, Inc.1 | 45,835 | 1,402,551 |
| Total Energy | | 1,402,551 |
| Financials - 1.9% |
| Capital Markets - 1.9% |
| FinServ Acquisition Corp.1 | 816,667 | 8,019,670 |
| | Shares | Value |
FinServ Acquisition Corp.
Founder Shares
Acquisition Date: 2/22/21, Cost $01,3,4 | 83,333 | $ 409,165 |
FinServ Acquisition Corp.
Private Placement Units Acquisition Date: 2/12/21, Cost $208,3301,3,4 | 20,833 | 102,290 |
| WisdomTree Investments, Inc. | 1,441,178 | 7,306,772 |
| Total Financials | | 15,837,897 |
| Health Care - 23.2% |
| Biotechnology - 7.4% |
| 4D Molecular Therapeutics, Inc.1 | 507,039 | 3,539,132 |
| Albireo Pharma, Inc.1,2 | 202,036 | 4,012,435 |
| C4 Therapeutics, Inc.1 | 592,552 | 4,467,842 |
| CareDx, Inc.1 | 318,563 | 6,842,733 |
Centrexion Therapeutics Corp. (Dividend Shares)
Acquisition Date: 3/14/19,
Cost $01,3,4 | 17,318 | 1,039 |
| Erasca, Inc.1,2 | 227,749 | 1,268,562 |
| Heron Therapeutics, Inc.1 | 608,728 | 1,698,351 |
| Inhibrx, Inc.1 | 311,730 | 3,538,136 |
| Instil Bio, Inc.1,2 | 1,056,053 | 4,878,965 |
| Kiniksa Pharmaceuticals Ltd. Class A1,2 | 548,223 | 5,312,281 |
| PMV Pharmaceuticals, Inc.1,2 | 344,731 | 4,912,417 |
| Relay Therapeutics, Inc.1,2 | 288,601 | 4,834,067 |
| SpringWorks Therapeutics, Inc.1,2 | 286,852 | 7,062,296 |
| Veracyte, Inc.1 | 388,815 | 7,737,418 |
| | | 60,105,674 |
| Health Care Equipment & Supplies - 9.6% |
| Artivion, Inc.1,2 | 230,789 | 4,357,296 |
| Axogen, Inc.1 | 552,170 | 4,522,272 |
| Cardiovascular Systems, Inc.1 | 385,336 | 5,533,425 |
| Merit Medical Systems, Inc.1 | 261,439 | 14,188,295 |
| Nevro Corp. 1 | 125,941 | 5,519,994 |
| Omnicell, Inc.1 | 59,880 | 6,811,350 |
| Paragon 28, Inc.1,2 | 379,248 | 6,018,666 |
| QuidelOrtho Corp.1 | 178,518 | 17,348,379 |
| Sight Sciences, Inc.1,2 | 717,998 | 6,454,802 |
| Silk Road Medical, Inc.1,2 | 149,650 | 5,445,764 |
| Sonendo, Inc.1,2 | 897,410 | 1,543,545 |
| Talis Biomedical Corp.1 | 230,078 | 186,823 |
| | | 77,930,611 |
| Health Care Providers & Services - 2.0% |
| HealthEquity, Inc.1 | 189,599 | 11,639,483 |
| MEDNAX, Inc.1 | 242,250 | 5,089,672 |
| | | 16,729,155 |
The accompanying notes are an integral part of the financial statements.
| Meridian Funds | 43 | www.meridianfund.com |
Meridian Small Cap Growth Fund
Schedule of Investments (continued)
June 30, 2022
| | Shares | Value |
| Health Care Technology - 1.0% |
| Certara, Inc.1 | 389,429 | $ 8,357,147 |
| Life Sciences Tools & Services - 2.1% |
| MaxCyte, Inc.1 | 1,124,866 | 5,320,616 |
| Medpace Holdings, Inc.1 | 25,263 | 3,781,113 |
| Syneos Health, Inc.1 | 107,083 | 7,675,710 |
| | | 16,777,439 |
| Pharmaceuticals - 1.1% |
| Arvinas, Inc.1,2 | 110,339 | 4,644,169 |
| DICE Therapeutics, Inc.1,2 | 284,997 | 4,423,153 |
| | | 9,067,322 |
| Total Health Care | | 188,967,348 |
| Industrials - 28.1% |
| Aerospace & Defense - 1.1% |
| Byrna Technologies, Inc.1,2 | 770,301 | 6,616,885 |
| Rocket Lab U.S.A., Inc.1,2 | 727,106 | 2,755,732 |
| | | 9,372,617 |
| Air Freight & Logistics - 1.7% |
| Forward Air Corp. | 147,072 | 13,524,741 |
| Commercial Services & Supplies - 10.7% |
| ACV Auctions, Inc. Class A1 | 1,453,179 | 9,503,791 |
| Cimpress Plc (Ireland)1 | 126,176 | 4,908,246 |
| Clean Harbors, Inc.1 | 91,847 | 8,052,227 |
| Heritage-Crystal Clean, Inc.1 | 1,042,474 | 28,105,099 |
| Ritchie Bros. Auctioneers, Inc. (Canada) | 408,181 | 26,556,256 |
| SP Plus Corp.1 | 325,064 | 9,985,966 |
| | | 87,111,585 |
| Machinery - 2.8% |
| John Bean Technologies Corp. | 62,578 | 6,909,863 |
| Kadant, Inc. | 27,451 | 5,005,690 |
| Tennant Co. | 182,259 | 10,798,846 |
| | | 22,714,399 |
| Marine - 2.9% |
| Kirby Corp.1 | 148,309 | 9,023,120 |
| Matson, Inc. | 199,838 | 14,564,193 |
| | | 23,587,313 |
| Professional Services - 6.7% |
| Alight, Inc. Class A1 | 1,601,701 | 10,811,482 |
| First Advantage Corp.1 | 596,561 | 7,558,428 |
| Forrester Research, Inc.1 | 202,200 | 9,673,248 |
| Legalzoom.com, Inc.1,2 | 404,425 | 4,444,631 |
| TriNet Group, Inc.1 | 148,149 | 11,499,325 |
| TrueBlue, Inc.1 | 616,269 | 11,031,215 |
| | | 55,018,329 |
| Road & Rail - 0.7% |
| Heartland Express, Inc. | 390,776 | 5,435,694 |
| | Shares | Value |
| Trading Companies & Distributors - 1.5% |
| Hudson Technologies, Inc.1 | 1,622,308 | $ 12,183,533 |
| Total Industrials | | 228,948,211 |
| Information Technology - 13.8% |
| Electronic Equipment, Instruments & Components - 1.2% |
| CTS Corp. | 137,396 | 4,678,334 |
| Mirion Technologies, Inc.1,2 | 924,542 | 5,325,362 |
| | | 10,003,696 |
| IT Services - 0.9% |
| International Money Express, Inc.1 | 342,043 | 7,001,620 |
| Semiconductors & Semiconductor Equipment - 0.7% |
| Allegro MicroSystems, Inc. (Japan)1 | 279,043 | 5,773,400 |
| Software - 11.0% |
| 8x8, Inc.1 | 912,521 | 4,699,483 |
| Alkami Technology, Inc.1,2 | 732,699 | 10,177,189 |
| Asure Software, Inc.1 | 812,486 | 4,631,170 |
| ChannelAdvisor Corp.1 | 510,158 | 7,438,104 |
| Consensus Cloud Solutions, Inc.1 | 112,065 | 4,894,999 |
| ForgeRock, Inc. Class A1,2 | 278,356 | 5,962,385 |
| KnowBe4, Inc. Class A1 | 353,620 | 5,523,544 |
| Model N, Inc.1,2 | 182,324 | 4,663,848 |
| Momentive Global, Inc.1 | 1,162,891 | 10,233,441 |
| Monday.com Ltd.1,2 | 112,226 | 11,577,234 |
| Ping Identity Holding Corp.1 | 310,568 | 5,633,704 |
| Sumo Logic, Inc.1 | 431,917 | 3,235,058 |
| Upland Software, Inc.1 | 344,144 | 4,996,971 |
| Vertex, Inc. Class A1 | 491,187 | 5,565,149 |
| | | 89,232,279 |
| Total Information Technology | | 112,010,995 |
| Materials - 1.0% |
| Containers & Packaging - 1.0% |
| Ranpak Holdings Corp.1 | 1,186,303 | 8,304,121 |
| Total Materials | | 8,304,121 |
| Telecommunication Services - 0.6% |
| Wireless Telecommunication Services - 0.6% |
Starry, Inc.
Acquisition Date: 3/28/22,
Cost $2,400,0001,3 | 320,000 | 1,318,400 |
Starry, Inc.
Acquisition Date: 5/14/18 - 3/6/19,
Cost $5,444,9951,3 | 969,013 | 3,393,484 |
| Total Telecommunication Services | | 4,711,884 |
The accompanying notes are an integral part of the financial statements.
| Meridian Funds | 44 | www.meridianfund.com |
Meridian Small Cap Growth Fund
Schedule of Investments (continued)
June 30, 2022
| | Shares | Value |
| Utilities - 0.5% |
| Water Utilities - 0.5% |
| Pure Cycle Corp.1 | 420,811 | $ 4,435,348 |
| Total Utilities | | 4,435,348 |
Total Common Stocks - 88.0%
(Cost $791,047,787) | | 716,413,459 |
| Warrants - 0.0% |
| Health Care - 0.0% |
| Health Care Equipment & Supplies - 0.0% |
| Beta Bionics, Inc. Strike Price $0.01, Expires 2/16/321,3,4 | 2,157 | 195,424 |
| Total Health Care | | 195,424 |
Total Warrants - 0.0%
(Cost $239,997) | | 195,424 |
| Preferred Stocks - 5.1% |
| Communication Services - 1.1% |
| Internet & Direct Marketing Retail - 1.1% |
Evolve Vacation Rental Network, Inc. Series 8
Acquisition Date: 6/15/18,
Cost $3,999,9991,3,4 | 470,013 | 8,751,642 |
| Total Communication Services | | 8,751,642 |
| Health Care - 2.6% |
| Biotechnology - 1.0% |
Centrexion Therapeutics Corp.
Acquisition Date: 12/18/17,
Cost $2,995,0071,3,4 | 1,663,893 | 515,807 |
DNA Script Series C
Acquisition Date: 10/8/21
Cost $3,431,7211,3,4 | 3,955 | 2,313,161 |
Neurogene, Inc. Series B
Acquisition Date: 3/4/22
Cost $3,000,0001,3,4 | 1,229,508 | 2,557,376 |
YAP Therapeutics, Inc. Series B
Acquisition Date: 1/12/22
Cost $3,000,0051,3,4 | 64,544 | 3,000,005 |
| | | 8,386,349 |
| Health Care Equipment & Supplies - 0.8% |
Adagio Medical, Inc. Series E
Acquisition Date: 11/9/20,
Cost $4,000,0031,3,4 | 176,913 | 3,425,036 |
Beta Bionics, Inc. Series B
Acquisition Date: 10/9/18,
Cost $3,999,9761,3,4 | 26,631 | 2,548,320 |
| | Shares | Value |
Beta Bionics, Inc. Series C
Acquisition Date: 2/16/22,
Cost $959,9871,3,4 | 8,628 | $ 781,783 |
| | | 6,755,139 |
| Health Care Providers & Services - 0.6% |
Binx Health, Inc. Series E
Acquisition Date: 5/26/21,
Cost $6,500,0411,3,4 | 24,179 | 4,794,212 |
| Pharmaceuticals - 0.2% |
Capsule Corp. Series D
Acquisition Date: 4/8/21,
Cost $2,000,0001,3,4 | 138,011 | 1,273,842 |
| Total Health Care | | 21,209,542 |
| Information Technology - 1.0% |
| IT Services - 0.5% |
Skyryse, Inc. Series B
Acquisition Date: 10/21/21,
Cost $4,184,9831,3,4 | 169,570 | 4,184,983 |
| Software - 0.5% |
Dataminr, Inc. Series F
Acquisition Date: 3/22/21,
Cost $5,655,3201,3,4 | 128,530 | 3,749,220 |
| Total Information Technology | | 7,934,203 |
| Real Estate - 0.4% |
| Real Estate Management & Development - 0.4% |
Apartment List, Inc. Series D
Acquisition Date: 11/2/20 - 12/21/20,
Cost $5,999,9981,3,4 | 1,642,485 | 3,662,741 |
| Total Real Estate | | 3,662,741 |
Total Preferred Stocks - 5.1%
(Cost $49,727,039) | | 41,558,128 |
| Private Investment Fund - 0.4% |
Quail Investment Holdings, LLC
Acquisition Date: 9/1/20,
Cost $2,917,6951,3,5 | 2,918 | 2,794,773 |
Total Private Investment Fund - 0.4%
(Cost $2,917,695) | | 2,794,773 |
The accompanying notes are an integral part of the financial statements.
| Meridian Funds | 45 | www.meridianfund.com |
Meridian Small Cap Growth Fund
Schedule of Investments (continued)
June 30, 2022
| | Shares/
Principal
Amount | Value |
| Short-Term Investments - 8.9%6 |
| Money Market Funds - 1.9% |
| BlackRock Liquidity Funds, FedFund, Institutional Class, 1.32% | 1,361,000 | $ 1,361,000 |
| Dreyfus Institutional Preferred Government Plus Money Market Fund, Institutional Class, 1.46% | 5,439,000 | 5,439,000 |
| Goldman Sachs Financial Square Government Fund, Institutional Class, 1.36% | 1,361,000 | 1,361,000 |
| Invesco Short Term Investments, Government & Agency Portfolio, Institutional Class, 1.39% | 1,361,000 | 1,361,000 |
| Morgan Stanley Institutional Liquidity Funds, Government Portfolio, Institutional Class, 1.38% | 5,779,000 | 5,779,000 |
Total Money Market Funds
(Cost $15,301,000) | | 15,301,000 |
| Repurchase Agreements - 7.0% |
| Bank of America Securities, Inc., dated 6/30/22, due 7/1/22, 1.55% total to be received $16,914,121 (collateralized by various U.S. Government Sponsored Agency, 1.00% - 8.50%, 1/20/24 - 6/20/52, totaling $17,251,661) | $ 16,913,393 | 16,913,393 |
| Daiwa Capital Markets America, Inc., dated 6/30/22, due 7/1/22, 1.55% total to be received $16,914,121 (collateralized by various U.S. Government Sponsored Agency and U.S. Treasury Obligations, 0.00% - 6.50%, 7/31/22 - 7/1/52, totaling $17,251,661) | 16,913,393 | 16,913,393 |
| | Shares/
Principal
Amount | Value |
| Nomura Securities International, Inc., dated 6/30/22, due 7/1/22, 1.54% total to be received $6,623,585 (collateralized by various U.S. Government Sponsored Agency, 1.50% - 6.50%, 7/1/27 - 6/1/52, totaling $6,755,771) | $ 6,623,302 | $ 6,623,302 |
| RBC Dominion Securities, Inc., dated 6/30/22, due 7/1/22, 1.55% total to be received $16,914,121 (collateralized by various U.S. Government Sponsored Agency and U.S. Treasury Obligations, 0.00% - 6.88%, 8/16/22 - 5/20/52, totaling $17,251,661) | 16,913,393 | 16,913,393 |
Total Repurchase Agreements
(Cost $57,363,481) | | 57,363,481 |
Total Short-Term
Investments - 8.9%
(Cost $72,664,481) | | 72,664,481 |
Total Investments - 102.4%
(Cost $916,596,999) | |
833,626,265 |
| Liabilities in Excess of Other Assets - (2.4)% | | (19,426,352) |
| Net Assets - 100.0% | | $814,199,913 |
The accompanying notes are an integral part of the financial statements.
| Meridian Funds | 46 | www.meridianfund.com |
Meridian Small Cap Growth Fund
Schedule of Investments (continued)
June 30, 2022
| Plc—Public Limited Company |
| 1 | Non-income producing securities. |
| 2 | All or portion of this security is on loan at June 30, 2022. Total value of such securities at year-end amounts to
$80,718,440 and represents 9.91% of net assets. |
| 3 | Restricted security; cannot be offered for public resale without first being registered under the Securities Act of 1933 and related rules and agreements. Acquisition date represents the date on which an enforceable right to acquire such security is obtained and is presented along with related cost in the security description. The Fund has registration rights for certain restricted securities. Any costs related to such registration are borne by the issuer. The aggregate value of restricted securities at year-end amounts to $49,772,702 and represents 6.11% of net assets. |
| 4 | Security is valued using significant unobservable inputs in good faith in accordance with procedures approved by the Board of Directors. See Note 1 in Notes to financial statements. |
| 5 | Quail Investment Holdings, LLC is a limited liability company that was organized to invest solely in Qumulo, Inc Series E Preferred Stock. The value of Qumulo, Inc. is substantially the same as Quail Investment Holdings, LLC. |
| 6 | Collateral received from brokers for securities lending was invested in short-term investments. |
The accompanying notes are an integral part of the financial statements.
| Meridian Funds | 47 | www.meridianfund.com |
Meridian Fund, Inc.
Statements of Assets and Liabilities
| June 30, 2022 | Meridian
Growth Fund | Meridian
Contrarian Fund | Meridian
Enhanced
Equity Fund | Meridian
Small Cap
Growth Fund |
| Assets |
Investments, at value1,2
| $1,421,575,652 | $522,472,172 | $61,892,448 | $776,262,784 |
Repurchase agreements3
| 65,918,434 | 17,364,610 | 445,212 | 57,363,481 |
Cash
| 28,992,372 | 53,194,331 | 367,840 | 58,515,952 |
| Receivables and other assets: | | | | |
Fund shares purchased
| 453,617 | 24,829 | 25 | 643,089 |
Investments sold
| 487,564 | 4,492,263 | — | 81,127 |
Dividends
| 242,260 | 751,130 | 56,016 | 72,030 |
Securities lending interest
| 30,492 | 26,596 | 367 | 26,056 |
Prepaid expenses
| 53,123 | 31,162 | 22,062 | 36,656 |
Total Assets
| 1,517,753,514 | 598,357,093 | 62,783,970 | 893,001,175 |
| |
| Liabilities |
Collateral held for securities on loan
| 84,677,434 | 21,832,610 | 445,212 | 72,664,481 |
Due to broker
| 4 | — | — | — |
| Payables and other accrued expenses: | | | | |
Options written at value4
| — | — | 11,684,701 | — |
Fund shares sold
| 571,631 | 67,670 | — | 320,994 |
Investments purchased
| 306,319 | 1,735,731 | — | 4,821,018 |
Investment management fees
| 940,004 | 497,687 | 37,253 | 693,707 |
Distribution and service plan fees
| 2,186 | 794 | 447 | 8,091 |
Professional fees
| 80,530 | 46,976 | 32,298 | 69,613 |
Transfer agent fees
| 103,097 | 57,481 | 4,464 | 150,566 |
Other
| 71,213 | 15,984 | 9,768 | 72,792 |
Total Liabilities
| 86,752,418 | 24,254,933 | 12,214,143 | 78,801,262 |
Net Assets
| $1,431,001,096 | $574,102,160 | $50,569,827 | $814,199,913 |
| |
| Net Assets Consist of |
Paid-in capital
| $1,311,935,383 | $450,541,392 | $49,145,839 | $841,335,071 |
Accumulated earnings (loss)
| 119,065,713 | 123,560,768 | 1,423,988 | (27,135,158) |
Net Assets
| $1,431,001,096 | $574,102,160 | $50,569,827 | $814,199,913 |
1 Investments at cost
| $1,452,440,466 | $456,140,842 | $69,470,352 | $859,233,518 |
| | |
| 2 | Including securities on loan valued at $145,238,727, $70,980,100, $1,210,093 and $80,718,440 respectively. See Note 4 in Notes to Financial Statements. |
| 3 | Repurchase agreements at cost are $65,918,434, $17,364,610, $445,212 and $57,363,481, respectively. |
| 4 | Written options, premium received of $—, $—, $17,519,635 and $—, respectively. |
The accompanying notes are an integral part of the financial statements.
| Meridian Funds | 48 | www.meridianfund.com |
Meridian Fund, Inc.
Statements of Assets and Liabilities (continued)
| June 30, 2022 | Meridian
Growth Fund | Meridian
Contrarian Fund | Meridian
Enhanced
Equity Fund | Meridian
Small Cap
Growth Fund |
| Net Asset Value |
| Legacy Class | | | | |
Net Assets
| $962,311,447 | $560,553,996 | $46,636,333 | $ 30,519,021 |
Shares outstanding5
| 28,345,801 | 15,453,613 | 3,802,799 | 2,582,269 |
Net Asset value per share (offering and redemption price)
| $ 33.95 | $ 36.27 | $ 12.26 | $ 11.82 |
| Institutional Class | | | | |
Net Assets
| $422,428,685 | $ — | $ — | $316,076,096 |
Shares outstanding5
| 12,440,278 | — | — | 26,515,423 |
Net Asset value per share (offering and redemption price)
| $ 33.96 | $ — | $ — | $ 11.92 |
| Class A | | | | |
Net Assets
| $ 4,162,947 | $ 2,057,138 | $ 1,844,075 | $ 20,945,764 |
Shares outstanding5
| 129,434 | 58,709 | 154,460 | 1,852,010 |
Net Asset value per share (offering and redemption price)
| $ 32.16 | $ 35.04 | $ 11.94 | $ 11.31 |
| Class C | | | | |
Net Assets
| $ 1,458,805 | $ 403,264 | $ 58,090 | $ 4,240,580 |
Shares outstanding5
| 47,475 | 12,017 | 5,021 | 400,393 |
Net Asset value per share (offering and redemption price)
| $ 30.73 | $ 33.56 | $ 11.57 | $ 10.59 |
| Investor Class | | | | |
Net Assets
| $ 40,639,212 | $ 11,087,762 | $ 2,031,329 | $442,418,452 |
Shares outstanding5
| 1,214,474 | 308,938 | 166,163 | 37,743,985 |
Net Asset value per share (offering and redemption price)
| $ 33.46 | $ 35.89 | $ 12.22 | $ 11.72 |
| | |
| 5 | 500,000,000 shares authorized, $0.01 par value. |
The accompanying notes are an integral part of the financial statements.
| Meridian Funds | 49 | www.meridianfund.com |
Meridian Fund, Inc.
Statements of Operations
| For the Year Ended June 30, 2022 | Meridian
Growth Fund | Meridian
Contrarian Fund | Meridian
Enhanced
Equity Fund | Meridian
Small Cap
Growth Fund |
| Investment Income |
Dividends
| $ 8,124,319 | $ 7,299,616 | $ 546,449 | $ 2,744,724 |
Foreign taxes withheld
| (113,341) | (43,226) | (322) | (64,007) |
Interest income
| — | — | — | 4,534 |
Securities lending
| 402,623 | 401,551 | 10,164 | 547,676 |
Total investment income
| 8,413,601 | 7,657,941 | 556,291 | 3,232,927 |
| |
| Expenses |
Investment management fees
| 15,053,604 | 6,980,671 | 515,631 | 11,849,904 |
Custodian fees
| 199,568 | 71,089 | 5,584 | 137,334 |
| Distribution and service plan fees: | | | | |
Class A
| 13,855 | 6,553 | 5,412 | 75,945 |
Class C
| 24,148 | 3,302 | 438 | 67,013 |
Directors' fees
| 198,739 | 69,508 | 6,039 | 118,462 |
Pricing fees
| 194,377 | 77,527 | 24,827 | 113,087 |
Audit and tax fees
| 34,971 | 26,273 | 25,096 | 31,660 |
Legal fees
| 40,354 | 17,688 | 965 | 57,127 |
Registration and filing fees
| 109,471 | 88,703 | 84,335 | 120,404 |
Shareholder communications fees
| 116,630 | 50,974 | 16,836 | 148,460 |
Transfer agent fees
| 812,682 | 423,238 | 35,622 | 1,180,469 |
Recoupment of investment advisory fees previously waived
| — | — | 127 | 6,831 |
Miscellaneous expenses
| 104,743 | 41,979 | 16,404 | 70,838 |
Total expenses excluding interest expenses
| 16,903,142 | 7,857,505 | 737,316 | 13,977,534 |
Interest expenses
| — | — | 402 | — |
Total expenses
| 16,903,142 | 7,857,505 | 737,718 | 13,977,534 |
Less waivers and/or reimbursements (Note 6)
| — | — | (75) | — |
Net expenses
| 16,903,142 | 7,857,505 | 737,643 | 13,977,534 |
Net investment loss
| (8,489,541) | (199,564) | (181,352) | (10,744,607) |
| |
| Realized and Unrealized Gain (Loss) |
Net realized gain on investments and foreign currency transactions
| 237,319,795 | 68,472,165 | 5,514,003 | 241,196,306 |
Net realized gain on securities sold short
| 17,394,698 | — | — | — |
Net realized gain on written options
| — | — | 992,111 | — |
Net change in unrealized depreciation on investments and foreign currency translations
| (849,474,577) | (188,726,096) | (22,971,353) | (635,547,919) |
Net change in unrealized appreciation on written options
| — | 128,926 | 8,919,776 | — |
Total realized and unrealized loss
| (594,760,084) | (120,125,005) | (7,545,463) | (394,351,613) |
Net decrease in net assets resulting from operations
| $(603,249,625) | $(120,324,569) | $ (7,726,815) | $(405,096,220) |
The accompanying notes are an integral part of the financial statements.
| Meridian Funds | 50 | www.meridianfund.com |
Meridian Fund, Inc.
Statements of Changes in Net Assets
| | Meridian Growth Fund | | Meridian Contrarian Fund |
| Changes in Net Assets From: | Year Ended
June 30, 2022 | Year Ended
June 30, 2021 | | Year Ended
June 30, 2022 | Year Ended
June 30, 2021 |
| Operations |
Net investment loss
| $ (8,489,541) | $ (10,597,759) | | $ (199,564) | $ (706,723) |
Net realized gain on investments, securities sold short and foreign currency transactions
| 254,714,493 | 304,073,283 | | 68,472,165 | 120,376,063 |
Net change in unrealized appreciation/(depreciation) on investments and written options
| (849,474,577) | 661,320,758 | | (188,597,170) | 186,950,015 |
Net increase/(decrease) in net assets from operations
| (603,249,625) | 954,796,282 | | (120,324,569) | 306,619,355 |
| |
| Distributions to Shareholders: |
Legacy Class
| (194,054,079) | (11,923,723) | | (91,794,387) | (29,590,465) |
Institutional Class
| (81,802,242) | (4,705,276) | | — | — |
Class A
| (837,322) | (49,734) | | (361,504) | (89,267) |
Class C
| (378,203) | (25,185) | | (50,641) | (7,188) |
Investor Class
| (8,081,484) | (3,292,390) | | (1,202,076) | (106,172) |
Decrease in net assets from distributions
| (285,153,330) | (19,996,308) | | (93,408,608) | (29,793,092) |
| |
| Fund Share Transactions |
Net increase/(decrease) in net assets resulting from fund share transactions (Note 2)
| 84,308,728 | (537,735,273) | | 47,836,902 | (24,033,444) |
Total increase/(decrease) in net assets
| (804,094,227) | 397,064,701 | | (165,896,275) | 252,792,819 |
| |
| Net Assets |
Beginning of Year
| 2,235,095,323 | 1,838,030,622 | | 739,998,435 | 487,205,616 |
End of Year
| $1,431,001,096 | $2,235,095,323 | | $ 574,102,160 | $739,998,435 |
The accompanying notes are an integral part of the financial statements.
| Meridian Funds | 51 | www.meridianfund.com |
Meridian Fund, Inc.
Statements of Changes in Net Assets (continued)
| | Meridian Enhanced Equity Fund | | Meridian Small Cap Growth Fund |
| Changes in Net Assets From: | Year Ended
June 30, 2022 | Year Ended
June 30, 2021 | | Year Ended
June 30, 2022 | Year Ended
June 30, 2021 |
| Operations |
Net investment loss
| $ (181,352) | $ (188,865) | | $ (10,744,607) | $ (11,960,077) |
Net realized gain on investments, forward foreign currency exchange contracts, written options and foreign currency transactions
| 6,506,114 | 14,249,180 | | 241,196,306 | 185,176,237 |
Net change in unrealized appreciation/(depreciation) on investments, written options and foreign currency translations
| (14,051,577) | 2,706,922 | | (635,547,919) | 543,629,016 |
Net increase/(decrease) in net assets from operations
| (7,726,815) | 16,767,237 | | (405,096,220) | 716,845,176 |
| |
| Distributions to Shareholders: |
Legacy Class
| (12,274,693) | (6,719,285) | | (9,963,768) | (597,274) |
Institutional Class
| — | — | | (112,922,342) | (12,486,518) |
Class A
| (463,710) | (248,148) | | (8,338,772) | (671,223) |
Class C
| (8,835) | (4,202) | | (1,873,343) | (164,935) |
Investor Class
| (413,786) | (261,508) | | (162,733,487) | (17,279,229) |
Decrease in net assets from distributions
| (13,161,024) | (7,233,143) | | (295,831,712) | (31,199,179) |
| |
| Fund Share Transactions |
Net increase/(decrease) in net assets resulting from fund share transactions (Note 2)
| 6,808,736 | 3,302,816 | | (102,115,956) | (390,012,892) |
Total increase/(decrease) in net assets
| (14,079,103) | 12,836,910 | | (803,043,888) | 295,633,105 |
| |
| Net Assets |
Beginning of Year
| 64,648,930 | 51,812,020 | | 1,617,243,801 | 1,321,610,696 |
End of Year
| $ 50,569,827 | $64,648,930 | | $ 814,199,913 | $1,617,243,801 |
The accompanying notes are an integral part of the financial statements.
| Meridian Funds | 52 | www.meridianfund.com |
Meridian Growth Fund
Financial Highlights
| | For the Fiscal Year Ended June 30, |
| Legacy Class | 2022 | 2021 | 2020 | 2019 | 2018 |
| Per Share Operating Performance |
Net asset value, beginning of year
| $ 55.49 | $ 35.86 | $ 39.69 | $ 45.05 | $ 40.15 |
| Income (loss) from investment operations: | | | | | |
Net investment loss1
| (0.21) | (0.24) | (0.05) | (0.03) | (0.10) |
Net realized and unrealized gain (loss)
| (13.93) | 20.29 | (0.23) | 0.12 | 7.94 |
Net increase (decrease) from investment operations
| (14.14) | 20.05 | (0.28) | 0.09 | 7.84 |
| Less distributions to shareholders: | | | | | |
Distributions from net investment income
| 0.00 | 0.00 | 0.00 | (0.02) | 0.00 |
Distributions from net realized capital gains
| (7.40) | (0.42) | (3.55) | (5.43) | (2.94) |
Total distributions to shareholders
| (7.40) | (0.42) | (3.55) | (5.45) | (2.94) |
Redemption fees
| 0.00 2 | 0.00 2 | 0.00 2 | 0.00 2 | 0.00 2 |
Net asset value, end of year
| $ 33.95 | $ 55.49 | $ 35.86 | $ 39.69 | $ 45.05 |
Total return
| (29.20)% | 56.11% | (1.40)% 3 | 2.98% 3 | 20.14% |
| |
| Ratios to Average Net Assets |
Ratio of net investment loss to
average net assets
| (0.43)% 4 | (0.51)% 4 | (0.12)% | (0.06)% | (0.23)% |
Ratio of expenses to average net assets
| 0.85% 4 | 0.84% 4 | 0.85% | 0.85% | 0.86% |
| |
| Supplemental Data |
Net Assets, End of Year (000's)
| $ 962,311 | $1,503,022 | $1,095,062 | $1,307,172 | $1,400,431 |
Portfolio Turnover Rate
| 42% | 30% | 47% | 35% | 47% |
| | |
| 1 | Per share net investment loss has been calculated using the average daily shares method. |
| 2 | Less than $0.005 per share. |
| 3 | The total return is based on beginning and ending Financial Statement Net Asset Value as shown above, which may differ from the traded Net Asset Value, due to rounding. |
| 4 | These ratios exclude the impact of expenses of the underlying private investment funds in which the Fund invests as represented in the Schedule of Investments. |
The accompanying notes are an integral part of the financial statements.
| Meridian Funds | 53 | www.meridianfund.com |
Meridian Growth Fund
Financial Highlights
| | For the Fiscal Year Ended June 30, |
| Institutional Class | 2022 | 2021 | 2020 | 2019 | 2018 |
| Per Share Operating Performance |
Net asset value, beginning of year
| $ 55.48 | $ 35.85 | $ 39.67 | $ 45.03 | $ 40.13 |
| Income (loss) from investment operations: | | | | | |
Net investment loss1
| (0.19) | (0.23) | (0.03) | (0.02) | (0.11) |
Net realized and unrealized gain (loss)
| (13.93) | 20.28 | (0.24) | 0.12 | 7.95 |
Net increase (decrease) from investment operations
| (14.12) | 20.05 | (0.27) | 0.10 | 7.84 |
| Less distributions to shareholders: | | | | | |
Distributions from net investment income
| 0.00 | 0.00 | 0.00 | (0.03) | 0.00 |
Distributions from net realized capital gains
| (7.40) | (0.42) | (3.55) | (5.43) | (2.94) |
Total distributions to shareholders
| (7.40) | (0.42) | (3.55) | (5.46) | (2.94) |
Redemption fees
| 0.00 2 | 0.00 2 | 0.00 2 | 0.00 2 | 0.00 2 |
Net asset value, end of year
| $ 33.96 | $ 55.48 | $ 35.85 | $ 39.67 | $ 45.03 |
Total return
| (29.17)% | 56.13% | (1.38)% | 3.00% | 20.18% |
| |
| Ratios to Average Net Assets |
Ratio of net investment loss to average
net assets
| (0.40)% 3 | (0.49)% 3 | (0.09)% | (0.05)% | (0.25)% |
Ratio of expenses to average net assets
| 0.82% 3 | 0.82% 3 | 0.82% | 0.83% | 0.85% |
| |
| Supplemental Data |
Net Assets, End of Year (000's)
| $ 422,429 | $660,985 | $455,636 | $367,627 | $311,019 |
Portfolio Turnover Rate
| 42% | 30% | 47% | 35% | 47% |
| | |
| 1 | Per share net investment loss has been calculated using the average daily shares method. |
| 2 | Less than $0.005 per share. |
| 3 | These ratios exclude the impact of expenses of the underlying private investment funds in which the Fund invests as represented in the Schedule of Investments. |
The accompanying notes are an integral part of the financial statements.
| Meridian Funds | 54 | www.meridianfund.com |
Meridian Growth Fund
Financial Highlights
| | For the Fiscal Year Ended June 30, |
| Class A | 2022 | 2021 | 2020 | 2019 | 2018 |
| Per Share Operating Performance |
Net asset value, beginning of year
| $ 53.12 | $ 34.45 | $ 38.38 | $ 43.88 | $ 39.29 |
| Income (loss) from investment operations: | | | | | |
Net investment loss1
| (0.34) | (0.37) | (0.16) | (0.13) | (0.21) |
Net realized and unrealized gain (loss)
| (13.22) | 19.46 | (0.22) | 0.06 | 7.74 |
Net increase (decrease) from investment operations
| (13.56) | 19.09 | (0.38) | (0.07) | 7.53 |
| Less distributions to shareholders: | | | | | |
Distributions from net realized capital gains
| (7.40) | (0.42) | (3.55) | (5.43) | (2.94) |
Total distributions to shareholders
| (7.40) | (0.42) | (3.55) | (5.43) | (2.94) |
Redemption fees
| 0.00 | 0.00 2 | 0.00 2 | 0.00 | 0.00 2 |
Net asset value, end of year
| $ 32.16 | $ 53.12 | $ 34.45 | $ 38.38 | $ 43.88 |
Total return3
| (29.43)% | 55.62% | (1.72)% 4 | 2.64% 4 | 19.81% |
| |
| Ratios to Average Net Assets |
Ratio of net investment loss to average
net assets
| (0.75)% 5 | (0.82)% 5 | (0.45)% | (0.32)% | (0.51)% |
Ratio of expenses to average net assets
| 1.17% 5 | 1.16% 5 | 1.17% | 1.15% | 1.15% |
| |
| Supplemental Data |
Net Assets, End of Year (000's)
| $ 4,163 | $ 6,045 | $ 4,731 | $ 6,707 | $ 15,701 |
Portfolio Turnover Rate
| 42% | 30% | 47% | 35% | 47% |
| | |
| 1 | Per share net investment loss has been calculated using the average daily shares method. |
| 2 | Less than $0.005 per share. |
| 3 | Excludes the effects of any sales charges. |
| 4 | The total return is based on beginning and ending Financial Statement Net Asset Value as shown above, which may differ from the traded Net Asset Value, due to rounding. |
| 5 | These ratios exclude the impact of expenses of the underlying private investment funds in which the Fund invests as represented in the Schedule of Investments. |
The accompanying notes are an integral part of the financial statements.
| Meridian Funds | 55 | www.meridianfund.com |
Meridian Growth Fund
Financial Highlights
| | For the Fiscal Year Ended June 30, |
| Class C | 2022 | 2021 | 2020 | 2019 | 2018 |
| Per Share Operating Performance |
Net asset value, beginning of year
| $ 51.42 | $ 33.60 | $ 37.76 | $ 43.56 | $ 39.30 |
| Income (loss) from investment operations: | | | | | |
Net investment loss1
| (0.64) | (0.66) | (0.40) | (0.43) | (0.52) |
Net realized and unrealized gain (loss)
| (12.65) | 18.90 | (0.21) | 0.06 | 7.72 |
Net increase (decrease) from investment operations
| (13.29) | 18.24 | (0.61) | (0.37) | 7.20 |
| Less distributions to shareholders: | | | | | |
Distributions from net realized capital gains
| (7.40) | (0.42) | (3.55) | (5.43) | (2.94) |
Total distributions to shareholders
| (7.40) | (0.42) | (3.55) | (5.43) | (2.94) |
Redemption fees
| 0.00 | 0.00 | 0.00 | 0.00 | 0.00 2 |
Net asset value, end of year
| $ 30.73 | $ 51.42 | $ 33.60 | $ 37.76 | $ 43.56 |
Total return3
| (29.91)% | 54.49% | (2.40)% 4 | 1.94% 4 | 18.90% |
| |
| Ratios to Average Net Assets |
Ratio of net investment loss to average net assets
| (1.44)% 5 | (1.53)% 5 | (1.15)% | (1.08)% | (1.27)% |
Ratio of expenses to average net assets
| 1.87% 5 | 1.87% 5 | 1.87% | 1.87% | 1.90% |
| |
| Supplemental Data |
Net Assets, End of Year (000's)
| $ 1,459 | $ 2,899 | $ 2,188 | $ 2,914 | $ 3,384 |
Portfolio Turnover Rate
| 42% | 30% | 47% | 35% | 47% |
| | |
| 1 | Per share net investment loss has been calculated using the average daily shares method. |
| 2 | Less than $0.005 per share. |
| 3 | Excludes the effects of any sales charges. |
| 4 | The total return is based on beginning and ending Financial Statement Net Asset Value as shown above, which may differ from the traded Net Asset Value, due to rounding. |
| 5 | These ratios exclude the impact of expenses of the underlying private investment funds in which the Fund invests as represented in the Schedule of Investments. |
The accompanying notes are an integral part of the financial statements.
| Meridian Funds | 56 | www.meridianfund.com |
Meridian Growth Fund
Financial Highlights
| | For the Fiscal Year Ended June 30, |
| Investor Class | 2022 | 2021 | 2020 | 2019 | 2018 |
| Per Share Operating Performance |
Net asset value, beginning of year
| $ 54.83 | $ 35.46 | $ 39.29 | $ 44.66 | $ 39.86 |
| Income (loss) from investment operations: | | | | | |
Net investment loss1
| (0.23) | (0.20) | (0.05) | (0.06) | (0.13) |
Net realized and unrealized gain (loss)
| (13.74) | 19.99 | (0.23) | 0.13 | 7.87 |
Net increase (decrease) from investment operations
| (13.97) | 19.79 | (0.28) | 0.07 | 7.74 |
| Less distributions to shareholders: | | | | | |
Distributions from net investment income
| 0.00 | 0.00 | 0.00 | (0.01) | 0.00 |
Distributions from net realized capital gains
| (7.40) | (0.42) | (3.55) | (5.43) | (2.94) |
Total distributions to shareholders
| (7.40) | (0.42) | (3.55) | (5.44) | (2.94) |
Redemption fees
| 0.00 | 0.00 2 | 0.00 2 | 0.00 2 | 0.00 |
Net asset value, end of year
| $ 33.46 | $ 54.83 | $ 35.46 | $ 39.29 | $ 44.66 |
Total return
| (29.25)% | 56.01% | (1.42)% 3 | 2.95% 3 | 20.06% |
| |
| Ratios to Average Net Assets |
Ratio of net investment loss to average net assets
| (0.50)% 4 | (0.47)% 4 | (0.13)% | (0.14)% | (0.31)% |
Ratio of expenses to average net assets
| 0.92% 4 | 0.87% 4 | 0.86% | 0.87% | 0.95% |
| |
| Supplemental Data |
Net Assets, End of Year (000's)
| $ 40,639 | $ 62,145 | $280,414 | $362,613 | $103,643 |
Portfolio Turnover Rate
| 42% | 30% | 47% | 35% | 47% |
| | |
| 1 | Per share net investment loss has been calculated using the average daily shares method. |
| 2 | Less than $0.005 per share. |
| 3 | The total return is based on beginning and ending Financial Statement Net Asset Value as shown above, which may differ from the traded Net Asset Value, due to rounding. |
| 4 | These ratios exclude the impact of expenses of the underlying private investment funds in which the Fund invests as represented in the Schedule of Investments. |
The accompanying notes are an integral part of the financial statements.
| Meridian Funds | 57 | www.meridianfund.com |
Meridian Contrarian Fund
Financial Highlights
| | For the Fiscal Year Ended June 30, |
| Legacy Class | 2022 | 2021 | 2020 | 2019 | 2018 |
| Per Share Operating Performance |
Net asset value, beginning of year
| $ 50.21 | $ 31.63 | $ 35.91 | $ 45.23 | $ 39.79 |
| Income (loss) from investment operations: | | | | | |
Net investment income (loss)1
| (0.01) | (0.04) | 0.16 | 0.20 | 0.46 |
Net realized and unrealized gain (loss)
| (7.44) | 20.68 | (1.64) | (1.63) | 9.39 |
Net increase (decrease) from investment operations
| (7.45) | 20.64 | (1.48) | (1.43) | 9.85 |
| Less distributions to shareholders: | | | | | |
Distributions from net investment income
| 0.00 | (0.94) | (0.31) | (0.49) | 0.00 |
Distributions from net realized capital gains
| (6.49) | (1.12) | (2.49) | (7.40) | (4.41) |
Total distributions to shareholders
| (6.49) | (2.06) | (2.80) | (7.89) | (4.41) |
Redemption fees
| 0.00 | 0.00 2 | 0.00 2 | 0.00 2 | 0.00 2 |
Net asset value, end of year
| $ 36.27 | $ 50.21 | $ 31.63 | $ 35.91 | $ 45.23 |
Total return
| (17.18)% | 66.77% | (4.90)% | (0.05)% | 25.73% |
| |
| Ratios to Average Net Assets |
Ratio of net investment income (loss) to average
net assets
| (0.03)% | (0.11)% | 0.47% | 0.51% | 1.07% |
Ratio of expenses to average net assets
| 1.12% | 1.11% | 1.13% | 1.12% | 1.12% |
| |
| Supplemental Data |
Net Assets, End of Year (000's)
| $ 560,554 | $730,712 | $483,573 | $592,899 | $672,035 |
Portfolio Turnover Rate
| 57% | 72% | 76% | 57% | 49% |
| | |
| 1 | Per share net investment income (loss) has been calculated using the average daily shares method. |
| 2 | Less than $0.005 per share. |
The accompanying notes are an integral part of the financial statements.
| Meridian Funds | 58 | www.meridianfund.com |
Meridian Contrarian Fund
Financial Highlights
| | For the Fiscal Year Ended June 30, |
| Class A | 2022 | 2021 | 2020 | 2019 | 2018 |
| Per Share Operating Performance |
Net asset value, beginning of year
| $ 48.85 | $ 30.83 | $ 34.94 | $ 44.26 | $ 39.19 |
| Income (loss) from investment operations: | | | | | |
Net investment income (loss)1
| (0.17) | (0.21) | 0.01 | 0.05 | 0.04 |
Net realized and unrealized gain (loss)
| (7.17) | 20.17 | (1.57) | (1.60) | 9.44 |
Net increase (decrease) from investment operations
| (7.34) | 19.96 | (1.56) | (1.55) | 9.48 |
| Less distributions to shareholders: | | | | | |
Distributions from net investment income
| 0.00 | (0.82) | (0.06) | (0.37) | 0.00 |
Distributions from net realized capital gains
| (6.49) | (1.12) | (2.49) | (7.40) | (4.41) |
Total distributions to shareholders
| (6.49) | (1.94) | (2.55) | (7.77) | (4.41) |
Redemption fees
| 0.02 | 0.00 2 | 0.00 2 | 0.00 2 | 0.00 2 |
Net asset value, end of year
| $ 35.04 | $ 48.85 | $ 30.83 | $ 34.94 | $ 44.26 |
Total return3
| (17.40)% | 66.22% | (5.22)% | (0.42)% | 25.17% |
| |
| Ratios to Average Net Assets |
Ratio of net investment income (loss) to
average net assets
| (0.38)% | (0.51)% | 0.04% | 0.12% | 0.09% |
| Ratio of expenses to average net assets: | | | | | |
Total expenses
| 1.46% | 1.43% | 1.48% | 1.48% | 1.60% |
Excluding recoupment of past waived fees
| 1.46% | 1.43% | 1.48% | 1.48% | 1.41% |
| |
| Supplemental Data |
Net Assets, End of Year (000's)
| $ 2,057 | $ 3,403 | $ 1,648 | $ 4,572 | $ 7,097 |
Portfolio Turnover Rate
| 57% | 72% | 76% | 57% | 49% |
| | |
| 1 | Per share net investment income (loss) has been calculated using the average daily shares method. |
| 2 | Less than $0.005 per share. |
| 3 | Excludes the effects of any sales charges. |
The accompanying notes are an integral part of the financial statements.
| Meridian Funds | 59 | www.meridianfund.com |
Meridian Contrarian Fund
Financial Highlights
| | For the Fiscal Year Ended June 30, |
| Class C | 2022 | 2021 | 2020 | 2019 | 2018 |
| Per Share Operating Performance |
Net asset value, beginning of year
| $ 47.38 | $ 30.13 | $ 34.37 | $ 43.77 | $ 39.00 |
| Income (loss) from investment operations: | | | | | |
Net investment loss1
| (0.43) | (0.53) | (0.17) | (0.18) | (0.05) |
Net realized and unrealized gain (loss)
| (6.91) | 19.69 | (1.58) | (1.60) | 9.23 |
Net increase (decrease) from investment operations
| (7.34) | 19.16 | (1.75) | (1.78) | 9.18 |
| Less distributions to shareholders: | | | | | |
Distributions from net investment income
| 0.00 | (0.79) | 0.00 | (0.22) | 0.00 |
Distributions from net realized capital gains
| (6.49) | (1.12) | (2.49) | (7.40) | (4.41) |
Total distributions to shareholders
| (6.49) | (1.91) | (2.49) | (7.62) | (4.41) |
Redemption fees
| 0.01 | 0.00 | 0.00 | 0.00 | 0.00 |
Net asset value, end of year
| $ 33.56 | $ 47.38 | $ 30.13 | $ 34.37 | $ 43.77 |
Total return2
| (18.01)% | 65.03% | (5.86)% 3 | (1.06)% 3 | 24.46% |
| |
| Ratios to Average Net Assets |
Ratio of net investment loss to average net assets
| (1.06)% | (1.27)% | (0.55)% | (0.50)% | (0.13)% |
Ratio of expenses to average net assets
| 2.19% | 2.16% | 2.17% | 2.14% | 2.14% |
| |
| Supplemental Data |
Net Assets, End of Year (000's)
| $ 403 | $ 193 | $ 49 | $ 49 | $ 25 |
Portfolio Turnover Rate
| 57% | 72% | 76% | 57% | 49% |
| | |
| 1 | Per share net investment income (loss) has been calculated using the average daily shares method. |
| 2 | Excludes the effects of any sales charges. |
| 3 | The total return is based on beginning and ending Financial Statement Net Asset Value as shown above, which may differ from the traded Net Asset Value, due to rounding. |
The accompanying notes are an integral part of the financial statements.
| Meridian Funds | 60 | www.meridianfund.com |
Meridian Contrarian Fund
Financial Highlights
| | For the Fiscal Year Ended June 30, |
| Investor Class | 2022 | 2021 | 2020 | 2019 | 2018 |
| Per Share Operating Performance |
Net asset value, beginning of year
| $ 49.77 | $ 31.37 | $ 35.63 | $ 44.90 | $ 39.61 |
| Income (loss) from investment operations: | | | | | |
Net investment income (loss)1
| (0.05) | (0.11) | 0.12 | 0.18 | 0.35 |
Net realized and unrealized gain (loss)
| (7.34) | 20.54 | (1.61) | (1.63) | 9.35 |
Net increase (decrease) from investment operations
| (7.39) | 20.43 | (1.49) | (1.45) | 9.70 |
| Less distributions to shareholders: | | | | | |
Distributions from net investment income
| 0.00 | (0.91) | (0.28) | (0.42) | 0.00 |
Distributions from net realized capital gains
| (6.49) | (1.12) | (2.49) | (7.40) | (4.41) |
Total distributions to shareholders
| (6.49) | (2.03) | (2.77) | (7.82) | (4.41) |
Redemption fees
| 0.00 2 | 0.00 2 | 0.00 2 | 0.00 | 0.00 |
Net asset value, end of year
| $ 35.89 | $ 49.77 | $ 31.37 | $ 35.63 | $ 44.90 |
Total return
| (17.21)% | 66.65% | (4.96)% | (0.11)% | 25.44% |
| |
| Ratios to Average Net Assets |
Ratio of net investment income (loss) to average net assets
| (0.11)% | (0.28)% | 0.37% | 0.45% | 0.81% |
| Ratio of expenses to average net assets: | | | | | |
Total expenses
| 1.18% | 1.19% | 1.19% | 1.18% | 1.35% |
Excluding recoupment of past waived fees
| 1.18% | 1.19% | 1.19% | 1.18% | 1.18% |
| |
| Supplemental Data |
Net Assets, End of Year (000's)
| $ 11,088 | $ 5,690 | $ 1,936 | $ 3,484 | $ 3,916 |
Portfolio Turnover Rate
| 57% | 72% | 76% | 57% | 49% |
| | |
| 1 | Per share net investment income (loss) has been calculated using the average daily shares method. |
| 2 | Less than $0.005 per share. |
The accompanying notes are an integral part of the financial statements.
| Meridian Funds | 61 | www.meridianfund.com |
Meridian Enhanced Equity Fund
Financial Highlights
| | For the Fiscal Year Ended June 30, |
| Legacy Class | 2022 | 2021 | 2020 | 2019 | 2018 |
| Per Share Operating Performance |
Net asset value, beginning of year
| $ 17.80 | $ 15.17 | $ 18.42 | $ 18.64 | $ 13.59 |
| Income (loss) from investment operations: | | | | | |
Net investment income (loss)1
| (0.04) | (0.05) | (0.02) | (0.13) | 0.06 |
Net realized and unrealized gain (loss)
| (1.74) | 4.82 | 2.65 | 1.55 | 5.18 |
Net increase (decrease) from investment operations
| (1.78) | 4.77 | 2.63 | 1.42 | 5.24 |
| Less distributions to shareholders: | | | | | |
Distributions from net investment income
| 0.00 | 0.00 | 0.00 | (0.09) | (0.19) |
Distributions from net realized capital gains
| (3.76) | (2.14) | (5.88) | (1.55) | 0.00 |
Total distributions to shareholders
| (3.76) | (2.14) | (5.88) | (1.64) | (0.19) |
Redemption fees
| 0.00 | 0.00 | 0.00 2 | 0.00 | 0.00 2 |
Net asset value, end of year
| $ 12.26 | $ 17.80 | $ 15.17 | $ 18.42 | $ 18.64 |
Total return
| (13.52)% | 33.17% | 15.86% 3 | 11.20% 3 | 38.78% |
| |
| Ratios to Average Net Assets |
Ratio of net investment income (loss) to average
net assets
| (0.29)% | (0.31)% | (0.12)% | (0.79)% | 0.36% |
| Ratio of expenses to average net assets: | | | | | |
Total expenses
| 1.20% | 1.25% | 1.28% | 1.58% | 1.44% |
Before fees waived and excluding recoupment of past waived fees
| 1.20% | 1.24% | 1.28% | 1.58% | 1.40% |
After fees waived and excluding recoupment of past waived fees4
| 1.20% | 1.24% | 1.26% | 1.58% | 1.40% |
After fees waived and Excluding recoupment of past waived fees and interest and dividend expenses
| 1.20% | 1.24% | 1.25% | 1.19% | 1.17% |
| |
| Supplemental Data |
Net Assets, End of Year (000's)
| $ 46,636 | $ 60,565 | $ 48,332 | $ 60,306 | $ 56,631 |
Portfolio Turnover Rate
| 74% | 96% | 140% | 47% | 49% |
| | |
| 1 | Per share net investment income (loss) has been calculated using the average daily shares method. |
| 2 | Less than $0.005 per share. |
| 3 | The total return is based on beginning and ending Financial Statement Net Asset Value as shown above, which may differ from the traded Net Asset Value, due to rounding. |
| 4 | See Note 6 to Financial Statements. |
The accompanying notes are an integral part of the financial statements.
| Meridian Funds | 62 | www.meridianfund.com |
Meridian Enhanced Equity Fund
Financial Highlights
| | For the Fiscal Year Ended June 30, |
| Class A | 2022 | 2021 | 2020 | 2019 | 2018 |
| Per Share Operating Performance |
Net asset value, beginning of year
| $ 17.48 | $ 14.97 | $ 18.31 | $ 18.48 | $ 13.52 |
| Income (loss) from investment operations: | | | | | |
Net investment loss1
| (0.10) | (0.11) | (0.08) | (0.21) | (0.02) |
Net realized and unrealized gain (loss)
| (1.68) | 4.76 | 2.61 | 1.59 | 5.16 |
Net increase (decrease) from investment operations
| (1.78) | 4.65 | 2.53 | 1.38 | 5.14 |
| Less distributions to shareholders: | | | | | |
Distributions from net investment income
| 0.00 | 0.00 | 0.00 | 0.00 | (0.18) |
Distributions from net realized capital gains
| (3.76) | (2.14) | (5.88) | (1.55) | 0.00 |
Total distributions to shareholders
| (3.76) | (2.14) | (5.88) | (1.55) | (0.18) |
Redemption fees
| 0.00 2 | 0.00 2 | 0.01 | 0.00 2 | 0.00 2 |
Net asset value, end of year
| $ 11.94 | $ 17.48 | $ 14.97 | $ 18.31 | $ 18.48 |
Total return3
| (13.80)% | 32.78% | 15.39% 4 | 10.87% 4 | 38.24% |
| |
| Ratios to Average Net Assets |
Ratio of net investment loss to average
net assets
| (0.63)% | (0.66)% | (0.50)% | (1.27)% | (0.11)% |
| Ratio of expenses to average net assets: | | | | | |
Total expenses
| 1.54% | 1.60% | 1.64% | 2.00% | 1.84% |
Before fees waived and Excluding recoupment of past waived fees
| 1.53% | 1.57% | 1.64% | 2.00% | 1.78% |
After fees waived and excluding recoupment of past waived fees5
| 1.53% | 1.57% | 1.61% | 2.00% | 1.78% |
After fees waived and excluding recoupment of past waived fees and interest and dividend expenses
| 1.53% | 1.57% | 1.60% | 1.55% | 1.55% |
| |
| Supplemental Data |
Net Assets, End of Year (000's)
| $ 1,844 | $ 2,117 | $ 1,770 | $ 3,200 | $ 5,730 |
Portfolio Turnover Rate
| 74% | 96% | 140% | 47% | 49% |
| | |
| 1 | Per share net investment income (loss) has been calculated using the average daily shares method. |
| 2 | Less than $0.005 per share. |
| 3 | Excludes the effects of any sales charges. |
| 4 | The total return is based on beginning and ending Financial Statement Net Asset Value as shown above, which may differ from the traded Net Asset Value, due to rounding. |
| 5 | See Note 6 to Financial Statements. |
The accompanying notes are an integral part of the financial statements.
| Meridian Funds | 63 | www.meridianfund.com |
Meridian Enhanced Equity Fund
Financial Highlights
| | For the Fiscal Year Ended June 30, |
| Class C | 2022 | 2021 | 2020 | 2019 | 2018 |
| Per Share Operating Performance |
Net asset value, beginning of year
| $ 17.13 | $ 14.76 | $ 18.17 | $ 18.44 | $ 13.47 |
| Income (loss) from investment operations: | | | | | |
Net investment loss1
| (0.15) | (0.17) | (0.11) | (0.27) | (0.09) |
Net realized and unrealized gain (loss)
| (1.65) | 4.68 | 2.58 | 1.55 | 5.14 |
Net increase (decrease) from investment operations
| (1.80) | 4.51 | 2.47 | 1.28 | 5.05 |
| Less distributions to shareholders: | | | | | |
Distributions from net investment income
| 0.00 | 0.00 | 0.00 | 0.00 | (0.08) |
Distributions from net realized capital gains
| (3.76) | (2.14) | (5.88) | (1.55) | 0.00 |
Total distributions to shareholders
| (3.76) | (2.14) | (5.88) | (1.55) | (0.08) |
Redemption fees
| 0.00 | 0.00 | 0.00 | 0.00 | 0.00 2 |
Net asset value, end of year
| $ 11.57 | $ 17.13 | $ 14.76 | $ 18.17 | $ 18.44 |
Total return3
| (14.23)% | 32.27% | 15.08% | 10.31% | 37.61% |
| |
| Ratios to Average Net Assets |
Ratio of net investment loss to average net assets
| (1.05)% | (1.05)% | (0.77)% | (1.60)% | (0.55)% |
| Ratio of expenses to average net assets: | | | | | |
Total expenses
| 2.17% | 2.20% | 2.25% | 2.35% | 2.24% |
Before fees waived and Excluding recoupment of past waived fees
| 2.17% | 2.20% | 2.25% | 2.32% | 2.25% |
After fees waived and excluding recoupment of past waived fees4
| 2.00% | 2.00% | 2.02% | 2.32% | 2.24% |
After fees waived and excluding recoupment of past waived fees and interest and dividend expenses
| 2.00% | 2.00% | 2.00% | 1.97% | 2.00% |
| |
| Supplemental Data |
Net Assets, End of Year (000's)
| $ 58 | $ 10 | $ 30 | $ 2 | $ 2 |
Portfolio Turnover Rate
| 74% | 96% | 140% | 47% | 49% |
| | |
| 1 | Per share net investment income (loss) has been calculated using the average daily shares method. |
| 2 | Less than $0.005 per share. |
| 3 | Excludes the effects of any sales charges. |
| 4 | See Note 6 to Financial Statements. |
The accompanying notes are an integral part of the financial statements.
| Meridian Funds | 64 | www.meridianfund.com |
Meridian Enhanced Equity Fund
Financial Highlights
| | For the Fiscal Year Ended June 30, |
| Investor Class | 2022 | 2021 | 2020 | 2019 | 2018 |
| Per Share Operating Performance |
Net asset value, beginning of year
| $ 17.76 | $ 15.12 | $ 18.40 | $ 18.61 | $ 13.60 |
| Income (loss) from investment operations: | | | | | |
Net investment income (loss)1
| (0.04) | (0.04) | (0.03) | (0.18) | 0.09 |
Net realized and unrealized gain (loss)
| (1.74) | 4.81 | 2.62 | 1.60 | 5.10 |
Net increase (decrease) from investment operations
| (1.78) | 4.77 | 2.59 | 1.42 | 5.19 |
| Less distributions to shareholders: | | | | | |
Distributions from net investment income
| 0.00 | 0.00 | 0.00 | (0.08) | (0.18) |
Distributions from net realized capital gains
| (3.76) | (2.14) | (5.88) | (1.55) | 0.00 |
Total distributions to shareholders
| (3.76) | (2.14) | (5.88) | (1.63) | (0.18) |
Redemption fees
| 0.00 | 0.01 | 0.01 | 0.00 2 | 0.00 2 |
Net asset value, end of year
| $ 12.22 | $ 17.76 | $ 15.12 | $ 18.40 | $ 18.61 |
Total return
| (13.55)% | 33.37% | 15.65% | 11.22% 3 | 38.34% |
| |
| Ratios to Average Net Assets |
Ratio of net investment income (loss) to average net assets
| (0.27)% | (0.26)% | (0.17)% | (1.05)% | 0.58% |
| Ratio of expenses to average net assets: | | | | | |
Total expenses
| 1.19% | 1.20% | 1.35% | 1.70% | 1.59% |
Excluding recoupment of past waived fees
| 1.19% | 1.20% | 1.35% | 1.70% | 1.47% |
Excluding recoupment of past waived fees and interest and dividend expenses
| 1.19% | 1.20% | 1.34% | 1.22% | 1.24% |
| |
| Supplemental Data |
Net Assets, End of Year (000's)
| $ 2,031 | $ 1,957 | $ 1,681 | $ 1,014 | $ 1,060 |
Portfolio Turnover Rate
| 74% | 96% | 140% | 47% | 49% |
| | |
| 1 | Per share net investment income (loss) has been calculated using the average daily shares method. |
| 2 | Less than $0.005 per share. |
| 3 | The total return is based on beginning and ending Financial Statement Net Asset Value as shown above, which may differ from the traded Net Asset Value, due to rounding. |
The accompanying notes are an integral part of the financial statements.
| Meridian Funds | 65 | www.meridianfund.com |
Meridian Small Cap Growth Fund
Financial Highlights
| | For the Fiscal Year Ended June 30, |
| Legacy Class | 2022 | 2021 | 2020 | 2019 | 2018 |
| Per Share Operating Performance |
Net asset value, beginning of year
| $ 23.30 | $ 14.71 | $ 15.74 | $ 18.03 | $ 15.07 |
| Income (loss) from investment operations: | | | | | |
Net investment loss1
| (0.16) | (0.15) | (0.06) | (0.07) | (0.09) |
Net realized and unrealized gain (loss)
| (5.96) | 9.13 | (0.04) | (0.44) | 3.72 |
Net increase (decrease) from investment operations
| (6.12) | 8.98 | (0.10) | (0.51) | 3.63 |
| Less distributions to shareholders: | | | | | |
Distributions from net realized capital gains
| (5.36) | (0.39) | (0.93) | (1.78) | (0.67) |
Total distributions to shareholders
| (5.36) | (0.39) | (0.93) | (1.78) | (0.67) |
Redemption fees
| 0.00 | 0.00 | 0.00 2 | 0.00 2 | 0.00 2 |
Net asset value, end of year
| $ 11.82 | $ 23.30 | $ 14.71 | $ 15.74 | $ 18.03 |
Total return
| (32.39)% | 61.51% | (1.17)% | (1.49)% | 24.66% |
| |
| Ratios to Average Net Assets |
Ratio of net investment loss to average
net assets
| (0.88)% 3 | (0.75)% 3 | (0.42)% | (0.41)% | (0.55)% |
| Ratio of expenses to average net assets: | | | | | |
Total expenses
| 1.15% 3 | 1.12% 3 | 1.13% | 1.12% | 1.15% |
Excluding recoupment of past waived fees
| 1.15% 3 | 1.12% 3 | 1.13% | 1.12% | 1.13% |
| |
| Supplemental Data |
Net Assets, End of Year (000's)
| $ 30,519 | $ 41,481 | $ 27,080 | $ 41,637 | $ 54,856 |
Portfolio Turnover Rate
| 45% | 32% | 40% | 43% | 44% |
| | |
| 1 | Per share net investment loss has been calculated using the average daily shares method. |
| 2 | Less than $0.005 per share. |
| 3 | These ratios exclude the impact of expenses of the underlying private investment funds in which the Fund invests as represented in the Schedule of Investments. |
The accompanying notes are an integral part of the financial statements.
| Meridian Funds | 66 | www.meridianfund.com |
Meridian Small Cap Growth Fund
Financial Highlights
| | For the Fiscal Year Ended June 30, |
| Institutional Class | 2022 | 2021 | 2020 | 2019 | 2018 |
| Per Share Operating Performance |
Net asset value, beginning of year
| $ 23.44 | $ 14.79 | $ 15.81 | $ 18.09 | $ 15.11 |
| Income (loss) from investment operations: | | | | | |
Net investment loss1
| (0.15) | (0.14) | (0.06) | (0.07) | (0.08) |
Net realized and unrealized gain (loss)
| (6.01) | 9.18 | (0.04) | (0.43) | 3.73 |
Net increase (decrease) from investment operations
| (6.16) | 9.04 | (0.10) | (0.50) | 3.65 |
| Less distributions to shareholders: | | | | | |
Distributions from net realized capital gains
| (5.36) | (0.39) | (0.93) | (1.78) | (0.67) |
Total distributions to shareholders
| (5.36) | (0.39) | (0.93) | (1.78) | (0.67) |
Redemption fees
| 0.00 2 | 0.00 2 | 0.01 | 0.00 2 | 0.00 2 |
Net asset value, end of year
| $ 11.92 | $ 23.44 | $ 14.79 | $ 15.81 | $ 18.09 |
Total return
| (32.36)% | 61.59% | (1.09)% | (1.42)% | 24.73% |
| |
| Ratios to Average Net Assets |
Ratio of net investment loss to average
net assets
| (0.82)% 3 | (0.72)% 3 | (0.40)% | (0.41)% | (0.50)% |
| Ratio of expenses to average net assets: | | | | | |
Total expenses
| 1.09% 3 | 1.10% 3 | 1.10% | 1.10% | 1.10% |
Before fees waived and excluding recoupment of past waived fees
| 1.09% 3 | 1.09% 3 | 1.10% | 1.10% | 1.11% |
After fees waived and excluding recoupment of past waived fees 4
| 1.09% 3 | 1.09% 3 | 1.10% | 1.09% | 1.10% |
| |
| Supplemental Data |
Net Assets, End of Year (000's)
| $ 316,076 | $611,787 | $587,095 | $728,123 | $728,538 |
Portfolio Turnover Rate
| 45% | 32% | 40% | 43% | 44% |
| | |
| 1 | Per share net investment loss has been calculated using the average daily shares method. |
| 2 | Less than $0.005 per share. |
| 3 | These ratios exclude the impact of expenses of the underlying private investment funds in which the Fund invests as represented in the Schedule of Investments. |
| 4 | See Note 6 to Financial Statements. |
The accompanying notes are an integral part of the financial statements.
| Meridian Funds | 67 | www.meridianfund.com |
Meridian Small Cap Growth Fund
Financial Highlights
| | For the Fiscal Year Ended June 30, |
| Class A | 2022 | 2021 | 2020 | 2019 | 2018 |
| Per Share Operating Performance |
Net asset value, beginning of year
| $ 22.62 | $ 14.33 | $ 15.42 | $ 17.76 | $ 14.89 |
| Income (loss) from investment operations: | | | | | |
Net investment loss1
| (0.21) | (0.20) | (0.11) | (0.12) | (0.13) |
Net realized and unrealized gain (loss)
| (5.74) | 8.88 | (0.05) | (0.44) | 3.67 |
Net increase (decrease) from investment operations
| (5.95) | 8.68 | (0.16) | (0.56) | 3.54 |
| Less distributions to shareholders: | | | | | |
Distributions from net realized capital gains
| (5.36) | (0.39) | (0.93) | (1.78) | (0.67) |
Total distributions to shareholders
| (5.36) | (0.39) | (0.93) | (1.78) | (0.67) |
Redemption fees
| 0.00 2 | 0.00 | 0.00 2 | 0.00 2 | 0.00 2 |
Net asset value, end of year
| $ 11.31 | $ 22.62 | $ 14.33 | $ 15.42 | $ 17.76 |
Total return3
| (32.63)% | 61.05% | (1.59)% | (1.81)% 4 | 24.34% |
| |
| Ratios to Average Net Assets |
Ratio of net investment loss to average
net assets
| (1.22)% 5 | (1.10)% 5 | (0.80)% | (0.74)% | (0.82)% |
Ratio of expenses to average net assets
| 1.49% 5 | 1.48% 5 | 1.49% | 1.44% | 1.41% |
| |
| Supplemental Data |
Net Assets, End of Year (000's)
| $ 20,946 | $ 35,335 | $ 33,878 | $ 45,376 | $ 89,306 |
Portfolio Turnover Rate
| 45% | 32% | 40% | 43% | 44% |
| | |
| 1 | Per share net investment loss has been calculated using the average daily shares method. |
| 2 | Less than $0.005 per share. |
| 3 | Excludes the effects of any sales charges. |
| 4 | The total return is based on beginning and ending Financial Statement Net Asset Value as shown above, which may differ from the traded Net Asset Value, due to rounding. |
| 5 | These ratios exclude the impact of expenses of the underlying private investment funds in which the Fund invests as represented in the Schedule of Investments. |
The accompanying notes are an integral part of the financial statements.
| Meridian Funds | 68 | www.meridianfund.com |
Meridian Small Cap Growth Fund
Financial Highlights
| | For the Fiscal Year Ended June 30, |
| Class C | 2022 | 2021 | 2020 | 2019 | 2018 |
| Per Share Operating Performance |
Net asset value, beginning of year
| $ 21.68 | $ 13.84 | $ 15.02 | $ 17.46 | $ 14.76 |
| Income (loss) from investment operations: | | | | | |
Net investment loss1
| (0.31) | (0.32) | (0.21) | (0.24) | (0.25) |
Net realized and unrealized gain (loss)
| (5.42) | 8.55 | (0.04) | (0.42) | 3.62 |
Net increase (decrease) from investment operations
| (5.73) | 8.23 | (0.25) | (0.66) | 3.37 |
| Less distributions to shareholders: | | | | | |
Distributions from net realized capital gains
| (5.36) | (0.39) | (0.93) | (1.78) | (0.67) |
Total distributions to shareholders
| (5.36) | (0.39) | (0.93) | (1.78) | (0.67) |
Redemption fees
| 0.00 | 0.00 | 0.00 2 | 0.00 2 | 0.00 |
Net asset value, end of year
| $ 10.59 | $ 21.68 | $ 13.84 | $ 15.02 | $ 17.46 |
Total return3
| (33.10)% | 59.94% | (2.25)% | (2.45)% | 23.39% |
| |
| Ratios to Average Net Assets |
Ratio of net investment loss to average net assets
| (1.90)% 4 | (1.78)% 4 | (1.47)% | (1.45)% | (1.56)% |
Ratio of expenses to average net assets
| 2.17% 4 | 2.16% 4 | 2.18% | 2.16% | 2.15% |
| |
| Supplemental Data |
Net Assets, End of Year (000's)
| $ 4,241 | $ 8,324 | $ 6,922 | $ 13,255 | $ 31,174 |
Portfolio Turnover Rate
| 45% | 32% | 40% | 43% | 44% |
| | |
| 1 | Per share net investment loss has been calculated using the average daily shares method. |
| 2 | Less than $0.005 per share. |
| 3 | Excludes the effects of any sales charges. |
| 4 | These ratios exclude the impact of expenses of the underlying private investment funds in which the Fund invests as represented in the Schedule of Investments. |
The accompanying notes are an integral part of the financial statements.
| Meridian Funds | 69 | www.meridianfund.com |
Meridian Small Cap Growth Fund
Financial Highlights
| | For the Fiscal Year Ended June 30, |
| Investor Class | 2022 | 2021 | 2020 | 2019 | 2018 |
| Per Share Operating Performance |
Net asset value, beginning of year
| $ 23.17 | $ 14.63 | $ 15.70 | $ 17.99 | $ 15.05 |
| Income (loss) from investment operations: | | | | | |
Net investment loss1
| (0.17) | (0.15) | (0.09) | (0.09) | (0.09) |
Net realized and unrealized gain (loss)
| (5.92) | 9.08 | (0.05) | (0.42) | 3.70 |
Net increase (decrease) from investment operations
| (6.09) | 8.93 | (0.14) | (0.51) | 3.61 |
| Less distributions to shareholders: | | | | | |
Distributions from net realized capital gains
| (5.36) | (0.39) | (0.93) | (1.78) | (0.67) |
Total distributions to shareholders
| (5.36) | (0.39) | (0.93) | (1.78) | (0.67) |
Redemption fees
| 0.00 2 | 0.00 | 0.00 2 | 0.00 2 | 0.00 2 |
Net asset value, end of year
| $ 11.72 | $ 23.17 | $ 14.63 | $ 15.70 | $ 17.99 |
Total return
| (32.44)% | 61.51% | (1.43)% 3 | (1.50)% 3 | 24.56% |
| |
| Ratios to Average Net Assets |
Ratio of net investment loss to average net assets
| (0.94)% 4 | (0.80)% 4 | (0.59)% | (0.53)% | (0.57)% |
Ratio of expenses to average net assets
| 1.22% 4 | 1.17% 4 | 1.29% | 1.22% | 1.16% |
| |
| Supplemental Data |
Net Assets, End of Year (000's)
| $ 442,418 | $920,317 | $666,635 | $844,975 | $853,794 |
Portfolio Turnover Rate
| 45% | 32% | 40% | 43% | 44% |
| | |
| 1 | Per share net investment loss has been calculated using the average daily shares method. |
| 2 | Less than $0.005 per share. |
| 3 | The total return is based on beginning and ending Financial Statement Net Asset Value as shown above, which may differ from the traded Net Asset Value, due to rounding. |
| 4 | These ratios exclude the impact of expenses of the underlying private investment funds in which the Fund invests as represented in the Schedule of Investments. |
The accompanying notes are an integral part of the financial statements.
| Meridian Funds | 70 | www.meridianfund.com |
Meridian Fund, Inc.
Notes to Financial Statements
June 30, 2022
| 1. | Organization and Significant Accounting Policies: Meridian Fund, Inc. (the “Meridian Funds” or the “Company”) comprises the following separate series: the Meridian Growth Fund (the “Growth Fund”), the Meridian Contrarian Fund (the “Contrarian Fund”), the Meridian Enhanced Equity Fund (the “Enhanced Equity Fund”) (formerly Meridian Equity Income Fund), and the Meridian Small Cap Growth Fund (the “Small Cap Growth Fund”) (each a “Fund” and collectively, the “Funds”). The Company is registered as an open-end investment company under the Investment Company Act of 1940 and is organized as a Maryland corporation. Each Fund is classified as a "diversified" management investment company. |
| | Meridian Funds offer five share classes: Legacy Class Shares, Investor Class Shares, Class A Shares, Class C Shares and Institutional Class Shares. Prior to July 1, 2015, Class A Shares were known as Advisor Class Shares. As of June 30, 2022, Institutional Class Shares of the Enhanced Equity Fund and Contrarian Fund are not currently being offered for sale. Effective June 15, 2017, Investor Class, Class A, and Class C Shares of the Growth Fund are closed to new investors. Effective June 29, 2018, Investor Class, Class A, and Class C Shares of the Small Cap Growth Fund are closed to new investors. Legacy Class Shares are available to investors who have continuously held an investment in any Meridian Fund prior to November 15, 2013. Effective November 1, 2018, direct initial purchases of Legacy Class Shares are permitted in the Enhanced Equity Fund. Institutional Class Shares are available to certain eligible investors including endowments, foundations and qualified retirement plans. Class A, Class C and Investor Class Shares are available for purchase through financial intermediary platforms. Legacy Class, Investor Class, Class A and Institutional Class Shares are subject to a 2% redemption fee on shares redeemed or exchanged that have been held for 60 days or less. The redemption fees are collected and retained by the Fund for the benefit of the remaining shareholders. The redemption fees are recorded as a credit to paid-in capital. Class A Shares are subject to a maximum initial sales charge (front-end load) of 5.75%. Class C Shares are subject to a 1.00% contingent deferred sales charge ("CDSC") if redeemed within one year of purchase. Investor Class Shares are not subject to front-end load or CDSC and require a higher minimum initial investment. All Classes have identical rights and privileges with respect to the Fund in general, and exclusive voting rights with respect to Class specific matters. Net Asset Value ("NAV") per share may differ by class due to each class having its own expenses directly attributable to that class. Investor Class, Class A and Class C Shares are subject to sub-transfer agent fees. Class A and Class C Shares are also subject to certain expenses related to the distribution of these shares. See Note 6 for further information on additional share classes. |
| | The primary investment objectives of the Growth Fund, Contrarian Fund, and Enhanced Equity Fund are to seek long-term growth of capital. |
| | The primary investment objective of the Small Cap Growth Fund is to seek long-term growth of capital by investing primarily in equity securities of small capitalization companies. |
| | The following significant accounting policies are consistently followed by the Funds in the preparation of their financial statements in conformity with U.S. GAAP. Each Fund is considered an investment company under U.S. GAAP and follows the accounting and reporting guidance in the Financial Accounting Standards Board (FASB) Accounting Standards Codification Topic 946, Financial Services - Investment Companies. |
| a. | Cash & Cash Equivalents: Each Fund considers its investment in a FDIC insured interest bearing account to be cash and cash equivalents. Cash and cash equivalents are valued at cost plus any accrued interest. The Funds maintain cash balances, which, at times may exceed federally insured limits. The Funds maintain these balances with a high quality financial institution. The Funds may incur charges on cash overdrafts. |
| b. | Share Valuation: The NAV of each Fund is calculated by dividing the sum of the value of the securities held by each Fund, plus cash or other assets, minus all liabilities (including estimated accrued expenses), by the total number of shares outstanding of each Fund. The result is rounded to the nearest cent. Each Fund’s shares will not be priced on the days in which the New York Stock Exchange ("NYSE") is closed for trading. |
| c. | Investment Valuations: Equity securities are valued at the closing price or last sales price on the principal exchange or market on which they are traded; or, if there were no sales that day, at the last reported bid price. |
| | Fixed income (debt) securities are valued on the basis of last available bid prices or current market quotations provided by dealers or pricing services. In determining the value of a particular investment, pricing services may |
| Meridian Funds | 71 | www.meridianfund.com |
Meridian Fund, Inc.
Notes to Financial Statements (continued)
June 30, 2022
| | use certain information with respect to transactions in such investments, quotations from dealers, pricing matrixes, market transactions in comparable investments, various relationships observed in the market between investments and calculated yield measures. |
| | Investments in open-end U.S. mutual funds are valued at NAV each business day. |
| | The market value of the Funds' investments in exchange traded funds is based on the published NAV of each fund computed as of the close of regular trading on the NYSE on days when the NYSE is open. |
| | Exchange-traded options are valued at the most recent sale price at the close of the options market in which the options trade. An exchange-traded option for which there is no close price is valued at the last bid (long positions) or ask (short positions) price. If no bid or ask price is available, the prior day’s price will be used, unless it is determined that the prior day’s price no longer reflects the fair value of the option. |
| | Securities and other assets for which reliable market quotations are not readily available or for which a significant event has occurred since the time of the most recent market quotation, will be valued based upon other available factors deemed relevant by ArrowMark Colorado Holdings, LLC (the “Adviser”) under the guidelines established by, and under the general supervision and responsibility of, the Funds’ Board of Directors (the “Board”). These factors include but are not limited to (i) attributes specific to the investment; (ii) the principal market for the investment; (iii) the customary participants in the principal market for the investment; (iv) data assumptions by market participants for the investment, if reasonably available; (v) quoted prices for similar investments in active markets; and (vi) other factors, such as future cash flows, interest rates, yield curves, volatilities, prepayment speeds, loss severities, credit risks and/or default rates. Valuations based on such factors are reported to the Board on a quarterly basis. |
| | The Funds' investment in an unregistered pooled investment vehicle (“Private Investment Fund”) is valued, as a practical expedient, at the most recent net asset value determined by the Private Investment Fund manager according to such manager’s policies and procedures based on valuation information reasonably available to the Private Investment Fund manager at that time; provided, however, that the Valuation Committee may consider whether it is appropriate, in light of relevant circumstances, to adjust such valuation in accordance with the Fund’s valuation procedures. If the Private Investment Fund does not report a value to the Fund on a timely basis, the fair value of the Private Investment Fund shall be based on the most recent value reported by the Private Investment Fund, as well as any other relevant information available at the time the Fund values its portfolio. The frequency and timing of receiving valuations for the Private Investment Fund investment is subject to change at any time, without notice to investors, at the discretion of the Private Investment Fund manager or the Fund. |
| d. | Fair Value Measurements: As described in Note 1.c. above, the Funds utilize various methods to determine and measure the fair value of investment securities on a recurring basis. The objective of a fair value measurement is to determine the price that would be received to sell an asset or paid to transfer a liability in an orderly transaction between market participants at the measurement date (an exit price). Accordingly, the fair value hierarchy gives the highest priority to quoted prices (unadjusted) in active markets for identical assets or liabilities (Level 1) and the lowest priority to unobservable inputs (Level 3) that are significant to the fair value instrument. The three levels of the fair value hierarchy are described below: |
| | Level 1 - quoted prices in active markets for identical securities; |
| | Level 2 - other significant observable inputs (including quoted prices for similar securities, interest rates, prepayment speeds, credit risk, etc.); and |
| | Level 3 - significant unobservable inputs (including the Funds' determinations as to the fair value of investments). |
| | The inputs or methodology used for valuing securities are not necessarily an indication of the risks associated with investing in those securities. The summary of inputs used to value the Funds’ securities as of June 30, 2022 is as follows: |
| | |
| Meridian Funds | 72 | www.meridianfund.com |
Meridian Fund, Inc.
Notes to Financial Statements (continued)
June 30, 2022
| | Level 1 | | Level 2 | | Level 3 | | Practical Expedient1 | | Total |
| Growth Fund |
| | | | | | | | | | |
Common Stocks2
| $ 1,353,926,570 | | $ 5,206,026 | | — | | — | | $ 1,359,132,596 |
Preferred Stocks2
| — | | — | | $ 39,816,290 | | — | | 39,816,290 |
Private Investment Fund
| — | | — | | — | | $ 3,867,766 | | 3,867,766 |
Short-Term Investments
| 18,759,000 | | 65,918,434 | | — | | — | | 84,677,434 |
Total Investments
| $ 1,372,685,570 | | $ 71,124,460 | | $ 39,816,290 | | $ 3,867,766 | | $ 1,487,494,086 |
| Contrarian Fund |
| | | | | | | | | | |
Common Stocks2
| $ 515,923,574 | | — | | — | | — | | $ 515,923,574 |
Warrants2
| 77,400 | | — | | — | | — | | 77,400 |
Preferred Stocks2
| — | | — | | $ 2,003,198 | | — | | 2,003,198 |
Short-Term Investments
| 4,468,000 | | $ 17,364,610 | | — | | — | | 21,832,610 |
Total Investments
| $ 520,468,974 | | $ 17,364,610 | | $ 2,003,198 | | — | | $ 539,836,782 |
| Enhanced Equity Fund |
| Assets: | | | | | | | | | |
Common Stocks2
| $ 61,201,038 | | $ 686,668 | | — | | — | | $ 61,887,706 |
Warrants
| 3,956 | | 786 | | — | | — | | 4,742 |
Short-Term Investments
| — | | 445,212 | | — | | — | | 445,212 |
Total Investments - Assets
| $ 61,204,994 | | $ 1,132,666 | | — | | — | | $ 62,337,660 |
| Liabilities: | | | | | | | | | |
Call Options Written
| $ (1,428,761) | | $ (10,255,940) | | — | | — | | $ (11,684,701) |
Total Investments - Liabilities
| $ (1,428,761) | | $ (10,255,940) | | — | | — | | $ (11,684,701) |
| Small Cap Growth Fund |
| | | | | | | | | | |
Common Stocks2
| $ 703,157,082 | | $ 12,743,883 | | $ 512,494 | | — | | $ 716,413,459 |
Warrants2
| — | | — | | 195,424 | | — | | 195,424 |
Preferred Stocks2
| — | | — | | 41,558,128 | | — | | 41,558,128 |
Private Investment Fund
| — | | — | | — | | $ 2,794,773 | | 2,794,773 |
Short-Term Investments
| 15,301,000 | | 57,363,481 | | — | | — | | 72,664,481 |
Total Investments
| $ 718,458,082 | | $ 70,107,364 | | $ 42,266,046 | | $ 2,794,773 | | $ 833,626,265 |
| Meridian Funds | 73 | www.meridianfund.com |
Meridian Fund, Inc.
Notes to Financial Statements (continued)
June 30, 2022
| 1 | Certain investments that are measured at fair value using the NAV Per Share (or its equivalent) practical expedient have not been categorized in the fair value hierarchy. The fair value amounts presented in this table are intended to permit reconciliation of the fair value hierarchy to the amounts presented in the Schedule of Investments. |
| 2 | See above Schedule of Investments for values in each industry. |
The following is the fair value measurement of investments that are measured at NAV per Share (or its equivalent) as a practical expedient:
| Growth Fund |
| Security Description | | Investment
Category | | Value | | Unfunded
Commitments | | Redemption
Frequency | | Redemption
Notice Period |
Quail Investment
Holdings, LLC | | Private Investment Fund1 | | $ 3,867,766 | | — | | Subject to
advisor
approval | | N/A |
| | | | | | | | | | | |
| Small Cap Growth Fund |
| Security Description | | Investment
Category | | Value | | Unfunded
Commitments | | Redemption
Frequency | | Redemption
Notice Period |
Quail Investment
Holdings, LLC | | Private Investment Fund1 | | $ 2,794,773 | | — | | Subject to
advisor
approval | | N/A |
| 1 | Private Investment Fund investing generally consists of private partnerships which directly invest in various strategies to generate capital appreciation and/or income yield. These strategies may span across the capital stock and may include Private Equity, Private Credit, Venture Capital, Collateralized Loan Obligations, Asset-Backed Securities, Master Limited Partners and Direct Real Estate. |
Reconciliations of Level 3 investments are presented when the Funds had significant amounts of Level 3 investments at the beginning and/or end of the period in relation to net assets. The following tables are reconciliations of Level 3 investments for which significant unobservable inputs were used in determining fair value:
| Growth Fund | Preferred
Stocks | | Total Level 3 |
| Investments in Securities | | | |
Beginning Balance 07/01/21
| 56,034,920 | | 56,034,920 |
Total Purchases
| 7,164,990 | | 7,164,990 |
Transfers out1
| (11,754,950) | | (11,754,950) |
Change in unrealized Gain (Loss)
| (11,628,670) | | (11,628,670) |
Ending Balance 06/30/22
| $ 39,816,290 | | $ 39,816,290 |
Change in unrealized Gain (Loss) on investments still held at 06/30/22
| $ (5,553,007) | | $ (5,553,007) |
| | |
| 1 | During the year ended June 30, 2022, certain investments were transferred into or out of Level 3 in the fair value hierarchy as a result of an initial public offering or as a result of being valued at the time of purchase utilizing significant unobservable inputs and valued utilizing observable inputs at the end of the year. Investments transferred out of Level 3 as a result of an initial public offering were transferred out at fair value prior to the initial public offering, and therefore unrealized gains and losses are not reflective within. |
| Meridian Funds | 74 | www.meridianfund.com |
Meridian Fund, Inc.
Notes to Financial Statements (continued)
June 30, 2022
| Contrarian Fund | Preferred
Stocks | | Total Level 3 |
| Investments in Securities | | | |
Beginning Balance 07/01/21
| — | | — |
Total Purchases
| 3,000,000 | | 3,000,000 |
Transfers out
| — | | — |
Change in unrealized Gain (Loss)
| (996,802) | | (996,802) |
Ending Balance 06/30/22
| $ 2,003,198 | | $ 2,003,198 |
Change in unrealized Gain (Loss) on investments still held at 06/30/22
| $ (996,802) | | $ (996,802) |
| Small Cap Growth Fund | Common
Stocks | | Preferred
Stocks | | Warrants | | Convertible
Corporate
Bonds | | Total Level 3 |
| Investments in Securities | | | | | | | | | |
Beginning Balance 07/01/21
| 5,195 | | 58,948,566 | | — | | 1,312,500 | | 60,266,261 |
Total Purchases
| — | | 14,576,696 | | 239,997 | | — | | 14,816,693 |
Transfers in1
| 511,455 | | — | | — | | — | | 511,455 |
Transfers out1
| — | | (16,244,977) | | — | | (1,312,500) | | (17,557,477) |
Change in unrealized Gain (Loss)
| (4,156) | | (15,722,157) | | (44,573) | | — | | (15,770,886) |
Ending Balance 06/30/22
| $ 512,494 | | $ 41,558,128 | | $ 195,424 | | $ — | | $ 42,266,046 |
Change in unrealized Gain (Loss) on investments still held at 06/30/22
| $ (4,156) | | $ (9,622,759) | | $ (44,573) | | $ — | | $ (9,671,488) |
| | |
| 1 | During the year ended June 30, 2022, certain investments were transferred into or out of Level 3 in the fair value hierarchy as a result of an initial public offering or as a result of being valued at the time of purchase utilizing significant unobservable inputs and valued utilizing observable inputs at the end of the year. Investments transferred out of Level 3 as a result of an initial public offering were transferred out at fair value prior to the initial public offering, and therefore unrealized gains and losses are not reflective within. |
In accordance with GAAP, the following table provides quantitative information about significant unobservable inputs used to determine the fair valuations of the Funds' Level 3 assets, by class of financial instrument; it also indicates the sensitivity of the Level 3 valuations to changes in those significant unobservable inputs. Because the Valuation Committee considers a wide variety of factors and inputs, both observable and unobservable, in determining fair values, the unobservable inputs presented do not reflect all inputs significant to the fair value determination.
| Growth Fund |
| Asset Class | Market Value | Valuation Technique | Unobservable Input | Value/Range
(Weighted Average)1,2 |
| Preferred Stocks | $ 5,127,838 | Option Pricing Method | Industry Volatility,
Time to Exit | 65%, 36 months |
| | | Market Approach | Revenue Multiple | 3.17x to 3.83x |
| Preferred Stocks | $13,434,405 | Option Pricing Method | Industry Volatility,
Time to Exit | 50%-100%, 24-36 months
(73.3%, 30.4 months) |
| | | Fully Diluted Method | Enterprise Value Adjustment | -5% - -30% (-16.7%) |
| Preferred Stocks | $21,254,047 | Market Approach | Revenue Multiple | 2.40x to 12.75x (5.37x) |
| Meridian Funds | 75 | www.meridianfund.com |
Meridian Fund, Inc.
Notes to Financial Statements (continued)
June 30, 2022
| Contrarian Fund |
| Asset Class | Market Value | Valuation Technique | Unobservable Input | Value/Range
(Weighted Average)1,2 |
| Preferred Stocks | $2,003,198 | Market Approach | Revenue Multiple | 4.50x to 5.00x |
| Small Cap Growth Fund |
| Asset Class | Market Value | Valuation Technique | Unobservable Input | Value/Range
(Weighted Average)1,2 |
| Common Stocks | $ 1,039 | Option Pricing Method | Industry Volatility,
Time to Exit | 80%, 24 months |
| | | Fully Diluted Method | Enterprise Value Adjustment | -87.5% |
| Common Stocks | $ 511,455 | Market Approach | Discount for Lack of Marketability | 50% |
| Preferred Stocks | $ 3,662,741 | Option Pricing Method | Industry Volatility,
Time to Exit | 65%, 36 months |
| | | Market Approach | Revenue Multiple | 3.17x to 3.83x |
| Preferred Stocks | $21,120,678 | Option Pricing Method | Industry Volatility,
Time to Exit | 50%-100%, 24-36 months
(74.9%, 29.6 months) |
| | | Fully Diluted Method | Enterprise Value Adjustment | -5% - -87.5% (-20.6%) |
| Preferred Stocks | $13,774,704 | Market Approach | Revenue Multiple | 2.40x to 12.75x (5.72x) |
| Preferred Stocks | $ 3,000,005 | Cost | N/A | N/A |
| Warrants | $ 195,424 | Option Pricing Method | Industry Volatility,
Time to Exit | 80%, 24 months |
| | | Fully Diluted Method | Enterprise Value Adjustment | -20% |
| 1 | A significant change in an unobservable input would have resulted in a correlated significant change to value. |
| 2 | Unobservable inputs were weighted by the fair value of the investments. |
| Unobservable Input | Impact to Value if Input Increases | | Impact to Value if Input Decreases |
| Industry Volatility | Decrease | | Increase |
| Time to Exit | Decrease | | Increase |
| Revenue Multiple | Increase | | Decrease |
Enterprise Value
Adjustment | Increase | | Decrease |
| e. | Investment Transactions and Investment Income: Security transactions are accounted for on the date the securities are purchased or sold (trade date). Realized gains and losses on security transactions are determined on the basis of specific identification for both financial statement and federal income tax purposes. Dividend income is recorded on the ex-dividend date. Under the applicable foreign tax laws, a withholding tax at various rates may be imposed on capital gains, dividends and interest. Interest income, including amortization and accretion of premiums and discounts on debt securities, is accrued daily. Discounts and premiums on securities purchased are accreted and amortized over the lives of the respective securities using the effective interest method. Upon |
| Meridian Funds | 76 | www.meridianfund.com |
Meridian Fund, Inc.
Notes to Financial Statements (continued)
June 30, 2022
| | notification from issuers, a portion of the dividend income received from a real estate investment trust may be redesignated as a reduction of cost of the related investment and/or realized gain. Distributions from Private Investment Funds that represent returns of capital in excess of cumulative profits and losses are credited to investment cost rather than income. |
| f. | Option writing: When the Fund writes an option, an amount equal to the premium received by the Fund is recorded as a liability and subsequently adjusted to the current fair value of the option written. Premiums received from writing options that expire unexercised are treated by the Fund on the expiration date as realized gains from investments. The difference between the premium and amount paid on effecting a closing purchase transaction, including brokerage commissions, is also treated as a realized gain or, if the premium is less than the amount paid for the closing purchase transaction, as a realized loss. If a call option is exercised, the premium is added to the proceeds from the sale of the underlying security or currency in determining whether the Fund has realized a gain or loss. If a put option is exercised, the premium reduces the cost basis of the securities purchased by the Fund. The Fund as writer of an option bears the market risk of an unfavorable change in the price of the security underlying the written option. |
| g. | Allocation of Income, Expenses, Gains and Losses: Income, gains and losses are allocated on a daily basis to each share class based on the relative proportion of the net assets of the class to each Fund’s total net assets. Expenses are allocated on the basis of relative net assets of the class to the Fund, or if an expense is specific to a share class, to that specific share class. |
| h. | Use of Estimates: The preparation of financial statements in accordance with U.S. GAAP requires management to make estimates and assumptions that affect the reported amount of assets and liabilities and disclosure of contingent assets and liabilities at the date of the financial statements and the reported amounts of increases and decreases in net assets from operations during the reporting period. Actual amounts could differ from those estimates, and such differences could be significant. |
| i. | Distributions to Shareholders: The Funds record distributions to shareholders on the ex-dividend date. The amount of distributions from net investment income and net realized capital gains are determined in accordance with federal income tax regulations which may differ from U.S. GAAP. These “book/tax” differences are either considered temporary or permanent in nature. To the extent these differences are permanent in nature, such amounts are reclassified within the capital accounts based on their federal tax-basis treatment; temporary differences do not require reclassification. |
| | Distributions which exceed net investment income and net realized capital gains are reported as distributions in excess of net investment income or distributions in excess of net realized capital gains for financial reporting purposes but not for tax purposes. To the extent they exceed net investment income and net realized capital gains for tax purposes, they are reported as distributions of paid-in capital. |
| j. | Guarantees and Indemnification: Under the Funds’ organizational documents, its Officers and Directors are indemnified against certain liability arising out of the performance of their duties to the Funds. Additionally, in the normal course of business, the Funds enter into contracts with service providers that contain general indemnification clauses, subject to applicable law. The Funds’ maximum exposure under these arrangements is unknown, as this would involve future claims that may be made against the Funds that have not yet occurred. However, based on experience, the Funds expect the risk of loss to be remote. |
| Meridian Funds | 77 | www.meridianfund.com |
Meridian Fund, Inc.
Notes to Financial Statements (continued)
June 30, 2022
| 2. | Capital Shares Transactions: Transactions in capital shares were as follows: |
| | Year Ended
June 30, 2022 | | Year Ended
June 30, 2021 |
| | | Shares | Amount | | | Shares | Amount |
| Growth Fund: |
| Legacy Class |
Shares sold
| | 376,528 | $ 17,604,094 | | | 428,659 | $ 20,634,848 |
Shares issued from reinvestment of distributions
| | 3,999,593 | 188,260,840 | | | 244,157 | 11,597,439 |
Redemption fees
| | — | 7,506 | | | — | 25,465 |
Shares redeemed
| | (3,118,389) | (145,976,450) | | | (4,121,565) | (185,922,502) |
Net increase/(decrease)
| | 1,257,732 | $ 59,895,990 | | | (3,448,749) | $(153,664,750) |
| Institutional Class |
Shares sold
| | 1,411,780 | $ 67,045,357 | | | 3,509,616 | $ 168,866,561 |
Shares issued from reinvestment of distributions
| | 1,724,945 | 81,193,187 | | | 98,320 | 4,669,236 |
Redemption fees
| | — | 3,924 | | | — | 11,522 |
Shares redeemed
| | (2,610,282) | (127,768,533) | | | (4,404,282) | (201,376,494) |
Net increase/(decrease)
| | 526,443 | $ 20,473,935 | | | (796,346) | $ (27,829,175) |
| Class A |
Shares sold
| | 16,732 | $ 732,217 | | | 6,137 | $ 305,778 |
Shares issued from reinvestment of distributions
| | 18,085 | 807,835 | | | 1,081 | 49,230 |
Redemption fees
| | — | — | | | — | 160 |
Shares redeemed
| | (19,194) | (870,049) | | | (30,742) | (1,290,397) |
Net increase/(decrease)
| | 15,623 | $ 670,003 | | | (23,524) | $ (935,229) |
| Class C |
Shares sold
| | 1,175 | $ 51,609 | | | 715 | $ 30,200 |
Shares issued from reinvestment of distributions
| | 8,830 | 378,203 | | | 569 | 25,185 |
Shares redeemed
| | (18,901) | (777,428) | | | (10,045) | (417,337) |
Net decrease
| | (8,896) | $ (347,616) | | | (8,761) | $ (361,952) |
| Investor Class |
Shares sold
| | 100,783 | $ 4,870,691 | | | 1,053,556 | $ 44,340,843 |
Shares issued from reinvestment of distributions
| | 154,977 | 7,192,465 | | | 68,924 | 3,237,366 |
Redemption fees
| | — | — | | | — | 304 |
Shares redeemed
| | (174,656) | (8,446,740) | | | (7,896,526) | (402,522,680) |
Net increase/(decrease)
| | 81,104 | $ 3,616,416 | | | (6,774,046) | $(354,944,167) |
| Meridian Funds | 78 | www.meridianfund.com |
Meridian Fund, Inc.
Notes to Financial Statements (continued)
June 30, 2022
| | Year Ended
June 30, 2022 | | Year Ended
June 30, 2021 |
| | | Shares | Amount | | | Shares | Amount |
| Contrarian Fund: |
| Legacy Class |
Shares sold
| | 62,549 | $ 2,791,832 | | | 74,298 | $ 3,333,191 |
Shares issued from reinvestment of distributions
| | 2,008,272 | 88,986,567 | | | 706,046 | 28,700,767 |
Redemption fees
| | — | — | | | — | 10,603 |
Shares redeemed
| | (1,171,501) | (52,934,540) | | | (1,513,844) | (59,692,315) |
Net increase/(decrease)
| | 899,320 | $ 38,843,859 | | | (733,500) | $(27,647,754) |
| Class A |
Shares sold
| | 14,694 | $ 672,955 | | | 30,492 | $ 1,435,842 |
Shares issued from reinvestment of distributions
| | 4,643 | 199,023 | | | 995 | 39,410 |
Redemption fees
| | — | 1,095 | | | — | 1 |
Shares redeemed
| | (30,283) | (1,392,479) | | | (15,270) | (590,916) |
Net increase/(decrease)
| | (10,946) | $ (519,406) | | | 16,217 | $ 884,337 |
| Class C |
Shares sold
| | 9,296 | $ 387,157 | | | 2,273 | $ 92,016 |
Shares issued from reinvestment of distributions
| | 1,216 | 50,087 | | | 182 | 7,026 |
Redemption fees
| | — | 116 | | | — | — |
Shares redeemed
| | (2,573) | (100,710) | | | — | — |
Net increase
| | 7,939 | $ 336,650 | | | 2,455 | $ 99,042 |
| Investor Class |
Shares sold
| | 421,484 | $ 18,744,946 | | | 68,648 | $ 3,281,268 |
Shares issued from reinvestment of distributions
| | 26,887 | 1,178,997 | | | 2,574 | 103,740 |
Redemption fees
| | — | 2 | | | — | 160 |
Shares redeemed
| | (253,768) | (10,748,146) | | | (18,596) | (754,237) |
Net increase
| | 194,603 | $ 9,175,799 | | | 52,626 | $ 2,630,931 |
| Meridian Funds | 79 | www.meridianfund.com |
Meridian Fund, Inc.
Notes to Financial Statements (continued)
June 30, 2022
| | Year Ended
June 30, 2022 | | Year Ended
June 30, 2021 |
| | | Shares | Amount | | | Shares | Amount |
| Enhanced Equity Fund: |
| Legacy Class |
Shares sold
| | 76,893 | $ 1,076,328 | | | 62,350 | $ 1,047,325 |
Shares issued from reinvestment of distributions
| | 784,030 | 11,540,921 | | | 414,399 | 6,584,808 |
Shares redeemed
| | (459,820) | (7,173,300) | | | (262,029) | (4,327,423) |
Net increase
| | 401,103 | $ 5,443,949 | | | 214,720 | $ 3,304,710 |
| Class A |
Shares sold
| | 32,512 | $ 482,565 | | | 47,241 | $ 791,640 |
Shares issued from reinvestment of distributions
| | 32,033 | 459,994 | | | 15,741 | 246,032 |
Redemption fees
| | — | 6 | | | — | 21 |
Shares redeemed
| | (31,205) | (433,907) | | | (60,058) | (988,668) |
Net increase
| | 33,340 | $ 508,658 | | | 2,924 | $ 49,025 |
| Class C |
Shares sold
| | 3,905 | $ 60,000 | | | 310 | $ 5,000 |
Shares issued from reinvestment of distributions
| | 512 | 7,131 | | | 62 | 952 |
Shares redeemed
| | — | — | | | (1,779) | (28,175) |
Net increase/(decrease)
| | 4,417 | $ 67,131 | | | (1,407) | $ (22,223) |
| Investor Class |
Shares sold
| | 42,212 | $ 602,177 | | | 35,560 | $ 593,081 |
Shares issued from reinvestment of distributions
| | 28,161 | 413,128 | | | 16,321 | 258,366 |
Redemption fees
| | — | — | | | — | 867 |
Shares redeemed
| | (14,383) | (226,307) | | | (52,885) | (881,010) |
Net increase/(decrease)
| | 55,990 | $ 788,998 | | | (1,004) | $ (28,696) |
| Meridian Funds | 80 | www.meridianfund.com |
Meridian Fund, Inc.
Notes to Financial Statements (continued)
June 30, 2022
| | Year Ended
June 30, 2022 | | Year Ended
June 30, 2021 |
| | | Shares | Amount | | | Shares | Amount |
| Small Cap Growth Fund: |
| Legacy Class |
Shares sold
| | 1,409,663 | $ 20,770,888 | | | 432,151 | $ 8,977,034 |
Shares issued from reinvestment of distributions
| | 617,979 | 9,943,280 | | | 29,813 | 595,665 |
Shares redeemed
| | (1,225,338) | (18,139,957) | | | (523,472) | (8,977,143) |
Net increase/(decrease)
| | 802,304 | $ 12,574,211 | | | (61,508) | $ 595,556 |
| Institutional Class |
Shares sold
| | 4,912,859 | $ 85,327,364 | | | 5,281,775 | $ 103,935,707 |
Shares issued from reinvestment of distributions
| | 6,471,753 | 104,971,834 | | | 589,316 | 11,839,351 |
Redemption fees
| | — | 7,991 | | | — | 2,129 |
Shares redeemed
| | (10,967,666) | (217,700,221) | | | (19,474,051) | (371,565,411) |
Net increase/(decrease)
| | 416,946 | $ (27,393,032) | | | (13,602,960) | $(255,788,224) |
| Class A |
Shares sold
| | 619,539 | $ 9,981,434 | | | 326,559 | $ 6,549,450 |
Shares issued from reinvestment of distributions
| | 449,971 | 6,938,550 | | | 30,007 | 582,752 |
Redemption fees
| | — | 349 | | | — | — |
Shares redeemed
| | (779,912) | (12,135,572) | | | (1,157,908) | (20,795,244) |
Net increase/(decrease)
| | 289,598 | $ 4,784,761 | | | (801,342) | $ (13,663,042) |
| Class C |
Shares sold
| | 10,876 | $ 191,618 | | | 25,959 | $ 444,825 |
Shares issued from reinvestment of distributions
| | 127,851 | 1,852,562 | | | 8,708 | 162,666 |
Shares redeemed
| | (122,350) | (1,896,982) | | | (150,773) | (2,625,482) |
Net increase/(decrease)
| | 16,377 | $ 147,198 | | | (116,106) | $ (2,017,991) |
| Investor Class |
Shares sold
| | 10,511,544 | $ 158,875,532 | | | 5,470,724 | $ 103,925,394 |
Shares issued from reinvestment of distributions
| | 8,942,683 | 142,725,214 | | | 797,312 | 15,842,579 |
Redemption fees
| | — | 5,445 | | | — | — |
Shares redeemed
| | (21,426,502) | (393,835,285) | | | (12,103,324) | (238,907,164) |
Net decrease
| | (1,972,275) | $ (92,229,094) | | | (5,835,288) | $(119,139,191) |
| Meridian Funds | 81 | www.meridianfund.com |
Meridian Fund, Inc.
Notes to Financial Statements (continued)
June 30, 2022
| 3. | Investment Transactions: The cost of investments purchased and the proceeds from sales of investments, excluding short-term securities and U.S. government obligations, for the year ended June 30, 2022, were as follows: |
| | Purchases | | Proceeds from Sales |
Growth Fund
| $814,983,800 | | $957,342,112 |
Contrarian Fund
| $371,524,423 | | $448,531,770 |
Enhanced Equity Fund
| $ 60,128,303 | | $ 65,631,447 |
Small Cap Growth Fund
| $518,897,977 | | $937,468,958 |
| | | | |
| | | | |
| 4. | Other Investment Transactions |
| a. | Restricted Securities: Restricted securities for which quotations are not readily available are valued at fair value, as determined by the board of directors. Restricted securities issued by publicly traded companies are generally valued at a discount to similar publicly traded securities. Restricted securities issued by nonpublic entities may be valued by reference to comparable public entities or fundamental data relating to the issuer, or both. Depending on the relative significance of valuation inputs, these instruments may be classified in either level 2 or level 3 of the fair value hierarchy. Refer to the Schedules of Investments for information about restricted securities held as of June 30, 2022 for Growth, Contrarian, Enhanced Equity and Small Cap Growth Funds. |
| b. | Private Placement Securities: Privately issued securities are restricted securities that are offered in a private placement and are generally not registered with the SEC or any federal or state regulatory authority. Securities issued in a private placement are generally "restricted securities" as that term is defined under Rule 144 promulgated under the Securities Act of 1933, and may not be resold without registration with the Securities and Exchange Commission or the availability of an exemption therefrom. There is generally no public trading market for privately offered securities and it is generally not anticipated that a public trading market will develop. There are substantial restrictions on the transfer of privately offered securities. Such securities have limited liquidity that makes it difficult or impossible to sell. An investment in privately issued securities often requires a long-term investment horizon and it may be many years before an investor receives significant distributions from such investment. Due to the lack of public market for privately offered securities, it may be difficult to value the investment. |
| c. | Securities Lending: The Funds have entered into an agreement with The Bank of New York Mellon (the “Lending Agent”), dated September 23, 2015 (“Securities Lending Agreement”), to provide securities lending services to the Funds. Under this program, the proceeds (cash collateral) received from borrowers are used to invest in money market funds or joint repurchase agreements. Under the Securities Lending Agreement, the borrowers may pay the Funds negotiated lender fees and the Funds receive cash and/or securities as collateral in an amount equal to not less than 102% of the market value of loaned securities. The market value of the loaned securities is determined at the close of each business day of the Fund and any additional required collateral is delivered to the Fund, or excess collateral is returned by the Fund, on the next business day. The borrower pays fees at the Funds’ direction to the Lending Agent. Although the risk of lending is generally mitigated by the collateral, the Funds could experience a delay in recovering securities and a possible loss of income or value if the borrower fails to return them. Loans of securities are terminable at any time and the borrower, after notice, is required to return borrowed securities within the standard time period for settlement of securities transactions. |
| | The following table summarizes the securities received as collateral for securities lending: |
| | Collateral Type | | Coupon Range | | Maturity Date Range | | Market Value |
Growth Fund
| U.S. Government Obligations | | 0.00% - 4.63% | | 7/31/22 - 11/15/51 | | $69,045,876 |
Contrarian Fund
| U.S. Government Obligations | | 0.00% - 7.50% | | 7/14/22 - 11/15/51 | | 51,325,992 |
Enhanced Equity Fund
| U.S. Government Obligations | | 0.13% - 4.63% | | 1/15/23 - 5/15/51 | | 817,495 |
Small Cap Growth Fund
| U.S. Government Obligations | | 0.00% - 7.50% | | 7/14/22 - 11/15/51 | | 11,335,107 |
| Meridian Funds | 82 | www.meridianfund.com |
Meridian Fund, Inc.
Notes to Financial Statements (continued)
June 30, 2022
Income generated from securities lending is presented in the Statements of Operations. As of June 30, 2022, the total value of securities on loan for the Growth Fund, Contrarian Fund, Enhanced Equity Fund, and the Small Cap Growth Fund were $145,238,727, $70,980,100, $1,210,093 and $80,718,440, respectively. Securities on loan are footnoted in the Schedules of Investments. As of June 30, 2022, the total collateral value for the Growth Fund, Contrarian Fund, Enhanced Equity Fund, and the Small Cap Growth Fund were $153,723,310, $73,158,602, $1,262,707 and $83,999,588, respectively.
| d. | Repurchase Agreements and Joint Repurchase Agreements: The Funds may enter into repurchase agreements for temporary cash management purposes provided that the value of the underlying collateral, including accrued interest, will equal or exceed the value of the repurchase agreement during the term of the agreement. The underlying collateral for all repurchase agreements is held in safekeeping by the Funds' custodian or at the Federal Reserve Bank. If the seller defaults and the value of the collateral declines, or if bankruptcy proceedings commence with respect to the seller of the security, realization of the collateral by the Funds may be delayed or limited. |
| | Additionally, the Funds may enter into joint repurchase agreements for reinvestment of cash collateral on securities lending transactions under the securities lending program offered by the Lending Agent (the “Program”), provided that the value of the underlying collateral, including accrued interest will equal or exceed the value of the joint repurchase agreement during the term of the agreement. The Funds participate on a pro rata basis with other clients of the Lending Agent in its share of the underlying collateral under such joint repurchase agreements and in its share of proceeds from any repurchase or other disposition of the underlying collateral. The underlying collateral for joint repurchase agreements is held in safekeeping by the Funds’ custodian or at the Federal Reserve Bank. If the seller defaults and the value of the collateral declines, or if bankruptcy proceedings commence with respect to the seller of the security, realization of the collateral by the Funds may be delayed or limited. Pursuant to the Program, the Funds are indemnified for such losses by the Lending Agent. |
| | At June 30, 2022, the market value of repurchase agreements or joint repurchase agreements outstanding for the Growth Fund, Contrarian Fund, Enhanced Equity Fund, and the Small Cap Growth Fund were $65,918,434, $17,364,610, $445,212 and $57,363,481, respectively. |
| e. | Master Netting Arrangements: The Funds may enter into master netting agreements with their counterparties for the repurchase agreements, which provide the right, in the event of default (including bankruptcy or insolvency) for the non-defaulting party to liquidate the collateral and calculate net exposure to the defaulting party or request additional collateral. For financial reporting purposes, the Funds do not offset financial assets and financial liabilities that are subject to master netting agreements in the Statements of Assets and Liabilities. |
| Meridian Funds | 83 | www.meridianfund.com |
Meridian Fund, Inc.
Notes to Financial Statements (continued)
June 30, 2022
| | The following table is a summary of the Funds’ open repurchase agreements that are subject to a master netting arrangement as of June 30, 2022: |
| | Assets |
| | Gross Amounts
Presented in
Statements of
Assets and
Liabilities | | Collateral
Received | | Net
Amount |
Growth Fund
| | | | | |
Repurchase agreement
| $65,918,434 | | $(65,918,434) 1 | | $— |
Contrarian Fund
| | | | | |
Repurchase agreement
| $17,364,610 | | $(17,364,610) 1 | | $— |
Enhanced Equity Fund
| | | | | |
Repurchase agreement
| $ 445,212 | | $ (445,212)1 | | $— |
Small Cap Growth Fund
| | | | | |
Repurchase agreement
| $57,363,481 | | $(57,363,481) 1 | | $— |
| 1 | The amount of collateral presented is limited such that the net amount cannot be less than zero. Collateral received in excess of the market value of repurchase agreements is not presented in this table. |
| f. | Options: Certain Funds purchase and write call and put options to increase or decrease their exposure to underlying instruments (including equity risk, interest rate risk and/or commodity price risk) and/or, in the case of options written, to generate gains from options premiums. A call option gives the purchaser (holder) of the option the right (but not the obligation) to buy, and obligates the seller (writer) to sell (when the option is exercised) the underlying instrument at the exercise or strike price at any time or at a specified time during the option period. A put option gives the holder the right to sell and obligates the writer to buy the underlying instrument at the exercise or strike price at any time or at a specified time during the option period. When the Funds purchase (write) an option, an amount equal to the premium paid (received) by the Funds is reflected as an asset (liability). The amount of the asset (liability) is subsequently marked-to-market to reflect the current market value of the option purchased (written). When an instrument is purchased or sold through an exercise of an option, the related premium paid (or received) is added to (or deducted from) the basis of the instrument acquired or deducted from (or added to) the proceeds of the instrument sold. When an option expires (or the Funds enter into a closing transaction), the Funds realize a gain or loss on the option to the extent of the premiums received or paid (or gain or loss to the extent the cost of the closing transaction exceeds the premiums received or paid). When the Funds write a call option, such option is “covered,” meaning that the Funds hold the underlying instrument subject to being called by the option counterparty. When the Funds write a put option, such option is covered by cash in an amount sufficient to cover the obligation. |
| | In purchasing and writing options, the Funds bear the risk of an unfavorable change in the value of the underlying instrument or the risk that the Funds may not be able to enter into a closing transaction due to an illiquid market. Exercise of a written option could result in the Funds purchasing or selling a security when it otherwise would not, or at a price different from the current market value. |
| | Average quarterly balances of outstanding derivative financial instruments were as follows. |
| Contrarian Fund | |
| Options: | |
Average value of option contracts purchased
| $114,000 |
Average value of option contracts written
| $ 30,500 |
| Enhanced Equity Fund | |
| Options: | |
Average value of option contracts written
| $15,134,690 |
| Meridian Funds | 84 | www.meridianfund.com |
Meridian Fund, Inc.
Notes to Financial Statements (continued)
June 30, 2022
For the year ended June 30, 2022, the effect of equity option positions written can be found in the Statements of Operations under Realized and Unrealized Gain (Loss), Net realized gain on written options and Net change in unrealized depreciation on written options, and are included in Options written at value in the Statements of Assets and Liabilities. Equity options purchased are included in Investments, at value in the Statements of Assets and Liabilities. Realized and unrealized gain/loss of equity options purchased are included in Net realized gain on investments and foreign currency transactions and Net change in unrealized appreciation/(depreciation) on investments in the Statements of Operations. The change in unrealized appreciation (depreciation) on purchased options for the Contrarian Fund was $303,924. The realized gains (losses) on purchased options for the Contrarian Fund during the year ended June 30, 2022 was $(639,712).
| g. | Warrants: The Funds can invest in warrants and stock purchase rights of companies of any market capitalization. A warrant gives the Funds the right to buy stock, typically from the issuer. The warrant specifies the amount of underlying stock, the purchase (or "exercise") price, and the date the warrant expires. Certain warrants may permit, without legal obligation, net settlement for stock or cash. The Funds have no obligation to exercise the warrant and buy the stock. |
| h. | Short Sales: The Funds may enter into short sales. A short sale occurs when a fund sells a security it generally does not own (the security is borrowed), in anticipation of a decline in the security’s price. The initial amount of a short sale is recorded as a liability which is marked-to-market daily. Fluctuations in the value of the short liability are recorded as unrealized gains or losses. If a Fund shorts a security when also holding a long position in the security (a “short against the box”), as the security’s price declines, the short position increases in value, offsetting the long position’s decrease in value. The opposite effect occurs if the security’s price rises. A Fund realizes a gain or loss upon closing of the short sale (returning the security to the counterparty by way of purchase or delivery of a long position owned). Possible losses from short sales may be unlimited, whereas losses from security purchases cannot exceed the total amount invested. The Funds are liable to the buyer for any dividends payable on securities while those securities are in a short position. These dividends are an expense of the Funds. The Funds designate collateral consisting of cash, U.S. government securities or other liquid assets sufficient to collateralize the market value of short positions. |
| i. | Private Investment Funds: The Funds value private investment companies using the NAVs provided by the underlying private investment companies as a practical expedient. The Funds apply the practical expedient to private investment companies on an investment-by-investment basis, and consistently with each Fund’s entire position in a particular investment, unless it is probable that the Funds will sell a portion of an investment at an amount different from the NAV of the investment. Each of these investments has certain restrictions with respect to rights of withdrawal by the Funds as specified in the respective agreements. Generally, the Funds are required to provide notice of its intent to withdraw after the investment has been maintained for a certain period of time. |
| 5. | Risk |
| | In the normal course of business, each Fund's investment activities expose it to various types of risk associated with the financial instruments and markets in which it invests. The significant types of financial risks each Fund is exposed to include market risk, debt securities risk, options risk and private investment funds risk. Each Fund’s prospectus and statement of additional information provide details of these and other types of risk. |
| | Market Risk: Market risk refers to the possibility that the market values of securities or other investments that a Fund holds will fall, sometimes rapidly or unpredictably, or fail to rise. Security values may fall or fail to rise because of a variety of factors affecting (or the market’s perception of) individual companies or other issuers (e.g., an unfavorable earnings report), industries or sectors, or the market as a whole, reducing the value of an investment in a Fund. Accordingly, an investment in the Fund could lose money over short or even long periods. The market values of the securities the Fund holds also can be affected by changes (or perceived changes) in U.S. or foreign economies and financial markets, and the liquidity of these securities, among other factors. In general, equity securities tend to have greater price volatility than debt securities. In addition, stock prices may be sensitive to rising interest rates, as the cost of capital rises and borrowing costs increase. As a result, the value of your investments in a Fund may be more or less than the value of your purchase price. |
| Meridian Funds | 85 | www.meridianfund.com |
Meridian Fund, Inc.
Notes to Financial Statements (continued)
June 30, 2022
| | Debt Securities Risk: Each Fund may invest in debt securities of both government and corporate issuers. A decline in prevailing levels of interest rates generally increases the value of debt securities in a Fund’s portfolio, while an increase in rates usually reduces the value of those securities. The value of a Fund’s debt securities, including bonds and convertible securities, are affected by movements in interest rates; if interest rates rise, the value of these securities may fall. Generally, the longer the average maturity of a debt security, the greater the change in its value. As a result, to the extent that a Fund invests in debt securities, interest rate fluctuations will affect the Fund’s net asset value, but not the income it receives from debt securities it owns. Debt securities are also subject to credit, liquidity risk and prepayment and extension risk. Credit risk is the risk that the entity that issued a debt security may become unable to make payments of principal and interest, and includes the risk of default. Liquidity risk is the risk that a Fund may not be able to sell portfolio securities because there are too few buyers for them. Prepayment and extension risk is the risk that a loan, bond or other security might be called or otherwise converted, prepaid or redeemed before maturity. If a loan or security is converted, prepaid or redeemed before maturity, particularly during a time of declining interest rates or spreads, the portfolio managers may not be able to invest the proceeds in securities or loans providing as high a level of income, resulting in a reduced yield to a Fund. Conversely, as interest rates rise or spreads widen, the likelihood of prepayment decreases. The portfolio managers may be unable to capitalize on securities with higher interest rates or wider spreads because a Fund’s investments are locked in at a lower rate for a longer period of time. |
| | Options Risk: Investments in options involve risks different from, and possibly greater than, investing directly in the underlying security, asset or other reference, including, among others, the risk that the counterparty to an option may not perform or may be unable to perform in accordance with the terms of the instrument, the potential that, at times, there may not be a liquid secondary market for the options (as described above), and the risk of imperfect correlation between any movement in the price or value of options and their underlying security, asset or other reference. Such events, as well as circumstances under which a Fund is required to purchase the underlying asset at a disadvantageous price, may result in losses to the Fund. In addition, options also may involve a small initial investment relative to the risk assumed, which could result in losses that are greater than the amount originally invested. Special risks are presented by internationally traded options. Because of time differences between the United States and various foreign countries, and because different holidays are observed in different countries, foreign options markets may be open for trading during hours or on days when U.S. markets are closed. As a result, option premiums may not reflect the current prices of the underlying interest in the United States. |
| | Private Investment Funds (PIF) Risk: PIFs are subject to management and other expenses, which will be directly or indirectly paid by the Funds. As a result, the cost of investing in the Fund will be higher than the cost of investing directly in PIFs and also may be higher than other funds that invest directly in stocks and bonds. Each PIF is subject to specific risks, depending on the nature of its investment strategy. The Funds may invest in private investment funds and/or hedge funds, which may pursue alternative investment strategies. Hedge funds often engage in speculative investment practices such as leverage, short-selling, arbitrage, hedging, derivatives, and other strategies that may increase investment loss. |
| 6. | Affiliate Transactions and Fees |
| | Investment Management Fees: Under the Investment Management Agreement, the Adviser receives the following fees for providing certain investment management and other services necessary for managing each Fund. The fee is paid monthly in arrears and calculated based on that month’s daily average net assets. |
| Growth Fund: | | Contrarian Fund: |
| Average Daily Net Assets | | Investment
Management Fee | | Average Daily Net Assets | | Investment
Management Fee |
Up to $50,000,000
| | 1.00% | | Up to $750,000,000
| | 1.00% |
Greater than $50,000,000
| | 0.75% | | $750,000,000 to $800,000,000
| | 0.75% |
| | | | | $800,000,000 to $850,000,000
| | 0.70% |
| | | | | $850,000,000 to $900,000,000
| | 0.65% |
| | | | | $900,000,000 to $950,000,000
| | 0.60% |
| | | | | $950,000,000 to $1,000,000,000
| | 0.55% |
| | | | | Greater than $1,000,000,000
| | 0.50% |
| Meridian Funds | 86 | www.meridianfund.com |
Meridian Fund, Inc.
Notes to Financial Statements (continued)
June 30, 2022
| Enhanced Equity Fund: | | Small Cap Growth Fund: |
| Average Daily Net Assets | | Investment
Management Fee | | Average Daily Net Assets | | Investment
Management Fee |
Up to $10,000,000
| | 1.00% | | Greater than $0
| | 1.00% |
$10,000,001 to $30,000,000
| | 0.90% | | | | |
$30,000,001 to $50,000,000
| | 0.80% | | | | |
Greater than $50,000,000
| | 0.70% | | | | |
Prior to June 1, 2022, the Contrarian Fund’s investment management fees were 1.00% of the average daily net assets.
Distribution Plan for Class A and Class C shares: Each Fund has entered into and adopted a Distribution Plan for Class A and Class C shares. Under the Distribution Plan, the Funds may pay ALPS Distributors, Inc. (the “Distributor”), and/or eligible financial intermediaries a fee for services and expenses related to the sale and distribution of the Funds’ Class A and Class C at an annual rate of up to 0.25% and 1.00% of average daily net assets for Class A and Class C shares, respectively.
For the year ended June 30, 2022, the distributor received commissions in the amounts of $410, $1,531, $1 and $175 for Class A of Growth Fund, Contrarian Fund, Enhanced Equity Fund and Small Cap Growth Fund, respectively. The Small Cap Growth Fund also paid CDSC fees in the amount of $301 to distributors for Class C.
Waivers and Reimbursements of Expenses: The Adviser contractually agreed to waive its investment advisory fees and reimburse operating expenses, to the extent that total annual operating expenses for the Funds exceed the expense limitations listed below, excluding acquired fund fees and expenses, dividend expenses on securities sold short, and interest expenses on short sales. With respect to these limits, the Adviser waived the fees listed below during the year ended June 30, 2022.
| | Expense
Limitation | | Total Waivers and
Reimbursements for
the year ended
June 30, 2022 |
| Growth Fund | | | |
Institutional Class
| 0.90% | | $ — |
Class A
| 1.55% | | $ — |
Class C
| 2.25% | | $ — |
Investor Class
| 1.30% | | $ — |
| Contrarian Fund | | | |
Class A
| 1.60% | | $ — |
Class C
| 2.20% | | $ — |
Investor Class
| 1.35% | | $ — |
| Enhanced Equity Fund | | | |
Legacy Class
| 1.25% | | $ — |
Class A
| 1.60% | | $ — |
Class C
| 2.00% | | $75 |
Investor Class
| 1.35% | | $ — |
| Small Cap Growth Fund | | | |
Legacy Class
| 1.20% | | $ — |
Institutional Class
| 1.10% | | $ — |
Class A
| 1.60% | | $ — |
Class C
| 2.25% | | $ — |
Investor Class
| 1.35% | | $ — |
| | | | |
| | | | |
| Meridian Funds | 87 | www.meridianfund.com |
Meridian Fund, Inc.
Notes to Financial Statements (continued)
June 30, 2022
Subject to the approval of the Board, the Funds may repay the Advisor the amounts of its reimbursement for the Funds by each share class for up to three years following the the reimbursement up to the lesser of an amount not to exceed the current expense limitation of that share class or the expense limitation of that share class in effect at the time that the share class received the applicable reimbursement. This agreement will continue until October 31, 2022, and may be renewed or modified with approval of the Funds' Board. For the year ended June 30, 2022, the Adviser recouped $127 and $6,831 from the Enhanced Equity Fund and Small Cap Growth Fund, respectively.
At June 30, 2022, the balance of carried forward recoupable expenses along with the year of expiration for each Fund were as follows:
| | Expiration June 30, |
| | 2023 | | 2024 | | 2025 |
Growth Fund
| $ — | | $ — | | $ — |
Contrarian Fund
| — | | — | | — |
Enhanced Equity Fund
| 49 | | 48 | | 75 |
Small Cap Growth Fund
| — | | — | | — |
| | | | | | |
| | | | | | |
| 7. | Directors and Officers: Certain Officers of the Funds are also Officers of the Adviser. Officers of the Funds who are Officers of the Adviser receive no compensation from the Funds. Each Non-Interested Director is paid an annual fee set at $40,000. An additional $5,000 is paid to each Non-Interested Director for attendance at each in-person meeting of the Board and an additional $1,000 is paid to each Non-Interested Director for participating in a telephonic meeting of the Board. An additional $3,000 is paid to each member of the Audit or Governance Committee of the Board for attendance at an in-person Audit or Governance Committee meeting and an additional $1,000 is paid to each member of the Audit or Governance Committee of the Board for participating in a telephonic Audit or Governance Committee meeting. |
| | An additional $10,000 is paid to the Chairman of the Board and the Chairman of a Committee of the Board. The Chairman of the Board also receives an additional $2,500 for attending each in-person meeting of the Board. The Chairman of a Committee receives an additional $2,000 for attending each in-person Committee meeting. |
| 8. | Distribution Information: Income and long-term capital gains distributions are determined in accordance with federal income tax regulations, which may differ from U.S. GAAP. The tax character of distributions made during the fiscal year ended June 30, 2022, is as follows: |
| | 2022 Taxable Distributions |
| | Ordinary Income | | Net Long-Term
Capital Gain | | Total
Distributions |
Growth Fund
| $91,415,999 | | $193,737,331 | | $285,153,330 |
Contrarian Fund
| — | | 93,408,608 | | 93,408,608 |
Enhanced Equity Fund
| 5,302,570 | | 7,858,454 | | 13,161,024 |
Small Cap Growth Fund
| 63,297,228 | | 232,534,484 | | 295,831,712 |
The tax character of distributions made during the fiscal year ended June 30, 2021, is as follows:
| | 2021 Taxable Distributions |
| | Ordinary Income | | Net Long-Term
Capital Gain | | Total
Distributions |
Growth Fund
| $19,996,308 | | $ — | | $19,996,308 |
Contrarian Fund
| 2,166,314 | | 27,626,778 | | 29,793,092 |
Enhanced Equity Fund
| 2,257,676 | | 4,975,467 | | 7,233,143 |
Small Cap Growth Fund
| 5,279,434 | | 25,919,745 | | 31,199,179 |
| Meridian Funds | 88 | www.meridianfund.com |
Meridian Fund, Inc.
Notes to Financial Statements (continued)
June 30, 2022
| 9. | Federal Income Taxes Information: It is the Funds’ policy to comply with the requirements of Subchapter M of the Internal Revenue Code of 1986, as amended, applicable to regulated investment companies and to distribute all of their taxable income to their shareholders; therefore, no federal income tax provision is required. Management has analyzed the Funds’ tax positions taken on federal income tax returns for all open tax years (current and prior three tax years), and has concluded that no provision for federal income tax is required in the Funds’ financial statements. The Funds’ federal and state income and federal excise tax returns for tax years for which the applicable statutes of limitations have not expired are subject to examination by the Internal Revenue Service and state departments of revenue. The Funds are not aware of any tax positions for which it is reasonably possible that the total amounts of unrecognized tax benefits will significantly change in the next 12 months. The Funds recognize interest and penalties, if any, related to unrecognized tax benefits as income tax expense in the Statements of Operations. During the year ended June 30, 2022, the Funds did not incur any interest or penalties. |
| | For the year ended June 30, 2022, the following reclassifications were made as a result of permanent differences between the financial statements and income tax reporting requirements: |
| | Increase/(Decrease)
Paid-in Capital | | Increase/(Decrease)
Accumulated Earnings |
Growth Fund
| $ — | | $ — |
Contrarian Fund
| (797,795) | | 797,795 |
Enhanced Equity Fund
| (70) | | 70 |
Small Cap Growth Fund
| 30,882,757 | | (30,882,757) |
| | | | |
| | | | |
The aggregate cost of investments and unrealized appreciation and depreciation, for federal income tax purposes, at June 30, 2022 is as follows:
| | Aggregrate Cost | | Aggregrate Gross
Unrealized
Appreciation | | Aggregrate Gross
Unrealized
Depreciation | | Net Unrealized
Appreciation/(Depreciation) |
Growth Fund
| $1,529,553,003 | | $287,895,243 | | $(329,954,202) | | $(42,058,959) |
Contrarian Fund
| 476,647,762 | | 114,349,034 | | (51,160,014) | | 63,189,020 |
Enhanced Equity Fund
| 70,900,344 | | 20,117,785 | | (22,845,525) | | (2,727,740) |
Small Cap Growth Fund
| 924,188,189 | | 135,204,919 | | (225,766,843) | | (90,561,924) |
| | Components of Accumulated Earnings (Losses) on a Tax Basis |
| | Growth
Fund | | Contrarian
Fund | | Enhanced Equity
Fund | | Small Cap
Growth Fund |
Undistributed ordinary income
| $ 40,769,175 | | $ — | | $ 1,580,288 | | $ — |
Capital loss carry forward
| — | | — | | — | | — |
Undistributed long-term capital gains
| 120,355,497 | | 60,409,978 | | 2,571,440 | | 89,101,093 |
Unrealized appreciation/(depreciation)
| (42,058,959) | | 63,189,020 | | (2,727,740) | | (90,561,924) |
Qualified late year deferred losses
| — | | (38,230) | | — | | (25,674,327) |
Total Accumulated Earnings/(Losses)
| $119,065,713 | | $123,560,768 | | $ 1,423,988 | | $(27,135,158) |
The differences between book and tax-basis unrealized appreciations are attributable to the tax deferral of losses on wash sales, straddles and investment adjustments in partnerships. Late year losses incurred after December 31 within the fiscal year or period are deemed to arise on the first business day of the following fiscal year for tax purposes. The Contrarian Fund and Small Cap Growth Fund incurred and elected to defer such late year losses of $38,230 and $6,657,292, respectively. The Small Cap Growth Fund also incurred and elected to defer Post October losses of $19,017,035.
As of June 30, 2022, the Funds had no capital loss carryforwards available to offset future realized capital gains.
| Meridian Funds | 89 | www.meridianfund.com |
Meridian Fund, Inc.
Notes to Financial Statements (continued)
June 30, 2022
| 10. | Subsequent Events: Management has evaluated the impact of all subsequent events on the Funds through the date the financial statements were issued, and has noted no additional events that require recognition or disclosure in the financial statements. |
| Meridian Funds | 90 | www.meridianfund.com |
Report of Independent Registered Public Accounting Firm
To the Shareholders of Meridian Growth Fund, Meridian Contrarian Fund, Meridian Enhanced Equity Fund, and Meridian Small Cap Growth Fund and
Board of Directors of Meridian Fund, Inc.
Opinion on the Financial Statements
We have audited the accompanying statements of assets and liabilities, including the schedules of investments, of Meridian Fund, Inc. comprising Meridian Growth Fund, Meridian Contrarian Fund, Meridian Enhanced Equity Fund, and Meridian Small Cap Growth Fund (the “Funds”) as of June 30, 2022, the related statements of operations for the year then ended, the statements of changes in net assets for each of the two years in the period then ended, the related notes, and the financial highlights for each of the five years in the period then ended (collectively referred to as the “financial statements”). In our opinion, the financial statements present fairly, in all material respects, the financial position of each of the Funds as of June 30, 2022, the results of their operations for the year then ended, the changes in net assets for each of the two years in the period then ended, and the financial highlights for each of the five years in the period then ended, in conformity with accounting principles generally accepted in the United States of America.
Basis for Opinion
These financial statements are the responsibility of the Funds’ management. Our responsibility is to express an opinion on the Funds’ financial statements based on our audits. We are a public accounting firm registered with the Public Company Accounting Oversight Board (United States) (“PCAOB”) and are required to be independent with respect to the Funds in accordance with the U.S. federal securities laws and the applicable rules and regulations of the Securities and Exchange Commission and the PCAOB.
We conducted our audits in accordance with the standards of the PCAOB. Those standards require that we plan and perform the audit to obtain reasonable assurance about whether the financial statements are free of material misstatement whether due to error or fraud.
Our audits included performing procedures to assess the risks of material misstatement of the financial statements, whether due to error or fraud, and performing procedures that respond to those risks. Such procedures included examining, on a test basis, evidence regarding the amounts and disclosures in the financial statements. Our procedures included confirmation of securities owned as of June 30, 2022, by correspondence with the custodian, brokers, administrator, issuer, and transfer agents; when replies were not received from brokers, we performed other auditing procedures. Our audits also included evaluating the accounting principles used and significant estimates made by management, as well as evaluating the overall presentation of the financial statements. We believe that our audits provide a reasonable basis for our opinion.
We have served as the Funds’ auditor since 2018.
COHEN & COMPANY, LTD.
Cleveland, Ohio
August 26, 2022
| Meridian Funds | 91 | www.meridianfund.com |
Board Consideration of Liquidity Risk Management Program
The Corporation has adopted and implemented a liquidity risk management program (the “Program”), as consistent with Rule 22e-4 to govern the Corporation’s approach to managing liquidity risk for each Fund. The Program is overseen by the Liquidity Committee (the “Committee”), which is comprised of the Corporation’s Treasurer, Secretary, Assistant Treasurer and a compliance representative of the Corporation’s investment adviser, ArrowMark Colorado Holdings, LLC. The Corporation’s Board of Directors (the “Board”) has approved the designation of the Committee to oversee the Program.
The Program’s principal objectives include supporting each Fund’s compliance with limits on investments in illiquid assets and mitigating the risk that a Fund will be unable to meet its redemption obligations in a timely manner. The Program also includes a number of elements that support the management and assessment of liquidity risk, including an annual assessment of factors that influence a Fund’s liquidity and the periodic classification and re-classification of the Fund’s investments into groupings that reflect the Committee’s assessment of their relative liquidity under current market conditions.
At a meeting of the Board held on May 10, 2022, the Committee provided a report (the “Report”) to the Board addressing the operation, adequacy, and effectiveness of the Program, including any material changes to the Program for the period from April 1, 2021 through March 31, 2022 (“Reporting Period”). The Report concluded that the Corporation’s Program was reasonably designed to assess and manage each Fund’s liquidity risk and was adequately and effectively implemented during the Reporting Period. There were no material changes to the Program during the Reporting Period. The Report further concluded that the Corporation’s investment strategies continue to be appropriate given the Corporation’s status as an open-end fund.
There can be no assurance that the Program will achieve its objectives in the future. Additional information regarding risks of investing in the Corporation, including liquidity risks presented by the Corporation’s investment portfolio, is found in the Corporation’s Prospectus and Statement of Additional Information.
| Meridian Funds | 92 | www.meridianfund.com |
Meridian Fund, Inc.
Information About the Directors and Officers (Unaudited)
The individuals listed below serve as directors or officers of Meridian Fund, Inc. (the “Meridian Funds”). Each director of the Meridian Funds serves until a successor is elected and qualified or until resignation. Each officer of the Meridian Funds is elected annually by the Board of Directors. The address of all officers and directors is 100 Fillmore Street, Suite 325, Denver, CO 80206. The Meridian Funds’ Statement of Additional Information (SAI) includes more information about the Directors. To request a free copy, call Meridian at 1-800-446-6662.
| Interested Directors* | Positions(s) Held with
Fund: | Length of Service
(Beginning Date) | Principal Occupation(s)
During Past 5 Years | Number of
Portfolios Overseen | Other
Directorships |
| Michael Stolper * (77) | Director | Indefinite term since
May 3, 1985 | President, Stolper &
Company, Inc. (an
investment adviser),
September 1975 to
December 2017; Trustee, Ewing Marion Kauffman
Foundation, March 2010
to March 2019. | 4 | ArrowMark
Financial Corp.;
Windowpane Funds
(one portfolio) |
| * Mr. Stolper is treated as an “interested” person of the Funds, as such term is defined in the 1940 Act, because, as a result of his prior ownership interest in Aster Investment Management, Inc. (the “Previous Investment Adviser”, the previous investment adviser to the Meridian Enhanced Equity Fund, Meridian Growth Fund, and Meridian Contrarian Fund). |
| Non-Interested Directors | Position(s) Held with Fund: | Length of Service
(Beginning Date) | Princiapl Occupation(s)
During Past 5 Years | Number of Portfolios Overseen | Other Directorships |
| Guy M. Arnold (54) | Director | Indefinite term since
May 12, 2015 | President of Hunt
Development Group from
July 2015 to present; Owner/Manager of GMA
Holdings, LLC from January
2013 to July 2015. | 4 | ArrowMark
Financial Corp.;
MidFirst Bank –
Colorado
Advisory
Member; The
Children's
Hospital of Colorado |
| John S. Emrich, CFA (54) | Director | Indefinite term since
October 6, 2010 | Private Investor, January
2011 to present. | 4 | ArrowMark
Financial Corp.;
Destra Funds (4
Funds) |
| Michael S. Erickson (70) | Director | Indefinite term since
May 3, 1985 | Private Investor,
August 2007 to present; Treasurer and Vice President, Erickson Holding Corp., 2003 to present; Treasurer, Vice President, and Manager, McGee Island LLC, 2015 to present. | 4 | Destra Funds (4 Funds); McGee Island, LLC |
| James Bernard Glavin (87) | Director and Chairman
of the Board | Indefinite term since
May 3, 1985 | Retired; previously
Chairman of the Board,
Orchestra Therapeutics,
Inc. | 4 | None |
| Edward F. Keely, CFA (55) | Director | Indefinite term since
February 13, 2015 | Independent Advisor to
Borgen Investment Group,
January 2021 to present.
Formerly Chief Investment
Officer/Portfolio Manager at
Borgen Investment Group,
2008 to February 2021. | 4 | None |
| Officers | Position(s) Held with
Fund: | Length of Service | Principal Occupation(s)
During Past 5 Years |
| David Corkins (55) | President (Principal
Executive Officer) | Indefinite; Since
September 5, 2013 | Co-Founder, Principal and Portfolio Manager, ArrowMark Colorado Holdings, LLC |
| Rick Grove (53) | Vice President,
Secretary and Chief
Compliance Officer | Indefinite; Since
September 5, 2013 | Chief Compliance Officer, ArrowMark Colorado Holdings, LLC; formerly, Chief Operating Officer, ArrowMark Colorado Holdings, LLC |
| Katie Jones (38) | Chief Financial Officer
(Principal Financial
Officer) and Treasurer | Indefinite; Since
August 12, 2014 | Director, ArrowMark Colorado Holdings, LLC; formerly, Assistant Treasurer, Meridian Fund, Inc. |
| Kelsey Auble (32) | Assistant Treasurer | Indefinite; Since
November 12, 2019 | Controller, ArrowMark Colorado Holdings, LLC |
| Meridian Funds | 93 | www.meridianfund.com |
Meridian Fund, Inc.
2022 TAX NOTICE TO SHAREHOLDERS (Unaudited)
The information set forth below is for each Fund’s fiscal year as required by federal laws. Shareholders, however, must report distributions on a calendar year basis for income tax purposes, which may include distributions for portions of two fiscal years of a fund. Accordingly, the information needed by shareholders for income tax purposes will be sent to them in early 2022. Please consult your tax advisor for proper treatment of this information.
For the period July 1, 2021 to June 30, 2022, the Funds reported the following terms with regard to distributions paid during the period. All information is based on financial information available as of the date of this annual report and, accordingly, is subject to change. For each item, it is the intention of each Fund to report the maximum amount permitted under the Internal Revenue Code and the regulations thereunder.
Pursuant to Internal Revenue Code Section 852(b)(3), the Growth Fund, Contrarian Fund, Enhanced Equity Fund, and Small Cap Growth Fund reported $193,737,331, $93,408,608, $7,858,454, and $232,534,484, respectively, as long-term capital gain distribution for the year ended June 30, 2022.
Pursuant to Internal Revenue Code Section 854(b)(2), the Funds listed below report a percentage of their ordinary income dividends distributed during the year ended June 30, 2022 as qualifying for the corporate dividends-received deduction:
| | |
| Growth Fund | 3.15% |
| Contrarian Fund | 0% |
| Enhanced Equity Fund | 10.56% |
| Small Cap Growth Fund | 7.07% |
Pursuant to Section 1 (h)(11) of the Internal Revenue Code, the Funds listed below report the following amounts of their income dividends paid during the year ended June 30, 2022 as qualified dividend income (QDI):
| | |
| Growth Fund | 4.13% |
| Contrarian Fund | 0% |
| Enhanced Equity Fund | 11.01% |
| Small Cap Growth Fund | 8.40% |
The Funds report a portion of the net income dividends distributed during the year ended June 30, 2022, as Qualified Interest Income (QII), as defined in the Internal Revenue Code as follows:
| | |
| Growth Fund | 0% |
| Contrarian Fund | 0% |
| Enhanced Equity Fund | 0% |
| Small Cap Growth Fund | 0% |
The Funds report a portion of the short term capital gain dividends distributed during the year ended June 30, 2022, as Qualified Short-Term Gain, as defined in the Internal Revenue Code as follows:
| | |
| Growth Fund | 100% |
| Contrarian Fund | 100% |
| Enhanced Equity Fund | 100% |
| Small Cap Growth Fund | 100% |
U.S. Government interest represents the amount of interest that was derived from direct U.S. Government obligations and distributed during the fiscal year. This amount is reflected as a percentage of total ordinary income distributions (the total of short-term capital gain and net investment income distributions). Generally, interest from direct U.S. Government obligations is exempt from state income tax. However, for residents of California, Connecticut and New York, the statutory threshold requirements were not satisfied to permit exception of these amounts from state income for the Funds.
| Meridian Funds | 94 | www.meridianfund.com |
Meridian Fund, Inc.
2022 TAX NOTICE TO SHAREHOLDERS (Unaudited) (continued)
U.S. Government interest:
| | |
| Growth Fund | 0% |
| Contrarian Fund | 0% |
| Enhanced Equity Fund | 0% |
| Small Cap Growth Fund | 0% |
| Meridian Funds | 95 | www.meridianfund.com |
Meridian Fund, Inc.
Glossary of Terms Used in this Report (Unaudited)
Average Annual Total Return: This is a commonly used method to express an investment’s performance over a particular, usually multi-year time period. It expresses the return that would have been necessary each year to equal the investment’s actual cumulative performance (including change in NAV or offer price and reinvested distributions and capital gains, if any) over the time period being considered.
Call Option: An agreement that gives an investor the right (but not the obligation) to buy a stock, bond, commodity, or other instrument at a specified price within a specific time period.
Russell 2000® Growth Index: An index that measures the performance of those Russell 2000 companies with higher price-to-book ratios and higher forecasted growth values. The index returns assume reinvestment of distributions, but do not reflect any applicable sales charges or management fees.
Russell 2500® Growth Index: Measures the performances of the small to mid-cap growth segment of the U.S. equity universe. It includes those Russell 2500® Index companies with higher price-to-book ratios and higher forecasted growth values.
Russell 2500® Index: Measures the performance of the small to mid-cap segment of the U.S. equity universe, commonly referred to as "smid" cap. The Russell 2500™ is a subset of the Russell 3000® Index.
Russell 2500® Value Index: Measures the performance of the small to mid-cap value segment of the U.S. equity universe. It includes those Russell 2500 companies that are considered more value oriented relative to the overall market as defined by Russell’s leading style methodology. One cannot invest directly into an index.
S&P 500® Index: A commonly recognized market-capitalization-weighted index of 500 widely held equity securities, designed to measure broad U. S. equity performance.
| Meridian Funds | 96 | www.meridianfund.com |
MERIDIAN FUND, INC. PRIVACY POLICY NOTICE
Meridian Fund, Inc. shareholders are entitled to know how we protect personal information and how we limit disclosure.
Information sources. We obtain nonpublic personal information about our shareholders from the following sources:
| • | Applications or other forms |
| • | Transactions with us, our affiliates, or others |
Protection of information. We do not disclose any nonpublic personal information about current or former shareholders, except as permitted or required by law. Personal information refers to information that personally identifies you or your financial accounts. This includes among other items, your social security numbers, your address and account transactions. We do not sell your personal information to anyone.
Disclosure of information. We may send your financial adviser or other financial intermediaries or individuals (as designated by you) copies of confirmations, quarterly account statements and other documents reporting activity in your accounts. We may also provide your personal information to firms that assist us in servicing your account, such as our transfer agent. If at any time in the future it is necessary to disclose your personal information in a way that is inconsistent with this policy, we will give you advance notice of the proposed change so that you will have the opportunity to opt out of such disclosure. We will not disclose your personal information to any other unaffiliated third parties, except as permitted or required by law, unless you have specifically asked us to do so; that is, opted in.
Security measures. To protect your personal information, we permit access only by authorized employees or service providers. We maintain physical, electronic and procedural safeguards to protect your personal account information. Our employees and agents have access to that information only so that they may offer products or provide services to you, for example, when responding to questions directly related to your account. If you ever find that your account information is incomplete, inaccurate or not current, please write to us at Meridian Fund, Inc., P.O. Box 9792, Providence, RI 02940 or call us at 1-800-446-6662. This privacy policy applies to all Meridian Fund, Inc. accounts you presently have, or may open in the future using your social security number, whether or not you remain a shareholder of a Fund. If you have any questions or concerns, please contact us at the address or telephone number above.
For more information about MERIDIAN FUND, INC. the following documents are available free upon request. You can download shareholder reports and the Funds’ Statement of Additional Information at no cost from our website at www.meridianfund.com.
Annual/Semi-annual Reports:
The Funds’ Annual and Semi-annual Reports to Shareholders contain detailed information about the Funds’ portfolios.
In the Funds’ Annual Report, you will find a discussion of market conditions and investment strategies that significantly affected the Funds’ performance during the last fiscal year.
Statement of Additional Information (SAI):
The SAI provides additional information about the Funds, including operations and investment strategies.
You may obtain free copies of the reports and the SAI, request other information or make shareholder inquiries, by visiting the Meridian Fund, Inc. website at www.meridianfund.com. To request additional information or to speak with a representative of the Funds, contact us at:
MERIDIAN FUND, INC.
P.O. Box 9792
Providence, RI 02940
1-800-446-6662
You can also review the Funds’ reports and SAI:
| • | By electronic request at the following E-mail address: publicinfo@sec.gov |
| • | Free from the Commission’s Website at http://www.sec.gov. |
(Investment Company Act File No. 811-04014)
THIS PAGE INTENTIONALLY LEFT BLANK
Meridian Fund, Inc.
Other Information (Unaudited)
June 30, 2022
Proxy Voting Guidelines
The Adviser is responsible for exercising the voting rights associated with the securities purchased and held by the Funds. A description of the policies and procedures that the Adviser uses in fulfilling this responsibility and information regarding how those proxies were voted during the most recent 12-month period ended June 30 are available without charge upon request by calling toll free (800) 446-6662. These items are also available on the Securities and Exchange Commission’s website at http://www.sec.gov.
Quarterly Portfolio Disclosure
The Adviser files a complete listing of portfolio holdings for each Fund as of the end of the first and third quarters of each fiscal year as an exhibit to its reports on Form N-PORT, and for reporting periods prior to March 31, 2019, filed such information on Form N-Q. The complete listing is available on the Commission’s website at http://www.sec.gov.
Contact Us
By phone from 9:00 AM to 6:00 PM EST on any business day at the following if you are an:
Individual Investor:
(800) 446-6662
Institutional Investor:
(303) 398-2929
Financial Advisor:
(877) 796-3434
Investment Adviser
ArrowMark Colorado Holdings, LLC
100 Fillmore Street, Suite 325
Denver, CO 80206
Distributor
ALPS Distributors, Inc.
1290 Broadway, Suite 1000
Denver, CO 80203
Administrator, Transfer Agent and Disbursing Agent
BNY Mellon Investment Servicing (US) Inc.
103 Bellevue Parkway
Wilmington, DE 19809
Custodian
The Bank of New York Mellon
One Wall Street
New York, NY 10286
Counsel
Davis Graham & Stubbs LLP
1550 17th Street, Suite 500
Denver, CO 80202
Independent Registered Public Accounting Firm
Cohen & Company, Ltd.
1350 Euclid Ave., Suite 800
Cleveland, OH 44115
Directors and Officers
Directors
James Bernard Glavin, Chairman
Guy M. Arnold
John S. Emrich
Michael S. Erickson
Edward F. Keely
Michael Stolper*
Officers
David Corkins, President
Katie Jones, Chief Financial Officer and Treasurer
Richard Grove, Vice President, Secretary and Chief
Compliance Officer
Kelsey Auble, Assistant Treasurer
*Interested Director
| | (a) | The registrant, as of the end of the period covered by this report, has adopted a code of ethics that applies to the registrant’s principal executive officer, principal financial officer, principal accounting officer or controller, or persons performing similar functions, regardless of whether these individuals are employed by the registrant or a third party. |
| | (c) | There have been no amendments, during the period covered by this report, to a provision of the code of ethics that applies to the registrant’s principal executive officer, principal financial officer, principal accounting officer or controller, or persons performing similar functions, regardless of whether these individuals are employed by the registrant or a third party, and that relates to any element of the code of ethics description. |
| | (d) | The registrant has not granted any waivers, including an implicit waiver, from a provision of the code of ethics that applies to the registrant’s principal executive officer, principal financial officer, principal accounting officer or controller, or persons performing similar functions, regardless of whether these individuals are employed by the registrant or a third party, that relates to one or more of the items set forth in paragraph (b) of this item’s instructions. |
| | (f) | A copy of the registrant’s code of ethics is filed as Exhibit 12(a)(1) to this report. |
| Item 3. | Audit Committee Financial Expert. |
As of the end of the period covered by the report, the registrant’s board of directors has determined that James Glavin is qualified to serve as an audit committee financial expert serving on its audit committee and that he is “independent,” as defined by Item 3 of Form N-CSR.
| Item 4. | Principal Accountant Fees and Services. |
| | • | | Registrant may incorporate the following information by reference, if this information has been disclosed in the registrant’s definitive proxy statement or definitive information statement. The proxy statement or information statement must be filed no later than 120 days after the end of the fiscal year covered by the Annual Report. |
Audit Fees
| | (a) | The aggregate fees billed for each of the last two fiscal years for professional services rendered by the principal accountant for the audit of the registrant’s annual financial statements or services that are normally provided by the accountant in connection with statutory and regulatory filings or engagements for those fiscal years are $122,000 in 2022 and $96,000 in 2021. |
Audit-Related Fees
| | (b) | The aggregate fees billed in each of the last two fiscal years for assurance and related services by the principal accountant that are reasonably related to the performance of the audit of the registrant’s financial statements and are not reported under paragraph (a) of this Item are $0 in 2022 and $0 in 2021. |
Tax Fees
| | (c) | The aggregate fees billed in each of the last two fiscal years for professional services rendered by the principal accountant for tax compliance, tax advice, and tax planning are $21,000 in 2022 and $20,000 in 2021. The fiscal year tax fees were for review of each fund’s federal and excise tax returns and year-end distributions. |
All Other Fees
| | (d) | The aggregate fees billed in each of the last two fiscal years for products and services provided by the principal accountant, other than the services reported in paragraphs (a) through (c) of this Item are $0 in 2022 and $0 in 2021. |
| | (e)(1) | Disclose the audit committee’s pre-approval policies and procedures described in paragraph (c)(7) of Rule 2-01 of Regulation S-X. |
PRE-APPROVAL OF AUDIT AND PERMITTED NON-AUDIT SERVICES PROVIDED TO THE COMPANY
| 1. | Pre-Approval Requirements. The Committee shall pre-approve all auditing services and permissible non-audit services (e.g., tax services) to be provided to the Company by the Auditor, including the fees therefore. The Committee may delegate to one or more of its members the authority to grant pre-approvals. In connection with such delegation, the Committee shall establish pre-approval policies and procedures, including the requirement that the decisions of any member to whom authority is delegated under this section shall be presented to the full Committee at each of its scheduled meetings. |
| 2. | De Minimis Exception to Pre-Approval: Pre-approval for a permitted non-audit service shall not be required if: |
| | a. | the aggregate amount of all such non-audit services is not more than 5% of the total revenues paid by the Company to the Auditor in the fiscal year in which the non-audit services are provided; |
| | b. | such services were not recognized by the Company at the time of the engagement to be non-audit services; and |
| | c. | such services are promptly brought to the attention of the Committee and approved prior to the completion of the audit by the Committee or by one or more members of the Committee to whom authority to grant such approvals has been delegated by the Committee. |
Additionally, the Committee shall pre-approve the Auditor’s engagements for non-audit services with the Adviser and any affiliate of the Adviser that provides ongoing services to the Company in accordance with the foregoing, if the engagement relates directly to the operations and financial reporting of the Company, unless the aggregate amount of all services provided constitutes no more than 5% of the total amount of revenues paid to the Auditor by the Company, the Adviser and any affiliate of the Adviser that provides ongoing services to the Company during the fiscal year in which the services are provided that would have to be pre-approved by the Committee pursuant to this paragraph (without regard to this exception).
PROHIBITED SERVICES
The Committee shall confirm with the Auditor engaged to perform the audit of the Company that the Auditor is not performing contemporaneously any of the following non-audit services for the Company, the Adviser, or any affiliates of the Company or Adviser:
| | 1. | bookkeeping or other services related to the accounting records or financial statements of the Company; |
| | 2. | financial information systems design and implementation; |
| | 3. | appraisal or valuation services, fairness opinions, or contribution-in-kind reports; |
| | 5. | internal audit outsourcing services; |
| | 6. | management functions or human resources; |
| | 7. | broker or dealer, investment adviser, or investment banking services; |
| | 8. | legal services and expert services unrelated to the audit; and |
| | 9. | any other service that the Public Company Accounting Oversight Board determines, by regulation, is impermissible. |
The Auditor is responsible for informing the Committee of whether it believes that a particular service is permissible or prohibited pursuant to applicable regulations and standards.
| (e)(2) | The percentage of services described in each of paragraphs (b) through (d) of this Item that were approved by the audit committee pursuant to paragraph (c)(7)(i)(C) of Rule 2-01 of Regulation S-X are as follows: |
(b) N/A
(c) N/A
(d) N/A
| | (g) | The aggregate non-audit fees billed by the registrant’s accountant for services rendered to the registrant for each of the last two fiscal years of the registrant was $21,000 in 2022 and $20,000 in 2021. The aggregate non-audit fees billed by the registrant’s accountant for services rendered to the registrant’s investment adviser (not including any sub-adviser whose role is primarily portfolio management and is subcontracted with or overseen by another investment adviser), and any entity controlling, controlled by, or under common control with the adviser that provides ongoing services to the registrant for each of the last two fiscal years of the registrant was $0 in 2022 and $0 in 2021. |
| Item 5. | Audit Committee of Listed Registrants. |
Not applicable.
| (a) | Schedule of Investments in securities of unaffiliated issuers as of the close of the reporting period is included as part of the report to shareholders filed under Item 1 of this form. |
| Item 7. | Disclosure of Proxy Voting Policies and Procedures for Closed-End Management Investment Companies. |
Not applicable.
| Item 8. | Portfolio Managers of Closed-End Management Investment Companies. |
Not applicable.
| Item 9. | Purchases of Equity Securities by Closed-End Management Investment Company and Affiliated Purchasers. |
Not applicable.
| Item 10. | Submission of Matters to a Vote of Security Holders. |
There have been no material changes to the procedures by which the shareholders may recommend nominees to the registrant’s board of directors, where those changes were implemented after the registrant last provided disclosure in response to the requirements of Item 407(c)(2)(iv) of Regulation S-K (17 CFR 229.407) (as required by Item 22(b)(15) of Schedule 14A (17 CFR 240.14a-101)), or this Item.
| Item 11. | Controls and Procedures. |
| | (a) | The registrant’s principal executive and principal financial officers, or persons performing similar functions, have concluded that the registrant’s disclosure controls and procedures (as defined in Rule 30a-3(c) under the Investment Company Act of 1940, as amended (the “1940 Act”) (17 CFR 270.30a-3(c))) are effective, as of a date within 90 days of the filing date of the report that includes the disclosure required by this paragraph, based on their evaluation of these controls and procedures required by Rule 30a-3(b) under the 1940 Act (17 CFR 270.30a-3(b)) and Rules 13a-15(b) or 15d-15(b) under the Securities Exchange Act of 1934, as amended (17 CFR 240.13a-15(b) or 240.15d-15(b)). |
| | (b) | There were no changes in the registrant’s internal control over financial reporting (as defined in Rule 30a-3(d) under the 1940 Act (17 CFR 270.30a-3(d))) that occurred during the period covered by this report that has materially affected, or is reasonably likely to materially affect, the registrant’s internal control over financial reporting. |
| Item 12. | Disclosure of Securities Lending Activities for Closed-End Management Investment Companies. |
Not applicable.
SIGNATURES
Pursuant to the requirements of the Securities Exchange Act of 1934 and the Investment Company Act of 1940, the registrant has duly caused this report to be signed on its behalf by the undersigned, thereunto duly authorized.
| | |
| (Registrant) | | Meridian Fund, Inc.® |
| |
| By (Signature and Title)* | | /s/ David J. Corkins |
| | David J. Corkins |
| | Principal Executive Officer and President |
Pursuant to the requirements of the Securities Exchange Act of 1934 and the Investment Company Act of 1940, this report has been signed below by the following persons on behalf of the registrant and in the capacities and on the dates indicated.
| | |
| By (Signature and Title)* | | /s/ David J. Corkins |
| | David J. Corkins |
| | Principal Executive Officer and President |
| | |
| By (Signature and Title)* | | /s/ Katie Jones |
| | Katie Jones |
| | Principal Financial Officer and Treasurer |
| * | Print the name and title of each signing officer under his or her signature. |