UNITED STATES
SECURITIES AND EXCHANGE COMMISSION
Washington, D.C. 20549
FORM N-CSR
CERTIFIED SHAREHOLDER REPORT OF REGISTERED MANAGEMENT INVESTMENT COMPANIES
Investment Company Act file number
(Exact name of registrant as specified in charter)
100 Fillmore St., Suite 325
Denver, CO 80206
(Address of principal executive offices) (Zip code)
David J. Corkins
100 Fillmore St., Suite 325
Denver, CO 80206
(Name and address of agent for service)
Registrant's telephone number, including area code:
Date of reporting period:
Item 1. Report to Stockholders.
(a) The registrant’s undefined report transmitted to shareholders pursuant to Rule 30e-1 under the Investment Company Act of 1940 is as follows:
Meridian Growth Fund
Legacy Class | (MERDX)
Annual SHAREHOLDER REPORT | June 30, 2024
This annual shareholder report contains important information about the Meridian Growth Fund (“Fund”) for the period of July 1, 2023 to June 30, 2024. You can also request this information by contacting us at 1-800-446-6662.
This report describes changes to the Fund that occurred during the reporting period. You can find additional information about the Fund at www.arrowmarkpartners.com/meridian/.
What were the Fund expenses for the last year?
(Based on a hypothetical $10,000 investment)
| Fund | Costs of a $10,000 investment | Costs paid as a percentage
of a $10,000 investment |
Meridian Growth Fund
(Legacy Class) | $90 | 0.90% |
What drove fund performance during the past 12 months?
U.S. equities moved higher over the 12-month period ended June 30, 2024.
In our view, resilient economic growth, a strong labor market, higher corporate earnings, and easing inflation gave investors the support they needed to look past higher interest rates and bid stocks higher.
Small cap stocks, while delivering a respectable 10% index return over the period, were generally overshadowed by the market’s narrow focus on larger, AI-related companies.
The investment strategy’s emphasis on downside protection proved effective during the period, as the strategy outperformed on eight of the nine days on which the index declined 2% or more.
Our investment process focuses on what we believe are high-quality companies with recurring revenue and sustainable competitive advantages.
The market presented a challenging landscape for our approach as high-momentum stocks outperformed [other investment strategies], creating a headwind to performance since the fund does not focus on those stocks.
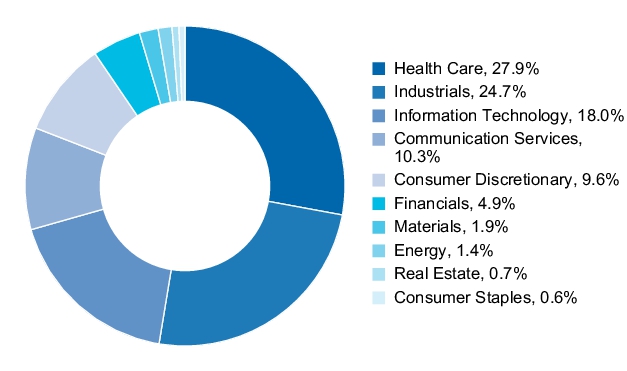
From a sector perspective, positive stock selection in the industrials and healthcare sectors aided returns.
Conversely, negative stock selection in the consumer discretionary and communication services sectors were headwinds to relative performance.
The preceding information is the opinion of portfolio management only through the end of the period stated. Any such opinions are subject to change at any time based upon market or other conditions and should not be relied upon as investment advice. Past performance is no guarantee of future results, and there is no guarantee that market forecasts will be realized.
Investors should consider the investment objective and policies, risk considerations, charges and ongoing expenses of an investment carefully before investing. The prospectus contains this and other information relevant to an investment in any of the Meridian Funds. Please read the prospectus carefully before you invest. To obtain a prospectus, please contact your investment representative or the Funds' transfer agent at 1-800-446-6662 or access our website at www.arrowmarkpartners.com/meridian/.
How has the Fund historically performed?
This chart assumes an initial investment of $10,000 made on July 1, 2014 for Legacy Class including any applicable sales charges or fees. The performance of the other share class may be greater or less than that shown based on differences in inception dates, fees, and sales charges. Performance assumes reinvestment of dividends and capital gain distributions.
GROWTH OF $10,000

| AVERAGE ANNUAL TOTAL RETURN | 1 Year | 5 Years | 10 Years | Since Inception(1) |
| Meridian Growth Fund (Legacy Class/(MERDX)) | 0.44% | 4.64% | 7.61% | 11.46% |
| Russell 2500® Growth Index | 9.02% | 7.58% | 8.77% | N/A(2) |
| Russell 3000® | 23.13% | 14.14% | 12.15% | 11.67% |
| (1) | Inception date of Legacy Class is 08/01/84 |
| (2) | Inception date of Legacy Class precedes the inception date of the Russell 2500® Growth Index. |
Past performance is not predictive of future performance. The graph and table do not reflect the deduction of taxes that a shareholder would pay on Fund distributions or the redemption of Fund shares and do not reflect the imposition of a 2% redemption fee on shares held 60 days or less to deter market timers. If reflected, the taxes and fees would reduce the performance quoted. Net asset value, investment return and principal value will fluctuate, so shares, when redeemed, may be worth more or less than their original cost.
| Fund net assets | $1,147,064,640% |
| Total number of portfolio holdings | $89% |
| Total advisory fee paid | $9,757,215% |
| Portfolio turnover rate as of the end of the reporting period | $33% |
| RB Global, Inc. (Canada) | 3.8% |
| Trimble, Inc. | 3.3% |
| Ziff Davis, Inc. | 3.1% |
| Churchill Downs, Inc. | 3.0% |
| Cargurus, Inc. | 3.0% |
| Sensata Technologies Holding Plc | 2.9% |
| Euronet Worldwide, Inc. | 2.8% |
| ACV Auctions, Inc. Class A | 2.8% |
| STERIS Plc | 2.8% |
| Smartsheet, Inc. Class A | 2.7% |
Portfolio holdings are subject to change and may not reflect the current or future position of the portfolio. Top ten holdings excluding short-term investments are reported as a percentage of net assets.
Sector allocations are subject to change and may not reflect the current or future position of the portfolio. Sector allocations are reported as a percentage of equity investments excluding cash or cash equivalents, Private Investment Fund & Convertible Note. As of period end, the Fund invested a significant portion of their assets in securities in the sectors. Changes in economic conditions affecting such sectors would have a greater impact on the Fund and could affect the value, income and/or liquidity of positions in such securities.
For compliance purposes, the Fund’s industry classifications may refer to any one or more of the industry sub-classifications used by one or more widely recognized market indexes or ratings group indexes, and/or as defined by Fund management. This definition may not apply for purposes of this report, which may combine subclassifications for reporting ease.
Availability of Additional Information
You can find additional information about the Fund such as the prospectus, financial information, holdings, and proxy voting information at www.arrowmarkpartners.com/meridian/. You can also request this information by contacting us at 800.446.6662.
Householding
We will deliver a single copy of prospectuses, proxies, financial reports and other communication to shareholders with the same residential address, provided they have the same last name, or we reasonably believe them to be members of the same family. Unless we are notified otherwise, we will continue to send recipients only one copy of these materials for as long as they remain a shareholder of the Fund. If you would like to receive individual mailings, please call the Funds’ transfer agent at 800.446.6662.
Meridian Growth Fund
Institutional Class | (MRRGX)
Annual SHAREHOLDER REPORT | June 30, 2024
This annual shareholder report contains important information about the Meridian Growth Fund (“Fund”) for the period of July 1, 2023 to June 30, 2024. You can also request this information by contacting us at 1-800-446-6662.
This report describes changes to the Fund that occurred during the reporting period. You can find additional information about the Fund at www.arrowmarkpartners.com/meridian/.
What were the Fund expenses for the last year?
(Based on a hypothetical $10,000 investment)
| Fund | Costs of a $10,000 investment | Costs paid as a percentage
of a $10,000 investment |
Meridian Growth Fund
(Institutional Class) | $87 | 0.87% |
What drove fund performance during the past 12 months?
U.S. equities moved higher over the 12-month period ended June 30, 2024.
In our view, resilient economic growth, a strong labor market, higher corporate earnings, and easing inflation gave investors the support they needed to look past higher interest rates and bid stocks higher.
Small cap stocks, while delivering a respectable 10% index return over the period, were generally overshadowed by the market’s narrow focus on larger, AI-related companies.
The investment strategy’s emphasis on downside protection proved effective during the period, as the strategy outperformed on eight of the nine days on which the index declined 2% or more.
Our investment process focuses on what we believe are high-quality companies with recurring revenue and sustainable competitive advantages.
The market presented a challenging landscape for our approach as high-momentum stocks outperformed [other investment strategies], creating a headwind to performance since the fund does not focus on those stocks.
From a sector perspective, positive stock selection in the industrials and healthcare sectors aided returns.
Conversely, negative stock selection in the consumer discretionary and communication services sectors were headwinds to relative performance.
The preceding information is the opinion of portfolio management only through the end of the period stated. Any such opinions are subject to change at any time based upon market or other conditions and should not be relied upon as investment advice. Past performance is no guarantee of future results, and there is no guarantee that market forecasts will be realized.
Investors should consider the investment objective and policies, risk considerations, charges and ongoing expenses of an investment carefully before investing. The prospectus contains this and other information relevant to an investment in any of the Meridian Funds. Please read the prospectus carefully before you invest. To obtain a prospectus, please contact your investment representative or the Funds' transfer agent at 1-800-446-6662 or access our website at www.arrowmarkpartners.com/meridian/.
How has the Fund historically performed?
This chart assumes an initial investment of $1,000,000 made on December 24, 2014 for Institutional Class including any applicable sales charges or fees. The performance of the other share class may be greater or less than that shown based on differences in inception dates, fees, and sales charges. Performance assumes reinvestment of dividends and capital gain distributions.
GROWTH OF $1,000,000
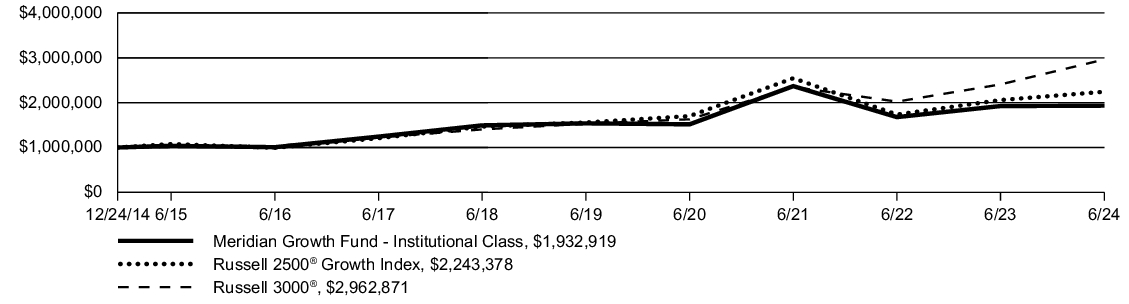
| AVERAGE ANNUAL TOTAL RETURN | 1 Year | 5 Years | 10 Years | Since Inception(1) |
| Meridian Growth Fund (Institutional Class/(MRRGX)) | 0.47% | 4.68% | 0.00% | 7.17% |
| Russell 2500® Growth Index | 9.02% | 7.58% | 8.77% | N/A(2) |
| Russell 3000® | 23.13% | 14.14% | 12.15% | 11.67% |
| (1) | Inception date of Institutional Class is 12/24/14 |
| (2) | Inception date of Institutional Class precedes the inception date of the Russell 2500® Growth Index. |
Past performance is not predictive of future performance. The graph and table do not reflect the deduction of taxes that a shareholder would pay on Fund distributions or the redemption of Fund shares and do not reflect the imposition of a 2% redemption fee on shares held 60 days or less to deter market timers. If reflected, the taxes and fees would reduce the performance quoted. Net asset value, investment return and principal value will fluctuate, so shares, when redeemed, may be worth more or less than their original cost.
| Fund net assets | $1,147,064,640% |
| Total number of portfolio holdings | $89% |
| Total advisory fee paid | $9,757,215% |
| Portfolio turnover rate as of the end of the reporting period | $33% |
| RB Global, Inc. (Canada) | 3.8% |
| Trimble, Inc. | 3.3% |
| Ziff Davis, Inc. | 3.1% |
| Churchill Downs, Inc. | 3.0% |
| Cargurus, Inc. | 3.0% |
| Sensata Technologies Holding Plc | 2.9% |
| Euronet Worldwide, Inc. | 2.8% |
| ACV Auctions, Inc. Class A | 2.8% |
| STERIS Plc | 2.8% |
| Smartsheet, Inc. Class A | 2.7% |
Portfolio holdings are subject to change and may not reflect the current or future position of the portfolio. Top ten holdings excluding short-term investments are reported as a percentage of net assets.
Sector allocations are subject to change and may not reflect the current or future position of the portfolio. Sector allocations are reported as a percentage of equity investments excluding cash or cash equivalents, Private Investment Fund & Convertible Note. As of period end, the Fund invested a significant portion of their assets in securities in the sectors. Changes in economic conditions affecting such sectors would have a greater impact on the Fund and could affect the value, income and/or liquidity of positions in such securities.
For compliance purposes, the Fund’s industry classifications may refer to any one or more of the industry sub-classifications used by one or more widely recognized market indexes or ratings group indexes, and/or as defined by Fund management. This definition may not apply for purposes of this report, which may combine subclassifications for reporting ease.
Availability of Additional Information
You can find additional information about the Fund such as the prospectus, financial information, holdings, and proxy voting information at www.arrowmarkpartners.com/meridian/. You can also request this information by contacting us at 800.446.6662.
Householding
We will deliver a single copy of prospectuses, proxies, financial reports and other communication to shareholders with the same residential address, provided they have the same last name, or we reasonably believe them to be members of the same family. Unless we are notified otherwise, we will continue to send recipients only one copy of these materials for as long as they remain a shareholder of the Fund. If you would like to receive individual mailings, please call the Funds’ transfer agent at 800.446.6662.
Meridian Growth Fund
Class A | (MRAGX)
Annual SHAREHOLDER REPORT | June 30, 2024
This annual shareholder report contains important information about the Meridian Growth Fund (“Fund”) for the period of July 1, 2023 to June 30, 2024. You can also request this information by contacting us at 1-800-446-6662.
This report describes changes to the Fund that occurred during the reporting period. You can find additional information about the Fund at www.arrowmarkpartners.com/meridian/.
What were the Fund expenses for the last year?
(Based on a hypothetical $10,000 investment)
| Fund | Costs of a $10,000 investment | Costs paid as a percentage
of a $10,000 investment |
Meridian Growth Fund
(Class A) | $107 | 1.07% |
What drove fund performance during the past 12 months?
U.S. equities moved higher over the 12-month period ended June 30, 2024.
In our view, resilient economic growth, a strong labor market, higher corporate earnings, and easing inflation gave investors the support they needed to look past higher interest rates and bid stocks higher.
Small cap stocks, while delivering a respectable 10% index return over the period, were generally overshadowed by the market’s narrow focus on larger, AI-related companies.
The investment strategy’s emphasis on downside protection proved effective during the period, as the strategy outperformed on eight of the nine days on which the index declined 2% or more.
Our investment process focuses on what we believe are high-quality companies with recurring revenue and sustainable competitive advantages.
The market presented a challenging landscape for our approach as high-momentum stocks outperformed [other investment strategies], creating a headwind to performance since the fund does not focus on those stocks.
From a sector perspective, positive stock selection in the industrials and healthcare sectors aided returns.
Conversely, negative stock selection in the consumer discretionary and communication services sectors were headwinds to relative performance.
The preceding information is the opinion of portfolio management only through the end of the period stated. Any such opinions are subject to change at any time based upon market or other conditions and should not be relied upon as investment advice. Past performance is no guarantee of future results, and there is no guarantee that market forecasts will be realized.
Investors should consider the investment objective and policies, risk considerations, charges and ongoing expenses of an investment carefully before investing. The prospectus contains this and other information relevant to an investment in any of the Meridian Funds. Please read the prospectus carefully before you invest. To obtain a prospectus, please contact your investment representative or the Funds' transfer agent at 1-800-446-6662 or access our website at www.arrowmarkpartners.com/meridian/.
How has the Fund historically performed?
This chart assumes an initial investment of $10,000 made on July 1, 2014 for Class A including any applicable sales charges or fees. The performance of the other share class may be greater or less than that shown based on differences in inception dates, fees, and sales charges. Performance assumes reinvestment of dividends and capital gain distributions.
GROWTH OF $10,000
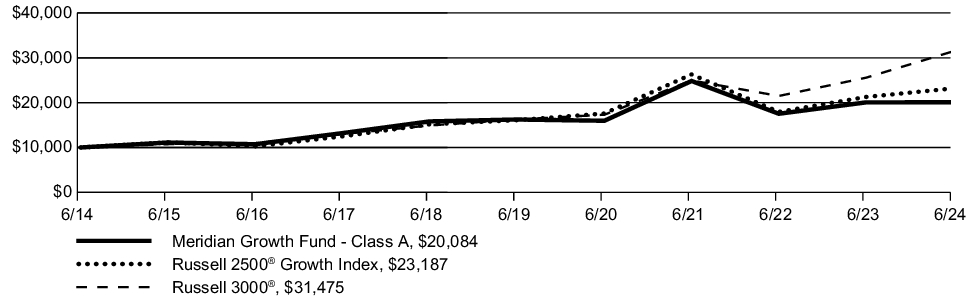
| AVERAGE ANNUAL TOTAL RETURN | 1 Year | 5 Years | 10 Years | Since Inception(1) |
| Meridian Growth Fund (Class A/(MRAGX)) | 0.25)% | 4.34% | 7.22% | 7.35% |
| Meridian Growth Fund (Class A/(MRAGX)) (2) | (5.64)% | 3.11% | 6.59% | 6.75% |
| Russell 2500® Growth Index | 9.02)% | 7.58% | 8.77% | N/A(3) |
| Russell 3000® | 23.13)% | 14.14% | 12.15% | 11.67% |
| (1) | Inception date of Class A is 11/15/13 |
| (2) | Assuming maximum sales charge, if any. Class A Shares are subject to a maximum initial sales charge of 5.75% |
| (3) | Inception date of Class A precedes the inception date of the Russell 2500® Growth Index. |
Past performance is not predictive of future performance. The graph and table do not reflect the deduction of taxes that a shareholder would pay on Fund distributions or the redemption of Fund shares and do not reflect the imposition of a 2% redemption fee on shares held 60 days or less to deter market timers. If reflected, the taxes and fees would reduce the performance quoted. Net asset value, investment return and principal value will fluctuate, so shares, when redeemed, may be worth more or less than their original cost.
| Fund net assets | $1,147,064,640% |
| Total number of portfolio holdings | $89% |
| Total advisory fee paid | $9,757,215% |
| Portfolio turnover rate as of the end of the reporting period | $33% |
| RB Global, Inc. (Canada) | 3.8% |
| Trimble, Inc. | 3.3% |
| Ziff Davis, Inc. | 3.1% |
| Churchill Downs, Inc. | 3.0% |
| Cargurus, Inc. | 3.0% |
| Sensata Technologies Holding Plc | 2.9% |
| Euronet Worldwide, Inc. | 2.8% |
| ACV Auctions, Inc. Class A | 2.8% |
| STERIS Plc | 2.8% |
| Smartsheet, Inc. Class A | 2.7% |
Portfolio holdings are subject to change and may not reflect the current or future position of the portfolio. Top ten holdings excluding short-term investments are reported as a percentage of net assets.
Sector allocations are subject to change and may not reflect the current or future position of the portfolio. Sector allocations are reported as a percentage of equity investments excluding cash or cash equivalents, Private Investment Fund & Convertible Note. As of period end, the Fund invested a significant portion of their assets in securities in the sectors. Changes in economic conditions affecting such sectors would have a greater impact on the Fund and could affect the value, income and/or liquidity of positions in such securities.
For compliance purposes, the Fund’s industry classifications may refer to any one or more of the industry sub-classifications used by one or more widely recognized market indexes or ratings group indexes, and/or as defined by Fund management. This definition may not apply for purposes of this report, which may combine subclassifications for reporting ease.
Availability of Additional Information
You can find additional information about the Fund such as the prospectus, financial information, holdings, and proxy voting information at www.arrowmarkpartners.com/meridian/. You can also request this information by contacting us at 800.446.6662.
Householding
We will deliver a single copy of prospectuses, proxies, financial reports and other communication to shareholders with the same residential address, provided they have the same last name, or we reasonably believe them to be members of the same family. Unless we are notified otherwise, we will continue to send recipients only one copy of these materials for as long as they remain a shareholder of the Fund. If you would like to receive individual mailings, please call the Funds’ transfer agent at 800.446.6662.
Meridian Growth Fund
Class C | (MRCGX)
Annual SHAREHOLDER REPORT | June 30, 2024
This annual shareholder report contains important information about the Meridian Growth Fund (“Fund”) for the period of July 1, 2023 to June 30, 2024. You can also request this information by contacting us at 1-800-446-6662.
This report describes changes to the Fund that occurred during the reporting period. You can find additional information about the Fund at www.arrowmarkpartners.com/meridian/.
What were the Fund expenses for the last year?
(Based on a hypothetical $10,000 investment)
| Fund | Costs of a $10,000 investment | Costs paid as a percentage
of a $10,000 investment |
Meridian Growth Fund
(Class C) | $178 | 1.78% |
What drove fund performance during the past 12 months?
U.S. equities moved higher over the 12-month period ended June 30, 2024.
In our view, resilient economic growth, a strong labor market, higher corporate earnings, and easing inflation gave investors the support they needed to look past higher interest rates and bid stocks higher.
Small cap stocks, while delivering a respectable 10% index return over the period, were generally overshadowed by the market’s narrow focus on larger, AI-related companies.
The investment strategy’s emphasis on downside protection proved effective during the period, as the strategy outperformed on eight of the nine days on which the index declined 2% or more.
Our investment process focuses on what we believe are high-quality companies with recurring revenue and sustainable competitive advantages.
The market presented a challenging landscape for our approach as high-momentum stocks outperformed [other investment strategies], creating a headwind to performance since the fund does not focus on those stocks.
From a sector perspective, positive stock selection in the industrials and healthcare sectors aided returns.
Conversely, negative stock selection in the consumer discretionary and communication services sectors were headwinds to relative performance.
The preceding information is the opinion of portfolio management only through the end of the period stated. Any such opinions are subject to change at any time based upon market or other conditions and should not be relied upon as investment advice. Past performance is no guarantee of future results, and there is no guarantee that market forecasts will be realized.
Investors should consider the investment objective and policies, risk considerations, charges and ongoing expenses of an investment carefully before investing. The prospectus contains this and other information relevant to an investment in any of the Meridian Funds. Please read the prospectus carefully before you invest. To obtain a prospectus, please contact your investment representative or the Funds' transfer agent at 1-800-446-6662 or access our website at www.arrowmarkpartners.com/meridian/.
How has the Fund historically performed?
This chart assumes an initial investment of $10,000 made on July 1, 2015 for Class C including any applicable sales charges or fees. The performance of the other share class may be greater or less than that shown based on differences in inception dates, fees, and sales charges. Performance assumes reinvestment of dividends and capital gain distributions.
GROWTH OF $10,000
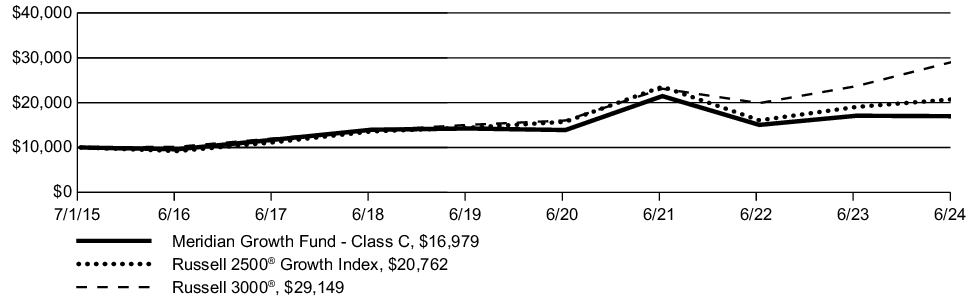
| AVERAGE ANNUAL TOTAL RETURN | 1 Year | 5 Years | 10 Years | Since Inception(1) |
| Meridian Growth Fund (Class C/(MRCGX)) | (0.43)% | 3.59% | 0.00% | 6.06% |
| Russell 2500® Growth Index | 9.02)% | 7.58% | 8.77% | N/A(2) |
| Russell 3000® | 23.13)% | 14.14% | 12.15% | 11.67% |
| (1) | Inception date of Class C is 07/01/15 |
| (2) | Inception date of Class C precedes the inception date of the Russell 2500® Growth Index. |
Past performance is not predictive of future performance. The graph and table do not reflect the deduction of taxes that a shareholder would pay on Fund distributions or the redemption of Fund shares. If reflected, the taxes and fees would reduce the performance quoted. Net asset value, investment return and principal value will fluctuate, so shares, when redeemed, may be worth more or less than their original cost.
| Fund net assets | $1,147,064,640% |
| Total number of portfolio holdings | $89% |
| Total advisory fee paid | $9,757,215% |
| Portfolio turnover rate as of the end of the reporting period | $33% |
| RB Global, Inc. (Canada) | 3.8% |
| Trimble, Inc. | 3.3% |
| Ziff Davis, Inc. | 3.1% |
| Churchill Downs, Inc. | 3.0% |
| Cargurus, Inc. | 3.0% |
| Sensata Technologies Holding Plc | 2.9% |
| Euronet Worldwide, Inc. | 2.8% |
| ACV Auctions, Inc. Class A | 2.8% |
| STERIS Plc | 2.8% |
| Smartsheet, Inc. Class A | 2.7% |
Portfolio holdings are subject to change and may not reflect the current or future position of the portfolio. Top ten holdings excluding short-term investments are reported as a percentage of net assets.
Sector allocations are subject to change and may not reflect the current or future position of the portfolio. Sector allocations are reported as a percentage of equity investments excluding cash or cash equivalents, Private Investment Fund & Convertible Note. As of period end, the Fund invested a significant portion of their assets in securities in the sectors. Changes in economic conditions affecting such sectors would have a greater impact on the Fund and could affect the value, income and/or liquidity of positions in such securities.
For compliance purposes, the Fund’s industry classifications may refer to any one or more of the industry sub-classifications used by one or more widely recognized market indexes or ratings group indexes, and/or as defined by Fund management. This definition may not apply for purposes of this report, which may combine subclassifications for reporting ease.
Availability of Additional Information
You can find additional information about the Fund such as the prospectus, financial information, holdings, and proxy voting information at www.arrowmarkpartners.com/meridian/. You can also request this information by contacting us at 800.446.6662.
Householding
We will deliver a single copy of prospectuses, proxies, financial reports and other communication to shareholders with the same residential address, provided they have the same last name, or we reasonably believe them to be members of the same family. Unless we are notified otherwise, we will continue to send recipients only one copy of these materials for as long as they remain a shareholder of the Fund. If you would like to receive individual mailings, please call the Funds’ transfer agent at 800.446.6662.
Meridian Growth Fund
Investor Class | (MRIGX)
Annual SHAREHOLDER REPORT | June 30, 2024
This annual shareholder report contains important information about the Meridian Growth Fund (“Fund”) for the period of July 1, 2023 to June 30, 2024. You can also request this information by contacting us at 1-800-446-6662.
This report describes changes to the Fund that occurred during the reporting period. You can find additional information about the Fund at www.arrowmarkpartners.com/meridian/.
What were the Fund expenses for the last year?
(Based on a hypothetical $10,000 investment)
| Fund | Costs of a $10,000 investment | Costs paid as a percentage
of a $10,000 investment |
Meridian Growth Fund
(Investor Class) | $96 | 0.96% |
What drove fund performance during the past 12 months?
U.S. equities moved higher over the 12-month period ended June 30, 2024.
In our view, resilient economic growth, a strong labor market, higher corporate earnings, and easing inflation gave investors the support they needed to look past higher interest rates and bid stocks higher.
Small cap stocks, while delivering a respectable 10% index return over the period, were generally overshadowed by the market’s narrow focus on larger, AI-related companies.
The investment strategy’s emphasis on downside protection proved effective during the period, as the strategy outperformed on eight of the nine days on which the index declined 2% or more.
Our investment process focuses on what we believe are high-quality companies with recurring revenue and sustainable competitive advantages.
The market presented a challenging landscape for our approach as high-momentum stocks outperformed [other investment strategies], creating a headwind to performance since the fund does not focus on those stocks.
From a sector perspective, positive stock selection in the industrials and healthcare sectors aided returns.
Conversely, negative stock selection in the consumer discretionary and communication services sectors were headwinds to relative performance.
The preceding information is the opinion of portfolio management only through the end of the period stated. Any such opinions are subject to change at any time based upon market or other conditions and should not be relied upon as investment advice. Past performance is no guarantee of future results, and there is no guarantee that market forecasts will be realized.
Investors should consider the investment objective and policies, risk considerations, charges and ongoing expenses of an investment carefully before investing. The prospectus contains this and other information relevant to an investment in any of the Meridian Funds. Please read the prospectus carefully before you invest. To obtain a prospectus, please contact your investment representative or the Funds' transfer agent at 1-800-446-6662 or access our website at www.arrowmarkpartners.com/meridian/.
How has the Fund historically performed?
This chart assumes an initial investment of $10,000 made on July 1, 2014 for Investor Class including any applicable sales charges or fees. The performance of the other share class may be greater or less than that shown based on differences in inception dates, fees, and sales charges. Performance assumes reinvestment of dividends and capital gain distributions.
GROWTH OF $10,000
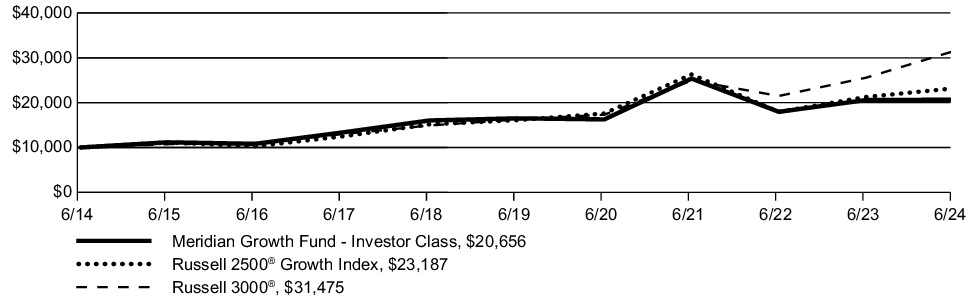
| AVERAGE ANNUAL TOTAL RETURN | 1 Year | 5 Years | 10 Years | Since Inception(1) |
| Meridian Growth Fund (Investor Class/(MRIGX)) | 0.39% | 4.59% | 7.52% | 7.65% |
| Russell 2500® Growth Index | 9.02% | 7.58% | 8.77% | N/A(2) |
| Russell 3000® | 23.13% | 14.14% | 12.15% | 11.67% |
| (1) | Inception date of Investor Class is 11/15/13 |
| (2) | Inception date of Investor Class precedes the inception date of the Russell 2500® Growth Index. |
Past performance is not predictive of future performance. The graph and table do not reflect the deduction of taxes that a shareholder would pay on Fund distributions or the redemption of Fund shares and do not reflect the imposition of a 2% redemption fee on shares held 60 days or less to deter market timers. If reflected, the taxes and fees would reduce the performance quoted. Net asset value, investment return and principal value will fluctuate, so shares, when redeemed, may be worth more or less than their original cost.
| Fund net assets | $1,147,064,640% |
| Total number of portfolio holdings | $89% |
| Total advisory fee paid | $9,757,215% |
| Portfolio turnover rate as of the end of the reporting period | $33% |
| RB Global, Inc. (Canada) | 3.8% |
| Trimble, Inc. | 3.3% |
| Ziff Davis, Inc. | 3.1% |
| Churchill Downs, Inc. | 3.0% |
| Cargurus, Inc. | 3.0% |
| Sensata Technologies Holding Plc | 2.9% |
| Euronet Worldwide, Inc. | 2.8% |
| ACV Auctions, Inc. Class A | 2.8% |
| STERIS Plc | 2.8% |
| Smartsheet, Inc. Class A | 2.7% |
Portfolio holdings are subject to change and may not reflect the current or future position of the portfolio. Top ten holdings excluding short-term investments are reported as a percentage of net assets.
Sector allocations are subject to change and may not reflect the current or future position of the portfolio. Sector allocations are reported as a percentage of equity investments excluding cash or cash equivalents, Private Investment Fund & Convertible Note. As of period end, the Fund invested a significant portion of their assets in securities in the sectors. Changes in economic conditions affecting such sectors would have a greater impact on the Fund and could affect the value, income and/or liquidity of positions in such securities.
For compliance purposes, the Fund’s industry classifications may refer to any one or more of the industry sub-classifications used by one or more widely recognized market indexes or ratings group indexes, and/or as defined by Fund management. This definition may not apply for purposes of this report, which may combine subclassifications for reporting ease.
Availability of Additional Information
You can find additional information about the Fund such as the prospectus, financial information, holdings, and proxy voting information at www.arrowmarkpartners.com/meridian/. You can also request this information by contacting us at 800.446.6662.
Householding
We will deliver a single copy of prospectuses, proxies, financial reports and other communication to shareholders with the same residential address, provided they have the same last name, or we reasonably believe them to be members of the same family. Unless we are notified otherwise, we will continue to send recipients only one copy of these materials for as long as they remain a shareholder of the Fund. If you would like to receive individual mailings, please call the Funds’ transfer agent at 800.446.6662.
Meridian Contrarian Fund
Legacy Class | (MVALX)
Annual SHAREHOLDER REPORT | June 30, 2024
This annual shareholder report contains important information about the Meridian Contrarian Fund (“Fund”) for the period of July 1, 2023 to June 30, 2024. You can also request this information by contacting us at 1-800-446-6662.
This report describes changes to the Fund that occurred during the reporting period. You can find additional information about the Fund at www.arrowmarkpartners.com/meridian/.
What were the Fund expenses for the last year?
(Based on a hypothetical $10,000 investment)
| Fund | Costs of a $10,000 investment | Costs paid as a percentage
of a $10,000 investment |
Meridian Contrarian Fund
(Legacy Class) | $119 | 1.17% |
What drove fund performance during the past 12 months?
U.S. equities moved higher over the 12-month period ended June 30, 2024.
In our view, resilient economic growth, a strong labor market, higher corporate earnings, and easing inflation gave investors the support they needed to look past higher interest rates and bid stocks higher.
Small cap stocks, while delivering a respectable 10% index return over the period, were generally overshadowed by the market’s narrow focus on larger, AI-related companies.
Experience has taught us that businesses with the potential for earnings growth and multiple expansion can be a powerful source of outperformance.
As such, we employ a fundamental research-driven process that includes screening for companies that have multiple quarters of year-over-year earnings declines; exploring the reason for the declines; and singling out the companies we believe are poised for an earnings rebound via a cohesive turnaround plan, a new management team, or through improvements or changes to the business.
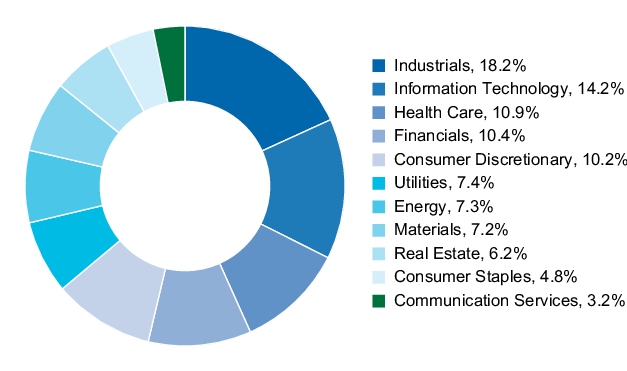
From a sector perspective, positive stock selection in the communication services and consumer discretionary sectors aided returns.
Conversely, negative stock selection in the information technology and healthcare sectors were headwinds to relative performance.
The preceding information is the opinion of portfolio management only through the end of the period stated. Any such opinions are subject to change at any time based upon market or other conditions and should not be relied upon as investment advice. Past performance is no guarantee of future results, and there is no guarantee that market forecasts will be realized.
Investors should consider the investment objective and policies, risk considerations, charges and ongoing expenses of an investment carefully before investing. The prospectus contains this and other information relevant to an investment in any of the Meridian Funds. Please read the prospectus carefully before you invest. To obtain a prospectus, please contact your investment representative or the Funds' transfer agent at 1-800-446-6662 or access our website at www.arrowmarkpartners.com/meridian/.
How has the Fund historically performed?
This chart assumes an initial investment of $10,000 made on July 1, 2014 for Legacy Class including any applicable sales charges or fees. The performance of the other share class may be greater or less than that shown based on differences in inception dates, fees, and sales charges. Performance assumes reinvestment of dividends and capital gain distributions.
GROWTH OF $10,000
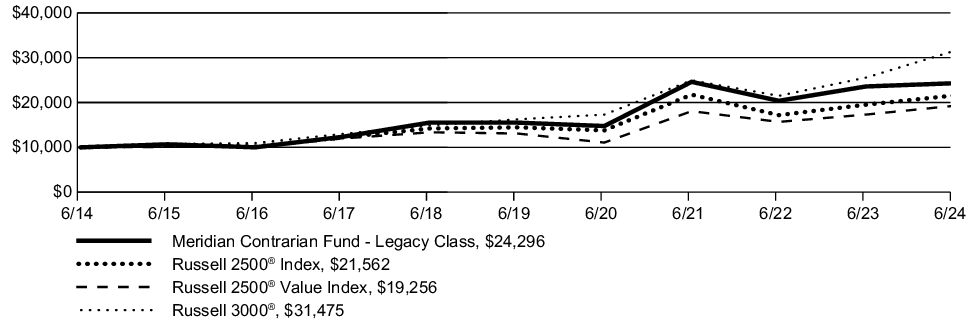
| AVERAGE ANNUAL TOTAL RETURN | 1 Year | 5 Years | 10 Years | Since Inception(1) |
| Meridian Contrarian Fund (Legacy Class/(MVALX)) | 3.02% | 9.38% | 9.28% | 12.12% |
| Russell 2500® Index | 10.47% | 8.31% | 7.99% | 9.83% |
| Russell 2500® Value Index | 11.24% | 8.01% | 6.77% | N/A(2) |
| Russell 3000® | 23.13% | 14.14% | 12.15% | 10.34% |
| (1) | Inception date of Legacy Class is 02/10/94 |
| (2) | Inception date of Legacy Class precedes the inception date of the Russell 2500® Value Index. |
Past performance is not predictive of future performance. The graph and table do not reflect the deduction of taxes that a shareholder would pay on Fund distributions or the redemption of Fund shares and do not reflect the imposition of a 2% redemption fee on shares held 60 days or less to deter market timers. If reflected, the taxes and fees would reduce the performance quoted. Net asset value, investment return and principal value will fluctuate, so shares, when redeemed, may be worth more or less than their original cost.
| Fund net assets | $564,747,899% |
| Total number of portfolio holdings | $75% |
| Total advisory fee paid | $5,824,218% |
| Portfolio turnover rate as of the end of the reporting period | $58% |
| First Citizens BancShares, Inc. Class A | 3.7% |
| CACI International, Inc. Class A | 3.6% |
| Brookfield Renewable Corp. Class A | 3.2% |
| VICI Properties, Inc. | 3.2% |
| Tenet Healthcare Corp. | 3.0% |
| Axis Capital Holdings Ltd. | 2.9% |
| SMART Global Holdings, Inc. | 2.8% |
| Cameco Corp. (Canada) | 2.6% |
| California Resources Corp. | 2.6% |
| Perrigo Co. Plc | 2.6% |
Portfolio holdings are subject to change and may not reflect the current or future position of the portfolio. Top ten holdings excluding short-term investments are reported as a percentage of net assets.
Sector allocations are subject to change and may not reflect the current or future position of the portfolio. Sector allocations are reported as a percentage of equity investments excluding cash or cash equivalents. As of period end, the Fund invested a significant portion of their assets in securities in the sectors. Changes in economic conditions affecting such sectors would have a greater impact on the Fund and could affect the value, income and/or liquidity of positions in such securities.
For compliance purposes, the Fund’s industry classifications may refer to any one or more of the industry sub-classifications used by one or more widely recognized market indexes or ratings group indexes, and/or as defined by Fund management. This definition may not apply for purposes of this report, which may combine subclassifications for reporting ease.
Availability of Additional Information
You can find additional information about the Fund such as the prospectus, financial information, holdings, and proxy voting information at www.arrowmarkpartners.com/meridian/. You can also request this information by contacting us at 800.446.6662.
Householding
We will deliver a single copy of prospectuses, proxies, financial reports and other communication to shareholders with the same residential address, provided they have the same last name, or we reasonably believe them to be members of the same family. Unless we are notified otherwise, we will continue to send recipients only one copy of these materials for as long as they remain a shareholder of the Fund. If you would like to receive individual mailings, please call the Funds’ transfer agent at 800.446.6662.
Meridian Contrarian Fund
Class A | (MFCAX)
Annual SHAREHOLDER REPORT | June 30, 2024
This annual shareholder report contains important information about the Meridian Contrarian Fund (“Fund”) for the period of July 1, 2023 to June 30, 2024. You can also request this information by contacting us at 1-800-446-6662.
This report describes changes to the Fund that occurred during the reporting period. You can find additional information about the Fund at www.arrowmarkpartners.com/meridian/.
What were the Fund expenses for the last year?
(Based on a hypothetical $10,000 investment)
| Fund | Costs of a $10,000 investment | Costs paid as a percentage
of a $10,000 investment |
Meridian Contrarian Fund
(Class A) | $146 | 1.44% |
What drove fund performance during the past 12 months?
U.S. equities moved higher over the 12-month period ended June 30, 2024.
In our view, resilient economic growth, a strong labor market, higher corporate earnings, and easing inflation gave investors the support they needed to look past higher interest rates and bid stocks higher.
Small cap stocks, while delivering a respectable 10% index return over the period, were generally overshadowed by the market’s narrow focus on larger, AI-related companies.
Experience has taught us that businesses with the potential for earnings growth and multiple expansion can be a powerful source of outperformance.
As such, we employ a fundamental research-driven process that includes screening for companies that have multiple quarters of year-over-year earnings declines; exploring the reason for the declines; and singling out the companies we believe are poised for an earnings rebound via a cohesive turnaround plan, a new management team, or through improvements or changes to the business.
From a sector perspective, positive stock selection in the communication services and consumer discretionary sectors aided returns.
Conversely, negative stock selection in the information technology and healthcare sectors were headwinds to relative performance.
The preceding information is the opinion of portfolio management only through the end of the period stated. Any such opinions are subject to change at any time based upon market or other conditions and should not be relied upon as investment advice. Past performance is no guarantee of future results, and there is no guarantee that market forecasts will be realized.
Investors should consider the investment objective and policies, risk considerations, charges and ongoing expenses of an investment carefully before investing. The prospectus contains this and other information relevant to an investment in any of the Meridian Funds. Please read the prospectus carefully before you invest. To obtain a prospectus, please contact your investment representative or the Funds' transfer agent at 1-800-446-6662 or access our website at www.arrowmarkpartners.com/meridian/.
How has the Fund historically performed?
This chart assumes an initial investment of $10,000 made on July 1, 2014 for Class A including any applicable sales charges or fees. The performance of the other share class may be greater or less than that shown based on differences in inception dates, fees, and sales charges. Performance assumes reinvestment of dividends and capital gain distributions.
GROWTH OF $10,000
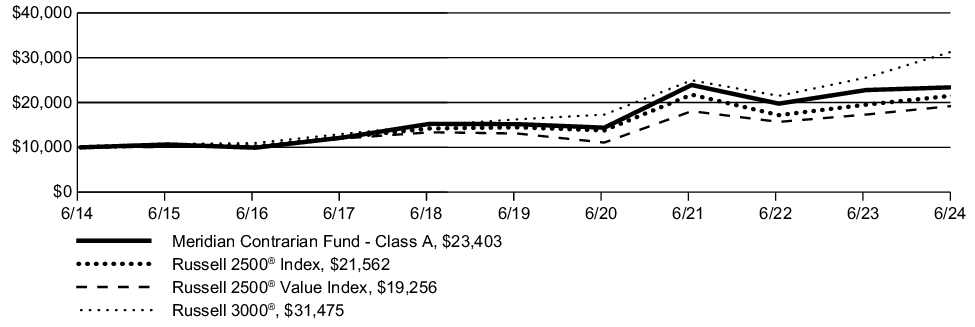
| AVERAGE ANNUAL TOTAL RETURN | 1 Year | 5 Years | 10 Years | Since Inception(1) |
| Meridian Contrarian Fund (Class A/(MFCAX)) | 2.74)% | 9.05% | 8.87% | 9.02% |
| Meridian Contrarian Fund (Class A/(MFCAX)) (2) | (3.16)% | 7.77% | 8.23% | 8.41% |
| Russell 2500® Index | 10.47)% | 8.31% | 7.99% | 9.83% |
| Russell 2500® Value Index | 11.24)% | 8.01% | 6.77% | N/A(3) |
| Russell 3000® | 23.13)% | 14.14% | 12.15% | 10.34% |
| (1) | Inception date of Class A is 11/15/13 |
| (2) | Assuming maximum sales charge, if any. Class A Shares are subject to a maximum initial sales charge of 5.75% |
| (3) | Inception date of Class A precedes the inception date of the Russell 2500® Value Index. |
Past performance is not predictive of future performance. The graph and table do not reflect the deduction of taxes that a shareholder would pay on Fund distributions or the redemption of Fund shares and do not reflect the imposition of a 2% redemption fee on shares held 60 days or less to deter market timers. If reflected, the taxes and fees would reduce the performance quoted. Net asset value, investment return and principal value will fluctuate, so shares, when redeemed, may be worth more or less than their original cost.
| Fund net assets | $564,747,899% |
| Total number of portfolio holdings | $75% |
| Total advisory fee paid | $5,824,218% |
| Portfolio turnover rate as of the end of the reporting period | $58% |
| First Citizens BancShares, Inc. Class A | 3.7% |
| CACI International, Inc. Class A | 3.6% |
| Brookfield Renewable Corp. Class A | 3.2% |
| VICI Properties, Inc. | 3.2% |
| Tenet Healthcare Corp. | 3.0% |
| Axis Capital Holdings Ltd. | 2.9% |
| SMART Global Holdings, Inc. | 2.8% |
| Cameco Corp. (Canada) | 2.6% |
| California Resources Corp. | 2.6% |
| Perrigo Co. Plc | 2.6% |
Portfolio holdings are subject to change and may not reflect the current or future position of the portfolio. Top ten holdings excluding short-term investments are reported as a percentage of net assets.
Sector allocations are subject to change and may not reflect the current or future position of the portfolio. Sector allocations are reported as a percentage of equity investments excluding cash or cash equivalents. As of period end, the Fund invested a significant portion of their assets in securities in the sectors. Changes in economic conditions affecting such sectors would have a greater impact on the Fund and could affect the value, income and/or liquidity of positions in such securities.
For compliance purposes, the Fund’s industry classifications may refer to any one or more of the industry sub-classifications used by one or more widely recognized market indexes or ratings group indexes, and/or as defined by Fund management. This definition may not apply for purposes of this report, which may combine subclassifications for reporting ease.
Availability of Additional Information
You can find additional information about the Fund such as the prospectus, financial information, holdings, and proxy voting information at www.arrowmarkpartners.com/meridian/. You can also request this information by contacting us at 800.446.6662.
Householding
We will deliver a single copy of prospectuses, proxies, financial reports and other communication to shareholders with the same residential address, provided they have the same last name, or we reasonably believe them to be members of the same family. Unless we are notified otherwise, we will continue to send recipients only one copy of these materials for as long as they remain a shareholder of the Fund. If you would like to receive individual mailings, please call the Funds’ transfer agent at 800.446.6662.
Meridian Contrarian Fund
Class C | (MFCCX)
Annual SHAREHOLDER REPORT | June 30, 2024
This annual shareholder report contains important information about the Meridian Contrarian Fund (“Fund”) for the period of July 1, 2023 to June 30, 2024. You can also request this information by contacting us at 1-800-446-6662.
This report describes changes to the Fund that occurred during the reporting period. You can find additional information about the Fund at www.arrowmarkpartners.com/meridian/.
What were the Fund expenses for the last year?
(Based on a hypothetical $10,000 investment)
| Fund | Costs of a $10,000 investment | Costs paid as a percentage
of a $10,000 investment |
Meridian Contrarian Fund
(Class C) | $225 | 2.23% |
What drove fund performance during the past 12 months?
U.S. equities moved higher over the 12-month period ended June 30, 2024.
In our view, resilient economic growth, a strong labor market, higher corporate earnings, and easing inflation gave investors the support they needed to look past higher interest rates and bid stocks higher.
Small cap stocks, while delivering a respectable 10% index return over the period, were generally overshadowed by the market’s narrow focus on larger, AI-related companies.
Experience has taught us that businesses with the potential for earnings growth and multiple expansion can be a powerful source of outperformance.
As such, we employ a fundamental research-driven process that includes screening for companies that have multiple quarters of year-over-year earnings declines; exploring the reason for the declines; and singling out the companies we believe are poised for an earnings rebound via a cohesive turnaround plan, a new management team, or through improvements or changes to the business.
From a sector perspective, positive stock selection in the communication services and consumer discretionary sectors aided returns.
Conversely, negative stock selection in the information technology and healthcare sectors were headwinds to relative performance.
The preceding information is the opinion of portfolio management only through the end of the period stated. Any such opinions are subject to change at any time based upon market or other conditions and should not be relied upon as investment advice. Past performance is no guarantee of future results, and there is no guarantee that market forecasts will be realized.
Investors should consider the investment objective and policies, risk considerations, charges and ongoing expenses of an investment carefully before investing. The prospectus contains this and other information relevant to an investment in any of the Meridian Funds. Please read the prospectus carefully before you invest. To obtain a prospectus, please contact your investment representative or the Funds' transfer agent at 1-800-446-6662 or access our website at www.arrowmarkpartners.com/meridian/.
How has the Fund historically performed?
This chart assumes an initial investment of $10,000 made on July 1, 2015 for Class C including any applicable sales charges or fees. The performance of the other share class may be greater or less than that shown based on differences in inception dates, fees, and sales charges. Performance assumes reinvestment of dividends and capital gain distributions.
GROWTH OF $10,000
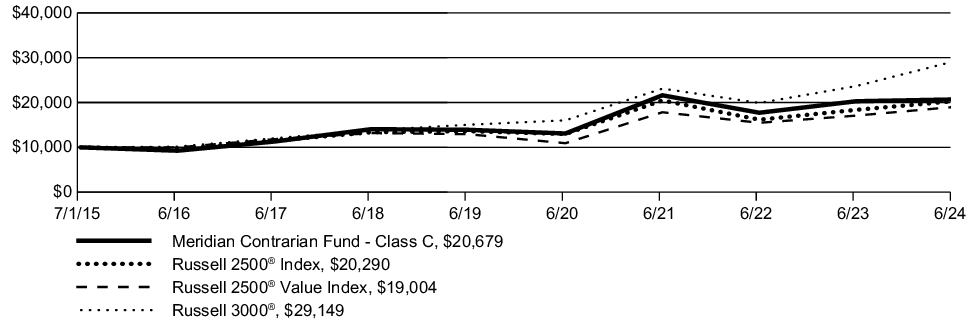
| AVERAGE ANNUAL TOTAL RETURN | 1 Year | 5 Years | 10 Years | Since Inception(1) |
| Meridian Contrarian Fund (Class C/(MFCCX)) | 1.93% | 8.25% | 0.00% | 8.41% |
| Russell 2500® Index | 10.47% | 8.31% | 7.99% | 9.83% |
| Russell 2500® Value Index | 11.24% | 8.01% | 6.77% | N/A(2) |
| Russell 3000® | 23.13% | 14.14% | 12.15% | 10.34% |
| (1) | Inception date of Class C is 07/01/15 |
| (2) | Inception date of Class C precedes the inception date of the Russell 2500® Value Index. |
Past performance is not predictive of future performance. The graph and table do not reflect the deduction of taxes that a shareholder would pay on Fund distributions or the redemption of Fund shares. If reflected, the taxes and fees would reduce the performance quoted. Net asset value, investment return and principal value will fluctuate, so shares, when redeemed, may be worth more or less than their original cost.
| Fund net assets | $564,747,899% |
| Total number of portfolio holdings | $75% |
| Total advisory fee paid | $5,824,218% |
| Portfolio turnover rate as of the end of the reporting period | $58% |
| First Citizens BancShares, Inc. Class A | 3.7% |
| CACI International, Inc. Class A | 3.6% |
| Brookfield Renewable Corp. Class A | 3.2% |
| VICI Properties, Inc. | 3.2% |
| Tenet Healthcare Corp. | 3.0% |
| Axis Capital Holdings Ltd. | 2.9% |
| SMART Global Holdings, Inc. | 2.8% |
| Cameco Corp. (Canada) | 2.6% |
| California Resources Corp. | 2.6% |
| Perrigo Co. Plc | 2.6% |
Portfolio holdings are subject to change and may not reflect the current or future position of the portfolio. Top ten holdings excluding short-term investments are reported as a percentage of net assets.
Sector allocations are subject to change and may not reflect the current or future position of the portfolio. Sector allocations are reported as a percentage of equity investments excluding cash or cash equivalents. As of period end, the Fund invested a significant portion of their assets in securities in the sectors. Changes in economic conditions affecting such sectors would have a greater impact on the Fund and could affect the value, income and/or liquidity of positions in such securities.
For compliance purposes, the Fund’s industry classifications may refer to any one or more of the industry sub-classifications used by one or more widely recognized market indexes or ratings group indexes, and/or as defined by Fund management. This definition may not apply for purposes of this report, which may combine subclassifications for reporting ease.
Availability of Additional Information
You can find additional information about the Fund such as the prospectus, financial information, holdings, and proxy voting information at www.arrowmarkpartners.com/meridian/. You can also request this information by contacting us at 800.446.6662.
Householding
We will deliver a single copy of prospectuses, proxies, financial reports and other communication to shareholders with the same residential address, provided they have the same last name, or we reasonably believe them to be members of the same family. Unless we are notified otherwise, we will continue to send recipients only one copy of these materials for as long as they remain a shareholder of the Fund. If you would like to receive individual mailings, please call the Funds’ transfer agent at 800.446.6662.
Meridian Contrarian Fund
Investor Class | (MFCIX)
Annual SHAREHOLDER REPORT | June 30, 2024
This annual shareholder report contains important information about the Meridian Contrarian Fund (“Fund”) for the period of July 1, 2023 to June 30, 2024. You can also request this information by contacting us at 1-800-446-6662.
This report describes changes to the Fund that occurred during the reporting period. You can find additional information about the Fund at www.arrowmarkpartners.com/meridian/.
What were the Fund expenses for the last year?
(Based on a hypothetical $10,000 investment)
| Fund | Costs of a $10,000 investment | Costs paid as a percentage
of a $10,000 investment |
Meridian Contrarian Fund
(Investor Class) | $122 | 1.20% |
What drove fund performance during the past 12 months?
U.S. equities moved higher over the 12-month period ended June 30, 2024.
In our view, resilient economic growth, a strong labor market, higher corporate earnings, and easing inflation gave investors the support they needed to look past higher interest rates and bid stocks higher.
Small cap stocks, while delivering a respectable 10% index return over the period, were generally overshadowed by the market’s narrow focus on larger, AI-related companies.
Experience has taught us that businesses with the potential for earnings growth and multiple expansion can be a powerful source of outperformance.
As such, we employ a fundamental research-driven process that includes screening for companies that have multiple quarters of year-over-year earnings declines; exploring the reason for the declines; and singling out the companies we believe are poised for an earnings rebound via a cohesive turnaround plan, a new management team, or through improvements or changes to the business.
From a sector perspective, positive stock selection in the communication services and consumer discretionary sectors aided returns.
Conversely, negative stock selection in the information technology and healthcare sectors were headwinds to relative performance.
The preceding information is the opinion of portfolio management only through the end of the period stated. Any such opinions are subject to change at any time based upon market or other conditions and should not be relied upon as investment advice. Past performance is no guarantee of future results, and there is no guarantee that market forecasts will be realized.
Investors should consider the investment objective and policies, risk considerations, charges and ongoing expenses of an investment carefully before investing. The prospectus contains this and other information relevant to an investment in any of the Meridian Funds. Please read the prospectus carefully before you invest. To obtain a prospectus, please contact your investment representative or the Funds' transfer agent at 1-800-446-6662 or access our website at www.arrowmarkpartners.com/meridian/.
How has the Fund historically performed?
This chart assumes an initial investment of $10,000 made on July 1, 2014 for Investor Class including any applicable sales charges or fees. The performance of the other share class may be greater or less than that shown based on differences in inception dates, fees, and sales charges. Performance assumes reinvestment of dividends and capital gain distributions.
GROWTH OF $10,000

| AVERAGE ANNUAL TOTAL RETURN | 1 Year | 5 Years | 10 Years | Since Inception(1) |
| Meridian Contrarian Fund (Investor Class/(MFCIX)) | 3.00% | 9.33% | 9.16% | 9.30% |
| Russell 2500® Index | 10.47% | 8.31% | 7.99% | 9.83% |
| Russell 2500® Value Index | 11.24% | 8.01% | 6.77% | N/A(2) |
| Russell 3000® | 23.13% | 14.14% | 12.15% | 10.34% |
| (1) | Inception date of Investor Class is 11/15/13 |
| (2) | Inception date of Investor Class precedes the inception date of the Russell 2500® Value Index. |
Past performance is not predictive of future performance. The graph and table do not reflect the deduction of taxes that a shareholder would pay on Fund distributions or the redemption of Fund shares and do not reflect the imposition of a 2% redemption fee on shares held 60 days or less to deter market timers. If reflected, the taxes and fees would reduce the performance quoted. Net asset value, investment return and principal value will fluctuate, so shares, when redeemed, may be worth more or less than their original cost.
| Fund net assets | $564,747,899% |
| Total number of portfolio holdings | $75% |
| Total advisory fee paid | $5,824,218% |
| Portfolio turnover rate as of the end of the reporting period | $58% |
| First Citizens BancShares, Inc. Class A | 3.7% |
| CACI International, Inc. Class A | 3.6% |
| Brookfield Renewable Corp. Class A | 3.2% |
| VICI Properties, Inc. | 3.2% |
| Tenet Healthcare Corp. | 3.0% |
| Axis Capital Holdings Ltd. | 2.9% |
| SMART Global Holdings, Inc. | 2.8% |
| Cameco Corp. (Canada) | 2.6% |
| California Resources Corp. | 2.6% |
| Perrigo Co. Plc | 2.6% |
Portfolio holdings are subject to change and may not reflect the current or future position of the portfolio. Top ten holdings excluding short-term investments are reported as a percentage of net assets.
Sector allocations are subject to change and may not reflect the current or future position of the portfolio. Sector allocations are reported as a percentage of equity investments excluding cash or cash equivalents. As of period end, the Fund invested a significant portion of their assets in securities in the sectors. Changes in economic conditions affecting such sectors would have a greater impact on the Fund and could affect the value, income and/or liquidity of positions in such securities.
For compliance purposes, the Fund’s industry classifications may refer to any one or more of the industry sub-classifications used by one or more widely recognized market indexes or ratings group indexes, and/or as defined by Fund management. This definition may not apply for purposes of this report, which may combine subclassifications for reporting ease.
Availability of Additional Information
You can find additional information about the Fund such as the prospectus, financial information, holdings, and proxy voting information at www.arrowmarkpartners.com/meridian/. You can also request this information by contacting us at 800.446.6662.
Householding
We will deliver a single copy of prospectuses, proxies, financial reports and other communication to shareholders with the same residential address, provided they have the same last name, or we reasonably believe them to be members of the same family. Unless we are notified otherwise, we will continue to send recipients only one copy of these materials for as long as they remain a shareholder of the Fund. If you would like to receive individual mailings, please call the Funds’ transfer agent at 800.446.6662.
Meridian Hedged Equity Fund
Legacy Class | (MEIFX)
Annual SHAREHOLDER REPORT | June 30, 2024
This annual shareholder report contains important information about the Meridian Hedged Equity Fund (“Fund”) for the period of July 1, 2023 to June 30, 2024. You can also request this information by contacting us at 1-800-446-6662.
This report describes changes to the Fund that occurred during the reporting period. You can find additional information about the Fund at www.arrowmarkpartners.com/meridian/.
What were the Fund expenses for the last year?
(Based on a hypothetical $10,000 investment)
| Fund | Costs of a $10,000 investment | Costs paid as a percentage
of a $10,000 investment |
Meridian Hedged Equity Fund
(Legacy Class) | $134 | 1.25% |
What drove fund performance during the past 12 months?
U.S. equities moved higher over the 12-month period ended June 30, 2024.
In our view, resilient economic growth, a strong labor market, higher corporate earnings, and easing inflation gave investors the support they needed to look past higher interest rates and bid stocks higher.
Large-cap growth companies’ index returned 33.5% while all large caps’ index returned 23.9%.
At period end, approximately 40% of the portfolio was unhedged, with long-term capital growth the primary objective.
The rest of the Fund is invested in companies with covered call options, a strategy that seeks to balance the capital growth potential of the underlying companies with downside protection provided by the income generated from writing options.
The contracts we write are structured to allow our fundamental thesis to play out while the strategy gains valuable income and potential downside protection.
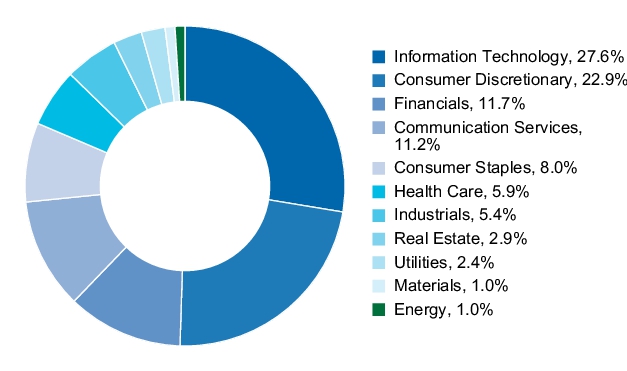
Contributing positively to performance, were several names in the information technology sector.
Conversely, select holdings in the consumer discretionary sector detracted from relative performance.
The preceding information is the opinion of portfolio management only through the end of the period stated. Any such opinions are subject to change at any time based upon market or other conditions and should not be relied upon as investment advice. Past performance is no guarantee of future results, and there is no guarantee that market forecasts will be realized.
Investors should consider the investment objective and policies, risk considerations, charges and ongoing expenses of an investment carefully before investing. The prospectus contains this and other information relevant to an investment in any of the Meridian Funds. Please read the prospectus carefully before you invest. To obtain a prospectus, please contact your investment representative or the Funds' transfer agent at 1-800-446-6662 or access our website at www.arrowmarkpartners.com/meridian/.
How has the Fund historically performed?
This chart assumes an initial investment of $10,000 made on July 1, 2014 for Legacy Class including any applicable sales charges or fees. The performance of the other share class may be greater or less than that shown based on differences in inception dates, fees, and sales charges. Performance assumes reinvestment of dividends and capital gain distributions.
GROWTH OF $10,000

| AVERAGE ANNUAL TOTAL RETURN | 1 Year | 5 Years | 10 Years | Since Inception(1) |
| Meridian Hedged Equity Fund (Legacy Class/(MEIFX)) | 14.37% | 11.21% | 12.09% | 9.84% |
| S&P 500® Index | 24.56% | 15.05% | 12.86% | 10.36% |
| CBOE S&P 500 Buy Write Index | 8.91% | 5.56% | 5.77% | 5.46% |
| (1) | Inception date of Legacy Class is 01/31/05 |
Past performance is not predictive of future performance. The graph and table do not reflect the deduction of taxes that a shareholder would pay on Fund distributions or the redemption of Fund shares and do not reflect the imposition of a 2% redemption fee on shares held 60 days or less to deter market timers. If reflected, the taxes and fees would reduce the performance quoted. Net asset value, investment return and principal value will fluctuate, so shares, when redeemed, may be worth more or less than their original cost.
| Fund net assets | $45,273,958% |
| Total number of portfolio holdings | $113% |
| Total advisory fee paid | $325,145% |
| Portfolio turnover rate as of the end of the reporting period | $33% |
| NVIDIA Corp. | 7.8% |
| QUALCOMM, Inc. | 5.4% |
| D.R. Horton, Inc. | 4.2% |
| Live Nation Entertainment, Inc. | 4.0% |
| Sally Beauty Holdings, Inc. | 4.0% |
| Clear Secure, Inc. Class A | 4.0% |
| MGM Resorts International | 3.8% |
| Alibaba Group Holding Ltd. (China) | 3.6% |
| Illumina, Inc. | 3.5% |
| Charles Schwab Corp. (The) | 3.2% |
Portfolio holdings are subject to change and may not reflect the current or future position of the portfolio. Top ten holdings excluding short-term investments are reported as a percentage of net assets.
Sector allocations are subject to change and may not reflect the current or future position of the portfolio. Sector allocations are reported as a percentage of equity investments excluding cash or cash equivalents. As of period end, the Fund invested a significant portion of their assets in securities in the sectors. Changes in economic conditions affecting such sectors would have a greater impact on the Fund and could affect the value, income and/or liquidity of positions in such securities.
For compliance purposes, the Fund’s industry classifications may refer to any one or more of the industry sub-classifications used by one or more widely recognized market indexes or ratings group indexes, and/or as defined by Fund management. This definition may not apply for purposes of this report, which may combine subclassifications for reporting ease.
Availability of Additional Information
You can find additional information about the Fund such as the prospectus, financial information, holdings, and proxy voting information at www.arrowmarkpartners.com/meridian/. You can also request this information by contacting us at 800.446.6662.
Householding
We will deliver a single copy of prospectuses, proxies, financial reports and other communication to shareholders with the same residential address, provided they have the same last name, or we reasonably believe them to be members of the same family. Unless we are notified otherwise, we will continue to send recipients only one copy of these materials for as long as they remain a shareholder of the Fund. If you would like to receive individual mailings, please call the Funds’ transfer agent at 800.446.6662.
Meridian Hedged Equity Fund
Class A | (MRAEX)
Annual SHAREHOLDER REPORT | June 30, 2024
This annual shareholder report contains important information about the Meridian Hedged Equity Fund (“Fund”) for the period of July 1, 2023 to June 30, 2024. You can also request this information by contacting us at 1-800-446-6662.
This report describes changes to the Fund that occurred during the reporting period. You can find additional information about the Fund at www.arrowmarkpartners.com/meridian/.
What were the Fund expenses for the last year?
(Based on a hypothetical $10,000 investment)
| Fund | Costs of a $10,000 investment | Costs paid as a percentage
of a $10,000 investment |
Meridian Hedged Equity Fund
(Class A) | $164 | 1.53% |
What drove fund performance during the past 12 months?
U.S. equities moved higher over the 12-month period ended June 30, 2024.
In our view, resilient economic growth, a strong labor market, higher corporate earnings, and easing inflation gave investors the support they needed to look past higher interest rates and bid stocks higher.
Large-cap growth companies’ index returned 33.5% while all large caps’ index returned 23.9%.
At period end, approximately 40% of the portfolio was unhedged, with long-term capital growth the primary objective.
The rest of the Fund is invested in companies with covered call options, a strategy that seeks to balance the capital growth potential of the underlying companies with downside protection provided by the income generated from writing options.
The contracts we write are structured to allow our fundamental thesis to play out while the strategy gains valuable income and potential downside protection.
Contributing positively to performance, were several names in the information technology sector.
Conversely, select holdings in the consumer discretionary sector detracted from relative performance.
The preceding information is the opinion of portfolio management only through the end of the period stated. Any such opinions are subject to change at any time based upon market or other conditions and should not be relied upon as investment advice. Past performance is no guarantee of future results, and there is no guarantee that market forecasts will be realized.
Investors should consider the investment objective and policies, risk considerations, charges and ongoing expenses of an investment carefully before investing. The prospectus contains this and other information relevant to an investment in any of the Meridian Funds. Please read the prospectus carefully before you invest. To obtain a prospectus, please contact your investment representative or the Funds' transfer agent at 1-800-446-6662 or access our website at www.arrowmarkpartners.com/meridian/.
How has the Fund historically performed?
This chart assumes an initial investment of $10,000 made on July 1, 2014 for Class A including any applicable sales charges or fees. The performance of the other share class may be greater or less than that shown based on differences in inception dates, fees, and sales charges. Performance assumes reinvestment of dividends and capital gain distributions.
GROWTH OF $10,000
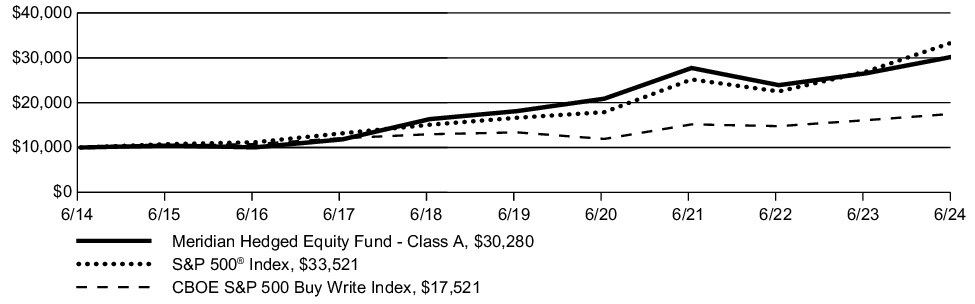
| AVERAGE ANNUAL TOTAL RETURN | 1 Year | 5 Years | 10 Years | Since Inception(1) |
| Meridian Hedged Equity Fund (Class A/(MRAEX)) | 14.09% | 10.83% | 11.72% | 11.67% |
| Meridian Hedged Equity Fund (Class A/(MRAEX)) (2) | 7.51% | 9.52% | 11.06% | 11.05% |
| S&P 500® Index | 24.56% | 15.05% | 12.86% | 10.36% |
| CBOE S&P 500 Buy Write Index | 8.91% | 5.56% | 5.77% | 5.46% |
| (1) | Inception date of Class A is 11/15/13 |
| (2) | Assuming maximum sales charge, if any. Class A Shares are subject to a maximum initial sales charge of 5.75% |
Past performance is not predictive of future performance. The graph and table do not reflect the deduction of taxes that a shareholder would pay on Fund distributions or the redemption of Fund shares and do not reflect the imposition of a 2% redemption fee on shares held 60 days or less to deter market timers. If reflected, the taxes and fees would reduce the performance quoted. Net asset value, investment return and principal value will fluctuate, so shares, when redeemed, may be worth more or less than their original cost.
| Fund net assets | $45,273,958% |
| Total number of portfolio holdings | $113% |
| Total advisory fee paid | $325,145% |
| Portfolio turnover rate as of the end of the reporting period | $33% |
| NVIDIA Corp. | 7.8% |
| QUALCOMM, Inc. | 5.4% |
| D.R. Horton, Inc. | 4.2% |
| Live Nation Entertainment, Inc. | 4.0% |
| Sally Beauty Holdings, Inc. | 4.0% |
| Clear Secure, Inc. Class A | 4.0% |
| MGM Resorts International | 3.8% |
| Alibaba Group Holding Ltd. (China) | 3.6% |
| Illumina, Inc. | 3.5% |
| Charles Schwab Corp. (The) | 3.2% |
Portfolio holdings are subject to change and may not reflect the current or future position of the portfolio. Top ten holdings excluding short-term investments are reported as a percentage of net assets.
Sector allocations are subject to change and may not reflect the current or future position of the portfolio. Sector allocations are reported as a percentage of equity investments excluding cash or cash equivalents. As of period end, the Fund invested a significant portion of their assets in securities in the sectors. Changes in economic conditions affecting such sectors would have a greater impact on the Fund and could affect the value, income and/or liquidity of positions in such securities.
For compliance purposes, the Fund’s industry classifications may refer to any one or more of the industry sub-classifications used by one or more widely recognized market indexes or ratings group indexes, and/or as defined by Fund management. This definition may not apply for purposes of this report, which may combine subclassifications for reporting ease.
Availability of Additional Information
You can find additional information about the Fund such as the prospectus, financial information, holdings, and proxy voting information at www.arrowmarkpartners.com/meridian/. You can also request this information by contacting us at 800.446.6662.
Householding
We will deliver a single copy of prospectuses, proxies, financial reports and other communication to shareholders with the same residential address, provided they have the same last name, or we reasonably believe them to be members of the same family. Unless we are notified otherwise, we will continue to send recipients only one copy of these materials for as long as they remain a shareholder of the Fund. If you would like to receive individual mailings, please call the Funds’ transfer agent at 800.446.6662.
Meridian Hedged Equity Fund
Class C | (MRCEX)
Annual SHAREHOLDER REPORT | June 30, 2024
This annual shareholder report contains important information about the Meridian Hedged Equity Fund (“Fund”) for the period of July 1, 2023 to June 30, 2024. You can also request this information by contacting us at 1-800-446-6662.
This report describes changes to the Fund that occurred during the reporting period. You can find additional information about the Fund at www.arrowmarkpartners.com/meridian/.
What were the Fund expenses for the last year?
(Based on a hypothetical $10,000 investment)
| Fund | Costs of a $10,000 investment | Costs paid as a percentage
of a $10,000 investment |
Meridian Hedged Equity Fund
(Class C) | $231 | 2.17% |
What drove fund performance during the past 12 months?
U.S. equities moved higher over the 12-month period ended June 30, 2024.
In our view, resilient economic growth, a strong labor market, higher corporate earnings, and easing inflation gave investors the support they needed to look past higher interest rates and bid stocks higher.
Large-cap growth companies’ index returned 33.5% while all large caps’ index returned 23.9%.
At period end, approximately 40% of the portfolio was unhedged, with long-term capital growth the primary objective.
The rest of the Fund is invested in companies with covered call options, a strategy that seeks to balance the capital growth potential of the underlying companies with downside protection provided by the income generated from writing options.
The contracts we write are structured to allow our fundamental thesis to play out while the strategy gains valuable income and potential downside protection.
Contributing positively to performance, were several names in the information technology sector.
Conversely, select holdings in the consumer discretionary sector detracted from relative performance.
The preceding information is the opinion of portfolio management only through the end of the period stated. Any such opinions are subject to change at any time based upon market or other conditions and should not be relied upon as investment advice. Past performance is no guarantee of future results, and there is no guarantee that market forecasts will be realized.
Investors should consider the investment objective and policies, risk considerations, charges and ongoing expenses of an investment carefully before investing. The prospectus contains this and other information relevant to an investment in any of the Meridian Funds. Please read the prospectus carefully before you invest. To obtain a prospectus, please contact your investment representative or the Funds' transfer agent at 1-800-446-6662 or access our website at www.arrowmarkpartners.com/meridian/.
How has the Fund historically performed?
This chart assumes an initial investment of $10,000 made on July 1, 2015 for Class C including any applicable sales charges or fees. The performance of the other share class may be greater or less than that shown based on differences in inception dates, fees, and sales charges. Performance assumes reinvestment of dividends and capital gain distributions.
GROWTH OF $10,000
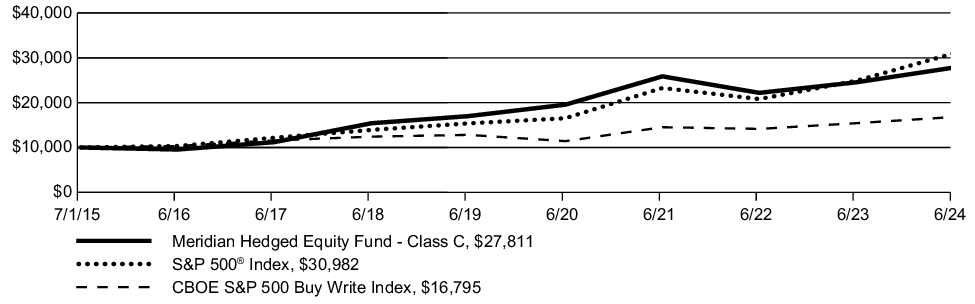
| AVERAGE ANNUAL TOTAL RETURN | 1 Year | 5 Years | 10 Years | Since Inception(1) |
| Meridian Hedged Equity Fund (Class C/(MRCEX)) | 13.35% | 10.36% | 0.00% | 12.04% |
| S&P 500® Index | 24.56% | 15.05% | 12.86% | 10.36% |
| CBOE S&P 500 Buy Write Index | 8.91% | 5.56% | 5.77% | 5.46% |
| (1) | Inception date of Class C is 07/01/15 |
Past performance is not predictive of future performance. The graph and table do not reflect the deduction of taxes that a shareholder would pay on Fund distributions or the redemption of Fund shares. If reflected, the taxes and fees would reduce the performance quoted. Net asset value, investment return and principal value will fluctuate, so shares, when redeemed, may be worth more or less than their original cost.
| Fund net assets | $45,273,958% |
| Total number of portfolio holdings | $113% |
| Total advisory fee paid | $325,145% |
| Portfolio turnover rate as of the end of the reporting period | $33% |
| NVIDIA Corp. | 7.8% |
| QUALCOMM, Inc. | 5.4% |
| D.R. Horton, Inc. | 4.2% |
| Live Nation Entertainment, Inc. | 4.0% |
| Sally Beauty Holdings, Inc. | 4.0% |
| Clear Secure, Inc. Class A | 4.0% |
| MGM Resorts International | 3.8% |
| Alibaba Group Holding Ltd. (China) | 3.6% |
| Illumina, Inc. | 3.5% |
| Charles Schwab Corp. (The) | 3.2% |
Portfolio holdings are subject to change and may not reflect the current or future position of the portfolio. Top ten holdings excluding short-term investments are reported as a percentage of net assets.
Sector allocations are subject to change and may not reflect the current or future position of the portfolio. Sector allocations are reported as a percentage of equity investments excluding cash or cash equivalents. As of period end, the Fund invested a significant portion of their assets in securities in the sectors. Changes in economic conditions affecting such sectors would have a greater impact on the Fund and could affect the value, income and/or liquidity of positions in such securities.
For compliance purposes, the Fund’s industry classifications may refer to any one or more of the industry sub-classifications used by one or more widely recognized market indexes or ratings group indexes, and/or as defined by Fund management. This definition may not apply for purposes of this report, which may combine subclassifications for reporting ease.
Availability of Additional Information
You can find additional information about the Fund such as the prospectus, financial information, holdings, and proxy voting information at www.arrowmarkpartners.com/meridian/. You can also request this information by contacting us at 800.446.6662.
Householding
We will deliver a single copy of prospectuses, proxies, financial reports and other communication to shareholders with the same residential address, provided they have the same last name, or we reasonably believe them to be members of the same family. Unless we are notified otherwise, we will continue to send recipients only one copy of these materials for as long as they remain a shareholder of the Fund. If you would like to receive individual mailings, please call the Funds’ transfer agent at 800.446.6662.
Meridian Hedged Equity Fund
Investor Class | (MRIEX)
Annual SHAREHOLDER REPORT | June 30, 2024
This annual shareholder report contains important information about the Meridian Hedged Equity Fund (“Fund”) for the period of July 1, 2023 to June 30, 2024. You can also request this information by contacting us at 1-800-446-6662.
This report describes changes to the Fund that occurred during the reporting period. You can find additional information about the Fund at www.arrowmarkpartners.com/meridian/.
What were the Fund expenses for the last year?
(Based on a hypothetical $10,000 investment)
| Fund | Costs of a $10,000 investment | Costs paid as a percentage
of a $10,000 investment |
Meridian Hedged Equity Fund
(Investor Class) | $137 | 1.28% |
What drove fund performance during the past 12 months?
U.S. equities moved higher over the 12-month period ended June 30, 2024.
In our view, resilient economic growth, a strong labor market, higher corporate earnings, and easing inflation gave investors the support they needed to look past higher interest rates and bid stocks higher.
Large-cap growth companies’ index returned 33.5% while all large caps’ index returned 23.9%.
At period end, approximately 40% of the portfolio was unhedged, with long-term capital growth the primary objective.
The rest of the Fund is invested in companies with covered call options, a strategy that seeks to balance the capital growth potential of the underlying companies with downside protection provided by the income generated from writing options.
The contracts we write are structured to allow our fundamental thesis to play out while the strategy gains valuable income and potential downside protection.
Contributing positively to performance, were several names in the information technology sector.
Conversely, select holdings in the consumer discretionary sector detracted from relative performance.
The preceding information is the opinion of portfolio management only through the end of the period stated. Any such opinions are subject to change at any time based upon market or other conditions and should not be relied upon as investment advice. Past performance is no guarantee of future results, and there is no guarantee that market forecasts will be realized.
Investors should consider the investment objective and policies, risk considerations, charges and ongoing expenses of an investment carefully before investing. The prospectus contains this and other information relevant to an investment in any of the Meridian Funds. Please read the prospectus carefully before you invest. To obtain a prospectus, please contact your investment representative or the Funds' transfer agent at 1-800-446-6662 or access our website at www.arrowmarkpartners.com/meridian/.
How has the Fund historically performed?
This chart assumes an initial investment of $10,000 made on July 1, 2014 for Investor Class including any applicable sales charges or fees. The performance of the other share class may be greater or less than that shown based on differences in inception dates, fees, and sales charges. Performance assumes reinvestment of dividends and capital gain distributions.
GROWTH OF $10,000
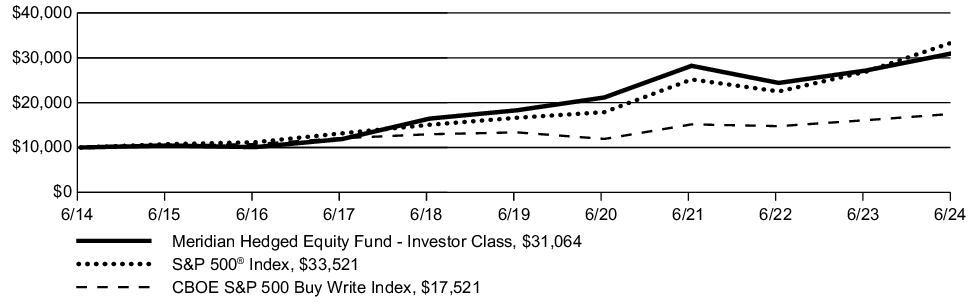
| AVERAGE ANNUAL TOTAL RETURN | 1 Year | 5 Years | 10 Years | Since Inception(1) |
| Meridian Hedged Equity Fund (Investor Class/(MRIEX)) | 14.34% | 11.17% | 12.00% | 11.96% |
| S&P 500® Index | 24.56% | 15.05% | 12.86% | 10.36% |
| CBOE S&P 500 Buy Write Index | 8.91% | 5.56% | 5.77% | 5.46% |
| (1) | Inception date of Investor Class is 11/15/13 |
Past performance is not predictive of future performance. The graph and table do not reflect the deduction of taxes that a shareholder would pay on Fund distributions or the redemption of Fund shares and do not reflect the imposition of a 2% redemption fee on shares held 60 days or less to deter market timers. If reflected, the taxes and fees would reduce the performance quoted. Net asset value, investment return and principal value will fluctuate, so shares, when redeemed, may be worth more or less than their original cost.
| Fund net assets | $45,273,958% |
| Total number of portfolio holdings | $113% |
| Total advisory fee paid | $325,145% |
| Portfolio turnover rate as of the end of the reporting period | $33% |
| NVIDIA Corp. | 7.8% |
| QUALCOMM, Inc. | 5.4% |
| D.R. Horton, Inc. | 4.2% |
| Live Nation Entertainment, Inc. | 4.0% |
| Sally Beauty Holdings, Inc. | 4.0% |
| Clear Secure, Inc. Class A | 4.0% |
| MGM Resorts International | 3.8% |
| Alibaba Group Holding Ltd. (China) | 3.6% |
| Illumina, Inc. | 3.5% |
| Charles Schwab Corp. (The) | 3.2% |
Portfolio holdings are subject to change and may not reflect the current or future position of the portfolio. Top ten holdings excluding short-term investments are reported as a percentage of net assets.
Sector allocations are subject to change and may not reflect the current or future position of the portfolio. Sector allocations are reported as a percentage of equity investments excluding cash or cash equivalents. As of period end, the Fund invested a significant portion of their assets in securities in the sectors. Changes in economic conditions affecting such sectors would have a greater impact on the Fund and could affect the value, income and/or liquidity of positions in such securities.
For compliance purposes, the Fund’s industry classifications may refer to any one or more of the industry sub-classifications used by one or more widely recognized market indexes or ratings group indexes, and/or as defined by Fund management. This definition may not apply for purposes of this report, which may combine subclassifications for reporting ease.
Availability of Additional Information
You can find additional information about the Fund such as the prospectus, financial information, holdings, and proxy voting information at www.arrowmarkpartners.com/meridian/. You can also request this information by contacting us at 800.446.6662.
Householding
We will deliver a single copy of prospectuses, proxies, financial reports and other communication to shareholders with the same residential address, provided they have the same last name, or we reasonably believe them to be members of the same family. Unless we are notified otherwise, we will continue to send recipients only one copy of these materials for as long as they remain a shareholder of the Fund. If you would like to receive individual mailings, please call the Funds’ transfer agent at 800.446.6662.
Meridian Small Cap Growth Fund
Legacy Class | (MSGGX)
Annual SHAREHOLDER REPORT | June 30, 2024
This annual shareholder report contains important information about the Meridian Small Cap Growth Fund (“Fund”) for the period of July 1, 2023 to June 30, 2024. You can also request this information by contacting us at 1-800-446-6662.
This report describes changes to the Fund that occurred during the reporting period. You can find additional information about the Fund at www.arrowmarkpartners.com/meridian/.
What were the Fund expenses for the last year?
(Based on a hypothetical $10,000 investment)
| Fund | Costs of a $10,000 investment | Costs paid as a percentage
of a $10,000 investment |
Meridian Small Cap Growth Fund
(Legacy Class) | $126 | 1.23% |
What drove fund performance during the past 12 months?
U.S. equities moved higher over the 12-month period ended June 30, 2024.
In our view, resilient economic growth, a strong labor market, higher corporate earnings, and easing inflation gave investors the support they needed to look past higher interest rates and bid stocks higher.
Small cap stocks, while delivering a respectable 10% index return over the period, were generally overshadowed by the market’s narrow focus on larger, AI-related companies.
The investment strategy’s emphasis on downside protection proved effective during the period, as the strategy outperformed on nine of the ten days on which the index declined 2% or more.
Our investment process focuses on what we believe are high-quality companies with recurring revenue and sustainable competitive advantages, which we are currently finding lower on the [small] capitalization spectrum.
This process contrasted with the market’s appetite for larger, high-momentum companies during the period.
From a sector perspective, stock selection was positive in the healthcare and consumer discretionary sectors.
Conversely, an underweight position and negative stock selection in the information technology sector detracted from relative returns, as the information technology sector was one of the better-performing sectors of the market during the period.
The preceding information is the opinion of portfolio management only through the end of the period stated. Any such opinions are subject to change at any time based upon market or other conditions and should not be relied upon as investment advice. Past performance is no guarantee of future results, and there is no guarantee that market forecasts will be realized.
Investors should consider the investment objective and policies, risk considerations, charges and ongoing expenses of an investment carefully before investing. The prospectus contains this and other information relevant to an investment in any of the Meridian Funds. Please read the prospectus carefully before you invest. To obtain a prospectus, please contact your investment representative or the Funds' transfer agent at 1-800-446-6662 or access our website at www.arrowmarkpartners.com/meridian/.
How has the Fund historically performed?
This chart assumes an initial investment of $10,000 made on July 1, 2014 for Legacy Class including any applicable sales charges or fees. The performance of the other share class may be greater or less than that shown based on differences in inception dates, fees, and sales charges. Performance assumes reinvestment of dividends and capital gain distributions.
GROWTH OF $10,000

| AVERAGE ANNUAL TOTAL RETURN | 1 Year | 5 Years | 10 Years | Since Inception(1) |
| Meridian Small Cap Growth Fund (Legacy Class/(MSGGX)) | 4.33% | 5.54% | 8.04% | 9.19% |
| Russell 2000® Growth Index | 9.14% | 6.17% | 7.39% | 7.66% |
| Russell 3000® | 23.13% | 14.14% | 12.15% | 12.58% |
| (1) | Inception date of Legacy Class is 12/16/13 |
Past performance is not predictive of future performance. The graph and table do not reflect the deduction of taxes that a shareholder would pay on Fund distributions or the redemption of Fund shares and do not reflect the imposition of a 2% redemption fee on shares held 60 days or less to deter market timers. If reflected, the taxes and fees would reduce the performance quoted. Net asset value, investment return and principal value will fluctuate, so shares, when redeemed, may be worth more or less than their original cost.
| Fund net assets | $441,206,126% |
| Total number of portfolio holdings | $106% |
| Total advisory fee paid | $5,479,951% |
| Portfolio turnover rate as of the end of the reporting period | $42% |
| Cargurus, Inc. | 2.9% |
| RB Global, Inc. (Canada) | 2.9% |
| Turning Point Brands, Inc. | 2.8% |
| ACV Auctions, Inc. Class A | 2.7% |
| Smartsheet, Inc. Class A | 2.6% |
| TransMedics Group, Inc. | 2.6% |
| Merit Medical Systems, Inc. | 2.5% |
| Mirion Technologies, Inc. | 2.4% |
| PlayAGS, Inc. | 2.3% |
| Stoneridge, Inc. | 2.3% |
Portfolio holdings are subject to change and may not reflect the current or future position of the portfolio. Top ten holdings excluding short-term investments are reported as a percentage of net assets.
Sector allocations are subject to change and may not reflect the current or future position of the portfolio. Sector allocations are reported as a percentage of equity investments excluding cash or cash equivalents & Private Investment Fund. As of period end, the Fund invested a significant portion of their assets in securities in the sectors. Changes in economic conditions affecting such sectors would have a greater impact on the Fund and could affect the value, income and/or liquidity of positions in such securities.
For compliance purposes, the Fund’s industry classifications may refer to any one or more of the industry sub-classifications used by one or more widely recognized market indexes or ratings group indexes, and/or as defined by Fund management. This definition may not apply for purposes of this report, which may combine subclassifications for reporting ease.
Availability of Additional Information
You can find additional information about the Fund such as the prospectus, financial information, holdings, and proxy voting information at www.arrowmarkpartners.com/meridian/. You can also request this information by contacting us at 800.446.6662.
Householding
We will deliver a single copy of prospectuses, proxies, financial reports and other communication to shareholders with the same residential address, provided they have the same last name, or we reasonably believe them to be members of the same family. Unless we are notified otherwise, we will continue to send recipients only one copy of these materials for as long as they remain a shareholder of the Fund. If you would like to receive individual mailings, please call the Funds’ transfer agent at 800.446.6662.
Meridian Small Cap Growth Fund
Institutional Class | (MSGRX)
Annual SHAREHOLDER REPORT | June 30, 2024
This annual shareholder report contains important information about the Meridian Small Cap Growth Fund (“Fund”) for the period of July 1, 2023 to June 30, 2024. You can also request this information by contacting us at 1-800-446-6662.
This report describes changes to the Fund that occurred during the reporting period. You can find additional information about the Fund at www.arrowmarkpartners.com/meridian/.
What were the Fund expenses for the last year?
(Based on a hypothetical $10,000 investment)
| Fund | Costs of a $10,000 investment | Costs paid as a percentage
of a $10,000 investment |
Meridian Small Cap Growth Fund
(Institutional Class) | $112 | 1.10% |
What drove fund performance during the past 12 months?
U.S. equities moved higher over the 12-month period ended June 30, 2024.
In our view, resilient economic growth, a strong labor market, higher corporate earnings, and easing inflation gave investors the support they needed to look past higher interest rates and bid stocks higher.
Small cap stocks, while delivering a respectable 10% index return over the period, were generally overshadowed by the market’s narrow focus on larger, AI-related companies.
The investment strategy’s emphasis on downside protection proved effective during the period, as the strategy outperformed on nine of the ten days on which the index declined 2% or more.
Our investment process focuses on what we believe are high-quality companies with recurring revenue and sustainable competitive advantages, which we are currently finding lower on the [small] capitalization spectrum.
This process contrasted with the market’s appetite for larger, high-momentum companies during the period.
From a sector perspective, stock selection was positive in the healthcare and consumer discretionary sectors.
Conversely, an underweight position and negative stock selection in the information technology sector detracted from relative returns, as the information technology sector was one of the better-performing sectors of the market during the period.
The preceding information is the opinion of portfolio management only through the end of the period stated. Any such opinions are subject to change at any time based upon market or other conditions and should not be relied upon as investment advice. Past performance is no guarantee of future results, and there is no guarantee that market forecasts will be realized.
Investors should consider the investment objective and policies, risk considerations, charges and ongoing expenses of an investment carefully before investing. The prospectus contains this and other information relevant to an investment in any of the Meridian Funds. Please read the prospectus carefully before you invest. To obtain a prospectus, please contact your investment representative or the Funds' transfer agent at 1-800-446-6662 or access our website at www.arrowmarkpartners.com/meridian/.
How has the Fund historically performed?
This chart assumes an initial investment of $1,000,000 made on December 24, 2014 for Institutional Class including any applicable sales charges or fees. The performance of the other share class may be greater or less than that shown based on differences in inception dates, fees, and sales charges. Performance assumes reinvestment of dividends and capital gain distributions.
GROWTH OF $1,000,000
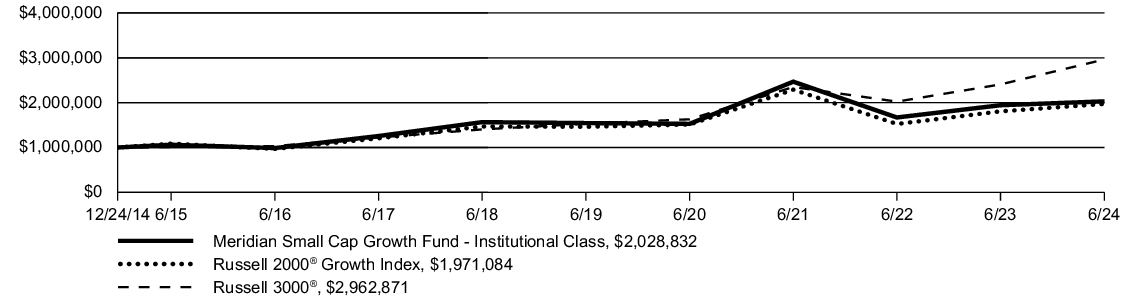
| AVERAGE ANNUAL TOTAL RETURN | 1 Year | 5 Years | 10 Years | Since Inception(1) |
| Meridian Small Cap Growth Fund (Institutional Class/(MSGRX)) | 4.45% | 5.62% | 0.00% | 7.72% |
| Russell 2000® Growth Index | 9.14% | 6.17% | 7.39% | 7.66% |
| Russell 3000® | 23.13% | 14.14% | 12.15% | 12.58% |
| (1) | Inception date of Institutional Class is 12/24/14 |
Past performance is not predictive of future performance. The graph and table do not reflect the deduction of taxes that a shareholder would pay on Fund distributions or the redemption of Fund shares and do not reflect the imposition of a 2% redemption fee on shares held 60 days or less to deter market timers. If reflected, the taxes and fees would reduce the performance quoted. Net asset value, investment return and principal value will fluctuate, so shares, when redeemed, may be worth more or less than their original cost.
| Fund net assets | $441,206,126% |
| Total number of portfolio holdings | $106% |
| Total advisory fee paid | $5,479,951% |
| Portfolio turnover rate as of the end of the reporting period | $42% |
| Cargurus, Inc. | 2.9% |
| RB Global, Inc. (Canada) | 2.9% |
| Turning Point Brands, Inc. | 2.8% |
| ACV Auctions, Inc. Class A | 2.7% |
| Smartsheet, Inc. Class A | 2.6% |
| TransMedics Group, Inc. | 2.6% |
| Merit Medical Systems, Inc. | 2.5% |
| Mirion Technologies, Inc. | 2.4% |
| PlayAGS, Inc. | 2.3% |
| Stoneridge, Inc. | 2.3% |
Portfolio holdings are subject to change and may not reflect the current or future position of the portfolio. Top ten holdings excluding short-term investments are reported as a percentage of net assets.
Sector allocations are subject to change and may not reflect the current or future position of the portfolio. Sector allocations are reported as a percentage of equity investments excluding cash or cash equivalents & Private Investment Fund. As of period end, the Fund invested a significant portion of their assets in securities in the sectors. Changes in economic conditions affecting such sectors would have a greater impact on the Fund and could affect the value, income and/or liquidity of positions in such securities.
For compliance purposes, the Fund’s industry classifications may refer to any one or more of the industry sub-classifications used by one or more widely recognized market indexes or ratings group indexes, and/or as defined by Fund management. This definition may not apply for purposes of this report, which may combine subclassifications for reporting ease.
Availability of Additional Information
You can find additional information about the Fund such as the prospectus, financial information, holdings, and proxy voting information at www.arrowmarkpartners.com/meridian/. You can also request this information by contacting us at 800.446.6662.
Householding
We will deliver a single copy of prospectuses, proxies, financial reports and other communication to shareholders with the same residential address, provided they have the same last name, or we reasonably believe them to be members of the same family. Unless we are notified otherwise, we will continue to send recipients only one copy of these materials for as long as they remain a shareholder of the Fund. If you would like to receive individual mailings, please call the Funds’ transfer agent at 800.446.6662.
Meridian Small Cap Growth Fund
Class A | (MSGAX)
Annual SHAREHOLDER REPORT | June 30, 2024
This annual shareholder report contains important information about the Meridian Small Cap Growth Fund (“Fund”) for the period of July 1, 2023 to June 30, 2024. You can also request this information by contacting us at 1-800-446-6662.
This report describes changes to the Fund that occurred during the reporting period. You can find additional information about the Fund at www.arrowmarkpartners.com/meridian/.
What were the Fund expenses for the last year?
(Based on a hypothetical $10,000 investment)
| Fund | Costs of a $10,000 investment | Costs paid as a percentage
of a $10,000 investment |
Meridian Small Cap Growth Fund
(Class A) | $157 | 1.54% |
What drove fund performance during the past 12 months?
U.S. equities moved higher over the 12-month period ended June 30, 2024.
In our view, resilient economic growth, a strong labor market, higher corporate earnings, and easing inflation gave investors the support they needed to look past higher interest rates and bid stocks higher.
Small cap stocks, while delivering a respectable 10% index return over the period, were generally overshadowed by the market’s narrow focus on larger, AI-related companies.
The investment strategy’s emphasis on downside protection proved effective during the period, as the strategy outperformed on nine of the ten days on which the index declined 2% or more.
Our investment process focuses on what we believe are high-quality companies with recurring revenue and sustainable competitive advantages, which we are currently finding lower on the [small] capitalization spectrum.
This process contrasted with the market’s appetite for larger, high-momentum companies during the period.
From a sector perspective, stock selection was positive in the healthcare and consumer discretionary sectors.
Conversely, an underweight position and negative stock selection in the information technology sector detracted from relative returns, as the information technology sector was one of the better-performing sectors of the market during the period.
The preceding information is the opinion of portfolio management only through the end of the period stated. Any such opinions are subject to change at any time based upon market or other conditions and should not be relied upon as investment advice. Past performance is no guarantee of future results, and there is no guarantee that market forecasts will be realized.
Investors should consider the investment objective and policies, risk considerations, charges and ongoing expenses of an investment carefully before investing. The prospectus contains this and other information relevant to an investment in any of the Meridian Funds. Please read the prospectus carefully before you invest. To obtain a prospectus, please contact your investment representative or the Funds' transfer agent at 1-800-446-6662 or access our website at www.arrowmarkpartners.com/meridian/.
How has the Fund historically performed?
This chart assumes an initial investment of $10,000 made on July 1, 2014 for Class A including any applicable sales charges or fees. The performance of the other share class may be greater or less than that shown based on differences in inception dates, fees, and sales charges. Performance assumes reinvestment of dividends and capital gain distributions.
GROWTH OF $10,000
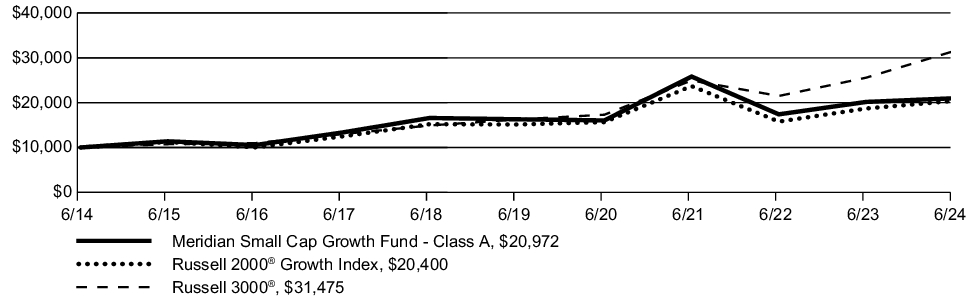
| AVERAGE ANNUAL TOTAL RETURN | 1 Year | 5 Years | 10 Years | Since Inception(1) |
| Meridian Small Cap Growth Fund (Class A/(MSGAX)) | 4.04)% | 5.18% | 7.69% | 8.83% |
| Meridian Small Cap Growth Fund (Class A/(MSGAX)) (2) | (1.91)% | 3.95% | 7.05% | 8.22% |
| Russell 2000® Growth Index | 9.14)% | 6.17% | 7.39% | 7.66% |
| Russell 3000® | 23.13)% | 14.14% | 12.15% | 12.58% |
| (1) | Inception date of Class A is 12/16/13 |
| (2) | Assuming maximum sales charge, if any. Class A Shares are subject to a maximum initial sales charge of 5.75% |
Past performance is not predictive of future performance. The graph and table do not reflect the deduction of taxes that a shareholder would pay on Fund distributions or the redemption of Fund shares and do not reflect the imposition of a 2% redemption fee on shares held 60 days or less to deter market timers. If reflected, the taxes and fees would reduce the performance quoted. Net asset value, investment return and principal value will fluctuate, so shares, when redeemed, may be worth more or less than their original cost.
| Fund net assets | $441,206,126% |
| Total number of portfolio holdings | $106% |
| Total advisory fee paid | $5,479,951% |
| Portfolio turnover rate as of the end of the reporting period | $42% |
| Cargurus, Inc. | 2.9% |
| RB Global, Inc. (Canada) | 2.9% |
| Turning Point Brands, Inc. | 2.8% |
| ACV Auctions, Inc. Class A | 2.7% |
| Smartsheet, Inc. Class A | 2.6% |
| TransMedics Group, Inc. | 2.6% |
| Merit Medical Systems, Inc. | 2.5% |
| Mirion Technologies, Inc. | 2.4% |
| PlayAGS, Inc. | 2.3% |
| Stoneridge, Inc. | 2.3% |
Portfolio holdings are subject to change and may not reflect the current or future position of the portfolio. Top ten holdings excluding short-term investments are reported as a percentage of net assets.
Sector allocations are subject to change and may not reflect the current or future position of the portfolio. Sector allocations are reported as a percentage of equity investments excluding cash or cash equivalents & Private Investment Fund. As of period end, the Fund invested a significant portion of their assets in securities in the sectors. Changes in economic conditions affecting such sectors would have a greater impact on the Fund and could affect the value, income and/or liquidity of positions in such securities.
For compliance purposes, the Fund’s industry classifications may refer to any one or more of the industry sub-classifications used by one or more widely recognized market indexes or ratings group indexes, and/or as defined by Fund management. This definition may not apply for purposes of this report, which may combine subclassifications for reporting ease.
Availability of Additional Information
You can find additional information about the Fund such as the prospectus, financial information, holdings, and proxy voting information at www.arrowmarkpartners.com/meridian/. You can also request this information by contacting us at 800.446.6662.
Householding
We will deliver a single copy of prospectuses, proxies, financial reports and other communication to shareholders with the same residential address, provided they have the same last name, or we reasonably believe them to be members of the same family. Unless we are notified otherwise, we will continue to send recipients only one copy of these materials for as long as they remain a shareholder of the Fund. If you would like to receive individual mailings, please call the Funds’ transfer agent at 800.446.6662.
Meridian Small Cap Growth Fund
Class C | (MSGCX)
Annual SHAREHOLDER REPORT | June 30, 2024
This annual shareholder report contains important information about the Meridian Small Cap Growth Fund (“Fund”) for the period of July 1, 2023 to June 30, 2024. You can also request this information by contacting us at 1-800-446-6662.
This report describes changes to the Fund that occurred during the reporting period. You can find additional information about the Fund at www.arrowmarkpartners.com/meridian/.
What were the Fund expenses for the last year?
(Based on a hypothetical $10,000 investment)
| Fund | Costs of a $10,000 investment | Costs paid as a percentage
of a $10,000 investment |
Meridian Small Cap Growth Fund
(Class C) | $229 | 2.25% |
What drove fund performance during the past 12 months?
U.S. equities moved higher over the 12-month period ended June 30, 2024.
In our view, resilient economic growth, a strong labor market, higher corporate earnings, and easing inflation gave investors the support they needed to look past higher interest rates and bid stocks higher.
Small cap stocks, while delivering a respectable 10% index return over the period, were generally overshadowed by the market’s narrow focus on larger, AI-related companies.
The investment strategy’s emphasis on downside protection proved effective during the period, as the strategy outperformed on nine of the ten days on which the index declined 2% or more.
Our investment process focuses on what we believe are high-quality companies with recurring revenue and sustainable competitive advantages, which we are currently finding lower on the [small] capitalization spectrum.
This process contrasted with the market’s appetite for larger, high-momentum companies during the period.
From a sector perspective, stock selection was positive in the healthcare and consumer discretionary sectors.
Conversely, an underweight position and negative stock selection in the information technology sector detracted from relative returns, as the information technology sector was one of the better-performing sectors of the market during the period.
The preceding information is the opinion of portfolio management only through the end of the period stated. Any such opinions are subject to change at any time based upon market or other conditions and should not be relied upon as investment advice. Past performance is no guarantee of future results, and there is no guarantee that market forecasts will be realized.
Investors should consider the investment objective and policies, risk considerations, charges and ongoing expenses of an investment carefully before investing. The prospectus contains this and other information relevant to an investment in any of the Meridian Funds. Please read the prospectus carefully before you invest. To obtain a prospectus, please contact your investment representative or the Funds' transfer agent at 1-800-446-6662 or access our website at www.arrowmarkpartners.com/meridian/.
How has the Fund historically performed?
This chart assumes an initial investment of $10,000 made on July 1, 2015 for Class C including any applicable sales charges or fees. The performance of the other share class may be greater or less than that shown based on differences in inception dates, fees, and sales charges. Performance assumes reinvestment of dividends and capital gain distributions.
GROWTH OF $10,000
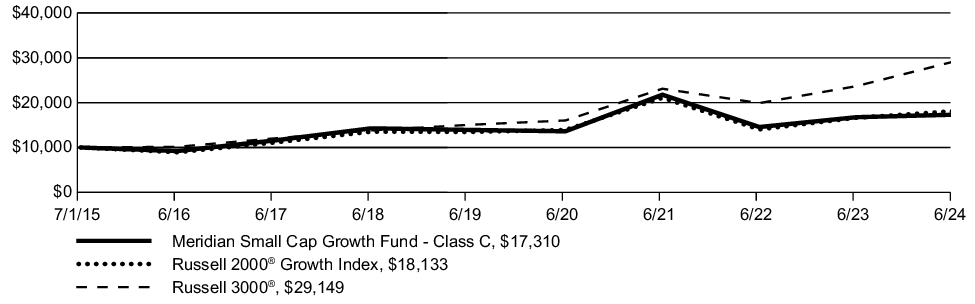
| AVERAGE ANNUAL TOTAL RETURN | 1 Year | 5 Years | 10 Years | Since Inception(1) |
| Meridian Small Cap Growth Fund (Class C/(MSGCX)) | 3.35% | 4.45% | 0.00% | 6.29% |
| Russell 2000® Growth Index | 9.14% | 6.17% | 7.39% | 7.66% |
| Russell 3000® | 23.13% | 14.14% | 12.15% | 12.58% |
| (1) | Inception date of Class C is 07/01/15 |
Past performance is not predictive of future performance. The graph and table do not reflect the deduction of taxes that a shareholder would pay on Fund distributions or the redemption of Fund shares. If reflected, the taxes and fees would reduce the performance quoted. Net asset value, investment return and principal value will fluctuate, so shares, when redeemed, may be worth more or less than their original cost.
| Fund net assets | $441,206,126% |
| Total number of portfolio holdings | $106% |
| Total advisory fee paid | $5,479,951% |
| Portfolio turnover rate as of the end of the reporting period | $42% |
| Cargurus, Inc. | 2.9% |
| RB Global, Inc. (Canada) | 2.9% |
| Turning Point Brands, Inc. | 2.8% |
| ACV Auctions, Inc. Class A | 2.7% |
| Smartsheet, Inc. Class A | 2.6% |
| TransMedics Group, Inc. | 2.6% |
| Merit Medical Systems, Inc. | 2.5% |
| Mirion Technologies, Inc. | 2.4% |
| PlayAGS, Inc. | 2.3% |
| Stoneridge, Inc. | 2.3% |
Portfolio holdings are subject to change and may not reflect the current or future position of the portfolio. Top ten holdings excluding short-term investments are reported as a percentage of net assets.
Sector allocations are subject to change and may not reflect the current or future position of the portfolio. Sector allocations are reported as a percentage of equity investments excluding cash or cash equivalents & Private Investment Fund. As of period end, the Fund invested a significant portion of their assets in securities in the sectors. Changes in economic conditions affecting such sectors would have a greater impact on the Fund and could affect the value, income and/or liquidity of positions in such securities.
For compliance purposes, the Fund’s industry classifications may refer to any one or more of the industry sub-classifications used by one or more widely recognized market indexes or ratings group indexes, and/or as defined by Fund management. This definition may not apply for purposes of this report, which may combine subclassifications for reporting ease.
Availability of Additional Information
You can find additional information about the Fund such as the prospectus, financial information, holdings, and proxy voting information at www.arrowmarkpartners.com/meridian/. You can also request this information by contacting us at 800.446.6662.
Householding
We will deliver a single copy of prospectuses, proxies, financial reports and other communication to shareholders with the same residential address, provided they have the same last name, or we reasonably believe them to be members of the same family. Unless we are notified otherwise, we will continue to send recipients only one copy of these materials for as long as they remain a shareholder of the Fund. If you would like to receive individual mailings, please call the Funds’ transfer agent at 800.446.6662.
Meridian Small Cap Growth Fund
Investor Class | (MISGX)
Annual SHAREHOLDER REPORT | June 30, 2024
This annual shareholder report contains important information about the Meridian Small Cap Growth Fund (“Fund”) for the period of July 1, 2023 to June 30, 2024. You can also request this information by contacting us at 1-800-446-6662.
This report describes changes to the Fund that occurred during the reporting period. You can find additional information about the Fund at www.arrowmarkpartners.com/meridian/.
What were the Fund expenses for the last year?
(Based on a hypothetical $10,000 investment)
| Fund | Costs of a $10,000 investment | Costs paid as a percentage
of a $10,000 investment |
Meridian Small Cap Growth Fund
(Investor Class) | $130 | 1.27% |
What drove fund performance during the past 12 months?
U.S. equities moved higher over the 12-month period ended June 30, 2024.
In our view, resilient economic growth, a strong labor market, higher corporate earnings, and easing inflation gave investors the support they needed to look past higher interest rates and bid stocks higher.
Small cap stocks, while delivering a respectable 10% index return over the period, were generally overshadowed by the market’s narrow focus on larger, AI-related companies.
The investment strategy’s emphasis on downside protection proved effective during the period, as the strategy outperformed on nine of the ten days on which the index declined 2% or more.
Our investment process focuses on what we believe are high-quality companies with recurring revenue and sustainable competitive advantages, which we are currently finding lower on the [small] capitalization spectrum.
This process contrasted with the market’s appetite for larger, high-momentum companies during the period.
From a sector perspective, stock selection was positive in the healthcare and consumer discretionary sectors.
Conversely, an underweight position and negative stock selection in the information technology sector detracted from relative returns, as the information technology sector was one of the better-performing sectors of the market during the period.
The preceding information is the opinion of portfolio management only through the end of the period stated. Any such opinions are subject to change at any time based upon market or other conditions and should not be relied upon as investment advice. Past performance is no guarantee of future results, and there is no guarantee that market forecasts will be realized.
Investors should consider the investment objective and policies, risk considerations, charges and ongoing expenses of an investment carefully before investing. The prospectus contains this and other information relevant to an investment in any of the Meridian Funds. Please read the prospectus carefully before you invest. To obtain a prospectus, please contact your investment representative or the Funds' transfer agent at 1-800-446-6662 or access our website at www.arrowmarkpartners.com/meridian/.
How has the Fund historically performed?
This chart assumes an initial investment of $10,000 made on July 1, 2014 for Investor Class including any applicable sales charges or fees. The performance of the other share class may be greater or less than that shown based on differences in inception dates, fees, and sales charges. Performance assumes reinvestment of dividends and capital gain distributions.
GROWTH OF $10,000
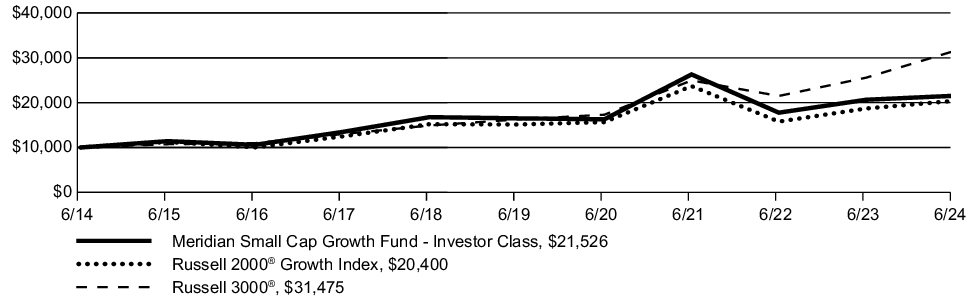
| AVERAGE ANNUAL TOTAL RETURN | 1 Year | 5 Years | 10 Years | Since Inception(1) |
| Meridian Small Cap Growth Fund (Investor Class/(MISGX)) | 4.29% | 5.46% | 7.97% | 9.12% |
| Russell 2000® Growth Index | 9.14% | 6.17% | 7.39% | 7.66% |
| Russell 3000® | 23.13% | 14.14% | 12.15% | 12.58% |
| (1) | Inception date of Investor Class is 12/16/13 |
Past performance is not predictive of future performance. The graph and table do not reflect the deduction of taxes that a shareholder would pay on Fund distributions or the redemption of Fund shares and do not reflect the imposition of a 2% redemption fee on shares held 60 days or less to deter market timers. If reflected, the taxes and fees would reduce the performance quoted. Net asset value, investment return and principal value will fluctuate, so shares, when redeemed, may be worth more or less than their original cost.
| Fund net assets | $441,206,126% |
| Total number of portfolio holdings | $106% |
| Total advisory fee paid | $5,479,951% |
| Portfolio turnover rate as of the end of the reporting period | $42% |
| Cargurus, Inc. | 2.9% |
| RB Global, Inc. (Canada) | 2.9% |
| Turning Point Brands, Inc. | 2.8% |
| ACV Auctions, Inc. Class A | 2.7% |
| Smartsheet, Inc. Class A | 2.6% |
| TransMedics Group, Inc. | 2.6% |
| Merit Medical Systems, Inc. | 2.5% |
| Mirion Technologies, Inc. | 2.4% |
| PlayAGS, Inc. | 2.3% |
| Stoneridge, Inc. | 2.3% |
Portfolio holdings are subject to change and may not reflect the current or future position of the portfolio. Top ten holdings excluding short-term investments are reported as a percentage of net assets.
Sector allocations are subject to change and may not reflect the current or future position of the portfolio. Sector allocations are reported as a percentage of equity investments excluding cash or cash equivalents & Private Investment Fund. As of period end, the Fund invested a significant portion of their assets in securities in the sectors. Changes in economic conditions affecting such sectors would have a greater impact on the Fund and could affect the value, income and/or liquidity of positions in such securities.
For compliance purposes, the Fund’s industry classifications may refer to any one or more of the industry sub-classifications used by one or more widely recognized market indexes or ratings group indexes, and/or as defined by Fund management. This definition may not apply for purposes of this report, which may combine subclassifications for reporting ease.
Availability of Additional Information
You can find additional information about the Fund such as the prospectus, financial information, holdings, and proxy voting information at www.arrowmarkpartners.com/meridian/. You can also request this information by contacting us at 800.446.6662.
Householding
We will deliver a single copy of prospectuses, proxies, financial reports and other communication to shareholders with the same residential address, provided they have the same last name, or we reasonably believe them to be members of the same family. Unless we are notified otherwise, we will continue to send recipients only one copy of these materials for as long as they remain a shareholder of the Fund. If you would like to receive individual mailings, please call the Funds’ transfer agent at 800.446.6662.
Item 2. Code of Ethics.
| (a) | The registrant, as of the end of the period covered by this report, has adopted a code of ethics that applies to the registrant’s principal executive officer, principal financial officer, principal accounting officer or controller, or persons performing similar functions, regardless of whether these individuals are employed by the registrant or a third party (the “Code of Ethics”). |
| (c) | There have been no amendments, during the period covered by this report, to a provision of the Code of Ethics that applies to the registrant’s principal executive officer, principal financial officer, principal accounting officer or controller, or persons performing similar functions, regardless of whether these individuals are employed by the registrant or a third party, and that relates to any element of the code of ethics definition enumerated in Item 2(b) of Form N-CSR. |
| (d) | The registrant has not granted any waivers, including an implicit waiver, from a provision of the code of ethics that applies to the registrant’s principal executive officer, principal financial officer, principal accounting officer or controller, or persons performing similar functions, regardless of whether these individuals are employed by the registrant or a third party, that relates to one or more of the items set forth in Item 2(b) of Form N-CSR. |
| (f) | A copy of the Code of Ethics is filed as Exhibit. |
Item 3. Audit Committee Financial Expert.
As of the end of the period covered by the report, the registrant’s board of directors has determined that James Glavin is qualified to serve as an audit committee financial expert serving on its audit committee and that he is “independent,” as defined by Item 3 of Form N-CSR.
Item 4. Principal Accountant Fees and Services.
| | • | | Registrant may incorporate the following information by reference, if this information has been disclosed in the registrant’s definitive proxy statement or definitive information statement. The proxy statement or information statement must be filed no later than 120 days after the end of the fiscal year covered by the Annual Report. |
Audit Fees
| | (a) | The aggregate fees billed for each of the last two fiscal years for professional services rendered by the principal accountant for the audit of the registrant’s annual financial statements or services that are normally provided by the accountant in connection with statutory and regulatory filings or engagements for those fiscal years are $134,900 in 2024 and $125,600 in 2023. |
Audit-Related Fees
| | (b) | The aggregate fees billed in each of the last two fiscal years for assurance and related services by the principal accountant that are reasonably related to the performance of the audit of the registrant’s financial statements and are not reported under paragraph (a) of this Item are $0 in 2024 and $0 in 2023. |
Tax Fees
| | (c) | The aggregate fees billed in each of the last two fiscal years for professional services rendered by the principal accountant for tax compliance, tax advice, and tax planning are $21,600 in 2024 and $21,600 in 2023. The fiscal year tax fees were for review of each fund’s federal and excise tax returns and year-end distributions. |
All Other Fees
| | (d) | The aggregate fees billed in each of the last two fiscal years for products and services provided by the principal accountant, other than the services reported in paragraphs (a) through (c) of this Item are $0 in 2024 and $0 in 2023. |
| | (e)(1) | The audit committee has adopted pre-approval policies and procedures that require the audit committee to pre-approve all audit and non-audit services to be provided to the Registrant by the principal accountant, including services provided to any entity affiliated with the Registrant. |
PROHIBITED SERVICES
The Committee shall confirm with the Auditor engaged to perform the audit of the Company that the Auditor is not performing contemporaneously any of the following non-audit services for the Company, the Adviser, or any affiliates of the Company or Adviser:
| | 1. | bookkeeping or other services related to the accounting records or financial statements of the Company; |
| | 2. | financial information systems design and implementation; |
| | 3. | appraisal or valuation services, fairness opinions, or contribution-in-kind reports; |
| | 5. | internal audit outsourcing services; |
| | 6. | management functions or human resources; |
| | 7. | broker or dealer, investment adviser, or investment banking services; |
| | 8. | legal services and expert services unrelated to the audit; and |
| | 9. | any other service that the Public Company Accounting Oversight Board determines, by regulation, is impermissible. |
The Auditor is responsible for informing the Committee of whether it believes that a particular service is permissible or prohibited pursuant to applicable regulations and standards.
| | (e)(2) | The percentage of services described in each of paragraphs (b) through (d) of this Item that were approved by the audit committee pursuant to paragraph (c)(7)(i)(C) of Rule 2-01 of Regulation S-X are as follows: |
| | (g) | The aggregate non-audit fees billed by the registrant’s accountant for services rendered to the registrant for each of the last two fiscal years of the registrant was $21,600 in 2024 and $21,600 in 2023. The aggregate non-audit fees billed by the registrant’s accountant for services rendered to the registrant’s investment adviser (not including any sub-adviser whose role is primarily portfolio management and is subcontracted with or overseen by another investment adviser), and any entity controlling, controlled by, or under common control with the adviser that provides ongoing services to the registrant for each of the last two fiscal years of the registrant was $0 in 2024 and $0 in 2023. |
Item 5. Audit Committee of Listed Registrants.
Not applicable.
Item 6. Investments.
| (a) | Schedule of Investments in securities of unaffiliated issuers as of the close of the reporting period is included as part of the report to shareholders filed under Item 1(a) of this form or is included in the financial statements filed under Item 7 of this Form. |
Item 7. Financial Statements and Financial Highlights for Open-End Management Investment Companies.
| (a) | An open-end management investment company registered on Form N-1A [17 CFR 239.15A and 17 CFR 274.11A] must file its most recent annual or semi-annual financial statements required, and for the periods specified, by Regulation S-X. |
The annual financial statements are attached herewith.
Financial Statements and Other Important Information
June 30, 2024
Meridian Fund, Inc.
Meridian Growth Fund
Meridian Contrarian Fund
Meridian Hedged Equity Fund
Meridian Small Cap Growth Fund
MERIDIAN FUND, INC.
Table of Contents
| Meridian Funds | 3 | www.arrowmarkpartners.com/meridian/ |
Meridian Growth Fund
Schedule of Investments
June 30, 2024
| | Shares | Value |
| Common Stocks - 92.7% |
| Communication Services - 8.5% |
| Diversified Telecommunication Services - 0.6% |
| Iridium Communications, Inc. | 277,620 | $7,390,244 |
| Interactive Media & Services - 7.9% |
| Cargurus, Inc.1 | 1,310,569 | 34,336,908 |
| IAC, Inc.1 | 262,720 | 12,308,432 |
| Ziff Davis, Inc.1,2 | 634,677 | 34,938,969 |
| ZipRecruiter, Inc. Class A1 | 986,775 | 8,969,785 |
| | | 90,554,094 |
| Total Communication Services | | 97,944,338 |
| Consumer Discretionary - 9.2% |
| Automobile Components - 0.6% |
| Fox Factory Holding Corp.1 | 140,939 | 6,791,850 |
| Distributors - 0.5% |
| Pool Corp. | 18,623 | 5,723,407 |
| Hotels, Restaurants & Leisure - 3.8% |
| Churchill Downs, Inc. | 249,693 | 34,857,143 |
| Sportradar Group AG Class A (Switzerland)1,2 | 808,091 | 9,034,457 |
| | | 43,891,600 |
| Specialty Retail - 2.7% |
| Chewy, Inc. Class A1,2 | 515,501 | 14,042,247 |
| Five Below, Inc.1 | 18,886 | 2,058,007 |
| Floor & Decor Holdings, Inc. Class A1,2 | 29,494 | 2,931,999 |
| National Vision Holdings, Inc.1 | 283,743 | 3,714,196 |
| Sally Beauty Holdings, Inc.1 | 726,996 | 7,800,667 |
| | | 30,547,116 |
| Textiles, Apparel & Luxury Goods - 1.6% |
| Skechers U.S.A., Inc. Class A1 | 270,627 | 18,705,738 |
| Total Consumer Discretionary | | 105,659,711 |
| Consumer Staples - 0.6% |
| Consumer Staples Distribution & Retail - 0.6% |
| BJ's Wholesale Club Holdings, Inc.1 | 80,717 | 7,090,181 |
| Total Consumer Staples | | 7,090,181 |
| Energy - 1.4% |
| Oil, Gas & Consumable Fuels - 1.4% |
| Viper Energy, Inc. | 417,941 | 15,685,326 |
| Total Energy | | 15,685,326 |
| Financials - 4.7% |
| Capital Markets - 1.3% |
| WisdomTree, Inc. | 1,433,253 | 14,203,537 |
| Financial Services - 3.4% |
| Euronet Worldwide, Inc.1 | 313,797 | 32,477,990 |
| | Shares | Value |
| Remitly Global, Inc.1 | 573,836 | $6,954,892 |
| | | 39,432,882 |
| Total Financials | | 53,636,419 |
| Health Care - 26.7% |
| Biotechnology - 5.7% |
| Agios Pharmaceuticals, Inc.1 | 191,366 | 8,251,702 |
| Dyne Therapeutics, Inc.1 | 120,586 | 4,255,480 |
| Halozyme Therapeutics, Inc.1 | 351,326 | 18,395,429 |
| Legend Biotech Corp. ADR1,2 | 177,344 | 7,854,566 |
| Madrigal Pharmaceuticals, Inc.1,2 | 35,570 | 9,965,291 |
| SpringWorks Therapeutics, Inc.1 | 218,060 | 8,214,320 |
| Veracyte, Inc.1 | 406,994 | 8,819,560 |
| | | 65,756,348 |
| Health Care Equipment & Supplies - 14.2% |
| Align Technology, Inc.1 | 23,197 | 5,600,452 |
| Axogen, Inc.1 | 635,638 | 4,602,019 |
| CONMED Corp.2 | 80,241 | 5,562,306 |
| Cooper Cos., Inc. (The) | 270,220 | 23,590,206 |
| Merit Medical Systems, Inc.1 | 251,055 | 21,578,177 |
| Nevro Corp. 1 | 633,748 | 5,336,158 |
| Omnicell, Inc.1 | 109,741 | 2,970,689 |
| QuidelOrtho Corp.1 | 281,598 | 9,354,686 |
| STERIS Plc2 | 143,624 | 31,531,213 |
| Tandem Diabetes Care, Inc.1 | 390,712 | 15,741,786 |
| Teleflex, Inc. | 56,699 | 11,925,501 |
| TransMedics Group, Inc.1 | 163,204 | 24,581,786 |
| | | 162,374,979 |
| Health Care Providers & Services - 1.4% |
| HealthEquity, Inc.1 | 184,207 | 15,878,644 |
| Health Care Technology - 3.0% |
| Certara, Inc.1 | 583,601 | 8,082,874 |
| Doximity, Inc. Class A1 | 641,590 | 17,945,272 |
| Waystar Holding Corp.1 | 365,466 | 7,857,519 |
| | | 33,885,665 |
| Life Sciences Tools & Services - 1.9% |
| Bio-Techne Corp. | 190,328 | 13,637,001 |
| Sotera Health Co.1 | 738,642 | 8,767,681 |
| | | 22,404,682 |
| Pharmaceuticals - 0.5% |
| Arvinas, Inc.1 | 198,853 | 5,293,467 |
Capsule Corp.
Acquisition Date: 4/8/21,
Cost $2,999,9931,3,4 | 207,016 | 26,912 |
| | | 5,320,379 |
| Total Health Care | | 305,620,697 |
The accompanying notes are an integral part of the financial statements.
| Meridian Funds | 4 | www.arrowmarkpartners.com/meridian/ |
Meridian Growth Fund
Schedule of Investments (continued)
June 30, 2024
| | Shares | Value |
| Industrials - 23.6% |
| Aerospace & Defense - 0.8% |
| Curtiss-Wright Corp. | 35,643 | $9,658,540 |
| Commercial Services & Supplies - 8.8% |
| ACV Auctions, Inc. Class A1 | 1,771,418 | 32,328,379 |
| Cimpress Plc (Ireland)1 | 168,288 | 14,743,712 |
| GFL Environmental, Inc. | 250,408 | 9,748,383 |
| RB Global, Inc. (Canada) | 574,751 | 43,887,986 |
| | | 100,708,460 |
| Electrical Equipment - 4.8% |
| Generac Holdings, Inc.1 | 162,084 | 21,430,746 |
| Sensata Technologies Holding Plc | 903,402 | 33,778,201 |
| | | 55,208,947 |
| Ground Transportation - 0.5% |
| Heartland Express, Inc. | 434,886 | 5,362,144 |
| Machinery - 1.9% |
| Middleby Corp. (The)1 | 74,253 | 9,104,161 |
| Toro Co. (The)2 | 133,061 | 12,442,534 |
| | | 21,546,695 |
| Marine Transportation - 3.4% |
| Kirby Corp.1 | 126,714 | 15,171,467 |
| Matson, Inc. | 181,459 | 23,765,686 |
| | | 38,937,153 |
| Professional Services - 2.0% |
| Alight, Inc. Class A1 | 3,125,510 | 23,066,264 |
| Trading Companies & Distributors - 1.4% |
| Applied Industrial Technologies, Inc. | 49,856 | 9,672,064 |
| Core & Main, Inc. Class A1 | 137,144 | 6,711,827 |
| | | 16,383,891 |
| Total Industrials | | 270,872,094 |
| Information Technology - 16.2% |
| Electronic Equipment, Instruments & Components - 3.3% |
| Trimble, Inc.1 | 672,577 | 37,610,506 |
| IT Services - 2.2% |
| Okta, Inc.1 | 266,738 | 24,969,344 |
| Semiconductors & Semiconductor Equipment - 2.0% |
| GLOBALFOUNDRIES, Inc.1,2 | 338,597 | 17,119,465 |
| ON Semiconductor Corp.1 | 83,006 | 5,690,061 |
| | | 22,809,526 |
| Software - 8.7% |
| 8x8, Inc.1,2 | 1,729,451 | 3,839,381 |
| Blackbaud, Inc.1 | 153,871 | 11,720,354 |
| Consensus Cloud Solutions, Inc.1 | 192,794 | 3,312,201 |
| | Shares | Value |
| Dynatrace, Inc.1 | 315,092 | $14,097,216 |
| Elastic, N.V.1 | 49,524 | 5,641,279 |
| N-able, Inc.1 | 716,190 | 10,907,574 |
| nCino, Inc.1 | 220,902 | 6,947,368 |
| Smartsheet, Inc. Class A1 | 707,211 | 31,173,861 |
| Tenable Holdings, Inc.1 | 290,737 | 12,670,318 |
| | | 100,309,552 |
| Total Information Technology | | 185,698,928 |
| Materials - 1.8% |
| Containers & Packaging - 1.8% |
| Graphic Packaging Holding Co. | 802,766 | 21,040,497 |
| Total Materials | | 21,040,497 |
Total Common Stocks - 92.7%
(Cost $845,473,557) | | 1,063,248,191 |
| Preferred Stocks - 3.0% |
| Communication Services - 1.3% |
| Interactive Media & Services - 1.3% |
Evolve Vacation Rental Network, Inc. Series 9
Acquisition Date: 5/29/20,
Cost $4,499,9991,3,4 | 776,451 | 14,923,388 |
| Total Communication Services | | 14,923,388 |
| Health Care - 0.1% |
| Health Care Providers & Services - 0.1% |
Binx Health, Inc. Series E
Acquisition Date: 5/26/21,
Cost $8,500,1361,3,4 | 31,619 | 1,171,800 |
| Total Health Care | | 1,171,800 |
| Information Technology - 1.0% |
| IT Services - 0.6% |
Skyryse, Inc. Series B
Acquisition Date: 10/21/21,
Cost $7,164,9901,3,4 | 290,316 | 7,164,999 |
| Software - 0.4% |
Dataminr, Inc. Series F
Acquisition Date: 3/22/21,
Cost $7,369,6921,3,4 | 167,493 | 4,224,173 |
| Total Information Technology | | 11,389,172 |
The accompanying notes are an integral part of the financial statements.
| Meridian Funds | 5 | www.arrowmarkpartners.com/meridian/ |
Meridian Growth Fund
Schedule of Investments (continued)
June 30, 2024
| | Shares | Value |
| Real Estate - 0.6% |
| Real Estate Management & Development - 0.6% |
Apartment List, Inc. Series D
Acquisition Date: 11/2/20 - 12/21/20,
Cost $8,399,9971,3,4 | 2,299,479 | $7,404,323 |
| Total Real Estate | | 7,404,323 |
Total Preferred Stocks - 3.0%
(Cost $35,934,814) | | 34,888,683 |
| Private Investment Fund - 0.3% |
Quail Investment Holdings, LLC
Acquisition Date: 9/1/20,
Cost $4,037,8821,3,5 | 4,038 | 3,846,850 |
Total Private Investment Fund - 0.3%
(Cost $4,037,882) | | 3,846,850 |
| Convertible Note - 0.1% |
| Information Technology - 0.1% |
| Software - 0.1% |
Skyryse, Inc.
Acquisition Date: 4/10/24,
Cost $1,000,0001,3,4 | 1,000,000 | 1,000,000 |
| Total Information Technology | | 1,000,000 |
Total Convertible Note - 0.1%
(Cost $1,000,000) | | 1,000,000 |
| | Shares/
Principal
Amount | |
| Short-Term Investments - 4.1% |
| Money Market Funds - 3.6% |
Goldman Sachs Financial Square Government Fund, Institutional Class, 5.21%
(Cost $41,378,774) | 41,378,774 | 41,378,774 |
| Repurchase Agreements - 0.5%6 |
| Bank of America Securities, Inc., dated 6/28/24, due 7/1/24, 5.33% total to be received $1,224,766 (collateralized by various U.S. Government Sponsored Agency, 2.00% - 6.50%, 1/1/31 - 5/1/54, totaling $1,248,706) | $1,224,222 | 1,224,222 |
| | Shares/
Principal
Amount | Value |
| BNP Paribas S.A., dated 6/28/24, due 7/1/24, 5.32% total to be received $1,224,765 (collateralized by various U.S. Government Sponsored Agency and U.S. Treasury Obligations, 0.00% - 7.00%, 11/15/31 - 6/1/54, totaling $1,248,706) | $1,224,222 | $1,224,222 |
| Citigroup Global Markets, Inc., dated 6/28/24, due 7/1/24, 5.34% total to be received $225,480 (collateralized by various U.S. Government Sponsored Agency and U.S. Treasury Obligations, 1.98% - 7.50%, 6/1/27 - 4/20/64, totaling $229,888) | 225,380 | 225,380 |
| National Bank Financial, Inc., dated 6/28/24, due 7/1/24, 5.34% total to be received $1,224,767 (collateralized by various U.S. Treasury Obligations, 0.75% - 4.38%, 7/1/24 - 9/9/49, totaling $1,248,711) | 1,224,222 | 1,224,222 |
The accompanying notes are an integral part of the financial statements.
| Meridian Funds | 6 | www.arrowmarkpartners.com/meridian/ |
Meridian Growth Fund
Schedule of Investments (continued)
June 30, 2024
| | Shares/
Principal
Amount | Value |
| Nomura Securities International, Inc., dated 6/28/24, due 7/1/24, 5.32% total to be received $1,224,765 (collateralized by various U.S. Government Sponsored Agency and U.S. Treasury Obligations, 1.50% - 6.50%, 4/30/26 - 8/1/58, totaling $1,248,707) | $1,224,222 | $1,224,222 |
Total Repurchase Agreements
(Cost $5,122,268) | | 5,122,268 |
Total Short-Term
Investments - 4.1%
(Cost $46,501,042) | | 46,501,042 |
Total Investments - 100.2%
(Cost $932,947,295) | |
1,149,484,766 |
| Liabilities in Excess of Other Assets - (0.2)% | | (2,420,126) |
| Net Assets - 100.0% | | $1,147,064,640 |
| ADR—American Depositary Receipt |
| N.V.—Naamloze Vennootschap is the Dutch term for limited liability company |
| Plc—Public Limited Company |
| S.A.—Société Anonyme is the French term for a public limited company |
| 1 | Non-income producing securities. |
| 2 | All or portion of this security is on loan at June 30, 2024. Total value of such securities at year-end amounts to
$36,840,912 and represents 3.21% of net assets. |
| 3 | Restricted security; cannot be offered for public resale without first being registered under the Securities Act of 1933 and related rules and agreements. Acquisition date represents the date on which an enforceable right to acquire such security is obtained and is presented along with related cost in the security description. The Fund has registration rights for certain restricted securities. Any costs related to such registration are borne by the issuer. The aggregate value of restricted securities at year-end amounts to $39,762,445 and represents 3.47% of net assets. |
| 4 | Security is valued using significant unobservable inputs in good faith in accordance with procedures approved by the Board of Directors. See Note 1 in Notes to financial statements. |
| 5 | Quail Investment Holdings, LLC is a limited liability company that was organized to invest solely in Qumulo, Inc Series E Preferred Stock. The value of Qumulo, Inc. is substantially the same as Quail Investment Holdings, LLC. |
| 6 | Cash collateral received from brokers for securities lending was invested in short-term investments. |
The accompanying notes are an integral part of the financial statements.
| Meridian Funds | 7 | www.arrowmarkpartners.com/meridian/ |
Meridian Contrarian Fund
Schedule of Investments
June 30, 2024
| | Shares | Value |
| Common Stocks - 93.3% |
| Communication Services - 3.0% |
| Interactive Media & Services - 3.0% |
| Cars.com, Inc.1 | 561,000 | $11,051,700 |
| Pinterest, Inc. Class A1 | 129,000 | 5,685,030 |
| Total Communication Services | | 16,736,730 |
| Consumer Discretionary - 9.5% |
| Hotels, Restaurants & Leisure - 5.1% |
| Bowlero Corp. Class A2 | 781,803 | 11,328,325 |
| PlayAGS, Inc.1 | 493,622 | 5,676,653 |
| Sweetgreen, Inc. Class A1 | 387,000 | 11,664,180 |
| | | 28,669,158 |
| Specialty Retail - 2.2% |
| Aritzia, Inc. (Canada)1 | 346,416 | 9,756,807 |
| National Vision Holdings, Inc.1 | 220,448 | 2,885,664 |
| | | 12,642,471 |
| Textiles, Apparel & Luxury Goods - 2.2% |
| Levi Strauss & Co. Class A | 363,000 | 6,998,640 |
| VF Corp.2 | 409,000 | 5,521,500 |
| | | 12,520,140 |
| Total Consumer Discretionary | | 53,831,769 |
| Consumer Staples - 4.5% |
| Food Products - 3.0% |
| Lancaster Colony Corp. | 42,000 | 7,936,740 |
| Seaboard Corp. | 2,800 | 8,850,072 |
| | | 16,786,812 |
| Personal Care Products - 1.5% |
| Honest Co., Inc. (The)1 | 2,972,421 | 8,679,469 |
| Total Consumer Staples | | 25,466,281 |
| Energy - 6.8% |
| Oil, Gas & Consumable Fuels - 6.8% |
| APA Corp. | 302,125 | 8,894,560 |
| California Resources Corp. | 278,000 | 14,795,160 |
| Cameco Corp. (Canada) | 301,289 | 14,823,419 |
| Total Energy | | 38,513,139 |
| Financials - 9.7% |
| Banks - 5.4% |
| First Citizens BancShares, Inc. Class A | 12,495 | 21,036,707 |
| Texas Capital Bancshares, Inc.1 | 160,000 | 9,782,400 |
| | | 30,819,107 |
| Insurance - 4.3% |
| Axis Capital Holdings Ltd. | 233,000 | 16,461,450 |
| | Shares | Value |
| Universal Insurance Holdings, Inc. | 415,000 | $7,785,400 |
| | | 24,246,850 |
| Total Financials | | 55,065,957 |
| Health Care - 9.9% |
| Biotechnology - 2.7% |
| 4D Molecular Therapeutics, Inc.1 | 100,000 | 2,099,000 |
| Legend Biotech Corp. ADR1 | 190,821 | 8,451,462 |
| ORIC Pharmaceuticals, Inc.1,2 | 320,000 | 2,262,400 |
| SpringWorks Therapeutics, Inc.1 | 66,000 | 2,486,220 |
| | | 15,299,082 |
| Health Care Equipment & Supplies - 1.5% |
| Integra LifeSciences Holdings Corp.1 | 148,000 | 4,312,720 |
| QuidelOrtho Corp.1 | 135,000 | 4,484,700 |
| | | 8,797,420 |
| Health Care Providers & Services - 3.1% |
| Tenet Healthcare Corp.1 | 129,857 | 17,274,877 |
| Pharmaceuticals - 2.6% |
| Perrigo Co. Plc | 563,855 | 14,479,796 |
| Total Health Care | | 55,851,175 |
| Industrials - 17.1% |
| Aerospace & Defense - 2.2% |
| BWX Technologies, Inc. | 130,223 | 12,371,185 |
| Building Products - 1.3% |
| Hayward Holdings, Inc.1,2 | 592,000 | 7,281,600 |
| Commercial Services & Supplies - 2.5% |
| ACV Auctions, Inc. Class A1 | 485,000 | 8,851,250 |
| VSE Corp. | 60,000 | 5,296,800 |
| | | 14,148,050 |
| Electrical Equipment - 2.0% |
| American Superconductor Corp.1 | 246,432 | 5,764,045 |
| Regal Rexnord Corp. | 41,000 | 5,544,020 |
| | | 11,308,065 |
| Ground Transportation - 2.9% |
| Knight-Swift Transportation Holdings, Inc. | 177,813 | 8,876,425 |
| U-Haul Holding Co.1,2 | 120,800 | 7,456,984 |
| | | 16,333,409 |
| Machinery - 2.1% |
| Kornit Digital Ltd. (Israel)1 | 349,000 | 5,109,360 |
| Toro Co. (The) | 74,493 | 6,965,840 |
| | | 12,075,200 |
| Professional Services - 4.1% |
| CACI International, Inc. Class A1 | 47,000 | 20,216,110 |
The accompanying notes are an integral part of the financial statements.
| Meridian Funds | 8 | www.arrowmarkpartners.com/meridian/ |
Meridian Contrarian Fund
Schedule of Investments (continued)
June 30, 2024
| | Shares | Value |
| Planet Labs PBC1 | 1,416,000 | $2,633,760 |
| | | 22,849,870 |
| Total Industrials | | 96,367,379 |
| Information Technology - 13.2% |
| Electronic Equipment, Instruments & Components - 3.8% |
| Mirion Technologies, Inc.1 | 631,000 | 6,776,940 |
| nLight, Inc.1 | 360,000 | 3,934,800 |
| Trimble, Inc.1 | 197,156 | 11,024,964 |
| | | 21,736,704 |
| IT Services - 0.5% |
| Okta, Inc.1 | 32,000 | 2,995,520 |
| Semiconductors & Semiconductor Equipment - 6.1% |
| Advanced Micro Devices, Inc.1 | 55,000 | 8,921,550 |
| Ambarella, Inc.1 | 70,000 | 3,776,500 |
| Navitas Semiconductor Corp.1,2 | 1,496,000 | 5,879,280 |
| SMART Global Holdings, Inc.1,2 | 690,000 | 15,780,300 |
| | | 34,357,630 |
| Software - 2.8% |
| Adeia, Inc. | 509,000 | 5,693,165 |
| BlackBerry Ltd. (Canada)1,2 | 1,852,000 | 4,592,960 |
| LiveRamp Holdings, Inc.1 | 170,314 | 5,269,515 |
| | | 15,555,640 |
| Total Information Technology | | 74,645,494 |
| Materials - 6.7% |
| Chemicals - 1.3% |
| Olin Corp. | 159,984 | 7,543,246 |
| Containers & Packaging - 3.0% |
| Crown Holdings, Inc. | 129,642 | 9,644,068 |
| Ranpak Holdings Corp.1 | 1,130,000 | 7,265,900 |
| | | 16,909,968 |
| Metals & Mining - 2.4% |
| Constellium SE1 | 421,913 | 7,953,060 |
| MP Materials Corp.1,2 | 211,000 | 2,686,030 |
| Radius Recycling, Inc. | 198,000 | 3,023,460 |
| | | 13,662,550 |
| Total Materials | | 38,115,764 |
| Real Estate - 5.9% |
| Diversified REITs - 1.5% |
| Alexander & Baldwin, Inc. | 510,000 | 8,649,600 |
| Real Estate Management & Development - 1.2% |
| DigitalBridge Group, Inc. | 481,750 | 6,599,975 |
| Specialized REITs - 3.2% |
| VICI Properties, Inc. | 623,000 | 17,842,720 |
| Total Real Estate | | 33,092,295 |
| | Shares | Value |
| Utilities - 7.0% |
| Electric Utilities - 3.8% |
| ALLETE, Inc. | 163,000 | $10,163,050 |
| Evergy, Inc. | 210,000 | 11,123,700 |
| | | 21,286,750 |
| Independent Power & Renewable Electricity Producers - 3.2% |
| Brookfield Renewable Corp. Class A2 | 636,800 | 18,072,384 |
| Total Utilities | | 39,359,134 |
Total Common Stocks - 93.3%
(Cost $406,281,013) | | 527,045,117 |
| Warrants - 0.0% |
| Information Technology - 0.0% |
| Software - 0.0% |
| KLDiscovery, Inc., Strike Price $11.50, Expires 12/19/241 | 450,000 | 450 |
| Total Information Technology | | 450 |
Total Warrants - 0.0%
(Cost $250,695) | | 450 |
| Preferred Stocks - 0.4% |
| Health Care - 0.3% |
| Biotechnology - 0.3% |
Zenas BioPharma Series C
Acquisition Date: 5/3/24,
Cost $1,999,9871,3,4 | 1,161,905 | 1,999,987 |
| Total Health Care | | 1,999,987 |
| Information Technology - 0.1% |
| Software - 0.1% |
Casters Holdings, Inc. dba Fyllo Compliance Cloud Series C
Acquisition Date: 10/25/21,
Cost $3,000,0001,3,4 | 2,821,405 | 141,070 |
Fyllo Series C-2 Shares
Acquisition Date: 10/21/22,
Cost $3,000,0001,3,4 | 2,272,727 | 136,364 |
Fyllo Series C-3
Acquisition Date: 12/20/23,
Cost $250,0001,3,4 | 2,158,895 | 237,479 |
| Total Information Technology | | 514,913 |
Total Preferred Stocks - 0.4%
(Cost $8,249,987) | | 2,514,900 |
The accompanying notes are an integral part of the financial statements.
| Meridian Funds | 9 | www.arrowmarkpartners.com/meridian/ |
Meridian Contrarian Fund
Schedule of Investments (continued)
June 30, 2024
| | Shares | Value |
| Rights - 0.1% |
| Health Care - 0.1% |
| Biotechnology - 0.1% |
| Albireo Pharma, Inc. CVR1,4 | 150,750 | $343,710 |
| Total Health Care | | 343,710 |
Total Rights - 0.1%
(Cost $0) | | 343,710 |
| | Shares/
Principal
Amount | |
| Short-Term Investments - 10.0% |
| Money Market Funds - 6.7% |
Goldman Sachs Financial Square Government Fund, Institutional Class, 5.21%
(Cost $38,007,810) | 38,007,810 | 38,007,810 |
| Repurchase Agreements - 3.3%5 |
| Bank of America Securities, Inc., dated 6/28/24, due 7/1/24, 5.33% total to be received $4,374,285 (collateralized by various U.S. Government Sponsored Agency, 2.00% - 6.50%, 1/1/31 - 5/1/54, totaling $4,459,790) | $4,372,343 | 4,372,343 |
| BNP Paribas S.A., dated 6/28/24, due 7/1/24, 5.32% total to be received $4,374,281 (collateralized by various U.S. Government Sponsored Agency and U.S. Treasury Obligations, 0.00% - 7.00%, 11/15/31 - 6/1/54, totaling $4,459,790) | 4,372,343 | 4,372,343 |
| Citigroup Global Markets, Inc., dated 6/28/24, due 7/1/24, 5.34% total to be received $185,474 (collateralized by various U.S. Government Sponsored Agency and U.S. Treasury Obligations, 1.98% - 7.50%, 6/1/27 - 4/20/64, totaling $189,100) | 185,392 | 185,392 |
| | Shares/
Principal
Amount | Value |
| National Bank Financial, Inc., dated 6/28/24, due 7/1/24, 5.34% total to be received $4,374,289 (collateralized by various U.S. Treasury Obligations, 0.75% - 4.38%, 7/1/24 - 9/9/49, totaling $4,459,805) | $4,372,343 | $4,372,343 |
| Nomura Securities International, Inc., dated 6/28/24, due 7/1/24, 5.32% total to be received $4,374,281 (collateralized by various U.S. Government Sponsored Agency and U.S. Treasury Obligations, 1.50% - 6.50%, 4/30/26 - 8/1/58, totaling $4,459,793) | 4,372,343 | 4,372,343 |
| Santander U.S. Capital Markets LLC, dated 6/28/24, due 7/1/24, 5.39% total to be received $619,837 (collateralized by various U.S. Government Sponsored Agency, 0.01% - 6.83%, 9/25/28 - 3/20/71, totaling $631,950) | 619,559 | 619,559 |
Total Repurchase Agreements
(Cost $18,294,323) | | 18,294,323 |
Total Short-Term
Investments - 10.0%
(Cost $56,302,133) | | 56,302,133 |
Total Investments - 103.8%
(Cost $471,083,828) | |
586,206,310 |
| Liabilities in Excess of Other Assets - (3.8)% | | (21,458,411) |
| Net Assets - 100.0% | | $564,747,899 |
The accompanying notes are an integral part of the financial statements.
| Meridian Funds | 10 | www.arrowmarkpartners.com/meridian/ |
Meridian Contrarian Fund
Schedule of Investments (continued)
June 30, 2024
| ADR—American Depositary Receipt |
| CVR—Contingent Value Rights |
| PBC—Public Benefit Corporation |
| Plc—Public Limited Company |
| S.A.—Société Anonyme is the French term for a public limited company |
| SE—Societas Europaea is the Latin term for a public limited liability company |
| 1 | Non-income producing securities. |
| 2 | All or portion of this security is on loan at June 30, 2024. Total value of such securities at year-end amounts to
$27,120,679 and represents 4.80% of net assets. |
| 3 | Restricted security; cannot be offered for public resale without first being registered under the Securities Act of 1933 and related rules and agreements. Acquisition date represents the date on which an enforceable right to acquire such security is obtained and is presented along with related cost in the security description. The Fund has registration rights for certain restricted securities. Any costs related to such registration are borne by the issuer. The aggregate value of restricted securities at year-end amounts to $2,514,900 and represents 0.45% of net assets. |
| 4 | Security is valued using significant unobservable inputs in good faith in accordance with procedures approved by the Board of Directors. See Note 1 in Notes to financial statements. |
| 5 | Cash collateral received from brokers for securities lending was invested in short-term investments. |
The accompanying notes are an integral part of the financial statements.
| Meridian Funds | 11 | www.arrowmarkpartners.com/meridian/ |
Meridian Hedged Equity Fund
Schedule of Investments
June 30, 2024
| | Shares | Value |
| Common Stocks - 115.3% |
| Communication Services - 12.9% |
| Diversified Telecommunication Services - 0.5% |
| Verizon Communications, Inc. | 5,892 | $242,986 |
| Entertainment - 5.9% |
| Liberty Media Corp.-Liberty Live Class A1 | 3,237 | 121,420 |
| Liberty Media Corp.-Liberty Live Class C1 | 199 | 7,616 |
| Live Nation Entertainment, Inc.1,2 | 19,500 | 1,827,930 |
| Madison Square Garden Entertainment Corp.1 | 4,977 | 170,363 |
| Sphere Entertainment Co.1,3 | 4,977 | 174,493 |
| Walt Disney Co. (The) | 3,546 | 352,082 |
| | | 2,653,904 |
| Interactive Media & Services - 4.4% |
| Alphabet, Inc. Class C2 | 6,300 | 1,155,546 |
| IAC, Inc.1 | 4,170 | 195,365 |
| Match Group, Inc.1,2 | 21,000 | 637,980 |
| | | 1,988,891 |
| Media - 2.1% |
| Boston Omaha Corp. Class A1 | 9,662 | 130,050 |
| Ibotta, Inc. Class A1,3 | 1,348 | 101,316 |
| Liberty Broadband Corp. Class C1 | 7,553 | 414,055 |
| Liberty Media Corp.-Liberty SiriusXM Class A1 | 12,951 | 286,865 |
| Liberty Media Corp.-Liberty SiriusXM1 | 799 | 17,706 |
| | | 949,992 |
| Total Communication Services | | 5,835,773 |
| Consumer Discretionary - 26.5% |
| Automobiles - 0.1% |
| Rivian Automotive, Inc. Class A1 | 4,170 | 55,961 |
| Broadline Retail - 6.8% |
| Alibaba Group Holding Ltd. ADR (China)2 | 22,500 | 1,620,000 |
| Amazon.com, Inc.1 | 7,494 | 1,448,216 |
| | | 3,068,216 |
| Diversified Consumer Services - 2.4% |
| ADT, Inc.2 | 143,600 | 1,091,360 |
| Hotels, Restaurants & Leisure - 3.8% |
| MGM Resorts International1,2 | 38,400 | 1,706,496 |
| Household Durables - 4.2% |
| D.R. Horton, Inc.2 | 13,500 | 1,902,555 |
| Specialty Retail - 6.2% |
| Advance Auto Parts, Inc. | 1,717 | 108,738 |
| Home Depot, Inc. (The) | 1,148 | 395,187 |
| Lowe's Cos., Inc. | 2,065 | 455,250 |
| | Shares | Value |
| Sally Beauty Holdings, Inc.1,2 | 170,000 | $1,824,100 |
| | | 2,783,275 |
| Textiles, Apparel & Luxury Goods - 3.0% |
| Levi Strauss & Co. Class A2 | 59,000 | 1,137,520 |
| NIKE, Inc. Class B | 3,025 | 227,994 |
| | | 1,365,514 |
| Total Consumer Discretionary | | 11,973,377 |
| Consumer Staples - 9.2% |
| Consumer Staples Distribution & Retail - 2.2% |
| Costco Wholesale Corp. | 773 | 657,042 |
| Target Corp. | 2,234 | 330,722 |
| | | 987,764 |
| Food Products - 5.3% |
| Archer-Daniels-Midland Co.2 | 17,900 | 1,082,055 |
| Dole Plc | 32,645 | 399,575 |
| Lamb Weston Holdings, Inc.2 | 11,300 | 950,104 |
| | | 2,431,734 |
| Personal Care Products - 1.7% |
| Coty, Inc. Class A1,2 | 48,000 | 480,960 |
| Kenvue, Inc. | 15,412 | 280,190 |
| | | 761,150 |
| Total Consumer Staples | | 4,180,648 |
| Energy - 1.1% |
| Oil, Gas & Consumable Fuels - 1.1% |
| Chevron Corp. | 3,310 | 517,750 |
| Total Energy | | 517,750 |
| Financials - 13.5% |
| Banks - 4.9% |
| JPMorgan Chase & Co. | 4,000 | 809,040 |
| U.S. Bancorp | 17,777 | 705,747 |
| Wells Fargo & Co.2 | 11,700 | 694,863 |
| | | 2,209,650 |
| Capital Markets - 5.9% |
| Charles Schwab Corp. (The)2 | 20,000 | 1,473,800 |
| Intercontinental Exchange, Inc. | 6,664 | 912,235 |
| S&P Global, Inc. | 690 | 307,740 |
| | | 2,693,775 |
| Financial Services - 2.7% |
| PayPal Holdings, Inc.1 | 3,160 | 183,375 |
| Visa, Inc. Class A | 3,911 | 1,026,520 |
| | | 1,209,895 |
| Total Financials | | 6,113,320 |
| Health Care - 6.8% |
| Biotechnology - 0.1% |
| GRAIL, Inc.1 | 2,533 | 38,932 |
The accompanying notes are an integral part of the financial statements.
| Meridian Funds | 12 | www.arrowmarkpartners.com/meridian/ |
Meridian Hedged Equity Fund
Schedule of Investments (continued)
June 30, 2024
| | Shares | Value |
| Health Care Providers & Services - 1.4% |
| Progyny, Inc.1,2 | 22,500 | $643,725 |
| Life Sciences Tools & Services - 4.6% |
| Danaher Corp. | 2,025 | 505,946 |
| Illumina, Inc. 1,2 | 15,200 | 1,586,576 |
| | | 2,092,522 |
| Pharmaceuticals - 0.7% |
| Johnson & Johnson | 2,215 | 323,745 |
| Total Health Care | | 3,098,924 |
| Industrials - 6.2% |
| Commercial Services & Supplies - 2.0% |
| ACV Auctions, Inc. Class A1 | 13,594 | 248,090 |
| GFL Environmental, Inc. | 17,526 | 682,287 |
| | | 930,377 |
| Electrical Equipment - 2.6% |
| Acuity Brands, Inc.2 | 4,800 | 1,158,912 |
| Professional Services - 1.6% |
| Alight, Inc. Class A1 | 27,247 | 201,083 |
| CACI International, Inc. Class A1 | 840 | 361,309 |
| Dun & Bradstreet Holdings, Inc. | 17,376 | 160,902 |
| | | 723,294 |
| Total Industrials | | 2,812,583 |
| Information Technology - 31.8% |
| IT Services - 1.6% |
| Shopify, Inc. Class A (Canada)1,2 | 11,300 | 746,365 |
| Semiconductors & Semiconductor Equipment - 15.5% |
| GLOBALFOUNDRIES, Inc.1 | 4,200 | 212,352 |
| Micron Technology, Inc.2 | 6,200 | 815,486 |
| NVIDIA Corp.2 | 28,530 | 3,524,596 |
| QUALCOMM, Inc.2 | 12,300 | 2,449,914 |
| | | 7,002,348 |
| Software - 13.0% |
| Clear Secure, Inc. Class A2 | 96,000 | 1,796,160 |
| Microsoft Corp. | 2,889 | 1,291,238 |
| Salesforce, Inc.2 | 1,729 | 444,526 |
| ServiceNow, Inc.1,2 | 1,600 | 1,258,672 |
| Zoom Video Communications, Inc. Class A1,2 | 18,300 | 1,083,177 |
| | | 5,873,773 |
| Technology Hardware, Storage & Peripherals - 1.7% |
| Apple, Inc.2 | 3,588 | 755,705 |
| Total Information Technology | | 14,378,191 |
| Materials - 1.2% |
| Chemicals - 1.2% |
| Huntsman Corp.2 | 23,100 | 525,987 |
| Total Materials | | 525,987 |
| | Shares | Value |
| Real Estate - 3.3% |
| Health Care REITs - 0.7% |
| Alexandria Real Estate Equities, Inc. | 2,941 | $344,009 |
| Specialized REITs - 2.6% |
| American Tower Corp. | 2,978 | 578,864 |
| Equinix, Inc. | 772 | 584,095 |
| | | 1,162,959 |
| Total Real Estate | | 1,506,968 |
| Utilities - 2.8% |
| Electric Utilities - 1.1% |
| Entergy Corp. | 4,787 | 512,209 |
| Independent Power & Renewable Electricity Producers - 1.7% |
| Vistra Corp. | 8,609 | 740,202 |
| Total Utilities | | 1,252,411 |
Total Common Stocks - 115.3%
(Cost $44,602,037) | | 52,195,932 |
| | Shares/
Principal
Amount | |
| Short-Term Investments - 16.6% |
| Money Market Funds - 16.4% |
Goldman Sachs Financial Square Government Fund, Institutional Class, 5.21%
(Cost $7,403,581) | 7,403,581 | 7,403,581 |
| Repurchase Agreements - 0.2%4 |
National Bank Financial, Inc., dated 6/28/24, due 7/1/24, 5.34% total to be received $104,074 (collateralized by various U.S. Treasury Obligations, 0.75% - 4.38%, 7/1/24 - 9/9/49, totaling $106,109)
(Cost $104,028) | $104,028 | 104,028 |
Total Short-Term
Investments - 16.6%
(Cost $7,507,609) | | 7,507,609 |
Total Investments - 131.9%
(Cost $52,109,646) | |
59,703,541 |
| Liabilities in Excess of Other Assets - (31.9)% | | (14,429,583) |
| Net Assets - 100.0% | | $45,273,958 |
The accompanying notes are an integral part of the financial statements.
| Meridian Funds | 13 | www.arrowmarkpartners.com/meridian/ |
Meridian Hedged Equity Fund
Schedule of Investments (continued)
June 30, 2024
| | | Value |
| Call Options Written - (31.7)% |
Total Call Options Written - (31.7)%
(Premium received $(9,939,013)) | | $(14,362,365) |
| ADR—American Depositary Receipt |
| Plc—Public Limited Company |
| 1 | Non-income producing securities. |
| 2 | Securities, or a portion thereof, with a value of $33,895,386 were pledged as collateral for written options by the fund. |
| 3 | All or portion of this security is on loan at June 30, 2024. Total value of such securities at year-end amounts to
$275,809 and represents 0.61% of net assets. |
| 4 | Cash collateral received from brokers for securities lending was invested in short-term investments. |
The accompanying notes are an integral part of the financial statements.
| Meridian Funds | 14 | www.arrowmarkpartners.com/meridian/ |
Meridian Hedged Equity Fund
Schedule of Investments (continued)
June 30, 2024
| Exchange-Traded Options Written |
| Description | | Strike Price | | Expiration Date | | Number of
Contracts | | Notional
Amount | | Premium
Received | | Value |
| Call | | | | | | | | | | | | |
| Levi Strauss & Co. Class A | | 13.00 | | 7/19/24 | | 290 | | $559,120 | | $(98,374) | | $(208,800) |
| Live Nation Entertainment, Inc. | | 70.00 | | 7/19/24 | | 35 | | 328,090 | | (79,941) | | (92,750) |
| ADT, Inc. | | 5.00 | | 8/16/24 | | 1,436 | | 1,091,360 | | (271,722) | | (409,260) |
| Huntsman Corp. | | 19.00 | | 8/16/24 | | 1 | | 2,277 | | (579) | | (560) |
| Archer-Daniels-Midland Co. | | 42.50 | | 9/20/24 | | 29 | | 175,305 | | (31,168) | | (59,160) |
| Illumina, Inc. | | 75.00 | | 9/20/24 | | 33 | | 344,454 | | (241,271) | | (117,150) |
| Sally Beauty Holdings, Inc. | | 7.50 | | 9/20/24 | | 1,574 | | 1,688,902 | | (801,511) | | (692,560) |
| Zoom Video Communications, Inc. Class A | | 55.00 | | 9/20/24 | | 60 | | 355,140 | | (102,253) | | (39,600) |
| Acuity Brands, Inc. | | 210.00 | | 12/20/24 | | 48 | | 1,158,912 | | (291,896) | | (215,520) |
| Alibaba Group Holding Ltd. ADR (China) | | 50.00 | | 1/17/25 | | 100 | | 720,000 | | (276,829) | | (250,000) |
| Alphabet, Inc. Class C | | 70.00 | | 1/17/25 | | 63 | | 1,155,546 | | (203,646) | | (743,400) |
| Apple, Inc. | | 155.00 | | 1/17/25 | | 35 | | 737,170 | | (143,473) | | (220,500) |
| Coty, Inc. Class A | | 10.00 | | 1/17/25 | | 480 | | 480,960 | | (146,876) | | (60,000) |
| D.R. Horton, Inc. | | 115.00 | | 1/17/25 | | 86 | | 1,211,998 | | (333,187) | | (284,316) |
| Huntsman Corp. | | 18.00 | | 1/17/25 | | 230 | | 523,710 | | (159,670) | | (124,200) |
| Illumina, Inc. | | 65.00 | | 1/17/25 | | 85 | | 887,230 | | (690,768) | | (399,500) |
| Lamb Weston Holdings, Inc. | | 75.00 | | 1/17/25 | | 33 | | 277,464 | | (78,475) | | (47,850) |
| Levi Strauss & Co. Class A | | 13.00 | | 1/17/25 | | 300 | | 578,400 | | (116,766) | | (219,000) |
| Match Group, Inc. | | 25.00 | | 1/17/25 | | 210 | | 637,980 | | (293,387) | | (155,400) |
| Micron Technology, Inc. | | 45.00 | | 1/17/25 | | 62 | | 815,486 | | (163,377) | | (559,550) |
| Progyny, Inc. | | 22.50 | | 1/17/25 | | 225 | | 643,725 | | (357,031) | | (198,000) |
| QUALCOMM, Inc. | | 120.00 | | 1/17/25 | | 88 | | 1,752,784 | | (371,985) | | (743,160) |
| Salesforce, Inc. | | 110.00 | | 1/17/25 | | 17 | | 437,070 | | (99,945) | | (258,740) |
| ServiceNow, Inc. | | 300.00 | | 1/17/25 | | 16 | | 1,258,672 | | (251,750) | | (809,600) |
| Shopify, Inc. Class A (Canada) | | 22.50 | | 1/17/25 | | 113 | | 746,365 | | (321,591) | | (524,320) |
| Wells Fargo & Co. | | 32.50 | | 1/17/25 | | 116 | | 688,924 | | (150,707) | | (341,040) |
| Zoom Video Communications, Inc. Class A | | 55.00 | | 1/17/25 | | 60 | | 355,140 | | (113,653) | | (52,800) |
| Alibaba Group Holding Ltd. ADR (China) | | 50.00 | | 6/20/25 | | 125 | | 900,000 | | (336,965) | | (343,750) |
| Charles Schwab Corp. (The) | | 47.50 | | 6/20/25 | | 200 | | 1,473,800 | | (407,003) | | (584,000) |
| NVIDIA Corp. | | 135.00 | | 6/20/25 | | 260 | | 3,212,040 | | (167,311) | | (2,915,900) |
| QUALCOMM, Inc. | | 115.00 | | 6/20/25 | | 22 | | 438,196 | | (98,808) | | (201,300) |
| Archer-Daniels-Midland Co. | | 45.00 | | 1/16/26 | | 150 | | 906,750 | | (189,508) | | (297,000) |
| Clear Secure, Inc. Class A | | 17.13 | | 1/16/26 | | 960 | | 1,796,160 | | (630,660) | | (470,400) |
| D.R. Horton, Inc. | | 120.00 | | 1/16/26 | | 49 | | 690,557 | | (192,158) | | (198,450) |
| Illumina, Inc. | | 80.00 | | 1/16/26 | | 34 | | 354,892 | | (265,550) | | (149,600) |
| Lamb Weston Holdings, Inc. | | 65.00 | | 1/16/26 | | 80 | | 672,640 | | (205,257) | | (228,000) |
| Live Nation Entertainment, Inc. | | 70.00 | | 1/16/26 | | 160 | | 1,499,840 | | (509,252) | | (560,000) |
| MGM Resorts International | | 40.00 | | 1/16/26 | | 384 | | 1,706,496 | | (524,188) | | (437,760) |
| QUALCOMM, Inc. | | 185.00 | | 1/16/26 | | 13 | | 258,934 | | (72,522) | | (60,450) |
The accompanying notes are an integral part of the financial statements.
| Meridian Funds | 15 | www.arrowmarkpartners.com/meridian/ |
Meridian Hedged Equity Fund
Schedule of Investments (continued)
June 30, 2024
| Exchange-Traded Options Written |
| Description | | Strike Price | | Expiration Date | | Number of
Contracts | | Notional
Amount | | Premium
Received | | Value |
| Zoom Video Communications, Inc. Class A | | 55.00 | | 1/16/26 | | 63 | | $372,897 | | $(148,000) | | $(89,019) |
| | | | | | | | | Total | | $(9,939,013) | | $(14,362,365) |
The accompanying notes are an integral part of the financial statements.
| Meridian Funds | 16 | www.arrowmarkpartners.com/meridian/ |
Meridian Small Cap Growth Fund
Schedule of Investments
June 30, 2024
| | Shares | Value |
| Common Stocks - 89.9% |
| Communication Services - 6.7% |
| Entertainment - 1.1% |
| Vivid Seats, Inc. Class A1,2 | 852,112 | $4,899,644 |
| Interactive Media & Services - 4.5% |
| Angi, Inc.1,2 | 1,945,668 | 3,735,682 |
| Cargurus, Inc.1 | 493,828 | 12,938,294 |
| ZipRecruiter, Inc. Class A1 | 350,115 | 3,182,545 |
| | | 19,856,521 |
| Media - 1.1% |
| Ibotta, Inc. Class A1,2 | 29,817 | 2,241,046 |
| TechTarget, Inc.1 | 88,006 | 2,743,147 |
| | | 4,984,193 |
| Total Communication Services | | 29,740,358 |
| Consumer Discretionary - 12.2% |
| Automobile Components - 3.2% |
| Dorman Products, Inc.1 | 45,541 | 4,166,090 |
| Stoneridge, Inc.1 | 635,406 | 10,141,080 |
| | | 14,307,170 |
| Hotels, Restaurants & Leisure - 5.0% |
| Everi Holdings, Inc.1 | 778,740 | 6,541,416 |
| Genius Sports Ltd. (United Kingdom)1 | 451,090 | 2,458,441 |
| PlayAGS, Inc.1 | 893,497 | 10,275,216 |
| Sweetgreen, Inc. Class A1 | 95,482 | 2,877,827 |
| | | 22,152,900 |
| Leisure Products - 1.1% |
| Clarus Corp.2 | 732,968 | 4,932,875 |
| Machinery - 0.5% |
| Atmus Filtration Technologies, Inc.1 | 68,016 | 1,957,500 |
| Specialty Retail - 1.0% |
| National Vision Holdings, Inc.1 | 113,427 | 1,484,760 |
| Sally Beauty Holdings, Inc.1 | 256,388 | 2,751,043 |
| | | 4,235,803 |
| Textiles, Apparel & Luxury Goods - 1.4% |
| Skechers U.S.A., Inc. Class A1 | 90,698 | 6,269,046 |
| Total Consumer Discretionary | | 53,855,294 |
| Consumer Staples - 2.8% |
| Tobacco - 2.8% |
| Turning Point Brands, Inc. | 378,432 | 12,143,883 |
| Total Consumer Staples | | 12,143,883 |
| Energy - 3.8% |
| Energy Equipment & Services - 2.4% |
| NCS Multistage Holdings, Inc.1 | 35,932 | 602,939 |
| | Shares | Value |
| Newpark Resources, Inc.1 | 1,193,317 | $9,916,464 |
| | | 10,519,403 |
| Oil, Gas & Consumable Fuels - 1.4% |
| Viper Energy, Inc. | 160,280 | 6,015,309 |
| Total Energy | | 16,534,712 |
| Financials - 3.0% |
| Capital Markets - 1.2% |
| WisdomTree, Inc. | 521,731 | 5,170,354 |
| Financial Services - 1.8% |
| International Money Express, Inc.1 | 385,844 | 8,040,989 |
| Total Financials | | 13,211,343 |
| Health Care - 24.7% |
| Biotechnology - 6.2% |
| 4D Molecular Therapeutics, Inc.1,2 | 130,435 | 2,737,831 |
| C4 Therapeutics, Inc.1,2 | 500,617 | 2,312,850 |
Centrexion Therapeutics Corp. (Dividend Shares)
Acquisition Date: 3/14/19,
Cost $01,3,4 | 17,318 | 0 |
| CG oncology, Inc.1 | 48,853 | 1,542,289 |
| Inhibrx Biosciences, Inc.1 | 24,228 | 343,311 |
| Kiniksa Pharmaceuticals International Plc1 | 165,976 | 3,098,772 |
| Neurogene, Inc.1,2 | 70,176 | 2,553,705 |
| Newamsterdam Pharma Co., N.V. (Netherlands)1 | 80,436 | 1,545,176 |
| Nuvalent, Inc. Class A1,2 | 30,800 | 2,336,488 |
| ORIC Pharmaceuticals, Inc.1,2 | 320,329 | 2,264,726 |
| PMV Pharmaceuticals, Inc.1 | 1,255,473 | 2,033,866 |
| SpringWorks Therapeutics, Inc.1 | 76,380 | 2,877,235 |
| Veracyte, Inc.1 | 173,141 | 3,751,965 |
| | | 27,398,214 |
| Health Care Equipment & Supplies - 11.7% |
| Axogen, Inc.1 | 329,572 | 2,386,101 |
| CONMED Corp. | 33,700 | 2,336,084 |
| Merit Medical Systems, Inc.1 | 129,721 | 11,149,520 |
| Nevro Corp. 1 | 264,081 | 2,223,562 |
| Omnicell, Inc.1 | 83,936 | 2,272,148 |
| PROCEPT BioRobotics Corp.1,2 | 30,993 | 1,893,363 |
| QuidelOrtho Corp.1 | 104,274 | 3,463,982 |
| Silk Road Medical, Inc.1 | 316,775 | 8,565,596 |
| Tandem Diabetes Care, Inc.1 | 148,394 | 5,978,794 |
| TransMedics Group, Inc.1 | 75,989 | 11,445,463 |
| | | 51,714,613 |
| Health Care Providers & Services - 1.8% |
| HealthEquity, Inc.1 | 64,576 | 5,566,451 |
The accompanying notes are an integral part of the financial statements.
| Meridian Funds | 17 | www.arrowmarkpartners.com/meridian/ |
Meridian Small Cap Growth Fund
Schedule of Investments (continued)
June 30, 2024
| | Shares | Value |
| Pediatrix Medical Group, Inc.1 | 305,413 | $2,305,868 |
| | | 7,872,319 |
| Health Care Technology - 3.0% |
| Certara, Inc.1,2 | 238,758 | 3,306,798 |
| Definitive Healthcare Corp.1,2 | 495,275 | 2,704,202 |
| Phreesia, Inc.1 | 179,484 | 3,805,061 |
| Waystar Holding Corp.1 | 157,745 | 3,391,517 |
| | | 13,207,578 |
| Life Sciences Tools & Services - 0.9% |
| MaxCyte, Inc.1,2 | 482,566 | 1,891,659 |
| Tempus AI, Inc.1,2 | 57,662 | 2,018,170 |
| | | 3,909,829 |
| Pharmaceuticals - 1.1% |
| Arvinas, Inc.1 | 81,382 | 2,166,389 |
Capsule Corp.
Acquisition Date: 4/8/21,
Cost $2,000,0001,3,4 | 138,011 | 17,941 |
| Structure Therapeutics, Inc. ADR1,2 | 67,877 | 2,665,530 |
| | | 4,849,860 |
| Total Health Care | | 108,952,413 |
| Industrials - 20.7% |
| Aerospace & Defense - 1.9% |
| Byrna Technologies, Inc.1,2 | 833,708 | 8,320,406 |
| Commercial Services & Supplies - 7.8% |
| ACV Auctions, Inc. Class A1 | 664,547 | 12,127,983 |
| Cimpress Plc (Ireland)1 | 64,756 | 5,673,273 |
| Montrose Environmental Group, Inc.1 | 87,898 | 3,916,735 |
| RB Global, Inc. (Canada) | 164,907 | 12,592,298 |
| | | 34,310,289 |
| Ground Transportation - 0.7% |
| Heartland Express, Inc. | 234,814 | 2,895,257 |
| Machinery - 0.5% |
| Kadant, Inc. | 8,285 | 2,433,967 |
| Marine Transportation - 3.2% |
| Kirby Corp.1 | 44,655 | 5,346,543 |
| Matson, Inc. | 67,829 | 8,883,564 |
| | | 14,230,107 |
| Professional Services - 6.1% |
| Alight, Inc. Class A1 | 1,164,483 | 8,593,884 |
| Forrester Research, Inc.1 | 271,299 | 4,633,787 |
| Legalzoom.com, Inc.1 | 1,153,328 | 9,676,422 |
| UL Solutions, Inc. Class A2 | 96,210 | 4,059,100 |
| | | 26,963,193 |
| | Shares | Value |
| Trading Companies & Distributors - 0.5% |
| Titan Machinery, Inc.1 | 128,962 | $2,050,496 |
| Total Industrials | | 91,203,715 |
| Information Technology - 14.2% |
| Electronic Equipment, Instruments & Components - 2.4% |
| Mirion Technologies, Inc.1 | 976,846 | 10,491,326 |
| Semiconductors & Semiconductor Equipment - 1.0% |
| Allegro MicroSystems, Inc. (Japan)1 | 91,693 | 2,589,410 |
| Navitas Semiconductor Corp.1,2 | 482,202 | 1,895,054 |
| | | 4,484,464 |
| Software - 10.8% |
| 8x8, Inc.1,2 | 1,094,248 | 2,429,231 |
| Alkami Technology, Inc.1 | 248,362 | 7,073,350 |
| Amplitude, Inc. Class A1,2 | 400,555 | 3,564,939 |
| Blackbaud, Inc.1 | 70,554 | 5,374,098 |
| Consensus Cloud Solutions, Inc.1 | 398,654 | 6,848,876 |
| CS Disco, Inc.1,2 | 351,586 | 2,095,453 |
| PagerDuty, Inc.1 | 385,413 | 8,837,520 |
| Smartsheet, Inc. Class A1 | 263,431 | 11,612,038 |
| | | 47,835,505 |
| Total Information Technology | | 62,811,295 |
| Materials - 1.2% |
| Containers & Packaging - 1.2% |
| Ranpak Holdings Corp.1,2 | 819,058 | 5,266,543 |
| Total Materials | | 5,266,543 |
| Utilities - 0.6% |
| Water Utilities - 0.6% |
| Pure Cycle Corp.1 | 296,162 | 2,828,347 |
| Total Utilities | | 2,828,347 |
Total Common Stocks - 89.9%
(Cost $326,071,920) | | 396,547,903 |
| Warrants - 0.2% |
| Health Care - 0.2% |
| Health Care Equipment & Supplies - 0.2% |
| Beta Bionics, Inc. Series D, Strike Price $0.01, Expires 8/28/331,3,4 | 83,332 | 490,825 |
| Beta Bionics, Inc. Strike Price $0.01, Expires 2/16/321,3,4 | 21,570 | 204,484 |
| Total Health Care | | 695,309 |
Total Warrants - 0.2%
(Cost $533,120) | | 695,309 |
The accompanying notes are an integral part of the financial statements.
| Meridian Funds | 18 | www.arrowmarkpartners.com/meridian/ |
Meridian Small Cap Growth Fund
Schedule of Investments (continued)
June 30, 2024
| | Shares | Value |
| Preferred Stocks - 7.3% |
| Communication Services - 2.0% |
| Specialty Retail - 2.0% |
Evolve Vacation Rental Network, Inc. Series 8
Acquisition Date: 6/15/18,
Cost $3,999,9991,3,4 | 470,013 | $9,033,650 |
| Total Communication Services | | 9,033,650 |
| Health Care - 2.4% |
| Biotechnology - 1.1% |
Centrexion Therapeutics Corp.
Acquisition Date: 12/18/17,
Cost $2,995,0071,3,4 | 1,663,893 | 133,111 |
DNA Script Series C
Acquisition Date: 10/8/21,
Cost $3,431,7211,3,4 | 3,955 | 1,457,062 |
YAP Therapeutics, Inc. Series B
Acquisition Date: 1/12/22,
Cost $3,000,0051,3,4 | 64,544 | 3,250,436 |
| | | 4,840,609 |
| Health Care Equipment & Supplies - 1.1% |
Adagio Medical, Inc. Series E
Acquisition Date: 11/9/20,
Cost $4,000,0031,3,4 | 176,913 | 318,443 |
Beta Bionics, Inc. Series B
Acquisition Date: 10/9/18,
Cost $3,999,9761,3,4 | 266,310 | 2,676,416 |
Beta Bionics, Inc. Series C
Acquisition Date: 2/16/22,
Cost $959,987 1,3,4 | 86,280 | 818,797 |
Beta Bionics, Inc. Series D
Acquisition Date: 8/28/23,
Cost $706,8711,3,4 | 119,047 | 978,566 |
| | | 4,792,222 |
| Health Care Providers & Services - 0.2% |
Binx Health, Inc. Series E
Acquisition Date: 5/26/21,
Cost $6,500,0411,3,4 | 24,179 | 896,074 |
| Total Health Care | | 10,528,905 |
| Information Technology - 1.7% |
| IT Services - 1.0% |
Skyryse, Inc. Series B
Acquisition Date: 10/21/21,
Cost $4,184,9831,3,4 | 169,570 | 4,184,987 |
| | Shares | Value |
| Software - 0.7% |
Dataminr, Inc. Series F
Acquisition Date: 3/22/21,
Cost $5,655,320 1,3,4 | 128,530 | $3,241,527 |
| Total Information Technology | | 7,426,514 |
| Real Estate - 1.2% |
| Real Estate Management & Development - 1.2% |
Apartment List, Inc. Series D
Acquisition Date: 12/21/20 - 12/24/20,
Cost $5,999,9981,3,4 | 1,642,485 | 5,288,802 |
| Total Real Estate | | 5,288,802 |
Total Preferred Stocks - 7.3%
(Cost $45,433,911) | | 32,277,871 |
| Private Investment Fund - 0.6% |
Quail Investment Holdings, LLC
Acquisition Date: 9/1/20,
Cost $2,917,6951,3,5 | 2,918 | 2,779,659 |
Total Private Investment Fund - 0.6%
(Cost $2,917,695) | | 2,779,659 |
| Rights - 0.0% |
| Health Care - 0.0% |
| Biotechnology - 0.0% |
| Inhibrx, Inc. CVR1,4 | 96,915 | 61,056 |
| Total Health Care | | 61,056 |
Total Rights - 0.0%
(Cost $0) | | 61,056 |
| | Shares/
Principal
Amount | |
| Short-Term Investments - 3.9% |
| Money Market Funds - 2.0% |
Goldman Sachs Financial Square Government Fund, Institutional Class, 5.21%
(Cost $8,818,508) | 8,818,508 | 8,818,508 |
The accompanying notes are an integral part of the financial statements.
| Meridian Funds | 19 | www.arrowmarkpartners.com/meridian/ |
Meridian Small Cap Growth Fund
Schedule of Investments (continued)
June 30, 2024
| | Shares/
Principal
Amount | Value |
| Repurchase Agreements - 1.9%6 |
| Bank of America Securities, Inc., dated 6/28/24, due 7/1/24, 5.33% total to be received $2,044,772 (collateralized by various U.S. Government Sponsored Agency, 2.00% - 6.50%, 1/1/31 - 5/1/54, totaling $2,084,741) | $2,043,864 | $2,043,864 |
| BNP Paribas S.A., dated 6/28/24, due 7/1/24, 5.32% total to be received $2,044,770 (collateralized by various U.S. Government Sponsored Agency and U.S. Treasury Obligations, 0.00% - 7.00%, 11/15/31 - 6/1/54, totaling $2,084,741) | 2,043,864 | 2,043,864 |
| Citigroup Global Markets, Inc., dated 6/28/24, due 7/1/24, 5.34% total to be received $376,445 (collateralized by various U.S. Government Sponsored Agency and U.S. Treasury Obligations, 1.98% - 7.50%, 6/1/27 - 4/20/64, totaling $383,804) | 376,278 | 376,278 |
| National Bank Financial, Inc., dated 6/28/24, due 7/1/24, 5.34% total to be received $2,044,774 (collateralized by various U.S. Treasury Obligations, 0.75% - 4.38%, 7/1/24 - 9/9/49, totaling $2,084,748) | 2,043,864 | 2,043,864 |
| | Shares/
Principal
Amount | Value |
| Nomura Securities International, Inc., dated 6/28/24, due 7/1/24, 5.32% total to be received $2,044,770 (collateralized by various U.S. Government Sponsored Agency and U.S. Treasury Obligations, 1.50% - 6.50%, 4/30/26 - 8/1/58, totaling $2,084,743) | $2,043,864 | $2,043,864 |
Total Repurchase Agreements
(Cost $8,551,734) | | 8,551,734 |
Total Short-Term
Investments - 3.9%
(Cost $17,370,242) | | 17,370,242 |
Total Investments - 101.9%
(Cost $392,326,888) | |
449,732,040 |
| Liabilities in Excess of Other Assets - (1.9)% | | (8,525,914) |
| Net Assets - 100.0% | | $441,206,126 |
The accompanying notes are an integral part of the financial statements.
| Meridian Funds | 20 | www.arrowmarkpartners.com/meridian/ |
Meridian Small Cap Growth Fund
Schedule of Investments (continued)
June 30, 2024
| ADR—American Depositary Receipt |
| CVR—Contingent Value Rights |
| N.V.—Naamloze Vennootschap is the Dutch term for limited liability company |
| Plc—Public Limited Company |
| S.A.—Société Anonyme is the French term for a public limited company |
| 1 | Non-income producing securities. |
| 2 | All or portion of this security is on loan at June 30, 2024. Total value of such securities at year-end amounts to
$25,278,877 and represents 5.73% of net assets. |
| 3 | Restricted security; cannot be offered for public resale without first being registered under the Securities Act of 1933 and related rules and agreements. Acquisition date represents the date on which an enforceable right to acquire such security is obtained and is presented along with related cost in the security description. The Fund has registration rights for certain restricted securities. Any costs related to such registration are borne by the issuer. The aggregate value of restricted securities at year-end amounts to $35,770,780 and represents 8.11% of net assets. |
| 4 | Security is valued using significant unobservable inputs in good faith in accordance with procedures approved by the Board of Directors. See Note 1 in Notes to financial statements. |
| 5 | Quail Investment Holdings, LLC is a limited liability company that was organized to invest solely in Qumulo, Inc Series E Preferred Stock. The value of Qumulo, Inc. is substantially the same as Quail Investment Holdings, LLC. |
| 6 | Cash collateral received from brokers for securities lending was invested in short-term investments. |
The accompanying notes are an integral part of the financial statements.
| Meridian Funds | 21 | www.arrowmarkpartners.com/meridian/ |
Meridian Fund, Inc.
Statements of Assets and Liabilities
| June 30, 2024 | Meridian
Growth Fund | Meridian
Contrarian Fund | Meridian
Hedged
Equity Fund | Meridian
Small Cap
Growth Fund |
| Assets |
Investments, at value1,2
| $1,144,362,498 | $567,911,987 | $59,599,513 | $441,180,306 |
Repurchase agreements3
| 5,122,268 | 18,294,323 | 104,028 | 8,551,734 |
| Receivables and other assets: | | | | |
Fund shares purchased
| 67,326 | 1,675 | 3,481 | 307,252 |
Investments sold
| 3,694,536 | 1,337,118 | — | 395,181 |
Dividends
| 348,190 | 687,767 | 94,241 | 165,028 |
Securities lending interest
| 8,801 | 68,748 | 213 | 10,257 |
Prepaid expenses
| 50,340 | 33,198 | 20,619 | 29,541 |
Total Assets
| 1,153,653,959 | 588,334,816 | 59,822,095 | 450,639,299 |
| |
| Liabilities |
Collateral held for securities on loan
| 5,122,268 | 18,294,323 | 104,028 | 8,551,734 |
Options written at value4
| — | — | 14,362,365 | — |
| Payables and other accrued expenses: | | | | |
Fund shares sold
| 452,552 | 150,141 | — | 221,136 |
Investments purchased
| — | 4,516,619 | — | — |
Investment management fees
| 723,189 | 467,174 | 16,246 | 339,595 |
Distribution and service plan fees
| 1,117 | 763 | 1,545 | 3,719 |
Professional fees
| 104,342 | 56,158 | 30,214 | 98,257 |
Directors' fees
| — | — | — | 4,237 |
Transfer agent fees
| 66,370 | 45,023 | 3,169 | 63,215 |
Other
| 119,481 | 56,716 | 30,570 | 151,280 |
Total Liabilities
| 6,589,319 | 23,586,917 | 14,548,137 | 9,433,173 |
Net Assets
| $1,147,064,640 | $564,747,899 | $45,273,958 | $441,206,126 |
| |
| Net Assets Consist of |
Paid-in capital
| $994,597,129 | $429,623,570 | $36,783,580 | $402,889,981 |
Accumulated earnings
| 152,467,511 | 135,124,329 | 8,490,378 | 38,316,145 |
Net Assets
| $1,147,064,640 | $564,747,899 | $45,273,958 | $441,206,126 |
1 Investments at cost
| $927,825,027 | $452,789,505 | $52,005,618 | $383,775,154 |
| | |
| 2 | Including securities on loan valued at $36,840,912, $27,120,679, $275,809 and $25,278,877 respectively. See Note 4 in Notes to Financial Statements. |
| 3 | Repurchase agreements at cost are $5,122,268, $18,294,323, $104,028 and $8,551,734, respectively. |
| 4 | Written options, premium received of $—, $—, $9,939,013 and $—, respectively. |
The accompanying notes are an integral part of the financial statements.
| Meridian Funds | 22 | www.arrowmarkpartners.com/meridian/ |
Meridian Fund, Inc.
Statements of Assets and Liabilities (continued)
| June 30, 2024 | Meridian
Growth Fund | Meridian
Contrarian Fund | Meridian
Hedged
Equity Fund | Meridian
Small Cap
Growth Fund |
| Net Asset Value |
| Legacy Class | | | | |
Net Assets
| $737,419,667 | $545,609,488 | $41,037,655 | $16,909,985 |
Shares outstanding5
| 21,468,405 | 14,831,324 | 2,886,512 | 1,349,712 |
Net Asset value per share (offering and redemption price)
| $34.35 | $36.79 | $14.22 | $12.53 |
| Institutional Class | | | | |
Net Assets
| $386,378,576 | $— | $— | $296,281,993 |
Shares outstanding5
| 11,237,861 | — | — | 23,359,938 |
Net Asset value per share (offering and redemption price)
| $34.38 | $— | $— | $12.68 |
| Class A | | | | |
Net Assets
| $2,718,941 | $1,423,713 | $1,662,649 | $9,897,928 |
Shares outstanding5
| 84,511 | 40,378 | 121,023 | 836,018 |
Net Asset value per share (offering and redemption price)
| $32.17 | $35.26 | $13.74 | $11.84 |
| Class C | | | | |
Net Assets
| $676,772 | $570,456 | $5,945 | $2,009,228 |
Shares outstanding5
| 22,511 | 17,302 | 453 | 185,945 |
Net Asset value per share (offering and redemption price)
| $30.06 | $32.97 | $13.136 | $10.81 |
| Investor Class | | | | |
Net Assets
| $19,870,684 | $17,144,242 | $2,567,709 | $116,106,992 |
Shares outstanding5
| 588,788 | 472,042 | 181,281 | 9,363,026 |
Net Asset value per share (offering and redemption price)
| $33.75 | $36.32 | $14.16 | $12.40 |
| | |
| 5 | 500,000,000 shares authorized, $0.01 par value. |
| 6 | Calculated NAV may not equal actual NAV shown due to rounding of the net assets and shares. |
The accompanying notes are an integral part of the financial statements.
| Meridian Funds | 23 | www.arrowmarkpartners.com/meridian/ |
Meridian Fund, Inc.
Statements of Operations
| For the Year Ended June 30, 2024 | Meridian
Growth Fund | Meridian
Contrarian Fund | Meridian
Hedged
Equity Fund | Meridian
Small Cap
Growth Fund |
| Investment Income |
Dividends
| $7,954,090 | $8,802,842 | $907,556 | $2,760,614 |
Non-cash dividends
| — | — | — | 335,568 |
Foreign taxes withheld
| (82,792) | (92,771) | (1,272) | (28,704) |
Securities lending
| 191,741 | 707,529 | 2,484 | 289,434 |
Total investment income
| 8,063,039 | 9,417,600 | 908,768 | 3,356,912 |
| |
| Expenses |
Investment management fees
| 9,757,215 | 5,824,274 | 410,076 | 5,713,515 |
Custodian fees
| 132,836 | 61,815 | 9,813 | 78,002 |
| Distribution and service plan fees: | | | | |
Class A
| 3,774 | 4,479 | 2,443 | 29,939 |
Class C
| 6,997 | 6,332 | 53 | 25,367 |
Directors' fees
| 202,568 | 87,914 | 6,925 | 96,381 |
Pricing fees
| 166,489 | 95,563 | 23,936 | 124,930 |
Audit and tax fees
| 75,193 | 37,379 | 28,032 | 85,859 |
Legal fees
| 41,333 | 20,821 | 1,502 | 17,503 |
Registration and filing fees
| 117,340 | 100,856 | 93,033 | 119,959 |
Shareholder communications fees
| 202,021 | 100,936 | 35,034 | 219,735 |
Transfer agent fees
| 618,337 | 409,467 | 32,436 | 519,654 |
Miscellaneous expenses
| 119,075 | 63,025 | 24,806 | 68,485 |
Total expenses
| 11,443,178 | 6,812,861 | 668,089 | 7,099,329 |
Less waivers and/or reimbursements (Note 6)
| — | (56) | (84,931) | (233,564) |
Net expenses
| 11,443,178 | 6,812,805 | 583,158 | 6,865,765 |
Net investment income (loss)
| (3,380,139) | 2,604,795 | 325,610 | (3,508,853) |
| |
| Realized and Unrealized Gain (Loss) |
Net realized gain on investments and foreign currency transactions
| 81,710,343 | 22,023,916 | 1,440,355 | 80,286,019 |
Net realized gain on written options
| — | — | 3,553,991 | — |
Net change in unrealized appreciation (depreciation) on investments and foreign currency translations
| (80,885,277) | (8,025,959) | 1,581,393 | (50,882,661) |
Net change in unrealized depreciation on written options
| — | — | (707,690) | — |
Total realized and unrealized gain
| 825,066 | 13,997,957 | 5,868,049 | 29,403,358 |
Net increase/(decrease) in net assets resulting from operations
| $(2,555,073) | $16,602,752 | $6,193,659 | $25,894,505 |
The accompanying notes are an integral part of the financial statements.
| Meridian Funds | 24 | www.arrowmarkpartners.com/meridian/ |
Meridian Fund, Inc.
Statements of Changes in Net Assets
| | Meridian Growth Fund | | Meridian Contrarian Fund |
| Changes in Net Assets From: | Year Ended
June 30, 2024 | Year Ended
June 30, 2023 | | Year Ended
June 30, 2024 | Year Ended
June 30, 2023 |
| Operations |
Net investment income/(loss)
| $(3,380,139) | $(4,327,292) | | $2,604,795 | $2,635,939 |
Net realized gain/(loss)
| 81,710,343 | (132,453,682) | | 22,023,916 | 27,152,375 |
Net change in unrealized appreciation/(depreciation)
| (80,885,277) | 328,287,475 | | (8,025,959) | 56,817,111 |
Net increase/(decrease) in net assets resulting from operations
| (2,555,073) | 191,506,501 | | 16,602,752 | 86,605,425 |
| |
| Distributions to Shareholders: |
Legacy Class
| — | (107,518,469) | | (30,160,813) | (58,613,137) |
Institutional Class
| — | (48,923,168) | | — | — |
Class A
| — | (376,445) | | (77,166) | (261,059) |
Class C
| — | (173,743) | | (37,712) | (48,333) |
Investor Class
| — | (4,133,336) | | (958,306) | (1,488,090) |
Decrease in net assets from distributions
| — | (161,125,161) | | (31,233,997) | (60,410,619) |
| |
| Fund Share Transactions |
Net increase/(decrease) in net assets resulting from fund share transactions (Note 2)
| (306,711,113) | (5,051,610) | | (37,071,532) | 16,153,710 |
Total increase/(decrease) in net assets
| (309,266,186) | 25,329,730 | | (51,702,777) | 42,348,516 |
| |
| Net Assets |
Beginning of Year
| 1,456,330,826 | 1,431,001,096 | | 616,450,676 | 574,102,160 |
End of Year
| $1,147,064,640 | $1,456,330,826 | | $564,747,899 | $616,450,676 |
The accompanying notes are an integral part of the financial statements.
| Meridian Funds | 25 | www.arrowmarkpartners.com/meridian/ |
Meridian Fund, Inc.
Statements of Changes in Net Assets (continued)
| | Meridian Hedged Equity Fund | | Meridian Small Cap Growth Fund |
| Changes in Net Assets From: | Year Ended
June 30, 2024 | Year Ended
June 30, 2023 | | Year Ended
June 30, 2024 | Year Ended
June 30, 2023 |
| Operations |
Net investment income/(loss)
| $325,610 | $73,371 | | $(3,508,853) | $(5,799,759) |
Net realized gain/(loss)
| 4,994,346 | 1,199,480 | | 80,286,019 | (71,349,266) |
Net change in unrealized appreciation/(depreciation)
| 873,703 | 4,039,835 | | (50,882,661) | 191,258,547 |
Net increase/(decrease) in net assets resulting from operations
| 6,193,659 | 5,312,686 | | 25,894,505 | 114,109,522 |
| |
| Distributions to Shareholders: |
Legacy Class
| (268,416) | (3,856,611) | | — | (2,861,579) |
Institutional Class
| — | — | | — | (32,231,867) |
Class A
| (6,832) | (113,612) | | — | (2,366,555) |
Class C
| (27) | (5,065) | | — | (505,652) |
Investor Class
| (12,899) | (176,493) | | — | (51,135,572) |
Decrease in net assets from distributions
| (288,174) | (4,151,781) | | — | (89,101,225) |
| |
| Fund Share Transactions |
Net decrease in net assets resulting from fund share transactions (Note 2)
| (8,230,414) | (4,131,845) | | (371,649,402) | (52,247,187) |
Total decrease in net assets
| (2,324,929) | (2,970,940) | | (345,754,897) | (27,238,890) |
| |
| Net Assets |
Beginning of Year
| 47,598,887 | 50,569,827 | | 786,961,023 | 814,199,913 |
End of Year
| $45,273,958 | $47,598,887 | | $441,206,126 | $786,961,023 |
The accompanying notes are an integral part of the financial statements.
| Meridian Funds | 26 | www.arrowmarkpartners.com/meridian/ |
| (b) | An open-end management investment company registered on Form N-1A [17 CFR 239.15A and 17 CFR 274.11A] must file the information required by Item 13 of Form N-1A. |
The Financial Highlights are attached herewith.
Meridian Growth Fund
Financial Highlights
| | For the Fiscal Year Ended June 30, |
| Legacy Class | 2024 | 2023 | 2022 | 2021 | 2020 |
| Per Share Operating Performance |
Net asset value, beginning of year
| $34.20 | $33.95 | $55.49 | $35.86 | $39.69 |
| Income (loss) from investment operations: | | | | | |
Net investment loss1
| (0.09) | (0.11) | (0.21) | (0.24) | (0.05) |
Net realized and unrealized gain (loss)
| 0.24 | 4.46 | (13.93) | 20.29 | (0.23) |
Net increase (decrease) from investment operations
| 0.15 | 4.35 | (14.14) | 20.05 | (0.28) |
| Less distributions to shareholders: | | | | | |
Distributions from net realized capital gains
| — | (4.10) | (7.40) | (0.42) | (3.55) |
Total distributions to shareholders
| — | (4.10) | (7.40) | (0.42) | (3.55) |
Redemption fees
| 0.002 | 0.002 | 0.002 | 0.002 | 0.002 |
Net asset value, end of year
| $34.35 | $34.20 | $33.95 | $55.49 | $35.86 |
Total return
| 0.44% | 14.67% | (29.20)% | 56.11% | (1.40)%3 |
| |
| Ratios to Average Net Assets |
Ratio of net investment loss to
average net assets
| (0.27)%4 | (0.31)%4 | (0.43)%4 | (0.51)%4 | (0.12)% |
Ratio of expenses to average net assets
| 0.90%4 | 0.88%4 | 0.85%4 | 0.84%4 | 0.85% |
| |
| Supplemental Data |
Net Assets, End of Year (000's)
| $737,420 | $930,493 | $962,311 | $1,503,022 | $1,095,062 |
Portfolio Turnover Rate
| 33% | 47% | 42% | 30% | 47% |
| | |
| 1 | Per share net investment loss has been calculated using the average daily shares method. |
| 2 | Less than $0.005 per share. |
| 3 | The total return is based on beginning and ending Financial Statement Net Asset Value as shown above, which may differ from the traded Net Asset Value, due to rounding. |
| 4 | These ratios exclude the impact of expenses of the underlying private investment funds in which the Fund invests as represented in the Schedule of Investments. |
The accompanying notes are an integral part of the financial statements.
| Meridian Funds | 27 | www.arrowmarkpartners.com/meridian/ |
Meridian Growth Fund
Financial Highlights
| | For the Fiscal Year Ended June 30, |
| Institutional Class | 2024 | 2023 | 2022 | 2021 | 2020 |
| Per Share Operating Performance |
Net asset value, beginning of year
| $34.22 | $33.96 | $55.48 | $35.85 | $39.67 |
| Income (loss) from investment operations: | | | | | |
Net investment loss1
| (0.08) | (0.09) | (0.19) | (0.23) | (0.03) |
Net realized and unrealized gain (loss)
| 0.24 | 4.45 | (13.93) | 20.28 | (0.24) |
Net increase (decrease) from investment operations
| 0.16 | 4.36 | (14.12) | 20.05 | (0.27) |
| Less distributions to shareholders: | | | | | |
Distributions from net realized capital gains
| — | (4.10) | (7.40) | (0.42) | (3.55) |
Total distributions to shareholders
| — | (4.10) | (7.40) | (0.42) | (3.55) |
Redemption fees
| 0.002 | 0.002 | 0.002 | 0.002 | 0.002 |
Net asset value, end of year
| $34.38 | $34.22 | $33.96 | $55.48 | $35.85 |
Total return
| 0.47% | 14.69% | (29.17)% | 56.13% | (1.38)% |
| |
| Ratios to Average Net Assets |
Ratio of net investment loss to average
net assets
| (0.24)%3 | (0.27)%3 | (0.40)%3 | (0.49)%3 | (0.09)% |
Ratio of expenses to average net assets
| 0.87%3 | 0.85%3 | 0.82%3 | 0.82%3 | 0.82% |
| |
| Supplemental Data |
Net Assets, End of Year (000's)
| $386,379 | $488,196 | $422,429 | $660,985 | $455,636 |
Portfolio Turnover Rate
| 33% | 47% | 42% | 30% | 47% |
| | |
| 1 | Per share net investment loss has been calculated using the average daily shares method. |
| 2 | Less than $0.005 per share. |
| 3 | These ratios exclude the impact of expenses of the underlying private investment funds in which the Fund invests as represented in the Schedule of Investments. |
The accompanying notes are an integral part of the financial statements.
| Meridian Funds | 28 | www.arrowmarkpartners.com/meridian/ |
Meridian Growth Fund
Financial Highlights
| | For the Fiscal Year Ended June 30, |
| Class A | 2024 | 2023 | 2022 | 2021 | 2020 |
| Per Share Operating Performance |
Net asset value, beginning of year
| $32.09 | $32.16 | $53.12 | $34.45 | $38.38 |
| Income (loss) from investment operations: | | | | | |
Net investment loss1
| (0.14) | (0.17) | (0.34) | (0.37) | (0.16) |
Net realized and unrealized gain (loss)
| 0.22 | 4.20 | (13.22) | 19.46 | (0.22) |
Net increase (decrease) from investment operations
| 0.08 | 4.03 | (13.56) | 19.09 | (0.38) |
| Less distributions to shareholders: | | | | | |
Distributions from net realized capital gains
| — | (4.10) | (7.40) | (0.42) | (3.55) |
Total distributions to shareholders
| — | (4.10) | (7.40) | (0.42) | (3.55) |
Redemption fees
| — | — | — | 0.002 | 0.002 |
Net asset value, end of year
| $32.17 | $32.09 | $32.16 | $53.12 | $34.45 |
Total return3
| 0.25% | 14.48% | (29.43)% | 55.62% | (1.72)%4 |
| |
| Ratios to Average Net Assets |
Ratio of net investment loss to average
net assets
| (0.44)%5 | (0.52)%5 | (0.75)%5 | (0.82)%5 | (0.45)% |
Ratio of expenses to average net assets
| 1.07%5 | 1.08%5 | 1.17%5 | 1.16%5 | 1.17% |
| |
| Supplemental Data |
Net Assets, End of Year (000's)
| $2,719 | $3,414 | $4,163 | $6,045 | $4,731 |
Portfolio Turnover Rate
| 33% | 47% | 42% | 30% | 47% |
| | |
| 1 | Per share net investment loss has been calculated using the average daily shares method. |
| 2 | Less than $0.005 per share. |
| 3 | Excludes the effects of any sales charges. |
| 4 | The total return is based on beginning and ending Financial Statement Net Asset Value as shown above, which may differ from the traded Net Asset Value, due to rounding. |
| 5 | These ratios exclude the impact of expenses of the underlying private investment funds in which the Fund invests as represented in the Schedule of Investments. |
The accompanying notes are an integral part of the financial statements.
| Meridian Funds | 29 | www.arrowmarkpartners.com/meridian/ |
Meridian Growth Fund
Financial Highlights
| | For the Fiscal Year Ended June 30, |
| Class C | 2024 | 2023 | 2022 | 2021 | 2020 |
| Per Share Operating Performance |
Net asset value, beginning of year
| $30.19 | $30.73 | $51.42 | $33.60 | $37.76 |
| Income (loss) from investment operations: | | | | | |
Net investment loss1
| (0.33) | (0.39) | (0.64) | (0.66) | (0.40) |
Net realized and unrealized gain (loss)
| 0.20 | 3.95 | (12.65) | 18.90 | (0.21) |
Net increase (decrease) from investment operations
| (0.13) | 3.56 | (13.29) | 18.24 | (0.61) |
| Less distributions to shareholders: | | | | | |
Distributions from net realized capital gains
| — | (4.10) | (7.40) | (0.42) | (3.55) |
Total distributions to shareholders
| — | (4.10) | (7.40) | (0.42) | (3.55) |
Redemption fees
| — | — | — | — | — |
Net asset value, end of year
| $30.06 | $30.19 | $30.73 | $51.42 | $33.60 |
Total return2
| (0.43)% | 13.56% | (29.91)% | 54.49% | (2.40)%3 |
| |
| Ratios to Average Net Assets |
Ratio of net investment loss to average net assets
| (1.14)%4 | (1.30)%4 | (1.44)%4 | (1.53)%4 | (1.15)% |
Ratio of expenses to average net assets
| 1.78%4 | 1.84%4 | 1.87%4 | 1.87%4 | 1.87% |
| |
| Supplemental Data |
Net Assets, End of Year (000's)
| $677 | $961 | $1,459 | $2,899 | $2,188 |
Portfolio Turnover Rate
| 33% | 47% | 42% | 30% | 47% |
| | |
| 1 | Per share net investment loss has been calculated using the average daily shares method. |
| 2 | Excludes the effects of any sales charges. |
| 3 | The total return is based on beginning and ending Financial Statement Net Asset Value as shown above, which may differ from the traded Net Asset Value, due to rounding. |
| 4 | These ratios exclude the impact of expenses of the underlying private investment funds in which the Fund invests as represented in the Schedule of Investments. |
The accompanying notes are an integral part of the financial statements.
| Meridian Funds | 30 | www.arrowmarkpartners.com/meridian/ |
Meridian Growth Fund
Financial Highlights
| | For the Fiscal Year Ended June 30, |
| Investor Class | 2024 | 2023 | 2022 | 2021 | 2020 |
| Per Share Operating Performance |
Net asset value, beginning of year
| $33.62 | $33.46 | $54.83 | $35.46 | $39.29 |
| Income (loss) from investment operations: | | | | | |
Net investment loss1
| (0.10) | (0.13) | (0.23) | (0.20) | (0.05) |
Net realized and unrealized gain (loss)
| 0.23 | 4.39 | (13.74) | 19.99 | (0.23) |
Net increase (decrease) from investment operations
| 0.13 | 4.26 | (13.97) | 19.79 | (0.28) |
| Less distributions to shareholders: | | | | | |
Distributions from net realized capital gains
| — | (4.10) | (7.40) | (0.42) | (3.55) |
Total distributions to shareholders
| — | (4.10) | (7.40) | (0.42) | (3.55) |
Redemption fees
| 0.002 | 0.002 | — | 0.002 | 0.002 |
Net asset value, end of year
| $33.75 | $33.62 | $33.46 | $54.83 | $35.46 |
Total return
| 0.39% | 14.61% | (29.25)% | 56.01% | (1.42)%3 |
| |
| Ratios to Average Net Assets |
Ratio of net investment loss to average net assets
| (0.31)%4 | (0.38)%4 | (0.50)%4 | (0.47)%4 | (0.13)% |
Ratio of expenses to average net assets
| 0.96%4 | 0.94%4 | 0.92%4 | 0.87%4 | 0.86% |
| |
| Supplemental Data |
Net Assets, End of Year (000's)
| $19,871 | $33,267 | $40,639 | $62,145 | $280,414 |
Portfolio Turnover Rate
| 33% | 47% | 42% | 30% | 47% |
| | |
| 1 | Per share net investment loss has been calculated using the average daily shares method. |
| 2 | Less than $0.005 per share. |
| 3 | The total return is based on beginning and ending Financial Statement Net Asset Value as shown above, which may differ from the traded Net Asset Value, due to rounding. |
| 4 | These ratios exclude the impact of expenses of the underlying private investment funds in which the Fund invests as represented in the Schedule of Investments. |
The accompanying notes are an integral part of the financial statements.
| Meridian Funds | 31 | www.arrowmarkpartners.com/meridian/ |
Meridian Contrarian Fund
Financial Highlights
| | For the Fiscal Year Ended June 30, |
| Legacy Class | 2024 | 2023 | 2022 | 2021 | 2020 |
| Per Share Operating Performance |
Net asset value, beginning of year
| $37.68 | $36.27 | $50.21 | $31.63 | $35.91 |
| Income (loss) from investment operations: | | | | | |
Net investment income (loss)1
| 0.16 | 0.16 | (0.01) | (0.04) | 0.16 |
Net realized and unrealized gain (loss)
| 0.94 | 5.17 | (7.44) | 20.68 | (1.64) |
Net increase (decrease) from investment operations
| 1.10 | 5.33 | (7.45) | 20.64 | (1.48) |
| Less distributions to shareholders: | | | | | |
Distributions from net investment income
| (0.17) | — | — | (0.94) | (0.31) |
Distributions from net realized capital gains
| (1.82) | (3.92) | (6.49) | (1.12) | (2.49) |
Total distributions to shareholders
| (1.99) | (3.92) | (6.49) | (2.06) | (2.80) |
Redemption fees
| 0.002 | 0.002 | — | 0.002 | 0.002 |
Net asset value, end of year
| $36.79 | $37.68 | $36.27 | $50.21 | $31.63 |
Total return
| 3.02% | 15.71% | (17.18)% | 66.77% | (4.90)% |
| |
| Ratios to Average Net Assets |
Ratio of net investment income (loss) to average
net assets
| 0.45% | 0.44% | (0.03)% | (0.11)% | 0.47% |
Ratio of expenses to average net assets
| 1.17% | 1.15% | 1.12% | 1.11% | 1.13% |
| |
| Supplemental Data |
Net Assets, End of Year (000's)
| $545,609 | $596,928 | $560,554 | $730,712 | $483,573 |
Portfolio Turnover Rate
| 58% | 54% | 57% | 72% | 76% |
| | |
| 1 | Per share net investment income (loss) has been calculated using the average daily shares method. |
| 2 | Less than $0.005 per share. |
The accompanying notes are an integral part of the financial statements.
| Meridian Funds | 32 | www.arrowmarkpartners.com/meridian/ |
Meridian Contrarian Fund
Financial Highlights
| | For the Fiscal Year Ended June 30, |
| Class A | 2024 | 2023 | 2022 | 2021 | 2020 |
| Per Share Operating Performance |
Net asset value, beginning of year
| $36.13 | $35.04 | $48.85 | $30.83 | $34.94 |
| Income (loss) from investment operations: | | | | | |
Net investment income (loss)1
| 0.05 | 0.05 | (0.17) | (0.21) | 0.01 |
Net realized and unrealized gain (loss)
| 0.91 | 4.96 | (7.17) | 20.17 | (1.57) |
Net increase (decrease) from investment operations
| 0.96 | 5.01 | (7.34) | 19.96 | (1.56) |
| Less distributions to shareholders: | | | | | |
Distributions from net investment income
| (0.01) | — | — | (0.82) | (0.06) |
Distributions from net realized capital gains
| (1.82) | (3.92) | (6.49) | (1.12) | (2.49) |
Total distributions to shareholders
| (1.83) | (3.92) | (6.49) | (1.94) | (2.55) |
Redemption fees
| — | — | 0.02 | 0.002 | 0.002 |
Net asset value, end of year
| $35.26 | $36.13 | $35.04 | $48.85 | $30.83 |
Total return3
| 2.74% | 15.33% | (17.40)% | 66.22% | (5.22)% |
| |
| Ratios to Average Net Assets |
Ratio of net investment income (loss) to
average net assets
| 0.14% | 0.13% | (0.38)% | (0.51)% | 0.04% |
Ratio of expenses to average net assets
| 1.44% | 1.46% | 1.46% | 1.43% | 1.48% |
| |
| Supplemental Data |
Net Assets, End of Year (000's)
| $1,424 | $2,451 | $2,057 | $3,403 | $1,648 |
Portfolio Turnover Rate
| 58% | 54% | 57% | 72% | 76% |
| | |
| 1 | Per share net investment income (loss) has been calculated using the average daily shares method. |
| 2 | Less than $0.005 per share. |
| 3 | Excludes the effects of any sales charges. |
The accompanying notes are an integral part of the financial statements.
| Meridian Funds | 33 | www.arrowmarkpartners.com/meridian/ |
Meridian Contrarian Fund
Financial Highlights
| | For the Fiscal Year Ended June 30, |
| Class C | 2024 | 2023 | 2022 | 2021 | 2020 |
| Per Share Operating Performance |
Net asset value, beginning of year
| $34.16 | $33.56 | $47.38 | $30.13 | $34.37 |
| Income (loss) from investment operations: | | | | | |
Net investment loss1
| (0.20) | (0.20) | (0.43) | (0.53) | (0.17) |
Net realized and unrealized gain (loss)
| 0.83 | 4.72 | (6.91) | 19.69 | (1.58) |
Net increase (decrease) from investment operations
| 0.63 | 4.52 | (7.34) | 19.16 | (1.75) |
| Less distributions to shareholders: | | | | | |
Distributions from net investment income
| — | — | — | (0.79) | — |
Distributions from net realized capital gains
| (1.82) | (3.92) | (6.49) | (1.12) | (2.49) |
Total distributions to shareholders
| (1.82) | (3.92) | (6.49) | (1.91) | (2.49) |
Redemption fees
| — | 0.002 | 0.01 | — | — |
Net asset value, end of year
| $32.97 | $34.16 | $33.56 | $47.38 | $30.13 |
Total return3
| 1.93% | 14.50% | (18.01)% | 65.03% | (5.86)%4 |
| |
| Ratios to Average Net Assets |
Ratio of net investment loss to average net assets
| (0.61)% | (0.59)% | (1.06)% | (1.27)% | (0.55)% |
| Ratio of expenses to average net assets: | | | | | |
Total expenses
| 2.24% | 2.23% | 2.19% | 2.16% | 2.17% |
After fees waived5
| 2.23% | 2.20% | 2.19% | 2.16% | 2.17% |
| |
| Supplemental Data |
Net Assets, End of Year (000's)
| $570 | $583 | $403 | $193 | $49 |
Portfolio Turnover Rate
| 58% | 54% | 57% | 72% | 76% |
| | |
| 1 | Per share net investment income (loss) has been calculated using the average daily shares method. |
| 2 | Less than $0.005 per share. |
| 3 | Excludes the effects of any sales charges. |
| 4 | The total return is based on beginning and ending Financial Statement Net Asset Value as shown above, which may differ from the traded Net Asset Value, due to rounding. |
| 5 | See Note 6 to Financial Statements. |
The accompanying notes are an integral part of the financial statements.
| Meridian Funds | 34 | www.arrowmarkpartners.com/meridian/ |
Meridian Contrarian Fund
Financial Highlights
| | For the Fiscal Year Ended June 30, |
| Investor Class | 2024 | 2023 | 2022 | 2021 | 2020 |
| Per Share Operating Performance |
Net asset value, beginning of year
| $37.22 | $35.89 | $49.77 | $31.37 | $35.63 |
| Income (loss) from investment operations: | | | | | |
Net investment income (loss)1
| 0.16 | 0.16 | (0.05) | (0.11) | 0.12 |
Net realized and unrealized gain (loss)
| 0.91 | 5.09 | (7.34) | 20.54 | (1.61) |
Net increase (decrease) from investment operations
| 1.07 | 5.25 | (7.39) | 20.43 | (1.49) |
| Less distributions to shareholders: | | | | | |
Distributions from net investment income
| (0.15) | — | — | (0.91) | (0.28) |
Distributions from net realized capital gains
| (1.82) | (3.92) | (6.49) | (1.12) | (2.49) |
Total distributions to shareholders
| (1.97) | (3.92) | (6.49) | (2.03) | (2.77) |
Redemption fees
| 0.002 | — | 0.002 | 0.002 | 0.002 |
Net asset value, end of year
| $36.32 | $37.22 | $35.89 | $49.77 | $31.37 |
Total return
| 3.00% | 15.65% | (17.21)% | 66.65% | (4.96)% |
| |
| Ratios to Average Net Assets |
Ratio of net investment income (loss) to average net assets
| 0.43% | 0.43% | (0.11)% | (0.28)% | 0.37% |
Ratio of expenses to average net assets
| 1.20% | 1.19% | 1.18% | 1.19% | 1.19% |
| |
| Supplemental Data |
Net Assets, End of Year (000's)
| $17,144 | $16,487 | $11,088 | $5,690 | $1,936 |
Portfolio Turnover Rate
| 58% | 54% | 57% | 72% | 76% |
| | |
| 1 | Per share net investment income (loss) has been calculated using the average daily shares method. |
| 2 | Less than $0.005 per share. |
The accompanying notes are an integral part of the financial statements.
| Meridian Funds | 35 | www.arrowmarkpartners.com/meridian/ |
Meridian Hedged Equity Fund
Financial Highlights
| | For the Fiscal Year Ended June 30, |
| Legacy Class | 2024 | 2023 | 2022 | 2021 | 2020 |
| Per Share Operating Performance |
Net asset value, beginning of year
| $12.51 | $12.26 | $17.80 | $15.17 | $18.42 |
| Income (loss) from investment operations: | | | | | |
Net investment income (loss)1
| 0.09 | 0.02 | (0.04) | (0.05) | (0.02) |
Net realized and unrealized gain (loss)
| 1.70 | 1.28 | (1.74) | 4.82 | 2.65 |
Net increase (decrease) from investment operations
| 1.79 | 1.30 | (1.78) | 4.77 | 2.63 |
| Less distributions to shareholders: | | | | | |
Distributions from net investment income
| (0.02) | — | — | — | — |
Distributions from net realized capital gains
| (0.06) | (1.05) | (3.76) | (2.14) | (5.88) |
Total distributions to shareholders
| (0.08) | (1.05) | (3.76) | (2.14) | (5.88) |
Redemption fees
| 0.002 | — | — | — | 0.002 |
Net asset value, end of year
| $14.22 | $12.51 | $12.26 | $17.80 | $15.17 |
Total return
| 14.37% | 11.52% | (13.52)% | 33.17% | 15.86%3 |
| |
| Ratios to Average Net Assets |
Ratio of net investment income (loss) to average
net assets
| 0.71% | 0.16% | (0.29)% | (0.31)% | (0.12)% |
| Ratio of expenses to average net assets: | | | | | |
Total expenses
| 1.44% | 1.33% | 1.20% | 1.25% | 1.28% |
Before fees waived and excluding recoupment of past waived fees
| 1.44% | 1.33% | 1.20% | 1.24% | 1.28% |
After fees waived and excluding recoupment of past waived fees4
| 1.25% | 1.25% | 1.20% | 1.24% | 1.26% |
After fees waived and Excluding recoupment of past waived fees and interest and dividend expenses4
| 1.25% | 1.25% | 1.20% | 1.24% | 1.25% |
| |
| Supplemental Data |
Net Assets, End of Year (000's)
| $41,038 | $43,993 | $46,636 | $60,565 | $48,332 |
Portfolio Turnover Rate
| 33% | 43% | 74% | 96% | 140% |
| | |
| 1 | Per share net investment income (loss) has been calculated using the average daily shares method. |
| 2 | Less than $0.005 per share. |
| 3 | The total return is based on beginning and ending Financial Statement Net Asset Value as shown above, which may differ from the traded Net Asset Value, due to rounding. |
| 4 | See Note 6 to Financial Statements. |
The accompanying notes are an integral part of the financial statements.
| Meridian Funds | 36 | www.arrowmarkpartners.com/meridian/ |
Meridian Hedged Equity Fund
Financial Highlights
| | For the Fiscal Year Ended June 30, |
| Class A | 2024 | 2023 | 2022 | 2021 | 2020 |
| Per Share Operating Performance |
Net asset value, beginning of year
| $12.10 | $11.94 | $17.48 | $14.97 | $18.31 |
| Income (loss) from investment operations: | | | | | |
Net investment income (loss)1
| 0.06 | (0.02) | (0.10) | (0.11) | (0.08) |
Net realized and unrealized gain (loss)
| 1.64 | 1.23 | (1.68) | 4.76 | 2.61 |
Net increase (decrease) from investment operations
| 1.70 | 1.21 | (1.78) | 4.65 | 2.53 |
| Less distributions to shareholders: | | | | | |
Distributions from net realized capital gains
| (0.06) | (1.05) | (3.76) | (2.14) | (5.88) |
Total distributions to shareholders
| (0.06) | (1.05) | (3.76) | (2.14) | (5.88) |
Redemption fees
| — | 0.002 | 0.002 | 0.002 | 0.01 |
Net asset value, end of year
| $13.74 | $12.10 | $11.94 | $17.48 | $14.97 |
Total return3
| 14.09% | 11.05% | (13.80)% | 32.78% | 15.39%4 |
| |
| Ratios to Average Net Assets |
Ratio of net investment income (loss) to
average net assets
| 0.44% | (0.20)% | (0.63)% | (0.66)% | (0.50)% |
| Ratio of expenses to average net assets: | | | | | |
Total expenses
| 1.68% | 1.62% | 1.54% | 1.60% | 1.64% |
Before fees waived and excluding recoupment of past waived fees
| 1.68% | 1.62% | 1.53% | 1.57% | 1.64% |
After fees waived and excluding recoupment of past waived fees5
| 1.53% | 1.60% | 1.53% | 1.57% | 1.61% |
After fees waived and excluding recoupment of past waived fees and interest and dividend expenses5
| 1.53% | 1.60% | 1.53% | 1.57% | 1.60% |
| |
| Supplemental Data |
Net Assets, End of Year (000's)
| $1,663 | $1,414 | $1,844 | $2,117 | $1,770 |
Portfolio Turnover Rate
| 33% | 43% | 74% | 96% | 140% |
| | |
| 1 | Per share net investment income (loss) has been calculated using the average daily shares method. |
| 2 | Less than $0.005 per share. |
| 3 | Excludes the effects of any sales charges. |
| 4 | The total return is based on beginning and ending Financial Statement Net Asset Value as shown above, which may differ from the traded Net Asset Value, due to rounding. |
| 5 | See Note 6 to Financial Statements. |
The accompanying notes are an integral part of the financial statements.
| Meridian Funds | 37 | www.arrowmarkpartners.com/meridian/ |
Meridian Hedged Equity Fund
Financial Highlights
| | For the Fiscal Year Ended June 30, |
| Class C | 2024 | 2023 | 2022 | 2021 | 2020 |
| Per Share Operating Performance |
Net asset value, beginning of year
| $11.64 | $11.57 | $17.13 | $14.76 | $18.17 |
| Income (loss) from investment operations: | | | | | |
Net investment loss1
| (0.03) | (0.07) | (0.15) | (0.17) | (0.11) |
Net realized and unrealized gain (loss)
| 1.58 | 1.19 | (1.65) | 4.68 | 2.58 |
Net increase (decrease) from investment operations
| 1.55 | 1.12 | (1.80) | 4.51 | 2.47 |
| Less distributions to shareholders: | | | | | |
Distributions from net realized capital gains
| (0.06) | (1.05) | (3.76) | (2.14) | (5.88) |
Total distributions to shareholders
| (0.06) | (1.05) | (3.76) | (2.14) | (5.88) |
Redemption fees
| — | — | — | — | — |
Net asset value, end of year
| $13.13 | $11.64 | $11.57 | $17.13 | $14.76 |
Total return2
| 13.35% | 10.60% | (14.23)% | 32.27% | 15.08% |
| |
| Ratios to Average Net Assets |
Ratio of net investment loss to average net assets
| (0.27)% | (0.60)% | (1.05)% | (1.05)% | (0.77)% |
| Ratio of expenses to average net assets: | | | | | |
Total expenses
| 2.41% | 2.25% | 2.17% | 2.20% | 2.25% |
Excluding recoupment of past waived fees
| 2.41% | 2.25% | 2.17% | 2.20% | 2.25% |
After fees waived and excluding recoupment of past waived fees3
| 2.17% | 2.00% | 2.00% | 2.00% | 2.02% |
After fees waived and excluding recoupment of past waived fees and interest and dividend expenses3
| 2.17% | 2.00% | 2.00% | 2.00% | 2.00% |
| |
| Supplemental Data |
Net Assets, End of Year (000's)
| $6 | $24 | $58 | $10 | $30 |
Portfolio Turnover Rate
| 33% | 43% | 74% | 96% | 140% |
| | |
| 1 | Per share net investment income (loss) has been calculated using the average daily shares method. |
| 2 | Excludes the effects of any sales charges. |
| 3 | See Note 6 to Financial Statements. |
The accompanying notes are an integral part of the financial statements.
| Meridian Funds | 38 | www.arrowmarkpartners.com/meridian/ |
Meridian Hedged Equity Fund
Financial Highlights
| | For the Fiscal Year Ended June 30, |
| Investor Class | 2024 | 2023 | 2022 | 2021 | 2020 |
| Per Share Operating Performance |
Net asset value, beginning of year
| $12.45 | $12.22 | $17.76 | $15.12 | $18.40 |
| Income (loss) from investment operations: | | | | | |
Net investment income (loss)1
| 0.09 | 0.01 | (0.04) | (0.04) | (0.03) |
Net realized and unrealized gain (loss)
| 1.69 | 1.27 | (1.74) | 4.81 | 2.62 |
Net increase (decrease) from investment operations
| 1.78 | 1.28 | (1.78) | 4.77 | 2.59 |
| Less distributions to shareholders: | | | | | |
Distributions from net investment income
| (0.01) | — | — | — | — |
Distributions from net realized capital gains
| (0.06) | (1.05) | (3.76) | (2.14) | (5.88) |
Total distributions to shareholders
| (0.07) | (1.05) | (3.76) | (2.14) | (5.88) |
Redemption fees
| — | — | — | 0.01 | 0.01 |
Net asset value, end of year
| $14.16 | $12.45 | $12.22 | $17.76 | $15.12 |
Total return
| 14.34% | 11.38% | (13.55)% | 33.37% | 15.65% |
| |
| Ratios to Average Net Assets |
Ratio of net investment income (loss) to average net assets
| 0.70% | 0.09% | (0.27)% | (0.26)% | (0.17)% |
| Ratio of expenses to average net assets: | | | | | |
Total expenses
| 1.43% | 1.33% | 1.19% | 1.20% | 1.35% |
Before fees waived and excluding recoupment of past waived fees
| 1.43% | 1.33% | 1.19% | 1.20% | 1.35% |
After fees waived and excluding recoupment of past waived fees and interest and dividend expenses
| 1.28% | 1.33% | 1.19% | 1.20% | 1.34% |
| |
| Supplemental Data |
Net Assets, End of Year (000's)
| $2,568 | $2,168 | $2,031 | $1,957 | $1,681 |
Portfolio Turnover Rate
| 33% | 43% | 74% | 96% | 140% |
| | |
| 1 | Per share net investment income (loss) has been calculated using the average daily shares method. |
The accompanying notes are an integral part of the financial statements.
| Meridian Funds | 39 | www.arrowmarkpartners.com/meridian/ |
Meridian Small Cap Growth Fund
Financial Highlights
| | For the Fiscal Year Ended June 30, |
| Legacy Class | 2024 | 2023 | 2022 | 2021 | 2020 |
| Per Share Operating Performance |
Net asset value, beginning of year
| $12.01 | $11.82 | $23.30 | $14.71 | $15.74 |
| Income (loss) from investment operations: | | | | | |
Net investment loss1
| (0.08) | (0.09) | (0.16) | (0.15) | (0.06) |
Net realized and unrealized gain (loss)
| 0.60 | 1.81 | (5.96) | 9.13 | (0.04) |
Net increase (decrease) from investment operations
| 0.52 | 1.72 | (6.12) | 8.98 | (0.10) |
| Less distributions to shareholders: | | | | | |
Distributions from net realized capital gains
| — | (1.53) | (5.36) | (0.39) | (0.93) |
Total distributions to shareholders
| — | (1.53) | (5.36) | (0.39) | (0.93) |
Redemption fees
| — | 0.002 | — | — | 0.002 |
Net asset value, end of year
| $12.53 | $12.01 | $11.82 | $23.30 | $14.71 |
Total return
| 4.33% | 16.25% | (32.39)% | 61.51% | (1.17)% |
| |
| Ratios to Average Net Assets |
Ratio of net investment loss to average
net assets
| (0.64)%3 | (0.74)%3 | (0.88)%3 | (0.75)%3 | (0.42)% |
| Ratio of expenses to average net assets: | | | | | |
Total expenses
| 1.25%3 | 1.21%3 | 1.15%3 | 1.12%3 | 1.13% |
After fees waived4
| 1.23%3 | 1.20%3 | 1.15%3 | 1.12%3 | 1.13% |
| |
| Supplemental Data |
Net Assets, End of Year (000's)
| $16,910 | $30,447 | $30,519 | $41,481 | $27,080 |
Portfolio Turnover Rate
| 42% | 53% | 45% | 32% | 40% |
| | |
| 1 | Per share net investment loss has been calculated using the average daily shares method. |
| 2 | Less than $0.005 per share. |
| 3 | These ratios exclude the impact of expenses of the underlying private investment funds in which the Fund invests as represented in the Schedule of Investments. |
| 4 | See Note 6 to Financial Statements. |
The accompanying notes are an integral part of the financial statements.
| Meridian Funds | 40 | www.arrowmarkpartners.com/meridian/ |
Meridian Small Cap Growth Fund
Financial Highlights
| | For the Fiscal Year Ended June 30, |
| Institutional Class | 2024 | 2023 | 2022 | 2021 | 2020 |
| Per Share Operating Performance |
Net asset value, beginning of year
| $12.14 | $11.92 | $23.44 | $14.79 | $15.81 |
| Income (loss) from investment operations: | | | | | |
Net investment loss1
| (0.06) | (0.08) | (0.15) | (0.14) | (0.06) |
Net realized and unrealized gain (loss)
| 0.60 | 1.83 | (6.01) | 9.18 | (0.04) |
Net increase (decrease) from investment operations
| 0.54 | 1.75 | (6.16) | 9.04 | (0.10) |
| Less distributions to shareholders: | | | | | |
Distributions from net realized capital gains
| — | (1.53) | (5.36) | (0.39) | (0.93) |
Total distributions to shareholders
| — | (1.53) | (5.36) | (0.39) | (0.93) |
Redemption fees
| 0.002 | 0.002 | 0.002 | 0.002 | 0.01 |
Net asset value, end of year
| $12.68 | $12.14 | $11.92 | $23.44 | $14.79 |
Total return
| 4.45% | 16.38% | (32.36)% | 61.59% | (1.09)% |
| |
| Ratios to Average Net Assets |
Ratio of net investment loss to average
net assets
| (0.49)%3 | (0.65)%3 | (0.82)%3 | (0.72)%3 | (0.40)% |
| Ratio of expenses to average net assets: | | | | | |
Total expenses
| 1.19%3 | 1.15%3 | 1.09%3 | 1.10%3 | 1.10% |
Before fees waived and excluding recoupment of past waived fees
| 1.19%3 | 1.15%3 | 1.09%3 | 1.09%3 | 1.10% |
After fees waived and excluding recoupment of past waived fees 4
| 1.10%3 | 1.10%3 | 1.09%3 | 1.09%3 | 1.10% |
| |
| Supplemental Data |
Net Assets, End of Year (000's)
| $296,282 | $300,507 | $316,076 | $611,787 | $587,095 |
Portfolio Turnover Rate
| 42% | 53% | 45% | 32% | 40% |
| | |
| 1 | Per share net investment loss has been calculated using the average daily shares method. |
| 2 | Less than $0.005 per share. |
| 3 | These ratios exclude the impact of expenses of the underlying private investment funds in which the Fund invests as represented in the Schedule of Investments. |
| 4 | See Note 6 to Financial Statements. |
The accompanying notes are an integral part of the financial statements.
| Meridian Funds | 41 | www.arrowmarkpartners.com/meridian/ |
Meridian Small Cap Growth Fund
Financial Highlights
| | For the Fiscal Year Ended June 30, |
| Class A | 2024 | 2023 | 2022 | 2021 | 2020 |
| Per Share Operating Performance |
Net asset value, beginning of year
| $11.38 | $11.31 | $22.62 | $14.33 | $15.42 |
| Income (loss) from investment operations: | | | | | |
Net investment loss1
| (0.10) | (0.12) | (0.21) | (0.20) | (0.11) |
Net realized and unrealized gain (loss)
| 0.56 | 1.72 | (5.74) | 8.88 | (0.05) |
Net increase (decrease) from investment operations
| 0.46 | 1.60 | (5.95) | 8.68 | (0.16) |
| Less distributions to shareholders: | | | | | |
Distributions from net realized capital gains
| — | (1.53) | (5.36) | (0.39) | (0.93) |
Total distributions to shareholders
| — | (1.53) | (5.36) | (0.39) | (0.93) |
Redemption fees
| — | 0.002 | 0.002 | — | 0.002 |
Net asset value, end of year
| $11.84 | $11.38 | $11.31 | $22.62 | $14.33 |
Total return3
| 4.04% | 15.90% | (32.63)% | 61.05% | (1.59)% |
| |
| Ratios to Average Net Assets |
Ratio of net investment loss to average
net assets
| (0.94)%4 | (1.04)%4 | (1.22)%4 | (1.10)%4 | (0.80)% |
| Ratio of expenses to average net assets: | | | | | |
Total expenses
| 1.59%4 | 1.49%4 | 1.49%4 | 1.48%4 | 1.49% |
After fees waived5
| 1.54%4 | 1.49%4 | 1.49%4 | 1.48%4 | 1.49% |
| |
| Supplemental Data |
Net Assets, End of Year (000's)
| $9,898 | $14,667 | $20,946 | $35,335 | $33,878 |
Portfolio Turnover Rate
| 42% | 53% | 45% | 32% | 40% |
| | |
| 1 | Per share net investment loss has been calculated using the average daily shares method. |
| 2 | Less than $0.005 per share. |
| 3 | Excludes the effects of any sales charges. |
| 4 | These ratios exclude the impact of expenses of the underlying private investment funds in which the Fund invests as represented in the Schedule of Investments. |
| 5 | See Note 6 to Financial Statements. |
The accompanying notes are an integral part of the financial statements.
| Meridian Funds | 42 | www.arrowmarkpartners.com/meridian/ |
Meridian Small Cap Growth Fund
Financial Highlights
| | For the Fiscal Year Ended June 30, |
| Class C | 2024 | 2023 | 2022 | 2021 | 2020 |
| Per Share Operating Performance |
Net asset value, beginning of year
| $10.46 | $10.59 | $21.68 | $13.84 | $15.02 |
| Income (loss) from investment operations: | | | | | |
Net investment loss1
| (0.17) | (0.19) | (0.31) | (0.32) | (0.21) |
Net realized and unrealized gain (loss)
| 0.52 | 1.59 | (5.42) | 8.55 | (0.04) |
Net increase (decrease) from investment operations
| 0.35 | 1.40 | (5.73) | 8.23 | (0.25) |
| Less distributions to shareholders: | | | | | |
Distributions from net realized capital gains
| — | (1.53) | (5.36) | (0.39) | (0.93) |
Total distributions to shareholders
| — | (1.53) | (5.36) | (0.39) | (0.93) |
Redemption fees
| — | 0.002 | — | — | 0.002 |
Net asset value, end of year
| $10.81 | $10.46 | $10.59 | $21.68 | $13.84 |
Total return3
| 3.35% | 15.03% | (33.10)% | 59.94% | (2.25)% |
| |
| Ratios to Average Net Assets |
Ratio of net investment loss to average net assets
| (1.66)%4 | (1.79)%4 | (1.90)%4 | (1.78)%4 | (1.47)% |
| Ratio of expenses to average net assets: | | | | | |
Total expenses
| 2.28%4 | 2.22%4 | 2.17%4 | 2.16%4 | 2.18% |
After fees waived5
| 2.25%4 | 2.22%4 | 2.17%4 | 2.16%4 | 2.18% |
| |
| Supplemental Data |
Net Assets, End of Year (000's)
| $2,009 | $3,374 | $4,241 | $8,324 | $6,922 |
Portfolio Turnover Rate
| 42% | 53% | 45% | 32% | 40% |
| | |
| 1 | Per share net investment loss has been calculated using the average daily shares method. |
| 2 | Less than $0.005 per share. |
| 3 | Excludes the effects of any sales charges. |
| 4 | These ratios exclude the impact of expenses of the underlying private investment funds in which the Fund invests as represented in the Schedule of Investments. |
| 5 | See Note 6 to Financial Statements. |
The accompanying notes are an integral part of the financial statements.
| Meridian Funds | 43 | www.arrowmarkpartners.com/meridian/ |
Meridian Small Cap Growth Fund
Financial Highlights
| | For the Fiscal Year Ended June 30, |
| Investor Class | 2024 | 2023 | 2022 | 2021 | 2020 |
| Per Share Operating Performance |
Net asset value, beginning of year
| $11.89 | $11.72 | $23.17 | $14.63 | $15.70 |
| Income (loss) from investment operations: | | | | | |
Net investment loss1
| (0.08) | (0.09) | (0.17) | (0.15) | (0.09) |
Net realized and unrealized gain (loss)
| 0.59 | 1.79 | (5.92) | 9.08 | (0.05) |
Net increase (decrease) from investment operations
| 0.51 | 1.70 | (6.09) | 8.93 | (0.14) |
| Less distributions to shareholders: | | | | | |
Distributions from net realized capital gains
| — | (1.53) | (5.36) | (0.39) | (0.93) |
Total distributions to shareholders
| — | (1.53) | (5.36) | (0.39) | (0.93) |
Redemption fees
| 0.002 | 0.002 | 0.002 | — | 0.002 |
Net asset value, end of year
| $12.40 | $11.89 | $11.72 | $23.17 | $14.63 |
Total return
| 4.29% | 16.21% | (32.44)% | 61.51% | (1.43)%3 |
| |
| Ratios to Average Net Assets |
Ratio of net investment loss to average net assets
| (0.70)%4 | (0.79)%4 | (0.94)%4 | (0.80)%4 | (0.59)% |
Ratio of expenses to average net assets
| 1.27%4 | 1.24%4 | 1.22%4 | 1.17%4 | 1.29% |
| |
| Supplemental Data |
Net Assets, End of Year (000's)
| $116,107 | $437,966 | $442,418 | $920,317 | $666,635 |
Portfolio Turnover Rate
| 42% | 53% | 45% | 32% | 40% |
| | |
| 1 | Per share net investment loss has been calculated using the average daily shares method. |
| 2 | Less than $0.005 per share. |
| 3 | The total return is based on beginning and ending Financial Statement Net Asset Value as shown above, which may differ from the traded Net Asset Value, due to rounding. |
| 4 | These ratios exclude the impact of expenses of the underlying private investment funds in which the Fund invests as represented in the Schedule of Investments. |
The accompanying notes are an integral part of the financial statements.
| Meridian Funds | 44 | www.arrowmarkpartners.com/meridian/ |
Meridian Fund, Inc.
Notes to Financial Statements
June 30, 2024
| 1. | Organization and Significant Accounting Policies: Meridian Fund, Inc. (the “Meridian Funds” or the “Company”) comprises the following separate series: the Meridian Growth Fund (the “Growth Fund”), the Meridian Contrarian Fund (the “Contrarian Fund”), the Meridian Hedged Equity Fund (the “Hedged Equity Fund”) and the Meridian Small Cap Growth Fund (the “Small Cap Growth Fund”) (each a “Fund” and collectively, the “Funds”). The Company is registered as an open-end investment company under the Investment Company Act of 1940 and is organized as a Maryland corporation. Each Fund is classified as a "diversified" management investment company. |
| | Meridian Funds offer five share classes: Legacy Class Shares, Investor Class Shares, Class A Shares, Class C Shares and Institutional Class Shares. As of June 30, 2024, Institutional Class Shares of the Hedged Equity Fund and Contrarian Fund are not currently being offered for sale. Effective June 15, 2017, Investor Class, Class A, and Class C Shares of the Growth Fund are closed to new investors. Effective June 29, 2018, Investor Class, Class A, and Class C Shares of the Small Cap Growth Fund are closed to new investors. Legacy Class Shares are available to investors who have continuously held an investment in any Meridian Fund prior to November 15, 2013. Effective November 1, 2018, direct initial purchases of Legacy Class Shares are permitted in the Hedged Equity Fund. Institutional Class Shares are available to certain eligible investors including endowments, foundations and qualified retirement plans. Class A, Class C and Investor Class Shares are available for purchase through financial intermediary platforms. Legacy Class, Investor Class, Class A and Institutional Class Shares are subject to a 2% redemption fee on shares redeemed or exchanged that have been held for 60 days or less. The redemption fees are collected and retained by the Fund for the benefit of the remaining shareholders. The redemption fees are recorded as a credit to paid-in capital. Class A Shares are subject to a maximum initial sales charge (front-end load) of 5.75%. Class C Shares are subject to a 1.00% contingent deferred sales charge ("CDSC") if redeemed within one year of purchase. Investor Class Shares are not subject to front-end load or CDSC and require a higher minimum initial investment. All Classes have identical rights and privileges with respect to the Fund in general, and exclusive voting rights with respect to Class specific matters. Net Asset Value ("NAV") per share may differ by class due to each class having its own expenses directly attributable to that class. Class A and Class C Shares are also subject to certain expenses related to the distribution of these shares. See Note 6 for further information on additional share classes. |
| | The primary investment objectives of the Growth Fund, Contrarian Fund, and Hedged Equity Fund are to seek long-term growth of capital. |
| | The primary investment objective of the Small Cap Growth Fund is to seek long-term growth of capital by investing primarily in equity securities of small capitalization companies. |
| | The following significant accounting policies are consistently followed by the Funds in the preparation of their financial statements in conformity with U.S. generally accepted accounting principles ("U.S." GAAP"). Each Fund is considered an investment company under U.S. GAAP and follows the accounting and reporting guidance in the Financial Accounting Standards Board (FASB) Accounting Standards Codification Topic 946, Financial Services - Investment Companies. |
| a. | Cash & Cash Equivalents: Each Fund considers its investment in a Federal Deposit Insurance Corporation insured interest bearing account to be cash and cash equivalents. Cash and cash equivalents are valued at cost plus any accrued interest. The Funds maintain cash balances, which, at times may exceed federally insured limits. The Funds maintain these balances with a high quality financial institution. The Funds may incur charges on cash overdrafts. |
| b. | Share Valuation: The NAV of each Fund's share class is calculated by dividing the sum of the value of the securities held by each Fund, plus cash or other assets, minus all liabilities (including estimated accrued expenses), by the total number of shares outstanding of each Fund. The result is rounded to the nearest cent. Each Fund’s shares will not be priced on the days in which the New York Stock Exchange ("NYSE") is closed for trading. |
| c. | Investment Valuations: Equity securities are valued at the closing price or last sales price on the principal exchange or market on which they are traded; or, if there were no sales that day, at the last reported bid price. |
| | Fixed income (debt) securities are valued on the basis of last available bid prices or current market quotations provided by dealers or pricing services. In determining the value of a particular investment, pricing services may use certain information with respect to transactions in such investments, quotations from dealers, pricing matrixes, market transactions in comparable investments, various relationships observed in the market between investments and calculated yield measures. |
| Meridian Funds | 45 | www.arrowmarkpartners.com/meridian/ |
Meridian Fund, Inc.
Notes to Financial Statements (continued)
June 30, 2024
| | Investments in open-end U.S. mutual funds are valued at NAV each business day. |
| | The market value of the Funds' investments in exchange traded funds is based on the published NAV of each fund computed as of the close of regular trading on the NYSE on days when the NYSE is open. |
| | Exchange-traded options are valued at the most recent sale price at the close of the options market in which the options trade. An exchange-traded option for which there is no close price is valued at the last bid (long positions) or ask (short positions) price. If no bid or ask price is available, the prior day’s price will be used, unless it is determined that the prior day’s price no longer reflects the fair value of the option. |
| | Securities and other assets for which reliable market quotations are not readily available or for which a significant event has occurred since the time of the most recent market quotation, will be valued based upon other available factors deemed relevant by ArrowMark Colorado Holdings, LLC (the “Adviser”) under the guidelines utilized by the Funds' valuation designee, and under the general supervision and responsibility of, the Funds’ Board of Directors (the “Board”). These factors include but are not limited to (i) attributes specific to the investment; (ii) the principal market for the investment; (iii) the customary participants in the principal market for the investment; (iv) data assumptions by market participants for the investment, if reasonably available; (v) quoted prices for similar investments in active markets; and (vi) other factors, such as future cash flows, interest rates, yield curves, volatilities, prepayment speeds, loss severities, credit risks and/or default rates. Valuations based on such factors are reported to the Board on a quarterly basis. The Board has approved the designation of the Adviser as the valuation designee for the Funds. |
| | A Fund's investment in an unregistered pooled investment vehicle (“Private Investment Fund”) is valued, as a practical expedient, at the most recent net asset value determined by the Private Investment Fund manager according to such manager’s policies and procedures based on valuation information reasonably available to the Private Investment Fund manager at that time; provided, however, that the Valuation Designee may consider whether it is appropriate, in light of relevant circumstances, to adjust such valuation in accordance with the Fund’s valuation procedures. If the Private Investment Fund does not report a value to a Fund on a timely basis, the fair value of the Private Investment Fund shall be based on the most recent value reported by the Private Investment Fund, as well as any other relevant information available at the time the Fund values its portfolio. The frequency and timing of receiving valuations for the Private Investment Fund investment is subject to change at any time, without notice to investors, at the discretion of the Private Investment Fund manager or the Fund. |
| d. | Fair Value Measurements: All investment securities are recorded at their estimated fair value. As described in Note 1.c. above, the Funds utilize various methods to determine and measure the fair value of investment securities on a recurring basis. The objective of a fair value measurement is to determine the price that would be received to sell an asset or paid to transfer a liability in an orderly transaction between market participants at the measurement date (an exit price). Accordingly, the fair value hierarchy gives the highest priority to quoted prices (unadjusted) in active markets for identical assets or liabilities (Level 1) and the lowest priority to unobservable inputs (Level 3) that are significant to the fair value instrument. The three levels of the fair value hierarchy are described below: |
| | Level 1 - quoted prices in active markets for identical securities; |
| | Level 2 - other significant observable inputs (including quoted prices for similar securities, interest rates, prepayment speeds, credit risk, etc.); and |
| | Level 3 - significant unobservable inputs (including the Funds' determinations as to the fair value of investments). |
| Meridian Funds | 46 | www.arrowmarkpartners.com/meridian/ |
Meridian Fund, Inc.
Notes to Financial Statements (continued)
June 30, 2024
| | The inputs or methodology used for valuing securities are not necessarily an indication of the risks associated with investing in those securities. The summary of inputs used to value the Funds’ securities as of June 30, 2024 is as follows: |
| | Level 1 | | Level 2 | | Level 3 | | Practical Expedient1 | | Total |
| Growth Fund |
| | | | | | | | | | |
Common Stocks2
| $1,063,221,279 | | $— | | $26,912 | | $— | | $1,063,248,191 |
Preferred Stocks2
| — | | — | | 34,888,683 | | — | | 34,888,683 |
Private Investment Fund
| — | | — | | — | | 3,846,850 | | 3,846,850 |
Convertible Note2
| — | | — | | 1,000,000 | | — | | 1,000,000 |
Short-Term Investments
| 41,378,774 | | 5,122,268 | | — | | — | | 46,501,042 |
Total Investments
| $1,104,600,053 | | $5,122,268 | | $35,915,595 | | $3,846,850 | | $1,149,484,766 |
| Contrarian Fund |
| | | | | | | | | | |
Common Stocks2
| $527,045,117 | | $— | | $— | | $— | | $527,045,117 |
Warrants2
| — | | 450 | | — | | — | | 450 |
Preferred Stocks2
| — | | — | | 2,514,900 | | — | | 2,514,900 |
Rights2
| — | | — | | 343,710 | | — | | 343,710 |
Short-Term Investments
| 38,007,810 | | 18,294,323 | | — | | — | | 56,302,133 |
Total Investments
| $565,052,927 | | $18,294,773 | | $2,858,610 | | $— | | $586,206,310 |
| Hedged Equity Fund |
| Assets: | | | | | | | | | |
Common Stocks2
| $52,195,932 | | $— | | $— | | $— | | $52,195,932 |
Short-Term Investments
| 7,403,581 | | 104,028 | | — | | — | | 7,507,609 |
Total Investments - Assets
| $59,599,513 | | $104,028 | | $— | | $— | | $59,703,541 |
| Liabilities: | | | | | | | | | |
Call Options Written
| $(776,185) | | $(13,586,180) | | $— | | $— | | $(14,362,365) |
Total Investments - Liabilities
| $(776,185) | | $(13,586,180) | | $— | | $— | | $(14,362,365) |
| Meridian Funds | 47 | www.arrowmarkpartners.com/meridian/ |
Meridian Fund, Inc.
Notes to Financial Statements (continued)
June 30, 2024
| | Level 1 | | Level 2 | | Level 3 | | Practical Expedient1 | | Total |
| Small Cap Growth Fund |
| | | | | | | | | | |
Common Stocks2
| $396,529,962 | | $— | | $17,941 | | $— | | $396,547,903 |
Warrants2
| — | | — | | 695,309 | | — | | 695,309 |
Preferred Stocks2
| — | | — | | 32,277,871 | | — | | 32,277,871 |
Rights2
| — | | — | | 61,056 | | — | | 61,056 |
Private Investment Fund
| — | | — | | — | | 2,779,659 | | 2,779,659 |
Short-Term Investments
| 8,818,508 | | 8,551,734 | | — | | — | | 17,370,242 |
Total Investments
| $405,348,470 | | $8,551,734 | | $33,052,177 | | $2,779,659 | | $449,732,040 |
| 1 | Certain investments that are measured at fair value using the NAV Per Share (or its equivalent) practical expedient have not been categorized in the fair value hierarchy. The fair value amounts presented in this table are intended to permit reconciliation of the fair value hierarchy to the amounts presented in the Schedule of Investments. |
| 2 | See above Schedule of Investments for values in each industry. |
The following is the fair value measurement of investments that are measured at NAV per Share (or its equivalent) as a practical expedient:
| Growth Fund |
| Security Description | | Investment
Category | | Value | | Unfunded
Commitments | | Redemption
Frequency | | Redemption
Notice Period |
Quail Investment
Holdings, LLC | | Private Investment Fund1 | | $3,846,850 | | — | | Subject to
advisor
approval | | N/A |
| | | | | | | | | | | |
| Small Cap Growth Fund |
| Security Description | | Investment
Category | | Value | | Unfunded
Commitments | | Redemption
Frequency | | Redemption
Notice Period |
Quail Investment
Holdings, LLC | | Private Investment Fund1 | | $2,779,659 | | — | | Subject to
advisor
approval | | N/A |
| 1 | Private Investment Fund investing generally consists of private partnerships which directly invest in various strategies to generate capital appreciation and/or income yield. These strategies may span across the capital stock and may include Private Equity, Private Credit, Venture Capital, Collateralized Loan Obligations, Asset-Backed Securities, Master Limited Partners and Direct Real Estate. |
| Meridian Funds | 48 | www.arrowmarkpartners.com/meridian/ |
Meridian Fund, Inc.
Notes to Financial Statements (continued)
June 30, 2024
Reconciliations of Level 3 investments are presented when the Funds had significant amounts of Level 3 investments at the beginning and/or end of the period in relation to net assets. The following tables are reconciliations of Level 3 investments for which significant unobservable inputs were used in determining fair value:
| Growth Fund | Common
Stocks | | Preferred
Stocks | | Convertible
Note | | Total Level 3 |
| Investments in Securities | | | | | | | |
Beginning Balance July 1, 2023
| $53,824 | | $37,177,544 | | $— | | $37,231,368 |
Total Purchases
| — | | — | | 1,000,000 | | 1,000,000 |
Total Sales
| — | | — | | — | | — |
Transfers in
| — | | — | | — | | — |
Transfers out
| — | | — | | — | | — |
Change in unrealized Gain (Loss)
| (26,912) | | (2,288,861) | | — | | (2,315,773) |
Ending Balance June 30, 2024
| $26,912 | | $34,888,683 | | $1,000,000 | | $35,915,595 |
Change in unrealized Gain (Loss) on investments still held at June 30, 2024
| $(26,912) | | $(2,288,861) | | $— | | $(2,315,773) |
| Contrarian Fund | Preferred
Stocks | | Rights | | Total Level 3 |
| Investments in Securities | | | | | |
Beginning Balance July 1, 2023
| $3,431,089 | | $328,635 | | $3,759,724 |
Total Purchases
| 2,249,988 | | — | | 2,249,988 |
Total Sales
| — | | — | | — |
Transfers in
| — | | — | | — |
Transfers out
| — | | — | | — |
Change in unrealized Gain (Loss)
| (3,166,177) | | 15,075 | | (3,151,102) |
Ending Balance June 30, 2024
| $2,514,900 | | $343,710 | | $2,858,610 |
Change in unrealized Gain (Loss) on investments still held at June 30, 2024
| $(3,166,177) | | $15,075 | | $(3,151,102) |
| Small Cap Growth Fund | Common
Stocks | | Preferred
Stocks | | Rights | | Warrants | | Total Level 3 |
| Investments in Securities | | | | | | | | | |
Beginning Balance July 1, 2023
| $1,668,194 | | $36,754,738 | | $— | | $129,161 | | $38,552,093 |
Total Purchases
| — | | 706,872 | | — | | 293,124 | | 999,996 |
Total Sales
| — | | — | | — | | — | | — |
Transfers in
| — | | — | | — | | — | | — |
Transfers out1
| — | | (2,999,999) | | — | | — | | (2,999,999) |
Realized Gain (Loss)2
| (208,331) | | — | | — | | — | | (208,331) |
Change in unrealized Gain (Loss)
| (1,441,922) | | (2,183,740) | | 61,056 | | 273,024 | | (3,291,582) |
Ending Balance June 30, 2024
| $17,941 | | $32,277,871 | | $61,056 | | $695,309 | | $33,052,177 |
Change in unrealized Gain (Loss) on investments still held at June 30, 2024
| $(17,941) | | $(2,183,740) | | $61,056 | | $273,024 | | $(1,867,601) |
| 1 | During the year ended June 30, 2024, certain Level 3 investments were transferred out as a result of a corporate action. |
| 2 | During the year ended June 30, 2024, certain investments were sold with a value of $0 as a result of Liquidation. |
| Meridian Funds | 49 | www.arrowmarkpartners.com/meridian/ |
Meridian Fund, Inc.
Notes to Financial Statements (continued)
June 30, 2024
In accordance with GAAP, the following table provides quantitative information about significant unobservable inputs used to determine the fair valuations of the Funds' Level 3 assets, by class of financial instrument; it also indicates the sensitivity of the Level 3 valuations to changes in those significant unobservable inputs. Because the Valuation Designee considers a wide variety of factors and inputs, both observable and unobservable, in determining fair values, the unobservable inputs presented do not reflect all inputs significant to the fair value determination.
| Growth Fund |
| Asset Class | Market Value | Valuation Technique | Unobservable Input | Value/Range
(Weighted Average)1,2 |
| Common Stock | $26,912 | Option Pricing Method | Industry Volatility,
Time to Exit | 60%, 36 months |
| | | Market Approach | Revenue Multiple | 0.45x to 0.55x |
| Preferred Stock | $7,164,999 | Recent Transaction | Convertible Price | $24.68 |
| Preferred Stock | $1,171,800 | Option Pricing Method | Industry Volatility,
Time to Exit | 70%, 24 months |
| | | Fully Diluted Method | Enterprise Value Adjustment | 0.0% |
| Preferred Stocks | $26,551,884 | Market Approach | Revenue Multiple | 4.0x - 7.3x (5.77x) |
| | | Liquidation Preference | Price Per Share | $3.17 - $36.36 ($17.62) |
| Convertible Note | $1,000,000 | Cost | N/A | N/A |
| Contrarian Fund |
| Asset Class | Market Value | Valuation Technique | Unobservable Input | Value/Range
(Weighted Average)1,2 |
| Preferred Stocks | $514,913 | Option Pricing
Method | Industry Volatility,
Time to Exit | 90%, 36 months |
| | | Market Approach | Revenue Multiple | 0.20x to 0.30x (0.25x) |
| Preferred Stocks | $1,999,987 | Cost | N/A | N/A |
| Rights | $343,710 | Market Approach | Probability Weighting of Expected Future Outcome | 26.0% |
| Meridian Funds | 50 | www.arrowmarkpartners.com/meridian/ |
Meridian Fund, Inc.
Notes to Financial Statements (continued)
June 30, 2024
| Small Cap Growth Fund | | | | |
| Asset Class | Market Value | Valuation Technique | Unobservable Input | Value/Range
(Weighted Average)1,2 |
| Common Stock | $17,941 | Option Pricing Method | Industry Volatility,
Time to Exit | 60%, 36 months |
| | | Market Approach | Revenue Multiple | 0.45x to 0.55x |
| Common Stock | — | Option Pricing Method | Industry Volatility,
Time to Exit | 80%, 24 months |
| | | Fully Diluted Method | Enterprise Value Adjustment | -90.0% |
| Preferred Stock | $318,443 | Fully Diluted Method | Discount Rate | 25% |
| Preferred Stock | $4,184,987 | Recent Transaction | Convertible Price | $24.68 |
| Preferred Stock | $1,457,062 | Option Pricing Method | Industry Volatility, Time to Exit | 70%, 48 months |
| Preferred Stocks | $8,753,400 | Option Pricing Method | Industry Volatility,
Time to Exit | 70%-80%, 24-36 months (79.0%, 28.5 months) |
| | | Fully Diluted Method | Enterprise Value Adjustment | -90.0% - 56% (30.97%) |
| Preferred Stocks | $17,563,979 | Market Approach | Revenue Multiple | 4.0x - 7.3x (5.83x) |
| | | Liquidation Preference | Price Per Share | $3.17 - $36.36 ($17.69) |
| Rights | $61,056 | Market Approach | Probability Weighting of Expected Future Outcome | 15.0% |
| Warrants | $695,309 | Option Pricing Method | Industry Volatility,
Time to Exit | 80%, 24 months |
| | | Fully Diluted Method | Enterprise Value Adjustment | 56.0% |
| 1 | A significant change in an unobservable input would have resulted in a correlated significant change to value. |
| 2 | Unobservable inputs were weighted by the fair value of the investments. |
| Unobservable Input | Impact to Value if Input Increases | | Impact to Value if Input Decreases |
| Industry Volatility | Decrease | | Increase |
| Time to Exit | Decrease | | Increase |
| Revenue Multiple | Increase | | Decrease |
| Enterprise Value Adjustment | Increase | | Decrease |
| Probability Weighting of Expected Future Outcome | Increase | | Decrease |
| Price Per Share | Increase | | Decrease |
| Discount Rate | Decrease | | Increase |
| Convertible Price | Increase | | Decrease |
| e. | Investment Transactions and Investment Income: Security transactions are accounted for on the date the securities are purchased or sold (trade date). Realized gains and losses on security transactions are determined on the basis of specific identification for both financial statement and federal income tax purposes. Dividend income is recorded on the ex-dividend date. Non-cash dividends received in the form of stock are recorded as dividend income at market value. Under the applicable foreign tax laws, a withholding tax at various rates may be imposed |
| Meridian Funds | 51 | www.arrowmarkpartners.com/meridian/ |
Meridian Fund, Inc.
Notes to Financial Statements (continued)
June 30, 2024
| | on capital gains, dividends and interest. Interest income, including amortization and accretion of premiums and discounts on debt securities, is accrued daily. Discounts and premiums on securities purchased are accreted and amortized over the lives of the respective securities using the effective interest method. Upon notification from issuers, a portion of the dividend income received from a real estate investment trust may be redesignated as a reduction of cost of the related investment and/or realized gain. Distributions from Private Investment Funds that represent returns of capital in excess of cumulative profits and losses are credited to investment cost rather than income. |
| f. | Option writing: When a Fund writes an option, an amount equal to the premium received by the Fund is recorded as a liability and subsequently adjusted to the current fair value of the option written. Premiums received from writing options that expire unexercised are treated by a Fund on the expiration date as realized gains from investments. The difference between the premium and amount paid on effecting a closing purchase transaction, including brokerage commissions, is also treated as a realized gain or, if the premium is less than the amount paid for the closing purchase transaction, as a realized loss. If a call option is exercised, the premium is added to the proceeds from the sale of the underlying security or currency in determining whether a Fund has realized a gain or loss. If a put option is exercised, the premium reduces the cost basis of the securities purchased by the Fund. A Fund as writer of an option bears the market risk of an unfavorable change in the price of the security underlying the written option. |
| g. | Allocation of Income, Expenses, Gains and Losses: Income, gains and losses are allocated on a daily basis to each share class based on the relative proportion of the net assets of the class to each Fund’s total net assets. Expenses are allocated on the basis of relative net assets of the class to the Fund, or if an expense is specific to a share class, to that specific share class. |
| h. | Use of Estimates: The preparation of financial statements in accordance with U.S. GAAP requires management to make estimates and assumptions that affect the reported amount of assets and liabilities and disclosure of contingent assets and liabilities at the date of the financial statements and the reported amounts of increases and decreases in net assets from operations during the reporting period. Actual amounts could differ from those estimates, and such differences could be significant. |
| i. | Distributions to Shareholders: The Funds record distributions to shareholders on the ex-dividend date. The amount of distributions from net investment income and net realized capital gains are determined in accordance with federal income tax regulations which may differ from U.S. GAAP. These “book/tax” differences are either considered temporary or permanent in nature. To the extent these differences are permanent in nature, such amounts are reclassified within the capital accounts based on their federal tax-basis treatment; temporary differences do not require reclassification. |
| | Distributions which exceed net investment income and net realized capital gains are reported as distributions in excess of net investment income or distributions in excess of net realized capital gains for financial reporting purposes but not for tax purposes. To the extent they exceed net investment income and net realized capital gains for tax purposes, they are reported as distributions of paid-in capital. |
| j. | Guarantees and Indemnification: Under the Funds’ organizational documents, its Officers and Directors are indemnified against certain liability arising out of the performance of their duties to the Funds. Additionally, in the normal course of business, the Funds enter into contracts with service providers that contain general indemnification clauses, subject to applicable law. The Funds’ maximum exposure under these arrangements is unknown, as this would involve future claims that may be made against the Funds that have not yet occurred. |
| Meridian Funds | 52 | www.arrowmarkpartners.com/meridian/ |
Meridian Fund, Inc.
Notes to Financial Statements (continued)
June 30, 2024
| 2. | Capital Shares Transactions: Transactions in capital shares were as follows: |
| | Year Ended
June 30, 2024 | | Year Ended
June 30, 2023 |
| | | Shares | Amount | | | Shares | Amount |
| Growth Fund: |
| Legacy Class |
Shares sold
| | 202,918 | $6,574,342 | | | 948,579 | $31,010,792 |
Shares issued from reinvestment of distributions
| | — | — | | | 3,511,434 | 104,078,921 |
Redemption fees
| | — | 8,552 | | | — | 7,170 |
Shares redeemed
| | (5,939,587) | (197,104,486) | | | (5,600,740) | (184,803,944) |
Net decrease
| | (5,736,669) | $(190,521,592) | | | (1,140,727) | $(49,707,061) |
| Institutional Class |
Shares sold
| | 1,200,081 | $39,783,781 | | | 2,682,334 | $88,569,479 |
Shares issued from reinvestment of distributions
| | — | — | | | 1,639,791 | 48,619,780 |
Redemption fees
| | — | 10,953 | | | — | 5,848 |
Shares redeemed
| | (4,227,501) | (141,899,424) | | | (2,497,122) | (83,129,297) |
Net increase/(decrease)
| | (3,027,420) | $(102,104,690) | | | 1,825,003 | $54,065,810 |
| Class A |
Shares sold
| | 3,560 | $113,854 | | | 14,529 | $452,904 |
Shares issued from reinvestment of distributions
| | — | — | | | 13,302 | 370,056 |
Shares redeemed
| | (25,450) | (807,707) | | | (50,864) | (1,680,513) |
Net decrease
| | (21,890) | $(693,853) | | | (23,033) | $(857,553) |
| Class C |
Shares sold
| | 418 | $12,350 | | | 689 | $19,900 |
Shares issued from reinvestment of distributions
| | — | — | | | 6,609 | 173,743 |
Shares redeemed
| | (9,739) | (287,487) | | | (22,941) | (666,700) |
Net decrease
| | (9,321) | $(275,137) | | | (15,643) | $(473,057) |
| Investor Class |
Shares sold
| | 38,587 | $1,224,864 | | | 121,700 | $4,083,477 |
Shares issued from reinvestment of distributions
| | — | — | | | 129,741 | 3,780,669 |
Redemption fees
| | — | 2,058 | | | — | 14 |
Shares redeemed
| | (439,268) | (14,342,763) | | | (476,446) | (15,943,909) |
Net decrease
| | (400,681) | $(13,115,841) | | | (225,005) | $(8,079,749) |
| Meridian Funds | 53 | www.arrowmarkpartners.com/meridian/ |
Meridian Fund, Inc.
Notes to Financial Statements (continued)
June 30, 2024
| | Year Ended
June 30, 2024 | | Year Ended
June 30, 2023 |
| | | Shares | Amount | | | Shares | Amount |
| Contrarian Fund: |
| Legacy Class |
Shares sold
| | 55,039 | $1,980,501 | | | 56,778 | $2,094,519 |
Shares issued from reinvestment of distributions
| | 809,671 | 29,188,628 | | | 1,646,536 | 56,723,162 |
Redemption fees
| | — | 381 | | | — | 326 |
Shares redeemed
| | (1,876,624) | (68,330,533) | | | (1,313,689) | (48,157,781) |
Net increase/(decrease)
| | (1,011,914) | $(37,161,023) | | | 389,625 | $10,660,226 |
| Class A |
Shares sold
| | 1,530 | $49,277 | | | 15,550 | $560,441 |
Shares issued from reinvestment of distributions
| | 2,230 | 77,166 | | | 5,074 | 167,898 |
Shares redeemed
| | (31,232) | (1,066,771) | | | (11,483) | (403,381) |
Net increase/(decrease)
| | (27,472) | $(940,328) | | | 9,141 | $324,958 |
| Class C |
Shares sold
| | 4,026 | $134,716 | | | 4,621 | $152,191 |
Shares issued from reinvestment of distributions
| | 1,161 | 37,712 | | | 1,528 | 47,999 |
Redemption fees
| | — | — | | | — | 32 |
Shares redeemed
| | (4,962) | (162,827) | | | (1,089) | (35,854) |
Net increase
| | 225 | $9,601 | | | 5,060 | $164,368 |
| Investor Class |
Shares sold
| | 112,751 | $4,031,967 | | | 184,511 | $6,938,079 |
Shares issued from reinvestment of distributions
| | 25,993 | 925,359 | | | 42,448 | 1,444,928 |
Redemption fees
| | — | 1,953 | | | — | — |
Shares redeemed
| | (109,702) | (3,939,061) | | | (92,897) | (3,378,849) |
Net increase
| | 29,042 | $1,020,218 | | | 134,062 | $5,004,158 |
| Meridian Funds | 54 | www.arrowmarkpartners.com/meridian/ |
Meridian Fund, Inc.
Notes to Financial Statements (continued)
June 30, 2024
| | Year Ended
June 30, 2024 | | Year Ended
June 30, 2023 |
| | | Shares | Amount | | | Shares | Amount |
| Hedged Equity Fund: |
| Legacy Class |
Shares sold
| | 19,383 | $253,345 | | | 19,970 | $242,436 |
Shares issued from reinvestment of distributions
| | 19,886 | 264,685 | | | 323,009 | 3,646,775 |
Redemption fees
| | — | 199 | | | — | — |
Shares redeemed
| | (670,264) | (8,876,875) | | | (628,271) | (7,615,055) |
Net decrease
| | (630,995) | $(8,358,646) | | | (285,292) | $(3,725,844) |
| Class A |
Shares sold
| | 17,108 | $228,160 | | | 4,084 | $51,145 |
Shares issued from reinvestment of distributions
| | 525 | 6,765 | | | 10,331 | 113,129 |
Redemption fees
| | — | — | | | — | 9 |
Shares redeemed
| | (13,466) | (172,282) | | | (52,019) | (625,111) |
Net increase/(decrease)
| | 4,167 | $62,643 | | | (37,604) | $(460,828) |
| Class C |
Shares issued from reinvestment of distributions
| | 2 | $27 | | | 435 | $4,589 |
Shares redeemed
| | (1,608) | (18,818) | | | (3,397) | (38,617) |
Net decrease
| | (1,606) | $(18,791) | | | (2,962) | $(34,028) |
| Investor Class |
Shares sold
| | 24,726 | $321,561 | | | 15,729 | $192,561 |
Shares issued from reinvestment of distributions
| | 972 | 12,887 | | | 15,271 | 171,793 |
Shares redeemed
| | (18,502) | (250,068) | | | (23,078) | (275,499) |
Net increase
| | 7,196 | $84,380 | | | 7,922 | $88,855 |
| Meridian Funds | 55 | www.arrowmarkpartners.com/meridian/ |
Meridian Fund, Inc.
Notes to Financial Statements (continued)
June 30, 2024
| | Year Ended
June 30, 2024 | | Year Ended
June 30, 2023 |
| | | Shares | Amount | | | Shares | Amount |
| Small Cap Growth Fund: |
| Legacy Class |
Shares sold
| | 336,599 | $3,597,870 | | | 821,915 | $9,691,077 |
Shares issued from reinvestment of distributions
| | — | — | | | 269,478 | 2,859,160 |
Redemption fees
| | — | — | | | — | 2,115 |
Shares redeemed
| | (1,522,805) | (18,540,445) | | | (1,137,744) | (13,701,128) |
Net decrease
| | (1,186,206) | $(14,942,575) | | | (46,351) | $(1,148,776) |
| Institutional Class |
Shares sold
| | 6,730,304 | $83,999,638 | | | 4,633,609 | $55,149,174 |
Shares issued from reinvestment of distributions
| | — | — | | | 2,864,006 | 30,702,146 |
Redemption fees
| | — | 4,198 | | | — | 7,221 |
Shares redeemed
| | (8,129,339) | (97,398,015) | | | (9,254,065) | (112,331,265) |
Net decrease
| | (1,399,035) | $(13,394,179) | | | (1,756,450) | $(26,472,724) |
| Class A |
Shares sold
| | 85,805 | $952,564 | | | 193,112 | $2,260,415 |
Shares issued from reinvestment of distributions
| | — | — | | | 222,757 | 2,243,163 |
Redemption fees
| | — | — | | | — | 62 |
Shares redeemed
| | (538,639) | (6,085,838) | | | (979,027) | (11,252,049) |
Net decrease
| | (452,834) | $(5,133,274) | | | (563,158) | $(6,748,409) |
| Class C |
Shares sold
| | 286 | $3,000 | | | 4,011 | $44,359 |
Shares issued from reinvestment of distributions
| | — | — | | | 53,788 | 499,685 |
Redemption fees
| | — | — | | | — | 3 |
Shares redeemed
| | (136,876) | (1,396,043) | | | (135,657) | (1,419,305) |
Net decrease
| | (136,590) | $(1,393,043) | | | (77,858) | $(875,258) |
| Investor Class |
Shares sold
| | 2,760,630 | $31,256,186 | | | 7,936,909 | $92,619,119 |
Shares issued from reinvestment of distributions
| | — | — | | | 3,868,445 | 40,657,361 |
Redemption fees
| | — | 2,501 | | | — | 2,566 |
Shares redeemed
| | (30,237,765) | (368,045,018) | | | (12,709,178) | (150,281,066) |
Net decrease
| | (27,477,135) | $(336,786,331) | | | (903,824) | $(17,002,020) |
| Meridian Funds | 56 | www.arrowmarkpartners.com/meridian/ |
Meridian Fund, Inc.
Notes to Financial Statements (continued)
June 30, 2024
| 3. | Investment Transactions: The cost of investments purchased and the proceeds from sales of investments, excluding short-term securities and U.S. government obligations, for the year ended June 30, 2024, were as follows: |
| | Purchases | | Proceeds from Sales |
Growth Fund
| $398,619,346 | | $603,257,885 |
Contrarian Fund
| $315,058,062 | | $365,418,861 |
Hedged Equity Fund
| $24,095,866 | | $42,024,428 |
Small Cap Growth Fund
| $228,340,750 | | $550,383,264 |
| | | | |
| | | | |
| 4. | Other Investment Transactions |
| a. | Restricted Securities: Restricted securities for which quotations are not readily available are valued at fair value, as determined by the Valuation Designee. Restricted securities issued by publicly traded companies are generally valued at a discount to similar publicly traded securities. Restricted securities issued by nonpublic entities may be valued by reference to comparable public entities or fundamental data relating to the issuer, or both. Depending on the relative significance of valuation inputs, these instruments may be classified in either level 2 or level 3 of the fair value hierarchy. Refer to the Schedules of Investments for information about restricted securities held as of June 30, 2024 for Growth, Contrarian and Small Cap Growth Funds. |
| b. | Private Placement Securities: Privately issued securities are restricted securities that are offered in a private placement and are generally not registered with the SEC or any federal or state regulatory authority. Securities issued in a private placement are generally "restricted securities" as that term is defined under Rule 144 promulgated under the Securities Act of 1933, and may not be resold without registration with the Securities and Exchange Commission or the availability of an exemption therefrom. There is generally no public trading market for privately offered securities and it is generally not anticipated that a public trading market will develop. There are substantial restrictions on the transfer of privately offered securities. Such securities have limited liquidity that makes it difficult or impossible to sell. An investment in privately issued securities often requires a long-term investment horizon and it may be many years before an investor receives significant distributions from such investment. Due to the lack of public market for privately offered securities, it may be difficult to value the investment. |
| c. | Securities Lending: The Funds have entered into an agreement with The Bank of New York Mellon (the “Lending Agent”), dated September 23, 2015 (“Securities Lending Agreement”), to provide securities lending services to the Funds. Under this program, the proceeds (cash collateral) received from borrowers are used to invest in money market funds or joint repurchase agreements. Under the Securities Lending Agreement, the borrowers may pay the Funds negotiated lender fees and the Funds receive cash and/or securities as collateral in an amount equal to not less than 102% of the market value of loaned securities. The market value of the loaned securities is determined at the close of each business day of the Fund and any additional required collateral is delivered to the Fund, or excess collateral is returned by the Fund, on the next business day. The borrower pays fees at the Funds’ direction to the Lending Agent. Although the risk of lending is generally mitigated by the collateral, the Funds could experience a delay in recovering securities and a possible loss of income or value if the borrower fails to return them. Loans of securities are terminable at any time and the borrower, after notice, is required to return borrowed securities within the standard time period for settlement of securities transactions. |
| | The following table summarizes the securities received as collateral for securities lending: |
| | Collateral Type | | Coupon Range | | Maturity Date Range | | Market Value |
Growth Fund
| U.S. Government Obligations | | 0.00% - 5.30% | | 7/30/24 - 11/15/53 | | $32,658,608 |
Contrarian Fund
| U.S. Government Obligations | | 0.00% - 5.30% | | 7/30/24 - 11/15/53 | | 9,861,480 |
Hedged Equity Fund
| U.S. Government Obligations | | 0.00% - 5.30% | | 7/31/24 - 11/15/53 | | 182,639 |
Small Cap Growth Fund
| U.S. Government Obligations | | 0.00% - 5.30% | | 7/31/24 - 11/15/53 | | 16,711,795 |
| Meridian Funds | 57 | www.arrowmarkpartners.com/meridian/ |
Meridian Fund, Inc.
Notes to Financial Statements (continued)
June 30, 2024
Income generated from securities lending is presented in the Statements of Operations. As of June 30, 2024, the total value of securities on loan for the Growth Fund, Contrarian Fund, Hedged Equity Fund, and the Small Cap Growth Fund were $36,840,912, $27,120,679, $275,809 and $25,278,877, respectively. Securities on loan are footnoted in the Schedules of Investments. As of June 30, 2024, the total collateral value for the Growth Fund, Contrarian Fund, Hedged Equity Fund, and the Small Cap Growth Fund were $37,780,876, $28,155,803, $286,667 and $25,263,529, respectively.
| d. | Repurchase Agreements and Joint Repurchase Agreements: The Funds may enter into repurchase agreements for temporary cash management purposes provided that the value of the underlying collateral, including accrued interest, will equal or exceed the value of the repurchase agreement during the term of the agreement. The underlying collateral for all repurchase agreements is held in safekeeping by the Funds' custodian or at the Federal Reserve Bank. If the seller defaults and the value of the collateral declines, or if bankruptcy proceedings commence with respect to the seller of the security, realization of the collateral by the Funds may be delayed or limited. |
| | Additionally, the Funds may enter into joint repurchase agreements for reinvestment of cash collateral on securities lending transactions under the securities lending program offered by the Lending Agent (the “Program”), provided that the value of the underlying collateral, including accrued interest will equal or exceed the value of the joint repurchase agreement during the term of the agreement. The Funds participate on a pro rata basis with other clients of the Lending Agent in its share of the underlying collateral under such joint repurchase agreements and in its share of proceeds from any repurchase or other disposition of the underlying collateral. The underlying collateral for joint repurchase agreements is held in safekeeping by the Funds’ custodian or at the Federal Reserve Bank. If the seller defaults and the value of the collateral declines, or if bankruptcy proceedings commence with respect to the seller of the security, realization of the collateral by the Funds may be delayed or limited. Pursuant to the Program, the Funds are indemnified for such losses by the Lending Agent. |
| | At June 30, 2024, the market value of repurchase agreements or joint repurchase agreements outstanding for the Growth Fund, Contrarian Fund, Hedged Equity Fund, and the Small Cap Growth Fund were $5,122,268, $18,294,323, $104,028 and $8,551,734, respectively. |
| e. | Master Netting Arrangements: The Funds may enter into master netting agreements with their counterparties for the repurchase agreements, which provide the right, in the event of default (including bankruptcy or insolvency) for the non-defaulting party to liquidate the collateral and calculate net exposure to the defaulting party or request additional collateral. For financial reporting purposes, the Funds do not offset financial assets and financial liabilities that are subject to master netting agreements in the Statements of Assets and Liabilities. |
| | The following table is a summary of the Funds’ open repurchase agreements that are subject to a master netting arrangement as of June 30, 2024: |
| | |
| | Gross Amounts
Presented in
Statements of
Assets and
Liabilities
(Value of
Securities on Loan) | | Collateral
Received | | Net
Amount |
Growth Fund
| | | | | |
Repurchase agreement
| $5,122,268 | | $(5,122,268)1 | | $— |
Contrarian Fund
| | | | | |
Repurchase agreement
| $18,294,323 | | $(18,294,323)1 | | $— |
Hedged Equity Fund
| | | | | |
Repurchase agreement
| $104,028 | | $(104,028)1 | | $— |
Small Cap Growth Fund
| | | | | |
Repurchase agreement
| $8,551,734 | | $(8,551,734)1 | | $— |
| Meridian Funds | 58 | www.arrowmarkpartners.com/meridian/ |
Meridian Fund, Inc.
Notes to Financial Statements (continued)
June 30, 2024
| 1 | The amount of collateral presented is limited such that the net amount cannot be less than zero. Collateral received in excess of the market value of repurchase agreements is not presented in this table. |
| f. | Options: Certain Funds purchase and write call and put options to increase or decrease their exposure to underlying instruments (including equity risk, interest rate risk and/or commodity price risk) and/or, in the case of options written, to generate gains from options premiums. A call option gives the purchaser (holder) of the option the right (but not the obligation) to buy, and obligates the seller (writer) to sell (when the option is exercised) the underlying instrument at the exercise or strike price at any time or at a specified time during the option period. A put option gives the holder the right to sell and obligates the writer to buy the underlying instrument at the exercise or strike price at any time or at a specified time during the option period. When the Funds purchase (write) an option, an amount equal to the premium paid (received) by the Funds is reflected as an asset (liability). The amount of the asset (liability) is subsequently marked-to-market to reflect the current market value of the option purchased (written). When an instrument is purchased or sold through an exercise of an option, the related premium paid (or received) is added to (or deducted from) the basis of the instrument acquired or deducted from (or added to) the proceeds of the instrument sold. When an option expires (or the Funds enter into a closing transaction), the Funds realize a gain or loss on the option to the extent of the premiums received or paid (or gain or loss to the extent the cost of the closing transaction exceeds the premiums received or paid). When the Funds write a call option, such option is “covered,” meaning that the Funds hold the underlying instrument subject to being called by the option counterparty. When the Funds write a put option, such option is covered by cash in an amount sufficient to cover the obligation. |
| | In purchasing and writing options, the Funds bear the risk of an unfavorable change in the value of the underlying instrument or the risk that the Funds may not be able to enter into a closing transaction due to an illiquid market. Exercise of a written option could result in the Funds purchasing or selling a security when it otherwise would not, or at a price different from the current market value. |
| | Average quarterly balances of outstanding derivative financial instruments were as follows. |
| Hedged Equity Fund | |
| Options: | |
Average value of option contracts written
| $18,914,571 |
For the year ended June 30, 2024, the effect of equity option positions written can be found in the Statements of Operations under Realized and Unrealized Gain (Loss), Net realized gain on written options and Net change in unrealized depreciation on written options, and are included in Options written at value in the Statements of Assets and Liabilities. Equity options purchased are included in Investments, at value in the Statements of Assets and Liabilities. Realized and unrealized gain/loss of equity options purchased are included in Net realized gain/(loss) on investments and foreign currency transactions and Net change in unrealized appreciation on investments and foreign currency translations in the Statements of Operations.
| g. | Warrants: The Funds can invest in warrants and stock purchase rights of companies of any market capitalization. A warrant gives the Funds the right to buy stock, typically from the issuer. The warrant specifies the amount of underlying stock, the purchase (or "exercise") price, and the date the warrant expires. Certain warrants may permit, without legal obligation, net settlement for stock or cash. The Funds have no obligation to exercise the warrant and buy the stock. |
| h. | Short Sales: The Funds may enter into short sales. A short sale occurs when a fund sells a security it generally does not own (the security is borrowed), in anticipation of a decline in the security’s price. The initial amount of a short sale is recorded as a liability which is marked-to-market daily. Fluctuations in the value of the short liability are recorded as unrealized gains or losses. If a Fund shorts a security when also holding a long position in the security (a “short against the box”), as the security’s price declines, the short position increases in value, offsetting the long position’s decrease in value. The opposite effect occurs if the security’s price rises. A Fund realizes a gain or loss upon closing of the short sale (returning the security to the counterparty by way of purchase or delivery of a long position owned). Possible losses from short sales may be unlimited, whereas losses from security purchases |
| Meridian Funds | 59 | www.arrowmarkpartners.com/meridian/ |
Meridian Fund, Inc.
Notes to Financial Statements (continued)
June 30, 2024
| | cannot exceed the total amount invested. The Funds are liable to the buyer for any dividends payable on securities while those securities are in a short position. These dividends are an expense of the Funds. The Funds designate collateral consisting of cash, U.S. government securities or other liquid assets sufficient to collateralize the market value of short positions. |
| i. | Private Investment Funds: The Funds value private investment companies using the NAVs provided by the underlying private investment companies as a practical expedient. The Funds apply the practical expedient to private investment companies on an investment-by-investment basis, and consistently with each Fund’s entire position in a particular investment, unless it is probable that the Funds will sell a portion of an investment at an amount different from the NAV of the investment. Each of these investments has certain restrictions with respect to rights of withdrawal by the Funds as specified in the respective agreements. Generally, the Funds are required to provide notice of its intent to withdraw after the investment has been maintained for a certain period of time. |
| 5. | Selected Risks |
| | In the normal course of business, each Fund's investment activities expose it to various types of risk associated with the financial instruments and markets in which it invests. Some significant types of financial risks each Fund is exposed to include market risk, debt securities risk, options risk and private investment funds risk. Each Fund’s prospectus and statement of additional information provide details of these and other types of risk. |
| | Market Risk: Market risk refers to the possibility that the market values of securities or other investments that a Fund holds will fall, sometimes rapidly or unpredictably, or fail to rise. Security values may fall or fail to rise because of a variety of factors affecting (or the market’s perception of) individual companies or other issuers (e.g., an unfavorable earnings report), industries or sectors, or the market as a whole, reducing the value of an investment in a Fund. Accordingly, an investment in the Fund could lose money over short or even long periods. The market values of the securities the Fund holds also can be affected by changes (or perceived changes) in U.S. or foreign economies and financial markets, and the liquidity of these securities, among other factors. In general, equity securities tend to have greater price volatility than debt securities. In addition, stock prices may be sensitive to rising interest rates, as the cost of capital rises and borrowing costs increase. As a result, the value of your investments in a Fund may be more or less than the value of your purchase price. |
| | Debt Securities Risk: Each Fund may invest in debt securities of both government and corporate issuers. A decline in prevailing levels of interest rates generally increases the value of debt securities in a Fund’s portfolio, while an increase in rates usually reduces the value of those securities. The value of a Fund’s debt securities, including bonds and convertible securities, are affected by movements in interest rates; if interest rates rise, the value of these securities may fall. Generally, the longer the average maturity of a debt security, the greater the change in its value. As a result, to the extent that a Fund invests in debt securities, interest rate fluctuations will affect the Fund’s net asset value, but not the income it receives from debt securities it owns. Debt securities are also subject to credit, liquidity risk and prepayment and extension risk. Credit risk is the risk that the entity that issued a debt security may become unable to make payments of principal and interest, and includes the risk of default. Liquidity risk is the risk that a Fund may not be able to sell portfolio securities because there are too few buyers for them. Prepayment and extension risk is the risk that a loan, bond or other security might be called or otherwise converted, prepaid or redeemed before maturity. If a loan or security is converted, prepaid or redeemed before maturity, particularly during a time of declining interest rates or spreads, the portfolio managers may not be able to invest the proceeds in securities or loans providing as high a level of income, resulting in a reduced yield to a Fund. Conversely, as interest rates rise or spreads widen, the likelihood of prepayment decreases. The portfolio managers may be unable to capitalize on securities with higher interest rates or wider spreads because a Fund’s investments are locked in at a lower rate for a longer period of time. |
| | Options Risk: Investments in options involve risks different from, and possibly greater than, investing directly in the underlying security, asset or other reference, including, among others, the risk that the counterparty to an option may not perform or may be unable to perform in accordance with the terms of the instrument, the potential that, at times, there may not be a liquid secondary market for the options (as described above), and the risk of imperfect correlation between any movement in the price or value of options and their underlying security, asset or other reference. Such events, as well as circumstances under which a Fund is required to purchase the underlying asset at a disadvantageous price, may result in losses to the Fund. In addition, options also may involve a small initial investment relative to the risk |
| Meridian Funds | 60 | www.arrowmarkpartners.com/meridian/ |
Meridian Fund, Inc.
Notes to Financial Statements (continued)
June 30, 2024
| | assumed, which could result in losses that are greater than the amount originally invested. Special risks are presented by internationally traded options. Because of time differences between the United States and various foreign countries, and because different holidays are observed in different countries, foreign options markets may be open for trading during hours or on days when U.S. markets are closed. As a result, option premiums may not reflect the current prices of the underlying interest in the United States. |
| | Private Investment Funds (PIF) Risk: PIFs are subject to management and other expenses, which will be directly or indirectly paid by the Funds. As a result, the cost of investing in the Fund will be higher than the cost of investing directly in PIFs and also may be higher than other funds that invest directly in stocks and bonds. Each PIF is subject to specific risks, depending on the nature of its investment strategy. The Funds may invest in private investment funds and/or hedge funds, which may pursue alternative investment strategies. Hedge funds often engage in speculative investment practices such as leverage, short-selling, arbitrage, hedging, derivatives, and other strategies that may increase investment loss. |
| 6. | Affiliate Transactions and Fees |
| | Investment Management Fees: Under the Investment Management Agreement, the Adviser receives the following fees for providing certain investment management and other services necessary for managing each Fund. The fee is paid monthly in arrears and calculated based on that month’s daily average net assets. |
| Growth Fund: | | Contrarian Fund: |
| Average Daily Net Assets | | Investment
Management Fee | | Average Daily Net Assets | | Investment
Management Fee |
Up to $50,000,000
| | 1.00% | | Up to $750,000,000
| | 1.00% |
Greater than $50,000,000
| | 0.75% | | $750,000,000 to $800,000,000
| | 0.75% |
| | | | | $800,000,000 to $850,000,000
| | 0.70% |
| | | | | $850,000,000 to $900,000,000
| | 0.65% |
| | | | | $900,000,000 to $950,000,000
| | 0.60% |
| | | | | $950,000,000 to $1,000,000,000
| | 0.55% |
| | | | | Greater than $1,000,000,000
| | 0.50% |
| Hedged Equity Fund: | | Small Cap Growth Fund: |
| Average Daily Net Assets | | Investment
Management Fee | | Average Daily Net Assets | | Investment
Management Fee |
Up to $10,000,000
| | 1.00% | | Greater than $0
| | 1.00% |
$10,000,001 to $30,000,000
| | 0.90% | | | | |
$30,000,001 to $50,000,000
| | 0.80% | | | | |
Greater than $50,000,000
| | 0.70% | | | | |
Distribution Plan for Class A and Class C shares: Each Fund has entered into and adopted a Distribution Plan for Class A and Class C shares. Under the Distribution Plan, the Funds may pay ALPS Distributors, Inc. (the “Distributor”), and/or eligible financial intermediaries a fee for services and expenses related to the sale and distribution of the Funds’ Class A and Class C at an annual rate of up to 0.25% and 1.00% of average daily net assets for Class A and Class C shares, respectively.
For the year ended June 30, 2024, the Distributor received commissions in the amounts of $34, $152, $57 and $105 for Class A of Growth Fund, Contrarian Fund, Hedged Equity Fund and Small Cap Growth Fund, respectively. The Growth Fund and Small Cap Growth Fund also paid CDSC fees in the amount of $61 and $7 to distributors for Class C.
Waivers and Reimbursements of Expenses: Until October 31, 2023 the Adviser contractually agreed to waive its investment advisory fees and reimburse operating expenses, to the extent that total annual operating expenses for the Funds exceed the expense limitations listed below, excluding acquired fund fees and expenses, dividend expenses on securities sold short, and interest expenses on short sales. Effective November 1, 2023, the Adviser contractually agreed to waive its investment advisory fees and reimburse operating expenses, to the extent that total annual operating expenses for the Funds exceed the expense limitations listed below, excluding acquired fund fees and expenses,
| Meridian Funds | 61 | www.arrowmarkpartners.com/meridian/ |
Meridian Fund, Inc.
Notes to Financial Statements (continued)
June 30, 2024
brokerage expenses, dividend expenses on securities sold short and interest expense on short sales, taxes, and extraordinary expenses. With respect to these limits, the Adviser waived the fees listed below during the year ended June 30, 2024.
| | Expense Limitations
effective November 1, 2023 | | Expense Limitations
prior to November 1, 2023 | | Total Waivers and
Reimbursements for
the year ended
June 30, 2024 |
| Growth Fund | | | | | |
Legacy Class
| 1.05% | | — | | $— |
Institutional Class
| 0.90% | | 0.90% | | $— |
Class A
| 1.30% | | 1.55% | | $— |
Class C
| 2.05% | | 2.25% | | $— |
Investor Class
| 1.05% | | 1.30% | | $— |
| Contrarian Fund | | | | | |
Legacy Class
| 1.25% | | — | | $— |
Class A
| 1.50% | | 1.60% | | $— |
Class C
| 2.25% | | 2.20% | | $56 |
Investor Class
| 1.25% | | 1.35% | | $— |
| Hedged Equity Fund | | | | | |
Legacy Class
| 1.25% | | 1.25% | | $79,218 |
Class A
| 1.50% | | 1.60% | | $2,124 |
Class C
| 2.25% | | 2.00% | | $14 |
Investor Class
| 1.25% | | 1.35% | | $3,575 |
| Small Cap Growth Fund | | | | | |
Legacy Class
| 1.25% | | 1.20% | | $4,388 |
Institutional Class
| 1.10% | | 1.10% | | $220,939 |
Class A
| 1.50% | | 1.60% | | $6,560 |
Class C
| 2.25% | | 2.25% | | $808 |
Investor Class
| 1.25% | | 1.35% | | $869 |
| | | | | | |
| | | | | | |
Subject to the approval of the Board, the Funds may repay the Advisor the amounts of its reimbursement for the Funds by each share class for up to three years following the reimbursement up to the lesser of an amount not to exceed the current expense limitation of that share class or the expense limitation of that share class in effect at the time that the share class received the applicable reimbursement. This agreement will continue until October 31, 2024, and may be renewed or modified with approval of the Funds' Board. For the year ended June 30, 2024, the Adviser did not recoup any of the Funds' expenses.
At June 30, 2024, the balance of carried forward recoupable expenses along with the year of expiration for each Fund were as follows:
| | Expiration June 30, |
| | 2024 | | 2025 | | 2026 | | 2027 |
Growth Fund
| $— | | $— | | $— | | $— |
Contrarian Fund
| — | | — | | 135 | | 56 |
Hedged Equity Fund
| 48 | | 75 | | 35,268 | | 84,931 |
Small Cap Growth Fund
| — | | — | | 153,039 | | 233,564 |
| | | | | | | | |
| | | | | | | | |
| 7. | Directors and Officers: Certain Officers of the Funds are also Officers of the Adviser. Officers of the Funds who are |
| Meridian Funds | 62 | www.arrowmarkpartners.com/meridian/ |
Meridian Fund, Inc.
Notes to Financial Statements (continued)
June 30, 2024
| | Officers of the Adviser receive no compensation from the Funds. Each Non-Interested Director is paid an annual fee set at $40,000. An additional $5,000 is paid to each Non-Interested Director for attendance at each in-person meeting of the Board and an additional $1,000 is paid to each Non-Interested Director for participating in a telephonic meeting of the Board. An additional $3,000 is paid to each member of the Audit or Governance Committee of the Board for attendance at an in-person Audit or Governance Committee meeting and an additional $1,000 is paid to each member of the Audit or Governance Committee of the Board for participating in a telephonic Audit or Governance Committee meeting. |
| | An additional $10,000 is paid to the Chairman of the Board and the Chairman of a Committee of the Board. The Chairman of the Board also receives an additional $2,500 for attending each in-person meeting of the Board. The Chairman of a Committee receives an additional $2,000 for attending each in-person Committee meeting. |
| 8. | Distribution Information: Income and long-term capital gains distributions are determined in accordance with federal income tax regulations, which may differ from U.S. GAAP. The tax character of distributions made during the fiscal year ended June 30, 2024, is as follows: |
| | 2024 Taxable Distributions |
| | Ordinary Income | | Net Long-Term
Capital Gain | | Total
Distributions |
Growth Fund
| $— | | $— | | $— |
Contrarian Fund
| 2,596,858 | | 28,637,139 | | 31,233,997 |
Hedged Equity Fund
| 73,345 | | 214,829 | | 288,174 |
Small Cap Growth Fund
| — | | — | | — |
The tax character of distributions made during the fiscal year ended June 30, 2023, is as follows:
| | 2023 Taxable Distributions |
| | Ordinary Income | | Net Long-Term
Capital Gain | | Total
Distributions |
Growth Fund
| $40,769,496 | | $120,355,665 | | $161,125,161 |
Contrarian Fund
| — | | 60,410,619 | | 60,410,619 |
Hedged Equity Fund
| 1,580,326 | | 2,571,455 | | 4,151,781 |
Small Cap Growth Fund
| — | | 89,101,225 | | 89,101,225 |
| 9. | Federal Income Taxes Information: It is the Funds’ policy to comply with the requirements of Subchapter M of the Internal Revenue Code of 1986, as amended, applicable to regulated investment companies and to distribute all of their taxable income to their shareholders; therefore, no federal income tax provision is required. Management has analyzed the Funds’ tax positions taken on federal income tax returns for all open tax years (current and prior three tax years), and has concluded that no provision for federal income tax is required in the Funds’ financial statements. The Funds’ federal and state income and federal excise tax returns for tax years for which the applicable statutes of limitations have not expired are subject to examination by the Internal Revenue Service and state departments of revenue. The Funds are not aware of any tax positions for which it is reasonably possible that the total amounts of unrecognized tax benefits will significantly change in the next 12 months. The Funds recognize interest and penalties, if any, related to unrecognized tax benefits as income tax expense in the Statements of Operations. During the year ended June 30, 2024, the Funds did not incur any interest or penalties. |
| | For the year ended June 30, 2024, the following reclassifications were made as a result of permanent differences between the financial statements and income tax reporting requirements. Reclassifications result primarily from differences in net operating losses and return of capital distributions: |
| | |
| Meridian Funds | 63 | www.arrowmarkpartners.com/meridian/ |
Meridian Fund, Inc.
Notes to Financial Statements (continued)
June 30, 2024
| | The aggregate cost of investments and unrealized appreciation and depreciation, for federal income tax purposes, at June 30, 2024 is as follows: |
| | Increase/(Decrease)
Paid-in Capital | | Increase/(Decrease)
Accumulated Earnings |
Growth Fund
| $(2,334,165) | | $2,334,165 |
Contrarian Fund
| — | | — |
Hedged Equity Fund
| — | | — |
Small Cap Growth Fund
| (4,279,756) | | 4,279,756 |
| | | | |
| | | | |
| | Aggregate Cost | | Aggregate Gross
Unrealized
Appreciation | | Aggregate Gross
Unrealized
Depreciation | | Net Unrealized
Appreciation |
Growth Fund
| $943,946,549 | | $315,135,022 | | $(109,596,805) | | $205,538,217 |
Contrarian Fund
| 474,139,466 | | 141,491,659 | | (29,424,815) | | 112,066,844 |
Hedged Equity Fund
| 52,595,782 | | 15,404,014 | | (8,296,255) | | 7,107,759 |
Small Cap Growth Fund
| 404,933,565 | | 119,238,007 | | (74,439,532) | | 44,798,475 |
| | Components of Accumulated Earnings (Losses) on a Tax Basis |
| | Growth
Fund | | Contrarian
Fund | | Hedged Equity
Fund | | Small Cap
Growth Fund |
Undistributed ordinary income
| $— | | $2,605,278 | | $4,511,949 | | $— |
Capital loss carry forward
| (50,784,802) | | — | | — | | (5,089,729) |
Undistributed long-term capital gains
| — | | 20,452,207 | | 1,293,987 | | — |
Unrealized appreciation/(depreciation)
| 205,538,088 | | 112,066,844 | | 2,684,442 | | 44,798,475 |
Qualified late year deferred losses
| (2,285,775) | | — | | — | | (1,392,601) |
Total Accumulated Earnings/(Losses)
| $152,467,511 | | $135,124,329 | | $8,490,378 | | $38,316,145 |
The differences between book and tax-basis unrealized appreciations are attributable to the tax deferral of losses on wash sales, straddles and investment adjustments in partnerships. Late year losses incurred after December 31 within the fiscal year or period are deemed to arise on the first business day of the following fiscal year for tax purposes. The Growth Fund and Small Cap Growth Fund incurred and elected to defer such ordinary late year losses of $2,285,775 and $1,392,601, respectively.
As of June 30, 2024, the Growth Fund and Small Cap Growth Fund had $50,784,802 and $5,089,729, respectively, short-term capital loss carryforwards available to offset future realized capital gains. The Growth Fund and Small Cap Growth Fund utilized capital loss carryover of $74,297,511 and $78,492,602, respectively.
| 10. | Subsequent Events: Management has evaluated the impact of all subsequent events on the Funds through the date the financial statements were issued, and has noted no additional events that require recognition or disclosure in the financial statements. |
| Meridian Funds | 64 | www.arrowmarkpartners.com/meridian/ |
Report of Independent Registered Public Accounting Firm
To the Shareholders of Meridian Growth Fund, Meridian Contrarian Fund, Meridian Hedged Equity Fund, and Meridian Small Cap Growth Fund and
Board of Directors of Meridian Fund, Inc.
Opinion on the Financial Statements
We have audited the accompanying statements of assets and liabilities, including the schedules of investments, of Meridian Fund, Inc. comprising Meridian Growth Fund, Meridian Contrarian Fund, Meridian Hedged Equity Fund, and Meridian Small Cap Growth Fund (the “Funds”) as of June 30, 2024, the related statements of operations for the year then ended, the statements of changes in net assets for each of the two years in the period then ended, the financial highlights for each of the five years in the period then ended, and the related notes (collectively referred to as the “financial statements”). In our opinion, the financial statements present fairly, in all material respects, the financial position of each of the Funds as of June 30, 2024, the results of their operations for the year then ended, the changes in net assets for each of the two years in the period then ended, and the financial highlights for each of the five years in the period then ended, in conformity with accounting principles generally accepted in the United States of America.
Basis for Opinion
These financial statements are the responsibility of the Funds’ management. Our responsibility is to express an opinion on the Funds’ financial statements based on our audits. We are a public accounting firm registered with the Public Company Accounting Oversight Board (United States) (“PCAOB”) and are required to be independent with respect to the Funds in accordance with the U.S. federal securities laws and the applicable rules and regulations of the Securities and Exchange Commission and the PCAOB.
We conducted our audits in accordance with the standards of the PCAOB. Those standards require that we plan and perform the audit to obtain reasonable assurance about whether the financial statements are free of material misstatement whether due to error or fraud.
Our audits included performing procedures to assess the risks of material misstatement of the financial statements, whether due to error or fraud, and performing procedures that respond to those risks. Such procedures included examining, on a test basis, evidence regarding the amounts and disclosures in the financial statements. Our procedures included confirmation of securities owned as of June 30, 2024, by correspondence with the custodian, brokers, administrator, issuer, and transfer agents; when replies were not received, we performed other auditing procedures. Our audits also included evaluating the accounting principles used and significant estimates made by management, as well as evaluating the overall presentation of the financial statements. We believe that our audits provide a reasonable basis for our opinion.
We have served as the Funds’ auditor since 2018.
COHEN & COMPANY, LTD.
Cleveland, Ohio
August 27, 2024
| Meridian Funds | 65 | www.arrowmarkpartners.com/meridian/ |
Meridian Fund, Inc.
2024 TAX NOTICE TO SHAREHOLDERS (Unaudited)
The information set forth below is for each Fund’s fiscal year as required by federal laws. Shareholders, however, must report distributions on a calendar year basis for income tax purposes, which may include distributions for portions of two fiscal years of a fund. Accordingly, the information needed by shareholders for income tax purposes will be sent to them in early 2023. Please consult your tax advisor for proper treatment of this information.
For the period July 1, 2023 to June 30, 2024, the Funds reported the following terms with regard to distributions paid during the period. All information is based on financial information available as of the date of this annual report and, accordingly, is subject to change. For each item, it is the intention of each Fund to report the maximum amount permitted under the Internal Revenue Code and the regulations thereunder.
Pursuant to Internal Revenue Code Section 852(b)(3), the Contrarian Fund and Hedged Equity Fund reported $28,637,139 and $214,829, respectively, as long-term capital gain distribution for the year ended June 30, 2024.
Pursuant to Internal Revenue Code Section 854(b)(2), the Funds listed below report a percentage of their ordinary income dividends distributed during the year ended June 30, 2024 as qualifying for the corporate dividends-received deduction:
| | |
| Growth Fund | 0% |
| Contrarian Fund | 100.00% |
| Hedged Equity Fund | 99.99% |
| Small Cap Growth Fund | 0% |
Pursuant to Section 1 (h)(11) of the Internal Revenue Code, the Funds listed below report the following amounts of their income dividends paid during the year ended June 30, 2024 as qualified dividend income (QDI):
| | |
| Growth Fund | 0% |
| Contrarian Fund | 100.00% |
| Hedged Equity Fund | 99.99% |
| Small Cap Growth Fund | 0% |
The Funds report a portion of the net income dividends distributed during the year ended June 30, 2024, as Qualified Interest Income (QII), as defined in the Internal Revenue Code as follows:
| | |
| Growth Fund | 0% |
| Contrarian Fund | 12.85% |
| Hedged Equity Fund | 20.47% |
| Small Cap Growth Fund | 0% |
The Funds report a portion of the short term capital gain dividends distributed during the year ended June 30, 2024, as Qualified Short-Term Gain, as defined in the Internal Revenue Code as follows:
| | |
| Growth Fund | 0% |
| Contrarian Fund | 0% |
| Hedged Equity Fund | 0% |
| Small Cap Growth Fund | 0% |
U.S. Government interest represents the amount of interest that was derived from direct U.S. Government obligations and distributed during the fiscal year. This amount is reflected as a percentage of total ordinary income distributions (the total of short-term capital gain and net investment income distributions). Generally, interest from direct U.S. Government obligations is exempt from state income tax. However, for residents of California, Connecticut and New York, the statutory threshold requirements were not satisfied to permit exception of these amounts from state income for the Funds.
| Meridian Funds | 66 | www.arrowmarkpartners.com/meridian/ |
Meridian Fund, Inc.
2024 TAX NOTICE TO SHAREHOLDERS (Unaudited) (continued)
U.S. Government interest:
| | |
| Growth Fund | 0% |
| Contrarian Fund | 0% |
| Hedged Equity Fund | 0% |
| Small Cap Growth Fund | 0% |
| Meridian Funds | 67 | www.arrowmarkpartners.com/meridian/ |
Meridian Fund, Inc.
Glossary of Terms Used in this Report (Unaudited)
Call Option: An agreement that gives an investor the right (but not the obligation) to buy a stock, bond, commodity, or other instrument at a specified price within a specific time period.
| Meridian Funds | 68 | www.arrowmarkpartners.com/meridian/ |
MERIDIAN FUND, INC. PRIVACY POLICY NOTICE
Meridian Fund, Inc. shareholders are entitled to know how we protect personal information and how we limit disclosure.
Information sources. We obtain nonpublic personal information about our shareholders from the following sources:
| • | Applications or other forms |
| • | Transactions with us, our affiliates, or others |
Protection of information. We do not disclose any nonpublic personal information about current or former shareholders, except as permitted or required by law. Personal information refers to information that personally identifies you or your financial accounts. This includes among other items, your social security numbers, your address and account transactions. We do not sell your personal information to anyone.
Disclosure of information. We may send your financial adviser or other financial intermediaries or individuals (as designated by you) copies of confirmations, quarterly account statements and other documents reporting activity in your accounts. We may also provide your personal information to firms that assist us in servicing your account, such as our transfer agent. If at any time in the future it is necessary to disclose your personal information in a way that is inconsistent with this policy, we will give you advance notice of the proposed change so that you will have the opportunity to opt out of such disclosure. We will not disclose your personal information to any other unaffiliated third parties, except as permitted or required by law, unless you have specifically asked us to do so; that is, opted in.
Security measures. To protect your personal information, we permit access only by authorized employees or service providers. We maintain physical, electronic and procedural safeguards to protect your personal account information. Our employees and agents have access to that information only so that they may offer products or provide services to you, for example, when responding to questions directly related to your account. If you ever find that your account information is incomplete, inaccurate or not current, please write to us at Meridian Fund, Inc., P.O. Box 534452, Pittsburgh, PA 15253-4452 or call us at 1-800-446-6662. This privacy policy applies to all Meridian Fund, Inc. accounts you presently have, or may open in the future using your social security number, whether or not you remain a shareholder of a Fund. If you have any questions or concerns, please contact us at the address or telephone number above.
Item 8. Changes in and Disagreements with Accountants for Open-End Management Investment Companies.
Not applicable.
Item 9. Proxy Disclosures for Open-End Management Investment Companies.
Not applicable.
Item 10. Remuneration Paid to Directors, Officers, and Others of Open-End Management Investment Companies.
Included under Item 7.
Item 11. Statement Regarding Basis for Approval of Investment Advisory Contract.
Not applicable.
Item 12. Disclosure of Proxy Voting Policies and Procedures for Closed-End Management Investment Companies.
Not applicable.
Item 13. Portfolio Managers of Closed-End Management Investment Companies.
Not applicable.
Item 14. Purchases of Equity Securities by Closed-End Management Investment Company and Affiliated Purchasers.
Not applicable.
Item 15. Submission of Matters to a Vote of Security Holders.
There have been no material changes to the procedures by which the shareholders may recommend nominees to the registrant’s board of directors, where those changes were implemented after the registrant last provided disclosure in response to the requirements of Item 407(c)(2)(iv) of Regulation S-K (17 CFR 229.407) (as required by Item 22(b)(15) of Schedule 14A (17 CFR 240.14a-101)), or this Item.
Item 16. Controls and Procedures.
| (a) | The Registrant’s principal executive and principal financial officers have concluded, based on their evaluation of the Registrant’s disclosure controls and procedures as of a date within 90 days of the filing date of this report, that the Registrant’s disclosure controls and procedures are reasonably designed to ensure that information required to be disclosed by the Registrant on Form N-CSR is recorded, processed, summarized and reported within the required time periods and that information required to be disclosed by the Registrant in the reports that it files or submits on Form N-CSR is accumulated and communicated to the Registrant’s management, including its principal executive and principal financial officers, as appropriate to allow timely decisions regarding required disclosure. |
| (b) | There were no changes to the Registrant’s internal control over financial reporting that occurred during the period covered by this report that have materially affected, or are reasonably likely to materially affect, the Registrant’s internal control over financial reporting. |
Item 17. Disclosure of Securities Lending Activities for Closed-End Management Investment Companies.
Not applicable.
Item 18. Recovery of Erroneously Awarded Compensation. [Applies to listed companies only]
Not Applicable.
Item 19. Exhibits.
SIGNATURES
Pursuant to the requirements of the Securities Exchange Act of 1934 and the Investment Company Act of 1940, the registrant has duly caused this report to be signed on its behalf by the undersigned, thereunto duly authorized.
| | |
| (Registrant) | | Meridian Fund, Inc.® |
| |
| By (Signature and Title)* | | /s/ David J. Corkins |
| | David J. Corkins |
| | Principal Executive Officer and President |
Pursuant to the requirements of the Securities Exchange Act of 1934 and the Investment Company Act of 1940, this report has been signed below by the following persons on behalf of the registrant and in the capacities and on the dates indicated.
| | |
| By (Signature and Title)* | | /s/ David J. Corkins |
| | David J. Corkins |
| | Principal Executive Officer and President |
| | |
| By (Signature and Title)* | | /s/ Katie Jones |
| | Katie Jones |
| | Principal Financial Officer and Treasurer |
| * | Print the name and title of each signing officer under his or her signature. |