United States
Securities and Exchange Commission
Washington, D.C. 20549
Form N-CSR
Certified Shareholder Report of Registered Management Investment Companies
811-4017
(Investment Company Act File Number)
Federated Equity Funds
_______________________________________________________________
(Exact Name of Registrant as Specified in Charter)
Federated Investors Funds
4000 Ericsson Drive
Warrendale, Pennsylvania 15086-7561
(Address of Principal Executive Offices)
(412) 288-1900
(Registrant's Telephone Number)
John W. McGonigle, Esquire
Federated Investors Tower
1001 Liberty Avenue
Pittsburgh, Pennsylvania 15222-3779
(Name and Address of Agent for Service)
(Notices should be sent to the Agent for Service)
Date of Fiscal Year End: 11/30/08
Date of Reporting Period: Fiscal year ended 11/30/08
Item 1. Reports to Stockholders
Federated
World-Class Investment Manager
Federated
InterContinental Fund
A Portfolio of Federated Equity Funds
ANNUAL SHAREHOLDER REPORT
November 30, 2008
Class A Shares
Class B Shares
Class C Shares
Class K Shares
FINANCIAL HIGHLIGHTS
SHAREHOLDER EXPENSE EXAMPLE
MANAGEMENT'S DISCUSSION OF FUND PERFORMANCE
PORTFOLIO OF INVESTMENTS SUMMARY TABLES
PORTFOLIO OF INVESTMENTS
STATEMENT OF ASSETS AND LIABILITIES
STATEMENT OF OPERATIONS
STATEMENT OF CHANGES IN NET ASSETS
NOTES TO FINANCIAL STATEMENTS
REPORT OF INDEPENDENT REGISTERED PUBLIC ACCOUNTING FIRM
BOARD OF TRUSTEES AND TRUST OFFICERS
EVALUATION AND APPROVAL OF ADVISORY CONTRACT
VOTING PROXIES ON FUND PORTFOLIO SECURITIES
QUARTERLY PORTFOLIO SCHEDULE
Not FDIC Insured * May Lose Value * No Bank Guarantee
Financial Highlights - Class A Shares
(For a Share Outstanding Throughout Each Period)
| | Year
Ended | | | Period
Ended | | | Year Ended December 31,
|
|
| 11/30/2008
|
|
| 11/30/2007
| 1,2
|
| 2006
|
|
| 2005
|
|
| 2004
|
|
| 2003
|
|
Net Asset Value, Beginning of Period
| | $70.32 | | | $56.98 | | | $43.69 | | | $36.32 | | | $29.77 | | | $21.74 | |
Income From Investment Operations:
| | | | | | | | | | | | | | | | | | |
Net investment income
| | 1.34 | 3 | | 0.93 | 3 | | 0.72 | | | 0.38 | | | 0.05 | | | 0.19 | |
Net realized and unrealized gain (loss) on investments and foreign currency transactions
|
| (37.24
| )
|
| 12.41
|
|
| 13.78
|
|
| 7.27
|
|
| 6.75
|
|
| 8.01
|
|
TOTAL FROM INVESTMENT OPERATIONS
|
| (35.90
| )
|
| 13.34
|
|
| 14.50
|
|
| 7.65
|
|
| 6.80
|
|
| 8.20
|
|
Less Distributions:
| | | | | | | | | | | | | | | | | | |
Distributions from net investment income
| | (0.47 | ) | | - -- | | | (0.65 | ) | | (0.28 | ) | | (0.25 | ) | | (0.17 | ) |
Distributions from net realized gain on investments and foreign currency transactions
|
| (2.36
| )
|
| - --
|
|
| (0.57
| )
|
| - --
|
|
| - --
|
|
| - --
|
|
TOTAL DISTRIBUTIONS
|
| (2.83
| )
|
| - --
|
|
| (1.22
| )
|
| (0.28
| )
|
| (0.25
| )
|
| (0.17
| )
|
Redemption Fees
|
| 0.00
| 4
|
| 0.00
| 4
|
| 0.01
|
|
| 0.00
| 4
|
| - --
|
|
| - --
|
|
Net Asset Value, End of Period
|
| $31.59
|
|
| $70.32
|
|
| $56.98
|
|
| $43.69
|
|
| $36.32
|
|
| $29.77
|
|
Total Return 5
|
| (53.15
| )%
|
| 23.41
| %
|
| 33.26
| %
|
| 21.07
| %
|
| 22.96
| %
|
| 37.76
| %
|
| | | | | | | | | | | | | | | | | | |
Ratios to Average Net Assets:
|
|
|
|
|
|
|
|
|
|
|
|
|
|
|
|
|
|
|
Net expenses
|
| 1.50
| %
|
| 1.63
| % 6
|
| 1.70
| %
|
| 1.65
| %
|
| 1.73
| %
|
| 1.54
| %
|
Net investment income
|
| 2.45
| %
|
| 1.45
| % 6
|
| 1.38
| %
|
| 1.15
| %
|
| 0.20
| %
|
| 0.91
| %
|
Expense waiver/reimbursement 7
|
| 0.08
| %
|
| 0.06
| % 6
|
| - --
|
|
| - --
|
|
| - --
|
|
| - --
|
|
Supplemental Data:
|
|
|
|
|
|
|
|
|
|
|
|
|
|
|
|
|
|
|
Net assets, end of period (000 omitted)
|
| $382,447
|
| $519,855
|
| $273,595
|
| $135,097
|
| $59,184
|
| $37,515
|
|
Portfolio turnover
|
| 65
| %
|
| 28
| %
|
| 56
| %
|
| 39
| %
|
| 77
| %
|
| 55
| %
|
1 The Fund changed its fiscal year end from December 31 to November 30.
2 Beginning with the period ended November 30, 2007, the Fund was audited by KPMG LLP. The previous years were audited by another independent registered public accounting firm.
3 Per share numbers have been calculated using the average shares method.
4 Represents less than $0.01.
5 Based on net asset value, which does not reflect the sales charge, redemption fee or contingent deferred sales charge, if applicable. Total returns for periods of less than one year are not annualized.
6 Computed on an annualized basis.
7 This expense decrease is reflected in both the net expense and the net investment income ratios shown above.
See Notes which are an integral part of the Financial Statements
Financial Highlights - Class B Shares
(For a Share Outstanding Throughout Each Period)
| | Year
Ended | | | Period
Ended | |
|
| 11/30/2008
|
|
| 11/30/2007
| 1
|
Net Asset Value, Beginning of Period
| | $70.20 | | | $65.15 | |
Income From Investment Operations:
| | | | | | |
Net investment income (loss)
| | 1.02 | 2 | | (0.10 | ) 2 |
Net realized and unrealized gain (loss) on investments and foreign currency transactions
|
| (37.14
| )
|
| 5.15
|
|
TOTAL FROM INVESTMENT OPERATIONS
|
| (36.12
| )
|
| 5.05
|
|
Less Distributions:
| | | | | | |
Distributions from net investment income
| | (0.40 | ) | | - -- | |
Distributions from net realized gain on investments and foreign currency transactions
|
| (2.36
| )
|
| - --
|
|
TOTAL DISTRIBUTIONS
|
| (2.76
| )
|
| - --
|
|
Redemption Fees
|
| 0.00
| 3
|
| - --
|
|
Net Asset Value, End of Period
|
| $31.32
|
|
| $70.20
|
|
Total Return 4
|
| (53.51
| )%
|
| 7.75
| %
|
| | | | | | |
Ratios to Average Net Assets:
|
|
|
|
|
|
|
Net expenses
|
| 2.29
| %
|
| 2.30
| % 5
|
Net investment income (loss)
|
| 1.89
| %
|
| (0.53
| )% 5
|
Expense waiver/reimbursement 6
|
| 0.12
| %
|
| 0.21
| % 5
|
Supplemental Data:
|
|
|
|
|
|
|
Net assets, end of period (000 omitted)
|
| $17,344
|
|
| $11,299
|
|
Portfolio turnover
|
| 65
| %
|
| 28
| % 7
|
1 Reflects operations for the period from August 25, 2007 (start of performance) to November 30, 2007.
2 Per share numbers have been calculated using the average shares method.
3 Represents less than $0.01.
4 Based on net asset value, which does not reflect the sales charge, redemption fee or contingent deferred sales charge, if applicable. Total returns for periods of less than one year are not annualized.
5 Computed on an annualized basis.
6 This expense decrease is reflected in both the net expense and the net investment income (loss) ratios shown above.
7 Portfolio turnover is calculated at the Fund level. Percentage indicated was calculated for the period from January 1, 2007 to November 30, 2007.
See Notes which are an integral part of the Financial Statements
Financial Highlights - Class C Shares
(For a Share Outstanding Throughout Each Period)
| | Year
Ended | | | Period
Ended | |
|
| 11/30/2008
|
|
| 11/30/2007
| 1
|
Net Asset Value, Beginning of Period
| | $70.19 | | | $65.15 | |
Income From Investment Operations:
| | | | | | |
Net investment income (loss)
| | 1.01 | 2 | | (0.09 | ) 2 |
Net realized and unrealized gain (loss) on investments and foreign currency transactions
|
| (37.11
| )
|
| 5.13
|
|
TOTAL FROM INVESTMENT OPERATIONS
|
| (36.10
| )
|
| 5.04
|
|
Less Distributions:
| | | | | | |
Distributions from net investment income
| | (0.42 | ) | | - -- | |
Distributions from net realized gain on investments and foreign currency transactions
|
| (2.36
| )
|
| - --
|
|
TOTAL DISTRIBUTIONS
|
| (2.78
| )
|
| - --
|
|
Redemption Fees
|
| 0.00
| 3
|
| - --
|
|
Net Asset Value, End of Period
|
| $31.31
|
|
| $70.19
|
|
Total Return 4
|
| (53.51
| )%
|
| 7.74
| %
|
| | | | | | |
Ratios to Average Net Assets:
|
|
|
|
|
|
|
Net expenses
|
| 2.28
| %
|
| 2.29
| % 5
|
Net investment income (loss)
|
| 1.89
| %
|
| (0.47
| )% 5
|
Expense waiver/reimbursement 6
|
| 0.10
| %
|
| 0.23
| % 5
|
Supplemental Data:
|
|
|
|
|
|
|
Net assets, end of period (000 omitted)
|
| $59,407
|
|
| $29,920
|
|
Portfolio turnover
|
| 65
| %
|
| 28
| % 7
|
1 Reflects operations for the period from August 25, 2007 (start of performance) to November 30, 2007.
2 Per share numbers have been calculated using the average shares method.
3 Represents less than $0.01.
4 Based on net asset value, which does not reflect the sales charge, redemption fee or contingent deferred sales charge, if applicable. Total returns for periods of less than one year are not annualized.
5 Computed on an annualized basis.
6 This expense decrease is reflected in both the net expense and the net investment income (loss) ratios shown above.
7 Portfolio turnover is calculated at the Fund level. Percentage indicated was calculated for the period from January 1, 2007 to November 30, 2007.
See Notes which are an integral part of the Financial Statements
Financial Highlights - Class K Shares
(For a Share Outstanding Throughout Each Period)
|
| Year
Ended
11/30/2008
|
|
| Period
Ended
11/30/2007
| 1
|
Net Asset Value, Beginning of Period
| | $70.24 | | | $65.15 | |
Income From Investment Operations:
| | | | | | |
Net investment income (loss)
| | 0.73 | 2 | | (0.07 | ) 2 |
Net realized and unrealized gain (loss) on investments and foreign currency transactions
|
| (36.77
| )
|
| 5.16
|
|
TOTAL FROM INVESTMENT OPERATIONS
|
| (36.04
| )
|
| 5.09
|
|
Less Distributions:
| | | | | | |
Distributions from net investment income
| | (0.39 | ) | | - -- | |
Distributions from net realized gain on investments and foreign currency transactions
|
| (2.36
| )
|
| - --
|
|
TOTAL DISTRIBUTIONS
|
| (2.75
| )
|
| - --
|
|
Redemption Fees
|
| 0.00
| 3
|
| - --
|
|
Net Asset Value, End of Period
|
| $31.45
|
|
| $70.24
|
|
Total Return 4
|
| (53.35
| )%
|
| 7.81
| %
|
| | | | | | |
Ratios to Average Net Assets:
|
|
|
|
|
|
|
Net expenses
|
| 1.95
| %
|
| 1.95
| % 5
|
Net investment income (loss)
|
| 2.08
| %
|
| (0.40
| )% 5
|
Expense waiver/reimbursement 6
|
| 0.08
| %
|
| 0.17
| % 5
|
Supplemental Data:
|
|
|
|
|
|
|
Net assets, end of period (000 omitted)
|
| $231
|
|
| $22
|
|
Portfolio turnover
|
| 65
| %
|
| 28
| % 7
|
1 Reflects operations for the period from August 25, 2007 (start of performance) to November 30, 2007.
2 Per share numbers have been calculated using the average shares method.
3 Represents less than $0.01.
4 Based on net asset value, which does not reflect the sales charge, redemption fee or contingent deferred sales charge, if applicable. Total returns for periods of less than one year are not annualized.
5 Computed on an annualized basis.
6 This expense decrease is reflected in both the net expense and the net investment income (loss) ratios shown above.
7 Portfolio turnover is calculated at the Fund level. Percentage indicated was calculated for the period from January 1, 2007 to November 30, 2007.
See Notes which are an integral part of the Financial Statements
Shareholder Expense Example
As a shareholder of the Fund, you incur two types of costs: (1) transaction costs, including sales charges (loads) on purchase or redemption payments and redemption/exchange fees; and (2) ongoing costs, including management fees and to the extent applicable, distribution (12b-1) fees and/or shareholder services fees and other Fund expenses. This Example is intended to help you to understand your ongoing costs (in dollars) of investing in the Fund and to compare these costs with the ongoing costs of investing in other mutual funds. It is based on an investment of $1,000 invested at the beginning of the period and held for the entire period from June 1, 2008 to November 30, 2008.
ACTUAL EXPENSES
The first section of the table below provides information about actual account values and actual expenses. You may use the information in this section, together with the amount you invested, to estimate the expenses that you incurred over the period. Simply divide your account value by $1,000 (for example, an $8,600 account value divided by $1,000 = 8.6), then multiply the result by the number in the first section under the heading entitled "Expenses Paid During Period" to estimate the expenses attributable to your investment during this period.
HYPOTHETICAL EXAMPLE FOR COMPARISON PURPOSES
The second section of the table below provides information about hypothetical account values and hypothetical expenses based on the Fund's actual expense ratio and an assumed rate of return of 5% per year before expenses, which is not the Fund's actual return. Thus, you should not use the hypothetical account values and expenses to estimate the actual ending account balance or your expenses for the period. Rather, these figures are required to be provided to enable you to compare the ongoing costs of investing in the Fund with other funds. To do so, compare this 5% hypothetical example with the 5% hypothetical examples that appear in the shareholder reports of the other funds.
Please note that the expenses shown in the table are meant to highlight your ongoing costs only and do not reflect any transaction costs, such as sales charges (loads) on purchase or redemption payments, or redemption/exchange fees. Therefore, the second section of the table is useful in comparing ongoing costs only, and will not help you determine the relative total costs of owning different funds. In addition, if these transaction costs were included, your costs would have been higher.
|
| Beginning
Account Value
6/1/2008
|
| Ending
Account Value
11/30/2008
|
| Expenses Paid
During Period 1
|
Actual:
|
|
|
|
|
|
|
Class A Shares
|
| $1,000
|
| $484.80
|
| $5.64
|
Class B Shares
|
| $1,000
|
| $482.90
|
| $8.60
|
Class C Shares
|
| $1,000
|
| $482.80
|
| $8.60
|
Class K Shares
|
| $1,000
|
| $483.80
|
| $7.27
|
Hypothetical (assuming a 5% return before expenses):
|
|
|
|
|
|
|
Class A Shares
|
| $1,000
|
| $1,017.40
|
| $ 7.67
|
Class B Shares
|
| $1,000
|
| $1,013.40
|
| $11.68
|
Class C Shares
|
| $1,000
|
| $1,013.40
|
| $11.68
|
Class K Shares
|
| $1,000
|
| $1,015.20
|
| $ 9.87
|
1 Expenses are equal to the Fund's annualized net expense ratios, multiplied by the average account value over the period, multiplied by 183/366 (to reflect the one-half-year period). The annualized net expense ratios are as follows:
Class A Shares
|
| 1.52%
|
Class B Shares
|
| 2.32%
|
Class C Shares
|
| 2.32%
|
Class K Shares
|
| 1.96%
|
Management's Discussion of Fund Performance
For the one-year reporting period ended November 30, 2008, the fund's total return, based on net asset value, was (53.15)% for Class A Shares, (53.51)% for Class B Shares, (53.51)% for Class C Shares and (53.35)% for Class K Shares. The Morgan Stanley Capital International All Country World Index ex USA (MSCI AC World ex USA), the fund's benchmark, returned (49.21)% for the same period. The fund's total return for the fiscal year reflected actual cash flows, transaction costs and other expenses which were not reflected in the total return of the MSCI AC World ex USA.
The following discussion will focus on the performance of the fund's Class A Shares.
Market Overview
During the reporting period, headline-grabbing market shocks impacted every major asset class, as the global economy faced a severe slowdown. The fund and the MSCI World ex USA 2 both had the worst absolute return year since their inception 10 and 40 years ago, respectively. Good asset classes were sold off disproportionately with bad asset classes as equity investors raced to sell their holdings. The trends that have driven international markets in recent years such as exports, urbanization and growing consumer economies became strained during the reporting period.
1 The MSCI AC World ex USA is an unmanaged index representing 45 developed and emerging markets around the world that collectively comprise virtually all of the foreign equity stock markets. The index is unmanaged and, unlike the Fund, is not affected by cashflows. It is not possible to invest directly in an index.
2 The MSCI World ex USA Index is a free float-adjusted market capitalization weighted index that is designed to measure the equity market performance of developed markets. As of June 2007 the MSCI World ex USA Index consisted of the following 23 developed market country indices: Australia, Austria, Belgium, Canada, Denmark, Finland, France, Germany, Greece, Hong Kong, Ireland, Italy, Japan, Netherlands, New Zealand, Norway, Portugal, Singapore, Spain, Sweden, Switzerland, the United Kingdom and the United States. The index is unmanaged and, unlike the fund, is not affected by cash flows. It is not possible to invest directly in an index.
Over the last three months of the reporting period, international economies provided massive global stimuli on an unprecedented scale. Some actions implemented were: (1) huge economic stimulus packages such as China's $586 billion stimulus package; (2) coordinated and multiple central banks' liquidity injections including: Bank of Canada, Bank of England, European Central Bank, Bank of Japan, Swiss National Bank, Reserve Bank of Australia, United Arab Emirates; (3) tax incentives for long-term holdings of domestic funds to strengthen stock markets, such as those provided by the South Korean government; (4) countries cutting reserve requirements, such as the Central Bank of Taiwan; (5) easing of collateral requirements on loans by Sweden's Riksbank and Bank of Italy; and (6) numerous and biggest historic rate cuts in many economies, including recent European Central Bank's 75 basis point largest cut ever.
As the year progressed, country governments responded with more urgency and decisiveness. As we saw in the final week of November 2008, The People's Bank of China reduced its key one-year lending rate by 108 basis points--the largest cut in 11 years to 5.58%. This was the fourth reduction since the middle of September 2008, resulting in a cumulative reduction of 189 basis points.
Country allocation remained the primary driver of the fund's relative performance for the fiscal year 3 (as it has consistently been over the past 10 years), but despite the global stimuli, the most recent three months in the reporting period showed a dramatic increase in correlations between asset classes--everything declined at the same time. All countries declined together and were highly correlated with each other due to unusual market stress and volatility.
Fund Performance
Throughout the reporting period, the fund reduced exposure, to its lowest weight in several years, to the faster-growth emerging markets due to risk aversion, although these developing economies, such as China, are playing an important role in balancing the support system for the global economy. The fund's front-end risk process successfully screened out the biggest country loser, Russia, which declined 70.38%. The Fund benefited on a relative basis from emerging market investment timing decisions in Brazil and Taiwan. The fund also benefited from other countries that performed better compared to its benchmark. Several of our key markets traded at unprecedented valuation levels as compared to the prior 20 years, including: Netherlands (52.53)%, Germany (51.21)% and France (48.47)% in the Eurozone. 4 The fund favored select developing economies including Brazil (55.71)% and Turkey (63.49)%. Over the reporting period, the countries and companies that performed better in this environment have strong cash flows and low leverage.
3 International investing involves special risks including currency risk, increased volatility, political risks and differences in auditing and other financial standards. Prices of emerging markets securities can be significantly more volatile than the prices of securities in developed countries and currency risk and political risks are accentuated in emerging markets.
4 The Eurozone consists of: Austria, Belgium, Cyprus, Finland, France, Germany, Greece, Ireland, Italy, Luxembourg, Malta, The Netherlands, Portugal, Spain, Slovenia and Slovakia. The 16 countries are united by a common currency (the Euro), monetary policy and adherence to the Maastrict Treaty.
The fund's overweight in Norway was the biggest drag on the fund's performance. Norway declined 65.38% despite the Norwegian economy's continued resilience and robust Gross Domestic Product ("GDP"). The market dropped primarily due to increased concerns for a global recession. Energy and other commodity companies in Norway were impacted from the decline in oil prices, as commodity markets were undercut due to the fears surrounding a global economy, which is now facing recession.
The fund's underweight Japanese yen currency exposure also contributed negatively to the fund's relative performance. The yen currency makes up 19% of the MSCI AC World ex USA. Our investment process relies on the view that currencies will appreciate if the country economy and underlying stocks' fundamentals are strong. Over the reporting period year, forced selling due to de-leveraging and unwinding of the "Carry Trade" in order to repatriate funds contributed meaningfully to outsized yen returns versus U.S. dollar.
GROWTH OF A $10,000 INVESTMENT - CLASS A SHARES 1
The graph below illustrates the hypothetical investment of $10,000 2 in Federated InterContinental Fund (Class A Shares) (the "Fund") from December 31, 1998 to November 30, 2008, compared to the Morgan Stanley Capital International All Country World Index ex USA (MSCI AC World ex USA). 3
Average Annual Total Returns 4 for the Period Ended 11/30/2008
|
|
|
|
1 Year
|
| (55.72
| )%
|
5 Years
|
| 3.28
| %
|
10 Years
|
| 1.45
| %
|

Performance data quoted represents past performance which is no guarantee of future results. Investment return and principal value will fluctuate so that an investor's shares, when redeemed, may be worth more or less than their original cost. Mutual fund performance changes over time and current performance may be lower or higher than what is stated. For current to the most recent month-end performance and after-tax returns, visit FederatedInvestors.com or call 1-800-341-7400. Returns shown do not reflect the deduction of taxes that a shareholder would pay on Fund distributions or the redemption of Fund shares. Mutual funds are not obligations of or guaranteed by any bank and are not federally insured. Total returns shown include the maximum sales charge of 5.50% ..
1 Federated InterContinental Fund is the successor to Rochdale Atlas Portfolio pursuant to a reorganization that took place on August 24, 2007. The information presented above, for the periods prior to August 24, 2007, is historical information for Rochdale Atlas Portfolio. The fiscal year end of Rochedale Atlas Portfolio was December 31.
2 Represents a hypothetical investment of $10,000 in the Fund after deducting the maximum sales charge of 5.50% ($10,000 investment minus $550 sales charge = $9,450). The Fund's performance assumes the reinvestment of all dividends and distributions. The MSCI AC World ex USA has been adjusted to reflect reinvestment of dividends on securities in the index.
3 The MSCI AC World ex USA is not adjusted to reflect sales charges, expenses or other fees that the Securities and Exchange Commission (SEC) requires to be reflected in the Fund's performance. The index is unmanaged and, unlike the Fund, is not affected by cash flows. It is not possible to invest directly in an index.
4 Total returns quoted reflect all applicable sales charges.
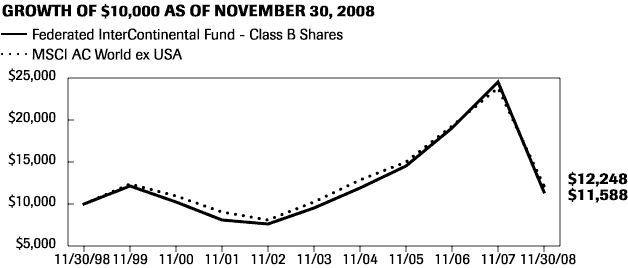
GROWTH OF A $10,000 INVESTMENT - CLASS B SHARES
The Fund's Class B Shares commenced operations on August 25, 2007. The Fund offers four other classes of shares: Institutional Shares, Class A Shares, Class C Shares and Class K Shares. For the period prior to commencement of operations of Class B Shares, the performance information shown is for the Fund's Class A Shares, adjusted to reflect the expenses of Class B Shares. The graph below illustrates the hypothetical investment of $10,000 1 in Federated InterContinental Fund (Class B Shares) (the "Fund") from November 30, 1998 to November 30, 2008, compared to the Morgan Stanley Capital International All Country World Index ex USA (MSCI AC World ex USA). 2
Average Annual Total Returns 3 for the Period Ended 11/30/2008
|
|
|
|
1 Year
|
| (55.97
| )%
|
5 Years
|
| 3.45
| %
|
10 Years
|
| 1.49
| %
|
Performance data quoted represents past performance which is no guarantee of future results. Investment return and principal value will fluctuate so that an investor's shares, when redeemed, may be worth more or less than their original cost. Mutual fund performance changes over time and current performance may be lower or higher than what is stated. For current to the most recent month-end performance and after-tax returns, visit FederatedInvestors.com or call 1-800-341-7400. Returns shown do not reflect the deduction of taxes that a shareholder would pay on Fund distributions or the redemption of Fund shares. Mutual funds are not obligations of or guaranteed by any bank and are not federally insured. Total returns shown include the maximum contingent deferred sales change of 5.50%, as applicable.
1 Represents a hypothetical investment of $10,000 in the Fund. The maximum contingent deferred sales change is 5.50% on any redemption less than one year from the purchase date. The Fund's performance assumes the reinvestment of all dividends and distributions. The MSCI AC World ex USA has been adjusted to reflect reinvestment of dividends on securities in the index.
2 The MSCI AC World ex USA is not adjusted to reflect sales charges, expenses or other fees that the SEC requires to be reflected in the Fund's performance. The index is unmanaged and, unlike the Fund, is not affected by cash flows. It is not possible to invest directly in an index.
3 Total returns quoted reflect all applicable contingent deferred sales charges.
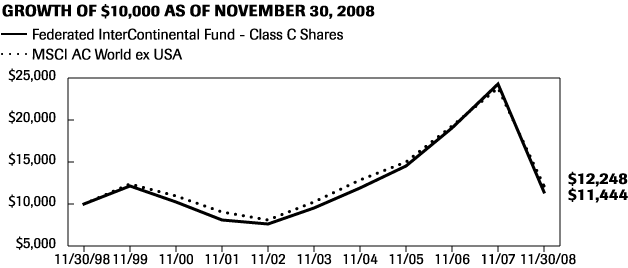
GROWTH OF A $10,000 INVESTMENT - CLASS C SHARES
The Fund's Class C Shares commenced operations on August 25, 2007. The Fund offers four other classes of shares: Institutional Shares, Class A Shares, Class B Shares and Class K Shares. For the period prior to commencement of operations of Class C Shares, the performance information shown is for the Fund's Class A Shares, adjusted to reflect the expenses of Class C Shares. The graph below illustrates the hypothetical investment of $10,000 1 in Federated InterContinental Fund (Class C Shares) (the "Fund") from November 30, 1998 to November 30, 2008, compared to the Morgan Stanley Capital International All Country World Index ex USA (MSCI AC World ex USA). 2
Average Annual Total Returns 3 for the Period Ended 11/30/2008
|
|
|
|
1 Year
|
| (53.95
| )%
|
5 Years
|
| 3.81
| %
|
10 Years
|
| 1.36
| %
|
Performance data quoted represents past performance which is no guarantee of future results. Investment return and principal value will fluctuate so that an investor's shares, when redeemed, may be worth more or less than their original cost. Mutual fund performance changes over time and current performance may be lower or higher than what is stated. For current to the most recent month-end performance and after-tax returns, visit FederatedInvestors.com or call 1-800-341-7400. Returns shown do not reflect the deduction of taxes that a shareholder would pay on Fund distributions or the redemption of Fund shares. Mutual funds are not obligations of or guaranteed by any bank and are not federally insured. Total returns shown include the maximum contingent deferred sales change of 1.00%, as applicable.
1 Represents a hypothetical investment of $10,000 in the Fund. A 1.00% contingent deferred sales charge would be applied in any redemption less than one year form the purchase date. The Fund's performance assumes the reinvestment of all dividends and distributions. The MSCI AC World ex USA has been adjusted to reflect reinvestment of dividends on securities in the index.
2 The MSCI AC World ex USA is not adjusted to reflect sales charges, expenses or other fees that the SEC requires to be reflected in the Fund's performance. The index is unmanaged and, unlike the Fund, is not affected by cash flows. It is not possible to invest directly in an index.
3 Total returns quoted reflect all applicable contingent deferred sales charges.
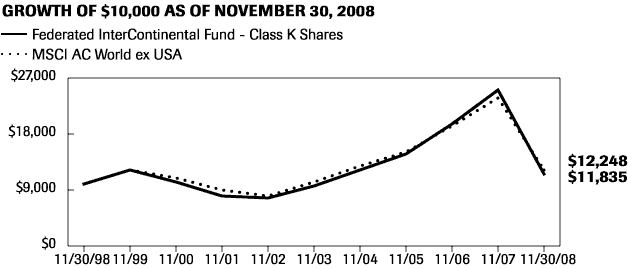
GROWTH OF A $10,000 INVESTMENT - CLASS K SHARES
The Fund's Class K Shares commenced operations on August 25, 2007. The Fund offers four other classes of shares: Institutional Shares, Class A Shares, Class B Shares and Class C Shares. For the period prior to commencement of operations of Class K Shares, the performance information shown is for the Fund's Class A Shares, adjusted to reflect the expenses of Class K Shares. The graph below illustrates the hypothetical investment of $10,000 1 in Federated InterContinental Fund (Class K Shares) (the "Fund") from November 30, 1998 to November 30, 2008, compared to the Morgan Stanley Capital International All Country World Index ex USA (MSCI AC World ex USA). 2
Average Annual Total Returns for the Period Ended 11/30/2008
|
|
|
|
1 Year
|
| (53.35
| )%
|
5 Years
|
| 4.15
| %
|
10 Years
|
| 1.70
| %
|
Performance data quoted represents past performance which is no guarantee of future results. Investment return and principal value will fluctuate so that an investor's shares, when redeemed, may be worth more or less than their original cost. Mutual fund performance changes over time and current performance may be lower or higher than what is stated. For current to the most recent month-end performance and after-tax returns, visit FederatedInvestors.com or call 1-800-341-7400. Returns shown do not reflect the deduction of taxes that a shareholder would pay on Fund distributions or the redemption of Fund shares. Mutual funds are not obligations of or guaranteed by any bank and are not federally insured.
1 Represents a hypothetical investment of $10,000 in the Fund. The Fund's performance assumes the reinvestment of all dividends and distributions. The MSCI AC World ex USA has been adjusted to reflect reinvestment of dividends on securities in the index.
2 The MSCI AC World ex USA is not adjusted to reflect sales charges, expenses or other fees that the SEC requires to be reflected in the Fund's performance. The index is unmanaged and, unlike the Fund, is not affected by cashflows. It is not possible to invest directly in an index.
Performance data quoted represents past performance which is no guarantee of future results. Investment return and principal value will fluctuate so that an investor's shares, when redeemed, may be worth more or less than their original cost. Mutual fund performance changes over time and current performance may be lower or higher than what is stated. For current to the most recent month-end performance and after-tax returns, visit FederatedInvestors.com or call 1-800-341-7400.
Portfolio of Investments Summary Tables
At November 30, 2008, the Fund's portfolio composition 1 was as follows:
Country
|
| Percentage of
Total Net Assets
|
Germany
|
| 17.2
| %
|
France
|
| 14.6
| %
|
Netherlands
|
| 12.2
| %
|
Japan
|
| 10.6
| %
|
Korea
|
| 8.4
| %
|
Norway
|
| 5.7
| %
|
Italy
|
| 5.4
| %
|
Poland
|
| 5.4
| %
|
Austria
|
| 4.7
| %
|
Brazil
|
| 3.9
| %
|
Turkey
|
| 3.4
| %
|
Derivative Contracts 2
|
| 2.2
| %
|
Securities Lending Collateral 3
|
| 7.3
| %
|
Other Securities 4
|
| 0.4
| %
|
Cash Equivalents 5
|
| 5.7
| %
|
Other Assets and Liabilities--Net 6
|
| (7.1
| )%
|
TOTAL
|
| 100.0
| %
|
1 Country allocations are based primarily on the country in which a company is incorporated. However, the Fund's adviser may allocate a company to a country based on other factors such as location of the company's principal office, the location of the principal trading market for the company's securities or the country where a majority of the company's revenues are derived.
2 Based upon net unrealized appreciation (depreciation) or value of the derivative contracts as applicable. Derivative contracts may consist of futures, forwards, options and swaps. The impact of a derivative contract on the Fund's performance may be larger than its unrealized appreciation (depreciation) or value may indicate. In many cases, the notional value or amount of a derivative contract may provide a better indication of the contract's significance to the portfolio. More complete information regarding the Fund's direct investments in derivative contracts, including unrealized appreciation (depreciation), value and notional values or amounts of such contracts, can be found in the table at the end of the Portfolio of Investments included in this report.
3 Cash collateral received from lending portfolio securities which is invested in short-term investments such as repurchase agreements or money market mutual funds.
4 Other Securities include an exchange-traded fund.
5 Cash Equivalents include any investments in money market mutual funds and/or overnight repurchase agreements.
6 Assets, other than investments in securities and derivative contracts, less liabilities. See Statement of Assets and Liabilities.
At November 30, 2008, the Fund's sector classification composition 7 was as follows:
Sector Classification
|
| Percentage of
Total Net Assets
|
Financials
|
| 12.8
| %
|
Telecommunication Services
|
| 12.7
| %
|
Consumer Staples
|
| 12.2
| %
|
Energy
|
| 9.9
| %
|
Industrials
|
| 9.4
| %
|
Health Care
|
| 9.0
| %
|
Utilities
|
| 7.5
| %
|
Materials
|
| 6.4
| %
|
Consumer Discretionary
|
| 6.2
| %
|
Information Technology
|
| 5.8
| %
|
Derivative Contracts 2
|
| 2.2
| %
|
Securities Lending Collateral 3
|
| 7.3
| %
|
Cash Equivalents 5
|
| 5.7
| %
|
Other Assets and Liabilities--Net 6
|
| (7.1
| )%
|
TOTAL
|
| 100.0
| %
|
7 Except for Securities Lending Collateral, Derivative Contracts, Cash Equivalents and Other Assets and Liabilities, sector classifications are based upon, and individual securities assigned to, the classifications of the Global Industry Classification Standard (GICS), except that the adviser assigns a classification to securities not classified by the GICS and to securities for which the adviser does not have access to the classification made by the GICS.
Portfolio of Investments
November 30, 2008
Shares
|
|
|
|
| Value in
U.S. Dollars
|
|
| | | COMMON STOCKS--91.5% | | | | |
| | | Austria--4.7% | | | | |
| 64,000 | | Andritz AG
| | $ | 1,490,197 | |
| 221,110 | 1 | Erste Bank Der Oesterreichischen Sparkassen AG
| | | 5,048,403 | |
| 13,000 | | Mayr-Melnhof Karton AG
| | | 792,155 | |
| 214,700 | | OMV AG
| | | 5,422,180 | |
| 77,700 | | Oesterreichische Elektrizitaetswirtschafts AG
| | | 3,442,203 | |
| 420,490 | | Telekom Austria AG
| | | 5,630,042 | |
| 135,500 | | Vienna Insurance Group
|
|
| 3,746,059
|
|
| | | TOTAL
|
|
| 25,571,239
|
|
| | | Brazil--3.9% | | | | |
| 73,100 | | Banco Bradesco SA, ADR
| | | 777,784 | |
| 114,650 | | Banco Itau SA, ADR
| | | 1,327,647 | |
| 85,000 | 2 | Brasil Telecom SA, ADR
| | | 1,686,400 | |
| 126,344 | 2 | Companhia Energetica de Minas Gerais, ADR
| | | 2,000,026 | |
| 98,000 | 2 | Companhia Siderurgica Nacional SA, ADR
| | | 1,128,960 | |
| 209,820 | 1 | Companhia Vale Do Rio Doce, ADR
| | | 2,505,251 | |
| 50,000 | | Companhia de Bebidas das Americas (AmBev), ADR
| | | 2,173,500 | |
| 26,600 | 2 | Companhia de Saneamento Basico do Estado de Sao Paulo, ADR
| | | 556,472 | |
| 80,000 | | Embraer - Empresa Brasileira de Aeronautica SA, ADR
| | | 1,242,400 | |
| 71,900 | | Gerdau SA, ADR
| | | 468,788 | |
| 113,880 | 2 | Petroleo Brasileiro SA, ADR, Common
| | | 2,384,647 | |
| 131,200 | 2 | Petroleo Brasileiro SA, ADR, Preference
| | | 2,332,736 | |
| 51,700 | 2 | Tele Norte Leste Participacoes SA, ADR
| | | 758,956 | |
| 34,600 | | Unibanco Uniao de Bancos Brasileiros SA, GDR
|
|
| 2,217,514
|
|
| | | TOTAL
|
|
| 21,561,081
|
|
Shares
|
|
|
|
| Value in
U.S. Dollars
|
|
| | | COMMON STOCKS--continued | | | | |
| | | France--14.6% | | | | |
| 102,577 | | AXA SA
| | $ | 1,963,365 | |
| 77,288 | | BNP Paribas SA
| | | 4,283,349 | |
| 33,100 | | CNP Assurances
| | | 2,132,276 | |
| 50,000 | | Cap Gemini SA
| | | 1,610,848 | |
| 50,000 | | Carrefour SA
| | | 1,885,041 | |
| 92,000 | | Casino Guichard-Perrachon
| | | 5,625,537 | |
| 75,000 | 1 | Christian Dior
| | | 3,462,110 | |
| 53,500 | | Compagnie de Saint-Gobain SA
| | | 2,153,830 | |
| 42,000 | | Electricite De France
| | | 2,437,892 | |
| 42,000 | | Essilor International SA
| | | 1,680,364 | |
| 150,000 | | European Aeronautic Defence and Space Co.
| | | 2,381,788 | |
| 429,300 | | France Telecomm SA
| | | 11,078,945 | |
| 15,600 | | L'Oreal SA
| | | 1,260,306 | |
| 85,000 | | Lagardere S.C.A.
| | | 3,118,517 | |
| 314,850 | | Sanofi-Aventis, ADR
| | | 8,708,751 | |
| 94,400 | | Societe BIC SA
| | | 4,796,015 | |
| 41,000 | | Suez SA
| | | 1,579,977 | |
| 128,040 | | Total SA
| | | 6,717,561 | |
| 113,950 | 1 | Total SA, ADR
| | | 6,010,862 | |
| 75,910 | | Vinci SA
| | | 3,069,399 | |
| 128,050 | | Vivendi SA
|
|
| 3,628,971
|
|
| | | TOTAL
|
|
| 79,585,704
|
|
| | | Germany--17.2% | | | | |
| 43,548 | | Allianz SE
| | | 3,643,949 | |
| 218,600 | | BASF AG
| | | 7,028,513 | |
| 170,900 | | Bayer AG
| | | 8,880,219 | |
| 95,000 | | Beiersdorf AG
| | | 5,283,785 | |
Shares
|
|
|
|
| Value in
U.S. Dollars
|
|
| | | COMMON STOCKS--continued | | | | |
| | | Germany--continued | | | | |
| 219,500 | 1 | Daimler AG
| | $ | 6,874,740 | |
| 101,980 | 1 | Deutsche Bank AG
| | | 3,662,127 | |
| 232,340 | | Deutsche Post AG
| | | 3,348,584 | |
| 831,520 | | Deutsche Telekom AG
| | | 11,571,358 | |
| 112,740 | | E.On AG
| | | 3,974,193 | |
| 98,000 | | Fresenius Medical Care AG & Co. KGaA
| | | 4,281,430 | |
| 60,000 | 2 | Gerresheimer AG
| | | 2,064,311 | |
| 38,000 | | Merck KGAA
| | | 3,192,637 | |
| 85,794 | | Metro AG
| | | 2,639,058 | |
| 133,936 | | RWE AG
| | | 11,299,146 | |
| 220,000 | | SAP AG
| | | 7,557,942 | |
| 15,000 | | Salzgitter AG
| | | 1,045,353 | |
| 39,700 | | Siemens AG
| | | 2,393,492 | |
| 381,000 | 1 | Suedzucker AG
|
|
| 4,821,487
|
|
| | | TOTAL
|
|
| 93,562,324
|
|
| | | Italy--5.4% | | | | |
| 131,800 | | Assicurazioni Generali S.p.A.
| | | 3,189,827 | |
| 785,830 | | Enel S.p.A.
| | | 4,932,630 | |
| 729,640 | | Finmeccanica S.p.A.
| | | 9,137,240 | |
| 1,917,064 | | Intesa Sanpaolo S.p.A.
| | | 5,794,852 | |
| 68,900 | | Lottomatica S.p.A.
| | | 1,634,592 | |
| 110,000 | | Saipem S.p.A.
| | | 1,714,213 | |
| 635,000 | | Snam Rete Gas S.p.A.
|
|
| 3,326,797
|
|
| | | TOTAL
|
|
| 29,730,151
|
|
| | | Japan--10.6% | | | | |
| 300,000 | | Ajinomoto Co., Inc.
| | | 3,176,369 | |
| 95,000 | | Asahi Breweries Ltd.
| | | 1,657,127 | |
Shares
|
|
|
|
| Value in
U.S. Dollars
|
|
| | | COMMON STOCKS--continued | | | | |
| | | Japan--continued | | | | |
| 450,000 | | Asahi Glass Co. Ltd.
| | $ | 2,530,621 | |
| 186,900 | | Bridgestone Corp.
| | | 3,130,383 | |
| 60,000 | | Chubu Electric Power Co., Inc.
| | | 1,649,843 | |
| 90,000 | | Chugai Pharmaceutical Co. Ltd.
| | | 1,553,628 | |
| 200 | | East Japan Railway Co.
| | | 1,540,595 | |
| 64,600 | | Honda Motor Co. Ltd.
| | | 1,420,223 | |
| 500 | | KDDI Corp.
| | | 3,251,181 | |
| 10,400 | | Keyence Corp.
| | | 1,730,632 | |
| 200,000 | | Kyowa Hakko Kirin Co., Ltd.
| | | 1,697,003 | |
| 400,000 | | Meiji Seika Kaisha
| | | 1,786,819 | |
| 1,000 | | NTT DoCoMo, Inc.
| | | 1,659,300 | |
| 5,300 | | Nintendo Corp. Ltd.
| | | 1,640,909 | |
| 533,000 | | Nippon Express Co. Ltd.
| | | 2,393,090 | |
| 480 | | Nippon Telegraph & Telephone Corp.
| | | 2,088,886 | |
| 83,000 | | Panasonic Corp.
| | | 996,349 | |
| 53,000 | | Seven & I Holdings Co. Ltd.
| | | 1,500,885 | |
| 357,000 | | Shionogi and Co. Ltd.
| | | 7,747,864 | |
| 140,000 | | Shiseido Co., Ltd.
| | | 2,604,372 | |
| 405,100 | | Taiyo Nippon Sanso Corp.
| | | 2,847,617 | |
| 75,000 | | Terumo Corp.
| | | 3,483,696 | |
| 500,000 | | Toppan Printing Co.
| | | 3,757,824 | |
| 60,000 | | Toyota Motor Corp.
|
|
| 1,888,655
|
|
| | | TOTAL
|
|
| 57,733,871
|
|
| | | Korea, Republic of--8.4% | | | | |
| 14,300 | | Hyundai Heavy Industries Co. Ltd.
| | | 1,536,037 | |
| 110,000 | | Hyundai Marine & Fire Insurance Co.
| | | 985,041 | |
| 50,000 | | Hyundai Motor Co. Ltd.
| | | 1,414,230 | |
Shares
|
|
|
|
| Value in
U.S. Dollars
|
|
| | | COMMON STOCKS--continued | | | | |
| | | Korea, Republic of--continued | | | | |
| 227,400 | | KT Corp., ADR
| | $ | 2,578,716 | |
| 139,500 | | KT Freetel Co. Ltd.
| | | 2,707,188 | |
| 631,330 | | Korea Electric Power Corp., ADR
| | | 5,871,369 | |
| 22,994 | | LG Chem Ltd.
| | | 1,088,163 | |
| 88,500 | | LG Electronics, Inc.
| | | 4,758,289 | |
| 17,500 | | LS Corporation
| | | 845,120 | |
| 80,250 | 1 | POSCO, ADR
| | | 4,634,438 | |
| 15,000 | | SK Telecom Co. ADR
| | | 2,208,368 | |
| 25,600 | | Samsung C&T Corp.
| | | 692,180 | |
| 131,500 | | Samsung Electro-Mechanics Co.
| | | 3,132,362 | |
| 23,850 | | Samsung Electronics Co. Ltd.
| | | 7,888,765 | |
| 10,200 | | Samsung Fire & Marine Insurance
| | | 1,346,359 | |
| 60,000 | | Samsung Heavy Industries
| | | 835,753 | |
| 77,800 | | Samsung SDI Co. Ltd.
|
|
| 3,181,397
|
|
| | | TOTAL
|
|
| 45,703,775
|
|
| | | Netherlands--12.2% | | | | |
| 138,000 | 2 | ASML Holding NV
| | | 2,104,626 | |
| 1,075,000 | 2 | Ahold NV
| | | 11,995,585 | |
| 93,000 | | Akzo Nobel NV
| | | 3,176,965 | |
| 75,000 | | Fugro NV
| | | 2,388,337 | |
| 253,000 | | Heineken NV
| | | 6,980,514 | |
| 136,229 | | Koninklijke DSM NV
| | | 3,161,041 | |
| 865,000 | | Koninklijke KPN NV
| | | 11,958,877 | |
| 313,000 | | Philips Electronics NV
| | | 5,105,076 | |
| 220,000 | 1,2 | Qiagen NV
| | | 3,492,185 | |
| 188,000 | | SBM Offshore NV
| | | 2,936,057 | |
| 562,207 | | Unilever NV
|
|
| 13,141,816
|
|
| | | TOTAL
|
|
| 66,441,079
|
|
Shares
|
|
|
|
| Value in
U.S. Dollars
|
|
| | | COMMON STOCKS--continued | | | | |
| | | Norway--5.7% | | | | |
| 436,100 | | DnB NOR
| | $ | 1,661,248 | |
| 129,000 | 1 | Frontline Ltd.
| | | 3,714,195 | |
| 816,600 | | Norsk Hydro ASA
| | | 2,963,444 | |
| 160,000 | | Schibsted ASA
| | | 1,718,574 | |
| 695,043 | | StatoilHydro ASA
| | | 11,786,138 | |
| 120,000 | 2 | Subsea 7, Inc.
| | | 823,494 | |
| 831,600 | | Telenor ASA
| | | 4,505,497 | |
| 227,800 | | Yara International ASA
|
|
| 3,794,038
|
|
| | | TOTAL
|
|
| 30,966,628
|
|
| | | Poland--5.4% | | | | |
| 164,528 | | Asseco Ploand SA
| | | 2,656,899 | |
| 123,840 | | Bank Pekao SA
| | | 4,659,801 | |
| 90,500 | | Bank Zachodni WBK SA
| | | 3,257,323 | |
| 24,200 | 2 | PBG SA
| | | 1,699,044 | |
| 5,116,140 | | Polskie Gornictwo Naftowe I Gazownictwo SA
| | | 6,079,445 | |
| 674,900 | | Powszechna Kasa Oszczednosci
| | | 7,328,049 | |
| 540,000 | | Telekomunikacja Polska SA
|
|
| 3,539,751
|
|
| | | TOTAL
|
|
| 29,220,312
|
|
| | | Turkey--3.4% | | | | |
| 1,380,000 | | Akbank T.A.S.
| | | 3,835,919 | |
| 177,000 | | Tupras Turkiye Petrol Rafinerileri AS
| | | 1,713,791 | |
| 700,000 | | Turkcell Iletisim Hizmetleri AS
| | | 3,897,012 | |
| 2,540,000 | | Turkiye Garanti Bankasi AS
| | | 3,748,169 | |
| 2,010,000 | | Turkiye Is Bankasi (Isbank), Class C
|
|
| 5,236,299
|
|
| | | TOTAL
|
|
| 18,431,190
|
|
| | | TOTAL COMMON STOCKS
(IDENTIFIED COST $828,851,294)
|
|
| 498,507,354
|
|
Shares
|
|
|
|
| Value in
U.S. Dollars
|
|
| | | EXCHANGE-TRADED FUND--0.4% | | | | |
| 60,000 | | iShares DJ STOXX 600 Health Care Fund
(IDENTIFIED COST $3,001,686)
|
| $
| 2,522,260
|
|
| | | MUTUAL FUND--13.0% | | | | |
| 70,656,316 | 3,4,5 | Prime Value Obligations Fund, Institutional Shares, 2.35%
(AT NET ASSET VALUE)
|
|
| 70,656,316
|
|
| | | TOTAL INVESTMENTS--104.9%
(IDENTIFIED COST $902,509,296) 6
|
|
| 571,685,930
|
|
| | | OTHER ASSETS AND LIABILITIES - NET--(4.9)% 7
|
|
| (26,737,919
| )
|
| | | TOTAL NET ASSETS--100%
|
| $
| 544,948,011
|
|
At November 30, 2008, the Fund had outstanding foreign exchange contracts as follows:
Settlement Date
|
| Foreign
Currency Units
to Deliver/Receive
|
| In Exchange For
|
| Contracts
at Value
|
| Unrealized
Appreciation
(Depreciation)
|
|
Contracts Purchased:
|
|
|
|
|
|
|
|
|
|
1/15/2009
|
| 34,825,500 Norwegian Krone
|
| $ 5,938,611
|
| $ 4,946,484
|
| $ (992,127
| )
|
1/15/2009
|
| 184,612,250 Norwegian Krone
|
| $26,397,691
|
| $26,221,633
|
| $ (176,058
| )
|
1/15/2009
|
| 33,192,500 Norwegian Krone
|
| $ 5,000,000
|
| $ 4,714,539
|
| $ (285,461
| )
|
Contracts Sold:
|
|
|
|
|
|
|
|
|
|
1/15/2009
|
| 496,054,900 Norwegian Krone
|
| $84,003,918
|
| $70,457,782
|
| $13,546,136
|
|
NET UNREALIZED APPRECIATION ON FOREIGN EXCHANGE CONTRACTS
| $12,092,490
|
|
Net Unrealized Appreciation on Foreign Exchange Contracts is included in "Other Assets and Liabilities--Net."
1 All or a portion of these securities are temporarily on loan to unaffiliated broker/dealers.
2 Non-income-producing security.
3 Affiliated company.
4 7-Day net yield.
5 All or a portion of this security is held as collateral for securities lending.
6 Also represents cost of investments for federal tax purposes.
7 Assets, other than investments in securities, less liabilities. See Statement of Assets and Liabilities.
Note: The categories of investments are shown as a percentage of total net assets at November 30, 2008.
Various inputs are used in determining the value of the Fund's investments. These inputs are summarized in the three broad levels listed below:
Level 1--quoted prices in active markets for identical securities
Level 2--other significant observable inputs (including quoted prices for similar securities, interest rates, prepayment speeds, credit risk, etc.)
Level 3--significant unobservable inputs (including the Fund's own assumptions in determining the fair value of investments)
The inputs or methodology used for valuing securities are not an indication of the risk associated with investing in those securities.
The following is a summary of the inputs used, as of November 30, 2008, in valuing the Fund's assets carried at fair value:
Valuation Inputs
|
| Investments
in Securities
|
| Other Financial
Instruments*
|
Level 1--Quoted Prices
|
| $126,896,272
|
| $ --
|
Level 2--Other Significant Observable Inputs
|
| 444,789,658
|
| 12,092,490
|
Level 3--Significant Unobservable Inputs
|
| - --
|
| - --
|
TOTAL
|
| $571,685,930
|
| $12,092,490
|
* Other financial instruments include foreign exchange contracts.
The following acronyms are used throughout this portfolio:
| ADR | - --American Depositary Receipt |
| GDR | - --Global Depositary Receipt |
See Notes which are an integral part of the Financial Statements
Statement of Assets and Liabilities
November 30, 2008
Assets:
| | | | | | | |
Total investments in securities, at value including $70,656,316 of investments in an affiliated issuer (Note 5) and $33,076,365 of securities loaned (identified cost $902,509,296)
| | | | | $ | 571,685,930 | |
Cash
| | | | | | 2,032,937 | |
Cash denominated in foreign currencies (identified cost $1,573,945)
| | | | | | 1,549,432 | |
Income receivable
| | | | | | 1,069,098 | |
Receivable for investments sold
| | | | | | 1,532,570 | |
Receivable for shares sold
| | | | | | 1,531,258 | |
Receivable for foreign exchange contracts
| | | | | | 13,546,136 | |
Other assets
|
|
|
|
|
| 25,512
|
|
TOTAL ASSETS
|
|
|
|
|
| 592,972,873
|
|
Liabilities:
| | | | | | | |
Payable for investments purchased
| | $ | 3,484,609 | | | | |
Payable for shares redeemed
| | | 3,060,203 | | | | |
Payable for collateral due to broker for securities loaned
| | | 39,547,898 | | | | |
Payable for Directors'/Trustees' fees
| | | 3,678 | | | | |
Payable for distribution services fee (Note 5)
| | | 48,252 | | | | |
Payable for shareholder services fee (Note 5)
| | | 10,717 | | | | |
Payable for foreign exchange contracts
| | | 1,453,646 | | | | |
Accrued expenses
|
|
| 415,859
|
|
|
|
|
TOTAL LIABILITIES
|
|
|
|
|
| 48,024,862
|
|
Net assets for 17,265,967 shares outstanding
|
|
|
|
| $
| 544,948,011
|
|
Net Assets Consist of:
| | | | | | | |
Paid-in capital
| | | | | $ | 1,032,217,360 | |
Net unrealized depreciation of investments and translation of assets and
liabilities in foreign currency
| |
| | | |
(318,745,845 | ) |
Accumulated net realized loss on investments and foreign currency transactions
| | | | | | (187,255,931 | ) |
Undistributed net investment income
|
|
|
|
|
| 18,732,427
|
|
TOTAL NET ASSETS
|
|
|
|
| $
| 544,948,011
|
|
Statement of Assets and Liabilities - continued
Net Asset Value, Offering Price and Redemption Proceeds Per Share
| | | | | | | |
Class A Shares:
| | | | | | | |
Net asset value per share ($382,446,825 ÷ 12,107,635 shares outstanding), no par value, unlimited shares authorized
|
|
|
|
|
| $31.59
|
|
Offering price per share (100/94.50 of $31.59) 1
|
|
|
|
|
| $33.43
|
|
Redemption proceeds per share (98.00/100 of $31.59) 1
|
|
|
|
|
| $30.96
|
|
Class B Shares:
| | | | | | | |
Net asset value per share ($17,343,930 ÷ 553,780 shares outstanding), no par value, unlimited shares authorized
|
|
|
|
|
| $31.32
|
|
Offering price per share
|
|
|
|
|
| $31.32
|
|
Redemption proceeds per share (92.50/100 of $31.32) 1
|
|
|
|
|
| $28.97
|
|
Class C Shares:
| | | | | | | |
Net asset value per share ($59,406,844 ÷ 1,897,532 shares outstanding), no par value, unlimited shares authorized
|
|
|
|
|
| $31.31
|
|
Offering price per share
|
|
|
|
|
| $31.31
|
|
Redemption proceeds per share (97.00/100 of $31.31) 1
|
|
|
|
|
| $30.37
|
|
Institutional Shares:
| | | | | | | |
Net asset value per share ($85,519,567 ÷ 2,699,680 shares outstanding), no par value, unlimited shares authorized
|
|
|
|
|
| $31.68
|
|
Offering price per share
|
|
|
|
|
| $31.68
|
|
Redemption proceeds per share (98.00/100 of $31.68) 1
|
|
|
|
|
| $31.05
|
|
Class K Shares:
| | | | | | | |
Net asset value per share ($230,845 ÷ 7,340 shares outstanding), no par value, unlimited shares authorized
|
|
|
|
|
| $31.45
|
|
Offering price per share
|
|
|
|
|
| $31.45
|
|
Redemption proceeds per share (98.00/100 of $31.45) 1
|
|
|
|
|
| $30.82
|
|
1 See "What Do Shares Cost?" in the Prospectus.
See Notes which are an integral part of the Financial Statements
Statement of Operations
Year Ended November 30, 2008
Investment Income:
| | | | | | | | | | | | |
Dividends (including $493,079 received from an affiliated issuer (Note 5) and net of foreign taxes withheld of $4,780,906)
| | | | | | | | | | $ | 32,267,953 | |
Interest (including income on securities loaned of $2,552,309)
|
|
|
|
|
|
|
|
|
|
| 2,614,303
|
|
TOTAL INCOME
|
|
|
|
|
|
|
|
|
|
| 34,882,256
|
|
Expenses:
| | | | | | | | | | | | |
Investment adviser fee (Note 5)
| | | | | | $ | 8,656,344 | | | | | |
Administrative personnel and services fee (Note 5)
| | | | | | | 686,474 | | | | | |
Custodian fees
| | | | | | | 812,951 | | | | | |
Transfer and dividend disbursing agent fees and expenses--Class A Shares
| | | | | | | 601,938 | | | | | |
Transfer and dividend disbursing agent fees and expenses--Class B Shares
| | | | | | | 49,868 | | | | | |
Transfer and dividend disbursing agent fees and expenses--Class C Shares
| | | | | | | 135,244 | | | | | |
Transfer and dividend disbursing agent fees and expenses--Institutional Shares
| | | | | | | 59,385 | | | | | |
Transfer and dividend disbursing agent fees and expenses--Class K Shares
| | | | | | | 273 | | | | | |
Directors'/Trustees' fees
| | | | | | | 12,177 | | | | | |
Auditing fees
| | | | | | | 40,500 | | | | | |
Legal fees
| | | | | | | 44,475 | | | | | |
Portfolio accounting fees
| | | | | | | 97,755 | | | | | |
Distribution services fee--Class B Shares
| | | | | | | 207,511 | | | | | |
Distribution services fee--Class C Shares
| | | | | | | 643,236 | | | | | |
Distribution services fee--Class K Shares
| | | | | | | 445 | | | | | |
Shareholder services fee--Class A Shares
| | | | | | | 1,552,315 | | | | | |
Shareholder services fee--Class B Shares
| | | | | | | 69,170 | | | | | |
Shareholder services fee--Class C Shares
| | | | | | | 208,373 | | | | | |
Account administration fee--Class A Shares
| | | | | | | 42,095 | | | | | |
Account administration fee--Class C Shares
| | | | | | | 227 | | | | | |
Share registration costs
| | | | | | | 187,159 | | | | | |
Printing and postage
| | | | | | | 107,451 | | | | | |
Insurance premiums
| | | | | | | 5,951 | | | | | |
Taxes
| | | | | | | 600 | | | | | |
Miscellaneous
|
|
|
|
|
|
| 12,251
|
|
|
|
|
|
TOTAL EXPENSES
|
|
|
|
|
|
| 14,234,168
|
|
|
|
|
|
Statement of Operations - continued
Waivers and Reimbursements (Note 5):
| | | | | | | | | | | | |
Waiver/reimbursement of investment adviser fee
| | $ | (664,468 | ) | | | | | | | | |
Waiver of administrative personnel and services fee
| | | (17,615 | ) | | | | | | | | |
Reimbursement of transfer and dividend disbursing agent fees and expenses--Class B Shares
| | | (10,546 | ) | | | | | | | | |
Reimbursement of transfer and dividend disbursing agent fees and expenses--Class C Shares
| | | (16,155 | ) | | | | | | | | |
Reimbursement of transfer and dividend disbursing agent fees and expenses--Institutional Shares
|
|
| (1,854
| )
|
|
|
|
|
|
|
|
|
TOTAL WAIVERS AND REIMBURSEMENTS
|
|
|
|
|
| $
| (710,638
| )
|
|
|
|
|
Net expenses
|
|
|
|
|
|
|
|
|
| $
| 13,523,530
|
|
Net investment income
|
|
|
|
|
|
|
|
|
|
| 21,358,726
|
|
Realized and Unrealized Loss on Investments and Foreign Currency Transactions:
| | | | | | | | | | | | |
Net realized loss on investments and foreign currency transactions
| | | | | | | | | | | (189,751,662 | ) |
Net change in unrealized appreciation of investments and translation of assets and liabilities in foreign currency
|
|
|
|
|
|
|
|
|
|
| (421,982,722
| )
|
Net realized and unrealized loss on investments and foreign currency transactions
|
|
|
|
|
|
|
|
|
|
| (611,734,384
| )
|
CHANGE IN NET ASSETS RESULTING FROM OPERATIONS
|
|
|
|
|
|
|
|
|
| $
| (590,375,658
| )
|
See Notes which are an integral part of the Financial Statements
Statement of Changes in Net Assets
|
|
| Year Ended
11/30/2008
|
|
|
| Period Ended
11/30/2007
| 1
|
|
| Year Ended
12/31/2006
|
|
Increase (Decrease) in Net Assets
| | | | | | | | | | | | |
Operations:
| | | | | | | | | | | | |
Net investment income
| | $ | 21,358,726 | | | $ | 4,764,203 | | | $ | 2,808,495 | |
Net realized gain (loss) on investments and foreign currency transactions
| | | (189,751,662 | ) | | | 20,167,305 | | | | 21,005,705 | |
Net change in unrealized appreciation/depreciation of investments and translation of assets and liabilities in foreign currency
|
|
| (421,982,722
| )
|
|
| 44,975,947
|
|
|
| 34,076,774
|
|
CHANGE IN NET ASSETS RESULTING FROM OPERATIONS
|
|
| (590,375,658
| )
|
|
| 69,907,455
|
|
|
| 57,890,974
|
|
Distributions to Shareholders:
| | | | | | | | | | | | |
Distributions from net investment income
| | | | | | | | | | | | |
Class A Shares
| | | (3,701,166 | ) | | | - -- | | | | (2,997,359 | ) |
Class B Shares
| | | (80,443 | ) | | | - -- | | | | - -- | |
Class C Shares
| | | (226,848 | ) | | | - -- | | | | - -- | |
Institutional Shares
| | | (292,158 | ) | | | - -- | | | | - -- | |
Class K Shares
| | | (164 | ) | | | - -- | | | | - -- | |
Distributions from net realized gain on investments and foreign currency transactions
| | | | | | | | | | | | |
Class A Shares
| | | (18,706,692 | ) | | | - -- | | | | (2,657,257 | ) |
Class B Shares
| | | (474,412 | ) | | | - -- | | | | - -- | |
Class C Shares
| | | (1,284,669 | ) | | | - -- | | | | - -- | |
Institutional Shares
| | | (1,301,122 | ) | | | - -- | | | | - -- | |
Class K Shares
|
|
| (984
| )
|
|
| - --
|
|
|
| - --
|
|
CHANGE IN NET ASSETS RESULTING FROM DISTRIBUTIONS TO SHAREHOLDERS
|
|
| (26,068,658
| )
|
|
| - --
|
|
|
| (5,654,616
| )
|
Share Transactions:
| | | | | | | | | | | | |
Proceeds from sale of shares
| | | 716,742,169 | | | | 280,132,091 | | | | 100,119,871 | |
Proceeds from shares issued in connection with the tax-free transfer of assets from Federated International Capital Appreciation Fund
| | | 162,229,186 | | | | - -- | | | | - -- | |
Net asset value of shares issued to shareholders in payment of distributions declared
| | | 22,384,808 | | | | - -- | | | | 5,301,119 | |
Cost of shares redeemed
|
|
| (330,206,624
| )
|
|
| (33,480,584
| )
|
|
| (19,183,424
| )
|
CHANGE IN NET ASSETS RESULTING FROM SHARE TRANSACTIONS
|
|
| 571,149,539
|
|
|
| 246,651,507
|
|
|
| 86,237,566
|
|
Redemption Fees
|
|
| 83,901
|
|
|
| 4,510
|
|
|
| 24,637
|
|
Change in net assets
|
|
| (45,210,876
| )
|
|
| 316,563,472
|
|
|
| 138,498,561
|
|
Net Assets:
| | | | | | | | | | | | |
Beginning of period
|
|
| 590,158,887
|
|
|
| 273,595,415
|
|
|
| 135,096,854
|
|
End of period (including undistributed net investment income of $18,732,427, $4,171,070 and $55,980, respectively)
|
| $
| 544,948,011
|
|
| $
| 590,158,887
|
|
| $
| 273,595,415
|
|
1 Reflects operations for the period from January 1, 2007 to November 30, 2007.
See Notes which are an integral part of the Financial Statements.
Notes to Financial Statements
November 30, 2008
1. ORGANIZATION
Federated Equity Funds (the "Trust") is registered under the Investment Company Act of 1940, as amended (the "Act"), as an open-end management investment company. The Trust consists of 10 diversified portfolios. The financial statements included herein are only those of Federated InterContinental Fund (the "Fund"). The financial statements of the other portfolios are presented separately. The assets of each portfolio are segregated and a shareholder's interest is limited to the portfolio in which shares are held. Each portfolio pays its own expenses. The Fund offers five classes of shares: Class A Shares, Class B Shares, Class C Shares, Institutional Shares and Class K Shares. All shares of the Fund have equal rights with respect to voting, except on class-specific matters. The financial highlights of the Institutional Shares are presented separately. The investment objective of the Fund is to seek long-term capital appreciation.
Rochdale Atlas Portfolio (the "Predecessor Fund") was reorganized into the Fund as of the close of business on August 24, 2007. Prior to the reorganization, the Fund had no investment operations. The Fund is the successor to the Predecessor Fund, which commenced operations on October 2, 1998. The Fund changed its fiscal year end from December 31 to November 30.
Effective August 24, 2007, the Fund began offering Class B Shares, Class C Shares, Institutional Shares and Class K Shares.
On January 25, 2008, the Fund received assets from Federated International Capital Appreciation Fund as the result of a tax-free reorganization, as follows:
Shares of the
Fund Issued
|
| Federated
International
Capital
Appreciation
Fund Net Assets
Received
|
| Unrealized
Depreciation 1
|
| Net Assets
of the Fund
Immediately
Prior to
Combination
|
| Net Assets of
Federated
International
Capital
Appreciation
Fund
Immediately
Prior to
Combination
|
| Net Assets
of the Fund
Immediately
After
Combination
|
2,814,492
|
| $162,229,186
|
| $(2,929,080)
|
| $599,246,970
|
| $162,229,186
|
| $761,476,156
|
1 Unrealized Depreciation is included in the Federated International Capital Appreciation Fund Net Assets Received amount shown above.
2. SIGNIFICANT ACCOUNTING POLICIES
The following is a summary of significant accounting policies consistently followed by the Fund in the preparation of its financial statements. These policies are in conformity with generally accepted accounting principles (GAAP) in the United States of America.
Investment Valuation
In calculating its net asset value (NAV), the Fund generally values investments as follows:
- Equity securities listed on an exchange or traded through a regulated market system are valued at their last reported sale price or official closing price on their principal exchange or market.
- Shares of other mutual funds are valued based upon their reported NAVs.
- Fixed-income securities acquired with remaining maturities greater than 60 days are fair valued using price evaluations provided by a pricing service approved by the Board of Trustees (the "Trustees").
- Fixed-income securities acquired with remaining maturities of 60 days or less are valued at their cost (adjusted for the accretion of any discount or amortization of any premium).
- Derivative contracts listed on exchanges are valued at their reported settlement or closing price.
- Over-the-counter (OTC) derivative contracts are fair valued using price evaluations provided by a pricing service approved by the Trustees.
If the Fund cannot obtain a price or price evaluation from a pricing service for an investment, the Fund may attempt to value the investment based upon the mean of bid and asked quotations or fair value the investment based on price evaluations, from one or more dealers. If any price, quotation, price evaluation or other pricing source is not readily available when the NAV is calculated, the Fund uses the fair value of the investment determined in accordance with the procedures described below. There can be no assurance that the Fund could purchase or sell an investment at the price used to calculate the Fund's NAV.
Fair Valuation and Significant Events Procedures
The Trustees have authorized the use of pricing services to provide evaluations of the current fair value of certain investments for purposes of calculating the NAV. Factors considered by pricing services in evaluating an investment include the yields or prices of investments of comparable quality, coupon, maturity, call rights and other potential prepayments, terms and type, reported transactions, indications as to values from dealers and general market conditions. Some pricing services provide a single price evaluation reflecting the bid-side of the market for an investment (a "bid" evaluation). Other pricing services offer both bid evaluations and price evaluations indicative of a price between the prices bid and asked for the investment (a "mid" evaluation). The Fund normally uses bid evaluations for U.S. Treasury and Agency securities, mortgage-backed securities and municipal securities. The Fund normally uses mid evaluations for other types of fixed-income securities and OTC derivative contracts. In the event that market quotations and price evaluations are not available for an investment, the fair value of the investment is determined in accordance with procedures adopted by the Trustees.
The Trustees also have adopted procedures requiring an investment to be priced at its fair value whenever the Adviser determines that a significant event affecting the value of the investment has occurred between the time as of which the price of the investment would otherwise be determined and the time as of which the NAV is computed. An event is considered significant if there is both an affirmative expectation that the investment's value will change in response to the event and a reasonable basis for quantifying the resulting change in value. Examples of significant events that may occur after the close of the principal market on which a security is traded, or after the time of a price evaluation provided by a pricing service or a dealer, include:
- With respect to securities traded in foreign markets, significant trends in U.S. equity markets or in the trading of foreign securities index futures or options contracts;
- With respect to price evaluations of fixed-income securities determined before the close of regular trading on the NYSE, actions by the Federal Reserve Open Market Committee and other significant trends in U.S. fixed-income markets;
- Political or other developments affecting the economy or markets in which an issuer conducts its operations or its securities are traded; and
- Announcements concerning matters such as acquisitions, recapitalizations, litigation developments, a natural disaster affecting the issuer's operations or regulatory changes or market developments affecting the issuer's industry.
The Trustees have approved the use of a pricing service to determine the fair value of equity securities traded principally in foreign markets when the Adviser determines that there has been a significant trend in the U.S. equity markets or in index futures trading. For other significant events, the Fund may seek to obtain more current quotations or price evaluations from alternative pricing sources. If a reliable alternative pricing source is not available, the Fund will determine the fair value of the investment using another method approved by the Trustees.
Repurchase Agreements
It is the policy of the Fund to require the other party to a repurchase agreement to transfer to the Fund's custodian or sub-custodian eligible securities or cash with a market value (after transaction costs) at least equal to the repurchase price to be paid under the repurchase agreement. The eligible securities are transferred to accounts with the custodian or sub-custodian in which the Fund holds a "securities entitlement" and exercises "control" as those terms are defined in the Uniform Commercial Code. The Fund has established procedures for monitoring the market value of the transferred securities and requiring the transfer of additional eligible securities if necessary to equal at least the repurchase price. These procedures also allow the other party to require securities to be transferred from the account to the extent that their market value exceeds the repurchase price or in exchange for other eligible securities of equivalent market value.
With respect to agreements to repurchase U.S. government securities and cash items, the Fund treats the repurchase agreement as an investment in the underlying securities and not as an obligation of the other party to the repurchase agreement. Other repurchase agreements are treated as obligations of the other party secured by the underlying securities. Nevertheless, the insolvency of the other party or other failure to repurchase the securities may delay the disposition of the underlying securities or cause the Fund to receive less than the full repurchase price. Under the terms of the repurchase agreement, any amounts received by the Fund in excess of the repurchase price and related transaction costs must be remitted to the other party.
The Fund may enter into repurchase agreements in which eligible securities are transferred into joint trading accounts maintained by the custodian or sub-custodian for investment companies and other clients advised by the Fund's Adviser and its affiliates. The Fund will participate on a pro rata basis with the other investment companies and clients in its share of the securities transferred under such repurchase agreements and in its share of proceeds from any repurchase or other disposition of such securities.
Investment Income, Gains and Losses, Expenses and Distributions
Interest income and expenses are accrued daily. Dividend income and distributions to shareholders are recorded on the ex-dividend date. Foreign dividends are recorded on the ex-dividend date or when the Fund is informed of the ex-dividend date. Distributions of net investment income are declared and paid annually. Non-cash dividends included in dividend income, if any, are recorded at fair value. Investment income, realized and unrealized gains and losses and certain fund-level expenses are allocated to each class based on relative average daily net assets, except that Class A Shares, Class B Shares, Class C Shares, Institutional Shares and Class K Shares may bear distribution services fees, shareholder services fees, account administration fees and certain transfer and dividend disbursing agent fees unique to those classes. Dividends are declared separately for each class. No class has preferential dividend rights; differences in per share dividend rates are generally due to differences in separate class expenses.
Premium and Discount Amortization
All premiums and discounts on fixed-income securities are amortized/accreted for financial statement purposes.
Federal Taxes
It is the Fund's policy to comply with the Subchapter M provision of the Internal Revenue Code (the "Code") and to distribute to shareholders each year substantially all of its income. Accordingly, no provision for federal income tax is necessary. The Fund adopted the provisions of Financial Accounting Standards Board (FASB) Interpretation No. 48 (FIN 48), "Accounting for Uncertainty in Income Taxes," on December 1, 2007. As of and during the year ended November 30, 2008, the Fund did not have a liability for any unrecognized tax expenses. The Fund recognizes interest and penalties, if any, related to tax liabilities as income tax expense in the Statement of Operations. As of November 30, 2008, tax years 2005 through 2008 remain subject to examination by the Fund's major tax jurisdictions, which include the United States of America and the commonwealth of Massachusetts.
Withholding taxes and where appropriate, deferred withholding taxes on foreign interest, dividends and capital gains have been provided for in accordance with the applicable country's tax rules and rates.
When-Issued and Delayed Delivery Transactions
The Fund may engage in when-issued or delayed delivery transactions. The Fund records when-issued securities on the trade date and maintains security positions such that sufficient liquid assets will be available to make payment for the securities purchased. Securities purchased on a when-issued or delayed delivery basis are marked to market daily and begin earning interest on the settlement date. Losses may occur on these transactions due to changes in market conditions or the failure of counterparties to perform under the contract.
Foreign Exchange Contracts
The Fund may enter into foreign exchange contracts for the delayed delivery of securities or foreign currency exchange transactions. The Fund may enter into foreign exchange contracts to protect assets against adverse changes in foreign currency exchange rates or exchange control regulations. Purchased contracts are used to acquire exposure to foreign currencies, whereas, contracts to sell are used to hedge the Fund's securities against currency fluctuations. Risks may arise upon entering into these transactions from the potential inability of counterparties to meet the terms of their commitments and from unanticipated movements in security prices or foreign exchange rates. The foreign exchange contracts are adjusted by the daily exchange rate of the underlying currency and any gains or losses are recorded for financial statement purposes as unrealized until the settlement date.
Foreign exchange contracts outstanding at period end are listed after the Fund's portfolio of investments.
Foreign Currency Translation
The accounting records of the Fund are maintained in U.S. dollars. All assets and liabilities denominated in foreign currencies (FCs) are translated into U.S. dollars based on the rates of exchange of such currencies against U.S. dollars on the date of valuation. Purchases and sales of securities, income and expenses are translated at the rate of exchange quoted on the respective date that such transactions are recorded. The Fund does not isolate that portion of the results of operations resulting from changes in foreign exchange rates on investments from the fluctuations arising from changes in market prices of securities held. Such fluctuations are included with the net realized and unrealized gain or loss from investments.
Reported net realized foreign exchange gains or losses arise from sales of portfolio securities, sales and maturities of short-term securities, sales of FCs, currency gains or losses realized between the trade and settlement dates on securities transactions, the difference between the amounts of dividends, interest and foreign withholding taxes recorded on the Fund's books and the U.S. dollar equivalent of the amounts actually received or paid. Net unrealized foreign exchange gains and losses arise from changes in the value of assets and liabilities other than investments in securities at fiscal year end, resulting from changes in the exchange rate.
Securities Lending
The Fund participates in a securities lending program providing for the lending of equity securities to qualified brokers. The Fund normally receives cash collateral for securities loaned that is invested in an affiliated money market fund. Collateral is maintained at a minimum level of 100% of the market value of investments loaned, plus interest, if applicable. Earnings on collateral are allocated between the securities lending agent, as a fee for its services under the program, and the Fund, according to agreed-upon rates.
As of November 30, 2008, securities subject to this type of arrangement and related collateral were as follows:
Market Value of
Securities Loaned
|
| Market Value
of Collateral
|
$33,076,365
|
| $39,547,898
|
Use of Estimates
The preparation of financial statements in conformity with GAAP requires management to make estimates and assumptions that affect the amounts of assets, liabilities, expenses and revenues reported in the financial statements. Actual results could differ from those estimated.
Other
Investment transactions are accounted for on a trade-date basis. Realized gains and losses from investment transactions are recorded on an identified-cost basis.
3. SHARES OF BENEFICIAL INTEREST
The following tables summarize share activity:
|
| Year Ended
11/30/2008
|
| Period Ended
11/30/2007 1
|
| Year Ended
12/31/2006
|
Class A Shares:
|
| Shares
|
|
|
| Amount
|
|
| Shares
|
|
|
| Amount
|
|
| Shares
|
|
|
| Amount
|
|
Shares sold
| | 7,427,045 | | | $ | 430,063,821 | | | 3,112,130 | | | $ | 209,137,003 | | | 1,997,292 | | | $ | 100,119,871 | |
Shares issued in connection
with tax-free transfer of assets from Federated
International
Capital Appreciation Fund
| | 1,892,702 | | | | 109,171,066 | | | - -- | | | | - -- | | | - -- | | | | - -- | |
Shares issued to shareholders in
payment of distributions declared
|
| 303,544 |
| | |
20,003,546 |
| | - -- | | | | - -- |
| | 94,849 |
| | | 5,301,119 |
|
Shares redeemed
|
| (4,908,680
| )
|
|
| (237,550,747
| )
|
| (520,500
| )
|
|
| (33,177,380
| )
|
| (382,667
| )
|
|
| (19,183,424
| )
|
NET CHANGE RESULTING FROM CLASS A SHARE TRANSACTIONS
|
| 4,714,611
|
|
| $
| 321,687,686
|
|
| 2,591,630
|
|
| $
| 175,959,623
|
|
| 1,709,474
|
|
| $
| 86,237,566
|
|
| | | | | | | | | | | | | | | | | | | | | |
|
| Year Ended
11/30/2008
|
| Period Ended
11/30/2007 1,2
|
| Year Ended
12/31/2006
|
Class B Shares:
|
| Shares
|
|
|
| Amount
|
|
| Shares
|
|
|
| Amount
|
|
| Shares
|
|
|
| Amount
|
|
Shares sold
| | 328,932 | | | $ | 19,496,392 | | | 162,097 | | | $ | 11,433,491 | | | - -- | | | $ | - -- | |
Shares issued in connection
with tax-free
transfer of assets from Federated
International Capital
Appreciation Fund
| | 281,322 | | | | 16,199,198 | | | - -- | | | | - -- | | | - -- | | | | - -- | |
Shares issued to shareholders
in payment
of distributions declared
|
| 7,140 |
| | | 469,898 |
| | - -- | | | | - -- |
| | - -- |
| | | - -- |
|
Shares redeemed
|
| (224,575
| )
|
|
| (11,644,527
| )
|
| (1,136
| )
|
|
| (80,072
| )
|
| - --
|
|
|
| - --
|
|
NET CHANGE RESULTING FROM CLASS B SHARE TRANSACTIONS
|
| 392,819
|
|
| $
| 24,520,961
|
|
| 160,961
|
|
| $
| 11,353,419
|
|
| - --
|
|
| $
| - --
|
|
|
| Year Ended
11/30/2008
|
| Period Ended
11/30/2007 1,2
|
| Year Ended
12/31/2006
|
Class C Shares:
|
| Shares
|
|
|
| Amount
|
|
| Shares
|
|
|
| Amount
|
|
| Shares
|
|
|
| Amount
|
|
Shares sold
| | 1,422,380 | | | $ | 83,483,147 | | | 428,876 | | | $ | 30,652,911 | | | - -- | | | $ | - -- | |
Shares issued in connection
with tax-free transfer
of assets from Federated
International
Capital Appreciation Fund
| | 640,468 | | | | 36,858,922 | | | - -- | | | | - -- | | | - -- | | | | - - | |
Shares issued to shareholders in payment
of distributions declared
|
| 16,332 | | | | 1,074,452 |
| | - -- | | | | - -- |
| | - -- |
| | | - -- |
|
Shares redeemed
|
| (607,899
| )
|
|
| (29,661,822
| )
|
| (2,625
| )
|
|
| (190,234
| )
|
| - --
|
|
|
| - --
|
|
NET CHANGE RESULTING FROM
CLASS C SHARE TRANSACTIONS
|
| 1,471,281
|
|
| $
| 91,754,699
|
|
| 426,251
|
|
| $
| 30,462,677
|
|
| - --
|
|
| $
| - --
|
|
| | | | | | | | | | | | | | | | | | | | | |
|
| Year Ended
11/30/2008
|
| Period Ended
11/30/2007 1,2
|
| Year Ended
12/31/2006
|
Institutional Shares:
|
| Shares
|
|
|
| Amount
|
|
| Shares
|
|
|
| Amount
|
|
| Shares
|
|
|
| Amount
|
|
Shares sold
| | 3,273,487 | | | $ | 183,352,416 | | | 413,522 | | | $ | 28,888,484 | | | - -- | | | $ | - -- | |
Shares issued to shareholders
in payment
of distributions declared
|
| 12,687 |
| | | 835,966 |
| | - -- | | | | - -- |
| | - -- |
| | | - -- |
|
Shares redeemed
|
| (999,537
| )
|
|
| (51,319,635
| )
|
| (479
| )
|
|
| (32,798
| )
|
| - --
|
|
|
| - --
|
|
NET CHANGE RESULTING FROM
INSTITUTIONAL SHARE TRANSACTIONS
|
| 2,286,637
|
|
| $
| 132,868,747
|
|
| 413,043
|
|
| $
| 28,855,686
|
|
| - --
|
|
| $
| - --
|
|
| | | | | | | | | | | | | | | | | | | | | |
|
| Year Ended
11/30/2008
|
| Period Ended
11/30/2007 1,2
|
| Year Ended
12/31/2006
|
Class K Shares:
|
| Shares
|
|
|
| Amount
|
|
| Shares
|
|
|
| Amount
|
|
| Shares
|
|
|
| Amount
|
|
Shares sold
| | 7,581 | | | $ | 346,393 | | | 329 | | | $ | 20,202 | | | - -- | | | $ | - -- | |
Shares issued to shareholders in payment of distributions declared
|
| 15 |
| | | 946 |
| | - -- | | | | - -- |
| | - -- |
| | | - -- |
|
Shares redeemed
|
| (575
| )
|
|
| (29,893
| )
|
| (10
| )
|
|
| (100
| )
|
| - --
|
|
|
| - --
|
|
NET CHANGE RESULTING FROM CLASS K SHARE TRANSACTIONS
|
| 7,021
|
|
| $
| 317,446
|
|
| 319
|
|
| $
| 20,102
|
|
| - --
|
|
| $
| - --
|
|
NET CHANGE RESULTING FROM SHARE TRANSACTIONS
|
| 8,872,369
|
|
| $
| 571,149,539
|
|
| 3,592,204
|
|
| $
| 246,651,507
|
|
| 1,709,474
|
|
| $
| 86,237,566
|
|
1 The Fund changed its fiscal year end from December 31 to November 30.
2 Reflects operations for the period from August 25, 2007 (start of performance) to November 30, 2007.
Redemption Fees
The Fund imposes a 2.00% redemption fee to shareholders of the Fund's Class A Shares, Class B Shares, Class C Shares, Institutional Shares and Class K Shares who redeem shares held for 30 days or less. Shares acquired by reinvestment of dividends or distributions of the Fund, or purchased pursuant to the Systematic Investment Program or withdrawn pursuant to the Systematic Withdrawal Program, will not be subject to the redemption fee. All redemption fees are recorded by the Fund as additions to paid-in capital. For the year ended November 30, 2008, the redemption fees for Class A Shares, Class B Shares, Class C Shares, Institutional Shares and Class K Shares amounted to $60,321, $2,801, $8,688, $12,079 and $12, respectively. For the period ended November 30, 2007, the redemption fees for Class A Shares amounted to $4,510. For the year ended December 31, 2006, the redemption fees for Class A Shares amounted to $24,637.
4. FEDERAL TAX INFORMATION
The timing and character of income and capital gain distributions are determined in accordance with income tax regulations, which may differ from GAAP. These differences are due in part to differing treatments for foreign currency transactions and litigation payments.
For the year ended November 30, 2008, permanent differences identified and reclassified among the components of net assets were as follows:
Increase (Decrease)
|
Undistributed
Net Investment
Income (Loss)
|
| Accumulated
Net Realized
Gain (Loss)
|
$(2,496,590)
|
| $2,496,590
|
Net investment income (loss), net realized gains (losses) and net assets were not affected by this reclassification.
The tax character of distributions as reported on the Statement of Changes in Net Assets for the year ended November 30, 2008, the period ended November 30, 2007 and the year ended December 31, 2006, was as follows:
|
| 2008
|
| 2007
|
| 2006
|
Ordinary income 1
|
| $ 8,060,864
|
| - --
|
| $2,997,359
|
Long-term capital gains
|
| $18,007,794
|
| - --
|
| $2,657,257
|
1 For tax purposes, short-term capital gain distributions are considered ordinary income distributions.
As of November 30, 2008, the components of distributable earnings on a tax basis were as follows:
Undistributed ordinary income
|
| $
| 30,824,916
|
|
Net unrealized depreciation
|
| $
| (330,838,334
| )
|
Capital loss carryforwards
|
| $
| (187,255,931
| )
|
At November 30, 2008, the cost of investments for federal tax purposes was $902,509,296. The net unrealized depreciation of investments for federal tax purposes excluding any unrealized depreciation resulting from changes in foreign currency exchange rates and outstanding foreign currency commitments was $330,823,366. This consists of net unrealized appreciation from investments for those securities having an excess of value over cost of $4,365,742 and net unrealized depreciation from investments for those securities having an excess of cost over value of $335,189,108.
At November 30, 2008, the Fund had a capital loss carryforward of $187,255,931 which will reduce the Fund's taxable income arising from future net realized gains on investments, if any, to the extent permitted by the Code and thus will reduce the amount of distributions to shareholders which would otherwise be necessary to relieve the Fund of any liability for federal income tax. Pursuant to the Code, such capital loss carryforward will expire in 2016.
5. INVESTMENT ADVISER FEE AND OTHER TRANSACTIONS WITH AFFILIATES
Investment Adviser Fee
Federated Global Investment Management Corp. is the Fund's investment adviser (the "Adviser"). The advisory agreement between the Fund and the Adviser provides for an annual fee equal to 1.00% of the Fund's average daily net assets. Under the investment advisory contract, which is subject to annual review by the Trustees, the Adviser will waive all or a portion of the advisory fee (excluding interest, taxes and brokerage commissions) in order to contractually limit the Fund's Class A Shares aggregate annual operating expenses to no more than 1.70% based on average daily net assets. The Adviser agreed to keep this contractual limitation in place through August 24, 2009.
In addition, after fulfilling its contractual commitment and subject to the terms described in the Expense Limitation note, the Adviser may voluntarily choose to waive any portion of its fee. The Adviser can modify or terminate this voluntary waiver at any time at its sole discretion. For the year ended November 30, 2008, the Adviser voluntarily waived $580,595 of its fee. In addition, an affiliate of the adviser reimbursed $28,555 of transfer and dividend disbursing agent fees and expenses.
Prior to close of business on August 24, 2007, the Predecessor Fund's investment adviser was Rochdale Investment Management LLC. After the close of business on August 24, 2007, the Predecessor Fund was reorganized into the Fund. The annual rate did not change due to this reorganization. For the period from January 1, 2007 to August 24, 2007, the net fee paid to Rochdale Investment Management LLC was $2,092,602.
Administrative Fee
Federated Administrative Services (FAS), under the Administrative Services Agreement, provides the Fund with administrative personnel and services. The fee paid to FAS is based on the average aggregate daily net assets of certain Federated funds as specified below:
Administrative Fee
|
| Average Aggregate Daily Net Assets
of the Federated Funds
|
0.150%
|
| on the first $5 billion
|
0.125%
|
| on the next $5 billion
|
0.100%
|
| on the next $10 billion
|
0.075%
|
| on assets in excess of $20 billion
|
The administrative fee received during any fiscal year shall be at least $150,000 per portfolio and $40,000 per each additional class of Shares. Subject to the terms described in the Expense Limitation note, FAS may voluntarily choose to waive any portion of its fee. FAS can modify or terminate this voluntary waiver at any time at its sole discretion. For the year ended November 30, 2008, the net fee paid to FAS was 0.077% of average daily net assets of the Fund. FAS waived $17,615 of its fee.
Prior to close of business on August 24, 2007, U.S. Bancorp Fund Services, LLC provided administrative services to the Predecessor Fund. For the period from January 1, 2007 to August 24, 2007, the net fee paid to U.S. Bancorp Fund Services, LLC was $127,670.
Distribution Services Fee
The Fund has adopted a Distribution Plan (the "Plan") pursuant to Rule 12b-1 under the Act. Under the terms of the Plan, the Fund will compensate Federated Securities Corp. (FSC), the principal distributor, from the daily net assets of the Fund's Class A Shares, Class B Shares, Class C Shares and Class K Shares to finance activities intended to result in the sale of these shares. The Plan provides that the Fund may incur distribution expenses at the following percentages of average daily net assets annually, to compensate FSC:
Share Class Name
|
| Percentage of Average Daily
Net Assets of Class
|
Class A Shares
|
| 0.05%
|
Class B Shares
|
| 0.75%
|
Class C Shares
|
| 0.75%
|
Class K Shares
|
| 0.50%
|
Subject to the terms described in the Expense Limitation note, FSC may voluntarily choose to waive any portion of its fee. FSC can modify or terminate this voluntary waiver at any time at its sole discretion. When FSC receives fees, it may pay some or all of them to financial intermediaries whose customers purchase shares. For the year ended November 30, 2008, FSC retained $2,718 of fees paid by the Fund.
On November 15, 2007, the Fund's Trustees approved an amendment to the Plan to reduce the distribution services fee for the Fund's Class A Shares from 0.25% to 0.05%. The amendment to the Plan became effective for the Fund's Class A Shares on January 1, 2008. For the year ended November 30, 2008, the Fund's Class A Shares did not incur a distribution services fee.
Prior to close of business on August 24, 2007, Rochdale Investment Management LLC was the principal distributor for the Predecessor Fund. For the period from January 1, 2007 to August 24, 2007, the net fee paid to Rochdale Investment Management LLC was $523,150.
Sales Charges
For the year ended November 30, 2008, FSC retained $179,230 in sales charges from the sale of Class A Shares. FSC also retained $5,269 of contingent deferred sales charges relating to redemptions of Class A Shares and $22,794 relating to redemptions of Class C Shares. See "What Do Shares Cost?" in the Prospectus.
For the period from August 25, 2007 to November 30, 2007, FSC retained $143,596 in sales charges from the sale of Class A Shares. FSC also retained $171 of contingent deferred sales charges relating to redemptions of Class C Shares.
Prior to close of business on August 24, 2007, RIM Securities LLC, an affiliate of Rochdale Investment Management LLC, served as distributor of the Predecessor Fund's shares. For the period from January 1, 2007 to August 24, 2007, RIM Securities LLC retained $12,304 in sales charges from the sale of the Predecessor Fund's shares.
Shareholder Services Fee
The Fund may pay fees (Service Fees) up to 0.25% of the average daily net assets of the Fund's Class A Shares, Class B Shares and Class C Shares to financial intermediaries or to Federated Shareholder Services Company (FSSC) for providing services to shareholders and maintaining shareholder accounts. Financial intermediaries may include a company affiliated with management of Federated Investors, Inc. A financial intermediary affiliated with management of Federated Investors, Inc. received $57,619 of Service Fees for the year ended November 30, 2008. Subject to the terms described in the Expense Limitation note, FSSC may voluntarily reimburse the Fund for shareholder services fees. This voluntary reimbursement can be modified or terminated at any time. For the year ended November 30, 2008, FSSC did not receive any fees paid by the Fund.
Expense Limitation
The Adviser and its affiliates (which may include FSC, FAS and FSSC) have voluntarily agreed to waive their fees and/or reimburse expenses so that the total operating expenses (as shown in the financial highlights) paid by the Fund's Class A Shares, Class B Shares, Class C Shares, Institutional Shares and Class K Shares (after the voluntary waivers and reimbursements) will not exceed 1.50%, 2.29%, 2.28%, 1.19% and 1.95%, respectively, for the fiscal year ending November 30, 2009. Although these actions are voluntary, the Adviser and its affiliates have agreed to continue these waivers and/or reimbursements at least through January 31, 2010.
General
Certain of the Officers and Trustees of the Fund are Officers and Directors or Trustees of the above companies.
Transactions with Affiliated Companies
Affiliated holdings are mutual funds which are managed by the Adviser or an affiliate of the Adviser. The Adviser has agreed to reimburse the Fund for certain investment adviser fees as a result of transactions in other affiliated mutual funds. For the year ended November 30, 2008, the Adviser reimbursed $83,873. Transactions with the affiliated company during the year ended November 30, 2008 were as follows:
Affiliate
|
| Balance of
Shares
Held
11/30/2007
|
| Purchases/
Additions
|
| Sales/
Reductions
|
| Balance of
Shares Held
11/30/2008
|
| Value
|
| Dividend
Income
|
Prime Value Obligations Fund, Institutional Shares
|
| 44,763,597
|
| 1,282,610,795
|
| 1,256,718,076
|
| 70,656,316
|
| $70,656,316
|
| $493,079
|
6. INVESTMENT TRANSACTIONS
Purchases and sales of investments, excluding long-term U.S. government securities and short-term obligations, for the year ended November 30, 2008, were as follows:
Purchases
|
| $
| 1,111,775,934
|
Sales
|
| $
| 547,100,947
|
7. CONCENTRATION OF RISK
The Fund invests in securities of non-U.S. issuers. Political or economic developments may have an effect on the liquidity and volatility of portfolio securities and currency holdings.
8. LINE OF CREDIT
The Fund participates in a $100,000,000 unsecured, uncommitted revolving line of credit (LOC) agreement with PNC Bank. The LOC was made available for extraordinary or emergency purposes, primarily for financing redemption payments. Borrowings are charged interest at a rate of 0.65% over the federal funds rate. As of November 30, 2008, there were no outstanding loans. During the year ended November 30, 2008, the Fund did not utilize the LOC.
9. INTERFUND LENDING
Pursuant to an Exemptive Order issued by the Securities and Exchange Commission (SEC), the Fund, along with other funds advised by subsidiaries of Federated Investors, Inc., may participate in an interfund lending program. This program provides an alternative credit facility allowing the funds to borrow from other participating affiliated funds. As of November 30, 2008, there were no outstanding loans. During the year ended November 30, 2008, the program was not utilized.
10. LEGAL PROCEEDINGS
Since October 2003, Federated Investors, Inc. and related entities (collectively, "Federated") and various Federated funds ("Federated Funds") have been named as defendants in several class action lawsuits now pending in the United States District Court for the District of Maryland. The lawsuits were purportedly filed on behalf of people who purchased, owned and/or redeemed shares of Federated-sponsored mutual funds during specified periods beginning November 1, 1998. The suits are generally similar in alleging that Federated engaged in illegal and improper trading practices including market timing and late trading in concert with certain institutional traders, which allegedly caused financial injury to the mutual fund shareholders. These lawsuits began to be filed shortly after Federated's first public announcement that it had received requests for information on shareholder trading activities in the Federated Funds from the SEC, the Office of the New York State Attorney General ("NYAG") and other authorities. In that regard, on November 28, 2005, Federated announced that it had reached final settlements with the SEC and the NYAG with respect to those matters. As Federated previously reported in 2004, it has already paid approximately $8.0 million to certain funds as determined by an independent consultant. As part of these settlements, Federated agreed to pay for the benefit of fund shareholders additional disgorgement and a civil money penalty in the aggregate amount of an additional $72 million. Federated entities have also been named as defendants in several additional lawsuits that are now pending in the United States District Court for the Western District of Pennsylvania, alleging, among other things, excessive advisory and Rule 12b-1 fees. The Board of the Federated Funds retained the law firm of Dickstein Shapiro LLP to represent the Federated Funds in these lawsuits. Federated and the Federated Funds and their respective counsel have been defending this litigation and none of the Federated Funds remains a defendant in any of the lawsuits (though some could potentially receive any recoveries as nominal defendants). Additional lawsuits based upon similar allegations may be filed in the future. The potential impact of these lawsuits, all of which seek unquantified damages, attorneys' fees and expenses, and future potential similar suits is uncertain. Although we do not believe that these lawsuits will have a material adverse effect on the Federated Funds, there can be no assurance that these suits, the ongoing adverse publicity and/or other developments resulting from the regulatory investigations will not result in increased Federated Fund redemptions, reduced sales of Federated Fund shares or other adverse consequences for the Federated Funds.
11. RECENT ACCOUNTING PRONOUNCEMENTS
In March 2008, FASB released Statement of Financial Accounting Standards No. 161, "Disclosures about Derivative Instruments and Hedging Activities" (FAS 161). FAS 161 requires qualitative disclosures about objectives and strategies for using derivatives, quantitative disclosures about fair value amounts of gains and losses on derivative instruments and disclosures about credit-risk-related contingent features in derivative agreements. FAS 161 is effective for fiscal years and interim periods beginning after November 15, 2008. At this time, management is evaluating the implications of adopting FAS 161 and its impact on the financial statements and the accompanying notes.
12. FEDERAL TAX INFORMATION (UNAUDITED)
For the year ended November 30, 2008, the amount of long-term capital gains designated by the Fund was $18,007,794.
For the fiscal year ended November 30, 2008, 99.86% of total ordinary income (including short-term capital gain) distributions made by the Fund are qualifying dividends which may be subject to a maximum tax rate of 15%, as provided for by the Jobs and Growth Tax Relief Act of 2003. Complete information is reported in conjunction with the reporting of your distributions on Form 1099-DIV.
To the extent the Fund meets the requirements of Section 853 of the Internal Revenue Code of 1986, as amended, the Fund will pass through to its shareholders credits for foreign taxes paid.
For the fiscal year ended November 30, 2008, the Fund derived $37,110,853 of gross income from foreign sources and paid foreign taxes of $4,780,906.
Report of Independent Registered Public Accounting Firm
TO THE BOARD OF TRUSTEES OF FEDERATED EQUITY FUNDS AND THE SHAREHOLDERS OF FEDERATED INTERCONTINENTAL FUND:
We have audited the accompanying statement of assets and liabilities, including the portfolio of investments, of the Federated InterContinental Fund (the "Fund"), a portfolio of Federated Equity Funds, as of November 30, 2008, and the related statement of operations for the year then ended, the statements of changes in net assets for each of the years or period in the two-year period then ended, and the financial highlights for each of the years or period in the two-year period then ended. These financial statements and financial highlights are the responsibility of the Fund's management. Our responsibility is to express an opinion on these financial statements and financial highlights based on our audits. The financial highlights for the periods presented prior to January 1, 2007, were audited by other independent registered public accountants whose report thereon dated February 26, 2007, expressed an unqualified opinion on those statements.
We conducted our audits in accordance with the standards of the Public Company Accounting Oversight Board (United States). Those standards require that we plan and perform the audit to obtain reasonable assurance about whether the financial statements and financial highlights are free of material misstatement. An audit includes examining, on a test basis, evidence supporting the amounts and disclosures in the financial statements. Our procedures included confirmation of securities owned as of November 30, 2008 by correspondence with the custodian and brokers. An audit also includes assessing the accounting principles used and significant estimates made by management, as well as evaluating the overall financial statement presentation. We believe that our audits provide a reasonable basis for our opinion.
In our opinion, the financial statements and financial highlights referred to above present fairly, in all material respects, the financial position of the Federated InterContinental Fund as of November 30, 2008, and the results of its operations for the year then ended, the changes in its net assets for each of the years in the two-year period then ended, and the financial highlights for each of the years or period in the two-year period then ended, in conformity with U.S. generally accepted accounting principles.
KPMG LLP
Boston, Massachusetts
January 23, 2009
Board of Trustees and Trust Officers
The Board is responsible for managing the Trust's business affairs and for exercising all the Trust's powers except those reserved for the shareholders. The following tables give information about each Board member and the senior officers of the Fund. Where required, the tables separately list Board members who are "interested persons" of the Fund (i.e., "Interested" Board members) and those who are not (i.e., "Independent" Board members). Unless otherwise noted, the address of each person listed is Federated Investors Tower, 1001 Liberty Avenue, Pittsburgh, PA 15222. The address of all Independent Board members listed is 4000 Ericsson Drive, Warrendale, PA 15086-7561; Attention: Mutual Fund Board. As of December 31, 2008, the Trust comprised eight portfolios, and the Federated Fund Complex consisted of 40 investment companies (comprising 149 portfolios). Unless otherwise noted, each Officer is elected annually. Unless otherwise noted, each Board member oversees all portfolios in the Federated Fund Complex and serves for an indefinite term. The Fund's Statement of Additional Information includes additional information about Trust Trustees and is available, without charge and upon request, by calling 1-800-341-7400.
INTERESTED TRUSTEES BACKGROUND
|
|
|
Name
Birth Date
Positions Held with Trust
Date Service Began
|
| Principal Occupation(s) for Past Five Years,
Other Directorships Held and Previous Position(s)
|
John F. Donahue*
Birth Date: July 28, 1924
TRUSTEE
Began serving: April 1984 | | Principal Occupations: Director or Trustee of the Federated Fund Complex; Chairman and Director, Federated Investors, Inc.; Chairman of the Federated Fund Complex's Executive Committee.
Previous Positions: Chairman of the Federated Fund Complex; Trustee, Federated Investment Management Company; Chairman and Director, Federated Investment Counseling. |
|
|
|
J. Christopher Donahue*
Birth Date: April 11, 1949
PRESIDENT AND TRUSTEE
Began serving: January 2000 | | Principal Occupations: Principal Executive Officer and President of the Federated Fund Complex; Director or Trustee of some of the Funds in the Federated Fund Complex; President, Chief Executive Officer and Director, Federated Investors, Inc.; Chairman and Trustee, Federated Investment Management Company; Trustee, Federated Investment Counseling; Chairman and Director, Federated Global Investment Management Corp.; Chairman, Federated Equity Management Company of Pennsylvania and Passport Research, Ltd. (investment advisory subsidiary of Federated); Trustee, Federated Shareholder Services Company; Director, Federated Services Company.
Previous Positions: President, Federated Investment Counseling; President and Chief Executive Officer, Federated Investment Management Company, Federated Global Investment Management Corp. and Passport Research, Ltd. |
|
|
|
* Family relationships and reasons for "interested" status: John F. Donahue is the father of J. Christopher Donahue; both are "interested" due to their beneficial ownership of shares of Federated Investors, Inc. and the positions they hold with Federated and its subsidiaries.
INDEPENDENT TRUSTEES BACKGROUND
|
|
|
Name
Birth Date
Positions Held with Trust
Date Service Began
|
| Principal Occupation(s) for Past Five Years,
Other Directorships Held and Previous Position(s)
|
Thomas G. Bigley
Birth Date: February 3, 1934
TRUSTEE
Began serving: October 1995 | | Principal Occupation: Director or Trustee of the Federated Fund Complex.
Other Directorships Held: Director, Member of Executive Committee, Children's Hospital of Pittsburgh; Director, University of Pittsburgh.
Previous Position: Senior Partner, Ernst & Young LLP. |
|
|
|
John T. Conroy, Jr.
Birth Date: June 23, 1937
TRUSTEE
Began serving: November 1991 | | Principal Occupations: Director or Trustee of the Federated Fund Complex; Chairman of the Board, Investment Properties Corporation; Partner or Trustee in private real estate ventures in Southwest Florida; Assistant Professor in Theology at Barry University and Blessed Edmund Rice School for Pastoral Ministry.
Previous Positions: President, Investment Properties Corporation; Senior Vice President, John R. Wood and Associates, Inc., Realtors; President, Naples Property Management, Inc. and Northgate Village Development Corporation. |
|
|
|
Nicholas P. Constantakis
Birth Date: September 3, 1939
TRUSTEE
Began serving: February 1998 | | Principal Occupation: Director or Trustee of the Federated Fund Complex.
Other Directorships Held: Director and Chairman of the Audit Committee, Michael Baker Corporation (engineering and energy services worldwide).
Previous Position: Partner, Andersen Worldwide SC. |
|
|
|
John F. Cunningham
Birth Date: March 5, 1943
TRUSTEE
Began serving: January 1999 | | Principal Occupations: Director or Trustee of the Federated Fund Complex.
Other Directorships Held: Chairman, President and Chief Executive Officer, Cunningham & Co., Inc. (strategic business consulting); Trustee Associate, Boston College.
Previous Positions: Director, QSGI, Inc. (technology services company); Director, Redgate Communications and EMC Corporation (computer storage systems); Chairman of the Board and Chief Executive Officer, Computer Consoles, Inc.; President and Chief Operating Officer, Wang Laboratories; Director, First National Bank of Boston; Director, Apollo Computer, Inc. |
|
|
|
|
|
|
Name
Birth Date
Positions Held with Trust
Date Service Began
|
| Principal Occupation(s) for Past Five Years,
Other Directorships Held and Previous Position(s)
|
Peter E. Madden
Birth Date: March 16, 1942
TRUSTEE
Began serving: November 1991 | | Principal Occupation: Director or Trustee of the Federated Fund Complex.
Other Directorships Held: Board of Overseers, Babson College.
Previous Positions: Representative, Commonwealth of Massachusetts General Court; President, State Street Bank and Trust Company and State Street Corporation (retired); Director, VISA USA and VISA International; Chairman and Director, Massachusetts Bankers Association; Director, Depository Trust Corporation; Director, The Boston Stock Exchange. |
|
|
|
Charles F. Mansfield, Jr.
Birth Date: April 10, 1945
TRUSTEE
Began serving: January 1999 | | Principal Occupations: Director or Trustee of the Federated Fund Complex; Management Consultant.
Previous Positions: Chief Executive Officer, PBTC International Bank; Partner, Arthur Young & Company (now Ernst & Young LLP); Chief Financial Officer of Retail Banking Sector, Chase Manhattan Bank; Senior Vice President, HSBC Bank USA (formerly, Marine Midland Bank); Vice President, Citibank; Assistant Professor of Banking and Finance, Frank G. Zarb School of Business, Hofstra University; Executive Vice President DVC Group, Inc. (marketing, communications and technology). |
|
|
|
R. James Nicholson
Birth Date: February 4, 1938
TRUSTEE
Began serving: January 2008 | | Principal Occupations: Director or Trustee of the Federated Fund Complex; Senior Counsel, Brownstein Hyatt Farber Schrek, P.C.; Former Secretary of the U.S. Dept. of Veterans Affairs; Former U.S. Ambassador to the Holy See; Former Chairman of the Republican National Committee.
Other Directorships Held : Director, Horatio Alger Association.
Previous Positions: Colonel, U.S. Army Reserve; Partner, Calkins, Kramer, Grimshaw and Harring, P.C.; General Counsel, Colorado Association of Housing and Building; Chairman and CEO, Nicholson Enterprises, Inc. (real estate holding company); Chairman and CEO, Renaissance Homes of Colorado. |
|
|
|
Thomas M. O'Neill
Birth Date: June 14, 1951
TRUSTEE
Began serving: October 2006 | | Principal Occupations: Director or Trustee of the Federated Fund Complex; Managing Director and Partner, Navigator Management Company, L.P. (investment and strategic consulting).
Other Directorships Held: Director, Midway Pacific (lumber); Board of Overseers, Children's Hospital of Boston; Visiting Committee on Athletics, Harvard College.
Previous Positions: Chief Executive Officer and President, Managing Director and Chief Investment Officer, Fleet Investment Advisors; President and Chief Executive Officer, Aeltus Investment Management, Inc.; General Partner, Hellman, Jordan Management Co., Boston, MA; Chief Investment Officer, The Putnam Companies, Boston, MA; Credit Analyst and Lending Officer, Fleet Bank. |
|
|
|
|
|
|
Name
Birth Date
Positions Held with Trust
Date Service Began
|
| Principal Occupation(s) for Past Five Years,
Other Directorships Held and Previous Position(s)
|
John S. Walsh
Birth Date: November 28, 1957
TRUSTEE
Began serving: January 1999 | | Principal Occupations: Director or Trustee of the Federated Fund Complex; President and Director, Heat Wagon, Inc. (manufacturer of construction temporary heaters); President and Director, Manufacturers Products, Inc. (distributor of portable construction heaters); President, Portable Heater Parts, a division of Manufacturers Products, Inc.
Previous Position: Vice President, Walsh & Kelly, Inc. |
|
|
|
James F. Will
Birth Date: October 12, 1938
TRUSTEE
Began serving: April 2006 | | Principal Occupations: Director or Trustee of the Federated Fund Complex; formerly, Vice Chancellor and President, Saint Vincent College.
Other Directorships Held: Trustee, Saint Vincent College; Alleghany Corporation.
Previous Positions: Chairman, President and Chief Executive Officer, Armco, Inc.; President and Chief Executive Officer, Cyclops Industries; President and Chief Operating Officer, Kaiser Steel Corporation. |
|
|
|
OFFICERS
|
|
|
Name
Birth Date
Address
Positions Held with Trust
Date Service Began
|
| Principal Occupation(s) for Past Five Years and Previous Position(s)
|
John W. McGonigle
Birth Date: October 26, 1938
EXECUTIVE VICE PRESIDENT
AND SECRETARY
Began serving: April 1984 | | Principal Occupations: Executive Vice President and Secretary of the Federated Fund Complex; Vice Chairman, Executive Vice President, Secretary and Director, Federated Investors, Inc.
Previous Positions: Trustee, Federated Investment Management Company and Federated Investment Counseling; Director, Federated Global Investment Management Corp., Federated Services Company and Federated Securities Corp. |
|
|
|
|
|
|
Name
Birth Date
Address
Positions Held with Trust
Date Service Began
|
| Principal Occupation(s) for Past Five Years and Previous Position(s)
|
Richard A. Novak
Birth Date: December 25, 1963 TREASURER
Began serving: January 2006 | | Principal Occupations: Principal Financial Officer and Treasurer of the Federated Fund Complex; Senior Vice President, Federated Administrative Services; Financial and Operations Principal for Federated Securities Corp., Edgewood Services, Inc. and Southpointe Distribution Services, Inc.
Previous Positions: Controller of Federated Investors, Inc.; Vice President, Finance of Federated Services Company; held various financial management positions within The Mercy Hospital of Pittsburgh; Auditor, Arthur Andersen & Co. |
|
|
|
Richard B. Fisher
Birth Date: May 17, 1923
VICE PRESIDENT
Began serving: April 1984 | | Principal Occupations: Vice Chairman or Vice President of some of the Funds in the Federated Fund Complex; Vice Chairman, Federated Investors, Inc.; Chairman, Federated Securities Corp.
Previous Positions: President and Director or Trustee of some of the Funds in the Federated Fund Complex; Executive Vice President, Federated Investors, Inc.; Director and Chief Executive Officer, Federated Securities Corp. |
|
|
|
Brian P. Bouda
Birth Date: February 28, 1947
CHIEF COMPLIANCE OFFICER
and SENIOR VICE PRESIDENT
Began serving: January 2006 | | Principal Occupations: Senior Vice President and Chief Compliance Officer of the Federated Fund Complex; Vice President and Chief Compliance Officer of Federated Investors, Inc. and Chief Compliance Officer of its subsidiaries. Mr. Bouda joined Federated in 1999 and is a member of the American Bar Association and the State Bar Association of Wisconsin. |
|
|
|
Stephen F. Auth
Birth Date: September 3, 1956
450 Lexington Avenue
Suite 3700
New York, NY 10017-3943
CHIEF INVESTMENT OFFICER
Began serving: November 2002 | | Principal Occupations: Chief Investment Officer of this Fund and various other Funds in the Federated Fund Complex; Executive Vice President, Federated Investment Counseling, Federated global Investment Management Corp. and Federated Equity Management Company of Pennsylvania.
Previous Positions: Executive Vice President, Federated Investment Management Company, and Passport Research, Ltd. (Investment advisory subsidiary of Federated); Senior Vice President, Global Portfolio Management Services Division; Senior Vice President, Federated Investment Management Company and Passport Research, Ltd.; Senior Managing Director and Portfolio Manager, Prudential Investments. |
|
|
|
|
|
|
Name
Birth Date
Address
Positions Held with Trust
Date Service Began
|
| Principal Occupation(s) for Past Five Years and Previous Position(s)
|
Lawrence Auriana
Birth Date: January 8, 1944
140 East 45 th Street
New York, NY 10017
VICE PRESIDENT
Began serving: November 2001 | | Principal Occupations: Lawrence is Vice President of the Trust. Mr. Auriana joined Federated in April 2001 as Co-Head of Investments/Federated Kaufmann. From August 1984 to April 2001, Mr. Auriana was President and Treasurer of Edgemont Asset Management Corp., and Chairman of the Board and Portfolio Manager to The Kaufmann Fund, Inc. (predecessor to the Federated Kaufmann Fund). Mr. Auriana earned a B.S. in economics from Fordham University and has been engaged in the securities business since 1965. |
|
|
|
Walter C. Bean
Birth Date : June 22, 1945
VICE PRESIDENT
Began serving: November 2006 | | Principal Occupations: Walter C. Bean is Vice President of the Trust. Mr. Bean is a Senior Vice President, Senior Portfolio Manager and the Head of the Income and Value Equity Management Teams of the Fund's Adviser. Mr. Bean joined Federated in 2000. His previous associations included: various investment management and research positions with C.S. McKee & Company, First Chicago Investment Advisors, CIGNA Investment Advisors and Mellon Bank. Mr. Bean earned a Bachelors Degree in Business Administration from Ohio University and an M.B.A. from the Pennsylvania State University. Mr. Bean is a Chartered Financial Analyst and has 39 years of investment experience. |
|
|
|
Hans P. Utsch
Birth Date: July 3, 1936
140 East 45 th Street
New York, NY 10017
VICE PRESIDENT
Began serving: November 2001 | | Principal Occupations: Hans P. Utsch is Vice President of the Trust. Mr. Utsch joined Federated in April 2001 as Co-Head of Investments/Federated Kaufmann. From August 1984 to April 2001, Mr. Utsch was Chairman of the Board and Secretary of Edgemont Asset Management Corp., and President and Portfolio Manager to The Kaufmann Fund, Inc. (predecessor to the Federated Kaufmann Fund). Mr. Utsch graduated from Amherst College and holds an M.B.A. from Columbia University. He has been engaged in the securities business since 1962. |
|
|
|
Evaluation and Approval of Advisory Contract - May 2008
FEDERATED INTERCONTINENTAL FUND (THE "FUND")
The Fund's Board reviewed the Fund's investment advisory contract at meetings held in May 2008. The Board's decision regarding the contract reflects the exercise of its business judgment on whether to continue the existing arrangements.
In this connection, the Federated funds' Board had previously appointed a Senior Officer, whose duties include specified responsibilities relating to the process by which advisory fees are to be charged to a Federated fund. The Senior Officer has the authority to retain consultants, experts, or staff as may be reasonably necessary to assist in the performance of his duties, reports directly to the Board, and may be terminated only with the approval of a majority of the independent members of the Board. The Senior Officer prepared and furnished to the Board an independent, written evaluation that covered topics discussed below. The Board considered that evaluation, along with other information, in deciding to approve the advisory contract.
During its review of the contract, the Board considered compensation and benefits received by the Adviser. This included the fees received for services provided to the Fund by other entities in the Federated organization and research services received by the Adviser from brokers that execute Federated fund trades, as well as advisory fees. The Board is also familiar with and considered judicial decisions concerning allegedly excessive investment advisory fees, which have indicated that the following factors may be relevant to an Adviser's fiduciary duty with respect to its receipt of compensation from a fund: the nature and quality of the services provided by the Adviser, including the performance of the fund; the Adviser's cost of providing the services; the extent to which the Adviser may realize "economies of scale" as a fund grows larger; any indirect benefits that may accrue to the Adviser and its affiliates as a result of the Adviser's relationship with a fund; performance and expenses of comparable funds; and the extent to which the independent Board members are fully informed about all facts the Board deems relevant bearing on the Adviser's services and fees. The Board further considered management fees (including any components thereof) charged to institutional and other clients of the Adviser for what might be viewed as like services, and the cost to the Adviser and its affiliates of supplying services pursuant to the management fee agreements, excluding any intra-corporate profit and profit margins of the Adviser and its affiliates for supplying such services. The Board was aware of these factors and was guided by them in its review of the Fund's advisory contract to the extent it considered them to be appropriate and relevant, as discussed further below.
The Board considered and weighed these circumstances in light of its substantial accumulated experience in governing the Fund and working with Federated on matters relating to the Federated funds, and was assisted in its deliberations by independent legal counsel. Throughout the year, the Board has requested and received substantial and detailed information about the Fund and the Federated organization that was in addition to the extensive materials that comprise and accompany the Senior Officer's evaluation. Federated provided much of this information at each regular meeting of the Board, and furnished additional reports in connection with the particular meeting at which the Board's formal review of the advisory contract occurred. Between regularly scheduled meetings, the Board also received information on particular matters as the need arose. Thus, the Board's consideration of the advisory contract included review of the Senior Officer's evaluation, accompanying data and additional reports covering such matters as: the Adviser's investment philosophy, revenue, profitability, personnel and processes; investment and operating strategies; the Fund's short- and long-term performance (in absolute terms, both on a gross basis and net of expenses, as well as in relationship to its particular investment program and certain competitor or "peer group" funds and/or other benchmarks, as appropriate), and comments on the reasons for performance; the Fund's investment objectives; the Fund's expenses (including the advisory fee itself and the overall expense structure of the Fund, both in absolute terms and relative to similar and/or competing funds, with due regard for contractual or voluntary expense limitations); the use and allocation of brokerage commissions derived from trading the Fund's portfolio securities (if any); and the nature, quality and extent of the advisory and other services provided to the Fund by the Adviser and its affiliates. The Board also considered the preferences and expectations of Fund shareholders and their relative sophistication; the continuing state of competition in the mutual fund industry and market practices; the range of comparable fees for similar funds in the mutual fund industry; the Fund's relationship to the Federated family of funds which include a comprehensive array of funds with different investment objectives, policies and strategies which are available for exchange without the incurrence of additional sales charges; compliance and audit reports concerning the Federated funds and the Federated companies that service them (including communications from regulatory agencies), as well as Federated's responses to any issues raised therein; and relevant developments in the mutual fund industry and how the Federated funds and/or Federated are responding to them. The Board's evaluation process is evolutionary. The criteria considered and the emphasis placed on relevant criteria change in recognition of changing circumstances in the mutual fund marketplace.
With respect to the Fund's performance and expenses in particular, the Board has found the use of comparisons to other mutual funds with comparable investment programs to be particularly useful, given the high degree of competition in the mutual fund business. The Board focused on comparisons with other similar mutual funds more heavily than non-mutual fund products or services because, simply put, they are more relevant. For example, other mutual funds are the products most like the Fund, they are readily available to Fund shareholders as alternative investment vehicles, and they are the type of investment vehicle in fact chosen and maintained by the Fund's investors. The range of their fees and expenses therefore appears to be a generally reliable indication of what consumers have found to be reasonable in the precise marketplace in which the Fund competes. The Fund's ability to deliver competitive performance when compared to its peer group was a useful indicator of how the Adviser is executing the Fund's investment program, which in turn assisted the Board in reaching a conclusion that the nature, extent, and quality of the Adviser's investment management services were such as to warrant continuation of the advisory contract. In this regard, the Senior Officer has reviewed Federated's fees for providing advisory services to products outside the Federated family of funds (e.g., institutional and separate accounts). He concluded that mutual funds and institutional accounts are inherently different products. Those differences include, but are not limited to, different types of targeted investors; being subject to different laws and regulations; different legal structures; different average account sizes; different associated costs; and different portfolio management techniques made necessary by different cash flows. The Senior Officer did not consider these fee schedules to be significant in determining the appropriateness of mutual fund advisory contracts.
The Senior Officer reviewed reports compiled by Federated, using data supplied by independent fund ranking organizations, regarding the performance of, and fees charged by, other mutual funds, noting his view that comparisons to fund peer groups are highly important in judging the reasonableness of proposed fees.
For both the one- and three-year periods ending December 31, 2007, the Fund's performance was above the median of the relevant peer group.
The Board also received financial information about Federated, including reports on the compensation and benefits Federated derived from its relationships with the Federated funds. These reports covered not only the fees under the advisory contracts, but also fees received by Federated's subsidiaries for providing other services to the Federated funds under separate contracts (e.g., for serving as the Federated funds' administrator). The reports also discussed any indirect benefit Federated may derive from its receipt of research services from brokers who execute Federated fund trades. In addition, the Board considered the fact that, in order for a fund to be competitive in the marketplace, Federated and its affiliates frequently waived fees and/or reimbursed expenses and have disclosed to fund investors and/or indicated to the Board their intention to do so in the future, where appropriate.
Federated furnished reports, requested by the Senior Officer, that reported revenues on a fund-by-fund basis and made estimates of the allocation of expenses on a fund-by-fund basis, using allocation methodologies specified by the Senior Officer. The Senior Officer noted that, although they may apply consistent allocation processes, the inherent difficulties in allocating costs (and the unavoidable arbitrary aspects of that exercise) and the lack of consensus on how to allocate those costs may render such allocation reports unreliable. The allocation reports were considered in the analysis by the Board but were determined to be of limited use.
The Board and the Senior Officer also reviewed a report compiled by Federated comparing profitability information for Federated to other publicly held fund management companies. In this regard, the Senior Officer noted the limited availability of such information, but nonetheless concluded that Federated's profit margins did not appear to be excessive and the Board agreed.
The Senior Officer's evaluation also discussed the notion of possible realization of "economies of scale" as a fund grows larger. The Board considered in this regard that the Adviser has made significant and long-term investments in areas that support all of the Federated funds, such as personnel and processes for the portfolio management, compliance, and risk management functions; and systems technology; and that the benefits of these efforts (as well as any economies, should they exist) were likely to be enjoyed by the fund complex as a whole. Finally, the Board also noted the absence of any applicable regulatory or industry guidelines on this subject, which (as discussed in the Senior Officer's evaluation) is compounded by the lack of any common industry practice or general pattern with respect to structuring fund advisory fees with "breakpoints" that serve to reduce the fee as the fund attains a certain size. The Senior Officer did not recommend institution of breakpoints in pricing Federated's fund advisory services at this time.
It was noted in the materials for the Board meeting that for the Fund's most recently completed fiscal year, the Fund's investment advisory fee, after waivers and expense reimbursements, if any, was above he median of the relevant peer group. The Board reviewed the fees and other expenses of the Fund with the Adviser and was satisfied that the overall expense structure of the Fund remained competitive. The Board will continue to monitor advisory fees and other expenses borne by the Fund.
The Senior Officer's evaluation noted his belief that the information and observations contained in his evaluation supported a finding that the proposed management fees are reasonable, and that Federated appeared to provide appropriate administrative services to the Fund for the fees paid. Under these circumstances, no changes were recommended to, and no objection was raised to, the continuation of the Fund's advisory contract. The Board concluded that the nature, quality and scope of services provided the Fund by the Adviser and its affiliates were satisfactory.
In its decision to continue an existing investment advisory contract, the Board was mindful of the potential disruptions of the Fund's operations and various risks, uncertainties and other effects that could occur as a result of a decision to terminate or not renew an advisory contract. In particular, the Board recognized that most shareholders have invested in the Fund on the strength of the Adviser's industry standing and reputation and with the expectation that the Adviser will have a continuing role in providing advisory services to the Fund. Thus, the Board's approval of the advisory contract reflected the fact that it is the shareholders who have effectively selected the Adviser by virtue of having invested in the Fund.
The Board based its decision to approve the advisory contract on the totality of the circumstances and relevant factors and with a view to past and future long-term considerations. Not all of the factors and considerations identified above were necessarily relevant to the Fund, nor did the Board consider any one of them to be determinative. With respect to the factors that were relevant, the Board's decision to approve the contract reflects its determination that Federated's performance and actions provided a satisfactory basis to support the decision to continue the existing arrangements.
Voting Proxies on Fund Portfolio Securities
A description of the policies and procedures that the Fund uses to determine how to vote proxies, if any, relating to securities held in the Fund's portfolio is available, without charge and upon request, by calling 1-800-341-7400. A report on "Form N-PX" of how the Fund voted any such proxies during the most recent 12-month period ended June 30 is available from Federated's website at FederatedInvestors.com. To access this information from the "Products" section of the website, click on the "Prospectuses and Regulatory Reports" link under "Related Information," then select the appropriate link opposite the name of the Fund; or select the name of the Fund and from the Fund's page, click on the "Prospectuses and Regulatory Reports" link. Form N-PX filings are also available at the SEC's website at www.sec.gov.
Quarterly Portfolio Schedule
The Fund files with the SEC a complete schedule of its portfolio holdings, as of the close of the first and third quarters of its fiscal year, on "Form N-Q." These filings are available on the SEC's website at www.sec.gov and may be reviewed and copied at the SEC's Public Reference Room in Washington, DC. (Call 1-800-SEC-0330 for information on the operation of the Public Reference Room.) You may also access this information from the "Products" section of Federated's website at FederatedInvestors.com by clicking on "Portfolio Holdings" under "Related Information," then selecting the appropriate link opposite the name of the Fund; or select the name of the Fund and from the Fund's page, click on the "Portfolio Holdings" link.
Mutual funds are not bank deposits or obligations, are not guaranteed by any bank and are not insured or guaranteed by the U.S. government, the Federal Deposit Insurance Corporation, the Federal Reserve Board or any other government agency. Investment in mutual funds involves investment risk, including the possible loss of principal.
This report is authorized for distribution to prospective investors only when preceded or accompanied by the Fund's Prospectus, which contains facts concerning its objective and policies, management fees, expenses and other information.
Federated
World-Class Investment Manager
FederatedInterContinental Fund
Federated Investors Funds
4000 Ericsson Drive
Warrendale, PA 15086-7561
Contact us at FederatedInvestors.com
or call 1-800-341-7400.
Federated Securities Corp., Distributor
Cusip 314172511
Cusip 314172495
Cusip 314172487
Cusip 314172479
37865 (1/09)
Federated is a registered mark of Federated Investors, Inc. 2009 (c)Federated Investors, Inc.
Federated
World-Class Investment Manager
Federated
InterContinental Fund
A Portfolio of Federated Equity Funds
ANNUAL SHAREHOLDER REPORT
November 30, 2008
Institutional Shares
FINANCIAL HIGHLIGHTS
SHAREHOLDER EXPENSE EXAMPLE
MANAGEMENT'S DISCUSSION OF FUND PERFORMANCE
PORTFOLIO OF INVESTMENTS SUMMARY TABLES
PORTFOLIO OF INVESTMENTS
STATEMENT OF ASSETS AND LIABILITIES
STATEMENT OF OPERATIONS
STATEMENT OF CHANGES IN NET ASSETS
NOTES TO FINANCIAL STATEMENTS
REPORT OF INDEPENDENT REGISTERED PUBLIC ACCOUNTING FIRM
BOARD OF TRUSTEES AND TRUST OFFICERS
EVALUATION AND APPROVAL OF ADVISORY CONTRACT
VOTING PROXIES ON FUND PORTFOLIO SECURITIES
QUARTERLY PORTFOLIO SCHEDULE
Not FDIC Insured * May Lose Value * No Bank Guarantee
Financial Highights
(For a Share Outstanding Throughout Each Period)
| | Year
Ended | | | Period
Ended | |
|
| 11/30/2008
|
|
| 11/30/2007
| 1
|
Net Asset Value, Beginning of Period
| | $70.36 | | | $65.15 | |
Income From Investment Operations:
| | | | | | |
Net investment income
| | 1.67 | 2 | | 0.12 | 2 |
Net realized and unrealized gain (loss) on investments and foreign currency transactions
|
| (37.46
| )
|
| 5.09
|
|
TOTAL FROM INVESTMENT OPERATIONS
|
| (35.79
| )
|
| 5.21
|
|
Less Distributions:
| | | | | | |
Distributions from net investment income
| | (0.53 | ) | | - -- | |
Distributions from net realized gain on investments and foreign currency transactions
|
| (2.36
| )
|
| - --
|
|
TOTAL DISTRIBUTIONS
|
| (2.89
| )
|
| - --
|
|
Redemption Fees
|
| 0.00
| 3
|
| - --
|
|
Net Asset Value, End of Period
|
| $31.68
|
|
| $70.36
|
|
Total Return 4
|
| (53.00
| )%
|
| 8.00
| %
|
| | | | | | |
Ratios to Average Net Assets:
|
|
|
|
|
|
|
Net expenses
|
| 1.20
| %
|
| 1.20
| % 5
|
Net investment income
|
| 3.12
| %
|
| 0.64
| % 5
|
Expense waiver/reimbursement 6
|
| 0.08
| %
|
| 0.23
| % 5
|
Supplemental Data:
|
|
|
|
|
|
|
Net assets, end of period (000 omitted)
|
| $85,520
|
|
| $29,062
|
|
Portfolio turnover
|
| 65
| %
|
| 28
| % 7
|
1 Reflects operations for the period from August 25, 2007 (start of performance) to November 30, 2007.
2 Per share numbers have been calculated using the average shares method.
3 Represents less than $0.01.
4 Based on net asset value, which does not reflect the sales charge, redemption fee or contingent deferred sales charge, if applicable. Total returns for periods of less than one year are not annualized.
5 Computed on an annualized basis.
6 This expense decrease is reflected in both the net expense and the net investment income ratios shown above.
7 Portfolio turnover is calculated at the Fund level. Percentage indicated was calculated for the period from January 1, 2007 to November 30, 2007.
See Notes which are an integral part of the Financial Statements
Shareholder Expense Example
As a shareholder of the Fund, you incur two types of costs: (1) transaction costs, including redemption/exchange fees; and (2) ongoing costs, including management fees and to the extent applicable, distribution (12b-1) fees and/or shareholder services fees and other Fund expenses. This Example is intended to help you to understand your ongoing costs (in dollars) of investing in the Fund and to compare these costs with the ongoing costs of investing in other mutual funds. It is based on an investment of $1,000 invested at the beginning of the period and held for the entire period from June 1, 2008 to November 30, 2008.
ACTUAL EXPENSES
The first section of the table below provides information about actual account values and actual expenses. You may use the information in this section, together with the amount you invested, to estimate the expenses that you incurred over the period. Simply divide your account value by $1,000 (for example, an $8,600 account value divided by $1,000 = 8.6), then multiply the result by the number in the first section under the heading entitled "Expenses Paid During Period" to estimate the expenses attributable to your investment during this period.
HYPOTHETICAL EXAMPLE FOR COMPARISON PURPOSES
The second section of the table below provides information about hypothetical account values and hypothetical expenses based on the Fund's actual expense ratio and an assumed rate of return of 5% per year before expenses, which is not the Fund's actual return. Thus, you should not use the hypothetical account values and expenses to estimate the actual ending account balance or your expenses for the period. Rather, these figures are required to be provided to enable you to compare the ongoing costs of investing in the Fund with other funds. To do so, compare this 5% hypothetical example with the 5% hypothetical examples that appear in the shareholder reports of the other funds.
Please note that the expenses shown in the table are meant to highlight your ongoing costs only and do not reflect any transaction costs, such as redemption/exchange fees. Therefore, the second section of the table is useful in comparing ongoing costs only, and will not help you determine the relative total costs of owning different funds. In addition, if these transaction costs were included, your costs would have been higher.
|
| Beginning
Account Value
6/1/2008
|
| Ending
Account Value
11/30/2008
|
| Expenses Paid
During Period 1
|
Actual
|
| $1,000
|
| $ 485.70
|
| $4.49
|
Hypothetical (assuming a 5% return before expenses)
|
| $1,000
|
| $1,018.95
|
| $6.11
|
1 Expenses are equal to the Fund's annualized net expense ratio of 1.21%, multiplied by the average account value over the period, multiplied by 183/366 (to reflect the one-half-year period).
Management's Discussion of Fund Performance
For the one-year reporting period ended November 30, 2008, the fund's total return, based on net asset value, was (53.00)% for Institutional Shares. The Morgan Stanley Capital International All Country World Index ex USA (MSCI AC World ex USA), 1 the fund's benchmark, returned (49.21)% for the same period. The fund's total return for the fiscal year reflected actual cash flows, transaction costs and other expenses which were not reflected in the total return of the MSCI AC World ex USA.
Market Overview
During the reporting period, headline-grabbing market shocks impacted every major asset class, as the global economy faced a severe slowdown. The fund and the MSCI World ex USA 2 both had the worst absolute return year since their inception 10 and 40 years ago, respectively. Good asset classes were sold off disproportionately with bad asset classes as equity investors raced to sell their holdings. The trends that have driven international markets in recent years such as exports, urbanization and growing consumer economies became strained during the reporting period.
Over the last three months of the reporting period, international economies provided massive global stimuli on an unprecedented scale. Some actions implemented were: (1) huge economic stimulus packages, such as China's $586 billion stimulus package; (2) coordinated and multiple central banks' liquidity injections including: Bank of Canada, Bank of England, European Central Bank, Bank of Japan, Swiss National Bank, Reserve Bank of Australia, United Arab Emirates; (3) tax incentives for long-term holdings of domestic funds to strengthen stock markets, such as those provided by the South Korean government; (4) countries cutting reserve requirements, such as the Central Bank of Taiwan; (5) easing of collateral requirements on loans by Sweden's Riksbank and Bank of Italy; and (6) numerous and biggest historic rate cuts in many economies, including recent European Central Bank's 75 basis point largest cut ever.
1 The MSCI AC World ex USA is an unmanaged index representing 45 developed and emerging markets around the world that collectively comprise virtually all of the foreign equity stock markets. The index is unmanaged and, unlike the Fund, is not affected by cashflows. It is not possible to invest directly in an index.
2 The MSCI World ex USA Index is a free float-adjusted market capitalization weighted index that is designed to measure the equity market performance of developed markets. As of June 2007 the MSCI World ex USA Index consisted of the following 23 developed market country indices: Australia, Austria, Belgium, Canada, Denmark, Finland, France, Germany, Greece, Hong Kong, Ireland, Italy, Japan, Netherlands, New Zealand, Norway, Portugal, Singapore, Spain, Sweden, Switzerland, the United Kingdom and the United States. The index is unmanaged and, unlike the fund, is not affected by cash flows. It is not possible to invest directly in an index.
As the year progressed, country governments responded with more urgency and decisiveness. As we saw in the final week of November 2008, The People's Bank of China reduced its key one-year lending rate by 108 basis points--the largest cut in 11 years to 5.58%. This was the fourth reduction since the middle of September 2008, resulting in a cumulative reduction of 189 basis points.
Country allocation remained the primary driver of the fund's relative performance for the fiscal year 3 (as it has consistently been over the past 10 years), but despite the global stimuli, the most recent three months in the reporting period showed a dramatic increase in correlations between asset classes--everything declined at the same time. All countries declined together and were highly correlated with each other due to unusual market stress and volatility.
Fund Performance
Throughout the reporting period, the fund reduced exposure, to its lowest weight in several years, to the faster-growth emerging markets due to risk aversion, although these developing economies, such as China, are playing an important role in balancing the support system for the global economy. The fund's front-end risk process successfully screened out the biggest country loser, Russia, which declined 70.38%. The Fund benefited on a relative basis from emerging market investment timing decisions in Brazil and Taiwan. The fund also benefited from other countries that performed better compared to its benchmark. Several of our key markets traded at unprecedented valuation levels as compared to the prior 20 years including: Netherlands (52.53)%, Germany (51.21)% and France (48.47)% in the Eurozone. 4 The fund favored select developing economies including Brazil (55.71)% and Turkey (63.49)%. Over the reporting period, the countries and companies that performed better in this environment have strong cash flows and low leverage.
The fund's overweight in Norway was the biggest drag on the fund's performance. Norway declined 65.38% despite the Norwegian economy's continued resilience and robust Gross Domestic Product ("GDP"). The market dropped primarily due to increased concerns for a global recession. Energy and other commodity companies in Norway were impacted from the decline in oil prices, as commodity markets were undercut due to the fears surrounding a global economy, which is now facing recession.
The fund's underweight Japanese yen currency exposure also contributed negatively to the fund's relative performance. The yen currency makes up 19% of the MSCI AC World ex USA. Our investment process relies on the view that currencies will appreciate if the country economy and underlying stocks' fundamentals are strong. Over the reporting period year, forced selling due to de-leveraging and unwinding of the "Carry Trade" in order to repatriate funds contributed meaningfully to outsized yen returns versus U.S. dollar.
3 International investing involves special risks including currency risk, increased volatility, political risks and differences in auditing and other financial standards. Prices of emerging markets securities can be significantly more volatile than the prices of securities in developed countries and currency risk and political risks are accentuated in emerging markets.
4 The Eurozone consists of: Austria, Belgium, Cyprus, Finland, France, Germany, Greece, Ireland, Italy, Luxembourg, Malta, The Netherlands, Portugal, Spain, Slovenia and Slovakia. The 16 countries are united by a common currency (the Euro), monetary policy and adherence to the Maastrict Treaty.
GROWTH OF A $10,000 INVESTMENT - INSTITUTIONAL SHARES
The Fund's Institutional Shares commenced operations on August 25, 2007. The Fund offers four other classes of shares: Class A Shares, Class B Shares, Class C Shares and Class K Shares. For the period prior to commencement of operations of Institutional Shares, the performance information shown is for the Fund's Class A Shares. The performance of the Class A Shares has not been adjusted to reflect the expenses of the Institutional Shares, since the Institutional Shares have a lower expense ratio than the expense ratio of the Class A Shares. The performance of the Class A Shares has been adjusted to remove any voluntary waiver of Fund expenses related to the Class A Shares that may have occurred during the period prior to commencement of operations of the Institutional Shares. The graph below illustrates the hypothetical investment of $10,000 1 in Federated InterContinental Fund (Institutional Shares) (the "Fund") from November 30, 1998 to November 30, 2008, compared to the Morgan Stanley Capital International All Country World Index ex USA (MSCI AC World ex USA). 2
Average Annual Total Returns for the Period Ended 11/30/2008
|
|
|
|
1 Year
|
| (53.00
| )%
|
5 Years
|
| 4.54
| %
|
10 Years
|
| 2.06
| %
|
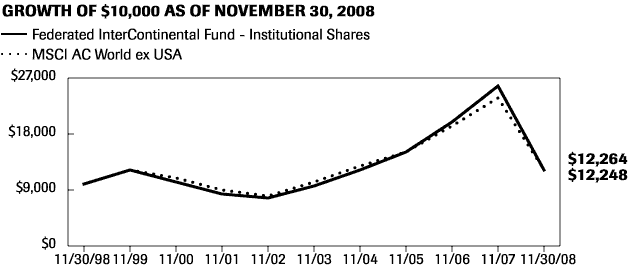
Performance data quoted represents past performance which is no guarantee of future results. Investment return and principal value will fluctuate so that an investor's shares, when redeemed, may be worth more or less than their original cost. Mutual fund performance changes over time and current performance may be lower or higher than what is stated. For current to the most recent month-end performance and after-tax returns, visit FederatedInvestors.com or call 1-800-341-7400. Returns shown do not reflect the deduction of taxes that a shareholder would pay on Fund distributions or the redemption of Fund shares. Mutual funds are not obligations of or guaranteed by any bank and are not federally insured.
1 Represents a hypothetical investment of $10,000 in the Fund. The Fund's performance assumes the reinvestment of all dividends and distributions. The MSCI AC World ex USA has been adjusted to reflect reinvestment of dividends on securities in the index.
2 The MSCI AC World ex USA is not adjusted to reflect sales charges, expenses or other fees that the Securities and Exchange Commission (SEC) requires to be reflected in the Fund's performance. The index is unmanaged and, unlike the Fund, is not affected by cash flows. It is not possible to invest directly in an index.
Performance data quoted represents past performance which is no guarantee of future results. Investment return and principal value will fluctuate so that an investor's shares, when redeemed, may be worth more or less than their original cost. Mutual fund performance changes over time and current performance may be lower or higher than what is stated. For current to the most recent month-end performance and after-tax returns, visit FederatedInvestors.com or call 1-800-341-7400.
Portfolio of Investments Summary Tables
At November 30, 2008, the Fund's portfolio composition 1 was as follows:
Country
|
| Percentage of
Total Net Assets
|
Germany
|
| 17.2
| %
|
France
|
| 14.6
| %
|
Netherlands
|
| 12.2
| %
|
Japan
|
| 10.6
| %
|
Korea
|
| 8.4
| %
|
Norway
|
| 5.7
| %
|
Italy
|
| 5.4
| %
|
Poland
|
| 5.4
| %
|
Austria
|
| 4.7
| %
|
Brazil
|
| 3.9
| %
|
Turkey
|
| 3.4
| %
|
Derivative Contracts 2
|
| 2.2
| %
|
Securities Lending Collateral 3
|
| 7.3
| %
|
Other Securities 4
|
| 0.4
| %
|
Cash Equivalents 5
|
| 5.7
| %
|
Other Assets and Liabilities--Net 6
|
| (7.1
| )%
|
TOTAL
|
| 100.0
| %
|
1 Country allocations are based primarily on the country in which a company is incorporated. However, the Fund's adviser may allocate a company to a country based on other factors such as location of the company's principal office, the location of the principal trading market for the company's securities or the country where a majority of the company's revenues are derived.
2 Based upon net unrealized appreciation (depreciation) or value of the derivative contracts as applicable. Derivative contracts may consist of futures, forwards, options and swaps. The impact of a derivative contract on the Fund's performance may be larger than its unrealized appreciation (depreciation) or value may indicate. In many cases, the notional value or amount of a derivative contract may provide a better indication of the contract's significance to the portfolio. More complete information regarding the Fund's direct investments in derivative contracts, including unrealized appreciation (depreciation), value and notional values or amounts of such contracts, can be found in the table at the end of the Portfolio of Investments included in this report.
3 Cash collateral received from lending portfolio securities which is invested in short-term investments such as repurchase agreements or money market mutual funds.
4 Other Securities include an exchange-traded fund.
5 Cash Equivalents include any investments in money market mutual funds and/or overnight repurchase agreements.
6 Assets, other than investments in securities and derivative contracts, less liabilities. See Statement of Assets and Liabilities.
At November 30, 2008, the Fund's sector classification composition 7 was as follows:
Sector Classification
|
| Percentage of
Total Net Assets
|
Financials
|
| 12.8
| %
|
Telecommunication Services
|
| 12.7
| %
|
Consumer Staples
|
| 12.2
| %
|
Energy
|
| 9.9
| %
|
Industrials
|
| 9.4
| %
|
Health Care
|
| 9.0
| %
|
Utilities
|
| 7.5
| %
|
Materials
|
| 6.4
| %
|
Consumer Discretionary
|
| 6.2
| %
|
Information Technology
|
| 5.8
| %
|
Derivative Contracts 2
|
| 2.2
| %
|
Securities Lending Collateral 3
|
| 7.3
| %
|
Cash Equivalents 5
|
| 5.7
| %
|
Other Assets and Liabilities--Net 6
|
| (7.1
| )%
|
TOTAL
|
| 100.0
| %
|
7 Except for Securities Lending Collateral, Derivative Contracts, Cash Equivalents and Other Assets and Liabilities, sector classifications are based upon, and individual securities assigned to, the classifications of the Global Industry Classification Standard (GICS), except that the adviser assigns a classification to securities not classified by the GICS and to securities for which the adviser does not have access to the classification made by the GICS.
Portfolio of Investments
November 30, 2008
Shares
|
|
|
|
| Value in
U.S. Dollars
|
|
| | | COMMON STOCKS--91.5% | | | | |
| | | Austria--4.7% | | | | |
| 64,000 | | Andritz AG
| | $ | 1,490,197 | |
| 221,110 | 1 | Erste Bank Der Oesterreichischen Sparkassen AG
| | | 5,048,403 | |
| 13,000 | | Mayr-Melnhof Karton AG
| | | 792,155 | |
| 214,700 | | OMV AG
| | | 5,422,180 | |
| 77,700 | | Oesterreichische Elektrizitaetswirtschafts AG
| | | 3,442,203 | |
| 420,490 | | Telekom Austria AG
| | | 5,630,042 | |
| 135,500 | | Vienna Insurance Group
|
|
| 3,746,059
|
|
| | | TOTAL
|
|
| 25,571,239
|
|
| | | Brazil--3.9% | | | | |
| 73,100 | | Banco Bradesco SA, ADR
| | | 777,784 | |
| 114,650 | | Banco Itau SA, ADR
| | | 1,327,647 | |
| 85,000 | 2 | Brasil Telecom SA, ADR
| | | 1,686,400 | |
| 126,344 | 2 | Companhia Energetica de Minas Gerais, ADR
| | | 2,000,026 | |
| 98,000 | 2 | Companhia Siderurgica Nacional SA, ADR
| | | 1,128,960 | |
| 209,820 | 1 | Companhia Vale Do Rio Doce, ADR
| | | 2,505,251 | |
| 50,000 | | Companhia de Bebidas das Americas (AmBev), ADR
| | | 2,173,500 | |
| 26,600 | 2 | Companhia de Saneamento Basico do Estado de Sao Paulo, ADR
| | | 556,472 | |
| 80,000 | | Embraer - Empresa Brasileira de Aeronautica SA, ADR
| | | 1,242,400 | |
| 71,900 | | Gerdau SA, ADR
| | | 468,788 | |
| 113,880 | 2 | Petroleo Brasileiro SA, ADR, Common
| | | 2,384,647 | |
| 131,200 | 2 | Petroleo Brasileiro SA, ADR, Preference
| | | 2,332,736 | |
| 51,700 | 2 | Tele Norte Leste Participacoes SA, ADR
| | | 758,956 | |
| 34,600 | | Unibanco Uniao de Bancos Brasileiros SA, GDR
|
|
| 2,217,514
|
|
| | | TOTAL
|
|
| 21,561,081
|
|
Shares
|
|
|
|
| Value in
U.S. Dollars
|
|
| | | COMMON STOCKS--continued | | | | |
| | | France--14.6% | | | | |
| 102,577 | | AXA SA
| | $ | 1,963,365 | |
| 77,288 | | BNP Paribas SA
| | | 4,283,349 | |
| 33,100 | | CNP Assurances
| | | 2,132,276 | |
| 50,000 | | Cap Gemini SA
| | | 1,610,848 | |
| 50,000 | | Carrefour SA
| | | 1,885,041 | |
| 92,000 | | Casino Guichard-Perrachon
| | | 5,625,537 | |
| 75,000 | 1 | Christian Dior
| | | 3,462,110 | |
| 53,500 | | Compagnie de Saint-Gobain SA
| | | 2,153,830 | |
| 42,000 | | Electricite De France
| | | 2,437,892 | |
| 42,000 | | Essilor International SA
| | | 1,680,364 | |
| 150,000 | | European Aeronautic Defence and Space Co.
| | | 2,381,788 | |
| 429,300 | | France Telecomm SA
| | | 11,078,945 | |
| 15,600 | | L'Oreal SA
| | | 1,260,306 | |
| 85,000 | | Lagardere S.C.A.
| | | 3,118,517 | |
| 314,850 | | Sanofi-Aventis, ADR
| | | 8,708,751 | |
| 94,400 | | Societe BIC SA
| | | 4,796,015 | |
| 41,000 | | Suez SA
| | | 1,579,977 | |
| 128,040 | | Total SA
| | | 6,717,561 | |
| 113,950 | 1 | Total SA, ADR
| | | 6,010,862 | |
| 75,910 | | Vinci SA
| | | 3,069,399 | |
| 128,050 | | Vivendi SA
|
|
| 3,628,971
|
|
| | | TOTAL
|
|
| 79,585,704
|
|
| | | Germany--17.2% | | | | |
| 43,548 | | Allianz SE
| | | 3,643,949 | |
| 218,600 | | BASF AG
| | | 7,028,513 | |
| 170,900 | | Bayer AG
| | | 8,880,219 | |
| 95,000 | | Beiersdorf AG
| | | 5,283,785 | |
Shares
|
|
|
|
| Value in
U.S. Dollars
|
|
| | | COMMON STOCKS--continued | | | | |
| | | Germany--continued | | | | |
| 219,500 | 1 | Daimler AG
| | $ | 6,874,740 | |
| 101,980 | 1 | Deutsche Bank AG
| | | 3,662,127 | |
| 232,340 | | Deutsche Post AG
| | | 3,348,584 | |
| 831,520 | | Deutsche Telekom AG
| | | 11,571,358 | |
| 112,740 | | E.On AG
| | | 3,974,193 | |
| 98,000 | | Fresenius Medical Care AG & Co. KGaA
| | | 4,281,430 | |
| 60,000 | 2 | Gerresheimer AG
| | | 2,064,311 | |
| 38,000 | | Merck KGAA
| | | 3,192,637 | |
| 85,794 | | Metro AG
| | | 2,639,058 | |
| 133,936 | | RWE AG
| | | 11,299,146 | |
| 220,000 | | SAP AG
| | | 7,557,942 | |
| 15,000 | | Salzgitter AG
| | | 1,045,353 | |
| 39,700 | | Siemens AG
| | | 2,393,492 | |
| 381,000 | 1 | Suedzucker AG
|
|
| 4,821,487
|
|
| | | TOTAL
|
|
| 93,562,324
|
|
| | | Italy--5.4% | | | | |
| 131,800 | | Assicurazioni Generali S.p.A.
| | | 3,189,827 | |
| 785,830 | | Enel S.p.A.
| | | 4,932,630 | |
| 729,640 | | Finmeccanica S.p.A.
| | | 9,137,240 | |
| 1,917,064 | | Intesa Sanpaolo S.p.A.
| | | 5,794,852 | |
| 68,900 | | Lottomatica S.p.A.
| | | 1,634,592 | |
| 110,000 | | Saipem S.p.A.
| | | 1,714,213 | |
| 635,000 | | Snam Rete Gas S.p.A.
|
|
| 3,326,797
|
|
| | | TOTAL
|
|
| 29,730,151
|
|
| | | Japan--10.6% | | | | |
| 300,000 | | Ajinomoto Co., Inc.
| | | 3,176,369 | |
| 95,000 | | Asahi Breweries Ltd.
| | | 1,657,127 | |
Shares
|
|
|
|
| Value in
U.S. Dollars
|
|
| | | COMMON STOCKS--continued | | | | |
| | | Japan--continued | | | | |
| 450,000 | | Asahi Glass Co. Ltd.
| | $ | 2,530,621 | |
| 186,900 | | Bridgestone Corp.
| | | 3,130,383 | |
| 60,000 | | Chubu Electric Power Co., Inc.
| | | 1,649,843 | |
| 90,000 | | Chugai Pharmaceutical Co. Ltd.
| | | 1,553,628 | |
| 200 | | East Japan Railway Co.
| | | 1,540,595 | |
| 64,600 | | Honda Motor Co. Ltd.
| | | 1,420,223 | |
| 500 | | KDDI Corp.
| | | 3,251,181 | |
| 10,400 | | Keyence Corp.
| | | 1,730,632 | |
| 200,000 | | Kyowa Hakko Kirin Co., Ltd.
| | | 1,697,003 | |
| 400,000 | | Meiji Seika Kaisha
| | | 1,786,819 | |
| 1,000 | | NTT DoCoMo, Inc.
| | | 1,659,300 | |
| 5,300 | | Nintendo Corp. Ltd.
| | | 1,640,909 | |
| 533,000 | | Nippon Express Co. Ltd.
| | | 2,393,090 | |
| 480 | | Nippon Telegraph & Telephone Corp.
| | | 2,088,886 | |
| 83,000 | | Panasonic Corp.
| | | 996,349 | |
| 53,000 | | Seven & I Holdings Co. Ltd.
| | | 1,500,885 | |
| 357,000 | | Shionogi and Co. Ltd.
| | | 7,747,864 | |
| 140,000 | | Shiseido Co., Ltd.
| | | 2,604,372 | |
| 405,100 | | Taiyo Nippon Sanso Corp.
| | | 2,847,617 | |
| 75,000 | | Terumo Corp.
| | | 3,483,696 | |
| 500,000 | | Toppan Printing Co.
| | | 3,757,824 | |
| 60,000 | | Toyota Motor Corp.
|
|
| 1,888,655
|
|
| | | TOTAL
|
|
| 57,733,871
|
|
| | | Korea, Republic of--8.4% | | | | |
| 14,300 | | Hyundai Heavy Industries Co. Ltd.
| | | 1,536,037 | |
| 110,000 | | Hyundai Marine & Fire Insurance Co.
| | | 985,041 | |
| 50,000 | | Hyundai Motor Co. Ltd.
| | | 1,414,230 | |
Shares
|
|
|
|
| Value in
U.S. Dollars
|
|
| | | COMMON STOCKS--continued | | | | |
| | | Korea, Republic of--continued | | | | |
| 227,400 | | KT Corp., ADR
| | $ | 2,578,716 | |
| 139,500 | | KT Freetel Co. Ltd.
| | | 2,707,188 | |
| 631,330 | | Korea Electric Power Corp., ADR
| | | 5,871,369 | |
| 22,994 | | LG Chem Ltd.
| | | 1,088,163 | |
| 88,500 | | LG Electronics, Inc.
| | | 4,758,289 | |
| 17,500 | | LS Corporation
| | | 845,120 | |
| 80,250 | 1 | POSCO, ADR
| | | 4,634,438 | |
| 15,000 | | SK Telecom Co. ADR
| | | 2,208,368 | |
| 25,600 | | Samsung C&T Corp.
| | | 692,180 | |
| 131,500 | | Samsung Electro-Mechanics Co.
| | | 3,132,362 | |
| 23,850 | | Samsung Electronics Co. Ltd.
| | | 7,888,765 | |
| 10,200 | | Samsung Fire & Marine Insurance
| | | 1,346,359 | |
| 60,000 | | Samsung Heavy Industries
| | | 835,753 | |
| 77,800 | | Samsung SDI Co. Ltd.
|
|
| 3,181,397
|
|
| | | TOTAL
|
|
| 45,703,775
|
|
| | | Netherlands--12.2% | | | | |
| 138,000 | 2 | ASML Holding NV
| | | 2,104,626 | |
| 1,075,000 | 2 | Ahold NV
| | | 11,995,585 | |
| 93,000 | | Akzo Nobel NV
| | | 3,176,965 | |
| 75,000 | | Fugro NV
| | | 2,388,337 | |
| 253,000 | | Heineken NV
| | | 6,980,514 | |
| 136,229 | | Koninklijke DSM NV
| | | 3,161,041 | |
| 865,000 | | Koninklijke KPN NV
| | | 11,958,877 | |
| 313,000 | | Philips Electronics NV
| | | 5,105,076 | |
| 220,000 | 1,2 | Qiagen NV
| | | 3,492,185 | |
| 188,000 | | SBM Offshore NV
| | | 2,936,057 | |
| 562,207 | | Unilever NV
|
|
| 13,141,816
|
|
| | | TOTAL
|
|
| 66,441,079
|
|
Shares
|
|
|
|
| Value in
U.S. Dollars
|
|
| | | COMMON STOCKS--continued | | | | |
| | | Norway--5.7% | | | | |
| 436,100 | | DnB NOR
| | $ | 1,661,248 | |
| 129,000 | 1 | Frontline Ltd.
| | | 3,714,195 | |
| 816,600 | | Norsk Hydro ASA
| | | 2,963,444 | |
| 160,000 | | Schibsted ASA
| | | 1,718,574 | |
| 695,043 | | StatoilHydro ASA
| | | 11,786,138 | |
| 120,000 | 2 | Subsea 7, Inc.
| | | 823,494 | |
| 831,600 | | Telenor ASA
| | | 4,505,497 | |
| 227,800 | | Yara International ASA
|
|
| 3,794,038
|
|
| | | TOTAL
|
|
| 30,966,628
|
|
| | | Poland--5.4% | | | | |
| 164,528 | | Asseco Ploand SA
| | | 2,656,899 | |
| 123,840 | | Bank Pekao SA
| | | 4,659,801 | |
| 90,500 | | Bank Zachodni WBK SA
| | | 3,257,323 | |
| 24,200 | 2 | PBG SA
| | | 1,699,044 | |
| 5,116,140 | | Polskie Gornictwo Naftowe I Gazownictwo SA
| | | 6,079,445 | |
| 674,900 | | Powszechna Kasa Oszczednosci
| | | 7,328,049 | |
| 540,000 | | Telekomunikacja Polska SA
|
|
| 3,539,751
|
|
| | | TOTAL
|
|
| 29,220,312
|
|
| | | Turkey--3.4% | | | | |
| 1,380,000 | | Akbank T.A.S.
| | | 3,835,919 | |
| 177,000 | | Tupras Turkiye Petrol Rafinerileri AS
| | | 1,713,791 | |
| 700,000 | | Turkcell Iletisim Hizmetleri AS
| | | 3,897,012 | |
| 2,540,000 | | Turkiye Garanti Bankasi AS
| | | 3,748,169 | |
| 2,010,000 | | Turkiye Is Bankasi (Isbank), Class C
|
|
| 5,236,299
|
|
| | | TOTAL
|
|
| 18,431,190
|
|
| | | TOTAL COMMON STOCKS
(IDENTIFIED COST $828,851,294)
|
|
| 498,507,354
|
|
Shares
|
|
|
|
| Value in
U.S. Dollars
|
|
| | | EXCHANGE-TRADED FUND--0.4% | | | | |
| 60,000 | | iShares DJ STOXX 600 Health Care Fund
(IDENTIFIED COST $3,001,686)
|
| $
| 2,522,260
|
|
| | | MUTUAL FUND--13.0% | | | | |
| 70,656,316 | 3,4,5 | Prime Value Obligations Fund, Institutional Shares, 2.35%
(AT NET ASSET VALUE)
|
|
| 70,656,316
|
|
| | | TOTAL INVESTMENTS--104.9%
(IDENTIFIED COST $902,509,296) 6
|
|
| 571,685,930
|
|
| | | OTHER ASSETS AND LIABILITIES - NET--(4.9)% 7
|
|
| (26,737,919
| )
|
| | | TOTAL NET ASSETS--100%
|
| $
| 544,948,011
|
|
At November 30, 2008, the Fund had outstanding foreign exchange contracts as follows:
Settlement Date
|
| Foreign
Currency Units
to Deliver/Receive
|
| In Exchange For
|
| Contracts
at Value
|
| Unrealized
Appreciation
(Depreciation)
|
|
Contracts Purchased:
|
|
|
|
|
|
|
|
|
|
1/15/2009
|
| 34,825,500 Norwegian Krone
|
| $ 5,938,611
|
| $ 4,946,484
|
| $ (992,127
| )
|
1/15/2009
|
| 184,612,250 Norwegian Krone
|
| $26,397,691
|
| $26,221,633
|
| $ (176,058
| )
|
1/15/2009
|
| 33,192,500 Norwegian Krone
|
| $ 5,000,000
|
| $ 4,714,539
|
| $ (285,461
| )
|
Contracts Sold:
|
|
|
|
|
|
|
|
|
|
1/15/2009
|
| 496,054,900 Norwegian Krone
|
| $84,003,918
|
| $70,457,782
|
| $13,546,136
|
|
NET UNREALIZED APPRECIATION ON FOREIGN EXCHANGE CONTRACTS
| $12,092,490
|
|
Net Unrealized Appreciation on Foreign Exchange Contracts is included in "Other Assets and Liabilities--Net."
1 All or a portion of these securities are temporarily on loan to unaffiliated broker/dealers.
2 Non-income-producing security.
3 Affiliated company.
4 7-Day net yield.
5 All or a portion of this security is held as collateral for securities lending.
6 Also represents cost of investments for federal tax purposes.
7 Assets, other than investments in securities, less liabilities. See Statement of Assets and Liabilities.
Note: The categories of investments are shown as a percentage of total net assets at November 30, 2008.
Various inputs are used in determining the value of the Fund's investments. These inputs are summarized in the three broad levels listed below:
Level 1--quoted prices in active markets for identical securities
Level 2--other significant observable inputs (including quoted prices for similar securities, interest rates, prepayment speeds, credit risk, etc.)
Level 3--significant unobservable inputs (including the Fund's own assumptions in determining the fair value of investments)
The inputs or methodology used for valuing securities are not an indication of the risk associated with investing in those securities.
The following is a summary of the inputs used, as of November 30, 2008, in valuing the Fund's assets carried at fair value:
Valuation Inputs
|
| Investments
in Securities
|
| Other Financial
Instruments*
|
Level 1--Quoted Prices
|
| $126,896,272
|
| $ --
|
Level 2--Other Significant Observable Inputs
|
| 444,789,658
|
| 12,092,490
|
Level 3--Significant Unobservable Inputs
|
| - --
|
| - --
|
TOTAL
|
| $571,685,930
|
| $12,092,490
|
* Other financial instruments include foreign exchange contracts.
The following acronyms are used throughout this portfolio:
| ADR | - --American Depositary Receipt |
| GDR | - --Global Depositary Receipt |
See Notes which are an integral part of the Financial Statements
Statement of Assets and Liabilities
November 30, 2008
Assets:
| | | | | | | |
Total investments in securities, at value including $70,656,316 of investments in an affiliated issuer (Note 5) and $33,076,365 of securities loaned (identified cost $902,509,296)
| | | | | $ | 571,685,930 | |
Cash
| | | | | | 2,032,937 | |
Cash denominated in foreign currencies (identified cost $1,573,945)
| | | | | | 1,549,432 | |
Income receivable
| | | | | | 1,069,098 | |
Receivable for investments sold
| | | | | | 1,532,570 | |
Receivable for shares sold
| | | | | | 1,531,258 | |
Receivable for foreign exchange contracts
| | | | | | 13,546,136 | |
Other assets
|
|
|
|
|
| 25,512
|
|
TOTAL ASSETS
|
|
|
|
|
| 592,972,873
|
|
Liabilities:
| | | | | | | |
Payable for investments purchased
| | $ | 3,484,609 | | | | |
Payable for shares redeemed
| | | 3,060,203 | | | | |
Payable for collateral due to broker for securities loaned
| | | 39,547,898 | | | | |
Payable for Directors'/Trustees' fees
| | | 3,678 | | | | |
Payable for distribution services fee (Note 5)
| | | 48,252 | | | | |
Payable for shareholder services fee (Note 5)
| | | 10,717 | | | | |
Payable for foreign exchange contracts
| | | 1,453,646 | | | | |
Accrued expenses
|
|
| 415,859
|
|
|
|
|
TOTAL LIABILITIES
|
|
|
|
|
| 48,024,862
|
|
Net assets for 17,265,967 shares outstanding
|
|
|
|
| $
| 544,948,011
|
|
Net Assets Consist of:
| | | | | | | |
Paid-in capital
| | | | | $ | 1,032,217,360 | |
Net unrealized depreciation of investments and translation of assets and
liabilities in foreign currency
| |
| | | |
(318,745,845 | ) |
Accumulated net realized loss on investments and foreign currency transactions
| | | | | | (187,255,931 | ) |
Undistributed net investment income
|
|
|
|
|
| 18,732,427
|
|
TOTAL NET ASSETS
|
|
|
|
| $
| 544,948,011
|
|
Statement of Assets and Liabilities - continued
Net Asset Value, Offering Price and Redemption Proceeds Per Share
| | | | | | | |
Class A Shares:
| | | | | | | |
Net asset value per share ($382,446,825 ÷ 12,107,635 shares outstanding), no par value, unlimited shares authorized
|
|
|
|
|
| $31.59
|
|
Offering price per share (100/94.50 of $31.59) 1
|
|
|
|
|
| $33.43
|
|
Redemption proceeds per share (98.00/100 of $31.59) 1
|
|
|
|
|
| $30.96
|
|
Class B Shares:
| | | | | | | |
Net asset value per share ($17,343,930 ÷ 553,780 shares outstanding), no par value, unlimited shares authorized
|
|
|
|
|
| $31.32
|
|
Offering price per share
|
|
|
|
|
| $31.32
|
|
Redemption proceeds per share (92.50/100 of $31.32) 1
|
|
|
|
|
| $28.97
|
|
Class C Shares:
| | | | | | | |
Net asset value per share ($59,406,844 ÷ 1,897,532 shares outstanding), no par value, unlimited shares authorized
|
|
|
|
|
| $31.31
|
|
Offering price per share
|
|
|
|
|
| $31.31
|
|
Redemption proceeds per share (97.00/100 of $31.31) 1
|
|
|
|
|
| $30.37
|
|
Institutional Shares:
| | | | | | | |
Net asset value per share ($85,519,567 ÷ 2,699,680 shares outstanding), no par value, unlimited shares authorized
|
|
|
|
|
| $31.68
|
|
Offering price per share
|
|
|
|
|
| $31.68
|
|
Redemption proceeds per share (98.00/100 of $31.68) 1
|
|
|
|
|
| $31.05
|
|
Class K Shares:
| | | | | | | |
Net asset value per share ($230,845 ÷ 7,340 shares outstanding), no par value, unlimited shares authorized
|
|
|
|
|
| $31.45
|
|
Offering price per share
|
|
|
|
|
| $31.45
|
|
Redemption proceeds per share (98.00/100 of $31.45) 1
|
|
|
|
|
| $30.82
|
|
1 See "What Do Shares Cost?" in the Prospectus.
See Notes which are an integral part of the Financial Statements
Statement of Operations
Year Ended November 30, 2008
Investment Income:
| | | | | | | | | | | | |
Dividends (including $493,079 received from an affiliated issuer (Note 5) and net of foreign taxes withheld of $4,780,906)
| | | | | | | | | | $ | 32,267,953 | |
Interest (including income on securities loaned of $2,552,309)
|
|
|
|
|
|
|
|
|
|
| 2,614,303
|
|
TOTAL INCOME
|
|
|
|
|
|
|
|
|
|
| 34,882,256
|
|
Expenses:
| | | | | | | | | | | | |
Investment adviser fee (Note 5)
| | | | | | $ | 8,656,344 | | | | | |
Administrative personnel and services fee (Note 5)
| | | | | | | 686,474 | | | | | |
Custodian fees
| | | | | | | 812,951 | | | | | |
Transfer and dividend disbursing agent fees and expenses--Class A Shares
| | | | | | | 601,938 | | | | | |
Transfer and dividend disbursing agent fees and expenses--Class B Shares
| | | | | | | 49,868 | | | | | |
Transfer and dividend disbursing agent fees and expenses--Class C Shares
| | | | | | | 135,244 | | | | | |
Transfer and dividend disbursing agent fees and expenses--Institutional Shares
| | | | | | | 59,385 | | | | | |
Transfer and dividend disbursing agent fees and expenses--Class K Shares
| | | | | | | 273 | | | | | |
Directors'/Trustees' fees
| | | | | | | 12,177 | | | | | |
Auditing fees
| | | | | | | 40,500 | | | | | |
Legal fees
| | | | | | | 44,475 | | | | | |
Portfolio accounting fees
| | | | | | | 97,755 | | | | | |
Distribution services fee--Class B Shares
| | | | | | | 207,511 | | | | | |
Distribution services fee--Class C Shares
| | | | | | | 643,236 | | | | | |
Distribution services fee--Class K Shares
| | | | | | | 445 | | | | | |
Shareholder services fee--Class A Shares
| | | | | | | 1,552,315 | | | | | |
Shareholder services fee--Class B Shares
| | | | | | | 69,170 | | | | | |
Shareholder services fee--Class C Shares
| | | | | | | 208,373 | | | | | |
Account administration fee--Class A Shares
| | | | | | | 42,095 | | | | | |
Account administration fee--Class C Shares
| | | | | | | 227 | | | | | |
Share registration costs
| | | | | | | 187,159 | | | | | |
Printing and postage
| | | | | | | 107,451 | | | | | |
Insurance premiums
| | | | | | | 5,951 | | | | | |
Taxes
| | | | | | | 600 | | | | | |
Miscellaneous
|
|
|
|
|
|
| 12,251
|
|
|
|
|
|
TOTAL EXPENSES
|
|
|
|
|
|
| 14,234,168
|
|
|
|
|
|
Statement of Operations - continued
Waivers and Reimbursements (Note 5):
| | | | | | | | | | | | |
Waiver/reimbursement of investment adviser fee
| | $ | (664,468 | ) | | | | | | | | |
Waiver of administrative personnel and services fee
| | | (17,615 | ) | | | | | | | | |
Reimbursement of transfer and dividend disbursing agent fees and expenses--Class B Shares
| | | (10,546 | ) | | | | | | | | |
Reimbursement of transfer and dividend disbursing agent fees and expenses--Class C Shares
| | | (16,155 | ) | | | | | | | | |
Reimbursement of transfer and dividend disbursing agent fees and expenses--Institutional Shares
|
|
| (1,854
| )
|
|
|
|
|
|
|
|
|
TOTAL WAIVERS AND REIMBURSEMENTS
|
|
|
|
|
| $
| (710,638
| )
|
|
|
|
|
Net expenses
|
|
|
|
|
|
|
|
|
| $
| 13,523,530
|
|
Net investment income
|
|
|
|
|
|
|
|
|
|
| 21,358,726
|
|
Realized and Unrealized Loss on Investments and Foreign Currency Transactions:
| | | | | | | | | | | | |
Net realized loss on investments and foreign currency transactions
| | | | | | | | | | | (189,751,662 | ) |
Net change in unrealized appreciation of investments and translation of assets and liabilities in foreign currency
|
|
|
|
|
|
|
|
|
|
| (421,982,722
| )
|
Net realized and unrealized loss on investments and foreign currency transactions
|
|
|
|
|
|
|
|
|
|
| (611,734,384
| )
|
CHANGE IN NET ASSETS RESULTING FROM OPERATIONS
|
|
|
|
|
|
|
|
|
| $
| (590,375,658
| )
|
See Notes which are an integral part of the Financial Statements
Statement of Changes in Net Assets
|
|
| Year Ended
11/30/2008
|
|
|
| Period Ended
11/30/2007
| 1
|
|
| Year Ended
12/31/2006
|
|
Increase (Decrease) in Net Assets
| | | | | | | | | | | | |
Operations:
| | | | | | | | | | | | |
Net investment income
| | $ | 21,358,726 | | | $ | 4,764,203 | | | $ | 2,808,495 | |
Net realized gain (loss) on investments and foreign currency transactions
| | | (189,751,662 | ) | | | 20,167,305 | | | | 21,005,705 | |
Net change in unrealized appreciation/depreciation of investments and translation of assets and liabilities in foreign currency
|
|
| (421,982,722
| )
|
|
| 44,975,947
|
|
|
| 34,076,774
|
|
CHANGE IN NET ASSETS RESULTING FROM OPERATIONS
|
|
| (590,375,658
| )
|
|
| 69,907,455
|
|
|
| 57,890,974
|
|
Distributions to Shareholders:
| | | | | | | | | | | | |
Distributions from net investment income
| | | | | | | | | | | | |
Class A Shares
| | | (3,701,166 | ) | | | - -- | | | | (2,997,359 | ) |
Class B Shares
| | | (80,443 | ) | | | - -- | | | | - -- | |
Class C Shares
| | | (226,848 | ) | | | - -- | | | | - -- | |
Institutional Shares
| | | (292,158 | ) | | | - -- | | | | - -- | |
Class K Shares
| | | (164 | ) | | | - -- | | | | - -- | |
Distributions from net realized gain on investments and foreign currency transactions
| | | | | | | | | | | | |
Class A Shares
| | | (18,706,692 | ) | | | - -- | | | | (2,657,257 | ) |
Class B Shares
| | | (474,412 | ) | | | - -- | | | | - -- | |
Class C Shares
| | | (1,284,669 | ) | | | - -- | | | | - -- | |
Institutional Shares
| | | (1,301,122 | ) | | | - -- | | | | - -- | |
Class K Shares
|
|
| (984
| )
|
|
| - --
|
|
|
| - --
|
|
CHANGE IN NET ASSETS RESULTING FROM DISTRIBUTIONS TO SHAREHOLDERS
|
|
| (26,068,658
| )
|
|
| - --
|
|
|
| (5,654,616
| )
|
Share Transactions:
| | | | | | | | | | | | |
Proceeds from sale of shares
| | | 716,742,169 | | | | 280,132,091 | | | | 100,119,871 | |
Proceeds from shares issued in connection with the tax-free transfer of assets from Federated International Capital Appreciation Fund
| | | 162,229,186 | | | | - -- | | | | - -- | |
Net asset value of shares issued to shareholders in payment of distributions declared
| | | 22,384,808 | | | | - -- | | | | 5,301,119 | |
Cost of shares redeemed
|
|
| (330,206,624
| )
|
|
| (33,480,584
| )
|
|
| (19,183,424
| )
|
CHANGE IN NET ASSETS RESULTING FROM SHARE TRANSACTIONS
|
|
| 571,149,539
|
|
|
| 246,651,507
|
|
|
| 86,237,566
|
|
Redemption Fees
|
|
| 83,901
|
|
|
| 4,510
|
|
|
| 24,637
|
|
Change in net assets
|
|
| (45,210,876
| )
|
|
| 316,563,472
|
|
|
| 138,498,561
|
|
Net Assets:
| | | | | | | | | | | | |
Beginning of period
|
|
| 590,158,887
|
|
|
| 273,595,415
|
|
|
| 135,096,854
|
|
End of period (including undistributed net investment income of $18,732,427, $4,171,070 and $55,980, respectively)
|
| $
| 544,948,011
|
|
| $
| 590,158,887
|
|
| $
| 273,595,415
|
|
1 Reflects operations for the period from January 1, 2007 to November 30, 2007.
See Notes which are an integral part of the Financial Statements.
Notes to Financial Statements
November 30, 2008
1. ORGANIZATION
Federated Equity Funds (the "Trust") is registered under the Investment Company Act of 1940, as amended (the "Act"), as an open-end management investment company. The Trust consists of 10 diversified portfolios. The financial statements included herein are only those of Federated InterContinental Fund (the "Fund"). The financial statements of the other portfolios are presented separately. The assets of each portfolio are segregated and a shareholder's interest is limited to the portfolio in which shares are held. Each portfolio pays its own expenses. The Fund offers five classes of shares: Class A Shares, Class B Shares, Class C Shares, Institutional Shares and Class K Shares. All shares of the Fund have equal rights with respect to voting, except on class-specific matters. The financial highlights of the Class A Shares, Class B Shares, Class C Shares and Class K Shares are presented separately. The investment objective of the Fund is to seek long-term capital appreciation.
Rochdale Atlas Portfolio (the "Predecessor Fund") was reorganized into the Fund as of the close of business on August 24, 2007. Prior to the reorganization, the Fund had no investment operations. The Fund is the successor to the Predecessor Fund, which commenced operations on October 2, 1998. The Fund changed its fiscal year end from December 31 to November 30.
Effective August 24, 2007, the Fund began offering Class B Shares, Class C Shares, Institutional Shares and Class K Shares.
On January 25, 2008, the Fund received assets from Federated International Capital Appreciation Fund as the result of a tax-free reorganization, as follows:
Shares of the
Fund Issued
|
| Federated
International
Capital
Appreciation
Fund Net Assets
Received
|
| Unrealized
Depreciation 1
|
| Net Assets
of the Fund
Immediately
Prior to
Combination
|
| Net Assets of
Federated
International
Capital
Appreciation
Fund
Immediately
Prior to
Combination
|
| Net Assets
of the Fund
Immediately
After
Combination
|
2,814,492
|
| $162,229,186
|
| $(2,929,080)
|
| $599,246,970
|
| $162,229,186
|
| $761,476,156
|
1 Unrealized Depreciation is included in the Federated International Capital Appreciation Fund Net Assets Received amount shown above.
2. SIGNIFICANT ACCOUNTING POLICIES
The following is a summary of significant accounting policies consistently followed by the Fund in the preparation of its financial statements. These policies are in conformity with generally accepted accounting principles (GAAP) in the United States of America.
Investment Valuation
In calculating its net asset value (NAV), the Fund generally values investments as follows:
- Equity securities listed on an exchange or traded through a regulated market system are valued at their last reported sale price or official closing price on their principal exchange or market.
- Shares of other mutual funds are valued based upon their reported NAVs.
- Fixed-income securities acquired with remaining maturities greater than 60 days are fair valued using price evaluations provided by a pricing service approved by the Board of Trustees (the "Trustees").
- Fixed-income securities acquired with remaining maturities of 60 days or less are valued at their cost (adjusted for the accretion of any discount or amortization of any premium).
- Derivative contracts listed on exchanges are valued at their reported settlement or closing price.
- Over-the-counter (OTC) derivative contracts are fair valued using price evaluations provided by a pricing service approved by the Trustees.
If the Fund cannot obtain a price or price evaluation from a pricing service for an investment, the Fund may attempt to value the investment based upon the mean of bid and asked quotations or fair value the investment based on price evaluations, from one or more dealers. If any price, quotation, price evaluation or other pricing source is not readily available when the NAV is calculated, the Fund uses the fair value of the investment determined in accordance with the procedures described below. There can be no assurance that the Fund could purchase or sell an investment at the price used to calculate the Fund's NAV.
Fair Valuation and Significant Events Procedures
The Trustees have authorized the use of pricing services to provide evaluations of the current fair value of certain investments for purposes of calculating the NAV. Factors considered by pricing services in evaluating an investment include the yields or prices of investments of comparable quality, coupon, maturity, call rights and other potential prepayments, terms and type, reported transactions, indications as to values from dealers and general market conditions. Some pricing services provide a single price evaluation reflecting the bid-side of the market for an investment (a "bid" evaluation). Other pricing services offer both bid evaluations and price evaluations indicative of a price between the prices bid and asked for the investment (a "mid" evaluation). The Fund normally uses bid evaluations for U.S. Treasury and Agency securities, mortgage-backed securities and municipal securities. The Fund normally uses mid evaluations for other types of fixed-income securities and OTC derivative contracts. In the event that market quotations and price evaluations are not available for an investment, the fair value of the investment is determined in accordance with procedures adopted by the Trustees.
The Trustees also have adopted procedures requiring an investment to be priced at its fair value whenever the Adviser determines that a significant event affecting the value of the investment has occurred between the time as of which the price of the investment would otherwise be determined and the time as of which the NAV is computed. An event is considered significant if there is both an affirmative expectation that the investment's value will change in response to the event and a reasonable basis for quantifying the resulting change in value. Examples of significant events that may occur after the close of the principal market on which a security is traded, or after the time of a price evaluation provided by a pricing service or a dealer, include:
- With respect to securities traded in foreign markets, significant trends in U.S. equity markets or in the trading of foreign securities index futures or options contracts;
- With respect to price evaluations of fixed-income securities determined before the close of regular trading on the NYSE, actions by the Federal Reserve Open Market Committee and other significant trends in U.S. fixed-income markets;
- Political or other developments affecting the economy or markets in which an issuer conducts its operations or its securities are traded; and
- Announcements concerning matters such as acquisitions, recapitalizations, litigation developments, a natural disaster affecting the issuer's operations or regulatory changes or market developments affecting the issuer's industry.
The Trustees have approved the use of a pricing service to determine the fair value of equity securities traded principally in foreign markets when the Adviser determines that there has been a significant trend in the U.S. equity markets or in index futures trading. For other significant events, the Fund may seek to obtain more current quotations or price evaluations from alternative pricing sources. If a reliable alternative pricing source is not available, the Fund will determine the fair value of the investment using another method approved by the Trustees.
Repurchase Agreements
It is the policy of the Fund to require the other party to a repurchase agreement to transfer to the Fund's custodian or sub-custodian eligible securities or cash with a market value (after transaction costs) at least equal to the repurchase price to be paid under the repurchase agreement. The eligible securities are transferred to accounts with the custodian or sub-custodian in which the Fund holds a "securities entitlement" and exercises "control" as those terms are defined in the Uniform Commercial Code. The Fund has established procedures for monitoring the market value of the transferred securities and requiring the transfer of additional eligible securities if necessary to equal at least the repurchase price. These procedures also allow the other party to require securities to be transferred from the account to the extent that their market value exceeds the repurchase price or in exchange for other eligible securities of equivalent market value.
With respect to agreements to repurchase U.S. government securities and cash items, the Fund treats the repurchase agreement as an investment in the underlying securities and not as an obligation of the other party to the repurchase agreement. Other repurchase agreements are treated as obligations of the other party secured by the underlying securities. Nevertheless, the insolvency of the other party or other failure to repurchase the securities may delay the disposition of the underlying securities or cause the Fund to receive less than the full repurchase price. Under the terms of the repurchase agreement, any amounts received by the Fund in excess of the repurchase price and related transaction costs must be remitted to the other party.
The Fund may enter into repurchase agreements in which eligible securities are transferred into joint trading accounts maintained by the custodian or sub-custodian for investment companies and other clients advised by the Fund's Adviser and its affiliates. The Fund will participate on a pro rata basis with the other investment companies and clients in its share of the securities transferred under such repurchase agreements and in its share of proceeds from any repurchase or other disposition of such securities.
Investment Income, Gains and Losses, Expenses and Distributions
Interest income and expenses are accrued daily. Dividend income and distributions to shareholders are recorded on the ex-dividend date. Foreign dividends are recorded on the ex-dividend date or when the Fund is informed of the ex-dividend date. Distributions of net investment income are declared and paid annually. Non-cash dividends included in dividend income, if any, are recorded at fair value. Investment income, realized and unrealized gains and losses and certain fund-level expenses are allocated to each class based on relative average daily net assets, except that Class A Shares, Class B Shares, Class C Shares, Institutional Shares and Class K Shares may bear distribution services fees, shareholder services fees, account administration fees and certain transfer and dividend disbursing agent fees unique to those classes. Dividends are declared separately for each class. No class has preferential dividend rights; differences in per share dividend rates are generally due to differences in separate class expenses.
Premium and Discount Amortization
All premiums and discounts on fixed-income securities are amortized/accreted for financial statement purposes.
Federal Taxes
It is the Fund's policy to comply with the Subchapter M provision of the Internal Revenue Code (the "Code") and to distribute to shareholders each year substantially all of its income. Accordingly, no provision for federal income tax is necessary. The Fund adopted the provisions of Financial Accounting Standards Board (FASB) Interpretation No. 48 (FIN 48), "Accounting for Uncertainty in Income Taxes," on December 1, 2007. As of and during the year ended November 30, 2008, the Fund did not have a liability for any unrecognized tax expenses. The Fund recognizes interest and penalties, if any, related to tax liabilities as income tax expense in the Statement of Operations. As of November 30, 2008, tax years 2005 through 2008 remain subject to examination by the Fund's major tax jurisdictions, which include the United States of America and the commonwealth of Massachusetts.
Withholding taxes and where appropriate, deferred withholding taxes on foreign interest, dividends and capital gains have been provided for in accordance with the applicable country's tax rules and rates.
When-Issued and Delayed Delivery Transactions
The Fund may engage in when-issued or delayed delivery transactions. The Fund records when-issued securities on the trade date and maintains security positions such that sufficient liquid assets will be available to make payment for the securities purchased. Securities purchased on a when-issued or delayed delivery basis are marked to market daily and begin earning interest on the settlement date. Losses may occur on these transactions due to changes in market conditions or the failure of counterparties to perform under the contract.
Foreign Exchange Contracts
The Fund may enter into foreign exchange contracts for the delayed delivery of securities or foreign currency exchange transactions. The Fund may enter into foreign exchange contracts to protect assets against adverse changes in foreign currency exchange rates or exchange control regulations. Purchased contracts are used to acquire exposure to foreign currencies, whereas, contracts to sell are used to hedge the Fund's securities against currency fluctuations. Risks may arise upon entering into these transactions from the potential inability of counterparties to meet the terms of their commitments and from unanticipated movements in security prices or foreign exchange rates. The foreign exchange contracts are adjusted by the daily exchange rate of the underlying currency and any gains or losses are recorded for financial statement purposes as unrealized until the settlement date.
Foreign exchange contracts outstanding at period end are listed after the Fund's portfolio of investments.
Foreign Currency Translation
The accounting records of the Fund are maintained in U.S. dollars. All assets and liabilities denominated in foreign currencies (FCs) are translated into U.S. dollars based on the rates of exchange of such currencies against U.S. dollars on the date of valuation. Purchases and sales of securities, income and expenses are translated at the rate of exchange quoted on the respective date that such transactions are recorded. The Fund does not isolate that portion of the results of operations resulting from changes in foreign exchange rates on investments from the fluctuations arising from changes in market prices of securities held. Such fluctuations are included with the net realized and unrealized gain or loss from investments.
Reported net realized foreign exchange gains or losses arise from sales of portfolio securities, sales and maturities of short-term securities, sales of FCs, currency gains or losses realized between the trade and settlement dates on securities transactions, the difference between the amounts of dividends, interest and foreign withholding taxes recorded on the Fund's books and the U.S. dollar equivalent of the amounts actually received or paid. Net unrealized foreign exchange gains and losses arise from changes in the value of assets and liabilities other than investments in securities at fiscal year end, resulting from changes in the exchange rate.
Securities Lending
The Fund participates in a securities lending program providing for the lending of equity securities to qualified brokers. The Fund normally receives cash collateral for securities loaned that is invested in an affiliated money market fund. Collateral is maintained at a minimum level of 100% of the market value of investments loaned, plus interest, if applicable. Earnings on collateral are allocated between the securities lending agent, as a fee for its services under the program, and the Fund, according to agreed-upon rates.
As of November 30, 2008, securities subject to this type of arrangement and related collateral were as follows:
Market Value of
Securities Loaned
|
| Market Value
of Collateral
|
$33,076,365
|
| $39,547,898
|
Use of Estimates
The preparation of financial statements in conformity with GAAP requires management to make estimates and assumptions that affect the amounts of assets, liabilities, expenses and revenues reported in the financial statements. Actual results could differ from those estimated.
Other
Investment transactions are accounted for on a trade-date basis. Realized gains and losses from investment transactions are recorded on an identified-cost basis.
3. SHARES OF BENEFICIAL INTEREST
The following tables summarize share activity:
|
| Year Ended
11/30/2008
|
| Period Ended
11/30/2007 1
|
| Year Ended
12/31/2006
|
Class A Shares:
|
| Shares
|
|
|
| Amount
|
|
| Shares
|
|
|
| Amount
|
|
| Shares
|
|
|
| Amount
|
|
Shares sold
| | 7,427,045 | | | $ | 430,063,821 | | | 3,112,130 | | | $ | 209,137,003 | | | 1,997,292 | | | $ | 100,119,871 | |
Shares issued in connection
with tax-free transfer of assets from Federated
International
Capital Appreciation Fund
| | 1,892,702 | | | | 109,171,066 | | | - -- | | | | - -- | | | - -- | | | | - -- | |
Shares issued to shareholders in
payment of distributions declared
|
| 303,544 |
| | |
20,003,546 |
| | - -- | | | | - -- |
| | 94,849 |
| | | 5,301,119 |
|
Shares redeemed
|
| (4,908,680
| )
|
|
| (237,550,747
| )
|
| (520,500
| )
|
|
| (33,177,380
| )
|
| (382,667
| )
|
|
| (19,183,424
| )
|
NET CHANGE RESULTING FROM CLASS A SHARE TRANSACTIONS
|
| 4,714,611
|
|
| $
| 321,687,686
|
|
| 2,591,630
|
|
| $
| 175,959,623
|
|
| 1,709,474
|
|
| $
| 86,237,566
|
|
| | | | | | | | | | | | | | | | | | | | | |
|
| Year Ended
11/30/2008
|
| Period Ended
11/30/2007 1,2
|
| Year Ended
12/31/2006
|
Class B Shares:
|
| Shares
|
|
|
| Amount
|
|
| Shares
|
|
|
| Amount
|
|
| Shares
|
|
|
| Amount
|
|
Shares sold
| | 328,932 | | | $ | 19,496,392 | | | 162,097 | | | $ | 11,433,491 | | | - -- | | | $ | - -- | |
Shares issued in connection
with tax-free
transfer of assets from Federated
International Capital
Appreciation Fund
| | 281,322 | | | | 16,199,198 | | | - -- | | | | - -- | | | - -- | | | | - -- | |
Shares issued to shareholders
in payment
of distributions declared
|
| 7,140 |
| | | 469,898 |
| | - -- | | | | - -- |
| | - -- |
| | | - -- |
|
Shares redeemed
|
| (224,575
| )
|
|
| (11,644,527
| )
|
| (1,136
| )
|
|
| (80,072
| )
|
| - --
|
|
|
| - --
|
|
NET CHANGE RESULTING FROM CLASS B SHARE TRANSACTIONS
|
| 392,819
|
|
| $
| 24,520,961
|
|
| 160,961
|
|
| $
| 11,353,419
|
|
| - --
|
|
| $
| - --
|
|
|
| Year Ended
11/30/2008
|
| Period Ended
11/30/2007 1,2
|
| Year Ended
12/31/2006
|
Class C Shares:
|
| Shares
|
|
|
| Amount
|
|
| Shares
|
|
|
| Amount
|
|
| Shares
|
|
|
| Amount
|
|
Shares sold
| | 1,422,380 | | | $ | 83,483,147 | | | 428,876 | | | $ | 30,652,911 | | | - -- | | | $ | - -- | |
Shares issued in connection
with tax-free transfer
of assets from Federated
International
Capital Appreciation Fund
| | 640,468 | | | | 36,858,922 | | | - -- | | | | - -- | | | - -- | | | | - - | |
Shares issued to shareholders in payment
of distributions declared
|
| 16,332 | | | | 1,074,452 |
| | - -- | | | | - -- |
| | - -- |
| | | - -- |
|
Shares redeemed
|
| (607,899
| )
|
|
| (29,661,822
| )
|
| (2,625
| )
|
|
| (190,234
| )
|
| - --
|
|
|
| - --
|
|
NET CHANGE RESULTING FROM
CLASS C SHARE TRANSACTIONS
|
| 1,471,281
|
|
| $
| 91,754,699
|
|
| 426,251
|
|
| $
| 30,462,677
|
|
| - --
|
|
| $
| - --
|
|
| | | | | | | | | | | | | | | | | | | | | |
|
| Year Ended
11/30/2008
|
| Period Ended
11/30/2007 1,2
|
| Year Ended
12/31/2006
|
Institutional Shares:
|
| Shares
|
|
|
| Amount
|
|
| Shares
|
|
|
| Amount
|
|
| Shares
|
|
|
| Amount
|
|
Shares sold
| | 3,273,487 | | | $ | 183,352,416 | | | 413,522 | | | $ | 28,888,484 | | | - -- | | | $ | - -- | |
Shares issued to shareholders
in payment
of distributions declared
|
| 12,687 |
| | | 835,966 |
| | - -- | | | | - -- |
| | - -- |
| | | - -- |
|
Shares redeemed
|
| (999,537
| )
|
|
| (51,319,635
| )
|
| (479
| )
|
|
| (32,798
| )
|
| - --
|
|
|
| - --
|
|
NET CHANGE RESULTING FROM
INSTITUTIONAL SHARE TRANSACTIONS
|
| 2,286,637
|
|
| $
| 132,868,747
|
|
| 413,043
|
|
| $
| 28,855,686
|
|
| - --
|
|
| $
| - --
|
|
| | | | | | | | | | | | | | | | | | | | | |
|
| Year Ended
11/30/2008
|
| Period Ended
11/30/2007 1,2
|
| Year Ended
12/31/2006
|
Class K Shares:
|
| Shares
|
|
|
| Amount
|
|
| Shares
|
|
|
| Amount
|
|
| Shares
|
|
|
| Amount
|
|
Shares sold
| | 7,581 | | | $ | 346,393 | | | 329 | | | $ | 20,202 | | | - -- | | | $ | - -- | |
Shares issued to shareholders in payment of distributions declared
|
| 15 |
| | | 946 |
| | - -- | | | | - -- |
| | - -- |
| | | - -- |
|
Shares redeemed
|
| (575
| )
|
|
| (29,893
| )
|
| (10
| )
|
|
| (100
| )
|
| - --
|
|
|
| - --
|
|
NET CHANGE RESULTING FROM CLASS K SHARE TRANSACTIONS
|
| 7,021
|
|
| $
| 317,446
|
|
| 319
|
|
| $
| 20,102
|
|
| - --
|
|
| $
| - --
|
|
NET CHANGE RESULTING FROM SHARE TRANSACTIONS
|
| 8,872,369
|
|
| $
| 571,149,539
|
|
| 3,592,204
|
|
| $
| 246,651,507
|
|
| 1,709,474
|
|
| $
| 86,237,566
|
|
1 The Fund changed its fiscal year end from December 31 to November 30.
2 Reflects operations for the period from August 25, 2007 (start of performance) to November 30, 2007.
Redemption Fees
The Fund imposes a 2.00% redemption fee to shareholders of the Fund's Class A Shares, Class B Shares, Class C Shares, Institutional Shares and Class K Shares who redeem shares held for 30 days or less. Shares acquired by reinvestment of dividends or distributions of the Fund, or purchased pursuant to the Systematic Investment Program or withdrawn pursuant to the Systematic Withdrawal Program, will not be subject to the redemption fee. All redemption fees are recorded by the Fund as additions to paid-in capital. For the year ended November 30, 2008, the redemption fees for Class A Shares, Class B Shares, Class C Shares, Institutional Shares and Class K Shares amounted to $60,321, $2,801, $8,688, $12,079 and $12, respectively. For the period ended November 30, 2007, the redemption fees for Class A Shares amounted to $4,510. For the year ended December 31, 2006, the redemption fees for Class A Shares amounted to $24,637.
4. FEDERAL TAX INFORMATION
The timing and character of income and capital gain distributions are determined in accordance with income tax regulations, which may differ from GAAP. These differences are due in part to differing treatments for foreign currency transactions and litigation payments.
For the year ended November 30, 2008, permanent differences identified and reclassified among the components of net assets were as follows:
Increase (Decrease)
|
Undistributed
Net Investment
Income (Loss)
|
| Accumulated
Net Realized
Gain (Loss)
|
$(2,496,590)
|
| $2,496,590
|
Net investment income (loss), net realized gains (losses) and net assets were not affected by this reclassification.
The tax character of distributions as reported on the Statement of Changes in Net Assets for the year ended November 30, 2008, the period ended November 30, 2007 and the year ended December 31, 2006, was as follows:
|
| 2008
|
| 2007
|
| 2006
|
Ordinary income 1
|
| $ 8,060,864
|
| - --
|
| $2,997,359
|
Long-term capital gains
|
| $18,007,794
|
| - --
|
| $2,657,257
|
1 For tax purposes, short-term capital gain distributions are considered ordinary income distributions.
As of November 30, 2008, the components of distributable earnings on a tax basis were as follows:
Undistributed ordinary income
|
| $
| 30,824,916
|
|
Net unrealized depreciation
|
| $
| (330,838,334
| )
|
Capital loss carryforwards
|
| $
| (187,255,931
| )
|
At November 30, 2008, the cost of investments for federal tax purposes was $902,509,296. The net unrealized depreciation of investments for federal tax purposes excluding any unrealized depreciation resulting from changes in foreign currency exchange rates and outstanding foreign currency commitments was $330,823,366. This consists of net unrealized appreciation from investments for those securities having an excess of value over cost of $4,365,742 and net unrealized depreciation from investments for those securities having an excess of cost over value of $335,189,108.
At November 30, 2008, the Fund had a capital loss carryforward of $187,255,931 which will reduce the Fund's taxable income arising from future net realized gains on investments, if any, to the extent permitted by the Code and thus will reduce the amount of distributions to shareholders which would otherwise be necessary to relieve the Fund of any liability for federal income tax. Pursuant to the Code, such capital loss carryforward will expire in 2016.
5. INVESTMENT ADVISER FEE AND OTHER TRANSACTIONS WITH AFFILIATES
Investment Adviser Fee
Federated Global Investment Management Corp. is the Fund's investment adviser (the "Adviser"). The advisory agreement between the Fund and the Adviser provides for an annual fee equal to 1.00% of the Fund's average daily net assets. Under the investment advisory contract, which is subject to annual review by the Trustees, the Adviser will waive all or a portion of the advisory fee (excluding interest, taxes and brokerage commissions) in order to contractually limit the Fund's Class A Shares aggregate annual operating expenses to no more than 1.70% based on average daily net assets. The Adviser agreed to keep this contractual limitation in place through August 24, 2009.
In addition, after fulfilling its contractual commitment and subject to the terms described in the Expense Limitation note, the Adviser may voluntarily choose to waive any portion of its fee. The Adviser can modify or terminate this voluntary waiver at any time at its sole discretion. For the year ended November 30, 2008, the Adviser voluntarily waived $580,595 of its fee. In addition, an affiliate of the adviser reimbursed $28,555 of transfer and dividend disbursing agent fees and expenses.
Prior to close of business on August 24, 2007, the Predecessor Fund's investment adviser was Rochdale Investment Management LLC. After the close of business on August 24, 2007, the Predecessor Fund was reorganized into the Fund. The annual rate did not change due to this reorganization. For the period from January 1, 2007 to August 24, 2007, the net fee paid to Rochdale Investment Management LLC was $2,092,602.
Administrative Fee
Federated Administrative Services (FAS), under the Administrative Services Agreement, provides the Fund with administrative personnel and services. The fee paid to FAS is based on the average aggregate daily net assets of certain Federated funds as specified below:
Administrative Fee
|
| Average Aggregate Daily Net Assets
of the Federated Funds
|
0.150%
|
| on the first $5 billion
|
0.125%
|
| on the next $5 billion
|
0.100%
|
| on the next $10 billion
|
0.075%
|
| on assets in excess of $20 billion
|
The administrative fee received during any fiscal year shall be at least $150,000 per portfolio and $40,000 per each additional class of Shares. Subject to the terms described in the Expense Limitation note, FAS may voluntarily choose to waive any portion of its fee. FAS can modify or terminate this voluntary waiver at any time at its sole discretion. For the year ended November 30, 2008, the net fee paid to FAS was 0.077% of average daily net assets of the Fund. FAS waived $17,615 of its fee.
Prior to close of business on August 24, 2007, U.S. Bancorp Fund Services, LLC provided administrative services to the Predecessor Fund. For the period from January 1, 2007 to August 24, 2007, the net fee paid to U.S. Bancorp Fund Services, LLC was $127,670.
Distribution Services Fee
The Fund has adopted a Distribution Plan (the "Plan") pursuant to Rule 12b-1 under the Act. Under the terms of the Plan, the Fund will compensate Federated Securities Corp. (FSC), the principal distributor, from the daily net assets of the Fund's Class A Shares, Class B Shares, Class C Shares and Class K Shares to finance activities intended to result in the sale of these shares. The Plan provides that the Fund may incur distribution expenses at the following percentages of average daily net assets annually, to compensate FSC:
Share Class Name
|
| Percentage of Average Daily
Net Assets of Class
|
Class A Shares
|
| 0.05%
|
Class B Shares
|
| 0.75%
|
Class C Shares
|
| 0.75%
|
Class K Shares
|
| 0.50%
|
Subject to the terms described in the Expense Limitation note, FSC may voluntarily choose to waive any portion of its fee. FSC can modify or terminate this voluntary waiver at any time at its sole discretion. When FSC receives fees, it may pay some or all of them to financial intermediaries whose customers purchase shares. For the year ended November 30, 2008, FSC retained $2,718 of fees paid by the Fund.
On November 15, 2007, the Fund's Trustees approved an amendment to the Plan to reduce the distribution services fee for the Fund's Class A Shares from 0.25% to 0.05%. The amendment to the Plan became effective for the Fund's Class A Shares on January 1, 2008. For the year ended November 30, 2008, the Fund's Class A Shares did not incur a distribution services fee.
Prior to close of business on August 24, 2007, Rochdale Investment Management LLC was the principal distributor for the Predecessor Fund. For the period from January 1, 2007 to August 24, 2007, the net fee paid to Rochdale Investment Management LLC was $523,150.
Sales Charges
For the year ended November 30, 2008, FSC retained $179,230 in sales charges from the sale of Class A Shares. FSC also retained $5,269 of contingent deferred sales charges relating to redemptions of Class A Shares and $22,794 relating to redemptions of Class C Shares. See "What Do Shares Cost?" in the Prospectus.
For the period from August 25, 2007 to November 30, 2007, FSC retained $143,596 in sales charges from the sale of Class A Shares. FSC also retained $171 of contingent deferred sales charges relating to redemptions of Class C Shares.
Prior to close of business on August 24, 2007, RIM Securities LLC, an affiliate of Rochdale Investment Management LLC, served as distributor of the Predecessor Fund's shares. For the period from January 1, 2007 to August 24, 2007, RIM Securities LLC retained $12,304 in sales charges from the sale of the Predecessor Fund's shares.
Shareholder Services Fee
The Fund may pay fees (Service Fees) up to 0.25% of the average daily net assets of the Fund's Class A Shares, Class B Shares and Class C Shares to financial intermediaries or to Federated Shareholder Services Company (FSSC) for providing services to shareholders and maintaining shareholder accounts. Financial intermediaries may include a company affiliated with management of Federated Investors, Inc. A financial intermediary affiliated with management of Federated Investors, Inc. received $57,619 of Service Fees for the year ended November 30, 2008. Subject to the terms described in the Expense Limitation note, FSSC may voluntarily reimburse the Fund for shareholder services fees. This voluntary reimbursement can be modified or terminated at any time. For the year ended November 30, 2008, FSSC did not receive any fees paid by the Fund.
Expense Limitation
The Adviser and its affiliates (which may include FSC, FAS and FSSC) have voluntarily agreed to waive their fees and/or reimburse expenses so that the total operating expenses (as shown in the financial highlights) paid by the Fund's Class A Shares, Class B Shares, Class C Shares, Institutional Shares and Class K Shares (after the voluntary waivers and reimbursements) will not exceed 1.50%, 2.29%, 2.28%, 1.19% and 1.95%, respectively, for the fiscal year ending November 30, 2009. Although these actions are voluntary, the Adviser and its affiliates have agreed to continue these waivers and/or reimbursements at least through January 31, 2010.
General
Certain of the Officers and Trustees of the Fund are Officers and Directors or Trustees of the above companies.
Transactions with Affiliated Companies
Affiliated holdings are mutual funds which are managed by the Adviser or an affiliate of the Adviser. The Adviser has agreed to reimburse the Fund for certain investment adviser fees as a result of transactions in other affiliated mutual funds. For the year ended November 30, 2008, the Adviser reimbursed $83,873. Transactions with the affiliated company during the year ended November 30, 2008 were as follows:
Affiliate
|
| Balance of
Shares
Held
11/30/2007
|
| Purchases/
Additions
|
| Sales/
Reductions
|
| Balance of
Shares Held
11/30/2008
|
| Value
|
| Dividend
Income
|
Prime Value Obligations Fund, Institutional Shares
|
| 44,763,597
|
| 1,282,610,795
|
| 1,256,718,076
|
| 70,656,316
|
| $70,656,316
|
| $493,079
|
6. INVESTMENT TRANSACTIONS
Purchases and sales of investments, excluding long-term U.S. government securities and short-term obligations, for the year ended November 30, 2008, were as follows:
Purchases
|
| $
| 1,111,775,934
|
Sales
|
| $
| 547,100,947
|
7. CONCENTRATION OF RISK
The Fund invests in securities of non-U.S. issuers. Political or economic developments may have an effect on the liquidity and volatility of portfolio securities and currency holdings.
8. LINE OF CREDIT
The Fund participates in a $100,000,000 unsecured, uncommitted revolving line of credit (LOC) agreement with PNC Bank. The LOC was made available for extraordinary or emergency purposes, primarily for financing redemption payments. Borrowings are charged interest at a rate of 0.65% over the federal funds rate. As of November 30, 2008, there were no outstanding loans. During the year ended November 30, 2008, the Fund did not utilize the LOC.
9. INTERFUND LENDING
Pursuant to an Exemptive Order issued by the Securities and Exchange Commission (SEC), the Fund, along with other funds advised by subsidiaries of Federated Investors, Inc., may participate in an interfund lending program. This program provides an alternative credit facility allowing the funds to borrow from other participating affiliated funds. As of November 30, 2008, there were no outstanding loans. During the year ended November 30, 2008, the program was not utilized.
10. LEGAL PROCEEDINGS
Since October 2003, Federated Investors, Inc. and related entities (collectively, "Federated") and various Federated funds ("Federated Funds") have been named as defendants in several class action lawsuits now pending in the United States District Court for the District of Maryland. The lawsuits were purportedly filed on behalf of people who purchased, owned and/or redeemed shares of Federated-sponsored mutual funds during specified periods beginning November 1, 1998. The suits are generally similar in alleging that Federated engaged in illegal and improper trading practices including market timing and late trading in concert with certain institutional traders, which allegedly caused financial injury to the mutual fund shareholders. These lawsuits began to be filed shortly after Federated's first public announcement that it had received requests for information on shareholder trading activities in the Federated Funds from the SEC, the Office of the New York State Attorney General ("NYAG") and other authorities. In that regard, on November 28, 2005, Federated announced that it had reached final settlements with the SEC and the NYAG with respect to those matters. As Federated previously reported in 2004, it has already paid approximately $8.0 million to certain funds as determined by an independent consultant. As part of these settlements, Federated agreed to pay for the benefit of fund shareholders additional disgorgement and a civil money penalty in the aggregate amount of an additional $72 million. Federated entities have also been named as defendants in several additional lawsuits that are now pending in the United States District Court for the Western District of Pennsylvania, alleging, among other things, excessive advisory and Rule 12b-1 fees. The Board of the Federated Funds retained the law firm of Dickstein Shapiro LLP to represent the Federated Funds in these lawsuits. Federated and the Federated Funds and their respective counsel have been defending this litigation and none of the Federated Funds remains a defendant in any of the lawsuits (though some could potentially receive any recoveries as nominal defendants). Additional lawsuits based upon similar allegations may be filed in the future. The potential impact of these lawsuits, all of which seek unquantified damages, attorneys' fees and expenses, and future potential similar suits is uncertain. Although we do not believe that these lawsuits will have a material adverse effect on the Federated Funds, there can be no assurance that these suits, the ongoing adverse publicity and/or other developments resulting from the regulatory investigations will not result in increased Federated Fund redemptions, reduced sales of Federated Fund shares or other adverse consequences for the Federated Funds.
11. RECENT ACCOUNTING PRONOUNCEMENTS
In March 2008, FASB released Statement of Financial Accounting Standards No. 161, "Disclosures about Derivative Instruments and Hedging Activities" (FAS 161). FAS 161 requires qualitative disclosures about objectives and strategies for using derivatives, quantitative disclosures about fair value amounts of gains and losses on derivative instruments and disclosures about credit-risk-related contingent features in derivative agreements. FAS 161 is effective for fiscal years and interim periods beginning after November 15, 2008. At this time, management is evaluating the implications of adopting FAS 161 and its impact on the financial statements and the accompanying notes.
12. FEDERAL TAX INFORMATION (UNAUDITED)
For the year ended November 30, 2008, the amount of long-term capital gains designated by the Fund was $18,007,794.
For the fiscal year ended November 30, 2008, 99.86% of total ordinary income (including short-term capital gain) distributions made by the Fund are qualifying dividends which may be subject to a maximum tax rate of 15%, as provided for by the Jobs and Growth Tax Relief Act of 2003. Complete information is reported in conjunction with the reporting of your distributions on Form 1099-DIV.
To the extent the Fund meets the requirements of Section 853 of the Internal Revenue Code of 1986, as amended, the Fund will pass through to its shareholders credits for foreign taxes paid.
For the fiscal year ended November 30, 2008, the Fund derived $37,110,853 of gross income from foreign sources and paid foreign taxes of $4,780,906.
Report of Independent Registered Public Accounting Firm
TO THE BOARD OF TRUSTEES OF FEDERATED EQUITY FUNDS AND THE SHAREHOLDERS OF FEDERATED INTERCONTINENTAL FUND:
We have audited the accompanying statement of assets and liabilities, including the portfolio of investments, of the Federated InterContinental Fund (the "Fund"), a portfolio of Federated Equity Funds, as of November 30, 2008, and the related statement of operations for the year then ended, the statements of changes in net assets for each of the years or period in the two-year period then ended, and the financial highlights for each of the years or period in the two-year period then ended. These financial statements and financial highlights are the responsibility of the Fund's management. Our responsibility is to express an opinion on these financial statements and financial highlights based on our audits. The financial highlights for the periods presented prior to January 1, 2007, were audited by other independent registered public accountants whose report thereon dated February 26, 2007, expressed an unqualified opinion on those statements.
We conducted our audits in accordance with the standards of the Public Company Accounting Oversight Board (United States). Those standards require that we plan and perform the audit to obtain reasonable assurance about whether the financial statements and financial highlights are free of material misstatement. An audit includes examining, on a test basis, evidence supporting the amounts and disclosures in the financial statements. Our procedures included confirmation of securities owned as of November 30, 2008 by correspondence with the custodian and brokers. An audit also includes assessing the accounting principles used and significant estimates made by management, as well as evaluating the overall financial statement presentation. We believe that our audits provide a reasonable basis for our opinion.
In our opinion, the financial statements and financial highlights referred to above present fairly, in all material respects, the financial position of the Federated InterContinental Fund as of November 30, 2008, and the results of its operations for the year then ended, the changes in its net assets for each of the years in the two-year period then ended, and the financial highlights for each of the years or period in the two-year period then ended, in conformity with U.S. generally accepted accounting principles.
KPMG LLP
Boston, Massachusetts
January 23, 2009
Board of Trustees and Trust Officers
The Board is responsible for managing the Trust's business affairs and for exercising all the Trust's powers except those reserved for the shareholders. The following tables give information about each Board member and the senior officers of the Fund. Where required, the tables separately list Board members who are "interested persons" of the Fund (i.e., "Interested" Board members) and those who are not (i.e., "Independent" Board members). Unless otherwise noted, the address of each person listed is Federated Investors Tower, 1001 Liberty Avenue, Pittsburgh, PA 15222. The address of all Independent Board members listed is 4000 Ericsson Drive, Warrendale, PA 15086-7561; Attention: Mutual Fund Board. As of December 31, 2008, the Trust comprised eight portfolios, and the Federated Fund Complex consisted of 40 investment companies (comprising 149 portfolios). Unless otherwise noted, each Officer is elected annually. Unless otherwise noted, each Board member oversees all portfolios in the Federated Fund Complex and serves for an indefinite term. The Fund's Statement of Additional Information includes additional information about Trust Trustees and is available, without charge and upon request, by calling 1-800-341-7400.
INTERESTED TRUSTEES BACKGROUND
|
|
|
Name
Birth Date
Positions Held with Trust
Date Service Began
|
| Principal Occupation(s) for Past Five Years,
Other Directorships Held and Previous Position(s)
|
John F. Donahue*
Birth Date: July 28, 1924
TRUSTEE
Began serving: April 1984 | | Principal Occupations: Director or Trustee of the Federated Fund Complex; Chairman and Director, Federated Investors, Inc.; Chairman of the Federated Fund Complex's Executive Committee.
Previous Positions: Chairman of the Federated Fund Complex; Trustee, Federated Investment Management Company; Chairman and Director, Federated Investment Counseling. |
|
|
|
J. Christopher Donahue*
Birth Date: April 11, 1949
PRESIDENT AND TRUSTEE
Began serving: January 2000 | | Principal Occupations: Principal Executive Officer and President of the Federated Fund Complex; Director or Trustee of some of the Funds in the Federated Fund Complex; President, Chief Executive Officer and Director, Federated Investors, Inc.; Chairman and Trustee, Federated Investment Management Company; Trustee, Federated Investment Counseling; Chairman and Director, Federated Global Investment Management Corp.; Chairman, Federated Equity Management Company of Pennsylvania and Passport Research, Ltd. (investment advisory subsidiary of Federated); Trustee, Federated Shareholder Services Company; Director, Federated Services Company.
Previous Positions: President, Federated Investment Counseling; President and Chief Executive Officer, Federated Investment Management Company, Federated Global Investment Management Corp. and Passport Research, Ltd. |
|
|
|
* Family relationships and reasons for "interested" status: John F. Donahue is the father of J. Christopher Donahue; both are "interested" due to their beneficial ownership of shares of Federated Investors, Inc. and the positions they hold with Federated and its subsidiaries.
INDEPENDENT TRUSTEES BACKGROUND
|
|
|
Name
Birth Date
Positions Held with Trust
Date Service Began
|
| Principal Occupation(s) for Past Five Years,
Other Directorships Held and Previous Position(s)
|
Thomas G. Bigley
Birth Date: February 3, 1934
TRUSTEE
Began serving: October 1995 | | Principal Occupation: Director or Trustee of the Federated Fund Complex.
Other Directorships Held: Director, Member of Executive Committee, Children's Hospital of Pittsburgh; Director, University of Pittsburgh.
Previous Position: Senior Partner, Ernst & Young LLP. |
|
|
|
John T. Conroy, Jr.
Birth Date: June 23, 1937
TRUSTEE
Began serving: November 1991 | | Principal Occupations: Director or Trustee of the Federated Fund Complex; Chairman of the Board, Investment Properties Corporation; Partner or Trustee in private real estate ventures in Southwest Florida; Assistant Professor in Theology at Barry University and Blessed Edmund Rice School for Pastoral Ministry.
Previous Positions: President, Investment Properties Corporation; Senior Vice President, John R. Wood and Associates, Inc., Realtors; President, Naples Property Management, Inc. and Northgate Village Development Corporation. |
|
|
|
Nicholas P. Constantakis
Birth Date: September 3, 1939
TRUSTEE
Began serving: February 1998 | | Principal Occupation: Director or Trustee of the Federated Fund Complex.
Other Directorships Held: Director and Chairman of the Audit Committee, Michael Baker Corporation (engineering and energy services worldwide).
Previous Position: Partner, Andersen Worldwide SC. |
|
|
|
John F. Cunningham
Birth Date: March 5, 1943
TRUSTEE
Began serving: January 1999 | | Principal Occupations: Director or Trustee of the Federated Fund Complex.
Other Directorships Held: Chairman, President and Chief Executive Officer, Cunningham & Co., Inc. (strategic business consulting); Trustee Associate, Boston College.
Previous Positions: Director, QSGI, Inc. (technology services company); Director, Redgate Communications and EMC Corporation (computer storage systems); Chairman of the Board and Chief Executive Officer, Computer Consoles, Inc.; President and Chief Operating Officer, Wang Laboratories; Director, First National Bank of Boston; Director, Apollo Computer, Inc. |
|
|
|
|
|
|
Name
Birth Date
Positions Held with Trust
Date Service Began
|
| Principal Occupation(s) for Past Five Years,
Other Directorships Held and Previous Position(s)
|
Peter E. Madden
Birth Date: March 16, 1942
TRUSTEE
Began serving: November 1991 | | Principal Occupation: Director or Trustee of the Federated Fund Complex.
Other Directorships Held: Board of Overseers, Babson College.
Previous Positions: Representative, Commonwealth of Massachusetts General Court; President, State Street Bank and Trust Company and State Street Corporation (retired); Director, VISA USA and VISA International; Chairman and Director, Massachusetts Bankers Association; Director, Depository Trust Corporation; Director, The Boston Stock Exchange. |
|
|
|
Charles F. Mansfield, Jr.
Birth Date: April 10, 1945
TRUSTEE
Began serving: January 1999 | | Principal Occupations: Director or Trustee of the Federated Fund Complex; Management Consultant.
Previous Positions: Chief Executive Officer, PBTC International Bank; Partner, Arthur Young & Company (now Ernst & Young LLP); Chief Financial Officer of Retail Banking Sector, Chase Manhattan Bank; Senior Vice President, HSBC Bank USA (formerly, Marine Midland Bank); Vice President, Citibank; Assistant Professor of Banking and Finance, Frank G. Zarb School of Business, Hofstra University; Executive Vice President DVC Group, Inc. (marketing, communications and technology). |
|
|
|
R. James Nicholson
Birth Date: February 4, 1938
TRUSTEE
Began serving: January 2008 | | Principal Occupations: Director or Trustee of the Federated Fund Complex; Senior Counsel, Brownstein Hyatt Farber Schrek, P.C.; Former Secretary of the U.S. Dept. of Veterans Affairs; Former U.S. Ambassador to the Holy See; Former Chairman of the Republican National Committee.
Other Directorships Held : Director, Horatio Alger Association.
Previous Positions: Colonel, U.S. Army Reserve; Partner, Calkins, Kramer, Grimshaw and Harring, P.C.; General Counsel, Colorado Association of Housing and Building; Chairman and CEO, Nicholson Enterprises, Inc. (real estate holding company); Chairman and CEO, Renaissance Homes of Colorado. |
|
|
|
Thomas M. O'Neill
Birth Date: June 14, 1951
TRUSTEE
Began serving: October 2006 | | Principal Occupations: Director or Trustee of the Federated Fund Complex; Managing Director and Partner, Navigator Management Company, L.P. (investment and strategic consulting).
Other Directorships Held: Director, Midway Pacific (lumber); Board of Overseers, Children's Hospital of Boston; Visiting Committee on Athletics, Harvard College.
Previous Positions: Chief Executive Officer and President, Managing Director and Chief Investment Officer, Fleet Investment Advisors; President and Chief Executive Officer, Aeltus Investment Management, Inc.; General Partner, Hellman, Jordan Management Co., Boston, MA; Chief Investment Officer, The Putnam Companies, Boston, MA; Credit Analyst and Lending Officer, Fleet Bank. |
|
|
|
|
|
|
Name
Birth Date
Positions Held with Trust
Date Service Began
|
| Principal Occupation(s) for Past Five Years,
Other Directorships Held and Previous Position(s)
|
John S. Walsh
Birth Date: November 28, 1957
TRUSTEE
Began serving: January 1999 | | Principal Occupations: Director or Trustee of the Federated Fund Complex; President and Director, Heat Wagon, Inc. (manufacturer of construction temporary heaters); President and Director, Manufacturers Products, Inc. (distributor of portable construction heaters); President, Portable Heater Parts, a division of Manufacturers Products, Inc.
Previous Position: Vice President, Walsh & Kelly, Inc. |
|
|
|
James F. Will
Birth Date: October 12, 1938
TRUSTEE
Began serving: April 2006 | | Principal Occupations: Director or Trustee of the Federated Fund Complex; formerly, Vice Chancellor and President, Saint Vincent College.
Other Directorships Held: Trustee, Saint Vincent College; Alleghany Corporation.
Previous Positions: Chairman, President and Chief Executive Officer, Armco, Inc.; President and Chief Executive Officer, Cyclops Industries; President and Chief Operating Officer, Kaiser Steel Corporation. |
|
|
|
OFFICERS
|
|
|
Name
Birth Date
Address
Positions Held with Trust
Date Service Began
|
| Principal Occupation(s) for Past Five Years and Previous Position(s)
|
John W. McGonigle
Birth Date: October 26, 1938
EXECUTIVE VICE PRESIDENT
AND SECRETARY
Began serving: April 1984 | | Principal Occupations: Executive Vice President and Secretary of the Federated Fund Complex; Vice Chairman, Executive Vice President, Secretary and Director, Federated Investors, Inc.
Previous Positions: Trustee, Federated Investment Management Company and Federated Investment Counseling; Director, Federated Global Investment Management Corp., Federated Services Company and Federated Securities Corp. |
|
|
|
|
|
|
Name
Birth Date
Address
Positions Held with Trust
Date Service Began
|
| Principal Occupation(s) for Past Five Years and Previous Position(s)
|
Richard A. Novak
Birth Date: December 25, 1963 TREASURER
Began serving: January 2006 | | Principal Occupations: Principal Financial Officer and Treasurer of the Federated Fund Complex; Senior Vice President, Federated Administrative Services; Financial and Operations Principal for Federated Securities Corp., Edgewood Services, Inc. and Southpointe Distribution Services, Inc.
Previous Positions: Controller of Federated Investors, Inc.; Vice President, Finance of Federated Services Company; held various financial management positions within The Mercy Hospital of Pittsburgh; Auditor, Arthur Andersen & Co. |
|
|
|
Richard B. Fisher
Birth Date: May 17, 1923
VICE PRESIDENT
Began serving: April 1984 | | Principal Occupations: Vice Chairman or Vice President of some of the Funds in the Federated Fund Complex; Vice Chairman, Federated Investors, Inc.; Chairman, Federated Securities Corp.
Previous Positions: President and Director or Trustee of some of the Funds in the Federated Fund Complex; Executive Vice President, Federated Investors, Inc.; Director and Chief Executive Officer, Federated Securities Corp. |
|
|
|
Brian P. Bouda
Birth Date: February 28, 1947
CHIEF COMPLIANCE OFFICER
and SENIOR VICE PRESIDENT
Began serving: January 2006 | | Principal Occupations: Senior Vice President and Chief Compliance Officer of the Federated Fund Complex; Vice President and Chief Compliance Officer of Federated Investors, Inc. and Chief Compliance Officer of its subsidiaries. Mr. Bouda joined Federated in 1999 and is a member of the American Bar Association and the State Bar Association of Wisconsin. |
|
|
|
Stephen F. Auth
Birth Date: September 3, 1956
450 Lexington Avenue
Suite 3700
New York, NY 10017-3943
CHIEF INVESTMENT OFFICER
Began serving: November 2002 | | Principal Occupations: Chief Investment Officer of this Fund and various other Funds in the Federated Fund Complex; Executive Vice President, Federated Investment Counseling, Federated global Investment Management Corp. and Federated Equity Management Company of Pennsylvania.
Previous Positions: Executive Vice President, Federated Investment Management Company, and Passport Research, Ltd. (Investment advisory subsidiary of Federated); Senior Vice President, Global Portfolio Management Services Division; Senior Vice President, Federated Investment Management Company and Passport Research, Ltd.; Senior Managing Director and Portfolio Manager, Prudential Investments. |
|
|
|
|
|
|
Name
Birth Date
Address
Positions Held with Trust
Date Service Began
|
| Principal Occupation(s) for Past Five Years and Previous Position(s)
|
Lawrence Auriana
Birth Date: January 8, 1944
140 East 45 th Street
New York, NY 10017
VICE PRESIDENT
Began serving: November 2001 | | Principal Occupations: Lawrence is Vice President of the Trust. Mr. Auriana joined Federated in April 2001 as Co-Head of Investments/Federated Kaufmann. From August 1984 to April 2001, Mr. Auriana was President and Treasurer of Edgemont Asset Management Corp., and Chairman of the Board and Portfolio Manager to The Kaufmann Fund, Inc. (predecessor to the Federated Kaufmann Fund). Mr. Auriana earned a B.S. in economics from Fordham University and has been engaged in the securities business since 1965. |
|
|
|
Walter C. Bean
Birth Date : June 22, 1945
VICE PRESIDENT
Began serving: November 2006 | | Principal Occupations: Walter C. Bean is Vice President of the Trust. Mr. Bean is a Senior Vice President, Senior Portfolio Manager and the Head of the Income and Value Equity Management Teams of the Fund's Adviser. Mr. Bean joined Federated in 2000. His previous associations included: various investment management and research positions with C.S. McKee & Company, First Chicago Investment Advisors, CIGNA Investment Advisors and Mellon Bank. Mr. Bean earned a Bachelors Degree in Business Administration from Ohio University and an M.B.A. from the Pennsylvania State University. Mr. Bean is a Chartered Financial Analyst and has 39 years of investment experience. |
|
|
|
Hans P. Utsch
Birth Date: July 3, 1936
140 East 45 th Street
New York, NY 10017
VICE PRESIDENT
Began serving: November 2001 | | Principal Occupations: Hans P. Utsch is Vice President of the Trust. Mr. Utsch joined Federated in April 2001 as Co-Head of Investments/Federated Kaufmann. From August 1984 to April 2001, Mr. Utsch was Chairman of the Board and Secretary of Edgemont Asset Management Corp., and President and Portfolio Manager to The Kaufmann Fund, Inc. (predecessor to the Federated Kaufmann Fund). Mr. Utsch graduated from Amherst College and holds an M.B.A. from Columbia University. He has been engaged in the securities business since 1962. |
|
|
|
Evaluation and Approval of Advisory Contract - May 2008
FEDERATED INTERCONTINENTAL FUND (THE "FUND")
The Fund's Board reviewed the Fund's investment advisory contract at meetings held in May 2008. The Board's decision regarding the contract reflects the exercise of its business judgment on whether to continue the existing arrangements.
In this connection, the Federated funds' Board had previously appointed a Senior Officer, whose duties include specified responsibilities relating to the process by which advisory fees are to be charged to a Federated fund. The Senior Officer has the authority to retain consultants, experts, or staff as may be reasonably necessary to assist in the performance of his duties, reports directly to the Board, and may be terminated only with the approval of a majority of the independent members of the Board. The Senior Officer prepared and furnished to the Board an independent, written evaluation that covered topics discussed below. The Board considered that evaluation, along with other information, in deciding to approve the advisory contract.
During its review of the contract, the Board considered compensation and benefits received by the Adviser. This included the fees received for services provided to the Fund by other entities in the Federated organization and research services received by the Adviser from brokers that execute Federated fund trades, as well as advisory fees. The Board is also familiar with and considered judicial decisions concerning allegedly excessive investment advisory fees, which have indicated that the following factors may be relevant to an Adviser's fiduciary duty with respect to its receipt of compensation from a fund: the nature and quality of the services provided by the Adviser, including the performance of the fund; the Adviser's cost of providing the services; the extent to which the Adviser may realize "economies of scale" as a fund grows larger; any indirect benefits that may accrue to the Adviser and its affiliates as a result of the Adviser's relationship with a fund; performance and expenses of comparable funds; and the extent to which the independent Board members are fully informed about all facts the Board deems relevant bearing on the Adviser's services and fees. The Board further considered management fees (including any components thereof) charged to institutional and other clients of the Adviser for what might be viewed as like services, and the cost to the Adviser and its affiliates of supplying services pursuant to the management fee agreements, excluding any intra-corporate profit and profit margins of the Adviser and its affiliates for supplying such services. The Board was aware of these factors and was guided by them in its review of the Fund's advisory contract to the extent it considered them to be appropriate and relevant, as discussed further below.
The Board considered and weighed these circumstances in light of its substantial accumulated experience in governing the Fund and working with Federated on matters relating to the Federated funds, and was assisted in its deliberations by independent legal counsel. Throughout the year, the Board has requested and received substantial and detailed information about the Fund and the Federated organization that was in addition to the extensive materials that comprise and accompany the Senior Officer's evaluation. Federated provided much of this information at each regular meeting of the Board, and furnished additional reports in connection with the particular meeting at which the Board's formal review of the advisory contract occurred. Between regularly scheduled meetings, the Board also received information on particular matters as the need arose. Thus, the Board's consideration of the advisory contract included review of the Senior Officer's evaluation, accompanying data and additional reports covering such matters as: the Adviser's investment philosophy, revenue, profitability, personnel and processes; investment and operating strategies; the Fund's short- and long-term performance (in absolute terms, both on a gross basis and net of expenses, as well as in relationship to its particular investment program and certain competitor or "peer group" funds and/or other benchmarks, as appropriate), and comments on the reasons for performance; the Fund's investment objectives; the Fund's expenses (including the advisory fee itself and the overall expense structure of the Fund, both in absolute terms and relative to similar and/or competing funds, with due regard for contractual or voluntary expense limitations); the use and allocation of brokerage commissions derived from trading the Fund's portfolio securities (if any); and the nature, quality and extent of the advisory and other services provided to the Fund by the Adviser and its affiliates. The Board also considered the preferences and expectations of Fund shareholders and their relative sophistication; the continuing state of competition in the mutual fund industry and market practices; the range of comparable fees for similar funds in the mutual fund industry; the Fund's relationship to the Federated family of funds which include a comprehensive array of funds with different investment objectives, policies and strategies which are available for exchange without the incurrence of additional sales charges; compliance and audit reports concerning the Federated funds and the Federated companies that service them (including communications from regulatory agencies), as well as Federated's responses to any issues raised therein; and relevant developments in the mutual fund industry and how the Federated funds and/or Federated are responding to them. The Board's evaluation process is evolutionary. The criteria considered and the emphasis placed on relevant criteria change in recognition of changing circumstances in the mutual fund marketplace.
With respect to the Fund's performance and expenses in particular, the Board has found the use of comparisons to other mutual funds with comparable investment programs to be particularly useful, given the high degree of competition in the mutual fund business. The Board focused on comparisons with other similar mutual funds more heavily than non-mutual fund products or services because, simply put, they are more relevant. For example, other mutual funds are the products most like the Fund, they are readily available to Fund shareholders as alternative investment vehicles, and they are the type of investment vehicle in fact chosen and maintained by the Fund's investors. The range of their fees and expenses therefore appears to be a generally reliable indication of what consumers have found to be reasonable in the precise marketplace in which the Fund competes. The Fund's ability to deliver competitive performance when compared to its peer group was a useful indicator of how the Adviser is executing the Fund's investment program, which in turn assisted the Board in reaching a conclusion that the nature, extent, and quality of the Adviser's investment management services were such as to warrant continuation of the advisory contract. In this regard, the Senior Officer has reviewed Federated's fees for providing advisory services to products outside the Federated family of funds (e.g., institutional and separate accounts). He concluded that mutual funds and institutional accounts are inherently different products. Those differences include, but are not limited to, different types of targeted investors; being subject to different laws and regulations; different legal structures; different average account sizes; different associated costs; and different portfolio management techniques made necessary by different cash flows. The Senior Officer did not consider these fee schedules to be significant in determining the appropriateness of mutual fund advisory contracts.
The Senior Officer reviewed reports compiled by Federated, using data supplied by independent fund ranking organizations, regarding the performance of, and fees charged by, other mutual funds, noting his view that comparisons to fund peer groups are highly important in judging the reasonableness of proposed fees.
For both the one- and three-year periods ending December 31, 2007, the Fund's performance was above the median of the relevant peer group.
The Board also received financial information about Federated, including reports on the compensation and benefits Federated derived from its relationships with the Federated funds. These reports covered not only the fees under the advisory contracts, but also fees received by Federated's subsidiaries for providing other services to the Federated funds under separate contracts (e.g., for serving as the Federated funds' administrator). The reports also discussed any indirect benefit Federated may derive from its receipt of research services from brokers who execute Federated fund trades. In addition, the Board considered the fact that, in order for a fund to be competitive in the marketplace, Federated and its affiliates frequently waived fees and/or reimbursed expenses and have disclosed to fund investors and/or indicated to the Board their intention to do so in the future, where appropriate.
Federated furnished reports, requested by the Senior Officer, that reported revenues on a fund-by-fund basis and made estimates of the allocation of expenses on a fund-by-fund basis, using allocation methodologies specified by the Senior Officer. The Senior Officer noted that, although they may apply consistent allocation processes, the inherent difficulties in allocating costs (and the unavoidable arbitrary aspects of that exercise) and the lack of consensus on how to allocate those costs may render such allocation reports unreliable. The allocation reports were considered in the analysis by the Board but were determined to be of limited use.
The Board and the Senior Officer also reviewed a report compiled by Federated comparing profitability information for Federated to other publicly held fund management companies. In this regard, the Senior Officer noted the limited availability of such information, but nonetheless concluded that Federated's profit margins did not appear to be excessive and the Board agreed.
The Senior Officer's evaluation also discussed the notion of possible realization of "economies of scale" as a fund grows larger. The Board considered in this regard that the Adviser has made significant and long-term investments in areas that support all of the Federated funds, such as personnel and processes for the portfolio management, compliance, and risk management functions; and systems technology; and that the benefits of these efforts (as well as any economies, should they exist) were likely to be enjoyed by the fund complex as a whole. Finally, the Board also noted the absence of any applicable regulatory or industry guidelines on this subject, which (as discussed in the Senior Officer's evaluation) is compounded by the lack of any common industry practice or general pattern with respect to structuring fund advisory fees with "breakpoints" that serve to reduce the fee as the fund attains a certain size. The Senior Officer did not recommend institution of breakpoints in pricing Federated's fund advisory services at this time.
It was noted in the materials for the Board meeting that for the Fund's most recently completed fiscal year, the Fund's investment advisory fee, after waivers and expense reimbursements, if any, was above he median of the relevant peer group. The Board reviewed the fees and other expenses of the Fund with the Adviser and was satisfied that the overall expense structure of the Fund remained competitive. The Board will continue to monitor advisory fees and other expenses borne by the Fund.
The Senior Officer's evaluation noted his belief that the information and observations contained in his evaluation supported a finding that the proposed management fees are reasonable, and that Federated appeared to provide appropriate administrative services to the Fund for the fees paid. Under these circumstances, no changes were recommended to, and no objection was raised to, the continuation of the Fund's advisory contract. The Board concluded that the nature, quality and scope of services provided the Fund by the Adviser and its affiliates were satisfactory.
In its decision to continue an existing investment advisory contract, the Board was mindful of the potential disruptions of the Fund's operations and various risks, uncertainties and other effects that could occur as a result of a decision to terminate or not renew an advisory contract. In particular, the Board recognized that most shareholders have invested in the Fund on the strength of the Adviser's industry standing and reputation and with the expectation that the Adviser will have a continuing role in providing advisory services to the Fund. Thus, the Board's approval of the advisory contract reflected the fact that it is the shareholders who have effectively selected the Adviser by virtue of having invested in the Fund.
The Board based its decision to approve the advisory contract on the totality of the circumstances and relevant factors and with a view to past and future long-term considerations. Not all of the factors and considerations identified above were necessarily relevant to the Fund, nor did the Board consider any one of them to be determinative. With respect to the factors that were relevant, the Board's decision to approve the contract reflects its determination that Federated's performance and actions provided a satisfactory basis to support the decision to continue the existing arrangements.
Voting Proxies on Fund Portfolio Securities
A description of the policies and procedures that the Fund uses to determine how to vote proxies, if any, relating to securities held in the Fund's portfolio is available, without charge and upon request, by calling 1-800-341-7400. A report on "Form N-PX" of how the Fund voted any such proxies during the most recent 12-month period ended June 30 is available from Federated's website at FederatedInvestors.com. To access this information from the "Products" section of the website, click on the "Prospectuses and Regulatory Reports" link under "Related Information," then select the appropriate link opposite the name of the Fund; or select the name of the Fund and from the Fund's page, click on the "Prospectuses and Regulatory Reports" link. Form N-PX filings are also available at the SEC's website at www.sec.gov.
Quarterly Portfolio Schedule
The Fund files with the SEC a complete schedule of its portfolio holdings, as of the close of the first and third quarters of its fiscal year, on "Form N-Q." These filings are available on the SEC's website at www.sec.gov and may be reviewed and copied at the SEC's Public Reference Room in Washington, DC. (Call 1-800-SEC-0330 for information on the operation of the Public Reference Room.) You may also access this information from the "Products" section of Federated's website at FederatedInvestors.com by clicking on "Portfolio Holdings" under "Related Information," then selecting the appropriate link opposite the name of the Fund; or select the name of the Fund and from the Fund's page, click on the "Portfolio Holdings" link.
Mutual funds are not bank deposits or obligations, are not guaranteed by any bank and are not insured or guaranteed by the U.S. government, the Federal Deposit Insurance Corporation, the Federal Reserve Board or any other government agency. Investment in mutual funds involves investment risk, including the possible loss of principal.
This report is authorized for distribution to prospective investors only when preceded or accompanied by the Fund's Prospectus, which contains facts concerning its objective and policies, management fees, expenses and other information.
Federated
World-Class Investment Manager
FederatedInterContinental Fund
Federated Investors Funds
4000 Ericsson Drive
Warrendale, PA 15086-7561
Contact us at FederatedInvestors.com
or call 1-800-341-7400.
Federated Securities Corp., Distributor
Cusip 314172461
37869 (1/09)
Federated is a registered mark of Federated Investors, Inc. 2009 (c)Federated Investors, Inc.
Federated
World-Class Investment Manager
Federated International Strategic Value Fund
Established 2008
A Portfolio of Federated Equity Funds
ANNUAL SHAREHOLDER REPORT
November 30, 2008
Class A Shares
Class C Shares
FINANCIAL HIGHLIGHTS
SHAREHOLDER EXPENSE EXAMPLE
MANAGEMENT'S DISCUSSION OF FUND PERFORMANCE
PORTFOLIO OF INVESTMENTS SUMMARY TABLES
PORTFOLIO OF INVESTMENTS
STATEMENT OF ASSETS AND LIABILITIES
STATEMENT OF OPERATIONS
STATEMENT OF CHANGES IN NET ASSETS
NOTES TO FINANCIAL STATEMENTS
REPORT OF INDEPENDENT REGISTERED PUBLIC ACCOUNTING FIRM
BOARD OF TRUSTEES AND TRUST OFFICERS
EVALUATION AND APPROVAL OF ADVISORY CONTRACT
VOTING PROXIES ON FUND PORTFOLIO SECURITIES
QUARTERLY PORTFOLIO SCHEDULE
Not FDIC Insured * May Lose Value * No Bank Guarantee
Financial Highlights - Class A Shares
(For a Share Outstanding Throughout the Period)
Period Ended November 30
|
| 2008
| 1
|
Net Asset Value, Beginning of Period
| | $5.00 | |
Income From Investment Operations:
| | | |
Net investment income
| | 0.07 | 2 |
Net realized and unrealized loss on investments and foreign currency transactions
|
| (2.00
| )
|
TOTAL FROM INVESTMENT OPERATIONS
|
| (1.93
| )
|
Less Distributions:
| | | |
Distributions from net investment income
|
| (0.02
| )
|
Net Asset Value, End of Period
|
| $3.05
|
|
Total Return 3
|
| (38.78
| )%
|
| | | |
Ratios to Average Net Assets:
|
|
|
|
Net expenses
|
| 0.46
| % 4
|
Net investment income
|
| 3.96
| % 4
|
Expense waiver/reimbursement 5
|
| 52.69
| % 4
|
Supplemental Data:
|
|
|
|
Net assets, end of period (000 omitted)
|
| $11
|
|
Portfolio turnover
|
| 22
| %
|
1 Reflects operations for the period from June 4, 2008 (date of initial investment) to November 30, 2008.
2 Per share number has been calculated using the average shares method.
3 Based on net asset value, which does not reflect the sales charge, redemption fee or contingent deferred sales charge, if applicable. Total returns for periods of less than one year are not annualized.
4 Computed on an annualized basis.
5 This expense decrease is reflected in both the net expense and the net investment income ratios shown above.
See Notes which are an integral part of the Financial Statements
Financial Highlights - Class C Shares
(For a Share Outstanding Throughout the Period)
Period Ended November 30
|
| 2008
| 1
|
Net Asset Value, Beginning of Period
| | $5.00 | |
Income From Investment Operations:
| | | |
Net investment income
| | 0.07 | 2 |
Net realized and unrealized loss on investments and foreign currency transactions
|
| (2.00
| )
|
TOTAL FROM INVESTMENT OPERATIONS
|
| (1.93
| )
|
Less Distributions:
| | | |
Distributions from net investment income
|
| (0.02
| )
|
Net Asset Value, End of Period
|
| $3.05
|
|
Total Return 3
|
| (38.77
| )%
|
| | | |
Ratios to Average Net Assets:
|
|
|
|
Net expenses
|
| 1.23
| % 4
|
Net investment income
|
| 3.29
| % 4
|
Expense waiver/reimbursement 5
|
| 52.36
| % 4
|
Supplemental Data:
|
|
|
|
Net assets, end of period (000 omitted)
|
| $0
| 6
|
Portfolio turnover
|
| 22
| %
|
1 Reflects operations for the period from June 4, 2008 (date of initial investment) to November 30, 2008.
2 Per share number has been calculated using the average shares method.
3 Based on net asset value, which does not reflect the sales charge, redemption fee or contingent deferred sales charge, if applicable. Total returns for periods of less than one year are not annualized.
4 Computed on an annualized basis.
5 This expense decrease is reflected in both the net expense and the net investment income ratios shown above.
6 Represents less than $1,000.
See Notes which are an integral part of the Financial Statements
Shareholder Expense Example
As a shareholder of the Fund, you incur two types of costs: (1) transaction costs, including sales charges (loads) on purchase or redemption payments and redemption/exchange fees; and (2) ongoing costs, including management fees and to the extent applicable, distribution (12b-1) fees and/or shareholder services fees and other Fund expenses. This Example is intended to help you to understand your ongoing costs (in dollars) of investing in the Fund and to compare these costs with the ongoing costs of investing in other mutual funds. It is based on an investment of $1,000 invested at the beginning of the period and held for the entire period from June 1, 2008 1 to November 30, 2008.
ACTUAL EXPENSES
The first section of the table below provides information about actual account values and actual expenses. You may use the information in this section, together with the amount you invested, to estimate the expenses that you incurred over the period. Simply divide your account value by $1,000 (for example, an $8,600 account value divided by $1,000 = 8.6), then multiply the result by the number in the first section under the heading entitled "Expenses Paid During Period" to estimate the expenses attributable to your investment during this period.
HYPOTHETICAL EXAMPLE FOR COMPARISON PURPOSES
The second section of the table below provides information about hypothetical account values and hypothetical expenses based on the Fund's actual expense ratio and an assumed rate of return of 5% per year before expenses, which is not the Fund's actual return. Thus, you should not use the hypothetical account values and expenses to estimate the actual ending account balance or your expenses for the period. Rather, these figures are required to be provided to enable you to compare the ongoing costs of investing in the Fund with other funds. To do so, compare this 5% hypothetical example with the 5% hypothetical examples that appear in the shareholder reports of the other funds.
Please note that the expenses shown in the table are meant to highlight your ongoing costs only and do not reflect any transaction costs, such as sales charges (loads) on purchase or redemption payments, or redemption/exchange fees. Therefore, the second section of the table is useful in comparing ongoing costs only, and will not help you determine the relative total costs of owning different funds. In addition, if these transaction costs were included, your costs would have been higher.
|
| Beginning
Account Value
6/1/2008
|
| Ending
Account Value
11/30/2008
|
| Expenses Paid
During Period 1
|
Actual:
|
|
|
|
|
|
|
Class A Shares
|
| $1,000
|
| $ 612.20
|
| $1.82
|
Class C Shares
|
| $1,000
|
| $ 612.30
|
| $4.88
|
Hypothetical (assuming a 5% return before expenses):
|
|
|
|
|
|
|
Class A Shares
|
| $1,000
|
| $1,022.70
|
| $2.33
|
Class C Shares
|
| $1,000
|
| $1,018.85
|
| $6.21
|
1 "Actual" expense information is for the period from June 4, 2008 (date of initial investment) to November 30, 2008. Actual expenses are equal to the Fund's annualized net expense ratio of the respective Share Class, multiplied by 180/366 (to reflect the period from initial investment to November 30, 2008). "Hypothetical" expense information for Class A Shares and Class C Shares is presented on the basis of the full one-half-year period to enable comparison to other funds. It is based on assuming the same net expense ratio and average account value over the period, but it is multiplied by 183/366 (to reflect the full half-year period). The annualized net expense ratios are as follows:
Class A Shares
|
| 0.46%
|
Class C Shares
|
| 1.23%
|
Management's Discussion of Fund Performance
Since its inception date of June 4, 2008 through fiscal year ended November 30, 2008, the total return of the Federated International Strategic Value Fund was (-38.78%) for Class A Shares and (-38.77%) for Class C Shares at net asset value. The total return of the MSCI EAFE High Dividend Yield Index (MSCI HDY), 1 was (-45.06%) for the same period. The fund's total return for the fiscal year reflected actual cash flows, transaction costs and other expenses, which were not reflected in the total return of the benchmark.
The following discussion will focus on the performance of the fund's Class A Shares.
MARKET OVERVIEW
The fund was launched on June 4, 2008. The subsequent period proved to be a challenging investment environment characterized by both high volatility and double-digit negative total returns across most countries within the MSCI HDY. 2 Non-U.S. stock markets struggled under the weight of de-leveraging financial systems, declining housing markets and the weakening in demand associated with the spike in commodity prices.
The currency markets have been equally volatile. The U.S. dollar made a strong comeback versus the Euro and Sterling, but much of that strength was due to a flight to quality and the weaker economic outlook in Europe, rather than strength on our shores.
1 The MSCI HDY represents the components of the MSCI Europe, Australasia and Far East Index (MSCI EAFE), an unmanaged market capitalization-weighted equity index comprising 20 of the 48 countries in the MSCI universe and representing the developed world outside of North America. Each MSCI country index is created separately, then aggregated, without change, into regional MSCI indices. MSCI EAFE performance data is calculated in U.S. dollars and in local currency. The MSCI HDY, however, only includes securities which have a dividend yield that is at least 30% higher than its relative parent index, the MSCI EAFE. Only securities with a reasonable payout and a non-negative 5-Year DPS growth rate are eligible for inclusion in the MSCI HDY. Investments cannot be made directly in an index.
2 International investing involves special risks including currency risk, increased volatility of foreign securities, political risks and differences in auditing and other financial standards.
Still, there were notable return patterns. Prior to the fund's launch, the commodity bubble was still expanding and the financial sector was struggling; dividend stocks were very much out of favor. By the middle of 2008, however, high dividend-yielding sectors experienced some much-needed relief as the selling shifted to the more cyclical sectors. 3
As investors fled for safety, those areas that gave up less return were dividend-friendly sectors such as Health Care (-20.20%), Telecom Services (-29.69%) and Consumer Staples (-32.09%). Further to the fund's benefit, there were broad sell-offs in yield-starved sectors such Materials (-60.11%) and Industrials (-53.72%). Once a yield rich sector, Financials (-54.66%) led the market down as financial institutions and foreign governments alike slashed dividend policies in hopes of defending themselves against the worsening financial crisis.
FUND PERFORMANCE
During the reporting period the fund outperformed the MSCI HDY by 6.28%. A key driver of the fund's outperformance was positive stock selection in Canada, Brazil and Mexico, countries not represented in the benchmark. Stocks that outperformed the benchmark constituents included Bank of Montreal, one of Canada's largest financial institutions, Natura Cosmeticos, a Brazilian personal care producer, and Kimberly Clark De Mexico, a personal care manufacturer in Mexico. The fund benefited further from positive stock selection in Belgium, the United Kingdom and Australia. The fund gave up relative performance with overweight positions in Finland and Ireland, countries under extreme economic pressure.
From a sector perspective, the fund benefited importantly from its 15.52% underweight position in the Financials sector. Positive stock selection within the sector further increased relative performance as the fund holdings outperformed the benchmark constituents by 3.14%.
The fund benefited from overweight positions in Consumer Staples and Telecom Services. Both groups outperformed the overall benchmark due to their lower downside risk features in weak markets. A Consumer Staples name that did particularly well, Rothmans, gained 10.01% in the period on news that Phillip Morris would acquire the company at a premium.
The fund was penalized by a 6.20% underweight exposure to Energy, a group that offers little opportunity to dividend investors, yet outperformed the broad market. The fund was also negatively impacted by weak stock selection within this sector. Nestle Oil negatively affected relative performance as the stock fell 56.93% in the reporting period.
3 There are no guarantees that dividend-paying stocks will continue to pay dividends. In addition, dividend-paying stocks may not experience the same capital appreciation potential as non-dividend-paying stocks.
GROWTH OF A $10,000 INVESTMENT- CLASS A SHARES
The graph below illustrates the hypothetical investment of $10,000 1 in Federated International Strategic Value Fund (Class A Shares) (the "Fund") from June 4, 2008 (start of performance) to November 30, 2008, compared to the MSCI EAFE High Dividend Yield Index (MSCI HDY) 2 and the Morningstar Foreign Large Value Funds Category Average (MFLVFCA). 2
Cumulative Total Return 3 for the Period Ended 11/30/2008
|
|
|
Start of Performance (6/4/2008)
|
| (42.13)%
|
Performance data quoted represents past performance which is no guarantee of future results. Investment return and principal value will fluctuate so that an investor's shares, when redeemed, may be worth more or less than their original cost. Mutual fund performance changes over time and current performance may be lower or higher than what is stated. For current to the most recent month-end performance and after-tax returns, visit FederatedInvestors.com or call 1-800-341-7400. Returns shown do not reflect the deduction of taxes that a shareholder would pay on Fund distributions or the redemption of Fund shares. Mutual funds are not obligations of or guaranteed by any bank and are not federally insured. Total returns shown include the maximum sales charge of 5.50%.
1 Represents a hypothetical investment of $10,000 in the Fund after deducting the maximum sales charge of 5.50% ($10,000 investment minus $550 sales charge = $9,450). The Fund's performance assumes the reinvestment of all dividends and distributions. The MSCI HDY and the MFLVFCA have been adjusted to reflect reinvestment of dividends on securities in the index and average.
2 The MSCI HDY and the MFLVFCA are not adjusted to reflect sales charges, expenses or other fees that the Securities and Exchange Commission (SEC) requires to be reflected in the Fund's performance. The MSCI HDY represents the components of the MSCI Europe, Australasia and Far East Index (MSCI EAFE), an unmanaged market capitalization-weighted equity index comprising 20 of the 48 countries in the MSCI universe and representing the developed world outside of North America. Each MSCI country index is created separately, then aggregated, without change, into regional MSCI indices. MSCI EAFE performance data is calculated in U.S. dollars and in local currency. The MSCI HDY, however, only includes securities which have a dividend yield that is at least 30% higher than its relative parent index, the MSCI EAFE. Only securities with a reasonable payout and a non-negative 5-Year DPS growth rate are eligible for inclusion in the MSCI HDY. The MFLVFCA includes foreign large-value portfolios that invest mainly in big international stocks that are less expensive or growing more slowly than other large-cap stocks. Most of these portfolios divide their assets among a dozen or more developed markets, including Japan, Britain, France and Germany. These portfolios primarily invest in stocks that have market caps in the top 70% of each economically integrated market (such as Europe or Asia ex-Japan). Value is defined based on low valuations (low price ratios and high dividend yields) and slow growth (low growth rates for earnings, sales, book value and cash flow). These portfolios typically will have less than 20% of assets invested in U.S. stocks. The index is unmanaged and, unlike the Fund is not affected by cash flows. It is not possible to invest directly in an index or an average.
© 2008 Morningstar, Inc. All Rights Reserved. The information contained herein: (1) is proprietary to Morningstar and/or its content providers; (2) may not be copied or distributed; and (3) is not warranted to be accurate, complete or timely. Neither Morningstar nor its content providers are responsible for any damages or losses arising from any use of this information. Past performance is no guarantee of future results.
3 Total return quoted reflects all applicable sales charges.
GROWTH OF A $10,000 INVESTMENT - CLASS C SHARES
The graph below illustrates the hypothetical investment of $10,000 1 in Federated International Strategic Value Fund (Class C Shares) (the "Fund") from June 4, 2008 (start of performance) to November 30, 2008, compared to the MSCI EAFE High Dividend Yield Index (MSCI HDY) 2 and the Morningstar Foreign Large Value Funds Category Average (MFLVFCA). 2
Cumulative Total Return 3 for the Period Ended 11/30/2008
|
|
|
Start of Performance (6/4/2008)
|
| (39.38)%
|

Performance data quoted represents past performance which is no guarantee of future results. Investment return and principal value will fluctuate so that an investor's shares, when redeemed, may be worth more or less than their original cost. Mutual fund performance changes over time and current performance may be lower or higher than what is stated. For current to the most recent month-end performance and after-tax returns, visit FederatedInvestors.com or call 1-800-341-7400. Returns shown do not reflect the deduction of taxes that a shareholder would pay on Fund distributions or the redemption of Fund shares. Mutual funds are not obligations of or guaranteed by any bank and are not federally insured. Total returns shown include the maximum contingent deferred sales charge of 1.00%, as applicable.
1 Represents a hypothetical investment of $10,000 in the Fund. A 1.00% contingent deferred sales charge would be applied on any redemption less than one year from the purchase date. The Fund's performance assumes the reinvestment of all dividends and distributions. The MSCI HDY and the MFLVFCA have been adjusted to reflect reinvestment of dividends on securities in the index and average.
2 The MSCI HDY and the MFLVFCA are not adjusted to reflect sales charges, expenses or other fees that the SEC requires to be reflected in the Fund's performance. The MSCI HDY represents the components of the MSCI Europe, Australasia and Far East Index (MSCI EAFE), an unmanaged market capitalization-weighted equity index comprising 20 of the 48 countries in the MSCI universe and representing the developed world outside of North America. Each MSCI country index is created separately, then aggregated, without change, into regional MSCI indices. MSCI EAFE performance data is calculated in U.S. dollars and in local currency. The MSCI HDY, however, only includes securities which have a dividend yield that is at least 30% higher than its relative parent index, the MSCI EAFE. Only securities with a reasonable payout and a non-negative 5-Year DPS growth rate are eligible for inclusion in the MSCI HDY. The MFLVFCA includes foreign large-value portfolios that invest mainly in big international stocks that are less expensive or growing more slowly than other large-cap stocks. Most of these portfolios divide their assets among a dozen or more developed markets, including Japan, Britain, France and Germany. These portfolios primarily invest in stocks that have market caps in the top 70% of each economically integrated market (such as Europe or Asia ex-Japan). Value is defined based on low valuations (low price ratios and high dividend yields) and slow growth (low growth rates for earnings, sales, book value and cash flow). These portfolios typically will have less than 20% of assets invested in U.S. stocks. The index is unmanaged and, unlike the Fund is not affected by cash flows. It is not possible to invest directly in an index or an average.
© 2008 Morningstar, Inc. All Rights Reserved. The information contained herein: (1) is proprietary to Morningstar and/or its content providers; (2) may not be copied or distributed; and (3) is not warranted to be accurate, complete or timely. Neither Morningstar nor its content providers are responsible for any damages or losses arising from any use of this information. Past performance is no guarantee of future results.
3 Total return quoted reflects all applicable contingent deferred sales charges.
Performance data quoted represents past performance which is no guarantee of future results. Investment return and principal value will fluctuate so that an investor's shares, when redeemed, may be worth more or less than their original cost. Mutual fund performance changes over time and current performance may be lower or higher than what is stated. For current to the most recent month-end performance and after-tax returns, visit FederatedInvestors.com or call 1-800-341-7400.
Portfolio of Investments Summary Tables
At November 30, 2008, the Fund's portfolio composition 1 was as follows:
Country
|
| Percentage of
Total Net Assets
|
United Kingdom
|
| 38.3
| %
|
France
|
| 10.8
| %
|
Australia
|
| 9.2
| %
|
Mexico
|
| 5.8
| %
|
Germany
|
| 4.9
| %
|
Brazil
|
| 4.6
| %
|
Finland
|
| 3.9
| %
|
Belgium
|
| 3.5
| %
|
Netherlands
|
| 3.5
| %
|
Italy
|
| 3.4
| %
|
Canada
|
| 2.7
| %
|
Poland
|
| 2.6
| %
|
Japan
|
| 2.1
| %
|
Greece
|
| 1.0
| %
|
Portugal
|
| 0.6
| %
|
Cash Equivalents 2
|
| 9.7
| %
|
Other Assets and Liabilities--Net 3
|
| (6.6
| )%
|
TOTAL
|
| 100.0
| %
|
1 Country allocations are based primarily on the country in which a company is incorporated. However, the Fund's adviser may allocate a company to a country based on other factors such as location of the company's principal office, the location of the principal trading market for the company's securities or the country where a majority of the company's revenues are derived.
2 Cash Equivalents include any investments in money market mutual funds and/or overnight repurchase agreements.
3 Assets, other than investments in securities, less liabilities. See Statement of Assets and Liabilities.
At November 30, 2008, the Fund's sector classification composition 4 was as follows:
Sector Classification
|
| Percentage of
Total Net Assets
|
Consumer Staples
|
| 21.3
| %
|
Telecommunication Services
|
| 20.6
| %
|
Energy
|
| 12.0
| %
|
Financials
|
| 11.7
| %
|
Health Care
|
| 11.6
| %
|
Utilities
|
| 11.2
| %
|
Consumer Discretionary
|
| 5.1
| %
|
Materials
|
| 3.4
| %
|
Cash Equivalents 2
|
| 9.7
| %
|
Other Assets and Liabilities--Net 3
|
| (6.6
| )%
|
TOTAL
|
| 100.0
| %
|
4 Except for Cash Equivalents and Other Assets and Liabilities, sector classifications are based upon, and individual securities assigned to, the classifications of the Global Industry Classification Standard (GICS) except that the adviser assigns a classification to securities not classified by the GICS and to securities for which the adviser does not have access to the classification made by the GICS.
Portfolio of Investments
November 30, 2008
Shares
|
|
|
|
| Value in
U.S. Dollars
|
| | COMMON STOCKS--94.9% | | | | |
| | Banks--8.2% | | | | |
| 710 | | Bank of Montreal
| | $ | 21,825 | |
| 2,149 | | HSBC Holdings PLC
| | | 23,431 | |
| 670 | | National Australia Bank Ltd., Melbourne
| | | 8,892 | |
| 900 | | Westpac Banking Corp. Ltd., Sydney
|
|
| 10,668
|
|
| | TOTAL
|
|
| 64,816
|
|
| | Consumer Services--1.0% | | | | |
| 308 | | Greek Organization of Football Prognostics
|
|
| 7,637
|
|
| | Energy--12.1% | | | | |
| 2,719 | | BP PLC
| | | 22,055 | |
| 593 | | ENI SpA
| | | 13,451 | |
| 726 | 1 | Neste Oil Oyj
| | | 10,200 | |
| 853 | 1 | Royal Dutch Shell PLC, Class A
| | | 22,998 | |
| 512 | | Total SA
|
|
| 26,862
|
|
| | TOTAL
|
|
| 95,566
|
|
| | Food Beverage & Tobacco--16.1% | | | | |
| 635 | | British American Tobacco PLC
| | | 16,672 | |
| 1,295 | | Coca-Cola Amatil Ltd.
| | | 7,340 | |
| 1,446 | | Diageo PLC
| | | 20,299 | |
| 6,065 | | Foster's Group Ltd.
| | | 21,828 | |
| 5,800 | 1 | Grupo Continental SA
| | | 7,768 | |
| 3,900 | | Grupo Modelo SA de CV, Class C
| | | 10,258 | |
| 740 | | Imperial Tobacco Group PLC
| | | 18,515 | |
| 1,094 | | Unilever PLC
|
|
| 25,242
|
|
| | TOTAL
|
|
| 127,922
|
|
Shares
|
|
|
|
| Value in
U.S. Dollars
|
| | COMMON STOCKS--continued | | | | |
| | Household & Personal Products--3.1% | | | | |
| 5,055 | 1 | Kimberly-Clark de Mexico
| | $ | 15,814 | |
| 990 | 1 | Natura Cosmeticos SA
|
|
| 8,854
|
|
| | TOTAL
|
|
| 24,668
|
|
| | Insurance--3.5% | | | | |
| 1,937 | | Aviva PLC
| | | 12,023 | |
| 847 | | Sampo Oyj, Class A
|
|
| 15,822
|
|
| | TOTAL
|
|
| 27,845
|
|
| | Materials--3.4% | | | | |
| 1,720 | | Amcor Ltd.
| | | 6,708 | |
| 3,708 | | Rexam PLC
|
|
| 19,999
|
|
| | TOTAL
|
|
| 26,707
|
|
| | Media--4.1% | | | | |
| 2,226 | | Pearson PLC
| | | 21,382 | |
| 406 | | Vivendi SA
|
|
| 11,506
|
|
| | TOTAL
|
|
| 32,888
|
|
| | Pharmaceuticals, Biotechnology & Life Sciences--11.6% | | | | |
| 682 | | AstraZeneca PLC
| | | 25,819 | |
| 400 | | Daiichi Sankyo Co. Ltd.
| | | 8,241 | |
| 1,328 | | GlaxoSmithKline PLC
| | | 23,049 | |
| 200 | | Ono Pharmaceutical Co. Ltd.
| | | 8,823 | |
| 473 | | Sanofi-Aventis
|
|
| 26,237
|
|
| | TOTAL
|
|
| 92,169
|
|
| | Telecommunication Services--20.6% | | | | |
| 8,105 | 1 | America Movil SAB de CV
| | | 12,376 | |
| 768 | | Belgacom
| | | 27,988 | |
| 2,167 | | Deutsche Telekom AG, Class REG
| | | 30,156 | |
| 1,997 | | Koninklijke KPN NV
| | | 27,609 | |
| 640 | | Portugal Telecom SGPS SA
| | | 4,740 | |
| 3,160 | | Telekomunikacja Polska SA
| | | 20,714 | |
Shares
|
|
|
|
| Value in
U.S. Dollars
|
| | COMMON STOCKS--continued | | | | |
| | Telecommunication Services--continued | | | | |
| 6,605 | | Telstra Corp. Ltd.
| | $ | 17,611 | |
| 11,300 | | Vodafone Group PLC
|
|
| 22,117
|
|
| | TOTAL
|
|
| 163,311
|
|
| | Utilities--11.2% | | | | |
| 2,155 | | Enel SpA
| | | 13,527 | |
| 248 | | Fortum Corp.
| | | 4,981 | |
| 296 | 1 | GDF Suez
| | | 11,911 | |
| 2,857 | | National Grid PLC
| | | 29,764 | |
| 101 | | RWE AG
| | | 8,521 | |
| 1,380 | | Tractebel Energia SA
| | | 11,581 | |
| 354 | | Veolia Environnement
|
|
| 8,829
|
|
| | TOTAL
|
|
| 89,114
|
|
| | TOTAL COMMON STOCKS
(IDENTIFIED COST $1,018,945)
|
|
| 752,643
|
|
| | PREFERRED STOCK--2.0% | | | | |
| | Food Beverage & Tobacco--2.0% | | | | |
| 375 | | Companhia de Bebidas das Americas (AmBev), Pfd.
(IDENTIFIED COST $22,082)
|
|
| 15,988
|
|
| | MUTUAL FUND--9.7% | | | | |
| 76,615 | 2,3 | Prime Value Obligations Fund, Institutional Shares, 2.35%
(AT NET ASSET VALUE)
|
|
| 76,615
|
|
| | TOTAL INVESTMENTS--106.6%
(IDENTIFIED COST $1,117,642) 4
|
|
| 845,246
|
|
| | OTHER ASSETS AND LIABILITIES - NET--(6.6)% 5
|
|
| (52,200
| )
|
| | TOTAL NET ASSETS--100%
|
| $
| 793,046
|
|
1 Non-income-producing security.
2 Affiliated company.
3 7-Day net yield.
4 The cost of investments for federal tax purposes amounts to $1,117,642.
5 Assets, other than investments in securities, less liabilities. See Statement of Assets and Liabilities.
Note: The categories of investments are shown as a percentage of total net assets at November 30, 2008.
Various inputs are used in determining the value of the Fund's investments. These inputs are summarized in the three broad levels listed below:
Level 1--quoted prices in active markets for identical securities
Level 2--other significant observable inputs (including quoted prices for similar securities, interest rates, prepayment speeds, credit risk, etc.)
Level 3--significant unobservable inputs (including the Fund's own assumptions in determining the fair value of investments)
The inputs or methodology used for valuing securities are not an indication of the risk associated with investing in those securities.
The following is a summary of the inputs used, as of November 30, 2008, in valuing the Fund's assets carried at fair value:
Valuation Inputs
|
| Investments in
Securities
|
Level 1--Quoted Prices
|
| $181,079
|
Level 2--Other Significant Observable Inputs
|
| 664,167
|
Level 3--Significant Unobservable Inputs
|
| - --
|
TOTAL
|
| $845,246
|
See Notes which are an integral part of the Financial Statements
Statement of Assets and Liabilities
November 30, 2008
Assets:
| | | | | | | |
Total investments in securities, at value including $76,615 of investments in an affiliated issuer (Note 5) (identified cost $1,117,642)
| | | | | $ | 845,246 | |
Cash denominated in foreign currency (identified cost $1,166)
| | | | | | 1,127 | |
Income receivable
|
|
|
|
|
| 4,057
|
|
TOTAL ASSETS
|
|
|
|
|
| 850,430
|
|
Liabilities:
| | | | | | | |
Payable for administrative personnel and services fee (Note 5)
| | $ | 14,961 | | | | |
Payable for custodian fees
| | | 1,621 | | | | |
Payable for auditing fees
| | | 28,000 | | | | |
Payable for portfolio accounting fees
| | | 5,666 | | | | |
Payable for insurance premiums
| | | 4,342 | | | | |
Accrued expenses
|
|
| 2,794
|
|
|
|
|
TOTAL LIABILITIES
|
|
|
|
|
| 57,384
|
|
Net assets for 259,952 shares outstanding
|
|
|
|
| $
| 793,046
|
|
Net Assets Consist of:
| | | | | | | |
Paid-in capital
| | | | | $ | 1,197,431 | |
Net unrealized depreciation of investments and translation of assets and
liabilities in foreign currency
| |
| | | |
(272,463 | ) |
Accumulated net realized loss on investments and foreign currency transactions
| | | | | | (153,623 | ) |
Undistributed net investment income
|
|
|
|
|
| 21,701
|
|
TOTAL NET ASSETS
|
|
|
|
| $
| 793,046
|
|
Net Asset Value, Offering Price and Redemption Proceeds Per Share
| | | | | | | |
Class A Shares:
| | | | | | | |
Net asset value per share ($11,337 ÷ 3,722 shares outstanding), no par value, unlimited shares authorized
|
|
|
|
|
| $3.05
|
|
Offering price per share (100/94.50 of $3.05) 1
|
|
|
|
|
| $3.23
|
|
Redemption proceeds per share (98.00/100 of $3.05) 1
|
|
|
|
|
| $2.99
|
|
Class C Shares:
| | | | | | | |
Net asset value per share ($61 ÷ 20 shares outstanding), no par value, unlimited shares authorized
|
|
|
|
|
| $3.05
|
|
Offering price per share
|
|
|
|
|
| $3.05
|
|
Redemption proceeds per share (97.00/100 of $3.05) 1
|
|
|
|
|
| $2.96
|
|
Institutional Shares:
| | | | | | | |
Net asset value per share ($781,648 ÷ 256,210 shares outstanding), no par value, unlimited shares authorized
|
|
|
|
|
| $3.05
|
|
Offering price per share
|
|
|
|
|
| $3.05
|
|
Redemption proceeds per share (98.00/100 of $3.05) 1
|
|
|
|
|
| $2.99
|
|
1 See "What Do Shares Cost?" in the Prospectus.
See Notes which are an integral part of the Financial Statements
Statement of Operations
Period Ended November 30, 2008 1
Investment Income:
| | | | | | | | | | | | |
Dividends (including $890 received from an affiliated issuer (Note 5) and net of foreign taxes withheld of $1,011)
|
|
|
|
|
|
|
|
|
| $
| 20,310
|
|
Expenses:
| | | | | | | | | | | | |
Investment adviser fee (Note 5)
| | | | | | $ | 3,223 | | | | | |
Administrative personnel and services fee (Note 5)
| | | | | | | 113,115 | | | | | |
Custodian fees
| | | | | | | 6,502 | | | | | |
Transfer and dividend disbursing agent fees and expenses
| | | | | | | 130 | | | | | |
Auditing fees
| | | | | | | 28,000 | | | | | |
Legal fees
| | | | | | | 3,445 | | | | | |
Portfolio accounting fees
| | | | | | | 8,500 | | | | | |
Shareholder services fee--Class A Shares (Note 5)
| | | | | | | 5 | | | | | |
Share registration costs
| | | | | | | 49,766 | | | | | |
Printing and postage
| | | | | | | 8,098 | | | | | |
Insurance premiums
| | | | | | | 4,342 | | | | | |
Miscellaneous
|
|
|
|
|
|
| 1,770
|
|
|
|
|
|
TOTAL EXPENSES
|
|
|
|
|
|
| 226,896
|
|
|
|
|
|
Waivers and Reimbursements (Note 5):
| | | | | | | | | | | | |
Waiver/reimbursement of investment adviser fee
| | $ | (3,223 | ) | | | | | | | | |
Waiver of administrative personnel and services fee
| | | (22,127 | ) | | | | | | | | |
Reimbursement of other operating expenses
|
|
| (200,775
| )
|
|
|
|
|
|
|
|
|
TOTAL WAIVERS AND REIMBURSEMENTS
|
|
|
|
|
|
| (226,125
| )
|
|
|
|
|
Net expenses
|
|
|
|
|
|
|
|
|
|
| 771
|
|
Net investment income
|
|
|
|
|
|
|
|
|
|
| 19,539
|
|
Realized and Unrealized Loss on Investments and Foreign Currency Transactions:
| | | | | | | | | | | | |
Net realized loss on investments and foreign currency transactions
| | | | | | | | | | | (147,962 | ) |
Net change in unrealized depreciation of investments and translation of assets and liabilities in foreign currency
|
|
|
|
|
|
|
|
|
|
|
(272,463
| )
|
Net realized and unrealized loss on investments and foreign currency transactions
|
|
|
|
|
|
|
|
|
|
| (420,425
| )
|
Change in net assets resulting from operations
|
|
|
|
|
|
|
|
|
| $
| (400,886
| )
|
1 Reflects operations for the period from June 4, 2008 (date of initial investment) to November 30, 2008.
See Notes which are an integral part of the Financial Statements
Statement of Changes in Net Assets
|
|
| Period
Ended
11/30/2008
| 1
|
Increase (Decrease) in Net Assets
| | | | |
Operations:
| | | | |
Net investment income
| | $ | 19,539 | |
Net realized loss on investments and foreign currency transactions
| | | (147,962 | ) |
Net change in unrealized appreciation/depreciation of investments and translation of assets and liabilities in foreign currency
|
|
| (272,463
| )
|
CHANGE IN NET ASSETS RESULTING FROM OPERATIONS
|
|
| (400,886
| )
|
Distributions to Shareholders:
| | | | |
Distributions from net investment income
| | | | |
Class A Shares
| | | (11 | ) |
Class C Shares
| | | (1 | ) |
Institutional Shares
|
|
| (3,487
| )
|
CHANGE IN NET ASSETS RESULTING FROM DISTRIBUTIONS TO SHAREHOLDERS
|
|
| (3,499
| )
|
Share Transactions:
| | | | |
Proceeds from sale of shares
| | | 1,208,219 | |
Net asset value of shares issued to shareholders in payment of distributions declared
| | | 18 | |
Cost of shares redeemed
|
|
| (10,806
| )
|
CHANGE IN NET ASSETS RESULTING FROM SHARE TRANSACTIONS
|
|
| 1,197,431
|
|
Change in net assets
|
|
| 793,046
|
|
Net Assets:
| | | | |
Beginning of period
|
|
| - --
|
|
End of period (including undistributed net investment income of $21,701)
|
| $
| 793,046
|
|
1 For the period from June 4, 2008 (date of initial investment) to November 30, 2008.
See Notes which are an integral part of the Financial Statements
Notes to Financial Statements
November 30, 2008
1. ORGANIZATION
Federated Equity Funds (the "Trust") is registered under the Investment Company Act of 1940, as amended (the "Act"), as an open-end management investment company. The Trust consists of 10 diversified portfolios. The financial statements included herein are only those of Federated International Strategic Value Fund (the "Fund"), a diversified portfolio. The financial statements of the other portfolios are presented separately. The assets of each portfolio are segregated and a shareholder's interest is limited to the portfolio in which shares are held. Each portfolio pays its own expenses. The Fund offers three classes of shares: Class A Shares, Class C Shares and Institutional Shares. All shares of the Fund have equal rights with respect to voting, except on class-specific matters. The financial highlights of the Institutional Shares are presented separately. The investment objective of the Fund is to provide income and long-term capital appreciation.
2. SIGNIFICANT ACCOUNTING POLICIES
The following is a summary of significant accounting policies consistently followed by the Fund in the preparation of its financial statements. These policies are in conformity with generally accepted accounting principles (GAAP) in the United States of America.
Investment Valuation
In calculating its net asset value (NAV), the Fund generally values investments as follows:
- Equity securities listed on an exchange or traded through a regulated market system are valued at their last reported sale price or official closing price on their principal exchange or market.
- Shares of other mutual funds are valued based upon their reported NAVs.
- Fixed-income securities acquired with remaining maturities greater than 60 days are fair valued using price evaluations provided by a pricing service approved by the Board of Trustees (the "Trustees").
- Fixed-income securities acquired with remaining maturities of 60 days or less are valued at their cost (adjusted for the accretion of any discount or amortization of any premium).
- Derivative contracts listed on exchanges are valued at their reported settlement or closing price.
- Over-the-counter (OTC) derivative contracts are fair valued using price evaluations provided by a pricing service approved by the Trustees.
If the Fund cannot obtain a price or price evaluation from a pricing service for an investment, the Fund may attempt to value the investment based upon the mean of bid and asked quotations or fair value the investment based on price evaluations, from one or more dealers. If any price, quotation, price evaluation or other pricing source is not readily available when the NAV is calculated, the Fund uses the fair value of the investment determined in accordance with the procedures described below. There can be no assurance that the Fund could purchase or sell an investment at the price used to calculate the Fund's NAV.
Fair Valuation and Significant Events Procedures
The Trustees have authorized the use of pricing services to provide evaluations of the current fair value of certain investments for purposes of calculating the NAV. Factors considered by pricing services in evaluating an investment include the yields or prices of investments of comparable quality, coupon, maturity, call rights and other potential prepayments, terms and type, reported transactions, indications as to values from dealers and general market conditions. Some pricing services provide a single price evaluation reflecting the bid-side of the market for an investment (a "bid" evaluation). Other pricing services offer both bid evaluations and price evaluations indicative of a price between the prices bid and asked for the investment (a "mid" evaluation). The Fund normally uses bid evaluations for U.S. Treasury and Agency securities, mortgage-backed securities and municipal securities. The Fund normally uses mid evaluations for other types of fixed-income securities and OTC derivative contracts. In the event that market quotations and price evaluations are not available for an investment, the fair value of the investment is determined in accordance with procedures adopted by the Trustees.
The Trustees also have adopted procedures requiring an investment to be priced at its fair value whenever the Adviser determines that a significant event affecting the value of the investment has occurred between the time as of which the price of the investment would otherwise be determined and the time as of which the NAV is computed. An event is considered significant if there is both an affirmative expectation that the investment's value will change in response to the event and a reasonable basis for quantifying the resulting change in value. Examples of significant events that may occur after the close of the principal market on which a security is traded, or after the time of a price evaluation provided by a pricing service or a dealer, include:
- With respect to securities traded in foreign markets, significant trends in U.S. equity markets or in the trading of foreign securities index futures or options contracts;
- With respect to price evaluations of fixed-income securities determined before the close of regular trading on the NYSE, actions by the Federal Reserve Open Market Committee and other significant trends in U.S. fixed-income markets;
- Political or other developments affecting the economy or markets in which an issuer conducts its operations or its securities are traded; and
- Announcements concerning matters such as acquisitions, recapitalizations, litigation developments, a natural disaster affecting the issuer's operations or regulatory changes or market developments affecting the issuer's industry.
The Trustees have approved the use of a pricing service to determine the fair value of equity securities traded principally in foreign markets when the Adviser determines that there has been a significant trend in the U.S. equity markets or in index futures trading. For other significant events, the Fund may seek to obtain more current quotations or price evaluations from alternative pricing sources. If a reliable alternative pricing source is not available, the Fund will determine the fair value of the investment using another method approved by the Trustees.
Repurchase Agreements
It is the policy of the Fund to require the other party to a repurchase agreement to transfer to the Fund's custodian or sub-custodian eligible securities or cash with a market value (after transaction costs) at least equal to the repurchase price to be paid under the repurchase agreement. The eligible securities are transferred to accounts with the custodian or sub-custodian in which the Fund holds a "securities entitlement" and exercises "control" as those terms are defined in the Uniform Commercial Code. The Fund has established procedures for monitoring the market value of the transferred securities and requiring the transfer of additional eligible securities if necessary to equal at least the repurchase price. These procedures also allow the other party to require securities to be transferred from the account to the extent that their market value exceeds the repurchase price or in exchange for other eligible securities of equivalent market value.
With respect to agreements to repurchase U.S. government securities and cash items, the Fund treats the repurchase agreement as an investment in the underlying securities and not as an obligation of the other party to the repurchase agreement. Other repurchase agreements are treated as obligations of the other party secured by the underlying securities. Nevertheless, the insolvency of the other party or other failure to repurchase the securities may delay the disposition of the underlying securities or cause the Fund to receive less than the full repurchase price. Under the terms of the repurchase agreement, any amounts received by the Fund in excess of the repurchase price and related transaction costs must be remitted to the other party.
The Fund may enter into repurchase agreements in which eligible securities are transferred into joint trading accounts maintained by the custodian or sub-custodian for investment companies and other clients advised by the Fund's Adviser and its affiliates. The Fund will participate on a pro rata basis with the other investment companies and clients in its share of the securities transferred under such repurchase agreements and in its share of proceeds from any repurchase or other disposition of such securities.
Investment Income, Gains and Losses, Expenses and Distributions
Interest income and expenses are accrued daily. Dividend income and distributions to shareholders are recorded on the ex-dividend date. Foreign dividends are recorded on the ex-dividend date or when the Fund is informed of the ex-dividend date. Distributions of net investment income are declared and paid semi-annually. Non-cash dividends included in dividend income, if any, are recorded at fair value. Investment income, realized and unrealized gains and losses and certain fund-level expenses are allocated to each class based on relative average daily net assets, except that each class may bear certain expenses unique to that class such as distribution services and shareholder services fees. Dividends are declared separately for each class. No class has preferential dividend rights; differences in per share dividend rates are generally due to differences in separate class expenses.
Premium and Discount Amortization
All premiums and discounts on fixed-income securities are amortized/accreted for financial statement purposes.
Federal Taxes
It is the Fund's policy to comply with the Subchapter M provision of the Internal Revenue Code (the "Code") and to distribute to shareholders each year substantially all of its income. Accordingly, no provision for federal income tax is necessary. The Fund adopted the provisions of Financial Accounting Standards Board (FASB) Interpretation No. 48 (FIN 48), "Accounting for Uncertainty in Income Taxes," on June 4, 2008. As of and during the period ended November 30, 2008, the Fund did not have a liability for any unrecognized tax expenses. The Fund recognizes interest and penalties, if any, related to tax liabilities as income tax expense in the Statement of Operations. As of November 30, 2008, tax year 2008 remains subject to examination by the Fund's major tax jurisdictions, which include the United States of America and the commonwealth of Massachusetts.
Withholding taxes and where appropriate, deferred withholding taxes on foreign interest, dividends and capital gains have been provided for in accordance with the applicable country's tax rules and rates.
When-Issued and Delayed Delivery Transactions
The Fund may engage in when-issued or delayed delivery transactions. The Fund records when-issued securities on the trade date and maintains security positions such that sufficient liquid assets will be available to make payment for the securities purchased. Securities purchased on a when-issued or delayed delivery basis are marked to market daily and begin earning interest on the settlement date. Losses may occur on these transactions due to changes in market conditions or the failure of counterparties to perform under the contract.
Foreign Currency Translation
The accounting records of the Fund are maintained in U.S. dollars. All assets and liabilities denominated in foreign currencies (FCs) are translated into U.S. dollars based on the rates of exchange of such currencies against U.S. dollars on the date of valuation. Purchases and sales of securities, income and expenses are translated at the rate of exchange quoted on the respective date that such transactions are recorded. The Fund does not isolate that portion of the results of operations resulting from changes in foreign exchange rates on investments from the fluctuations arising from changes in market prices of securities held. Such fluctuations are included with the net realized and unrealized gain or loss from investments.
Reported net realized foreign exchange gains or losses arise from sales of portfolio securities, sales and maturities of short-term securities, sales of FCs, currency gains or losses realized between the trade and settlement dates on securities transactions, the difference between the amounts of dividends, interest and foreign withholding taxes recorded on the Fund's books and the U.S. dollar equivalent of the amounts actually received or paid. Net unrealized foreign exchange gains and losses arise from changes in the value of assets and liabilities other than investments in securities at fiscal year end, resulting from changes in the exchange rate.
Use of Estimates
The preparation of financial statements in conformity with GAAP requires management to make estimates and assumptions that affect the amounts of assets, liabilities, expenses and revenues reported in the financial statements. Actual results could differ from those estimated.
Other
Investment transactions are accounted for on a trade-date basis. Realized gains and losses from investment transactions are recorded on an identified-cost basis.
3. SHARES OF BENEFICIAL INTEREST
The following tables summarize share activity:
Period Ended November 30
|
| 2008 1
|
Class A Shares
|
| Shares
|
|
|
| Amount
|
|
Shares sold
| | 3,720 | | | $ | 13,583 | |
Shares issued to shareholders in payment of distributions declared
|
| 2
|
|
|
| 11
|
|
NET CHANGE RESULTING FROM CLASS A SHARE TRANSACTIONS
|
| 3,722
|
|
| $
| 13,594
|
|
| | | | | | | |
Period Ended November 30
|
| 2008 1
|
Class C Shares
|
| Shares
|
|
|
| Amount
|
|
Shares sold
|
| 20
|
|
| $
| 100
|
|
NET CHANGE RESULTING FROM CLASS C SHARE TRANSACTIONS
|
| 20
|
|
| $
| 100
|
|
| | | | | | | |
Period Ended November 30
|
| 2008 1
|
Institutional Shares
|
| Shares
|
|
|
| Amount
|
|
Shares sold
| | 259,778 | | | $ | 1,194,536 | |
Shares issued to shareholders in payment of distributions declared
| | 1 | | | | 7 | |
Shares redeemed
|
| (3,569
| )
|
|
| (10,806
| )
|
NET CHANGE RESULTING FROM INSTITUTIONAL SHARE TRANSACTIONS
|
| 256,210
|
|
|
$
|
1,183,737
|
|
NET CHANGE RESULTING FROM SHARE TRANSACTIONS
|
| 259,952
|
|
| $
| 1,197.431
|
|
1 Reflects operations for the period from June 4, 2008 (date of initial investment) to November 30, 2008.
Redemption Fees
The Fund imposes a 2.00% redemption fee to shareholders of the Fund's Class A Shares, Class C Shares and Institutional Shares who redeem shares held for 30 days or less. Shares acquired by reinvestment of dividends or distributions of the Fund, or purchased pursuant to the Systematic Investment Program or withdrawn pursuant to the Systematic Withdrawal Program, will not be subject to the redemption fee. All redemption fees are recorded by the Fund as additions to paid-in-capital. For the period ended November 30, 2008, the Fund's Class A Shares, Class C Shares and Institutional Shares did not have any redemption fees.
4. FEDERAL TAX INFORMATION
The timing and character of income and capital gain distributions are determined in accordance with income tax regulations, which may differ from GAAP. These differences are due to differing treatments for foreign currency transactions.
For the period ended November 30, 2008, permanent differences identified and reclassified among the components of net assets were as follows:
Increase (Decrease)
|
Undistributed Net
Investment Income (Loss)
|
| Accumulated Net
Realized Gain (Loss)
|
$5,661
|
| $(5,661)
|
Net investment income (loss), net realized gains (losses) and net assets were not affected by this reclassification.
The tax character of distributions as reported on the Statement of Changes in Net Assets for the period ended November 30, 2008 was as follows:
As of November 30, 2008, the components of distributable earnings on a tax basis were as follows:
Undistributed ordinary income
|
| $
| 21,701
|
|
Net unrealized depreciation
|
| $
| (272,463
| )
|
Capital loss carryforward
|
| $
| (153,623
| )
|
At November 30, 2008, the cost of investments for federal tax purposes was $1,117,642. The net unrealized depreciation of investments for federal tax purposes excluding any unrealized depreciation resulting from changes in foreign currency exchange rates was $272,396. This consists of net unrealized appreciation from investments for those securities having an excess of value over cost of $1,735 and net unrealized depreciation from investments for those securities having an excess of cost over value of $274,131.
At November 30, 2008, the Fund had a capital loss carryforward of $153,623 which will reduce the Fund's taxable income arising from future net realized gains on investments, if any, to the extent permitted by the Code and thus will reduce the amount of distributions to shareholders which would otherwise be necessary to relieve the Fund of any liability for federal income tax. Pursuant to the Code, such capital loss carryforward will expire in 2016.
5. INVESTMENT ADVISER FEE AND OTHER TRANSACTIONS WITH AFFILIATES
Investment Adviser Fee
Federated Equity Management Company of Pennsylvania is the Fund's investment adviser (the "Adviser"). The advisory agreement between the Fund and the Adviser provides for an annual fee equal to 0.75% of the Fund's average daily net assets. The Adviser may voluntarily choose to waive any portion of its fee and/or reimburse certain operating expenses of the Fund. The Adviser can modify or terminate this voluntary waiver and/or reimbursement at any time at its sole discretion. For the period ended November 30, 2008, the Adviser voluntarily waived $3,191 of its fee and voluntarily reimbursed $200,775 of other operating expenses.
Administrative Fee
Federated Administrative Services (FAS), under the Administrative Services Agreement, provides the Fund with administrative personnel and services. The fee paid to FAS is based on the average aggregate daily net assets of certain Federated funds as specified below:
Administrative Fee
|
| Average Aggregate Daily Net Assets
of the Federated Funds
|
0.150%
|
| on the first $5 billion
|
0.125%
|
| on the next $5 billion
|
0.100%
|
| on the next $10 billion
|
0.075%
|
| on assets in excess of $20 billion
|
The administrative fee received during any fiscal year shall be at least $150,000 per portfolio and $40,000 per each additional class of Shares. FAS may voluntarily choose to waive any portion of its fee. FAS can modify or terminate this voluntary waiver at any time at its sole discretion. For the period ended November 30, 2008, the net fee paid to FAS was 21.171% of average daily net assets of the Fund. FAS waived $22,127 of its fee. The Fund currently accrues the minimum administrative fee; therefore the fee as a percentage of average aggregate daily net assets is greater than the amounts presented in the chart above.
Distribution Services Fee
The Fund has adopted a Distribution Plan (the "Plan") pursuant to Rule 12b-1 under the Act. Under the terms of the Plan, the Fund will compensate Federated Securities Corp. (FSC), the principal distributor, from the daily net assets of the Fund's Class A Shares and Class C Shares to finance activities intended to result in the sale of these shares. The Plan provides that the Fund may incur distribution expenses at the following percentages of average daily net assets annually, to compensate FSC:
Share Class Name
|
| Percentage of Average Daily
Net Assets of Class
|
Class A Shares
|
| 0.05%
|
Class C Shares
|
| 0.75%
|
FSC may voluntarily choose to waive any portion of its fee. FSC can modify or terminate this voluntary waiver at any time at its sole discretion. When FSC receives fees, it may pay some or all of them to financial intermediaries whose customers purchase shares. For the period ended November 30, 2008, the Fund's Class A Shares and Class C Shares did not incur a distribution services fee.
Sales Charges
For the period ended November 30, 2008, FSC retained $16 in sales charges from the sale of Class A Shares. See "What Do Shares Cost?" in the Prospectus.
Shareholder Services Fee
The Fund may pay fees (Service Fees) up to 0.25% of the average daily net assets of the Fund's Class A Shares and Class C Shares to financial intermediaries or to Federated Shareholder Services Company (FSSC) for providing services to shareholders and maintaining shareholder accounts. FSSC may voluntarily reimburse the Fund for shareholder services fees. This voluntary reimbursement can be modified or terminated at any time. For the period ended November 30, 2008, FSSC did not receive any fees paid by the Fund. For the period ended November 30, 2008, the Fund's Class C Shares did not incur a shareholder services fee.
Expense Limitation
The Adviser and its affiliates (which may include FSC, FAS and FSSC) have voluntarily agreed to waive their fees and/or reimburse expenses so that the total operating expenses (as shown in the financial highlights) paid by the Fund's Class A Shares, Class C Shares and Institutional Shares (after the voluntary waivers and reimbursements) will not exceed 1.00%, 1.75% and 0.75%, respectively, for the fiscal year ending November 30, 2009. Although these actions are voluntary, the Adviser and its affiliates have agreed to continue these waivers and/or reimbursements at least through January 31, 2010.
General
Certain of the Officers and Trustees of the Fund are Officers and Directors or Trustees of the above companies.
Transactions with Affiliated Companies
Affiliated holdings are mutual funds which are managed by the Adviser or an affiliate of the Adviser. The Adviser has agreed to reimburse the Fund for certain investment adviser fees as a result of transactions in other affiliated mutual funds. For the period ended November 30, 2008, the Adviser reimbursed $32. Transactions with the affiliated company during the period ended November 30, 2008, were as follows:
Affiliate
|
| Balance of
Shares Held
6/4/2008
|
| Purchases/
Additions
|
| Sales/
Reductions
|
| Balance of
Shares Held
11/30/2008
|
| Value
|
| Dividend
Income
|
Prime Value Obligations Fund, Institutional Shares
|
| - --
|
| 1,396,948
|
| 1,320,333
|
| 76,615
|
| $76,615
|
| $890
|
6. INVESTMENT TRANSACTIONS
Purchases and sales of investments, excluding long-term U.S. government securities and short-term obligations for the period ended November 30, 2008, were as follows:
Purchases
|
| $
| 1,374,814
|
Sales
|
| $
| 180,164
|
7. CONCENTRATION OF RISK
The Fund invests in securities of non-U.S. issuers. Political or economic developments may have an effect on the liquidity and volatility of portfolio securities and currency holdings.
At November 30, 2008, the diversification of countries was as follows:
Country
|
| Percentage of
Net Assets
|
United Kingdom
|
| 38.3
| %
|
France
|
| 10.8
| %
|
Australia
|
| 9.2
| %
|
Mexico
|
| 5.8
| %
|
Germany
|
| 4.9
| %
|
Brazil
|
| 4.6
| %
|
Finland
|
| 3.9
| %
|
Belgium
|
| 3.5
| %
|
Netherlands
|
| 3.5
| %
|
Italy
|
| 3.4
| %
|
Canada
|
| 2.7
| %
|
Poland
|
| 2.6
| %
|
Japan
|
| 2.1
| %
|
Greece
|
| 1.0
| %
|
Portugal
|
| 0.6
| %
|
The Fund may invest a portion of its assets in securities of companies that are deemed by the Fund's management to be classified in similar business sectors. Economic developments may have an effect on the liquidity and volatility of the portfolio securities.
8. LINE OF CREDIT
The Fund participates in a $100,000,000 unsecured, uncommitted revolving line of credit (LOC) agreement with PNC Bank. The LOC was made available for extraordinary or emergency purposes, primarily for financing redemption payments. Borrowings are charged interest at a rate of 0.65% over the federal funds rate. As of November 30, 2008, there were no outstanding loans. During the period ended November 30, 2008, the Fund did not utilize the LOC.
9. INTERFUND LENDING
Pursuant to an Exemptive Order issued by the Securities and Exchange Commission (SEC), the Fund, along with other funds advised by subsidiaries of Federated Investors, Inc., may participate in an interfund lending program. This program provides an alternative credit facility allowing the funds to borrow from other participating affiliated funds. As of November 30, 2008, there were no outstanding loans. During the period ended November 30, 2008, the program was not utilized.
10. LEGAL PROCEEDINGS
Since October 2003, Federated Investors, Inc. and related entities (collectively, "Federated") and various Federated funds ("Federated Funds") have been named as defendants in several class action lawsuits now pending in the United States District Court for the District of Maryland. The lawsuits were purportedly filed on behalf of people who purchased, owned and/or redeemed shares of Federated-sponsored mutual funds during specified periods beginning November 1, 1998. The suits are generally similar in alleging that Federated engaged in illegal and improper trading practices including market timing and late trading in concert with certain institutional traders, which allegedly caused financial injury to the mutual fund shareholders. These lawsuits began to be filed shortly after Federated's first public announcement that it had received requests for information on shareholder trading activities in the Federated Funds from the SEC, the Office of the New York State Attorney General ("NYAG") and other authorities. In that regard, on November 28, 2005, Federated announced that it had reached final settlements with the SEC and the NYAG with respect to those matters. As Federated previously reported in 2004, it has already paid approximately $8.0 million to certain funds as determined by an independent consultant. As part of these settlements, Federated agreed to pay for the benefit of fund shareholders additional disgorgement and a civil money penalty in the aggregate amount of an additional $72 million. Federated entities have also been named as defendants in several additional lawsuits that are now pending in the United States District Court for the Western District of Pennsylvania, alleging, among other things, excessive advisory and Rule 12b-1 fees. The Board of the Federated Funds retained the law firm of Dickstein Shapiro LLP to represent the Federated Funds in these lawsuits. Federated and the Federated Funds and their respective counsel have been defending this litigation and none of the Federated Funds remains a defendant in any of the lawsuits (though some could potentially receive any recoveries as nominal defendants). Additional lawsuits based upon similar allegations may be filed in the future. The potential impact of these lawsuits, all of which seek unquantified damages, attorneys' fees and expenses, and future potential similar suits is uncertain. Although we do not believe that these lawsuits will have a material adverse effect on the Federated Funds, there can be no assurance that these suits, the ongoing adverse publicity and/or other developments resulting from the regulatory investigations will not result in increased Federated Fund redemptions, reduced sales of Federated Fund shares or other adverse consequences for the Federated Funds.
11. RECENT ACCOUNTING PRONOUNCEMENTS
In March 2008, FASB released Statement of Financial Accounting Standards No. 161, "Disclosures about Derivative Instruments and Hedging Activities" (FAS 161). FAS 161 requires qualitative disclosures about objectives and strategies for using derivatives, quantitative disclosures about fair value amounts of gains and losses on derivative instruments and disclosures about credit-risk-related contingent features in derivative agreements. FAS 161 is effective for fiscal years and interim periods beginning after November 15, 2008. At this time, management is evaluating the implications of adopting FAS 161 and its impact on the financial statements and the accompanying notes.
12. FEDERAL TAX INFORMATION (UNAUDITED)
For the period ended November 30, 2008, 73.2% of total ordinary income distributions made by the Fund are qualifying dividends which may be subject to a maximum tax rate of 15%, as provided for by the Jobs and Growth Tax Relief Act of 2003. Complete information is reported in conjunction with the reporting of your distributions on Form 1099-DIV.
If the Fund meets the requirements of Section 853 of the Internal Revenue Code of 1986, as amended, the Fund will pass through to its shareholders credits for foreign taxes paid.
For the period ended November 30, 2008, the Fund derived $19,467 of gross income from foreign sources and paid foreign taxes of $1,011.
Report of Independent Registered Public Accounting Firm
TO THE BOARD OF TRUSTEES OF FEDERATED EQUITY FUNDS AND THE SHAREHOLDERS OF FEDERATED INTERNATIONAL STRATEGIC VALUE FUND:
We have audited the accompanying statement of assets and liabilities, including the portfolio of investments, of the Federated International Strategic Value Fund (the "Fund"), a portfolio of Federated Equity Funds, as of November 30, 2008, and the related statement of operations, the statement of changes in net assets, and the financial highlights for the period from June 4, 2008 to November 30, 2008. These financial statements and financial highlights are the responsibility of the Fund's management. Our responsibility is to express an opinion on these financial statements and financial highlights based on our audits.
We conducted our audits in accordance with the standards of the Public Company Accounting Oversight Board (United States). Those standards require that we plan and perform the audit to obtain reasonable assurance about whether the financial statements and financial highlights are free of material misstatement. An audit includes examining, on a test basis, evidence supporting the amounts and disclosures in the financial statements. Our procedures included confirmation of securities owned as of November 30, 2008 by correspondence with the custodian. An audit also includes assessing the accounting principles used and significant estimates made by management, as well as evaluating the overall financial statement presentation. We believe that our audits provide a reasonable basis for our opinion.
In our opinion, the financial statements and financial highlights referred to above present fairly, in all material respects, the financial position of the Federated International Strategic Value Fund as of November 30, 2008, and the results of its operations, the changes in its net assets, and the financial highlights for the period then ended, in conformity with U.S. generally accepted accounting principles.
KPMG LLP
Boston, Massachusetts
January 23, 2009
Board of Trustees and Trust Officers
The Board is responsible for managing the Trust's business affairs and for exercising all the Trust's powers except those reserved for the shareholders. The following tables give information about each Board member and the senior officers of the Fund. Where required, the tables separately list Board members who are "interested persons" of the Fund (i.e., "Interested" Board members) and those who are not (i.e., "Independent" Board members). Unless otherwise noted, the address of each person listed is Federated Investors Tower, 1001 Liberty Avenue, Pittsburgh, PA 15222. The address of all Independent Board members listed is 4000 Ericsson Drive, Warrendale, PA 15086-7561; Attention: Mutual Fund Board. As of December 31, 2008, the Trust comprised 10 portfolios, and the Federated Fund Complex consisted of 40 investment companies (comprising 149 portfolios). Unless otherwise noted, each Officer is elected annually. Unless otherwise noted, each Board member oversees all portfolios in the Federated Fund Complex and serves for an indefinite term. The Fund's Statement of Additional Information includes additional information about Trust Trustees and is available, without charge and upon request, by calling 1-800-341-7400.
INTERESTED TRUSTEES BACKGROUND
|
|
|
Name
Birth Date
Positions Held with Trust
Date Service Began
|
| Principal Occupation(s) for Past Five Years,
Other Directorships Held and Previous Position(s)
|
John F. Donahue*
Birth Date: July 28, 1924
TRUSTEE
Began serving: April 1984 | | Principal Occupations: Director or Trustee of the Federated Fund Complex; Chairman and Director, Federated Investors, Inc.; Chairman of the Federated Fund Complex's Executive Committee.
Previous Positions: Chairman of the Federated Fund Complex; Trustee, Federated Investment Management Company; Chairman and Director, Federated Investment Counseling. |
|
|
|
J. Christopher Donahue*
Birth Date: April 11, 1949
TRUSTEE AND PRESIDENT
Began serving: January 2000 | | Principal Occupations: Principal Executive Officer and President of the Federated Fund Complex; Director or Trustee of some of the Funds in the Federated Fund Complex; President, Chief Executive Officer and Director, Federated Investors, Inc.; Chairman and Trustee, Federated Investment Management Company; Trustee, Federated Investment Counseling; Chairman and Director, Federated Global Investment Management Corp.; Chairman, Federated Equity Management Company of Pennsylvania and Passport Research, Ltd. (investment advisory subsidiary of Federated); Trustee, Federated Shareholder Services Company; Director, Federated Services Company.
Previous Positions: President, Federated Investment Counseling; President and Chief Executive Officer, Federated Investment Management Company, Federated Global Investment Management Corp. and Passport Research, Ltd. |
|
|
|
* Family relationships and reasons for "interested" status: John F. Donahue is the father of J. Christopher Donahue; both are "interested" due to their beneficial ownership of shares of Federated Investors, Inc. and the positions they hold with Federated and its subsidiaries.
INDEPENDENT TRUSTEES BACKGROUND
|
|
|
Name
Birth Date
Positions Held with Trust
Date Service Began
|
| Principal Occupation(s) for Past Five Years,
Other Directorships Held and Previous Position(s)
|
Thomas G. Bigley
Birth Date: February 3, 1934
TRUSTEE
Began serving: October 1995 | | Principal Occupation: Director or Trustee of the Federated Fund Complex.
Other Directorships Held: Director, Member of Executive Committee, Children's Hospital of Pittsburgh; Director, University of Pittsburgh.
Previous Position: Senior Partner, Ernst & Young LLP. |
|
|
|
John T. Conroy, Jr.
Birth Date: June 23, 1937
TRUSTEE
Began serving: November 1991 | | Principal Occupations: Director or Trustee of the Federated Fund Complex; Chairman of the Board, Investment Properties Corporation; Partner or Trustee in private real estate ventures in Southwest Florida; Assistant Professor in Theology at Barry University and Blessed Edmund Rice School for Pastoral Ministry.
Previous Positions: President, Investment Properties Corporation; Senior Vice President, John R. Wood and Associates, Inc., Realtors; President, Naples Property Management, Inc. and Northgate Village Development Corporation. |
|
|
|
Nicholas P. Constantakis
Birth Date: September 3, 1939
TRUSTEE
Began serving: February 1998 | | Principal Occupation: Director or Trustee of the Federated Fund Complex.
Other Directorships Held: Director and Chairman of the Audit Committee, Michael Baker Corporation (engineering and energy services worldwide).
Previous Position: Partner, Andersen Worldwide SC. |
|
|
|
John F. Cunningham
Birth Date: March 5, 1943
TRUSTEE
Began serving: January 1999 | | Principal Occupations: Director or Trustee of the Federated Fund Complex.
Other Directorships Held: Chairman, President and Chief Executive Officer, Cunningham & Co., Inc. (strategic business consulting); Trustee Associate, Boston College.
Previous Positions: Director, QSGI, Inc. (technology services company); Director, Redgate Communications and EMC Corporation (computer storage systems); Chairman of the Board and Chief Executive Officer, Computer Consoles, Inc.; President and Chief Operating Officer, Wang Laboratories; Director, First National Bank of Boston; Director, Apollo Computer, Inc. |
|
|
|
|
|
|
Name
Birth Date
Positions Held with Trust
Date Service Began
|
| Principal Occupation(s) for Past Five Years,
Other Directorships Held and Previous Position(s)
|
Peter E. Madden
Birth Date: March 16, 1942
TRUSTEE
Began serving: November 1991 | | Principal Occupation: Director or Trustee, and Chairman of the Board of Directors or Trustees, of the Federated Fund Complex.
Other Directorships Held: Board of Overseers, Babson College.
Previous Positions: Representative, Commonwealth of Massachusetts General Court; President, State Street Bank and Trust Company and State Street Corporation (retired); Director, VISA USA and VISA International; Chairman and Director, Massachusetts Bankers Association; Director, Depository Trust Corporation; Director, The Boston Stock Exchange. |
|
|
|
Charles F. Mansfield, Jr.
Birth Date: April 10, 1945
TRUSTEE
Began serving: January 1999 | | Principal Occupations: Director or Trustee of the Federated Fund Complex; Management Consultant.
Previous Positions: Chief Executive Officer, PBTC International Bank; Partner, Arthur Young & Company (now Ernst & Young LLP); Chief Financial Officer of Retail Banking Sector, Chase Manhattan Bank; Senior Vice President, HSBC Bank USA (formerly, Marine Midland Bank); Vice President, Citibank; Assistant Professor of Banking and Finance, Frank G. Zarb School of Business, Hofstra University; Executive Vice President DVC Group, Inc. (marketing, communications and technology). |
|
|
|
R. James Nicholson
Birth Date: February 4, 1938
TRUSTEE
Began serving: January 2008 | | Principal Occupations: Director or Trustee of the Federated Fund Complex; Senior Counsel, Brownstein Hyatt Farber Schrek, P.C.; Former Secretary of the U.S. Dept. of Veterans Affairs; Former U.S. Ambassador to the Holy See; Former Chairman of the Republican National Committee.
Other Directorships Held: Director, Horatio Alger Association.
Previous Positions: Colonel, U.S. Army Reserve; Partner, Calkins, Kramer, Grimshaw and Harring, P.C.; General Counsel, Colorado Association of Housing and Building; Chairman and CEO, Nicholson Enterprises, Inc. (real estate holding company); Chairman and CEO, Renaissance Homes of Colorado. |
|
|
|
|
|
|
Name
Birth Date
Positions Held with Trust
Date Service Began
|
| Principal Occupation(s) for Past Five Years,
Other Directorships Held and Previous Position(s)
|
Thomas M. O'Neill
Birth Date: June 14, 1951
TRUSTEE
Began serving: October 2006 | | Principal Occupations: Director or Trustee of the Federated Fund Complex; Managing Director and Partner, Navigator Management Company, L.P. (investment and strategic consulting).
Other Directorships Held: Board of Overseers, Children's Hospital of Boston; Visiting Committee on Athletics, Harvard College.
Previous Positions: Chief Executive Officer and President, Managing Director and Chief Investment Officer, Fleet Investment Advisors; President and Chief Executive Officer, Aeltus Investment Management, Inc.; General Partner, Hellman, Jordan Management Co., Boston, MA; Chief Investment Officer, The Putnam Companies, Boston, MA; Credit Analyst and Lending Officer, Fleet Bank. |
|
|
|
John S. Walsh
Birth Date: November 28, 1957
TRUSTEE
Began serving: January 1999 | | Principal Occupations: Director or Trustee of the Federated Fund Complex; President and Director, Heat Wagon, Inc. (manufacturer of construction temporary heaters); President and Director, Manufacturers Products, Inc. (distributor of portable construction heaters); President, Portable Heater Parts, a division of Manufacturers Products, Inc.
Previous Position: Vice President, Walsh & Kelly, Inc. |
|
|
|
James F. Will
Birth Date: October 12, 1938
TRUSTEE
Began serving: April 2006 | | Principal Occupations: Director or Trustee of the Federated Fund Complex; formerly, Vice Chancellor and President, Saint Vincent College.
Other Directorships Held: Trustee, Saint Vincent College; Alleghany Corporation.
Previous Positions: Chairman, President and Chief Executive Officer, Armco, Inc.; President and Chief Executive Officer, Cyclops Industries; President and Chief Operating Officer, Kaiser Steel Corporation. |
|
|
|
OFFICERS
|
|
|
Name
Birth Date
Address
Positions Held with Trust
Date Service Began
|
| Principal Occupation(s) for Past Five Years and Previous Position(s)
|
John W. McGonigle
Birth Date: October 26, 1938
EXECUTIVE VICE PRESIDENT
AND SECRETARY
Began serving: April 1984 | | Principal Occupations: Executive Vice President and Secretary of the Federated Fund Complex; Vice Chairman, Executive Vice President, Secretary and Director, Federated Investors, Inc.
Previous Positions: Trustee, Federated Investment Management Company and Federated Investment Counseling; Director, Federated Global Investment Management Corp., Federated Services Company and Federated Securities Corp. |
|
|
|
Richard A. Novak
Birth Date: December 25, 1963 TREASURER
Began serving: January 2006 | | Principal Occupations: Principal Financial Officer and Treasurer of the Federated Fund Complex; Senior Vice President, Federated Administrative Services; Financial and Operations Principal for Federated Securities Corp., Edgewood Services, Inc. and Southpointe Distribution Services, Inc.
Previous Positions: Controller of Federated Investors, Inc.; Vice President, Finance of Federated Services Company; held various financial management positions within The Mercy Hospital of Pittsburgh; Auditor, Arthur Andersen & Co. |
|
|
|
Richard B. Fisher
Birth Date: May 17, 1923
VICE PRESIDENT
Began serving: April 1984 | | Principal Occupations: Vice Chairman or Vice President of some of the Funds in the Federated Fund Complex; Vice Chairman, Federated Investors, Inc.; Chairman, Federated Securities Corp.
Previous Positions: President and Director or Trustee of some of the Funds in the Federated Fund Complex; Executive Vice President, Federated Investors, Inc.; Director and Chief Executive Officer, Federated Securities Corp. |
|
|
|
Brian P. Bouda
Birth Date: February 28, 1947
CHIEF COMPLIANCE OFFICER
AND SENIOR VICE PRESIDENT
Began serving: August 2004 | | Principal Occupations: Senior Vice President and Chief Compliance Officer of the Federated Fund Complex; Vice President and Chief Compliance Officer of Federated Investors, Inc. and Chief Compliance Officer of its subsidiaries. Mr. Bouda joined Federated in 1999 and is a member of the American Bar Association and the State Bar Association of Wisconsin. |
|
|
|
|
|
|
Name
Birth Date
Address
Positions Held with Trust
Date Service Began
|
| Principal Occupation(s) for Past Five Years and Previous Position(s)
|
Stephen F. Auth
Birth Date: September 3, 1956
450 Lexington Avenue
Suite 3700
New York, NY 10017-3943
CHIEF INVESTMENT OFFICER
Began serving: November 2002 | | Principal Occupations: Chief Investment Officer of this Fund and various other Funds in the Federated Fund Complex; Executive Vice President, Federated Investment Counseling, Federated Global Investment Management Corp. and Federated Equity Management Company of Pennsylvania.
Previous Positions: Executive Vice President, Federated Investment Management Company, and Passport Research, Ltd. (investment advisory subsidiary of Federated); Senior Vice President, Global Portfolio Management Services Division; Senior Vice President, Federated Investment Management Company and Passport Research, Ltd.; Senior Managing Director and Portfolio Manager, Prudential Investments. |
|
|
|
Lawrence Auriana
Birth Date: January 8, 1944
140 East 45 th Street
New York, NY 10017
VICE PRESIDENT
Began serving: November 2001 | | Principal Occupations: Lawrence Auriana is Vice President of the Trust. Mr. Auriana joined Federated in April 2001 as Co-Head of Investments/Federated Kaufmann. From August 1984 to April 2001, Mr. Auriana was President and Treasurer of Edgemont Asset Management Corp., and Chairman of the Board and Portfolio Manager to The Kaufmann Fund, Inc. (predecessor to the Federated Kaufmann Fund). Mr. Auriana earned a B.S. in economics from Fordham University and has been engaged in the securities business since 1965. |
|
|
|
Walter C. Bean
Birth Date : June 22, 1945
VICE PRESIDENT
Began serving: November 2006 | | Principal Occupations : Walter C. Bean has been the Fund's Portfolio Manager since inception. He is Vice President of the Trust. Mr. Bean is a Senior Vice President, Senior Portfolio Manager and the Head of the Income and Value Equity Management Teams of the Fund's Adviser. Mr. Bean joined Federated in 2000. His previous associations included: various investment management and research positions with C.S. McKee & Company, First Chicago Investment Advisors, CIGNA Investment Advisors and Mellon Bank. Mr. Bean earned a Bachelors Degree in Business Administration from Ohio University and an M.B.A. from the Pennsylvania State University. Mr. Bean is a Chartered Financial Analyst and has 39 years of investment experience. |
|
|
|
Hans P. Utsch
Birth Date: July 3, 1936
140 East 45 th Street
New York, NY 10017
VICE PRESIDENT
Began serving: November 2001 | | Principal Occupations: Hans P. Utsch is Vice President of the Trust. Mr. Utsch joined Federated in April 2001 as Co-Head of Investments/Federated Kaufmann. From August 1984 to April 2001, Mr. Utsch was Chairman of the Board and Secretary of Edgemont Asset Management Corp., and President and Portfolio Manager to The Kaufmann Fund, Inc. (predecessor to the Federated Kaufmann Fund). Mr. Utsch graduated from Amherst College and holds an M.B.A. from Columbia University. He has been engaged in the securities business since 1962. |
|
|
|
Evaluation and Approval of Advisory
Contract - May 2008
FEDERATED INTERNATIONAL STRATEGIC VALUE FUND (THE "FUND")
The Fund's Board reviewed the Fund's proposed investment advisory contract at meetings held in May 2008. The Board's decision to approve the contract reflects the exercise of its business judgment on whether to authorize the creation and offering of this new investment vehicle, as proposed by, and based on information provided by, the Federated organization, and based on Federated's recommendation to go forward with development of the Fund.
The Federated funds' Board had previously appointed a Senior Officer, whose duties include specified responsibilities relating to the process by which advisory fees are to be charged to a Federated Fund. The Senior Officer has the authority to retain consultants, experts, or staff as may be reasonably necessary to assist in the performance of his duties, reports directly to the Board, and may be terminated only with the approval of a majority of the independent members of the Board. The Senior Officer prepared and furnished to the Board an independent, written evaluation that covered topics discussed below. The Board considered that evaluation, along with other information, in deciding to approve the proposed advisory contract.
The Board also considered the anticipated compensation and benefits to be received by the Adviser. This includes fees to be received for services provided to the Fund by other entities in the Federated organization and research services that may be received by the Adviser from brokers that execute fund trades, as well as advisory fees. The Board is also familiar with and considered judicial decisions concerning allegedly excessive investment advisory fees, which have indicated that the following factors may be relevant to an Adviser's fiduciary duty with respect to its receipt of compensation from a fund: the nature and quality of the services provided by the Adviser, including the performance of the Fund; the Adviser's cost of providing the services; the extent to which the Adviser may realize "economies of scale" as the Fund grows larger; any indirect benefits that may accrue to the Adviser and its affiliates as a result of the Adviser's relationship with the Fund; performance and expenses of comparable funds; and the extent to which the independent Board members are fully informed about all facts the Board deems relevant bearing on the Adviser's services and fees. The Board further considered management fees (including any components thereof) charged to institutional and other clients of the Adviser for what might be viewed as like services, and the cost to the Adviser and its affiliates of supplying services pursuant to the management fee agreements, excluding any intra-corporate profit and profit margins of the Adviser and its affiliates for supplying such services. The Board was aware of these factors and was guided by them in its review of the Fund's advisory contract to the extent it considered them to be appropriate and relevant, as discussed further below.
The Board considered and weighed these circumstances in light of its substantial accumulated experience in working with Federated on matters relating to other Federated funds, and was assisted in its deliberations by independent legal counsel. The Board's consideration of the proposed advisory contract included review of the Senior Officer's evaluation, accompanying data and additional reports covering such matters as: the Adviser's investment philosophy, revenue, profitability, personnel and processes; investment and operating strategies; the Fund's investment objectives; the Fund's anticipated expenses (including the proposed advisory fee itself and the overall estimated expense structure of the Fund, both in absolute terms and relative to similar and/or competing funds, with due regard for contractual or voluntary expense limitations); and the nature, quality and extent of the advisory and other services to be provided to the Fund by the Adviser and its affiliates. The Board also considered the likely preferences and expectations of anticipated Fund shareholders and their relative sophistication; the continuing state of competition in the mutual fund industry and market practices; the range of comparable fees for similar funds in the mutual fund industry; the Fund's relationship to the Federated family of funds which include a comprehensive array of funds with different investment objectives, policies and strategies which are available for exchange without the incurrence of additional sales charges; compliance and audit reports concerning the Federated funds and the Federated companies that service them (including communications from regulatory agencies), as well as Federated's responses to any issues raised therein; and relevant developments in the mutual fund industry and how the Federated funds and/or Federated are responding to them. The Board's evaluation process is evolutionary. The criteria considered and the emphasis placed on relevant criteria change in recognition of changing circumstances in the mutual fund market-place.
With respect to the Fund's expenses in particular, the Board has found the use of comparisons to other mutual funds with comparable investment programs to be particularly useful, given the high degree of competition in the mutual fund business. The Board focused on comparisons with other similar mutual funds more heavily than non-mutual fund products or services because, simply put, they are more relevant. For example, other mutual funds are the products most like the Fund, they are readily available to Fund shareholders as alternative investment vehicles, and they are the type of investment vehicle in fact chosen and maintained by the Fund's anticipated investors. The range of their fees and expenses therefore appears to be a generally reliable indication of what consumers have found to be reasonable in the precise marketplace in which the Fund will compete. In this regard, the Senior Officer also reviewed Federated's fees for providing advisory services to products outside the Federated family of funds (e.g., institutional and separate accounts). He concluded that mutual funds and institutional accounts are inherently different products. Those differences included, but are not limited to, different types of targeted investors; being subject to different laws and regulations; different legal structures; different average account sizes; different associated costs; and different portfolio management techniques made necessary by different cash flows. The Senior Officer did not consider these fee schedules to be significant in determining the appropriateness of mutual fund advisory contracts.
The Senior Officer reviewed reports compiled by Federated, using data supplied by independent fund ranking organizations, regarding the fees charged by other mutual funds, noting his view that comparisons to fund peer groups are highly important in judging the reasonableness of proposed fees.
Because the Board was considering the advisory contract in the context of Federated's proposal to create a new fund, the factors mentioned above relating to such matters as performance and any indirect benefits that may accrue to the Adviser and its affiliates as a result of the Adviser's relationship with the Fund, are essentially impossible to apply before the Fund has experienced any meaningful operating history. Nevertheless, in connection with the Board's governance of other Federated funds, it should be noted that the Board regularly receives financial information about Federated, including reports on the compensation and benefits Federated derives from its relationships with the other Federated funds. These reports cover not only the fees under the advisory contracts, but also fees received by Federated's subsidiaries for providing other services to the Federated funds under separate contracts (e.g., for serving as the Federated funds' administrator). The reports also discuss any indirect benefit Federated may derive from its receipt of research services from brokers who execute Federated fund trades. In addition, the Board considered the fact that, in order for a fund to be competitive in the marketplace, Federated and its affiliates frequently waive fees and/or reimburse expenses and have disclosed to fund investors and/or indicated to the Board their intention to do so in the future, where appropriate.
Federated furnished reports, requested by the Senior Officer, that reported projected revenues and estimated the various components of the Fund's expenses. The Senior Officer noted, in material provided to the Board, that this Fund is new to Federated and any projected profit margin would be expected to be less than the overall Federated profit margin, taking all allocated costs into consideration, and could be significantly less during the initial years of operation.
The Board and the Senior Officer also reviewed a report compiled by Federated comparing profitability information for Federated to other publicly held fund management companies. In this regard, the Senior Officer noted the limited availability of such information, but nonetheless concluded that Federated's profit margins did not appear to be excessive and the Board agreed.
The Senior Officer's evaluation also discussed the notion of possible realization of "economies of scale" as a fund grows larger. The Board considered in this regard that the Adviser has made significant and long-term investments in areas that support all of the Federated funds, such as personnel and processes for the portfolio management, compliance, and risk management functions; and systems technology; and that the benefits of these efforts (as well as any economies, should they exist) were likely to be enjoyed by the fund complex as a whole. Finally, the Board also noted the absence of any applicable regulatory or industry guidelines on this subject, which is compounded by the lack of any common industry practice or general pattern with respect to structuring fund advisory fees with "breakpoints" that serve to reduce the fee as the fund attains a certain size. The Senior Officer did not recommend institution of breakpoints in pricing Federated's proposed advisory services to the Fund at this time.
The Board based its decision to approve the proposed advisory contract on the totality of the circumstances and relevant factors, and with a view to past and future long-term considerations. As noted, not all of the factors and considerations identified above were necessarily relevant to the Fund, nor does the Board consider any one of them to be determinative. With respect to the factors that are relevant, the Board's decision to approve the contract reflects its determination that, based upon the information requested and supplied, Federated's proposal to establish and manage the Fund, and its past performance and actions in providing services to other mutual funds (which the Board has found to be satisfactory with respect to such other funds), provide a satisfactory basis to support the business decision to approve the proposed arrangements.
Voting Proxies on Fund Portfolio Securities
A description of the policies and procedures that the Fund uses to determine how to vote proxies, if any, relating to securities held in the Fund's portfolio is available, without charge and upon request, by calling 1-800-341-7400. A report on "Form N-PX" of how the Fund voted any such proxies during the most recent 12-month period ended June 30 is available from Federated's website at FederatedInvestors.com. To access this information from the "Products" section of the website, click on the "Prospectuses and Regulatory Reports" link under "Related Information," then select the appropriate link opposite the name of the Fund; or select the name of the Fund and from the Fund's page, click on the "Prospectuses and Regulatory Reports" link. Form N-PX filings are also available at the SEC's website at www.sec.gov.
Quarterly Portfolio Schedule
The Fund files with the SEC a complete schedule of its portfolio holdings, as of the close of the first and third quarters of its fiscal year, on "Form N-Q." These filings are available on the SEC's website at www.sec.gov and may be reviewed and copied at the SEC's Public Reference Room in Washington, DC. (Call 1-800-SEC-0330 for information on the operation of the Public Reference Room.) You may also access this information from the "Products" section of Federated's website at FederatedInvestors.com by clicking on "Portfolio Holdings" under "Related Information," then selecting the appropriate link opposite the name of the Fund; or select the name of the Fund and from the Fund's page, click on the "Portfolio Holdings" link.
Mutual funds are not bank deposits or obligations, are not guaranteed by any bank and are not insured or guaranteed by the U.S. government, the Federal Deposit Insurance Corporation, the Federal Reserve Board or any other government agency. Investment in mutual funds involves investment risk, including the possible loss of principal.
This report is authorized for distribution to prospective investors only when preceded or accompanied by the Fund's prospectus, which contains facts concerning its objective and policies, management fees, expenses and other information.
Federated
World-Class Investment Manager
Federated International Strategic Value Fund
Federated Investors Funds
4000 Ericsson Drive
Warrendale, PA 15086-7561
Contact us at FederatedInvestors.com
or call 1-800-341-7400.
Federated Securities Corp., Distributor
Cusip 314172388
Cusip 314172370
39834 (1/09)
Federated is a registered mark of Federated Investors, Inc. 2009 (c)Federated Investors, Inc.
Federated
World-Class Investment Manager
Federated International Strategic Value Fund
Established 2008
A Portfolio of Federated Equity Funds
ANNUAL SHAREHOLDER REPORT
November 30, 2008
Institutional Shares
FINANCIAL HIGHLIGHTS
SHAREHOLDER EXPENSE EXAMPLE
MANAGEMENT'S DISCUSSION OF FUND PERFORMANCE
PORTFOLIO OF INVESTMENTS SUMMARY TABLES
PORTFOLIO OF INVESTMENTS
STATEMENT OF ASSETS AND LIABILITIES
STATEMENT OF OPERATIONS
STATEMENT OF CHANGES IN NET ASSETS
NOTES TO FINANCIAL STATEMENTS
REPORT OF INDEPENDENT REGISTERED PUBLIC ACCOUNTING FIRM
BOARD OF TRUSTEES AND TRUST OFFICERS
EVALUATION AND APPROVAL OF ADVISORY CONTRACT
VOTING PROXIES ON FUND PORTFOLIO SECURITIES
QUARTERLY PORTFOLIO SCHEDULE
Not FDIC Insured * May Lose Value * No Bank Guarantee
Financial Highlights
(For a Share Outstanding Throughout the Period)
Period Ended November 30
|
| 2008
| 1
|
Net Asset Value, Beginning of Period
| | $5.00 | |
Income From Investment Operations:
| | | |
Net investment income
| | 0.09 | 2 |
Net realized and unrealized loss on investments and foreign currency transactions
|
| (2.02
| )
|
TOTAL FROM INVESTMENT OPERATIONS
|
| (1.93
| )
|
Less Distributions:
| | | |
Distributions from net investment income
|
| (0.02
| )
|
Net Asset Value, End of Period
|
| $3.05
|
|
Total Return 3
|
| (38.77
| )%
|
| | | |
Ratios to Average Net Assets:
|
|
|
|
Net expenses
|
| 0.18
| % 4
|
Net investment income
|
| 4.55
| % 4
|
Expense waiver/reimbursement 5
|
| 52.61
| % 4
|
Supplemental Data:
|
|
|
|
Net assets, end of period (000 omitted)
|
| $782
|
|
Portfolio turnover
|
| 22
| %
|
1 Reflects operations for the period from June 4, 2008 (date of initial investment) to November 30, 2008.
2 Per share number has been calculated using the average shares method.
3 Based on net asset value, which does not reflect the sales charge, redemption fee or contingent deferred sales charge, if applicable. Total returns for periods of less than one year are not annualized.
4 Computed on an annualized basis.
5 This expense decrease is reflected in both the net expense and the net investment income ratios shown above.
See Notes which are an integral part of the Financial Statements
Shareholder Expense Example
As a shareholder of the Fund, you incur ongoing costs, including management fees and to the extent applicable, distribution (12b-1) fees and/or shareholder services fees and other Fund expenses. This Example is intended to help you to understand your ongoing costs (in dollars) of investing in the Fund and to compare these costs with the ongoing costs of investing in other mutual funds. It is based on an investment of $1,000 invested at the beginning of the period and held for the entire period from June 1, 2008 1 to November 30, 2008.
ACTUAL EXPENSES
The first section of the table below provides information about actual account values and actual expenses. You may use the information in this section, together with the amount you invested, to estimate the expenses that you incurred over the period. Simply divide your account value by $1,000 (for example, an $8,600 account value divided by $1,000 = 8.6), then multiply the result by the number in the first section under the heading entitled "Expenses Paid During Period" to estimate the expenses attributable to your investment during this period.
HYPOTHETICAL EXAMPLE FOR COMPARISON PURPOSES
The second section of the table below provides information about hypothetical account values and hypothetical expenses based on the Fund's actual expense ratio and an assumed rate of return of 5% per year before expenses, which is not the Fund's actual return. Thus, you should not use the hypothetical account values and expenses to estimate the actual ending account balance or your expenses for the period. Rather, these figures are required to be provided to enable you to compare the ongoing costs of investing in the Fund with other funds. To do so, compare this 5% hypothetical example with the 5% hypothetical examples that appear in the shareholder reports of the other funds.
Please note that the expenses shown in the table are meant to highlight your ongoing costs only. Therefore, the second section of the table is useful in comparing ongoing costs only, and will not help you determine the relative total costs of owning different funds.
|
| Beginning
Account Value
6/1/2008
|
| Ending
Account Value
11/30/2008
|
| Expenses Paid
During Period 1
|
Actual
|
| $1,000
|
| $ 612.30
|
| $0.71
|
Hypothetical (assuming a 5% return before expenses)
|
| $1,000
|
| $1,024.10
|
| $0.91
|
1 "Actual" expense information for the Fund's Institutional Shares is for the period from June 4, 2008 (date of initial investment) to November 30, 2008. Actual expenses are equal to the Fund's annualized net expense ratio of 0.18%, multiplied by 180/366 (to reflect the period from initial investment to November 30, 2008). "Hypothetical" expense information is presented on the basis of the full one-half-year period to enable comparison to other funds. It is based on assuming the same net expense ratio and average account value over the period, but it is multiplied by 183/366 (to reflect the full half-year period).
Management's Discussion of Fund Performance
Since its inception date of June 4, 2008 through fiscal year ended November 30, 2008, the total return of the Federated International Strategic Value Fund was (-38.77%) for the Institutional Shares. The total return of the MSCI EAFE High Dividend Yield Index (MSCI HDY) 1 was (-45.06%) for the same period. The fund's total return for the fiscal year reflected actual cash flows, transaction costs and other expenses, which were not reflected in the total return of the benchmark.
The following discussion will focus on the performance of the fund's Institutional Shares.
MARKET OVERVIEW
The fund was launched on June 4, 2008. The subsequent period proved to be a challenging investment environment characterized by both high volatility and double-digit negative total returns across most countries within the MSCI HDY. 2 Non-U.S. stock markets struggled under the weight of deleveraging financial systems, declining housing markets and the weakening in demand associated with the spike in commodity prices.
The currency markets have been equally volatile. The U.S. dollar made a strong comeback versus the Euro and Sterling, but much of that strength was due to a flight to quality and the weaker economic outlook in Europe, rather than strength on our shores.
1 The MSCI HDY represents the components of the MSCI Europe, Australasia and Far East Index (MSCI EAFE), an unmanaged market capitalization-weighted equity index comprising 20 of the 48 countries in the MSCI universe and representing the developed world outside of North America. Each MSCI country index is created separately, then aggregated, without change, into regional MSCI indices. MSCI EAFE performance data is calculated in U.S. dollars and in local currency. The MSCI HDY, however, only includes securities which have a dividend yield that is at least 30% higher than its relative parent index, the MSCI EAFE. Only securities with a reasonable payout and a non-negative 5 Year DPS growth rate are eligible for inclusion in the MSCI HDY. Investments cannot be made directly in an index.
2 International investing involves special risks including currency risk, increased volatility of foreign securities, political risks and differences in auditing and other financial standards.
Still, there were notable return patterns. Prior to the fund's launch, the commodity bubble was still expanding and the financial sector was struggling; dividend stocks were very much out of favor. By the middle of 2008, however, high dividend-yielding sectors experienced some much needed relief as the selling shifted to the more cyclical sectors. 3
As investors fled for safety, those areas that gave up less return were dividend-friendly sectors such as Health Care (-20.20%), Telecom Services (-29.69%) and Consumer Staples (-32.09%). Further to the fund's benefit, there were broad sell-offs in yield-starved sectors such as Materials (-60.11%) and Industrials (-53.72%). Once a yield-rich sector, Financials (-54.66%) led the market down as financial institutions and foreign governments alike slashed dividend policies in hopes of defending themselves against the worsening financial crisis.
FUND PERFORMANCE
During the reporting period, the fund outperformed the MSCI HDY by 6.28%. A key driver of the fund's outperformance was positive stock selection in Canada, Brazil and Mexico, countries not represented in the benchmark. Stocks that outperformed the benchmark constituents included Bank of Montreal, one of Canada's largest financial institutions, Natura Cosmeticos, a Brazilian personal care producer, and Kimberly Clark De Mexico, a personal care manufacturer in Mexico. The fund benefited further from positive stock selection in Belgium, the United Kingdom and Australia. The fund gave up relative performance with overweight positions in Finland and Ireland, countries under extreme economic pressure.
From a sector perspective, the fund benefited importantly from its 15.52% underweight position in the Financials sector. Positive stock selection within the sector further increased relative performance, as the fund holdings outperformed the benchmark constituents by 3.14%.
The fund benefited from overweight positions in Consumer Staples and Telecom Services. Both groups outperformed the overall benchmark due to their lower downside risk features in weak markets. A Consumer Staples name that did particularly well, Rothmans, gained 10.01% in the period on news that Phillip Morris would acquire the company at a premium.
The fund was penalized by a 6.20% underweight exposure to Energy, a group that offers little opportunity to dividend investors, yet outperformed the broad market. The fund was also negatively impacted by weak stock selection within this sector. Nestle Oil negatively affected relative performance as the stock fell 56.93% in the reporting period.
3 There are no guarantees that dividend-paying stocks will continue to pay dividends. In addition, dividend-paying stocks may not experience the same capital appreciation potential as non-dividend-paying stocks.
GROWTH OF A $10,000 INVESTMENT - INSTITUTIONAL SHARES
The graph below illustrates the hypothetical investment of $10,000 1 in Federated International Strategic Value Fund (Institutional Shares) (the "Fund") from June 4, 2008 (start of performance) to November 30, 2008, compared to the MSCI EAFE High Dividend Yield Index (MSCI HDY) 2 and the Morningstar Foreign Large Value Funds Category Average (MFLVFCA). 2
Cumulative Total Return for the Period Ended 11/30/2008
|
|
|
Start of Performance (6/4/2008)
|
| (38.77)%
|
Performance data quoted represents past performance which is no guarantee of future results. Investment return and principal value will fluctuate so that an investor's shares, when redeemed, may be worth more or less than their original cost. Mutual fund performance changes over time and current performance may be lower or higher than what is stated. For current to the most recent month-end performance and after-tax returns, visit FederatedInvestors.com or call 1-800-341-7400. Returns shown do not reflect the deduction of taxes that a shareholder would pay on Fund distributions or the redemption of Fund shares. Mutual funds are not obligations of or guaranteed by any bank and are not federally insured.
1 Represents a hypothetical investment of $10,000 in the Fund. The Fund's performance assumes the reinvestment of all dividends and distributions. The MSCI HDY and the MFLVFCA have been adjusted to reflect reinvestment of dividends on securities in the index and average.
2 The MSCI HDY and the MFLVFCA are not adjusted to reflect sales charges, expenses or other fees that the Securities and Exchange Commission (SEC) requires to be reflected in the Fund's performance. The MSCI HDY represents the components of the MSCI Europe, Australasia and Far East Index (MSCI EAFE), an unmanaged market capitalization-weighted equity index comprising 20 of the 48 countries in the MSCI universe and representing the developed world outside of North America. Each MSCI country index is created separately, then aggregated, without change, into regional MSCI indices. MSCI EAFE performance data is calculated in U.S. dollars and in local currency. The MSCI HDY, however, only includes securities which have a dividend yield that is at least 30% higher than its relative parent index, the MSCI EAFE. Only securities with a reasonable payout and a non-negative 5 Year DPS growth rate are eligible for inclusion in the MSCI HDY. The MFLVFCA includes foreign large-value portfolios that invest mainly in big international stocks that are less expensive or growing more slowly than other large-cap stocks. Most of these portfolios divide their assets among a dozen or more developed markets, including Japan, Britain, France and Germany. These portfolios primarily invest in stocks that have market caps in the top 70% of each economically integrated market (such as Europe or Asia ex-Japan). Value is defined based on low valuations (low price ratios and high dividend yields) and slow growth (low growth rates for earnings, sales, book value and cash flow). These portfolios typically will have less than 20% of assets invested in U.S. stocks. The index is unmanaged and, unlike the Fund is not affected by cashflows. It is not possible to invest directly in an index or an average.
© 2008 Morningstar, Inc. All Rights Reserved. The information contained herein: (1) is proprietary to Morningstar and/or its content providers; (2) may no be copied or distributed; and (3) is not warranted to be accurate, complete or timely. Neither Morningstar nor its content providers are responsible for any damages or losses arising from any use of this information. Past performance is no guarantee of future results.
Performance data quoted represents past performance which is no guarantee of future results. Investment return and principal value will fluctuate so that an investor's shares, when redeemed, may be worth more or less than their original cost. Mutual fund performance changes over time and current performance may be lower or higher than what is stated. For current to the most recent month-end performance and after-tax returns, visit FederatedInvestors.com or call 1-800-341-7400.
Portfolio of Investments Summary Tables
At November 30, 2008, the Fund's portfolio composition 1 was as follows:
Country
|
| Percentage of
Total Net Assets
|
United Kingdom
|
| 38.3
| %
|
France
|
| 10.8
| %
|
Australia
|
| 9.2
| %
|
Mexico
|
| 5.8
| %
|
Germany
|
| 4.9
| %
|
Brazil
|
| 4.6
| %
|
Finland
|
| 3.9
| %
|
Belgium
|
| 3.5
| %
|
Netherlands
|
| 3.5
| %
|
Italy
|
| 3.4
| %
|
Canada
|
| 2.7
| %
|
Poland
|
| 2.6
| %
|
Japan
|
| 2.1
| %
|
Greece
|
| 1.0
| %
|
Portugal
|
| 0.6
| %
|
Cash Equivalents 2
|
| 9.7
| %
|
Other Assets and Liabilities--Net 3
|
| (6.6
| )%
|
TOTAL
|
| 100.0
| %
|
1 Country allocations are based primarily on the country in which a company is incorporated. However, the Fund's adviser may allocate a company to a country based on other factors such as location of the company's principal office, the location of the principal trading market for the company's securities or the country where a majority of the company's revenues are derived.
2 Cash Equivalents include any investments in money market mutual funds and/or overnight repurchase agreements.
3 Assets, other than investments in securities, less liabilities. See Statement of Assets and Liabilities.
At November 30, 2008, the Fund's sector classification composition 4 was as follows:
Sector Classification
|
| Percentage of
Total Net Assets
|
Consumer Staples
|
| 21.3
| %
|
Telecommunication Services
|
| 20.6
| %
|
Energy
|
| 12.0
| %
|
Financials
|
| 11.7
| %
|
Health Care
|
| 11.6
| %
|
Utilities
|
| 11.2
| %
|
Consumer Discretionary
|
| 5.1
| %
|
Materials
|
| 3.4
| %
|
Cash Equivalents 2
|
| 9.7
| %
|
Other Assets and Liabilities--Net 3
|
| (6.6
| )%
|
TOTAL
|
| 100.0
| %
|
4 Except for Cash Equivalents and Other Assets and Liabilities, sector classifications are based upon, and individual securities assigned to, the classifications of the Global Industry Classification Standard (GICS) except that the adviser assigns a classification to securities not classified by the GICS and to securities for which the adviser does not have access to the classification made by the GICS.
Portfolio of Investments
November 30, 2008
Shares
|
|
|
|
| Value in
U.S. Dollars
|
| | COMMON STOCKS--94.9% | | | | |
| | Banks--8.2% | | | | |
| 710 | | Bank of Montreal
| | $ | 21,825 | |
| 2,149 | | HSBC Holdings PLC
| | | 23,431 | |
| 670 | | National Australia Bank Ltd., Melbourne
| | | 8,892 | |
| 900 | | Westpac Banking Corp. Ltd., Sydney
|
|
| 10,668
|
|
| | TOTAL
|
|
| 64,816
|
|
| | Consumer Services--1.0% | | | | |
| 308 | | Greek Organization of Football Prognostics
|
|
| 7,637
|
|
| | Energy--12.1% | | | | |
| 2,719 | | BP PLC
| | | 22,055 | |
| 593 | | ENI SpA
| | | 13,451 | |
| 726 | 1 | Neste Oil Oyj
| | | 10,200 | |
| 853 | 1 | Royal Dutch Shell PLC, Class A
| | | 22,998 | |
| 512 | | Total SA
|
|
| 26,862
|
|
| | TOTAL
|
|
| 95,566
|
|
| | Food Beverage & Tobacco--16.1% | | | | |
| 635 | | British American Tobacco PLC
| | | 16,672 | |
| 1,295 | | Coca-Cola Amatil Ltd.
| | | 7,340 | |
| 1,446 | | Diageo PLC
| | | 20,299 | |
| 6,065 | | Foster's Group Ltd.
| | | 21,828 | |
| 5,800 | 1 | Grupo Continental SA
| | | 7,768 | |
| 3,900 | | Grupo Modelo SA de CV, Class C
| | | 10,258 | |
| 740 | | Imperial Tobacco Group PLC
| | | 18,515 | |
| 1,094 | | Unilever PLC
|
|
| 25,242
|
|
| | TOTAL
|
|
| 127,922
|
|
Shares
|
|
|
|
| Value in
U.S. Dollars
|
| | COMMON STOCKS--continued | | | | |
| | Household & Personal Products--3.1% | | | | |
| 5,055 | 1 | Kimberly-Clark de Mexico
| | $ | 15,814 | |
| 990 | 1 | Natura Cosmeticos SA
|
|
| 8,854
|
|
| | TOTAL
|
|
| 24,668
|
|
| | Insurance--3.5% | | | | |
| 1,937 | | Aviva PLC
| | | 12,023 | |
| 847 | | Sampo Oyj, Class A
|
|
| 15,822
|
|
| | TOTAL
|
|
| 27,845
|
|
| | Materials--3.4% | | | | |
| 1,720 | | Amcor Ltd.
| | | 6,708 | |
| 3,708 | | Rexam PLC
|
|
| 19,999
|
|
| | TOTAL
|
|
| 26,707
|
|
| | Media--4.1% | | | | |
| 2,226 | | Pearson PLC
| | | 21,382 | |
| 406 | | Vivendi SA
|
|
| 11,506
|
|
| | TOTAL
|
|
| 32,888
|
|
| | Pharmaceuticals, Biotechnology & Life Sciences--11.6% | | | | |
| 682 | | AstraZeneca PLC
| | | 25,819 | |
| 400 | | Daiichi Sankyo Co. Ltd.
| | | 8,241 | |
| 1,328 | | GlaxoSmithKline PLC
| | | 23,049 | |
| 200 | | Ono Pharmaceutical Co. Ltd.
| | | 8,823 | |
| 473 | | Sanofi-Aventis
|
|
| 26,237
|
|
| | TOTAL
|
|
| 92,169
|
|
| | Telecommunication Services--20.6% | | | | |
| 8,105 | 1 | America Movil SAB de CV
| | | 12,376 | |
| 768 | | Belgacom
| | | 27,988 | |
| 2,167 | | Deutsche Telekom AG, Class REG
| | | 30,156 | |
| 1,997 | | Koninklijke KPN NV
| | | 27,609 | |
| 640 | | Portugal Telecom SGPS SA
| | | 4,740 | |
| 3,160 | | Telekomunikacja Polska SA
| | | 20,714 | |
Shares
|
|
|
|
| Value in
U.S. Dollars
|
| | COMMON STOCKS--continued | | | | |
| | Telecommunication Services--continued | | | | |
| 6,605 | | Telstra Corp. Ltd.
| | $ | 17,611 | |
| 11,300 | | Vodafone Group PLC
|
|
| 22,117
|
|
| | TOTAL
|
|
| 163,311
|
|
| | Utilities--11.2% | | | | |
| 2,155 | | Enel SpA
| | | 13,527 | |
| 248 | | Fortum Corp.
| | | 4,981 | |
| 296 | 1 | GDF Suez
| | | 11,911 | |
| 2,857 | | National Grid PLC
| | | 29,764 | |
| 101 | | RWE AG
| | | 8,521 | |
| 1,380 | | Tractebel Energia SA
| | | 11,581 | |
| 354 | | Veolia Environnement
|
|
| 8,829
|
|
| | TOTAL
|
|
| 89,114
|
|
| | TOTAL COMMON STOCKS
(IDENTIFIED COST $1,018,945)
|
|
| 752,643
|
|
| | PREFERRED STOCK--2.0% | | | | |
| | Food Beverage & Tobacco--2.0% | | | | |
| 375 | | Companhia de Bebidas das Americas (AmBev), Pfd.
(IDENTIFIED COST $22,082)
|
|
| 15,988
|
|
| | MUTUAL FUND--9.7% | | | | |
| 76,615 | 2,3 | Prime Value Obligations Fund, Institutional Shares, 2.35%
(AT NET ASSET VALUE)
|
|
| 76,615
|
|
| | TOTAL INVESTMENTS--106.6%
(IDENTIFIED COST $1,117,642) 4
|
|
| 845,246
|
|
| | OTHER ASSETS AND LIABILITIES - NET--(6.6)% 5
|
|
| (52,200
| )
|
| | TOTAL NET ASSETS--100%
|
| $
| 793,046
|
|
1 Non-income-producing security.
2 Affiliated company.
3 7-Day net yield.
4 The cost of investments for federal tax purposes amounts to $1,117,642.
5 Assets, other than investments in securities, less liabilities. See Statement of Assets and Liabilities.
Note: The categories of investments are shown as a percentage of total net assets at November 30, 2008.
Various inputs are used in determining the value of the Fund's investments. These inputs are summarized in the three broad levels listed below:
Level 1--quoted prices in active markets for identical securities
Level 2--other significant observable inputs (including quoted prices for similar securities, interest rates, prepayment speeds, credit risk, etc.)
Level 3--significant unobservable inputs (including the Fund's own assumptions in determining the fair value of investments)
The inputs or methodology used for valuing securities are not an indication of the risk associated with investing in those securities.
The following is a summary of the inputs used, as of November 30, 2008, in valuing the Fund's assets carried at fair value:
Valuation Inputs
|
| Investments in
Securities
|
Level 1--Quoted Prices
|
| $181,079
|
Level 2--Other Significant Observable Inputs
|
| 664,167
|
Level 3--Significant Unobservable Inputs
|
| - --
|
TOTAL
|
| $845,246
|
See Notes which are an integral part of the Financial Statements
Statement of Assets and Liabilities
November 30, 2008
Assets:
| | | | | | | |
Total investments in securities, at value including $76,615 of investments in an affiliated issuer (Note 5) (identified cost $1,117,642)
| | | | | $ | 845,246 | |
Cash denominated in foreign currency (identified cost $1,166)
| | | | | | 1,127 | |
Income receivable
|
|
|
|
|
| 4,057
|
|
TOTAL ASSETS
|
|
|
|
|
| 850,430
|
|
Liabilities:
| | | | | | | |
Payable for administrative personnel and services fee (Note 5)
| | $ | 14,961 | | | | |
Payable for custodian fees
| | | 1,621 | | | | |
Payable for auditing fees
| | | 28,000 | | | | |
Payable for portfolio accounting fees
| | | 5,666 | | | | |
Payable for insurance premiums
| | | 4,342 | | | | |
Accrued expenses
|
|
| 2,794
|
|
|
|
|
TOTAL LIABILITIES
|
|
|
|
|
| 57,384
|
|
Net assets for 259,952 shares outstanding
|
|
|
|
| $
| 793,046
|
|
Net Assets Consist of:
| | | | | | | |
Paid-in capital
| | | | | $ | 1,197,431 | |
Net unrealized depreciation of investments and translation of assets and
liabilities in foreign currency
| |
| | | |
(272,463 | ) |
Accumulated net realized loss on investments and foreign currency transactions
| | | | | | (153,623 | ) |
Undistributed net investment income
|
|
|
|
|
| 21,701
|
|
TOTAL NET ASSETS
|
|
|
|
| $
| 793,046
|
|
Net Asset Value, Offering Price and Redemption Proceeds Per Share
| | | | | | | |
Class A Shares:
| | | | | | | |
Net asset value per share ($11,337 ÷ 3,722 shares outstanding), no par value, unlimited shares authorized
|
|
|
|
|
| $3.05
|
|
Offering price per share (100/94.50 of $3.05) 1
|
|
|
|
|
| $3.23
|
|
Redemption proceeds per share (98.00/100 of $3.05) 1
|
|
|
|
|
| $2.99
|
|
Class C Shares:
| | | | | | | |
Net asset value per share ($61 ÷ 20 shares outstanding), no par value, unlimited shares authorized
|
|
|
|
|
| $3.05
|
|
Offering price per share
|
|
|
|
|
| $3.05
|
|
Redemption proceeds per share (97.00/100 of $3.05) 1
|
|
|
|
|
| $2.96
|
|
Institutional Shares:
| | | | | | | |
Net asset value per share ($781,648 ÷ 256,210 shares outstanding), no par value, unlimited shares authorized
|
|
|
|
|
| $3.05
|
|
Offering price per share
|
|
|
|
|
| $3.05
|
|
Redemption proceeds per share (98.00/100 of $3.05) 1
|
|
|
|
|
| $2.99
|
|
1 See "What Do Shares Cost?" in the Prospectus.
See Notes which are an integral part of the Financial Statements
Statement of Operations
Period Ended November 30, 2008 1
Investment Income:
| | | | | | | | | | | | |
Dividends (including $890 received from an affiliated issuer (Note 5) and net of foreign taxes withheld of $1,011)
|
|
|
|
|
|
|
|
|
| $
| 20,310
|
|
Expenses:
| | | | | | | | | | | | |
Investment adviser fee (Note 5)
| | | | | | $ | 3,223 | | | | | |
Administrative personnel and services fee (Note 5)
| | | | | | | 113,115 | | | | | |
Custodian fees
| | | | | | | 6,502 | | | | | |
Transfer and dividend disbursing agent fees and expenses
| | | | | | | 130 | | | | | |
Auditing fees
| | | | | | | 28,000 | | | | | |
Legal fees
| | | | | | | 3,445 | | | | | |
Portfolio accounting fees
| | | | | | | 8,500 | | | | | |
Shareholder services fee--Class A Shares (Note 5)
| | | | | | | 5 | | | | | |
Share registration costs
| | | | | | | 49,766 | | | | | |
Printing and postage
| | | | | | | 8,098 | | | | | |
Insurance premiums
| | | | | | | 4,342 | | | | | |
Miscellaneous
|
|
|
|
|
|
| 1,770
|
|
|
|
|
|
TOTAL EXPENSES
|
|
|
|
|
|
| 226,896
|
|
|
|
|
|
Waivers and Reimbursements (Note 5):
| | | | | | | | | | | | |
Waiver/reimbursement of investment adviser fee
| | $ | (3,223 | ) | | | | | | | | |
Waiver of administrative personnel and services fee
| | | (22,127 | ) | | | | | | | | |
Reimbursement of other operating expenses
|
|
| (200,775
| )
|
|
|
|
|
|
|
|
|
TOTAL WAIVERS AND REIMBURSEMENTS
|
|
|
|
|
|
| (226,125
| )
|
|
|
|
|
Net expenses
|
|
|
|
|
|
|
|
|
|
| 771
|
|
Net investment income
|
|
|
|
|
|
|
|
|
|
| 19,539
|
|
Realized and Unrealized Loss on Investments and Foreign Currency Transactions:
| | | | | | | | | | | | |
Net realized loss on investments and foreign currency transactions
| | | | | | | | | | | (147,962 | ) |
Net change in unrealized depreciation of investments and translation of assets and liabilities in foreign currency
|
|
|
|
|
|
|
|
|
|
|
(272,463
| )
|
Net realized and unrealized loss on investments and foreign currency transactions
|
|
|
|
|
|
|
|
|
|
| (420,425
| )
|
Change in net assets resulting from operations
|
|
|
|
|
|
|
|
|
| $
| (400,886
| )
|
1 Reflects operations for the period from June 4, 2008 (date of initial investment) to November 30, 2008.
See Notes which are an integral part of the Financial Statements
Statement of Changes in Net Assets
|
|
| Period
Ended
11/30/2008
| 1
|
Increase (Decrease) in Net Assets
| | | | |
Operations:
| | | | |
Net investment income
| | $ | 19,539 | |
Net realized loss on investments and foreign currency transactions
| | | (147,962 | ) |
Net change in unrealized appreciation/depreciation of investments and translation of assets and liabilities in foreign currency
|
|
| (272,463
| )
|
CHANGE IN NET ASSETS RESULTING FROM OPERATIONS
|
|
| (400,886
| )
|
Distributions to Shareholders:
| | | | |
Distributions from net investment income
| | | | |
Class A Shares
| | | (11 | ) |
Class C Shares
| | | (1 | ) |
Institutional Shares
|
|
| (3,487
| )
|
CHANGE IN NET ASSETS RESULTING FROM DISTRIBUTIONS TO SHAREHOLDERS
|
|
| (3,499
| )
|
Share Transactions:
| | | | |
Proceeds from sale of shares
| | | 1,208,219 | |
Net asset value of shares issued to shareholders in payment of distributions declared
| | | 18 | |
Cost of shares redeemed
|
|
| (10,806
| )
|
CHANGE IN NET ASSETS RESULTING FROM SHARE TRANSACTIONS
|
|
| 1,197,431
|
|
Change in net assets
|
|
| 793,046
|
|
Net Assets:
| | | | |
Beginning of period
|
|
| - --
|
|
End of period (including undistributed net investment income of $21,701)
|
| $
| 793,046
|
|
1 For the period from June 4, 2008 (date of initial investment) to November 30, 2008.
See Notes which are an integral part of the Financial Statements
Notes to Financial Statements
November 30, 2008
1. ORGANIZATION
Federated Equity Funds (the "Trust") is registered under the Investment Company Act of 1940, as amended (the "Act"), as an open-end management investment company. The Trust consists of 10 diversifed portfolios. The financial statements included herein are only those of Federated International Strategic Value Fund (the "Fund"), a diversified portfolio. The financial statements of the other portfolios are presented separately. The assets of each portfolio are segregated and a shareholder's interest is limited to the portfolio in which shares are held. Each portfolio pays its own expenses. The Fund offers three classes of shares: Class A Shares, Class C Shares and Institutional Shares. All shares of the Fund have equal rights with respect to voting, except on class-specific matters. The financial highlights of the Class A Shares and Class C Shares are presented separately. The investment objective of the Fund is to provide income and long-term capital appreciation.
2. SIGNIFICANT ACCOUNTING POLICIES
The following is a summary of significant accounting policies consistently followed by the Fund in the preparation of its financial statements. These policies are in conformity with generally accepted accounting principles (GAAP) in the United States of America.
Investment Valuation
In calculating its net asset value (NAV), the Fund generally values investments as follows:
- Equity securities listed on an exchange or traded through a regulated market system are valued at their last reported sale price or official closing price on their principal exchange or market.
- Shares of other mutual funds are valued based upon their reported NAVs.
- Fixed-income securities acquired with remaining maturities greater than 60 days are fair valued using price evaluations provided by a pricing service approved by the Board of Trustees (the "Trustees").
- Fixed-income securities acquired with remaining maturities of 60 days or less are valued at their cost (adjusted for the accretion of any discount or amortization of any premium).
- Derivative contracts listed on exchanges are valued at their reported settlement or closing price.
- Over-the-counter (OTC) derivative contracts are fair valued using price evaluations provided by a pricing service approved by the Trustees.
If the Fund cannot obtain a price or price evaluation from a pricing service for an investment, the Fund may attempt to value the investment based upon the mean of bid and asked quotations or fair value the investment based on price evaluations, from one or more dealers. If any price, quotation, price evaluation or other pricing source is not readily available when the NAV is calculated, the Fund uses the fair value of the investment determined in accordance with the procedures described below. There can be no assurance that the Fund could purchase or sell an investment at the price used to calculate the Fund's NAV.
Fair Valuation and Significant Events Procedures
The Trustees have authorized the use of pricing services to provide evaluations of the current fair value of certain investments for purposes of calculating the NAV. Factors considered by pricing services in evaluating an investment include the yields or prices of investments of comparable quality, coupon, maturity, call rights and other potential prepayments, terms and type, reported transactions, indications as to values from dealers and general market conditions. Some pricing services provide a single price evaluation reflecting the bid-side of the market for an investment (a "bid" evaluation). Other pricing services offer both bid evaluations and price evaluations indicative of a price between the prices bid and asked for the investment (a "mid" evaluation). The Fund normally uses bid evaluations for U.S. Treasury and Agency securities, mortgage-backed securities and municipal securities. The Fund normally uses mid evaluations for other types of fixed-income securities and OTC derivative contracts. In the event that market quotations and price evaluations are not available for an investment, the fair value of the investment is determined in accordance with procedures adopted by the Trustees.
The Trustees also have adopted procedures requiring an investment to be priced at its fair value whenever the Adviser determines that a significant event affecting the value of the investment has occurred between the time as of which the price of the investment would otherwise be determined and the time as of which the NAV is computed. An event is considered significant if there is both an affirmative expectation that the investment's value will change in response to the event and a reasonable basis for quantifying the resulting change in value. Examples of significant events that may occur after the close of the principal market on which a security is traded, or after the time of a price evaluation provided by a pricing service or a dealer, include:
- With respect to securities traded in foreign markets, significant trends in U.S. equity markets or in the trading of foreign securities index futures or options contracts;
- With respect to price evaluations of fixed-income securities determined before the close of regular trading on the NYSE, actions by the Federal Reserve Open Market Committee and other significant trends in U.S. fixed-income markets;
- Political or other developments affecting the economy or markets in which an issuer conducts its operations or its securities are traded; and
- Announcements concerning matters such as acquisitions, recapitalizations, litigation developments, a natural disaster affecting the issuer's operations or regulatory changes or market developments affecting the issuer's industry.
The Trustees have approved the use of a pricing service to determine the fair value of equity securities traded principally in foreign markets when the Adviser determines that there has been a significant trend in the U.S. equity markets or in index futures trading. For other significant events, the Fund may seek to obtain more current quotations or price evaluations from alternative pricing sources. If a reliable alternative pricing source is not available, the Fund will determine the fair value of the investment using another method approved by the Trustees.
Repurchase Agreements
It is the policy of the Fund to require the other party to a repurchase agreement to transfer to the Fund's custodian or sub-custodian eligible securities or cash with a market value (after transaction costs) at least equal to the repurchase price to be paid under the repurchase agreement. The eligible securities are transferred to accounts with the custodian or sub-custodian in which the Fund holds a "securities entitlement" and exercises "control" as those terms are defined in the Uniform Commercial Code. The Fund has established procedures for monitoring the market value of the transferred securities and requiring the transfer of additional eligible securities if necessary to equal at least the repurchase price. These procedures also allow the other party to require securities to be transferred from the account to the extent that their market value exceeds the repurchase price or in exchange for other eligible securities of equivalent market value.
With respect to agreements to repurchase U.S. government securities and cash items, the Fund treats the repurchase agreement as an investment in the underlying securities and not as an obligation of the other party to the repurchase agreement. Other repurchase agreements are treated as obligations of the other party secured by the underlying securities. Nevertheless, the insolvency of the other party or other failure to repurchase the securities may delay the disposition of the underlying securities or cause the Fund to receive less than the full repurchase price. Under the terms of the repurchase agreement, any amounts received by the Fund in excess of the repurchase price and related transaction costs must be remitted to the other party.
The Fund may enter into repurchase agreements in which eligible securities are transferred into joint trading accounts maintained by the custodian or sub-custodian for investment companies and other clients advised by the Fund's Adviser and its affiliates. The Fund will participate on a pro rata basis with the other investment companies and clients in its share of the securities transferred under such repurchase agreements and in its share of proceeds from any repurchase or other disposition of such securities.
Investment Income, Gains and Losses, Expenses and Distributions
Interest income and expenses are accrued daily. Dividend income and distributions to shareholders are recorded on the ex-dividend date. Foreign dividends are recorded on the ex-dividend date or when the Fund is informed of the ex-dividend date. Distributions of net investment income are declared and paid semi-annually. Non-cash dividends included in dividend income, if any, are recorded at fair value. Investment income, realized and unrealized gains and losses and certain fund-level expenses are allocated to each class based on relative average daily net assets, except that each class may bear certain expenses unique to that class such as distribution services and shareholder services fees. Dividends are declared separately for each class. No class has preferential dividend rights; differences in per share dividend rates are generally due to differences in separate class expenses.
Premium and Discount Amortization
All premiums and discounts on fixed-income securities are amortized/accreted for financial statement purposes.
Federal Taxes
It is the Fund's policy to comply with the Subchapter M provision of the Internal Revenue Code (the "Code") and to distribute to shareholders each year substantially all of its income. Accordingly, no provision for federal income tax is necessary. The Fund adopted the provisions of Financial Accounting Standards Board (FASB) Interpretation No. 48 (FIN 48), "Accounting for Uncertainty in Income Taxes," on June 4, 2008. As of and during the period ended November 30, 2008, the Fund did not have a liability for any unrecognized tax expenses. The Fund recognizes interest and penalties, if any, related to tax liabilities as income tax expense in the Statement of Operations. As of November 30, 2008, tax year 2008 remains subject to examination by the Fund's major tax jurisdictions, which include the United States of America and the commonwealth of Massachusetts.
Withholding taxes and where appropriate, deferred withholding taxes on foreign interest, dividends and capital gains have been provided for in accordance with the applicable country's tax rules and rates.
When-Issued and Delayed Delivery Transactions
The Fund may engage in when-issued or delayed delivery transactions. The Fund records when-issued securities on the trade date and maintains security positions such that sufficient liquid assets will be available to make payment for the securities purchased. Securities purchased on a when-issued or delayed delivery basis are marked to market daily and begin earning interest on the settlement date. Losses may occur on these transactions due to changes in market conditions or the failure of counterparties to perform under the contract.
Foreign Currency Translation
The accounting records of the Fund are maintained in U.S. dollars. All assets and liabilities denominated in foreign currencies (FCs) are translated into U.S. dollars based on the rates of exchange of such currencies against U.S. dollars on the date of valuation. Purchases and sales of securities, income and expenses are translated at the rate of exchange quoted on the respective date that such transactions are recorded. The Fund does not isolate that portion of the results of operations resulting from changes in foreign exchange rates on investments from the fluctuations arising from changes in market prices of securities held. Such fluctuations are included with the net realized and unrealized gain or loss from investments.
Reported net realized foreign exchange gains or losses arise from sales of portfolio securities, sales and maturities of short-term securities, sales of FCs, currency gains or losses realized between the trade and settlement dates on securities transactions, the difference between the amounts of dividends, interest and foreign withholding taxes recorded on the Fund's books and the U.S. dollar equivalent of the amounts actually received or paid. Net unrealized foreign exchange gains and losses arise from changes in the value of assets and liabilities other than investments in securities at fiscal year end, resulting from changes in the exchange rate.
Use of Estimates
The preparation of financial statements in conformity with GAAP requires management to make estimates and assumptions that affect the amounts of assets, liabilities, expenses and revenues reported in the financial statements. Actual results could differ from those estimated.
Other
Investment transactions are accounted for on a trade-date basis. Realized gains and losses from investment transactions are recorded on an identified-cost basis.
3. SHARES OF BENEFICIAL INTEREST
The following tables summarize share activity:
Period Ended November 30
|
| 2008 1
|
Class A Shares
|
| Shares
|
|
|
| Amount
|
|
Shares sold
| | 3,720 | | | $ | 13,583 | |
Shares issued to shareholders in payment of distributions declared
|
| 2
|
|
|
| 11
|
|
NET CHANGE RESULTING FROM CLASS A SHARE TRANSACTIONS
|
| 3,722
|
|
| $
| 13,594
|
|
| | | | | | | |
Period Ended November 30
|
| 2008 1
|
Class C Shares
|
| Shares
|
|
|
| Amount
|
|
Shares sold
|
| 20
|
|
| $
| 100
|
|
NET CHANGE RESULTING FROM CLASS C SHARE TRANSACTIONS
|
| 20
|
|
| $
| 100
|
|
| | | | | | | |
Period Ended November 30
|
| 2008 1
|
Institutional Shares
|
| Shares
|
|
|
| Amount
|
|
Shares sold
| | 259,778 | | | $ | 1,194,536 | |
Shares issued to shareholders in payment of distributions declared
| | 1 | | | | 7 | |
Shares redeemed
|
| (3,569
| )
|
|
| (10,806
| )
|
NET CHANGE RESULTING FROM INSTITUTIONAL SHARE TRANSACTIONS
|
| 256,210
|
|
|
$
|
1,183,737
|
|
NET CHANGE RESULTING FROM SHARE TRANSACTIONS
|
| 259,952
|
|
| $
| 1,197.431
|
|
1 Reflects operations for the period from June 4, 2008 (date of initial investment) to November 30, 2008.
Redemption Fees
The Fund imposes a 2.00% redemption fee to shareholders of the Fund's Class A Shares, Class C Shares and Institutional Shares who redeem shares held for 30 days or less. Shares acquired by reinvestment of dividends or distributions of the Fund, or purchased pursuant to the Systematic Investment Program or withdrawn pursuant to the Systematic Withdrawal Program, will not be subject to the redemption fee. All redemption fees are recorded by the Fund as additions to paid-in-capital. For the period ended November 30, 2008, the Fund's Class A Shares, Class C Shares and Institutional Shares did not have any redemption fees.
4. FEDERAL TAX INFORMATION
The timing and character of income and capital gain distributions are determined in accordance with income tax regulations, which may differ from GAAP. These differences are due to differing treatments for foreign currency transactions.
For the period ended November 30, 2008, permanent differences identified and reclassified among the components of net assets were as follows:
Increase (Decrease)
|
Undistributed Net
Investment Income (Loss)
|
| Accumulated Net
Realized Gain (Loss)
|
$5,661
|
| $(5,661)
|
Net investment income (loss), net realized gains (losses) and net assets were not affected by this reclassification.
The tax character of distributions as reported on the Statement of Changes in Net Assets for the period ended November 30, 2008 was as follows:
As of November 30, 2008, the components of distributable earnings on a tax basis were as follows:
Undistributed ordinary income
|
| $
| 21,701
|
|
Net unrealized depreciation
|
| $
| (272,463
| )
|
Capital loss carryforward
|
| $
| (153,623
| )
|
At November 30, 2008, the cost of investments for federal tax purposes was $1,117,642. The net unrealized depreciation of investments for federal tax purposes excluding any unrealized depreciation resulting from changes in foreign currency exchange rates was $272,396. This consists of net unrealized appreciation from investments for those securities having an excess of value over cost of $1,735 and net unrealized depreciation from investments for those securities having an excess of cost over value of $274,131.
At November 30, 2008, the Fund had a capital loss carryforward of $153,623 which will reduce the Fund's taxable income arising from future net realized gains on investments, if any, to the extent permitted by the Code and thus will reduce the amount of distributions to shareholders which would otherwise be necessary to relieve the Fund of any liability for federal income tax. Pursuant to the Code, such capital loss carryforward will expire in 2016.
5. INVESTMENT ADVISER FEE AND OTHER TRANSACTIONS WITH AFFILIATES
Investment Adviser Fee
Federated Equity Management Company of Pennsylvania is the Fund's investment adviser (the "Adviser"). The advisory agreement between the Fund and the Adviser provides for an annual fee equal to 0.75% of the Fund's average daily net assets. The Adviser may voluntarily choose to waive any portion of its fee and/or reimburse certain operating expenses of the Fund. The Adviser can modify or terminate this voluntary waiver and/or reimbursement at any time at its sole discretion. For the period ended November 30, 2008, the Adviser voluntarily waived $3,191 of its fee and voluntarily reimbursed $200,775 of other operating expenses.
Administrative Fee
Federated Administrative Services (FAS), under the Administrative Services Agreement, provides the Fund with administrative personnel and services. The fee paid to FAS is based on the average aggregate daily net assets of certain Federated funds as specified below:
Administrative Fee
|
| Average Aggregate Daily Net Assets
of the Federated Funds
|
0.150%
|
| on the first $5 billion
|
0.125%
|
| on the next $5 billion
|
0.100%
|
| on the next $10 billion
|
0.075%
|
| on assets in excess of $20 billion
|
The administrative fee received during any fiscal year shall be at least $150,000 per portfolio and $40,000 per each additional class of Shares. FAS may voluntarily choose to waive any portion of its fee. FAS can modify or terminate this voluntary waiver at any time at its sole discretion. For the period ended November 30, 2008, the net fee paid to FAS was 21.171% of average daily net assets of the Fund. FAS waived $22,127 of its fee. The Fund currently accrues the minimum administrative fee; therefore the fee as a percentage of average aggregate daily net assets is greater than the amounts presented in the chart above.
Distribution Services Fee
The Fund has adopted a Distribution Plan (the "Plan") pursuant to Rule 12b-1 under the Act. Under the terms of the Plan, the Fund will compensate Federated Securities Corp. (FSC), the principal distributor, from the daily net assets of the Fund's Class A Shares and Class C Shares to finance activities intended to result in the sale of these shares. The Plan provides that the Fund may incur distribution expenses at the following percentages of average daily net assets annually, to compensate FSC:
Share Class Name
|
| Percentage of Average Daily
Net Assets of Class
|
Class A Shares
|
| 0.05%
|
Class C Shares
|
| 0.75%
|
FSC may voluntarily choose to waive any portion of its fee. FSC can modify or terminate this voluntary waiver at any time at its sole discretion. When FSC receives fees, it may pay some or all of them to financial intermediaries whose customers purchase shares. For the period ended November 30, 2008, the Fund's Class A Shares and Class C Shares did not incur a distribution services fee.
Sales Charges
For the period ended November 30, 2008, FSC retained $16 in sales charges from the sale of Class A Shares. See "What Do Shares Cost?" in the Prospectus.
Shareholder Services Fee
The Fund may pay fees (Service Fees) up to 0.25% of the average daily net assets of the Fund's Class A Shares and Class C Shares to financial intermediaries or to Federated Shareholder Services Company (FSSC) for providing services to shareholders and maintaining shareholder accounts. FSSC may voluntarily reimburse the Fund for shareholder services fees. This voluntary reimbursement can be modified or terminated at any time. For the period ended November 30, 2008, FSSC did not receive any fees paid by the Fund. For the period ended November 30, 2008, the Fund's Class C Shares did not incur a shareholder services fee.
Expense Limitation
The Adviser and its affiliates (which may include FSC, FAS and FSSC) have voluntarily agreed to waive their fees and/or reimburse expenses so that the total operating expenses (as shown in the financial highlights) paid by the Fund's Class A Shares, Class C Shares and Institutional Shares (after the voluntary waivers and reimbursements) will not exceed 1.00%, 1.75% and 0.75%, respectively, for the fiscal year ending November 30, 2009. Although these actions are voluntary, the Adviser and its affiliates have agreed to continue these waivers and/or reimbursements at least through January 31, 2010.
General
Certain of the Officers and Trustees of the Fund are Officers and Directors or Trustees of the above companies.
Transactions with Affiliated Companies
Affiliated holdings are mutual funds which are managed by the Adviser or an affiliate of the Adviser. The Adviser has agreed to reimburse the Fund for certain investment adviser fees as a result of transactions in other affiliated mutual funds. For the period ended November 30, 2008, the Adviser reimbursed $32. Transactions with the affiliated company during the period ended November 30, 2008, were as follows:
Affiliate
|
| Balance of
Shares Held
6/4/2008
|
| Purchases/
Additions
|
| Sales/
Reductions
|
| Balance of
Shares Held
11/30/2008
|
| Value
|
| Dividend
Income
|
Prime Value Obligations Fund, Institutional Shares
|
| - --
|
| 1,396,948
|
| 1,320,333
|
| 76,615
|
| $76,615
|
| $890
|
6. INVESTMENT TRANSACTIONS
Purchases and sales of investments, excluding long-term U.S. government securities and short-term obligations for the period ended November 30, 2008, were as follows:
Purchases
|
| $
| 1,374,814
|
Sales
|
| $
| 180,164
|
7. CONCENTRATION OF RISK
The Fund invests in securities of non-U.S. issuers. Political or economic developments may have an effect on the liquidity and volatility of portfolio securities and currency holdings.
At November 30, 2008, the diversification of countries was as follows:
Country
|
| Percentage of
Net Assets
|
United Kingdom
|
| 38.3
| %
|
France
|
| 10.8
| %
|
Australia
|
| 9.2
| %
|
Mexico
|
| 5.8
| %
|
Germany
|
| 4.9
| %
|
Brazil
|
| 4.6
| %
|
Finland
|
| 3.9
| %
|
Belgium
|
| 3.5
| %
|
Netherlands
|
| 3.5
| %
|
Italy
|
| 3.4
| %
|
Canada
|
| 2.7
| %
|
Poland
|
| 2.6
| %
|
Japan
|
| 2.1
| %
|
Greece
|
| 1.0
| %
|
Portugal
|
| 0.6
| %
|
The Fund may invest a portion of its assets in securities of companies that are deemed by the Fund's management to be classified in similar business sectors. Economic developments may have an effect on the liquidity and volatility of the portfolio securities.
8. LINE OF CREDIT
The Fund participates in a $100,000,000 unsecured, uncommitted revolving line of credit (LOC) agreement with PNC Bank. The LOC was made available for extraordinary or emergency purposes, primarily for financing redemption payments. Borrowings are charged interest at a rate of 0.65% over the federal funds rate. As of November 30, 2008, there were no outstanding loans. During the period ended November 30, 2008, the Fund did not utilize the LOC.
9. INTERFUND LENDING
Pursuant to an Exemptive Order issued by the Securities and Exchange Commission (SEC), the Fund, along with other funds advised by subsidiaries of Federated Investors, Inc., may participate in an interfund lending program. This program provides an alternative credit facility allowing the funds to borrow from other participating affiliated funds. As of November 30, 2008, there were no outstanding loans. During the period ended November 30, 2008, the program was not utilized.
10. LEGAL PROCEEDINGS
Since October 2003, Federated Investors, Inc. and related entities (collectively, "Federated") and various Federated funds ("Federated Funds") have been named as defendants in several class action lawsuits now pending in the United States District Court for the District of Maryland. The lawsuits were purportedly filed on behalf of people who purchased, owned and/or redeemed shares of Federated-sponsored mutual funds during specified periods beginning November 1, 1998. The suits are generally similar in alleging that Federated engaged in illegal and improper trading practices including market timing and late trading in concert with certain institutional traders, which allegedly caused financial injury to the mutual fund shareholders. These lawsuits began to be filed shortly after Federated's first public announcement that it had received requests for information on shareholder trading activities in the Federated Funds from the SEC, the Office of the New York State Attorney General ("NYAG") and other authorities. In that regard, on November 28, 2005, Federated announced that it had reached final settlements with the SEC and the NYAG with respect to those matters. As Federated previously reported in 2004, it has already paid approximately $8.0 million to certain funds as determined by an independent consultant. As part of these settlements, Federated agreed to pay for the benefit of fund shareholders additional disgorgement and a civil money penalty in the aggregate amount of an additional $72 million. Federated entities have also been named as defendants in several additional lawsuits that are now pending in the United States District Court for the Western District of Pennsylvania, alleging, among other things, excessive advisory and Rule 12b-1 fees. The Board of the Federated Funds retained the law firm of Dickstein Shapiro LLP to represent the Federated Funds in these lawsuits. Federated and the Federated Funds and their respective counsel have been defending this litigation and none of the Federated Funds remains a defendant in any of the lawsuits (though some could potentially receive any recoveries as nominal defendants). Additional lawsuits based upon similar allegations may be filed in the future. The potential impact of these lawsuits, all of which seek unquantified damages, attorneys' fees and expenses, and future potential similar suits is uncertain. Although we do not believe that these lawsuits will have a material adverse effect on the Federated Funds, there can be no assurance that these suits, the ongoing adverse publicity and/or other developments resulting from the regulatory investigations will not result in increased Federated Fund redemptions, reduced sales of Federated Fund shares or other adverse consequences for the Federated Funds.
11. RECENT ACCOUNTING PRONOUNCEMENTS
In March 2008, FASB released Statement of Financial Accounting Standards No. 161, "Disclosures about Derivative Instruments and Hedging Activities" (FAS 161). FAS 161 requires qualitative disclosures about objectives and strategies for using derivatives, quantitative disclosures about fair value amounts of gains and losses on derivative instruments and disclosures about credit-risk-related contingent features in derivative agreements. FAS 161 is effective for fiscal years and interim periods beginning after November 15, 2008. At this time, management is evaluating the implications of adopting FAS 161 and its impact on the financial statements and the accompanying notes.
12. FEDERAL TAX INFORMATION (UNAUDITED)
For the period ended November 30, 2008, 73.2% of total ordinary income distributions made by the Fund are qualifying dividends which may be subject to a maximum tax rate of 15%, as provided for by the Jobs and Growth Tax Relief Act of 2003. Complete information is reported in conjunction with the reporting of your distributions on Form 1099-DIV.
If the Fund meets the requirements of Section 853 of the Internal Revenue Code of 1986, as amended, the Fund will pass through to its shareholders credits for foreign taxes paid.
For the period ended November 30, 2008, the Fund derived $19,467 of gross income from foreign sources and paid foreign taxes of $1,011.
Report of Independent Registered Public Accounting Firm
TO THE BOARD OF TRUSTEES OF FEDERATED EQUITY FUNDS AND THE SHAREHOLDERS OF FEDERATED INTERNATIONAL STRATEGIC VALUE FUND:
We have audited the accompanying statement of assets and liabilities, including the portfolio of investments, of the Federated International Strategic Value Fund (the "Fund"), a portfolio of Federated Equity Funds, as of November 30, 2008, and the related statement of operations, the statement of changes in net assets, and the financial highlights for the period from June 4, 2008 to November 30, 2008. These financial statements and financial highlights are the responsibility of the Fund's management. Our responsibility is to express an opinion on these financial statements and financial highlights based on our audits.
We conducted our audits in accordance with the standards of the Public Company Accounting Oversight Board (United States). Those standards require that we plan and perform the audit to obtain reasonable assurance about whether the financial statements and financial highlights are free of material misstatement. An audit includes examining, on a test basis, evidence supporting the amounts and disclosures in the financial statements. Our procedures included confirmation of securities owned as of November 30, 2008 by correspondence with the custodian. An audit also includes assessing the accounting principles used and significant estimates made by management, as well as evaluating the overall financial statement presentation. We believe that our audits provide a reasonable basis for our opinion.
In our opinion, the financial statements and financial highlights referred to above present fairly, in all material respects, the financial position of the Federated International Strategic Value Fund as of November 30, 2008, and the results of its operations, the changes in its net assets, and the financial highlights for the period then ended, in conformity with U.S. generally accepted accounting principles.
KPMG LLP
Boston, Massachusetts
January 23, 2009
Board of Trustees and Trust Officers
The Board is responsible for managing the Trust's business affairs and for exercising all the Trust's powers except those reserved for the shareholders. The following tables give information about each Board member and the senior officers of the Fund. Where required, the tables separately list Board members who are "interested persons" of the Fund (i.e., "Interested" Board members) and those who are not (i.e., "Independent" Board members). Unless otherwise noted, the address of each person listed is Federated Investors Tower, 1001 Liberty Avenue, Pittsburgh, PA 15222. The address of all Independent Board members listed is 4000 Ericsson Drive, Warrendale, PA 15086-7561; Attention: Mutual Fund Board. As of December 31, 2008, the Trust comprised 10 portfolios, and the Federated Fund Complex consisted of 40 investment companies (comprising 149 portfolios). Unless otherwise noted, each Officer is elected annually. Unless otherwise noted, each Board member oversees all portfolios in the Federated Fund Complex and serves for an indefinite term. The Fund's Statement of Additional Information includes additional information about Trust Trustees and is available, without charge and upon request, by calling 1-800-341-7400.
INTERESTED TRUSTEES BACKGROUND
|
|
|
Name
Birth Date
Positions Held with Trust
Date Service Began
|
| Principal Occupation(s) for Past Five Years,
Other Directorships Held and Previous Position(s)
|
John F. Donahue*
Birth Date: July 28, 1924
TRUSTEE
Began serving: April 1984 | | Principal Occupations: Director or Trustee of the Federated Fund Complex; Chairman and Director, Federated Investors, Inc.; Chairman of the Federated Fund Complex's Executive Committee.
Previous Positions: Chairman of the Federated Fund Complex; Trustee, Federated Investment Management Company; Chairman and Director, Federated Investment Counseling. |
|
|
|
J. Christopher Donahue*
Birth Date: April 11, 1949
TRUSTEE AND PRESIDENT
Began serving: January 2000 | | Principal Occupations: Principal Executive Officer and President of the Federated Fund Complex; Director or Trustee of some of the Funds in the Federated Fund Complex; President, Chief Executive Officer and Director, Federated Investors, Inc.; Chairman and Trustee, Federated Investment Management Company; Trustee, Federated Investment Counseling; Chairman and Director, Federated Global Investment Management Corp.; Chairman, Federated Equity Management Company of Pennsylvania and Passport Research, Ltd. (investment advisory subsidiary of Federated); Trustee, Federated Shareholder Services Company; Director, Federated Services Company.
Previous Positions: President, Federated Investment Counseling; President and Chief Executive Officer, Federated Investment Management Company, Federated Global Investment Management Corp. and Passport Research, Ltd. |
|
|
|
* Family relationships and reasons for "interested" status: John F. Donahue is the father of J. Christopher Donahue; both are "interested" due to their beneficial ownership of shares of Federated Investors, Inc. and the positions they hold with Federated and its subsidiaries.
INDEPENDENT TRUSTEES BACKGROUND
|
|
|
Name
Birth Date
Positions Held with Trust
Date Service Began
|
| Principal Occupation(s) for Past Five Years,
Other Directorships Held and Previous Position(s)
|
Thomas G. Bigley
Birth Date: February 3, 1934
TRUSTEE
Began serving: October 1995 | | Principal Occupation: Director or Trustee of the Federated Fund Complex.
Other Directorships Held: Director, Member of Executive Committee, Children's Hospital of Pittsburgh; Director, University of Pittsburgh.
Previous Position: Senior Partner, Ernst & Young LLP. |
|
|
|
John T. Conroy, Jr.
Birth Date: June 23, 1937
TRUSTEE
Began serving: November 1991 | | Principal Occupations: Director or Trustee of the Federated Fund Complex; Chairman of the Board, Investment Properties Corporation; Partner or Trustee in private real estate ventures in Southwest Florida; Assistant Professor in Theology at Barry University and Blessed Edmund Rice School for Pastoral Ministry.
Previous Positions: President, Investment Properties Corporation; Senior Vice President, John R. Wood and Associates, Inc., Realtors; President, Naples Property Management, Inc. and Northgate Village Development Corporation. |
|
|
|
Nicholas P. Constantakis
Birth Date: September 3, 1939
TRUSTEE
Began serving: February 1998 | | Principal Occupation: Director or Trustee of the Federated Fund Complex.
Other Directorships Held: Director and Chairman of the Audit Committee, Michael Baker Corporation (engineering and energy services worldwide).
Previous Position: Partner, Andersen Worldwide SC. |
|
|
|
John F. Cunningham
Birth Date: March 5, 1943
TRUSTEE
Began serving: January 1999 | | Principal Occupations: Director or Trustee of the Federated Fund Complex.
Other Directorships Held: Chairman, President and Chief Executive Officer, Cunningham & Co., Inc. (strategic business consulting); Trustee Associate, Boston College.
Previous Positions: Director, QSGI, Inc. (technology services company); Director, Redgate Communications and EMC Corporation (computer storage systems); Chairman of the Board and Chief Executive Officer, Computer Consoles, Inc.; President and Chief Operating Officer, Wang Laboratories; Director, First National Bank of Boston; Director, Apollo Computer, Inc. |
|
|
|
|
|
|
Name
Birth Date
Positions Held with Trust
Date Service Began
|
| Principal Occupation(s) for Past Five Years,
Other Directorships Held and Previous Position(s)
|
Peter E. Madden
Birth Date: March 16, 1942
TRUSTEE
Began serving: November 1991 | | Principal Occupation: Director or Trustee, and Chairman of the Board of Directors or Trustees, of the Federated Fund Complex.
Other Directorships Held: Board of Overseers, Babson College.
Previous Positions: Representative, Commonwealth of Massachusetts General Court; President, State Street Bank and Trust Company and State Street Corporation (retired); Director, VISA USA and VISA International; Chairman and Director, Massachusetts Bankers Association; Director, Depository Trust Corporation; Director, The Boston Stock Exchange. |
|
|
|
Charles F. Mansfield, Jr.
Birth Date: April 10, 1945
TRUSTEE
Began serving: January 1999 | | Principal Occupations: Director or Trustee of the Federated Fund Complex; Management Consultant.
Previous Positions: Chief Executive Officer, PBTC International Bank; Partner, Arthur Young & Company (now Ernst & Young LLP); Chief Financial Officer of Retail Banking Sector, Chase Manhattan Bank; Senior Vice President, HSBC Bank USA (formerly, Marine Midland Bank); Vice President, Citibank; Assistant Professor of Banking and Finance, Frank G. Zarb School of Business, Hofstra University; Executive Vice President DVC Group, Inc. (marketing, communications and technology). |
|
|
|
R. James Nicholson
Birth Date: February 4, 1938
TRUSTEE
Began serving: January 2008 | | Principal Occupations: Director or Trustee of the Federated Fund Complex; Senior Counsel, Brownstein Hyatt Farber Schrek, P.C.; Former Secretary of the U.S. Dept. of Veterans Affairs; Former U.S. Ambassador to the Holy See; Former Chairman of the Republican National Committee.
Other Directorships Held: Director, Horatio Alger Association.
Previous Positions: Colonel, U.S. Army Reserve; Partner, Calkins, Kramer, Grimshaw and Harring, P.C.; General Counsel, Colorado Association of Housing and Building; Chairman and CEO, Nicholson Enterprises, Inc. (real estate holding company); Chairman and CEO, Renaissance Homes of Colorado. |
|
|
|
|
|
|
Name
Birth Date
Positions Held with Trust
Date Service Began
|
| Principal Occupation(s) for Past Five Years,
Other Directorships Held and Previous Position(s)
|
Thomas M. O'Neill
Birth Date: June 14, 1951
TRUSTEE
Began serving: October 2006 | | Principal Occupations: Director or Trustee of the Federated Fund Complex; Managing Director and Partner, Navigator Management Company, L.P. (investment and strategic consulting).
Other Directorships Held: Board of Overseers, Children's Hospital of Boston; Visiting Committee on Athletics, Harvard College.
Previous Positions: Chief Executive Officer and President, Managing Director and Chief Investment Officer, Fleet Investment Advisors; President and Chief Executive Officer, Aeltus Investment Management, Inc.; General Partner, Hellman, Jordan Management Co., Boston, MA; Chief Investment Officer, The Putnam Companies, Boston, MA; Credit Analyst and Lending Officer, Fleet Bank. |
|
|
|
John S. Walsh
Birth Date: November 28, 1957
TRUSTEE
Began serving: January 1999 | | Principal Occupations: Director or Trustee of the Federated Fund Complex; President and Director, Heat Wagon, Inc. (manufacturer of construction temporary heaters); President and Director, Manufacturers Products, Inc. (distributor of portable construction heaters); President, Portable Heater Parts, a division of Manufacturers Products, Inc.
Previous Position: Vice President, Walsh & Kelly, Inc. |
|
|
|
James F. Will
Birth Date: October 12, 1938
TRUSTEE
Began serving: April 2006 | | Principal Occupations: Director or Trustee of the Federated Fund Complex; formerly, Vice Chancellor and President, Saint Vincent College.
Other Directorships Held: Trustee, Saint Vincent College; Alleghany Corporation.
Previous Positions: Chairman, President and Chief Executive Officer, Armco, Inc.; President and Chief Executive Officer, Cyclops Industries; President and Chief Operating Officer, Kaiser Steel Corporation. |
|
|
|
OFFICERS
|
|
|
Name
Birth Date
Address
Positions Held with Trust
Date Service Began
|
| Principal Occupation(s) for Past Five Years and Previous Position(s)
|
John W. McGonigle
Birth Date: October 26, 1938
EXECUTIVE VICE PRESIDENT
AND SECRETARY
Began serving: April 1984 | | Principal Occupations: Executive Vice President and Secretary of the Federated Fund Complex; Vice Chairman, Executive Vice President, Secretary and Director, Federated Investors, Inc.
Previous Positions: Trustee, Federated Investment Management Company and Federated Investment Counseling; Director, Federated Global Investment Management Corp., Federated Services Company and Federated Securities Corp. |
|
|
|
Richard A. Novak
Birth Date: December 25, 1963 TREASURER
Began serving: January 2006 | | Principal Occupations: Principal Financial Officer and Treasurer of the Federated Fund Complex; Senior Vice President, Federated Administrative Services; Financial and Operations Principal for Federated Securities Corp., Edgewood Services, Inc. and Southpointe Distribution Services, Inc.
Previous Positions: Controller of Federated Investors, Inc.; Vice President, Finance of Federated Services Company; held various financial management positions within The Mercy Hospital of Pittsburgh; Auditor, Arthur Andersen & Co. |
|
|
|
Richard B. Fisher
Birth Date: May 17, 1923
VICE PRESIDENT
Began serving: April 1984 | | Principal Occupations: Vice Chairman or Vice President of some of the Funds in the Federated Fund Complex; Vice Chairman, Federated Investors, Inc.; Chairman, Federated Securities Corp.
Previous Positions: President and Director or Trustee of some of the Funds in the Federated Fund Complex; Executive Vice President, Federated Investors, Inc.; Director and Chief Executive Officer, Federated Securities Corp. |
|
|
|
Brian P. Bouda
Birth Date: February 28, 1947
CHIEF COMPLIANCE OFFICER
AND SENIOR VICE PRESIDENT
Began serving: August 2004 | | Principal Occupations: Senior Vice President and Chief Compliance Officer of the Federated Fund Complex; Vice President and Chief Compliance Officer of Federated Investors, Inc. and Chief Compliance Officer of its subsidiaries. Mr. Bouda joined Federated in 1999 and is a member of the American Bar Association and the State Bar Association of Wisconsin. |
|
|
|
|
|
|
Name
Birth Date
Address
Positions Held with Trust
Date Service Began
|
| Principal Occupation(s) for Past Five Years and Previous Position(s)
|
Stephen F. Auth
Birth Date: September 3, 1956
450 Lexington Avenue
Suite 3700
New York, NY 10017-3943
CHIEF INVESTMENT OFFICER
Began serving: November 2002 | | Principal Occupations: Chief Investment Officer of this Fund and various other Funds in the Federated Fund Complex; Executive Vice President, Federated Investment Counseling, Federated Global Investment Management Corp. and Federated Equity Management Company of Pennsylvania.
Previous Positions: Executive Vice President, Federated Investment Management Company, and Passport Research, Ltd. (investment advisory subsidiary of Federated); Senior Vice President, Global Portfolio Management Services Division; Senior Vice President, Federated Investment Management Company and Passport Research, Ltd.; Senior Managing Director and Portfolio Manager, Prudential Investments. |
|
|
|
Lawrence Auriana
Birth Date: January 8, 1944
140 East 45 th Street
New York, NY 10017
VICE PRESIDENT
Began serving: November 2001 | | Principal Occupations: Lawrence Auriana is Vice President of the Trust. Mr. Auriana joined Federated in April 2001 as Co-Head of Investments/Federated Kaufmann. From August 1984 to April 2001, Mr. Auriana was President and Treasurer of Edgemont Asset Management Corp., and Chairman of the Board and Portfolio Manager to The Kaufmann Fund, Inc. (predecessor to the Federated Kaufmann Fund). Mr. Auriana earned a B.S. in economics from Fordham University and has been engaged in the securities business since 1965. |
|
|
|
Walter C. Bean
Birth Date : June 22, 1945
VICE PRESIDENT
Began serving: November 2006 | | Principal Occupations : Walter C. Bean has been the Fund's Portfolio Manager since inception. He is Vice President of the Trust. Mr. Bean is a Senior Vice President, Senior Portfolio Manager and the Head of the Income and Value Equity Management Teams of the Fund's Adviser. Mr. Bean joined Federated in 2000. His previous associations included: various investment management and research positions with C.S. McKee & Company, First Chicago Investment Advisors, CIGNA Investment Advisors and Mellon Bank. Mr. Bean earned a Bachelors Degree in Business Administration from Ohio University and an M.B.A. from the Pennsylvania State University. Mr. Bean is a Chartered Financial Analyst and has 39 years of investment experience. |
|
|
|
Hans P. Utsch
Birth Date: July 3, 1936
140 East 45 th Street
New York, NY 10017
VICE PRESIDENT
Began serving: November 2001 | | Principal Occupations: Hans P. Utsch is Vice President of the Trust. Mr. Utsch joined Federated in April 2001 as Co-Head of Investments/Federated Kaufmann. From August 1984 to April 2001, Mr. Utsch was Chairman of the Board and Secretary of Edgemont Asset Management Corp., and President and Portfolio Manager to The Kaufmann Fund, Inc. (predecessor to the Federated Kaufmann Fund). Mr. Utsch graduated from Amherst College and holds an M.B.A. from Columbia University. He has been engaged in the securities business since 1962. |
|
|
|
Evaluation and Approval of Advisory
Contract - May 2008
FEDERATED INTERNATIONAL STRATEGIC VALUE FUND (THE "FUND")
The Fund's Board reviewed the Fund's proposed investment advisory contract at meetings held in May 2008. The Board's decision to approve the contract reflects the exercise of its business judgment on whether to authorize the creation and offering of this new investment vehicle, as proposed by, and based on information provided by, the Federated organization, and based on Federated's recommendation to go forward with development of the Fund.
The Federated funds' Board had previously appointed a Senior Officer, whose duties include specified responsibilities relating to the process by which advisory fees are to be charged to a Federated Fund. The Senior Officer has the authority to retain consultants, experts, or staff as may be reasonably necessary to assist in the performance of his duties, reports directly to the Board, and may be terminated only with the approval of a majority of the independent members of the Board. The Senior Officer prepared and furnished to the Board an independent, written evaluation that covered topics discussed below. The Board considered that evaluation, along with other information, in deciding to approve the proposed advisory contract.
The Board also considered the anticipated compensation and benefits to be received by the Adviser. This includes fees to be received for services provided to the Fund by other entities in the Federated organization and research services that may be received by the Adviser from brokers that execute fund trades, as well as advisory fees. The Board is also familiar with and considered judicial decisions concerning allegedly excessive investment advisory fees, which have indicated that the following factors may be relevant to an Adviser's fiduciary duty with respect to its receipt of compensation from a fund: the nature and quality of the services provided by the Adviser, including the performance of the Fund; the Adviser's cost of providing the services; the extent to which the Adviser may realize "economies of scale" as the Fund grows larger; any indirect benefits that may accrue to the Adviser and its affiliates as a result of the Adviser's relationship with the Fund; performance and expenses of comparable funds; and the extent to which the independent Board members are fully informed about all facts the Board deems relevant bearing on the Adviser's services and fees. The Board further considered management fees (including any components thereof) charged to institutional and other clients of the Adviser for what might be viewed as like services, and the cost to the Adviser and its affiliates of supplying services pursuant to the management fee agreements, excluding any intra-corporate profit and profit margins of the Adviser and its affiliates for supplying such services. The Board was aware of these factors and was guided by them in its review of the Fund's advisory contract to the extent it considered them to be appropriate and relevant, as discussed further below.
The Board considered and weighed these circumstances in light of its substantial accumulated experience in working with Federated on matters relating to other Federated funds, and was assisted in its deliberations by independent legal counsel. The Board's consideration of the proposed advisory contract included review of the Senior Officer's evaluation, accompanying data and additional reports covering such matters as: the Adviser's investment philosophy, revenue, profitability, personnel and processes; investment and operating strategies; the Fund's investment objectives; the Fund's anticipated expenses (including the proposed advisory fee itself and the overall estimated expense structure of the Fund, both in absolute terms and relative to similar and/or competing funds, with due regard for contractual or voluntary expense limitations); and the nature, quality and extent of the advisory and other services to be provided to the Fund by the Adviser and its affiliates. The Board also considered the likely preferences and expectations of anticipated Fund shareholders and their relative sophistication; the continuing state of competition in the mutual fund industry and market practices; the range of comparable fees for similar funds in the mutual fund industry; the Fund's relationship to the Federated family of funds which include a comprehensive array of funds with different investment objectives, policies and strategies which are available for exchange without the incurrence of additional sales charges; compliance and audit reports concerning the Federated funds and the Federated companies that service them (including communications from regulatory agencies), as well as Federated's responses to any issues raised therein; and relevant developments in the mutual fund industry and how the Federated funds and/or Federated are responding to them. The Board's evaluation process is evolutionary. The criteria considered and the emphasis placed on relevant criteria change in recognition of changing circumstances in the mutual fund market-place.
With respect to the Fund's expenses in particular, the Board has found the use of comparisons to other mutual funds with comparable investment programs to be particularly useful, given the high degree of competition in the mutual fund business. The Board focused on comparisons with other similar mutual funds more heavily than non-mutual fund products or services because, simply put, they are more relevant. For example, other mutual funds are the products most like the Fund, they are readily available to Fund shareholders as alternative investment vehicles, and they are the type of investment vehicle in fact chosen and maintained by the Fund's anticipated investors. The range of their fees and expenses therefore appears to be a generally reliable indication of what consumers have found to be reasonable in the precise marketplace in which the Fund will compete. In this regard, the Senior Officer also reviewed Federated's fees for providing advisory services to products outside the Federated family of funds (e.g., institutional and separate accounts). He concluded that mutual funds and institutional accounts are inherently different products. Those differences included, but are not limited to, different types of targeted investors; being subject to different laws and regulations; different legal structures; different average account sizes; different associated costs; and different portfolio management techniques made necessary by different cash flows. The Senior Officer did not consider these fee schedules to be significant in determining the appropriateness of mutual fund advisory contracts.
The Senior Officer reviewed reports compiled by Federated, using data supplied by independent fund ranking organizations, regarding the fees charged by other mutual funds, noting his view that comparisons to fund peer groups are highly important in judging the reasonableness of proposed fees.
Because the Board was considering the advisory contract in the context of Federated's proposal to create a new fund, the factors mentioned above relating to such matters as performance and any indirect benefits that may accrue to the Adviser and its affiliates as a result of the Adviser's relationship with the Fund, are essentially impossible to apply before the Fund has experienced any meaningful operating history. Nevertheless, in connection with the Board's governance of other Federated funds, it should be noted that the Board regularly receives financial information about Federated, including reports on the compensation and benefits Federated derives from its relationships with the other Federated funds. These reports cover not only the fees under the advisory contracts, but also fees received by Federated's subsidiaries for providing other services to the Federated funds under separate contracts (e.g., for serving as the Federated funds' administrator). The reports also discuss any indirect benefit Federated may derive from its receipt of research services from brokers who execute Federated fund trades. In addition, the Board considered the fact that, in order for a fund to be competitive in the marketplace, Federated and its affiliates frequently waive fees and/or reimburse expenses and have disclosed to fund investors and/or indicated to the Board their intention to do so in the future, where appropriate.
Federated furnished reports, requested by the Senior Officer, that reported projected revenues and estimated the various components of the Fund's expenses. The Senior Officer noted, in material provided to the Board, that this Fund is new to Federated and any projected profit margin would be expected to be less than the overall Federated profit margin, taking all allocated costs into consideration, and could be significantly less during the initial years of operation.
The Board and the Senior Officer also reviewed a report compiled by Federated comparing profitability information for Federated to other publicly held fund management companies. In this regard, the Senior Officer noted the limited availability of such information, but nonetheless concluded that Federated's profit margins did not appear to be excessive and the Board agreed.
The Senior Officer's evaluation also discussed the notion of possible realization of "economies of scale" as a fund grows larger. The Board considered in this regard that the Adviser has made significant and long-term investments in areas that support all of the Federated funds, such as personnel and processes for the portfolio management, compliance, and risk management functions; and systems technology; and that the benefits of these efforts (as well as any economies, should they exist) were likely to be enjoyed by the fund complex as a whole. Finally, the Board also noted the absence of any applicable regulatory or industry guidelines on this subject, which is compounded by the lack of any common industry practice or general pattern with respect to structuring fund advisory fees with "breakpoints" that serve to reduce the fee as the fund attains a certain size. The Senior Officer did not recommend institution of breakpoints in pricing Federated's proposed advisory services to the Fund at this time.
The Board based its decision to approve the proposed advisory contract on the totality of the circumstances and relevant factors, and with a view to past and future long-term considerations. As noted, not all of the factors and considerations identified above were necessarily relevant to the Fund, nor does the Board consider any one of them to be determinative. With respect to the factors that are relevant, the Board's decision to approve the contract reflects its determination that, based upon the information requested and supplied, Federated's proposal to establish and manage the Fund, and its past performance and actions in providing services to other mutual funds (which the Board has found to be satisfactory with respect to such other funds), provide a satisfactory basis to support the business decision to approve the proposed arrangements.
Voting Proxies on Fund Portfolio Securities
A description of the policies and procedures that the Fund uses to determine how to vote proxies, if any, relating to securities held in the Fund's portfolio is available, without charge and upon request, by calling 1-800-341-7400. A report on "Form N-PX" of how the Fund voted any such proxies during the most recent 12-month period ended June 30 is available from Federated's website at FederatedInvestors.com. To access this information from the "Products" section of the website, click on the "Prospectuses and Regulatory Reports" link under "Related Information," then select the appropriate link opposite the name of the Fund; or select the name of the Fund and from the Fund's page, click on the "Prospectuses and Regulatory Reports" link. Form N-PX filings are also available at the SEC's website at www.sec.gov.
Quarterly Portfolio Schedule
The Fund files with the SEC a complete schedule of its portfolio holdings, as of the close of the first and third quarters of its fiscal year, on "Form N-Q." These filings are available on the SEC's website at www.sec.gov and may be reviewed and copied at the SEC's Public Reference Room in Washington, DC. (Call 1-800-SEC-0330 for information on the operation of the Public Reference Room.) You may also access this information from the "Products" section of Federated's website at FederatedInvestors.com by clicking on "Portfolio Holdings" under "Related Information," then selecting the appropriate link opposite the name of the Fund; or select the name of the Fund and from the Fund's page, click on the "Portfolio Holdings" link.
Mutual funds are not bank deposits or obligations, are not guaranteed by any bank and are not insured or guaranteed by the U.S. government, the Federal Deposit Insurance Corporation, the Federal Reserve Board or any other government agency. Investment in mutual funds involves investment risk, including the possible loss of principal.
This report is authorized for distribution to prospective investors only when preceded or accompanied by the Fund's Prospectus, which contains facts concerning its objective and policies, management fees, expenses and other information.
Federated
World-Class Investment Manager
Federated International Strategic Value Fund
Federated Investors Funds
4000 Ericsson Drive
Warrendale, PA 15086-7561
Contact us at FederatedInvestors.com
or call 1-800-341-7400.
Federated Securities Corp., Distributor
Cusip 314172362
39835 (1/09)
Federated is a registered mark of Federated Investors, Inc. 2009 (c)Federated Investors, Inc.
Item 2. Code of Ethics
(a) As of the end of the period covered by this report, the registrant has adopted a code of ethics (the "Section 406 Standards for Investment Companies - Ethical Standards for Principal Executive and Financial Officers") that applies to the registrant's Principal Executive Officer and Principal Financial Officer; the registrant's Principal Financial Officer also serves as the Principal Accounting Officer.
(c) Not Applicable
(d) Not Applicable
(e) Not Applicable
(f)(3) The registrant hereby undertakes to provide any person, without charge, upon request, a copy of the code of ethics. To request a copy of the code of ethics, contact the registrant at 1-800-341-7400, and ask for a copy of the Section 406 Standards for Investment Companies - Ethical Standards for Principal Executive and Financial Officers.
Item 3. Audit Committee Financial Expert
The registrant's Board has determined that each of the following members of the Board's Audit Committee is an “audit committee financial expert,” and is "independent," for purposes of this Item: Thomas G. Bigley, Nicholas P. Constantakis and Charles F. Mansfield, Jr.
Item 4. Principal Accountant Fees and Services
(a) Audit Fees billed to the registrant for the two most recent fiscal years:
Fiscal year ended 2008 - $267,500
Fiscal year ended 2007 - $230,500
(b) Audit-Related Fees billed to the registrant for the two most recent fiscal years:
Fiscal year ended 2008 - $0
Fiscal year ended 2007 - $0
Amount requiring approval of the registrant’s audit committee pursuant to paragraph (c)(7)(ii) of Rule 2-01 of Regulation S-X, $9,857 and $0 respectively. Fiscal year ended 2008- Fees for review of N-14 merger documents.
(c) Tax Fees billed to the registrant for the two most recent fiscal years:
Fiscal year ended 2008 - $0
Fiscal year ended 2007 - $0
Amount requiring approval of the registrant’s audit committee pursuant to paragraph (c)(7)(ii) of Rule 2-01 of Regulation S-X, $14,743 and $0 respectively. Fiscal year ended 2008- Tax preparation fees for fiscal year ended 2007.
(d) All Other Fees billed to the registrant for the two most recent fiscal years:
Fiscal year ended 2008 - $0
Fiscal year ended 2007 - $0
Amount requiring approval of the registrant’s audit committee pursuant to paragraph (c)(7)(ii) of Rule 2-01 of Regulation S-X, $3,479 and $49,068 respectively. Fiscal year ended 2008- Discussion on accounting related to REMICs. Fiscal year ended 2007 – Discussion on accounting related to swaps, billing related to technical matters on non-compete clauses and advice for handling qualified dividend income on 1099 DIV forms.
(e)(1) Audit Committee Policies regarding Pre-approval of Services.
The Audit Committee is required to pre-approve audit and non-audit services performed by the independent auditor in order to assure that the provision of such services do not impair the auditor’s independence. Unless a type of service to be provided by the independent auditor has received general pre-approval, it will require specific pre-approval by the Audit Committee. Any proposed services exceeding pre-approved cost levels will require specific pre-approval by the Audit Committee.
Certain services have the general pre-approval of the Audit Committee. The term of the general pre-approval is 12 months from the date of pre-approval, unless the Audit Committee specifically provides for a different period. The Audit Committee will annually review the services that may be provided by the independent auditor without obtaining specific pre-approval from the Audit Committee and may grant general pre-approval for such services. The Audit Committee will revise the list of general pre-approved services from time to time, based on subsequent determinations. The Audit Committee will not delegate its responsibilities to pre-approve services performed by the independent auditor to management.
The Audit Committee has delegated pre-approval authority to its Chairman. The Chairman will report any pre-approval decisions to the Audit Committee at its next scheduled meeting. The Committee will designate another member with such pre-approval authority when the Chairman is unavailable.
AUDIT SERVICES
The annual Audit services engagement terms and fees will be subject to the specific pre-approval of the Audit Committee. The Audit Committee must approve any changes in terms, conditions and fees resulting from changes in audit scope, registered investment company (RIC) structure or other matters.
In addition to the annual Audit services engagement specifically approved by the Audit Committee, the Audit Committee may grant general pre-approval for other Audit Services, which are those services that only the independent auditor reasonably can provide. The Audit Committee has pre-approved certain Audit services, all other Audit services must be specifically pre-approved by the Audit Committee.
AUDIT-RELATED SERVICES
Audit-related services are assurance and related services that are reasonably related to the performance of the audit or review of the Company’s financial statements or that are traditionally performed by the independent auditor. The Audit Committee believes that the provision of Audit-related services does not impair the independence of the auditor, and has pre-approved certain Audit-related services, all other Audit-related services must be specifically pre-approved by the Audit Committee.
TAX SERVICES
The Audit Committee believes that the independent auditor can provide Tax services to the Company such as tax compliance, tax planning and tax advice without impairing the auditor’s independence. However, the Audit Committee will not permit the retention of the independent auditor in connection with a transaction initially recommended by the independent auditor, the purpose of which may be tax avoidance and the tax treatment of which may not be supported in the Internal Revenue Code and related regulations. The Audit Committee has pre-approved certain Tax services, all Tax services involving large and complex transactions must be specifically pre-approved by the Audit Committee.
ALL OTHER SERVICES
With respect to the provision of services other than audit, review or attest services the pre-approval requirement is waived if:
| (1) | The aggregate amount of all such services provided constitutes no more than five percent of the total amount of revenues paid by the registrant, the registrant’s adviser (not including any sub-adviser whose role is primarily portfolio management and is subcontracted with or overseen by another investment adviser), and any entity controlling, controlled by, or under common control with the investment adviser that provides ongoing services to the registrant to its accountant during the fiscal year in which the services are provided; |
| (2) | Such services were not recognized by the registrant, the registrant’s adviser (not including any sub-adviser whose role is primarily portfolio management and is subcontracted with or overseen by another investment adviser), and any entity controlling, controlled by, or under common control with the investment adviser that provides ongoing services to the registrant at the time of the engagement to be non-audit services; and |
| (3) | Such services are promptly brought to the attention of the Audit Committee of the issuer and approved prior to the completion of the audit by the Audit Committee or by one or more members of the Audit Committee who are members of the board of directors to whom authority to grant such approvals has been delegated by the Audit Committee. |
The Audit Committee may grant general pre-approval to those permissible non-audit services classified as All Other services that it believes are routine and recurring services, and would not impair the independence of the auditor.
The SEC’s rules and relevant guidance should be consulted to determine the precise definitions of prohibited non-audit services and the applicability of exceptions to certain of the prohibitions.
PRE-APPROVAL FEE LEVELS
Pre-approval fee levels for all services to be provided by the independent auditor will be established annually by the Audit Committee. Any proposed services exceeding these levels will require specific pre-approval by the Audit Committee.
PROCEDURES
Requests or applications to provide services that require specific approval by the Audit Committee will be submitted to the Audit Committee by both the independent auditor and the Principal Accounting Officer and/or Internal Auditor, and must include a joint statement as to whether, in their view, the request or application is consistent with the SEC’s rules on auditor independence.
(e)(2) Percentage of services identified in items 4(b) through 4(d) that were approved by the registrants audit committee pursuant to paragraph (c)(7)(i)(C) of Rule 2-01 of Regulation S-X:
4(b)
Fiscal year ended 2008 – 0%
Fiscal year ended 2007 - 0%
Percentage of services provided to the registrants investment adviser and any entity controlling, controlled by, or under common control with the investment adviser that provides ongoing services to the registrant that were approved by the registrants audit committee pursuant to paragraph (c)(7)(i)(C) of Rule 2-01 of Regulation S-X, 0% and 0% respectively.
4(c)
Fiscal year ended 2008 – 0%
Fiscal year ended 2007 – 0%
Percentage of services provided to the registrants investment adviser and any entity controlling, controlled by, or under common control with the investment adviser that provides ongoing services to the registrant that were approved by the registrants audit committee pursuant to paragraph (c)(7)(i)(C) of Rule 2-01 of Regulation S-X, 0% and 0% respectively.
4(d)
Fiscal year ended 2008 – 0%
Fiscal year ended 2007 – 0%
Percentage of services provided to the registrants investment adviser and any entity controlling, controlled by, or under common control with the investment adviser that provides ongoing services to the registrant that were approved by the registrants audit committee pursuant to paragraph (c)(7)(i)(C) of Rule 2-01 of Regulation S-X, 0% and 0% respectively.
| (g) | Non-Audit Fees billed to the registrant, the registrant’s investment adviser, and certain entities controlling, controlled by or under common control with the investment adviser: |
Fiscal year ended 2008 - $322,858
Fiscal year ended 2007 - $303,813
(h) The registrant’s Audit Committee has considered that the provision of non-audit services that were rendered to the registrant’s adviser (not including any sub-adviser whose role is primarily portfolio management and is subcontracted with or overseen by another investment adviser), and any entity controlling, controlled by, or under common control with the investment adviser that provides ongoing services to the registrant that were not pre-approved pursuant to paragraph (c)(7)(ii) of Rule 2-01 of Regulation S-X is compatible with maintaining the principal accountant’s independence.
Item 5. Audit Committee of Listed Registrants
Not Applicable
Item 6. Schedule of Investments
Not Applicable
| Item 7. | Disclosure of Proxy Voting Policies and Procedures for Closed-End Management Investment Companies |
| Item 8. | Portfolio Managers of Closed-End Management Investment Companies |
| Item 9. | Purchases of Equity Securities by Closed-End Management Investment Company and Affiliated Purchasers |
Item 10. Submission of Matters to a Vote of Security Holders
Not Applicable
Item 11. Controls and Procedures
(a) The registrant’s President and Treasurer have concluded that the
registrant’s disclosure controls and procedures (as defined in rule 30a-3(c) under the Act) are effective in design and operation and are sufficient to form the basis of the certifications required by Rule 30a-(2) under the Act, based on their evaluation of these disclosure controls and procedures within 90 days of the filing date of this report on Form N-CSR.
(b) There were no changes in the registrant’s internal control over financial reporting (as defined in rule 30a-3(d) under the Act) during the last fiscal quarter that have materially affected, or are reasonably likely to materially affect, the registrant’s internal control over financial reporting.
Item 12. Exhibits
SIGNATURES
Pursuant to the requirements of the Securities Exchange Act of 1934 and the Investment Company Act of 1940, the registrant has duly caused this report to be signed on its behalf by the undersigned, thereunto duly authorized.
| Registrant | Federated Equity Funds |
| | |
| By | /S/ Richard A. Novak |
| | Richard A. Novak, Principal Financial Officer |
| Date | January 21, 2009 |
| | |
| Pursuant to the requirements of the Securities Exchange Act of 1934 and the Investment Company Act of 1940, this report has been signed below by the following persons on behalf of the registrant and in the capacities and on the dates indicated. |
| | |
| | |
| By | /S/ J. Christopher Donahue |
| | J. Christopher Donahue, Principal Executive Officer |
| Date | January 21, 2009 |
| | |
| | |
| By | /S/ Richard A. Novak |
| | Richard A. Novak, Principal Financial Officer |
| Date | January 21, 2009 |