United States
Securities and Exchange Commission
Washington, D.C. 20549
Form N-CSR
Certified Shareholder Report of Registered Management Investment Companies
811-4017
(Investment Company Act File Number)
Federated Equity Funds
_______________________________________________________________
(Exact Name of Registrant as Specified in Charter)
Federated Investors Funds
4000 Ericsson Drive
Warrendale, Pennsylvania 15086-7561
(Address of Principal Executive Offices)
(412) 288-1900
(Registrant's Telephone Number)
John W. McGonigle, Esquire
Federated Investors Tower
1001 Liberty Avenue
Pittsburgh, Pennsylvania 15222-3779
(Name and Address of Agent for Service)
(Notices should be sent to the Agent for Service)
Date of Fiscal Year End: 10/31/09
Date of Reporting Period: 10/31/09
Item 1. Reports to Stockholders
Federated Capital Appreciation FundEstablished 1977
A Portfolio of Federated Equity Funds
ANNUAL SHAREHOLDER REPORTOctober 31, 2009
Class A Shares
Class B Shares
Class C Shares
Class K Shares
FINANCIAL HIGHLIGHTS
SHAREHOLDER EXPENSE EXAMPLE
MANAGEMENT'S DISCUSSION OF FUND PERFORMANCE
PORTFOLIO OF INVESTMENTS SUMMARY TABLE
PORTFOLIO OF INVESTMENTS
STATEMENT OF ASSETS AND LIABILITIES
STATEMENT OF OPERATIONS
STATEMENT OF CHANGES IN NET ASSETS
NOTES TO FINANCIAL STATEMENTS
REPORT OF INDEPENDENT REGISTERED PUBLIC ACCOUNTING FIRM
BOARD OF TRUSTEES AND TRUST OFFICERS
EVALUATION AND APPROVAL OF ADVISORY CONTRACT
VOTING PROXIES ON FUND PORTFOLIO SECURITIES
QUARTERLY PORTFOLIO SCHEDULE
Financial Highlights - Class A Shares
(For a Share Outstanding Throughout Each Period)
| Year Ended October 31 | 2009 | 2008 | 2007 | 20061 | 2005 |
| Net Asset Value, Beginning of Period | $16.03 | $28.14 | $27.91 | $25.06 | $24.04 |
| Income From Investment Operations: | | | | | |
| Net investment income | 0.172 | 0.182 | 0.152 | 0.212 | 0.26 |
| Net realized and unrealized gain (loss) on investments and foreign currency transactions | 0.09 | (6.60) | 4.62 | 3.39 | 0.99 |
| TOTAL FROM INVESTMENT OPERATIONS | 0.26 | (6.42) | 4.77 | 3.60 | 1.25 |
| Less Distributions: | | | | | |
| Distributions from net investment income | (0.16) | (0.15) | (0.18) | (0.19) | (0.21) |
| Distributions from net realized gain on investments and foreign currency transactions | — | (5.54) | (4.36) | (0.56) | (0.02) |
| TOTAL DISTRIBUTIONS | (0.16) | (5.69) | (4.54) | (0.75) | (0.23) |
| Net Asset Value, End of Period | $16.13 | $16.03 | $28.14 | $27.91 | $25.06 |
| Total Return3 | 1.71% | (27.70)% | 19.78% | 14.73% | 5.22% |
| Ratios to Average Net Assets: | | | | | |
| Net expenses | 1.23%4 | 1.25%4 | 1.23%4 | 1.24%4 | 1.22%4 |
| Net investment income | 1.11% | 0.88% | 0.59% | 0.79% | 0.98% |
| Expense waiver/reimbursement5 | 0.08% | 0.01% | 0.01% | 0.01% | 0.02% |
| Supplemental Data: | | | | | |
| Net assets, end of period (000 omitted) | $943,922 | $939,280 | $1,433,917 | $1,600,635 | $2,225,781 |
| Portfolio turnover | 254% | 252% | 165% | 113% | 43% |
| 1 | Beginning with the year ended October 31, 2006, the Fund was audited by KPMG LLP. The previous year was audited by another independent registered public accounting firm. |
| 2 | Per share numbers have been calculated using the average shares method. |
| 3 | Based on net asset value, which does not reflect the sales charge, redemption fee or contingent deferred sales charge, if applicable. |
| 4 | The net expense ratio is calculated without reduction for expense offset arrangements. The net expense ratios are 1.22%, 1.24%, 1.22%, 1.23% and 1.21% for the years ended October 31, 2009, 2008, 2007, 2006 and 2005, respectively, after taking into account these expense reductions. |
| 5 | This expense decrease is reflected in both the net expense and the net investment income ratios shown above. |
- See Notes which are an integral part of the Financial Statements
Annual Shareholder Report1
Financial Highlights - Class B Shares
(For a Share Outstanding Throughout Each Period)
| Year Ended October 31 | 2009 | 2008 | 2007 | 20061 | 2005 |
| Net Asset Value, Beginning of Period | $15.24 | $27.07 | $27.03 | $24.30 | $23.34 |
| Income From Investment Operations: | | | | | |
| Net investment income (loss) | 0.042 | 0.022 | (0.05)2 | (0.01)2 | 0.02 |
| Net realized and unrealized gain (loss) on investments and foreign currency transactions | 0.08 | (6.31) | 4.45 | 3.30 | 1.00 |
| TOTAL FROM INVESTMENT OPERATIONS | 0.12 | (6.29) | 4.40 | 3.29 | 1.02 |
| Less Distributions: | | | | | |
| Distributions from net investment income | (0.04) | — | — | — | (0.04) |
| Distributions from net realized gain on investments and foreign currency transactions | — | (5.54) | (4.36) | (0.56) | (0.02) |
| TOTAL DISTRIBUTIONS | (0.04) | (5.54) | (4.36) | (0.56) | (0.06) |
| Net Asset Value, End of Period | $15.32 | $15.24 | $27.07 | $27.03 | $24.30 |
| Total Return3 | 0.83% | (28.29)% | 18.82% | 13.83% | 4.37% |
| Ratios to Average Net Assets: | | | | | |
| Net expenses | 2.10%4 | 2.05%4 | 2.03%4 | 2.04%4 | 2.01%4 |
| Net investment income (loss) | 0.31% | 0.10% | (0.22)% | (0.03)% | 0.19% |
| Expense waiver/reimbursement5 | 0.02% | 0.01% | 0.01% | 0.00%6 | 0.00%6 |
| Supplemental Data: | | | | | |
| Net assets, end of period (000 omitted) | $163,827 | $221,131 | $423,377 | $448,037 | $507,271 |
| Portfolio turnover | 254% | 252% | 165% | 113% | 43% |
| 1 | Beginning with the year ended October 31, 2006, the Fund was audited by KPMG LLP. The previous year was audited by another independent registered public accounting firm. |
| 2 | Per share numbers have been calculated using the average shares method. |
| 3 | Based on net asset value, which does not reflect the sales charge, redemption fee or contingent deferred sales charge, if applicable. |
| 4 | The net expense ratio is calculated without reduction for expense offset arrangements. The net expense ratios are 2.09%, 2.04%, 2.02%, 2.03% and 2.00% for the years ended October 31, 2009, 2008, 2007, 2006 and 2005, respectively, after taking into account these expense reductions. |
| 5 | This expense decrease is reflected in both the net expense and the net investment income (loss) ratios shown above. |
| 6 | Represents less than 0.01%. |
- See Notes which are an integral part of the Financial Statements
Annual Shareholder Report2
Financial Highlights - Class C Shares
(For a Share Outstanding Throughout Each Period)
| Year Ended October 31 | 2009 | 2008 | 2007 | 20061 | 2005 |
| Net Asset Value, Beginning of Period | $15.23 | $27.05 | $27.00 | $24.28 | $23.32 |
| Income From Investment Operations: | | | | | |
| Net investment income (loss) | 0.042 | 0.022 | (0.05)2 | (0.00)2,3 | 0.02 |
| Net realized and unrealized gain (loss) on investments and foreign currency transactions | 0.09 | (6.30) | 4.46 | 3.28 | 0.99 |
| TOTAL FROM INVESTMENT OPERATIONS | 0.13 | (6.28) | 4.41 | 3.28 | 1.01 |
| Less Distributions: | | | | | |
| Distributions from net investment income | (0.07) | — | — | — | (0.03) |
| Distributions from net realized gain on investments and foreign currency transactions | — | (5.54) | (4.36) | (0.56) | (0.02) |
| TOTAL DISTRIBUTIONS | (0.07) | (5.54) | (4.36) | (0.56) | (0.05) |
| Net Asset Value, End of Period | $15.29 | $15.23 | $27.05 | $27.00 | $24.28 |
| Total Return4 | 0.89% | (28.27)% | 18.89% | 13.80% | 4.35% |
| Ratios to Average Net Assets: | | | | | |
| Net expenses | 2.06%5 | 2.03%5 | 2.01%5 | 2.03%5 | 2.02%5 |
| Net investment income (loss) | 0.30% | 0.11% | (0.20)% | (0.01)% | 0.18% |
| Expense waiver/reimbursement6 | 0.02% | 0.01% | 0.01% | 0.00%7 | 0.00%7 |
| Supplemental Data: | | | | | |
| Net assets, end of period (000 omitted) | $83,060 | $88,572 | $144,473 | $145,655 | $185,175 |
| Portfolio turnover | 254% | 252% | 165% | 113% | 43% |
| 1 | Beginning with the year ended October 31, 2006, the Fund was audited by KPMG LLP. The previous year was audited by another independent registered public accounting firm. |
| 2 | Per share numbers have been calculated using the average shares method. |
| 3 | Represents less than $0.01. |
| 4 | Based on net asset value, which does not reflect the sales charge, redemption fee or contingent deferred sales charge, if applicable. |
| 5 | The net expense ratio is calculated without reduction for expense offset arrangements. The net expense ratios are 2.05%, 2.02%, 2.00%, 2.02% and 2.01% for the years ended October 31, 2009, 2008, 2007, 2006 and 2005, respectively, after taking into account these expense reductions. |
| 6 | This expense decrease is reflected in both the net expense and the net investment income (loss) ratios shown above. |
| 7 | Represents less than 0.01%. |
- See Notes which are an integral part of the Financial Statements
Annual Shareholder Report3
Financial Highlights - Class K Shares
(For a Share Outstanding Throughout Each Period)
| Year Ended October 31 | 2009 | 2008 | 2007 | 20061 | 2005 |
| Net Asset Value, Beginning of Period | $15.90 | $27.98 | $27.80 | $24.94 | $23.87 |
| Income From Investment Operations: | | | | | |
| Net investment income | 0.112 | 0.072 | 0.032 | 0.072 | 0.09 |
| Net realized and unrealized gain (loss) on investments and foreign currency transactions | 0.08 | (6.55) | 4.61 | 3.40 | 1.04 |
| TOTAL FROM INVESTMENT OPERATIONS | 0.19 | (6.48) | 4.64 | 3.47 | 1.13 |
| Less Distributions: | | | | | |
| Distributions from net investment income | (0.15) | (0.06) | (0.10) | (0.05) | (0.04) |
| Distributions from net realized gain on investments and foreign currency transactions | — | (5.54) | (4.36) | (0.56) | (0.02) |
| TOTAL DISTRIBUTIONS | (0.15) | (5.60) | (4.46) | (0.61) | (0.06) |
| Net Asset Value, End of Period | $15.94 | $15.90 | $27.98 | $27.80 | $24.94 |
| Total Return3 | 1.30% | (28.05)% | 19.26% | 14.22% | 4.73% |
| Ratios to Average Net Assets: | | | | | |
| Net expenses | 1.71%4 | 1.70%4 | 1.68%4 | 1.69%4 | 1.67%4 |
| Net investment income | 0.78% | 0.33% | 0.11% | 0.28% | 0.46% |
| Expense waiver/reimbursement5 | 0.02% | 0.01% | 0.01% | 0.00%6 | 0.00%6 |
| Supplemental Data: | | | | | |
| Net assets, end of period (000 omitted) | $21,994 | $39,155 | $19,768 | $13,669 | $7,389 |
| Portfolio turnover | 254% | 252% | 165% | 113% | 43% |
| 1 | Beginning with the year ended October 31, 2006, the Fund was audited by KPMG LLP. The previous year was audited by another independent registered public accounting firm. |
| 2 | Per share numbers have been calculated using the average shares method. |
| 3 | Based on net asset value, which does not reflect the sales charge, redemption fee or contingent deferred sales charge, if applicable. |
| 4 | The net expense ratio is calculated without reduction for expense offset arrangements. The net expense ratios are 1.70%, 1.69%, 1.67%, 1.68% and 1.66% for the years ended October 31, 2009, 2008, 2007, 2006 and 2005, respectively, after taking into account these expense reductions. |
| 5 | This expense decrease is reflected in both the net expense and the net investment income ratios shown above. |
| 6 | Represents less than 0.01%. |
- See Notes which are an integral part of the Financial Statements
Annual Shareholder Report4
Shareholder Expense Example (unaudited)
As a shareholder of the Fund, you incur two types of costs: (1) transaction costs, including sales charges (loads) on purchase or redemption payments; and (2) ongoing costs, including management fees and to the extent applicable, distribution (12b-1) fees and/or shareholder services fees and other Fund expenses. This Example is intended to help you to understand your ongoing costs (in dollars) of investing in the Fund and to compare these costs with the ongoing costs of investing in other mutual funds. It is based on an investment of $1,000 invested at the beginning of the period and held for the entire period from May 1, 2009 to October 31, 2009.
ACTUAL EXPENSES
The first section of the table below provides information about actual account values and actual expenses. You may use the information in this section, together with the amount you invested, to estimate the expenses that you incurred over the period. Simply divide your account value by $1,000 (for example, an $8,600 account value divided by $1,000 = 8.6), then multiply the result by the number in the first section under the heading entitled “Expenses Paid During Period” to estimate the expenses attributable to your investment during this period.
HYPOTHETICAL EXAMPLE FOR COMPARISON PURPOSES
The second section of the table below provides information about hypothetical account values and hypothetical expenses based on the Fund's actual expense ratio and an assumed rate of return of 5% per year before expenses, which is not the Fund's actual return. Thus, you should not use the hypothetical account values and expenses to estimate the actual ending account balance or your expenses for the period. Rather, these figures are required to be provided to enable you to compare the ongoing costs of investing in the Fund with other funds. To do so, compare this 5% hypothetical example with the 5% hypothetical examples that appear in the shareholder reports of the other funds.
Annual Shareholder Report5
Please note that the expenses shown in the table are meant to highlight your ongoing costs only and do not reflect any transaction costs, such as sales charges (loads) on purchase or redemption payments. Therefore, the second section of the table is useful in comparing ongoing costs only, and will not help you determine the relative total costs of owning different funds. In addition, if these transaction costs were included, your costs would have been higher. | Beginning
Account Value
5/1/2009 | Ending
Account Value
10/31/2009 | Expenses Paid
During Period1 |
| Actual: | | | |
| Class A Shares | $1,000 | $1,129.60 | $6.60 |
| Class B Shares | $1,000 | $1,124.80 | $10.93 |
| Class C Shares | $1,000 | $1,125.10 | $10.87 |
| Class K Shares | $1,000 | $1,127.30 | $9.06 |
Hypothetical (assuming a 5% return
before expenses): | | | |
| Class A Shares | $1,000 | $1,019.00 | $6.26 |
| Class B Shares | $1,000 | $1,014.92 | $10.36 |
| Class C Shares | $1,000 | $1,014.97 | $10.31 |
| Class K Shares | $1,000 | $1,016.69 | $8.59 |
| 1 | Expenses are equal to the Fund's annualized net expense ratios, multiplied by the average account value over the period, multiplied by 184/365 (to reflect the one-half-year period). The annualized net expense ratios are as follows: |
| Class A Shares | 1.23% |
| Class B Shares | 2.04% |
| Class C Shares | 2.03% |
| Class K Shares | 1.69% |
Annual Shareholder Report6
Performance data quoted represents past performance which is no guarantee of future results. Investment return and principal value will fluctuate so that an investor's shares, when redeemed, may be worth more or less than their original cost. Mutual fund performance changes over time and current performance may be lower or higher than what is stated. For current to the most recent month-end performance and after-tax returns, visit FederatedInvestors.com or call 1-800-341-7400.
Management's Discussion of Fund Performance (Unaudited)
PERFORMANCE OVERVIEW
During the 12-month reporting period ended October 31, 2009, the Fund produced total returns of 1.71%, 0.83%, 0.89% and 1.30% for Class A Shares, Class B Shares, Class C Shares and Class K Shares, respectively, based on net asset value. The following discussion will focus on the performance of the Fund's Class A Shares.
Stocks as measured by the Standard & Poor 500 Index1 (S&P 500) rose 9.80% during the reporting period. Information Technology and Consumer Discretionary were the strongest performing sectors within the Index rising 31.5% and 20.8%, respectively. Materials (up 16.4%), and Consumer Staples (up 8.5%) were also strong performers within the Index. Only one sector, Financials, had negative returns for the reporting period, down 7.2%.
The Fund underperformed its benchmark, with Class A Shares ranking in the 95th percentile out of 1,999 funds in the Large Cap Core Peer Group of Morningstar2 and the 98th percentile out of 908 funds in the Lipper Large Cap Core Peer Group3 for the 1-year time period ending October 31, 2009. Nearly 80% of the relative underperformance was driven by stock selection, with the remaining coming from sector allocation. The Fund's relative performance was constrained by conservative stock selection within all sectors relative to the S&P 500, particularly in the Industrial and Technology sectors. Some conservative positions that aided performance in the downturn but did not rally in the recent upturn, and are still favored, include Kroger and Wal-Mart. Poor stock selection within the Health Care sector was also detrimental to performance.
| 1 | The S&P 500 Index is an unmanaged, capitalization-weighted index of 500 stocks designed to measure performance of the broad domestic economy through changes in the aggregate market value of 500 stocks representing all major industries. Investment cannot be made directly in an index. |
| 2 | Morningstar rankings are based on total return and do not take sales charges into account. For the 5- and 10-year time periods ending October 31, 2009, the fund ranked in the 32nd percentile out of 1,352 funds and the 25th percentile out of 681 funds, respectively. Rankings are for Class A Shares and rankings for other share classes will vary. 2009 Morningstar, Inc. All Rights Reserved. The information contained herein: (1) is proprietary to Morningstar and/or its content providers; (2) may not be copied or distributed; and (3) is not warranted to be accurate, complete, or timely. Neither Morningstar nor its content providers are responsible for any damages or losses arising from any use of this information. Past performance is no guarantee of future results. |
| 3 | Past performance is no guarantee of future results. Lipper rankings are based on total return and do not take sales charges into account. For the 5- and 10-year time periods ending October 31, 2009, the fund ranked in the 33rd percentile out of 628 funds and 21st percentile out of 368 funds, respectively. Rankings are for Class A Shares and rankings for other share classes will vary. |
Annual Shareholder Report7
The Fund outperformed the market in the downturn and was close to the market's performance at the start of the upturn. However, during the summer we became more conservative due to the rise in stock prices and our long-term concerns regarding consumer spending growth. The market continued to march upward, reflecting primarily excellent cost controls implemented by corporate management.The newly developed markets around the world have led worldwide economic growth in 2009 and, as such, have caused the economic recovery to be more industrial-based than consumer-oriented. At the Fund's fiscal year end, the Fund was overweight in the Industrial and Material sectors and underweight in the Financials sector. The Fund was tilted more toward growth stocks during the year, in line with the idea of looking for stable earnings growth with favorable valuation. The Fund's exposure to foreign stocks4 at the end of the fiscal year, through ADRs and stocks of listed ADRs, was approximately 15.14%.
The portfolio is constructed on a bottom up basis and is confirmed by top down factors when these factors are viewed as helpful. We analyze fundamentals, with emphasis on our forward growth rate, and weigh that against valuation parameters.
Top five positive contributors were Goldman Sachs, EMC Corp, Darden Restaurants, Tyco International and Petro Brasileiro. Largest negative contributors were: PNC Financial, General Electric, Google Inc., Jetblue Airways and Medtronic.
| 4 | International investing involves special risks including currency risk, increased volatility of foreign securities, political risks and differences in auditing and other financial standards. Prices of emerging markets securities can be significantly more volatile than the prices of securities in developed countries, and currency risks and political risks are accentuated in emerging markets. |
Annual Shareholder Report8
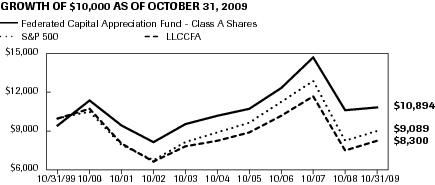
GROWTH OF A $10,000 INVESTMENT - CLASS A SHARES
The graph below illustrates the hypothetical investment of $10,0001 in Federated Capital Appreciation Fund (Class A Shares) (the “Fund”) from October 31, 1999 to October 31, 2009, compared to the S&P 500 Index (S&P 500)2 and the Lipper Large-Cap Core Funds Average (LLCCFA).2
| Average Annual Total Returns3 for the Period Ended 10/31/2009 | |
| 1 Year | -3.87% |
| 5 Years | 0.10% |
| 10 Years | 0.86% |
Performance data quoted represents past performance which is no guarantee of future results. Investment return and principal value will fluctuate so that an investor's shares, when redeemed, may be worth more or less than their original cost. Mutual fund performance changes over time and current performance may be lower or higher than what is stated. For current to the most recent month-end performance and after-tax returns, visit FederatedInvestors.com or call 1-800-341-7400. Returns shown do not reflect the deduction of taxes that a shareholder would pay on Fund distributions or the redemption of Fund shares. Mutual funds are not obligations of or guaranteed by any bank and are not federally insured. Total returns shown include the maximum sales charge of 5.50%.
| 1 | Represents a hypothetical investment of $10,000 in the Fund after deducting the maximum sales charge of 5.50% ($10,000 investment minus $550 sales charge=$9,450). The Fund's performance assumes the reinvestment of all dividends and distributions. The S&P 500 and LLCCFA have been adjusted to reflect reinvestment of dividends on securities in the index and average. |
| 2 | The S&P 500 is not adjusted to reflect sales loads, expenses or other fees that the Securities and Exchange Commission (SEC) requires to be reflected in the Fund's performance. The LLCCFA represents the average of the total returns reported by all of the mutual funds designated by Lipper, Inc. as falling into the category indicated, and is not adjusted to reflect any sales charges. However, these total returns are reported net of expenses or other fees that the SEC requires to be reflected in a fund's performance. The S&P 500 is unmanaged and, unlike the Fund, is not affected by cash flows. It is not possible to invest in an index or average. |
| 3 | Total returns quoted reflect all applicable sales charges. |
Annual Shareholder Report9
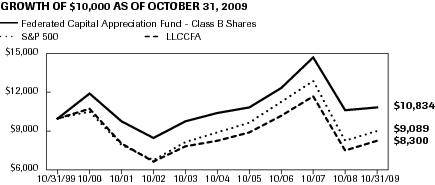
GROWTH OF A $10,000 INVESTMENT - CLASS B SHARES
The graph below illustrates the hypothetical investment of $10,0001 in Federated Capital Appreciation Fund (Class B Shares) (the “Fund”) from October 31, 1999 to October 31, 2009, compared to the S&P 500 Index (S&P 500)2 and the Lipper Large-Cap Core Funds Average (LLCCFA).2
| Average Annual Total Returns3 for the Period Ended 10/31/2009 | |
| 1 Year | -4.67% |
| 5 Years | 0.15% |
| 10 Years | 0.80% |
Performance data quoted represents past performance which is no guarantee of future results. Investment return and principal value will fluctuate so that an investor's shares, when redeemed, may be worth more or less than their original cost. Mutual fund performance changes over time and current performance may be lower or higher than what is stated. For current to the most recent month-end performance and after-tax returns, visit FederatedInvestors.com or call 1-800-341-7400. Returns shown do not reflect the deduction of taxes that a shareholder would pay on Fund distributions or the redemption of Fund shares. Mutual funds are not obligations of or guaranteed by any bank and are not federally insured. Total returns shown include the maximum contingent deferred sales charge of 5.50%, as applicable.
| 1 | Represents a hypothetical investment of $10,000 in the Fund. The ending value of the Fund does not reflect a contingent deferred sales charge on any redemption over eight years from the purchase date. The maximum contingent deferred sales charge is 5.50% on any redemption less than one year from the purchase date. The Fund's performance assumes the reinvestment of all dividends and distributions. The S&P 500 and LLCCFA have been adjusted to reflect reinvestment of dividends on securities in the index and average. |
| 2 | The S&P 500 is not adjusted to reflect sales loads, expenses or other fees that the SEC requires to be reflected in the Fund's performance. The LLCCFA represents the average of the total returns reported by all of the mutual funds designated by Lipper, Inc. as falling into the category indicated, and is not adjusted to reflect any sales charges. However, these total returns are reported net of expenses or other fees that the SEC requires to be reflected in a fund's performance. The S&P 500 is unmanaged and, unlike the Fund, is not affected by cash flows. It is not possible to invest in an index or average. |
| 3 | Total returns quoted reflect all applicable contingent deferred sales charges. |
Annual Shareholder Report10
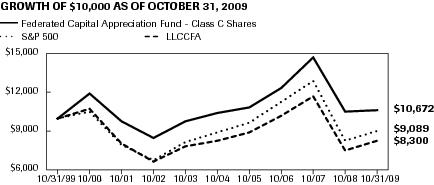
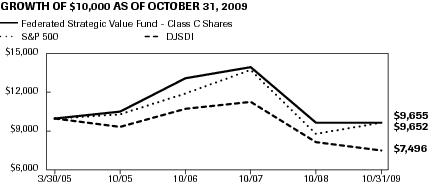
GROWTH OF A $10,000 INVESTMENT - CLASS C SHARES
The graph below illustrates the hypothetical investment of $10,0001 in Federated Capital Appreciation Fund (Class C Shares) (the “Fund”) from October 31, 1999 to October 31, 2009, compared to the S&P 500 Index (S&P 500)2 and the Lipper Large-Cap Core Funds Average (LLCCFA).2
| Average Annual Total Returns3 for the Period Ended 10/31/2009 | |
| 1 Year | -0.11% |
| 5 Years | 0.43% |
| 10 Years | 0.65% |
Performance data quoted represents past performance which is no guarantee of future results. Investment return and principal value will fluctuate so that an investor's shares, when redeemed, may be worth more or less than their original cost. Mutual fund performance changes over time and current performance may be lower or higher than what is stated. For current to the most recent month-end performance and after-tax returns, visit FederatedInvestors.com or call 1-800-341-7400. Returns shown do not reflect the deduction of taxes that a shareholder would pay on Fund distributions or the redemption of Fund shares. Mutual funds are not obligations of or guaranteed by any bank and are not federally insured. Total returns shown include the maximum contingent deferred sales charge of 1.00%, as applicable.
| 1 | Represents a hypothetical investment of $10,000 in the Fund. A 1.00% contingent deferred sales charge would be imposed on any redemption less than one year from the purchase date. The Fund's performance assumes the reinvestment of all dividends and distributions. The S&P 500 and LLCCFA have been adjusted to reflect reinvestment of dividends on securities in the index and average. |
| 2 | The S&P 500 is not adjusted to reflect sales loads, expenses or other fees that the SEC requires to be reflected in the Fund's performance. The LLCCFA represents the average of the total returns reported by all of the mutual funds designated by Lipper, Inc. as falling into the category indicated, and is not adjusted to reflect any sales charges. However, these total returns are reported net of expenses or other fees that the SEC requires to be reflected in a fund's performance. The S&P 500 is unmanaged and, unlike the Fund, is not affected by cash flows. It is not possible to invest in an index or average. |
| 3 | Total returns quoted reflect all applicable contingent deferred sales charges. |
Annual Shareholder Report11
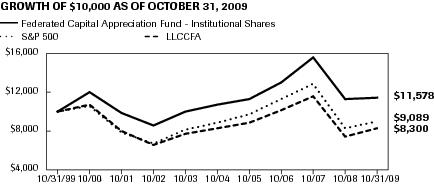
GROWTH OF A $10,000 INVESTMENT - CLASS K SHARES
The Fund's Class K Shares commenced operations on April 8, 2003. The Fund offers four other classes of shares: Class A Shares, Class B Shares, Class C Shares and Institutional Shares. For the period prior to the commencement of operations of the Class K Shares, the performance information shown is for the Fund's Class A Shares, adjusted to reflect the expenses of Class K Shares. The graph below illustrates the hypothetical investment of $10,0001 in Federated Capital Appreciation Fund (Class K Shares) (the “Fund”) from October 31, 1999 to October 31, 2009, compared to the S&P 500 Index (S&P 500)2 and the Lipper Large-Cap Core Funds Average (LLCCFA).2
| Average Annual Total Returns for the Period Ended 10/31/2009 | |
| 1 Year | 1.30% |
| 5 Years | 0.78% |
| 10 Years | 0.98% |
Performance data quoted represents past performance which is no guarantee of future results. Investment return and principal value will fluctuate so that an investor's shares, when redeemed, may be worth more or less than their original cost. Mutual fund performance changes over time and current performance may be lower or higher than what is stated. For current to the most recent month-end performance and after-tax returns, visit FederatedInvestors.com or call 1-800-341-7400. Returns shown do not reflect the deduction of taxes that a shareholder would pay on Fund distributions or the redemption of Fund shares. Mutual funds are not obligations of or guaranteed by any bank and are not federally insured.
| 1 | Represents a hypothetical investment of $10,000 in the Fund. The Fund's performance assumes the reinvestment of all dividends and distributions. The S&P 500 and LLCCFA have been adjusted to reflect reinvestment of dividends on securities in the index and average. |
| 2 | The S&P 500 is not adjusted to reflect sales loads, expenses or other fees that the SEC requires to be reflected in the Fund's performance. The LLCCFA represents the average of the total returns reported by all of the mutual funds designated by Lipper, Inc. as falling into the category indicated, and is not adjusted to reflect any sales charges. However, these total returns are reported net of expenses or other fees that the SEC requires to be reflected in a fund's performance. The S&P 500 is unmanaged and, unlike the Fund, is not affected by cash flows. It is not possible to invest in an index or average. |
Annual Shareholder Report12
Portfolio of Investments Summary Table (unaudited)
At October 31, 2009, the Fund's sector composition1 was as follows:
| Sector Composition | Percentage of
Total Net Assets |
| Information Technology | 19.0% |
| Industrials | 12.5% |
| Consumer Staples | 12.3% |
| Energy | 11.9% |
| Financials | 11.9% |
| Health Care | 10.2% |
| Consumer Discretionary | 9.7% |
| Materials | 7.2% |
| Utilities | 2.4% |
| Cash Equivalents2 | 0.1% |
| Other Assets and Liabilities — Net3 | 2.8% |
| TOTAL | 100.0% |
| 1 | Except for Cash Equivalents and Other Assets and Liabilities, sector classifications are based upon, and individual portfolio securities are assigned to, the classifications of the Global Industry Classification Standard (GICS) except that the Adviser assigns a classification to securities not classified by the GICS and to securities for which the Adviser does not have access to the classification made by the GICS. |
| 2 | Cash Equivalents include any investments in money market mutual funds and/or overnight repurchase agreements. |
| 3 | Assets, other than investments in securities, less liabilities. See Statement of Assets and Liabilities. |
Annual Shareholder Report13
Portfolio of Investments
October 31, 2009
|
| Shares | | | Value |
| | Common Stocks – 97.1% | |
| | Consumer Discretionary – 9.7% | |
| 399,600 | | Advance Auto Parts, Inc. | 14,889,096 |
| 645,900 | 1 | Coach, Inc. | 21,295,323 |
| 502,900 | 1 | Gymboree Corp. | 21,408,453 |
| 818,600 | | Home Depot, Inc. | 20,538,674 |
| 743,700 | | Macy's, Inc. | 13,066,809 |
| 242,990 | | McDonald's Corp. | 14,241,644 |
| 659,500 | | Target Corp. | 31,939,585 |
| | TOTAL | 137,379,584 |
| | Consumer Staples – 12.3% | |
| 861,000 | | Avon Products, Inc. | 27,595,050 |
| 432,400 | | General Mills, Inc. | 28,503,808 |
| 589,400 | | Kellogg Co. | 30,377,676 |
| 1,854,700 | | Kroger Co. | 42,899,211 |
| 623,659 | | Nestle S.A. | 28,990,795 |
| 331,600 | | Wal-Mart Stores, Inc. | 16,473,888 |
| | TOTAL | 174,840,428 |
| | Energy – 11.9% | |
| 179,700 | | Apache Corp. | 16,913,364 |
| 292,900 | | CONSOL Energy, Inc. | 12,539,049 |
| 570,500 | | Chevron Corp. | 43,666,070 |
| 396,297 | | Exxon Mobil Corp. | 28,402,606 |
| 642,700 | | Schlumberger Ltd. | 39,975,940 |
| 168,200 | 1 | Transocean Ltd. | 14,113,662 |
| 347,650 | | XTO Energy, Inc. | 14,448,334 |
| | TOTAL | 170,059,025 |
| | Financials – 11.9% | |
| 371,400 | | Ace Ltd. | 19,075,104 |
| 163,600 | | Goldman Sachs Group, Inc. | 27,839,812 |
| 1,122,500 | | J.P. Morgan Chase & Co. | 46,886,825 |
| 235,500 | | Morgan Stanley | 7,564,260 |
| 428,900 | | T. Rowe Price Group, Inc. | 20,900,297 |
| 536,800 | | The Travelers Cos., Inc. | 26,727,272 |
| 909,400 | | U.S. Bancorp | 21,116,268 |
| | TOTAL | 170,109,838 |
Annual Shareholder Report14
|
| | Health Care – 10.2% | |
| 726,700 | | Abbott Laboratories | 36,749,219 |
| 492,000 | | Baxter International, Inc. | 26,597,520 |
| 481,500 | | Johnson & Johnson | 28,432,575 |
| 183,600 | | Merck & Co., Inc. | 5,678,748 |
| 1,286,800 | | Pfizer, Inc. | 21,914,204 |
| 373,000 | | Teva Pharmaceutical Industries Ltd., ADR | 18,829,040 |
| 276,900 | | UnitedHealth Group, Inc. | 7,185,555 |
| | TOTAL | 145,386,861 |
| | Industrials – 12.5% | |
| 196,400 | | 3M Co. | 14,449,148 |
| 193,600 | | FedEx Corp. | 14,072,784 |
| 72,500 | | Flowserve Corp. | 7,120,225 |
| 293,200 | | Fluor Corp. | 13,023,944 |
| 852,500 | | Norfolk Southern Corp. | 39,743,550 |
| 684,400 | | Raytheon Co. | 30,989,632 |
| 862,300 | | Tyco International Ltd. | 28,930,165 |
| 479,900 | | United Technologies Corp. | 29,489,855 |
| | TOTAL | 177,819,303 |
| | Information Technology – 19.0% | |
| 77,900 | 1 | Apple, Inc. | 14,684,150 |
| 1,470,000 | 1 | Broadcom Corp. | 39,116,700 |
| 1,106,900 | 1 | Cisco Systems, Inc. | 25,292,665 |
| 427,200 | 1 | EMC Corp. | 7,035,984 |
| 34,000 | 1 | Google Inc. | 18,228,080 |
| 783,100 | | Hewlett-Packard Co. | 37,165,926 |
| 299,000 | | IBM Corp. | 36,062,390 |
| 1,023,500 | | Intel Corp. | 19,559,085 |
| 492,900 | 1 | McAfee, Inc. | 20,642,652 |
| 1,025,600 | | Microsoft Corp. | 28,439,888 |
| 588,200 | | Qualcomm, Inc. | 24,357,362 |
| | TOTAL | 270,584,882 |
| | Materials – 7.2% | |
| 317,000 | | BHP Billiton Ltd., ADR | 20,788,860 |
| 743,900 | | Barrick Gold Corp. | 26,728,327 |
| 97,900 | | Freeport-McMoRan Copper & Gold, Inc. | 7,181,944 |
| 198,000 | | Potash Corp. of Saskatchewan, Inc. | 18,370,440 |
Annual Shareholder Report15
|
| 361,100 | | Praxair, Inc. | 28,685,784 |
| | TOTAL | 101,755,355 |
| | Utilities – 2.4% | |
| 388,100 | | Progress Energy, Inc. | 14,565,393 |
| 644,700 | | Southern Co. | 20,108,193 |
| | TOTAL | 34,673,586 |
| | TOTAL COMMON STOCKS
(IDENTIFIED COST $1,215,867,519) | 1,382,608,862 |
| | Mutual Fund – 0.1% | |
| 2,398,801 | 2,3 | Prime Value Obligations Fund, Institutional Shares, 0.22%
(AT NET ASSET VALUE) | 2,398,801 |
| | TOTAL INVESTMENTS — 97.2%
(IDENTIFIED COST $1,218,266,320)4 | 1,385,007,663 |
| | OTHER ASSETS AND LIABILITIES - NET — 2.8%5 | 39,265,568 |
| | TOTAL NET ASSETS — 100% | $1,424,273,231 |
- At October 31, 2009, the Fund had an outstanding foreign exchange contract as follows:
| Settlement Date | Foreign
Currency
Units to
Deliver | In
Exchange
For | Unrealized
Appreciation |
| Contract Sold: | | | |
| 11/2/2009 | 358,966 Swiss Francs | $ 352,792 | $ 2,889 |
- Unrealized Appreciation on the Foreign Exchange Contract is included in “Other Assets and Liabilities — Net.”
- Note: The categories of investments are shown as a percentage of total net assets at October 31, 2009.
- Various inputs are used in determining the value of the Fund's investments. These inputs are summarized in the three broad levels listed below:
- Level 1 — quoted prices in active markets for identical securities
- Level 2 — other significant observable inputs (including quoted prices for similar securities, interest rates, prepayment speeds, credit risk, etc.)
- Level 3 — significant unobservable inputs (including the Fund's own assumptions in determining the fair value of investments)
Annual Shareholder Report16
- The inputs or methodology used for valuing securities are not an indication of the risk associated with investing in those securities.
- The following is a summary of the inputs used, as of October 31, 2009, in valuing the Fund's assets carried at fair value:
| Valuation Inputs | | | | |
| Level 1 -
Quoted
Prices and
Investments in
Mutual Funds | Level 2 -
Other
Significant
Observable
Inputs | Level 3 -
Significant
Unobservable
Inputs | Total |
| Equity Securities: | | | | |
| Domestic | $1,166,806,529 | $ — | $ — | $1,166,806,529 |
| International | 186,811,538 | 28,990,795 | — | 215,802,333 |
| Mutual Fund | 2,398,801 | — | — | 2,398,801 |
| TOTAL SECURITIES | $1,356,016,868 | $28,990,795 | $ — | $1,385,007,663 |
| OTHER FINANCIAL INSTRUMENTS* | $2,889 | $ — | $ — | $2,889 |
| * | Other financial instruments include a foreign exchange contract. |
- The following acronym is used throughout this portfolio:
- ADR — American Depositary Receipt
- See Notes which are an integral part of the Financial Statements
Annual Shareholder Report17
Statement of Assets and Liabilities
October 31, 2009
| Assets: | | |
| Total investments in securities, at value including $2,398,801 of investments in an affiliated issuer (Note 5) (identified cost $1,218,266,320) | | $1,385,007,663 |
| Cash | | 176,317 |
| Income receivable | | 2,174,414 |
| Receivable for investments sold | | 50,461,302 |
| Receivable for shares sold | | 1,217,706 |
| Receivable for foreign exchange contracts | | 2,889 |
| TOTAL ASSETS | | 1,439,040,291 |
| Liabilities: | | |
| Payable for investments purchased | $10,908,027 | |
| Payable for shares redeemed | 2,516,114 | |
| Payable for Directors'/Trustees' fees | 4,209 | |
| Payable for distribution services fee (Note 5) | 173,083 | |
| Payable for shareholder services fee (Note 5) | 590,864 | |
| Accrued expenses | 574,763 | |
| TOTAL LIABILITIES | | 14,767,060 |
| Net assets for 89,119,695 shares outstanding | | $1,424,273,231 |
| Net Assets Consist of: | | |
| Paid-in capital | | $1,639,806,688 |
| Net unrealized appreciation of investments and translation of assets and liabilities in foreign currency | | 166,758,636 |
| Accumulated net realized loss on investments, foreign currency transactions, futures contracts and written option contracts | | (391,508,562) |
| Undistributed net investment income | | 9,216,469 |
| TOTAL NET ASSETS | | $1,424,273,231 |
Annual Shareholder Report18
Statement of Assets and Liabilities — continued| Net Asset Value, Offering Price and Redemption Proceeds Per Share | | |
| Class A Shares: | | |
| Net asset value per share ($943,921,582 ÷ 58,516,596 shares outstanding), no par value, unlimited shares authorized | | $16.13 |
| Offering price per share (100/94.50 of $16.13) | | $17.07 |
| Redemption proceeds per share | | $16.13 |
| Class B Shares: | | |
| Net asset value per share ($163,826,985 ÷ 10,690,921 shares outstanding), no par value, unlimited shares authorized | | $15.32 |
| Offering price per share | | $15.32 |
| Redemption proceeds per share (94.50/100 of $15.32) | | $14.48 |
| Class C Shares: | | |
| Net asset value per share ($83,059,745 ÷ 5,432,515 shares outstanding), no par value, unlimited shares authorized | | $15.29 |
| Offering price per share | | $15.29 |
| Redemption proceeds per share (99.00/100 of $15.29) | | $15.14 |
| Class K Shares: | | |
| Net asset value per share ($21,994,497 ÷ 1,380,218 shares outstanding), no par value, unlimited shares authorized | | $15.94 |
| Offering price per share | | $15.94 |
| Redemption proceeds per share | | $15.94 |
| Institutional Shares: | | |
| Net asset value per share ($211,470,422 ÷ 13,099,445 shares outstanding), no par value, unlimited shares authorized | | $16.14 |
| Offering price per share | | $16.14 |
| Redemption proceeds per share | | $16.14 |
- See Notes which are an integral part of the Financial Statements
Annual Shareholder Report19
Statement of Operations
Year Ended October 31, 2009
| Investment Income: | | | |
| Dividends (including $764,043 received from an affiliated issuer (Note 5) and net of foreign taxes withheld of $474,464) | | | $30,400,069 |
| Interest | | | 910,450 |
| TOTAL INCOME | | | 31,310,519 |
| Expenses: | | | |
| Investment adviser fee (Note 5) | | $10,087,429 | |
| Administrative personnel and services fee (Note 5) | | 1,044,126 | |
| Custodian fees | | 67,047 | |
| Transfer and dividend disbursing agent fees and expenses — Class A Shares | | 1,652,754 | |
| Transfer and dividend disbursing agent fees and expenses — Class B Shares | | 413,273 | |
| Transfer and dividend disbursing agent fees and expenses — Class C Shares | | 163,120 | |
| Transfer and dividend disbursing agent fees and expenses — Class K Shares | | 94,414 | |
| Transfer and dividend disbursing agent fees and expenses — Institutional Shares | | 169,278 | |
| Directors'/Trustees' fees | | 12,499 | |
| Auditing fees | | 27,999 | |
| Legal fees | | 6,226 | |
| Portfolio accounting fees | | 189,198 | |
| Distribution services fee — Class B Shares (Note 5) | | 1,323,254 | |
| Distribution services fee — Class C Shares (Note 5) | | 604,587 | |
| Distribution services fee — Class K Shares (Note 5) | | 136,011 | |
| Shareholder services fee — Class A Shares (Note 5) | | 2,157,055 | |
| Shareholder services fee — Class B Shares (Note 5) | | 441,085 | |
| Shareholder services fee — Class C Shares (Note 5) | | 197,129 | |
| Account administration fee — Class A Shares | | 48,670 | |
| Account administration fee — Class C Shares | | 2,297 | |
| Share registration costs | | 90,940 | |
| Printing and postage | | 144,052 | |
| Insurance premiums | | 8,165 | |
| Miscellaneous | | 10,306 | |
| TOTAL EXPENSES | | 19,090,914 | |
Annual Shareholder Report20
Statement of Operations — continued| Waiver, Reimbursements and Expense Reduction: | | | |
| Reimbursement of investment adviser fee (Note 5) | $(69,879) | | |
| Waiver of administrative personnel and services fee (Note 5) | (20,588) | | |
| Reimbursement of shareholder services fee — Class A Shares (Note 5) | (464,794) | | |
| Reimbursement of transfer and dividend disbursing agent fees and expenses — Class A Shares (Note 5) | (59,838) | | |
| Reimbursement of transfer and dividend disbursing agent fees and expenses — Institutional Shares (Note 5) | (14,731) | | |
| Fees paid indirectly from directed brokerage arrangements (Note 6) | (154,693) | | |
| TOTAL WAIVER, REIMBURSEMENTS AND EXPENSE REDUCTION | | $(784,523) | |
| Net expenses | | | $18,306,391 |
| Net investment income | | | 13,004,128 |
| Realized and Unrealized Gain (Loss) on Investments and Foreign Currency Transactions: | | | |
| Net realized loss on investments and foreign currency transactions | | | (208,647,386) |
| Net change in unrealized depreciation of investments and translation of assets and liabilities in foreign currency | | | 228,599,747 |
| Net realized and unrealized gain on investments and foreign currency transactions | | | 19,952,361 |
| Change in net assets resulting from operations | | | $32,956,489 |
- See Notes which are an integral part of the Financial Statements
Annual Shareholder Report21
Statement of Changes in Net Assets
| Year Ended October 31 | 2009 | 2008 |
| Increase (Decrease) in Net Assets | | |
| Operations: | | |
| Net investment income | $13,004,128 | $11,654,580 |
| Net realized loss on investments and foreign currency transactions | (208,647,386) | (165,689,372) |
| Net change in unrealized appreciation/depreciation of investments and translation of assets and liabilities in foreign currency | 228,599,747 | (384,676,782) |
| CHANGE IN NET ASSETS RESULTING FROM OPERATIONS | 32,956,489 | (538,711,574) |
| Distributions to Shareholders: | | |
| Distributions from net investment income | | |
| Class A Shares | (9,327,315) | (9,287,303) |
| Class B Shares | (582,124) | — |
| Class C Shares | (406,255) | — |
| Class K Shares | (388,347) | (56,795) |
| Institutional Shares | (1,568,758) | — |
| Distributions from net realized gain on investments and foreign currency transactions | | |
| Class A Shares | — | (280,652,380) |
| Class B Shares | — | (85,611,210) |
| Class C Shares | — | (29,312,332) |
| Class K Shares | — | (3,928,786) |
| CHANGE IN NET ASSETS RESULTING FROM DISTRIBUTIONS TO SHAREHOLDERS | (12,272,799) | (408,848,806) |
| Share Transactions: | | |
| Proceeds from sale of shares | 528,867,667 | 481,922,779 |
| Proceeds from shares issued in connection with the tax-free transfer of assets from Suburban Common Trust Fund | 4,843,111 | — |
| Proceeds from shares issued in connection with the tax-free transfer of assets from Clearfield Bank Common Trust Fund | 2,596,634 | — |
| Proceeds from shares issued in connection with the tax-free transfer of assets from Central Bank Core Equity Fund | — | 42,103,041 |
| Net asset value of shares issued to shareholders in payment of distributions declared | 9,337,834 | 359,161,924 |
| Cost of shares redeemed | (505,968,842) | (593,249,539) |
| CHANGE IN NET ASSETS RESULTING FROM SHARE TRANSACTIONS | 39,676,404 | 289,938,205 |
| Change in net assets | 60,360,094 | (657,622,175) |
| Net Assets: | | |
| Beginning of period | 1,363,913,137 | 2,021,535,312 |
| End of period (including undistributed net investment income of $9,216,469 and $8,601,294, respectively) | $1,424,273,231 | $1,363,913,137 |
- See Notes which are an integral part of the Financial Statements
Annual Shareholder Report22
Notes to Financial Statements
October 31, 2009
1. ORGANIZATION
Federated Equity Funds (the “Trust”) is registered under the Investment Company Act of 1940, as amended (the “Act”), as an open-end management investment company. The Trust consists of 13 portfolios. The financial statements included herein are only those of Federated Capital Appreciation Fund (the “Fund”), a diversified portfolio. The financial statements of the other portfolios are presented separately. The assets of each portfolio are segregated and a shareholder's interest is limited to the portfolio in which shares are held. Each portfolio pays its own expenses. The Fund offers five classes of shares: Class A Shares, Class B Shares, Class C Shares, Class K Shares and Institutional Shares. All shares of the Fund have equal rights with respect to voting, except on class-specific matters. The financial highlights of the Institutional Shares are presented separately. The investment objective of the Fund is to provide capital appreciation.
Effective December 31, 2007, the Fund began offering Institutional Shares.
On December 19, 2008, the Fund received assets from Suburban Common Trust Fund as a result of a tax-free reorganization, as follows:
Shares of the
Fund Issued | Suburban
Common
Trust Fund
Net Assets
Received | Unrealized
Depreciation1 | Net Assets
of the Fund
Immediately
Prior to
Combination | Net Assets
of the Fund
Immediately
After
Combination |
| 324,388 | $4,843,111 | $(2,305,234) | $1,294,808,821 | $1,299,651,932 |
| 1 | Unrealized Depreciation is included in the Suburban Common Trust Fund Net Assets Received amount shown above. |
On November 14, 2008, the Fund received assets from Clearfield Bank Common Trust Fund as a result of a tax-free reorganization, as follows:
Shares of the
Fund Issued | Clearfield
Bank
Common
Trust Fund
Net Assets
Received | Unrealized
Appreciation1 | Net Assets
of the Fund
Immediately
Prior to
Combination | Net Assets
of the Fund
Immediately
After
Combination |
| 175,330 | $2,596,634 | $206,477 | $1,262,255,683 | $1,264,852,317 |
| 1 | Unrealized Appreciation is included in the Clearfield Bank Common Trust Fund Net Assets Received amount shown above. |
Annual Shareholder Report23
On May 9, 2008, the Fund received assets from Central Bank Core Equity Fund as a result of a tax-free reorganization, as follows:
Shares of the
Fund Issued | Central Bank
Core Equity
Fund Net
Assets
Received | Unrealized
Appreciation1 | Net Assets
of the Fund
Immediately
Prior to
Combination | Net Assets
of the Fund
Immediately
After
Combination |
| 2,017,395 | $42,103,041 | $8,921,086 | $1,762,228,108 | $1,804,331,149 |
| 1 | Unrealized Appreciation is included in the Central Bank Core Equity Fund Net Assets Received amount shown above. |
2. SIGNIFICANT ACCOUNTING POLICIES
The following is a summary of significant accounting policies consistently followed by the Fund in the preparation of its financial statements. These policies are in conformity with U.S. generally accepted accounting principles (GAAP).
Investment Valuation
In calculating its net asset value (NAV), the Fund generally values investments as follows:
- Equity securities listed on an exchange or traded through a regulated market system are valued at their last reported sale price or official closing price in their principal exchange or market.
- Shares of other mutual funds are valued based upon their reported NAVs.
- Derivative contracts listed on exchanges are valued at their reported settlement or closing price.
- Over-the-counter (OTC) derivative contracts are fair valued using price evaluations provided by a pricing service approved by the Board of Trustees (the “Trustees”).
- Fixed-income securities acquired with remaining maturities greater than 60 days are fair valued using price evaluations provided by a pricing service approved by the Trustees.
- Fixed-income securities acquired with remaining maturities of 60 days or less are valued at their cost (adjusted for the accretion of any discount or amortization of any premium).
If the Fund cannot obtain a price or price evaluation from a pricing service for an investment, the Fund may attempt to value the investment based upon the mean of bid and asked quotations or fair value the investment based on price evaluations, from one or more dealers. If any price, quotation, price evaluation or other pricing source is not readily available when the NAV is calculated, the Fund uses the fair value of the investment determined in accordance with the procedures described below. There can be no assurance that the Fund could purchase or sell an investment at the price used to calculate the Fund's NAV.
Fair Valuation and Significant Events Procedures
The Trustees have authorized the use of pricing services to provide evaluations of the current fair value of certain investments for purposes of calculating the NAV. Factors considered by pricing services in evaluating an investment include the yields or prices of investments of comparable quality, coupon, maturity, call rights and other potential prepayments, terms and type, reported transactions, indications as to values from dealers and general market conditions. Some pricing services provide a single price evaluation reflecting the bid-side of the market for an investment (a “bid” evaluation). Other pricing services offer both bid evaluations and price evaluations indicative of a price between the prices bid and asked for the investment (a “mid” evaluation). The Fund normally uses bid evaluations for U.S. Treasury Annual Shareholder Report24
and Agency securities and mortgage-backed securities. The Fund normally uses mid evaluations for other types of fixed-income securities and OTC derivative contracts. In the event that market quotations and price evaluations are not available for an investment, the fair value of the investment is determined in accordance with procedures adopted by the Trustees.The Trustees also have adopted procedures requiring an investment to be priced at its fair value whenever the Adviser determines that a significant event affecting the value of the investment has occurred between the time as of which the price of the investment would otherwise be determined and the time as of which the NAV is computed. An event is considered significant if there is both an affirmative expectation that the investment's value will change in response to the event and a reasonable basis for quantifying the resulting change in value. Examples of significant events that may occur after the close of the principal market on which a security is traded, or after the time of a price evaluation provided by a pricing service or a dealer, include:
- With respect to securities traded in foreign markets, significant trends in U.S. equity markets or in the trading of foreign securities index futures or options contracts;
- With respect to price evaluations of fixed-income securities determined before the close of regular trading on the NYSE, actions by the Federal Reserve Open Market Committee and other significant trends in U.S. fixed-income markets;
- Political or other developments affecting the economy or markets in which an issuer conducts its operations or its securities are traded; and
- Announcements concerning matters such as acquisitions, recapitalizations, litigation developments, a natural disaster affecting the issuer's operations or regulatory changes or market developments affecting the issuer's industry.
The Trustees have approved the use of a pricing service to determine the fair value of equity securities traded principally in foreign markets when the Adviser determines that there has been a significant trend in the U.S. equity markets or in index futures trading. For other significant events, the Fund may seek to obtain more current quotations or price evaluations from alternative pricing sources. If a reliable alternative pricing source is not available, the Fund will determine the fair value of the investment using another method approved by the Trustees.
Repurchase Agreements
It is the policy of the Fund to require the other party to a repurchase agreement to transfer to the Fund's custodian or sub-custodian eligible securities or cash with a market value (after transaction costs) at least equal to the repurchase price to be paid under the repurchase agreement. The eligible securities are transferred to accounts with the custodian or sub-custodian in which the Fund holds a “securities entitlement” and exercises “control” as those terms are defined in the Uniform Commercial Code. The Fund has established procedures for monitoring the market value of the transferred securities and requiring the transfer of additional eligible securities if necessary to equal at least the repurchase price. These procedures also allow the other party to require securities to be transferred from the account to the extent that their market value exceeds the repurchase price or in exchange for other eligible securities of equivalent market value.
With respect to agreements to repurchase U.S. government securities and cash items, the Fund treats the repurchase agreement as an investment in the underlying securities and not as an obligation of the other party to the repurchase agreement. Other repurchase agreements are treated as obligations of the other party secured by the underlying securities. Nevertheless, the insolvency of the other party or other failure to repurchase the securities Annual Shareholder Report25
may delay the disposition of the underlying securities or cause the Fund to receive less than the full repurchase price. Under the terms of the repurchase agreement, any amounts received by the Fund in excess of the repurchase price and related transaction costs must be remitted to the other party.The Fund may enter into repurchase agreements in which eligible securities are transferred into joint trading accounts maintained by the custodian or sub-custodian for investment companies and other clients advised by the Fund's Adviser and its affiliates. The Fund will participate on a pro rata basis with the other investment companies and clients in its share of the securities transferred under such repurchase agreements and in its share of proceeds from any repurchase or other disposition of such securities.
Investment Income, Gains and Losses, Expenses and Distributions
Investment transactions are accounted for on a trade-date basis. Realized gains and losses from investment transactions are recorded on an identified-cost basis. Interest income and expenses are accrued daily. Dividend income and distributions to shareholders are recorded on the ex-dividend date. Foreign dividends are recorded on the ex-dividend date or when the Fund is informed of the ex-dividend date. Distributions of net investment income are declared and paid annually. Non-cash dividends included in dividend income, if any, are recorded at fair value. Investment income, realized and unrealized gains and losses and certain fund-level expenses are allocated to each class based on relative average daily net assets, except that Institutional Shares, Class A Shares, Class B Shares, Class C Shares and Class K Shares may bear distribution services fees, shareholder services fees, account administration fees and certain transfer and dividend disbursing agent fees unique to those classes. Dividends are declared separately for each class. No class has preferential dividend rights; differences in per share dividend rates are generally due to differences in separate class expenses.
Premium and Discount Amortization
All premiums and discounts on fixed-income securities are amortized/accreted for financial statement purposes.
Federal Taxes
It is the Fund's policy to comply with the Subchapter M provision of the Internal Revenue Code (the “Code”) and to distribute to shareholders each year substantially all of its income. Accordingly, no provision for federal income tax is necessary. As of and during the year ended October 31, 2009, the Fund did not have a liability for any uncertain tax positions. The Fund recognizes interest and penalties, if any, related to tax liabilities as income tax expense in the Statement of Operations. As of October 31, 2009, tax years 2006 through 2009 remain subject to examination by the Fund's major tax jurisdictions, which include the United States of America and the Commonwealth of Massachusetts.
The Fund may be subject to taxes imposed by governments of countries in which it invests. Such taxes are generally based on either income or gains earned or repatriated. The Fund accrues and applies such taxes to net investment income, net realized gains and net unrealized gains as income and/or gains are earned.
Annual Shareholder Report26
When-Issued and Delayed Delivery TransactionsThe Fund may engage in when-issued or delayed delivery transactions. The Fund records when-issued securities on the trade date and maintains security positions such that sufficient liquid assets will be available to make payment for the securities purchased. Securities purchased on a when-issued or delayed delivery basis are marked to market daily and begin earning interest on the settlement date. Losses may occur on these transactions due to changes in market conditions or the failure of counterparties to perform under the contract.
Foreign Exchange Contracts
The Fund may enter into foreign exchange contracts for the delayed delivery of securities or foreign currency exchange transactions. The Fund may enter into foreign exchange contracts to protect assets against adverse changes in foreign currency exchange rates or exchange control regulations. Purchased contracts are used to acquire exposure to foreign currencies, whereas, contracts to sell are used to hedge the Fund's securities against currency fluctuations. Risks may arise upon entering into these transactions from the potential inability of counterparties to meet the terms of their commitments and from unanticipated movements in security prices or foreign exchange rates. The foreign exchange contracts are adjusted by the daily exchange rate of the underlying currency and any gains or losses are recorded for financial statement purposes as unrealized until the settlement date.
Foreign exchange contracts outstanding at period end are listed after the Fund's Portfolio of Investments.
Foreign Currency Translation
The accounting records of the Fund are maintained in U.S. dollars. All assets and liabilities denominated in foreign currencies (FCs) are translated into U.S. dollars based on the rates of exchange of such currencies against U.S. dollars on the date of valuation. Purchases and sales of securities, income and expenses are translated at the rate of exchange quoted on the respective date that such transactions are recorded. The Fund does not isolate that portion of the results of operations resulting from changes in foreign exchange rates on investments from the fluctuations arising from changes in market prices of securities held. Such fluctuations are included with the net realized and unrealized gain or loss from investments.
Reported net realized foreign exchange gains or losses arise from sales of portfolio securities, sales and maturities of short-term securities, sales of FCs, currency gains or losses realized between the trade and settlement dates on securities transactions, the difference between the amounts of dividends, interest and foreign withholding taxes recorded on the Fund's books, and the U.S. dollar equivalent of the amounts actually received or paid. Net unrealized foreign exchange gains and losses arise from changes in the value of assets and liabilities other than investments in securities at fiscal year end, resulting from changes in the exchange rate.
Annual Shareholder Report27
Additional Disclosure Related to Derivative Instruments| Fair Value of Derivative Instruments |
| Asset | Liability |
| Statement of
Assets and
Liabilities
Location | Fair
Value | Statement of
Assets and
Liabilities
Location | Fair
Value |
| Derivatives not accounted for as hedging instruments under ASC Topic 815 | | | | |
| Foreign exchange contracts | Receivable for foreign exchange contracts | $2,889 | — | — |
The Effect of Derivative Instruments on the Statement of Operations for the Year Ended October 31, 2009
| Amount of Realized Gain or (Loss) on Derivatives Recognized in Income |
| Forward
Currency
Contracts |
| Foreign exchange contracts | $1,424 |
| Change in Unrealized Appreciation or (Depreciation) on Derivatives Recognized in Income |
| Forward
Currency
Contracts |
| Foreign exchange contracts | $43,221 |
Other
The preparation of financial statements in conformity with GAAP requires management to make estimates and assumptions that affect the amounts of assets, liabilities, expenses and revenues reported in the financial statements. Actual results could differ from those estimated.
3. SHARES OF BENEFICIAL INTEREST
The following tables summarize share activity:
| Year Ended October 31 | 2009 | 2008 |
| Class A Shares: | Shares | Amount | Shares | Amount |
| Shares sold | 20,847,863 | $307,583,080 | 16,853,104 | $336,236,946 |
| Shares issued to shareholders in payment of distributions declared | 535,205 | 7,781,880 | 11,739,668 | 249,902,539 |
| Shares redeemed | (21,476,847) | (317,973,196) | (20,931,618) | (419,767,400) |
NET CHANGE RESULTING
FROM CLASS A SHARE TRANSACTIONS | (93,779) | $(2,608,236) | 7,661,154 | $166,372,085 |
Annual Shareholder Report28
| Year Ended October 31 | 2009 | 2008 |
| Class B Shares: | Shares | Amount | Shares | Amount |
| Shares sold | 857,656 | $12,075,453 | 791,872 | $15,361,782 |
| Shares issued to shareholders in payment of distributions declared | 39,608 | 551,341 | 3,969,781 | 80,388,061 |
| Shares redeemed | (4,715,500) | (66,134,508) | (5,889,752) | (112,993,395) |
NET CHANGE RESULTING
FROM CLASS B SHARE TRANSACTIONS | (3,818,236) | $(53,507,714) | (1,128,099) | $(17,243,552) |
| Year Ended October 31 | 2009 | 2008 |
| Class C Shares: | Shares | Amount | Shares | Amount |
| Shares sold | 1,503,629 | $21,060,246 | 1,340,717 | $25,824,322 |
| Shares issued to shareholders in payment of distributions declared | 24,411 | 338,825 | 1,234,167 | 24,967,189 |
| Shares redeemed | (1,911,514) | (26,567,911) | (2,099,452) | (40,351,015) |
NET CHANGE RESULTING
FROM CLASS C SHARE TRANSACTIONS | (383,474) | $(5,168,840) | 475,432 | $10,440,496 |
| Year Ended October 31 | 2009 | 2008 |
| Class K Shares: | Shares | Amount | Shares | Amount |
| Shares sold | 949,009 | $13,781,255 | 2,119,876 | $43,230,665 |
| Shares issued to shareholders in payment of distributions declared | 26,460 | 381,815 | 184,818 | 3,904,135 |
| Shares redeemed | (2,057,137) | (29,288,403) | (549,210) | (10,724,702) |
NET CHANGE RESULTING
FROM CLASS K SHARE TRANSACTIONS | (1,081,668) | $(15,125,333) | 1,755,484 | $36,410,098 |
Annual Shareholder Report29
| Year Ended
10/31/2009 | Period Ended
10/31/20081 |
| Institutional Shares: | Shares | Amount | Shares | Amount |
| Shares sold | 12,046,730 | $174,367,633 | 3,186,759 | $61,269,064 |
| Proceeds from shares issued in connection with the tax-free transfer of assets from Suburban Common Trust Fund | 324,388 | 4,843,111 | — | — |
| Proceeds from shares issued in connection with the tax-free transfer of assets from Clearfield Bank Common Trust Fund | 175,330 | 2,596,634 | — | — |
| Proceeds from shares issued in connection with the tax-free transfer of assets from Central Bank Core Equity Fund | — | — | 2,017,395 | 42,103,041 |
| Shares issued to shareholders in payment of distributions declared | 19,543 | 283,973 | — | — |
| Shares redeemed | (4,184,146) | (66,004,824) | (486,554) | (9,413,027) |
NET CHANGE RESULTING
FROM INSTITUTIONAL SHARE TRANSACTIONS | 8,381,845 | $ 116,086,527 | 4,717,600 | $93,959,078 |
NET CHANGE RESULTING
FROM FUND SHARE TRANSACTIONS | 3,004,688 | $ 39,676,404 | 13,481,571 | $289,938,205 |
| 1 | Reflects operations for the period from December 31, 2007 (date of initial investment) to October 31, 2008. |
4. FEDERAL TAX INFORMATION
The timing and character of income and capital gain distributions are determined in accordance with income tax regulations, which may differ from GAAP. These differences are attributable in part to reclass of gain (loss) on foreign exchange contracts, expiration of capital loss carryforwards and reclassification for regulatory settlement proceeds.
For the year ended October 31, 2009, permanent differences identified and reclassified among the components of net assets were as follows:
| Increase (Decrease) |
| Paid-In Capital | Undistributed
Net Investment
Income (Loss) | Accumulated
Net Realized
Gain (Loss) |
| $(4,147,107) | $(116,154) | $4,263,261 |
Net investment income (loss), net realized gains (losses), and net assets were not affected by this reclassification.
Annual Shareholder Report30
The tax character of distributions as reported on the Statement of Changes in Net Assets for the years ended October 31, 2009 and 2008, was as follows: | 2009 | 2008 |
| Ordinary income1 | $12,272,799 | $166,975,138 |
| Long-term capital gains | $ — | $241,873,668 |
| 1 | For tax purposes, short-term capital gain distributions are considered ordinary income distributions. |
As of October 31, 2009, the components of distributable earnings on a tax basis were as follows:
| Undistributed ordinary income | $9,216,469 |
| Net unrealized appreciation | $144,907,395 |
| Capital loss carryforwards | $(369,657,321) |
The difference between book-basis and tax-basis net unrealized appreciation/depreciation is attributable to differing treatments for the deferral of losses on wash sales.
At October 31, 2009, the cost of investments for federal tax purposes was $1,240,117,561. The net unrealized appreciation of investments for federal tax purposes excluding any unrealized appreciation resulting from changes in foreign currency exchange rates and outstanding foreign currency commitments was $144,890,102. This consists of net unrealized appreciation from investments for those securities having an excess of value over cost of $162,102,044 and net unrealized depreciation from investments for those securities having an excess of cost over value of $17,211,942.
At October 31, 2009, the Fund had a capital loss carryforward of $369,657,321 which will reduce the Fund's taxable income arising from future net realized gains on investments, if any, to the extent permitted by the Code and thus will reduce the amount of distributions to shareholders which would otherwise be necessary to relieve the Fund of any liability for federal income tax. Pursuant to the Code, such capital loss carryforward will expire as follows:
| Expiration Year | Expiration Amount |
| 2010 | $2,978,206 |
| 2011 | $978,641 |
| 2012 | $1,306,623 |
| 2016 | $110,598,251 |
| 2017 | $253,795,600 |
As a result of the tax-free transfer of assets from Vintage Growth Fund certain capital loss carryforwards listed above may be limited.
Capital loss carryforwards of $5,129,844 expired during the year ended October 31, 2009.
Annual Shareholder Report31
5. INVESTMENT ADVISER FEE AND OTHER TRANSACTIONS WITH AFFILIATESInvestment Adviser Fee
Federated Equity Management Company of Pennsylvania is the Fund's investment adviser (the “Adviser”). The advisory agreement between the Fund and the Adviser provides for an annual fee equal to 0.75% of the Fund's average daily net assets. Subject to the terms described in the Expense Limitation note, the Adviser may voluntarily choose to waive any portion of its fee. The Adviser can modify or terminate this voluntary waiver at any time at its sole discretion. For the year ended October 31, 2009, an affiliate of the adviser reimbursed $74,569 of transfer and dividend disbursing agent fees and expenses.
Administrative Fee
Federated Administrative Services (FAS), under the Administrative Services Agreement, provides the Fund with administrative personnel and services. The fee paid to FAS is based on the average aggregate daily net assets of certain Federated funds as specified below:
| Administrative Fee | Average Aggregate Daily Net Assets
of the Federated Funds |
| 0.150% | on the first $5 billion |
| 0.125% | on the next $5 billion |
| 0.100% | on the next $10 billion |
| 0.075% | on assets in excess of $20 billion |
The administrative fee received during any fiscal year shall be at least $150,000 per portfolio and $40,000 per each additional class of Shares. Subject to the terms described in the Expense Limitation note, FAS may voluntarily choose to waive any portion of its fee. FAS can modify or terminate this voluntary waiver at any time at its sole discretion. For the year ended
October 31, 2009, the net fee paid to FAS was 0.076% of average daily net assets of the Fund. FAS waived $20,588 of its fee.
Distribution Services Fee
The Fund has adopted a Distribution Plan (the “Plan”) pursuant to Rule 12b-1 under the Act. Under the terms of the Plan, the Fund will compensate Federated Securities Corp. (FSC), the principal distributor, from the daily net assets of the Fund's Class A Shares, Class B Shares, Class C Shares and Class K Shares to finance activities intended to result in the sale of these shares. The Plan provides that the Fund may incur distribution expenses at the following percentages of average daily net assets annually, to compensate FSC:
| Share Class Name | Percentage of Average Daily
Net Assets of Class |
| Class A Shares | 0.05% |
| Class B Shares | 0.75% |
| Class C Shares | 0.75% |
| Class K Shares | 0.50% |
Annual Shareholder Report32
Subject to the terms described in the Expense Limitation note, FSC may voluntarily choose to waive any portion of its fee. FSC can modify or terminate this voluntary waiver at any time at its sole discretion. When FSC receives fees, it may pay some or all of them to financial intermediaries whose customers purchase shares. For the year ended October 31, 2009, FSC retained $57,554 of fees paid by the Fund. For the year ended October 31, 2009, the Fund's Class A Shares did not incur a distribution services fee; however it may begin to incur this fee upon approval of the Trustees.
Sales Charges
Front-end sales charges and contingent deferred sales charges (CDSC) do not represent expenses of the Fund. They are deducted from the proceeds of sales of Fund shares prior to investment or from redemption proceeds prior to remittance, as applicable. For the year ended October 31, 2009, FSC retained $86,541 in sales charges from the sale of Class A Shares. FSC also retained $2,571 of CDSC relating to redemptions of Class A Shares and $3,420 relating to redemptions of Class C Shares.
Shareholder Services Fee
The Fund may pay fees (Service Fees) up to 0.25% of the average daily net assets of the Fund's Class A Shares, Class B Shares and Class C Shares to financial intermediaries or to Federated Shareholder Services Company (FSSC) for providing services to shareholders and maintaining shareholder accounts. Financial intermediaries may include a company affiliated with management of Federated Investors, Inc. A financial intermediary affiliated with management of Federated Investors, Inc. received $10,438 of Service Fees for the year ended October 31, 2009. Subject to the terms described in the Expense Limitation note, FSSC may voluntarily reimburse the Fund for shareholder services fees. This voluntary reimbursement can be modified or terminated at any time. For the year ended October 31, 2009, FSSC voluntarily reimbursed $464,794 of shareholder services fees. For the year ended October 31, 2009, FSSC did not receive any fees paid by the Fund.
Interfund Transactions
During the year ended October 31, 2009, the Fund engaged in purchase and sale transactions with funds that have a common investment adviser (or affiliated investment advisers), common Directors/Trustees, and/or common Officers. These purchase and sale transactions complied with Rule 17a-7 under the Act and amounted to $1,572,922 and $1,236,733, respectively.
Expense Limitation
The Adviser and its affiliates (which may include FSC, FAS and FSSC) have voluntarily agreed to waive their fees and/or reimburse expenses so that the total operating expenses (as shown in the financial highlights) paid by the Fund's Class A Shares, Class B Shares, Class C Shares, Class K Shares and Institutional Shares (after the voluntary waivers and reimbursements) will not exceed 1.24%, 2.10%, 2.06%, 1.71% and 0.96%, respectively, through the later of (the “Termination Date”): (a) December 31, 2010; or (b) the date of the Fund's next effective Prospectus. While the Adviser and its affiliates currently do not anticipate terminating these arrangements prior to the Termination Date, these arrangements may only be terminated prior to the Termination Date with the agreement of the Fund's Board of Trustees.
General
Certain Officers and Trustees of the Fund are Officers and Directors or Trustees of the above companies.
Annual Shareholder Report33
Transactions with Affiliated CompaniesAffiliated holdings are mutual funds which are managed by the Adviser or an affiliate of the Adviser. The Adviser has agreed to reimburse the Fund for certain investment adviser fees as a result of transactions in other affiliated mutual funds. For the year ended October 31, 2009, the Adviser reimbursed $69,879. Transactions with the affiliated company during the year ended October 31, 2009 were as follows:
| Affiliate | Balance of
Shares Held
10/31/2008 | Purchases/
Additions | Sales/
Reductions | Balance of
Shares Held
10/31/2009 | Value | Dividend
Income |
| Prime Value Obligations Fund, Institutional Shares | 162,690,105 | 1,275,486,604 | 1,435,777,908 | 2,398,801 | $2,398,801 | $764,043 |
6. EXPENSE Reduction
The Fund directs portfolio trades to a broker that in turn pays a portion of the Fund's operating expenses. For the year ended October 31, 2009, the Fund's expenses were reduced by $154,693 under these arrangements.
7. Investment TRANSACTIONS
Purchases and sales of investments, excluding long-term U.S. government securities and short-term obligations, for the year ended October 31, 2009, were as follows:
| Purchases | $3,283,915,928 |
| Sales | $3,232,208,126 |
8. LINE OF CREDIT
The Fund participates in a $100,000,000 unsecured, uncommitted revolving line of credit (LOC) agreement with PNC Bank. The LOC was made available for extraordinary or emergency purposes, primarily for financing redemption payments. Borrowings are charged interest at a rate offered to the Fund by PNC Bank at the time of the borrowing. As of October 31, 2009, there were no outstanding loans. During the year ended October 31, 2009, the Fund did not utilize the LOC.
9. INTERFUND LENDING
Pursuant to an Exemptive Order issued by the Securities and Exchange Commission (SEC), the Fund, along with other funds advised by subsidiaries of Federated Investors, Inc., may participate in an interfund lending program. This program provides an alternative credit facility allowing the Fund to borrow from other participating affiliated funds. As of October 31, 2009, there were no outstanding loans. During the year ended October 31, 2009, the program was not utilized.
10. Legal Proceedings
Since October 2003, Federated Investors, Inc. and related entities (collectively, Federated) and various Federated funds (Federated Funds) have been named as defendants in several class action lawsuits now pending in the United States District Court for the District of Maryland. The lawsuits were purportedly filed on behalf of people who purchased, owned and/or redeemed shares of Federated-sponsored mutual funds during specified periods beginning November 1, 1998. The suits are generally similar in alleging that Federated engaged in illegal Annual Shareholder Report34
and improper trading practices including market timing and late trading in concert with certain institutional traders, which allegedly caused financial injury to the mutual fund shareholders. These lawsuits began to be filed shortly after Federated's first public announcement that it had received requests for information on shareholder trading activities in the Federated Funds from the SEC, the Office of the New York State Attorney General (NYAG) and other authorities. In that regard, on November 28, 2005, Federated announced that it had reached final settlements with the SEC and the NYAG with respect to those matters. As Federated previously reported in 2004, it has already paid approximately $8.0 million to certain funds as determined by an independent consultant. As part of these settlements, Federated agreed to pay for the benefit of fund shareholders additional disgorgement and a civil money penalty in the aggregate amount of an additional $72 million. Federated entities have also been named as defendants in several additional lawsuits that are now pending in the United States District Court for the Western District of Pennsylvania, alleging, among other things, excessive advisory and Rule 12b-1 fees. The Board of the Federated Funds retained the law firm of Dickstein Shapiro LLP to represent the Federated Funds in these lawsuits. Federated and the Federated Funds, and their respective counsel have been defending this litigation, and none of the Federated Funds remains a defendant in any of the lawsuits (though some could potentially receive any recoveries as nominal defendants). Additional lawsuits based upon similar allegations may be filed in the future. The potential impact of these lawsuits, all of which seek unquantified damages, attorneys' fees and expenses, and future potential similar suits is uncertain. Although we do not believe that these lawsuits will have a material adverse effect on the Federated Funds, there can be no assurance that these suits, the ongoing adverse publicity and/or other developments resulting from the regulatory investigations will not result in increased Federated Fund redemptions, reduced sales of Federated Fund shares or other adverse consequences for the Federated Funds.11. Subsequent events
Management has evaluated subsequent events through December 24, 2009, the date the financial statements were issued, and determined that no events have occurred that require additional disclosure.
12. FEDERAL TAX INFORMATION (UNAUDITED)
For the fiscal year ended October 31, 2009, 100% of total ordinary dividends paid by the Fund are qualifying dividends which may be subject to a maximum tax rate of 15%, as provided for by the Jobs and Growth Tax Relief Act of 2003. Complete information is reported in conjunction with the reporting of your distributions on Form 1099-DIV.
Of the ordinary income distributions made by the Fund during the year ended October 31, 2009, 100% qualify for the dividend received deduction available to corporate shareholders.
Annual Shareholder Report35
Report of Independent Registered Public Accounting Firm
TO THE BOARD OF Trustees of Federated equity funds AND SHAREHOLDERS OF federated capital appreciation fund:
We have audited the accompanying statement of assets and liabilities, including the portfolio of investments, of the Federated Capital Appreciation Fund (the “Fund”), a portfolio of Federated Equity Funds, as of October 31, 2009, and the related statement of operations for the year then ended, the statements of changes in net assets for each of the years in the two-year period then ended, and the financial highlights for each of the years in the four-year period then ended. These financial statements and financial highlights are the responsibility of the Fund's management. Our responsibility is to express an opinion on these financial statements and financial highlights based on our audits. The financial highlights for the period presented prior to November 1, 2005, was audited by other independent registered public accountants whose report thereon dated December 20, 2005, expressed an unqualified opinion on those statements.
We conducted our audits in accordance with the standards of the Public Company Accounting Oversight Board (United States). Those standards require that we plan and perform the audit to obtain reasonable assurance about whether the financial statements and financial highlights are free of material misstatement. An audit includes examining, on a test basis, evidence supporting the amounts and disclosures in the financial statements. Our procedures included confirmation of securities owned as of October 31, 2009 by correspondence with the custodian and brokers or by other appropriate auditing procedures. An audit also includes assessing the accounting principles used and significant estimates made by management, as well as evaluating the overall financial statement presentation. We believe that our audits provide a reasonable basis for our opinion.
In our opinion, the financial statements and financial highlights referred to above present fairly, in all material respects, the financial position of the Federated Capital Appreciation Fund as of October 31, 2009, the results of its operations for the year then ended, changes in its net assets for each of the years in the two-year period then ended, and financial highlights for each of the years in the four-year period then ended, in conformity with U.S. generally accepted accounting principles.
Boston, Massachusetts
December 24, 2009
Annual Shareholder Report36
Board of Trustees and Trust Officers
The Board is responsible for managing the Trust's business affairs and for exercising all the Trust's powers except those reserved for the shareholders. The following tables give information about each Board member and the senior officers of the Fund. Where required, the tables separately list Board members who are “interested persons” of the Fund (i.e., “Interested” Board members) and those who are not (i.e., “Independent” Board members). Unless otherwise noted, the address of each person listed is Federated Investors Tower, 1001 Liberty Avenue, Pittsburgh, PA 15222. The address of all Independent Board members listed is 4000 Ericsson Drive, Warrendale, PA 15086-7561; Attention: Mutual Fund Board. As of December 31, 2008, the Trust comprised ten portfolios, and the Federated Fund Complex consisted of 40 investment companies (comprising 149 portfolios). Unless otherwise noted, each Officer is elected annually. Unless otherwise noted, each Board member oversees all portfolios in the Federated Fund Complex and serves for an indefinite term. The Fund's Statement of Additional Information includes additional information about Trust Trustees and is available, without charge and upon request, by calling 1-800-341-7400.
Interested TRUSTEES Background
Name
Birth Date
Positions Held with Trust
Date Service Began | Principal Occupation(s) for Past Five Years,
Other Directorships Held and Previous Position(s) |
John F. Donahue*
Birth Date: July 28, 1924
TRUSTEE
Began serving: April 1984 | Principal Occupations: Director or Trustee of the Federated Fund Complex; Chairman and Director, Federated Investors, Inc.; Chairman of the Federated Fund Complex's Executive Committee.
Previous Positions: Chairman of the Federated Fund Complex; Trustee, Federated Investment Management Company; Chairman and Director, Federated Investment Counseling. |
J. Christopher Donahue*
Birth Date: April 11, 1949
PRESIDENT AND TRUSTEE
Began serving: January 2000 | Principal Occupations: Principal Executive Officer and President of the Federated Fund Complex; Director or Trustee of some of the Funds in the Federated Fund Complex; President, Chief Executive Officer and Director, Federated Investors, Inc.; Chairman and Trustee, Federated Investment Management Company; Trustee, Federated Investment Counseling; Chairman and Director, Federated Global Investment Management Corp.; Chairman, Federated Equity Management Company of Pennsylvania and Passport Research, Ltd. (investment advisory subsidiary of Federated); Trustee, Federated Shareholder Services Company; Director, Federated Services Company.
Previous Positions: President, Federated Investment Counseling; President and Chief Executive Officer, Federated Investment Management Company, Federated Global Investment Management Corp. and Passport Research, Ltd. |
| * | Family relationships and reasons for “interested” status: John F. Donahue is the father of J. Christopher Donahue; both are “interested” due to their beneficial ownership of shares of Federated Investors, Inc. and the positions they hold with Federated and its subsidiaries. |
Annual Shareholder Report37
INDEPENDENT TRUSTEES Background
Name
Birth Date
Positions Held with Trust
Date Service Began | Principal Occupation(s) for Past Five Years,
Other Directorships Held and Previous Position(s) |
John T. Conroy, Jr., Ph.D.
Birth Date: June 23, 1937
TRUSTEE
Began serving: November 1991 | Principal Occupations: Director or Trustee of the Federated Fund Complex; Chairman of the Board, Investment Properties Corporation; Partner or Trustee in private real estate ventures in Southwest Florida; Assistant Professor in Theology, Blessed Edmund Rice School for Pastoral Ministry.
Previous Positions: President, Investment Properties Corporation; Senior Vice President, John R. Wood and Associates, Inc., Realtors; President, Naples Property Management, Inc. and Northgate Village Development Corporation. |
Nicholas P. Constantakis
Birth Date: September 3, 1939
TRUSTEE
Began serving: February 1998 | Principal Occupation: Director or Trustee of the Federated Fund Complex.
Other Directorship Held: Director and Chairman of the Audit Committee, Michael Baker Corporation (architecture, engineering and construction services).
Previous Position: Partner, Andersen Worldwide SC. |
John F. Cunningham
Birth Date: March 5, 1943
TRUSTEE
Began serving: January 1999 | Principal Occupation: Director or Trustee of the Federated Fund Complex.
Other Directorships Held: Chairman, President and Chief Executive Officer, Cunningham & Co., Inc. (strategic business consulting); Trustee Associate, Boston College.
Previous Positions: Director, Redgate Communications and EMC Corporation (computer storage systems); Chairman of the Board and Chief Executive Officer, Computer Consoles, Inc.; President and Chief Operating Officer, Wang Laboratories; Director, First National Bank of Boston; Director, Apollo Computer, Inc. |
Maureen Lally-Green
Birth Date: July 5, 1949
TRUSTEE
Began serving: August 2009 | Principal Occupations: Director or Trustee of the Federated Fund Complex; Director, Office of Church Relations, Diocese of Pittsburgh; Adjunct Professor of Law, Duquesne University School of Law.
Other Directorships Held: Director, Auberle; Trustee St. Francis University; Director, Ireland Institute of Pittsburgh; Director, UPMC Mercy Hospital; Regent, St. Vincent Seminary; Director, Epilepsy Foundation of Western and Central Pennsylvania; Director, Saint Thomas More Society, Allegheny County; Director, Carlow University.
Previous Position: Pennsylvania Superior Court Judge. |
Annual Shareholder Report38
Name
Birth Date
Positions Held with Trust
Date Service Began | Principal Occupation(s) for Past Five Years,
Other Directorships Held and Previous Position(s) |
Peter E. Madden
Birth Date: March 16, 1942
TRUSTEE
Began serving: November 1991 | Principal Occupation: Director or Trustee and Chairman of the Board of the Federated Fund Complex.
Other Directorship Held: Board of Overseers, Babson College.
Previous Positions: Representative, Commonwealth of Massachusetts General Court; President, Chief Operating Officer and Director, State Street Bank and Trust Company and State Street Corporation (retired); Director, VISA USA and VISA International; Chairman and Director, Massachusetts Bankers Association; Director, Depository Trust Corporation; Director, The Boston Stock Exchange. |
Charles F. Mansfield, Jr.
Birth Date: April 10, 1945
TRUSTEE
Began serving: January 1999 | Principal Occupations: Director or Trustee and Chairman of the Audit Committee of the Federated Fund Complex; Management Consultant.
Previous Positions: Chief Executive Officer, PBTC International Bank; Partner, Arthur Young & Company (now Ernst & Young LLP); Chief Financial Officer of Retail Banking Sector, Chase Manhattan Bank; Senior Vice President, HSBC Bank USA (formerly, Marine Midland Bank); Vice President, Citibank; Assistant Professor of Banking and Finance, Frank G. Zarb School of Business, Hofstra University; Executive Vice President DVC Group, Inc. (marketing, communications and technology). |
R. James Nicholson
Birth Date: February 4, 1938
TRUSTEE
Began serving: April 2008 | Principal Occupations: Director or Trustee of the Federated Fund Complex; Senior Counsel, Brownstein Hyatt Farber Schrek, P.C.; Former Secretary of the U.S. Dept. of Veterans Affairs; Former U.S. Ambassador to the Holy See; Former Chairman of the Republican National Committee.
Other Directorships Held: Director, Horatio Alger Association; Director, The Daniels Fund.
Previous Positions: Colonel, U.S. Army Reserve; Partner, Calkins, Kramer, Grimshaw and Harring, P.C.; General Counsel, Colorado Association of Housing and Building; Chairman and CEO, Nicholson Enterprises, Inc. (real estate holding company); Chairman and CEO, Renaissance Homes of Colorado. |
Thomas M. O'Neill
Birth Date: June 14, 1951
TRUSTEE
Began serving: October 2006 | Principal Occupations: Director or Trustee of the Federated Fund Complex; Managing Director and Partner, Navigator Management Company, L.P. (investment and strategic consulting).
Other Directorships Held: Board of Overseers, Children's Hospital of Boston; Visiting Committee on Athletics, Harvard College.
Previous Positions: Chief Executive Officer and President, Managing Director and Chief Investment Officer, Fleet Investment Advisors; President and Chief Executive Officer, Aeltus Investment Management, Inc.; General Partner, Hellman, Jordan Management Co., Boston, MA; Chief Investment Officer, The Putnam Companies, Boston, MA; Credit Analyst and Lending Officer, Fleet Bank; Director and Consultant, EZE Castle Software (investment order management software); Director, Midway Pacific (lumber). |
Annual Shareholder Report39
Name
Birth Date
Positions Held with Trust
Date Service Began | Principal Occupation(s) for Past Five Years,
Other Directorships Held and Previous Position(s) |
John S. Walsh
Birth Date: November 28, 1957
TRUSTEE
Began serving: January 1999 | Principal Occupations: Director or Trustee of the Federated Fund Complex; President and Director, Heat Wagon, Inc. (manufacturer of construction temporary heaters); President and Director, Manufacturers Products, Inc. (distributor of portable construction heaters); President, Portable Heater Parts, a division of Manufacturers Products, Inc.
Previous Position: Vice President, Walsh & Kelly, Inc. |
James F. Will
Birth Date: October 12, 1938
TRUSTEE
Began serving: April 2006 | Principal Occupations: Director or Trustee of the Federated Fund Complex; formerly, Vice Chancellor and President, Saint Vincent College.
Other Directorships Held: Trustee, Saint Vincent College; Alleghany Corporation.
Previous Positions: Chairman, President and Chief Executive Officer, Armco, Inc.; President and Chief Executive Officer, Cyclops Industries; President and Chief Operating Officer, Kaiser Steel Corporation. |
OFFICERS
Name
Birth Date
Address
Positions Held with Trust
Date Service Began | Principal Occupation(s) for Past Five Years
and Previous Position(s) |
John W. McGonigle
Birth Date: October 26, 1938
EXECUTIVE VICE PRESIDENT AND SECRETARY
Began serving: April 1984 | Principal Occupations: Executive Vice President and Secretary of the Federated Fund Complex; Vice Chairman, Executive Vice President, Secretary and Director, Federated Investors, Inc.
Previous Positions: Trustee, Federated Investment Management Company and Federated Investment Counseling; Director, Federated Global Investment Management Corp., Federated Services Company and Federated Securities Corp. |
Richard A. Novak
Birth Date: December 25, 1963
TREASURER
Began serving: January 2006 | Principal Occupations: Principal Financial Officer and Treasurer of the Federated Fund Complex; Senior Vice President, Federated Administrative Services; Financial and Operations Principal for Federated Securities Corp., Edgewood Services, Inc. and Southpointe Distribution Services, Inc.
Previous Positions: Controller of Federated Investors, Inc.; Vice President, Finance of Federated Services Company; held various financial management positions within The Mercy Hospital of Pittsburgh; Auditor, Arthur Andersen & Co. |
Richard B. Fisher
Birth Date: May 17, 1923
VICE PRESIDENT
Began serving: April 1984 | Principal Occupations: Vice Chairman or Vice President of some of the Funds in the Federated Fund Complex; Vice Chairman, Federated Investors, Inc.; Chairman, Federated Securities Corp.
Previous Positions: President and Director or Trustee of some of the Funds in the Federated Fund Complex; Executive Vice President, Federated Investors, Inc.; Director and Chief Executive Officer, Federated Securities Corp. |
Annual Shareholder Report40
Name
Birth Date
Address
Positions Held with Trust
Date Service Began | Principal Occupation(s) for Past Five Years
and Previous Position(s) |
Brian P. Bouda
Birth Date: February 28, 1947
CHIEF COMPLIANCE OFFICER AND SENIOR VICE PRESIDENT
Began serving: August 2004 | Principal Occupations: Senior Vice President and Chief Compliance Officer of the Federated Fund Complex; Vice President and Chief Compliance Officer of Federated Investors, Inc. and Chief Compliance Officer of its subsidiaries. Mr. Bouda joined Federated in 1999 and is a member of the American Bar Association and the State Bar Association of Wisconsin. |
Stephen F. Auth
Birth Date: September 3, 1956
450 Lexington Avenue
Suite 3700
New York, NY 10017-3943
CHIEF INVESTMENT OFFICER
Began serving: November 2002 | Principal Occupations: Mr. Auth is Chief Investment Officer of this Fund and various other Funds in the Federated Fund Complex; Executive Vice President, Federated Investment Counseling, Federated Global Investment Management Corp. and Federated Equity Management Company of Pennsylvania.
Previous Positions: Executive Vice President, Federated Investment Management Company, and Passport Research, Ltd. (investment advisory subsidiary of Federated); Senior Vice President, Global Portfolio Management Services Division; Senior Vice President, Federated Investment Management Company and Passport Research, Ltd.; Senior Managing Director and Portfolio Manager, Prudential Investments. |
Lawrence Auriana
Birth Date: January 8, 1944
140 East 45th Street
New York, NY 10017
VICE PRESIDENT
Began serving: November 2001 | Principal Occupations: Lawrence Auriana is Vice President of the Trust. Mr. Auriana joined Federated in April 2001 as Co-Head of Investments/Federated Kaufmann. From August 1984 to April 2001, Mr. Auriana was President and Treasurer of Edgemont Asset Management Corp., and Chairman of the Board and Portfolio Manager to The Kaufmann Fund, Inc. (predecessor to the Federated Kaufmann Fund). Mr. Auriana earned a B.S. in economics from Fordham University and has been engaged in the securities business since 1965. |
Walter C. Bean
Birth Date: June 22, 1945
VICE PRESIDENT
Began serving: November 2006 | Principal Occupations: Walter C. Bean is Vice President of the Trust. Mr. Bean is a Senior Vice President, Senior Portfolio Manager and the Head of the Equity Income Management Team of the Fund's Adviser. Mr. Bean joined Federated in 2000. His previous associations included: various investment management and research positions with C.S. McKee & Company; First Chicago Investment Advisors; CIGNA Investment Advisors; and Mellon Bank. Mr. Bean earned a Bachelors Degree in Business Administration from Ohio University and an M.B.A. from the Pennsylvania State University. Mr. Bean is a Chartered Financial Analyst and has 40 years of investment experience. |
Hans P. Utsch
Birth Date: July 3, 1936
140 East 45th Street
New York, NY 10017
VICE PRESIDENT
Began serving: November 2001 | Principal Occupations: Hans P. Utsch is Vice President of the Trust. Mr. Utsch joined Federated in April 2001 as Co-Head of Investments/Federated Kaufmann. From August 1984 to April 2001, Mr. Utsch was Chairman of the Board and Secretary of Edgemont Asset Management Corp., and President and Portfolio Manager to The Kaufmann Fund, Inc. (predecessor to the Federated Kaufmann Fund). Mr. Utsch graduated from Amherst College and holds an M.B.A. from Columbia University. He has been engaged in the securities business since 1962. |
Annual Shareholder Report41
Evaluation and Approval of Advisory Contract - May 2009
Federated Capital Appreciation Fund (the “Fund”)
The Fund's Board reviewed the Fund's investment advisory contract at meetings held in May 2009. The Board's decision regarding the contract reflects the exercise of its business judgment on whether to continue the existing arrangements.
In this connection, the Federated funds' Board had previously appointed a Senior Officer, whose duties include specified responsibilities relating to the process by which advisory fees are to be charged to a Federated fund. The Senior Officer has the authority to retain consultants, experts, or staff as may be reasonably necessary to assist in the performance of his duties, reports directly to the Board, and may be terminated only with the approval of a majority of the independent members of the Board. The Senior Officer prepared and furnished to the Board an independent, written evaluation that covered topics discussed below. The Board considered that evaluation, along with other information, in deciding to approve the advisory contract.
During its review of the contract, the Board considered compensation and benefits received by the Adviser. This included the fees received for services provided to the Fund by other entities in the Federated organization and research services received by the Adviser from brokers that execute Federated fund trades, as well as advisory fees. The Board is also familiar with and considered judicial decisions concerning allegedly excessive investment advisory fees, which have indicated that the following factors may be relevant to an Adviser's fiduciary duty with respect to its receipt of compensation from a fund: the nature and quality of the services provided by the Adviser, including the performance of the fund; the Adviser's cost of providing the services; the extent to which the Adviser may realize “economies of scale” as a fund grows larger; any indirect benefits that may accrue to the Adviser and its affiliates as a result of the Adviser's relationship with a fund; performance and expenses of comparable funds; and the extent to which the independent Board members are fully informed about all facts the Board deems relevant bearing on the Adviser's services and fees. The Board further considered management fees (including any components thereof) charged to institutional and other clients of the Adviser for what might be viewed as like services, and the cost to the Adviser and its affiliates of supplying services pursuant to the management fee agreements, excluding any intra-corporate profit and profit margins of the Adviser and its affiliates for supplying such services. The Board was aware of these factors and was guided by them in its review of the Fund's advisory contract to the extent it considered them to be appropriate and relevant, as discussed further below.
Annual Shareholder Report42
The Board considered and weighed these circumstances in light of its substantial accumulated experience in governing the Fund and working with Federated on matters relating to the Federated funds, and was assisted in its deliberations by independent legal counsel. Throughout the year, the Board has requested and received substantial and detailed information about the Fund and the Federated organization that was in addition to the extensive materials that comprise and accompany the Senior Officer's evaluation. Federated provided much of this information at each regular meeting of the Board, and furnished additional reports in connection with the particular meeting at which the Board's formal review of the advisory contract occurred. Between regularly scheduled meetings, the Board also received information on particular matters as the need arose. Thus, the Board's consideration of the advisory contract included review of the Senior Officer's evaluation, accompanying data and additional reports covering such matters as: the Adviser's investment philosophy, revenue, profitability, personnel and processes; investment and operating strategies; the Fund's short- and long-term performance (in absolute terms, both on a gross basis and net of expenses, as well as in relationship to its particular investment program and certain competitor or “peer group” funds and/or other benchmarks, as appropriate), and comments on the reasons for performance; the Fund's investment objectives; the Fund's expenses (including the advisory fee itself and the overall expense structure of the Fund, both in absolute terms and relative to similar and/or competing funds, with due regard for contractual or voluntary expense limitations); the use and allocation of brokerage commissions derived from trading the Fund's portfolio securities (if any); and the nature, quality and extent of the advisory and other services provided to the Fund by the Adviser and its affiliates. The Board also considered the preferences and expectations of Fund shareholders and their relative sophistication; the continuing state of competition in the mutual fund industry and market practices; the range of comparable fees for similar funds in the mutual fund industry; the Fund's relationship to the Federated family of funds which include a comprehensive array of funds with different investment objectives, policies and strategies which are available for exchange without the incurrence of additional sales charges; compliance and audit reports concerning the Federated funds and the Federated companies that service them (including communications from regulatory agencies), as well as Federated's responses to any issues raised therein; and relevant developments in the mutual fund industry and how the Federated funds and/or Federated are responding to them. The Board's evaluation process is evolutionary. The criteria considered and the emphasis placed on relevant criteria change in recognition of changing circumstances in the mutual fund marketplace. With respect to the Fund's performance and expenses in particular, the Board has found the use of comparisons to other mutual funds with comparable investment programs to be particularly useful, given the high degree of competition in the mutual fund business. The Board focused on comparisons Annual Shareholder Report43
with other similar mutual funds more heavily than non-mutual fund products or services because it is believed that they are more relevant. For example, other mutual funds are the products most like the Fund, they are readily available to Fund shareholders as alternative investment vehicles, and they are the type of investment vehicle in fact chosen and maintained by the Fund's investors. The range of their fees and expenses therefore appears to be a generally reliable indication of what consumers have found to be reasonable in the precise marketplace in which the Fund competes. The Fund's ability to deliver competitive performance when compared to its peer group was a useful indicator of how the Adviser is executing the Fund's investment program, which in turn assisted the Board in reaching a conclusion that the nature, extent, and quality of the Adviser's investment management services were such as to warrant continuation of the advisory contract. In this regard, the Senior Officer has reviewed Federated's fees for providing advisory services to products outside the Federated family of funds (e.g., institutional and separate accounts). He concluded that mutual funds and institutional accounts are inherently different products. Those differences include, but are not limited to, different types of targeted investors; being subject to different laws and regulations; different legal structures; different average account sizes; different associated costs; different portfolio management techniques made necessary by different cash flows and portfolio manager time spent in review of securities pricing. The Senior Officer did not consider these fee schedules to be determinative in judging the appropriateness of mutual fund advisory contracts.The Senior Officer reviewed reports compiled by Federated, using data supplied by independent fund ranking organizations, regarding the performance of, and fees charged by, other mutual funds, noting his view that comparisons to fund peer groups are highly important in judging the reasonableness of proposed fees.
For the one-year, three-year and five-year periods covered by the report, the Fund's performance was above the median of the relevant peer group.
The Board also received financial information about Federated, including reports on the compensation and benefits Federated derived from its relationships with the Federated funds. These reports covered not only the fees under the advisory contracts, but also fees received by Federated's subsidiaries for providing other services to the Federated funds under separate contracts (e.g., for serving as the Federated funds' administrator). The reports also discussed any indirect benefit Federated may derive from its receipt of research services from brokers who execute Federated fund trades. In addition, the Board considered the fact that, in order for a fund to be competitive in the marketplace, Federated and its affiliates frequently waived fees and/or reimbursed expenses and have disclosed to fund investors and/or indicated to the Board their intention to do so in the future, where appropriate. Moreover, the Board receives regular reports regarding the institution or elimination of these voluntary waivers.
Annual Shareholder Report44
Federated furnished reports, requested by the Senior Officer, that reported revenues on a fund-by-fund basis and made estimates of the allocation of expenses on a fund-by-fund basis, using allocation methodologies specified by the Senior Officer. The Senior Officer noted that, although they may apply consistent allocation processes, the inherent difficulties in allocating costs (and the unavoidable arbitrary aspects of that exercise) and the lack of consensus on how to allocate those costs may render such allocation reports unreliable. The allocation reports were considered in the analysis by the Board but were determined to be of limited use.The Board and the Senior Officer also reviewed a report compiled by Federated comparing profitability information for Federated to other publicly held fund management companies. In this regard, the Senior Officer noted the limited availability of such information, but nonetheless concluded that Federated's profit margins did not appear to be excessive and the Board agreed.
The Senior Officer's evaluation also discussed the notion of possible realization of “economies of scale” as a fund grows larger. The Board considered in this regard that the Adviser has made significant and long-term investments in areas that support all of the Federated funds, such as personnel and processes for the portfolio management, compliance, and risk management functions; and systems technology; and that the benefits of these efforts (as well as any economies, should they exist) were likely to be enjoyed by the fund complex as a whole. Finally, the Board also noted the absence of any applicable regulatory or industry guidelines on this subject, which (as discussed in the Senior Officer's evaluation) is compounded by the lack of any common industry practice or general pattern with respect to structuring fund advisory fees with “breakpoints” that serve to reduce the fee as the fund attains a certain size. The Senior Officer did not recommend institution of breakpoints in pricing Federated's fund advisory services at this time.
It was noted in the materials for the Board meeting that for the period covered by the report, the Fund's investment advisory fee, after waivers and expense reimbursements, if any, was above the median of the relevant peer group. The Board reviewed the fees and other expenses of the Fund with the Adviser and was satisfied that the overall expense structure of the Fund remained competitive. The Board will continue to monitor advisory fees and other expenses borne by the Fund.
The Senior Officer's evaluation noted his belief that the information and observations contained in his evaluation supported a finding that the proposed management fees are reasonable, and that Federated appeared to provide appropriate administrative services to the Fund for the fees paid. Under these circumstances, no changes were recommended to, and no objection was raised to, the continuation of the Fund's advisory contract. The Board concluded that the nature, quality and scope of services provided the Fund by the Adviser and its affiliates were satisfactory.
Annual Shareholder Report45
In its decision to continue an existing investment advisory contract, the Board was mindful of the potential disruptions of the Fund's operations and various risks, uncertainties and other effects that could occur as a result of a decision to terminate or not renew an advisory contract. In particular, the Board recognized that many shareholders have invested in the Fund on the strength of the Adviser's industry standing and reputation and with the expectation that the Adviser will have a continuing role in providing advisory services to the Fund. Thus, the Board's approval of the advisory contract reflected the fact that it is the shareholders who have effectively selected the Adviser by virtue of having invested in the Fund.The Board based its decision to approve the advisory contract on the totality of the circumstances and relevant factors and with a view to past and future long-term considerations. Not all of the factors and considerations identified above were necessarily relevant to the Fund, nor did the Board consider any one of them to be determinative. With respect to the factors that were relevant, the Board's decision to approve the contract reflects its determination that Federated's performance and actions provided a satisfactory basis to support the decision to continue the existing arrangements.
Annual Shareholder Report46
Voting Proxies on Fund Portfolio Securities
A description of the policies and procedures that the Fund uses to determine how to vote proxies, if any, relating to securities held in the Fund's portfolio is available, without charge and upon request, by calling 1-800-341-7400. A report on “Form N-PX” of how the Fund voted any such proxies during the most recent 12-month period ended June 30 is available from Federated's Web site at FederatedInvestors.com. To access this information from the “Products” section of the Web site, click on the “Prospectuses and Regulatory Reports” link under “Related Information,” then select the appropriate link opposite the name of the Fund; or select the name of the Fund and from the Fund's page, click on the “Prospectuses and Regulatory Reports” link. Form N-PX filings are also available at the SEC's Web site at www.sec.gov.
Quarterly Portfolio Schedule
The Fund files with the SEC a complete schedule of its portfolio holdings, as of the close of the first and third quarters of its fiscal year, on “Form N-Q.” These filings are available on the SEC's Web site at www.sec.gov and may be reviewed and copied at the SEC's Public Reference Room in Washington, DC. (Call 1-800-SEC-0330 for information on the operation of the Public Reference Room.) You may also access this information from the “Products” section of Federated's Web site at FederatedInvestors.com by clicking on “Portfolio Holdings” under “Related Information,” then selecting the appropriate link opposite the name of the Fund; or select the name of the Fund and from the Fund's page, click on the “Portfolio Holdings” link.
Annual Shareholder Report47
Mutual funds are not bank deposits or obligations, are not guaranteed by any bank and are not insured or guaranteed by the U.S. government, the Federal Deposit Insurance Corporation, the Federal Reserve Board or any other government agency. Investment in mutual funds involves investment risk, including the possible loss of principal.
This Report is authorized for distribution to prospective investors only when preceded or accompanied by the Fund's Prospectus, which contains facts concerning its objective and policies, management fees, expenses and other information.
Federated Capital Appreciation Fund
Federated Investors Funds
4000 Ericsson Drive
Warrendale, PA 15086-7561
Contact us at FederatedInvestors.com
or call 1-800-341-7400.
Federated Securities Corp., Distributor
Cusip 314172701
Cusip 314172800
Cusip 314172883
Cusip 314172594
G01649-04 (12/09)
Federated is a registered mark of Federated Investors, Inc.
2009 Federated Investors, Inc.
Federated Capital Appreciation Fund
A Portfolio of Federated Equity Funds
ANNUAL SHAREHOLDER REPORTOctober 31, 2009
Institutional Shares
FINANCIAL HIGHLIGHTS
SHAREHOLDER EXPENSE EXAMPLE
MANAGEMENT'S DISCUSSION OF FUND PERFORMANCE
PORTFOLIO OF INVESTMENTS SUMMARY TABLE
PORTFOLIO OF INVESTMENTS
STATEMENT OF ASSETS AND LIABILITIES
STATEMENT OF OPERATIONS
STATEMENT OF CHANGES IN NET ASSETS
NOTES TO FINANCIAL STATEMENTS
REPORT OF INDEPENDENT REGISTERED PUBLIC ACCOUNTING FIRM
BOARD OF TRUSTEES AND TRUST OFFICERS
EVALUATION AND APPROVAL OF ADVISORY CONTRACT
VOTING PROXIES ON FUND PORTFOLIO SECURITIES
QUARTERLY PORTFOLIO SCHEDULE
Financial Highlights - Institutional Shares
(For a Share Outstanding Throughout Each Period)
| Year
Ended
10/31/2009 | Period
Ended
10/31/20081 |
| Net Asset Value, Beginning of Period | $16.06 | $21.34 |
| Income From Investment Operations: | | |
| Net investment income | 0.182 | 0.152 |
| Net realized and unrealized gain (loss) on investments and foreign currency transactions | 0.11 | (5.43) |
| TOTAL FROM INVESTMENT OPERATIONS | 0.29 | (5.28) |
| Less Distributions: | | |
| Distributions from net investment income | (0.21) | — |
| Net Asset Value, End of Period | $16.14 | $16.06 |
| Total Return3 | 1.97% | (24.74)% |
| Ratios to Average Net Assets: | | |
| Net expenses | 0.96%4 | 0.96%4,5 |
| Net investment income | 1.22% | 0.93%5 |
| Expense waiver/reimbursement6 | 0.03% | 0.02%5 |
| Supplemental Data: | | |
| Net assets, end of period (000 omitted) | $211,470 | $75,775 |
| Portfolio turnover | 254% | 252%7 |
| 1 | Reflects operations for the period from December 31, 2007 (date of initial investment) to October 31, 2008. |
| 2 | Per share numbers have been calculated using the average shares method. |
| 3 | Based on net asset value, which does not reflect the sales charge, redemption fee or contingent deferred sales charge, if applicable. Total returns for periods of less than one year are not annualized. |
| 4 | The net expense ratio is calculated without reduction for expense offset arrangements. The net expense ratios are 0.95% and 0.94% for the year ended October 31, 2009 and period ended October 31, 2008, respectively, after taking into account these expense reductions. |
| 5 | Computed on an annualized basis. |
| 6 | This expense decrease is reflected in both the net expense and the net investment income ratios shown above. |
| 7 | Portfolio turnover is calculated at the Fund level. Percentage indicated was calculated for the year ended October 31, 2008. |
- See Notes which are an integral part of the Financial Statements
Annual Shareholder Report1
Shareholder Expense Example (unaudited)
As a shareholder of the Fund, you incur ongoing costs, including management fees and to the extent applicable, distribution (12b-1) fees and/or shareholder services fees and other Fund expenses. This Example is intended to help you to understand your ongoing costs (in dollars) of investing in the Fund and to compare these costs with the ongoing costs of investing in other mutual funds. It is based on an investment of $1,000 invested at the beginning of the period and held for the entire period from May 1, 2009 to October 31, 2009.
ACTUAL EXPENSES
The first section of the table below provides information about actual account values and actual expenses. You may use the information in this section, together with the amount you invested, to estimate the expenses that you incurred over the period. Simply divide your account value by $1,000 (for example, an $8,600 account value divided by $1,000 = 8.6), then multiply the result by the number in the first section under the heading entitled “Expenses Paid During Period” to estimate the expenses attributable to your investment during this period.
HYPOTHETICAL EXAMPLE FOR COMPARISON PURPOSES
The second section of the table below provides information about hypothetical account values and hypothetical expenses based on the Fund's actual expense ratio and an assumed rate of return of 5% per year before expenses, which is not the Fund's actual return. Thus, you should not use the hypothetical account values and expenses to estimate the actual ending account balance or your expenses for the period. Rather, these figures are required to be provided to enable you to compare the ongoing costs of investing in the Fund with other funds. To do so, compare this 5% hypothetical example with the 5% hypothetical examples that appear in the shareholder reports of the other funds.
Annual Shareholder Report2
Please note that the expenses shown in the table are meant to highlight your ongoing costs only. Therefore, the second section of the table is useful in comparing ongoing costs only, and will not help you determine the relative total costs of owning different funds. | Beginning
Account Value
5/1/2009 | Ending
Account Value
10/31/2009 | Expenses Paid
During Period1 |
| Actual | $1,000 | $1,131.00 | $5.05 |
| Hypothetical (assuming a 5% return before expenses) | $1,000 | $1,020.47 | $4.79 |
| 1 | Expenses are equal to the Fund's annualized net expense ratio of 0.94%, multiplied by the average account value over the period, multiplied by 184/365 (to reflect the one-half-year period). |
Annual Shareholder Report3
Performance data quoted represents past performance which is no guarantee of future results. Investment return and principal value will fluctuate so that an investor's shares, when redeemed, may be worth more or less than their original cost. Mutual fund performance changes over time and current performance may be lower or higher than what is stated. For current to the most recent month-end performance and after-tax returns, visit FederatedInvestors.com or call 1-800-341-7400.
Management's Discussion of Fund Performance (Unaudited)
PERFORMANCE OVERVIEW
During the 12-month reporting period ended October 31, 2009, the Fund's Institutional Shares produced a total return of 1.97% based on net asset value.
Stocks, as measured by the Standard & Poors 500 Index1 (S&P 500), rose 9.80% during the reporting period. Information Technology and Consumer Discretionary were the strongest performing sectors within the Index rising 31.5% and 20.8%, respectively. Materials (up 16.4%), and Consumer Staples (up 8.5%) were also strong performers within the S&P 500. Only one sector, Financials, had negative returns for the reporting period, down 7.2%.
The Fund underperformed its benchmark S&P 500, ranking in the 95th percentile out of 1,999 funds in the Large Cap Core Peer Group of Morningstar2 and the 98th percentile out of 908 funds in the Lipper Large Cap Core Peer Group3 for the 1-year period ending October 31, 2009. Nearly 80% of the relative underperformance was driven by stock selection, with the remaining coming from sector allocation. The Fund's relative performance was constrained by conservative stock selection within all sectors relative to the S&P 500, particularly in the Industrial and Technology sectors. Some conservative positions that aided performance in the downturn but did not rally in the recent upturn, and are still favored, include Kroger and Wal-Mart. Poor stock selection within the Health Care sector was also detrimental to performance.
| 1 | The S&P 500 Index is an unmanaged, capitalization-weighted index of 500 stocks designed to measure performance of the broad domestic economy through changes in the aggregate market value of 500 stocks representing all major industries. Investment cannot be made directly in an index. |
| 2 | Morningstar rankings are based on total return and do not take sales charges into account. For the 5- and 10-year time periods ending October 31, 2009, the fund ranked in the 31st percentile out of 1,352 funds and the 24th percentile out of 681 funds, respectively. 2009 Morningstar, Inc. All Rights Reserved. The information contained herein: (1) is proprietary to Morningstar and/or its content providers; (2) may not be copied or distributed; and (3) is not warranted to be accurate, complete or timely. Neither Morningstar nor its content providers are responsible for any damages or losses arising from any use of this information. Past performance is no guarantee of future results. |
| 3 | Past performance is no guarantee of future results. Lipper rankings are based on total return and do not take sales charges into account. |
Annual Shareholder Report4
The Fund outperformed the market in the downturn and was close to the market's performance at the start of the upturn. However, during the summer we became more conservative due to the rise in stock prices and our long-term concerns regarding consumer spending growth. The market continued to march upward, reflecting primarily excellent cost controls implemented by corporate management.The newly developed markets around the world have led worldwide economic growth in 2009 and, as such, have resulted in the economic recovery to be more industrial-based than consumer-oriented. At the Fund's fiscal year end, the Fund was overweight in the Industrial and Material sectors and underweight in the Financials sector. The Fund was tilted more toward growth stocks during the year, in line with the idea of looking for stable earnings growth with favorable valuation. The Fund's exposure to foreign stocks4 at the end of the fiscal year, through ADRs and stocks of listed ADRs, was approximately 15.14%.
The portfolio is constructed on a bottom up basis and is confirmed by top down factors when these factors are viewed as helpful. We analyze fundamentals, with emphasis on our forward growth rate, and weigh that against valuation parameters.
Top five positive contributors were: Goldman Sachs, EMC Corp, Darden Restaurants, Tyco International and Petro Brasileiro. Largest negative contributors were: PNC Financial, General Electric, Google Inc., Jetblue Airways and Medtronic.
| 4 | International investing involves special risks including currency risks, increased volatility of foreign securities, political risks and differences in auditing and other financial standards. Prices of emerging markets securities can be significantly more volatile than the prices of securities in developed countries, and currency risks and political risks are accentuated in emerging markets. |
Annual Shareholder Report5
GROWTH OF A $10,000 INVESTMENT - INSTITUTIONAL SHARES
The Fund's Institutional Shares commenced operations on December 31, 2007. The Fund offers four other classes of shares: Class A Shares, Class B Shares, Class C Shares and Class K Shares. For the period prior to the commencement of operations of the Institutional Shares, the performance information shown is for the Fund's Class A Shares, adjusted to reflect the expenses of Institutional Shares. The graph below illustrates the hypothetical investment of $10,0001 in Federated Capital Appreciation Fund (Institutional Shares) (the “Fund”) from October 31, 1999 to October 31, 2009, compared to the S&P 500 Index (S&P 500)2 and the Lipper Large-Cap Core Funds Average (LLCCFA).2
| Average Annual Total Returns for the Period Ended 10/31/2009 | |
| 1 Year | 1.97% |
| 5 Years | 1.33% |
| 10 Years | 1.48% |
Performance data quoted represents past performance which is no guarantee of future results. Investment return and principal value will fluctuate so that an investor's shares, when redeemed, may be worth more or less than their original cost. Mutual fund performance changes over time and current performance may be lower or higher than what is stated. For current to the most recent month-end performance and after-tax returns, visit FederatedInvestors.com or call 1-800-341-7400. Returns shown do not reflect the deduction of taxes that a shareholder would pay on Fund distributions or the redemption of Fund shares. Mutual funds are not obligations of or guaranteed by any bank and are not federally insured.
| 1 | Represents a hypothetical investment of $10,000 in the Fund. The Fund's performance assumes the reinvestment of all dividends and distributions. The S&P 500 and LLCCFA have been adjusted to reflect reinvestment of dividends on securities in the index and the average. |
| 2 | The S&P 500 is not adjusted to reflect sales loads, expenses or other fees that the Securities and Exchange Commission (SEC) requires to be reflected in the Fund's performance. The LLCCFA represents the average of the total returns reported by all of the mutual funds designated by Lipper, Inc. as falling into the category indicated, and is not adjusted to reflect any sales charges. However, these total returns are reported net of expenses or other fees that the SEC requires to be reflected in a fund's performance. The S&P 500 is unmanaged and, unlike the Fund, is not affected by cash flows. It is not possible to invest in an index or average. |
Annual Shareholder Report6
Portfolio of Investments Summary Table (unaudited)
At October 31, 2009, the Fund's sector composition1 was as follows:
| Sector Composition | Percentage of
Total Net Assets |
| Information Technology | 19.0% |
| Industrials | 12.5% |
| Consumer Staples | 12.3% |
| Energy | 11.9% |
| Financials | 11.9% |
| Health Care | 10.2% |
| Consumer Discretionary | 9.7% |
| Materials | 7.2% |
| Utilities | 2.4% |
| Cash Equivalents2 | 0.1% |
| Other Assets and Liabilities — Net3 | 2.8% |
| TOTAL | 100.0% |
| 1 | Except for Cash Equivalents and Other Assets and Liabilities, sector classifications are based upon, and individual portfolio securities are assigned to, the classifications of the Global Industry Classification Standard (GICS) except that the Adviser assigns a classification to securities not classified by the GICS and to securities for which the Adviser does not have access to the classification made by the GICS. |
| 2 | Cash Equivalents include any investments in money market mutual funds and/or overnight repurchase agreements. |
| 3 | Assets, other than investments in securities, less liabilities. See Statement of Assets and Liabilities. |
Annual Shareholder Report7
Portfolio of Investments
October 31, 2009
|
| Shares | | | Value |
| | Common Stocks – 97.1% | |
| | Consumer Discretionary – 9.7% | |
| 399,600 | | Advance Auto Parts, Inc. | 14,889,096 |
| 645,900 | 1 | Coach, Inc. | 21,295,323 |
| 502,900 | 1 | Gymboree Corp. | 21,408,453 |
| 818,600 | | Home Depot, Inc. | 20,538,674 |
| 743,700 | | Macy's, Inc. | 13,066,809 |
| 242,990 | | McDonald's Corp. | 14,241,644 |
| 659,500 | | Target Corp. | 31,939,585 |
| | TOTAL | 137,379,584 |
| | Consumer Staples – 12.3% | |
| 861,000 | | Avon Products, Inc. | 27,595,050 |
| 432,400 | | General Mills, Inc. | 28,503,808 |
| 589,400 | | Kellogg Co. | 30,377,676 |
| 1,854,700 | | Kroger Co. | 42,899,211 |
| 623,659 | | Nestle S.A. | 28,990,795 |
| 331,600 | | Wal-Mart Stores, Inc. | 16,473,888 |
| | TOTAL | 174,840,428 |
| | Energy – 11.9% | |
| 179,700 | | Apache Corp. | 16,913,364 |
| 292,900 | | CONSOL Energy, Inc. | 12,539,049 |
| 570,500 | | Chevron Corp. | 43,666,070 |
| 396,297 | | Exxon Mobil Corp. | 28,402,606 |
| 642,700 | | Schlumberger Ltd. | 39,975,940 |
| 168,200 | 1 | Transocean Ltd. | 14,113,662 |
| 347,650 | | XTO Energy, Inc. | 14,448,334 |
| | TOTAL | 170,059,025 |
| | Financials – 11.9% | |
| 371,400 | | Ace Ltd. | 19,075,104 |
| 163,600 | | Goldman Sachs Group, Inc. | 27,839,812 |
| 1,122,500 | | J.P. Morgan Chase & Co. | 46,886,825 |
| 235,500 | | Morgan Stanley | 7,564,260 |
| 428,900 | | T. Rowe Price Group, Inc. | 20,900,297 |
| 536,800 | | The Travelers Cos., Inc. | 26,727,272 |
| 909,400 | | U.S. Bancorp | 21,116,268 |
| | TOTAL | 170,109,838 |
Annual Shareholder Report8
|
| | Health Care – 10.2% | |
| 726,700 | | Abbott Laboratories | 36,749,219 |
| 492,000 | | Baxter International, Inc. | 26,597,520 |
| 481,500 | | Johnson & Johnson | 28,432,575 |
| 183,600 | | Merck & Co., Inc. | 5,678,748 |
| 1,286,800 | | Pfizer, Inc. | 21,914,204 |
| 373,000 | | Teva Pharmaceutical Industries Ltd., ADR | 18,829,040 |
| 276,900 | | UnitedHealth Group, Inc. | 7,185,555 |
| | TOTAL | 145,386,861 |
| | Industrials – 12.5% | |
| 196,400 | | 3M Co. | 14,449,148 |
| 193,600 | | FedEx Corp. | 14,072,784 |
| 72,500 | | Flowserve Corp. | 7,120,225 |
| 293,200 | | Fluor Corp. | 13,023,944 |
| 852,500 | | Norfolk Southern Corp. | 39,743,550 |
| 684,400 | | Raytheon Co. | 30,989,632 |
| 862,300 | | Tyco International Ltd. | 28,930,165 |
| 479,900 | | United Technologies Corp. | 29,489,855 |
| | TOTAL | 177,819,303 |
| | Information Technology – 19.0% | |
| 77,900 | 1 | Apple, Inc. | 14,684,150 |
| 1,470,000 | 1 | Broadcom Corp. | 39,116,700 |
| 1,106,900 | 1 | Cisco Systems, Inc. | 25,292,665 |
| 427,200 | 1 | EMC Corp. | 7,035,984 |
| 34,000 | 1 | Google Inc. | 18,228,080 |
| 783,100 | | Hewlett-Packard Co. | 37,165,926 |
| 299,000 | | IBM Corp. | 36,062,390 |
| 1,023,500 | | Intel Corp. | 19,559,085 |
| 492,900 | 1 | McAfee, Inc. | 20,642,652 |
| 1,025,600 | | Microsoft Corp. | 28,439,888 |
| 588,200 | | Qualcomm, Inc. | 24,357,362 |
| | TOTAL | 270,584,882 |
| | Materials – 7.2% | |
| 317,000 | | BHP Billiton Ltd., ADR | 20,788,860 |
| 743,900 | | Barrick Gold Corp. | 26,728,327 |
| 97,900 | | Freeport-McMoRan Copper & Gold, Inc. | 7,181,944 |
| 198,000 | | Potash Corp. of Saskatchewan, Inc. | 18,370,440 |
Annual Shareholder Report9
|
| 361,100 | | Praxair, Inc. | 28,685,784 |
| | TOTAL | 101,755,355 |
| | Utilities – 2.4% | |
| 388,100 | | Progress Energy, Inc. | 14,565,393 |
| 644,700 | | Southern Co. | 20,108,193 |
| | TOTAL | 34,673,586 |
| | TOTAL COMMON STOCKS
(IDENTIFIED COST $1,215,867,519) | 1,382,608,862 |
| | Mutual Fund – 0.1% | |
| 2,398,801 | 2,3 | Prime Value Obligations Fund, Institutional Shares, 0.22%
(AT NET ASSET VALUE) | 2,398,801 |
| | TOTAL INVESTMENTS — 97.2%
(IDENTIFIED COST $1,218,266,320)4 | 1,385,007,663 |
| | OTHER ASSETS AND LIABILITIES - NET — 2.8%5 | 39,265,568 |
| | TOTAL NET ASSETS — 100% | $1,424,273,231 |
- At October 31, 2009, the Fund had an outstanding foreign exchange contract as follows:
| Settlement Date | Foreign
Currency
Units to
Deliver | In
Exchange
For | Unrealized
Appreciation |
| Contract Sold: | | | |
| 11/2/2009 | 358,966 Swiss Francs | $ 352,792 | $ 2,889 |
- Unrealized Appreciation on the Foreign Exchange Contract is included in “Other Assets and Liabilities — Net.”
- Note: The categories of investments are shown as a percentage of total net assets at October 31, 2009.
- Various inputs are used in determining the value of the Fund's investments. These inputs are summarized in the three broad levels listed below:
- Level 1 — quoted prices in active markets for identical securities
- Level 2 — other significant observable inputs (including quoted prices for similar securities, interest rates, prepayment speeds, credit risk, etc.)
- Level 3 — significant unobservable inputs (including the Fund's own assumptions in determining the fair value of investments)
Annual Shareholder Report10
- The inputs or methodology used for valuing securities are not an indication of the risk associated with investing in those securities.
- The following is a summary of the inputs used, as of October 31, 2009, in valuing the Fund's assets carried at fair value:
| Valuation Inputs | | | | |
| Level 1 -
Quoted
Prices and
Investments in
Mutual Funds | Level 2 -
Other
Significant
Observable
Inputs | Level 3 -
Significant
Unobservable
Inputs | Total |
| Equity Securities: | | | | |
| Domestic | $1,166,806,529 | $ — | $ — | $1,166,806,529 |
| International | 186,811,538 | 28,990,795 | — | 215,802,333 |
| Mutual Fund | 2,398,801 | — | — | 2,398,801 |
| TOTAL SECURITIES | $1,356,016,868 | $28,990,795 | $ — | $1,385,007,663 |
| OTHER FINANCIAL INSTRUMENTS* | $2,889 | $ — | $ — | $2,889 |
| * | Other financial instruments include a foreign exchange contract. |
- The following acronym is used throughout this portfolio:
- ADR — American Depositary Receipt
- See Notes which are an integral part of the Financial Statements
Annual Shareholder Report11
Statement of Assets and Liabilities
October 31, 2009
| Assets: | | |
| Total investments in securities, at value including $2,398,801 of investments in an affiliated issuer (Note 5) (identified cost $1,218,266,320) | | $1,385,007,663 |
| Cash | | 176,317 |
| Income receivable | | 2,174,414 |
| Receivable for investments sold | | 50,461,302 |
| Receivable for shares sold | | 1,217,706 |
| Receivable for foreign exchange contracts | | 2,889 |
| TOTAL ASSETS | | 1,439,040,291 |
| Liabilities: | | |
| Payable for investments purchased | $10,908,027 | |
| Payable for shares redeemed | 2,516,114 | |
| Payable for Directors'/Trustees' fees | 4,209 | |
| Payable for distribution services fee (Note 5) | 173,083 | |
| Payable for shareholder services fee (Note 5) | 590,864 | |
| Accrued expenses | 574,763 | |
| TOTAL LIABILITIES | | 14,767,060 |
| Net assets for 89,119,695 shares outstanding | | $1,424,273,231 |
| Net Assets Consist of: | | |
| Paid-in capital | | $1,639,806,688 |
| Net unrealized appreciation of investments and translation of assets and liabilities in foreign currency | | 166,758,636 |
| Accumulated net realized loss on investments, foreign currency transactions, futures contracts and written option contracts | | (391,508,562) |
| Undistributed net investment income | | 9,216,469 |
| TOTAL NET ASSETS | | $1,424,273,231 |
Annual Shareholder Report12
Statement of Assets and Liabilities — continued| Net Asset Value, Offering Price and Redemption Proceeds Per Share | | |
| Class A Shares: | | |
| Net asset value per share ($943,921,582 ÷ 58,516,596 shares outstanding), no par value, unlimited shares authorized | | $16.13 |
| Offering price per share (100/94.50 of $16.13) | | $17.07 |
| Redemption proceeds per share | | $16.13 |
| Class B Shares: | | |
| Net asset value per share ($163,826,985 ÷ 10,690,921 shares outstanding), no par value, unlimited shares authorized | | $15.32 |
| Offering price per share | | $15.32 |
| Redemption proceeds per share (94.50/100 of $15.32) | | $14.48 |
| Class C Shares: | | |
| Net asset value per share ($83,059,745 ÷ 5,432,515 shares outstanding), no par value, unlimited shares authorized | | $15.29 |
| Offering price per share | | $15.29 |
| Redemption proceeds per share (99.00/100 of $15.29) | | $15.14 |
| Class K Shares: | | |
| Net asset value per share ($21,994,497 ÷ 1,380,218 shares outstanding), no par value, unlimited shares authorized | | $15.94 |
| Offering price per share | | $15.94 |
| Redemption proceeds per share | | $15.94 |
| Institutional Shares: | | |
| Net asset value per share ($211,470,422 ÷ 13,099,445 shares outstanding), no par value, unlimited shares authorized | | $16.14 |
| Offering price per share | | $16.14 |
| Redemption proceeds per share | | $16.14 |
- See Notes which are an integral part of the Financial Statements
Annual Shareholder Report13
Statement of Operations
Year Ended October 31, 2009
| Investment Income: | | | |
| Dividends (including $764,043 received from an affiliated issuer (Note 5) and net of foreign taxes withheld of $474,464) | | | $30,400,069 |
| Interest | | | 910,450 |
| TOTAL INCOME | | | 31,310,519 |
| Expenses: | | | |
| Investment adviser fee (Note 5) | | $10,087,429 | |
| Administrative personnel and services fee (Note 5) | | 1,044,126 | |
| Custodian fees | | 67,047 | |
| Transfer and dividend disbursing agent fees and expenses — Class A Shares | | 1,652,754 | |
| Transfer and dividend disbursing agent fees and expenses — Class B Shares | | 413,273 | |
| Transfer and dividend disbursing agent fees and expenses — Class C Shares | | 163,120 | |
| Transfer and dividend disbursing agent fees and expenses — Class K Shares | | 94,414 | |
| Transfer and dividend disbursing agent fees and expenses — Institutional Shares | | 169,278 | |
| Directors'/Trustees' fees | | 12,499 | |
| Auditing fees | | 27,999 | |
| Legal fees | | 6,226 | |
| Portfolio accounting fees | | 189,198 | |
| Distribution services fee — Class B Shares (Note 5) | | 1,323,254 | |
| Distribution services fee — Class C Shares (Note 5) | | 604,587 | |
| Distribution services fee — Class K Shares (Note 5) | | 136,011 | |
| Shareholder services fee — Class A Shares (Note 5) | | 2,157,055 | |
| Shareholder services fee — Class B Shares (Note 5) | | 441,085 | |
| Shareholder services fee — Class C Shares (Note 5) | | 197,129 | |
| Account administration fee — Class A Shares | | 48,670 | |
| Account administration fee — Class C Shares | | 2,297 | |
| Share registration costs | | 90,940 | |
| Printing and postage | | 144,052 | |
| Insurance premiums | | 8,165 | |
| Miscellaneous | | 10,306 | |
| TOTAL EXPENSES | | 19,090,914 | |
Annual Shareholder Report14
Statement of Operations — continued| Waiver, Reimbursements and Expense Reduction: | | | |
| Reimbursement of investment adviser fee (Note 5) | $(69,879) | | |
| Waiver of administrative personnel and services fee (Note 5) | (20,588) | | |
| Reimbursement of shareholder services fee — Class A Shares (Note 5) | (464,794) | | |
| Reimbursement of transfer and dividend disbursing agent fees and expenses — Class A Shares (Note 5) | (59,838) | | |
| Reimbursement of transfer and dividend disbursing agent fees and expenses — Institutional Shares (Note 5) | (14,731) | | |
| Fees paid indirectly from directed brokerage arrangements (Note 6) | (154,693) | | |
| TOTAL WAIVER, REIMBURSEMENTS AND EXPENSE REDUCTION | | $(784,523) | |
| Net expenses | | | $18,306,391 |
| Net investment income | | | 13,004,128 |
| Realized and Unrealized Gain (Loss) on Investments and Foreign Currency Transactions: | | | |
| Net realized loss on investments and foreign currency transactions | | | (208,647,386) |
| Net change in unrealized depreciation of investments and translation of assets and liabilities in foreign currency | | | 228,599,747 |
| Net realized and unrealized gain on investments and foreign currency transactions | | | 19,952,361 |
| Change in net assets resulting from operations | | | $32,956,489 |
- See Notes which are an integral part of the Financial Statements
Annual Shareholder Report15
Statement of Changes in Net Assets
| Year Ended October 31 | 2009 | 2008 |
| Increase (Decrease) in Net Assets | | |
| Operations: | | |
| Net investment income | $13,004,128 | $11,654,580 |
| Net realized loss on investments and foreign currency transactions | (208,647,386) | (165,689,372) |
| Net change in unrealized appreciation/depreciation of investments and translation of assets and liabilities in foreign currency | 228,599,747 | (384,676,782) |
| CHANGE IN NET ASSETS RESULTING FROM OPERATIONS | 32,956,489 | (538,711,574) |
| Distributions to Shareholders: | | |
| Distributions from net investment income | | |
| Class A Shares | (9,327,315) | (9,287,303) |
| Class B Shares | (582,124) | — |
| Class C Shares | (406,255) | — |
| Class K Shares | (388,347) | (56,795) |
| Institutional Shares | (1,568,758) | — |
| Distributions from net realized gain on investments and foreign currency transactions | | |
| Class A Shares | — | (280,652,380) |
| Class B Shares | — | (85,611,210) |
| Class C Shares | — | (29,312,332) |
| Class K Shares | — | (3,928,786) |
| CHANGE IN NET ASSETS RESULTING FROM DISTRIBUTIONS TO SHAREHOLDERS | (12,272,799) | (408,848,806) |
| Share Transactions: | | |
| Proceeds from sale of shares | 528,867,667 | 481,922,779 |
| Proceeds from shares issued in connection with the tax-free transfer of assets from Suburban Common Trust Fund | 4,843,111 | — |
| Proceeds from shares issued in connection with the tax-free transfer of assets from Clearfield Bank Common Trust Fund | 2,596,634 | — |
| Proceeds from shares issued in connection with the tax-free transfer of assets from Central Bank Core Equity Fund | — | 42,103,041 |
| Net asset value of shares issued to shareholders in payment of distributions declared | 9,337,834 | 359,161,924 |
| Cost of shares redeemed | (505,968,842) | (593,249,539) |
| CHANGE IN NET ASSETS RESULTING FROM SHARE TRANSACTIONS | 39,676,404 | 289,938,205 |
| Change in net assets | 60,360,094 | (657,622,175) |
| Net Assets: | | |
| Beginning of period | 1,363,913,137 | 2,021,535,312 |
| End of period (including undistributed net investment income of $9,216,469 and $8,601,294, respectively) | $1,424,273,231 | $1,363,913,137 |
- See Notes which are an integral part of the Financial Statements
Annual Shareholder Report16
Notes to Financial Statements
October 31, 2009
1. ORGANIZATION
Federated Equity Funds (the “Trust”) is registered under the Investment Company Act of 1940, as amended (the “Act”), as an open-end management investment company. The Trust consists of 13 portfolios. The financial statements included herein are only those of Federated Capital Appreciation Fund (the “Fund”), a diversified portfolio. The financial statements of the other portfolios are presented separately. The assets of each portfolio are segregated and a shareholder's interest is limited to the portfolio in which shares are held. Each portfolio pays its own expenses. The Fund offers five classes of shares: Class A Shares, Class B Shares, Class C Shares, Class K Shares and Institutional Shares. All shares of the Fund have equal rights with respect to voting, except on class-specific matters. The financial highlights of the Class A Shares, Class B Shares, Class C Shares and Class K Shares are presented separately. The investment objective of the Fund is to provide capital appreciation.
Effective December 31, 2007, the Fund began offering Institutional Shares.
On December 19, 2008, the Fund received assets from Suburban Common Trust Fund as a result of a tax-free reorganization, as follows:
Shares of the
Fund Issued | Suburban
Common
Trust Fund
Net Assets
Received | Unrealized
Depreciation1 | Net Assets
of the Fund
Immediately
Prior to
Combination | Net Assets
of the Fund
Immediately
After
Combination |
| 324,388 | $4,843,111 | $(2,305,234) | $1,294,808,821 | $1,299,651,932 |
| 1 | Unrealized Depreciation is included in the Suburban Common Trust Fund Net Assets Received amount shown above. |
On November 14, 2008, the Fund received assets from Clearfield Bank Common Trust Fund as a result of a tax-free reorganization, as follows:
Shares of the
Fund Issued | Clearfield
Bank
Common
Trust Fund
Net Assets
Received | Unrealized
Appreciation1 | Net Assets
of the Fund
Immediately
Prior to
Combination | Net Assets
of the Fund
Immediately
After
Combination |
| 175,330 | $2,596,634 | $206,477 | $1,262,255,683 | $1,264,852,317 |
| 1 | Unrealized Appreciation is included in the Clearfield Bank Common Trust Fund Net Assets Received amount shown above. |
Annual Shareholder Report17
On May 9, 2008, the Fund received assets from Central Bank Core Equity Fund as a result of a tax-free reorganization, as follows:
Shares of the
Fund Issued | Central
Bank
Core Equity
Fund Net
Assets
Received | Unrealized
Appreciation1 | Net Assets
of the Fund
Immediately
Prior to
Combination | Net Assets
of the Fund
Immediately
After
Combination |
| 2,017,395 | $42,103,041 | $8,921,086 | $1,762,228,108 | $1,804,331,149 |
| 1 | Unrealized Appreciation is included in the Central Bank Core Equity Fund Net Assets Received amount shown above. |
2. SIGNIFICANT ACCOUNTING POLICIES
The following is a summary of significant accounting policies consistently followed by the Fund in the preparation of its financial statements. These policies are in conformity with U.S. generally accepted accounting principles (GAAP).
Investment Valuation
In calculating its net asset value (NAV), the Fund generally values investments as follows:
- Equity securities listed on an exchange or traded through a regulated market system are valued at their last reported sale price or official closing price in their principal exchange or market.
- Shares of other mutual funds are valued based upon their reported NAVs.
- Derivative contracts listed on exchanges are valued at their reported settlement or closing price.
- Over-the-counter (OTC) derivative contracts are fair valued using price evaluations provided by a pricing service approved by the Board of Trustees (the “Trustees”).
- Fixed-income securities acquired with remaining maturities greater than 60 days are fair valued using price evaluations provided by a pricing service approved by the Trustees.
- Fixed-income securities acquired with remaining maturities of 60 days or less are valued at their cost (adjusted for the accretion of any discount or amortization of any premium).
If the Fund cannot obtain a price or price evaluation from a pricing service for an investment, the Fund may attempt to value the investment based upon the mean of bid and asked quotations or fair value the investment based on price evaluations, from one or more dealers. If any price, quotation, price evaluation or other pricing source is not readily available when the NAV is calculated, the Fund uses the fair value of the investment determined in accordance with the procedures described below. There can be no assurance that the Fund could purchase or sell an investment at the price used to calculate the Fund's NAV.
Fair Valuation and Significant Events Procedures
The Trustees have authorized the use of pricing services to provide evaluations of the current fair value of certain investments for purposes of calculating the NAV. Factors considered by pricing services in evaluating an investment include the yields or prices of investments of comparable quality, coupon, maturity, call rights and other potential prepayments, terms and type, reported transactions, indications as to values from dealers and general market conditions. Some pricing services provide a single price evaluation reflecting the bid-side of the market for an investment (a “bid” evaluation). Other pricing services offer both bid evaluations and price evaluations indicative of a price between the prices bid and asked for the investment (a “mid” evaluation). The Fund normally uses bid evaluations for U.S. Treasury Annual Shareholder Report18
and Agency securities and mortgage-backed securities. The Fund normally uses mid evaluations for other types of fixed-income securities and OTC derivative contracts. In the event that market quotations and price evaluations are not available for an investment, the fair value of the investment is determined in accordance with procedures adopted by the Trustees.The Trustees also have adopted procedures requiring an investment to be priced at its fair value whenever the Adviser determines that a significant event affecting the value of the investment has occurred between the time as of which the price of the investment would otherwise be determined and the time as of which the NAV is computed. An event is considered significant if there is both an affirmative expectation that the investment's value will change in response to the event and a reasonable basis for quantifying the resulting change in value. Examples of significant events that may occur after the close of the principal market on which a security is traded, or after the time of a price evaluation provided by a pricing service or a dealer, include:
- With respect to securities traded in foreign markets, significant trends in U.S. equity markets or in the trading of foreign securities index futures or options contracts;
- With respect to price evaluations of fixed-income securities determined before the close of regular trading on the NYSE, actions by the Federal Reserve Open Market Committee and other significant trends in U.S. fixed-income markets;
- Political or other developments affecting the economy or markets in which an issuer conducts its operations or its securities are traded; and
- Announcements concerning matters such as acquisitions, recapitalizations, litigation developments, a natural disaster affecting the issuer's operations or regulatory changes or market developments affecting the issuer's industry.
The Trustees have approved the use of a pricing service to determine the fair value of equity securities traded principally in foreign markets when the Adviser determines that there has been a significant trend in the U.S. equity markets or in index futures trading. For other significant events, the Fund may seek to obtain more current quotations or price evaluations from alternative pricing sources. If a reliable alternative pricing source is not available, the Fund will determine the fair value of the investment using another method approved by the Trustees.
Repurchase Agreements
It is the policy of the Fund to require the other party to a repurchase agreement to transfer to the Fund's custodian or sub-custodian eligible securities or cash with a market value (after transaction costs) at least equal to the repurchase price to be paid under the repurchase agreement. The eligible securities are transferred to accounts with the custodian or sub-custodian in which the Fund holds a “securities entitlement” and exercises “control” as those terms are defined in the Uniform Commercial Code. The Fund has established procedures for monitoring the market value of the transferred securities and requiring the transfer of additional eligible securities if necessary to equal at least the repurchase price. These procedures also allow the other party to require securities to be transferred from the account to the extent that their market value exceeds the repurchase price or in exchange for other eligible securities of equivalent market value.
With respect to agreements to repurchase U.S. government securities and cash items, the Fund treats the repurchase agreement as an investment in the underlying securities and not as an obligation of the other party to the repurchase agreement. Other repurchase agreements are treated as obligations of the other party secured by the underlying securities. Nevertheless, the insolvency of the other party or other failure to repurchase the securities Annual Shareholder Report19
may delay the disposition of the underlying securities or cause the Fund to receive less than the full repurchase price. Under the terms of the repurchase agreement, any amounts received by the Fund in excess of the repurchase price and related transaction costs must be remitted to the other party.The Fund may enter into repurchase agreements in which eligible securities are transferred into joint trading accounts maintained by the custodian or sub-custodian for investment companies and other clients advised by the Fund's Adviser and its affiliates. The Fund will participate on a pro rata basis with the other investment companies and clients in its share of the securities transferred under such repurchase agreements and in its share of proceeds from any repurchase or other disposition of such securities.
Investment Income, Gains and Losses, Expenses and Distributions
Investment transactions are accounted for on a trade-date basis. Realized gains and losses from investment transactions are recorded on an identified-cost basis. Interest income and expenses are accrued daily. Dividend income and distributions to shareholders are recorded on the ex-dividend date. Foreign dividends are recorded on the ex-dividend date or when the Fund is informed of the ex-dividend date. Distributions of net investment income are declared and paid annually. Non-cash dividends included in dividend income, if any, are recorded at fair value. Investment income, realized and unrealized gains and losses and certain fund-level expenses are allocated to each class based on relative average daily net assets, except that Institutional Shares, Class A Shares, Class B Shares, Class C Shares and Class K Shares may bear distribution services fees, shareholder services fees, account administration fees and certain transfer and dividend disbursing agent fees unique to those classes. Dividends are declared separately for each class. No class has preferential dividend rights; differences in per-share dividend rates are generally due to differences in separate class expenses.
Premium and Discount Amortization
All premiums and discounts on fixed-income securities are amortized/accreted for financial statement purposes.
Federal Taxes
It is the Fund's policy to comply with the Subchapter M provision of the Internal Revenue Code (the “Code”) and to distribute to shareholders each year substantially all of its income. Accordingly, no provision for federal income tax is necessary. As of and during the year ended October 31, 2009, the Fund did not have a liability for any uncertain tax positions. The Fund recognizes interest and penalties, if any, related to tax liabilities as income tax expense in the Statement of Operations. As of October 31, 2009, tax years 2006 through 2009 remain subject to examination by the Fund's major tax jurisdictions, which include the United States of America and the Commonwealth of Massachusetts.
The Fund may be subject to taxes imposed by governments of countries in which it invests. Such taxes are generally based on either income or gains earned or repatriated. The Fund accrues and applies such taxes to net investment income, net realized gains and net unrealized gains as income and/or gains are earned.
Annual Shareholder Report20
When-Issued and Delayed Delivery TransactionsThe Fund may engage in when-issued or delayed delivery transactions. The Fund records when-issued securities on the trade date and maintains security positions such that sufficient liquid assets will be available to make payment for the securities purchased. Securities purchased on a when-issued or delayed delivery basis are marked to market daily and begin earning interest on the settlement date. Losses may occur on these transactions due to changes in market conditions or the failure of counterparties to perform under the contract.
Foreign Exchange Contracts
The Fund may enter into foreign exchange contracts for the delayed delivery of securities or foreign currency exchange transactions. The Fund may enter into foreign exchange contracts to protect assets against adverse changes in foreign currency exchange rates or exchange control regulations. Purchased contracts are used to acquire exposure to foreign currencies, whereas, contracts to sell are used to hedge the Fund's securities against currency fluctuations. Risks may arise upon entering into these transactions from the potential inability of counterparties to meet the terms of their commitments and from unanticipated movements in security prices or foreign exchange rates. The foreign exchange contracts are adjusted by the daily exchange rate of the underlying currency and any gains or losses are recorded for financial statement purposes as unrealized until the settlement date.
Foreign exchange contracts outstanding at period end are listed after the Fund's Portfolio of Investments.
Foreign Currency Translation
The accounting records of the Fund are maintained in U.S. dollars. All assets and liabilities denominated in foreign currencies (FCs) are translated into U.S. dollars based on the rates of exchange of such currencies against U.S. dollars on the date of valuation. Purchases and sales of securities, income and expenses are translated at the rate of exchange quoted on the respective date that such transactions are recorded. The Fund does not isolate that portion of the results of operations resulting from changes in foreign exchange rates on investments from the fluctuations arising from changes in market prices of securities held. Such fluctuations are included with the net realized and unrealized gain or loss from investments.
Reported net realized foreign exchange gains or losses arise from sales of portfolio securities, sales and maturities of short-term securities, sales of FCs, currency gains or losses realized between the trade and settlement dates on securities transactions, the difference between the amounts of dividends, interest and foreign withholding taxes recorded on the Fund's books, and the U.S. dollar equivalent of the amounts actually received or paid. Net unrealized foreign exchange gains and losses arise from changes in the value of assets and liabilities other than investments in securities at fiscal year end, resulting from changes in the exchange rate.
Annual Shareholder Report21
Additional Disclosure Related to Derivative Instruments| Fair Value of Derivative Instruments |
| Asset | Liability |
| Statement of
Assets and
Liabilities
Location | Fair
Value | Statement of
Assets and
Liabilities
Location | Fair
Value |
| Derivatives not accounted for as hedging instruments under ASC Topic 815 | | | | |
| Foreign exchange contracts | Receivable for foreign exchange contracts | $2,889 | — | — |
The Effect of Derivative Instruments on the Statement of Operations for the Year Ended October 31, 2009
| Amount of Realized Gain or (Loss) on Derivatives Recognized in Income |
| Forward
Currency
Contracts |
| Foreign exchange contracts | $1,424 |
| Change in Unrealized Appreciation or (Depreciation) on Derivatives Recognized in Income |
| Forward
Currency
Contracts |
| Foreign exchange contracts | $43,221 |
Other
The preparation of financial statements in conformity with GAAP requires management to make estimates and assumptions that affect the amounts of assets, liabilities, expenses and revenues reported in the financial statements. Actual results could differ from those estimated.
3. SHARES OF BENEFICIAL INTEREST
The following tables summarize share activity:
| Year Ended October 31 | 2009 | 2008 |
| Class A Shares: | Shares | Amount | Shares | Amount |
| Shares sold | 20,847,863 | $307,583,080 | 16,853,104 | $336,236,946 |
| Shares issued to shareholders in payment of distributions declared | 535,205 | 7,781,880 | 11,739,668 | 249,902,539 |
| Shares redeemed | (21,476,847) | (317,973,196) | (20,931,618) | (419,767,400) |
NET CHANGE RESULTING
FROM CLASS A SHARE TRANSACTIONS | (93,779) | $(2,608,236) | 7,661,154 | $166,372,085 |
Annual Shareholder Report22
| Year Ended October 31 | 2009 | 2008 |
| Class B Shares: | Shares | Amount | Shares | Amount |
| Shares sold | 857,656 | $12,075,453 | 791,872 | $15,361,782 |
| Shares issued to shareholders in payment of distributions declared | 39,608 | 551,341 | 3,969,781 | 80,388,061 |
| Shares redeemed | (4,715,500) | (66,134,508) | (5,889,752) | (112,993,395) |
NET CHANGE RESULTING
FROM CLASS B SHARE TRANSACTIONS | (3,818,236) | $(53,507,714) | (1,128,099) | $(17,243,552) |
| Year Ended October 31 | 2009 | 2008 |
| Class C Shares: | Shares | Amount | Shares | Amount |
| Shares sold | 1,503,629 | $21,060,246 | 1,340,717 | $25,824,322 |
| Shares issued to shareholders in payment of distributions declared | 24,411 | 338,825 | 1,234,167 | 24,967,189 |
| Shares redeemed | (1,911,514) | (26,567,911) | (2,099,452) | (40,351,015) |
NET CHANGE RESULTING
FROM CLASS C SHARE TRANSACTIONS | (383,474) | $(5,168,840) | 475,432 | $10,440,496 |
| Year Ended October 31 | 2009 | 2008 |
| Class K Shares: | Shares | Amount | Shares | Amount |
| Shares sold | 949,009 | $13,781,255 | 2,119,876 | $43,230,665 |
| Shares issued to shareholders in payment of distributions declared | 26,460 | 381,815 | 184,818 | 3,904,135 |
| Shares redeemed | (2,057,137) | (29,288,403) | (549,210) | (10,724,702) |
NET CHANGE RESULTING
FROM CLASS K SHARE TRANSACTIONS | (1,081,668) | $(15,125,333) | 1,755,484 | $36,410,098 |
Annual Shareholder Report23
| Year Ended
10/31/2009 | Period Ended
10/31/20081 |
| Institutional Shares: | Shares | Amount | Shares | Amount |
| Shares sold | 12,046,730 | $174,367,633 | 3,186,759 | $61,269,064 |
| Proceeds from shares issued in connection with the tax-free transfer of assets from Suburban Common Trust Fund | 324,388 | 4,843,111 | — | — |
| Proceeds from shares issued in connection with the tax-free transfer of assets from Clearfield Bank Common Trust Fund | 175,330 | 2,596,634 | — | — |
| Proceeds from shares issued in connection with the tax-free transfer of assets from Central Bank Core Equity Fund | — | — | 2,017,395 | 42,103,041 |
| Shares issued to shareholders in payment of distributions declared | 19,543 | 283,973 | — | — |
| Shares redeemed | (4,184,146) | (66,004,824) | (486,554) | (9,413,027) |
NET CHANGE RESULTING
FROM INSTITUTIONAL SHARE TRANSACTIONS | 8,381,845 | $ 116,086,527 | 4,717,600 | $93,959,078 |
| NET CHANGE RESULTING FROM FUND SHARE TRANSACTIONS | 3,004,688 | $ 39,676,404 | 13,481,571 | $289,938,205 |
| 1 | Reflects operations for the period from December 31, 2007 (date of initial investment) to October 31, 2008. |
4. FEDERAL TAX INFORMATION
The timing and character of income and capital gain distributions are determined in accordance with income tax regulations, which may differ from GAAP. These differences are attributable in part to reclass of gain (loss) on foreign exchange contracts, expiration of capital loss carryforwards and reclassification for regulatory settlement proceeds.
For the year ended October 31, 2009, permanent differences identified and reclassified among the components of net assets were as follows:
| Increase (Decrease) |
| Paid-In Capital | Undistributed
Net Investment
Income (Loss) | Accumulated
Net Realized
Gain (Loss) |
| $(4,147,107) | $(116,154) | $4,263,261 |
Net investment income (loss), net realized gains (losses), and net assets were not affected by this reclassification.
Annual Shareholder Report24
The tax character of distributions as reported on the Statement of Changes in Net Assets for the years ended October 31, 2009 and 2008, was as follows: | 2009 | 2008 |
| Ordinary income1 | $12,272,799 | $166,975,138 |
| Long-term capital gains | $ — | $241,873,668 |
| 1 | For tax purposes, short-term capital gain distributions are considered ordinary income distributions. |
As of October 31, 2009, the components of distributable earnings on a tax basis were as follows:
| Undistributed ordinary income | $9,216,469 |
| Net unrealized appreciation | $144,907,395 |
| Capital loss carryforwards | $(369,657,321) |
The difference between book-basis and tax-basis net unrealized appreciation/depreciation is attributable to differing treatments for the deferral of losses on wash sales.
At October 31, 2009, the cost of investments for federal tax purposes was $1,240,117,561. The net unrealized appreciation of investments for federal tax purposes excluding any unrealized appreciation resulting from changes in foreign currency exchange rates and outstanding foreign currency commitments was $144,890,102. This consists of net unrealized appreciation from investments for those securities having an excess of value over cost of $162,102,044 and net unrealized depreciation from investments for those securities having an excess of cost over value of $17,211,942.
At October 31, 2009, the Fund had a capital loss carryforward of $369,657,321 which will reduce the Fund's taxable income arising from future net realized gains on investments, if any, to the extent permitted by the Code and thus will reduce the amount of distributions to shareholders which would otherwise be necessary to relieve the Fund of any liability for federal income tax. Pursuant to the Code, such capital loss carryforward will expire as follows:
| Expiration Year | Expiration Amount |
| 2010 | $2,978,206 |
| 2011 | $978,641 |
| 2012 | $1,306,623 |
| 2016 | $110,598,251 |
| 2017 | $253,795,600 |
As a result of the tax-free transfer of assets from Vintage Growth Fund certain capital loss carryforwards listed above may be limited.
Capital loss carryforwards of $5,129,844 expired during the year ended October 31, 2009.
Annual Shareholder Report25
5. INVESTMENT ADVISER FEE AND OTHER TRANSACTIONS WITH AFFILIATESInvestment Adviser Fee
Federated Equity Management Company of Pennsylvania is the Fund's investment adviser (the “Adviser”). The advisory agreement between the Fund and the Adviser provides for an annual fee equal to 0.75% of the Fund's average daily net assets. Subject to the terms described in the Expense Limitation note, the Adviser may voluntarily choose to waive any portion of its fee. The Adviser can modify or terminate this voluntary waiver at any time at its sole discretion. For the year ended October 31, 2009, an affiliate of the adviser reimbursed $74,569 of transfer and dividend disbursing agent fees and expenses.
Administrative Fee
Federated Administrative Services (FAS), under the Administrative Services Agreement, provides the Fund with administrative personnel and services. The fee paid to FAS is based on the average aggregate daily net assets of certain Federated funds as specified below:
| Administrative Fee | Average Aggregate Daily Net Assets
of the Federated Funds |
| 0.150% | on the first $5 billion |
| 0.125% | on the next $5 billion |
| 0.100% | on the next $10 billion |
| 0.075% | on assets in excess of $20 billion |
The administrative fee received during any fiscal year shall be at least $150,000 per portfolio and $40,000 per each additional class of Shares. Subject to the terms described in the Expense Limitation note, FAS may voluntarily choose to waive any portion of its fee. FAS can modify or terminate this voluntary waiver at any time at its sole discretion. For the year ended October 31, 2009, the net fee paid to FAS was 0.076% of average daily net assets of the Fund. FAS waived $20,588 of its fee.
Distribution Services Fee
The Fund has adopted a Distribution Plan (the “Plan”) pursuant to Rule 12b-1 under the Act. Under the terms of the Plan, the Fund will compensate Federated Securities Corp. (FSC), the principal distributor, from the daily net assets of the Fund's Class A Shares, Class B Shares, Class C Shares and Class K Shares to finance activities intended to result in the sale of these shares. The Plan provides that the Fund may incur distribution expenses at the following percentages of average daily net assets annually, to compensate FSC:
| Share Class Name | Percentage of Average Daily
Net Assets of Class |
| Class A Shares | 0.05% |
| Class B Shares | 0.75% |
| Class C Shares | 0.75% |
| Class K Shares | 0.50% |
Annual Shareholder Report26
Subject to the terms described in the Expense Limitation note, FSC may voluntarily choose to waive any portion of its fee. FSC can modify or terminate this voluntary waiver at any time at its sole discretion. When FSC receives fees, it may pay some or all of them to financial intermediaries whose customers purchase shares. For the year ended October 31, 2009, FSC retained $57,554 of fees paid by the Fund. For the year ended October 31, 2009, the Fund's Class A Shares did not incur a distribution services fee; however it may begin to incur this fee upon approval of the Trustees.
Sales Charges
Front-end sales charges and contingent deferred sales charges (CDSC) do not represent expenses of the Fund. They are deducted from the proceeds of sales of Fund shares prior to investment or from redemption proceeds prior to remittance, as applicable. For the year ended October 31, 2009, FSC retained $86,541 in sales charges from the sale of Class A Shares. FSC also retained $2,571 of CDSC relating to redemptions of Class A Shares and $3,420 relating to redemptions of Class C Shares.
Shareholder Services Fee
The Fund may pay fees (Service Fees) up to 0.25% of the average daily net assets of the Fund's Class A Shares, Class B Shares and Class C Shares to financial intermediaries or to Federated Shareholder Services Company (FSSC) for providing services to shareholders and maintaining shareholder accounts. Financial intermediaries may include a company affiliated with management of Federated Investors, Inc. A financial intermediary affiliated with management of Federated Investors, Inc. received $10,438 of Service Fees for the year ended October 31, 2009. Subject to the terms described in the Expense Limitation note, FSSC may voluntarily reimburse the Fund for shareholder services fees. This voluntary reimbursement can be modified or terminated at any time. For the year ended October 31, 2009, FSSC voluntarily reimbursed $464,794 of shareholder services fees. For the year ended October 31, 2009, FSSC did not receive any fees paid by the Fund.
Interfund Transactions
During the year ended October 31, 2009, the Fund engaged in purchase and sale transactions with funds that have a common investment adviser (or affiliated investment advisers), common Directors/Trustees, and/or common Officers. These purchase and sale transactions complied with Rule 17a-7 under the Act and amounted to $1,572,922 and $1,236,733, respectively.
Expense Limitation
The Adviser and its affiliates (which may include FSC, FAS and FSSC) have voluntarily agreed to waive their fees and/or reimburse expenses so that the total operating expenses (as shown in the financial highlights) paid by the Fund's Class A Shares, Class B Shares, Class C Shares, Class K Shares and Institutional Shares (after the voluntary waivers and reimbursements) will not exceed 1.24%, 2.10%, 2.06%, 1.71% and 0.96%, respectively, through the later of (the “Termination Date”): (a) December 31, 2010; or (b) the date of the Fund's next effective Prospectus. While the Adviser and its affiliates currently do not anticipate terminating these arrangements prior to the Termination Date, these arrangements may only be terminated prior to the Termination Date with the agreement of the Fund's Board of Trustees.
General
Certain Officers and Trustees of the Fund are Officers and Directors or Trustees of the above companies.
Annual Shareholder Report27
Transactions with Affiliated CompaniesAffiliated holdings are mutual funds which are managed by the Adviser or an affiliate of the Adviser. The Adviser has agreed to reimburse the Fund for certain investment adviser fees as a result of transactions in other affiliated mutual funds. For the year ended October 31, 2009, the Adviser reimbursed $69,879. Transactions with the affiliated company during the year ended October 31, 2009 were as follows:
| Affiliate | Balance of
Shares Held
10/31/2008 | Purchases/
Additions | Sales/
Reductions | Balance of
Shares Held
10/31/2009 | Value | Dividend
Income |
| Prime Value Obligations Fund, Institutional Shares | 162,690,105 | 1,275,486,604 | 1,435,777,908 | 2,398,801 | $2,398,801 | $764,043 |
6. EXPENSE Reduction
The Fund directs portfolio trades to a broker that in turn pays a portion of the Fund's operating expenses. For the year ended October 31, 2009, the Fund's expenses were reduced by $154,693 under these arrangements.
7. Investment TRANSACTIONS
Purchases and sales of investments, excluding long-term U.S. government securities and short-term obligations, for the year ended October 31, 2009, were as follows:
| Purchases | $3,283,915,928 |
| Sales | $3,232,208,126 |
8. LINE OF CREDIT
The Fund participates in a $100,000,000 unsecured, uncommitted revolving line of credit (LOC) agreement with PNC Bank. The LOC was made available for extraordinary or emergency purposes, primarily for financing redemption payments. Borrowings are charged interest at a rate offered to the Fund by PNC Bank at the time of the borrowing. As of October 31, 2009, there were no outstanding loans. During the year ended October 31, 2009, the Fund did not utilize the LOC.
9. INTERFUND LENDING
Pursuant to an Exemptive Order issued by the Securities and Exchange Commission (SEC), the Fund, along with other funds advised by subsidiaries of Federated Investors, Inc., may participate in an interfund lending program. This program provides an alternative credit facility allowing the Fund to borrow from other participating affiliated funds. As of October 31, 2009, there were no outstanding loans. During the year ended October 31, 2009, the program was not utilized.
10. Legal Proceedings
Since October 2003, Federated Investors, Inc. and related entities (collectively, Federated) and various Federated funds (Federated Funds) have been named as defendants in several class action lawsuits now pending in the United States District Court for the District of Maryland. The lawsuits were purportedly filed on behalf of people who purchased, owned and/or redeemed shares of Federated-sponsored mutual funds during specified periods beginning November 1, 1998. The suits are generally similar in alleging that Federated engaged in illegal Annual Shareholder Report28
and improper trading practices including market timing and late trading in concert with certain institutional traders, which allegedly caused financial injury to the mutual fund shareholders. These lawsuits began to be filed shortly after Federated's first public announcement that it had received requests for information on shareholder trading activities in the Federated Funds from the SEC, the Office of the New York State Attorney General (NYAG), and other authorities. In that regard, on November 28, 2005, Federated announced that it had reached final settlements with the SEC and the NYAG with respect to those matters. As Federated previously reported in 2004, it has already paid approximately $8.0 million to certain funds as determined by an independent consultant. As part of these settlements, Federated agreed to pay for the benefit of fund shareholders additional disgorgement and a civil money penalty in the aggregate amount of an additional $72 million. Federated entities have also been named as defendants in several additional lawsuits that are now pending in the United States District Court for the Western District of Pennsylvania, alleging, among other things, excessive advisory and Rule 12b-1 fees. The Board of the Federated Funds retained the law firm of Dickstein Shapiro LLP to represent the Federated Funds in these lawsuits. Federated and the Federated Funds, and their respective counsel have been defending this litigation, and none of the Federated Funds remains a defendant in any of the lawsuits (though some could potentially receive any recoveries as nominal defendants). Additional lawsuits based upon similar allegations may be filed in the future. The potential impact of these lawsuits, all of which seek unquantified damages, attorneys' fees and expenses, and future potential similar suits is uncertain. Although we do not believe that these lawsuits will have a material adverse effect on the Federated Funds, there can be no assurance that these suits, the ongoing adverse publicity and/or other developments resulting from the regulatory investigations will not result in increased Federated Fund redemptions, reduced sales of Federated Fund shares or other adverse consequences for the Federated Funds.11. Subsequent events
Management has evaluated subsequent events through December 24, 2009, the date the financial statements were issued, and determined that no events have occurred that require additional disclosure.
12. FEDERAL TAX INFORMATION (UNAUDITED)
For the fiscal year ended October 31, 2009, 100% of total ordinary dividends paid by the Fund are qualifying dividends which may be subject to a maximum tax rate of 15%, as provided for by the Jobs and Growth Tax Relief Act of 2003. Complete information is reported in conjunction with the reporting of your distributions on Form 1099-DIV.
Of the ordinary income distributions made by the Fund during the year ended October 31, 2009, 100% qualify for the dividend received deduction available to corporate shareholders.
Annual Shareholder Report29
Report of Independent Registered Public Accounting Firm
TO THE BOARD OF Trustees of Federated equity funds AND SHAREHOLDERS OF federated capital appreciation fund:
We have audited the accompanying statement of assets and liabilities, including the portfolio of investments, of the Federated Capital Appreciation Fund (the “Fund”), a portfolio of Federated Equity Funds, as of October 31, 2009, and the related statement of operations for the year then ended, the statements of changes in net assets for each of the years in the two-year period then ended, and the financial highlights for each of the years in the four-year period then ended. These financial statements and financial highlights are the responsibility of the Fund's management. Our responsibility is to express an opinion on these financial statements and financial highlights based on our audits. The financial highlights for the period presented prior to November 1, 2005, was audited by other independent registered public accountants whose report thereon dated December 20, 2005, expressed an unqualified opinion on those statements.
We conducted our audits in accordance with the standards of the Public Company Accounting Oversight Board (United States). Those standards require that we plan and perform the audit to obtain reasonable assurance about whether the financial statements and financial highlights are free of material misstatement. An audit includes examining, on a test basis, evidence supporting the amounts and disclosures in the financial statements. Our procedures included confirmation of securities owned as of October 31, 2009 by correspondence with the custodian and brokers or by other appropriate auditing procedures. An audit also includes assessing the accounting principles used and significant estimates made by management, as well as evaluating the overall financial statement presentation. We believe that our audits provide a reasonable basis for our opinion.
In our opinion, the financial statements and financial highlights referred to above present fairly, in all material respects, the financial position of the Federated Capital Appreciation Fund as of October 31, 2009, the results of its operations for the year then ended, changes in its net assets for each of the years in the two-year period then ended, and financial highlights for each of the years in the four-year period then ended, in conformity with U.S. generally accepted accounting principles.
Boston, Massachusetts
December 24, 2009
Annual Shareholder Report30
Board of Trustees and Trust Officers
The Board is responsible for managing the Trust's business affairs and for exercising all the Trust's powers except those reserved for the shareholders. The following tables give information about each Board member and the senior officers of the Fund. Where required, the tables separately list Board members who are “interested persons” of the Fund (i.e., “Interested” Board members) and those who are not (i.e., “Independent” Board members). Unless otherwise noted, the address of each person listed is Federated Investors Tower, 1001 Liberty Avenue, Pittsburgh, PA 15222. The address of all Independent Board members listed is 4000 Ericsson Drive, Warrendale, PA 15086-7561; Attention: Mutual Fund Board. As of December 31, 2008, the Trust comprised ten portfolios, and the Federated Fund Complex consisted of 40 investment companies (comprising 149 portfolios). Unless otherwise noted, each Officer is elected annually. Unless otherwise noted, each Board member oversees all portfolios in the Federated Fund Complex and serves for an indefinite term. The Fund's Statement of Additional Information includes additional information about Trust Trustees and is available, without charge and upon request, by calling 1-800-341-7400.
Interested TRUSTEES Background
Name
Birth Date
Positions Held with Trust
Date Service Began | Principal Occupation(s) for Past Five Years,
Other Directorships Held and Previous Position(s) |
John F. Donahue*
Birth Date: July 28, 1924
TRUSTEE
Began serving: April 1984 | Principal Occupations: Director or Trustee of the Federated Fund Complex; Chairman and Director, Federated Investors, Inc.; Chairman of the Federated Fund Complex's Executive Committee.
Previous Positions: Chairman of the Federated Fund Complex; Trustee, Federated Investment Management Company; Chairman and Director, Federated Investment Counseling. |
J. Christopher Donahue*
Birth Date: April 11, 1949
PRESIDENT AND TRUSTEE
Began serving: January 2000 | Principal Occupations: Principal Executive Officer and President of the Federated Fund Complex; Director or Trustee of some of the Funds in the Federated Fund Complex; President, Chief Executive Officer and Director, Federated Investors, Inc.; Chairman and Trustee, Federated Investment Management Company; Trustee, Federated Investment Counseling; Chairman and Director, Federated Global Investment Management Corp.; Chairman, Federated Equity Management Company of Pennsylvania and Passport Research, Ltd. (investment advisory subsidiary of Federated); Trustee, Federated Shareholder Services Company; Director, Federated Services Company.
Previous Positions: President, Federated Investment Counseling; President and Chief Executive Officer, Federated Investment Management Company, Federated Global Investment Management Corp. and Passport Research, Ltd. |
| * | Family relationships and reasons for “interested” status: John F. Donahue is the father of J. Christopher Donahue; both are “interested” due to their beneficial ownership of shares of Federated Investors, Inc. and the positions they hold with Federated and its subsidiaries. |
Annual Shareholder Report31
INDEPENDENT TRUSTEES Background
Name
Birth Date
Positions Held with Trust
Date Service Began | Principal Occupation(s) for Past Five Years,
Other Directorships Held and Previous Position(s) |
John T. Conroy, Jr., Ph.D.
Birth Date: June 23, 1937
TRUSTEE
Began serving: November 1991 | Principal Occupations: Director or Trustee of the Federated Fund Complex; Chairman of the Board, Investment Properties Corporation; Partner or Trustee in private real estate ventures in Southwest Florida; Assistant Professor in Theology, Blessed Edmund Rice School for Pastoral Ministry.
Previous Positions: President, Investment Properties Corporation; Senior Vice President, John R. Wood and Associates, Inc., Realtors; President, Naples Property Management, Inc. and Northgate Village Development Corporation. |
Nicholas P. Constantakis
Birth Date: September 3, 1939
TRUSTEE
Began serving: February 1998 | Principal Occupation: Director or Trustee of the Federated Fund Complex.
Other Directorship Held: Director and Chairman of the Audit Committee, Michael Baker Corporation (architecture, engineering and construction services).
Previous Position: Partner, Andersen Worldwide SC. |
John F. Cunningham
Birth Date: March 5, 1943
TRUSTEE
Began serving: January 1999 | Principal Occupation: Director or Trustee of the Federated Fund Complex.
Other Directorships Held: Chairman, President and Chief Executive Officer, Cunningham & Co., Inc. (strategic business consulting); Trustee Associate, Boston College.
Previous Positions: Director, Redgate Communications and EMC Corporation (computer storage systems); Chairman of the Board and Chief Executive Officer, Computer Consoles, Inc.; President and Chief Operating Officer, Wang Laboratories; Director, First National Bank of Boston; Director, Apollo Computer, Inc. |
Maureen Lally-Green
Birth Date: July 5, 1949
TRUSTEE
Began serving: August 2009 | Principal Occupations: Director or Trustee of the Federated Fund Complex; Director, Office of Church Relations, Diocese of Pittsburgh; Adjunct Professor of Law, Duquesne University School of Law.
Other Directorships Held: Director, Auberle; Trustee St. Francis University; Director, Ireland Institute of Pittsburgh; Director, UPMC Mercy Hospital; Regent, St. Vincent Seminary; Director, Epilepsy Foundation of Western and Central Pennsylvania; Director, Saint Thomas More Society, Allegheny County; Director, Carlow University.
Previous Position: Pennsylvania Superior Court Judge. |
Annual Shareholder Report32
Name
Birth Date
Positions Held with Trust
Date Service Began | Principal Occupation(s) for Past Five Years,
Other Directorships Held and Previous Position(s) |
Peter E. Madden
Birth Date: March 16, 1942
TRUSTEE
Began serving: November 1991 | Principal Occupation: Director or Trustee and Chairman of the Board of the Federated Fund Complex.
Other Directorship Held: Board of Overseers, Babson College.
Previous Positions: Representative, Commonwealth of Massachusetts General Court; President, Chief Operating Officer and Director, State Street Bank and Trust Company and State Street Corporation (retired); Director, VISA USA and VISA International; Chairman and Director, Massachusetts Bankers Association; Director, Depository Trust Corporation; Director, The Boston Stock Exchange. |
Charles F. Mansfield, Jr.
Birth Date: April 10, 1945
TRUSTEE
Began serving: January 1999 | Principal Occupations: Director or Trustee and Chairman of the Audit Committee of the Federated Fund Complex; Management Consultant.
Previous Positions: Chief Executive Officer, PBTC International Bank; Partner, Arthur Young & Company (now Ernst & Young LLP); Chief Financial Officer of Retail Banking Sector, Chase Manhattan Bank; Senior Vice President, HSBC Bank USA (formerly, Marine Midland Bank); Vice President, Citibank; Assistant Professor of Banking and Finance, Frank G. Zarb School of Business, Hofstra University; Executive Vice President DVC Group, Inc. (marketing, communications and technology). |
R. James Nicholson
Birth Date: February 4, 1938
TRUSTEE
Began serving: April 2008 | Principal Occupations: Director or Trustee of the Federated Fund Complex; Senior Counsel, Brownstein Hyatt Farber Schrek, P.C.; Former Secretary of the U.S. Dept. of Veterans Affairs; Former U.S. Ambassador to the Holy See; Former Chairman of the Republican National Committee.
Other Directorships Held: Director, Horatio Alger Association; Director, The Daniels Fund.
Previous Positions: Colonel, U.S. Army Reserve; Partner, Calkins, Kramer, Grimshaw and Harring, P.C.; General Counsel, Colorado Association of Housing and Building; Chairman and CEO, Nicholson Enterprises, Inc. (real estate holding company); Chairman and CEO, Renaissance Homes of Colorado. |
Thomas M. O'Neill
Birth Date: June 14, 1951
TRUSTEE
Began serving: October 2006 | Principal Occupations: Director or Trustee of the Federated Fund Complex; Managing Director and Partner, Navigator Management Company, L.P. (investment and strategic consulting).
Other Directorships Held: Board of Overseers, Children's Hospital of Boston; Visiting Committee on Athletics, Harvard College.
Previous Positions: Chief Executive Officer and President, Managing Director and Chief Investment Officer, Fleet Investment Advisors; President and Chief Executive Officer, Aeltus Investment Management, Inc.; General Partner, Hellman, Jordan Management Co., Boston, MA; Chief Investment Officer, The Putnam Companies, Boston, MA; Credit Analyst and Lending Officer, Fleet Bank; Director and Consultant, EZE Castle Software (investment order management software); Director, Midway Pacific (lumber). |
Annual Shareholder Report33
Name
Birth Date
Positions Held with Trust
Date Service Began | Principal Occupation(s) for Past Five Years,
Other Directorships Held and Previous Position(s) |
John S. Walsh
Birth Date: November 28, 1957
TRUSTEE
Began serving: January 1999 | Principal Occupations: Director or Trustee of the Federated Fund Complex; President and Director, Heat Wagon, Inc. (manufacturer of construction temporary heaters); President and Director, Manufacturers Products, Inc. (distributor of portable construction heaters); President, Portable Heater Parts, a division of Manufacturers Products, Inc.
Previous Position: Vice President, Walsh & Kelly, Inc. |
James F. Will
Birth Date: October 12, 1938
TRUSTEE
Began serving: April 2006 | Principal Occupations: Director or Trustee of the Federated Fund Complex; formerly, Vice Chancellor and President, Saint Vincent College.
Other Directorships Held: Trustee, Saint Vincent College; Alleghany Corporation.
Previous Positions: Chairman, President and Chief Executive Officer, Armco, Inc.; President and Chief Executive Officer, Cyclops Industries; President and Chief Operating Officer, Kaiser Steel Corporation. |
OFFICERS
Name
Birth Date
Address
Positions Held with Trust
Date Service Began | Principal Occupation(s) for Past Five Years
and Previous Position(s) |
John W. McGonigle
Birth Date: October 26, 1938
EXECUTIVE VICE PRESIDENT AND SECRETARY
Began serving: April 1984 | Principal Occupations: Executive Vice President and Secretary of the Federated Fund Complex; Vice Chairman, Executive Vice President, Secretary and Director, Federated Investors, Inc.
Previous Positions: Trustee, Federated Investment Management Company and Federated Investment Counseling; Director, Federated Global Investment Management Corp., Federated Services Company and Federated Securities Corp. |
Richard A. Novak
Birth Date: December 25, 1963
TREASURER
Began serving: January 2006 | Principal Occupations: Principal Financial Officer and Treasurer of the Federated Fund Complex; Senior Vice President, Federated Administrative Services; Financial and Operations Principal for Federated Securities Corp., Edgewood Services, Inc. and Southpointe Distribution Services, Inc.
Previous Positions: Controller of Federated Investors, Inc.; Vice President, Finance of Federated Services Company; held various financial management positions within The Mercy Hospital of Pittsburgh; Auditor, Arthur Andersen & Co. |
Richard B. Fisher
Birth Date: May 17, 1923
VICE PRESIDENT
Began serving: April 1984 | Principal Occupations: Vice Chairman or Vice President of some of the Funds in the Federated Fund Complex; Vice Chairman, Federated Investors, Inc.; Chairman, Federated Securities Corp.
Previous Positions: President and Director or Trustee of some of the Funds in the Federated Fund Complex; Executive Vice President, Federated Investors, Inc.; Director and Chief Executive Officer, Federated Securities Corp. |
Annual Shareholder Report34
Name
Birth Date
Address
Positions Held with Trust
Date Service Began | Principal Occupation(s) for Past Five Years
and Previous Position(s) |
Brian P. Bouda
Birth Date: February 28, 1947
CHIEF COMPLIANCE OFFICER AND SENIOR VICE PRESIDENT
Began serving: August 2004 | Principal Occupations: Senior Vice President and Chief Compliance Officer of the Federated Fund Complex; Vice President and Chief Compliance Officer of Federated Investors, Inc. and Chief Compliance Officer of its subsidiaries. Mr. Bouda joined Federated in 1999 and is a member of the American Bar Association and the State Bar Association of Wisconsin. |
Stephen F. Auth
Birth Date: September 3, 1956
450 Lexington Avenue
Suite 3700
New York, NY 10017-3943
CHIEF INVESTMENT OFFICER
Began serving: November 2002 | Principal Occupations: Mr. Auth is Chief Investment Officer of this Fund and various other Funds in the Federated Fund Complex; Executive Vice President, Federated Investment Counseling, Federated Global Investment Management Corp. and Federated Equity Management Company of Pennsylvania.
Previous Positions: Executive Vice President, Federated Investment Management Company, and Passport Research, Ltd. (investment advisory subsidiary of Federated); Senior Vice President, Global Portfolio Management Services Division; Senior Vice President, Federated Investment Management Company and Passport Research, Ltd.; Senior Managing Director and Portfolio Manager, Prudential Investments. |
Lawrence Auriana
Birth Date: January 8, 1944
140 East 45th Street
New York, NY 10017
VICE PRESIDENT
Began serving: November 2001 | Principal Occupations: Lawrence Auriana is Vice President of the Trust. Mr. Auriana joined Federated in April 2001 as Co-Head of Investments/Federated Kaufmann. From August 1984 to April 2001, Mr. Auriana was President and Treasurer of Edgemont Asset Management Corp., and Chairman of the Board and Portfolio Manager to The Kaufmann Fund, Inc. (predecessor to the Federated Kaufmann Fund). Mr. Auriana earned a B.S. in economics from Fordham University and has been engaged in the securities business since 1965. |
Walter C. Bean
Birth Date: June 22, 1945
VICE PRESIDENT
Began serving: November 2006 | Principal Occupations: Walter C. Bean is Vice President of the Trust. Mr. Bean is a Senior Vice President, Senior Portfolio Manager and the Head of the Equity Income Management Team of the Fund's Adviser. Mr. Bean joined Federated in 2000. His previous associations included: various investment management and research positions with C.S. McKee & Company; First Chicago Investment Advisors; CIGNA Investment Advisors; and Mellon Bank. Mr. Bean earned a Bachelors Degree in Business Administration from Ohio University and an M.B.A. from the Pennsylvania State University. Mr. Bean is a Chartered Financial Analyst and has 40 years of investment experience. |
Hans P. Utsch
Birth Date: July 3, 1936
140 East 45th Street
New York, NY 10017
VICE PRESIDENT
Began serving: November 2001 | Principal Occupations: Hans P. Utsch is Vice President of the Trust. Mr. Utsch joined Federated in April 2001 as Co-Head of Investments/Federated Kaufmann. From August 1984 to April 2001, Mr. Utsch was Chairman of the Board and Secretary of Edgemont Asset Management Corp., and President and Portfolio Manager to The Kaufmann Fund, Inc. (predecessor to the Federated Kaufmann Fund). Mr. Utsch graduated from Amherst College and holds an M.B.A. from Columbia University. He has been engaged in the securities business since 1962. |
Annual Shareholder Report35
Evaluation and Approval of Advisory Contract - May 2009
Federated Capital Appreciation Fund (the “Fund”)
The Fund's Board reviewed the Fund's investment advisory contract at meetings held in May 2009. The Board's decision regarding the contract reflects the exercise of its business judgment on whether to continue the existing arrangements.
In this connection, the Federated funds' Board had previously appointed a Senior Officer, whose duties include specified responsibilities relating to the process by which advisory fees are to be charged to a Federated fund. The Senior Officer has the authority to retain consultants, experts, or staff as may be reasonably necessary to assist in the performance of his duties, reports directly to the Board, and may be terminated only with the approval of a majority of the independent members of the Board. The Senior Officer prepared and furnished to the Board an independent, written evaluation that covered topics discussed below. The Board considered that evaluation, along with other information, in deciding to approve the advisory contract.
During its review of the contract, the Board considered compensation and benefits received by the Adviser. This included the fees received for services provided to the Fund by other entities in the Federated organization and research services received by the Adviser from brokers that execute Federated fund trades, as well as advisory fees. The Board is also familiar with and considered judicial decisions concerning allegedly excessive investment advisory fees, which have indicated that the following factors may be relevant to an Adviser's fiduciary duty with respect to its receipt of compensation from a fund: the nature and quality of the services provided by the Adviser, including the performance of the fund; the Adviser's cost of providing the services; the extent to which the Adviser may realize “economies of scale” as a fund grows larger; any indirect benefits that may accrue to the Adviser and its affiliates as a result of the Adviser's relationship with a fund; performance and expenses of comparable funds; and the extent to which the independent Board members are fully informed about all facts the Board deems relevant bearing on the Adviser's services and fees. The Board further considered management fees (including any components thereof) charged to institutional and other clients of the Adviser for what might be viewed as like services, and the cost to the Adviser and its affiliates of supplying services pursuant to the management fee agreements, excluding any intra-corporate profit and profit margins of the Adviser and its affiliates for supplying such services. The Board was aware of these factors and was guided by them in its review of the Fund's advisory contract to the extent it considered them to be appropriate and relevant, as discussed further below.
Annual Shareholder Report36
The Board considered and weighed these circumstances in light of its substantial accumulated experience in governing the Fund and working with Federated on matters relating to the Federated funds, and was assisted in its deliberations by independent legal counsel. Throughout the year, the Board has requested and received substantial and detailed information about the Fund and the Federated organization that was in addition to the extensive materials that comprise and accompany the Senior Officer's evaluation. Federated provided much of this information at each regular meeting of the Board, and furnished additional reports in connection with the particular meeting at which the Board's formal review of the advisory contract occurred. Between regularly scheduled meetings, the Board also received information on particular matters as the need arose. Thus, the Board's consideration of the advisory contract included review of the Senior Officer's evaluation, accompanying data and additional reports covering such matters as: the Adviser's investment philosophy, revenue, profitability, personnel and processes; investment and operating strategies; the Fund's short- and long-term performance (in absolute terms, both on a gross basis and net of expenses, as well as in relationship to its particular investment program and certain competitor or “peer group” funds and/or other benchmarks, as appropriate), and comments on the reasons for performance; the Fund's investment objectives; the Fund's expenses (including the advisory fee itself and the overall expense structure of the Fund, both in absolute terms and relative to similar and/or competing funds, with due regard for contractual or voluntary expense limitations); the use and allocation of brokerage commissions derived from trading the Fund's portfolio securities (if any); and the nature, quality and extent of the advisory and other services provided to the Fund by the Adviser and its affiliates. The Board also considered the preferences and expectations of Fund shareholders and their relative sophistication; the continuing state of competition in the mutual fund industry and market practices; the range of comparable fees for similar funds in the mutual fund industry; the Fund's relationship to the Federated family of funds which include a comprehensive array of funds with different investment objectives, policies and strategies which are available for exchange without the incurrence of additional sales charges; compliance and audit reports concerning the Federated funds and the Federated companies that service them (including communications from regulatory agencies), as well as Federated's responses to any issues raised therein; and relevant developments in the mutual fund industry and how the Federated funds and/or Federated are responding to them. The Board's evaluation process is evolutionary. The criteria considered and the emphasis placed on relevant criteria change in recognition of changing circumstances in the mutual fund marketplace. With respect to the Fund's performance and expenses in particular, the Board has found the use of comparisons to other mutual funds with comparable investment programs to be particularly useful, given the high degree of competition in the mutual fund business. The Board focused on comparisons Annual Shareholder Report37
with other similar mutual funds more heavily than non-mutual fund products or services because it is believed that they are more relevant. For example, other mutual funds are the products most like the Fund, they are readily available to Fund shareholders as alternative investment vehicles, and they are the type of investment vehicle in fact chosen and maintained by the Fund's investors. The range of their fees and expenses therefore appears to be a generally reliable indication of what consumers have found to be reasonable in the precise marketplace in which the Fund competes. The Fund's ability to deliver competitive performance when compared to its peer group was a useful indicator of how the Adviser is executing the Fund's investment program, which in turn assisted the Board in reaching a conclusion that the nature, extent, and quality of the Adviser's investment management services were such as to warrant continuation of the advisory contract. In this regard, the Senior Officer has reviewed Federated's fees for providing advisory services to products outside the Federated family of funds (e.g., institutional and separate accounts). He concluded that mutual funds and institutional accounts are inherently different products. Those differences include, but are not limited to, different types of targeted investors; being subject to different laws and regulations; different legal structures; different average account sizes; different associated costs; different portfolio management techniques made necessary by different cash flows and portfolio manager time spent in review of securities pricing. The Senior Officer did not consider these fee schedules to be determinative in judging the appropriateness of mutual fund advisory contracts.The Senior Officer reviewed reports compiled by Federated, using data supplied by independent fund ranking organizations, regarding the performance of, and fees charged by, other mutual funds, noting his view that comparisons to fund peer groups are highly important in judging the reasonableness of proposed fees.
For the one-year, three-year and five-year periods covered by the report, the Fund's performance was above the median of the relevant peer group.
The Board also received financial information about Federated, including reports on the compensation and benefits Federated derived from its relationships with the Federated funds. These reports covered not only the fees under the advisory contracts, but also fees received by Federated's subsidiaries for providing other services to the Federated funds under separate contracts (e.g., for serving as the Federated funds' administrator). The reports also discussed any indirect benefit Federated may derive from its receipt of research services from brokers who execute Federated fund trades. In addition, the Board considered the fact that, in order for a fund to be competitive in the marketplace, Federated and its affiliates frequently waived fees and/or reimbursed expenses and have disclosed to fund investors and/or indicated to the Board their intention to do so in the future, where appropriate. Moreover, the Board receives regular reports regarding the institution or elimination of these voluntary waivers.
Annual Shareholder Report38
Federated furnished reports, requested by the Senior Officer, that reported revenues on a fund-by-fund basis and made estimates of the allocation of expenses on a fund-by-fund basis, using allocation methodologies specified by the Senior Officer. The Senior Officer noted that, although they may apply consistent allocation processes, the inherent difficulties in allocating costs (and the unavoidable arbitrary aspects of that exercise) and the lack of consensus on how to allocate those costs may render such allocation reports unreliable. The allocation reports were considered in the analysis by the Board but were determined to be of limited use.The Board and the Senior Officer also reviewed a report compiled by Federated comparing profitability information for Federated to other publicly held fund management companies. In this regard, the Senior Officer noted the limited availability of such information, but nonetheless concluded that Federated's profit margins did not appear to be excessive and the Board agreed.
The Senior Officer's evaluation also discussed the notion of possible realization of “economies of scale” as a fund grows larger. The Board considered in this regard that the Adviser has made significant and long-term investments in areas that support all of the Federated funds, such as personnel and processes for the portfolio management, compliance, and risk management functions; and systems technology; and that the benefits of these efforts (as well as any economies, should they exist) were likely to be enjoyed by the fund complex as a whole. Finally, the Board also noted the absence of any applicable regulatory or industry guidelines on this subject, which (as discussed in the Senior Officer's evaluation) is compounded by the lack of any common industry practice or general pattern with respect to structuring fund advisory fees with “breakpoints” that serve to reduce the fee as the fund attains a certain size. The Senior Officer did not recommend institution of breakpoints in pricing Federated's fund advisory services at this time.
It was noted in the materials for the Board meeting that for the period covered by the report, the Fund's investment advisory fee, after waivers and expense reimbursements, if any, was above the median of the relevant peer group. The Board reviewed the fees and other expenses of the Fund with the Adviser and was satisfied that the overall expense structure of the Fund remained competitive. The Board will continue to monitor advisory fees and other expenses borne by the Fund.
The Senior Officer's evaluation noted his belief that the information and observations contained in his evaluation supported a finding that the proposed management fees are reasonable, and that Federated appeared to provide appropriate administrative services to the Fund for the fees paid. Under these circumstances, no changes were recommended to, and no objection was raised to, the continuation of the Fund's advisory contract. The Board concluded that the nature, quality and scope of services provided the Fund by the Adviser and its affiliates were satisfactory.
Annual Shareholder Report39
In its decision to continue an existing investment advisory contract, the Board was mindful of the potential disruptions of the Fund's operations and various risks, uncertainties and other effects that could occur as a result of a decision to terminate or not renew an advisory contract. In particular, the Board recognized that many shareholders have invested in the Fund on the strength of the Adviser's industry standing and reputation and with the expectation that the Adviser will have a continuing role in providing advisory services to the Fund. Thus, the Board's approval of the advisory contract reflected the fact that it is the shareholders who have effectively selected the Adviser by virtue of having invested in the Fund.The Board based its decision to approve the advisory contract on the totality of the circumstances and relevant factors and with a view to past and future long-term considerations. Not all of the factors and considerations identified above were necessarily relevant to the Fund, nor did the Board consider any one of them to be determinative. With respect to the factors that were relevant, the Board's decision to approve the contract reflects its determination that Federated's performance and actions provided a satisfactory basis to support the decision to continue the existing arrangements.
Annual Shareholder Report40
Voting Proxies on Fund Portfolio Securities
A description of the policies and procedures that the Fund uses to determine how to vote proxies, if any, relating to securities held in the Fund's portfolio is available, without charge and upon request, by calling 1-800-341-7400. A report on “Form N-PX” of how the Fund voted any such proxies during the most recent 12-month period ended June 30 is available from Federated's Web site at FederatedInvestors.com. To access this information from the “Products” section of the Web site, click on the “Prospectuses and Regulatory Reports” link under “Related Information,” then select the appropriate link opposite the name of the Fund; or select the name of the Fund and from the Fund's page, click on the “Prospectuses and Regulatory Reports” link. Form N-PX filings are also available at the SEC's Web site at www.sec.gov.
Quarterly Portfolio Schedule
The Fund files with the SEC a complete schedule of its portfolio holdings, as of the close of the first and third quarters of its fiscal year, on “Form N-Q.” These filings are available on the SEC's Web site at www.sec.gov and may be reviewed and copied at the SEC's Public Reference Room in Washington, DC. (Call 1-800-SEC-0330 for information on the operation of the Public Reference Room.) You may also access this information from the “Products” section of Federated's Web site at FederatedInvestors.com by clicking on “Portfolio Holdings” under “Related Information,” then selecting the appropriate link opposite the name of the Fund; or select the name of the Fund and from the Fund's page, click on the “Portfolio Holdings” link.
Annual Shareholder Report41
Mutual funds are not bank deposits or obligations, are not guaranteed by any bank and are not insured or guaranteed by the U.S. government, the Federal Deposit Insurance Corporation, the Federal Reserve Board or any other government agency. Investment in mutual funds involves investment risk, including the possible loss of principal.
This Report is authorized for distribution to prospective investors only when preceded or accompanied by the Fund's Prospectus, which contains facts concerning its objective and policies, management fees, expenses and other information.
Federated Capital Appreciation Fund
Federated Investors Funds
4000 Ericsson Drive
Warrendale, PA 15086-7561
Contact us at FederatedInvestors.com
or call 1-800-341-7400.
Federated Securities Corp., Distributor
Cusip 314172396
39690 (12/09)
Federated is a registered mark of Federated Investors, Inc.
2009 Federated Investors, Inc.
Federated Kaufmann FundEstablished 2001
A Portfolio of Federated Equity Funds
ANNUAL SHAREHOLDER REPORTOctober 31, 2009
Class A Shares
Class B Shares
Class C Shares
FINANCIAL HIGHLIGHTS
SHAREHOLDER EXPENSE EXAMPLE
MANAGEMENT'S DISCUSSION OF FUND PERFORMANCE
PORTFOLIO OF INVESTMENTS SUMMARY TABLE
PORTFOLIO OF INVESTMENTS
STATEMENT OF ASSETS AND LIABILITIES
STATEMENT OF OPERATIONS
STATEMENT OF CHANGES IN NET ASSETS
NOTES TO FINANCIAL STATEMENTS
REPORT OF INDEPENDENT REGISTERED PUBLIC ACCOUNTING FIRM
BOARD OF TRUSTEES AND TRUST OFFICERS
EVALUATION AND APPROVAL OF ADVISORY CONTRACT
VOTING PROXIES ON FUND PORTFOLIO SECURITIES
QUARTERLY PORTFOLIO SCHEDULE
Financial Highlights - Class A Shares
(For a Share Outstanding Throughout Each Period)
| Year Ended October 31 | 2009 | 2008 | 2007 | 2006 | 2005 |
| Net Asset Value, Beginning of Period | $3.80 | $7.03 | $6.08 | $5.51 | $5.11 |
| Income From Investment Operations: | | | | | |
| Net investment income (loss) | (0.00)1,2 | (0.03)2 | (0.04)2 | (0.06)2 | (0.05)2 |
| Net realized and unrealized gain (loss) on investments, written options, futures contracts, short sales and foreign currency transactions | 0.42 | (2.57) | 1.73 | 0.96 | 0.74 |
| TOTAL FROM INVESTMENT OPERATIONS | 0.42 | (2.60) | 1.69 | 0.90 | 0.69 |
| Less Distributions: | | | | | |
| Distributions from net realized gain on investments and foreign currency transactions | — | (0.63) | (0.74) | (0.33) | (0.29) |
| Net Asset Value, End of Period | $4.22 | $3.80 | $7.03 | $6.08 | $5.51 |
| Total Return3 | 11.05% | (40.38)% | 31.07% | 17.06% | 14.05% |
| Ratios to Average Net Assets: | | | | | |
| Net expenses | 1.95%4 | 1.95%4 | 1.95%4 | 1.95% | 1.93% |
| Net investment income (loss) | (0.12)% | (0.56)% | (0.63)% | (0.98)% | (1.00)% |
| Expense waiver/reimbursement5 | 0.27% | 0.23% | 0.22% | 0.22% | 0.21% |
| Supplemental Data: | | | | | |
| Net assets, end of period (000 omitted) | $2,153,443 | $2,158,140 | $3,730,840 | $2,884,118 | $2,166,468 |
| Portfolio turnover | 91% | 78% | 49% | 64% | 71% |
| 1 | Represents less than $0.01. |
| 2 | Per share numbers have been calculated using the average shares method. |
| 3 | Based on net asset value, which does not reflect the sales charge, redemption fee or contingent deferred sales charge, if applicable. |
| 4 | The net expense ratio is calculated without reduction for expense offset arrangements. The net expense ratios are 1.95%, 1.95% and 1.95% for the years ended October 31, 2009, 2008 and 2007, respectively, after taking into account these expense reductions. |
| 5 | This expense decrease is reflected in both the net expense and the net investment income (loss) ratios shown above. |
- See Notes which are an integral part of the Financial Statements
Annual Shareholder Report1
Financial Highlights - Class B Shares
(For a Share Outstanding Throughout Each Period)
| Year Ended October 31 | 2009 | 2008 | 2007 | 2006 | 2005 |
| Net Asset Value, Beginning of Period | $3.62 | $6.75 | $5.89 | $5.38 | $5.02 |
| Income From Investment Operations: | | | | | |
| Net investment income (loss) | (0.02)1 | (0.06)1 | (0.07)1 | (0.09)1 | (0.08)1 |
| Net realized and unrealized gain (loss) on investments, written options, futures contracts, short sales and foreign currency transactions | 0.40 | (2.44) | 1.67 | 0.93 | 0.73 |
| TOTAL FROM INVESTMENT OPERATIONS | 0.38 | (2.50) | 1.60 | 0.84 | 0.65 |
| Less Distributions: | | | | | |
| Distributions from net realized gain on investments and foreign currency transactions | — | (0.63) | (0.74) | (0.33) | (0.29) |
| Net Asset Value, End of Period | $4.00 | $3.62 | $6.75 | $5.89 | $5.38 |
| Total Return2 | 10.50% | (40.60)% | 30.45% | 16.32% | 13.47% |
| Ratios to Average Net Assets: | | | | | |
| Net expenses | 2.50%3 | 2.50%3 | 2.50%3 | 2.50% | 2.49% |
| Net investment income (loss) | (0.67)% | (1.11)% | (1.18)% | (1.54)% | (1.56)% |
| Expense waiver/reimbursement4 | 0.22% | 0.19% | 0.18% | 0.18% | 0.16% |
| Supplemental Data: | | | | | |
| Net assets, end of period (000 omitted) | $562,618 | $651,474 | $1,362,195 | $1,184,964 | $1,102,133 |
| Portfolio turnover | 91% | 78% | 49% | 64% | 71% |
| 1 | Per share numbers have been calculated using the average shares method. |
| 2 | Based on net asset value, which does not reflect the sales charge, redemption fee or contingent deferred sales charge, if applicable. |
| 3 | The net expense ratio is calculated without reduction for expense offset arrangements. The net expense ratios are 2.50%, 2.50% and 2.50% for the years ended October 31, 2009, 2008 and 2007, respectively, after taking into account these expense reductions. |
| 4 | This expense decrease is reflected in both the net expense and the net investment income (loss) ratios shown above. |
- See Notes which are an integral part of the Financial Statements
Annual Shareholder Report2
Financial Highlights - Class C Shares
(For a Share Outstanding Throughout Each Period)
| Year Ended October 31 | 2009 | 2008 | 2007 | 2006 | 2005 |
| Net Asset Value, Beginning of Period | $3.62 | $6.75 | $5.89 | $5.38 | $5.02 |
| Income From Investment Operations: | | | | | |
| Net investment income (loss) | (0.02)1 | (0.06)1 | (0.07)1 | (0.09)1 | (0.08)1 |
| Net realized and unrealized gain (loss) on investments, written options, futures contracts, short sales and foreign currency transactions | 0.40 | (2.44) | 1.67 | 0.93 | 0.73 |
| TOTAL FROM INVESTMENT OPERATIONS | 0.38 | (2.50) | 1.60 | 0.84 | 0.65 |
| Less Distributions: | | | | | |
| Distributions from net realized gain on investments and foreign currency transactions | — | (0.63) | (0.74) | (0.33) | (0.29) |
| Net Asset Value, End of Period | $4.00 | $3.62 | $6.75 | $5.89 | $5.38 |
| Total Return2 | 10.50% | (40.60)% | 30.45% | 16.31% | 13.47% |
| Ratios to Average Net Assets: | | | | | |
| Net expenses | 2.50%3 | 2.50%3 | 2.50%3 | 2.50% | 2.49% |
| Net investment income (loss) | (0.67)% | (1.11)% | (1.18)% | (1.54)% | (1.56)% |
| Expense waiver/reimbursement4 | 0.22% | 0.19% | 0.18% | 0.18% | 0.16% |
| Supplemental Data: | | | | | |
| Net assets, end of period (000 omitted) | $656,086 | $707,980 | $1,246,604 | $918,502 | $724,468 |
| Portfolio turnover | 91% | 78% | 49% | 64% | 71% |
| 1 | Per share numbers have been calculated using the average shares method. |
| 2 | Based on net asset value, which does not reflect the sales charge, redemption fee or contingent deferred sales charge, if applicable. |
| 3 | The net expense ratio is calculated without reduction for expense offset arrangements. The net expense ratios are 2.50%, 2.50% and 2.50% for the years ended October 31, 2009, 2008 and 2007, respectively, after taking into account these expense reductions. |
| 4 | This expense decrease is reflected in both the net expense and the net investment income (loss) ratios shown above. |
- See Notes which are an integral part of the Financial Statements
Annual Shareholder Report3
Shareholder Expense Example (unaudited)
As a shareholder of the Fund, you incur two types of costs: (1) transaction costs, including sales charges (loads) on purchase or redemption payments; and (2) ongoing costs, including management fees and to the extent applicable, distribution (12b-1) fees and/or shareholder services fees and other Fund expenses. This Example is intended to help you to understand your ongoing costs (in dollars) of investing in the Fund and to compare these costs with the ongoing costs of investing in other mutual funds. It is based on an investment of $1,000 invested at the beginning of the period and held for the entire period from May 1, 2009 to October 31, 2009.
ACTUAL EXPENSES
The first section of the table below provides information about actual account values and actual expenses. You may use the information in this section, together with the amount you invested, to estimate the expenses that you incurred over the period. Simply divide your account value by $1,000 (for example, an $8,600 account value divided by $1,000 = 8.6), then multiply the result by the number in the first section under the heading entitled “Expenses Paid During Period” to estimate the expenses attributable to your investment during this period.
HYPOTHETICAL EXAMPLE FOR COMPARISON PURPOSES
The second section of the table below provides information about hypothetical account values and hypothetical expenses based on the Fund's actual expense ratio and an assumed rate of return of 5% per year before expenses, which is not the Fund's actual return. Thus, you should not use the hypothetical account values and expenses to estimate the actual ending account balance or your expenses for the period. Rather, these figures are required to be provided to enable you to compare the ongoing costs of investing in the Fund with other funds. To do so, compare this 5% hypothetical example with the 5% hypothetical examples that appear in the shareholder reports of the other funds.
Annual Shareholder Report4
Please note that the expenses shown in the table are meant to highlight your ongoing costs only and do not reflect any transaction costs, such as sales charges (loads) on purchase or redemption payments. Therefore, the second section of the table is useful in comparing ongoing costs only, and will not help you determine the relative total costs of owning different funds. In addition, if these transaction costs were included, your costs would have been higher. | Beginning
Account Value
5/1/2009 | Ending
Account Value
10/31/2009 | Expenses Paid
During Period1 |
| Actual: | | | |
| Class A Shares | $1,000 | $1,192.10 | $10.77 |
| Class B Shares | $1,000 | $1,190.50 | $13.80 |
| Class C Shares | $1,000 | $1,190.50 | $13.80 |
Hypothetical (assuming a 5% return
before expenses): | | | |
| Class A Shares | $1,000 | $1,015.38 | $9.91 |
| Class B Shares | $1,000 | $1,012.60 | $12.68 |
| Class C Shares | $1,000 | $1,012.60 | $12.68 |
| 1 | Expenses are equal to the Fund's annualized net expense ratios, multiplied by the average account value over the period, multiplied by 184/365 (to reflect the one-half-year period). The annualized net expense ratios are as follows: |
| Class A Shares | 1.95% |
| Class B Shares | 2.50% |
| Class C Shares | 2.50% |
Annual Shareholder Report5
Performance data quoted represents past performance which is no guarantee of future results. Investment return and principal value will fluctuate so that an investor's shares, when redeemed, may be worth more or less than their original cost. Mutual fund performance changes over time and current performance may be lower or higher than what is stated. For current to the most recent month-end performance and after-tax returns, visit FederatedInvestors.com or call 1-800-341-7400.
Management's Discussion of Fund Performance (unaudited)
The Federated Kaufmann Fund's Class A Shares, Class B Shares and Class C Shares produced total returns of 11.05%, 10.50% and 10.50%, respectively, based on the net asset value for the reporting period ended October 31, 2009. The Fund's benchmark, the Russell Midcap Growth Index,1 had a total return of 22.48% for the reporting period and the Lipper Mid-Cap Growth Funds Category2 had a median total return of 16.79%. The Fund's total return for the reporting period reflected actual cash flows, transaction costs and other expenses which were not reflected in the total return of the Russell Midcap Growth Index.
The following discussion will focus on the performance of the Fund's
Class A Shares.
MARKET OVERVIEW
The stock market as a whole posted strong positive returns during the latter portion of the reporting period. The global financial crisis continued throughout the period but in March the Standard & Poor's 500 Index (S&P 500 Index)3 bottomed and began a 50% plus rally. Mid-cap stocks performed best during the period followed by large-cap stocks and then small-cap stocks. In terms of style, growth stocks outperformed value stocks across large-, mid- and small-cap stock groupings.
The period began with economies across the world slowing as credit contracted. In response to the credit crisis, the Federal Reserve, as well as many other countries, cut their discount and federal funds target rates several times at the beginning of the reporting period and maintained them at their lowest levels. The end of the period was marked by a light at the end of the tunnel with some positive economic data on housing, productivity, corporate profits and trade appearing.
| 1 | The Russell Midcap Growth Index measures the performance of those Russell Midcap companies with higher price-to-book ratios and higher forecasted growth values. The stocks are also members of the Russell 1000 Growth Index. The index is unmanaged and, unlike the Fund, is not affected by cash flows. Investments cannot be made in an index. |
| 2 | Lipper figures represent the average of the total returns reported by all the mutual funds designated by Lipper, Inc. as falling into the category indicated. They do not reflect sales charges. |
| 3 | The S&P 500 Index is an unmanaged capitalization-weighted index of 500 stocks designed to measure performance of the broad domestic economy through changes in the aggregate market value of 500 stocks representing all major industries. Investments cannot be made directly in an index. |
Annual Shareholder Report6
The strongest sectors in the Russell Midcap Growth Index during the period were Materials (+36%), Information Technology (+32%) and Consumer Discretionary (+28%). The weakest sectors were Telecom Services (-0.9%), Utilities (+10%) and Financials (+13%). FUND PERFORMANCE
The Fund underperformed its respective peer average and benchmark index over the reporting period. The Fund's performance is driven primarily by bottom-up stock selection. Five of the Fund's top ten contributing companies across multiple sectors each returned over 60% during the reporting period. Specifically, Hypermarcas SA (+276%), Lee & Mann Paper Manufacturing Ltd. (+543%), Goldman Sachs (+86%), Nine Dragons Paper (+805%) and Housing Development Finance Corp. (+61%) contributed strongly to the Fund's performance. In addition, Auxilium Pharmaceuticals (+60%), Warner Chilcott Plc. (+59%), Dresser-Rand Group (+31%), Mastercard (+48%) and Chimera (+32%) were also among the Fund's top 10 contributing companies.
Five of the Fund's laggard companies were in the Financials Sector. Specifically, Bank of America (-38%), Wells Fargo (-16%), Loews Corp. (-26%), JP Morgan Chase (+3%) and Berkshire Hathaway (-20%) detracted from performance. Additional laggards included General Electric (-47%), Walter Industries (-53%), Cubist Pharmaceuticals (-33%), AMR (-79%) and Progenics (-58%). A particular industry that negatively affected performance was Pharmaceutical/Biotech where 14 of the Fund's holdings in the industry were down more than 30%. While it is interesting to know how specific stocks performed during the period, the success of these holdings won't be known until they are sold, typically over longer periods.
The sector exposures that result from the Fund's bottom-up investment process may provide some additional insight into the Fund's relative performance. An overweight in the Financials sector and underweight in Information Technology, relative to the benchmark, hurt performance somewhat. The Fund's performance was also negatively impacted by the Fund's cash position which averaged 8.7% during the period.
Annual Shareholder Report7
FEDERATED KAUFMANN FUND - CLASS A SHARES
Average Annual Total Returns for the Period Ended 10/31/2009
| 6-Month
(Cumulative) | 1-Year | 3-Years | 5-Years | 10-Years | 15-Years |
Federated Kaufmann Fund -
Class A Shares2 | 12.65% | 4.94% | -6.40% | 1.83% | 7.12% | 8.88% |
| Russell Midcap Growth Index3 | 19.87% | 22.48% | -5.61% | 2.22% | 1.01% | 7.35% |
| Lipper Mid-Cap Growth Index3 | 19.16% | 19.95% | -3.00% | 3.35% | 0.60% | 6.72% |
Performance data quoted represents past performance which is no guarantee of future results. Investment return and principal value will fluctuate so that an investor's shares, when redeemed, may be worth more or less than their original cost. Mutual fund performance changes over time and current performance may be lower or higher than what is stated. For current to the most recent month-end performance and after-tax returns, visit FederatedInvestors.com or call 1-800-341-7400. Returns shown do not reflect the deduction of taxes that a shareholder would pay on Fund distributions or the redemption of Fund shares. Mutual funds are not obligations of or guaranteed by any bank and are not federally insured. Total returns shown include the maximum sales charge of 5.50%.
| 1 | Represents a hypothetical investment of $10,000 in the Fund after deducting the maximum sales charge of 5.50% ($10,000 investment minus $550 sales charge = $9,450). The Fund's performance assumes the reinvestment of all dividends and distributions. The Russell Midcap Growth Index (RMGI) and the Lipper Mid-Cap Growth Index (LMCGI) have been adjusted to reflect reinvestment of all dividends on securities in the indexes. The Fund is a successor to the Kaufmann Fund, Inc. (Kaufmann Fund) pursuant to a reorganization that took place on April 23, 2001. Prior to that date, the Fund had no investment operations. Accordingly, the performance information provided is historical information of the Kaufmann Fund, but has been adjusted to reflect the expenses applicable to the Fund's Class A Shares. |
| 2 | Total returns quoted reflect all applicable sales charges. |
| 3 | The RMGI is not adjusted to reflect sales charges, expenses or other fees that the Securities and Exchange Commission (SEC) requires to be reflected in the Fund's performance. The RMGI measures the performance of those Russell Midcap companies with higher price-to-book ratios and higher forecasted growth values. The stocks are also members of the Russell 1000 Growth Index. The LMCGI is an equal dollar-weighted index of the largest mutual funds within the mid-cap growth classification, as defined by Lipper, Inc. The LMCGI does not reflect sales charges and is adjusted for the reinvestment of capital gains and income dividends. The RMGI is unmanaged and, unlike the Fund, is not affected by cash flows. Investments cannot be made in an index. |
Annual Shareholder Report8
FEDERATED KAUFMANN FUND - CLASS B SHARES
Average Annual Total Returns for the Period Ended 10/31/2009
| 6-Month
(Cumulative) | 1-Year | 3-Years | 5-Years | 10-Years | 15-Years |
Federated Kaufmann Fund -
Class B Shares2 | 13.55% | 5.00% | -6.06% | 2.19% | 7.28% | 8.99% |
| Russell Midcap Growth Index3 | 19.87% | 22.48% | -5.61% | 2.22% | 1.01% | 7.35% |
| Lipper Mid-Cap Growth Index3 | 19.16% | 19.95% | -3.00% | 3.35% | 0.60% | 6.72% |
Performance data quoted represents past performance which is no guarantee of future results. Investment return and principal value will fluctuate so that an investor's shares, when redeemed, may be worth more or less than their original cost. Mutual fund performance changes over time and current performance may be lower or higher than what is stated. For current to the most recent month-end performance and after-tax returns, visit FederatedInvestors.com or call 1-800-341-7400. Returns shown do not reflect the deduction of taxes that a shareholder would pay on Fund distributions or the redemption of Fund shares. Mutual funds are not obligations of or guaranteed by any bank and are not federally insured. Total returns shown include the maximum contingent deferred sales charge of 5.50%, as applicable.
| 1 | Represents a hypothetical investment of $10,000 in the Fund. The ending value of the Fund does not reflect a contingent deferred sales charge on any redemption over seven years from the purchase date. The maximum contingent deferred sales charge is 5.50% on any redemption less than one year from the purchase date. The Fund's performance assumes the reinvestment of all dividends and distributions. The Russell Midcap Growth Index (RMGI) and the Lipper Mid-Cap Growth Index (LMCGI) have been adjusted to reflect reinvestment of all dividends on securities in the indexes. The Fund is a successor to the Kaufmann Fund, Inc. (Kaufmann Fund) pursuant to a reorganization that took place on April 23, 2001. Prior to that date, the Fund had no investment operations. Accordingly, the performance information provided is historical information of the Kaufmann Fund, but has been adjusted to reflect the expenses applicable to the Fund's Class B Shares. |
| 2 | Total returns quoted reflect all applicable contingent deferred sales charges. |
| 3 | The RMGI is not adjusted to reflect sales charges, expenses or other fees that the SEC requires to be reflected in the Fund's performance. The RMGI measures the performance of those Russell Midcap companies with higher price-to-book ratios and higher forecasted growth values. The stocks are also members of the Russell 1000 Growth Index. The LMCGI is an equal dollar-weighted index of the largest mutual funds within the mid-cap growth classification, as defined by Lipper, Inc. The LMCGI does not reflect sales charges and is adjusted for the reinvestment of capital gains and income dividends. The RMGI is unmanaged and, unlike the Fund, is not affected by cash flows. Investments cannot be made in an index. |
Annual Shareholder Report9
FEDERATED KAUFMANN FUND - CLASS C SHARES
Average Annual Total Returns for the Period Ended 10/31/2009
| 6-Month
(Cumulative) | 1-Year | 3-Years | 5-Years | 10-Years | 15-Years |
Federated Kaufmann Fund -
Class C Shares2 | 18.05% | 9.50% | -5.04% | 2.47% | 7.19% | 8.74% |
| Russell Midcap Growth Index3 | 19.87% | 22.48% | -5.61% | 2.22% | 1.01% | 7.35% |
| Lipper Mid-Cap Growth Index3 | 19.16% | 19.95% | -3.00% | 3.35% | 0.60% | 6.72% |
Performance data quoted represents past performance which is no guarantee of future results. Investment return and principal value will fluctuate so that an investor's shares, when redeemed, may be worth more or less than their original cost. Mutual fund performance changes over time and current performance may be lower or higher than what is stated. For current to the most recent month-end performance and after-tax returns, visit FederatedInvestors.com or call 1-800-341-7400. Returns shown do not reflect the deduction of taxes that a shareholder would pay on Fund distributions or the redemption of Fund shares. Mutual funds are not obligations of or guaranteed by any bank and are not federally insured. Total returns shown include the maximum contingent deferred sales charge of 1.00%, as applicable.
| 1 | Represents a hypothetical investment of $10,000 in the Fund. The maximum contingent deferred sales charge is 1.00% on any redemption less than one year from the purchase date. Effective April 1, 2003, the Fund began to charge a maximum sales charge of 1.00%. Effective February 1, 2007, this sales charge was eliminated. The Fund's performance assumes the reinvestment of all dividends and distributions. The Russell Midcap Growth Index (RMGI) and the Lipper Mid-Cap Growth Index (LMCGI) have been adjusted to reflect reinvestment of all dividends on securities in the indexes. The Fund is a successor to the Kaufmann Fund, Inc. (Kaufmann Fund) pursuant to a reorganization that took place on April 23, 2001. Prior to that date, the Fund had no investment operations. Accordingly, the performance information provided is historical information of the Kaufmann Fund, but has been adjusted to reflect the expenses applicable to the Fund's Class C Shares. |
| 2 | Total returns quoted reflect all applicable contingent deferred sales charges. |
| 3 | The RMGI is not adjusted to reflect sales charges, expenses or other fees that the SEC requires to be reflected in the Fund's performance. The RMGI measures the performance of those Russell Midcap companies with higher price-to-book ratios and higher forecasted growth values. The stocks are also members of the Russell 1000 Growth Index. The LMCGI is an equal dollar-weighted index of the largest mutual funds within the mid-cap growth classification, as defined by Lipper, Inc. The LMCGI does not reflect sales charges and is adjusted for the reinvestment of capital gains and income dividends. The RMGI is unmanaged and, unlike the Fund, is not affected by cash flows. Investments cannot be made in an index. |
Annual Shareholder Report10
Portfolio of Investments Summary Table (unaudited)
At October 31, 2009, the Fund's sector composition1 was as follows:
| Sector Composition | | Percentage of
Total Net Assets |
| Health Care | | 30.1% |
| Financials | | 18.8% |
| Industrials | | 13.4% |
| Information Technology | | 11.7% |
| Materials | | 8.2% |
| Consumer Discretionary | | 6.0% |
| Consumer Staples | | 4.2% |
| Energy | | 2.8% |
| Telecommunication Services | | 1.8% |
| Utilities | | 1.3% |
| Other Security2 | | 0.1% |
| Securities Lending Collateral3 | | 25.8% |
| Security Sold Short | | (0.1)% |
| Cash Equivalents4 | | 1.4% |
| Other Assets and Liabilities — Net5 | | (25.5)% |
| TOTAL | | 100.0% |
| 1 | Except for Other Security, Securities Lending Collateral, Security Sold Short, Cash Equivalents and Other Assets and Liabilities, sector classifications are based upon, and individual portfolio securities are assigned to, the classifications of the Global Industry Classification System (GICS), except that the Adviser assigns a classification to securities not classified by the GICS and to securities for which the Adviser does not have access to the classification made by the GICS. |
| 2 | Other Security includes a U.S. Treasury Security. |
| 3 | Cash collateral received from lending portfolio securities, which is invested in short-term investments such as repurchase agreements or money market mutual funds. |
| 4 | Cash Equivalents include any investments in money market mutual funds and/or overnight repurchase agreements other than those representing securities lending collateral. |
| 5 | Assets, other than investments in securities and security sold short, less liabilities. See Statement of Assets and Liabilities. |
Annual Shareholder Report11
Portfolio of Investments
October 31, 2009
|
| Shares or Principal Amount | | | Value in U.S. Dollars |
| | Common Stocks – 94.4% | |
| | Consumer Discretionary – 5.3% | |
| 1,275,541 | 1,2 | ATA, Inc., ADR | 6,594,547 |
| 403,100 | 1,2,3,4 | B2W Companhia Global Do Varejo, GDR | 23,339,490 |
| 3,009,050 | | Bharat Forge Ltd. | 15,581,150 |
| 268,929 | 1,2 | Bridgepoint Education, Inc. | 3,813,413 |
| 2,667,050 | 1 | Cia Hering | 32,172,350 |
| 1,711,300 | | Cyrela Brazil Realty S.A. Empreendimentos e Participacoes | 21,857,544 |
| 744,895 | 1 | Dolan Media Co. | 8,894,046 |
| 325,900 | 1,3,4 | Dollarama, Inc., Series 144A | 5,812,920 |
| 250,000 | 1,2 | Focus Media Holding Ltd., ADR | 3,010,000 |
| 15,000,000 | 1,2 | Ford Motor Co. | 105,000,000 |
| 1,000,000 | 1,3,4 | Hydrogen Corp. | 20,000 |
| 500,000 | 1 | Imax Corp. | 5,150,000 |
| 150,950 | 1 | Lincoln Educational Services | 2,991,829 |
| 50,374 | | Marriott International, Inc., Class A | 1,262,373 |
| 2,358,759 | 5 | National CineMedia, Inc. | 37,740,144 |
| 100,000 | 1,2 | New Oriental Education & Technology Group, Inc., ADR | 6,984,000 |
| 2,115,500 | 1 | New World Department Store China | 1,891,815 |
| 3,754,900 | | Parkson Retail Group Ltd. | 6,081,661 |
| 244,300 | 1,2 | Penn National Gaming, Inc. | 6,139,259 |
| 545,000 | 2 | Regis Corp. | 8,850,800 |
| 11,997,538 | 1,5 | Restoque Comercio e Confeccoes de Roupas SA | 27,923,425 |
| 885,200 | 1 | SEB — Sistema Educacional Brasileiro SA | 8,592,711 |
| 4,737,275 | 1 | Wynn Macau Ltd. | 6,112,455 |
| | TOTAL | 345,815,932 |
| | Consumer Staples – 4.2% | |
| 230,000 | | Anheuser-Busch InBev NV | 10,809,058 |
| 6,705,000 | 1 | Hypermarcas SA | 137,289,595 |
| 500,000 | | Kellogg Co. | 25,770,000 |
| 1,650,000 | | Philip Morris International, Inc. | 78,144,000 |
| 400,000 | 1 | Ralcorp Holdings, Inc. | 21,480,000 |
| | TOTAL | 273,492,653 |
| | Energy – 2.7% | |
| 4,943,000 | 1 | Atlas Acquisition Holdings Corp. | 49,528,860 |
| 529,850 | 2 | Chesapeake Energy Corp. | 12,981,325 |
Annual Shareholder Report12
|
| 220,000 | 1 | China Integrated Energy, Inc. | 1,265,000 |
| 3,000,000 | 1,2 | Dresser-Rand Group, Inc. | 88,410,000 |
| 220,406 | 1 | Oil India Ltd. | 5,218,129 |
| 719,825 | 1,2 | Sandridge Energy, Inc. | 7,363,810 |
| 250,500 | 2 | XTO Energy, Inc. | 10,410,780 |
| | TOTAL | 175,177,904 |
| | Financials – 18.3% | |
| 1,000,000 | | American Express Co. | 34,840,000 |
| 770,000 | | Axis Capital Holdings Ltd. | 22,245,300 |
| 1,672,400 | 1 | BR Malls Participacoes | 18,512,602 |
| 500,000 | | Bank of America Corp. | 7,290,000 |
| 2,000,000 | 2 | Bank of New York Mellon Corp. | 53,320,000 |
| 1,000,000 | | Berkley, W. R. Corp. | 24,720,000 |
| 180,000 | 2 | Blackrock, Inc. | 38,968,200 |
| 8,718,450 | 1,5 | Brasil Brokers Participacoes | 30,189,910 |
| 17,903,500 | 1,5 | CETIP SA | 119,925,806 |
| 52,600,000 | 2,5 | Chimera Investment Corp. | 183,574,000 |
| 164,606 | 1 | CreXus Investment Corp. | 2,334,113 |
| 1 | 1,3,6 | FA Private Equity Fund IV LP | 856,906 |
| 500,000 | | Goldman Sachs Group, Inc. | 85,085,000 |
| 500,000 | 1 | Government Properties Income Trust | 11,640,000 |
| 350,000 | 2 | Greenhill & Co., Inc. | 30,180,500 |
| 1,347,650 | | Housing Development Finance Corp. Ltd. | 74,443,782 |
| 1 | 1,3,6 | Infrastructure Fund | 20,555 |
| 3,250,000 | 2 | J.P. Morgan Chase & Co. | 135,752,500 |
| 1,344,851 | 1 | LPS Brasil Cons De Imoveis | 14,428,749 |
| 2,000,000 | 2 | Morgan Stanley | 64,240,000 |
| 1,000,000 | 1 | Multiplan Empreendimentos Imobiliarios SA | 15,326,976 |
| 27,847,407 | | PT Bank Central Asia | 13,214,151 |
| 1 | 1,3,6 | Peachtree Leadscope LLC, Class A and B | 0 |
| 1 | 1,3,6 | Peachtree Leadscope LLC, Class C | 3,250,000 |
| 2,000,000 | | Power Finance Corp. | 9,260,291 |
| 1 | 1,3,6 | Rocket Ventures II | 0 |
| 2,000,000 | | Rural Electrification Corp. Ltd. | 8,338,652 |
| 1,350,000 | 2 | State Street Corp. | 56,673,000 |
| 54,231 | | Transatlantic Holdings, Inc. | 2,738,666 |
| 3,000,000 | 1,5 | Two Harbors Investment Co. | 29,070,000 |
Annual Shareholder Report13
|
| 1 | 1,3,6 | Venworks | 0 |
| 3,000,000 | 2 | Wells Fargo & Co. | 82,560,000 |
| 1,000,000 | 2 | Willis Group Holdings Ltd. | 27,000,000 |
| | TOTAL | 1,199,999,659 |
| | Health Care – 28.7% | |
| 989,111 | 1 | AGA Medical Holdings, Inc. | 13,224,414 |
| 425,441 | 1 | Alexza Pharmaceuticals, Inc. | 910,444 |
| 12,057,000 | 1,2,5 | Alkermes, Inc. | 96,094,290 |
| 1,100,000 | 2 | Allergan, Inc. | 61,875,000 |
| 1 | 3,6 | Apollo Investment Fund V | 5,936,545 |
| 2 | 1,6 | Ardais Corp. | 0 |
| 9,850,800 | 1,2,5 | Arena Pharmaceuticals, Inc. | 34,773,324 |
| 1,208,261 | 1,2 | Athenahealth, Inc. | 45,442,696 |
| 3,307,017 | 1,2,5 | Auxilium Pharmaceutical, Inc. | 104,038,755 |
| 450,000 | | Baxter International, Inc. | 24,327,000 |
| 3,250,000 | 1,2 | BioMarin Pharmaceutical, Inc. | 50,570,000 |
| 755,679 | 1,2 | Cepheid, Inc. | 10,027,860 |
| 185,980 | 1 | Chindex International, Inc. | 2,592,561 |
| 274,595 | 1,2 | Chindex International, Inc. | 3,827,854 |
| 625,000 | 3 | Conceptus, Inc. | 10,962,500 |
| 600,000 | 1,3,4,5 | Conceptus, Inc. | 10,524,000 |
| 714,286 | 3,5 | Conceptus, Inc. | 12,528,576 |
| 3,634,700 | 1,2,5 | Conceptus, Inc. | 63,752,638 |
| 2,278,165 | 1,6 | Corcept Therapeutics, Inc. | 3,758,972 |
| 500,000 | 1,3,6 | Cortek, Inc. | 0 |
| 7,000,000 | 1,2,5 | Cubist Pharmaceuticals, Inc. | 118,580,000 |
| 800,000 | 1,2 | Cypress Biosciences, Inc. | 4,912,000 |
| 1 | 3,6 | Denovo Ventures I LP | 3,034,000 |
| 4,916,800 | 1,2,5 | Dexcom, Inc. | 33,729,248 |
| 126,065 | 1 | Dexcom, Inc. Restricted | 864,806 |
| 1,367,900 | | Dishman Pharmaceuticals & Chemicals Ltd. | 6,686,291 |
| 552,681 | 1 | Durect Corp. | 1,166,157 |
| 11,355,088 | 1,5 | Dyax Corp. | 35,654,976 |
| 600,000 | 1 | Emergency Medical Services Corp., Class A | 28,812,000 |
| 3,555,556 | 1 | Endologix, Inc. | 16,924,447 |
| 6,915,528 | 1,2,3,5 | Endologix, Inc. | 32,917,913 |
| 4,847,764 | 1,5 | Epigenomics AG | 21,291,255 |
Annual Shareholder Report14
|
| 900,000 | 1,2 | Express Scripts, Inc., Class A | 71,928,000 |
| 100,000 | 1,2 | Genoptix, Inc. | 3,479,000 |
| 500,000 | | Hikma Pharmaceuticals PLC | 3,862,415 |
| 1,100,000 | 1,2 | Human Genome Sciences, Inc. | 20,559,000 |
| 4,000,000 | 1,2 | Illumina, Inc. | 128,400,000 |
| 2,850,000 | 1,2,5 | Insulet Corp. | 31,635,000 |
| 6,880,757 | 1,2,5 | Isis Pharmaceuticals, Inc. | 87,179,191 |
| 1 | 3,6 | Latin Healthcare Fund | 940,831 |
| 100,000 | 1,2 | LifeWatch AG | 1,941,470 |
| 1,816,541 | 1,2 | Masimo Corp. | 48,265,494 |
| 1,000,000 | 1,2 | Momenta Pharmaceuticals, Inc. | 9,120,000 |
| 1,800,000 | 1,2 | Mylan Laboratories, Inc. | 29,232,000 |
| 1,000,000 | 1,2 | Nektar Therapeutics | 8,120,000 |
| 2,395,733 | 1,5 | Neurocrine Biosciences, Inc. | 5,318,527 |
| 50,000 | 1,2 | NuVasive, Inc. | 1,814,500 |
| 2,091,860 | 1,2 | Orexigen Therapeutics, Inc. | 13,513,416 |
| 5,000,000 | 1,2,5 | Orthovita, Inc. | 17,500,000 |
| 3,500,000 | 1,5 | OSI Pharmaceuticals, Inc. | 112,770,000 |
| 1 | 1,3,6 | Peachtree Velquest | 0 |
| 3,460,000 | 1,5 | Pharmacyclics, Inc. | 6,747,000 |
| 2,000,000 | | Piramal Healthcare Ltd. | 15,746,238 |
| 4,700,000 | 1,5 | Progenics Pharmaceuticals, Inc. | 19,693,000 |
| 1,808,400 | 1,2 | Protalix Biotherapeutics, Inc. | 17,143,632 |
| 379,300 | 1,2 | Regeneron Pharmaceuticals, Inc. | 5,955,010 |
| 2,791,203 | 1,5 | Repligen Corp. | 13,621,071 |
| 500,000 | 1,2 | ResMed, Inc. | 24,605,000 |
| 1,001,800 | 1,2 | Savient Pharmaceuticals, Inc. | 12,622,680 |
| 3,000,000 | 1,2 | Seattle Genetics, Inc. | 27,240,000 |
| 1,000,000 | 1 | Select Medical Holdings Corp. | 9,700,000 |
| 190,400 | 1 | Sinopharm Medicine Holding Co., Ltd. | 689,107 |
| 274 | 1,6 | Soteira, Inc. | 176 |
| 2,000,000 | 1,2 | Spectrum Pharmaceuticals, Inc. | 8,300,000 |
| 4,000,000 | 1 | Talecris Biotherapeutics Holdings Corp. | 80,240,000 |
| 4,284,497 | 1,6 | Threshold Pharmaceuticals, Inc. | 8,697,529 |
| 7,738,820 | 1,2,5 | Vical, Inc. | 23,835,565 |
| 1,659,917 | 1,2 | Vivus, Inc. | 13,113,344 |
Annual Shareholder Report15
|
| 5,900,000 | 1,2 | Warner Chilcott PLC | 130,685,000 |
| | TOTAL | 1,873,953,718 |
| | Industrials – 13.0% | |
| 350,000 | | 3M Co. | 25,749,500 |
| 1,150,500 | | Bharat Heavy Electricals Ltd. | 53,343,318 |
| 1,340,000 | 2 | CLARCOR, Inc. | 39,436,200 |
| 566,509 | | CSX Corp. | 23,895,350 |
| 401,100 | 1,2 | Copart, Inc. | 12,903,387 |
| 500,000 | 1,2 | CoStar Group, Inc. | 19,410,000 |
| 1,180,873 | | Crompton Greaves Ltd. | 9,499,327 |
| 375,000 | | Danaher Corp. | 25,586,250 |
| 2,000,000 | 2 | Expeditors International Washington, Inc. | 64,440,000 |
| 900,000 | 2 | FedEx Corp. | 65,421,000 |
| 100,000 | 1 | First Solar, Inc. | 12,193,000 |
| 500,000 | 2 | Genco Shipping & Trading Ltd. | 9,945,000 |
| 924,656 | 1,2 | GeoEye, Inc. | 23,458,523 |
| 400,000 | 1,2 | IHS, Inc., Class A | 20,704,000 |
| 600,000 | 1 | Iron Mountain, Inc. | 14,658,000 |
| 11,000,000 | 1,2 | Jet Blue Airways Corp. | 54,560,000 |
| 255,100 | 2 | Joy Global, Inc. | 12,859,591 |
| 3,245,716 | | Max India Ltd. | 12,255,409 |
| 344,055 | | Norfolk Southern Corp. | 16,039,844 |
| 380,000 | 2 | Precision Castparts Corp. | 36,301,400 |
| 800,000 | 1 | Quanta Services, Inc. | 16,960,000 |
| 1,968,000 | 1 | RailAmerica, Inc. | 23,163,360 |
| 450,000 | 2 | Rockwell Collins | 22,671,000 |
| 500,000 | 2 | Roper Industries, Inc. | 25,275,000 |
| 2,900,000 | 1,2 | Ryanair Holdings PLC, ADR | 79,083,000 |
| 332,410 | 1 | SmartHeat, Inc. | 2,971,745 |
| 550,000 | 2 | Union Pacific Corp. | 30,327,000 |
| 400,000 | | United Technologies Corp. | 24,580,000 |
| 2,736,970 | 1 | Verisk Analytics, Inc. | 75,075,087 |
| | TOTAL | 852,765,291 |
| | Information Technology – 11.3% | |
| 358,500 | | Advantest Corp. | 7,864,280 |
| 981,607 | 1 | Affiliated Computer Services, Inc., Class A | 51,131,909 |
| 378,133 | 1,2 | Akamai Technologies, Inc. | 8,318,926 |
Annual Shareholder Report16
|
| 50,000 | 1 | Amdocs Ltd. | 1,260,000 |
| 1,125,000 | 1,2 | Blackboard, Inc. | 39,903,750 |
| 4,612,700 | 1 | Cia Brasileira de Meios de Pagamentos | 42,288,320 |
| 3,000,000 | 1 | Comverse Technology, Inc. | 25,200,000 |
| 1,550,000 | 1 | Dell, Inc. | 22,459,500 |
| 1,059,322 | 1,3,6 | Expand Networks Ltd. | 0 |
| 43,125 | 1 | Google, Inc. | 23,120,175 |
| 550,000 | 2 | Hewlett-Packard Co. | 26,103,000 |
| 2,380,000 | | Hon Hai Precision Industry Co. Ltd. | 9,370,216 |
| 50,395,000 | | Inotera Memories, Inc. | 29,907,591 |
| 13,553,200 | 1 | Inspur International Ltd. | 1,904,648 |
| 550,000 | | Lender Processing Services | 21,890,000 |
| 926,630 | 1 | ManTech International Corp., Class A | 40,641,992 |
| 450,000 | 2 | Mastercard, Inc. | 98,559,000 |
| 1,600,000 | 2 | Microchip Technology, Inc. | 38,336,000 |
| 6,000,000 | 1,2 | Micron Technology, Inc. | 40,740,000 |
| 800,000 | 1,2 | Microsemi Corp. | 10,648,000 |
| 2,144,060 | 1 | NIC, Inc. | 18,781,966 |
| 69,180 | | Nintendo Corp. Ltd. | 17,640,959 |
| 3,400,000 | 1,2 | ON Semiconductor Corp. | 22,746,000 |
| 1 | 1,3,6 | Peachtree Open Networks | 0 |
| 1,070,000 | 1,5 | RADWARE Ltd. | 12,379,900 |
| 3,709,800 | 1 | Redecard SA | 55,069,976 |
| 1 | 3,6 | Sensable Technologies, Inc. (Bridge Loan) | 100,279 |
| 3,751,199 | 1,3,6 | Sensable Technologies, Inc. | 0 |
| 2,011,100 | 1,2,5 | TNS, Inc. | 56,833,686 |
| 2,943,800 | 1 | Telecity Group PLC | 16,156,128 |
| | TOTAL | 739,356,201 |
| | Materials – 8.1% | |
| 904,800 | | Barrick Gold Corp. | 32,509,464 |
| 2,000,000 | 2 | Dow Chemical Co. | 46,960,000 |
| 700,000 | 2 | Ecolab, Inc. | 30,772,000 |
| 34,547,300 | 1 | Huabao International Holdings Ltd. | 32,629,319 |
| 369,050 | 1,2 | Intrepid Potash, Inc. | 9,506,728 |
| 36,273,628 | 1 | Lee & Man Paper Manufacturing Ltd. | 71,410,362 |
| 880,000 | | Monsanto Co. | 59,118,400 |
| 490,000 | 1 | Mosaic Co./The | 22,897,700 |
Annual Shareholder Report17
|
| 1,100,000 | | Newmont Mining Corp. | 47,806,000 |
| 33,986,100 | | Nine Dragons Paper Holdings Ltd. | 48,625,435 |
| 550,000 | 2 | Nucor Corp. | 21,917,500 |
| 440,000 | 2 | Potash Corp. of Saskatchewan, Inc. | 40,823,200 |
| 127,975 | 1 | Rockwood Holdings, Inc. | 2,544,143 |
| 900,000 | 2 | Sociedad Quimica Y Minera de Chile, ADR | 33,075,000 |
| 700,000 | | Steel Dynamics, Inc. | 9,373,000 |
| 200,000 | 1 | Terra Industries, Inc. | 6,354,000 |
| 13,905,000 | 1 | Yingde Gases Group Co. | 16,667,628 |
| | TOTAL | 532,989,879 |
| | Telecommunication Services – 1.7% | |
| 1,000,000 | 2 | CenturyTel, Inc. | 32,460,000 |
| 1,458,400 | 2 | NTELOS Holdings Corp. | 22,021,840 |
| 3,400,000 | 1,2 | TW Telecom, Inc. | 42,840,000 |
| 1,500,000 | | Windstream Corp. | 14,460,000 |
| | TOTAL | 111,781,840 |
| | Utilities – 1.1% | |
| 146,559 | 1 | BF Utilities Ltd. | 2,417,643 |
| 1,284,500 | 2 | ITC Holdings Corp. | 57,057,490 |
| 500,000 | 2 | Northeast Utilities Co. | 11,525,000 |
| | TOTAL | 71,000,133 |
| | TOTAL COMMON STOCKS
(IDENTIFIED COST $5,209,348,708) | 6,176,333,210 |
| | Warrants – 0.1% | |
| | Consumer Discretionary – 0.0% | |
| 250,000 | 1,6 | Hydrogen Corp., 5/5/2011 | 0 |
| 200,000 | 1,6 | Hydrogen Corp., 8/22/2013 | 0 |
| 870,000 | 1,6 | Hydrogen Corp., 10/23/2013 | 0 |
| | TOTAL | 0 |
| | Health Care – 0.1% | |
| 1,500,000 | 1 | Advancis Pharmaceutical Corp., 4/12/2012 | 210,295 |
| 382,897 | 1 | Alexza Pharmaceuticals, Inc., 10/15/2016 | 699,021 |
| 157,125 | 1 | Clinical Data, Inc., 5/24/2012 | 516 |
| 797,358 | 1 | Corcept Therapeutics, Inc., 10/16/2012 | 888,399 |
| 857,143 | 1 | Cyclacel Pharmaceuticals, Inc., 4/28/2013 | 307,062 |
| 242,091 | 1 | Cyclacel Pharmaceuticals, Inc., 2/17/2014 | 26,432 |
| 461,121 | 1 | Favrille, Inc., 3/7/2011 | 0 |
Annual Shareholder Report18
|
| 1,042,038 | 1 | Favrille, Inc., 11/7/2012 | 0 |
| 416,580 | 1 | Metabasis Therapeutics, Inc., 4/15/2013 | 40,860 |
| 222,650 | 1 | Pharmacopeia, Inc., 4/19/2011 | 3,826 |
| 978,500 | 1 | Spectrum Pharmaceuticals, Inc., 2/25/2010 | 602,603 |
| 1,713,798 | 1 | Threshold Pharmaceuticals, Inc., 10/5/2014 | 2,875,741 |
| 4,211,677 | 1,6 | Vasogen, Inc., 11/8/2011 | 0 |
| 1,874,085 | 1 | Vical, Inc., 2/21/2010 | 2,108,779 |
| | TOTAL | 7,763,534 |
| | TOTAL WARRANTS
(IDENTIFIED COST $1,158,685) | 7,763,534 |
| | Preferred Stocks – 0.9% | |
| | Consumer Discretionary – 0.3% | |
| 41,472 | 1,3,4 | Callaway Golf Co., Conv. Pfd., Series B, $1.88 Annual Dividend | 4,784,210 |
| 9,490 | 3,4 | Lodgenet Entertainment, Conv. Pfd., Series B, $29.17 Annual Dividend | 12,324,188 |
| | TOTAL | 17,108,398 |
| | Energy – 0.1% | |
| 41,000 | 3,4 | ATP Oil & Gas Corp., Conv. Pfd., Series 144A | 4,255,390 |
| | Health Care – 0.3% | |
| 1,694,915 | 1,3,6 | Ardais Corp., Conv. Pfd. | 0 |
| 790,960 | 1,3,6 | Ardais Corp., Conv. Pfd., Series C | 0 |
| 6,461,352 | | Bellus Health, Inc., Conv. Pfd., Series A | 1,104,891 |
| 446,816 | 1,3,6 | Cortek, Inc., Conv. Pfd., Series D2 | 0 |
| 1,515,152 | 1,3,6 | Cortex, Inc., Pfd., Series D | 0 |
| 20,000 | | Mylan Laboratories, Inc., Conv. Pfd. | 20,600,000 |
| 958,744 | 6 | Soteira, Inc., Pfd. | 616,988 |
| | TOTAL | 22,321,879 |
| | Information Technology – 0.0% | |
| 679,348 | 1,3,6 | Multiplex, Inc., Pfd., Series C | 0 |
| | Utilities – 0.2% | |
| 328,000 | 1 | FPL Group, Inc., Pfd. | 15,990,000 |
| | TOTAL PREFERRED STOCKS
(IDENTIFIED COST $79,252,060) | 59,675,667 |
Annual Shareholder Report19
|
| | Corporate Bonds – 2.8% | |
| | Consumer Discretionary – 0.4% | |
| $4,820,000 | | Brown Shoe Co., Inc., Company Guarantee, 8.75%, 5/1/2012 | 4,771,800 |
| 722,050 | 6 | Hydrogen Corp., 12.00%, 8/15/2010 | 144,410 |
| 15,107,000 | | Regis Corp., Conv. Bond, 5.00%, 7/15/2014 | 19,268,978 |
| | TOTAL | 24,185,188 |
| | Financials – 0.5% | |
| 8,448,000 | 3,4 | Alexandria Real Estate Equities, Inc., Conv. Bond, 8.00%, 4/15/2029 | 12,793,820 |
| 1,636,000 | | Developers Diversified Realty, 9.625%, 3/15/2016 | 1,662,580 |
| 12,723,000 | 3,4 | GLG Partners, Inc., Conv. Bond, Series 144A, 5.00%, 5/15/2014 | 11,534,672 |
| 5,044,000 | | HRPT Properties Trust, Sr. Secd. Note, 6.95%, 4/1/2012 | 5,252,301 |
| | TOTAL | 31,243,373 |
| | Health Care – 1.0% | |
| 9,401,000 | | CONMED Corp., Conv. Sr. Sub. Note, 2.50%, 11/15/2024 | 8,713,975 |
| 29,646,000 | | Insulet Corp., Sr. Unsecd. Note, 5.375%, 6/15/2013 | 24,767,454 |
| 19,800,000 | 3,4 | Isis Pharmaceuticals, Inc., Conv. Bond, 2.625%, 2/15/2027 | 20,988,000 |
| 5,908,900 | | Nektar Therapeutics, Conv. Bond, 3.25%, 9/28/2012 | 5,349,522 |
| 8,450,000 | 2 | Wright Medical Group, Inc., 2.625%, 12/1/2014 | 7,009,275 |
| | TOTAL | 66,828,226 |
| | Industrials – 0.4% | |
| 4,087,000 | | AMR Corp., Conv. Bond, 6.25%, 10/15/2014 | 3,393,232 |
| 6,700,000 | 3,4 | Covanta Holding Corp., Conv. Bond, Series 144A, 3.25%, 6/1/2014 | 7,477,870 |
| 2,944,000 | 2 | Jet Blue Airways Corp., Conv. Bond, Series A, 6.75%, 10/15/2039 | 3,768,761 |
| 13,331,000 | | Quanta Services, Inc., Conv. Bond, 3.75%, 4/30/2026 | 14,926,721 |
| | TOTAL | 29,566,584 |
| | Information Technology – 0.4% | |
| 24,802,000 | 3,4 | BearingPoint, Inc., Conv. Bond, 5.00%, 4/15/2025 | 4,743,383 |
| 7,191,000 | | FEI Co., 2.875%, 6/1/2013 | 7,549,687 |
| 3,752,000 | | GSI Commerce, Inc., Conv. Bond, 3.00%, 6/1/2025 | 4,331,722 |
| 7,620,000 | | Safeguard Scientifics, Inc., 2.625%, 3/15/2024 | 7,180,577 |
| | TOTAL | 23,805,369 |
| | Telecommunication Services – 0.1% | |
| 7,848,000 | 3,4 | SBA Communications, Corp., Conv. Bond, 4.00%, 10/1/2014 | 9,094,655 |
| | TOTAL CORPORATE BONDS
(IDENTIFIED COST $187,742,537) | 184,723,395 |
Annual Shareholder Report20
|
| | Corporate Note – 0.1% | |
| | Materials – 0.1% | |
| $7,055,000 | | Newmont Mining Corp., Conv. Note, 3.00%, 2/15/2012
(IDENTIFIED COST $7,055,000) | 8,450,902 |
| | U.S. Treasury – 0.1% | |
| 4,000,000 | 2,7 | United States Treasury Bill, 0.06%, 2/4/2010
(IDENTIFIED COST $3,998,997) | 3,999,400 |
| | Mutual Fund – 27.2% | |
| 1,775,556,873 | 5,8,9 | Prime Value Obligations Fund, Institutional Shares, 0.22%
(AT NET ASSET VALUE) | 1,775,556,873 |
| | TOTAL INVESTMENTS — 125.6%
(IDENTIFIED COST $7,264,112,860)10 | 8,216,502,981 |
| | OTHER ASSETS AND LIABILITIES - NET — (25.6)%11 | (1,675,434,245) |
| | TOTAL NET ASSETS — 100% | $6,541,068,736 |
schedule of SecuritY Sold Short
| 100,000 | Time Warner Cable, Inc. (Proceeds $2,494,876) | $3,944,000 |
- At October 31, 2009, the Fund had outstanding foreign exchange contracts as follows:
| Settlement Date | Foreign Currency
Units to
Deliver/Receive | In
Exchange
For | Unrealized
Appreciation/
(Depreciation) |
| Contracts Purchased: | | | |
| 11/3/2009 | 109,700,390 Brazilian Real | $62,002,142 | $ 271,013 |
| 11/3/2009 | 2,238,783 Brazilian Real | $1,265,350 | $ 5,531 |
| 11/3/2009 | 5,379,000 Brazilian Real | $3,065,830 | $ (12,356) |
| 11/4/2009 | 27,905,570 Brazilian Real | $16,186,525 | $(345,489) |
| 11/4/2009 | 569,501 Brazilian Real | $330,337 | $ (7,051) |
| 11/4/2009 | 5,817 Brazilian Real | $3,315 | $ (13) |
| 11/2/2009 | 895,899 Hong Kong Dollar | $115,600 | $ (3) |
| 11/2/2009 | 62,153,956 Hong Kong Dollar | $8,019,865 | $ (207) |
| Contracts Sold: | | | |
| 11/2/2009 | 1,400,519 Euro | $2,073,469 | $ 12,393 |
| NET UNREALIZED DEPRECIATION ON FOREIGN EXCHANGE CONTRACTS | $ (76,182) |
- Net Unrealized Depreciation on Foreign Exchange Contracts is included in “Other Assets and Liabilities — Net.”
Annual Shareholder Report21
- Note: The categories of investments are shown as a percentage of total net assets at October 31, 2009.
- Various inputs are used in determining the value of the Fund's investments. These inputs are summarized in the three broad levels listed below:
- Level 1 — quoted prices in active markets for identical securities
- Level 2 — other significant observable inputs (including quoted prices for similar securities, interest rates, prepayment speeds, credit risk, etc.)
- Level 3 — significant unobservable inputs (including the Fund's own assumptions in determining the fair value of investments)
- The inputs or methodology used for valuing securities are not an indication of the risk associated with investing in those securities.
Annual Shareholder Report22
- The following is a summary of the inputs used, as of October 31, 2009, in valuing the Fund's assets carried at fair value:
| Valuation Inputs | | | | |
| Level 1 —
Quoted
Prices and
Investments in
Mutual Funds | Level 2 —
Other
Significant
Observable
Inputs | Level 3 —
Significant
Unobservable
Inputs | Total |
| Equity Securities: | | | | |
| Domestic | $4,725,666,129 | $17,640,959 | $27,212,781 | $4,770,519,869 |
| International | 1,188,529,206 | 276,959,802 | — | 1,465,489,008 |
| Debt Securities: | | | | |
| Corporate Bonds | — | 184,578,985 | 144,410 | 184,723,395 |
| Corporate Note | — | 8,450,902 | — | 8,450,902 |
| U.S. Treasury | — | 3,999,400 | — | 3,999,400 |
| Warrants | — | 3,999,394 | 3,764,140 | 7,763,534 |
| Mutual Fund | 1,775,556,873 | — | — | 1,775,556,873 |
| TOTAL SECURITIES | $7,689,752,208 | $495,629,442 | $31,121,331 | $8,216,502,981 |
| OTHER FINANCIAL INSTRUMENTS* | $(4,020,182) | $ — | $ — | $(4,020,182) |
| * | Other financial instruments include security sold short and foreign exchange contracts. |
- Following is a reconciliation of assets in which significant unobservable inputs (Level 3) were used in determining fair value:
| Investments in
Equity Securities | Investments in
Debt Securities | Investments in
Warrants |
| Balance as of November 1, 2008 | $24,315,246 | 970,616 | $213 |
| Realized gain/loss | (11,201,174) | (609,591) | (213) |
| Change in unrealized appreciation/depreciation | 2,495,453 | (216,615) | 3,422,309 |
| Net purchases (sales) | 11,603,256 | — | 313,974 |
| Transfers in and/or out of Level 3 | — | — | 27,857 |
| Balance as of October 31, 2009 | $27,212,781 | $144,410 | $3,764,140 |
| The total change in unrealized appreciation (depreciation) included in the Statement of Operations attributable to investments still held at October 31, 2009 | $(4,566,287) | $(216,615) | $3,422,309 |
- The following acronyms are used throughout this portfolio:
| ADR | — American Depositary Receipt |
| GDR | — Global Depository Receipt |
- See Notes which are an integral part of the Financial Statements
Annual Shareholder Report23
Statement of Assets and Liabilities
October 31, 2009
| Assets: | | |
| Total investments in securities, at value including $3,155,378,073 of investments in affiliated issuers (Note 5) and $1,571,541,712 of securities loaned (identified cost $7,264,112,860) | | $8,216,502,981 |
| Cash | | 276,350 |
| Cash denominated in foreign currencies (identified cost $1,369,266) | | 1,356,588 |
| Deposit at broker for short sales | | 4,340,106 |
| Income receivable | | 4,372,253 |
| Receivable for investments sold | | 121,002,802 |
| Receivable for shares sold | | 4,929,741 |
| Receivable for foreign exchange contracts | | 288,937 |
| TOTAL ASSETS | | 8,353,069,758 |
| Liabilities: | | |
| Securities sold short, at value (proceeds $2,494,876) | $3,944,000 | |
| Payable for investments purchased | 100,566,567 | |
| Payable for shares redeemed | 11,048,709 | |
| Payable for foreign exchange contracts | 365,119 | |
| Payable for collateral due to broker for securities lending | 1,683,052,785 | |
| Payable for limited partnership commitments | 2,500,000 | |
| Payable for capital gains taxes withheld | 2,873,849 | |
| Payable for Directors'/Trustees' fees | 30,290 | |
| Payable for distribution services fee (Note 5) | 1,662,782 | |
| Payable for shareholder services fee (Note 5) | 3,533,197 | |
| Accrued expenses | 2,423,724 | |
| TOTAL LIABILITIES | | 1,812,001,022 |
| Net assets for 1,564,591,203 shares outstanding | | $6,541,068,736 |
| Net Assets Consist of: | | |
| Paid-in capital | | $6,589,236,990 |
| Net unrealized appreciation of investments, short sales and translation of assets and liabilities in foreign currency | | 951,464,349 |
| Accumulated net realized loss on investments, short sales, futures contracts, written options and foreign currency transactions | | (1,004,157,776) |
| Undistributed net investment income | | 4,525,173 |
| TOTAL NET ASSETS | | $6,541,068,736 |
Annual Shareholder Report24
Statement of Assets and Liabilities — continued| Net Asset Value, Offering Price and Redemption Proceeds Per Share | | |
| Class A Shares: | | |
| Net asset value per share ($2,153,443,172 ÷ 509,870,011 shares outstanding), no par value, unlimited shares authorized | | $4.22 |
| Offering price per share (100/94.50 of $4.22) | | $4.47 |
| Redemption proceeds per share | | $4.22 |
| Class B Shares: | | |
| Net asset value per share ($562,617,859 ÷ 140,810,509 shares outstanding), no par value, unlimited shares authorized | | $4.00 |
| Offering price per share | | $4.00 |
| Redemption proceeds per share (94.50/100 of $4.00) | | $3.78 |
| Class C Shares: | | |
| Net asset value per share ($656,085,986 ÷ 164,139,383 shares outstanding), no par value, unlimited shares authorized | | $4.00 |
| Offering price per share | | $4.00 |
| Redemption proceeds per share (99.00/100 of $4.00) | | $3.96 |
| Class K Shares: | | |
| Net asset value per share ($3,168,921,719 ÷ 749,771,300 shares outstanding), no par value, unlimited shares authorized | | $4.23 |
| Offering price per share | | $4.23 |
| Redemption proceeds per share (99.80/100 of $4.23) | | $4.22 |
- See Notes which are an integral part of the Financial Statements
Annual Shareholder Report25
Statement of Operations
Year Ended October 31, 2009
| Investment Income: | | | |
| Dividends (including $23,381,382 received from affiliated issuers (Note 5) and net of foreign taxes withheld of $684,021) | | | $81,946,288 |
| Interest (including income on securities loaned of $10,329,969) | | | 29,055,636 |
| TOTAL INCOME | | | 111,001,924 |
| Expenses: | | | |
| Investment adviser fee (Note 5) | | $86,377,545 | |
| Administrative personnel and services fee (Note 5) | | 4,705,832 | |
| Custodian fees | | 1,513,468 | |
| Transfer and dividend disbursing agent fees and expenses — Class A Shares | | 3,517,193 | |
| Transfer and dividend disbursing agent fees and expenses — Class B Shares | | 1,003,573 | |
| Transfer and dividend disbursing agent fees and expenses — Class C Shares | | 1,116,577 | |
| Transfer and dividend disbursing agent fees and expenses — Class K Shares | | 5,540,212 | |
| Directors'/Trustees' fees | | 80,310 | |
| Auditing fees | | 36,600 | |
| Legal fees | | 89,926 | |
| Portfolio accounting fees | | 208,401 | |
| Distribution services fee — Class A Shares (Note 5) | | 4,948,274 | |
| Distribution services fee — Class B Shares (Note 5) | | 4,199,368 | |
| Distribution services fee — Class C Shares (Note 5) | | 4,692,397 | |
| Distribution services fee — Class K Shares (Note 5) | | 14,483,518 | |
| Shareholder services fee — Class A Shares (Note 5) | | 4,847,607 | |
| Shareholder services fee — Class B Shares (Note 5) | | 1,399,789 | |
| Shareholder services fee — Class C Shares (Note 5) | | 1,555,200 | |
| Shareholder services fee — Class K Shares (Note 5) | | 7,169,609 | |
| Account administration fee — Class A Shares | | 25,216 | |
| Account administration fee — Class C Shares | | 2,504 | |
| Account administration fee — Class K Shares | | 8,195 | |
| Share registration costs | | 101,822 | |
| Printing and postage | | 588,545 | |
| Insurance premiums | | 10,576 | |
| Miscellaneous | | 90,432 | |
| TOTAL EXPENSES | | 148,312,689 | |
Annual Shareholder Report26
Statement of Operations — continued| Waivers, Reimbursements and Expense Reduction: | | | |
| Waiver/reimbursement of investment adviser fee (Note 5) | $(9,092,373) | | |
| Waiver of administrative personnel and services fee (Note 5) | (92,968) | | |
| Waiver of distribution services fee — Class A Shares (Note 5) | (2,276,864) | | |
| Waiver of distribution services fee — Class C Shares (Note 5) | (427,707) | | |
| Waiver of distribution services fee — Class K Shares (Note 5) | (11,012,663) | | |
| Reimbursement of shareholder services fee — Class B Shares (Note 5) | (391,618) | | |
| Fees paid indirectly from directed brokerage arrangements (Note 6) | (92,251) | | |
| TOTAL WAIVERS, REIMBURSEMENTS AND EXPENSE REDUCTION | | $(23,386,444) | |
| Net expenses | | | $124,926,245 |
| Net investment income (loss) | | | (13,924,321) |
| Realized and Unrealized Gain (Loss) on Investments, Short Sales, Written Options, Futures Contracts and Foreign Currency Transactions: | | | |
| Net realized loss on investments and foreign currency transactions (including realized loss of $47,747,236 on sale of investments in affiliated issuers (Note 5) and foreign taxes withheld of $2,873,849) | | | (905,955,137) |
| Net realized loss on short sales | | | (5,219,982) |
| Net realized gain on written options | | | 10,750,131 |
| Net realized gain on futures contracts | | | 14,946,805 |
| Net change in unrealized depreciation of investments and translation of assets and liabilities in foreign currency | | | 1,499,745,944 |
| Net change in unrealized depreciation of short sales | | | (1,449,124) |
| Net realized and unrealized gain on investments, short sales, written options, futures contracts and foreign currency transactions | | | 612,818,637 |
| Change in net assets resulting from operations | | | $598,894,316 |
- See Notes which are an integral part of the Financial Statements
Annual Shareholder Report27
Statement of Changes in Net Assets
| Year Ended October 31 | 2009 | 2008 |
| Increase (Decrease) in Net Assets | | |
| Operations: | | |
| Net investment income (loss) | $(13,924,321) | $(67,661,405) |
| Net realized loss on investments, short sales, written options, futures contracts and foreign currency transactions | (885,478,183) | (31,706,262) |
| Net change in unrealized appreciation/depreciation of investments, short sales and translation of assets and liabilities in foreign currency | 1,498,296,820 | (4,545,366,165) |
| CHANGE IN NET ASSETS RESULTING FROM OPERATIONS | 598,894,316 | (4,644,733,832) |
| Distributions to Shareholders: | | |
| Distributions from net realized gain on investments and foreign currency transactions | | |
| Class A Shares | — | (333,645,193) |
| Class B Shares | — | (126,008,696) |
| Class C Shares | — | (115,952,763) |
| Class K Shares | — | (485,667,675) |
| CHANGE IN NET ASSETS RESULTING FROM DISTRIBUTIONS TO SHAREHOLDERS | — | (1,061,274,327) |
| Share Transactions: | | |
| Proceeds from sale of shares | 781,547,383 | 1,497,569,175 |
| Net asset value of shares issued to shareholders in payment of distributions declared | — | 965,376,844 |
| Cost of shares redeemed | (1,408,747,444) | (1,959,713,944) |
| CHANGE IN NET ASSETS RESULTING FROM SHARE TRANSACTIONS | (627,200,061) | 503,232,075 |
| Regulatory Settlement Proceeds: | | |
| Net increase from regulatory settlement (Note 11) | 82,951 | 319,004 |
| Change in net assets | (28,222,794) | (5,202,457,080) |
| Net Assets: | | |
| Beginning of period | 6,569,291,530 | 11,771,748,610 |
| End of period (including undistributed net investment income/accumulated net investment income (loss) of $4,525,173 and $(975,427), respectively) | $6,541,068,736 | $6,569,291,530 |
- See Notes which are an integral part of the Financial Statements
Annual Shareholder Report28
Notes to Financial Statements
October 31, 2009
1. ORGANIZATION
Federated Equity Funds (the “Trust”) is registered under the Investment Company Act of 1940, as amended (the “Act”), as an open-end management investment company. The Trust consists of 13 portfolios. The financial statements included herein are only those of Federated Kaufmann Fund (the “Fund”), a diversified portfolio. The financial statements of the other portfolios are presented separately. The assets of each portfolio are segregated and a shareholder's interest is limited to the portfolio in which shares are held. Each portfolio pays its own expenses. The Fund offers four classes of shares: Class A Shares, Class B Shares, Class C Shares and Class K Shares. All shares of the Fund have equal rights with respect to voting, except on class-specific matters. The financial highlights of the Class K Shares are presented separately. The investment objective of the Fund is to provide capital appreciation.
2. SIGNIFICANT ACCOUNTING POLICIES
The following is a summary of significant accounting policies consistently followed by the Fund in the preparation of its financial statements. These policies are in conformity with U.S. generally accepted accounting principles (GAAP).
Investment Valuation
In calculating its net asset value (NAV), the Fund generally values investments as follows:
- Equity securities listed on an exchange or traded through a regulated market system are valued at their last reported sale price or official closing price in their principal exchange or market.
- Shares of other mutual funds are valued based upon their reported NAVs.
- Fixed-income securities acquired with remaining maturities greater than 60 days are fair valued using price evaluations provided by a pricing service approved by the Trustees.
- Fixed-income securities acquired with remaining maturities of 60 days or less are valued at their cost (adjusted for the accretion of any discount or amortization of any premium).
- Derivative contracts listed on exchanges are valued at their reported settlement or closing price.
- Over-the-counter (OTC) derivative contracts are fair valued using price evaluations provided by a pricing service approved by the Trustees.
If the Fund cannot obtain a price or price evaluation from a pricing service for an investment, the Fund may attempt to value the investment based upon the mean of bid and asked quotations or fair value the investment based on price evaluations from one or more dealers. If any price, quotation, price evaluation or other pricing source is not readily available when the NAV is calculated, the Fund uses the fair value of the investment determined in accordance with the procedures described below. There can be no assurance that the Fund could purchase or sell an investment at the price used to calculate the Fund's NAV.
Fair Valuation and Significant Events Procedures
The Trustees have authorized the use of pricing services to provide evaluations of the current fair value of certain investments for purposes of calculating the NAV. Factors considered by pricing services in evaluating an investment include the yields or prices of investments of comparable quality, coupon, maturity, call rights and other potential prepayments, terms and type, reported transactions, indications as to values from dealers and general market conditions. Some pricing services provide a single price evaluation reflecting the bid-side of Annual Shareholder Report29
the market for an investment (a “bid” evaluation). Other pricing services offer both bid evaluations and price evaluations indicative of a price between the prices bid and asked for the investment (a “mid” evaluation). The Fund normally uses bid evaluations for U.S. Treasury and Agency securities. The Fund normally uses mid evaluations for other types of fixed-income securities and OTC derivative contracts. In the event that market quotations and price evaluations are not available for an investment, the fair value of the investment is determined in accordance with procedures adopted by the Trustees.The Trustees also have adopted procedures requiring an investment to be priced at its fair value whenever the Adviser determines that a significant event affecting the value of the investment has occurred between the time as of which the price of the investment would otherwise be determined and the time as of which the NAV is computed. An event is considered significant if there is both an affirmative expectation that the investment's value will change in response to the event and a reasonable basis for quantifying the resulting change in value. Examples of significant events that may occur after the close of the principal market on which a security is traded, or after the time of a price evaluation provided by a pricing service or a dealer, include:
- With respect to securities traded in foreign markets, significant trends in U.S. equity markets or in the trading of foreign securities index futures or options contracts;
- With respect to price evaluations of fixed-income securities determined before the close of regular trading on the NYSE, actions by the Federal Reserve Open Market Committee and other significant trends in U.S. fixed-income markets;
- Political or other developments affecting the economy or markets in which an issuer conducts its operations or its securities are traded; and
- Announcements concerning matters such as acquisitions, recapitalizations, litigation developments, a natural disaster affecting the issuer's operations or regulatory changes or market developments affecting the issuer's industry.
The Trustees have approved the use of a pricing service to determine the fair value of equity securities traded principally in foreign markets when the Adviser determines that there has been a significant trend in the U.S. equity markets or in index futures trading. For other significant events, the Fund may seek to obtain more current quotations or price evaluations from alternative pricing sources. If a reliable alternative pricing source is not available, the Fund will determine the fair value of the investment using another method approved by the Trustees.
Repurchase Agreements
It is the policy of the Fund to require the other party to a repurchase agreement to transfer to the Fund's custodian or sub-custodian eligible securities or cash with a market value (after transaction costs) at least equal to the repurchase price to be paid under the repurchase agreement. The eligible securities are transferred to accounts with the custodian or sub-custodian in which the Fund holds a “securities entitlement” and exercises “control” as those terms are defined in the Uniform Commercial Code. The Fund has established procedures for monitoring the market value of the transferred securities and requiring the transfer of additional eligible securities if necessary to equal at least the repurchase price. These procedures also allow the other party to require securities to be transferred from the account to the extent that their market value exceeds the repurchase price or in exchange for other eligible securities of equivalent market value.
Annual Shareholder Report30
With respect to agreements to repurchase U.S. government securities and cash items, the Fund treats the repurchase agreement as an investment in the underlying securities and not as an obligation of the other party to the repurchase agreement. Other repurchase agreements are treated as obligations of the other party secured by the underlying securities. Nevertheless, the insolvency of the other party or other failure to repurchase the securities may delay the disposition of the underlying securities or cause the Fund to receive less than the full repurchase price. Under the terms of the repurchase agreement, any amounts received by the Fund in excess of the repurchase price and related transaction costs must be remitted to the other party.The Fund may enter into repurchase agreements in which eligible securities are transferred into joint trading accounts maintained by the custodian or sub-custodian for investment companies and other clients advised by the Fund's Adviser and its affiliates. The Fund will participate on a pro rata basis with the other investment companies and clients in its share of the securities transferred under such repurchase agreements and in its share of proceeds from any repurchase or other disposition of such securities.
Investment Income, Gains and Losses, Expenses and Distributions
Investment transactions are accounted for on a trade-date basis. Realized gains and losses from investment transactions are recorded on an identified-cost basis. Interest income and expenses are accrued daily. Dividend income and distributions to shareholders are recorded on the ex-dividend date. Foreign dividends are recorded on the ex-dividend date or when the Fund is informed of the ex-dividend date. Distributions of net investment income, if any, are declared and paid annually. Non-cash dividends included in dividend income, if any, are recorded at fair value. Investment income, realized and unrealized gains and losses, and certain fund-level expenses are allocated to each class based on relative average daily net assets, except that Class A Shares, Class B Shares, Class C Shares and Class K Shares may bear distribution services fees, shareholder services fees, account administration fees and certain transfer and dividend disbursing agent fees unique to those classes. Dividends are declared separately for each class. No class has preferential dividend rights; differences in per share dividend rates are generally due to differences in separate class expenses.
Premium and Discount Amortization
All premiums and discounts on fixed-income securities are amortized/accreted for financial statement purposes.
Federal Taxes
It is the Fund's policy to comply with the Subchapter M provision of the Internal Revenue Code (the “Code”) and to distribute to shareholders each year substantially all of its income. Accordingly, no provision for federal income tax is necessary. As of and during the year ended October 31, 2009, the Fund did not have a liability for any uncertain tax positions. The Fund recognizes interest and penalties, if any, related to tax liabilities as income tax expense in the Statement of Operations. As of October 31, 2009, tax years 2006 through 2009 remain subject to examination by the Fund's major tax jurisdictions, which include the United States of America and the Commonwealth of Massachusetts.
The Fund may be subject to taxes imposed by governments of countries in which it invests. Such taxes are generally based on either income or gains earned or repatriated. The Fund accrues and applies such taxes to net investment income, net realized gains and net unrealized gains as income and/or gains are earned.
Annual Shareholder Report31
When-Issued and Delayed Delivery TransactionsThe Fund may engage in when-issued or delayed delivery transactions. The Fund records when-issued securities on the trade date and maintains security positions such that sufficient liquid assets will be available to make payment for the securities purchased. Securities purchased on a when-issued or delayed delivery basis are marked to market daily and begin earning interest on the settlement date. Losses may occur on these transactions due to changes in market conditions or the failure of counterparties to perform under the contract.
Futures Contracts
The Fund may purchase and sell financial futures contracts to enhance yield, manage cash flows and to potentially reduce transaction costs. Upon entering into a financial futures contract with a broker, the Fund is required to deposit in a segregated account a specified amount of cash or U.S. government securities. Futures contracts are valued daily and unrealized gains or losses are recorded in a “variation margin” account. Daily, the Fund receives from or pays to the broker a specified amount of cash based upon changes in the variation margin account. When a contract is closed, the Fund recognizes a realized gain or loss. Futures contracts have market risks, including the risk that the change in the value of the contract may not correlate with the changes in the value of the underlying securities. There is minimal counterparty risk to the Fund since futures are exchange traded and the exchange's clearinghouse, as counterparty to all exchange traded futures, guarantees the futures against default.
At October 31, 2009, the Fund had no outstanding futures contracts.
Foreign Exchange Contracts
The Fund may enter into foreign exchange contracts for the delayed delivery of securities or foreign currency exchange transactions. The Fund may enter into foreign exchange contracts to protect assets against adverse changes in foreign currency exchange rates or exchange control regulations. Purchased contracts are used to acquire exposure to foreign currencies, whereas, contracts to sell are used to hedge the Fund's securities against currency fluctuations. Risks may arise upon entering into these transactions from the potential inability of counterparties to meet the terms of their commitments and from unanticipated movements in security prices or foreign exchange rates. The foreign exchange contracts are adjusted by the daily exchange rate of the underlying currency and any gains or losses are recorded for financial statement purposes as unrealized until the settlement date.
Foreign exchange contracts outstanding at period end are listed after the Fund's Portfolio of Investments.
Foreign Currency Translation
The accounting records of the Fund are maintained in U.S. dollars. All assets and liabilities denominated in foreign currencies (FCs) are translated into U.S. dollars based on the rates of exchange of such currencies against U.S. dollars on the date of valuation. Purchases and sales of securities, income and expenses are translated at the rate of exchange quoted on the respective date that such transactions are recorded. The Fund does not isolate that portion of the results of operations resulting from changes in foreign exchange rates on investments from the fluctuations arising from changes in market prices of securities held. Such fluctuations are included with the net realized and unrealized gain or loss from investments.
Annual Shareholder Report32
Reported net realized foreign exchange gains or losses arise from sales of portfolio securities, sales and maturities of short-term securities, sales of FCs, currency gains or losses realized between the trade and settlement dates on securities transactions, the difference between the amounts of dividends, interest and foreign withholding taxes recorded on the Fund's books, and the U.S. dollar equivalent of the amounts actually received or paid. Net unrealized foreign exchange gains and losses arise from changes in the value of assets and liabilities other than investments in securities at fiscal year end, resulting from changes in the exchange rate.Option Contracts
The Fund may buy or sell put and call options to obtain premiums from the sale of derivative contracts, realize gains from trading a derivative contract, or hedge against potential losses. The seller (writer) of an option receives a payment or premium, from the buyer, which the writer keeps regardless of whether the buyer exercises the option. Premiums paid for purchasing options which expire are treated as realized losses. The risk associated with purchasing put and call options is limited to the premium paid. When the Fund writes a put or call option, an amount equal to the premium received is recorded as a liability and subsequently marked to market to reflect the current value of the option written. Premiums received from writing options which expire are treated as realized gains. Premiums received from writing options which are exercised or closed are added to the proceeds or offset against amounts paid on the underlying reference instrument to determine the realized gain or loss. The Fund, as a writer of an option, bears the market risk of an unfavorable change in the price of the underlying reference instrument. Options can trade on securities or commodities exchanges. In this case, the exchange sets all the terms of the contract except for the price. Most exchanges require investors to maintain margin accounts through their brokers to cover their potential obligations to the exchange. This protects investors against potential defaults by the counterparty.
The following is a summary of the Fund's written option activity:
| Contracts | Number of
Contracts | Premium |
| Outstanding at October 31, 2008 | — | $ — |
| Contracts written | 589,401,982 | 15,907,939 |
| Contracts bought back | 589,401,982 | 15,907,939 |
| Outstanding at October 31, 2009 | — | $ — |
At October 31, 2009, the Fund had no outstanding written option contracts.
Securities Lending
The Fund participates in a securities lending program providing for the lending of equity securities to qualified brokers. The Fund normally receives cash collateral for securities loaned that is invested in an affiliated money market fund or in short-term securities including repurchase agreements. Collateral is maintained at a minimum level of 100% of the market value of investments loaned, plus interest, if applicable. Earnings on collateral are allocated between the securities lending agent, as a fee for its services under the program, and the Fund, according to agreed-upon rates.
Annual Shareholder Report33
As of October 31, 2009, securities subject to this type of arrangement and related collateral were as follows:Market Value of
Securities Loaned | Market Value
of Collateral |
| $1,571,541,712 | $1,683,052,785 |
Short Sales
The Fund may sell a security short in an effort to take advantage of an anticipated decline in the price of the security. In a short sale, the Fund sells a security it does not own, and must borrow the security in order to deliver it at completion of the sale. The Fund then has an obligation to replace the borrowed security. If the Fund can buy the security back at a lower price than it sold it for, a gain is realized. If the Fund has to buy the security back at a higher price, a loss is realized. For the year ended October 31, 2009, the Fund had a net realized loss on short sales of $5,219,982.
Short sales outstanding at period end are listed after the Fund's Portfolio of Investments.
Restricted Securities
Restricted securities are securities that either: (a) cannot be offered for public sale without first being registered, or being able to take advantage of an exemption from registration, under the Securities Act of 1933; or (b) are subject to contractual restrictions on public sales. In some cases, when a security cannot be offered for public sale without first being registered, the issuer of the restricted security has agreed to register such securities for resale, at the issuer's expense, either upon demand by the Fund or in connection with another registered offering of the securities. Many such restricted securities may be resold in the secondary market in transactions exempt from registration. Restricted securities may be determined to be liquid under criteria established by the Trustees. The Fund will not incur any registration costs upon such resales. The Fund's restricted securities are valued at the price provided by dealers in the secondary market or, if no market prices are available, at the fair value as determined in accordance with procedures established by and under the general supervision of the Trustees.
Annual Shareholder Report34
Additional information on restricted securities, excluding securities purchased under Rule 144A, if applicable, that have been deemed liquid by the Trustees, held at October 31, 2009, is as follows:| Security | Acquisition Date | Acquisition Cost | Market Value |
| Apollo Investment Fund V | 5/18/2001 | $580,812 | $5,936,545 |
| Ardais Corp., Conv. Pfd. | 3/2/2001 — 3/8/2001 | 9,999,999 | — |
| Ardais Corp., Conv. Pfd., Series C | 12/18/2002 | 4,666,664 | — |
| Conceptus, Inc. | 8/11/2005 | 4,500,000 | 10,962,500 |
| Conceptus, Inc. | 4/10/2001 | 5,000,000 | 12,528,576 |
| Cortek, Inc. | 2/29/2000 | — | — |
| Cortek, Inc., Conv. Pfd., Series D2 | 3/31/2003 | — | — |
| Cortex, Inc., Pfd., Series D | 6/18/2001 | — | — |
| Denovo Ventures I LP | 3/9/2000 | 3,332,145 | 3,034,000 |
| Endologix, Inc. | 12/8/2003 — 7/30/2009 | 29,380,119 | 32,917,913 |
| Expand Networks Ltd. | 9/22/2000 | 2,500,000 | — |
| FA Private Equity Fund IV LP | 3/4/2002 | 690,660 | 856,906 |
| Infrastructure Fund | 8/11/2000 | 410,088 | 20,555 |
| Latin Healthcare Fund | 11/28/2000 | — | 940,831 |
| Multiplex, Inc., Pfd., Series C | 2/22/2001 | 5,000,001 | — |
| Peachtree Leadscope LLC, Class C | 4/30/2002 | 3,000,000 | 3,250,000 |
| Peachtree Leadscope LLC, Class A & B | 6/30/2000 | 712,054 | — |
| Peachtree Open Networks | 10/5/2000 | 892,599 | — |
| Peachtree Velquest | 9/14/2000 | 494,382 | — |
| Rocket Ventures II | 7/20/1999 | 10,015,342 | — |
| Sensable Technologies, Inc. (Bridge Loan) | 12/16/2003 | 401,118 | 100,279 |
| Sensable Technologies, Inc. | 10/15/2004 | — | — |
| Venworks | 1/6/2000 | 5,000,000 | — |
Additional Disclosure Related to Derivative Instruments
| Fair Value of Derivative Instruments |
| Asset | Liability |
| Statement of
Assets and
Liabilities
Location | Fair
Value | Statement of
Assets and
Liabilities
Location | Fair
Value |
Derivatives not accounted for as hedging instruments under
ASC Topic 815 | | | | |
| Foreign exchange contracts | Receivable for foreign exchange contracts | $288,937 | Payable for foreign exchange contracts | $365,119 |
Annual Shareholder Report35
The Effect of Derivative Instruments on the Statement of Operations for the Year Ended October 31, 2009
| Amount of Realized Gain or (Loss) on Derivatives Recognized in Income |
| Option Contracts | Futures | Forward
Currency
Contracts | Total |
| Equity contracts | $21,182,721 | $14,946,805 | $ — | $36,129,526 |
| Foreign exchange contracts | — | — | 359,828 | 359,828 |
| TOTAL | $21,182,721 | $14,946,805 | $359,828 | $36,489,354 |
| Change in Unrealized Appreciation or (Depreciation) on Derivatives Recognized in Income |
| Option Contracts | Forward
Currency
Contracts | Total |
| Foreign exchange contracts | $ — | $(196,213) | $(196,213) |
| Equity contracts | (59,530,248) | — | (59,530,248) |
| TOTAL | $(59,530,248) | $(196,213) | $(59,726,461) |
Other
The preparation of financial statements in conformity with GAAP requires management to make estimates and assumptions that affect the amounts of assets, liabilities, expenses and revenues reported in the financial statements. Actual results could differ from those estimated.
3. SHARES OF BENEFICIAL INTEREST
The following tables summarize share activity:
| Year Ended October 31 | 2009 | 2008 |
| Class A Shares: | Shares | Amount | Shares | Amount |
| Shares sold | 129,793,261 | $486,148,491 | 155,726,508 | $858,694,230 |
| Shares issued to shareholders in payment of distributions declared | — | — | 47,419,878 | 289,259,872 |
| Shares redeemed | (187,402,355) | (682,429,197) | (166,073,383) | (874,880,670) |
NET CHANGE RESULTING
FROM CLASS A SHARE TRANSACTIONS | (57,609,094) | $(196,280,706) | 37,073,003 | $273,073,432 |
| Year Ended October 31 | 2009 | 2008 |
| Class B Shares: | Shares | Amount | Shares | Amount |
| Shares sold | 8,179,498 | $28,618,485 | 12,608,818 | $67,138,655 |
| Shares issued to shareholders in payment of distributions declared | — | — | 19,888,456 | 116,148,582 |
| Shares redeemed | (47,455,866) | (164,665,568) | (54,173,140) | (274,630,943) |
NET CHANGE RESULTING
FROM CLASS B SHARE TRANSACTIONS | (39,276,368) | $(136,047,083) | (21,675,866) | $(91,343,706) |
Annual Shareholder Report36
| Year Ended October 31 | 2009 | 2008 |
| Class C Shares: | Shares | Amount | Shares | Amount |
| Shares sold | 25,317,394 | $88,656,699 | 45,747,396 | $244,165,700 |
| Shares issued to shareholders in payment of distributions declared | — | — | 15,150,558 | 88,479,262 |
| Shares redeemed | (56,803,525) | (193,749,224) | (49,853,868) | (247,587,025) |
NET CHANGE RESULTING
FROM CLASS C SHARE TRANSACTIONS | (31,486,131) | $(105,092,525) | 11,044,086 | $85,057,937 |
| Year Ended October 31 | 2009 | 2008 |
| Class K Shares: | Shares | Amount | Shares | Amount |
| Shares sold | 48,539,071 | $178,123,708 | 59,305,047 | $327,570,590 |
| Shares issued to shareholders in payment of distributions declared | — | — | 77,166,652 | 471,489,128 |
| Shares redeemed | (100,648,477) | (367,903,455) | (106,802,101) | (562,615,306) |
NET CHANGE RESULTING
FROM CLASS K SHARE TRANSACTIONS | (52,109,406) | $(189,779,747) | 29,669,598 | $236,444,412 |
| NET CHANGE RESULTING FROM FUND SHARE TRANSACTIONS | (180,480,999) | $(627,200,061) | 56,110,821 | $503,232,075 |
Redemption Fee
The Fund's Class K Shares impose a redemption fee of 0.20% on the redemption price of the Fund's Class K Shares redeemed, if such shares were purchased after February 1, 1985. The redemption fee is applied to the Fund's Class K Shares expenses for providing redemption services, including, but not limited to: transfer agent fees, postage, printing, telephone and related employment costs. Any excess fee proceeds are added to the Fund's assets. Shares acquired through employer-sponsored retirement plans will not be subject to the redemption fee. However, if shares are purchased for a retirement plan account through a broker, financial institution or other intermediary maintaining an omnibus account for the shares, the waiver may not apply. In addition, this waiver does not apply to individual retirement accounts, such as Traditional, Roth and SEP-IRAs. For the year ended October 31, 2009, redemption fees of $448,895 were allocated to cover the cost of redemptions. For the year ended October 31, 2008, redemption fees of $664,418 were allocated to cover the cost of redemptions.
4. FEDERAL TAX INFORMATION
The timing and character of income and capital gain distributions are determined in accordance with income tax regulations, which may differ from GAAP. These differences are due in part to differing treatments for foreign currency transactions, partnership adjustments, defaulted interest, expiration of capital loss carryforwards, reclassification for regulatory settlement proceeds and discount accretion/premium amortization on debt securities.
Annual Shareholder Report37
For the year ended October 31, 2009, permanent differences identified and reclassified among the components of net assets were as follows:| Increase (Decrease) |
| Paid-In Capital | Undistributed
Net Investment
Income (Loss) | Accumulated
Net Realized
Gain (Loss) |
| $(15,639,943) | $19,424,921 | $(3,784,978) |
Net investment income (loss), net realized gains (losses) and net assets were not affected by this reclassification.
The tax character of distributions as reported on the Statement of Changes in Net Assets for the years ended October 31, 2009 and 2008, was as follows:
| 2009 | 2008 |
| Ordinary income1 | $ — | $270,508,444 |
| Long-term capital gains | $ — | $790,765,883 |
| 1 | For tax purposes, short-term capital gain distributions are considered ordinary income distributions. |
As of October 31, 2009, the components of distributable earnings on a tax basis were as follows:
| Undistributed ordinary income | $10,471,367 |
| Net unrealized appreciation | $849,711,502 |
| Capital loss carryforwards | $(908,351,123) |
The difference between book-basis and tax-basis net unrealized appreciation/depreciation is attributable in part to differing treatments for the deferral of losses on wash sales, partnership adjustments, the realization for tax purposes of unrealized gains on investments in passive foreign investment companies, defaulted interest and discount accretion/premium amortization on debt securities.
At October 31, 2009, the cost of investments for federal tax purposes was $7,362,991,858. The net unrealized appreciation of investments for federal tax purposes excluding any unrealized depreciation/appreciation resulting from changes in foreign currency exchange rates, outstanding foreign currency commitments and short sales was $853,511,123. This consists of net unrealized appreciation from investments for those securities having an excess of value over cost of $1,249,119,492 and net unrealized depreciation from investments for those securities having an excess of cost over value of $395,608,369.
At October 31, 2009, the Fund had a capital loss carryforward of $908,351,123, which will reduce the Fund's taxable income arising from future net realized gains on investments, if any, to the extent permitted by the Code and thus will reduce the amount of distributions to shareholders which would otherwise be necessary to relieve the Fund of any liability for federal income tax. Pursuant to the Code, such capital loss carryforward will expire as follows:
| Expiration Year | Expiration Amount |
| 2016 | $18,502,576 |
| 2017 | $889,848,547 |
Capital loss carryforwards of $15,557,130 expired during the year ended October 31, 2009.
Annual Shareholder Report38
5. INVESTMENT ADVISER FEE AND OTHER TRANSACTIONS WITH AFFILIATESInvestment Adviser Fee
Federated Equity Management Company of Pennsylvania is the Fund's investment adviser (the “Adviser”). The advisory agreement between the Fund and the Adviser provides for an annual fee equal to 1.425% of the Fund's average daily net assets. Subject to the terms described in the Expense Limitation note, the Adviser may voluntarily choose to waive any portion of its fee. The Adviser can modify or terminate this voluntary waiver at any time at its sole discretion. For the year ended October 31, 2009, the Adviser voluntarily waived $7,270,124 of its fee.
Certain of the Fund's assets are managed by Federated Global Investment Management Corp. (the “Sub-Adviser”). Under the terms of a sub-advisory agreement between the Adviser and the Sub-Adviser, the Sub-Adviser receives an allocable portion of the Fund's adviser fee. The fee is paid by the Adviser out of its resources and is not an incremental Fund expense. For the year ended October 31, 2009, the Sub-Adviser earned a fee of $71,223,590.
Administrative Fee
Federated Administrative Services (FAS), under the Administrative Services Agreement, provides the Fund with administrative personnel and services. The fee paid to FAS is based on the average aggregate daily net assets of certain Federated funds as specified below:
| Administrative Fee | Average Aggregate Daily Net Assets
of the Federated Funds |
| 0.150% | on the first $5 billion |
| 0.125% | on the next $5 billion |
| 0.100% | on the next $10 billion |
| 0.075% | on assets in excess of $20 billion |
The administrative fee received during any fiscal year shall be at least $150,000 per portfolio and $40,000 per each additional class of Shares. Subject to the terms described in the Expense Limitation note, FAS may voluntarily choose to waive any portion of its fee. FAS can modify or terminate this voluntary waiver at any time at its sole discretion. For the year ended October 31, 2009, the net fee paid to FAS was 0.076% of average daily net assets of the Fund. FAS waived $92,968 of its fee.
Distribution Services Fee
The Fund has adopted a Distribution Plan (the “Plan”) pursuant to Rule 12b-1 under the Act. Under the terms of the Plan, the Fund will compensate Federated Securities Corp. (FSC), the principal distributor, from the daily net assets of the Fund's Class A Shares, Class B Shares, Class C Shares and Class K Shares to finance activities intended to result in the sale of these shares. The Plan provides that the Fund may incur distribution expenses at the following percentages of average daily net assets annually, to compensate FSC:
| Share Class Name | Percentage of Average Daily
Net Assets of Class |
| Class A Shares | 0.25% |
| Class B Shares | 0.75% |
| Class C Shares | 0.75% |
| Class K Shares | 0.50% |
Annual Shareholder Report39
Subject to the terms described in the Expense Limitation note, FSC may voluntarily choose to waive any portion of its fee. FSC can modify or terminate this voluntary waiver at any time at its sole discretion. For the year ended October 31, 2009, FSC voluntarily waived $13,717,234 of its fee. When FSC receives fees, it may pay some or all of them to financial intermediaries whose customers purchase shares. For the year ended October 31, 2009, FSC retained $5,470,892 of fees paid by the Fund.
Sales Charges
Front-end sales charges and contingent deferred sales charges (CDSC) do not represent expenses of the Fund. They are deducted from the proceeds of sales of Fund shares prior to investment or from redemption proceeds prior to remittance, as applicable. For the year ended October 31, 2009, FSC retained $200,654 in sales charges from the sale of Class A Shares. FSC also retained $16,739 of CDSC relating to redemptions of Class A Shares and $41,732 relating to redemptions of Class C Shares.
Shareholder Services Fee
The Fund may pay fees (Service Fees) up to 0.25% of the average daily net assets of the Fund's Class A Shares, Class B Shares, Class C Shares and Class K Shares to financial intermediaries or to Federated Shareholder Services Company (FSSC) for providing services to shareholders and maintaining shareholder accounts. Financial intermediaries may include a company affiliated with management of Federated Investors, Inc. A financial intermediary affiliated with management of Federated Investors, Inc. received $8,955 of Service Fees for the year ended October 31, 2009. Subject to the terms described in the Expense Limitation note, FSSC may voluntarily reimburse the Fund for shareholder services fees. This voluntary reimbursement can be modified or terminated at any time. For the year ended October 31, 2009, FSSC voluntarily reimbursed $391,618 of shareholder services fees. For the year ended October 31, 2009, FSSC received $3,746,686 of fees paid by the Fund.
Commitments and Contingencies
In the course of pursuing its investment objective, the Fund sometimes invests in limited partnerships and limited liability companies. These entities often require the Fund to commit to a total dollar amount to be invested. The actual investments are usually made in installments over a period of time. At October 31, 2009, the Fund had total commitments to limited partnerships and limited liability companies of $45,173,400; of this amount, $41,214,996 was actually invested by the Fund leaving the Fund contingently liable for additional investments of $3,958,404.
Interfund Transactions
During the year ended October 31, 2009, the Fund engaged in purchase and sale transactions with funds that have a common investment adviser (or affiliated investment advisers), common Directors/Trustees, and/or common Officers. These purchase and sale transactions complied with Rule 17a-7 under the Act and amounted to $2,063,469 and $10,611,106, respectively.
Annual Shareholder Report40
Expense Limitation
The Adviser and its affiliates (which may include FSC, FAS and FSSC) have voluntarily agreed to waive their fees and/or reimburse expenses so that the total operating expenses (as shown in the financial highlights) paid by the Fund's Class A Shares, Class B Shares, Class C Shares and Class K Shares (after the voluntary waivers and reimbursements) will not exceed 1.95%, 2.50%, 2.50% and 1.95%, respectively, through the later of (the “Termination Date”): (a) December 31, 2010; or (b) the date of the Fund's next effective Prospectus. While the Adviser and its affiliates currently do not anticipate terminating these arrangements prior to the Termination Date, these arrangements may only be terminated prior to the Termination Date with the agreement of the Fund's Board of Trustees.
General
Certain Officers and Trustees of the Fund are Officers and Directors or Trustees of the above companies.
Transactions with Affiliated Companies and Affiliated Holdings
An affiliated company is a company in which the Fund has ownership of at least 5% of the voting shares. Transactions with affiliated companies during the year ended October 31, 2009, were as follows:
| Affiliates | Balance of
Shares Held
10/31/2008 | Purchases/
Additions | Sales/
Reductions | Balance of
Shares Held
10/31/2009 | Value | Dividend
Income |
| Alkermes, Inc. | 5,000,000 | 7,057,000 | — | 12,057,000 | $96,094,290 | $ — |
| Alleghany Corp., Conv. Pfd. | 173,200 | — | 173,200 | — | — | 1,976,351 |
| Arena Pharmaceuticals, Inc. | 8,000,000 | 7,995,037 | 6,144,237 | 9,850,800 | 34,773,324 | — |
| Auxilium Pharmaceutical, Inc. | 3,000,000 | 507,017 | 200,000 | 3,307,017 | 104,038,755 | — |
| Brasil Brokers Participacoes | 4,885,000 | 3,833,450 | — | 8,718,450 | 30,189,910 | 93,326 |
| CardioNet, Inc. | 1,499,989 | 473,400 | 1,973,389 | — | — | — |
| CETIP SA | — | 17,903,500 | — | 17,903,500 | 119,925,806 | — |
| Chimera Investment Corp. | 14,636,000 | 44,208,267 | 6,244,267 | 52,600,000 | 183,574,000 | 12,453,056 |
| Conceptus, Inc. | 600,000 | — | — | 600,000 | 10,524,000 | — |
| Conceptus, Inc. | 3,634,700 | — | — | 3,634,700 | 63,752,638 | — |
| Conceptus, Inc. | 714,286 | — | — | 714,286 | 12,528,576 | — |
| Cubist Pharmaceuticals, Inc. | 2,955,039 | 4,444,961 | 400,000 | 7,000,000 | 118,580,000 | — |
| Cyclacel Pharmaceuticals, Inc. | 1,275,467 | — | 1,275,467 | — | — | — |
| Dexcom, Inc. | — | 4,916,800 | — | 4,916,800 | 33,729,248 | — |
Annual Shareholder Report41
| Affiliates | Balance of
Shares Held
10/31/2008 | Purchases/
Additions | Sales/
Reductions | Balance of
Shares Held
10/31/2009 | Value | Dividend
Income |
| Dyax Corp. | 6,500,000 | 4,855,088 | — | 11,355,088 | $35,654,976 | $ — |
| Endologix, Inc. | 4,046,250 | 2,869,278 | — | 6,915,528 | 32,917,913 | — |
| Epigenomics AG | 5,081,706 | — | 233,942 | 4,847,764 | 21,291,255 | — |
| Insulet Corp. | 2,545,895 | 304,105 | — | 2,850,000 | 31,635,000 | — |
| IPC The Hospitalist Co., Inc. | 875,000 | — | 875,000 | — | — | — |
| Isis Pharmaceuticals, Inc. | 2,810,995 | 4,069,762 | — | 6,880,757 | 87,179,191 | — |
| MBF Healthcare Acquisition Corp. | 1,852,200 | — | 1,852,200 | — | — | — |
| National CineMedia, Inc. | 1,900,000 | 554,347 | 95,588 | 2,358,759 | 37,740,144 | 1,477,157 |
| Neurocrine Biosciences, Inc. | 3,900,000 | — | 1,504,267 | 2,395,733 | 5,318,527 | — |
| Orthovita, Inc. | 776,280 | 4,272,932 | 49,212 | 5,000,000 | 17,500,000 | — |
| OSI Pharmaceuticals, Inc. | 3,500,000 | 100,000 | 100,000 | 3,500,000 | 112,770,000 | — |
| Pharmacyclics, Inc. | — | 3,460,000 | — | 3,460,000 | 6,747,000 | — |
| Progenics Pharmaceuticals, Inc. | 3,000,000 | 1,700,000 | — | 4,700,000 | 19,693,000 | — |
| RADWARE Ltd. | 1,070,000 | — | — | 1,070,000 | 12,379,900 | — |
| Repligen Corp. | 1,000,000 | 1,791,203 | — | 2,791,203 | 13,621,071 | — |
| Restoque Comercio e Confeccoes de Roupas SA | 12,156,700 | — | 159,162 | 11,997,538 | 27,923,425 | 1,475,777 |
| Solera Holdings, Inc. | 3,556,267 | — | 3,556,267 | — | — | — |
| TNS, Inc. | 1,523,200 | 487,900 | — | 2,011,100 | 56,833,686 | — |
| Two Harbors Investment Co. | — | 3,000,000 | — | 3,000,000 | 29,070,000 | — |
| Vical, Inc. | 1,696,945 | 6,041,875 | — | 7,738,820 | 23,835,565 | — |
TOTAL OF
AFFILIATED
COMPANIES | 104,165,119 | 124,845,922 | 24,836,198 | 204,174,843 | $1,379,821,200 | $17,475,667 |
Annual Shareholder Report42
Affiliated holdings are mutual funds which are managed by the Adviser or an affiliate of the Adviser. The Adviser has agreed to reimburse the Fund for certain investment adviser fees as a result of transactions in other affiliated mutual funds. For the year ended October 31, 2009, the Adviser reimbursed $1,822,249. Transactions with affiliated holdings during the year ended October 31, 2009 were as follows:| Affiliates | Balance of
Shares Held
10/31/2008 | Purchases/
Additions | Sales/
Reductions | Balance of
Shares Held
10/31/2009 | Value | Dividend
Income |
| Government Obligations Fund, Institutional Shares | 243,685,058 | 55,665,720 | 299,350,778 | — | $ — | $91,065 |
Prime Value Obligations Fund, Institutional
Shares | 1,229,775,082 | 10,427,614,960 | 9,881,833,169 | 1,775,556,873 | 1,775,556,873 | 5,814,650 |
TOTAL OF
AFFILIATED
HOLDINGS | 1,473,460,140 | 10,483,280,680 | 10,181,183,947 | 1,775,556,873 | $1,775,556,873 | $5,905,715 |
6. EXPENSE Reduction
The Fund directs portfolio trades to a broker that in turn pays a portion of the Fund's operating expenses. For the year ended October 31, 2009, the Fund's expenses were reduced by $92,251 under these arrangements.
7. Investment TRANSACTIONS
Purchases and sales of investments, excluding long-term U.S. government securities and short-term obligations, for the year ended October 31, 2009, were as follows:
| Purchases | $5,124,218,218 |
| Sales | $5,111,692,867 |
Annual Shareholder Report43
8. CONCENTRATION OF RISKThe Fund invests in securities of non-U.S. issuers. Political or economic developments may have an effect on the liquidity and volatility of portfolio securities and currency holdings.
At October 31, 2009, the diversification of countries was as follows:
| Country | Percentage of
Net Assets |
| United States | 75.6% |
| Brazil | 8.3% |
| Bermuda | 3.3% |
| India | 3.3% |
| Cayman Islands | 1.7% |
| Canada | 1.3% |
| Ireland | 1.2% |
| Hong Kong | 0.8% |
| Taiwan | 0.6% |
| Chile | 0.5% |
| Japan | 0.4% |
| Denmark | 0.3% |
| United Kingdom | 0.3% |
| Indonesia | 0.2% |
| Belgium | 0.2% |
| Israel | 0.2% |
| China | 0.1% |
| Switzerland | 0.0%1 |
| 1 | Represents less than 0.1%. |
9. LINE OF CREDIT
The Fund participates in a $100,000,000 unsecured, uncommitted revolving line of credit (LOC) agreement with PNC Bank. The LOC was made available for extraordinary or emergency purposes, primarily for financing redemption payments. Borrowings are charged interest at a rate offered to the Fund by PNC Bank at the time of the borrowing. As of October 31, 2009, there were no outstanding loans. During the year ended October 31, 2009, the Fund did not utilize the LOC.
10. INTERFUND LENDING
Pursuant to an Exemptive Order issued by the Securities and Exchange Commission (SEC), the Fund, along with other funds advised by subsidiaries of Federated Investors, Inc., may participate in an interfund lending program. This program provides an alternative credit facility allowing the funds to borrow from other participating affiliated funds. As of October 31, 2009, there were no outstanding loans. During the year ended October 31, 2009, the program was not utilized.
Annual Shareholder Report44
11. REGULATORY SETTLEMENT PROCEEDSThe Fund received $82,951 and $319,004 for the years ended October 31, 2009 and 2008, respectively, in settlement of administrative proceedings against other unaffiliated third parties involving findings by the SEC of market timing and/or late trading of mutual funds. The settlement is recorded as an increase to paid-in capital in the accompanying financial statements.
12. Legal Proceedings
Since October 2003, Federated Investors, Inc. and related entities (collectively, Federated) and various Federated funds (Federated Funds) have been named as defendants in several class action lawsuits now pending in the United States District Court for the District of Maryland. The lawsuits were purportedly filed on behalf of people who purchased, owned and/or redeemed shares of Federated-sponsored mutual funds during specified periods beginning November 1, 1998. The suits are generally similar in alleging that Federated engaged in illegal and improper trading practices including market timing and late trading in concert with certain institutional traders, which allegedly caused financial injury to the mutual fund shareholders. These lawsuits began to be filed shortly after Federated's first public announcement that it had received requests for information on shareholder trading activities in the Federated Funds from the SEC, the Office of the New York State Attorney General (NYAG), and other authorities. In that regard, on November 28, 2005, Federated announced that it had reached final settlements with the SEC and the NYAG with respect to those matters. As Federated previously reported in 2004, it has already paid approximately $8.0 million to certain funds as determined by an independent consultant. As part of these settlements, Federated agreed to pay for the benefit of fund shareholders additional disgorgement and a civil money penalty in the aggregate amount of an additional $72 million. Federated entities have also been named as defendants in several additional lawsuits that are now pending in the United States District Court for the Western District of Pennsylvania, alleging, among other things, excessive advisory and Rule 12b-1 fees. The Board of the Federated Funds retained the law firm of Dickstein Shapiro LLP to represent the Federated Funds in these lawsuits. Federated and the Federated Funds, and their respective counsel have been defending this litigation, and none of the Federated Funds remains a defendant in any of the lawsuits (though some could potentially receive any recoveries as nominal defendants). Additional lawsuits based upon similar allegations may be filed in the future. The potential impact of these lawsuits, all of which seek unquantified damages, attorneys' fees and expenses, and future potential similar suits is uncertain. Although we do not believe that these lawsuits will have a material adverse effect on the Federated Funds, there can be no assurance that these suits, the ongoing adverse publicity and/or other developments resulting from the regulatory investigations will not result in increased Federated Fund redemptions, reduced sales of Federated Fund shares or other adverse consequences for the Federated Funds.
13. Subsequent events
Management has evaluated subsequent events through December 24, 2009, the date the financial statements were issued, and determined that no events have occurred that require additional disclosure.
Annual Shareholder Report45
Report of Independent Registered Public Accounting Firm
TO THE BOARD OF Trustees OF Federated Equity Funds AND SHAREHOLDERS OF Federated Kaufmann Fund:
We have audited the accompanying statement of assets and liabilities of Federated Kaufmann Fund (the “Fund”), one of the portfolios constituting Federated Equity Funds, including the portfolio of investments, as of October 31, 2009, and the related statement of operations for the year then ended, the statement of changes in net assets for each of the two years in the period then ended, and the financial highlights for each of the five years in the period then ended. These financial statements and financial highlights are the responsibility of the Fund's management. Our responsibility is to express an opinion on these financial statements and financial highlights based on our audits.
We conducted our audits in accordance with standards of the Public Company Accounting Oversight Board (United States). Those standards require that we plan and perform the audit to obtain reasonable assurance about whether the financial statements and financial highlights are free of material misstatement. We were not engaged to perform an audit of the Fund's internal control over financial reporting. Our audits included consideration of internal control over financial reporting as a basis for designing audit procedures that are appropriate in the circumstances, but not for the purpose of expressing an opinion on the effectiveness of the Fund's internal control over financial reporting. Accordingly, we express no such opinion. An audit also includes examining, on a test basis, evidence supporting the amounts and disclosures in the financial statements and financial highlights, assessing the accounting principles used and significant estimates made by management, and evaluating the overall financial statement presentation. Our procedures included confirmation of securities owned as of October 31, 2009, by correspondence with the custodian and brokers or by other appropriate auditing procedures where replies from brokers were not received. We believe that our audits provide a reasonable basis for our opinion.
In our opinion, the financial statements and financial highlights referred to above present fairly, in all material respects, the financial position of Federated Kaufmann Fund, a portfolio of Federated Equity Funds, at October 31, 2009, the results of its operations for the year then ended, the changes in its net assets for each of the two years in the period then ended, and the financial highlights for each of the five years in the period then ended, in conformity with U.S. generally accepted accounting principles.
Boston, Massachusetts
December 24, 2009
Annual Shareholder Report46
Board of Trustees and Trust Officers
The Board is responsible for managing the Trust's business affairs and for exercising all the Trust's powers except those reserved for the shareholders. The following tables give information about each Board member and the senior officers of the Fund. Where required, the tables separately list Board members who are “interested persons” of the Fund (i.e., “Interested” Board members) and those who are not (i.e., “Independent” Board members). Unless otherwise noted, the address of each person listed is Federated Investors Tower, 1001 Liberty Avenue, Pittsburgh, PA 15222. The address of all Independent Board members listed is 4000 Ericsson Drive, Warrendale, PA 15086-7561; Attention: Mutual Fund Board. As of December 31, 2008, the Trust comprised ten portfolios, and the Federated Fund Complex consisted of 40 investment companies (comprising 149 portfolios). Unless otherwise noted, each Officer is elected annually. Unless otherwise noted, each Board member oversees all portfolios in the Federated Fund Complex and serves for an indefinite term. The Fund's Statement of Additional Information includes additional information about Trust Trustees and is available, without charge and upon request, by calling 1-800-341-7400.
Interested TRUSTEES Background
Name
Birth Date
Positions Held with Trust
Date Service Began | Principal Occupation(s) for Past Five Years,
Other Directorships Held and Previous Position(s) |
John F. Donahue*
Birth Date: July 28, 1924
TRUSTEE
Began serving: April 1984 | Principal Occupations: Director or Trustee of the Federated Fund Complex; Chairman and Director, Federated Investors, Inc.; Chairman of the Federated Fund Complex's Executive Committee.
Previous Positions: Chairman of the Federated Fund Complex; Trustee, Federated Investment Management Company; Chairman and Director, Federated Investment Counseling. |
J. Christopher Donahue*
Birth Date: April 11, 1949
PRESIDENT AND TRUSTEE
Began serving: January 2000 | Principal Occupations: Principal Executive Officer and President of the Federated Fund Complex; Director or Trustee of some of the Funds in the Federated Fund Complex; President, Chief Executive Officer and Director, Federated Investors, Inc.; Chairman and Trustee, Federated Investment Management Company; Trustee, Federated Investment Counseling; Chairman and Director, Federated Global Investment Management Corp.; Chairman, Federated Equity Management Company of Pennsylvania and Passport Research, Ltd. (investment advisory subsidiary of Federated); Trustee, Federated Shareholder Services Company; Director, Federated Services Company.
Previous Positions: President, Federated Investment Counseling; President and Chief Executive Officer, Federated Investment Management Company, Federated Global Investment Management Corp. and Passport Research, Ltd. |
| * | Family relationships and reasons for “interested” status: John F. Donahue is the father of J. Christopher Donahue; both are “interested” due to their beneficial ownership of shares of Federated Investors, Inc. and the positions they hold with Federated and its subsidiaries. |
Annual Shareholder Report47
INDEPENDENT TRUSTEES Background
Name
Birth Date
Positions Held with Trust
Date Service Began | Principal Occupation(s) for Past Five Years,
Other Directorships Held and Previous Position(s) |
John T. Conroy, Jr., Ph.D.
Birth Date: June 23, 1937
TRUSTEE
Began serving: November 1991 | Principal Occupations: Director or Trustee of the Federated Fund Complex; Chairman of the Board, Investment Properties Corporation; Partner or Trustee in private real estate ventures in Southwest Florida; Assistant Professor in Theology, Blessed Edmund Rice School for Pastoral Ministry.
Previous Positions: President, Investment Properties Corporation; Senior Vice President, John R. Wood and Associates, Inc., Realtors; President, Naples Property Management, Inc. and Northgate Village Development Corporation. |
Nicholas P. Constantakis
Birth Date: September 3, 1939
TRUSTEE
Began serving: February 1998 | Principal Occupation: Director or Trustee of the Federated Fund Complex.
Other Directorship Held: Director and Chairman of the Audit Committee, Michael Baker Corporation (architecture, engineering and construction services).
Previous Position: Partner, Andersen Worldwide SC. |
John F. Cunningham
Birth Date: March 5, 1943
TRUSTEE
Began serving: January 1999 | Principal Occupation: Director or Trustee of the Federated Fund Complex.
Other Directorships Held: Chairman, President and Chief Executive Officer, Cunningham & Co., Inc. (strategic business consulting); Trustee Associate, Boston College.
Previous Positions: Director, Redgate Communications and EMC Corporation (computer storage systems); Chairman of the Board and Chief Executive Officer, Computer Consoles, Inc.; President and Chief Operating Officer, Wang Laboratories; Director, First National Bank of Boston; Director, Apollo Computer, Inc. |
Maureen Lally-Green
Birth Date: July 5, 1949
TRUSTEE
Began serving: August 2009 | Principal Occupations: Director or Trustee of the Federated Fund Complex; Director, Office of Church Relations, Diocese of Pittsburgh; Adjunct Professor of Law, Duquesne University School of Law.
Other Directorships Held: Director, Auberle; Trustee St. Francis University; Director, Ireland Institute of Pittsburgh; Director, UPMC Mercy Hospital; Regent, St. Vincent Seminary; Director, Epilepsy Foundation of Western and Central Pennsylvania; Director, Saint Thomas More Society, Allegheny County; Director, Carlow University.
Previous Position: Pennsylvania Superior Court Judge. |
Annual Shareholder Report48
Name
Birth Date
Positions Held with Trust
Date Service Began | Principal Occupation(s) for Past Five Years,
Other Directorships Held and Previous Position(s) |
Peter E. Madden
Birth Date: March 16, 1942
TRUSTEE
Began serving: November 1991 | Principal Occupation: Director or Trustee and Chairman of the Board of the Federated Fund Complex.
Other Directorship Held: Board of Overseers, Babson College.
Previous Positions: Representative, Commonwealth of Massachusetts General Court; President, Chief Operating Officer and Director, State Street Bank and Trust Company and State Street Corporation (retired); Director, VISA USA and VISA International; Chairman and Director, Massachusetts Bankers Association; Director, Depository Trust Corporation; Director, The Boston Stock Exchange. |
Charles F. Mansfield, Jr.
Birth Date: April 10, 1945
TRUSTEE
Began serving: January 1999 | Principal Occupations: Director or Trustee and Chairman of the Audit Committee of the Federated Fund Complex; Management Consultant.
Previous Positions: Chief Executive Officer, PBTC International Bank; Partner, Arthur Young & Company (now Ernst & Young LLP); Chief Financial Officer of Retail Banking Sector, Chase Manhattan Bank; Senior Vice President, HSBC Bank USA (formerly, Marine Midland Bank); Vice President, Citibank; Assistant Professor of Banking and Finance, Frank G. Zarb School of Business, Hofstra University; Executive Vice President DVC Group, Inc. (marketing, communications and technology). |
R. James Nicholson
Birth Date: February 4, 1938
TRUSTEE
Began serving: April 2008 | Principal Occupations: Director or Trustee of the Federated Fund Complex; Senior Counsel, Brownstein Hyatt Farber Schrek, P.C.; Former Secretary of the U.S. Dept. of Veterans Affairs; Former U.S. Ambassador to the Holy See; Former Chairman of the Republican National Committee.
Other Directorships Held: Director, Horatio Alger Association; Director, The Daniels Fund.
Previous Positions: Colonel, U.S. Army Reserve; Partner, Calkins, Kramer, Grimshaw and Harring, P.C.; General Counsel, Colorado Association of Housing and Building; Chairman and CEO, Nicholson Enterprises, Inc. (real estate holding company); Chairman and CEO, Renaissance Homes of Colorado. |
Thomas M. O'Neill
Birth Date: June 14, 1951
TRUSTEE
Began serving: October 2006 | Principal Occupations: Director or Trustee of the Federated Fund Complex; Managing Director and Partner, Navigator Management Company, L.P. (investment and strategic consulting).
Other Directorships Held: Board of Overseers, Children's Hospital of Boston; Visiting Committee on Athletics, Harvard College.
Previous Positions: Chief Executive Officer and President, Managing Director and Chief Investment Officer, Fleet Investment Advisors; President and Chief Executive Officer, Aeltus Investment Management, Inc.; General Partner, Hellman, Jordan Management Co., Boston, MA; Chief Investment Officer, The Putnam Companies, Boston, MA; Credit Analyst and Lending Officer, Fleet Bank; Director and Consultant, EZE Castle Software (investment order management software); Director, Midway Pacific (lumber). |
Annual Shareholder Report49
Name
Birth Date
Positions Held with Trust
Date Service Began | Principal Occupation(s) for Past Five Years,
Other Directorships Held and Previous Position(s) |
John S. Walsh
Birth Date: November 28, 1957
TRUSTEE
Began serving: January 1999 | Principal Occupations: Director or Trustee of the Federated Fund Complex; President and Director, Heat Wagon, Inc. (manufacturer of construction temporary heaters); President and Director, Manufacturers Products, Inc. (distributor of portable construction heaters); President, Portable Heater Parts, a division of Manufacturers Products, Inc.
Previous Position: Vice President, Walsh & Kelly, Inc. |
James F. Will
Birth Date: October 12, 1938
TRUSTEE
Began serving: April 2006 | Principal Occupations: Director or Trustee of the Federated Fund Complex; formerly, Vice Chancellor and President, Saint Vincent College.
Other Directorships Held: Trustee, Saint Vincent College; Alleghany Corporation.
Previous Positions: Chairman, President and Chief Executive Officer, Armco, Inc.; President and Chief Executive Officer, Cyclops Industries; President and Chief Operating Officer, Kaiser Steel Corporation. |
OFFICERS
Name
Birth Date
Address
Positions Held with Trust
Date Service Began | Principal Occupation(s) for Past Five Years
and Previous Position(s) |
John W. McGonigle
Birth Date: October 26, 1938
EXECUTIVE VICE PRESIDENT AND SECRETARY
Began serving: April 1984 | Principal Occupations: Executive Vice President and Secretary of the Federated Fund Complex; Vice Chairman, Executive Vice President, Secretary and Director, Federated Investors, Inc.
Previous Positions: Trustee, Federated Investment Management Company and Federated Investment Counseling; Director, Federated Global Investment Management Corp., Federated Services Company and Federated Securities Corp. |
Richard A. Novak
Birth Date: December 25, 1963
TREASURER
Began serving: January 2006 | Principal Occupations: Principal Financial Officer and Treasurer of the Federated Fund Complex; Senior Vice President, Federated Administrative Services; Financial and Operations Principal for Federated Securities Corp., Edgewood Services, Inc. and Southpointe Distribution Services, Inc.
Previous Positions: Controller of Federated Investors, Inc.; Vice President, Finance of Federated Services Company; held various financial management positions within The Mercy Hospital of Pittsburgh; Auditor, Arthur Andersen & Co. |
Richard B. Fisher
Birth Date: May 17, 1923
VICE PRESIDENT
Began serving: April 1984 | Principal Occupations: Vice Chairman or Vice President of some of the Funds in the Federated Fund Complex; Vice Chairman, Federated Investors, Inc.; Chairman, Federated Securities Corp.
Previous Positions: President and Director or Trustee of some of the Funds in the Federated Fund Complex; Executive Vice President, Federated Investors, Inc.; Director and Chief Executive Officer, Federated Securities Corp. |
Annual Shareholder Report50
Name
Birth Date
Address
Positions Held with Trust
Date Service Began | Principal Occupation(s) for Past Five Years
and Previous Position(s) |
Brian P. Bouda
Birth Date: February 28, 1947
CHIEF COMPLIANCE OFFICER AND SENIOR VICE PRESIDENT
Began serving: August 2004 | Principal Occupations: Senior Vice President and Chief Compliance Officer of the Federated Fund Complex; Vice President and Chief Compliance Officer of Federated Investors, Inc. and Chief Compliance Officer of its subsidiaries. Mr. Bouda joined Federated in 1999 and is a member of the American Bar Association and the State Bar Association of Wisconsin. |
Stephen F. Auth
Birth Date: September 3, 1956
450 Lexington Avenue
Suite 3700
New York, NY 10017-3943
CHIEF INVESTMENT OFFICER
Began serving: November 2002 | Principal Occupations: Mr. Auth is Chief Investment Officer of this Fund and various other Funds in the Federated Fund Complex; Executive Vice President, Federated Investment Counseling, Federated Global Investment Management Corp. and Federated Equity Management Company of Pennsylvania.
Previous Positions: Executive Vice President, Federated Investment Management Company, and Passport Research, Ltd. (investment advisory subsidiary of Federated); Senior Vice President, Global Portfolio Management Services Division; Senior Vice President, Federated Investment Management Company and Passport Research, Ltd.; Senior Managing Director and Portfolio Manager, Prudential Investments. |
Lawrence Auriana
Birth Date: January 8, 1944
140 East 45th Street
New York, NY 10017
VICE PRESIDENT
Began serving: November 2001 | Principal Occupations: Lawrence Auriana has been the Fund's Portfolio Manager since February 1986. He is Vice President of the Trust. Mr. Auriana joined Federated in April 2001 as Co-Head of Investments/Federated Kaufmann. From August 1984 to April 2001, Mr. Auriana was President and Treasurer of Edgemont Asset Management Corp., and Chairman of the Board and Portfolio Manager to The Kaufmann Fund, Inc. (predecessor to the Federated Kaufmann Fund). Mr. Auriana earned a B.S. in economics from Fordham University and has been engaged in the securities business since 1965. |
Walter C. Bean
Birth Date: June 22, 1945
VICE PRESIDENT
Began serving: November 2006 | Principal Occupations: Walter C. Bean is Vice President of the Trust. Mr. Bean is a Senior Vice President, Senior Portfolio Manager and the Head of the Equity Income Management Team of the Fund's Adviser. Mr. Bean joined Federated in 2000. His previous associations included: various investment management and research positions with C.S. McKee & Company; First Chicago Investment Advisors; CIGNA Investment Advisors; and Mellon Bank. Mr. Bean earned a Bachelors Degree in Business Administration from Ohio University and an M.B.A. from the Pennsylvania State University. Mr. Bean is a Chartered Financial Analyst and has 40 years of investment experience. |
Hans P. Utsch
Birth Date: July 3, 1936
VICE PRESIDENT
Began serving: November 2001 | Principal Occupations: Hans P. Utsch has been the Fund's Portfolio Manager since February 1986. He is Vice President of the Trust. Mr. Utsch joined Federated in April 2001 as Co-Head of Investments/Federated Kaufmann. From August 1984 to April 2001, Mr. Utsch was Chairman of the Board and Secretary of Edgemont Asset Management Corp., and President and Portfolio Manager to The Kaufmann Fund, Inc. (predecessor to the Federated Kaufmann Fund). Mr. Utsch graduated from Amherst College and holds an M.B.A. from Columbia University. He has been engaged in the securities business since 1962. |
Annual Shareholder Report51
Evaluation and Approval of Advisory Contract - May 2009
Federated Kaufmann Fund (the “Fund”)
The Fund's Board reviewed the Fund's investment advisory and subadvisory contracts at meetings held in May 2009. The Board's decision regarding these contracts reflects the exercise of its business judgment on whether to continue the existing arrangements.
In this connection, the Federated funds' Board had previously appointed a Senior Officer, whose duties include specified responsibilities relating to the process by which advisory fees are to be charged to a Federated fund. The Senior Officer has the authority to retain consultants, experts, or staff as may be reasonably necessary to assist in the performance of his duties, reports directly to the Board, and may be terminated only with the approval of a majority of the independent members of the Board. The Senior Officer prepared and furnished to the Board an independent, written evaluation that covered topics discussed below. The Board considered that evaluation, along with other information, in deciding to approve the advisory and subadvisory contracts.
During its review of these contracts, the Board considered compensation and benefits received by the Adviser and subadviser. This included the fees received for services provided to the Fund by other entities in the Federated organization and research services received by the Adviser from brokers that execute Federated fund trades, as well as advisory fees. The Board is also familiar with and considered judicial decisions concerning allegedly excessive investment advisory fees, which have indicated that the following factors may be relevant to an Adviser's fiduciary duty with respect to its receipt of compensation from a fund: the nature and quality of the services provided by the Adviser, including the performance of the fund; the Adviser's cost of providing the services; the extent to which the Adviser may realize “economies of scale” as a fund grows larger; any indirect benefits that may accrue to the Adviser and its affiliates as a result of the Adviser's relationship with a fund; performance and expenses of comparable funds; and the extent to which the independent Board members are fully informed about all facts the Board deems relevant bearing on the Adviser's services and fees. The Board further considered management fees (including any components thereof) charged to institutional and other clients of the Adviser and subadviser for what might be viewed as like services, and the cost to the Adviser and its affiliates of supplying services pursuant to the management fee agreements, excluding any intra-corporate profit and profit margins of the Adviser and its affiliates for supplying such services. The Board was aware of these factors and was guided by them in its review of the Fund's advisory and subadvisory contracts to the extent it considered them to be appropriate and relevant, as discussed further below.
Annual Shareholder Report52
The Board considered and weighed these circumstances in light of its substantial accumulated experience in governing the Fund and working with Federated on matters relating to the Federated funds, and was assisted in its deliberations by independent legal counsel. Throughout the year, the Board has requested and received substantial and detailed information about the Fund and the Federated organization that was in addition to the extensive materials that comprise and accompany the Senior Officer's evaluation. Federated provided much of this information at each regular meeting of the Board, and furnished additional reports in connection with the particular meeting at which the Board's formal review of the advisory and subadvisory contracts occurred. Between regularly scheduled meetings, the Board also received information on particular matters as the need arose. Thus, the Board's consideration of the advisory and subadvisory contracts included review of the Senior Officer's evaluation, accompanying data and additional reports covering such matters as: the Adviser's and subadviser's investment philosophy, revenue, profitability, personnel and processes; investment and operating strategies; the Fund's short- and long-term performance (in absolute terms, both on a gross basis and net of expenses, as well as in relationship to its particular investment program and certain competitor or “peer group” funds and/or other benchmarks, as appropriate), and comments on the reasons for performance; the Fund's investment objectives; the Fund's expenses (including the advisory fee itself and the overall expense structure of the Fund, both in absolute terms and relative to similar and/or competing funds, with due regard for contractual or voluntary expense limitations); the use and allocation of brokerage commissions derived from trading the Fund's portfolio securities (if any); and the nature, quality and extent of the advisory and other services provided to the Fund by the Adviser and its affiliates. The Board also considered the preferences and expectations of Fund shareholders and their relative sophistication; the continuing state of competition in the mutual fund industry and market practices; the range of comparable fees for similar funds in the mutual fund industry; the Fund's relationship to the Federated family of funds which include a comprehensive array of funds with different investment objectives, policies and strategies which are available for exchange without the incurrence of additional sales charges; compliance and audit reports concerning the Federated funds and the Federated companies that service them (including communications from regulatory agencies), as well as Federated's responses to any issues raised therein; and relevant developments in the mutual fund industry and how the Federated funds and/or Federated are responding to them. The Board's evaluation process is evolutionary. The criteria considered and the emphasis placed on relevant criteria change in recognition of changing circumstances in the mutual fund marketplace. Annual Shareholder Report53
With respect to the Fund's performance and expenses in particular, the Board has found the use of comparisons to other mutual funds with comparable investment programs to be particularly useful, given the high degree of competition in the mutual fund business. The Board focused on comparisons with other similar mutual funds more heavily than non-mutual fund products or services because, it is believed that, they are more relevant. For example, other mutual funds are the products most like the Fund, they are readily available to Fund shareholders as alternative investment vehicles, and they are the type of investment vehicle in fact chosen and maintained by the Fund's investors. The range of their fees and expenses therefore appears to be a generally reliable indication of what consumers have found to be reasonable in the precise marketplace in which the Fund competes. The Fund's ability to deliver competitive performance when compared to its peer group was a useful indicator of how the Adviser is executing the Fund's investment program, which in turn assisted the Board in reaching a conclusion that the nature, extent, and quality of the Adviser's investment management services were such as to warrant continuation of the advisory contract. In this regard, the Senior Officer has reviewed Federated's fees for providing advisory services to products outside the Federated family of funds (e.g., institutional and separate accounts). He concluded that mutual funds and institutional accounts are inherently different products. Those differences include, but are not limited to, different types of targeted investors; being subject to different laws and regulations; different legal structures; different average account sizes; different associated costs; different portfolio management techniques made necessary by different cash flows; and portfolio manager time spent in review of securities pricing. The Senior Officer did not consider these fee schedules to be determinative in judging the appropriateness of mutual fund advisory contracts.The Senior Officer reviewed reports compiled by Federated, using data supplied by independent fund ranking organizations, regarding the performance of, and fees charged by, other mutual funds, noting his view that comparisons to fund peer groups are highly important in judging the reasonableness of proposed fees.
For the one-year, three-year and five-year periods covered by the report, the Fund's performance was above the median of the relevant peer group. More specifically, the Fund's performance has been significantly and consistently above median over the longer term.
The Board also received financial information about Federated, including reports on the compensation and benefits Federated derived from its relationships with the Federated funds. These reports covered not only the fees under the advisory contracts, but also fees received by Federated's subsidiaries for providing other services to the Federated funds under separate contracts (e.g., for serving as the Federated funds' administrator). The reports also discussed any indirect benefit Federated may derive from its receipt of research services from brokers who execute Federated fund trades. In addition, the Board Annual Shareholder Report54
considered the fact that, in order for a fund to be competitive in the marketplace, Federated and its affiliates frequently waived fees and/or reimbursed expenses and have disclosed to fund investors and/or indicated to the Board their intention to do so in the future, where appropriate. Moreover, the Board receives regular reports regarding the institution or elimination of these voluntary waivers.Federated furnished reports, requested by the Senior Officer, that reported revenues on a fund-by-fund basis and made estimates of the allocation of expenses on a fund-by-fund basis, using allocation methodologies specified by the Senior Officer. The Senior Officer noted that, although they may apply consistent allocation processes, the inherent difficulties in allocating costs (and the unavoidable arbitrary aspects of that exercise) and the lack of consensus on how to allocate those costs may render such allocation reports unreliable. The allocation reports were considered in the analysis by the Board but were determined to be of limited use.
The Board and the Senior Officer also reviewed a report compiled by Federated comparing profitability information for Federated to other publicly held fund management companies. In this regard, the Senior Officer noted the limited availability of such information, but nonetheless concluded that Federated's profit margins did not appear to be excessive and the Board agreed.
The Senior Officer's evaluation also discussed the notion of possible realization of “economies of scale” as a fund grows larger. The Board considered in this regard that the Adviser has made significant and long-term investments in areas that support all of the Federated funds, such as personnel and processes for the portfolio management, compliance, and risk management functions; and systems technology; and that the benefits of these efforts (as well as any economies, should they exist) were likely to be enjoyed by the fund complex as a whole. Finally, the Board also noted the absence of any applicable regulatory or industry guidelines on this subject, which (as discussed in the Senior Officer's evaluation) is compounded by the lack of any common industry practice or general pattern with respect to structuring fund advisory fees with “breakpoints” that serve to reduce the fee as the fund attains a certain size. The Senior Officer did not recommend institution of breakpoints in pricing Federated's fund advisory services at this time. In this regard, the Senior Officer's evaluation noted that the Board is aware that the Fund is a relatively more expensive fund for the Adviser to manage than other Federated equity funds and, as noted earlier, that the Fund has also been significantly and consistently above median in its investment performance over the longer term. The Board agreed to monitor future developments and review changes in industry practices or competitive initiatives.
Annual Shareholder Report55
It was noted in the materials for the Board meeting that for the period covered by the report, the Fund's investment advisory fee, after waivers and expense reimbursements, if any, was above the median of the relevant peer group. The Board reviewed the fees and other expenses of the Fund with the Adviser and was satisfied that the overall expense structure of the Fund remained competitive. The Board will continue to monitor advisory fees and other expenses borne by the Fund.The Senior Officer's evaluation noted his belief that the information and observations contained in his evaluation supported a finding that the proposed management fees are reasonable, and that Federated appeared to provide appropriate administrative services to the Fund for the fees paid. Under these circumstances, no changes were recommended to, and no objection was raised to, the continuation of the Fund's advisory and subadvisory contracts. The Board concluded that the nature, quality and scope of services provided the Fund by the Adviser and its affiliates were satisfactory.
In its decision to continue an existing investment advisory contract, the Board was mindful of the potential disruptions of the Fund's operations and various risks, uncertainties and other effects that could occur as a result of a decision to terminate or not renew an advisory contract. In particular, the Board recognized that many shareholders have invested in the Fund on the strength of the Adviser's industry standing and reputation and with the expectation that the Adviser will have a continuing role in providing advisory services to the Fund. Thus, the Board's approval of the advisory contract reflected the fact that it is the shareholders who have effectively selected the Adviser by virtue of having invested in the Fund.
The Board based its decision to approve the advisory and subadvisory contracts on the totality of the circumstances and relevant factors and with a view to past and future long-term considerations. Not all of the factors and considerations identified above were necessarily relevant to the Fund, nor did the Board consider any one of them to be determinative. With respect to the factors that were relevant, the Board's decision to approve the contract reflects its determination that Federated's performance and actions provided a satisfactory basis to support the decision to continue the existing arrangements.
Annual Shareholder Report56
Voting Proxies on Fund Portfolio Securities
A description of the policies and procedures that the Fund uses to determine how to vote proxies, if any, relating to securities held in the Fund's portfolio is available, without charge and upon request, by calling 1-800-341-7400. A report on “Form N-PX” of how the Fund voted any such proxies during the most recent 12-month period ended June 30 is available from Federated's Web site at FederatedInvestors.com. To access this information from the “Products” section of the Web site, click on the “Prospectuses and Regulatory Reports” link under “Related Information,” then select the appropriate link opposite the name of the Fund; or select the name of the Fund and from the Fund's page, click on the “Prospectuses and Regulatory Reports” link. Form N-PX filings are also available at the SEC's Web site at www.sec.gov.
Quarterly Portfolio Schedule
The Fund files with the SEC a complete schedule of its portfolio holdings, as of the close of the first and third quarters of its fiscal year, on “Form N-Q.” These filings are available on the SEC's Web site at www.sec.gov and may be reviewed and copied at the SEC's Public Reference Room in Washington, DC. (Call 1-800-SEC-0330 for information on the operation of the Public Reference Room.) You may also access this information from the “Products” section of Federated's Web site at FederatedInvestors.com by clicking on “Portfolio Holdings” under “Related Information,” then selecting the appropriate link opposite the name of the Fund; or select the name of the Fund and from the Fund's page, click on the “Portfolio Holdings” link.
Annual Shareholder Report57
Mutual funds are not bank deposits or obligations, are not guaranteed by any bank and are not insured or guaranteed by the U.S. government, the Federal Deposit Insurance Corporation, the Federal Reserve Board or any other government agency. Investment in mutual funds involves investment risk, including the possible loss of principal.
This Report is authorized for distribution to prospective investors only when preceded or accompanied by the Fund's Prospectus, which contains facts concerning its objective and policies, management fees, expenses and other information.
Federated Kaufmann Fund
Federated Investors Funds
4000 Ericsson Drive
Warrendale, PA 15086-7561
Contact us at FederatedInvestors.com
or call 1-800-341-7400.
Federated Securities Corp., Distributor
Cusip 314172677
Cusip 314172669
Cusip 314172651
26396 (12/09)
Federated is a registered mark of Federated Investors, Inc.
2009 Federated Investors, Inc.
Federated Kaufmann FundEstablished 2001
A Portfolio of Federated Equity Funds
ANNUAL SHAREHOLDER REPORTOctober 31, 2009
Class K Shares
FINANCIAL HIGHLIGHTS
SHAREHOLDER EXPENSE EXAMPLE
MANAGEMENT'S DISCUSSION OF FUND PERFORMANCE
PORTFOLIO OF INVESTMENTS SUMMARY TABLE
PORTFOLIO OF INVESTMENTS
STATEMENT OF ASSETS AND LIABILITIES
STATEMENT OF OPERATIONS
STATEMENT OF CHANGES IN NET ASSETS
NOTES TO FINANCIAL STATEMENTS
REPORT OF INDEPENDENT REGISTERED PUBLIC ACCOUNTING FIRM
BOARD OF TRUSTEES AND TRUST OFFICERS
EVALUATION AND APPROVAL OF ADVISORY CONTRACT
VOTING PROXIES ON FUND PORTFOLIO SECURITIES
QUARTERLY PORTFOLIO SCHEDULE
Financial Highlights - Class K Shares
(For a Share Outstanding Throughout Each Period)
| Year Ended October 31 | 2009 | 2008 | 2007 | 2006 | 2005 |
| Net Asset Value, Beginning of Period | $3.81 | $7.03 | $6.08 | $5.52 | $5.11 |
| Income From Investment Operations: | | | | | |
| Net investment income (loss) | (0.00)1,2 | (0.03)2 | (0.04)2 | (0.06)2 | (0.05)2 |
| Net realized and unrealized gain (loss) on investments, written options, futures contracts, short sales and foreign currency transactions | 0.42 | (2.56) | 1.73 | 0.95 | 0.75 |
| TOTAL FROM INVESTMENT OPERATIONS | 0.42 | (2.59) | 1.69 | 0.89 | 0.70 |
| Less Distributions: | | | | | |
| Distributions from net realized gain on investments and foreign currency transactions | — | (0.63) | (0.74) | (0.33) | (0.29) |
| Net Asset Value, End of Period | $4.23 | $3.81 | $7.03 | $6.08 | $5.52 |
| Total Return3 | 11.02% | (40.23)% | 31.07% | 16.85% | 14.25% |
| Ratios to Average Net Assets: | | | | | |
| Net expenses | 1.95%4 | 1.95%4 | 1.95%4 | 1.95% | 1.95% |
| Net investment income (loss) | (0.12)% | (0.56)% | (0.63)% | (0.99)% | (1.01)% |
| Expense waiver/reimbursement5 | 0.53% | 0.49% | 0.48% | 0.46% | 0.45% |
| Supplemental Data: | | | | | |
| Net assets, end of period (000 omitted) | $3,168,922 | $3,051,697 | $5,432,110 | $4,330,877 | $3,856,427 |
| Portfolio turnover | 91% | 78% | 49% | 64% | 71% |
| 1 | Represents less than $0.01. |
| 2 | Per share numbers have been calculated using the average shares method. |
| 3 | Based on net asset value, which does not reflect the sales charge, redemption fee or contingent deferred sales charge, if applicable. |
| 4 | The net expense ratio is calculated without reduction for expense offset arrangements. The net expense ratios are 1.95%, 1.95% and 1.95% for the years ended October 31, 2009, 2008 and 2007, respectively, after taking into account these expense reductions. |
| 5 | This expense decrease is reflected in both the net expense and the net investment income (loss) ratios shown above. |
- See Notes which are an integral part of the Financial Statements
Annual Shareholder Report1
Shareholder Expense Example (unaudited)
As a shareholder of the Fund, you incur two types of costs: (1) transaction costs, including sales charges (loads) on purchase or redemption payments and redemption/exchange fees; and (2) ongoing costs, including management fees and to the extent applicable, distribution (12b-1) fees and/or shareholder services fees and other Fund expenses. This Example is intended to help you to understand your ongoing costs (in dollars) of investing in the Fund and to compare these costs with the ongoing costs of investing in other mutual funds. It is based on an investment of $1,000 invested at the beginning of the period and held for the entire period from May 1, 2009 to October 31, 2009.
ACTUAL EXPENSES
The first section of the table below provides information about actual account values and actual expenses. You may use the information in this section, together with the amount you invested, to estimate the expenses that you incurred over the period. Simply divide your account value by $1,000 (for example, an $8,600 account value divided by $1,000 = 8.6), then multiply the result by the number in the first section under the heading entitled “Expenses Paid During Period” to estimate the expenses attributable to your investment during this period.
HYPOTHETICAL EXAMPLE FOR COMPARISON PURPOSES
The second section of the table below provides information about hypothetical account values and hypothetical expenses based on the Fund's actual expense ratio and an assumed rate of return of 5% per year before expenses, which is not the Fund's actual return. Thus, you should not use the hypothetical account values and expenses to estimate the actual ending account balance or your expenses for the period. Rather, these figures are required to be provided to enable you to compare the ongoing costs of investing in the Fund with other funds. To do so, compare this 5% hypothetical example with the 5% hypothetical examples that appear in the shareholder reports of the other funds.
Annual Shareholder Report2
Please note that the expenses shown in the table are meant to highlight your ongoing costs only and do not reflect any transaction costs, such as sales charges (loads) on purchase or redemption payments, or redemption/exchange fees. Therefore, the second section of the table is useful in comparing ongoing costs only, and will not help you determine the relative total costs of owning different funds. In addition, if these transaction costs were included, your costs would have been higher. | Beginning
Account Value
5/1/2009 | Ending
Account Value
10/31/2009 | Expenses Paid
During Period1 |
| Actual | $1,000 | $1,194.90 | $10.79 |
Hypothetical (assuming a 5% return
before expenses) | $1,000 | $1,015.38 | $9.91 |
| 1 | Expenses are equal to the Fund's annualized net expense ratio of 1.95%, multiplied by the average account value over the period, multiplied by 184/365 (to reflect the one-half-year period). |
Annual Shareholder Report3
Performance data quoted represents past performance which is no guarantee of future results. Investment return and principal value will fluctuate so that an investor's shares, when redeemed, may be worth more or less than their original cost. Mutual fund performance changes over time and current performance may be lower or higher than what is stated. For current to the most recent month-end performance and after-tax returns, visit FederatedInvestors.com or call 1-800-341-7400.
Management's Discussion of Fund Performance (unaudited)
The Federated Kaufmann Fund's Class K Shares produced a total return of 11.02%, based on the net asset value for the reporting period ended October 31, 2009. The fund's benchmark, the Russell Midcap Growth Index,1 had a total return of 22.48% for the reporting period and the Lipper Mid-Cap Growth Funds Category2 had a median total return of 16.79%. The Fund's total return for the reporting period reflected actual cash flows, transaction costs and other expenses which were not reflected in the total return of the Russell Midcap Growth Index.
MARKET OVERVIEW
The stock market as a whole posted strong positive returns during the latter portion of the reporting period. The global financial crisis continued throughout the period but in March the Standard & Poor's 500 Index (S&P 500 Index)3 bottomed and began a 50% plus rally. Mid-cap stocks performed best during the period followed by large-cap stocks and then small-cap stocks. In terms of style, growth stocks outperformed value stocks across large-, mid- and small-cap stock groupings.
The period began with economies across the world slowing as credit contracted. In response to the credit crisis, the Federal Reserve, as well as many other countries, cut their discount and federal funds target rates several times at the beginning of the reporting period and maintained them at their lowest levels. The end of the period was marked by a light at the end of the tunnel with some positive economic data on housing, productivity, corporate profits and trade appearing.
The strongest sectors in the Russell Midcap Growth Index during the period were Materials (+36%), Information Technology (+32%) and Consumer Discretionary (+28%). The weakest sectors were Telecom Services (-0.9%), Utilities (+10%) and Financials (+13%).
| 1 | The Russell Midcap Growth Index measures the performance of those Russell Midcap companies with higher price-to-book ratios and higher forecasted growth values. The stocks are also members of the Russell 1000 Growth Index. The index is unmanaged and, unlike the Fund, is not affected by cash flows. Investments cannot be made in an index. |
| 2 | Lipper figures represent the average of the total returns reported by all the mutual funds designated by Lipper, Inc. as falling into the category indicated. They do not reflect sales charges. |
| 3 | The S&P 500 Index is an unmanaged capitalization-weighted index of 500 stocks designed to measure performance of the broad domestic economy through changes in the aggregate market value of 500 stocks representing all major industries. Investments cannot be made directly in an index. |
Annual Shareholder Report4
FUND PERFORMANCE
The Fund underperformed its respective peer average and benchmark index over the reporting period. The Fund's performance is driven primarily by bottom-up stock selection. Five of the Fund's top ten contributing companies across multiple sectors each returned over 60% during the reporting period. Specifically, Hypermarcas SA (+276%), Lee & Mann Paper Manufacturing Ltd. (+543%), Goldman Sachs (+86%), Nine Dragons Paper (+805%) and Housing Development Finance Corp. (+61%) contributed strongly to the Fund's performance. In addition, Auxilium Pharmaceuticals (+60%) Warner Chilcott Plc. (+59%), Dresser-Rand Group (+31%), Mastercard (+48%) and Chimera (+32%) were also among the Fund's top ten contributing companies.
Five of the Fund's laggard companies were in the Financials Sector. Specifically, Bank of America (-38%), Wells Fargo (-16%), Loews Corp. (-26%), JP Morgan Chase (+3%) and Berkshire Hathaway (-20%) detracted from performance. Additional laggards included General Electric (-47%), Walter Industries (-53%), Cubist Pharmaceuticals (-33%), AMR (-79%) and Progenics (-58%). A particular industry that negatively affected performance was Pharmaceutical/Biotech where 14 of the Fund's holdings in the industry were down more than 30%. While it is interesting to know how specific stocks performed during the period, the success of these holdings won't be known until they are sold, typically over longer periods.
The sector exposures that result from the Fund's bottom-up investment process may provide some additional insight into the Fund's relative performance. An overweight in the Financials sector and underweight in Information Technology, relative to the benchmark, hurt performance somewhat. The Fund's performance was also negatively impacted by the Fund's cash position which averaged 8.7% during the period.
Annual Shareholder Report5
FEDERATED KAUFMANN FUND - CLASS K SHARES
Average Annual Total Returns for the Period Ended 10/31/2009
| 6-Month
(Cumulative) | 1-Year | 3-Years | 5-Years | 10-Years | 15-Years |
Federated Kaufmann Fund -
Class K Shares2 | 19.25% | 10.80% | -4.61% | 2.99% | 7.77% | 9.42% |
| Russell Midcap Growth Index3 | 19.87% | 22.48% | -5.61% | 2.22% | 1.01% | 7.35% |
| Lipper Mid-Cap Growth Index3 | 19.16% | 19.95% | -3.00% | 3.35% | 0.60% | 6.72% |
Performance data quoted represents past performance which is no guarantee of future results. Investment return and principal value will fluctuate so that an investor's shares, when redeemed, may be worth more or less than their original cost. Mutual fund performance changes over time and current performance may be lower or higher than what is stated. For current to the most recent month-end performance and after-tax returns, visit FederatedInvestors.com or call 1-800-341-7400. Returns shown do not reflect the deduction of taxes that a shareholder would pay on Fund distributions or the redemption of Fund shares. Mutual funds are not obligations of or guaranteed by any bank and are not federally insured.
| 1 | Represents a hypothetical investment of $10,000 in the Fund. The ending value of the Fund reflects a 0.20% redemption fee. The Fund's performance assumes the reinvestment of all dividends and distributions. The Russell Midcap Growth Index (RMGI) and the Lipper Mid-Cap Growth Index (LMCGI) have been adjusted to reflect reinvestment of all dividends on securities in the indexes. |
| 2 | Total returns reflect the 0.20% redemption fee. |
| 3 | The RMGI is not adjusted to reflect sales charges, expenses or other fees that the Securities and Exchange Commission requires to be reflected in the Fund's performance. The RMGI measures the performance of those Russell Midcap companies with higher price-to-book ratios and higher forecasted growth values. The stocks are also members of the Russell 1000 Growth Index. The LMCGI is an equal dollar-weighted index of the largest mutual funds within the mid-cap growth classification, as defined by Lipper, Inc. The LMCGI does not reflect sales charges and is adjusted for the reinvestment of capital gains and income dividends. The RMGI is unmanaged and, unlike the Fund, is not affected by cash flows. Investments cannot be made in an index. |
Annual Shareholder Report6
Portfolio of Investments Summary Table (unaudited)
At October 31, 2009, the Fund's sector composition1 was as follows:
| Sector Composition | | Percentage of
Total Net Assets |
| Health Care | | 30.1% |
| Financials | | 18.8% |
| Industrials | | 13.4% |
| Information Technology | | 11.7% |
| Materials | | 8.2% |
| Consumer Discretionary | | 6.0% |
| Consumer Staples | | 4.2% |
| Energy | | 2.8% |
| Telecommunication Services | | 1.8% |
| Utilities | | 1.3% |
| Other Security2 | | 0.1% |
| Securities Lending Collateral3 | | 25.8% |
| Security Sold Short | | (0.1)% |
| Cash Equivalents4 | | 1.4% |
| Other Assets and Liabilities — Net5 | | (25.5)% |
| TOTAL | | 100.0% |
| 1 | Except for Other Security, Securities Lending Collateral, Security Sold Short, Cash Equivalents and Other Assets and Liabilities, sector classifications are based upon, and individual portfolio securities are assigned to, the classifications of the Global Industry Classification System (GICS), except that the Adviser assigns a classification to securities not classified by the GICS and to securities for which the Adviser does not have access to the classification made by the GICS. |
| 2 | Other Security includes a U.S. Treasury Security. |
| 3 | Cash collateral received from lending portfolio securities, which is invested in short-term investments such as repurchase agreements or money market mutual funds. |
| 4 | Cash Equivalents include any investments in money market mutual funds and/or overnight repurchase agreements other than those representing securities lending collateral. |
| 5 | Assets, other than investments in securities and security sold short, less liabilities. See Statement of Assets and Liabilities. |
Annual Shareholder Report7
Portfolio of Investments
October 31, 2009
|
| Shares or Principal Amount | | | Value in U.S. Dollars |
| | Common Stocks – 94.4% | |
| | Consumer Discretionary – 5.3% | |
| 1,275,541 | 1,2 | ATA, Inc., ADR | 6,594,547 |
| 403,100 | 1,2,3,4 | B2W Companhia Global Do Varejo, GDR | 23,339,490 |
| 3,009,050 | | Bharat Forge Ltd. | 15,581,150 |
| 268,929 | 1,2 | Bridgepoint Education, Inc. | 3,813,413 |
| 2,667,050 | 1 | Cia Hering | 32,172,350 |
| 1,711,300 | | Cyrela Brazil Realty S.A. Empreendimentos e Participacoes | 21,857,544 |
| 744,895 | 1 | Dolan Media Co. | 8,894,046 |
| 325,900 | 1,3,4 | Dollarama, Inc., Series 144A | 5,812,920 |
| 250,000 | 1,2 | Focus Media Holding Ltd., ADR | 3,010,000 |
| 15,000,000 | 1,2 | Ford Motor Co. | 105,000,000 |
| 1,000,000 | 1,3,4 | Hydrogen Corp. | 20,000 |
| 500,000 | 1 | Imax Corp. | 5,150,000 |
| 150,950 | 1 | Lincoln Educational Services | 2,991,829 |
| 50,374 | | Marriott International, Inc., Class A | 1,262,373 |
| 2,358,759 | 5 | National CineMedia, Inc. | 37,740,144 |
| 100,000 | 1,2 | New Oriental Education & Technology Group, Inc., ADR | 6,984,000 |
| 2,115,500 | 1 | New World Department Store China | 1,891,815 |
| 3,754,900 | | Parkson Retail Group Ltd. | 6,081,661 |
| 244,300 | 1,2 | Penn National Gaming, Inc. | 6,139,259 |
| 545,000 | 2 | Regis Corp. | 8,850,800 |
| 11,997,538 | 1,5 | Restoque Comercio e Confeccoes de Roupas SA | 27,923,425 |
| 885,200 | 1 | SEB — Sistema Educacional Brasileiro SA | 8,592,711 |
| 4,737,275 | 1 | Wynn Macau Ltd. | 6,112,455 |
| | TOTAL | 345,815,932 |
| | Consumer Staples – 4.2% | |
| 230,000 | | Anheuser-Busch InBev NV | 10,809,058 |
| 6,705,000 | 1 | Hypermarcas SA | 137,289,595 |
| 500,000 | | Kellogg Co. | 25,770,000 |
| 1,650,000 | | Philip Morris International, Inc. | 78,144,000 |
| 400,000 | 1 | Ralcorp Holdings, Inc. | 21,480,000 |
| | TOTAL | 273,492,653 |
| | Energy – 2.7% | |
| 4,943,000 | 1 | Atlas Acquisition Holdings Corp. | 49,528,860 |
| 529,850 | 2 | Chesapeake Energy Corp. | 12,981,325 |
Annual Shareholder Report8
|
| 220,000 | 1 | China Integrated Energy, Inc. | 1,265,000 |
| 3,000,000 | 1,2 | Dresser-Rand Group, Inc. | 88,410,000 |
| 220,406 | 1 | Oil India Ltd. | 5,218,129 |
| 719,825 | 1,2 | Sandridge Energy, Inc. | 7,363,810 |
| 250,500 | 2 | XTO Energy, Inc. | 10,410,780 |
| | TOTAL | 175,177,904 |
| | Financials – 18.3% | |
| 1,000,000 | | American Express Co. | 34,840,000 |
| 770,000 | | Axis Capital Holdings Ltd. | 22,245,300 |
| 1,672,400 | 1 | BR Malls Participacoes | 18,512,602 |
| 500,000 | | Bank of America Corp. | 7,290,000 |
| 2,000,000 | 2 | Bank of New York Mellon Corp. | 53,320,000 |
| 1,000,000 | | Berkley, W. R. Corp. | 24,720,000 |
| 180,000 | 2 | Blackrock, Inc. | 38,968,200 |
| 8,718,450 | 1,5 | Brasil Brokers Participacoes | 30,189,910 |
| 17,903,500 | 1,5 | CETIP SA | 119,925,806 |
| 52,600,000 | 2,5 | Chimera Investment Corp. | 183,574,000 |
| 164,606 | 1 | CreXus Investment Corp. | 2,334,113 |
| 1 | 1,3,6 | FA Private Equity Fund IV LP | 856,906 |
| 500,000 | | Goldman Sachs Group, Inc. | 85,085,000 |
| 500,000 | 1 | Government Properties Income Trust | 11,640,000 |
| 350,000 | 2 | Greenhill & Co., Inc. | 30,180,500 |
| 1,347,650 | | Housing Development Finance Corp. Ltd. | 74,443,782 |
| 1 | 1,3,6 | Infrastructure Fund | 20,555 |
| 3,250,000 | 2 | J.P. Morgan Chase & Co. | 135,752,500 |
| 1,344,851 | 1 | LPS Brasil Cons De Imoveis | 14,428,749 |
| 2,000,000 | 2 | Morgan Stanley | 64,240,000 |
| 1,000,000 | 1 | Multiplan Empreendimentos Imobiliarios SA | 15,326,976 |
| 27,847,407 | | PT Bank Central Asia | 13,214,151 |
| 1 | 1,3,6 | Peachtree Leadscope LLC, Class A and B | 0 |
| 1 | 1,3,6 | Peachtree Leadscope LLC, Class C | 3,250,000 |
| 2,000,000 | | Power Finance Corp. | 9,260,291 |
| 1 | 1,3,6 | Rocket Ventures II | 0 |
| 2,000,000 | | Rural Electrification Corp. Ltd. | 8,338,652 |
| 1,350,000 | 2 | State Street Corp. | 56,673,000 |
| 54,231 | | Transatlantic Holdings, Inc. | 2,738,666 |
| 3,000,000 | 1,5 | Two Harbors Investment Co. | 29,070,000 |
Annual Shareholder Report9
|
| 1 | 1,3,6 | Venworks | 0 |
| 3,000,000 | 2 | Wells Fargo & Co. | 82,560,000 |
| 1,000,000 | 2 | Willis Group Holdings Ltd. | 27,000,000 |
| | TOTAL | 1,199,999,659 |
| | Health Care – 28.7% | |
| 989,111 | 1 | AGA Medical Holdings, Inc. | 13,224,414 |
| 425,441 | 1 | Alexza Pharmaceuticals, Inc. | 910,444 |
| 12,057,000 | 1,2,5 | Alkermes, Inc. | 96,094,290 |
| 1,100,000 | 2 | Allergan, Inc. | 61,875,000 |
| 1 | 3,6 | Apollo Investment Fund V | 5,936,545 |
| 2 | 1,6 | Ardais Corp. | 0 |
| 9,850,800 | 1,2,5 | Arena Pharmaceuticals, Inc. | 34,773,324 |
| 1,208,261 | 1,2 | Athenahealth, Inc. | 45,442,696 |
| 3,307,017 | 1,2,5 | Auxilium Pharmaceutical, Inc. | 104,038,755 |
| 450,000 | | Baxter International, Inc. | 24,327,000 |
| 3,250,000 | 1,2 | BioMarin Pharmaceutical, Inc. | 50,570,000 |
| 755,679 | 1,2 | Cepheid, Inc. | 10,027,860 |
| 185,980 | 1 | Chindex International, Inc. | 2,592,561 |
| 274,595 | 1,2 | Chindex International, Inc. | 3,827,854 |
| 625,000 | 3 | Conceptus, Inc. | 10,962,500 |
| 600,000 | 1,3,4,5 | Conceptus, Inc. | 10,524,000 |
| 714,286 | 3,5 | Conceptus, Inc. | 12,528,576 |
| 3,634,700 | 1,2,5 | Conceptus, Inc. | 63,752,638 |
| 2,278,165 | 1,6 | Corcept Therapeutics, Inc. | 3,758,972 |
| 500,000 | 1,3,6 | Cortek, Inc. | 0 |
| 7,000,000 | 1,2,5 | Cubist Pharmaceuticals, Inc. | 118,580,000 |
| 800,000 | 1,2 | Cypress Biosciences, Inc. | 4,912,000 |
| 1 | 3,6 | Denovo Ventures I LP | 3,034,000 |
| 4,916,800 | 1,2,5 | Dexcom, Inc. | 33,729,248 |
| 126,065 | 1 | Dexcom, Inc. Restricted | 864,806 |
| 1,367,900 | | Dishman Pharmaceuticals & Chemicals Ltd. | 6,686,291 |
| 552,681 | 1 | Durect Corp. | 1,166,157 |
| 11,355,088 | 1,5 | Dyax Corp. | 35,654,976 |
| 600,000 | 1 | Emergency Medical Services Corp., Class A | 28,812,000 |
| 3,555,556 | 1 | Endologix, Inc. | 16,924,447 |
| 6,915,528 | 1,2,3,5 | Endologix, Inc. | 32,917,913 |
| 4,847,764 | 1,5 | Epigenomics AG | 21,291,255 |
Annual Shareholder Report10
|
| 900,000 | 1,2 | Express Scripts, Inc., Class A | 71,928,000 |
| 100,000 | 1,2 | Genoptix, Inc. | 3,479,000 |
| 500,000 | | Hikma Pharmaceuticals PLC | 3,862,415 |
| 1,100,000 | 1,2 | Human Genome Sciences, Inc. | 20,559,000 |
| 4,000,000 | 1,2 | Illumina, Inc. | 128,400,000 |
| 2,850,000 | 1,2,5 | Insulet Corp. | 31,635,000 |
| 6,880,757 | 1,2,5 | Isis Pharmaceuticals, Inc. | 87,179,191 |
| 1 | 3,6 | Latin Healthcare Fund | 940,831 |
| 100,000 | 1,2 | LifeWatch AG | 1,941,470 |
| 1,816,541 | 1,2 | Masimo Corp. | 48,265,494 |
| 1,000,000 | 1,2 | Momenta Pharmaceuticals, Inc. | 9,120,000 |
| 1,800,000 | 1,2 | Mylan Laboratories, Inc. | 29,232,000 |
| 1,000,000 | 1,2 | Nektar Therapeutics | 8,120,000 |
| 2,395,733 | 1,5 | Neurocrine Biosciences, Inc. | 5,318,527 |
| 50,000 | 1,2 | NuVasive, Inc. | 1,814,500 |
| 2,091,860 | 1,2 | Orexigen Therapeutics, Inc. | 13,513,416 |
| 5,000,000 | 1,2,5 | Orthovita, Inc. | 17,500,000 |
| 3,500,000 | 1,5 | OSI Pharmaceuticals, Inc. | 112,770,000 |
| 1 | 1,3,6 | Peachtree Velquest | 0 |
| 3,460,000 | 1,5 | Pharmacyclics, Inc. | 6,747,000 |
| 2,000,000 | | Piramal Healthcare Ltd. | 15,746,238 |
| 4,700,000 | 1,5 | Progenics Pharmaceuticals, Inc. | 19,693,000 |
| 1,808,400 | 1,2 | Protalix Biotherapeutics, Inc. | 17,143,632 |
| 379,300 | 1,2 | Regeneron Pharmaceuticals, Inc. | 5,955,010 |
| 2,791,203 | 1,5 | Repligen Corp. | 13,621,071 |
| 500,000 | 1,2 | ResMed, Inc. | 24,605,000 |
| 1,001,800 | 1,2 | Savient Pharmaceuticals, Inc. | 12,622,680 |
| 3,000,000 | 1,2 | Seattle Genetics, Inc. | 27,240,000 |
| 1,000,000 | 1 | Select Medical Holdings Corp. | 9,700,000 |
| 190,400 | 1 | Sinopharm Medicine Holding Co., Ltd. | 689,107 |
| 274 | 1,6 | Soteira, Inc. | 176 |
| 2,000,000 | 1,2 | Spectrum Pharmaceuticals, Inc. | 8,300,000 |
| 4,000,000 | 1 | Talecris Biotherapeutics Holdings Corp. | 80,240,000 |
| 4,284,497 | 1,6 | Threshold Pharmaceuticals, Inc. | 8,697,529 |
| 7,738,820 | 1,2,5 | Vical, Inc. | 23,835,565 |
| 1,659,917 | 1,2 | Vivus, Inc. | 13,113,344 |
Annual Shareholder Report11
|
| 5,900,000 | 1,2 | Warner Chilcott PLC | 130,685,000 |
| | TOTAL | 1,873,953,718 |
| | Industrials – 13.0% | |
| 350,000 | | 3M Co. | 25,749,500 |
| 1,150,500 | | Bharat Heavy Electricals Ltd. | 53,343,318 |
| 1,340,000 | 2 | CLARCOR, Inc. | 39,436,200 |
| 566,509 | | CSX Corp. | 23,895,350 |
| 401,100 | 1,2 | Copart, Inc. | 12,903,387 |
| 500,000 | 1,2 | CoStar Group, Inc. | 19,410,000 |
| 1,180,873 | | Crompton Greaves Ltd. | 9,499,327 |
| 375,000 | | Danaher Corp. | 25,586,250 |
| 2,000,000 | 2 | Expeditors International Washington, Inc. | 64,440,000 |
| 900,000 | 2 | FedEx Corp. | 65,421,000 |
| 100,000 | 1 | First Solar, Inc. | 12,193,000 |
| 500,000 | 2 | Genco Shipping & Trading Ltd. | 9,945,000 |
| 924,656 | 1,2 | GeoEye, Inc. | 23,458,523 |
| 400,000 | 1,2 | IHS, Inc., Class A | 20,704,000 |
| 600,000 | 1 | Iron Mountain, Inc. | 14,658,000 |
| 11,000,000 | 1,2 | Jet Blue Airways Corp. | 54,560,000 |
| 255,100 | 2 | Joy Global, Inc. | 12,859,591 |
| 3,245,716 | | Max India Ltd. | 12,255,409 |
| 344,055 | | Norfolk Southern Corp. | 16,039,844 |
| 380,000 | 2 | Precision Castparts Corp. | 36,301,400 |
| 800,000 | 1 | Quanta Services, Inc. | 16,960,000 |
| 1,968,000 | 1 | RailAmerica, Inc. | 23,163,360 |
| 450,000 | 2 | Rockwell Collins | 22,671,000 |
| 500,000 | 2 | Roper Industries, Inc. | 25,275,000 |
| 2,900,000 | 1,2 | Ryanair Holdings PLC, ADR | 79,083,000 |
| 332,410 | 1 | SmartHeat, Inc. | 2,971,745 |
| 550,000 | 2 | Union Pacific Corp. | 30,327,000 |
| 400,000 | | United Technologies Corp. | 24,580,000 |
| 2,736,970 | 1 | Verisk Analytics, Inc. | 75,075,087 |
| | TOTAL | 852,765,291 |
| | Information Technology – 11.3% | |
| 358,500 | | Advantest Corp. | 7,864,280 |
| 981,607 | 1 | Affiliated Computer Services, Inc., Class A | 51,131,909 |
| 378,133 | 1,2 | Akamai Technologies, Inc. | 8,318,926 |
Annual Shareholder Report12
|
| 50,000 | 1 | Amdocs Ltd. | 1,260,000 |
| 1,125,000 | 1,2 | Blackboard, Inc. | 39,903,750 |
| 4,612,700 | 1 | Cia Brasileira de Meios de Pagamentos | 42,288,320 |
| 3,000,000 | 1 | Comverse Technology, Inc. | 25,200,000 |
| 1,550,000 | 1 | Dell, Inc. | 22,459,500 |
| 1,059,322 | 1,3,6 | Expand Networks Ltd. | 0 |
| 43,125 | 1 | Google, Inc. | 23,120,175 |
| 550,000 | 2 | Hewlett-Packard Co. | 26,103,000 |
| 2,380,000 | | Hon Hai Precision Industry Co. Ltd. | 9,370,216 |
| 50,395,000 | | Inotera Memories, Inc. | 29,907,591 |
| 13,553,200 | 1 | Inspur International Ltd. | 1,904,648 |
| 550,000 | | Lender Processing Services | 21,890,000 |
| 926,630 | 1 | ManTech International Corp., Class A | 40,641,992 |
| 450,000 | 2 | Mastercard, Inc. | 98,559,000 |
| 1,600,000 | 2 | Microchip Technology, Inc. | 38,336,000 |
| 6,000,000 | 1,2 | Micron Technology, Inc. | 40,740,000 |
| 800,000 | 1,2 | Microsemi Corp. | 10,648,000 |
| 2,144,060 | 1 | NIC, Inc. | 18,781,966 |
| 69,180 | | Nintendo Corp. Ltd. | 17,640,959 |
| 3,400,000 | 1,2 | ON Semiconductor Corp. | 22,746,000 |
| 1 | 1,3,6 | Peachtree Open Networks | 0 |
| 1,070,000 | 1,5 | RADWARE Ltd. | 12,379,900 |
| 3,709,800 | 1 | Redecard SA | 55,069,976 |
| 1 | 3,6 | Sensable Technologies, Inc. (Bridge Loan) | 100,279 |
| 3,751,199 | 1,3,6 | Sensable Technologies, Inc. | 0 |
| 2,011,100 | 1,2,5 | TNS, Inc. | 56,833,686 |
| 2,943,800 | 1 | Telecity Group PLC | 16,156,128 |
| | TOTAL | 739,356,201 |
| | Materials – 8.1% | |
| 904,800 | | Barrick Gold Corp. | 32,509,464 |
| 2,000,000 | 2 | Dow Chemical Co. | 46,960,000 |
| 700,000 | 2 | Ecolab, Inc. | 30,772,000 |
| 34,547,300 | 1 | Huabao International Holdings Ltd. | 32,629,319 |
| 369,050 | 1,2 | Intrepid Potash, Inc. | 9,506,728 |
| 36,273,628 | 1 | Lee & Man Paper Manufacturing Ltd. | 71,410,362 |
| 880,000 | | Monsanto Co. | 59,118,400 |
| 490,000 | 1 | Mosaic Co./The | 22,897,700 |
Annual Shareholder Report13
|
| 1,100,000 | | Newmont Mining Corp. | 47,806,000 |
| 33,986,100 | | Nine Dragons Paper Holdings Ltd. | 48,625,435 |
| 550,000 | 2 | Nucor Corp. | 21,917,500 |
| 440,000 | 2 | Potash Corp. of Saskatchewan, Inc. | 40,823,200 |
| 127,975 | 1 | Rockwood Holdings, Inc. | 2,544,143 |
| 900,000 | 2 | Sociedad Quimica Y Minera de Chile, ADR | 33,075,000 |
| 700,000 | | Steel Dynamics, Inc. | 9,373,000 |
| 200,000 | 1 | Terra Industries, Inc. | 6,354,000 |
| 13,905,000 | 1 | Yingde Gases Group Co. | 16,667,628 |
| | TOTAL | 532,989,879 |
| | Telecommunication Services – 1.7% | |
| 1,000,000 | 2 | CenturyTel, Inc. | 32,460,000 |
| 1,458,400 | 2 | NTELOS Holdings Corp. | 22,021,840 |
| 3,400,000 | 1,2 | TW Telecom, Inc. | 42,840,000 |
| 1,500,000 | | Windstream Corp. | 14,460,000 |
| | TOTAL | 111,781,840 |
| | Utilities – 1.1% | |
| 146,559 | 1 | BF Utilities Ltd. | 2,417,643 |
| 1,284,500 | 2 | ITC Holdings Corp. | 57,057,490 |
| 500,000 | 2 | Northeast Utilities Co. | 11,525,000 |
| | TOTAL | 71,000,133 |
| | TOTAL COMMON STOCKS
(IDENTIFIED COST $5,209,348,708) | 6,176,333,210 |
| | Warrants – 0.1% | |
| | Consumer Discretionary – 0.0% | |
| 250,000 | 1,6 | Hydrogen Corp., 5/5/2011 | 0 |
| 200,000 | 1,6 | Hydrogen Corp., 8/22/2013 | 0 |
| 870,000 | 1,6 | Hydrogen Corp., 10/23/2013 | 0 |
| | TOTAL | 0 |
| | Health Care – 0.1% | |
| 1,500,000 | 1 | Advancis Pharmaceutical Corp., 4/12/2012 | 210,295 |
| 382,897 | 1 | Alexza Pharmaceuticals, Inc., 10/15/2016 | 699,021 |
| 157,125 | 1 | Clinical Data, Inc., 5/24/2012 | 516 |
| 797,358 | 1 | Corcept Therapeutics, Inc., 10/16/2012 | 888,399 |
| 857,143 | 1 | Cyclacel Pharmaceuticals, Inc., 4/28/2013 | 307,062 |
| 242,091 | 1 | Cyclacel Pharmaceuticals, Inc., 2/17/2014 | 26,432 |
| 461,121 | 1 | Favrille, Inc., 3/7/2011 | 0 |
Annual Shareholder Report14
|
| 1,042,038 | 1 | Favrille, Inc., 11/7/2012 | 0 |
| 416,580 | 1 | Metabasis Therapeutics, Inc., 4/15/2013 | 40,860 |
| 222,650 | 1 | Pharmacopeia, Inc., 4/19/2011 | 3,826 |
| 978,500 | 1 | Spectrum Pharmaceuticals, Inc., 2/25/2010 | 602,603 |
| 1,713,798 | 1 | Threshold Pharmaceuticals, Inc., 10/5/2014 | 2,875,741 |
| 4,211,677 | 1,6 | Vasogen, Inc., 11/8/2011 | 0 |
| 1,874,085 | 1 | Vical, Inc., 2/21/2010 | 2,108,779 |
| | TOTAL | 7,763,534 |
| | TOTAL WARRANTS
(IDENTIFIED COST $1,158,685) | 7,763,534 |
| | Preferred Stocks – 0.9% | |
| | Consumer Discretionary – 0.3% | |
| 41,472 | 1,3,4 | Callaway Golf Co., Conv. Pfd., Series B, $1.88 Annual Dividend | 4,784,210 |
| 9,490 | 3,4 | Lodgenet Entertainment, Conv. Pfd., Series B, $29.17 Annual Dividend | 12,324,188 |
| | TOTAL | 17,108,398 |
| | Energy – 0.1% | |
| 41,000 | 3,4 | ATP Oil & Gas Corp., Conv. Pfd., Series 144A | 4,255,390 |
| | Health Care – 0.3% | |
| 1,694,915 | 1,3,6 | Ardais Corp., Conv. Pfd. | 0 |
| 790,960 | 1,3,6 | Ardais Corp., Conv. Pfd., Series C | 0 |
| 6,461,352 | | Bellus Health, Inc., Conv. Pfd., Series A | 1,104,891 |
| 446,816 | 1,3,6 | Cortek, Inc., Conv. Pfd., Series D2 | 0 |
| 1,515,152 | 1,3,6 | Cortex, Inc., Pfd., Series D | 0 |
| 20,000 | | Mylan Laboratories, Inc., Conv. Pfd. | 20,600,000 |
| 958,744 | 6 | Soteira, Inc., Pfd. | 616,988 |
| | TOTAL | 22,321,879 |
| | Information Technology – 0.0% | |
| 679,348 | 1,3,6 | Multiplex, Inc., Pfd., Series C | 0 |
| | Utilities – 0.2% | |
| 328,000 | 1 | FPL Group, Inc., Pfd. | 15,990,000 |
| | TOTAL PREFERRED STOCKS
(IDENTIFIED COST $79,252,060) | 59,675,667 |
Annual Shareholder Report15
|
| | Corporate Bonds – 2.8% | |
| | Consumer Discretionary – 0.4% | |
| $4,820,000 | | Brown Shoe Co., Inc., Company Guarantee, 8.75%, 5/1/2012 | 4,771,800 |
| 722,050 | 6 | Hydrogen Corp., 12.00%, 8/15/2010 | 144,410 |
| 15,107,000 | | Regis Corp., Conv. Bond, 5.00%, 7/15/2014 | 19,268,978 |
| | TOTAL | 24,185,188 |
| | Financials – 0.5% | |
| 8,448,000 | 3,4 | Alexandria Real Estate Equities, Inc., Conv. Bond, 8.00%, 4/15/2029 | 12,793,820 |
| 1,636,000 | | Developers Diversified Realty, 9.625%, 3/15/2016 | 1,662,580 |
| 12,723,000 | 3,4 | GLG Partners, Inc., Conv. Bond, Series 144A, 5.00%, 5/15/2014 | 11,534,672 |
| 5,044,000 | | HRPT Properties Trust, Sr. Secd. Note, 6.95%, 4/1/2012 | 5,252,301 |
| | TOTAL | 31,243,373 |
| | Health Care – 1.0% | |
| 9,401,000 | | CONMED Corp., Conv. Sr. Sub. Note, 2.50%, 11/15/2024 | 8,713,975 |
| 29,646,000 | | Insulet Corp., Sr. Unsecd. Note, 5.375%, 6/15/2013 | 24,767,454 |
| 19,800,000 | 3,4 | Isis Pharmaceuticals, Inc., Conv. Bond, 2.625%, 2/15/2027 | 20,988,000 |
| 5,908,900 | | Nektar Therapeutics, Conv. Bond, 3.25%, 9/28/2012 | 5,349,522 |
| 8,450,000 | 2 | Wright Medical Group, Inc., 2.625%, 12/1/2014 | 7,009,275 |
| | TOTAL | 66,828,226 |
| | Industrials – 0.4% | |
| 4,087,000 | | AMR Corp., Conv. Bond, 6.25%, 10/15/2014 | 3,393,232 |
| 6,700,000 | 3,4 | Covanta Holding Corp., Conv. Bond, Series 144A, 3.25%, 6/1/2014 | 7,477,870 |
| 2,944,000 | 2 | Jet Blue Airways Corp., Conv. Bond, Series A, 6.75%, 10/15/2039 | 3,768,761 |
| 13,331,000 | | Quanta Services, Inc., Conv. Bond, 3.75%, 4/30/2026 | 14,926,721 |
| | TOTAL | 29,566,584 |
| | Information Technology – 0.4% | |
| 24,802,000 | 3,4 | BearingPoint, Inc., Conv. Bond, 5.00%, 4/15/2025 | 4,743,383 |
| 7,191,000 | | FEI Co., 2.875%, 6/1/2013 | 7,549,687 |
| 3,752,000 | | GSI Commerce, Inc., Conv. Bond, 3.00%, 6/1/2025 | 4,331,722 |
| 7,620,000 | | Safeguard Scientifics, Inc., 2.625%, 3/15/2024 | 7,180,577 |
| | TOTAL | 23,805,369 |
| | Telecommunication Services – 0.1% | |
| 7,848,000 | 3,4 | SBA Communications, Corp., Conv. Bond, 4.00%, 10/1/2014 | 9,094,655 |
| | TOTAL CORPORATE BONDS
(IDENTIFIED COST $187,742,537) | 184,723,395 |
Annual Shareholder Report16
|
| | Corporate Note – 0.1% | |
| | Materials – 0.1% | |
| $7,055,000 | | Newmont Mining Corp., Conv. Note, 3.00%, 2/15/2012
(IDENTIFIED COST $7,055,000) | 8,450,902 |
| | U.S. Treasury – 0.1% | |
| 4,000,000 | 2,7 | United States Treasury Bill, 0.06%, 2/4/2010
(IDENTIFIED COST $3,998,997) | 3,999,400 |
| | Mutual Fund – 27.2% | |
| 1,775,556,873 | 5,8,9 | Prime Value Obligations Fund, Institutional Shares, 0.22%
(AT NET ASSET VALUE) | 1,775,556,873 |
| | TOTAL INVESTMENTS — 125.6%
(IDENTIFIED COST $7,264,112,860)10 | 8,216,502,981 |
| | OTHER ASSETS AND LIABILITIES - NET — (25.6)%11 | (1,675,434,245) |
| | TOTAL NET ASSETS — 100% | $6,541,068,736 |
schedule of SecuritY Sold Short
| 100,000 | Time Warner Cable, Inc. (Proceeds $2,494,876) | $3,944,000 |
- At October 31, 2009, the Fund had outstanding foreign exchange contracts as follows:
| Settlement Date | Foreign Currency
Units to
Deliver/Receive | In
Exchange
For | Unrealized
Appreciation/
(Depreciation) |
| Contracts Purchased: | | | |
| 11/3/2009 | 109,700,390 Brazilian Real | $62,002,142 | $ 271,013 |
| 11/3/2009 | 2,238,783 Brazilian Real | $1,265,350 | $ 5,531 |
| 11/3/2009 | 5,379,000 Brazilian Real | $3,065,830 | $ (12,356) |
| 11/4/2009 | 27,905,570 Brazilian Real | $16,186,525 | $(345,489) |
| 11/4/2009 | 569,501 Brazilian Real | $330,337 | $ (7,051) |
| 11/4/2009 | 5,817 Brazilian Real | $3,315 | $ (13) |
| 11/2/2009 | 895,899 Hong Kong Dollar | $115,600 | $ (3) |
| 11/2/2009 | 62,153,956 Hong Kong Dollar | $8,019,865 | $ (207) |
| Contracts Sold: | | | |
| 11/2/2009 | 1,400,519 Euro | $2,073,469 | $ 12,393 |
| NET UNREALIZED DEPRECIATION ON FOREIGN EXCHANGE CONTRACTS | $ (76,182) |
- Net Unrealized Depreciation on Foreign Exchange Contracts is included in “Other Assets and Liabilities — Net.”
Annual Shareholder Report17
- Note: The categories of investments are shown as a percentage of total net assets at October 31, 2009.
- Various inputs are used in determining the value of the Fund's investments. These inputs are summarized in the three broad levels listed below:
- Level 1 — quoted prices in active markets for identical securities
- Level 2 — other significant observable inputs (including quoted prices for similar securities, interest rates, prepayment speeds, credit risk, etc.)
- Level 3 — significant unobservable inputs (including the Fund's own assumptions in determining the fair value of investments)
- The inputs or methodology used for valuing securities are not an indication of the risk associated with investing in those securities.
Annual Shareholder Report18
- The following is a summary of the inputs used, as of October 31, 2009, in valuing the Fund's assets carried at fair value:
| Valuation Inputs | | | | |
| Level 1 —
Quoted
Prices and
Investments in
Mutual Funds | Level 2 —
Other
Significant
Observable
Inputs | Level 3 —
Significant
Unobservable
Inputs | Total |
| Equity Securities: | | | | |
| Domestic | $4,725,666,129 | $17,640,959 | $27,212,781 | $4,770,519,869 |
| International | 1,188,529,206 | 276,959,802 | — | 1,465,489,008 |
| Debt Securities: | | | | |
| Corporate Bonds | — | 184,578,985 | 144,410 | 184,723,395 |
| Corporate Note | — | 8,450,902 | — | 8,450,902 |
| U.S. Treasury | — | 3,999,400 | — | 3,999,400 |
| Warrants | — | 3,999,394 | 3,764,140 | 7,763,534 |
| Mutual Fund | 1,775,556,873 | — | — | 1,775,556,873 |
| TOTAL SECURITIES | $7,689,752,208 | $495,629,442 | $31,121,331 | $8,216,502,981 |
| OTHER FINANCIAL INSTRUMENTS* | $(4,020,182) | $ — | $ — | $(4,020,182) |
| * | Other financial instruments include security sold short and foreign exchange contracts. |
- Following is a reconciliation of assets in which significant unobservable inputs (Level 3) were used in determining fair value:
| Investments in
Equity Securities | Investments in
Debt Securities | Investments in
Warrants |
| Balance as of November 1, 2008 | $24,315,246 | 970,616 | $213 |
| Realized gain/loss | (11,201,174) | (609,591) | (213) |
| Change in unrealized appreciation/depreciation | 2,495,453 | (216,615) | 3,422,309 |
| Net purchases (sales) | 11,603,256 | — | 313,974 |
| Transfers in and/or out of Level 3 | — | — | 27,857 |
| Balance as of October 31, 2009 | $27,212,781 | $144,410 | $3,764,140 |
| The total change in unrealized appreciation (depreciation) included in the Statement of Operations attributable to investments still held at October 31, 2009 | $(4,566,287) | $(216,615) | $3,422,309 |
- The following acronyms are used throughout this portfolio:
| ADR | — American Depositary Receipt |
| GDR | — Global Depository Receipt |
- See Notes which are an integral part of the Financial Statements
Annual Shareholder Report19
Statement of Assets and Liabilities
October 31, 2009
| Assets: | | |
| Total investments in securities, at value including $3,155,378,073 of investments in affiliated issuers (Note 5) and $1,571,541,712 of securities loaned (identified cost $7,264,112,860) | | $8,216,502,981 |
| Cash | | 276,350 |
| Cash denominated in foreign currencies (identified cost $1,369,266) | | 1,356,588 |
| Deposit at broker for short sales | | 4,340,106 |
| Income receivable | | 4,372,253 |
| Receivable for investments sold | | 121,002,802 |
| Receivable for shares sold | | 4,929,741 |
| Receivable for foreign exchange contracts | | 288,937 |
| TOTAL ASSETS | | 8,353,069,758 |
| Liabilities: | | |
| Securities sold short, at value (proceeds $2,494,876) | $3,944,000 | |
| Payable for investments purchased | 100,566,567 | |
| Payable for shares redeemed | 11,048,709 | |
| Payable for foreign exchange contracts | 365,119 | |
| Payable for collateral due to broker for securities lending | 1,683,052,785 | |
| Payable for limited partnership commitments | 2,500,000 | |
| Payable for capital gains taxes withheld | 2,873,849 | |
| Payable for Directors'/Trustees' fees | 30,290 | |
| Payable for distribution services fee (Note 5) | 1,662,782 | |
| Payable for shareholder services fee (Note 5) | 3,533,197 | |
| Accrued expenses | 2,423,724 | |
| TOTAL LIABILITIES | | 1,812,001,022 |
| Net assets for 1,564,591,203 shares outstanding | | $6,541,068,736 |
| Net Assets Consist of: | | |
| Paid-in capital | | $6,589,236,990 |
| Net unrealized appreciation of investments, short sales and translation of assets and liabilities in foreign currency | | 951,464,349 |
| Accumulated net realized loss on investments, short sales, futures contracts, written options and foreign currency transactions | | (1,004,157,776) |
| Undistributed net investment income | | 4,525,173 |
| TOTAL NET ASSETS | | $6,541,068,736 |
Annual Shareholder Report20
Statement of Assets and Liabilities — continued| Net Asset Value, Offering Price and Redemption Proceeds Per Share | | |
| Class A Shares: | | |
| Net asset value per share ($2,153,443,172 ÷ 509,870,011 shares outstanding), no par value, unlimited shares authorized | | $4.22 |
| Offering price per share (100/94.50 of $4.22) | | $4.47 |
| Redemption proceeds per share | | $4.22 |
| Class B Shares: | | |
| Net asset value per share ($562,617,859 ÷ 140,810,509 shares outstanding), no par value, unlimited shares authorized | | $4.00 |
| Offering price per share | | $4.00 |
| Redemption proceeds per share (94.50/100 of $4.00) | | $3.78 |
| Class C Shares: | | |
| Net asset value per share ($656,085,986 ÷ 164,139,383 shares outstanding), no par value, unlimited shares authorized | | $4.00 |
| Offering price per share | | $4.00 |
| Redemption proceeds per share (99.00/100 of $4.00) | | $3.96 |
| Class K Shares: | | |
| Net asset value per share ($3,168,921,719 ÷ 749,771,300 shares outstanding), no par value, unlimited shares authorized | | $4.23 |
| Offering price per share | | $4.23 |
| Redemption proceeds per share (99.80/100 of $4.23) | | $4.22 |
- See Notes which are an integral part of the Financial Statements
Annual Shareholder Report21
Statement of Operations
Year Ended October 31, 2009
| Investment Income: | | | |
| Dividends (including $23,381,382 received from affiliated issuers (Note 5) and net of foreign taxes withheld of $684,021) | | | $81,946,288 |
| Interest (including income on securities loaned of $10,329,969) | | | 29,055,636 |
| TOTAL INCOME | | | 111,001,924 |
| Expenses: | | | |
| Investment adviser fee (Note 5) | | $86,377,545 | |
| Administrative personnel and services fee (Note 5) | | 4,705,832 | |
| Custodian fees | | 1,513,468 | |
| Transfer and dividend disbursing agent fees and expenses — Class A Shares | | 3,517,193 | |
| Transfer and dividend disbursing agent fees and expenses — Class B Shares | | 1,003,573 | |
| Transfer and dividend disbursing agent fees and expenses — Class C Shares | | 1,116,577 | |
| Transfer and dividend disbursing agent fees and expenses — Class K Shares | | 5,540,212 | |
| Directors'/Trustees' fees | | 80,310 | |
| Auditing fees | | 36,600 | |
| Legal fees | | 89,926 | |
| Portfolio accounting fees | | 208,401 | |
| Distribution services fee — Class A Shares (Note 5) | | 4,948,274 | |
| Distribution services fee — Class B Shares (Note 5) | | 4,199,368 | |
| Distribution services fee — Class C Shares (Note 5) | | 4,692,397 | |
| Distribution services fee — Class K Shares (Note 5) | | 14,483,518 | |
| Shareholder services fee — Class A Shares (Note 5) | | 4,847,607 | |
| Shareholder services fee — Class B Shares (Note 5) | | 1,399,789 | |
| Shareholder services fee — Class C Shares (Note 5) | | 1,555,200 | |
| Shareholder services fee — Class K Shares (Note 5) | | 7,169,609 | |
| Account administration fee — Class A Shares | | 25,216 | |
| Account administration fee — Class C Shares | | 2,504 | |
| Account administration fee — Class K Shares | | 8,195 | |
| Share registration costs | | 101,822 | |
| Printing and postage | | 588,545 | |
| Insurance premiums | | 10,576 | |
| Miscellaneous | | 90,432 | |
| TOTAL EXPENSES | | 148,312,689 | |
Annual Shareholder Report22
Statement of Operations — continued| Waivers, Reimbursements and Expense Reduction: | | | |
| Waiver/reimbursement of investment adviser fee (Note 5) | $(9,092,373) | | |
| Waiver of administrative personnel and services fee (Note 5) | (92,968) | | |
| Waiver of distribution services fee — Class A Shares (Note 5) | (2,276,864) | | |
| Waiver of distribution services fee — Class C Shares (Note 5) | (427,707) | | |
| Waiver of distribution services fee — Class K Shares (Note 5) | (11,012,663) | | |
| Reimbursement of shareholder services fee — Class B Shares (Note 5) | (391,618) | | |
| Fees paid indirectly from directed brokerage arrangements (Note 6) | (92,251) | | |
| TOTAL WAIVERS, REIMBURSEMENTS AND EXPENSE REDUCTION | | $(23,386,444) | |
| Net expenses | | | $124,926,245 |
| Net investment income (loss) | | | (13,924,321) |
| Realized and Unrealized Gain (Loss) on Investments, Short Sales, Written Options, Futures Contracts and Foreign Currency Transactions: | | | |
| Net realized loss on investments and foreign currency transactions (including realized loss of $47,747,236 on sale of investments in affiliated issuers (Note 5) and foreign taxes withheld of $2,873,849) | | | (905,955,137) |
| Net realized loss on short sales | | | (5,219,982) |
| Net realized gain on written options | | | 10,750,131 |
| Net realized gain on futures contracts | | | 14,946,805 |
| Net change in unrealized depreciation of investments and translation of assets and liabilities in foreign currency | | | 1,499,745,944 |
| Net change in unrealized depreciation of short sales | | | (1,449,124) |
| Net realized and unrealized gain on investments, short sales, written options, futures contracts and foreign currency transactions | | | 612,818,637 |
| Change in net assets resulting from operations | | | $598,894,316 |
- See Notes which are an integral part of the Financial Statements
Annual Shareholder Report23
Statement of Changes in Net Assets
| Year Ended October 31 | 2009 | 2008 |
| Increase (Decrease) in Net Assets | | |
| Operations: | | |
| Net investment income (loss) | $(13,924,321) | $(67,661,405) |
| Net realized loss on investments, short sales, written options, futures contracts and foreign currency transactions | (885,478,183) | (31,706,262) |
| Net change in unrealized appreciation/depreciation of investments, short sales and translation of assets and liabilities in foreign currency | 1,498,296,820 | (4,545,366,165) |
| CHANGE IN NET ASSETS RESULTING FROM OPERATIONS | 598,894,316 | (4,644,733,832) |
| Distributions to Shareholders: | | |
| Distributions from net realized gain on investments and foreign currency transactions | | |
| Class A Shares | — | (333,645,193) |
| Class B Shares | — | (126,008,696) |
| Class C Shares | — | (115,952,763) |
| Class K Shares | — | (485,667,675) |
| CHANGE IN NET ASSETS RESULTING FROM DISTRIBUTIONS TO SHAREHOLDERS | — | (1,061,274,327) |
| Share Transactions: | | |
| Proceeds from sale of shares | 781,547,383 | 1,497,569,175 |
| Net asset value of shares issued to shareholders in payment of distributions declared | — | 965,376,844 |
| Cost of shares redeemed | (1,408,747,444) | (1,959,713,944) |
| CHANGE IN NET ASSETS RESULTING FROM SHARE TRANSACTIONS | (627,200,061) | 503,232,075 |
| Regulatory Settlement Proceeds: | | |
| Net increase from regulatory settlement (Note 11) | 82,951 | 319,004 |
| Change in net assets | (28,222,794) | (5,202,457,080) |
| Net Assets: | | |
| Beginning of period | 6,569,291,530 | 11,771,748,610 |
| End of period (including undistributed net investment income/accumulated net investment income (loss) of $4,525,173 and $(975,427), respectively) | $6,541,068,736 | $6,569,291,530 |
- See Notes which are an integral part of the Financial Statements
Annual Shareholder Report24
Notes to Financial Statements
October 31, 2009
1. ORGANIZATION
Federated Equity Funds (the “Trust”) is registered under the Investment Company Act of 1940, as amended (the “Act”), as an open-end management investment company. The Trust consists of 13 portfolios. The financial statements included herein are only those of Federated Kaufmann Fund (the “Fund”), a diversified portfolio. The financial statements of the other portfolios are presented separately. The assets of each portfolio are segregated and a shareholder's interest is limited to the portfolio in which shares are held. Each portfolio pays its own expenses. The Fund offers four classes of shares: Class A Shares, Class B Shares, Class C Shares and Class K Shares. All shares of the Fund have equal rights with respect to voting, except on class-specific matters. The financial highlights of the Class A Shares, Class B Shares and Class C Shares are presented separately. The investment objective of the Fund is to provide capital appreciation.
2. SIGNIFICANT ACCOUNTING POLICIES
The following is a summary of significant accounting policies consistently followed by the Fund in the preparation of its financial statements. These policies are in conformity with U.S. generally accepted accounting principles (GAAP).
Investment Valuation
In calculating its net asset value (NAV), the Fund generally values investments as follows:
- Equity securities listed on an exchange or traded through a regulated market system are valued at their last reported sale price or official closing price in their principal exchange or market.
- Shares of other mutual funds are valued based upon their reported NAVs.
- Fixed-income securities acquired with remaining maturities greater than 60 days are fair valued using price evaluations provided by a pricing service approved by the Trustees.
- Fixed-income securities acquired with remaining maturities of 60 days or less are valued at their cost (adjusted for the accretion of any discount or amortization of any premium).
- Derivative contracts listed on exchanges are valued at their reported settlement or closing price.
- Over-the-counter (OTC) derivative contracts are fair valued using price evaluations provided by a pricing service approved by the Trustees.
If the Fund cannot obtain a price or price evaluation from a pricing service for an investment, the Fund may attempt to value the investment based upon the mean of bid and asked quotations or fair value the investment based on price evaluations from one or more dealers. If any price, quotation, price evaluation or other pricing source is not readily available when the NAV is calculated, the Fund uses the fair value of the investment determined in accordance with the procedures described below. There can be no assurance that the Fund could purchase or sell an investment at the price used to calculate the Fund's NAV.
Fair Valuation and Significant Events Procedures
The Trustees have authorized the use of pricing services to provide evaluations of the current fair value of certain investments for purposes of calculating the NAV. Factors considered by pricing services in evaluating an investment include the yields or prices of investments of comparable quality, coupon, maturity, call rights and other potential prepayments, terms and type, reported transactions, indications as to values from dealers and general market Annual Shareholder Report25
conditions. Some pricing services provide a single price evaluation reflecting the bid-side of the market for an investment (a “bid” evaluation). Other pricing services offer both bid evaluations and price evaluations indicative of a price between the prices bid and asked for the investment (a “mid” evaluation). The Fund normally uses bid evaluations for U.S. Treasury and Agency securities. The Fund normally uses mid evaluations for other types of fixed-income securities and OTC derivative contracts. In the event that market quotations and price evaluations are not available for an investment, the fair value of the investment is determined in accordance with procedures adopted by the Trustees.The Trustees also have adopted procedures requiring an investment to be priced at its fair value whenever the Adviser determines that a significant event affecting the value of the investment has occurred between the time as of which the price of the investment would otherwise be determined and the time as of which the NAV is computed. An event is considered significant if there is both an affirmative expectation that the investment's value will change in response to the event and a reasonable basis for quantifying the resulting change in value. Examples of significant events that may occur after the close of the principal market on which a security is traded, or after the time of a price evaluation provided by a pricing service or a dealer, include:
- With respect to securities traded in foreign markets, significant trends in U.S. equity markets or in the trading of foreign securities index futures or options contracts;
- With respect to price evaluations of fixed-income securities determined before the close of regular trading on the NYSE, actions by the Federal Reserve Open Market Committee and other significant trends in U.S. fixed-income markets;
- Political or other developments affecting the economy or markets in which an issuer conducts its operations or its securities are traded; and
- Announcements concerning matters such as acquisitions, recapitalizations, litigation developments, a natural disaster affecting the issuer's operations or regulatory changes or market developments affecting the issuer's industry.
The Trustees have approved the use of a pricing service to determine the fair value of equity securities traded principally in foreign markets when the Adviser determines that there has been a significant trend in the U.S. equity markets or in index futures trading. For other significant events, the Fund may seek to obtain more current quotations or price evaluations from alternative pricing sources. If a reliable alternative pricing source is not available, the Fund will determine the fair value of the investment using another method approved by the Trustees.
Repurchase Agreements
It is the policy of the Fund to require the other party to a repurchase agreement to transfer to the Fund's custodian or sub-custodian eligible securities or cash with a market value (after transaction costs) at least equal to the repurchase price to be paid under the repurchase agreement. The eligible securities are transferred to accounts with the custodian or sub-custodian in which the Fund holds a “securities entitlement” and exercises “control” as those terms are defined in the Uniform Commercial Code. The Fund has established procedures for monitoring the market value of the transferred securities and requiring the transfer of additional eligible securities if necessary to equal at least the repurchase price. These procedures also allow the other party to require securities to be transferred from the account to the extent that their market value exceeds the repurchase price or in exchange for other eligible securities of equivalent market value.
Annual Shareholder Report26
With respect to agreements to repurchase U.S. government securities and cash items, the Fund treats the repurchase agreement as an investment in the underlying securities and not as an obligation of the other party to the repurchase agreement. Other repurchase agreements are treated as obligations of the other party secured by the underlying securities. Nevertheless, the insolvency of the other party or other failure to repurchase the securities may delay the disposition of the underlying securities or cause the Fund to receive less than the full repurchase price. Under the terms of the repurchase agreement, any amounts received by the Fund in excess of the repurchase price and related transaction costs must be remitted to the other party.The Fund may enter into repurchase agreements in which eligible securities are transferred into joint trading accounts maintained by the custodian or sub-custodian for investment companies and other clients advised by the Fund's Adviser and its affiliates. The Fund will participate on a pro-rata basis with the other investment companies and clients in its share of the securities transferred under such repurchase agreements and in its share of proceeds from any repurchase or other disposition of such securities.
Investment Income, Gains and Losses, Expenses and Distributions
Investment transactions are accounted for on a trade-date basis. Realized gains and losses from investment transactions are recorded on an identified-cost basis. Interest income and expenses are accrued daily. Dividend income and distributions to shareholders are recorded on the ex-dividend date. Foreign dividends are recorded on the ex-dividend date or when the Fund is informed of the ex-dividend date. Distributions of net investment income, if any, are declared and paid annually. Non-cash dividends included in dividend income, if any, are recorded at fair value. Investment income, realized and unrealized gains and losses, and certain fund-level expenses are allocated to each class based on relative average daily net assets, except that Class A Shares, Class B Shares, Class C Shares and Class K Shares may bear distribution services fees, shareholder services fees, account administration fees and certain transfer and dividend disbursing agent fees unique to those classes. Dividends are declared separately for each class. No class has preferential dividend rights; differences in per-share dividend rates are generally due to differences in separate class expenses.
Premium and Discount Amortization
All premiums and discounts on fixed-income securities are amortized/accreted for financial statement purposes.
Federal Taxes
It is the Fund's policy to comply with the Subchapter M provision of the Internal Revenue Code (the “Code”) and to distribute to shareholders each year substantially all of its income. Accordingly, no provision for federal income tax is necessary. As of and during the year ended October 31, 2009, the Fund did not have a liability for any uncertain tax positions. The Fund recognizes interest and penalties, if any, related to tax liabilities as income tax expense in the Statement of Operations. As of October 31, 2009, tax years 2006 through 2009 remain subject to examination by the Fund's major tax jurisdictions, which include the United States of America and the Commonwealth of Massachusetts.
The Fund may be subject to taxes imposed by governments of countries in which it invests. Such taxes are generally based on either income or gains earned or repatriated. The Fund accrues and applies such taxes to net investment income, net realized gains and net unrealized gains as income and/or gains are earned.
Annual Shareholder Report27
When-Issued and Delayed Delivery TransactionsThe Fund may engage in when-issued or delayed delivery transactions. The Fund records when-issued securities on the trade date and maintains security positions such that sufficient liquid assets will be available to make payment for the securities purchased. Securities purchased on a when-issued or delayed delivery basis are marked to market daily and begin earning interest on the settlement date. Losses may occur on these transactions due to changes in market conditions or the failure of counterparties to perform under the contract.
Futures Contracts
The Fund may purchase and sell financial futures contracts to enhance yield, manage cash flows and to potentially reduce transaction costs. Upon entering into a financial futures contract with a broker, the Fund is required to deposit in a segregated account a specified amount of cash or U.S. government securities. Futures contracts are valued daily and unrealized gains or losses are recorded in a “variation margin” account. Daily, the Fund receives from or pays to the broker a specified amount of cash based upon changes in the variation margin account. When a contract is closed, the Fund recognizes a realized gain or loss. Futures contracts have market risks, including the risk that the change in the value of the contract may not correlate with the changes in the value of the underlying securities. There is minimal counterparty risk to the Fund since futures are exchange traded and the exchange's clearinghouse, as counterparty to all exchange traded futures, guarantees the futures against default.
At October 31, 2009, the Fund had no outstanding futures contracts.
Foreign Exchange Contracts
The Fund may enter into foreign exchange contracts for the delayed delivery of securities or foreign currency exchange transactions. The Fund may enter into foreign exchange contracts to protect assets against adverse changes in foreign currency exchange rates or exchange control regulations. Purchased contracts are used to acquire exposure to foreign currencies, whereas, contracts to sell are used to hedge the Fund's securities against currency fluctuations. Risks may arise upon entering into these transactions from the potential inability of counterparties to meet the terms of their commitments and from unanticipated movements in security prices or foreign exchange rates. The foreign exchange contracts are adjusted by the daily exchange rate of the underlying currency and any gains or losses are recorded for financial statement purposes as unrealized until the settlement date.
Foreign exchange contracts outstanding at period end are listed after the Fund's Portfolio of Investments.
Foreign Currency Translation
The accounting records of the Fund are maintained in U.S. dollars. All assets and liabilities denominated in foreign currencies (FCs) are translated into U.S. dollars based on the rates of exchange of such currencies against U.S. dollars on the date of valuation. Purchases and sales of securities, income and expenses are translated at the rate of exchange quoted on the respective date that such transactions are recorded. The Fund does not isolate that portion of the results of operations resulting from changes in foreign exchange rates on investments from the fluctuations arising from changes in market prices of securities held. Such fluctuations are included with the net realized and unrealized gain or loss from investments.
Annual Shareholder Report28
Reported net realized foreign exchange gains or losses arise from sales of portfolio securities, sales and maturities of short-term securities, sales of FCs, currency gains or losses realized between the trade and settlement dates on securities transactions, the difference between the amounts of dividends, interest and foreign withholding taxes recorded on the Fund's books, and the U.S. dollar equivalent of the amounts actually received or paid. Net unrealized foreign exchange gains and losses arise from changes in the value of assets and liabilities other than investments in securities at fiscal year end, resulting from changes in the exchange rate.Option Contracts
The Fund may buy or sell put and call options to obtain premiums from the sale of derivative contracts, realize gains from trading a derivative contract, or hedge against potential losses. The seller (writer) of an option receives a payment or premium, from the buyer, which the writer keeps regardless of whether the buyer exercises the option. Premiums paid for purchasing options which expire are treated as realized losses. The risk associated with purchasing put and call options is limited to the premium paid. When the Fund writes a put or call option, an amount equal to the premium received is recorded as a liability and subsequently marked to market to reflect the current value of the option written. Premiums received from writing options which expire are treated as realized gains. Premiums received from writing options which are exercised or closed are added to the proceeds or offset against amounts paid on the underlying reference instrument to determine the realized gain or loss. The Fund, as a writer of an option, bears the market risk of an unfavorable change in the price of the underlying reference instrument. Options can trade on securities or commodities exchanges. In this case, the exchange sets all the terms of the contract except for the price. Most exchanges require investors to maintain margin accounts through their brokers to cover their potential obligations to the exchange. This protects investors against potential defaults by the counterparty.
The following is a summary of the Fund's written option activity:
| Contracts | Number of
Contracts | Premium |
| Outstanding at October 31, 2008 | — | $ — |
| Contracts written | 589,401,982 | 15,907,939 |
| Contracts bought back | 589,401,982 | 15,907,939 |
| Outstanding at October 31, 2009 | — | $ — |
At October 31, 2009, the Fund had no outstanding written option contracts.
Annual Shareholder Report29
Securities Lending
The Fund participates in a securities lending program providing for the lending of equity securities to qualified brokers. The Fund normally receives cash collateral for securities loaned that is invested in an affiliated money market fund or in short-term securities including repurchase agreements. Collateral is maintained at a minimum level of 100% of the market value of investments loaned, plus interest, if applicable. Earnings on collateral are allocated between the securities lending agent, as a fee for its services under the program, and the Fund, according to agreed-upon rates.
As of October 31, 2009, securities subject to this type of arrangement and related collateral were as follows:
Market Value of
Securities Loaned | Market Value
of Collateral |
| $1,571,541,712 | $1,683,052,785 |
Short Sales
The Fund may sell a security short in an effort to take advantage of an anticipated decline in the price of the security. In a short sale, the Fund sells a security it does not own, and must borrow the security in order to deliver it at completion of the sale. The Fund then has an obligation to replace the borrowed security. If the Fund can buy the security back at a lower price than it sold it for, a gain is realized. If the Fund has to buy the security back at a higher price, a loss is realized. For the year ended October 31, 2009, the Fund had a net realized loss on short sales of $5,219,982.
Short Sales outstanding at period end are listed after the Fund's Portfolio of Investments.
Restricted Securities
Restricted securities are securities that either: (a) cannot be offered for public sale without first being registered, or being able to take advantage of an exemption from registration, under the Securities Act of 1933; or (b) are subject to contractual restrictions on public sales. In some cases, when a security cannot be offered for public sale without first being registered, the issuer of the restricted security has agreed to register such securities for resale, at the issuer's expense, either upon demand by the Fund or in connection with another registered offering of the securities. Many such restricted securities may be resold in the secondary market in transactions exempt from registration. Restricted securities may be determined to be liquid under criteria established by the Trustees. The Fund will not incur any registration costs upon such resales. The Fund's restricted securities are valued at the price provided by dealers in the secondary market or, if no market prices are available, at the fair value as determined in accordance with procedures established by and under the general supervision of the Trustees.
Annual Shareholder Report30
Additional information on restricted securities, excluding securities purchased under Rule 144A, if applicable, that have been deemed liquid by the Trustees, held at October 31, 2009, is as follows:| Security | Acquisition Date | Acquisition Cost | Market Value |
| Apollo Investment Fund V | 5/18/2001 | $580,812 | $5,936,545 |
| Ardais Corp., Conv. Pfd. | 3/2/2001-3/8/2001 | 9,999,999 | — |
| Ardais Corp., Conv. Pfd., Series C | 12/18/2002 | 4,666,664 | — |
| Conceptus, Inc. | 8/11/2005 | 4,500,000 | 10,962,500 |
| Conceptus, Inc. | 4/10/2001 | 5,000,000 | 12,528,576 |
| Cortek, Inc. | 2/29/2000 | — | — |
| Cortek, Inc., Conv. Pfd., Series D2 | 3/31/2003 | — | — |
| Cortex, Inc., Pfd., Series D | 6/18/2001 | — | — |
| Denovo Ventures I LP | 3/9/2000 | 3,332,145 | 3,034,000 |
| Endologix, Inc. | 12/8/2003-7/30/2009 | 29,380,119 | 32,917,913 |
| Expand Networks Ltd. | 9/22/2000 | 2,500,000 | — |
| FA Private Equity Fund IV LP | 3/4/2002 | 690,660 | 856,906 |
| Infrastructure Fund | 8/11/2000 | 410,088 | 20,555 |
| Latin Healthcare Fund | 11/28/2000 | — | 940,831 |
| Multiplex, Inc., Pfd., Series C | 2/22/2001 | 5,000,001 | — |
| Peachtree Leadscope LLC, Class C | 4/30/2002 | 3,000,000 | 3,250,000 |
| Peachtree Leadscope LLC, Class A & B | 6/30/2000 | 712,054 | — |
| Peachtree Open Networks | 10/5/2000 | 892,599 | — |
| Peachtree Velquest | 9/14/2000 | 494,382 | — |
| Rocket Ventures II | 7/20/1999 | 10,015,342 | — |
| Sensable Technologies, Inc. (Bridge Loan) | 12/16/2003 | 401,118 | 100,279 |
| Sensable Technologies, Inc. | 10/15/2004 | — | — |
| Venworks | 1/6/2000 | 5,000,000 | — |
Annual Shareholder Report31
Additional Disclosure Related to Derivative Instruments| Fair Value of Derivative Instruments |
| Asset | Liability |
| Statement of
Assets and
Liabilities
Location | Fair
Value | Statement of
Assets and
Liabilities
Location | Fair
Value |
Derivatives not accounted for as hedging instruments under
ASC Topic 815 | | | | |
| Foreign exchange contracts | Receivable for
foreign exchange contracts | $288,937 | Payable for
foreign exchange contracts | $365,119 |
The Effect of Derivative Instruments on the Statement of Operations for the Year Ended October 31, 2009
| Amount of Realized Gain or (Loss) on Derivatives Recognized in Income |
| Option Contracts | Futures | Forward
Currency
Contracts | Total |
| Equity contracts | $21,182,721 | $14,946,805 | $ — | $36,129,526 |
| Foreign exchange contracts | — | — | 359,828 | 359,828 |
| Total | $21,182,721 | $14,946,805 | $359,828 | $36,489,354 |
| Change in Unrealized Appreciation or (Depreciation) on Derivatives Recognized in Income |
| Option Contracts | Forward
Currency
Contracts | Total |
| Foreign exchange contracts | $ — | $(196,213) | $(196,213) |
| Equity contracts | (59,530,248) | — | (59,530,248) |
| Total | $(59,530,248) | $(196,213) | $(59,726,461) |
Other
The preparation of financial statements in conformity with GAAP requires management to make estimates and assumptions that affect the amounts of assets, liabilities, expenses and revenues reported in the financial statements. Actual results could differ from those estimated.
Annual Shareholder Report32
3. SHARES OF BENEFICIAL INTERESTThe following tables summarize share activity:
| Year Ended October 31 | 2009 | 2008 |
| Class A Shares: | Shares | Amount | Shares | Amount |
| Shares sold | 129,793,261 | $486,148,491 | 155,726,508 | $858,694,230 |
| Shares issued to shareholders in payment of distributions declared | — | — | 47,419,878 | 289,259,872 |
| Shares redeemed | (187,402,355) | (682,429,197) | (166,073,383) | (874,880,670) |
NET CHANGE RESULTING
FROM CLASS A
SHARE TRANSACTIONS | (57,609,094) | $(196,280,706) | 37,073,003 | $273,073,432 |
| Year Ended October 31 | 2009 | 2008 |
| Class B Shares: | Shares | Amount | Shares | Amount |
| Shares sold | 8,179,498 | $28,618,485 | 12,608,818 | $67,138,655 |
| Shares issued to shareholders in payment of distributions declared | — | — | 19,888,456 | 116,148,582 |
| Shares redeemed | (47,455,866) | (164,665,568) | (54,173,140) | (274,630,943) |
NET CHANGE RESULTING
FROM CLASS B
SHARE TRANSACTIONS | (39,276,368) | $(136,047,083) | (21,675,866) | $(91,343,706) |
| Year Ended October 31 | 2009 | 2008 |
| Class C Shares: | Shares | Amount | Shares | Amount |
| Shares sold | 25,317,394 | $88,656,699 | 45,747,396 | $244,165,700 |
| Shares issued to shareholders in payment of distributions declared | — | — | 15,150,558 | 88,479,262 |
| Shares redeemed | (56,803,525) | (193,749,224) | (49,853,868) | (247,587,025) |
NET CHANGE RESULTING
FROM CLASS C
SHARE TRANSACTIONS | (31,486,131) | $(105,092,525) | 11,044,086 | $85,057,937 |
| Year Ended October 31 | 2009 | 2008 |
| Class K Shares: | Shares | Amount | Shares | Amount |
| Shares sold | 48,539,071 | $178,123,708 | 59,305,047 | $327,570,590 |
| Shares issued to shareholders in payment of distributions declared | — | — | 77,166,652 | 471,489,128 |
| Shares redeemed | (100,648,477) | (367,903,455) | (106,802,101) | (562,615,306) |
NET CHANGE RESULTING
FROM CLASS K
SHARE TRANSACTIONS | (52,109,406) | $(189,779,747) | 29,669,598 | $236,444,412 |
NET CHANGE RESULTING
FROM FUND
SHARE TRANSACTIONS | (180,480,999) | $(627,200,061) | 56,110,821 | $503,232,075 |
Annual Shareholder Report33
Redemption Fee
The Fund's Class K Shares impose a redemption fee of 0.20% on the redemption price of the Fund's Class K Shares redeemed, if such shares were purchased after February 1, 1985. The redemption fee is applied to the Fund's Class K Shares expenses for providing redemption services, including, but not limited to: transfer agent fees, postage, printing, telephone and related employment costs. Any excess fee proceeds are added to the Fund's assets. Shares acquired through employer-sponsored retirement plans will not be subject to the redemption fee. However, if shares are purchased for a retirement plan account through a broker, financial institution or other intermediary maintaining an omnibus account for the shares, the waiver may not apply. In addition, this waiver does not apply to individual retirement accounts, such as Traditional, Roth and SEP-IRAs. For the year ended October 31, 2009, redemption fees of $448,895 were allocated to cover the cost of redemptions. For the year ended October 31, 2008, redemption fees of $664,418 were allocated to cover the cost of redemptions.
4. FEDERAL TAX INFORMATION
The timing and character of income and capital gain distributions are determined in accordance with income tax regulations, which may differ from GAAP. These differences are due in part to differing treatments for foreign currency transactions, partnership adjustments, defaulted interest, expiration of capital loss carryforwards, reclassification for regulatory settlement proceeds and discount accretion/premium amortization on debt securities.
For the year ended October 31, 2009, permanent differences identified and reclassified among the components of net assets were as follows:
| Increase (Decrease) |
| Paid-In Capital | Undistributed
Net Investment
Income (Loss) | Accumulated
Net Realized
Gain (Loss) |
| $(15,639,943) | $19,424,921 | $(3,784,978) |
Net investment income (loss), net realized gains (losses) and net assets were not affected by this reclassification.
The tax character of distributions as reported on the Statement of Changes in Net Assets for the years ended October 31, 2009 and 2008, was as follows:
| 2009 | 2008 |
| Ordinary income1 | $ — | $270,508,444 |
| Long-term capital gains | $ — | $790,765,883 |
| 1 | For tax purposes, short-term capital gain distributions are considered ordinary income distributions. |
As of October 31, 2009, the components of distributable earnings on a tax basis were as follows:
| Undistributed ordinary income | $10,471,367 |
| Net unrealized appreciation | $849,711,502 |
| Capital loss carryforwards | $(908,351,123) |
Annual Shareholder Report34
The difference between book-basis and tax-basis net unrealized appreciation/depreciation is attributable in part to differing treatments for the deferral of losses on wash sales, partnership adjustments, the realization for tax purposes of unrealized gains on investments in passive foreign investment companies, defaulted interest and discount accretion/premium amortization on debt securities.
At October 31, 2009, the cost of investments for federal tax purposes was $7,362,991,858. The net unrealized appreciation of investments for federal tax purposes excluding any unrealized depreciation/appreciation resulting from changes in foreign currency exchange rates, outstanding foreign currency commitments and short sales was $853,511,123. This consists of net unrealized appreciation from investments for those securities having an excess of value over cost of $1,249,119,492 and net unrealized depreciation from investments for those securities having an excess of cost over value of $395,608,369.
At October 31, 2009, the Fund had a capital loss carryforward of $908,351,123, which will reduce the Fund's taxable income arising from future net realized gains on investments, if any, to the extent permitted by the Code and thus will reduce the amount of distributions to shareholders which would otherwise be necessary to relieve the Fund of any liability for federal income tax. Pursuant to the Code, such capital loss carryforward will expire as follows:
| Expiration Year | Expiration Amount |
| 2016 | $18,502,576 |
| 2017 | $889,848,547 |
Capital loss carryforwards of $15,557,130 expired during the year ended October 31, 2009.
5. INVESTMENT ADVISER FEE AND OTHER TRANSACTIONS WITH AFFILIATES
Investment Adviser Fee
Federated Equity Management Company of Pennsylvania is the Fund's investment adviser (the “Adviser”). The advisory agreement between the Fund and the Adviser provides for an annual fee equal to 1.425% of the Fund's average daily net assets. Subject to the terms described in the Expense Limitation note, the Adviser may voluntarily choose to waive any portion of its fee. The Adviser can modify or terminate this voluntary waiver at any time at its sole discretion. For the year ended October 31, 2009, the Adviser voluntarily waived $7,270,124 of its fee.
Certain of the Fund's assets are managed by Federated Global Investment Management Corp. (the “Sub-Adviser”). Under the terms of a sub-advisory agreement between the Adviser and the Sub-Adviser, the Sub-Adviser receives an allocable portion of the Fund's adviser fee. The fee is paid by the Adviser out of its resources and is not an incremental Fund expense. For the year ended October 31, 2009, the Sub-Adviser earned a fee of $71,223,590.
Annual Shareholder Report35
Administrative FeeFederated Administrative Services (FAS), under the Administrative Services Agreement, provides the Fund with administrative personnel and services. The fee paid to FAS is based on the average aggregate daily net assets of certain Federated funds as specified below:
| Administrative Fee | Average Aggregate Daily Net Assets
of the Federated Funds |
| 0.150% | on the first $5 billion |
| 0.125% | on the next $5 billion |
| 0.100% | on the next $10 billion |
| 0.075% | on assets in excess of $20 billion |
The administrative fee received during any fiscal year shall be at least $150,000 per portfolio and $40,000 per each additional class of Shares. Subject to the terms described in the Expense Limitation note, FAS may voluntarily choose to waive any portion of its fee. FAS can modify or terminate this voluntary waiver at any time at its sole discretion. For the year ended October 31, 2009, the net fee paid to FAS was 0.076% of average daily net assets of the Fund. FAS waived $92,968 of its fee.
Distribution Services Fee
The Fund has adopted a Distribution Plan (the “Plan”) pursuant to Rule 12b-1 under the Act. Under the terms of the Plan, the Fund will compensate Federated Securities Corp. (FSC), the principal distributor, from the daily net assets of the Fund's Class A Shares, Class B Shares, Class C Shares and Class K Shares to finance activities intended to result in the sale of these shares. The Plan provides that the Fund may incur distribution expenses at the following percentages of average daily net assets annually, to compensate FSC:
| Share Class Name | Percentage of Average Daily
Net Assets of Class |
| Class A Shares | 0.25% |
| Class B Shares | 0.75% |
| Class C Shares | 0.75% |
| Class K Shares | 0.50% |
Subject to the terms described in the Expense Limitation note, FSC may voluntarily choose to waive any portion of its fee. FSC can modify or terminate this voluntary waiver at any time at its sole discretion. For the year ended October 31, 2009, FSC voluntarily waived $13,717,234 of its fee. When FSC receives fees, it may pay some or all of them to financial intermediaries whose customers purchase shares. For the year ended October 31, 2009, FSC retained $5,470,892 of fees paid by the Fund.
Sales Charges
Front-end sales charges and contingent deferred sales charges (CDSC) do not represent expenses of the Fund. They are deducted from the proceeds of sales of Fund shares prior to investment or from redemption proceeds prior to remittance, as applicable. For the year ended October 31, 2009, FSC retained $200,654 in sales charges from the sale of Class A Shares. FSC also retained $16,739 of CDSC relating to redemptions of Class A Shares and $41,732 relating to redemptions of Class C Shares.
Annual Shareholder Report36
Shareholder Services FeeThe Fund may pay fees (Service Fees) up to 0.25% of the average daily net assets of the Fund's Class A Shares, Class B Shares, Class C Shares and Class K Shares to financial intermediaries or to Federated Shareholder Services Company (FSSC) for providing services to shareholders and maintaining shareholder accounts. Financial intermediaries may include a company affiliated with management of Federated Investors, Inc. A financial intermediary affiliated with management of Federated Investors, Inc. received $8,955 of Service Fees for the year ended October 31, 2009. Subject to the terms described in the Expense Limitation note, FSSC may voluntarily reimburse the Fund for shareholder services fees. This voluntary reimbursement can be modified or terminated at any time. For the year ended October 31, 2009, FSSC voluntarily reimbursed $391,618 of shareholder services fees. For the year ended October 31, 2009, FSSC received $3,746,686 of fees paid by the Fund.
Commitments and Contingencies
In the course of pursuing its investment objective, the Fund sometimes invests in limited partnerships and limited liability companies. These entities often require the Fund to commit to a total dollar amount to be invested. The actual investments are usually made in installments over a period of time. At October 31, 2009, the Fund had total commitments to limited partnerships and limited liability companies of $45,173,400; of this amount, $41,214,996 was actually invested by the Fund leaving the Fund contingently liable for additional investments of $3,958,404.
Interfund Transactions
During the year ended October 31, 2009, the Fund engaged in purchase and sale transactions with funds that have a common investment adviser (or affiliated investment advisers), common Directors/Trustees, and/or common Officers. These purchase and sale transactions complied with Rule 17a-7 under the Act and amounted to $2,063,469 and $10,611,106, respectively.
Expense Limitation
The Adviser and its affiliates (which may include FSC, FAS and FSSC) have voluntarily agreed to waive their fees and/or reimburse expenses so that the total operating expenses (as shown in the financial highlights) paid by the Fund's Class A Shares, Class B Shares, Class C Shares and Class K Shares (after the voluntary waivers and reimbursements) will not exceed 1.95%, 2.50%, 2.50% and 1.95%, respectively, through the later of (the “Termination Date”): (a) December 31, 2010; or (b) the date of the Fund's next effective Prospectus. While the Adviser and its affiliates currently do not anticipate terminating these arrangements prior to the Termination Date, these arrangements may only be terminated prior to the Termination Date with the agreement of the Fund's Board of Trustees.
General
Certain Officers and Trustees of the Fund are Officers and Directors or Trustees of the above companies.
Annual Shareholder Report37
Transactions with Affiliated Companies and Affiliated HoldingsAn affiliated company is a company in which the Fund has ownership of at least 5% of the voting shares. Transactions with affiliated companies during the year ended October 31, 2009, were as follows:
| Affiliates | Balance of
Shares Held
10/31/2008 | Purchases/
Additions | Sales/
Reductions | Balance of
Shares Held
10/31/2009 | Value | Dividend
Income |
| Alkermes, Inc. | 5,000,000 | 7,057,000 | — | 12,057,000 | $96,094,290 | $ — |
| Alleghany Corp., Conv. Pfd. | 173,200 | — | 173,200 | — | — | 1,976,351 |
| Arena Pharmaceuticals, Inc. | 8,000,000 | 7,995,037 | 6,144,237 | 9,850,800 | 34,773,324 | — |
| Auxilium Pharmaceutical, Inc. | 3,000,000 | 507,017 | 200,000 | 3,307,017 | 104,038,755 | — |
| Brasil Brokers Participacoes | 4,885,000 | 3,833,450 | — | 8,718,450 | 30,189,910 | 93,326 |
| CardioNet, Inc. | 1,499,989 | 473,400 | 1,973,389 | — | — | — |
| CETIP SA | — | 17,903,500 | — | 17,903,500 | 119,925,806 | — |
| Chimera Investment Corp. | 14,636,000 | 44,208,267 | 6,244,267 | 52,600,000 | 183,574,000 | 12,453,056 |
| Conceptus, Inc. | 600,000 | — | — | 600,000 | 10,524,000 | — |
| Conceptus, Inc. | 3,634,700 | — | — | 3,634,700 | 63,752,638 | — |
| Conceptus, Inc. | 714,286 | — | — | 714,286 | 12,528,576 | — |
| Cubist Pharmaceuticals, Inc. | 2,955,039 | 4,444,961 | 400,000 | 7,000,000 | 118,580,000 | — |
| Cyclacel Pharmaceuticals, Inc. | 1,275,467 | — | 1,275,467 | — | — | — |
| Dexcom, Inc. | — | 4,916,800 | — | 4,916,800 | 33,729,248 | — |
| Dyax Corp. | 6,500,000 | 4,855,088 | — | 11,355,088 | 35,654,976 | — |
| Endologix, Inc. | 4,046,250 | 2,869,278 | — | 6,915,528 | 32,917,913 | — |
| Epigenomics AG | 5,081,706 | — | 233,942 | 4,847,764 | 21,291,255 | — |
| Insulet Corp. | 2,545,895 | 304,105 | — | 2,850,000 | 31,635,000 | — |
| IPC The Hospitalist Co., Inc. | 875,000 | — | 875,000 | — | — | — |
| Isis Pharmaceuticals, Inc. | 2,810,995 | 4,069,762 | — | 6,880,757 | 87,179,191 | — |
| MBF Healthcare Acquisition Corp. | 1,852,200 | — | 1,852,200 | — | — | — |
| National CineMedia, Inc. | 1,900,000 | 554,347 | 95,588 | 2,358,759 | 37,740,144 | 1,477,157 |
| Neurocrine Biosciences, Inc. | 3,900,000 | — | 1,504,267 | 2,395,733 | 5,318,527 | — |
| Orthovita, Inc. | 776,280 | 4,272,932 | 49,212 | 5,000,000 | 17,500,000 | — |
| OSI Pharmaceuticals, Inc. | 3,500,000 | 100,000 | 100,000 | 3,500,000 | 112,770,000 | — |
Annual Shareholder Report38
| Affiliates | Balance of
Shares Held
10/31/2008 | Purchases/
Additions | Sales/
Reductions | Balance of
Shares Held
10/31/2009 | Value | Dividend
Income |
| Pharmacyclics, Inc. | — | 3,460,000 | — | 3,460,000 | $6,747,000 | $ — |
| Progenics Pharmaceuticals, Inc. | 3,000,000 | 1,700,000 | — | 4,700,000 | 19,693,000 | — |
| RADWARE Ltd. | 1,070,000 | — | — | 1,070,000 | 12,379,900 | — |
| Repligen Corp. | 1,000,000 | 1,791,203 | — | 2,791,203 | 13,621,071 | — |
| Restoque Comercio e Confeccoes de Roupas SA | 12,156,700 | — | 159,162 | 11,997,538 | 27,923,425 | 1,475,777 |
| Solera Holdings, Inc. | 3,556,267 | — | 3,556,267 | — | — | — |
| TNS, Inc. | 1,523,200 | 487,900 | — | 2,011,100 | 56,833,686 | — |
| Two Harbors Investment Co. | — | 3,000,000 | — | 3,000,000 | 29,070,000 | — |
| Vical, Inc. | 1,696,945 | 6,041,875 | — | 7,738,820 | 23,835,565 | — |
TOTAL OF
AFFILIATED
COMPANIES | 104,165,119 | 124,845,922 | 24,836,198 | 204,174,843 | $1,379,821,200 | $17,475,667 |
Affiliated holdings are mutual funds which are managed by the Adviser or an affiliate of the Adviser. The Adviser has agreed to reimburse the Fund for certain investment adviser fees as a result of transactions in other affiliated mutual funds. For the year ended October 31, 2009, the Adviser reimbursed $1,822,249. Transactions with affiliated holdings during the year ended October 31, 2009, were as follows:
| Affiliates | Balance of
Shares Held
10/31/2008 | Purchases/
Additions | Sales/
Reductions | Balance of
Shares Held
10/31/2009 | Value | Dividend
Income |
| Government Obligations Fund, Institutional Shares | 243,685,058 | 55,665,720 | 299,350,778 | — | $ — | $91,065 |
Prime Value Obligations Fund, Institutional
Shares | 1,229,775,082 | 10,427,614,960 | 9,881,833,169 | 1,775,556,873 | 1,775,556,873 | 5,814,650 |
TOTAL OF
AFFILIATED
HOLDINGS | 1,473,460,140 | 10,483,280,680 | 10,181,183,947 | 1,775,556,873 | $1,775,556,873 | $5,905,715 |
Annual Shareholder Report39
6. EXPENSE ReductionThe Fund directs portfolio trades to a broker that in turn pays a portion of the Fund's operating expenses. For the year ended October 31, 2009, the Fund's expenses were reduced by $92,251 under these arrangements.
7. Investment TRANSACTIONS
Purchases and sales of investments, excluding long-term U.S. government securities and short-term obligations, for the year ended October 31, 2009, were as follows:
| Purchases | $5,124,218,218 |
| Sales | $5,111,692,867 |
8. CONCENTRATION OF RISK
The Fund invests in securities of non-U.S. issuers. Political or economic developments may have an effect on the liquidity and volatility of portfolio securities and currency holdings.
At October 31, 2009, the diversification of countries was as follows:
| Country | Percentage of
Net Assets |
| United States | 75.6% |
| Brazil | 8.3% |
| Bermuda | 3.3% |
| India | 3.3% |
| Cayman Islands | 1.7% |
| Canada | 1.3% |
| Ireland | 1.2% |
| Hong Kong | 0.8% |
| Taiwan | 0.6% |
| Chile | 0.5% |
| Japan | 0.4% |
| Denmark | 0.3% |
| United Kingdom | 0.3% |
| Indonesia | 0.2% |
| Belgium | 0.2% |
| Israel | 0.2% |
| China | 0.1% |
| Switzerland | 0.0%1 |
| 1 | Represents less than 0.1%. |
Annual Shareholder Report40
9. LINE OF CREDIT
The Fund participates in a $100,000,000 unsecured, uncommitted revolving line of credit (LOC) agreement with PNC Bank. The LOC was made available for extraordinary or emergency purposes, primarily for financing redemption payments. Borrowings are charged interest at a rate offered to the Fund by PNC Bank at the time of the borrowing. As of October 31, 2009, there were no outstanding loans. During the year ended October 31, 2009, the Fund did not utilize the LOC.
10. INTERFUND LENDING
Pursuant to an Exemptive Order issued by the Securities and Exchange Commission (SEC), the Fund, along with other funds advised by subsidiaries of Federated Investors, Inc., may participate in an interfund lending program. This program provides an alternative credit facility allowing the funds to borrow from other participating affiliated funds. As of October 31, 2009, there were no outstanding loans. During the year ended October 31, 2009, the program was not utilized.
11. REGULATORY SETTLEMENT PROCEEDS
The Fund received $82,951 and $319,004 for the years ended October 31, 2009 and 2008, respectively, in settlement of administrative proceedings against other unaffiliated third parties involving findings by the SEC of market timing and/or late trading of mutual funds. The settlement is recorded as an increase to paid-in capital in the accompanying financial statements.
12. Legal Proceedings
Since October 2003, Federated Investors, Inc. and related entities (collectively, Federated) and various Federated funds (Federated Funds) have been named as defendants in several class action lawsuits now pending in the United States District Court for the District of Maryland. The lawsuits were purportedly filed on behalf of people who purchased, owned and/or redeemed shares of Federated-sponsored mutual funds during specified periods beginning November 1, 1998. The suits are generally similar in alleging that Federated engaged in illegal and improper trading practices including market timing and late trading in concert with certain institutional traders, which allegedly caused financial injury to the mutual fund shareholders. These lawsuits began to be filed shortly after Federated's first public announcement that it had received requests for information on shareholder trading activities in the Federated Funds from the SEC, the Office of the New York State Attorney General (NYAG), and other authorities. In that regard, on November 28, 2005, Federated announced that it had reached final settlements with the SEC and the NYAG with respect to those matters. As Federated previously reported in 2004, it has already paid approximately $8.0 million to certain funds as determined by an independent consultant. As part of these settlements, Federated agreed to pay for the benefit of fund shareholders additional disgorgement and a civil money penalty in the aggregate amount of an additional $72 million. Federated entities have also been named as defendants in several additional lawsuits that are now pending in the United States District Court for the Western District of Pennsylvania, alleging, among other things, excessive advisory and Rule 12b-1 fees. The Board of the Federated Funds retained the law firm of Dickstein Shapiro LLP to represent the Federated Funds in these lawsuits. Federated and the Federated Funds, and their respective counsel have been defending this litigation, and none of the Federated Funds remains a defendant in any of the lawsuits (though some could potentially receive any recoveries as nominal defendants). Additional lawsuits based upon similar allegations may be filed in the future. The potential impact of these Annual Shareholder Report41
lawsuits, all of which seek unquantified damages, attorneys' fees and expenses, and future potential similar suits is uncertain. Although we do not believe that these lawsuits will have a material adverse effect on the Federated Funds, there can be no assurance that these suits, the ongoing adverse publicity and/or other developments resulting from the regulatory investigations will not result in increased Federated Fund redemptions, reduced sales of Federated Fund shares or other adverse consequences for the Federated Funds.13. Subsequent events
Management has evaluated subsequent events through December 24, 2009, the date the financial statements were issued, and determined that no events have occurred that require additional disclosure.
Annual Shareholder Report42
Report of Independent Registered Public Accounting Firm
TO THE BOARD OF Trustees OF Federated Equity Funds AND SHAREHOLDERS OF Federated Kaufmann Fund:
We have audited the accompanying statement of assets and liabilities of Federated Kaufmann Fund (the “Fund”), one of the portfolios constituting Federated Equity Funds, including the portfolio of investments, as of October 31, 2009, and the related statement of operations for the year then ended, the statement of changes in net assets for each of the two years in the period then ended, and the financial highlights for each of the five years in the period then ended. These financial statements and financial highlights are the responsibility of the Fund's management. Our responsibility is to express an opinion on these financial statements and financial highlights based on our audits.
We conducted our audits in accordance with standards of the Public Company Accounting Oversight Board (United States). Those standards require that we plan and perform the audit to obtain reasonable assurance about whether the financial statements and financial highlights are free of material misstatement. We were not engaged to perform an audit of the Fund's internal control over financial reporting. Our audits included consideration of internal control over financial reporting as a basis for designing audit procedures that are appropriate in the circumstances, but not for the purpose of expressing an opinion on the effectiveness of the Fund's internal control over financial reporting. Accordingly, we express no such opinion. An audit also includes examining, on a test basis, evidence supporting the amounts and disclosures in the financial statements and financial highlights, assessing the accounting principles used and significant estimates made by management, and evaluating the overall financial statement presentation. Our procedures included confirmation of securities owned as of October 31, 2009, by correspondence with the custodian and brokers or by other appropriate auditing procedures where replies from brokers were not received. We believe that our audits provide a reasonable basis for our opinion.
In our opinion, the financial statements and financial highlights referred to above present fairly, in all material respects, the financial position of Federated Kaufmann Fund, a portfolio of Federated Equity Funds, at October 31, 2009, the results of its operations for the year then ended, the changes in its net assets for each of the two years in the period then ended, and the financial highlights for each of the five years in the period then ended, in conformity with U.S. generally accepted accounting principles.
Boston, Massachusetts
December 24, 2009
Annual Shareholder Report43
Board of Trustees and Trust Officers
The Board is responsible for managing the Trust's business affairs and for exercising all the Trust's powers except those reserved for the shareholders. The following tables give information about each Board member and the senior officers of the Fund. Where required, the tables separately list Board members who are “interested persons” of the Fund (i.e., “Interested” Board members) and those who are not (i.e., “Independent” Board members). Unless otherwise noted, the address of each person listed is Federated Investors Tower, 1001 Liberty Avenue, Pittsburgh, PA 15222. The address of all Independent Board members listed is 4000 Ericsson Drive, Warrendale, PA 15086-7561; Attention: Mutual Fund Board. As of December 31, 2008, the Trust comprised ten portfolios, and the Federated Fund Complex consisted of 40 investment companies (comprising 149 portfolios). Unless otherwise noted, each Officer is elected annually. Unless otherwise noted, each Board member oversees all portfolios in the Federated Fund Complex and serves for an indefinite term. The Fund's Statement of Additional Information includes additional information about Trust Trustees and is available, without charge and upon request, by calling 1-800-341-7400.
Interested TRUSTEES Background
Name
Birth Date
Positions Held with Trust
Date Service Began | Principal Occupation(s) for Past Five Years,
Other Directorships Held and Previous Position(s) |
John F. Donahue*
Birth Date: July 28, 1924
TRUSTEE
Began serving: April 1984 | Principal Occupations: Director or Trustee of the Federated Fund Complex; Chairman and Director, Federated Investors, Inc.; Chairman of the Federated Fund Complex's Executive Committee.
Previous Positions: Chairman of the Federated Fund Complex; Trustee, Federated Investment Management Company; Chairman and Director, Federated Investment Counseling. |
J. Christopher Donahue*
Birth Date: April 11, 1949
PRESIDENT AND TRUSTEE
Began serving: January 2000 | Principal Occupations: Principal Executive Officer and President of the Federated Fund Complex; Director or Trustee of some of the Funds in the Federated Fund Complex; President, Chief Executive Officer and Director, Federated Investors, Inc.; Chairman and Trustee, Federated Investment Management Company; Trustee, Federated Investment Counseling; Chairman and Director, Federated Global Investment Management Corp.; Chairman, Federated Equity Management Company of Pennsylvania and Passport Research, Ltd. (investment advisory subsidiary of Federated); Trustee, Federated Shareholder Services Company; Director, Federated Services Company.
Previous Positions: President, Federated Investment Counseling; President and Chief Executive Officer, Federated Investment Management Company, Federated Global Investment Management Corp. and Passport Research, Ltd. |
| * | Family relationships and reasons for “interested” status: John F. Donahue is the father of J. Christopher Donahue; both are “interested” due to their beneficial ownership of shares of Federated Investors, Inc. and the positions they hold with Federated and its subsidiaries. |
Annual Shareholder Report44
INDEPENDENT TRUSTEES Background
Name
Birth Date
Positions Held with Trust
Date Service Began | Principal Occupation(s) for Past Five Years,
Other Directorships Held and Previous Position(s) |
John T. Conroy, Jr., Ph.D.
Birth Date: June 23, 1937
TRUSTEE
Began serving: November 1991 | Principal Occupations: Director or Trustee of the Federated Fund Complex; Chairman of the Board, Investment Properties Corporation; Partner or Trustee in private real estate ventures in Southwest Florida; Assistant Professor in Theology, Blessed Edmund Rice School for Pastoral Ministry.
Previous Positions: President, Investment Properties Corporation; Senior Vice President, John R. Wood and Associates, Inc., Realtors; President, Naples Property Management, Inc. and Northgate Village Development Corporation. |
Nicholas P. Constantakis
Birth Date: September 3, 1939
TRUSTEE
Began serving: February 1998 | Principal Occupation: Director or Trustee of the Federated Fund Complex.
Other Directorship Held: Director and Chairman of the Audit Committee, Michael Baker Corporation (architecture, engineering and construction services).
Previous Position: Partner, Andersen Worldwide SC. |
John F. Cunningham
Birth Date: March 5, 1943
TRUSTEE
Began serving: January 1999 | Principal Occupation: Director or Trustee of the Federated Fund Complex.
Other Directorships Held: Chairman, President and Chief Executive Officer, Cunningham & Co., Inc. (strategic business consulting); Trustee Associate, Boston College.
Previous Positions: Director, Redgate Communications and EMC Corporation (computer storage systems); Chairman of the Board and Chief Executive Officer, Computer Consoles, Inc.; President and Chief Operating Officer, Wang Laboratories; Director, First National Bank of Boston; Director, Apollo Computer, Inc. |
Maureen Lally-Green
Birth Date: July 5, 1949
TRUSTEE
Began serving: August 2009 | Principal Occupations: Director or Trustee of the Federated Fund Complex; Director, Office of Church Relations, Diocese of Pittsburgh; Adjunct Professor of Law, Duquesne University School of Law.
Other Directorships Held: Director, Auberle; Trustee St. Francis University; Director, Ireland Institute of Pittsburgh; Director, UPMC Mercy Hospital; Regent, St. Vincent Seminary; Director, Epilepsy Foundation of Western and Central Pennsylvania; Director, Saint Thomas More Society, Allegheny County; Director, Carlow University.
Previous Position: Pennsylvania Superior Court Judge. |
Annual Shareholder Report45
Name
Birth Date
Positions Held with Trust
Date Service Began | Principal Occupation(s) for Past Five Years,
Other Directorships Held and Previous Position(s) |
Peter E. Madden
Birth Date: March 16, 1942
TRUSTEE
Began serving: November 1991 | Principal Occupation: Director or Trustee and Chairman of the Board of the Federated Fund Complex.
Other Directorship Held: Board of Overseers, Babson College.
Previous Positions: Representative, Commonwealth of Massachusetts General Court; President, Chief Operating Officer and Director, State Street Bank and Trust Company and State Street Corporation (retired); Director, VISA USA and VISA International; Chairman and Director, Massachusetts Bankers Association; Director, Depository Trust Corporation; Director, The Boston Stock Exchange. |
Charles F. Mansfield, Jr.
Birth Date: April 10, 1945
TRUSTEE
Began serving: January 1999 | Principal Occupations: Director or Trustee and Chairman of the Audit Committee of the Federated Fund Complex; Management Consultant.
Previous Positions: Chief Executive Officer, PBTC International Bank; Partner, Arthur Young & Company (now Ernst & Young LLP); Chief Financial Officer of Retail Banking Sector, Chase Manhattan Bank; Senior Vice President, HSBC Bank USA (formerly, Marine Midland Bank); Vice President, Citibank; Assistant Professor of Banking and Finance, Frank G. Zarb School of Business, Hofstra University; Executive Vice President DVC Group, Inc. (marketing, communications and technology). |
R. James Nicholson
Birth Date: February 4, 1938
TRUSTEE
Began serving: April 2008 | Principal Occupations: Director or Trustee of the Federated Fund Complex; Senior Counsel, Brownstein Hyatt Farber Schrek, P.C.; Former Secretary of the U.S. Dept. of Veterans Affairs; Former U.S. Ambassador to the Holy See; Former Chairman of the Republican National Committee.
Other Directorships Held: Director, Horatio Alger Association; Director, The Daniels Fund.
Previous Positions: Colonel, U.S. Army Reserve; Partner, Calkins, Kramer, Grimshaw and Harring, P.C.; General Counsel, Colorado Association of Housing and Building; Chairman and CEO, Nicholson Enterprises, Inc. (real estate holding company); Chairman and CEO, Renaissance Homes of Colorado. |
Thomas M. O'Neill
Birth Date: June 14, 1951
TRUSTEE
Began serving: October 2006 | Principal Occupations: Director or Trustee of the Federated Fund Complex; Managing Director and Partner, Navigator Management Company, L.P. (investment and strategic consulting).
Other Directorships Held: Board of Overseers, Children's Hospital of Boston; Visiting Committee on Athletics, Harvard College.
Previous Positions: Chief Executive Officer and President, Managing Director and Chief Investment Officer, Fleet Investment Advisors; President and Chief Executive Officer, Aeltus Investment Management, Inc.; General Partner, Hellman, Jordan Management Co., Boston, MA; Chief Investment Officer, The Putnam Companies, Boston, MA; Credit Analyst and Lending Officer, Fleet Bank; Director and Consultant, EZE Castle Software (investment order management software); Director, Midway Pacific (lumber). |
Annual Shareholder Report46
Name
Birth Date
Positions Held with Trust
Date Service Began | Principal Occupation(s) for Past Five Years,
Other Directorships Held and Previous Position(s) |
John S. Walsh
Birth Date: November 28, 1957
TRUSTEE
Began serving: January 1999 | Principal Occupations: Director or Trustee of the Federated Fund Complex; President and Director, Heat Wagon, Inc. (manufacturer of construction temporary heaters); President and Director, Manufacturers Products, Inc. (distributor of portable construction heaters); President, Portable Heater Parts, a division of Manufacturers Products, Inc.
Previous Position: Vice President, Walsh & Kelly, Inc. |
James F. Will
Birth Date: October 12, 1938
TRUSTEE
Began serving: April 2006 | Principal Occupations: Director or Trustee of the Federated Fund Complex; formerly, Vice Chancellor and President, Saint Vincent College.
Other Directorships Held: Trustee, Saint Vincent College; Alleghany Corporation.
Previous Positions: Chairman, President and Chief Executive Officer, Armco, Inc.; President and Chief Executive Officer, Cyclops Industries; President and Chief Operating Officer, Kaiser Steel Corporation. |
OFFICERS
Name
Birth Date
Address
Positions Held with Trust
Date Service Began | Principal Occupation(s) for Past Five Years
and Previous Position(s) |
John W. McGonigle
Birth Date: October 26, 1938
EXECUTIVE VICE PRESIDENT AND SECRETARY
Began serving: April 1984 | Principal Occupations: Executive Vice President and Secretary of the Federated Fund Complex; Vice Chairman, Executive Vice President, Secretary and Director, Federated Investors, Inc.
Previous Positions: Trustee, Federated Investment Management Company and Federated Investment Counseling; Director, Federated Global Investment Management Corp., Federated Services Company and Federated Securities Corp. |
Richard A. Novak
Birth Date: December 25, 1963
TREASURER
Began serving: January 2006 | Principal Occupations: Principal Financial Officer and Treasurer of the Federated Fund Complex; Senior Vice President, Federated Administrative Services; Financial and Operations Principal for Federated Securities Corp., Edgewood Services, Inc. and Southpointe Distribution Services, Inc.
Previous Positions: Controller of Federated Investors, Inc.; Vice President, Finance of Federated Services Company; held various financial management positions within The Mercy Hospital of Pittsburgh; Auditor, Arthur Andersen & Co. |
Richard B. Fisher
Birth Date: May 17, 1923
VICE PRESIDENT
Began serving: April 1984 | Principal Occupations: Vice Chairman or Vice President of some of the Funds in the Federated Fund Complex; Vice Chairman, Federated Investors, Inc.; Chairman, Federated Securities Corp.
Previous Positions: President and Director or Trustee of some of the Funds in the Federated Fund Complex; Executive Vice President, Federated Investors, Inc.; Director and Chief Executive Officer, Federated Securities Corp. |
Annual Shareholder Report47
Name
Birth Date
Address
Positions Held with Trust
Date Service Began | Principal Occupation(s) for Past Five Years
and Previous Position(s) |
Brian P. Bouda
Birth Date: February 28, 1947
CHIEF COMPLIANCE OFFICER AND SENIOR VICE PRESIDENT
Began serving: August 2004 | Principal Occupations: Senior Vice President and Chief Compliance Officer of the Federated Fund Complex; Vice President and Chief Compliance Officer of Federated Investors, Inc. and Chief Compliance Officer of its subsidiaries. Mr. Bouda joined Federated in 1999 and is a member of the American Bar Association and the State Bar Association of Wisconsin. |
Stephen F. Auth
Birth Date: September 3, 1956
450 Lexington Avenue
Suite 3700
New York, NY 10017-3943
CHIEF INVESTMENT OFFICER
Began serving: November 2002 | Principal Occupations: Mr. Auth is Chief Investment Officer of this Fund and various other Funds in the Federated Fund Complex; Executive Vice President, Federated Investment Counseling, Federated Global Investment Management Corp. and Federated Equity Management Company of Pennsylvania.
Previous Positions: Executive Vice President, Federated Investment Management Company, and Passport Research, Ltd. (investment advisory subsidiary of Federated); Senior Vice President, Global Portfolio Management Services Division; Senior Vice President, Federated Investment Management Company and Passport Research, Ltd.; Senior Managing Director and Portfolio Manager, Prudential Investments. |
Lawrence Auriana
Birth Date: January 8, 1944
140 East 45th Street
New York, NY 10017
VICE PRESIDENT
Began serving: November 2001 | Principal Occupations: Lawrence Auriana has been the Fund's Portfolio Manager since February 1986. He is Vice President of the Trust. Mr. Auriana joined Federated in April 2001 as Co-Head of Investments/Federated Kaufmann. From August 1984 to April 2001, Mr. Auriana was President and Treasurer of Edgemont Asset Management Corp., and Chairman of the Board and Portfolio Manager to The Kaufmann Fund, Inc. (predecessor to the Federated Kaufmann Fund). Mr. Auriana earned a B.S. in economics from Fordham University and has been engaged in the securities business since 1965. |
Walter C. Bean
Birth Date: June 22, 1945
VICE PRESIDENT
Began serving: November 2006 | Principal Occupations: Walter C. Bean has been the Fund's Portfolio Manager since inception. Walter C. Bean is Vice President of the Trust. Mr. Bean is a Senior Vice President, Senior Portfolio Manager and the Head of the Equity Income Management Team of the Fund's Adviser. Mr. Bean joined Federated in 2000. His previous associations included: various investment management and research positions with C.S. McKee & Company, First Chicago Investment Advisors, CIGNA Investment Advisors and Mellon Bank. Mr. Bean earned a Bachelors Degree in Business Administration from Ohio University and an M.B.A. from the Pennsylvania State University. Mr. Bean is a Chartered Financial Analyst and has 40 years of investment experience. |
Hans P. Utsch
Birth Date: July 3, 1936
VICE PRESIDENT
Began serving: November 2001 | Principal Occupations: Hans P. Utsch has been the Fund's Portfolio Manager since February 1986. He is Vice President of the Trust. Mr. Utsch joined Federated in April 2001 as Co-Head of Investments/Federated Kaufmann. From August 1984 to April 2001, Mr. Utsch was Chairman of the Board and Secretary of Edgemont Asset Management Corp., and President and Portfolio Manager to The Kaufmann Fund, Inc. (predecessor to the Federated Kaufmann Fund). Mr. Utsch graduated from Amherst College and holds an M.B.A. from Columbia University. He has been engaged in the securities business since 1962. |
Annual Shareholder Report48
Evaluation and Approval of Advisory Contract - May 2009
Federated Kaufmann Fund (the “Fund”)
The Fund's Board reviewed the Fund's investment advisory and subadvisory contracts at meetings held in May 2009. The Board's decision regarding these contracts reflects the exercise of its business judgment on whether to continue the existing arrangements.
In this connection, the Federated funds' Board had previously appointed a Senior Officer, whose duties include specified responsibilities relating to the process by which advisory fees are to be charged to a Federated fund. The Senior Officer has the authority to retain consultants, experts, or staff as may be reasonably necessary to assist in the performance of his duties, reports directly to the Board, and may be terminated only with the approval of a majority of the independent members of the Board. The Senior Officer prepared and furnished to the Board an independent, written evaluation that covered topics discussed below. The Board considered that evaluation, along with other information, in deciding to approve the advisory and subadvisory contracts.
During its review of these contracts, the Board considered compensation and benefits received by the Adviser and subadviser. This included the fees received for services provided to the Fund by other entities in the Federated organization and research services received by the Adviser from brokers that execute Federated fund trades, as well as advisory fees. The Board is also familiar with and considered judicial decisions concerning allegedly excessive investment advisory fees, which have indicated that the following factors may be relevant to an Adviser's fiduciary duty with respect to its receipt of compensation from a fund: the nature and quality of the services provided by the Adviser, including the performance of the fund; the Adviser's cost of providing the services; the extent to which the Adviser may realize “economies of scale” as a fund grows larger; any indirect benefits that may accrue to the Adviser and its affiliates as a result of the Adviser's relationship with a fund; performance and expenses of comparable funds; and the extent to which the independent Board members are fully informed about all facts the Board deems relevant bearing on the Adviser's services and fees. The Board further considered management fees (including any components thereof) charged to institutional and other clients of the Adviser and subadviser for what might be viewed as like services, and the cost to the Adviser and its affiliates of supplying services pursuant to the management fee agreements, excluding any intra-corporate profit and profit margins of the Adviser and its affiliates for supplying such services. The Board was aware of these factors and was guided by them in its review of the Fund's advisory and subadvisory contracts to the extent it considered them to be appropriate and relevant, as discussed further below.
Annual Shareholder Report49
The Board considered and weighed these circumstances in light of its substantial accumulated experience in governing the Fund and working with Federated on matters relating to the Federated funds, and was assisted in its deliberations by independent legal counsel. Throughout the year, the Board has requested and received substantial and detailed information about the Fund and the Federated organization that was in addition to the extensive materials that comprise and accompany the Senior Officer's evaluation. Federated provided much of this information at each regular meeting of the Board, and furnished additional reports in connection with the particular meeting at which the Board's formal review of the advisory and subadvisory contracts occurred. Between regularly scheduled meetings, the Board also received information on particular matters as the need arose. Thus, the Board's consideration of the advisory and subadvisory contracts included review of the Senior Officer's evaluation, accompanying data and additional reports covering such matters as: the Adviser's and subadviser's investment philosophy, revenue, profitability, personnel and processes; investment and operating strategies; the Fund's short- and long-term performance (in absolute terms, both on a gross basis and net of expenses, as well as in relationship to its particular investment program and certain competitor or “peer group” funds and/or other benchmarks, as appropriate), and comments on the reasons for performance; the Fund's investment objectives; the Fund's expenses (including the advisory fee itself and the overall expense structure of the Fund, both in absolute terms and relative to similar and/or competing funds, with due regard for contractual or voluntary expense limitations); the use and allocation of brokerage commissions derived from trading the Fund's portfolio securities (if any); and the nature, quality and extent of the advisory and other services provided to the Fund by the Adviser and its affiliates. The Board also considered the preferences and expectations of Fund shareholders and their relative sophistication; the continuing state of competition in the mutual fund industry and market practices; the range of comparable fees for similar funds in the mutual fund industry; the Fund's relationship to the Federated family of funds which include a comprehensive array of funds with different investment objectives, policies and strategies which are available for exchange without the incurrence of additional sales charges; compliance and audit reports concerning the Federated funds and the Federated companies that service them (including communications from regulatory agencies), as well as Federated's responses to any issues raised therein; and relevant developments in the mutual fund industry and how the Federated funds and/or Federated are responding to them. The Board's evaluation process is evolutionary. The criteria considered and the emphasis placed on relevant criteria change in recognition of changing circumstances in the mutual fund marketplace. Annual Shareholder Report50
With respect to the Fund's performance and expenses in particular, the Board has found the use of comparisons to other mutual funds with comparable investment programs to be particularly useful, given the high degree of competition in the mutual fund business. The Board focused on comparisons with other similar mutual funds more heavily than non-mutual fund products or services because, it is believed that, they are more relevant. For example, other mutual funds are the products most like the Fund, they are readily available to Fund shareholders as alternative investment vehicles, and they are the type of investment vehicle in fact chosen and maintained by the Fund's investors. The range of their fees and expenses therefore appears to be a generally reliable indication of what consumers have found to be reasonable in the precise marketplace in which the Fund competes. The Fund's ability to deliver competitive performance when compared to its peer group was a useful indicator of how the Adviser is executing the Fund's investment program, which in turn assisted the Board in reaching a conclusion that the nature, extent, and quality of the Adviser's investment management services were such as to warrant continuation of the advisory contract. In this regard, the Senior Officer has reviewed Federated's fees for providing advisory services to products outside the Federated family of funds (e.g., institutional and separate accounts). He concluded that mutual funds and institutional accounts are inherently different products. Those differences include, but are not limited to, different types of targeted investors; being subject to different laws and regulations; different legal structures; different average account sizes; different associated costs; different portfolio management techniques made necessary by different cash flows; and portfolio manager time spent in review of securities pricing. The Senior Officer did not consider these fee schedules to be determinative in judging the appropriateness of mutual fund advisory contracts.The Senior Officer reviewed reports compiled by Federated, using data supplied by independent fund ranking organizations, regarding the performance of, and fees charged by, other mutual funds, noting his view that comparisons to fund peer groups are highly important in judging the reasonableness of proposed fees.
For the one-year, three-year and five-year periods covered by the report, the Fund's performance was above the median of the relevant peer group. More specifically, the Fund's performance has been significantly and consistently above median over the longer term.
The Board also received financial information about Federated, including reports on the compensation and benefits Federated derived from its relationships with the Federated funds. These reports covered not only the fees under the advisory contracts, but also fees received by Federated's subsidiaries for providing other services to the Federated funds under separate contracts (e.g., for serving as the Federated funds' administrator). The reports also discussed any indirect benefit Federated may derive from its receipt of research services from brokers who execute Federated fund trades. In addition, the Board Annual Shareholder Report51
considered the fact that, in order for a fund to be competitive in the marketplace, Federated and its affiliates frequently waived fees and/or reimbursed expenses and have disclosed to fund investors and/or indicated to the Board their intention to do so in the future, where appropriate. Moreover, the Board receives regular reports regarding the institution or elimination of these voluntary waivers.Federated furnished reports, requested by the Senior Officer, that reported revenues on a fund-by-fund basis and made estimates of the allocation of expenses on a fund-by-fund basis, using allocation methodologies specified by the Senior Officer. The Senior Officer noted that, although they may apply consistent allocation processes, the inherent difficulties in allocating costs (and the unavoidable arbitrary aspects of that exercise) and the lack of consensus on how to allocate those costs may render such allocation reports unreliable. The allocation reports were considered in the analysis by the Board but were determined to be of limited use.
The Board and the Senior Officer also reviewed a report compiled by Federated comparing profitability information for Federated to other publicly held fund management companies. In this regard, the Senior Officer noted the limited availability of such information, but nonetheless concluded that Federated's profit margins did not appear to be excessive and the Board agreed.
The Senior Officer's evaluation also discussed the notion of possible realization of “economies of scale” as a fund grows larger. The Board considered in this regard that the Adviser has made significant and long-term investments in areas that support all of the Federated funds, such as personnel and processes for the portfolio management, compliance, and risk management functions; and systems technology; and that the benefits of these efforts (as well as any economies, should they exist) were likely to be enjoyed by the fund complex as a whole. Finally, the Board also noted the absence of any applicable regulatory or industry guidelines on this subject, which (as discussed in the Senior Officer's evaluation) is compounded by the lack of any common industry practice or general pattern with respect to structuring fund advisory fees with “breakpoints” that serve to reduce the fee as the fund attains a certain size. The Senior Officer did not recommend institution of breakpoints in pricing Federated's fund advisory services at this time. In this regard, the Senior Officer's evaluation noted that the Board is aware that the Fund is a relatively more expensive fund for the Adviser to manage than other Federated equity funds and, as noted earlier, that the Fund has also been significantly and consistently above median in its investment performance over the longer term. The Board agreed to monitor future developments and review changes in industry practices or competitive initiatives.
Annual Shareholder Report52
It was noted in the materials for the Board meeting that for the period covered by the report, the Fund's investment advisory fee, after waivers and expense reimbursements, if any, was above the median of the relevant peer group. The Board reviewed the fees and other expenses of the Fund with the Adviser and was satisfied that the overall expense structure of the Fund remained competitive. The Board will continue to monitor advisory fees and other expenses borne by the Fund.The Senior Officer's evaluation noted his belief that the information and observations contained in his evaluation supported a finding that the proposed management fees are reasonable, and that Federated appeared to provide appropriate administrative services to the Fund for the fees paid. Under these circumstances, no changes were recommended to, and no objection was raised to, the continuation of the Fund's advisory and subadvisory contracts. The Board concluded that the nature, quality and scope of services provided the Fund by the Adviser and its affiliates were satisfactory.
In its decision to continue an existing investment advisory contract, the Board was mindful of the potential disruptions of the Fund's operations and various risks, uncertainties and other effects that could occur as a result of a decision to terminate or not renew an advisory contract. In particular, the Board recognized that many shareholders have invested in the Fund on the strength of the Adviser's industry standing and reputation and with the expectation that the Adviser will have a continuing role in providing advisory services to the Fund. Thus, the Board's approval of the advisory contract reflected the fact that it is the shareholders who have effectively selected the Adviser by virtue of having invested in the Fund.
The Board based its decision to approve the advisory and subadvisory contracts on the totality of the circumstances and relevant factors and with a view to past and future long-term considerations. Not all of the factors and considerations identified above were necessarily relevant to the Fund, nor did the Board consider any one of them to be determinative. With respect to the factors that were relevant, the Board's decision to approve the contract reflects its determination that Federated's performance and actions provided a satisfactory basis to support the decision to continue the existing arrangements.
Annual Shareholder Report53
Voting Proxies on Fund Portfolio Securities
A description of the policies and procedures that the Fund uses to determine how to vote proxies, if any, relating to securities held in the Fund's portfolio is available, without charge and upon request, by calling 1-800-341-7400. A report on “Form N-PX” of how the Fund voted any such proxies during the most recent 12-month period ended June 30 is available from Federated's Web site at FederatedInvestors.com. To access this information from the “Products” section of the Web site, click on the “Prospectuses and Regulatory Reports” link under “Related Information,” then select the appropriate link opposite the name of the Fund; or select the name of the Fund and from the Fund's page, click on the “Prospectuses and Regulatory Reports” link. Form N-PX filings are also available at the SEC's Web site at www.sec.gov.
Quarterly Portfolio Schedule
The Fund files with the SEC a complete schedule of its portfolio holdings, as of the close of the first and third quarters of its fiscal year, on “Form N-Q.” These filings are available on the SEC's Web site at www.sec.gov and may be reviewed and copied at the SEC's Public Reference Room in Washington, DC. (Call 1-800-SEC-0330 for information on the operation of the Public Reference Room.) You may also access this information from the “Products” section of Federated's Web site at FederatedInvestors.com by clicking on “Portfolio Holdings” under “Related Information,” then selecting the appropriate link opposite the name of the Fund; or select the name of the Fund and from the Fund's page, click on the “Portfolio Holdings” link.
Annual Shareholder Report54
Mutual funds are not bank deposits or obligations, are not guaranteed by any bank and are not insured or guaranteed by the U.S. government, the Federal Deposit Insurance Corporation, the Federal Reserve Board or any other government agency. Investment in mutual funds involves investment risk, including the possible loss of principal.
This Report is authorized for distribution to prospective investors only when preceded or accompanied by the Fund's Prospectus, which contains facts concerning its objective and policies, management fees, expenses and other information.
Federated Kaufmann Fund
Federated Investors Funds
4000 Ericsson Drive
Warrendale, PA 15086-7561
Contact us at FederatedInvestors.com
or call 1-800-341-7400.
Federated Securities Corp., Distributor
Cusip 314172644
26851 (12/09)
Federated is a registered mark of Federated Investors, Inc.
2009 Federated Investors, Inc.
Federated Kaufmann Large Cap FundEstablished 2007
A Portfolio of Federated Equity Funds
ANNUAL SHAREHOLDER REPORTOctober 31, 2009
Class A Shares
Class C Shares
Class K Shares
FINANCIAL HIGHLIGHTS
SHAREHOLDER EXPENSE EXAMPLE
MANAGEMENT'S DISCUSSION OF FUND PERFORMANCE
PORTFOLIO OF INVESTMENTS SUMMARY TABLE
PORTFOLIO OF INVESTMENTS
STATEMENT OF ASSETS AND LIABILITIES
STATEMENT OF OPERATIONS
STATEMENT OF CHANGES IN NET ASSETS
NOTES TO FINANCIAL STATEMENTS
REPORT OF INDEPENDENT REGISTERED PUBLIC ACCOUNTING FIRM
BOARD OF TRUSTEES AND TRUST OFFICERS
EVALUATION AND APPROVAL OF ADVISORY CONTRACT
VOTING PROXIES ON FUND PORTFOLIO SECURITIES
QUARTERLY PORTFOLIO SCHEDULE
Financial Highlights - Class A Shares
(For a Share Outstanding Throughout Each Period)
| Year Ended
10/31/2009 | Period Ended
10/31/20081 |
| Net Asset Value, Beginning of Period | $6.88 | $10.00 |
| Income From Investment Operations: | | |
| Net investment income | 0.052 | 0.032 |
| Net realized and unrealized gain (loss) on investments and foreign currency transactions | 1.78 | (3.15) |
| TOTAL FROM INVESTMENT OPERATIONS | 1.83 | (3.12) |
| Less Distributions: | | |
| Distributions from net investment income | (0.02) | — |
| Net Asset Value, End of Period | $8.69 | $6.88 |
| Total Return3 | 26.68% | (31.20)% |
| Ratios to Average Net Assets: | | |
| Net expenses | 1.50%4 | 1.50%5 |
| Net investment income | 0.67% | 0.37%5 |
| Expense waiver/reimbursement6 | 1.26% | 1.88%5 |
| Supplemental Data: | | |
| Net assets, end of period (000 omitted) | $60,203 | $31,156 |
| Portfolio turnover | 170% | 70% |
| 1 | Reflects operations for the period from December 5, 2007 (date of initial investment) to October 31, 2008. |
| 2 | Per share numbers have been calculated using the average shares method. |
| 3 | Based on net asset value, which does not reflect the sales charge, redemption fee or contingent deferred sales charge, if applicable. Total returns for periods of less than one year are not annualized. |
| 4 | The net expense ratio is calculated without reduction for expense offset arrangements. The net expense ratio is 1.50% for the year ended October 31, 2009 after taking into account this expense reduction. |
| 5 | Computed on an annualized basis. |
| 6 | This expense decrease is reflected in both the net expense and the net investment income ratios shown above. |
- See Notes which are an integral part of the Financial Statements
Annual Shareholder Report1
Financial Highlights - Class C Shares
(For a Share Outstanding Throughout Each Period)
| Year Ended
10/31/2009 | Period Ended
10/31/20081 |
| Net Asset Value, Beginning of Period | $6.85 | $10.00 |
| Income From Investment Operations: | | |
| Net investment income (loss) | (0.01)2 | (0.04)2 |
| Net realized and unrealized gain (loss) on investments and foreign currency transactions | 1.76 | (3.11) |
| TOTAL FROM INVESTMENT OPERATIONS | 1.75 | (3.15) |
| Net Asset Value, End of Period | $8.60 | $6.85 |
| Total Return3 | 25.55% | (31.50)% |
| Ratios to Average Net Assets: | | |
| Net expenses | 2.32%4 | 2.33%5 |
| Net investment loss | (0.12)% | (0.46)%5 |
| Expense waiver/reimbursement6 | 1.19% | 1.82%5 |
| Supplemental Data: | | |
| Net assets, end of period (000 omitted) | $32,721 | $16,307 |
| Portfolio turnover | 170% | 70% |
| 1 | Reflects operations for the period from December 5, 2007 (date of initial investment) to October 31, 2008. |
| 2 | Per share numbers have been calculated using the average shares method. |
| 3 | Based on net asset value, which does not reflect the sales charge, redemption fee or contingent deferred sales charge, if applicable. Total returns for periods of less than one year are not annualized. |
| 4 | The net expense ratio is calculated without reduction for expense offset arrangements. The net expense ratio is 2.31% for the year ended October 31, 2009 after taking into account this expense reduction. |
| 5 | Computed on an annualized basis. |
| 6 | This expense decrease is reflected in both the net expense and the net investment income (loss) ratios shown above. |
- See Notes which are an integral part of the Financial Statements
Annual Shareholder Report2
Financial Highlights - Class K Shares
(For a Share Outstanding Throughout Each Period)
| Year Ended
10/31/2009 | Period Ended
10/31/20081 |
| Net Asset Value, Beginning of Period | $6.87 | $10.00 |
| Income from Investment Operations: | | |
| Net investment income (loss) | 0.012 | (0.01)2 |
| Net realized and unrealized gain (loss) on investments and foreign currency transactions | 1.78 | (3.12) |
| TOTAL FROM INVESTMENT OPERATIONS | 1.79 | (3.13) |
| Less Distributions: | | |
| Distributions from net investment income | (0.03) | — |
| Net Asset Value, End of Period | $8.63 | $6.87 |
| Total Return3 | 26.12% | (31.30)% |
| Ratios to Average Net Assets: | | |
| Net expenses | 1.95%4 | 1.95%5 |
| Net investment income (loss) | 0.06% | (0.08)%5 |
| Expense waiver/reimbursement6 | 1.14% | 1.88%5 |
| Supplemental Data: | | |
| Net assets, end of period (000 omitted) | $332 | $2 |
| Portfolio turnover | 170% | 70% |
| 1 | Reflects operations for the period from December 5, 2007 (date of initial investment) to October 31, 2008. |
| 2 | Per share numbers have been calculated using the average shares method. |
| 3 | Based on net asset value, which does not reflect the sales charge, redemption fee or contingent deferred sales charge, if applicable. Total returns for periods of less than one year are not annualized. |
| 4 | The net expense ratio is calculated without reduction for expense offset arrangements. The net expense ratio is 1.95% for the year ended October 31, 2009 after taking into account this expense reduction. |
| 5 | Computed on an annualized basis. |
| 6 | This expense decrease is reflected in both the net expense and the net investment income (loss) ratios shown above. |
- See Notes which are an integral part of the Financial Statements
Annual Shareholder Report3
Shareholder Expense Example (unaudited)
As a shareholder of the Fund, you incur two types of costs: (1) transaction costs, including sales charges (loads) on purchase or redemption payments; and (2) ongoing costs, including management fees and to the extent applicable, distribution (12b-1) fees and/or shareholder services fees and other Fund expenses. This Example is intended to help you to understand your ongoing costs (in dollars) of investing in the Fund and to compare these costs with the ongoing costs of investing in other mutual funds. It is based on an investment of $1,000 invested at the beginning of the period and held for the entire period from May 1, 2009 to October 31, 2009.
ACTUAL EXPENSES
The first section of the table below provides information about actual account values and actual expenses. You may use the information in this section, together with the amount you invested, to estimate the expenses that you incurred over the period. Simply divide your account value by $1,000 (for example, an $8,600 account value divided by $1,000 = 8.6), then multiply the result by the number in the first section under the heading entitled “Expenses Paid During Period” to estimate the expenses attributable to your investment during this period.
HYPOTHETICAL EXAMPLE FOR COMPARISON PURPOSES
The second section of the table below provides information about hypothetical account values and hypothetical expenses based on the Fund's actual expense ratio and an assumed rate of return of 5% per year before expenses, which is not the Fund's actual return. Thus, you should not use the hypothetical account values and expenses to estimate the actual ending account balance or your expenses for the period. Rather, these figures are required to be provided to enable you to compare the ongoing costs of investing in the Fund with other funds. To do so, compare this 5% hypothetical example with the 5% hypothetical examples that appear in the shareholder reports of the other funds.
Annual Shareholder Report4
Please note that the expenses shown in the table are meant to highlight your ongoing costs only and do not reflect any transaction costs, such as sales charges (loads) on purchase or redemption payments. Therefore, the second section of the table is useful in comparing ongoing costs only, and will not help you determine the relative total costs of owning different funds. In addition, if these transaction costs were included, your costs would have been higher. | Beginning
Account Value
5/1/2009 | Ending
Account Value
10/31/2009 | Expenses Paid
During Period1 |
| Actual: | | | |
| Class A Shares | $1,000 | $1,218.80 | $8.39 |
| Class C Shares | $1,000 | $1,213.00 | $12.83 |
| Class K Shares | $1,000 | $1,212.10 | $10.87 |
Hypothetical (assuming a 5% return
before expenses): | | | |
| Class A Shares | $1,000 | $1,017.64 | $7.63 |
| Class C Shares | $1,000 | $1,013.61 | $11.67 |
| Class K Shares | $1,000 | $1,015.38 | $9.91 |
| 1 | Expenses are equal to the Fund's annualized net expense ratios, multiplied by the average account value over the period, multiplied by 184/365 (to reflect the one-half-year period). The annualized net expense ratios are as follows: |
| Class A Shares | 1.50% |
| Class C Shares | 2.30% |
| Class K Shares | 1.95% |
Annual Shareholder Report5
Performance data quoted represents past performance which is no guarantee of future results. Investment return and principal value will fluctuate so that an investor's shares, when redeemed, may be worth more or less than their original cost. Mutual fund performance changes over time and current performance may be lower or higher than what is stated. For current to the most recent month-end performance and after-tax returns, visit FederatedInvestors.com or call 1-800-341-7400.
Management's Discussion of Fund Performance (unaudited)
Federated Kaufmann Large Cap Fund's Class A Shares, Class C Shares and Class K Shares produced total returns of 26.68%, 25.55% and 26.12%, respectively, based on net asset value for the reporting period ended October 31, 2009. The Fund's benchmark, the Russell 1000 Growth Index (R1000G)1 had a total return of 17.51% for the reporting period and the Lipper Large Cap Growth Funds Index (LLCGFI)2 had a total return of 16.91%. The Fund's total return for the reporting period reflected actual cash flows, transaction costs and other expenses which were not reflected in the total return of the R1000G.
MARKET OVERVIEW
The stock market as a whole posted strong positive returns during the latter portion of the reporting period. The global financial crisis continued throughout the period but in March the Standard & Poor's 500 Index (S&P 500)3 bottomed and began a 50% plus rally. Mid-cap stocks performed best during the period followed by large-cap stocks and then small-cap stocks. In terms of style, growth stocks outperformed value stocks across large-, mid- and small-cap stock groupings.
The reporting period began with economies across the world slowing as credit contracted. In response to the credit crisis, the Federal Reserve, as well as many other countries, cut their discount and federal funds target rates several times at the beginning of the reporting period and maintained them at their lowest levels. The end of the reporting period was marked by a light at the end of the tunnel with some positive economic data on housing, productivity, corporate profits and trade finally appearing.
| 1 | The R1000G measures the performance of those Russell 1000 companies with higher price-to-book ratios and higher forecasted growth values. Investments cannot be made directly in an index. |
| 2 | The LLCGFI represents the composite performance of the 30 largest funds by assets in the Lipper Large Cap Growth Fund category. The Index is not adjusted to reflect any sales charges. Investments cannot be made directly in an index. |
| 3 | The S&P 500 Index is an unmanaged capitalization-weighted index of 500 stocks designed to measure performance of the broad domestic economy through changes in the aggregate market value of 500 stocks representing all major industries. Investments cannot be made directly in an index. |
Annual Shareholder Report6
The strongest sectors in the R1000G during the period were Information Technology (+31%), Consumer Discretionary (+25%) and Materials (+21%). The weakest sectors were Health Care (+8%), Utilities (+9%) and Industrials (+9%).FUND PERFORMANCE
The Fund outperformed its respective peer average and benchmark index over the reporting period. The Fund's performance was driven primarily by bottom-up stock selection. Five of the Fund's top 10 contributing companies across multiple sectors each returned over 60% during the reporting period. Specifically Housing Development Finance (+114%), Ingersol-Rand (+114%), Schering Plough Corp (+99%), Cummins Engine Inc. (+71%) and Precision Castparts (+60%) all contributed strongly to performance. In addition, Lennar Corp. (+40%), Bharti Airtel Ltd. (+56%), Goldman Sachs (+49%), Best Buy (+45%) and Anheiser-Busch Inbev (+35%) were among the Fund's top 10 contributing companies.
The sectors that underperformed were Energy, Financials, Industrials, Information Technology and Materials. Six of the Fund's most laggard companies were in these sectors: Wells Fargo (-16%); Southwest Airlines (-25%); Delta Airlines (-33%); MEMC Electronics (-32%); General Electric (-15%); and Cemex (-30%), each detracted from performance. Additional laggards included: iShares Russell 1000 Growth Index (-14%); Merck & Co. (-26%); and Abbott Labs (-13%). While it is interesting to know how specific stocks performed during the reporting period, the success of these holdings will not be known until they are sold, typically over longer periods.
The sector exposures that resulted from the bottom-up investment process may provide some additional insight into the relative performance of the Fund. The Fund's underweight in Information Technology and the Fund's overweight in the Industrials and Materials sectors relative to the benchmark negatively affected performance. The Fund's performance was negatively impacted by the Fund's high cash position which ranged as high as 20.7% (5.9% average) during the reporting period.
Annual Shareholder Report7
GROWTH OF A $10,000 INVESTMENT - CLASS A SHARES
The graph below illustrates the hypothetical investment of $10,0001 in Federated Kaufmann Large Cap Fund (Class A Shares) (the “Fund”) from December 5, 2007 (start of performance) to October 31, 2009 compared to the Russell 1000 Growth Index (R1000G)2 and the Lipper Large Cap Growth Funds Index (LLCGFI).2
| Average Annual Total Returns3 for the Period Ended 10/31/2009 | |
| 1 Year | 19.72% |
| Start of Performance (12/5/2007) | -9.68% |
Performance data quoted represents past performance which is no guarantee of future results. Investment return and principal value will fluctuate so that an investor's shares, when redeemed, may be worth more or less than their original cost. Mutual fund performance changes over time and current performance may be lower or higher than what is stated. For current to the most recent month-end performance and after-tax returns, visit FederatedInvestors.com or call 1-800-341-7400. Returns shown do not reflect the deduction of taxes that a shareholder would pay on Fund distributions or the redemption of Fund shares. Mutual funds are not obligations of or guaranteed by any bank and are not federally insured. Total returns shown include the maximum sales charge of 5.50%.
| 1 | Represents a hypothetical investment of $10,000 in the Fund after deducting the maximum sales charge of 5.50% ($10,000 investment minus $550 sales charge = $9,450). The Fund's performance assumes the reinvestment of all dividends and distributions. The R1000G and the LLCGFI have been adjusted to reflect reinvestment of dividends on securities in the R1000G and the funds in the LLCGFI. |
| 2 | The R1000G and the LLCGFI are not adjusted to reflect expenses or other fees that the Securities and Exchange Commission (SEC) requires to be reflected in the Fund's performance. The LLCGFI represents the composite performance of the 30 largest funds by assets in the Lipper Large Cap Growth Fund category, and is not adjusted to reflect any sales charges. The R1000G and the LLCGFI are unmanaged and, unlike the Fund, are not affected by cashflows. It is not possible to invest directly in an index. |
| 3 | Total returns quoted reflect all applicable sales charges. |
Annual Shareholder Report8
GROWTH OF A $10,000 INVESTMENT - CLASS C SHARES
The graph below illustrates the hypothetical investment of $10,0001 in Federated Kaufmann Large Cap Fund (Class C Shares) (the “Fund”) from December 5, 2007 (start of performance) to October 31, 2009 compared to the Russell 1000 Growth Index (R1000G)2 and the Lipper Large Cap Growth Funds Index (LLCGFI).2
| Average Annual Total Returns3 for the Period Ended 10/31/2009 | |
| 1 Year | 24.55% |
| Start of Performance (12/5/2007) | -7.62% |
Performance data quoted represents past performance which is no guarantee of future results. Investment return and principal value will fluctuate so that an investor's shares, when redeemed, may be worth more or less than their original cost. Mutual fund performance changes over time and current performance may be lower or higher than what is stated. For current to the most recent month-end performance and after-tax returns, visit FederatedInvestors.com or call 1-800-341-7400. Returns shown do not reflect the deduction of taxes that a shareholder would pay on Fund distributions or the redemption of Fund shares. Mutual funds are not obligations of or guaranteed by any bank and are not federally insured. Total returns shown include the maximum contingent deferred sales charge of 1.00% as applicable.
| 1 | Represents a hypothetical investment of $10,000 in the Fund. A 1.00% contingent deferred sales charge would be applied to any redemption less than one year from the purchase date. The Fund's performance assumes the reinvestment of all dividends and distributions. The R1000G and the LLCGFI have been adjusted to reflect reinvestment of dividends on securities in the R1000G and the funds in the LLCGFI. |
| 2 | The R1000G and the LLCGFI are not adjusted to reflect expenses or other fees that the SEC requires to be reflected in the Fund's performance. The LLCGFI represents the composite performance of the 30 largest funds by assets in the Lipper Large Cap Growth Fund category, and is not adjusted to reflect any sales charges. The R1000G and the LLCGFI are unmanaged and, unlike the Fund, are not affected by cashflows. It is not possible to invest directly in an index. |
| 3 | Total returns quoted reflect all applicable contingent deferred sales charges. |
Annual Shareholder Report9
GROWTH OF A $10,000 INVESTMENT - CLASS K SHARES
The graph below illustrates the hypothetical investment of $10,0001 in Federated Kaufmann Large Cap Fund (Class K Shares) (the “Fund”) from December 5, 2007 (start of performance) to October 31, 2009 compared to the Russell 1000 Growth Index (R1000G)2 and the Lipper Large Cap Growth Funds Index (LLCGFI).2
| Average Annual Total Returns for the Period Ended 10/31/2009 | |
| 1 Year | 26.12% |
| Start of Performance (12/5/2007) | -7.24% |
Performance data quoted represents past performance which is no guarantee of future results. Investment return and principal value will fluctuate so that an investor's shares, when redeemed, may be worth more or less than their original cost. Mutual fund performance changes over time and current performance may be lower or higher than what is stated. For current to the most recent month-end performance and after-tax returns, visit FederatedInvestors.com or call 1-800-341-7400. Returns shown do not reflect the deduction of taxes that a shareholder would pay on Fund distributions or the redemption of Fund shares. Mutual funds are not obligations of or guaranteed by any bank and are not federally insured.
| 1 | The Fund's performance assumes the reinvestment of all dividends and distributions. The R1000G and the LLCGFI have been adjusted to reflect reinvestment of dividends on securities in the R1000G and the funds in the LLCGFI. |
| 2 | The R1000G and the LLCGFI are not adjusted to reflect expenses or other fees that the SEC requires to be reflected in the Fund's performance. The LLCGFI represents the composite performance of the 30 largest funds by assets in the Lipper Large Cap Growth Fund category, and is not adjusted to reflect any sales charges. The R1000G and the LLCGFI are unmanaged and, unlike the Fund, are not affected by cashflows. It is not possible to invest directly in an index. |
Annual Shareholder Report10
Portfolio of Investments Summary Table (unaudited)
At October 31, 2009, the Fund's sector composition1 was as follows:
| Sector Composition | Percentage of
Total Net Assets |
| Financials | 21.4% |
| Industrials | 20.5% |
| Information Technology | 17.3% |
| Consumer Discretionary | 12.8% |
| Materials | 9.4% |
| Health Care | 5.2% |
| Consumer Staples | 2.8% |
| Energy | 2.7% |
| Telecommunication Services | 2.1% |
| Utilities | 1.1% |
| Cash Equivalents2 | 0.6% |
| Other Assets and Liabilities — Net3 | 4.1% |
| Total | 100.0% |
| 1 | Except for Cash Equivalents and Other Assets and Liabilities, sector classifications are based upon, and individual portfolio securities are assigned to, the classifications of the Global Industry Classification Standard (GICS) except that the adviser assigns a classification to securities not classified by the GICS and to securities for which the adviser does not have access to the classification made by the GICS. |
| 2 | Cash Equivalents include any investments in money market mutual funds and/or overnight repurchase agreements. |
| 3 | Assets, other than investments in securities, less liabilities. See Statement of Assets and Liabilities. |
Annual Shareholder Report11
Portfolio of Investments
October 31, 2009
|
| Principal Amount or Shares | | | Value |
| | Common Stocks – 90.9% | |
| | Consumer Discretionary – 10.9% | |
| 60,250 | | Best Buy Co., Inc. | 2,300,345 |
| 42,100 | 1 | Kohl's Corp. | 2,408,962 |
| 309,800 | | Lennar Corp., Class A | 3,903,480 |
| 63,300 | | TJX Cos., Inc. | 2,364,255 |
| 750,000 | 1 | Wynn Macau Ltd. | 967,717 |
| | TOTAL | 11,944,759 |
| | Consumer Staples – 2.8% | |
| 64,900 | | Anheuser-Busch InBev NV | 3,050,034 |
| | Energy – 2.7% | |
| 119,100 | | Chesapeake Energy Corp. | 2,917,950 |
| | Financials – 21.4% | |
| 69,800 | | American Express Co. | 2,431,832 |
| 450,400 | 1 | CETIP SA | 3,016,985 |
| 16,000 | | Goldman Sachs Group, Inc. | 2,722,720 |
| 62,500 | | Housing Development Finance Corp. Ltd. | 3,452,481 |
| 46,600 | | ICICI Bank Ltd., ADR | 1,465,570 |
| 89,242 | | J.P. Morgan Chase & Co. | 3,727,638 |
| 87,100 | | Morgan Stanley | 2,797,652 |
| 136,460 | | Wells Fargo & Co. | 3,755,379 |
| | TOTAL | 23,370,257 |
| | Health Care – 5.2% | |
| 47,000 | | Baxter International, Inc. | 2,540,820 |
| 145,300 | | Bristol-Myers Squibb Co. | 3,167,540 |
| | TOTAL | 5,708,360 |
| | Industrials – 20.5% | |
| 45,600 | | C.H. Robinson Worldwide, Inc. | 2,513,016 |
| 62,650 | | Cummins, Inc. | 2,697,709 |
| 43,900 | | FedEx Corp. | 3,191,091 |
| 31,450 | | Kuehne & Nagel International AG | 2,846,574 |
| 35,200 | | Precision Castparts Corp. | 3,362,656 |
| 61,900 | 1 | Ryanair Holdings PLC, ADR | 1,688,013 |
| 233,100 | | Southwest Airlines Co. | 1,958,040 |
| 149,000 | 1 | Verisk Analytics, Inc. | 4,087,070 |
| | TOTAL | 22,344,169 |
Annual Shareholder Report12
|
| | Information Technology – 17.3% | |
| 14,200 | 1 | Apple, Inc. | 2,676,700 |
| 336,600 | 1 | Cia Brasileira de Meios de Pagamentos | 3,085,882 |
| 115,600 | 1 | Cisco Systems, Inc. | 2,641,460 |
| 105,300 | 1 | MEMC Electronic Materials, Inc. | 1,307,826 |
| 5,600 | | Nintendo Corp. Ltd. | 1,428,005 |
| 123,400 | 1 | Oracle Corp. | 2,603,740 |
| 165,400 | 1 | Redecard SA | 2,455,274 |
| 152,600 | 1 | Symantec Corp. | 2,682,708 |
| | TOTAL | 18,881,595 |
| | Materials – 8.0% | |
| 87,000 | | Barrick Gold Corp. | 3,125,910 |
| 268,000 | | Cemex S.A. de C.V., ADR | 2,781,840 |
| 64,200 | | Ecolab, Inc. | 2,822,232 |
| | TOTAL | 8,729,982 |
| | Telecommunication Services – 2.1% | |
| 51,950 | 1 | America Movil S.A.B. de C.V., Class L, ADR | 2,292,554 |
| | TOTAL COMMON STOCKS
(IDENTIFIED COST $93,201,842) | 99,239,660 |
| | Corporate Bond – 1.9% | |
| | Consumer Discretionary – 1.9% | |
| $2,743,000 | | Central European Media Enterprises Ltd., Conv. Bond, 3.50%, 3/15/2013
(IDENTIFIED COST $1,412,645) | 2,116,247 |
| | Corporate Note – 1.4% | |
| | Materials – 1.4% | |
| 1,240,000 | | Newmont Mining Corp., Conv. Note, 3.00%, 2/15/2012
(IDENTIFIED COST $1,240,000) | 1,485,346 |
| | Preferred Stock – 1.1% | |
| | Utilities – 1.1% | |
| 25,500 | 1 | FPL Group, Inc., Pfd.
(IDENTIFIED COST $1,255,875) | 1,243,125 |
| | Mutual Fund – 0.6% | |
| 599,268 | 2,3 | Prime Value Obligations Fund, Institutional Shares, 0.22%
(AT NET ASSET VALUE) | 599,268 |
| | TOTAL INVESTMENTS-95.9%
(IDENTIFIED COST $97,709,630)4 | 104,683,646 |
| | OTHER ASSETS AND LIABILITIES - NET — 4.1%5 | 4,502,530 |
| | TOTAL NET ASSETS — 100% | $109,186,176 |
Annual Shareholder Report13
- At October 31, 2009, the Fund had outstanding foreign exchange contracts as follows:
| Settlement Date | Foreign
Currency
Units to
Receive | In
Exchange
For | Unrealized
Appreciation |
| Contracts Sold: | | | |
| 11/2/2009 | 103,360 Euros | $153,024 | $915 |
- Unrealized Appreciation on Foreign Exchange Contracts is included in “Other Assets and Liabilities — Net.”
- Note: The categories of investments are shown as a percentage of total net assets at October 31, 2009.
- Various inputs are used in determining the value of the Fund's investments. These inputs are summarized in the three broad levels listed below:
- Level 1 — quoted prices in active markets for identical securities
- Level 2 — other significant observable inputs (including quoted prices for similar securities, interest rates, prepayment speeds, credit risk, etc.)
- Level 3 — significant unobservable inputs (including the Fund's own assumptions in determining the fair value of investments)
- The inputs or methodology used for valuing securities are not an indication of the risk associated with investing in those securities.
Annual Shareholder Report14
- The following is a summary of the inputs used, as of October 31, 2009, in valuing the Fund's assets carried at fair value:
| Valuation Inputs | | | | |
| Level 1 -
Quoted
Prices and
Investments in
Mutual Funds | Level 2 -
Other
Significant
Observable
Inputs | Level 3 -
Significant
Unobservable
Inputs | Total |
| Equity Securities: | | | | |
| Domestic | $68,825,947 | $ — | $ — | $68,825,947 |
| International | 24,332,224 | 7,324,614 | — | 31,656,838 |
| Debt Securities: | | | | |
| Corporate Bond | — | 2,116,247 | — | 2,116,247 |
| Corporate Note | — | 1,485,346 | — | 1,485,346 |
| Mutual Fund | 599,268 | — | — | 599,268 |
| TOTAL SECURITIES | $93,757,439 | $10,926,207 | $ — | $104,683,646 |
| OTHER FINANCIAL INSTRUMENTS* | $915 | $ — | $ — | $915 |
| * | Other financial instruments include foreign exchange contracts. |
- The following acronym is used throughout this portfolio:
- ADR — American Depositary Receipt
- See Notes which are an integral part of the Financial Statements
Annual Shareholder Report15
Statement of Assets and Liabilities
October 31, 2009
| Assets: | | |
| Total investments in securities, at value including $599,268 of investments in an affiliated issuer (Note 5) (identified cost $97,709,630) | | $104,683,646 |
| Income receivable | | 128,235 |
| Receivable for investments sold | | 4,220,368 |
| Receivable for shares sold | | 944,335 |
| Receivable for foreign exchange contracts | | 915 |
| TOTAL ASSETS | | 109,977,499 |
| Liabilities: | | |
| Payable for shares redeemed | $345,645 | |
| Payable for capital gains taxes withheld | 278,118 | |
| Payable for auditing fees | 36,600 | |
| Payable for portfolio accounting fees | 35,791 | |
| Payable for distribution services fee (Note 5) | 21,857 | |
| Payable for shareholder services fee (Note 5) | 41,286 | |
| Accrued expenses | 32,026 | |
| TOTAL LIABILITIES | | 791,323 |
| Net assets for 12,593,501 shares outstanding | | $109,186,176 |
| Net Assets Consist of: | | |
| Paid-in capital | | $112,246,921 |
| Net unrealized appreciation of investments and translation of assets and liabilities in foreign currency | | 6,974,123 |
| Accumulated net realized loss on investments and foreign currency transactions | | (10,049,497) |
| Undistributed net investment income | | 14,629 |
| TOTAL NET ASSETS | | $109,186,176 |
Annual Shareholder Report16
Statement of Assets and Liabilities — continued| Net Asset Value, Offering Price and Redemption Proceeds Per Share | | |
| Institutional Shares: | | |
| Net asset value per share ($15,930,779 ÷ 1,825,682 shares outstanding), no par value, unlimited shares authorized | | $8.73 |
| Offering price per share | | $8.73 |
| Redemption proceeds per share | | $8.73 |
| Class A Shares: | | |
| Net asset value per share ($60,202,536 ÷ 6,925,574 shares outstanding), no par value, unlimited shares authorized | | $8.69 |
| Offering price per share (100/94.50 of $8.69) | | $9.20 |
| Redemption proceeds per share | | $8.69 |
| Class C Shares: | | |
| Net asset value per share ($32,720,582 ÷ 3,803,722 shares outstanding), no par value, unlimited shares authorized | | $8.60 |
| Offering price per share | | $8.60 |
| Redemption proceeds per share (99.00/100 of $8.60) | | $8.51 |
| Class K Shares: | | |
| Net asset value per share ($332,279 ÷ 38,523 shares outstanding), no par value, unlimited shares authorized | | $8.63 |
| Offering price per share | | $8.63 |
| Redemption proceeds per share | | $8.63 |
- See Notes which are an integral part of the Financial Statements
Annual Shareholder Report17
Statement of Operations
Year Ended October 31, 2009
| Investment Income: | | | |
| Dividends (including $42,794 received from an affiliated issuer (Note 5) and net of foreign taxes withheld of $3,133) | | | $1,240,680 |
| Interest | | | 290,771 |
| TOTAL INCOME | | | 1,531,451 |
| Expenses: | | | |
| Investment adviser fee (Note 5) | | $1,000,714 | |
| Administrative personnel and services fee (Note 5) | | 270,000 | |
| Custodian fees | | 25,646 | |
| Transfer and dividend disbursing agent fees and expenses — Institutional Shares | | 12,635 | |
| Transfer and dividend disbursing agent fees and expenses — Class A Shares | | 76,368 | |
| Transfer and dividend disbursing agent fees and expenses — Class C Shares | | 43,889 | |
| Transfer and dividend disbursing agent fees and expenses — Class K Shares | | 394 | |
| Directors'/Trustees' fees | | 1,591 | |
| Auditing fees | | 52,000 | |
| Legal fees | | 7,752 | |
| Portfolio accounting fees | | 103,963 | |
| Distribution services fee — Class C Shares (Note 5) | | 171,562 | |
| Distribution services fee — Class K Shares (Note 5) | | 540 | |
| Shareholder services fee — Class A Shares (Note 5) | | 93,536 | |
| Shareholder services fee — Class C Shares (Note 5) | | 57,188 | |
| Share registration costs | | 104,737 | |
| Printing and postage | | 43,479 | |
| Insurance premiums | | 1,957 | |
| Miscellaneous | | 9,886 | |
| TOTAL EXPENSES | | 2,077,837 | |
Annual Shareholder Report18
Statement of Operations — continued| Waivers, Reimbursements and Reduction: | | | |
| Waiver/reimbursement of investment adviser fee (Note 5) | $(775,461) | | |
| Waiver of administrative personnel and services fee (Note 5) | (54,296) | | |
| Waiver of distribution services fee — Class C Shares (Note 5) | (10) | | |
| Waiver of distribution services fee — Class K Shares (Note 5) | (63) | | |
| Reimbursement of shareholder services fee — Class A Shares (Note 5) | (185) | | |
| Reimbursement of transfer and dividend disbursing agent fees and expenses — Class A Shares (Note 5) | (28,507) | | |
| Reimbursement of transfer and dividend disbursing agent fees and expenses — Institutional Shares (Note 5) | (651) | | |
| Fees paid indirectly from directed brokerage arrangements (Note 6) | (3,187) | | |
| TOTAL WAIVERS, REIMBURSEMENTS AND REDUCTION | | $(862,360) | |
| Net expenses | | | $1,215,477 |
| Net investment income | | | 315,974 |
Realized and Unrealized Gain (Loss) on Investments, Written Options and Foreign
Currency Transactions: | | | |
| Net realized loss on investments and foreign currency transactions (including foreign taxes withheld of $390,817) | | | (6,553,125) |
| Net realized gain on written options | | | 88,760 |
| Net change in unrealized depreciation of investments and translation of assets and liabilities in foreign currency | | | 22,926,792 |
| Net realized and unrealized gain on investments, written options and foreign currency transactions | | | 16,462,427 |
| Change in net assets resulting from operations | | | $16,778,401 |
- See Notes which are an integral part of the Financial Statements
Annual Shareholder Report19
Statement of Changes in Net Assets
| Year Ended
10/31/2009 | Period Ended
10/31/20081 |
| Increase (Decrease) in Net Assets | | |
| Operations: | | |
| Net investment income | $315,974 | $32,113 |
| Net realized gain (loss) on investments, written options and foreign currency transactions | (6,464,365) | (3,791,896) |
| Net change in unrealized appreciation/depreciation of investments and translation of assets and liabilities in foreign currency | 22,926,792 | (15,952,669) |
| CHANGE IN NET ASSETS RESULTING FROM OPERATIONS | 16,778,401 | (19,712,452) |
| Distributions to Shareholders: | | |
| Distributions from net investment income | | |
| Institutional Shares | (34,222) | — |
| Class A Shares | (97,124) | — |
| Class K Shares | (119) | — |
| CHANGE IN NET ASSETS RESULTING FROM DISTRIBUTIONS TO SHAREHOLDERS | (131,465) | — |
| Share Transactions: | | |
| Proceeds from sale of shares | 67,130,420 | 76,913,035 |
| Net asset value of shares issued to shareholders in payment of distributions declared | 111,697 | — |
| Cost of shares redeemed | (24,614,521) | (7,288,939) |
| CHANGE IN NET ASSETS RESULTING FROM SHARE TRANSACTIONS | 42,627,596 | 69,624,096 |
| Change in net assets | 59,274,532 | 49,911,644 |
| Net Assets: | | |
| Beginning of period | 49,911,644 | — |
| End of period (including undistributed net investment income of $14,629 and $71,144, respectively) | $109,186,176 | $49,911,644 |
| 1 | Reflects operations for the period from December 5, 2007 (date of initial investment) to October 31, 2008. |
- See Notes which are an integral part of the Financial Statements
Annual Shareholder Report20
Notes to Financial Statements
October 31, 2009
1. ORGANIZATION
Federated Equity Funds (the “Trust”) is registered under the Investment Company Act of 1940, as amended (the “Act”), as an open-end management investment company. The Trust consists of 13 portfolios. The financial statements included herein are only those of Federated Kaufmann Large Cap Fund (the “Fund”), a diversified portfolio. The financial statements of the other portfolios are presented separately. The assets of each portfolio are segregated and a shareholder's interest is limited to the portfolio in which shares are held. Each portfolio pays its own expenses. The Fund, effective December 3, 2007, offers four classes of shares: Class A Shares, Class C Shares, Class K Shares and Institutional Shares. The financial highlights of the Institutional Shares are presented separately. All shares of the Fund have equal rights with respect to voting, except on class-specific matters. The investment objective of the Fund is to provide capital appreciation.
2. SIGNIFICANT ACCOUNTING POLICIES
The following is a summary of significant accounting policies consistently followed by the Fund in the preparation of its financial statements. These policies are in conformity with U.S. generally accepted accounting principles (GAAP).
Investment Valuation
In calculating its net asset value (NAV), the Fund generally values investments as follows:
- Equity securities listed on an exchange or traded through a regulated market system are valued at their last reported sale price or official closing price in their principal exchange or market.
- Fixed-income securities acquired with remaining maturities greater than 60 days are fair valued using price evaluations provided by a pricing service approved by the Board of Trustees (the “Trustees”).
- Fixed-income securities acquired with remaining maturities of 60 days or less are valued at their cost (adjusted for the accretion of any discount or amortization of any premium).
- Shares of other mutual funds are valued based upon their reported NAVs.
- Derivative contracts listed on exchanges are valued at their reported settlement or closing price.
- Over-the-counter (OTC) derivative contracts are fair valued using price evaluations provided by a pricing service approved by the Trustees.
If the Fund cannot obtain a price or price evaluation from a pricing service for an investment, the Fund may attempt to value the investment based upon the mean of bid and asked quotations or fair value the investment based on price evaluations, from one or more dealers. If any price, quotation, price evaluation or other pricing source is not readily available when the NAV is calculated, the Fund uses the fair value of the investment determined in accordance with the procedures described below. There can be no assurance that the Fund could purchase or sell an investment at the price used to calculate the Fund's NAV.
Fair Valuation and Significant Events Procedures
The Trustees have authorized the use of pricing services to provide evaluations of the current fair value of certain investments for purposes of calculating the NAV. Factors considered by pricing services in evaluating an investment include the yields or prices of investments of comparable quality, coupon, maturity, call rights and other potential prepayments, terms and Annual Shareholder Report21
type, reported transactions, indications as to values from dealers and general market conditions. Some pricing services provide a single price evaluation reflecting the bid-side of the market for an investment (a “bid” evaluation). Other pricing services offer both bid evaluations and price evaluations indicative of a price between the prices bid and asked for the investment (a “mid” evaluation). The Fund normally uses bid evaluations for U.S. Treasury and Agency securities and mortgage-backed securities. The Fund normally uses mid evaluations for other types of fixed-income securities and OTC derivative contracts. In the event that market quotations and price evaluations are not available for an investment, the fair value of the investment is determined in accordance with procedures adopted by the Trustees.The Trustees also have adopted procedures requiring an investment to be priced at its fair value whenever the Adviser determines that a significant event affecting the value of the investment has occurred between the time as of which the price of the investment would otherwise be determined and the time as of which the NAV is computed. An event is considered significant if there is both an affirmative expectation that the investment's value will change in response to the event and a reasonable basis for quantifying the resulting change in value. Examples of significant events that may occur after the close of the principal market on which a security is traded, or after the time of a price evaluation provided by a pricing service or a dealer, include:
- With respect to securities traded in foreign markets, significant trends in U.S. equity markets or in the trading of foreign securities index futures or options contracts;
- With respect to price evaluations of fixed-income securities determined before the close of regular trading on the NYSE, actions by the Federal Reserve Open Market Committee and other significant trends in U.S. fixed-income markets;
- Political or other developments affecting the economy or markets in which an issuer conducts its operations or its securities are traded; and
- Announcements concerning matters such as acquisitions, recapitalizations, litigation developments, a natural disaster affecting the issuer's operations or regulatory changes or market developments affecting the issuer's industry.
The Trustees have approved the use of a pricing service to determine the fair value of equity securities traded principally in foreign markets when the Adviser determines that there has been a significant trend in the U.S. equity markets or in index futures trading. For other significant events, the Fund may seek to obtain more current quotations or price evaluations from alternative pricing sources. If a reliable alternative pricing source is not available, the Fund will determine the fair value of the investment using another method approved by the Trustees.
Repurchase Agreements
It is the policy of the Fund to require the other party to a repurchase agreement to transfer to the Fund's custodian or sub-custodian eligible securities or cash with a market value (after transaction costs) at least equal to the repurchase price to be paid under the repurchase agreement. The eligible securities are transferred to accounts with the custodian or sub-custodian in which the Fund holds a “securities entitlement” and exercises “control” as those terms are defined in the Uniform Commercial Code. The Fund has established procedures for monitoring the market value of the transferred securities and requiring the transfer of additional eligible securities if necessary to equal at least the repurchase price. These procedures also allow the other party to require securities to be transferred from the account to the extent that their market value exceeds the repurchase price or in exchange for other eligible securities of equivalent market value.
Annual Shareholder Report22
With respect to agreements to repurchase U.S. government securities and cash items, the Fund treats the repurchase agreement as an investment in the underlying securities and not as an obligation of the other party to the repurchase agreement. Other repurchase agreements are treated as obligations of the other party secured by the underlying securities. Nevertheless, the insolvency of the other party or other failure to repurchase the securities may delay the disposition of the underlying securities or cause the Fund to receive less than the full repurchase price. Under the terms of the repurchase agreement, any amounts received by the Fund in excess of the repurchase price and related transaction costs must be remitted to the other party.The Fund may enter into repurchase agreements in which eligible securities are transferred into joint trading accounts maintained by the custodian or sub-custodian for investment companies and other clients advised by the Fund's Adviser and its affiliates. The Fund will participate on a pro rata basis with the other investment companies and clients in its share of the securities transferred under such repurchase agreements and in its share of proceeds from any repurchase or other disposition of such securities.
Investment Income, Gains and Losses, Expenses and Distributions
Investment transactions are accounted for on a trade-date basis. Realized gains and losses from investment transactions are recorded on an identified-cost basis. Interest income and expenses are accrued daily. Dividend income and distributions to shareholders are recorded on the ex-dividend date. Foreign dividends are recorded on the ex-dividend date or when the Fund is informed of the ex-dividend date. Distributions of net investment income, if any, are declared and paid annually. Non-cash dividends included in dividend income, if any, are recorded at fair value. Investment income, realized and unrealized gains and losses, and certain fund-level expenses are allocated to each class based on relative average daily net assets, except that Class A Shares, Class C Shares, Institutional Shares and Class K Shares may bear distribution services fees, shareholder services fees and certain transfer and dividend disbursing agent fees unique to those classes. Dividends are declared separately for each class. No class has preferential dividend rights; differences in per share dividend rates are generally due to differences in separate class expenses.
Premium and Discount Amortization
All premiums and discounts on fixed-income securities are amortized/accreted for financial statement purposes.
Federal Taxes
It is the Fund's policy to comply with the Subchapter M provision of the Internal Revenue Code (the “Code”) and to distribute to shareholders each year substantially all of its income. Accordingly, no provision for federal income tax is necessary. As of and during the year ended October 31, 2009, the Fund did not have a liability for any uncertain tax positions. The Fund recognizes interest and penalties, if any, related to tax liabilities as income tax expense in the Statement of Operations. As of October 31, 2009, tax years 2008 and 2009 remain subject to examination by the Fund's major tax jurisdictions, which include the United States of America and the Commonwealth of Massachusetts.
The Fund may be subject to taxes imposed by governments of countries in which it invests. Such taxes are generally based on either income or gains earned or repatriated. The Fund accrues and applies such taxes to net investment income, net realized gains and net unrealized gains as income and/or gains are earned.
Annual Shareholder Report23
When-Issued and Delayed Delivery TransactionsThe Fund may engage in when-issued or delayed delivery transactions. The Fund records when-issued securities on the trade date and maintains security positions such that sufficient liquid assets will be available to make payment for the securities purchased. Securities purchased on a when-issued or delayed delivery basis are marked to market daily and begin earning interest on the settlement date. Losses may occur on these transactions due to changes in market conditions or the failure of counterparties to perform under the contract.
Foreign Exchange Contracts
The Fund may enter into foreign exchange contracts for the delayed delivery of securities or foreign currency exchange transactions. The Fund may enter into foreign exchange contracts to protect assets against adverse changes in foreign currency exchange rates or exchange control regulations. Purchased contracts are used to acquire exposure to foreign currencies, whereas, contracts to sell are used to hedge the Fund's securities against currency fluctuations. Risks may arise upon entering into these transactions from the potential inability of counterparties to meet the terms of their commitments and from unanticipated movements in security prices or foreign exchange rates. The foreign exchange contracts are adjusted by the daily exchange rate of the underlying currency and any gains or losses are recorded for financial statement purposes as unrealized until the settlement date.
Foreign exchange contracts outstanding at period end are listed after the Fund's Portfolio of Investments.
Foreign Currency Translation
The accounting records of the Fund are maintained in U.S. dollars. All assets and liabilities denominated in foreign currencies (FCs) are translated into U.S. dollars based on the rates of exchange of such currencies against U.S. dollars on the date of valuation. Purchases and sales of securities, income and expenses are translated at the rate of exchange quoted on the respective date that such transactions are recorded. The Fund does not isolate that portion of the results of operations resulting from changes in foreign exchange rates on investments from the fluctuations arising from changes in market prices of securities held. Such fluctuations are included with the net realized and unrealized gain or loss from investments.
Reported net realized foreign exchange gains or losses arise from sales of portfolio securities, sales and maturities of short-term securities, sales of FCs, currency gains or losses realized between the trade and settlement dates on securities transactions, the difference between the amounts of dividends, interest and foreign withholding taxes recorded on the Fund's books, and the U.S. dollar equivalent of the amounts actually received or paid. Net unrealized foreign exchange gains and losses arise from changes in the value of assets and liabilities other than investments in securities at fiscal year end, resulting from changes in the exchange rate.
Option Contracts
The Fund may buy or sell put and call options to hedge currency. The seller (writer) of an option receives a payment or premium, from the buyer, which the writer keeps regardless of whether the buyer exercises the option. Premiums paid for purchasing options which expire are treated as realized losses. The risk associated with purchasing put and call options is limited to the premium paid. When the Fund writes a put or call option, an amount equal to the premium received is recorded as a liability and subsequently marked to market to reflect the current value of the option written. Premiums received from writing options which expire are treated as realized gains. Premiums received from writing options which are exercised or Annual Shareholder Report24
closed are added to the proceeds or offset against amounts paid on the underlying reference instrument to determine the realized gain or loss. The Fund, as a writer of an option, bears the market risk of an unfavorable change in the price of the underlying reference instrument. Options can trade on securities or commodities exchanges. In this case, the exchange sets all the terms of the contract except for the price. Most exchanges require investors to maintain margin accounts through their brokers to cover their potential obligations to the exchange. This protects investors against potential defaults by the counterparty.The following is a summary of the Fund's written option activity:
| Contracts | Number of
Contracts | Premium |
| Outstanding at October 31, 2008 | — | $ — |
| Contracts written | 5,800,000 | 137,650 |
| Contracts bought back | (5,800,000) | (137,650) |
| Outstanding at October 31, 2009 | — | $ — |
Additional Disclosure Related to Derivative Instruments
| Fair Value of Derivative Instruments |
| Asset | Liability |
| Statement of
Assets and
Liabilities
Location | Fair
Value | Statement of
Assets and
Liabilities
Location | Fair
Value |
| Derivatives not accounted for as hedging instruments under ASC Topic 815 | | | | |
| Foreign exchange contracts | Receivable for foreign exchange contracts | $915 | — | $ — |
The Effect of Derivative Instruments on the Statement of Operations for the Year Ended October 31, 2009
| Amount of Realized Gain or (Loss) on Derivatives Recognized in Income |
| Option
Contracts | Forward
Currency
Contracts | Total |
| Foreign exchange contracts | $139,098 | $(22,100) | $116,998 |
| Change in Unrealized Appreciation or (Depreciation) on Derivatives Recognized in Income |
| Forward
Currency
Contracts |
| Foreign exchange contracts | $915 |
Annual Shareholder Report25
Other
The preparation of financial statements in conformity with GAAP requires management to make estimates and assumptions that affect the amounts of assets, liabilities, expenses and revenues reported in the financial statements. Actual results could differ from those estimated.
3. SHARES OF BENEFICIAL INTEREST
The following tables summarize share activity:
| Year Ended
10/31/09 | Period Ended
10/31/081 |
| Institutional Shares: | Shares | Amount | Shares | Amount |
| Shares sold | 1,648,086 | $11,540,740 | 366,559 | $2,986,589 |
| Shares issued to shareholders in payment of distributions declared | 5,201 | 33,907 | — | — |
| Shares redeemed | (182,139) | (1,444,097) | (12,025) | (111,343) |
NET CHANGE RESULTING
FROM INSTITUTIONAL SHARE TRANSACTIONS | 1,471,148 | $10,130,550 | 354,534 | $2,875,246 |
| Year Ended
10/31/09 | Period Ended
10/31/081 |
| Class A Shares: | Shares | Amount | Shares | Amount |
| Shares sold | 5,164,199 | $39,815,480 | 5,149,971 | $49,053,817 |
| Shares issued to shareholders in payment of distributions declared | 11,931 | 77,671 | — | — |
| Shares redeemed | (2,777,438) | (18,310,126) | (623,089) | (5,172,000) |
NET CHANGE RESULTING
FROM CLASS A SHARE TRANSACTIONS | 2,398,692 | $21,583,025 | 4,526,882 | $43,881,817 |
| Year Ended
10/31/09 | Period Ended
10/31/081 |
| Class C Shares: | Shares | Amount | Shares | Amount |
| Shares sold | 2,106,276 | $15,425,563 | 2,625,254 | $24,869,902 |
| Shares issued to shareholders in payment of distributions declared | — | — | — | — |
| Shares redeemed | (684,595) | (4,817,632) | (243,213) | (2,005,596) |
NET CHANGE RESULTING
FROM CLASS C SHARE TRANSACTIONS | 1,421,681 | $10,607,931 | 2,382,041 | $22,864,306 |
Annual Shareholder Report26
| Year Ended
10/31/09 | Period Ended
10/31/081 |
| Class K Shares: | Shares | Amount | Shares | Amount |
| Shares sold | 43,499 | $348,637 | 286 | $2,727 |
| Shares issued to shareholders in payment of distributions declared | 18 | 119 | — | — |
| Shares redeemed | (5,280) | (42,666) | — | — |
NET CHANGE RESULTING
FROM CLASS K SHARE TRANSACTIONS | 38,237 | $306,090 | 286 | $2,727 |
| NET CHANGE RESULTING FROM FUND SHARE TRANSACTIONS | 5,329,758 | $42,627,596 | 7,263,743 | $69,624,096 |
| 1 | Reflects operations for the period from December 5, 2007 (date of initial investment) to October 31, 2008. |
4. FEDERAL TAX INFORMATION
The timing and character of income and capital gain distributions are determined in accordance with income tax regulations, which may differ from GAAP. These differences are due in part to differing treatments for foreign currency transactions, realized capital gains tax and discount accretion/premium amortization on debt securities.
For the year ended October 31, 2009, permanent differences identified and reclassified among the components of net assets were as follows:
| Increase (Decrease) |
Undistributed
Net Investment
Income (Loss) | | Accumulated
Net Realized
Gain (Loss) |
| $(241,024) | | $241,024 |
Net investment income (loss), net realized gains (losses) and net assets were not affected by this reclassification.
The tax character of distributions as reported on the Statement of Changes in Net Assets for the years ended October 31, 2009 and 2008, was as follows:
| 2009 | 2008 |
| Ordinary income | $131,465 | $ — |
As of October 31, 2009, the components of distributable earnings on a tax basis were as follows:
| Undistributed ordinary income | $34,661 |
| Net unrealized appreciation | $5,211,332 |
| Capital loss carryforwards | $(8,306,738) |
The difference between book-basis and tax-basis net unrealized appreciation/depreciation is attributable to the deferral of losses on wash sales and discount accretion/premium amount amortization on debt securities.
Annual Shareholder Report27
At October 31, 2009, the cost of investments for federal tax purposes was $99,194,303. The net unrealized appreciation of investments for federal tax purposes excluding any unrealized appreciation resulting from changes in outstanding foreign exchange contracts was $5,489,343. This consists of net unrealized appreciation from investments for those securities having an excess of value over cost of $10,861,704 and net unrealized depreciation from investments for those securities having an excess of cost over value of $5,372,361.At October 31, 2009, the Fund had a capital loss carryforward of $8,306,738, which will reduce the Fund's taxable income arising from future net realized gains on investments, if any, to the extent permitted by the Code and thus will reduce the amount of distributions to shareholders, which would otherwise be necessary to relieve the Fund of any liability for federal income tax. Pursuant to the Code, such capital loss carryforward will expire as follows:
| Expiration Year | Expiration Amount |
| 2016 | $3,186,204 |
| 2017 | $5,120,534 |
5. INVESTMENT ADVISER FEE AND OTHER TRANSACTIONS WITH AFFILIATES
Investment Adviser Fee
Federated Equity Management Company of Pennsylvania is the Fund's investment adviser (the “Adviser”). The advisory agreement between the Fund and the Adviser provides for an annual fee equal to 1.425% of the Fund's average daily net assets. Subject to the terms described in the Expense Limitation note, the Adviser may voluntarily choose to waive any portion of its fee and/or reimburse certain operating expenses of the Fund. The Adviser can modify or terminate this voluntary waiver and/or reimbursement at any time at its sole discretion. For the year ended October 31, 2009, the Adviser voluntarily waived $771,428 of its fee. In addition, an affiliate of the Adviser reimbursed $29,158 of transfer and dividend disbursing agent fees and expenses.
Certain of the Fund's assets are managed by Federated Global Investment Management Corp. (the “Sub-Adviser”). Under the terms of a sub-advisory agreement between the Adviser and the Sub-Adviser, the Sub-Adviser receives an allocable portion of the Fund's adviser fee. The fee is paid by the Adviser out of its resources and is not an incremental Fund expense. For the year ended October 31, 2009, the Sub-Adviser earned a fee of $825,151.
Administrative Fee
Federated Administrative Services (FAS), under the Administrative Services Agreement, provides the Fund with administrative personnel and services. The fee paid to FAS is based on the average aggregate daily net assets of certain Federated funds as specified below:
| Administrative Fee | Average Aggregate Daily Net Assets
of the Federated Funds |
| 0.150% | on the first $5 billion |
| 0.125% | on the next $5 billion |
| 0.100% | on the next $10 billion |
| 0.075% | on assets in excess of $20 billion |
Annual Shareholder Report28
The administrative fee received during any fiscal year shall be at least $150,000 per portfolio and $40,000 per each additional class of Shares. Subject to the terms described in the Expense Limitation note, FAS may voluntarily choose to waive any portion of its fee. FAS can modify or terminate this voluntary waiver at any time at its sole discretion. For the year ended
October 31, 2009, the net fee paid to FAS was 0.307% of average daily net assets of the Fund. FAS waived $54,296 of its fee. The Fund is currently being charged the minimum administrative fee; therefore the fee as a percentage of average daily net assets is greater than the amounts presented in the chart above.
Distribution Services Fee
The Fund has adopted a Distribution Plan (the “Plan”) pursuant to Rule 12b-1 under the Act. Under the terms of the Plan, the Fund will compensate Federated Securities Corp. (FSC), the principal distributor, from the daily net assets of the Fund's Class A Shares, Class C Shares and Class K Shares to finance activities intended to result in the sale of these shares. The Plan provides that the Fund may incur distribution expenses at the following percentages of average daily net assets annually, to compensate FSC:
| Share Class Name | Percentage of Average Daily
Net Assets of Class |
| Class A Shares | 0.25% |
| Class C Shares | 0.75% |
| Class K Shares | 0.50% |
Subject to the terms described in the Expense Limitation note, FSC may voluntarily choose to waive any portion of its fee. FSC can modify or terminate this voluntary waiver at any time at its sole discretion. For the year ended October 31, 2009, FSC voluntarily waived $73 of its fee. When FSC receives fees, it may pay some or all of them to financial intermediaries whose customers purchase shares. For the year ended October 31, 2009, FSC retained $82,965 of fees paid by the Fund. For the year ended October 31, 2009, the Fund's Class A Shares did not incur a distribution services fee; however it may begin to incur this fee upon approval of the Trustees.
Sales Charges
Front-end sales charges and contingent deferred sales charges (CDSC) do not represent expenses of the Fund. They are deducted from the proceeds of sales of Fund shares prior to investment or from redemption proceeds prior to remittance, as applicable. For the year ended October 31, 2009, FSC retained $20,768 in sales charges from the sale of Class A Shares. FSC also retained $190 of CDSC relating to redemptions of Class A Shares and $5,452 relating to redemptions of Class C Shares.
Shareholder Services Fee
The Fund may pay fees (Service Fees) up to 0.25% of the average daily net assets of the Fund's Class A Shares and Class C Shares to financial intermediaries or to Federated Shareholder Services Company (FSSC) for providing services to shareholders and maintaining shareholder accounts. Subject to the terms described in the Expense Limitation note, FSSC may voluntarily reimburse the Fund for shareholder services fees. This voluntary reimbursement can be modified or terminated at any time. For the year ended October 31, 2009, FSSC voluntarily reimbursed $185 of its fee. For the year ended October 31, 2009, FSSC did not receive any fees paid by the Fund.
Annual Shareholder Report29
Expense LimitationThe Adviser and its affiliates (which may include FSC, FAS and FSSC) have voluntarily agreed to waive their fees and/or reimburse expenses so that the total operating expenses (as shown in the financial highlights) paid by the Fund's Institutional Shares, Class A Shares, Class C Shares and Class K Shares (after the voluntary waivers and reimbursements) will not exceed 1.25%, 1.50%, 2.34% and 1.95%, respectively, through the later of (the “Termination Date”): (a) December 31, 2010; or (b) the date of the Fund's next effective Prospectus. While the Adviser and its affiliates currently do not anticipate terminating these arrangements prior to the Termination Date, these arrangements may only be terminated prior to the Termination Date with the agreement of the Fund's Board of Trustees.
Interfund Transactions
During the year ended October 31, 2009, the Fund engaged in purchase and sale transactions with funds that have a common investment adviser (or affiliated investment advisers), common Directors/Trustees, and/or common Officers. These purchase and sale transactions complied with Rule 17a-7 under the Act and amounted to $2,835,488 and $820,128, respectively.
General
Certain Officers and Trustees of the Fund are Officers and Directors or Trustees of the above companies.
Transactions with Affiliated Companies
Affiliated holdings are mutual funds which are managed by the Adviser or an affiliate of the Adviser. The Adviser has agreed to reimburse the Fund for certain investment adviser fees as a result of transactions in other affiliated mutual funds. For the year ended October 31, 2009, the Adviser reimbursed $4,033. Transactions with the affiliated company during the year ended October 31, 2009 were as follows:
| Affiliate | Balance of
Shares Held
10/31/2008 | Purchases/
Additions | Sales/
Reductions | Balance of
Shares Held
10/31/2009 | Value | Dividend
Income |
| Prime Value Obligations Fund, Institutional Shares | 429,133 | 83,591,918 | 83,421,783 | 599,268 | $599,268 | $42,794 |
6. EXPENSE Reduction
The Fund directs portfolio trades to a broker that in turn pays a portion of the Fund's operating expenses. For the year ended October 31, 2009, the Fund's expenses were reduced by $3,187 under these arrangements.
7. Investment TRANSACTIONS
Purchases and sales of investments, excluding long-term U.S. government securities and short-term obligations, for the year ended October 31, 2009, were as follows:
| Purchases | $153,580,039 |
| Sales | $113,488,920 |
Annual Shareholder Report30
8. CONCENTRATION OF RISK
The Fund invests in securities of non-U.S. issuers. Political or economic developments may have an effect on the liquidity and volatility of portfolio securities and currency holdings.
9. LINE OF CREDIT
The Fund participates in a $100,000,000 unsecured, uncommitted revolving line of credit (LOC) agreement with PNC Bank. The LOC was made available for extraordinary or emergency purposes, primarily for financing redemption payments. Borrowings are charged interest at a rate offered to the Fund by PNC Bank at the time of the borrowing. As of October 31, 2009, there were no outstanding loans. During the year ended October 31, 2009, the Fund did not utilize the LOC.
10. INTERFUND LENDING
Pursuant to an Exemptive Order issued by the Securities and Exchange Commission (SEC), the Fund, along with other funds advised by subsidiaries of Federated Investors, Inc., may participate in an interfund lending program. This program provides an alternative credit facility allowing the Fund to borrow from other participating affiliated funds. As of October 31, 2009, there were no outstanding loans. During the year ended October 31, 2009, the program was not utilized.
11. Legal Proceedings
Since October 2003, Federated Investors, Inc. and related entities (collectively, “Federated”), and various Federated funds (Federated Funds) have been named as defendants in several class action lawsuits now pending in the United States District Court for the District of Maryland. The lawsuits were purportedly filed on behalf of people who purchased, owned and/or redeemed shares of Federated-sponsored mutual funds during specified periods beginning November 1, 1998. The suits are generally similar in alleging that Federated engaged in illegal and improper trading practices including market timing and late trading in concert with certain institutional traders, which allegedly caused financial injury to the mutual fund shareholders. These lawsuits began to be filed shortly after Federated's first public announcement that it had received requests for information on shareholder trading activities in the Federated Funds from the SEC, the Office of the New York State Attorney General (NYAG) and other authorities. In that regard, on November 28, 2005, Federated announced that it had reached final settlements with the SEC and the NYAG with respect to those matters. As Federated previously reported in 2004, it has already paid approximately $8.0 million to certain funds as determined by an independent consultant. As part of these settlements, Federated agreed to pay for the benefit of fund shareholders additional disgorgement and a civil money penalty in the aggregate amount of an additional $72 million. Federated entities have also been named as defendants in several additional lawsuits that are now pending in the United States District Court for the Western District of Pennsylvania, alleging, among other things, excessive advisory and Rule 12b-1 fees. The Board of the Federated Funds retained the law firm of Dickstein Shapiro LLP to represent the Federated Funds in these lawsuits. Federated and the Federated Funds and their respective counsel have been defending this litigation, and none of the Federated Funds remains a defendant in any of the lawsuits (though some could potentially receive any recoveries as nominal defendants). Additional lawsuits based upon similar allegations may be filed in the future. The potential impact of these lawsuits, all of which seek unquantified damages, attorneys' fees and expenses, and future potential similar suits is uncertain. Although we do not believe that these lawsuits will have a Annual Shareholder Report31
material adverse effect on the Federated Funds, there can be no assurance that these suits, the ongoing adverse publicity and/or other developments resulting from the regulatory investigations will not result in increased Federated Fund redemptions, reduced sales of Federated Fund shares or other adverse consequences for the Federated Funds.12. Subsequent events
Management has evaluated subsequent events through December 24, 2009, the date the financial statements were issued, and determined that no events have occurred that require additional disclosure.
13. FEDERAL TAX INFORMATION (UNAUDITED)
For the fiscal year ended October 31, 2009, 100.0% of total ordinary income distributions made by the Fund are qualifying dividends which may be subject to a maximum tax rate of 15%, as provided for by the Jobs and Growth Tax Relief Act of 2003. Complete information is reported in conjunction with the reporting of your distributions on Form 1099-DIV.
Of the ordinary income distributions made by the Fund during the year ended October 31, 2009, 100.0% qualify for the dividend received deduction available to corporate shareholders.
Annual Shareholder Report32
Report of Independent Registered Public Accounting Firm
TO THE BOARD OF Trustees OF Federated Equity Funds AND SHAREHOLDERS OF Federated Kaufmann Large Cap Fund:
We have audited the accompanying statement of assets and liabilities of Federated Kaufmann Large Cap Fund (the “Fund”), one of the portfolios constituting Federated Equity Funds, including the portfolio of investments, as of October 31, 2009, and the related statement of operations for the year then ended, and the statement of changes in net assets and the financial highlights for each of the periods indicated therein. These financial statements and financial highlights are the responsibility of the Fund's management. Our responsibility is to express an opinion on these financial statements and financial highlights based on our audits.
We conducted our audits in accordance with standards of the Public Company Accounting Oversight Board (United States). Those standards require that we plan and perform the audit to obtain reasonable assurance about whether the financial statements and financial highlights are free of material misstatement. We were not engaged to perform an audit of the Fund's internal control over financial reporting. Our audits included consideration of internal control over financial reporting as a basis for designing audit procedures that are appropriate in the circumstances, but not for the purpose of expressing an opinion on the effectiveness of the Fund's internal control over financial reporting. Accordingly, we express no such opinion. An audit also includes examining, on a test basis, evidence supporting the amounts and disclosures in the financial statements and financial highlights, assessing the accounting principles used and significant estimates made by management, and evaluating the overall financial statement presentation. Our procedures included confirmation of securities owned as of October 31, 2009, by correspondence with the custodian and brokers. We believe that our audits provide a reasonable basis for our opinion.
In our opinion, the financial statements and financial highlights referred to above present fairly, in all material respects, the financial position of Federated Kaufmann Large Cap Fund, a portfolio of Federated Equity Funds, at October 31, 2009, the results of its operations for the year then ended, and its changes in net assets and the financial highlights for each of the periods indicated therein, in conformity with U.S. generally accepted accounting principles.
Boston, Massachusetts
December 24, 2009
Annual Shareholder Report33
Board of Trustees and Trust Officers
The Board is responsible for managing the Trust's business affairs and for exercising all the Trust's powers except those reserved for the shareholders. The following tables give information about each Board member and the senior officers of the Fund. Where required, the tables separately list Board members who are “interested persons” of the Fund (i.e., “Interested” Board members) and those who are not (i.e., “Independent” Board members). Unless otherwise noted, the address of each person listed is Federated Investors Tower, 1001 Liberty Avenue, Pittsburgh, PA 15222. The address of all Independent Board members listed is 4000 Ericsson Drive, Warrendale, PA 15086-7561; Attention: Mutual Fund Board. As of December 31, 2008, the Trust comprised 10 portfolios, and the Federated Fund Complex consisted of 40 investment companies (comprising 149 portfolios). Unless otherwise noted, each Officer is elected annually. Unless otherwise noted, each Board member oversees all portfolios in the Federated Fund Complex and serves for an indefinite term. The Fund's Statement of Additional Information includes additional information about Trust Trustees and is available, without charge and upon request, by calling 1-800-341-7400.
Interested TRUSTEES Background
Name
Birth Date
Positions Held with Trust
Date Service Began | Principal Occupation(s) for Past Five Years,
Other Directorships Held and Previous Position(s) |
John F. Donahue*
Birth Date: July 28, 1924
TRUSTEE
Began serving: April 1984 | Principal Occupations: Director or Trustee of the Federated Fund Complex; Chairman and Director, Federated Investors, Inc.; Chairman of the Federated Fund Complex's Executive Committee.
Previous Positions: Chairman of the Federated Fund Complex; Trustee, Federated Investment Management Company; Chairman and Director, Federated Investment Counseling. |
J. Christopher Donahue*
Birth Date: April 11, 1949
PRESIDENT AND TRUSTEE
Began serving: January 2000 | Principal Occupations: Principal Executive Officer and President of the Federated Fund Complex; Director or Trustee of some of the Funds in the Federated Fund Complex; President, Chief Executive Officer and Director, Federated Investors, Inc.; Chairman and Trustee, Federated Investment Management Company; Trustee, Federated Investment Counseling; Chairman and Director, Federated Global Investment Management Corp.; Chairman, Federated Equity Management Company of Pennsylvania and Passport Research, Ltd. (investment advisory subsidiary of Federated); Trustee, Federated Shareholder Services Company; Director, Federated Services Company.
Previous Positions: President, Federated Investment Counseling; President and Chief Executive Officer, Federated Investment Management Company, Federated Global Investment Management Corp. and Passport Research, Ltd. |
| * | Family relationships and reasons for “interested” status: John F. Donahue is the father of J. Christopher Donahue; both are “interested” due to their beneficial ownership of shares of Federated Investors, Inc. and the positions they hold with Federated and its subsidiaries. |
Annual Shareholder Report34
INDEPENDENT TRUSTEES Background
Name
Birth Date
Positions Held with Trust
Date Service Began | Principal Occupation(s) for Past Five Years,
Other Directorships Held and Previous Position(s) |
John T. Conroy, Jr., Ph.D.
Birth Date: June 23, 1937
TRUSTEE
Began serving: November 1991 | Principal Occupations: Director or Trustee of the Federated Fund Complex; Chairman of the Board, Investment Properties Corporation; Partner or Trustee in private real estate ventures in Southwest Florida; Assistant Professor in Theology, Blessed Edmund Rice School for Pastoral Ministry.
Previous Positions: President, Investment Properties Corporation; Senior Vice President, John R. Wood and Associates, Inc., Realtors; President, Naples Property Management, Inc. and Northgate Village Development Corporation. |
Nicholas P. Constantakis
Birth Date: September 3, 1939
TRUSTEE
Began serving: February 1998 | Principal Occupation: Director or Trustee of the Federated Fund Complex.
Other Directorship Held: Director and Chairman of the Audit Committee, Michael Baker Corporation (architecture, engineering and construction services).
Previous Position: Partner, Andersen Worldwide SC. |
John F. Cunningham
Birth Date: March 5, 1943
TRUSTEE
Began serving: January 1999 | Principal Occupation: Director or Trustee of the Federated Fund Complex.
Other Directorships Held: Chairman, President and Chief Executive Officer, Cunningham & Co., Inc. (strategic business consulting); Trustee Associate, Boston College.
Previous Positions: Director, Redgate Communications and EMC Corporation (computer storage systems); Chairman of the Board and Chief Executive Officer, Computer Consoles, Inc.; President and Chief Operating Officer, Wang Laboratories; Director, First National Bank of Boston; Director, Apollo Computer, Inc. |
Maureen Lally-Green
Birth Date: July 5, 1949
TRUSTEE
Began serving: August 2009 | Principal Occupations: Director or Trustee of the Federated Fund Complex; Director, Office of Church Relations, Diocese of Pittsburgh; Adjunct Professor of Law, Duquesne University School of Law.
Other Directorships Held: Director, Auberle; Trustee St. Francis University; Director, Ireland Institute of Pittsburgh; Director, UPMC Mercy Hospital; Regent, St. Vincent Seminary; Director, Epilepsy Foundation of Western and Central Pennsylvania; Director, Saint Thomas More Society, Allegheny County; Director, Carlow University.
Previous Position: Pennsylvania Superior Court Judge. |
Annual Shareholder Report35
Name
Birth Date
Positions Held with Trust
Date Service Began | Principal Occupation(s) for Past Five Years,
Other Directorships Held and Previous Position(s) |
Peter E. Madden
Birth Date: March 16, 1942
TRUSTEE
Began serving: November 1991 | Principal Occupation: Director or Trustee and Chairman of the Board of the Federated Fund Complex.
Other Directorship Held: Board of Overseers, Babson College.
Previous Positions: Representative, Commonwealth of Massachusetts General Court; President, Chief Operating Officer and Director, State Street Bank and Trust Company and State Street Corporation (retired); Director, VISA USA and VISA International; Chairman and Director, Massachusetts Bankers Association; Director, Depository Trust Corporation; Director, The Boston Stock Exchange. |
Charles F. Mansfield, Jr.
Birth Date: April 10, 1945
TRUSTEE
Began serving: January 1999 | Principal Occupations: Director or Trustee and Chairman of the Audit Committee of the Federated Fund Complex; Management Consultant.
Previous Positions: Chief Executive Officer, PBTC International Bank; Partner, Arthur Young & Company (now Ernst & Young LLP); Chief Financial Officer of Retail Banking Sector, Chase Manhattan Bank; Senior Vice President, HSBC Bank USA (formerly, Marine Midland Bank); Vice President, Citibank; Assistant Professor of Banking and Finance, Frank G. Zarb School of Business, Hofstra University; Executive Vice President DVC Group, Inc. (marketing, communications and technology). |
R. James Nicholson
Birth Date: February 4, 1938
TRUSTEE
Began serving: April 2008 | Principal Occupations: Director or Trustee of the Federated Fund Complex; Senior Counsel, Brownstein Hyatt Farber Schrek, P.C.; Former Secretary of the U.S. Dept. of Veterans Affairs; Former U.S. Ambassador to the Holy See; Former Chairman of the Republican National Committee.
Other Directorships Held: Director, Horatio Alger Association; Director, The Daniels Fund.
Previous Positions: Colonel, U.S. Army Reserve; Partner, Calkins, Kramer, Grimshaw and Harring, P.C.; General Counsel, Colorado Association of Housing and Building; Chairman and CEO, Nicholson Enterprises, Inc. (real estate holding company); Chairman and CEO, Renaissance Homes of Colorado. |
Thomas M. O'Neill
Birth Date: June 14, 1951
TRUSTEE
Began serving: October 2006 | Principal Occupations: Director or Trustee of the Federated Fund Complex; Managing Director and Partner, Navigator Management Company, L.P. (investment and strategic consulting).
Other Directorships Held: Board of Overseers, Children's Hospital of Boston; Visiting Committee on Athletics, Harvard College.
Previous Positions: Chief Executive Officer and President, Managing Director and Chief Investment Officer, Fleet Investment Advisors; President and Chief Executive Officer, Aeltus Investment Management, Inc.; General Partner, Hellman, Jordan Management Co., Boston, MA; Chief Investment Officer, The Putnam Companies, Boston, MA; Credit Analyst and Lending Officer, Fleet Bank; Director and Consultant, EZE Castle Software (investment order management software); Director, Midway Pacific (lumber). |
Annual Shareholder Report36
Name
Birth Date
Positions Held with Trust
Date Service Began | Principal Occupation(s) for Past Five Years,
Other Directorships Held and Previous Position(s) |
John S. Walsh
Birth Date: November 28, 1957
TRUSTEE
Began serving: January 1999 | Principal Occupations: Director or Trustee of the Federated Fund Complex; President and Director, Heat Wagon, Inc. (manufacturer of construction temporary heaters); President and Director, Manufacturers Products, Inc. (distributor of portable construction heaters); President, Portable Heater Parts, a division of Manufacturers Products, Inc.
Previous Position: Vice President, Walsh & Kelly, Inc. |
James F. Will
Birth Date: October 12, 1938
TRUSTEE
Began serving: April 2006 | Principal Occupations: Director or Trustee of the Federated Fund Complex; formerly, Vice Chancellor and President, Saint Vincent College.
Other Directorships Held: Trustee, Saint Vincent College; Alleghany Corporation.
Previous Positions: Chairman, President and Chief Executive Officer, Armco, Inc.; President and Chief Executive Officer, Cyclops Industries; President and Chief Operating Officer, Kaiser Steel Corporation. |
OFFICERS
Name
Birth Date
Address
Positions Held with Trust
Date Service Began | Principal Occupation(s) for Past Five Years
and Previous Position(s) |
John W. McGonigle
Birth Date: October 26, 1938
EXECUTIVE VICE PRESIDENT AND SECRETARY
Began serving: April 1984 | Principal Occupations: Executive Vice President and Secretary of the Federated Fund Complex; Vice Chairman, Executive Vice President, Secretary and Director, Federated Investors, Inc.
Previous Positions: Trustee, Federated Investment Management Company and Federated Investment Counseling; Director, Federated Global Investment Management Corp., Federated Services Company and Federated Securities Corp. |
Richard A. Novak
Birth Date: December 25, 1963
TREASURER
Began serving: January 2006 | Principal Occupations: Principal Financial Officer and Treasurer of the Federated Fund Complex; Senior Vice President, Federated Administrative Services; Financial and Operations Principal for Federated Securities Corp., Edgewood Services, Inc. and Southpointe Distribution Services, Inc.
Previous Positions: Controller of Federated Investors, Inc.; Vice President, Finance of Federated Services Company; held various financial management positions within The Mercy Hospital of Pittsburgh; Auditor, Arthur Andersen & Co. |
Richard B. Fisher
Birth Date: May 17, 1923
VICE PRESIDENT
Began serving: April 1984 | Principal Occupations: Vice Chairman or Vice President of some of the Funds in the Federated Fund Complex; Vice Chairman, Federated Investors, Inc.; Chairman, Federated Securities Corp.
Previous Positions: President and Director or Trustee of some of the Funds in the Federated Fund Complex; Executive Vice President, Federated Investors, Inc.; Director and Chief Executive Officer, Federated Securities Corp. |
Annual Shareholder Report37
Name
Birth Date
Address
Positions Held with Trust
Date Service Began | Principal Occupation(s) for Past Five Years
and Previous Position(s) |
Brian P. Bouda
Birth Date: February 28, 1947
CHIEF COMPLIANCE OFFICER AND SENIOR VICE PRESIDENT
Began serving: August 2004 | Principal Occupations: Senior Vice President and Chief Compliance Officer of the Federated Fund Complex; Vice President and Chief Compliance Officer of Federated Investors, Inc. and Chief Compliance Officer of its subsidiaries. Mr. Bouda joined Federated in 1999 and is a member of the American Bar Association and the State Bar Association of Wisconsin. |
Stephen F. Auth
Birth Date: September 3, 1956
450 Lexington Avenue
Suite 3700
New York, NY 10017-3943
CHIEF INVESTMENT OFFICER
Began serving: November 2002 | Principal Occupations: Mr. Auth is Chief Investment Officer of this Fund and various other Funds in the Federated Fund Complex; Executive Vice President, Federated Investment Counseling, Federated Global Investment Management Corp. and Federated Equity Management Company of Pennsylvania.
Previous Positions: Executive Vice President, Federated Investment Management Company, and Passport Research, Ltd. (investment advisory subsidiary of Federated); Senior Vice President, Global Portfolio Management Services Division; Senior Vice President, Federated Investment Management Company and Passport Research, Ltd.; Senior Managing Director and Portfolio Manager, Prudential Investments. |
Lawrence Auriana
Birth Date: January 8, 1944
140 East 45th Street
New York, NY 10017
VICE PRESIDENT
Began serving: November 2001 | Principal Occupations: Lawrence Auriana has been the Fund's Portfolio Manager since December 2007. He is Vice President of the Trust. Mr. Auriana joined Federated in April 2001 as Co-Head of Investments/Federated Kaufmann. From August 1984 to April 2001, Mr. Auriana was President and Treasurer of Edgemont Asset Management Corp., and Chairman of the Board and Portfolio Manager to The Kaufmann Fund, Inc. (predecessor to the Federated Kaufmann Fund). Mr. Auriana earned a B.S. in economics from Fordham University and has been engaged in the securities business since 1965. |
Walter C. Bean
Birth Date: June 22, 1945
VICE PRESIDENT
Began serving: November 2006 | Principal Occupations: Walter C. Bean is Vice President of the Trust. Mr. Bean is a Senior Vice President, Senior Portfolio Manager and the Head of the Equity Income Management Team of the Fund's Adviser. Mr. Bean joined Federated in 2000. His previous associations included: various investment management and research positions with C.S. McKee & Company; First Chicago Investment Advisors; CIGNA Investment Advisors; and Mellon Bank. Mr. Bean earned a Bachelors Degree in Business Administration from Ohio University and an M.B.A. from the Pennsylvania State University. Mr. Bean is a Chartered Financial Analyst and has 40 years of investment experience. |
Hans P. Utsch
Birth Date: July 3, 1936
VICE PRESIDENT
Began serving: November 2001 | Principal Occupations: Hans P. Utsch has been the Fund's Portfolio Manager since December 2007. He is Vice President of the Trust. Mr. Utsch joined Federated in April 2001 as Co-Head of Investments/Federated Kaufmann. From August 1984 to April 2001, Mr. Utsch was Chairman of the Board and Secretary of Edgemont Asset Management Corp., and President and Portfolio Manager to The Kaufmann Fund, Inc. (predecessor to the Federated Kaufmann Fund). Mr. Utsch graduated from Amherst College and holds an M.B.A. from Columbia University. He has been engaged in the securities business since 1962. |
Annual Shareholder Report38
Evaluation and Approval of Advisory Contract - May 2009
Federated Kaufmann Large Cap Fund (the “Fund”)
The Fund's Board reviewed the Fund's investment advisory and subadvisory contracts at meetings held in May 2009. The Board's decision regarding these contracts reflects the exercise of its business judgment on whether to continue the existing arrangements.
In this connection, the Federated funds' Board had previously appointed a Senior Officer, whose duties include specified responsibilities relating to the process by which advisory fees are to be charged to a Federated fund. The Senior Officer has the authority to retain consultants, experts, or staff as may be reasonably necessary to assist in the performance of his duties, reports directly to the Board, and may be terminated only with the approval of a majority of the independent members of the Board. The Senior Officer prepared and furnished to the Board an independent, written evaluation that covered topics discussed below. The Board considered that evaluation, along with other information, in deciding to approve the advisory and subadvisory contracts.
During its review of these contracts, the Board considered compensation and benefits received by the Adviser and subadviser. This included the fees received for services provided to the Fund by other entities in the Federated organization and research services received by the Adviser from brokers that execute Federated fund trades, as well as advisory fees. The Board is also familiar with and considered judicial decisions concerning allegedly excessive investment advisory fees, which have indicated that the following factors may be relevant to an Adviser's fiduciary duty with respect to its receipt of compensation from a fund: the nature and quality of the services provided by the Adviser, including the performance of the fund; the Adviser's cost of providing the services; the extent to which the Adviser may realize “economies of scale” as a fund grows larger; any indirect benefits that may accrue to the Adviser and its affiliates as a result of the Adviser's relationship with a fund; performance and expenses of comparable funds; and the extent to which the independent Board members are fully informed about all facts the Board deems relevant bearing on the Adviser's services and fees. The Board further considered management fees (including any components thereof) charged to institutional and other clients of the Adviser and subadviser for what might be viewed as like services, and the cost to the Adviser and its affiliates of supplying services pursuant to the management fee agreements, excluding any intra-corporate profit and profit margins of the Adviser and its affiliates for supplying such services. The Board was aware of these factors and was guided by them in its review of the Fund's advisory and subadvisory contracts to the extent it considered them to be appropriate and relevant, as discussed further below.
Annual Shareholder Report39
The Board considered and weighed these circumstances in light of its substantial accumulated experience in governing the Fund and working with Federated on matters relating to the Federated funds, and was assisted in its deliberations by independent legal counsel. Throughout the year, the Board has requested and received substantial and detailed information about the Fund and the Federated organization that was in addition to the extensive materials that comprise and accompany the Senior Officer's evaluation. Federated provided much of this information at each regular meeting of the Board, and furnished additional reports in connection with the particular meeting at which the Board's formal review of the advisory and subadvisory contracts occurred. Between regularly scheduled meetings, the Board also received information on particular matters as the need arose. Thus, the Board's consideration of the advisory and subadvisory contracts included review of the Senior Officer's evaluation, accompanying data and additional reports covering such matters as: the Adviser's and subadviser's investment philosophy, revenue, profitability, personnel and processes; investment and operating strategies; the Fund's short- and long-term performance (in absolute terms, both on a gross basis and net of expenses, as well as in relationship to its particular investment program and certain competitor or “peer group” funds and/or other benchmarks, as appropriate), and comments on the reasons for performance; the Fund's investment objectives; the Fund's expenses (including the advisory fee itself and the overall expense structure of the Fund, both in absolute terms and relative to similar and/or competing funds, with due regard for contractual or voluntary expense limitations); the use and allocation of brokerage commissions derived from trading the Fund's portfolio securities (if any); and the nature, quality and extent of the advisory and other services provided to the Fund by the Adviser and its affiliates. The Board also considered the preferences and expectations of Fund shareholders and their relative sophistication; the continuing state of competition in the mutual fund industry and market practices; the range of comparable fees for similar funds in the mutual fund industry; the Fund's relationship to the Federated family of funds which include a comprehensive array of funds with different investment objectives, policies and strategies which are available for exchange without the incurrence of additional sales charges; compliance and audit reports concerning the Federated funds and the Federated companies that service them (including communications from regulatory agencies), as well as Federated's responses to any issues raised therein; and relevant developments in the mutual fund industry and how the Federated funds and/or Federated are responding to them. The Board's evaluation process is evolutionary. The criteria considered and the emphasis placed on relevant criteria change in recognition of changing circumstances in the mutual fund marketplace. Annual Shareholder Report40
With respect to the Fund's performance and expenses in particular, the Board has found the use of comparisons to other mutual funds with comparable investment programs to be particularly useful, given the high degree of competition in the mutual fund business. The Board focused on comparisons with other similar mutual funds more heavily than non-mutual fund products or services because, it is believed that, they are more relevant. For example, other mutual funds are the products most like the Fund, they are readily available to Fund shareholders as alternative investment vehicles, and they are the type of investment vehicle in fact chosen and maintained by the Fund's investors. The range of their fees and expenses therefore appears to be a generally reliable indication of what consumers have found to be reasonable in the precise marketplace in which the Fund competes. The Fund's ability to deliver competitive performance when compared to its peer group was a useful indicator of how the Adviser is executing the Fund's investment program, which in turn assisted the Board in reaching a conclusion that the nature, extent, and quality of the Adviser's investment management services were such as to warrant continuation of the advisory contract. In this regard, the Senior Officer has reviewed Federated's fees for providing advisory services to products outside the Federated family of funds (e.g., institutional and separate accounts). He concluded that mutual funds and institutional accounts are inherently different products. Those differences include, but are not limited to, different types of targeted investors; being subject to different laws and regulations; different legal structures; different average account sizes; different associated costs; different portfolio management techniques made necessary by different cash flows; and portfolio manager time spent in review of securities pricing. The Senior Officer did not consider these fee schedules to be determinative in judging the appropriateness of mutual fund advisory contracts.The Senior Officer reviewed reports compiled by Federated, using data supplied by independent fund ranking organizations, regarding the performance of, and fees charged by, other mutual funds, noting his view that comparisons to fund peer groups are highly important in judging the reasonableness of proposed fees.
For the one-year period covered by the report, the Fund's performance was above the median of the relevant peer group.
The Board also received financial information about Federated, including reports on the compensation and benefits Federated derived from its relationships with the Federated funds. These reports covered not only the fees under the advisory contracts, but also fees received by Federated's subsidiaries for providing other services to the Federated funds under separate contracts (e.g., for serving as the Federated funds' administrator). The reports also discussed any indirect benefit Federated may derive from its receipt of research services from brokers who execute Federated fund trades. In addition, the Board considered the fact that, in order for a fund to be competitive in the marketplace, Federated and its affiliates frequently waived fees and/or Annual Shareholder Report41
reimbursed expenses and have disclosed to fund investors and/or indicated to the Board their intention to do so in the future, where appropriate. Moreover, the Board receives regular reports regarding the institution or elimination of these voluntary waivers.Federated furnished reports, requested by the Senior Officer, that reported revenues on a fund-by-fund basis and made estimates of the allocation of expenses on a fund-by-fund basis, using allocation methodologies specified by the Senior Officer. The Senior Officer noted that, although they may apply consistent allocation processes, the inherent difficulties in allocating costs (and the unavoidable arbitrary aspects of that exercise) and the lack of consensus on how to allocate those costs may render such allocation reports unreliable. The allocation reports were considered in the analysis by the Board but were determined to be of limited use.
The Board and the Senior Officer also reviewed a report compiled by Federated comparing profitability information for Federated to other publicly held fund management companies. In this regard, the Senior Officer noted the limited availability of such information, but nonetheless concluded that Federated's profit margins did not appear to be excessive and the Board agreed.
The Senior Officer's evaluation also discussed the notion of possible realization of “economies of scale” as a fund grows larger. The Board considered in this regard that the Adviser has made significant and long-term investments in areas that support all of the Federated funds, such as personnel and processes for the portfolio management, compliance, and risk management functions; and systems technology; and that the benefits of these efforts (as well as any economies, should they exist) were likely to be enjoyed by the fund complex as a whole. Finally, the Board also noted the absence of any applicable regulatory or industry guidelines on this subject, which (as discussed in the Senior Officer's evaluation) is compounded by the lack of any common industry practice or general pattern with respect to structuring fund advisory fees with “breakpoints” that serve to reduce the fee as the fund attains a certain size. The Senior Officer did not recommend institution of breakpoints in pricing Federated's fund advisory services at this time.
It was noted in the materials for the Board meeting that for the period covered by the report, the Fund's investment advisory fee was waived in its entirety. The Board reviewed the contractual fee rate and other expenses of the Fund with the Adviser and was satisfied that the overall expense structure of the Fund remained competitive.
The Senior Officer's evaluation noted his belief that the information and observations contained in his evaluation supported a finding that the proposed management fees are reasonable, and that Federated appeared to provide appropriate administrative services to the Fund for the fees paid. Under these Annual Shareholder Report42
circumstances, no changes were recommended to, and no objection was raised to, the continuation of the Fund's advisory and subadvisory contracts. The Board concluded that the nature, quality and scope of services provided the Fund by the Adviser and its affiliates were satisfactory.In its decision to continue an existing investment advisory contract, the Board was mindful of the potential disruptions of the Fund's operations and various risks, uncertainties and other effects that could occur as a result of a decision to terminate or not renew an advisory contract. In particular, the Board recognized that many shareholders have invested in the Fund on the strength of the Adviser's industry standing and reputation and with the expectation that the Adviser will have a continuing role in providing advisory services to the Fund. Thus, the Board's approval of the advisory contract reflected the fact that it is the shareholders who have effectively selected the Adviser by virtue of having invested in the Fund.
The Board based its decision to approve the advisory and subadvisory contracts on the totality of the circumstances and relevant factors and with a view to past and future long-term considerations. Not all of the factors and considerations identified above were necessarily relevant to the Fund, nor did the Board consider any one of them to be determinative. With respect to the factors that were relevant, the Board's decision to approve the contract reflects its determination that Federated's performance and actions provided a satisfactory basis to support the decision to continue the existing arrangements.
Annual Shareholder Report43
Voting Proxies on Fund Portfolio Securities
A description of the policies and procedures that the Fund uses to determine how to vote proxies, if any, relating to securities held in the Fund's portfolio is available, without charge and upon request, by calling 1-800-341-7400. A report on “Form N-PX” of how the Fund voted any such proxies during the most recent 12-month period ended June 30 is available from Federated's Web site at FederatedInvestors.com. To access this information from the “Products” section of the Web site, click on the “Prospectuses and Regulatory Reports” link under “Related Information,” then select the appropriate link opposite the name of the Fund; or select the name of the Fund and from the Fund's page, click on the “Prospectuses and Regulatory Reports” link. Form N-PX filings are also available at the SEC's Web site at www.sec.gov.
Quarterly Portfolio Schedule
The Fund files with the SEC a complete schedule of its portfolio holdings, as of the close of the first and third quarters of its fiscal year, on “Form N-Q.” These filings are available on the SEC's Web site at www.sec.gov and may be reviewed and copied at the SEC's Public Reference Room in Washington, DC. (Call 1-800-SEC-0330 for information on the operation of the Public Reference Room.) You may also access this information from the “Products” section of Federated's Web site at FederatedInvestors.com by clicking on “Portfolio Holdings” under “Related Information,” then selecting the appropriate link opposite the name of the Fund; or select the name of the Fund and from the Fund's page, click on the “Portfolio Holdings” link.
Annual Shareholder Report44
Mutual funds are not bank deposits or obligations, are not guaranteed by any bank and are not insured or guaranteed by the U.S. government, the Federal Deposit Insurance Corporation, the Federal Reserve Board or any other government agency. Investment in mutual funds involves investment risk, including the possible loss of principal.
This Report is authorized for distribution to prospective investors only when preceded or accompanied by the Fund's Prospectus, which contains facts concerning its objective and policies, management fees, expenses and other information.
Federated Kaufmann Large Cap Fund
Federated Investors Funds
4000 Ericsson Drive
Warrendale, PA 15086-7561
Contact us at FederatedInvestors.com
or call 1-800-341-7400.
Federated Securities Corp., Distributor
Cusip 314172446
Cusip 314172438
Cusip 314172420
39667 (12/09)
Federated is a registered mark of Federated Investors, Inc.
2009 Federated Investors, Inc.
Federated Kaufmann Large Cap Fund
A Portfolio of Federated Equity Funds
ANNUAL SHAREHOLDER REPORTOctober 31, 2009
Institutional Shares
FINANCIAL HIGHLIGHTS
SHAREHOLDER EXPENSE EXAMPLE
MANAGEMENT'S DISCUSSION OF FUND PERFORMANCE
PORTFOLIO OF INVESTMENTS SUMMARY TABLE
PORTFOLIO OF INVESTMENTS
STATEMENT OF ASSETS AND LIABILITIES
STATEMENT OF OPERATIONS
STATEMENT OF CHANGES IN NET ASSETS
NOTES TO FINANCIAL STATEMENTS
REPORT OF INDEPENDENT REGISTERED PUBLIC ACCOUNTING FIRM
BOARD OF TRUSTEES AND TRUST OFFICERS
EVALUATION AND APPROVAL OF ADVISORY CONTRACT
VOTING PROXIES ON FUND PORTFOLIO SECURITIES
QUARTERLY PORTFOLIO SCHEDULE
Financial Highlights - Institutional Shares
(For a Share Outstanding Throughout Each Period)
| Year
Ended
10/31/2009 | Period
Ended
10/31/20081 |
| Net Asset Value, Beginning of Period | $6.90 | $10.00 |
| Income From Investment Operations: | | |
| Net investment income | 0.072 | 0.052 |
| Net realized and unrealized gain (loss) on investments and foreign currency transactions | 1.79 | (3.15) |
| TOTAL FROM INVESTMENT OPERATIONS | 1.86 | (3.10) |
| Less Distributions: | | |
| Distributions from net investment income | (0.03) | — |
| Net Asset Value, End of Period | $8.73 | $6.90 |
| Total Return3 | 27.13% | (31.00)% |
| Ratios to Average Net Assets: | | |
| Net expenses | 1.25%4 | 1.25%5 |
| Net investment income | 0.95% | 0.62%5 |
| Expense waiver/reimbursement6 | 1.18% | 1.88%5 |
| Supplemental Data: | | |
| Net assets, end of period (000 omitted) | $15,931 | $2,446 |
| Portfolio turnover | 170% | 70% |
| 1 | Reflects operations for the period from December 5, 2007 (date of initial investment) to October 31, 2008. |
| 2 | Per share numbers have been calculated using the average shares method. |
| 3 | Based on net asset value, which does not reflect the sales charge, redemption fee or contingent deferred sales charge, if applicable. Total returns for periods of less than one year are not annualized. |
| 4 | The net expense ratio is calculated without reduction for expense offset arrangements. The net expense ratio is 1.25% for the year ended October 31, 2009 after taking into account this expense reduction. |
| 5 | Computed on an annualized basis. |
| 6 | This expense decrease is reflected in both the net expense and the net investment income ratios shown above. |
- See Notes which are an integral part of the Financial Statements
Annual Shareholder Report1
Shareholder Expense Example (unaudited)
As a shareholder of the Fund, you incur ongoing costs, including management fees and to the extent applicable, distribution (12b-1) fees and/or shareholder services fees and other Fund expenses. This Example is intended to help you to understand your ongoing costs (in dollars) of investing in the Fund and to compare these costs with the ongoing costs of investing in other mutual funds. It is based on an investment of $1,000 invested at the beginning of the period and held for the entire period from May 1, 2009 to October 31, 2009.
ACTUAL EXPENSES
The first section of the table below provides information about actual account values and actual expenses. You may use the information in this section, together with the amount you invested, to estimate the expenses that you incurred over the period. Simply divide your account value by $1,000 (for example, an $8,600 account value divided by $1,000 = 8.6), then multiply the result by the number in the first section under the heading entitled “Expenses Paid During Period” to estimate the expenses attributable to your investment during this period.
HYPOTHETICAL EXAMPLE FOR COMPARISON PURPOSES
The second section of the table below provides information about hypothetical account values and hypothetical expenses based on the Fund's actual expense ratio and an assumed rate of return of 5% per year before expenses, which is not the Fund's actual return. Thus, you should not use the hypothetical account values and expenses to estimate the actual ending account balance or your expenses for the period. Rather, these figures are required to be provided to enable you to compare the ongoing costs of investing in the Fund with other funds. To do so, compare this 5% hypothetical example with the 5% hypothetical examples that appear in the shareholder reports of the other funds.
Annual Shareholder Report2
Please note that the expenses shown in the table are meant to highlight your ongoing costs only. Therefore, the second section of the table is useful in comparing ongoing costs only, and will not help you determine the relative total costs of owning different funds. | Beginning
Account Value
5/1/2009 | Ending
Account Value
10/31/2009 | Expenses Paid
During Period1 |
| Actual | $1,000 | $1,217.60 | $6.99 |
Hypothetical (assuming a 5% return
before expenses) | $1,000 | $1,018.90 | $6.36 |
| 1 | Expenses are equal to the Fund's annualized net expense ratio of 1.25%, multiplied by the average account value over the period, multiplied by 184/365 (to reflect the one-half-year period). |
Annual Shareholder Report3
Performance data quoted represents past performance which is no guarantee of future results. Investment return and principal value will fluctuate so that an investor's shares, when redeemed, may be worth more or less than their original cost. Mutual fund performance changes over time and current performance may be lower or higher than what is stated. For current to the most recent month-end performance and after-tax returns, visit FederatedInvestors.com or call 1-800-341-7400.
Management's Discussion of Fund Performance (unaudited)
Federated Kaufmann Large Cap Fund's Institutional Shares produced a total return of 27.13% based on net asset value for the reporting period ended October 31, 2009. The Fund's benchmark, the Russell 1000 Growth Index (R1000G)1 had a total return of 17.51% for the reporting period and the Lipper Large Cap Growth Funds Index (LLCGFI)2 had a total return of 16.91%. The Fund's total return for the reporting period reflected actual cash flows, transaction costs and other expenses which were not reflected in the total return of the R1000G.
MARKET OVERVIEW
The stock market as a whole posted strong positive returns during the latter portion of the reporting period. The global financial crisis continued throughout the period but in March the Standard & Poor's 500 Index (S&P 500)3 bottomed and began a 50% plus rally. Mid-cap stocks performed best during the period followed by large-cap stocks and then small-cap stocks. In terms of style, growth stocks outperformed value stocks across large-, mid- and small-cap stock groupings.
The reporting period began with economies across the world slowing as credit contracted. In response to the credit crisis, the Federal Reserve, as well as many other countries, cut their discount and federal funds target rates several times at the beginning of the reporting period and maintained them at their lowest levels. The end of the reporting period was marked by a light at the end of the tunnel with some positive economic data on housing, productivity, corporate profits and trade finally appearing.
The strongest sectors in the R1000G during the period were Information Technology (+31%), Consumer Discretionary (+25%) and Materials (+21%). The weakest sectors were Health Care (+8%), Utilities (+9%) and Industrials (+9%).
| 1 | The R1000G measures the performance of those Russell 1000 companies with higher price-to-book ratios and higher forecasted growth values. Investments cannot be made directly in an index. |
| 2 | The LLCGFI represents the composite performance of the 30 largest funds by assets in the Lipper Large Cap Growth Fund Category. The Index is not adjusted to reflect any sales charges. Investments cannot be made in an index. |
| 3 | The S&P 500 Index is an unmanaged capitalization-weighted index of 500 stocks designed to measure performance of the broad domestic economy through changes in the aggregate market value of 500 stocks representing all major industries. Investments cannot be made directly in an index. |
Annual Shareholder Report4
FUND PERFORMANCE
The Fund outperformed its respective peer average and benchmark index over the reporting period. The Fund's performance was driven primarily by bottom-up stock selection. Five of the Fund's top 10 contributing companies across multiple sectors each returned over 60% during the reporting period. Specifically Housing Development Finance (+114%), Ingersol-Rand (+114%), Schering Plough Corp. (+99%), Cummins Engine Inc. (+71%) and Precision Castparts. (+60%) all contributed strongly to performance. In addition, Lennar Corp. (+40%), Bharti Airtel Ltd. (+56%), Goldman Sachs (+49%), Best Buy (+45%) and Anheiser-Busch Inbev (+35%) were among the Fund's top 10 contributing companies.
The sectors that underperformed were Energy, Financials, Industrials, Information Technology and Materials. Six of the Fund's most laggard companies were in these sectors: Wells Fargo (-16%); Southwest Airlines (-25%); Delta Airlines (-33%); MEMC Electronics (-32%); General Electric (-15%); and Cemex (-30%), each detracted from performance. Additional laggards included: iShares Russell 1000 Growth Index (-14%); Merck & Co. (-26%); and Abbott Labs (-13%). While it is interesting to know how specific stocks performed during the reporting period, the success of these holdings will not be known until they are sold, typically over longer periods.
The sector exposures that resulted from the bottom-up investment process may provide some additional insight into the relative performance of the Fund. The Fund's underweight in Information Technology and the Fund's overweight in the Industrials and Materials sectors relative to the benchmark negatively affected performance. The Fund's performance was negatively impacted by the Fund's high cash position which ranged as high as 20.7% (5.9% average) during the reporting period.
Annual Shareholder Report5
GROWTH OF A $10,000 INVESTMENT - INSTITUTIONAL SHARES
The graph below illustrates the hypothetical investment of $10,0001 in Federated Kaufmann Large Cap Fund (Institutional Shares) (the “Fund”) from December 5, 2007 (start of performance) to October 31, 2009 compared to the Russell 1000 Growth Index (R1000G)2 and the Lipper Large Cap Growth Funds Index (LLCGFI).2
| Average Annual Total Returns for the Period Ended 10/31/2009 | |
| 1 Year | 27.13% |
| Start of Performance (12/5/2007) | -6.64% |
Performance data quoted represents past performance which is no guarantee of future results. Investment return and principal value will fluctuate so that an investor's shares, when redeemed, may be worth more or less than their original cost. Mutual fund performance changes over time and current performance may be lower or higher than what is stated. For current to the most recent month-end performance and after-tax returns, visit FederatedInvestors.com or call 1-800-341-7400. Returns shown do not reflect the deduction of taxes that a shareholder would pay on fund distributions or the redemption of fund shares. Mutual funds are not obligations of or guaranteed by any bank and are not federally insured.
| 1 | The Fund's performance assumes the reinvestment of all dividends and distributions. The R1000G and the LLCGFI have been adjusted to reflect reinvestment of dividends on securities in the R1000G and the funds in the LLCGFI. |
| 2 | The R1000G and the LLCGFI are not adjusted to reflect expenses or other fees that the Securities and Exchange Commission requires to be reflected in the Fund's performance. The LLCGFI represents the composite performance of the 30 largest funds by assets in the Lipper Large Cap Growth Fund category, and is not adjusted to reflect any sales charges. The R1000G and LLCGFI are unmanaged and unlike the Fund, are not affected by cashflows. It is not possible to invest directly in an index. |
Annual Shareholder Report6
Portfolio of Investments Summary Table (unaudited)
At October 31, 2009, the Fund's sector composition1 was as follows:
| Sector Composition | Percentage of
Total Net Assets |
| Financials | 21.4% |
| Industrials | 20.5% |
| Information Technology | 17.3% |
| Consumer Discretionary | 12.8% |
| Materials | 9.4% |
| Health Care | 5.2% |
| Consumer Staples | 2.8% |
| Energy | 2.7% |
| Telecommunication Services | 2.1% |
| Utilities | 1.1% |
| Cash Equivalents2 | 0.6% |
| Other Assets and Liabilities — Net3 | 4.1% |
| Total | 100.0% |
| 1 | Except for Cash Equivalents and Other Assets and Liabilities, sector classifications are based upon, and individual portfolio securities are assigned to, the classifications of the Global Industry Classification Standard (GICS) except that the adviser assigns a classification to securities not classified by the GICS and to securities for which the adviser does not have access to the classification made by the GICS. |
| 2 | Cash Equivalents include any investments in money market mutual funds and/or overnight repurchase agreements. |
| 3 | Assets, other than investments in securities, less liabilities. See Statement of Assets and Liabilities. |
Annual Shareholder Report7
Portfolio of Investments
October 31, 2009
|
| Principal Amount or Shares | | | Value |
| | Common Stocks – 90.9% | |
| | Consumer Discretionary – 10.9% | |
| 60,250 | | Best Buy Co., Inc. | 2,300,345 |
| 42,100 | 1 | Kohl's Corp. | 2,408,962 |
| 309,800 | | Lennar Corp., Class A | 3,903,480 |
| 63,300 | | TJX Cos., Inc. | 2,364,255 |
| 750,000 | 1 | Wynn Macau Ltd. | 967,717 |
| | TOTAL | 11,944,759 |
| | Consumer Staples – 2.8% | |
| 64,900 | | Anheuser-Busch InBev NV | 3,050,034 |
| | Energy – 2.7% | |
| 119,100 | | Chesapeake Energy Corp. | 2,917,950 |
| | Financials – 21.4% | |
| 69,800 | | American Express Co. | 2,431,832 |
| 450,400 | 1 | CETIP SA | 3,016,985 |
| 16,000 | | Goldman Sachs Group, Inc. | 2,722,720 |
| 62,500 | | Housing Development Finance Corp. Ltd. | 3,452,481 |
| 46,600 | | ICICI Bank Ltd., ADR | 1,465,570 |
| 89,242 | | J.P. Morgan Chase & Co. | 3,727,638 |
| 87,100 | | Morgan Stanley | 2,797,652 |
| 136,460 | | Wells Fargo & Co. | 3,755,379 |
| | TOTAL | 23,370,257 |
| | Health Care – 5.2% | |
| 47,000 | | Baxter International, Inc. | 2,540,820 |
| 145,300 | | Bristol-Myers Squibb Co. | 3,167,540 |
| | TOTAL | 5,708,360 |
| | Industrials – 20.5% | |
| 45,600 | | C.H. Robinson Worldwide, Inc. | 2,513,016 |
| 62,650 | | Cummins, Inc. | 2,697,709 |
| 43,900 | | FedEx Corp. | 3,191,091 |
| 31,450 | | Kuehne & Nagel International AG | 2,846,574 |
| 35,200 | | Precision Castparts Corp. | 3,362,656 |
| 61,900 | 1 | Ryanair Holdings PLC, ADR | 1,688,013 |
| 233,100 | | Southwest Airlines Co. | 1,958,040 |
| 149,000 | 1 | Verisk Analytics, Inc. | 4,087,070 |
| | TOTAL | 22,344,169 |
Annual Shareholder Report8
|
| | Information Technology – 17.3% | |
| 14,200 | 1 | Apple, Inc. | 2,676,700 |
| 336,600 | 1 | Cia Brasileira de Meios de Pagamentos | 3,085,882 |
| 115,600 | 1 | Cisco Systems, Inc. | 2,641,460 |
| 105,300 | 1 | MEMC Electronic Materials, Inc. | 1,307,826 |
| 5,600 | | Nintendo Corp. Ltd. | 1,428,005 |
| 123,400 | 1 | Oracle Corp. | 2,603,740 |
| 165,400 | 1 | Redecard SA | 2,455,274 |
| 152,600 | 1 | Symantec Corp. | 2,682,708 |
| | TOTAL | 18,881,595 |
| | Materials – 8.0% | |
| 87,000 | | Barrick Gold Corp. | 3,125,910 |
| 268,000 | | Cemex S.A. de C.V., ADR | 2,781,840 |
| 64,200 | | Ecolab, Inc. | 2,822,232 |
| | TOTAL | 8,729,982 |
| | Telecommunication Services – 2.1% | |
| 51,950 | 1 | America Movil S.A.B. de C.V., Class L, ADR | 2,292,554 |
| | TOTAL COMMON STOCKS
(IDENTIFIED COST $93,201,842) | 99,239,660 |
| | Corporate Bond – 1.9% | |
| | Consumer Discretionary – 1.9% | |
| $2,743,000 | | Central European Media Enterprises Ltd., Conv. Bond, 3.50%, 3/15/2013
(IDENTIFIED COST $1,412,645) | 2,116,247 |
| | Corporate Note – 1.4% | |
| | Materials – 1.4% | |
| 1,240,000 | | Newmont Mining Corp., Conv. Note, 3.00%, 2/15/2012
(IDENTIFIED COST $1,240,000) | 1,485,346 |
| | Preferred Stock – 1.1% | |
| | Utilities – 1.1% | |
| 25,500 | 1 | FPL Group, Inc., Pfd.
(IDENTIFIED COST $1,255,875) | 1,243,125 |
| | Mutual Fund – 0.6% | |
| 599,268 | 2,3 | Prime Value Obligations Fund, Institutional Shares, 0.22%
(AT NET ASSET VALUE) | 599,268 |
| | TOTAL INVESTMENTS-95.9%
(IDENTIFIED COST $97,709,630)4 | 104,683,646 |
| | OTHER ASSETS AND LIABILITIES - NET — 4.1%5 | 4,502,530 |
| | TOTAL NET ASSETS — 100% | $109,186,176 |
Annual Shareholder Report9
- At October 31, 2009, the Fund had outstanding foreign exchange contracts as follows:
| Settlement Date | Foreign
Currency
Units to
Receive | In
Exchange
For | Unrealized
Appreciation |
| Contracts Sold: | | | |
| 11/2/2009 | 103,360 Euros | $153,024 | $915 |
- Unrealized Appreciation on Foreign Exchange Contracts is included in “Other Assets and Liabilities — Net.”
- Note: The categories of investments are shown as a percentage of total net assets at October 31, 2009.
- Various inputs are used in determining the value of the Fund's investments. These inputs are summarized in the three broad levels listed below:
- Level 1 — quoted prices in active markets for identical securities
- Level 2 — other significant observable inputs (including quoted prices for similar securities, interest rates, prepayment speeds, credit risk, etc.)
- Level 3 — significant unobservable inputs (including the Fund's own assumptions in determining the fair value of investments)
- The inputs or methodology used for valuing securities are not an indication of the risk associated with investing in those securities.
Annual Shareholder Report10
- The following is a summary of the inputs used, as of October 31, 2009, in valuing the Fund's assets carried at fair value:
| Valuation Inputs | | | | |
| Level 1 -
Quoted
Prices and
Investments in
Mutual Funds | Level 2 -
Other
Significant
Observable
Inputs | Level 3 -
Significant
Unobservable
Inputs | Total |
| Equity Securities: | | | | |
| Domestic | $68,825,947 | $ — | $ — | $68,825,947 |
| International | 24,332,224 | 7,324,614 | — | 31,656,838 |
| Debt Securities: | | | | |
| Corporate Bond | — | 2,116,247 | — | 2,116,247 |
| Corporate Note | — | 1,485,346 | — | 1,485,346 |
| Mutual Fund | 599,268 | — | — | 599,268 |
| TOTAL SECURITIES | $93,757,439 | $10,926,207 | $ — | $104,683,646 |
| OTHER FINANCIAL INSTRUMENTS* | $915 | $ — | $ — | $915 |
| * | Other financial instruments include foreign exchange contracts. |
- The following acronym is used throughout this portfolio:
- ADR — American Depositary Receipt
- See Notes which are an integral part of the Financial Statements
Annual Shareholder Report11
Statement of Assets and Liabilities
October 31, 2009
| Assets: | | |
| Total investments in securities, at value including $599,268 of investments in an affiliated issuer (Note 5) (identified cost $97,709,630) | | $104,683,646 |
| Income receivable | | 128,235 |
| Receivable for investments sold | | 4,220,368 |
| Receivable for shares sold | | 944,335 |
| Receivable for foreign exchange contracts | | 915 |
| TOTAL ASSETS | | 109,977,499 |
| Liabilities: | | |
| Payable for shares redeemed | $345,645 | |
| Payable for capital gains taxes withheld | 278,118 | |
| Payable for auditing fees | 36,600 | |
| Payable for portfolio accounting fees | 35,791 | |
| Payable for distribution services fee (Note 5) | 21,857 | |
| Payable for shareholder services fee (Note 5) | 41,286 | |
| Accrued expenses | 32,026 | |
| TOTAL LIABILITIES | | 791,323 |
| Net assets for 12,593,501 shares outstanding | | $109,186,176 |
| Net Assets Consist of: | | |
| Paid-in capital | | $112,246,921 |
| Net unrealized appreciation of investments and translation of assets and liabilities in foreign currency | | 6,974,123 |
| Accumulated net realized loss on investments and foreign currency transactions | | (10,049,497) |
| Undistributed net investment income | | 14,629 |
| TOTAL NET ASSETS | | $109,186,176 |
Annual Shareholder Report12
Statement of Assets and Liabilities — continued| Net Asset Value, Offering Price and Redemption Proceeds Per Share | | |
| Institutional Shares: | | |
| Net asset value per share ($15,930,779 ÷ 1,825,682 shares outstanding), no par value, unlimited shares authorized | | $8.73 |
| Offering price per share | | $8.73 |
| Redemption proceeds per share | | $8.73 |
| Class A Shares: | | |
| Net asset value per share ($60,202,536 ÷ 6,925,574 shares outstanding), no par value, unlimited shares authorized | | $8.69 |
| Offering price per share (100/94.50 of $8.69) | | $9.20 |
| Redemption proceeds per share | | $8.69 |
| Class C Shares: | | |
| Net asset value per share ($32,720,582 ÷ 3,803,722 shares outstanding), no par value, unlimited shares authorized | | $8.60 |
| Offering price per share | | $8.60 |
| Redemption proceeds per share (99.00/100 of $8.60) | | $8.51 |
| Class K Shares: | | |
| Net asset value per share ($332,279 ÷ 38,523 shares outstanding), no par value, unlimited shares authorized | | $8.63 |
| Offering price per share | | $8.63 |
| Redemption proceeds per share | | $8.63 |
- See Notes which are an integral part of the Financial Statements
Annual Shareholder Report13
Statement of Operations
Year Ended October 31, 2009
| Investment Income: | | | |
| Dividends (including $42,794 received from an affiliated issuer (Note 5) and net of foreign taxes withheld of $3,133) | | | $1,240,680 |
| Interest | | | 290,771 |
| TOTAL INCOME | | | 1,531,451 |
| Expenses: | | | |
| Investment adviser fee (Note 5) | | $1,000,714 | |
| Administrative personnel and services fee (Note 5) | | 270,000 | |
| Custodian fees | | 25,646 | |
| Transfer and dividend disbursing agent fees and expenses �� Institutional Shares | | 12,635 | |
| Transfer and dividend disbursing agent fees and expenses — Class A Shares | | 76,368 | |
| Transfer and dividend disbursing agent fees and expenses — Class C Shares | | 43,889 | |
| Transfer and dividend disbursing agent fees and expenses — Class K Shares | | 394 | |
| Directors'/Trustees' fees | | 1,591 | |
| Auditing fees | | 52,000 | |
| Legal fees | | 7,752 | |
| Portfolio accounting fees | | 103,963 | |
| Distribution services fee — Class C Shares (Note 5) | | 171,562 | |
| Distribution services fee — Class K Shares (Note 5) | | 540 | |
| Shareholder services fee — Class A Shares (Note 5) | | 93,536 | |
| Shareholder services fee — Class C Shares (Note 5) | | 57,188 | |
| Share registration costs | | 104,737 | |
| Printing and postage | | 43,479 | |
| Insurance premiums | | 1,957 | |
| Miscellaneous | | 9,886 | |
| TOTAL EXPENSES | | 2,077,837 | |
Annual Shareholder Report14
Statement of Operations — continued| Waivers, Reimbursements and Reduction: | | | |
| Waiver/reimbursement of investment adviser fee (Note 5) | $(775,461) | | |
| Waiver of administrative personnel and services fee (Note 5) | (54,296) | | |
| Waiver of distribution services fee — Class C Shares (Note 5) | (10) | | |
| Waiver of distribution services fee — Class K Shares (Note 5) | (63) | | |
| Reimbursement of shareholder services fee — Class A Shares (Note 5) | (185) | | |
| Reimbursement of transfer and dividend disbursing agent fees and expenses — Class A Shares (Note 5) | (28,507) | | |
| Reimbursement of transfer and dividend disbursing agent fees and expenses — Institutional Shares (Note 5) | (651) | | |
| Fees paid indirectly from directed brokerage arrangements (Note 6) | (3,187) | | |
| TOTAL WAIVERS, REIMBURSEMENTS AND REDUCTION | | $(862,360) | |
| Net expenses | | | $1,215,477 |
| Net investment income | | | 315,974 |
Realized and Unrealized Gain (Loss) on Investments, Written Options and Foreign
Currency Transactions: | | | |
| Net realized loss on investments and foreign currency transactions (including foreign taxes withheld of $390,817) | | | (6,553,125) |
| Net realized gain on written options | | | 88,760 |
| Net change in unrealized depreciation of investments and translation of assets and liabilities in foreign currency | | | 22,926,792 |
| Net realized and unrealized gain on investments, written options and foreign currency transactions | | | 16,462,427 |
| Change in net assets resulting from operations | | | $16,778,401 |
- See Notes which are an integral part of the Financial Statements
Annual Shareholder Report15
Statement of Changes in Net Assets
| Year Ended
10/31/2009 | Period Ended
10/31/20081 |
| Increase (Decrease) in Net Assets | | |
| Operations: | | |
| Net investment income | $315,974 | $32,113 |
| Net realized gain (loss) on investments, written options and foreign currency transactions | (6,464,365) | (3,791,896) |
| Net change in unrealized appreciation/depreciation of investments and translation of assets and liabilities in foreign currency | 22,926,792 | (15,952,669) |
| CHANGE IN NET ASSETS RESULTING FROM OPERATIONS | 16,778,401 | (19,712,452) |
| Distributions to Shareholders: | | |
| Distributions from net investment income | | |
| Institutional Shares | (34,222) | — |
| Class A Shares | (97,124) | — |
| Class K Shares | (119) | — |
| CHANGE IN NET ASSETS RESULTING FROM DISTRIBUTIONS TO SHAREHOLDERS | (131,465) | — |
| Share Transactions: | | |
| Proceeds from sale of shares | 67,130,420 | 76,913,035 |
| Net asset value of shares issued to shareholders in payment of distributions declared | 111,697 | — |
| Cost of shares redeemed | (24,614,521) | (7,288,939) |
| CHANGE IN NET ASSETS RESULTING FROM SHARE TRANSACTIONS | 42,627,596 | 69,624,096 |
| Change in net assets | 59,274,532 | 49,911,644 |
| Net Assets: | | |
| Beginning of period | 49,911,644 | — |
| End of period (including undistributed net investment income of $14,629 and $71,144, respectively) | $109,186,176 | $49,911,644 |
| 1 | Reflects operations for the period from December 5, 2007 (date of initial investment) to October 31, 2008. |
- See Notes which are an integral part of the Financial Statements
Annual Shareholder Report16
Notes to Financial Statements
October 31, 2009
1. ORGANIZATION
Federated Equity Funds (the “Trust”) is registered under the Investment Company Act of 1940, as amended (the “Act”), as an open-end management investment company. The Trust consists of 13 portfolios. The financial statements included herein are only those of Federated Kaufmann Large Cap Fund (the “Fund”), a diversified portfolio. The financial statements of the other portfolios are presented separately. The assets of each portfolio are segregated and a shareholder's interest is limited to the portfolio in which shares are held. Each portfolio pays its own expenses. The Fund, effective December 3, 2007, offers four classes of shares: Class A Shares, Class C Shares, Class K Shares and Institutional Shares. The financial highlights of the Class A Shares, Class C Shares and Class K Shares are presented separately. All shares of the Fund have equal rights with respect to voting, except on class-specific matters. The investment objective of the Fund is to provide capital appreciation.
2. SIGNIFICANT ACCOUNTING POLICIES
The following is a summary of significant accounting policies consistently followed by the Fund in the preparation of its financial statements. These policies are in conformity with U.S. generally accepted accounting principles (GAAP).
Investment Valuation
In calculating its net asset value (NAV), the Fund generally values investments as follows:
- Equity securities listed on an exchange or traded through a regulated market system are valued at their last reported sale price or official closing price in their principal exchange or market.
- Fixed-income securities acquired with remaining maturities greater than 60 days are fair valued using price evaluations provided by a pricing service approved by the Board of Trustees (the “Trustees”).
- Fixed-income securities acquired with remaining maturities of 60 days or less are valued at their cost (adjusted for the accretion of any discount or amortization of any premium).
- Shares of other mutual funds are valued based upon their reported NAVs.
- Derivative contracts listed on exchanges are valued at their reported settlement or closing price.
- Over-the-counter (OTC) derivative contracts are fair valued using price evaluations provided by a pricing service approved by the Trustees.
If the Fund cannot obtain a price or price evaluation from a pricing service for an investment, the Fund may attempt to value the investment based upon the mean of bid and asked quotations or fair value the investment based on price evaluations, from one or more dealers. If any price, quotation, price evaluation or other pricing source is not readily available when the NAV is calculated, the Fund uses the fair value of the investment determined in accordance with the procedures described below. There can be no assurance that the Fund could purchase or sell an investment at the price used to calculate the Fund's NAV.
Fair Valuation and Significant Events Procedures
The Trustees have authorized the use of pricing services to provide evaluations of the current fair value of certain investments for purposes of calculating the NAV. Factors considered by pricing services in evaluating an investment include the yields or prices of investments of comparable quality, coupon, maturity, call rights and other potential prepayments, terms and Annual Shareholder Report17
type, reported transactions, indications as to values from dealers and general market conditions. Some pricing services provide a single price evaluation reflecting the bid-side of the market for an investment (a “bid” evaluation). Other pricing services offer both bid evaluations and price evaluations indicative of a price between the prices bid and asked for the investment (a “mid” evaluation). The Fund normally uses bid evaluations for U.S. Treasury and Agency securities and mortgage-backed securities. The Fund normally uses mid evaluations for other types of fixed-income securities and OTC derivative contracts. In the event that market quotations and price evaluations are not available for an investment, the fair value of the investment is determined in accordance with procedures adopted by the Trustees.The Trustees also have adopted procedures requiring an investment to be priced at its fair value whenever the Adviser determines that a significant event affecting the value of the investment has occurred between the time as of which the price of the investment would otherwise be determined and the time as of which the NAV is computed. An event is considered significant if there is both an affirmative expectation that the investment's value will change in response to the event and a reasonable basis for quantifying the resulting change in value. Examples of significant events that may occur after the close of the principal market on which a security is traded, or after the time of a price evaluation provided by a pricing service or a dealer, include:
- With respect to securities traded in foreign markets, significant trends in U.S. equity markets or in the trading of foreign securities index futures or options contracts;
- With respect to price evaluations of fixed-income securities determined before the close of regular trading on the NYSE, actions by the Federal Reserve Open Market Committee and other significant trends in U.S. fixed-income markets;
- Political or other developments affecting the economy or markets in which an issuer conducts its operations or its securities are traded; and
- Announcements concerning matters such as acquisitions, recapitalizations, litigation developments, a natural disaster affecting the issuer's operations or regulatory changes or market developments affecting the issuer's industry.
The Trustees have approved the use of a pricing service to determine the fair value of equity securities traded principally in foreign markets when the Adviser determines that there has been a significant trend in the U.S. equity markets or in index futures trading. For other significant events, the Fund may seek to obtain more current quotations or price evaluations from alternative pricing sources. If a reliable alternative pricing source is not available, the Fund will determine the fair value of the investment using another method approved by the Trustees.
Repurchase Agreements
It is the policy of the Fund to require the other party to a repurchase agreement to transfer to the Fund's custodian or sub-custodian eligible securities or cash with a market value (after transaction costs) at least equal to the repurchase price to be paid under the repurchase agreement. The eligible securities are transferred to accounts with the custodian or sub-custodian in which the Fund holds a “securities entitlement” and exercises “control” as those terms are defined in the Uniform Commercial Code. The Fund has established procedures for monitoring the market value of the transferred securities and requiring the transfer of additional eligible securities if necessary to equal at least the repurchase price. These procedures also allow the other party to require securities to be transferred from the account to the extent that their market value exceeds the repurchase price or in exchange for other eligible securities of equivalent market value.
Annual Shareholder Report18
With respect to agreements to repurchase U.S. government securities and cash items, the Fund treats the repurchase agreement as an investment in the underlying securities and not as an obligation of the other party to the repurchase agreement. Other repurchase agreements are treated as obligations of the other party secured by the underlying securities. Nevertheless, the insolvency of the other party or other failure to repurchase the securities may delay the disposition of the underlying securities or cause the Fund to receive less than the full repurchase price. Under the terms of the repurchase agreement, any amounts received by the Fund in excess of the repurchase price and related transaction costs must be remitted to the other party.The Fund may enter into repurchase agreements in which eligible securities are transferred into joint trading accounts maintained by the custodian or sub-custodian for investment companies and other clients advised by the Fund's Adviser and its affiliates. The Fund will participate on a pro rata basis with the other investment companies and clients in its share of the securities transferred under such repurchase agreements and in its share of proceeds from any repurchase or other disposition of such securities.
Investment Income, Gains and Losses, Expenses and Distributions
Investment transactions are accounted for on a trade-date basis. Realized gains and losses from investment transactions are recorded on an identified-cost basis. Interest income and expenses are accrued daily. Dividend income and distributions to shareholders are recorded on the ex-dividend date. Foreign dividends are recorded on the ex-dividend date or when the Fund is informed of the ex-dividend date. Distributions of net investment income, if any, are declared and paid annually. Non-cash dividends included in dividend income, if any, are recorded at fair value. Investment income, realized and unrealized gains and losses, and certain fund-level expenses are allocated to each class based on relative average daily net assets, except that Class A Shares, Class C Shares, Institutional Shares and Class K Shares may bear distribution services fees, shareholder services fees and certain transfer and dividend disbursing agent fees unique to those classes. Dividends are declared separately for each class. No class has preferential dividend rights; differences in per share dividend rates are generally due to differences in separate class expenses.
Premium and Discount Amortization
All premiums and discounts on fixed-income securities are amortized/accreted for financial statement purposes.
Federal Taxes
It is the Fund's policy to comply with the Subchapter M provision of the Internal Revenue Code (the “Code”) and to distribute to shareholders each year substantially all of its income. Accordingly, no provision for federal income tax is necessary. As of and during the year ended October 31, 2009, the Fund did not have a liability for any uncertain tax positions. The Fund recognizes interest and penalties, if any, related to tax liabilities as income tax expense in the Statement of Operations. As of October 31, 2009, tax years 2008 and 2009 remain subject to examination by the Fund's major tax jurisdictions, which include the United States of America and the Commonwealth of Massachusetts.
The Fund may be subject to taxes imposed by governments of countries in which it invests. Such taxes are generally based on either income or gains earned or repatriated. The Fund accrues and applies such taxes to net investment income, net realized gains and net unrealized gains as income and/or gains are earned.
Annual Shareholder Report19
When-Issued and Delayed Delivery TransactionsThe Fund may engage in when-issued or delayed delivery transactions. The Fund records when-issued securities on the trade date and maintains security positions such that sufficient liquid assets will be available to make payment for the securities purchased. Securities purchased on a when-issued or delayed delivery basis are marked to market daily and begin earning interest on the settlement date. Losses may occur on these transactions due to changes in market conditions or the failure of counterparties to perform under the contract.
Foreign Exchange Contracts
The Fund may enter into foreign exchange contracts for the delayed delivery of securities or foreign currency exchange transactions. The Fund may enter into foreign exchange contracts to protect assets against adverse changes in foreign currency exchange rates or exchange control regulations. Purchased contracts are used to acquire exposure to foreign currencies, whereas, contracts to sell are used to hedge the Fund's securities against currency fluctuations. Risks may arise upon entering into these transactions from the potential inability of counterparties to meet the terms of their commitments and from unanticipated movements in security prices or foreign exchange rates. The foreign exchange contracts are adjusted by the daily exchange rate of the underlying currency and any gains or losses are recorded for financial statement purposes as unrealized until the settlement date.
Foreign exchange contracts outstanding at period end are listed after the Fund's Portfolio of Investments.
Foreign Currency Translation
The accounting records of the Fund are maintained in U.S. dollars. All assets and liabilities denominated in foreign currencies (FCs) are translated into U.S. dollars based on the rates of exchange of such currencies against U.S. dollars on the date of valuation. Purchases and sales of securities, income and expenses are translated at the rate of exchange quoted on the respective date that such transactions are recorded. The Fund does not isolate that portion of the results of operations resulting from changes in foreign exchange rates on investments from the fluctuations arising from changes in market prices of securities held. Such fluctuations are included with the net realized and unrealized gain or loss from investments.
Reported net realized foreign exchange gains or losses arise from sales of portfolio securities, sales and maturities of short-term securities, sales of FCs, currency gains or losses realized between the trade and settlement dates on securities transactions, the difference between the amounts of dividends, interest and foreign withholding taxes recorded on the Fund's books, and the U.S. dollar equivalent of the amounts actually received or paid. Net unrealized foreign exchange gains and losses arise from changes in the value of assets and liabilities other than investments in securities at fiscal year end, resulting from changes in the exchange rate.
Option Contracts
The Fund may buy or sell put and call options to hedge currency. The seller (writer) of an option receives a payment or premium, from the buyer, which the writer keeps regardless of whether the buyer exercises the option. Premiums paid for purchasing options which expire are treated as realized losses. The risk associated with purchasing put and call options is limited to the premium paid. When the Fund writes a put or call option, an amount equal to the premium received is recorded as a liability and subsequently marked to market to reflect the current value of the option written. Premiums received from writing options which expire are treated as realized gains. Premiums received from writing options which are exercised or Annual Shareholder Report20
closed are added to the proceeds or offset against amounts paid on the underlying reference instrument to determine the realized gain or loss. The Fund, as a writer of an option, bears the market risk of an unfavorable change in the price of the underlying reference instrument. Options can trade on securities or commodities exchanges. In this case, the exchange sets all the terms of the contract except for the price. Most exchanges require investors to maintain margin accounts through their brokers to cover their potential obligations to the exchange. This protects investors against potential defaults by the counterparty.The following is a summary of the Fund's written option activity:
| Contracts | Number of
Contracts | Premium |
| Outstanding at October 31, 2008 | — | $ — |
| Contracts written | 5,800,000 | 137,650 |
| Contracts bought back | (5,800,000) | (137,650) |
| Outstanding at October 31, 2009 | — | $ — |
Additional Disclosure Related to Derivative Instruments
| Fair Value of Derivative Instruments |
| Asset | Liability |
| Statement of
Assets and
Liabilities
Location | Fair
Value | Statement of
Assets and
Liabilities
Location | Fair
Value |
| Derivatives not accounted for as hedging instruments under ASC Topic 815 | | | | |
| Foreign exchange contracts | Receivable for foreign exchange contracts | $915 | — | $ — |
The Effect of Derivative Instruments on the Statement of Operations for the Year Ended October 31, 2009
| Amount of Realized Gain or (Loss) on Derivatives Recognized in Income |
| Option
Contracts | Forward
Currency
Contracts | Total |
| Foreign exchange contracts | $139,098 | $(22,100) | $116,998 |
| Change in Unrealized Appreciation or (Depreciation) on Derivatives Recognized in Income |
| Forward
Currency
Contracts |
| Foreign exchange contracts | $915 |
Annual Shareholder Report21
Other
The preparation of financial statements in conformity with GAAP requires management to make estimates and assumptions that affect the amounts of assets, liabilities, expenses and revenues reported in the financial statements. Actual results could differ from those estimated.
3. SHARES OF BENEFICIAL INTEREST
The following tables summarize share activity:
| Year Ended
10/31/09 | Period Ended
10/31/081 |
| Institutional Shares: | Shares | Amount | Shares | Amount |
| Shares sold | 1,648,086 | $11,540,740 | 366,559 | $2,986,589 |
| Shares issued to shareholders in payment of distributions declared | 5,201 | 33,907 | — | — |
| Shares redeemed | (182,139) | (1,444,097) | (12,025) | (111,343) |
NET CHANGE RESULTING
FROM INSTITUTIONAL SHARE TRANSACTIONS | 1,471,148 | $10,130,550 | 354,534 | $2,875,246 |
| Year Ended
10/31/09 | Period Ended
10/31/081 |
| Class A Shares: | Shares | Amount | Shares | Amount |
| Shares sold | 5,164,199 | $39,815,480 | 5,149,971 | $49,053,817 |
| Shares issued to shareholders in payment of distributions declared | 11,931 | 77,671 | — | — |
| Shares redeemed | (2,777,438) | (18,310,126) | (623,089) | (5,172,000) |
NET CHANGE RESULTING
FROM CLASS A SHARE TRANSACTIONS | 2,398,692 | $21,583,025 | 4,526,882 | $43,881,817 |
| Year Ended
10/31/09 | Period Ended
10/31/081 |
| Class C Shares: | Shares | Amount | Shares | Amount |
| Shares sold | 2,106,276 | $15,425,563 | 2,625,254 | $24,869,902 |
| Shares issued to shareholders in payment of distributions declared | — | — | — | — |
| Shares redeemed | (684,595) | (4,817,632) | (243,213) | (2,005,596) |
NET CHANGE RESULTING
FROM CLASS C SHARE TRANSACTIONS | 1,421,681 | $10,607,931 | 2,382,041 | $22,864,306 |
Annual Shareholder Report22
| Year Ended
10/31/09 | Period Ended
10/31/081 |
| Class K Shares: | Shares | Amount | Shares | Amount |
| Shares sold | 43,499 | $348,637 | 286 | $2,727 |
| Shares issued to shareholders in payment of distributions declared | 18 | 119 | — | — |
| Shares redeemed | (5,280) | (42,666) | — | — |
NET CHANGE RESULTING
FROM CLASS K SHARE TRANSACTIONS | 38,237 | $306,090 | 286 | $2,727 |
| NET CHANGE RESULTING FROM FUND SHARE TRANSACTIONS | 5,329,758 | $42,627,596 | 7,263,743 | $69,624,096 |
| 1 | Reflects operations for the period from December 5, 2007 (date of initial investment) to October 31, 2008. |
4. FEDERAL TAX INFORMATION
The timing and character of income and capital gain distributions are determined in accordance with income tax regulations, which may differ from GAAP. These differences are due in part to differing treatments for foreign currency transactions, realized capital gains tax and discount accretion/premium amortization on debt securities.
For the year ended October 31, 2009, permanent differences identified and reclassified among the components of net assets were as follows:
| Increase (Decrease) |
Undistributed
Net Investment
Income (Loss) | | Accumulated
Net Realized
Gain (Loss) |
| $(241,024) | | $241,024 |
Net investment income (loss), net realized gains (losses) and net assets were not affected by this reclassification.
The tax character of distributions as reported on the Statement of Changes in Net Assets for the years ended October 31, 2009 and 2008, was as follows:
| 2009 | 2008 |
| Ordinary income | $131,465 | $ — |
As of October 31, 2009, the components of distributable earnings on a tax basis were as follows:
| Undistributed ordinary income | $34,661 |
| Net unrealized appreciation | $5,211,332 |
| Capital loss carryforwards | $(8,306,738) |
The difference between book-basis and tax-basis net unrealized appreciation/depreciation is attributable to the deferral of losses on wash sales and discount accretion/premium amortization on debt securities.
Annual Shareholder Report23
At October 31, 2009, the cost of investments for federal tax purposes was $99,194,303. The net unrealized appreciation of investments for federal tax purposes excluding any unrealized appreciation resulting from changes in outstanding foreign exchange contracts was $5,489,343. This consists of net unrealized appreciation from investments for those securities having an excess of value over cost of $10,861,704 and net unrealized depreciation from investments for those securities having an excess of cost over value of $5,372,361.At October 31, 2009, the Fund had a capital loss carryforward of $8,306,738, which will reduce the Fund's taxable income arising from future net realized gains on investments, if any, to the extent permitted by the Code and thus will reduce the amount of distributions to shareholders, which would otherwise be necessary to relieve the Fund of any liability for federal income tax. Pursuant to the Code, such capital loss carryforward will expire as follows:
| Expiration Year | Expiration Amount |
| 2016 | $3,186,204 |
| 2017 | $5,120,534 |
5. INVESTMENT ADVISER FEE AND OTHER TRANSACTIONS WITH AFFILIATES
Investment Adviser Fee
Federated Equity Management Company of Pennsylvania is the Fund's investment adviser (the “Adviser”). The advisory agreement between the Fund and the Adviser provides for an annual fee equal to 1.425% of the Fund's average daily net assets. Subject to the terms described in the Expense Limitation note, the Adviser may voluntarily choose to waive any portion of its fee and/or reimburse certain operating expenses of the Fund. The Adviser can modify or terminate this voluntary waiver and/or reimbursement at any time at its sole discretion. For the year ended October 31, 2009, the Adviser voluntarily waived $771,428 of its fee. In addition, an affiliate of the Adviser reimbursed $29,158 of transfer and dividend disbursing agent fees and expenses.
Certain of the Fund's assets are managed by Federated Global Investment Management Corp. (the “Sub-Adviser”). Under the terms of a sub-advisory agreement between the Adviser and the Sub-Adviser, the Sub-Adviser receives an allocable portion of the Fund's adviser fee. The fee is paid by the Adviser out of its resources and is not an incremental Fund expense. For the year ended October 31, 2009, the Sub-Adviser earned a fee of $825,151.
Administrative Fee
Federated Administrative Services (FAS), under the Administrative Services Agreement, provides the Fund with administrative personnel and services. The fee paid to FAS is based on the average aggregate daily net assets of certain Federated funds as specified below:
| Administrative Fee | Average Aggregate Daily Net Assets
of the Federated Funds |
| 0.150% | on the first $5 billion |
| 0.125% | on the next $5 billion |
| 0.100% | on the next $10 billion |
| 0.075% | on assets in excess of $20 billion |
Annual Shareholder Report24
The administrative fee received during any fiscal year shall be at least $150,000 per portfolio and $40,000 per each additional class of Shares. Subject to the terms described in the Expense Limitation note, FAS may voluntarily choose to waive any portion of its fee. FAS can modify or terminate this voluntary waiver at any time at its sole discretion. For the year ended
October 31, 2009, the net fee paid to FAS was 0.307% of average daily net assets of the Fund. FAS waived $54,296 of its fee. The Fund is currently being charged the minimum administrative fee; therefore the fee as a percentage of average daily net assets is greater than the amounts presented in the chart above.
Distribution Services Fee
The Fund has adopted a Distribution Plan (the “Plan”) pursuant to Rule 12b-1 under the Act. Under the terms of the Plan, the Fund will compensate Federated Securities Corp. (FSC), the principal distributor, from the daily net assets of the Fund's Class A Shares, Class C Shares and Class K Shares to finance activities intended to result in the sale of these shares. The Plan provides that the Fund may incur distribution expenses at the following percentages of average daily net assets annually, to compensate FSC:
| Share Class Name | Percentage of Average Daily
Net Assets of Class |
| Class A Shares | 0.25% |
| Class C Shares | 0.75% |
| Class K Shares | 0.50% |
Subject to the terms described in the Expense Limitation note, FSC may voluntarily choose to waive any portion of its fee. FSC can modify or terminate this voluntary waiver at any time at its sole discretion. For the year ended October 31, 2009, FSC voluntarily waived $73 of its fee. When FSC receives fees, it may pay some or all of them to financial intermediaries whose customers purchase shares. For the year ended October 31, 2009, FSC retained $82,965 of fees paid by the Fund. For the year ended October 31, 2009, the Fund's Class A Shares did not incur a distribution services fee; however it may begin to incur this fee upon approval of the Trustees.
Sales Charges
Front-end sales charges and contingent deferred sales charges (CDSC) do not represent expenses of the Fund. They are deducted from the proceeds of sales of Fund shares prior to investment or from redemption proceeds prior to remittance, as applicable. For the year ended October 31, 2009, FSC retained $20,768 in sales charges from the sale of Class A Shares. FSC also retained $190 of CDSC relating to redemptions of Class A Shares and $5,452 relating to redemptions of Class C Shares.
Shareholder Services Fee
The Fund may pay fees (Service Fees) up to 0.25% of the average daily net assets of the Fund's Class A Shares and Class C Shares to financial intermediaries or to Federated Shareholder Services Company (FSSC) for providing services to shareholders and maintaining shareholder accounts. Subject to the terms described in the Expense Limitation note, FSSC may voluntarily reimburse the Fund for shareholder services fees. This voluntary reimbursement can be modified or terminated at any time. For the year ended October 31, 2009, FSSC voluntarily reimbursed $185 of its fee. For the year ended October 31, 2009, FSSC did not receive any fees paid by the Fund.
Annual Shareholder Report25
Expense LimitationThe Adviser and its affiliates (which may include FSC, FAS and FSSC) have voluntarily agreed to waive their fees and/or reimburse expenses so that the total operating expenses (as shown in the financial highlights) paid by the Fund's Institutional Shares, Class A Shares, Class C Shares and Class K Shares (after the voluntary waivers and reimbursements) will not exceed 1.25%, 1.50%, 2.34% and 1.95%, respectively, through the later of (the “Termination Date”): (a) December 31, 2010; or (b) the date of the Fund's next effective Prospectus. While the Adviser and its affiliates currently do not anticipate terminating these arrangements prior to the Termination Date, these arrangements may only be terminated prior to the Termination Date with the agreement of the Fund's Board of Trustees.
Interfund Transactions
During the year ended October 31, 2009, the Fund engaged in purchase and sale transactions with funds that have a common investment adviser (or affiliated investment advisers), common Directors/Trustees, and/or common Officers. These purchase and sale transactions complied with Rule 17a-7 under the Act and amounted to $2,835,488 and $820,128, respectively.
General
Certain Officers and Trustees of the Fund are Officers and Directors or Trustees of the above companies.
Transactions with Affiliated Companies
Affiliated holdings are mutual funds which are managed by the Adviser or an affiliate of the Adviser. The Adviser has agreed to reimburse the Fund for certain investment adviser fees as a result of transactions in other affiliated mutual funds. For the year ended October 31, 2009, the Adviser reimbursed $4,033. Transactions with the affiliated company during the year ended October 31, 2009 were as follows:
| Affiliate | Balance of
Shares Held
10/31/2008 | Purchases/
Additions | Sales/
Reductions | Balance of
Shares Held
10/31/2009 | Value | Dividend
Income |
| Prime Value Obligations Fund, Institutional Shares | 429,133 | 83,591,918 | 83,421,783 | 599,268 | $599,268 | $42,794 |
6. EXPENSE Reduction
The Fund directs portfolio trades to a broker that in turn pays a portion of the Fund's operating expenses. For the year ended October 31, 2009, the Fund's expenses were reduced by $3,187 under these arrangements.
7. Investment TRANSACTIONS
Purchases and sales of investments, excluding long-term U.S. government securities and short-term obligations, for the year ended October 31, 2009, were as follows:
| Purchases | $153,580,039 |
| Sales | $113,488,920 |
Annual Shareholder Report26
8. CONCENTRATION OF RISK
The Fund invests in securities of non-U.S. issuers. Political or economic developments may have an effect on the liquidity and volatility of portfolio securities and currency holdings.
9. LINE OF CREDIT
The Fund participates in a $100,000,000 unsecured, uncommitted revolving line of credit (LOC) agreement with PNC Bank. The LOC was made available for extraordinary or emergency purposes, primarily for financing redemption payments. Borrowings are charged interest at a rate offered to the Fund by PNC Bank at the time of the borrowing. As of October 31, 2009, there were no outstanding loans. During the year ended October 31, 2009, the Fund did not utilize the LOC.
10. INTERFUND LENDING
Pursuant to an Exemptive Order issued by the Securities and Exchange Commission (SEC), the Fund, along with other funds advised by subsidiaries of Federated Investors, Inc., may participate in an interfund lending program. This program provides an alternative credit facility allowing the Fund to borrow from other participating affiliated funds. As of October 31, 2009, there were no outstanding loans. During the year ended October 31, 2009, the program was not utilized.
11. Legal Proceedings
Since October 2003, Federated Investors, Inc. and related entities (collectively, “Federated”), and various Federated funds (Federated Funds) have been named as defendants in several class action lawsuits now pending in the United States District Court for the District of Maryland. The lawsuits were purportedly filed on behalf of people who purchased, owned and/or redeemed shares of Federated-sponsored mutual funds during specified periods beginning November 1, 1998. The suits are generally similar in alleging that Federated engaged in illegal and improper trading practices including market timing and late trading in concert with certain institutional traders, which allegedly caused financial injury to the mutual fund shareholders. These lawsuits began to be filed shortly after Federated's first public announcement that it had received requests for information on shareholder trading activities in the Federated Funds from the SEC, the Office of the New York State Attorney General (NYAG) and other authorities. In that regard, on November 28, 2005, Federated announced that it had reached final settlements with the SEC and the NYAG with respect to those matters. As Federated previously reported in 2004, it has already paid approximately $8.0 million to certain funds as determined by an independent consultant. As part of these settlements, Federated agreed to pay for the benefit of fund shareholders additional disgorgement and a civil money penalty in the aggregate amount of an additional $72 million. Federated entities have also been named as defendants in several additional lawsuits that are now pending in the United States District Court for the Western District of Pennsylvania, alleging, among other things, excessive advisory and Rule 12b-1 fees. The Board of the Federated Funds retained the law firm of Dickstein Shapiro LLP to represent the Federated Funds in these lawsuits. Federated and the Federated Funds and their respective counsel have been defending this litigation, and none of the Federated Funds remains a defendant in any of the lawsuits (though some could potentially receive any recoveries as nominal defendants). Additional lawsuits based upon similar allegations may be filed in the future. The potential impact of these lawsuits, all of which seek unquantified damages, attorneys' fees and expenses, and future potential similar suits is uncertain. Although we do not believe that these lawsuits will have a Annual Shareholder Report27
material adverse effect on the Federated Funds, there can be no assurance that these suits, the ongoing adverse publicity and/or other developments resulting from the regulatory investigations will not result in increased Federated Fund redemptions, reduced sales of Federated Fund shares or other adverse consequences for the Federated Funds.12. Subsequent events
Management has evaluated subsequent events through December 24, 2009, the date the financial statements were issued, and determined that no events have occurred that require additional disclosure.
13. FEDERAL TAX INFORMATION (UNAUDITED)
For the fiscal year ended October 31, 2009, 100.0% of total ordinary income distributions made by the Fund are qualifying dividends which may be subject to a maximum tax rate of 15%, as provided for by the Jobs and Growth Tax Relief Act of 2003. Complete information is reported in conjunction with the reporting of your distributions on Form 1099-DIV.
Of the ordinary income distributions made by the Fund during the year ended October 31, 2009, 100.0% qualify for the dividend received deduction available to corporate shareholders.
Annual Shareholder Report28
Report of Independent Registered Public Accounting Firm
TO THE BOARD OF Trustees OF Federated Equity Funds AND SHAREHOLDERS OF Federated Kaufmann Large Cap Fund:
We have audited the accompanying statement of assets and liabilities of Federated Kaufmann Large Cap Fund (the “Fund”), one of the portfolios constituting Federated Equity Funds, including the portfolio of investments, as of October 31, 2009, and the related statement of operations for the year then ended, and the statement of changes in net assets and the financial highlights for each of the periods indicated therein. These financial statements and financial highlights are the responsibility of the Fund's management. Our responsibility is to express an opinion on these financial statements and financial highlights based on our audits.
We conducted our audits in accordance with standards of the Public Company Accounting Oversight Board (United States). Those standards require that we plan and perform the audit to obtain reasonable assurance about whether the financial statements and financial highlights are free of material misstatement. We were not engaged to perform an audit of the Fund's internal control over financial reporting. Our audits included consideration of internal control over financial reporting as a basis for designing audit procedures that are appropriate in the circumstances, but not for the purpose of expressing an opinion on the effectiveness of the Fund's internal control over financial reporting. Accordingly, we express no such opinion. An audit also includes examining, on a test basis, evidence supporting the amounts and disclosures in the financial statements and financial highlights, assessing the accounting principles used and significant estimates made by management, and evaluating the overall financial statement presentation. Our procedures included confirmation of securities owned as of October 31, 2009, by correspondence with the custodian and brokers. We believe that our audits provide a reasonable basis for our opinion.
In our opinion, the financial statements and financial highlights referred to above present fairly, in all material respects, the financial position of Federated Kaufmann Large Cap Fund, a portfolio of Federated Equity Funds, at October 31, 2009, the results of its operations for the year then ended, and its changes in net assets and the financial highlights for each of the periods indicated therein, in conformity with U.S. generally accepted accounting principles.
Boston, Massachusetts
December 24, 2009
Annual Shareholder Report29
Board of Trustees and Trust Officers
The Board is responsible for managing the Trust's business affairs and for exercising all the Trust's powers except those reserved for the shareholders. The following tables give information about each Board member and the senior officers of the Fund. Where required, the tables separately list Board members who are “interested persons” of the Fund (i.e., “Interested” Board members) and those who are not (i.e., “Independent” Board members). Unless otherwise noted, the address of each person listed is Federated Investors Tower, 1001 Liberty Avenue, Pittsburgh, PA 15222. The address of all Independent Board members listed is 4000 Ericsson Drive, Warrendale, PA 15086-7561; Attention: Mutual Fund Board. As of December 31, 2008, the Trust comprised 10 portfolios, and the Federated Fund Complex consisted of 40 investment companies (comprising 149 portfolios). Unless otherwise noted, each Officer is elected annually. Unless otherwise noted, each Board member oversees all portfolios in the Federated Fund Complex and serves for an indefinite term. The Fund's Statement of Additional Information includes additional information about Trust Trustees and is available, without charge and upon request, by calling 1-800-341-7400.
Interested TRUSTEES Background
Name
Birth Date
Positions Held with Trust
Date Service Began | Principal Occupation(s) for Past Five Years,
Other Directorships Held and Previous Position(s) |
John F. Donahue*
Birth Date: July 28, 1924
TRUSTEE
Began serving: April 1984 | Principal Occupations: Director or Trustee of the Federated Fund Complex; Chairman and Director, Federated Investors, Inc.; Chairman of the Federated Fund Complex's Executive Committee.
Previous Positions: Chairman of the Federated Fund Complex; Trustee, Federated Investment Management Company; Chairman and Director, Federated Investment Counseling. |
J. Christopher Donahue*
Birth Date: April 11, 1949
PRESIDENT AND TRUSTEE
Began serving: January 2000 | Principal Occupations: Principal Executive Officer and President of the Federated Fund Complex; Director or Trustee of some of the Funds in the Federated Fund Complex; President, Chief Executive Officer and Director, Federated Investors, Inc.; Chairman and Trustee, Federated Investment Management Company; Trustee, Federated Investment Counseling; Chairman and Director, Federated Global Investment Management Corp.; Chairman, Federated Equity Management Company of Pennsylvania and Passport Research, Ltd. (investment advisory subsidiary of Federated); Trustee, Federated Shareholder Services Company; Director, Federated Services Company.
Previous Positions: President, Federated Investment Counseling; President and Chief Executive Officer, Federated Investment Management Company, Federated Global Investment Management Corp. and Passport Research, Ltd. |
| * | Family relationships and reasons for “interested” status: John F. Donahue is the father of J. Christopher Donahue; both are “interested” due to their beneficial ownership of shares of Federated Investors, Inc. and the positions they hold with Federated and its subsidiaries. |
Annual Shareholder Report30
INDEPENDENT TRUSTEES Background
Name
Birth Date
Positions Held with Trust
Date Service Began | Principal Occupation(s) for Past Five Years,
Other Directorships Held and Previous Position(s) |
John T. Conroy, Jr., Ph.D.
Birth Date: June 23, 1937
TRUSTEE
Began serving: November 1991 | Principal Occupations: Director or Trustee of the Federated Fund Complex; Chairman of the Board, Investment Properties Corporation; Partner or Trustee in private real estate ventures in Southwest Florida; Assistant Professor in Theology, Blessed Edmund Rice School for Pastoral Ministry.
Previous Positions: President, Investment Properties Corporation; Senior Vice President, John R. Wood and Associates, Inc., Realtors; President, Naples Property Management, Inc. and Northgate Village Development Corporation. |
Nicholas P. Constantakis
Birth Date: September 3, 1939
TRUSTEE
Began serving: February 1998 | Principal Occupation: Director or Trustee of the Federated Fund Complex.
Other Directorship Held: Director and Chairman of the Audit Committee, Michael Baker Corporation (architecture, engineering and construction services).
Previous Position: Partner, Andersen Worldwide SC. |
John F. Cunningham
Birth Date: March 5, 1943
TRUSTEE
Began serving: January 1999 | Principal Occupation: Director or Trustee of the Federated Fund Complex.
Other Directorships Held: Chairman, President and Chief Executive Officer, Cunningham & Co., Inc. (strategic business consulting); Trustee Associate, Boston College.
Previous Positions: Director, Redgate Communications and EMC Corporation (computer storage systems); Chairman of the Board and Chief Executive Officer, Computer Consoles, Inc.; President and Chief Operating Officer, Wang Laboratories; Director, First National Bank of Boston; Director, Apollo Computer, Inc. |
Maureen Lally-Green
Birth Date: July 5, 1949
TRUSTEE
Began serving: August 2009 | Principal Occupations: Director or Trustee of the Federated Fund Complex; Director, Office of Church Relations, Diocese of Pittsburgh; Adjunct Professor of Law, Duquesne University School of Law.
Other Directorships Held: Director, Auberle; Trustee St. Francis University; Director, Ireland Institute of Pittsburgh; Director, UPMC Mercy Hospital; Regent, St. Vincent Seminary; Director, Epilepsy Foundation of Western and Central Pennsylvania; Director, Saint Thomas More Society, Allegheny County; Director, Carlow University.
Previous Position: Pennsylvania Superior Court Judge. |
Annual Shareholder Report31
Name
Birth Date
Positions Held with Trust
Date Service Began | Principal Occupation(s) for Past Five Years,
Other Directorships Held and Previous Position(s) |
Peter E. Madden
Birth Date: March 16, 1942
TRUSTEE
Began serving: November 1991 | Principal Occupation: Director or Trustee and Chairman of the Board of the Federated Fund Complex.
Other Directorship Held: Board of Overseers, Babson College.
Previous Positions: Representative, Commonwealth of Massachusetts General Court; President, Chief Operating Officer and Director, State Street Bank and Trust Company and State Street Corporation (retired); Director, VISA USA and VISA International; Chairman and Director, Massachusetts Bankers Association; Director, Depository Trust Corporation; Director, The Boston Stock Exchange. |
Charles F. Mansfield, Jr.
Birth Date: April 10, 1945
TRUSTEE
Began serving: January 1999 | Principal Occupations: Director or Trustee and Chairman of the Audit Committee of the Federated Fund Complex; Management Consultant.
Previous Positions: Chief Executive Officer, PBTC International Bank; Partner, Arthur Young & Company (now Ernst & Young LLP); Chief Financial Officer of Retail Banking Sector, Chase Manhattan Bank; Senior Vice President, HSBC Bank USA (formerly, Marine Midland Bank); Vice President, Citibank; Assistant Professor of Banking and Finance, Frank G. Zarb School of Business, Hofstra University; Executive Vice President DVC Group, Inc. (marketing, communications and technology). |
R. James Nicholson
Birth Date: February 4, 1938
TRUSTEE
Began serving: April 2008 | Principal Occupations: Director or Trustee of the Federated Fund Complex; Senior Counsel, Brownstein Hyatt Farber Schrek, P.C.; Former Secretary of the U.S. Dept. of Veterans Affairs; Former U.S. Ambassador to the Holy See; Former Chairman of the Republican National Committee.
Other Directorships Held: Director, Horatio Alger Association; Director, The Daniels Fund.
Previous Positions: Colonel, U.S. Army Reserve; Partner, Calkins, Kramer, Grimshaw and Harring, P.C.; General Counsel, Colorado Association of Housing and Building; Chairman and CEO, Nicholson Enterprises, Inc. (real estate holding company); Chairman and CEO, Renaissance Homes of Colorado. |
Thomas M. O'Neill
Birth Date: June 14, 1951
TRUSTEE
Began serving: October 2006 | Principal Occupations: Director or Trustee of the Federated Fund Complex; Managing Director and Partner, Navigator Management Company, L.P. (investment and strategic consulting).
Other Directorships Held: Board of Overseers, Children's Hospital of Boston; Visiting Committee on Athletics, Harvard College.
Previous Positions: Chief Executive Officer and President, Managing Director and Chief Investment Officer, Fleet Investment Advisors; President and Chief Executive Officer, Aeltus Investment Management, Inc.; General Partner, Hellman, Jordan Management Co., Boston, MA; Chief Investment Officer, The Putnam Companies, Boston, MA; Credit Analyst and Lending Officer, Fleet Bank; Director and Consultant, EZE Castle Software (investment order management software); Director, Midway Pacific (lumber). |
Annual Shareholder Report32
Name
Birth Date
Positions Held with Trust
Date Service Began | Principal Occupation(s) for Past Five Years,
Other Directorships Held and Previous Position(s) |
John S. Walsh
Birth Date: November 28, 1957
TRUSTEE
Began serving: January 1999 | Principal Occupations: Director or Trustee of the Federated Fund Complex; President and Director, Heat Wagon, Inc. (manufacturer of construction temporary heaters); President and Director, Manufacturers Products, Inc. (distributor of portable construction heaters); President, Portable Heater Parts, a division of Manufacturers Products, Inc.
Previous Position: Vice President, Walsh & Kelly, Inc. |
James F. Will
Birth Date: October 12, 1938
TRUSTEE
Began serving: April 2006 | Principal Occupations: Director or Trustee of the Federated Fund Complex; formerly, Vice Chancellor and President, Saint Vincent College.
Other Directorships Held: Trustee, Saint Vincent College; Alleghany Corporation.
Previous Positions: Chairman, President and Chief Executive Officer, Armco, Inc.; President and Chief Executive Officer, Cyclops Industries; President and Chief Operating Officer, Kaiser Steel Corporation. |
OFFICERS
Name
Birth Date
Address
Positions Held with Trust
Date Service Began | Principal Occupation(s) for Past Five Years
and Previous Position(s) |
John W. McGonigle
Birth Date: October 26, 1938
EXECUTIVE VICE PRESIDENT AND SECRETARY
Began serving: April 1984 | Principal Occupations: Executive Vice President and Secretary of the Federated Fund Complex; Vice Chairman, Executive Vice President, Secretary and Director, Federated Investors, Inc.
Previous Positions: Trustee, Federated Investment Management Company and Federated Investment Counseling; Director, Federated Global Investment Management Corp., Federated Services Company and Federated Securities Corp. |
Richard A. Novak
Birth Date: December 25, 1963
TREASURER
Began serving: January 2006 | Principal Occupations: Principal Financial Officer and Treasurer of the Federated Fund Complex; Senior Vice President, Federated Administrative Services; Financial and Operations Principal for Federated Securities Corp., Edgewood Services, Inc. and Southpointe Distribution Services, Inc.
Previous Positions: Controller of Federated Investors, Inc.; Vice President, Finance of Federated Services Company; held various financial management positions within The Mercy Hospital of Pittsburgh; Auditor, Arthur Andersen & Co. |
Richard B. Fisher
Birth Date: May 17, 1923
VICE PRESIDENT
Began serving: April 1984 | Principal Occupations: Vice Chairman or Vice President of some of the Funds in the Federated Fund Complex; Vice Chairman, Federated Investors, Inc.; Chairman, Federated Securities Corp.
Previous Positions: President and Director or Trustee of some of the Funds in the Federated Fund Complex; Executive Vice President, Federated Investors, Inc.; Director and Chief Executive Officer, Federated Securities Corp. |
Annual Shareholder Report33
Name
Birth Date
Address
Positions Held with Trust
Date Service Began | Principal Occupation(s) for Past Five Years
and Previous Position(s) |
Brian P. Bouda
Birth Date: February 28, 1947
CHIEF COMPLIANCE OFFICER AND SENIOR VICE PRESIDENT
Began serving: August 2004 | Principal Occupations: Senior Vice President and Chief Compliance Officer of the Federated Fund Complex; Vice President and Chief Compliance Officer of Federated Investors, Inc. and Chief Compliance Officer of its subsidiaries. Mr. Bouda joined Federated in 1999 and is a member of the American Bar Association and the State Bar Association of Wisconsin. |
Stephen F. Auth
Birth Date: September 3, 1956
450 Lexington Avenue
Suite 3700
New York, NY 10017-3943
CHIEF INVESTMENT OFFICER
Began serving: November 2002 | Principal Occupations: Mr. Auth is Chief Investment Officer of this Fund and various other Funds in the Federated Fund Complex; Executive Vice President, Federated Investment Counseling, Federated Global Investment Management Corp. and Federated Equity Management Company of Pennsylvania.
Previous Positions: Executive Vice President, Federated Investment Management Company, and Passport Research, Ltd. (investment advisory subsidiary of Federated); Senior Vice President, Global Portfolio Management Services Division; Senior Vice President, Federated Investment Management Company and Passport Research, Ltd.; Senior Managing Director and Portfolio Manager, Prudential Investments. |
Lawrence Auriana
Birth Date: January 8, 1944
140 East 45th Street
New York, NY 10017
VICE PRESIDENT
Began serving: November 2001 | Principal Occupations: Lawrence Auriana has been the Fund's Portfolio Manager since December 2007. He is Vice President of the Trust. Mr. Auriana joined Federated in April 2001 as Co-Head of Investments/Federated Kaufmann. From August 1984 to April 2001, Mr. Auriana was President and Treasurer of Edgemont Asset Management Corp., and Chairman of the Board and Portfolio Manager to The Kaufmann Fund, Inc. (predecessor to the Federated Kaufmann Fund). Mr. Auriana earned a B.S. in economics from Fordham University and has been engaged in the securities business since 1965. |
Walter C. Bean
Birth Date: June 22, 1945
VICE PRESIDENT
Began serving: November 2006 | Principal Occupations: Walter C. Bean is Vice President of the Trust. Mr. Bean is a Senior Vice President, Senior Portfolio Manager and the Head of the Equity Income Management Team of the Fund's Adviser. Mr. Bean joined Federated in 2000. His previous associations included: various investment management and research positions with C.S. McKee & Company; First Chicago Investment Advisors; CIGNA Investment Advisors; and Mellon Bank. Mr. Bean earned a Bachelors Degree in Business Administration from Ohio University and an M.B.A. from the Pennsylvania State University. Mr. Bean is a Chartered Financial Analyst and has 40 years of investment experience. |
Hans P. Utsch
Birth Date: July 3, 1936
VICE PRESIDENT
Began serving: November 2001 | Principal Occupations: Hans P. Utsch has been the Fund's Portfolio Manager since December 2007. He is Vice President of the Trust. Mr. Utsch joined Federated in April 2001 as Co-Head of Investments/Federated Kaufmann. From August 1984 to April 2001, Mr. Utsch was Chairman of the Board and Secretary of Edgemont Asset Management Corp., and President and Portfolio Manager to The Kaufmann Fund, Inc. (predecessor to the Federated Kaufmann Fund). Mr. Utsch graduated from Amherst College and holds an M.B.A. from Columbia University. He has been engaged in the securities business since 1962. |
Annual Shareholder Report34
Evaluation and Approval of Advisory Contract - May 2009
Federated Kaufmann Large Cap Fund (the “Fund”)
The Fund's Board reviewed the Fund's investment advisory and subadvisory contracts at meetings held in May 2009. The Board's decision regarding these contracts reflects the exercise of its business judgment on whether to continue the existing arrangements.
In this connection, the Federated funds' Board had previously appointed a Senior Officer, whose duties include specified responsibilities relating to the process by which advisory fees are to be charged to a Federated fund. The Senior Officer has the authority to retain consultants, experts, or staff as may be reasonably necessary to assist in the performance of his duties, reports directly to the Board, and may be terminated only with the approval of a majority of the independent members of the Board. The Senior Officer prepared and furnished to the Board an independent, written evaluation that covered topics discussed below. The Board considered that evaluation, along with other information, in deciding to approve the advisory and subadvisory contracts.
During its review of these contracts, the Board considered compensation and benefits received by the Adviser and subadviser. This included the fees received for services provided to the Fund by other entities in the Federated organization and research services received by the Adviser from brokers that execute Federated fund trades, as well as advisory fees. The Board is also familiar with and considered judicial decisions concerning allegedly excessive investment advisory fees, which have indicated that the following factors may be relevant to an Adviser's fiduciary duty with respect to its receipt of compensation from a fund: the nature and quality of the services provided by the Adviser, including the performance of the fund; the Adviser's cost of providing the services; the extent to which the Adviser may realize “economies of scale” as a fund grows larger; any indirect benefits that may accrue to the Adviser and its affiliates as a result of the Adviser's relationship with a fund; performance and expenses of comparable funds; and the extent to which the independent Board members are fully informed about all facts the Board deems relevant bearing on the Adviser's services and fees. The Board further considered management fees (including any components thereof) charged to institutional and other clients of the Adviser and subadviser for what might be viewed as like services, and the cost to the Adviser and its affiliates of supplying services pursuant to the management fee agreements, excluding any intra-corporate profit and profit margins of the Adviser and its affiliates for supplying such services. The Board was aware of these factors and was guided by them in its review of the Fund's advisory and subadvisory contracts to the extent it considered them to be appropriate and relevant, as discussed further below.
Annual Shareholder Report35
The Board considered and weighed these circumstances in light of its substantial accumulated experience in governing the Fund and working with Federated on matters relating to the Federated funds, and was assisted in its deliberations by independent legal counsel. Throughout the year, the Board has requested and received substantial and detailed information about the Fund and the Federated organization that was in addition to the extensive materials that comprise and accompany the Senior Officer's evaluation. Federated provided much of this information at each regular meeting of the Board, and furnished additional reports in connection with the particular meeting at which the Board's formal review of the advisory and subadvisory contracts occurred. Between regularly scheduled meetings, the Board also received information on particular matters as the need arose. Thus, the Board's consideration of the advisory and subadvisory contracts included review of the Senior Officer's evaluation, accompanying data and additional reports covering such matters as: the Adviser's and subadviser's investment philosophy, revenue, profitability, personnel and processes; investment and operating strategies; the Fund's short- and long-term performance (in absolute terms, both on a gross basis and net of expenses, as well as in relationship to its particular investment program and certain competitor or “peer group” funds and/or other benchmarks, as appropriate), and comments on the reasons for performance; the Fund's investment objectives; the Fund's expenses (including the advisory fee itself and the overall expense structure of the Fund, both in absolute terms and relative to similar and/or competing funds, with due regard for contractual or voluntary expense limitations); the use and allocation of brokerage commissions derived from trading the Fund's portfolio securities (if any); and the nature, quality and extent of the advisory and other services provided to the Fund by the Adviser and its affiliates. The Board also considered the preferences and expectations of Fund shareholders and their relative sophistication; the continuing state of competition in the mutual fund industry and market practices; the range of comparable fees for similar funds in the mutual fund industry; the Fund's relationship to the Federated family of funds which include a comprehensive array of funds with different investment objectives, policies and strategies which are available for exchange without the incurrence of additional sales charges; compliance and audit reports concerning the Federated funds and the Federated companies that service them (including communications from regulatory agencies), as well as Federated's responses to any issues raised therein; and relevant developments in the mutual fund industry and how the Federated funds and/or Federated are responding to them. The Board's evaluation process is evolutionary. The criteria considered and the emphasis placed on relevant criteria change in recognition of changing circumstances in the mutual fund marketplace. Annual Shareholder Report36
With respect to the Fund's performance and expenses in particular, the Board has found the use of comparisons to other mutual funds with comparable investment programs to be particularly useful, given the high degree of competition in the mutual fund business. The Board focused on comparisons with other similar mutual funds more heavily than non-mutual fund products or services because, it is believed that, they are more relevant. For example, other mutual funds are the products most like the Fund, they are readily available to Fund shareholders as alternative investment vehicles, and they are the type of investment vehicle in fact chosen and maintained by the Fund's investors. The range of their fees and expenses therefore appears to be a generally reliable indication of what consumers have found to be reasonable in the precise marketplace in which the Fund competes. The Fund's ability to deliver competitive performance when compared to its peer group was a useful indicator of how the Adviser is executing the Fund's investment program, which in turn assisted the Board in reaching a conclusion that the nature, extent, and quality of the Adviser's investment management services were such as to warrant continuation of the advisory contract. In this regard, the Senior Officer has reviewed Federated's fees for providing advisory services to products outside the Federated family of funds (e.g., institutional and separate accounts). He concluded that mutual funds and institutional accounts are inherently different products. Those differences include, but are not limited to, different types of targeted investors; being subject to different laws and regulations; different legal structures; different average account sizes; different associated costs; different portfolio management techniques made necessary by different cash flows; and portfolio manager time spent in review of securities pricing. The Senior Officer did not consider these fee schedules to be determinative in judging the appropriateness of mutual fund advisory contracts.The Senior Officer reviewed reports compiled by Federated, using data supplied by independent fund ranking organizations, regarding the performance of, and fees charged by, other mutual funds, noting his view that comparisons to fund peer groups are highly important in judging the reasonableness of proposed fees.
For the one-year period covered by the report, the Fund's performance was above the median of the relevant peer group.
The Board also received financial information about Federated, including reports on the compensation and benefits Federated derived from its relationships with the Federated funds. These reports covered not only the fees under the advisory contracts, but also fees received by Federated's subsidiaries for providing other services to the Federated funds under separate contracts (e.g., for serving as the Federated funds' administrator). The reports also discussed any indirect benefit Federated may derive from its receipt of research services from brokers who execute Federated fund trades. In addition, the Board considered the fact that, in order for a fund to be competitive in the marketplace, Federated and its affiliates frequently waived fees and/or Annual Shareholder Report37
reimbursed expenses and have disclosed to fund investors and/or indicated to the Board their intention to do so in the future, where appropriate. Moreover, the Board receives regular reports regarding the institution or elimination of these voluntary waivers.Federated furnished reports, requested by the Senior Officer, that reported revenues on a fund-by-fund basis and made estimates of the allocation of expenses on a fund-by-fund basis, using allocation methodologies specified by the Senior Officer. The Senior Officer noted that, although they may apply consistent allocation processes, the inherent difficulties in allocating costs (and the unavoidable arbitrary aspects of that exercise) and the lack of consensus on how to allocate those costs may render such allocation reports unreliable. The allocation reports were considered in the analysis by the Board but were determined to be of limited use.
The Board and the Senior Officer also reviewed a report compiled by Federated comparing profitability information for Federated to other publicly held fund management companies. In this regard, the Senior Officer noted the limited availability of such information, but nonetheless concluded that Federated's profit margins did not appear to be excessive and the Board agreed.
The Senior Officer's evaluation also discussed the notion of possible realization of “economies of scale” as a fund grows larger. The Board considered in this regard that the Adviser has made significant and long-term investments in areas that support all of the Federated funds, such as personnel and processes for the portfolio management, compliance, and risk management functions; and systems technology; and that the benefits of these efforts (as well as any economies, should they exist) were likely to be enjoyed by the fund complex as a whole. Finally, the Board also noted the absence of any applicable regulatory or industry guidelines on this subject, which (as discussed in the Senior Officer's evaluation) is compounded by the lack of any common industry practice or general pattern with respect to structuring fund advisory fees with “breakpoints” that serve to reduce the fee as the fund attains a certain size. The Senior Officer did not recommend institution of breakpoints in pricing Federated's fund advisory services at this time.
It was noted in the materials for the Board meeting that for the period covered by the report, the Fund's investment advisory fee was waived in its entirety. The Board reviewed the contractual fee rate and other expenses of the Fund with the Adviser and was satisfied that the overall expense structure of the Fund remained competitive.
The Senior Officer's evaluation noted his belief that the information and observations contained in his evaluation supported a finding that the proposed management fees are reasonable, and that Federated appeared to provide appropriate administrative services to the Fund for the fees paid. Under these Annual Shareholder Report38
circumstances, no changes were recommended to, and no objection was raised to, the continuation of the Fund's advisory and subadvisory contracts. The Board concluded that the nature, quality and scope of services provided the Fund by the Adviser and its affiliates were satisfactory.In its decision to continue an existing investment advisory contract, the Board was mindful of the potential disruptions of the Fund's operations and various risks, uncertainties and other effects that could occur as a result of a decision to terminate or not renew an advisory contract. In particular, the Board recognized that many shareholders have invested in the Fund on the strength of the Adviser's industry standing and reputation and with the expectation that the Adviser will have a continuing role in providing advisory services to the Fund. Thus, the Board's approval of the advisory contract reflected the fact that it is the shareholders who have effectively selected the Adviser by virtue of having invested in the Fund.
The Board based its decision to approve the advisory and subadvisory contracts on the totality of the circumstances and relevant factors and with a view to past and future long-term considerations. Not all of the factors and considerations identified above were necessarily relevant to the Fund, nor did the Board consider any one of them to be determinative. With respect to the factors that were relevant, the Board's decision to approve the contract reflects its determination that Federated's performance and actions provided a satisfactory basis to support the decision to continue the existing arrangements.
Annual Shareholder Report39
Voting Proxies on Fund Portfolio Securities
A description of the policies and procedures that the Fund uses to determine how to vote proxies, if any, relating to securities held in the Fund's portfolio is available, without charge and upon request, by calling 1-800-341-7400. A report on “Form N-PX” of how the Fund voted any such proxies during the most recent 12-month period ended June 30 is available from Federated's Web site at FederatedInvestors.com. To access this information from the “Products” section of the Web site, click on the “Prospectuses and Regulatory Reports” link under “Related Information,” then select the appropriate link opposite the name of the Fund; or select the name of the Fund and from the Fund's page, click on the “Prospectuses and Regulatory Reports” link. Form N-PX filings are also available at the SEC's Web site at www.sec.gov.
Quarterly Portfolio Schedule
The Fund files with the SEC a complete schedule of its portfolio holdings, as of the close of the first and third quarters of its fiscal year, on “Form N-Q.” These filings are available on the SEC's Web site at www.sec.gov and may be reviewed and copied at the SEC's Public Reference Room in Washington, DC. (Call 1-800-SEC-0330 for information on the operation of the Public Reference Room.) You may also access this information from the “Products” section of Federated's Web site at FederatedInvestors.com by clicking on “Portfolio Holdings” under “Related Information,” then selecting the appropriate link opposite the name of the Fund; or select the name of the Fund and from the Fund's page, click on the “Portfolio Holdings” link.
Annual Shareholder Report40
Notes
41
Notes42
Notes43
Notes44
Notes45
Notes46
Mutual funds are not bank deposits or obligations, are not guaranteed by any bank and are not insured or guaranteed by the U.S. government, the Federal Deposit Insurance Corporation, the Federal Reserve Board or any other government agency. Investment in mutual funds involves investment risk, including the possible loss of principal.
This Report is authorized for distribution to prospective investors only when preceded or accompanied by the Fund's Prospectus, which contains facts concerning its objective and policies, management fees, expenses and other information.
Federated Kaufmann Large Cap Fund
Federated Investors Funds
4000 Ericsson Drive
Warrendale, PA 15086-7561
Contact us at FederatedInvestors.com
or call 1-800-341-7400.
Federated Securities Corp., Distributor
Cusip 314172412
39668 (12/09)
Federated is a registered mark of Federated Investors, Inc.
2009 Federated Investors, Inc.
Federated Kaufmann Small Cap FundEstablished 2002
A Portfolio of Federated Equity Funds
ANNUAL SHAREHOLDER REPORTOctober 31, 2009
Class A Shares
Class B Shares
Class C Shares
Class K Shares
FINANCIAL HIGHLIGHTS
SHAREHOLDER EXPENSE EXAMPLE
MANAGEMENT'S DISCUSSION OF FUND PERFORMANCE
PORTFOLIO OF INVESTMENTS SUMMARY TABLE
PORTFOLIO OF INVESTMENTS
STATEMENT OF ASSETS AND LIABILITIES
STATEMENT OF OPERATIONS
STATEMENT OF CHANGES IN NET ASSETS
NOTES TO FINANCIAL STATEMENTS
REPORT OF INDEPENDENT REGISTERED PUBLIC ACCOUNTING FIRM
BOARD OF TRUSTEES AND TRUST OFFICERS
EVALUATION AND APPROVAL OF ADVISORY CONTRACT
VOTING PROXIES ON FUND PORTFOLIO SECURITIES
QUARTERLY PORTFOLIO SCHEDULE
Financial Highlights - Class A Shares
(For a Share Outstanding Throughout Each Period)
| Year Ended October 31 | 2009 | 2008 | 2007 | 2006 | 2005 |
| Net Asset Value, Beginning of Period | $15.19 | $28.16 | $24.45 | $20.60 | $19.30 |
| Income From Investment Operations: | | | | | |
| Net investment income (loss) | (0.09)1 | (0.17)1 | (0.30)1 | (0.33)1 | (0.35)1 |
| Net realized and unrealized gain (loss) on investments, written options and foreign currency transactions | 2.75 | (11.95) | 5.19 | 4.51 | 2.76 |
| TOTAL FROM INVESTMENT OPERATIONS | 2.66 | (12.12) | 4.89 | 4.18 | 2.41 |
| Less Distributions: | | | | | |
| Distributions from net realized gain on investments and foreign currency transactions | — | (0.85) | (1.18) | (0.33) | (1.11) |
| Net Asset Value, End of Period | $17.85 | $15.19 | $28.16 | $24.45 | $20.60 |
| Total Return2 | 17.51% | (44.29)% | 20.92% | 20.50% | 12.79% |
| Ratios to Average Net Assets: | | | | | |
| Net expenses | 1.95%3 | 1.95%3 | 1.95% | 1.95% | 1.95% |
| Net investment income (loss) | (0.58)% | (0.77)% | (1.15)% | (1.39)% | (1.73)% |
| Expense waiver/reimbursement4 | 0.38% | 0.28% | 0.24% | 0.24% | 0.28% |
| Supplemental Data: | | | | | |
| Net assets, end of period (000 omitted) | $709,757 | $543,187 | $967,496 | $724,411 | $371,092 |
| Portfolio turnover | 90% | 58% | 46% | 51% | 42% |
| 1 | Per share numbers have been calculated using the average shares method. |
| 2 | Based on net asset value, which does not reflect the sales charge, redemption fee or contingent deferred sales charge, if applicable. |
| 3 | The net expense ratio is calculated without reduction for expense offset arrangements. The net expense ratios are 1.95% and 1.95% for the years ended October 31, 2009 and 2008, respectively, after taking into account these expense reductions. |
| 4 | This expense decrease is reflected in both the net expense and the net investment income (loss) ratios shown above. |
- See Notes which are an integral part of the Financial Statements
Annual Shareholder Report1
Financial Highlights - Class B Shares
(For a Share Outstanding Throughout Each Period)
| Year Ended October 31 | 2009 | 2008 | 2007 | 2006 | 2005 |
| Net Asset Value, Beginning of Period | $14.71 | $27.45 | $23.99 | $20.33 | $19.16 |
| Income From Investment Operations: | | | | | |
| Net investment income (loss) | (0.17)1 | (0.29)1 | (0.43)1 | (0.45)1 | (0.46)1 |
| Net realized and unrealized gain (loss) on investments, written options and foreign currency transactions | 2.65 | (11.60) | 5.07 | 4.44 | 2.74 |
| TOTAL FROM INVESTMENT OPERATIONS | 2.48 | (11.89) | 4.64 | 3.99 | 2.28 |
| Less Distributions: | | | | | |
| Distributions from net realized gain on investments and foreign currency transactions | — | (0.85) | (1.18) | (0.33) | (1.11) |
| Net Asset Value, End of Period | $17.19 | $14.71 | $27.45 | $23.99 | $20.33 |
| Total Return2 | 16.86% | (44.61)% | 20.25% | 19.83% | 12.17% |
| Ratios to Average Net Assets: | | | | | |
| Net expenses | 2.50%3 | 2.50%3 | 2.50% | 2.50% | 2.50% |
| Net investment income (loss) | (1.11)% | (1.35)% | (1.70)% | (1.95)% | (2.28)% |
| Expense waiver/reimbursement4 | 0.36% | 0.28% | 0.23% | 0.24% | 0.23% |
| Supplemental Data: | | | | | |
| Net assets, end of period (000 omitted) | $76,876 | $78,150 | $177,325 | $159,357 | $117,744 |
| Portfolio turnover | 90% | 58% | 46% | 51% | 42% |
| 1 | Per share numbers have been calculated using the average shares method. |
| 2 | Based on net asset value, which does not reflect the sales charge, redemption fee or contingent deferred sales charge, if applicable. |
| 3 | The net expense ratio is calculated without reduction for expense offset arrangements. The net expense ratios are 2.50% and 2.50% for the years ended October 31, 2009 and 2008, respectively, after taking into account these expense reductions. |
| 4 | This expense decrease is reflected in both the net expense and the net investment income (loss) ratios shown above. |
- See Notes which are an integral part of the Financial Statements
Annual Shareholder Report2
Financial Highlights - Class C Shares
(For a Share Outstanding Throughout Each Period)
| Year Ended October 31 | 2009 | 2008 | 2007 | 2006 | 2005 |
| Net Asset Value, Beginning of Period | $14.71 | $27.45 | $23.99 | $20.33 | $19.16 |
| Income From Investment Operations: | | | | | |
| Net investment income (loss) | (0.17)1 | (0.29)1 | (0.43)1 | (0.45)1 | (0.46)1 |
| Net realized and unrealized gain (loss) on investments, written options and foreign currency transactions | 2.65 | (11.60) | 5.07 | 4.44 | 2.74 |
| TOTAL FROM INVESTMENT OPERATIONS | 2.48 | (11.89) | 4.64 | 3.99 | 2.28 |
| Less Distributions: | | | | | |
| Distributions from net realized gain on investments and foreign currency transactions | — | (0.85) | (1.18) | (0.33) | (1.11) |
| Net Asset Value, End of Period | $17.19 | $14.71 | $27.45 | $23.99 | $20.33 |
| Total Return2 | 16.86% | (44.61)% | 20.25% | 19.83% | 12.17% |
| Ratios to Average Net Assets: | | | | | |
| Net expenses | 2.50%3 | 2.50%3 | 2.50% | 2.50% | 2.50% |
| Net investment income (loss) | (1.12)% | (1.34)% | (1.70)% | (1.94)% | (2.28)% |
| Expense waiver/reimbursement4 | 0.34% | 0.28% | 0.23% | 0.24% | 0.23% |
| Supplemental Data: | | | | | |
| Net assets, end of period (000 omitted) | $175,955 | $175,301 | $358,085 | $259,215 | $152,232 |
| Portfolio turnover | 90% | 58% | 46% | 51% | 42% |
| 1 | Per share numbers have been calculated using the average shares method. |
| 2 | Based on net asset value, which does not reflect the sales charge, redemption fee or contingent deferred sales charge, if applicable. |
| 3 | The net expense ratio is calculated without reduction for expense offset arrangements. The net expense ratios are 2.50% and 2.50% for the years ended October 31, 2009 and 2008, respectively, after taking into account these expense reductions. |
| 4 | This expense decrease is reflected in both the net expense and the net investment income (loss) ratios shown above. |
- See Notes which are an integral part of the Financial Statements
Annual Shareholder Report3
Financial Highlights - Class K Shares
(For a Share Outstanding Throughout Each Period)
| Year Ended October 31 | 2009 | 2008 | 2007 | 20061 |
| Net Asset Value, Beginning of Period | $15.19 | $28.16 | $24.45 | $20.60 |
| Income From Investment Operations: | | | | |
| Net investment income (loss) | (0.09)2 | (0.16)2 | (0.29)2 | (0.29)2 |
| Net realized and unrealized gain (loss) on investments, written options and foreign currency transactions | 2.75 | (11.96) | 5.18 | 4.47 |
| TOTAL FROM INVESTMENT OPERATIONS | 2.66 | (12.12) | 4.89 | 4.18 |
| Less Distributions: | | | | |
| Distributions from net realized gain on investments and foreign currency transactions | — | (0.85) | (1.18) | (0.33) |
| Net Asset Value, End of Period | $17.85 | $15.19 | $28.16 | $24.45 |
| Total Return3 | 17.51% | (44.29)% | 20.92% | 20.50% |
| Ratios to Average Net Assets: | | | | |
| Net expenses | 1.95%4 | 1.95%4 | 1.95% | 1.95% |
| Net investment income (loss) | (0.58)% | (0.73)% | (1.15)% | (1.25)% |
| Expense waiver/reimbursement5 | 0.49% | 0.46% | 0.44% | 0.45% |
| Supplemental Data: | | | | |
| Net assets, end of period (000 omitted) | $25,955 | $17,665 | $20,440 | $7,838 |
| Portfolio turnover | 90% | 58% | 46% | 51% |
| 1 | The date of initial investment was November 1, 2005. |
| 2 | Per share numbers have been calculated using the average shares method. |
| 3 | Based on net asset value, which does not reflect the sales charge, redemption fee or contingent deferred sales charge, if applicable. |
| 4 | The net expense ratio is calculated without reduction for expense offset arrangements. The net expense ratios are 1.95% and 1.95% for the years ended October 31, 2009 and 2008, respectively, after taking into account these expense reductions. |
| 5 | This expense decrease is reflected in both the net expense and the net investment income (loss) ratios shown above. |
- See Notes which are an integral part of the Financial Statements
Annual Shareholder Report4
Shareholder Expense Example (unaudited)
As a shareholder of the Fund, you incur two types of costs: (1) transaction costs, including sales charges (loads) on purchase or redemption payments; and (2) ongoing costs, including management fees and to the extent applicable, distribution (12b-1) fees and/or shareholder services fees and other Fund expenses. This Example is intended to help you to understand your ongoing costs (in dollars) of investing in the Fund and to compare these costs with the ongoing costs of investing in other mutual funds. It is based on an investment of $1,000 invested at the beginning of the period and held for the entire period from May 1, 2009 to October 31, 2009.
ACTUAL EXPENSES
The first section of the table below provides information about actual account values and actual expenses. You may use the information in this section, together with the amount you invested, to estimate the expenses that you incurred over the period. Simply divide your account value by $1,000 (for example, an $8,600 account value divided by $1,000 = 8.6), then multiply the result by the number in the first section under the heading entitled “Expenses Paid During Period” to estimate the expenses attributable to your investment during this period.
HYPOTHETICAL EXAMPLE FOR COMPARISON PURPOSES
The second section of the table below provides information about hypothetical account values and hypothetical expenses based on the Fund's actual expense ratio and an assumed rate of return of 5% per year before expenses, which is not the Fund's actual return. Thus, you should not use the hypothetical account values and expenses to estimate the actual ending account balance or your expenses for the period. Rather, these figures are required to be provided to enable you to compare the ongoing costs of investing in the Fund with other funds. To do so, compare this 5% hypothetical example with the 5% hypothetical examples that appear in the shareholder reports of the other funds.
Annual Shareholder Report5
Please note that the expenses shown in the table are meant to highlight your ongoing costs only and do not reflect any transaction costs, such as sales charges (loads) on purchase or redemption payments. Therefore, the second section of the table is useful in comparing ongoing costs only, and will not help you determine the relative total costs of owning different funds. In addition, if these transaction costs were included, your costs would have been higher. | Beginning
Account Value
5/1/2009 | Ending
Account Value
10/31/2009 | Expenses Paid
During Period1 |
| Actual: | | | |
| Class A Shares | $1,000 | $1,198.80 | $10.81 |
| Class B Shares | $1,000 | $1,195.40 | $13.83 |
| Class C Shares | $1,000 | $1,195.40 | $13.83 |
| Class K Shares | $1,000 | $1,198.80 | $10.81 |
Hypothetical (assuming a 5% return
before expenses): | | | |
| Class A Shares | $1,000 | $1,015.38 | $9.91 |
| Class B Shares | $1,000 | $1,012.60 | $12.68 |
| Class C Shares | $1,000 | $1,012.60 | $12.68 |
| Class K Shares | $1,000 | $1,015.38 | $9.91 |
| 1 | Expenses are equal to the Fund's annualized net expense ratios, multiplied by the average account value over the period, multiplied by 184/365 (to reflect the one-half-year period). The annualized net expense ratios are as follows: |
| Class A Shares | 1.95% |
| Class B Shares | 2.50% |
| Class C Shares | 2.50% |
| Class K Shares | 1.95% |
Annual Shareholder Report6
Performance data quoted represents past performance which is no guarantee of future results. Investment return and principal value will fluctuate so that an investor's shares, when redeemed, may be worth more or less than their original cost. Mutual fund performance changes over time and current performance may be lower or higher than what is stated. For current to the most recent month-end performance and after-tax returns, visit FederatedInvestors.com or call 1-800-341-7400.
Management's Discussion of Fund Performance (unaudited)
The Federated Kaufmann Small Cap Fund's Class A Shares, Class B Shares, Class C Shares and Class K Shares produced total returns of 17.51%, 16.86%, 16.86% and 17.51%, respectively, based on the net asset value for the reporting period ended October 31, 2009. The Fund's benchmark, the Russell 2000® Growth Index (R2000G) had a total return of 11.34%1 for the reporting period and the Lipper Small-Cap Growth Funds Average (LSCGFA) had a median total return of 3.04%.2
MARKET OVERVIEW
The stock market as a whole posted strong positive returns during the latter portion of the reporting period. The global financial crisis continued throughout the period, but in March the Standard & Poor's 500 Index (S&P 500)3 bottomed and began a 50% plus rally. Mid-cap stocks performed best during the period followed by large-cap stocks and then small-cap stocks. In terms of style, growth stocks outperformed value stocks across large-, mid- and small-cap stock groupings.
The period began with economies across the world slowing as credit contracted. In response to the credit crisis, the Federal Reserve, as well as many other countries, cut their discount and federal funds target rates several times at the beginning of the reporting period and maintained them at their lowest levels. The end of the period was marked by a light at the end of the tunnel with some positive economic data on housing, productivity, corporate profits and trade appearing.
The strongest sectors in the R2000G during the period were Consumer Discretionary (+32%), Information Technology (+30%) and Utilities (+16%). The weakest sectors were Industrials (-5%), Energy (-3%) and Financials (-3%).
| 1 | The R2000G measures the performance of those Russell 2000 companies with higher price-to-book ratios and higher forecasted growth values. The index is unmanaged and, unlike the Fund, is not affected by cash flows. Investments cannot be made in an index. |
| 2 | Lipper figures represent the average of the total returns reported by all of the mutual funds designed by Lipper, Inc. as falling in the category indicated. They do not reflect sales charges. |
| 3 | The S&P 500 is an unmanaged capitalization-weighted index of 500 stocks designed to measure performance of the broad domestic economy through changes in the aggregate market value of 500 stocks representing all major industries. The index is unmanaged and, unlike the Fund, is not affected by cash flows. Investments cannot be made in an index. |
Annual Shareholder Report7
FUND PERFORMANCE
The Fund's performance4 is driven primarily by bottom-up stock selection. Six of the Fund's top ten contributing companies across multiple sectors each returned over 80% during the reporting period. Specifically, Hypermarcas (+276%), Hhgregg (+201%), Rural Electrification (+230%), Commvault (+84%), Orthofix (+136%) and Omniture (+87%) all contributed strongly to performance. In addition, Meritage (+33%), AuxiliumPharmaceuticals (+60%), Dick'sSportingGoods (+48%) and WarnerChilcott (+60%) were also among the Fund's top ten contributing companies.
Six of the Fund's laggard companies were in the Industrials Sector. Specifically, Delta Airlines (-40%), Continental Airlines (-43%), Kansas City Southern (-47%), Pacer Int'l (-62%), UAL Corp (-55%) and Innovative Solutions (-26%) all detracted from performance. Additional laggards included MEMC Electronics (-32%), ProgenicsPharmaceuticals (-58%), CubistPharmaceuticals (-33%) and Microsemiconductor (-39%). A particular industry that negatively affected performance was Transportation where six of the Fund's holdings in the industry were down more than 24%. While it is interesting to know how specific stocks performed during the period, the success of these holdings won't be known until they are sold, typically over longer periods.
The sector exposures that result from the Fund's bottom-up investment process may provide some additional insight into the relative performance of the Fund. An underweight in the Information Technology sector relative to the benchmark hurt performance somewhat. The Fund's performance was also negatively impacted by the Fund's cash position which ranged between 0% and 10% during the period.
| 4 | Small company stocks may be less liquid and subject to greater price volatility than large capitalization stocks. |
Annual Shareholder Report8
GROWTH OF A $10,000 INVESTMENT - CLASS A SHARES
The graph below illustrates the hypothetical investment of $10,0001 in Federated Kaufmann Small Cap Fund (Class A Shares) (the “Fund”) from December 18, 2002 (start of performance) to October 31, 2009, compared to the Russell 2000 Growth Index (R2000G)2 and the Lipper Small-Cap Growth Funds Average (LSCGFA).2
| Average Annual Total Returns3 for the Period Ended 10/31/2009 | |
| 1 Year | 11.08% |
| 5 Years | 0.34% |
| Start of Performance (12/18/2002) | 10.54% |
Performance data quoted represents past performance which is no guarantee of future results. Investment return and principal value will fluctuate so that an investor's shares, when redeemed, may be worth more or less than their original cost. Mutual fund performance changes over time and current performance may be lower or higher than what is stated. For current to the most recent month-end performance and after-tax returns, visit FederatedInvestors.com or call 1-800-341-7400. Returns shown do not reflect the deduction of taxes that a shareholder would pay on Fund distributions or the redemption of Fund shares. Mutual funds are not obligations of or guaranteed by any bank and are not federally insured. Total returns shown include the maximum sales charge of 5.50%.
| 1 | Represents a hypothetical investment of $10,000 in the Fund after deducting the maximum sales charge of 5.50% ($10,000 investment minus $550 sales charge = $9,450). The Fund's performance assumes the reinvestment of all dividends and distributions. The R2000G and the LSCGFA have been adjusted to reflect reinvestment of dividends on securities in the index and the average. |
| 2 | The R2000G is not adjusted to reflect sales charges, expenses or other fees that the Securities and Exchange Commission (SEC) requires to be reflected in the Fund's performance. The LSCGFA represents the average of the total returns reported by all of the mutual funds designated by Lipper, Inc. as falling in the respective category indicated, and is not adjusted to reflect any sales charges. However, these total returns are reported net of expenses or other fees that the SEC requires to be reflected in a fund's performance. The R2000G is unmanaged and, unlike the Fund, is not affected by cash flows. It is not possible to invest directly in an index. |
| 3 | Total returns quoted reflect all applicable sales charges. |
Annual Shareholder Report9
GROWTH OF A $10,000 INVESTMENT - CLASS B SHARES
The graph below illustrates the hypothetical investment of $10,0001 in Federated Kaufmann Small Cap Fund (Class B Shares) (the “Fund”) from December 18, 2002 (start of performance) to October 31, 2009, compared to the Russell 2000 Growth Index (R2000G)2 and the Lipper Small-Cap Growth Funds Average (LSCGFA).2
| Average Annual Total Returns3 for the Period Ended 10/31/2009 | |
| 1 Year | 11.36% |
| 5 Years | 0.56% |
| Start of Performance (12/18/2002) | 10.89% |
Performance data quoted represents past performance which is no guarantee of future results. Investment return and principal value will fluctuate so that an investor's shares, when redeemed, may be worth more or less than their original cost. Mutual fund performance changes over time and current performance may be lower or higher than what is stated. For current to the most recent month-end performance and after-tax returns, visit FederatedInvestors.com or call 1-800-341-7400. Returns shown do not reflect the deduction of taxes that a shareholder would pay on Fund distributions or the redemption of Fund shares. Mutual funds are not obligations of or guaranteed by any bank and are not federally insured. Total returns shown include the maximum contingent deferred sales charge of 5.50%, as applicable.
| 1 | Represents a hypothetical investment of $10,000 in the Fund. The maximum contingent deferred sales charge is 5.50% on any redemption less than one year from purchase date. The Fund's performance assumes the reinvestment of all dividends and distributions. The R2000G and the LSCGFA have been adjusted to reflect reinvestment of dividends on securities in the index and the average. |
| 2 | The R2000G is not adjusted to reflect sales charges, expenses or other fees that the SEC requires to be reflected in the Fund's performance. The LSCGFA represents the average of the total returns reported by all of the mutual funds designated by Lipper, Inc. as falling in the respective category indicated, and is not adjusted to reflect any sales charges. However, these total returns are reported net of expenses or other fees that the SEC requires to be reflected in a fund's performance. The R2000G is unmanaged and, unlike the Fund, is not affected by cash flows. It is not possible to invest directly in an index. |
| 3 | Total returns quoted reflect all applicable contingent deferred sales charges. |
Annual Shareholder Report10
GROWTH OF A $10,000 INVESTMENT - CLASS C SHARES
The graph below illustrates the hypothetical investment of $10,0001 in Federated Kaufmann Small Cap Fund (Class C Shares) (the “Fund”) from December 18, 2002 (start of performance) to October 31, 2009, compared to the Russell 2000 Growth Index (R2000G)2 and the Lipper Small-Cap Growth Funds Average (LSCGFA).2
| Average Annual Total Returns3 for the Period Ended 10/31/2009 | |
| 1 Year | 15.86% |
| 5 Years | 0.91% |
| Start of Performance (12/18/2002) | 10.89% |
Performance data quoted represents past performance which is no guarantee of future results. Investment return and principal value will fluctuate so that an investor's shares, when redeemed, may be worth more or less than their original cost. Mutual fund performance changes over time and current performance may be lower or higher than what is stated. For current to the most recent month-end performance and after-tax returns, visit FederatedInvestors.com or call 1-800-341-7400. Returns shown do not reflect the deduction of taxes that a shareholder would pay on Fund distributions or the redemption of Fund shares. Mutual funds are not obligations of or guaranteed by any bank and are not federally insured. Total returns shown include the maximum contingent deferred sales charge of 1.00%, as applicable.
| 1 | Represents a hypothetical investment of $10,000 in the Fund. A 1.00% contingent deferred sales charge would be applied to any redemption less than one year from the purchase date. The Fund's performance assumes the reinvestment of all dividends and distributions. The R2000G and the LSCGFA have been adjusted to reflect reinvestment of dividends on securities in the index and the average. |
| 2 | The R2000G is not adjusted to reflect sales charges, expenses or other fees that the SEC requires to be reflected in the Fund's performance. The LSCGFA represents the average of the total returns reported by all of the mutual funds designated by Lipper, Inc. as falling in the respective category indicated, and is not adjusted to reflect any sales charges. However, these total returns are reported net of expenses or other fees that the SEC requires to be reflected in a fund's performance. The R2000G is unmanaged and, unlike the Fund, is not affected by cash flows. It is not possible to invest directly in an index. |
| 3 | Total returns quoted reflect all applicable contingent deferred sales charges. |
Annual Shareholder Report11
GROWTH OF A $10,000 INVESTMENT - CLASS K SHARES
The graph below illustrates the hypothetical investment of $10,0001 in Federated Kaufmann Small Cap Fund (Class K Shares) (the “Fund”) from November 1, 2005 (start of performance) to October 31, 2009, compared to the Russell 2000 Growth Index (R2000G)2 and the Lipper Small-Cap Growth Funds Average (LSCGFA).2
| Average Annual Total Returns for the Period Ended 10/31/2009 | |
| 1 Year | 17.51% |
| Start of Performance (11/1/2005) | -1.17% |
Performance data quoted represents past performance which is no guarantee of future results. Investment return and principal value will fluctuate so that an investor's shares, when redeemed, may be worth more or less than their original cost. Mutual fund performance changes over time and current performance may be lower or higher than what is stated. For current to the most recent month-end performance and after-tax returns, visit FederatedInvestors.com or call 1-800-341-7400. Returns shown do not reflect the deduction of taxes that a shareholder would pay on Fund distributions or the redemption of Fund shares. Mutual funds are not obligations of or guaranteed by any bank and are not federally insured.
| 1 | The Fund's performance assumes the reinvestment of all dividends and distributions. The R2000G and the LSCGFA have been adjusted to reflect reinvestment of dividends on securities in the index and the average. |
| 2 | The R2000G is not adjusted to reflect sales charges, expenses or other fees that the SEC requires to be reflected in the Fund's performance. The LSCGFA represents the average of the total returns reported by all of the mutual funds designated by Lipper, Inc. as falling in the respective category indicated, and is not adjusted to reflect any sales charges. However, these total returns are reported net of expenses or other fees that the SEC requires to be reflected in a fund's performance. The R2000G is unmanaged and, unlike the Fund, is not affected by cash flows. It is not possible to invest directly in an index. |
Annual Shareholder Report12
Portfolio of Investments Summary Table (unaudited)
At October 31, 2009, the Fund's sector composition1 was as follows:
| Sector Composition | | Percentage of
Total Net Assets |
| Consumer Discretionary | | 22.4% |
| Health Care | | 21.5% |
| Industrials | | 20.9% |
| Information Technology | | 15.7% |
| Financials | | 7.3% |
| Consumer Staples | | 4.0% |
| Materials | | 2.1% |
| Telecommunication Services | | 1.1% |
| Energy | | 1.0% |
| Utilities | | 0.7% |
| Other Securities2 | | 2.8% |
| Securities Lending Collateral3 | | 22.7% |
| Cash Equivalents4 | | 2.9% |
| Other Assets and Liabilities — Net5 | | (25.1)% |
| TOTAL | | 100.0% |
| 1 | Except for Other Securities, Securities Lending Collateral, Cash Equivalents and Other Assets and Liabilities, sector classifications are based upon, and individual portfolio securities are assigned to, the classifications of the Global Industry Classification Standard (GICS), except that the Adviser assigns a classification to securities not classified by the GICS and to securities for which the Adviser does not have access to the classification made by the GICS. |
| 2 | Other Securities include exchange-traded funds. |
| 3 | Cash collateral received from lending portfolio securities which is invested in short-term investments such as repurchase agreements or money market mutual funds. |
| 4 | Cash Equivalents include any investments in money market mutual funds and/or overnight repurchase agreements other than those representing securities lending collateral. |
| 5 | Assets, other than investments in securities, less liabilities. See Statement of Assets and Liabilities. |
Annual Shareholder Report13
Portfolio of Investments
October 31, 2009
|
| Shares or Principal Amount | | | Value in U.S. Dollars |
| | Common Stocks – 90.8% | |
| | Consumer Discretionary – 19.2% | |
| 75,500 | | Advance Auto Parts, Inc. | 2,813,130 |
| 52,300 | 1,2,3 | B2W Companhia Global Do Varejo, GDR | 3,028,170 |
| 52,929 | 1 | Bridgepoint Education, Inc. | 750,533 |
| 1,000,000 | 1,4 | Central European Media Enterprises Ltd., Class A | 25,140,000 |
| 305,850 | 1 | China Education Alliance, Inc. | 1,578,186 |
| 700,000 | 1,4 | ChinaCast Education Corp. | 4,354,000 |
| 66,629 | 1,4 | Chipotle Mexican Grill, Inc. | 5,429,597 |
| 157,804 | 1 | Cia Hering | 1,903,574 |
| 137,000 | | Ctrip.com International Ltd., ADR | 7,334,980 |
| 400,200 | 4 | D.R. Horton, Inc. | 4,386,192 |
| 40,800 | 1,4 | Deckers Outdoor Corp. | 3,658,536 |
| 699,000 | 1,4 | Dick's Sporting Goods, Inc. | 15,860,310 |
| 247,397 | 1,4 | Dolan Media Co. | 2,953,920 |
| 49,500 | 1,2,3 | Dollarama, Inc., Series 144A | 882,908 |
| 373,800 | 1,4 | Fuqi International, Inc. | 7,659,162 |
| 468,600 | 4 | Geox SpA | 3,584,649 |
| 1,051,400 | 1,4 | hhgregg, Inc. | 17,337,586 |
| 250,900 | 1 | LJ International, Inc. | 800,371 |
| 1,055,500 | 4 | Lennar Corp., Class A | 13,299,300 |
| 22,692 | 1 | Lincoln Educational Services | 449,755 |
| 98,172 | 1 | Lululemon Athletica Inc. | 2,466,081 |
| 963,011 | 1 | Meritage Corp. | 17,565,321 |
| 345,870 | 4 | National CineMedia, Inc. | 5,533,920 |
| 26,550 | 1,4 | New Oriental Education & Technology Group, Inc., ADR | 1,854,252 |
| 240,578 | 1 | Orchard Enterprises, Inc. | 252,607 |
| 778,900 | 4 | Orient-Express Hotel Ltd. | 6,698,540 |
| 37,100 | 1 | Penn National Gaming, Inc. | 932,323 |
| 5,240,900 | 1,2,3 | Piaggio & C. SpA | 13,301,837 |
| 77,621 | | Regis Corp. | 1,260,565 |
| 109,000 | 1 | SEB — Sistema Educacional Brasileiro SA | 1,058,072 |
| 272,200 | 1,4 | Texas Roadhouse, Inc. | 2,577,734 |
| 288,842 | | Thor Industries, Inc. | 7,573,437 |
Annual Shareholder Report14
|
| 73,200 | 1 | Vitamin Shoppe Industries, Inc. | 1,286,124 |
| 388,900 | 4 | Winnebago Industries, Inc. | 4,472,350 |
| | TOTAL | 190,038,022 |
| | Consumer Staples – 4.0% | |
| 223,800 | 1 | Bare Escentuals, Inc. | 2,826,594 |
| 980,000 | 1 | Hypermarcas SA | 20,066,190 |
| 480,158 | | Lance, Inc. | 11,581,411 |
| 168,600 | 1 | Seneca Foods Corp., Class A | 4,668,534 |
| | TOTAL | 39,142,729 |
| | Energy – 0.9% | |
| 164,800 | 1 | China Integrated Energy, Inc. | 947,600 |
| 93,500 | 1,4 | Grupo TMM SA de CV, ADR | 345,950 |
| 785,500 | 1,4 | Sandridge Energy, Inc. | 8,035,665 |
| | TOTAL | 9,329,215 |
| | Financials – 7.1% | |
| 100,578 | 1,4 | Affiliated Managers Group | 6,385,697 |
| 223,097 | 1 | BR Malls Participacoes | 2,469,568 |
| 253,800 | | Berkley, W. R. Corp. | 6,273,936 |
| 1,268,550 | 1 | Brasil Brokers Participacoes | 4,392,686 |
| 2,718,100 | 1 | CETIP SA | 18,207,073 |
| 462,963 | 1,4 | China Housing & Land Development, Inc. | 1,425,926 |
| 25,493 | 1,2,3 | China Housing & Land Development, Inc. | 78,518 |
| 138,910 | 1 | Colony Financial, Inc. | 2,701,800 |
| 54,575 | 1 | Government Properties Income Trust | 1,270,506 |
| 94,300 | 1 | Hambrecht Asia Acquisition Corp. | 839,270 |
| 197,200 | 1,5 | Media & Entertainment Holdings, Inc. | 0 |
| 123,200 | 1 | Multiplan Empreendimentos Imobiliarios SA | 1,888,283 |
| 185,300 | 1 | RHJ International | 1,351,898 |
| 2,090,874 | | Rural Electrification Corp. Ltd. | 8,717,536 |
| 25,808 | | Transatlantic Holdings, Inc. | 1,303,304 |
| 345,900 | | Willis Group Holdings Ltd. | 9,339,300 |
| 758,300 | 1,4 | Xinyuan Real Estate Co. Ltd, ADR | 3,071,115 |
| | TOTAL | 69,716,416 |
| | Health Care – 20.7% | |
| 151,250 | 1 | AGA Medical Holdings, Inc. | 2,022,213 |
| 312,000 | 1,2,3,5 | Adaltis, Inc. | 0 |
| 641,543 | 1,5 | Adaltis, Inc. | 0 |
Annual Shareholder Report15
|
| 904,300 | 1 | Alkermes, Inc. | 7,207,271 |
| 51,806 | 1 | Amylin Pharmaceuticals, Inc. | 571,938 |
| 576,400 | 1 | Anadys Pharmaceuticals, Inc. | 1,123,980 |
| 307,104 | 1,4 | Arena Pharmaceuticals, Inc. | 1,084,077 |
| 127,195 | 1,4 | Athenahealth, Inc. | 4,783,804 |
| 504,207 | 1,4 | Auxilium Pharmaceutical, Inc. | 15,862,352 |
| 400,000 | 1,4 | BioMarin Pharmaceutical, Inc. | 6,224,000 |
| 1,832,350 | 1 | Catalyst Pharmaceutical Partners Inc. | 1,375,362 |
| 104,208 | 1 | Cepheid, Inc. | 1,382,840 |
| 1,200 | 1 | Conceptus, Inc. | 21,048 |
| 346,120 | 1,5 | Corcept Therapeutics, Inc. | 571,098 |
| 19,324 | 1 | Crucell NV, ADR | 381,649 |
| 722,376 | 1,4 | Cubist Pharmaceuticals, Inc. | 12,237,050 |
| 314,000 | | Dishman Pharmaceuticals & Chemicals Ltd. | 1,534,831 |
| 61,647 | 1 | Durect Corp. | 130,075 |
| 1,713,019 | 1,4 | Dyax Corp. | 5,378,880 |
| 931,972 | 1,4 | Dynavax Technologies Corp. | 1,155,645 |
| 81,335 | 1 | Emergency Medical Services Corp., Class A | 3,905,707 |
| 378,563 | 1 | Endologix, Inc. | 1,801,960 |
| 343,512 | 1 | Epigenomics AG | 1,508,696 |
| 60,750 | | Hikma Pharmaceuticals PLC | 469,283 |
| 171,400 | 1,4 | Human Genome Sciences, Inc. | 3,203,466 |
| 169,644 | 1,4 | Illumina, Inc. | 5,445,572 |
| 135,200 | 1 | Insulet Corp. | 1,500,720 |
| 474,820 | 1,4 | Isis Pharmaceuticals, Inc. | 6,015,969 |
| 22,967 | 1,4 | LifeWatch AG | 445,897 |
| 115,492 | 1 | Masimo Corp. | 3,068,623 |
| 119,400 | 1 | Momenta Pharmaceuticals, Inc. | 1,088,928 |
| 269,243 | 1,4 | Mylan Laboratories, Inc. | 4,372,506 |
| 372,606 | 1,4 | Neurocrine Biosciences, Inc. | 827,185 |
| 442,300 | 1 | OSI Pharmaceuticals, Inc. | 14,250,906 |
| 327,300 | 1 | Orexigen Therapeutics, Inc. | 2,114,358 |
| 280,981 | 1,4 | Orthofix International NV | 8,991,392 |
| 619,000 | 1,4 | Orthovita, Inc. | 2,166,500 |
| 1,101,700 | 1 | Penwest Pharmaceuticals Co. | 2,379,672 |
| 473,299 | 1 | Pharmacyclics, Inc. | 922,933 |
| 409,200 | 1,4 | Phase Forward, Inc. | 5,364,612 |
Annual Shareholder Report16
|
| 239,400 | | Piramal Healthcare Ltd. | 1,884,825 |
| 712,400 | 1 | Progenics Pharmaceuticals, Inc. | 2,984,956 |
| 256,478 | 1,4 | Protalix Biotherapeutics, Inc. | 2,431,411 |
| 148,700 | 1,4 | Qiagen NV | 3,084,104 |
| 145,200 | 1,4 | Regeneron Pharmaceuticals, Inc. | 2,279,640 |
| 374,117 | 1 | Repligen Corp. | 1,825,691 |
| 412,900 | 1,4 | Rigel Pharmaceuticals, Inc. | 2,646,689 |
| 140,400 | 1 | SXC Health Solutions Corp. | 6,413,472 |
| 358,650 | 1,4 | Savient Pharmaceuticals, Inc. | 4,518,990 |
| 544,150 | 1,4 | Seattle Genetics, Inc. | 4,940,882 |
| 28,500 | 1 | Solta Medical, Inc. | 62,985 |
| 1,149,200 | 1,4 | Spectrum Pharmaceuticals, Inc. | 4,769,180 |
| 433,500 | 1 | Talecris Biotherapeutics Holdings Corp. | 8,696,010 |
| 611,100 | 1 | ThermoGenesis Corp. | 360,549 |
| 644,222 | 1,5 | Threshold Pharmaceuticals, Inc. | 1,307,771 |
| 66,756 | 1 | Transcend Services, Inc. | 1,218,297 |
| 471,400 | 1,5 | Valera Pharmaceuticals, Inc. | 0 |
| 1,311,330 | 1,4 | Vical, Inc. | 4,038,896 |
| 270,700 | 1 | Vivus, Inc. | 2,138,530 |
| 730,000 | 1 | Warner Chilcott PLC | 16,169,500 |
| | TOTAL | 204,665,376 |
| | Industrials – 20.1% | |
| 1,054,800 | 1 | AirTran Holdings, Inc. | 4,461,804 |
| 24,932,565 | 1 | Aramex PJSC | 11,051,284 |
| 454,350 | | CLARCOR, Inc. | 13,371,521 |
| 572,400 | | Con-way, Inc. | 18,883,476 |
| 108,000 | 1 | Copart, Inc. | 3,474,360 |
| 132,300 | 1 | CoStar Group, Inc. | 5,135,886 |
| 311,000 | 1 | Dynamex, Inc. | 5,762,830 |
| 93,500 | 1 | Dyncorp International, Inc., Class A | 1,589,500 |
| 1,527,300 | 1 | Express-1 Expedited Solutions | 1,542,573 |
| 24,812 | 1 | First Solar, Inc. | 3,025,327 |
| 856,819 | 4 | Forward Air Corp. | 18,284,517 |
| 282,156 | 1,4 | GeoEye, Inc. | 7,158,298 |
| 744,900 | 1 | IESI-BFC Ltd. | 9,571,965 |
| 109,440 | 1,4 | IHS, Inc., Class A | 5,664,614 |
| 1,764,988 | 1,4 | Innovative Solutions and Support, Inc. | 8,048,345 |
Annual Shareholder Report17
|
| 86,300 | 1 | Iron Mountain, Inc. | 2,108,309 |
| 5,196,000 | 1,4 | Jet Blue Airways Corp. | 25,772,160 |
| 110,900 | 1 | MOOG, Inc., Class A | 2,769,173 |
| 260,623 | | Max India Ltd. | 984,079 |
| 79,426 | 1,4 | Monster Worldwide, Inc. | 1,153,266 |
| 100,000 | 1 | Old Dominion Freight Lines, Inc. | 2,599,000 |
| 400,000 | 1 | Owens Corning, Inc. | 8,844,000 |
| 579,100 | 1 | Quality Distribution, Inc. | 2,165,834 |
| 3,242,224 | 1,4 | Satcon Technology Corp. | 6,614,137 |
| 193,600 | 4 | Simpson Manufacturing Co., Inc. | 4,528,304 |
| 50,449 | 1 | SmartHeat, Inc. | 451,014 |
| 500,620 | 1,4 | Spire Corp. | 2,347,908 |
| 29,123 | 1 | Sterling Construction Co., Inc. | 469,754 |
| 408,930 | 1 | Verisk Analytics, Inc. | 11,216,950 |
| 194,688 | | Vicor Corp. | 1,327,772 |
| 735,100 | 1,4 | Yingli Green Energy Holding Co. Ltd., ADR | 8,512,458 |
| | TOTAL | 198,890,418 |
| | Information Technology – 14.9% | |
| 48,400 | 1 | Akamai Technologies, Inc. | 1,064,800 |
| 129,000 | 1,4 | Blackboard, Inc. | 4,575,630 |
| 1,601,000 | 1 | Cinedigm Digital Cinema Corp. | 2,081,300 |
| 565,900 | 1 | Commvault Systems, Inc. | 11,148,230 |
| 438,000 | 1,4 | Compellent Technologies, Inc. | 8,032,920 |
| 1,025,300 | 1 | Entropic Communications, Inc. | 2,696,539 |
| 423,683 | 1 | Fundtech Ltd. | 5,499,405 |
| 951,600 | 1 | Gilat Satellite Networks | 4,272,684 |
| 338,029 | 1 | Hypercom Corp. | 963,383 |
| 183,990 | 1 | I2 Technologies, Inc. | 2,896,003 |
| 2,647,002 | 1 | iPass, Inc. | 3,441,103 |
| 672,003 | 1 | Kenexa Corp. | 8,467,238 |
| 36,400 | | Lender Processing Services | 1,448,720 |
| 97,300 | 1 | LogMeIn, Inc. | 1,955,730 |
| 825,296 | 1 | MEMC Electronic Materials, Inc. | 10,250,176 |
| 61,040 | 1,4 | Magma Design Automation | 131,236 |
| 112,949 | 1 | ManTech International Corp., Class A | 4,953,943 |
| 384,289 | 1,4 | Microsemi Corp. | 5,114,887 |
| 1,937,000 | 1 | Mindspeed Technologies, Inc. | 6,760,130 |
Annual Shareholder Report18
|
| 212,900 | 1,4 | NIC, Inc. | 1,865,004 |
| 1,215,020 | 1,4 | NaviSite, Inc. | 2,223,487 |
| 500,004 | 1,4 | Netezza Corp. | 4,620,037 |
| 425,000 | 1,4 | ON Semiconductor Corp. | 2,843,250 |
| 608,300 | 1 | Onvia.com, Inc. | 3,436,895 |
| 467,500 | 1 | Parametric Technology Corp. | 6,970,425 |
| 127,300 | 1 | Perfect World Co. Ltd., ADR | 5,602,473 |
| 1,920,000 | 1,4 | Phoenix Technology Ltd. | 4,492,800 |
| 605,800 | 1 | RADWARE Ltd. | 7,009,106 |
| 393,000 | 1 | Redecard SA | 5,833,873 |
| 928,856 | 1 | Smart Modular Technologies (WWH), Inc. | 3,771,155 |
| 61,200 | 1 | Switch & Data Facilities Co. | 1,023,876 |
| 150,725 | 1 | TNS, Inc. | 4,259,488 |
| 322,850 | 1 | Telecity Group PLC | 1,771,861 |
| 340,980 | 1 | Tier Technologies, Inc., Class B | 2,789,216 |
| 211,674 | 1,4 | ValueClick, Inc. | 2,082,872 |
| 1,823,500 | 1 | WebMediaBrands, Inc. | 1,148,805 |
| | TOTAL | 147,498,680 |
| | Materials – 2.3% | |
| 400,000 | 4 | Commercial Metals Corp. | 5,936,000 |
| 3,314,700 | 1 | Huabao International Holdings Ltd. | 3,130,676 |
| 2,322,500 | | Nine Dragons Paper Holdings Ltd. | 3,322,904 |
| 19,492 | 1 | Rockwood Holdings, Inc. | 387,501 |
| 97,700 | | Steel Dynamics, Inc. | 1,308,203 |
| 600,000 | 1 | Thompson Creek Metals Co., Inc. | 6,108,000 |
| 2,101,800 | 1 | Yingde Gases Group Co. | 2,519,383 |
| | TOTAL | 22,712,667 |
| | Telecommunication Services – 1.0% | |
| 9,600 | 1 | AboveNet, Inc. | 464,640 |
| 183,209 | | NTELOS Holdings Corp. | 2,766,456 |
| 533,700 | 1 | TW Telecom, Inc. | 6,724,620 |
| | TOTAL | 9,955,716 |
Annual Shareholder Report19
|
| | Utilities – 0.6% | |
| 125,600 | | ITC Holdings Corp. | 5,579,152 |
| | TOTAL COMMON STOCKS
(IDENTIFIED COST $929,469,154) | 897,528,391 |
| | Warrants – 0.1% | |
| | Consumer Discretionary – 0.0% | |
| 160,372 | 1 | Point Therapeutics, Inc. | 7 |
| | Financials – 0.0% | |
| 138,889 | 1 | China Housing & Land Development, Inc. | 127,798 |
| | Health Care – 0.1% | |
| 224,540 | 1 | Adaltis, Inc. | 0 |
| 131,950 | 1 | Anadys Pharmaceuticals, Inc. | 192,748 |
| 20,850 | 1 | Clinical Data, Inc. | 69 |
| 121,142 | 1,5 | Corcept Therapeutics, Inc. | 134,974 |
| 144,960 | 1 | Cortex Pharmaceuticals, Inc. | 3 |
| 201,055 | 1 | Medicure, Inc. | 0 |
| 94,000 | 1 | Spectrum Pharmaceuticals, Inc. | 57,889 |
| 257,688 | 1,5 | Threshold Pharmaceuticals, Inc. | 432,399 |
| 238,639 | 1 | Vical, Inc. | 268,524 |
| | TOTAL | 1,086,606 |
| | TOTAL WARRANTS
(IDENTIFIED COST $149,121) | 1,214,411 |
| | Preferred Stocks – 1.7% | |
| | Consumer Discretionary – 1.2% | |
| 36,269 | | Autoliv, Inc., Conv. Pfd., $1.17 Annual Dividend | 1,740,912 |
| 43,313 | 1,2,3 | Callaway Golf Co., Conv. Pfd., Series B, $1.88 Annual Dividend | 4,996,588 |
| 4,000 | 2,3 | Lodgenet Entertainment, Conv. Pfd., Series B, $29.17 Annual Dividend | 5,194,600 |
| | TOTAL | 11,932,100 |
| | Energy – 0.1% | |
| 6,000 | 2,3 | ATP Oil & Gas Corp., Conv. Pfd., Series 144A | 622,740 |
| | Health Care – 0.3% | |
| 792,576 | | Bellus Health, Inc., Conv. Pfd., Series A | 135,530 |
| 2,985 | | Mylan Laboratories, Inc., Conv. Pfd., $65.00 Annual Dividend | 3,074,550 |
| | TOTAL | 3,210,080 |
| | Utilities – 0.1% | |
| 15,200 | | Great Plains Energy, Inc., Conv. Pfd., $1.95 Annual Dividend | 939,360 |
| | TOTAL PREFERRED STOCKS
(IDENTIFIED COST $13,841,069) | 16,704,280 |
Annual Shareholder Report20
|
| | Corporate Bonds – 4.2% | |
| | Consumer Discretionary – 2.0% | |
| $830,000 | | Brown Shoe Co., Inc., Company Guarantee, 8.75%, 5/1/2012 | 821,700 |
| 11,700,000 | | Central European Media Enterprises Ltd., Conv. Bond, 3.50%, 3/15/2013 | 9,026,644 |
| 1,263,000 | | Coinstar, Inc., Conv. Bond, 4.00%, 9/1/2014 | 1,338,527 |
| 741,000 | 2,3 | Gaylord Entertainment Co., Conv. Bond, Series 144A, 3.75%, 10/1/2014 | 646,634 |
| 1,571,000 | | Newell Rubbermaid, Inc., Sr. Note, 5.50%, 3/15/2014 | 2,906,460 |
| 786,000 | | Newell Rubbermaid, Inc., Sr. Unsecd. Note, 10.60%, 4/15/2019 | 969,691 |
| 1,975,000 | | Regis Corp., Conv. Bond, 5.00%, 7/15/2014 | 2,519,112 |
| 372,000 | | Sonic Automotive, Inc., Conv. Bond, 5.00%, 10/1/2029 | 372,173 |
| 880,500 | 2,3 | Wendy's/Arby's Group Inc., Sr. Unsecd. Note, 10.00%, 7/15/2016 | 942,135 |
| | TOTAL | 19,543,076 |
| | Energy – 0.0% | |
| 387,000 | | Sesi LLC, 1.50%, 12/15/2026 | 351,991 |
| | Financials – 0.4% | |
| 1,087,000 | 2,3 | Alexandria Real Estate Equities, Inc., Conv. Bond, 8.00%, 4/15/2029 | 1,646,174 |
| 247,000 | | Developers Diversified Realty, 9.625%, 3/15/2016 | 251,013 |
| 1,179,000 | 2,3 | Digital Realty Trust, Inc., Conv. Bond, 5.50%, 4/15/2029 | 1,453,165 |
| 956,000 | | Safeguard Scientifics, Inc., 2.625%, 3/15/2024 | 900,870 |
| | TOTAL | 4,251,222 |
| | Health Care – 0.4% | |
| 1,169,000 | | CONMED Corp., Conv. Sr. Sub. Note, 2.50%, 11/15/2024 | 1,083,569 |
| 366,000 | | Charles River Laboratories International, Inc., 2.25%, 6/15/2013 | 364,216 |
| 973,000 | | Chemed Corp., Conv. Bond, 1.875%, 5/15/2014 | 832,012 |
| 412,000 | | Cubist Pharmaceuticals, Inc., 2.25%, 6/15/2013 | 372,613 |
| 672,000 | | Kendle International, Inc., Conv. Bond, 3.375%, 7/15/2012 | 601,353 |
| 733,000 | | Wright Medical Group, Inc., 2.625%, 12/1/2014 | 608,024 |
| | TOTAL | 3,861,787 |
| | Industrials – 0.5% | |
| 621,000 | | AMR Corp., Conv. Bond, 6.25%, 10/15/2014 | 515,585 |
| 900,000 | 2,3 | Covanta Holding Corp., Conv. Bond, Series 144A, 3.25%, 6/1/2014 | 1,004,490 |
| 380,000 | | Jet Blue Airways Corp., Conv. Bond, Series A, 6.75%, 10/15/2039 | 486,457 |
| 1,132,000 | | Mastec, Inc., Conv. Bond, 4.00%, 6/15/2014 | 1,172,016 |
| 734,000 | | Navistar International Corp., Sr. Note, 8.25%, 11/1/2021 | 720,238 |
| 1,000,000 | | UAL Corp., Conv. Bond, 5.00%, 2/1/2021 | 856,375 |
| | TOTAL | 4,755,161 |
Annual Shareholder Report21
|
| | Information Technology – 0.7% | |
| $1,177,000 | | Anixter International, Inc., Sr. Note, 10.00%, 3/15/2014 | 1,279,988 |
| 568,000 | | Arris Group, Inc., Conv. Bond, 2.00%, 11/15/2026 | 527,905 |
| 543,000 | 2,3 | Comtech Telecommunications Corp., Conv. Bond, 3.00%, 5/1/2029 | 597,327 |
| 264,000 | | Diodes, Inc., Conv. Bond, 2.25%, 10/1/2026 | 254,703 |
| 212,000 | | EarthLink Network, Inc., Conv. Bond, 3.25%, 11/15/2026 | 229,914 |
| 606,000 | | FEI Co., 2.875%, 6/1/2013 | 636,227 |
| 731,000 | | Flextronics International Ltd., Conv. Bond, 1.00%, 8/1/2010 | 721,527 |
| 860,000 | | GSI Commerce, Inc., Conv. Bond, 2.50%, 6/1/2027 | 771,144 |
| 462,000 | | GSI Commerce, Inc., Conv. Bond, 3.00%, 6/1/2025 | 533,384 |
| 193,000 | 2,3 | Mentor Graphics Corp., Conv. Bond, 6.25%, 3/1/2026 | 182,767 |
| 327,000 | | Tech Data Corp., Conv. Bond, 2.75%, 12/15/2026 | 334,848 |
| 393,000 | | Teradyne, Inc., 4.50%, 3/15/2014 | 686,335 |
| | TOTAL | 6,756,069 |
| | Materials – 0.1% | |
| 390,000 | 2,3 | BWay Corp., Sr. Sub. Note, 10.00%, 4/15/2014 | 416,325 |
| 197,000 | | Steel Dynamics, Inc., Conv. Bond, 5.125%, 6/15/2014 | 213,416 |
| | TOTAL | 629,741 |
| | Telecommunication Services – 0.1% | |
| 887,000 | 2,3 | SBA Communications, Corp., Conv. Bond, 4.00%, 10/1/2014 | 1,027,900 |
| | TOTAL CORPORATE BONDS
(IDENTIFIED COST $32,470,865) | 41,176,947 |
| | Exchange-Traded FundS – 2.7% | |
| 220,700 | 4 | iShares Russell 2000 Growth Index Fund | 13,486,977 |
| 245,500 | 4 | iShares Russell 2000 Index Fund | 13,833,925 |
| | TOTAL EXCHANGE-TRADED FUNDS
(IDENTIFIED COST $24,346,464) | 27,320,902 |
| | Mutual Fund – 25.6% | |
| 253,036,554 | 6,7,8 | Prime Value Obligations Fund, Institutional Shares, 0.22%
(AT NET ASSET VALUE) | 253,036,554 |
| | TOTAL INVESTMENTS — 125.1%
(IDENTIFIED COST $1,253,313,227)9 | 1,236,981,485 |
| | OTHER ASSETS AND LIABILITIES - NET — (25.1)%10 | (248,438,873) |
| | TOTAL NET ASSETS — 100% | $988,542,612 |
Annual Shareholder Report22
- At October 31, 2009, the Fund had outstanding foreign exchange contracts as follows:
| Settlement Date | Foreign Currency
Units to
Deliver/Receive | In
Exchange For | Unrealized
Appreciation/
(Depreciation) |
| Contracts Purchased: |
| 11/3/2009 | 11,755,828 Brazilian Real | $6,644,338 | $29,043 |
| 11/3/2009 | 239,915 Brazilian Real | $135,599 | $593 |
| 11/4/2009 | 3,677,732 Brazilian Real | $2,133,255 | $(45,533) |
| 11/4/2009 | 75,056 Brazilian Real | $43,536 | $(929) |
| 11/4/2009 | 883 Brazilian Real | $503 | $(2) |
| 11/2/2009 | 9,392,192 Hong Kong Dollar | $1,211,896 | $(32) |
| 11/2/2009 | 263,179 Euro | $389,636 | $2,329 |
| NET UNREALIZED DEPRECIATION ON FOREIGN EXCHANGE CONTRACTS | $(14,531) |
- Net Unrealized Depreciation on Foreign Exchange Contracts is included in “Other Assets and Liabilities — Net.”
- Note: The categories of investments are shown as a percentage of total net assets at October 31, 2009.
Annual Shareholder Report23
- Various inputs are used in determining the value of the Fund's investments. These inputs are summarized in the three broad levels listed below:
- Level 1 — quoted prices in active markets for identical securities
- Level 2 — other significant observable inputs (including quoted prices for similar securities, interest rates, prepayment speeds, credit risk, etc.)
- Level 3 — significant unobservable inputs (including the Fund's own assumptions in determining the fair value of investments)
- The inputs or methodology used for valuing securities are not an indication of the risk associated with investing in those securities.
- The following is a summary of the inputs used, as of October 31, 2009, in valuing the Fund's assets carried at fair value:
| Valuation Inputs | | | | |
| Level 1 —
Quoted
Prices and
Investments in
Mutual Funds | Level 2 —
Other
Significant
Observable
Inputs | Level 3 —
Significant
Unobservable
Inputs | Total |
| Equity Securities: | | | | |
| Domestic | $651,640,552 | $ — | $1,878,869 | $653,519,421 |
| International | 217,690,161 | 43,023,089 | — | 260,713,250 |
| Debt Securities: | | | | |
| Corporate Bonds | — | 41,176,947 | — | 41,176,947 |
| Warrants | — | 647,038 | 567,373 | 1,214,411 |
| Exchange-Traded Funds | 27,320,902 | — | — | 27,320,902 |
| Mutual Fund | 253,036,554 | — | — | 253,036,554 |
| TOTAL SECURITIES | $1,149,688,169 | $84,847,074 | $2,446,242 | $1,236,981,485 |
| OTHER FINANCIAL INSTRUMENTS* | $(14,531) | $ — | $ — | $(14,531) |
| * | Other financial instruments include foreign exchange contracts. |
Annual Shareholder Report24
- Following is a reconciliation of assets in which significant unobservable inputs (Level 3) were used in determining fair value:
| Investments in
Equity Securities | Investments
in Warrants |
| Balance as of November 1, 2008 | $ — | $ — |
| Change in unrealized appreciation (depreciation) | 153,351 | 520,007 |
| Net purchases (sales) | 1,678,050 | 47,366 |
| Transfers in and/or out of Level 3 | 47,468 | — |
| Balance as of October 31, 2009 | $1,878,869 | $567,373 |
| The total change in unrealized appreciation (depreciation) included in the Statement of Operations attributable to investments still held at October 31, 2009 | $153,351 | $520,007 |
- The following acronyms are used throughout this portfolio:
| ADR | — American Depositary Receipt |
| GDR | — Global Depositary Receipt |
- See Notes which are an integral part of the Financial Statements
Annual Shareholder Report25
Statement of Assets and Liabilities
October 31, 2009
| Assets: | | |
| Total investments in securities, at value, including $253,036,554 of investments in an affiliated issuer (Note 5) and $204,641,216 of securities loaned (identified cost $1,253,313,227) | | $1,236,981,485 |
| Cash | | 641 |
| Cash denominated in foreign currencies (identified cost $208,231) | | 206,292 |
| Income receivable | | 520,554 |
| Receivable for investments sold | | 11,917,990 |
| Receivable for shares sold | | 1,877,872 |
| Receivable for foreign exchange contracts | | 31,965 |
| TOTAL ASSETS | | 1,251,536,799 |
| Liabilities: | | |
| Payable for investments purchased | $35,178,473 | |
| Payable for shares redeemed | 2,102,344 | |
| Payable for foreign exchange contracts | 46,496 | |
| Payable for collateral due to broker for securities lending | 224,385,219 | |
| Payable for capital gains taxes withheld | 75,780 | |
| Payable for Directors'/Trustees' fees | 4,058 | |
| Payable for distribution services fee (Note 5) | 306,124 | |
| Payable for shareholder services fee (Note 5) | 453,627 | |
| Accrued expenses | 442,066 | |
| TOTAL LIABILITIES | | 262,994,187 |
| Net assets for 55,933,816 shares outstanding | | $988,542,612 |
| Net Assets Consist of: | | |
| Paid-in capital | | $1,159,100,453 |
| Net unrealized depreciation of investments and translation of assets and liabilities in foreign currency | | (16,292,591) |
| Accumulated net realized loss on investments, written options and foreign currency transactions | | (153,287,322) |
| Accumulated net invesment income (loss) | | (977,928) |
| TOTAL NET ASSETS | | $988,542,612 |
Annual Shareholder Report26
Statement of Assets and Liabilities — continued| Net Asset Value, Offering Price and Redemption Proceeds Per Share | | |
| Class A Shares: | | |
| Net asset value per share ($709,756,543 ÷ 39,771,858 shares outstanding), no par value, unlimited shares authorized | | $17.85 |
| Offering price per share (100/94.50 of $17.85) | | $18.89 |
| Redemption proceeds per share | | $17.85 |
| Class B Shares: | | |
| Net asset value per share ($76,876,265 ÷ 4,472,108 shares outstanding), no par value, unlimited shares authorized | | $17.19 |
| Offering price per share | | $17.19 |
| Redemption proceeds per share (94.50/100 of $17.19) | | $16.24 |
| Class C Shares: | | |
| Net asset value per share ($175,954,931 ÷ 10,235,617 shares outstanding), no par value, unlimited shares authorized | | $17.19 |
| Offering price per share | | $17.19 |
| Redemption proceeds per share (99.00/100 of $17.19) | | $17.02 |
| Class K Shares: | | |
| Net asset value per share ($25,954,873 ÷ 1,454,233 shares outstanding), no par value, unlimited shares authorized | | $17.85 |
| Offering price per share | | $17.85 |
| Redemption proceeds per share | | $17.85 |
- See Notes which are an integral part of the Financial Statements
Annual Shareholder Report27
Statement of Operations
Year Ended October 31, 2009
| Investment Income: | | | |
| Dividends (including $159,986 received from an affiliated issuer (Note 5) and net of foreign taxes withheld of $139,369) | | | $5,660,698 |
| Interest (including income on securities loaned of $2,780,462) | | | 5,328,810 |
| TOTAL INCOME | | | 10,989,508 |
| Expenses: | | | |
| Investment adviser fee (Note 5) | | $11,396,136 | |
| Administrative personnel and services fee (Note 5) | | 620,826 | |
| Custodian fees | | 213,490 | |
| Transfer and dividend disbursing agent fees and expenses — Class A Shares | | 1,361,359 | |
| Transfer and dividend disbursing agent fees and expenses — Class B Shares | | 192,124 | |
| Transfer and dividend disbursing agent fees and expenses — Class C Shares | | 411,371 | |
| Transfer and dividend disbursing agent fees and expenses — Class K Shares | | 70,445 | |
| Directors'/Trustees' fees | | 10,788 | |
| Auditing fees | | 38,700 | |
| Legal fees | | 6,477 | |
| Portfolio accounting fees | | 154,522 | |
| Distribution services fee — Class A Shares (Note 5) | | 1,371,190 | |
| Distribution services fee — Class B Shares (Note 5) | | 538,524 | |
| Distribution services fee — Class C Shares (Note 5) | | 1,193,805 | |
| Distribution services fee — Class K Shares (Note 5) | | 101,378 | |
| Shareholder services fee — Class A Shares (Note 5) | | 1,314,360 | |
| Shareholder services fee — Class B Shares (Note 5) | | 179,508 | |
| Shareholder services fee — Class C Shares (Note 5) | | 388,811 | |
| Account administration fee — Class A Shares | | 23,874 | |
| Account administration fee — Class C Shares | | 171 | |
| Share registration costs | | 72,323 | |
| Printing and postage | | 174,409 | |
| Insurance premiums | | 6,953 | |
| Miscellaneous | | 11,100 | |
| TOTAL EXPENSES | | 19,852,644 | |
Annual Shareholder Report28
Statement of Operations — continued| Waivers, Reimbursements and Reduction: | | | |
| Waiver/reimbursement of investment adviser fee (Note 5) | $(1,443,812) | | |
| Waiver of administrative personnel and services fee (Note 5) | (12,232) | | |
| Waiver of distribution services fee — Class A Shares (Note 5) | (243,381) | | |
| Waiver of distribution services fee — Class K Shares (Note 5) | (61,036) | | |
| Reimbursement of transfer and dividend disbursing agent fees and expenses — Class A Shares (Note 5) | (824,000) | | |
| Reimbursement of transfer and dividend disbursing agent fees and expenses — Class B Shares (Note 5) | (120,850) | | |
| Reimbursement of transfer and dividend disbursing agent fees and expenses — Class C Shares (Note 5) | (243,026) | | |
| Fees paid indirectly from directed brokerage arrangements (Note 6) | (16,060) | | |
| TOTAL WAIVERS, REIMBURSEMENTS AND REDUCTION | | $(2,964,397) | |
| Net expenses | | | $16,888,247 |
| Net investment income (loss) | | | (5,898,739) |
Realized and Unrealized Gain (Loss) on
Investments, Written Options and Foreign
Currency Transactions: | | | |
| Net realized loss on investments and foreign currency transactions (net of foreign taxes withheld of $75,780) | | | (118,018,338) |
| Net realized gain on written options | | | 1,404,694 |
| Net change in unrealized depreciation of investments and translation of assets and liabilities in foreign currency | | | 238,672,687 |
| Net realized and unrealized gain on investments, written options and foreign currency transactions | | | 122,059,043 |
| Change in net assets resulting from operations | | | $116,160,304 |
- See Notes which are an integral part of the Financial Statements
Annual Shareholder Report29
Statement of Changes in Net Assets
| Year Ended October 31 | 2009 | 2008 |
| Increase (Decrease) in Net Assets | | |
| Operations: | | |
| Net investment income (loss) | $(5,898,739) | $(11,881,943) |
| Net realized loss on investments, written options and foreign currency transactions | (116,613,644) | (30,952,312) |
| Net change in unrealized appreciation/depreciation of investments and translation of assets and liabilities in foreign currency | 238,672,687 | (631,513,757) |
| CHANGE IN NET ASSETS RESULTING FROM OPERATIONS | 116,160,304 | (674,348,012) |
| Distributions to Shareholders: | | |
| Distributions from net realized gain on investments and foreign currency transactions | | |
| Class A Shares | — | (29,029,160) |
| Class B Shares | — | (5,432,427) |
| Class C Shares | — | (11,037,351) |
| Class K Shares | — | (642,921) |
| CHANGE IN NET ASSETS RESULTING FROM DISTRIBUTIONS TO SHAREHOLDERS | — | (46,141,859) |
| Share Transactions: | | |
| Proceeds from sale of shares | 363,400,375 | 399,727,183 |
| Net asset value of shares issued to shareholders in payment of distributions declared | — | 34,096,277 |
| Cost of shares redeemed | (305,321,730) | (422,375,460) |
| CHANGE IN NET ASSETS RESULTING FROM SHARE TRANSACTIONS | 58,078,645 | 11,448,000 |
| Change in net assets | 174,238,949 | (709,041,871) |
| Net Assets: | | |
| Beginning of period | 814,303,663 | 1,523,345,534 |
| End of period (including accumulated net investment income (loss) of $(977,928) and $(208,481), respectively) | $988,542,612 | $814,303,663 |
- See Notes which are an integral part of the Financial Statements
Annual Shareholder Report30
Notes to Financial Statements
October 31, 2009
1. ORGANIZATION
Federated Equity Funds (the “Trust”) is registered under the Investment Company Act of 1940, as amended (the “Act”), as an open-end management investment company. The Trust consists of 13 portfolios. The financial statements included herein are only those of Federated Kaufmann Small Cap Fund (the “Fund”), a diversified portfolio. The financial statements of the other portfolios are presented separately. The assets of each portfolio are segregated and a shareholder's interest is limited to the portfolio in which shares are held. Each portfolio pays its own expenses. The Fund offers four classes of shares: Class A Shares, Class B Shares, Class C Shares and Class K Shares. All shares of the Fund have equal rights with respect to voting, except on class-specific matters. The primary investment objective of the Fund is to provide capital appreciation.
2. SIGNIFICANT ACCOUNTING POLICIES
The following is a summary of significant accounting policies consistently followed by the Fund in the preparation of its financial statements. These policies are in conformity with U.S. generally accepted accounting principles (GAAP).
Investment Valuation
In calculating its net asset value (NAV), the Fund generally values investments as follows:
- Equity securities listed on an exchange or traded through a regulated market system are valued at their last reported sale price or official closing price in their principal exchange or market.
- Shares of other mutual funds are valued based upon their reported NAVs.
- Fixed-income securities acquired with remaining maturities greater than 60 days are fair valued using price evaluations provided by a pricing service approved by the Trustees.
- Fixed-income securities acquired with remaining maturities of 60 days or less are valued at their cost (adjusted for the accretion of any discount or amortization of any premium).
- Derivative contracts listed on exchanges are valued at their reported settlement or closing price.
- Over-the-counter (OTC) derivative contracts are fair valued using price evaluations provided by a pricing service approved by the Trustees.
If the Fund cannot obtain a price or price evaluation from a pricing service for an investment, the Fund may attempt to value the investment based upon the mean of bid and asked quotations or fair value the investment based on price evaluations, from one or more dealers. If any price, quotation, price evaluation or other pricing source is not readily available when the NAV is calculated, the Fund uses the fair value of the investment determined in accordance with the procedures described below. There can be no assurance that the Fund could purchase or sell an investment at the price used to calculate the Fund's NAV.
Annual Shareholder Report31
Fair Valuation and Significant Events Procedures
The Trustees have authorized the use of pricing services to provide evaluations of the current fair value of certain investments for purposes of calculating the NAV. Factors considered by pricing services in evaluating an investment include the yields or prices of investments of comparable quality, coupon, maturity, call rights and other potential prepayments, terms and type, reported transactions, indications as to values from dealers and general market conditions. Some pricing services provide a single price evaluation reflecting the bid-side of the market for an investment (a “bid” evaluation). Other pricing services offer both bid evaluations and price evaluations indicative of a price between the prices bid and asked for the investment (a “mid” evaluation). The Fund normally uses bid evaluations for U.S. Treasury and Agency securities and mortgage-backed securities. The Fund normally uses mid evaluations for other types of fixed-income securities and OTC derivative contracts. In the event that market quotations and price evaluations are not available for an investment, the fair value of the investment is determined in accordance with procedures adopted by the Trustees.
The Trustees also have adopted procedures requiring an investment to be priced at its fair value whenever the Adviser determines that a significant event affecting the value of the investment has occurred between the time as of which the price of the investment would otherwise be determined and the time as of which the NAV is computed. An event is considered significant if there is both an affirmative expectation that the investment's value will change in response to the event and a reasonable basis for quantifying the resulting change in value. Examples of significant events that may occur after the close of the principal market on which a security is traded, or after the time of a price evaluation provided by a pricing service or a dealer, include:
- With respect to securities traded in foreign markets, significant trends in U.S. equity markets or in the trading of foreign securities index futures or options contracts;
- With respect to price evaluations of fixed-income securities determined before the close of regular trading on the NYSE, actions by the Federal Reserve Open Market Committee and other significant trends in U.S. fixed-income markets;
- Political or other developments affecting the economy or markets in which an issuer conducts its operations or its securities are traded; and
- Announcements concerning matters such as acquisitions, recapitalizations, litigation developments, a natural disaster affecting the issuer's operations or regulatory changes or market developments affecting the issuer's industry.
The Trustees have approved the use of a pricing service to determine the fair value of equity securities traded principally in foreign markets when the Adviser determines that there has been a significant trend in the U.S. equity markets or in index futures trading. For other significant events, the Fund may seek to obtain more current quotations or price evaluations from alternative pricing sources. If a reliable alternative pricing source is not available, the Fund will determine the fair value of the investment using another method approved by the Trustees.
Annual Shareholder Report32
Repurchase Agreements
It is the policy of the Fund to require the other party to a repurchase agreement to transfer to the Fund's custodian or sub-custodian eligible securities or cash with a market value (after transaction costs) at least equal to the repurchase price to be paid under the repurchase agreement. The eligible securities are transferred to accounts with the custodian or sub-custodian in which the Fund holds a “securities entitlement” and exercises “control” as those terms are defined in the Uniform Commercial Code. The Fund has established procedures for monitoring the market value of the transferred securities and requiring the transfer of additional eligible securities if necessary to equal at least the repurchase price. These procedures also allow the other party to require securities to be transferred from the account to the extent that their market value exceeds the repurchase price or in exchange for other eligible securities of equivalent market value.
With respect to agreements to repurchase U.S. government securities and cash items, the Fund treats the repurchase agreement as an investment in the underlying securities and not as an obligation of the other party to the repurchase agreement. Other repurchase agreements are treated as obligations of the other party secured by the underlying securities. Nevertheless, the insolvency of the other party or other failure to repurchase the securities may delay the disposition of the underlying securities or cause the Fund to receive less than the full repurchase price. Under the terms of the repurchase agreement, any amounts received by the Fund in excess of the repurchase price and related transaction costs must be remitted to the other party.
The Fund may enter into repurchase agreements in which eligible securities are transferred into joint trading accounts maintained by the custodian or sub-custodian for investment companies and other clients advised by the Fund's Adviser and its affiliates. The Fund will participate on a pro-rata basis with the other investment companies and clients in its share of the securities transferred under such repurchase agreements and in its share of proceeds from any repurchase or other disposition of such securities.
Investment Income, Gains and Losses, Expenses and Distributions
Investment transactions are accounted for on a trade-date basis. Realized gains and losses from investment transactions are recorded on an identified-cost basis. Interest income and expenses are accrued daily. Dividend income and distributions to shareholders are recorded on the ex-dividend date. Foreign dividends are recorded on the ex-dividend date or when the Fund is informed of the ex-dividend date. Distributions of net investment income, if any, are declared and paid annually. Non-cash dividends included in dividend income, if any, are recorded at fair value. Investment income, realized and unrealized gains and losses and certain fund-level expenses are allocated to each class based on relative average daily net assets, except that Class A Shares, Class B Shares, Class C Shares and Class K Shares may bear distribution services, shareholder services, account administration and certain transfer and dividend disbursing agent fees unique to those classes. Dividends are declared separately for each class. No class has preferential dividend rights; differences in per share dividend rates are generally due to differences in separate class expenses.
Premium and Discount Amortization
All premiums and discounts on fixed-income securities are amortized/accreted for financial statement purposes.
Annual Shareholder Report33
Federal TaxesIt is the Fund's policy to comply with the Subchapter M provision of the Internal Revenue Code (the “Code”) and to distribute to shareholders each year substantially all of its income. Accordingly, no provision for federal income tax is necessary. As of and during the year ended October 31, 2009, the Fund did not have a liability for any uncertain tax positions. The Fund recognizes interest and penalties, if any, related to tax liabilities as income tax expense in the Statement of Operations. As of October 31, 2009, tax years 2006 through 2009 remain subject to examination by the Fund's major tax jurisdictions, which include the United States of America and the Commonwealth of Massachusetts.
The Fund may be subject to taxes imposed by governments of countries in which it invests. Such taxes are generally based on either income or gains earned or repatriated. The Fund accrues and applies such taxes to net investment income, net realized gains and net unrealized gains as income and/or gains are earned.
When-Issued and Delayed Delivery Transactions
The Fund may engage in when-issued or delayed delivery transactions. The Fund records when-issued securities on the trade date and maintains security positions such that sufficient liquid assets will be available to make payment for the securities purchased. Securities purchased on a when-issued or delayed delivery basis are marked to market daily and begin earning interest on the settlement date. Losses may occur on these transactions due to changes in market conditions or the failure of counterparties to perform under the contract.
Foreign Exchange Contracts
The Fund may enter into foreign exchange contracts for the delayed delivery of securities or foreign currency exchange transactions. The Fund may enter into foreign exchange contracts to protect assets against adverse changes in foreign currency exchange rates or exchange control regulations. Purchased contracts are used to acquire exposure to foreign currencies, whereas, contracts to sell are used to hedge the Fund's securities against currency fluctuations. Risks may arise upon entering into these transactions from the potential inability of counterparties to meet the terms of their commitments and from unanticipated movements in security prices or foreign exchange rates. The foreign exchange contracts are adjusted by the daily exchange rate of the underlying currency and any gains or losses are recorded for financial statement purposes as unrealized until the settlement date.
Foreign exchange contracts outstanding at period end are listed after the Fund's Portfolio of Investments.
Foreign Currency Translation
The accounting records of the Fund are maintained in U.S. dollars. All assets and liabilities denominated in foreign currencies (FCs) are translated into U.S. dollars based on the rates of exchange of such currencies against U.S. dollars on the date of valuation. Purchases and sales of securities, income and expenses are translated at the rate of exchange quoted on the respective date that such transactions are recorded. The Fund does not isolate that portion of the results of operations resulting from changes in foreign exchange rates on investments from the fluctuations arising from changes in market prices of securities held. Such fluctuations are included with the net realized and unrealized gain or loss from investments.
Annual Shareholder Report34
Reported net realized foreign exchange gains or losses arise from sales of portfolio securities, sales and maturities of short-term securities, sales of FCs, currency gains or losses realized between the trade and settlement dates on securities transactions, the difference between the amounts of dividends, interest and foreign withholding taxes recorded on the Fund's books, and the U.S. dollar equivalent of the amounts actually received or paid. Net unrealized foreign exchange gains and losses arise from changes in the value of assets and liabilities other than investments in securities at fiscal year end, resulting from changes in the exchange rate.Option Contracts
The Fund may buy or sell put and call options to hedge currency. The seller (writer) of an option receives a payment or premium, from the buyer, which the writer keeps regardless of whether the buyer exercises the option. Premiums paid for purchasing options which expire are treated as realized losses. The risk associated with purchasing put and call options is limited to the premium paid. When the Fund writes a put or call option, an amount equal to the premium received is recorded as a liability and subsequently marked to market to reflect the current value of the option written. Premiums received from writing options which expire are treated as realized gains. Premiums received from writing options which are exercised or closed are added to the proceeds or offset against amounts paid on the underlying reference instrument to determine the realized gain or loss. The Fund, as a writer of an option, bears the market risk of an unfavorable change in the price of the underlying reference instrument. Options can trade on securities or commodities exchanges. In this case, the exchange sets all the terms of the contract except for the price. Most exchanges require investors to maintain margin accounts through their brokers to cover their potential obligations to the exchange. This protects investors against potential defaults by the counterparty.
The following is a summary of the Fund's written option activity:
| Contracts | Number of
Contracts | Premium |
| Outstanding at October 31, 2008 | — | $ — |
| Contracts written | 75,000,240 | 2,053,048 |
| Contracts bought back | (75,000,240) | 2,053,048 |
| Outstanding at October 31, 2009 | — | $ — |
Annual Shareholder Report35
Additional Disclosure Related to Derivative Instruments
| Fair Value of Derivative Instruments |
| Asset | Liability |
| Statement of
Assets and
Liabilities
Location | Fair
Value | Statement of
Assets and
Liabilities
Location | Fair
Value |
| Derivatives not accounted for as hedging instruments under ASC Topic 815 | | | | |
| Foreign exchange contracts | Receivable for foreign
exchange contracts | $31,965 | Payable for foreign
exchange contracts | $46,496 |
The Effect of Derivative Instruments on the Statement of Operations for the Year Ended October 31, 2009
| Amount of Realized Gain or (Loss) on Derivatives Recognized in Income |
| | Forward
Currency
Contracts | Option Contracts | Total |
| Foreign exchange contracts | | $6,390 | $2,781,927 | $2,788,317 |
| Change in Unrealized Appreciation or (Depreciation) on Derivatives Recognized in Income |
| | Forward
Currency
Contracts | Option Contracts | Total |
| Foreign exchange contracts | | $(90,977) | $(7,608,195) | $(7,699,172) |
Securities Lending
The Fund participates in a securities lending program providing for the lending of equity securities to qualified brokers. The Fund normally receives cash collateral for securities loaned that is invested in an affiliated money market fund or in short-term securities including repurchase agreements. Collateral is maintained at a minimum level of 100% of the market value of investments loaned, plus interest, if applicable. Earnings on collateral are allocated between the securities lending agent, as a fee for its services under the program, and the Fund, according to agreed-upon rates.
As of October 31, 2009, securities subject to this type of arrangement and related collateral were as follows:
Market Value of
Securities Loaned | Market Value
of Collateral |
| $204,641,216 | $224,385,219 |
Annual Shareholder Report36
Restricted Securities
Restricted securities are securities that either: (a) cannot be offered for public sale without first being registered, or being able to take advantage of an exemption from registration, under the Securities Act of 1933; or (b) are subject to contractual restrictions on public sales. In some cases, when a security cannot be offered for public sale without first being registered, the issuer of the restricted security has agreed to register such securities for resale, at the issuer's expense, either upon demand by the Fund or in connection with another registered offering of the securities. Many such restricted securities may be resold in the secondary market in transactions exempt from registration. Restricted securities may be determined to be liquid under criteria established by the Trustees. The Fund will not incur any registration costs upon such resales. The Fund's restricted securities are valued at the price provided by dealers in the secondary market or, if no market prices are available, at the fair value as determined in accordance with procedures established by and under the general supervision of the Trustees.
Other
The preparation of financial statements in conformity with GAAP requires management to make estimates and assumptions that affect the amounts of assets, liabilities, expenses and revenues reported in the financial statements. Actual results could differ from those estimated.
3. SHARES OF BENEFICIAL INTEREST
The following tables summarize share activity:
| Year Ended October 31 | 2009 | 2008 |
| Class A Shares: | Shares | Amount | Shares | Amount |
| Shares sold | 19,436,987 | $316,175,739 | 14,980,374 | $325,209,335 |
| Shares issued to shareholders in payment of distributions declared | — | — | 787,568 | 20,334,997 |
| Shares redeemed | (15,435,549) | (229,785,762) | (14,349,669) | (302,177,992) |
NET CHANGE RESULTING
FROM CLASS A
SHARE TRANSACTIONS | 4,001,438 | $86,389,977 | 1,418,273 | $43,366,340 |
| Year Ended October 31 | 2009 | 2008 |
| Class B Shares: | Shares | Amount | Shares | Amount |
| Shares sold | 420,258 | $6,185,580 | 415,392 | $8,993,322 |
| Shares issued to shareholders in payment of distributions declared | — | — | 190,507 | 4,789,336 |
| Shares redeemed | (1,262,143) | (18,039,773) | (1,750,656) | (36,647,925) |
NET CHANGE RESULTING
FROM CLASS B
SHARE TRANSACTIONS | (841,885) | $(11,854,193) | (1,144,757) | $(22,865,267) |
Annual Shareholder Report37
| Year Ended October 31 | 2009 | 2008 |
| Class C Shares: | Shares | Amount | Shares | Amount |
| Shares sold | 1,881,135 | $28,945,383 | 2,289,463 | $49,628,420 |
| Shares issued to shareholders in payment of distributions declared | — | — | 331,306 | 8,329,025 |
| Shares redeemed | (3,565,361) | (49,977,925) | (3,744,271) | (76,905,396) |
NET CHANGE RESULTING
FROM CLASS C
SHARE TRANSACTIONS | (1,684,226) | $(21,032,542) | (1,123,502) | $(18,947,951) |
| Year Ended October 31 | 2009 | 2008 |
| Class K Shares: | Shares | Amount | Shares | Amount |
| Shares sold | 785,427 | $12,093,673 | 724,704 | $15,896,106 |
| Shares issued to shareholders in payment of distributions declared | — | — | 24,900 | 642,919 |
| Shares redeemed | (494,408) | (7,518,270) | (312,118) | (6,644,147) |
NET CHANGE RESULTING
FROM CLASS K
SHARE TRANSACTIONS | 291,019 | $4,575,403 | 437,486 | $9,894,878 |
NET CHANGE RESULTING
FROM FUND
SHARE TRANSACTIONS | 1,766,346 | $58,078,645 | (412,500) | $11,448,000 |
4. FEDERAL TAX INFORMATION
The timing and character of income and capital gain distributions are determined in accordance with income tax regulations, which may differ from GAAP. These differences are due in part to differing treatments for foreign currency transactions, foreign capital gains tax expense, net operating losses and discount accretion/premium amortization on debt securities.
For the year ended October 31, 2009, permanent differences identified and reclassified among the components of net assets were as follows:
| Increase (Decrease) |
| Paid-In Capital | Undistributed
Net Investment
Income (Loss) | Accumulated
Net Realized
Gain (Loss) |
| $(2,513,415) | $5,129,292 | $(2,615,877) |
Net investment income (loss), net realized gains (losses), and net assets were not affected by this reclassification.
The tax character of distributions as reported on the Statement of Changes in Net Assets for the years ended October 31, 2009 and 2008, was as follows:
| 2009 | 2008 |
| Ordinary income1 | $ — | $13,337,468 |
| Long-term capital gains | $ — | $32,804,391 |
| 1 | For tax purposes, short-term capital gain distributions are considered ordinary income distributions. |
Annual Shareholder Report38
As of October 31, 2009, the components of distributable earnings on a tax basis were as follows:
| Net unrealized depreciation | $(25,006,661) |
| Capital loss carryforwards | $(145,551,180) |
The difference between book-basis and tax-basis net unrealized appreciation/depreciation is attributable in part to differing treatments for the deferral of losses on wash sales, passive foreign investment company gains and losses, discount accretion/premium amortization on debt securities and transactions in certain securities on loan.
At October 31, 2009, the cost of investments for federal tax purposes was $1,261,951,517. The net unrealized depreciation of investments for federal tax purposes excluding any unrealized depreciation resulting from changes in foreign currency exchange rates and outstanding foreign exchange contracts was $24,970,032. This consists of net unrealized appreciation from investments for those securities having an excess of value over cost of $146,978,439 and net unrealized depreciation from investments for those securities having an excess of cost over value of $171,948,471.
At October 31, 2009, the Fund had a capital loss carryforward of $145,551,180 which will reduce the Fund's taxable income arising from future net realized gains on investments, if any, to the extent permitted by the Code and thus will reduce the amount of distributions to shareholders which would otherwise be necessary to relieve the Fund of any liability for federal income tax. Pursuant to the Code, such capital loss carryforward will expire as follows:
| Expiration Year | Expiration Amount |
| 2016 | $27,041,641 |
| 2017 | $118,509,539 |
5. INVESTMENT ADVISER FEE AND OTHER TRANSACTIONS WITH AFFILIATES
Investment Adviser Fee
Federated Equity Management Company of Pennsylvania is the Fund's investment adviser (the “Adviser”). The advisory agreement between the Fund and the Adviser provides for an annual fee equal to 1.425% of the Fund's average daily net assets. Subject to the terms described in the Expense Limitation note, The Adviser may voluntarily choose to waive any portion of its fee. The Adviser can modify or terminate this voluntary waiver at any time at its sole discretion. For the year ended October 31, 2009, the Adviser voluntarily waived $1,260,012 of its fee. In addition, an affiliate of the Adviser reimbursed $1,187,876 of transfer and dividend disbursing agent fees and expenses.
Certain of the Fund's assets are managed by Federated Global Investment Management Corp. (the “Sub-Adviser”). Under the terms of a sub-advisory agreement between the Adviser and the Sub-Adviser, the Sub-Adviser receives an allocable portion of the Fund's adviser fee. The fee is paid by the Adviser out of its resources and is not an incremental Fund expense. For the year ended October 31, 2009, the Sub-Adviser earned a fee of $9,396,813.
Annual Shareholder Report39
Administrative FeeFederated Administrative Services (FAS), under the Administrative Services Agreement, provides the Fund with administrative personnel and services. The fee paid to FAS is based on the average aggregate daily net assets of certain Federated funds as specified below:
| Administrative Fee | Average Aggregate Daily Net Assets
of the Federated Funds |
| 0.150% | on the first $5 billion |
| 0.125% | on the next $5 billion |
| 0.100% | on the next $10 billion |
| 0.075% | on assets in excess of $20 billion |
The administrative fee received during any fiscal year shall be at least $150,000 per portfolio and $40,000 per each additional class of Shares. Subject to the terms described in the Expense Limitation note, FAS may voluntarily choose to waive any portion of its fee. FAS can modify or terminate this voluntary waiver at any time at its sole discretion. For the year ended October 31, 2009, the net fee paid to FAS was 0.076% of average daily net assets of the Fund. FAS waived $12,232 of its fee.
Distribution Services Fee
The Fund has adopted a Distribution Plan (the “Plan”) pursuant to Rule 12b-1 under the Act. Under the terms of the Plan, the Fund will compensate Federated Securities Corp. (FSC), the principal distributor, from the daily net assets of the Fund's Class A Shares, Class B Shares, Class C Shares and Class K Shares to finance activities intended to result in the sale of these shares. The Plan provides that the Fund may incur distribution expenses at the following percentages of average daily net assets annually, to compensate FSC:
| Share Class Name | Percentage of Average Daily
Net Assets of Class |
| Class A Shares | 0.25% |
| Class B Shares | 0.75% |
| Class C Shares | 0.75% |
| Class K Shares | 0.50% |
Subject to the terms described in the Expense Limitation note, FSC may voluntarily choose to waive any portion of its fee. FSC can modify or terminate this voluntary waiver at any time at its sole discretion. For the year ended October 31, 2009, FSC voluntarily waived $304,417 of its fee. When FSC receives fees, it may pay some or all of them to financial intermediaries whose customers purchase shares. For the year ended October 31, 2009, FSC retained $1,246,136 of fees paid by the Fund.
Sales Charges
Front-end sales charges and contingent deferred sales charges (CDSC) do not represent expenses of the Fund. They are deducted from the proceeds of sales of Fund shares prior to investment or from redemption proceeds prior to remittance, as applicable. For the year ended October 31, 2009, FSC retained $45,188 in sales charges from the sale of Class A Shares. FSC also retained $689 of CDSC relating to redemptions of Class A Shares and $13,735 relating to redemptions of Class C Shares.
Annual Shareholder Report40
Shareholder Services FeeThe Fund may pay fees (Service Fees) up to 0.25% of the average daily net assets of the Fund's Class A Shares, Class B Shares and Class C Shares to financial intermediaries or to Federated Shareholder Services Company (FSSC) for providing services to shareholders and maintaining shareholder accounts. Financial intermediaries may include a company affiliated with management of Federated Investors, Inc. A financial intermediary affiliated with management of Federated Investors, Inc. received $24,068 of Service Fees for the year ended October 31, 2009. Subject to the terms described in the Expense Limitation note, FSSC may voluntarily reimburse the Fund for shareholder services fees. This voluntary reimbursement can be modified or terminated at any time. For the year ended October 31, 2009, FSSC did not receive any fees paid by the Fund.
Interfund Transactions
During the year ended October 31, 2009, the Fund engaged in purchase and sale transactions with funds that have a common investment adviser (or affiliated investment advisers), common Directors/Trustees, and/or common Officers. These purchase and sale transactions complied with Rule 17a-7 under the Act and amounted to $7,960,651 and $1,783,103, respectively.
Expense Limitation
The Adviser and its affiliates (which may include FSC, FAS and FSSC) have voluntarily agreed to waive their fees and/or reimburse expenses so that the total operating expenses (as shown in the financial highlights) paid by the Fund's Class A Shares, Class B Shares, Class C Shares and Class K Shares (after the voluntary waivers and reimbursements) will not exceed 1.95%, 2.50%, 2.50% and 1.95%, respectively, through the later of (the “Termination Date”): (a) December 31, 2010; or (b) the date of the Fund's next effective Prospectus. While the Adviser and its affiliates currently do not anticipate terminating these arrangements prior to the Termination Date, these arrangements may only be terminated prior to the Termination Date with the agreement of the Fund's Board of Trustees.
General
Certain Officers and Trustees of the Fund are Officers and Directors or Trustees of the above companies.
Transactions with Affiliated Companies
Affiliated holdings are mutual funds which are managed by the Adviser or an affiliate of the Adviser. The Adviser has agreed to reimburse the Fund for certain investment adviser fees as a result of transactions in other affiliated mutual funds. For the year ended October 31, 2009, the Adviser reimbursed $183,800. Transactions with the affiliated company during the year ended October 31, 2009, were as follows:
| Affiliate | Balance of
Shares Held
10/31/2008 | Purchases/
Additions | Sales/
Reductions | Balance of
Shares Held
10/31/2009 | Value | Dividend
Income |
| Prime Value Obligations Fund, Institutional Shares | 121,073,881 | 1,244,205,339 | 1,112,242,666 | 253,036,554 | $253,036,554 | $159,986 |
Annual Shareholder Report41
6. EXPENSE Reduction
The Fund directs portfolio trades to a broker that in turn pays a portion of the Fund's operating expenses. For the year ended October 31, 2009, the Fund's expenses were reduced by $16,060 under these arrangements.
7. Investment TRANSACTIONS
Purchases and sales of investments, excluding long-term U.S. government securities and short-term obligations, for the year ended October 31, 2009, were as follows:
| Purchases | $778,477,738 |
| Sales | $707,795,635 |
8. CONCENTRATION OF RISK
The Fund may invest a portion of its assets in securities of companies that are deemed by the Fund's management to be classified in similar business sectors. Economic developments may have an effect on the liquidity and volatility of the portfolio securities.
9. LINE OF CREDIT
The Fund participates in a $100,000,000 unsecured, uncommitted revolving line of credit (LOC) agreement with PNC Bank. The LOC was made available for extraordinary or emergency purposes, primarily for financing redemption payments. Borrowings are charged interest at a rate offered to the Fund by PNC Bank at the time of the borrowing. As of October 31, 2009, there were no outstanding loans. During the year ended October 31, 2009, the Fund did not utilize the LOC.
10. INTERFUND LENDING
Pursuant to an Exemptive Order issued by the Securities and Exchange Commission (SEC), the Fund, along with other funds advised by subsidiaries of Federated Investors, Inc., may participate in an interfund lending program. This program provides an alternative credit facility allowing the Fund to borrow from other participating affiliated funds. As of October 31, 2009, there were no outstanding loans. During the year ended October 31, 2009, the program was not utilized.
11. Legal Proceedings
Since October 2003, Federated Investors, Inc. and related entities (collectively, Federated) and various Federated funds (Federated Funds) have been named as defendants in several class action lawsuits now pending in the United States District Court for the District of Maryland. The lawsuits were purportedly filed on behalf of people who purchased, owned and/or redeemed shares of Federated-sponsored mutual funds during specified periods beginning November 1, 1998. The suits are generally similar in alleging that Federated engaged in illegal and improper trading practices including market timing and late trading in concert with certain institutional traders, which allegedly caused financial injury to the mutual fund shareholders. These lawsuits began to be filed shortly after Federated's first public announcement that it had received requests for information on shareholder trading activities in the Federated Funds from the SEC, the Office of the New York State Attorney General (NYAG), and other authorities. In that regard, on November 28, 2005, Federated announced that it had reached final settlements with the SEC and the NYAG with respect to those matters. As Federated previously reported in 2004, it has already paid approximately $8.0 million to certain funds as determined by an independent consultant. As part of these settlements, Annual Shareholder Report42
Federated agreed to pay for the benefit of fund shareholders additional disgorgement and a civil money penalty in the aggregate amount of an additional $72 million. Federated entities have also been named as defendants in several additional lawsuits that are now pending in the United States District Court for the Western District of Pennsylvania, alleging, among other things, excessive advisory and Rule 12b-1 fees. The Board of the Federated Funds retained the law firm of Dickstein Shapiro LLP to represent the Federated Funds in these lawsuits. Federated and the Federated Funds, and their respective counsel have been defending this litigation, and none of the Federated Funds remains a defendant in any of the lawsuits (though some could potentially receive any recoveries as nominal defendants). Additional lawsuits based upon similar allegations may be filed in the future. The potential impact of these lawsuits, all of which seek unquantified damages, attorneys' fees and expenses, and future potential similar suits is uncertain. Although we do not believe that these lawsuits will have a material adverse effect on the Federated Funds, there can be no assurance that these suits, the ongoing adverse publicity and/or other developments resulting from the regulatory investigations will not result in increased Federated Fund redemptions, reduced sales of Federated Fund shares or other adverse consequences for the Federated Funds.12. Subsequent events
Management has evaluated subsequent events through December 24, 2009, the date the financial statements were issued, and determined that no events have occurred that require additional disclosure.
Annual Shareholder Report43
Report of Independent Registered Public Accounting Firm
TO THE BOARD OF Trustees OF Federated Equity Funds AND SHAREHOLDERS OF Federated Kaufmann Small Cap Fund:
We have audited the accompanying statement of assets and liabilities of Federated Kaufmann Small Cap Fund (the “Fund”), one of the portfolios constituting Federated Equity Funds, including the portfolio of investments, as of October 31, 2009, and the related statement of operations for the year then ended, the statement of changes in net assets for each of the two years in the period then ended, and the financial highlights for each of the periods indicated therein. These financial statements and financial highlights are the responsibility of the Fund's management. Our responsibility is to express an opinion on these financial statements and financial highlights based on our audits.
We conducted our audits in accordance with standards of the Public Company Accounting Oversight Board (United States). Those standards require that we plan and perform the audit to obtain reasonable assurance about whether the financial statements and financial highlights are free of material misstatement. We were not engaged to perform an audit of the Fund's internal control over financial reporting. Our audits included consideration of internal control over financial reporting as a basis for designing audit procedures that are appropriate in the circumstances, but not for the purpose of expressing an opinion on the effectiveness of the Fund's internal control over financial reporting. Accordingly, we express no such opinion. An audit also includes examining, on a test basis, evidence supporting the amounts and disclosures in the financial statements and financial highlights, assessing the accounting principles used and significant estimates made by management, and evaluating the overall financial statement presentation. Our procedures included confirmation of securities owned as of October 31, 2009, by correspondence with the custodian and brokers or by other appropriate auditing procedures where replies from brokers were not received. We believe that our audits provide a reasonable basis for our opinion.
In our opinion, the financial statements and financial highlights referred to above present fairly, in all material respects, the financial position of Federated Kaufmann Small Cap Fund, a portfolio of Federated Equity Funds, at October 31, 2009, the results of its operations for the year then ended, the changes in its net assets for each of the two years in the period then ended, and the financial highlights for each of the periods indicated therein, in conformity with U.S. generally accepted accounting principles.
Boston, Massachusetts
December 24, 2009
Annual Shareholder Report44
Board of Trustees and Trust Officers
The Board is responsible for managing the Trust's business affairs and for exercising all the Trust's powers except those reserved for the shareholders. The following tables give information about each Board member and the senior officers of the Fund. Where required, the tables separately list Board members who are “interested persons” of the Fund (i.e., “Interested” Board members) and those who are not (i.e., “Independent” Board members). Unless otherwise noted, the address of each person listed is Federated Investors Tower, 1001 Liberty Avenue, Pittsburgh, PA 15222. The address of all Independent Board members listed is 4000 Ericsson Drive, Warrendale, PA 15086-7561; Attention: Mutual Fund Board. As of December 31, 2008, the Trust comprised ten portfolios, and the Federated Fund Complex consisted of 40 investment companies (comprising 149 portfolios). Unless otherwise noted, each Officer is elected annually. Unless otherwise noted, each Board member oversees all portfolios in the Federated Fund Complex and serves for an indefinite term. The Fund's Statement of Additional Information includes additional information about Trust Trustees and is available, without charge and upon request, by calling 1-800-341-7400.
Interested TRUSTEES Background
Name
Birth Date
Positions Held with Trust
Date Service Began | Principal Occupation(s) for Past Five Years,
Other Directorships Held and Previous Position(s) |
John F. Donahue*
Birth Date: July 28, 1924
TRUSTEE
Began serving: April 1984 | Principal Occupations: Director or Trustee of the Federated Fund Complex; Chairman and Director, Federated Investors, Inc.; Chairman of the Federated Fund Complex's Executive Committee.
Previous Positions: Chairman of the Federated Fund Complex; Trustee, Federated Investment Management Company; Chairman and Director, Federated Investment Counseling. |
J. Christopher Donahue*
Birth Date: April 11, 1949
PRESIDENT AND TRUSTEE
Began serving: January 2000 | Principal Occupations: Principal Executive Officer and President of the Federated Fund Complex; Director or Trustee of some of the Funds in the Federated Fund Complex; President, Chief Executive Officer and Director, Federated Investors, Inc.; Chairman and Trustee, Federated Investment Management Company; Trustee, Federated Investment Counseling; Chairman and Director, Federated Global Investment Management Corp.; Chairman, Federated Equity Management Company of Pennsylvania and Passport Research, Ltd. (investment advisory subsidiary of Federated); Trustee, Federated Shareholder Services Company; Director, Federated Services Company.
Previous Positions: President, Federated Investment Counseling; President and Chief Executive Officer, Federated Investment Management Company, Federated Global Investment Management Corp. and Passport Research, Ltd. |
| * | Family relationships and reasons for “interested” status: John F. Donahue is the father of J. Christopher Donahue; both are “interested” due to their beneficial ownership of shares of Federated Investors, Inc. and the positions they hold with Federated and its subsidiaries. |
Annual Shareholder Report45
INDEPENDENT TRUSTEES Background
Name
Birth Date
Positions Held with Trust
Date Service Began | Principal Occupation(s) for Past Five Years,
Other Directorships Held and Previous Position(s) |
John T. Conroy, Jr., Ph.D.
Birth Date: June 23, 1937
TRUSTEE
Began serving: November 1991 | Principal Occupations: Director or Trustee of the Federated Fund Complex; Chairman of the Board, Investment Properties Corporation; Partner or Trustee in private real estate ventures in Southwest Florida; Assistant Professor in Theology, Blessed Edmund Rice School for Pastoral Ministry.
Previous Positions: President, Investment Properties Corporation; Senior Vice President, John R. Wood and Associates, Inc., Realtors; President, Naples Property Management, Inc. and Northgate Village Development Corporation. |
Nicholas P. Constantakis
Birth Date: September 3, 1939
TRUSTEE
Began serving: February 1998 | Principal Occupation: Director or Trustee of the Federated Fund Complex.
Other Directorship Held: Director and Chairman of the Audit Committee, Michael Baker Corporation (architecture, engineering and construction services).
Previous Position: Partner, Andersen Worldwide SC. |
John F. Cunningham
Birth Date: March 5, 1943
TRUSTEE
Began serving: January 1999 | Principal Occupation: Director or Trustee of the Federated Fund Complex.
Other Directorships Held: Chairman, President and Chief Executive Officer, Cunningham & Co., Inc. (strategic business consulting); Trustee Associate, Boston College.
Previous Positions: Director, Redgate Communications and EMC Corporation (computer storage systems); Chairman of the Board and Chief Executive Officer, Computer Consoles, Inc.; President and Chief Operating Officer, Wang Laboratories; Director, First National Bank of Boston; Director, Apollo Computer, Inc. |
Maureen Lally-Green
Birth Date: July 5, 1949
TRUSTEE
Began serving: August 2009 | Principal Occupations: Director or Trustee of the Federated Fund Complex; Director, Office of Church Relations, Diocese of Pittsburgh; Adjunct Professor of Law, Duquesne University School of Law.
Other Directorships Held: Director, Auberle; Trustee St. Francis University; Director, Ireland Institute of Pittsburgh; Director, UPMC Mercy Hospital; Regent, St. Vincent Seminary; Director, Epilepsy Foundation of Western and Central Pennsylvania; Director, Saint Thomas More Society, Allegheny County; Director, Carlow University.
Previous Position: Pennsylvania Superior Court Judge. |
Annual Shareholder Report46
Name
Birth Date
Positions Held with Trust
Date Service Began | Principal Occupation(s) for Past Five Years,
Other Directorships Held and Previous Position(s) |
Peter E. Madden
Birth Date: March 16, 1942
TRUSTEE
Began serving: November 1991 | Principal Occupation: Director or Trustee and Chairman of the Board of the Federated Fund Complex.
Other Directorship Held: Board of Overseers, Babson College.
Previous Positions: Representative, Commonwealth of Massachusetts General Court; President, Chief Operating Officer and Director, State Street Bank and Trust Company and State Street Corporation (retired); Director, VISA USA and VISA International; Chairman and Director, Massachusetts Bankers Association; Director, Depository Trust Corporation; Director, The Boston Stock Exchange. |
Charles F. Mansfield, Jr.
Birth Date: April 10, 1945
TRUSTEE
Began serving: January 1999 | Principal Occupations: Director or Trustee and Chairman of the Audit Committee of the Federated Fund Complex; Management Consultant.
Previous Positions: Chief Executive Officer, PBTC International Bank; Partner, Arthur Young & Company (now Ernst & Young LLP); Chief Financial Officer of Retail Banking Sector, Chase Manhattan Bank; Senior Vice President, HSBC Bank USA (formerly, Marine Midland Bank); Vice President, Citibank; Assistant Professor of Banking and Finance, Frank G. Zarb School of Business, Hofstra University; Executive Vice President DVC Group, Inc. (marketing, communications and technology). |
R. James Nicholson
Birth Date: February 4, 1938
TRUSTEE
Began serving: April 2008 | Principal Occupations: Director or Trustee of the Federated Fund Complex; Senior Counsel, Brownstein Hyatt Farber Schrek, P.C.; Former Secretary of the U.S. Dept. of Veterans Affairs; Former U.S. Ambassador to the Holy See; Former Chairman of the Republican National Committee.
Other Directorships Held: Director, Horatio Alger Association; Director, The Daniels Fund.
Previous Positions: Colonel, U.S. Army Reserve; Partner, Calkins, Kramer, Grimshaw and Harring, P.C.; General Counsel, Colorado Association of Housing and Building; Chairman and CEO, Nicholson Enterprises, Inc. (real estate holding company); Chairman and CEO, Renaissance Homes of Colorado. |
Thomas M. O'Neill
Birth Date: June 14, 1951
TRUSTEE
Began serving: October 2006 | Principal Occupations: Director or Trustee of the Federated Fund Complex; Managing Director and Partner, Navigator Management Company, L.P. (investment and strategic consulting).
Other Directorships Held: Board of Overseers, Children's Hospital of Boston; Visiting Committee on Athletics, Harvard College.
Previous Positions: Chief Executive Officer and President, Managing Director and Chief Investment Officer, Fleet Investment Advisors; President and Chief Executive Officer, Aeltus Investment Management, Inc.; General Partner, Hellman, Jordan Management Co., Boston, MA; Chief Investment Officer, The Putnam Companies, Boston, MA; Credit Analyst and Lending Officer, Fleet Bank; Director and Consultant, EZE Castle Software (investment order management software); Director, Midway Pacific (lumber). |
Annual Shareholder Report47
Name
Birth Date
Positions Held with Trust
Date Service Began | Principal Occupation(s) for Past Five Years,
Other Directorships Held and Previous Position(s) |
John S. Walsh
Birth Date: November 28, 1957
TRUSTEE
Began serving: January 1999 | Principal Occupations: Director or Trustee of the Federated Fund Complex; President and Director, Heat Wagon, Inc. (manufacturer of construction temporary heaters); President and Director, Manufacturers Products, Inc. (distributor of portable construction heaters); President, Portable Heater Parts, a division of Manufacturers Products, Inc.
Previous Position: Vice President, Walsh & Kelly, Inc. |
James F. Will
Birth Date: October 12, 1938
TRUSTEE
Began serving: April 2006 | Principal Occupations: Director or Trustee of the Federated Fund Complex; formerly, Vice Chancellor and President, Saint Vincent College.
Other Directorships Held: Trustee, Saint Vincent College; Alleghany Corporation.
Previous Positions: Chairman, President and Chief Executive Officer, Armco, Inc.; President and Chief Executive Officer, Cyclops Industries; President and Chief Operating Officer, Kaiser Steel Corporation. |
OFFICERS
Name
Birth Date
Address
Positions Held with Trust
Date Service Began | Principal Occupation(s) for Past Five Years
and Previous Position(s) |
John W. McGonigle
Birth Date: October 26, 1938
EXECUTIVE VICE PRESIDENT AND SECRETARY
Began serving: April 1984 | Principal Occupations: Executive Vice President and Secretary of the Federated Fund Complex; Vice Chairman, Executive Vice President, Secretary and Director, Federated Investors, Inc.
Previous Positions: Trustee, Federated Investment Management Company and Federated Investment Counseling; Director, Federated Global Investment Management Corp., Federated Services Company and Federated Securities Corp. |
Richard A. Novak
Birth Date: December 25, 1963
TREASURER
Began serving: January 2006 | Principal Occupations: Principal Financial Officer and Treasurer of the Federated Fund Complex; Senior Vice President, Federated Administrative Services; Financial and Operations Principal for Federated Securities Corp., Edgewood Services, Inc. and Southpointe Distribution Services, Inc.
Previous Positions: Controller of Federated Investors, Inc.; Vice President, Finance of Federated Services Company; held various financial management positions within The Mercy Hospital of Pittsburgh; Auditor, Arthur Andersen & Co. |
Richard B. Fisher
Birth Date: May 17, 1923
VICE PRESIDENT
Began serving: April 1984 | Principal Occupations: Vice Chairman or Vice President of some of the Funds in the Federated Fund Complex; Vice Chairman, Federated Investors, Inc.; Chairman, Federated Securities Corp.
Previous Positions: President and Director or Trustee of some of the Funds in the Federated Fund Complex; Executive Vice President, Federated Investors, Inc.; Director and Chief Executive Officer, Federated Securities Corp. |
Annual Shareholder Report48
Name
Birth Date
Address
Positions Held with Trust
Date Service Began | Principal Occupation(s) for Past Five Years
and Previous Position(s) |
Brian P. Bouda
Birth Date: February 28, 1947
CHIEF COMPLIANCE OFFICER AND SENIOR VICE PRESIDENT
Began serving: August 2004 | Principal Occupations: Senior Vice President and Chief Compliance Officer of the Federated Fund Complex; Vice President and Chief Compliance Officer of Federated Investors, Inc. and Chief Compliance Officer of its subsidiaries. Mr. Bouda joined Federated in 1999 and is a member of the American Bar Association and the State Bar Association of Wisconsin. |
Stephen F. Auth
Birth Date: September 3, 1956
450 Lexington Avenue
Suite 3700
New York, NY 10017-3943
CHIEF INVESTMENT OFFICER
Began serving: November 2002 | Principal Occupations: Mr. Auth is Chief Investment Officer of this Fund and various other Funds in the Federated Fund Complex; Executive Vice President, Federated Investment Counseling, Federated Global Investment Management Corp. and Federated Equity Management Company of Pennsylvania.
Previous Positions: Executive Vice President, Federated Investment Management Company, and Passport Research, Ltd. (investment advisory subsidiary of Federated); Senior Vice President, Global Portfolio Management Services Division; Senior Vice President, Federated Investment Management Company and Passport Research, Ltd.; Senior Managing Director and Portfolio Manager, Prudential Investments. |
Lawrence Auriana
Birth Date: January 8, 1944
140 East 45th Street
New York, NY 10017
VICE PRESIDENT
Began serving: November 2001 | Principal Occupations: Lawrence Auriana has been the Fund's Portfolio Manager since inception. He is Vice President of the Trust. Mr. Auriana joined Federated in April 2001 as Co-Head of Investments/Federated Kaufmann. From August 1984 to April 2001, Mr. Auriana was President and Treasurer of Edgemont Asset Management Corp., and Chairman of the Board and Portfolio Manager to The Kaufmann Fund, Inc. (predecessor to the Federated Kaufmann Fund). Mr. Auriana earned a B.S. in economics from Fordham University and has been engaged in the securities business since 1965. |
Walter C. Bean
Birth Date: June 22, 1945
VICE PRESIDENT
Began serving: November 2006 | Principal Occupations: Walter C. Bean is Vice President of the Trust. Mr. Bean is a Senior Vice President, Senior Portfolio Manager and the Head of the Equity Income Management Team of the Fund's Adviser. Mr. Bean joined Federated in 2000. His previous associations included: various investment management and research positions with C.S. McKee & Company; First Chicago Investment Advisors; CIGNA Investment Advisors; and Mellon Bank. Mr. Bean earned a Bachelors Degree in Business Administration from Ohio University and an M.B.A. from the Pennsylvania State University. Mr. Bean is a Chartered Financial Analyst and has 40 years of investment experience. |
Hans P. Utsch
Birth Date: July 3, 1936
VICE PRESIDENT
Began serving: November 2001 | Principal Occupations: Hans P. Utsch has been the Fund's Portfolio Manager since inception. He is Vice President of the Trust. Mr. Utsch joined Federated in April 2001 as Co-Head of Investments/Federated Kaufmann. From August 1984 to April 2001, Mr. Utsch was Chairman of the Board and Secretary of Edgemont Asset Management Corp., and President and Portfolio Manager to The Kaufmann Fund, Inc. (predecessor to the Federated Kaufmann Fund). Mr. Utsch graduated from Amherst College and holds an M.B.A. from Columbia University. He has been engaged in the securities business since 1962. |
Annual Shareholder Report49
Evaluation and Approval of Advisory Contract - May 2009
Federated Kaufmann Small Cap Fund (the “Fund”)
The Fund's Board reviewed the Fund's investment advisory and subadvisory contracts at meetings held in May 2009. The Board's decision regarding these contracts reflects the exercise of its business judgment on whether to continue the existing arrangements.
In this connection, the Federated funds' Board had previously appointed a Senior Officer, whose duties include specified responsibilities relating to the process by which advisory fees are to be charged to a Federated fund. The Senior Officer has the authority to retain consultants, experts, or staff as may be reasonably necessary to assist in the performance of his duties, reports directly to the Board, and may be terminated only with the approval of a majority of the independent members of the Board. The Senior Officer prepared and furnished to the Board an independent, written evaluation that covered topics discussed below. The Board considered that evaluation, along with other information, in deciding to approve the advisory and subadvisory contracts.
During its review of these contracts, the Board considered compensation and benefits received by the Adviser and subadviser. This included the fees received for services provided to the Fund by other entities in the Federated organization and research services received by the Adviser from brokers that execute Federated fund trades, as well as advisory fees. The Board is also familiar with and considered judicial decisions concerning allegedly excessive investment advisory fees, which have indicated that the following factors may be relevant to an Adviser's fiduciary duty with respect to its receipt of compensation from a fund: the nature and quality of the services provided by the Adviser, including the performance of the fund; the Adviser's cost of providing the services; the extent to which the Adviser may realize “economies of scale” as a fund grows larger; any indirect benefits that may accrue to the Adviser and its affiliates as a result of the Adviser's relationship with a fund; performance and expenses of comparable funds; and the extent to which the independent Board members are fully informed about all facts the Board deems relevant bearing on the Adviser's services and fees. The Board further considered management fees (including any components thereof) charged to institutional and other clients of the Adviser and subadviser for what might be viewed as like services, and the cost to the Adviser and its affiliates of supplying services pursuant to the management fee agreements, excluding any intra-corporate profit and profit margins of the Adviser and its affiliates for supplying such services. The Board was aware of these factors and was guided by them in its review of the Fund's advisory and subadvisory contracts to the extent it considered them to be appropriate and relevant, as discussed further below.
Annual Shareholder Report50
The Board considered and weighed these circumstances in light of its substantial accumulated experience in governing the Fund and working with Federated on matters relating to the Federated funds, and was assisted in its deliberations by independent legal counsel. Throughout the year, the Board has requested and received substantial and detailed information about the Fund and the Federated organization that was in addition to the extensive materials that comprise and accompany the Senior Officer's evaluation. Federated provided much of this information at each regular meeting of the Board, and furnished additional reports in connection with the particular meeting at which the Board's formal review of the advisory and subadvisory contracts occurred. Between regularly scheduled meetings, the Board also received information on particular matters as the need arose. Thus, the Board's consideration of the advisory and subadvisory contracts included review of the Senior Officer's evaluation, accompanying data and additional reports covering such matters as: the Adviser's and subadviser's investment philosophy, revenue, profitability, personnel and processes; investment and operating strategies; the Fund's short- and long-term performance (in absolute terms, both on a gross basis and net of expenses, as well as in relationship to its particular investment program and certain competitor or “peer group” funds and/or other benchmarks, as appropriate), and comments on the reasons for performance; the Fund's investment objectives; the Fund's expenses (including the advisory fee itself and the overall expense structure of the Fund, both in absolute terms and relative to similar and/or competing funds, with due regard for contractual or voluntary expense limitations); the use and allocation of brokerage commissions derived from trading the Fund's portfolio securities (if any); and the nature, quality and extent of the advisory and other services provided to the Fund by the Adviser and its affiliates. The Board also considered the preferences and expectations of Fund shareholders and their relative sophistication; the continuing state of competition in the mutual fund industry and market practices; the range of comparable fees for similar funds in the mutual fund industry; the Fund's relationship to the Federated family of funds which include a comprehensive array of funds with different investment objectives, policies and strategies which are available for exchange without the incurrence of additional sales charges; compliance and audit reports concerning the Federated funds and the Federated companies that service them (including communications from regulatory agencies), as well as Federated's responses to any issues raised therein; and relevant developments in the mutual fund industry and how the Federated funds and/or Federated are responding to them. The Board's evaluation process is evolutionary. The criteria considered and the emphasis placed on relevant criteria change in recognition of changing circumstances in the mutual fund marketplace. Annual Shareholder Report51
With respect to the Fund's performance and expenses in particular, the Board has found the use of comparisons to other mutual funds with comparable investment programs to be particularly useful, given the high degree of competition in the mutual fund business. The Board focused on comparisons with other similar mutual funds more heavily than non-mutual fund products or services because, it is believed that, they are more relevant. For example, other mutual funds are the products most like the Fund, they are readily available to Fund shareholders as alternative investment vehicles, and they are the type of investment vehicle in fact chosen and maintained by the Fund's investors. The range of their fees and expenses therefore appears to be a generally reliable indication of what consumers have found to be reasonable in the precise marketplace in which the Fund competes. The Fund's ability to deliver competitive performance when compared to its peer group was a useful indicator of how the Adviser is executing the Fund's investment program, which in turn assisted the Board in reaching a conclusion that the nature, extent, and quality of the Adviser's investment management services were such as to warrant continuation of the advisory contract. In this regard, the Senior Officer has reviewed Federated's fees for providing advisory services to products outside the Federated family of funds (e.g., institutional and separate accounts). He concluded that mutual funds and institutional accounts are inherently different products. Those differences include, but are not limited to, different types of targeted investors; being subject to different laws and regulations; different legal structures; different average account sizes; different associated costs; different portfolio management techniques made necessary by different cash flows; and portfolio manager time spent in review of securities pricing. The Senior Officer did not consider these fee schedules to be determinative in judging the appropriateness of mutual fund advisory contracts.The Senior Officer reviewed reports compiled by Federated, using data supplied by independent fund ranking organizations, regarding the performance of, and fees charged by, other mutual funds, noting his view that comparisons to fund peer groups are highly important in judging the reasonableness of proposed fees.
For the periods covered by the report, the Fund's performance for the five-year period was above the median of the relevant peer group, and the Fund's performance fell below the median of the relevant peer group for the one-year period. For the three-year period, the Fund's performance was at the median of the relevant peer group. The Board discussed the Fund's performance with the Adviser and recognized the efforts being undertaken by the Adviser. The Board will continue to monitor these efforts and the performance of the Fund.
The Board also received financial information about Federated, including reports on the compensation and benefits Federated derived from its relationships with the Federated funds. These reports covered not only the fees under the advisory contracts, but also fees received by Federated's subsidiaries for providing other services to the Federated funds under separate contracts Annual Shareholder Report52
(e.g., for serving as the Federated funds' administrator). The reports also discussed any indirect benefit Federated may derive from its receipt of research services from brokers who execute Federated fund trades. In addition, the Board considered the fact that, in order for a fund to be competitive in the marketplace, Federated and its affiliates frequently waived fees and/or reimbursed expenses and have disclosed to fund investors and/or indicated to the Board their intention to do so in the future, where appropriate. Moreover, the Board receives regular reports regarding the institution or elimination of these voluntary waivers.Federated furnished reports, requested by the Senior Officer, that reported revenues on a fund-by-fund basis and made estimates of the allocation of expenses on a fund-by-fund basis, using allocation methodologies specified by the Senior Officer. The Senior Officer noted that, although they may apply consistent allocation processes, the inherent difficulties in allocating costs (and the unavoidable arbitrary aspects of that exercise) and the lack of consensus on how to allocate those costs may render such allocation reports unreliable. The allocation reports were considered in the analysis by the Board but were determined to be of limited use.
The Board and the Senior Officer also reviewed a report compiled by Federated comparing profitability information for Federated to other publicly held fund management companies. In this regard, the Senior Officer noted the limited availability of such information, but nonetheless concluded that Federated's profit margins did not appear to be excessive and the Board agreed.
The Senior Officer's evaluation also discussed the notion of possible realization of “economies of scale” as a fund grows larger. The Board considered in this regard that the Adviser has made significant and long-term investments in areas that support all of the Federated funds, such as personnel and processes for the portfolio management, compliance, and risk management functions; and systems technology; and that the benefits of these efforts (as well as any economies, should they exist) were likely to be enjoyed by the fund complex as a whole. Finally, the Board also noted the absence of any applicable regulatory or industry guidelines on this subject, which (as discussed in the Senior Officer's evaluation) is compounded by the lack of any common industry practice or general pattern with respect to structuring fund advisory fees with “breakpoints” that serve to reduce the fee as the fund attains a certain size. The Senior Officer did not recommend institution of breakpoints in pricing Federated's fund advisory services at this time.
It was noted in the materials for the Board meeting that for the period covered by the report, the Fund's investment advisory fee, after waivers and expense reimbursements, if any, was above the median of the relevant peer group. The Board reviewed the fees and other expenses of the Fund with the Adviser and was satisfied that the overall expense structure of the Fund remained competitive. The Board will continue to monitor advisory fees and other expenses borne by the Fund.
Annual Shareholder Report53
The Senior Officer's evaluation noted his belief that the information and observations contained in his evaluation supported a finding that the proposed management fees are reasonable, and that Federated appeared to provide appropriate administrative services to the Fund for the fees paid. Under these circumstances, no changes were recommended to, and no objection was raised to, the continuation of the Fund's advisory and subadvisory contracts. The Board concluded that the nature, quality and scope of services provided the Fund by the Adviser and its affiliates were satisfactory.In its decision to continue an existing investment advisory contract, the Board was mindful of the potential disruptions of the Fund's operations and various risks, uncertainties and other effects that could occur as a result of a decision to terminate or not renew an advisory contract. In particular, the Board recognized that many shareholders have invested in the Fund on the strength of the Adviser's industry standing and reputation and with the expectation that the Adviser will have a continuing role in providing advisory services to the Fund. Thus, the Board's approval of the advisory contract reflected the fact that it is the shareholders who have effectively selected the Adviser by virtue of having invested in the Fund.
The Board based its decision to approve the advisory and subadvisory contracts on the totality of the circumstances and relevant factors and with a view to past and future long-term considerations. Not all of the factors and considerations identified above were necessarily relevant to the Fund, nor did the Board consider any one of them to be determinative. With respect to the factors that were relevant, the Board's decision to approve the contract reflects its determination that Federated's performance and actions provided a satisfactory basis to support the decision to continue the existing arrangements.
Annual Shareholder Report54
Voting Proxies on Fund Portfolio Securities
A description of the policies and procedures that the Fund uses to determine how to vote proxies, if any, relating to securities held in the Fund's portfolio is available, without charge and upon request, by calling 1-800-341-7400. A report on “Form N-PX” of how the Fund voted any such proxies during the most recent 12-month period ended June 30 is available from Federated's Web site at FederatedInvestors.com. To access this information from the “Products” section of the Web site, click on the “Prospectuses and Regulatory Reports” link under “Related Information,” then select the appropriate link opposite the name of the Fund; or select the name of the Fund and from the Fund's page, click on the “Prospectuses and Regulatory Reports” link. Form N-PX filings are also available at the SEC's Web site at www.sec.gov.
Quarterly Portfolio Schedule
The Fund files with the SEC a complete schedule of its portfolio holdings, as of the close of the first and third quarters of its fiscal year, on “Form N-Q.” These filings are available on the SEC's Web site at www.sec.gov and may be reviewed and copied at the SEC's Public Reference Room in Washington, DC. (Call 1-800-SEC-0330 for information on the operation of the Public Reference Room.) You may also access this information from the “Products” section of Federated's Web site at FederatedInvestors.com by clicking on “Portfolio Holdings” under “Related Information,” then selecting the appropriate link opposite the name of the Fund; or select the name of the Fund and from the Fund's page, click on the “Portfolio Holdings” link.
Annual Shareholder Report55
Mutual funds are not bank deposits or obligations, are not guaranteed by any bank and are not insured or guaranteed by the U.S. government, the Federal Deposit Insurance Corporation, the Federal Reserve Board or any other government agency. Investment in mutual funds involves investment risk, including the possible loss of principal.
This Report is authorized for distribution to prospective investors only when preceded or accompanied by the Fund's Prospectus, which contains facts concerning its objective and policies, management fees, expenses and other information.
Federated Kaufmann Small Cap Fund
Federated Investors Funds
4000 Ericsson Drive
Warrendale, PA 15086-7561
Contact us at FederatedInvestors.com
or call 1-800-341-7400.
Federated Securities Corp., Distributor
Cusip 314172636
Cusip 314172628
Cusip 314172610
Cusip 314172537
29503 (12/09)
Federated is a registered mark of Federated Investors, Inc.
2009 Federated Investors, Inc.
Federated Market Opportunity FundEstablished 2000
A Portfolio of Federated Equity Funds
ANNUAL SHAREHOLDER REPORTOctober 31, 2009
Class A Shares
Class B Shares
Class C Shares
FINANCIAL HIGHLIGHTS
SHAREHOLDER EXPENSE EXAMPLE
MANAGEMENT'S DISCUSSION OF FUND PERFORMANCE
PORTFOLIO OF INVESTMENTS SUMMARY TABLES
PORTFOLIO OF INVESTMENTS
STATEMENT OF ASSETS AND LIABILITIES
STATEMENT OF OPERATIONS
STATEMENT OF CHANGES IN NET ASSETS
NOTES TO FINANCIAL STATEMENTS
REPORT OF INDEPENDENT REGISTERED PUBLIC ACCOUNTING FIRM
BOARD OF TRUSTEES AND TRUST OFFICERS
EVALUATION AND APPROVAL OF ADVISORY CONTRACT
VOTING PROXIES ON FUND PORTFOLIO SECURITIES
QUARTERLY PORTFOLIO SCHEDULE
Financial Highlights - Class A Shares
(For a Share Outstanding Throughout Each Period)
| Year Ended October 31 | 2009 | 2008 | 2007 | 20061 | 2005 |
| Net Asset Value, Beginning of Period | $10.26 | $12.22 | $12.69 | $13.48 | $13.48 |
| Income From Investment Operations: | | | | | |
| Net investment income | 0.242 | 0.422 | 0.412 | 0.38 | 0.20 |
| Net realized and unrealized gain (loss) on investments, short sales, futures contracts, written options and foreign currency transactions | 1.05 | (1.83) | (0.43) | (0.05) | 0.31 |
| TOTAL FROM INVESTMENT OPERATIONS | 1.29 | (1.41) | (0.02) | 0.33 | 0.51 |
| Less Distributions: | | | | | |
| Distributions from net investment income | (0.46) | (0.55) | (0.45) | (0.32) | (0.32) |
| Distributions from net realized gain on investments, written options and foreign currency transactions | — | — | — | (0.80) | (0.19) |
| TOTAL DISTRIBUTIONS | (0.46) | (0.55) | (0.45) | (1.12) | (0.51) |
| Net Asset Value, End of Period | $11.09 | $10.26 | $12.22 | $12.69 | $13.48 |
| Total Return3 | 12.88% | (12.18)% | (0.18)% | 2.64% | 3.89% |
| Ratios to Average Net Assets: | | | | | |
| Net expenses | 1.39%4 | 1.20%4 | 1.22%4 | 1.22%4 | 1.24%4 |
| Net expenses excluding dividends on short positions | 1.24%4 | 1.20%4 | 1.22%4 | 1.22%4 | 1.24%4 |
| Net investment income | 2.23% | 3.46% | 3.31% | 3.09% | 1.64% |
| Expense waiver/reimbursement5 | 0.07% | 0.04% | 0.02% | 0.01% | 0.01% |
| Supplemental Data: | | | | | |
| Net assets, end of period (000 omitted) | $835,964 | $721,632 | $981,852 | $1,498,881 | $1,377,618 |
| Portfolio turnover | 191% | 255% | 79% | 124% | 61% |
| 1 | Beginning with the year ended October 31, 2006, the Fund was audited by KPMG LLP. The previous year was audited by another independent registered public accounting firm. |
| 2 | Per share numbers have been calculated using the average shares method. |
| 3 | Based on net asset value, which does not reflect the sales charge, redemption fee or contingent deferred sales charge, if applicable. |
| 4 | The net expense ratio is calculated without reduction for expense offset arrangements. The net expense ratios are 1.39%, 1.20%, 1.22%, 1.22% and 1.24%, after taking into account these expense reductions for the years ended October 31, 2009, 2008, 2007, 2006 and 2005, respectively. The net expense ratios excluding dividends on short positions are also calculated without reduction for these expense offset arrangements. |
| 5 | This expense decrease is reflected in both the net expense and net investment income ratios shown above. |
- See Notes which are an integral part of the Financial Statements
Annual Shareholder Report1
Financial Highlights - Class B Shares
(For a Share Outstanding Throughout Each Period)
| Year Ended October 31 | 2009 | 2008 | 2007 | 20061 | 2005 |
| Net Asset Value, Beginning of Period | $10.21 | $12.16 | $12.63 | $13.42 | $13.42 |
| Income From Investment Operations: | | | | | |
| Net investment income | 0.162 | 0.332 | 0.322 | 0.31 | 0.10 |
| Net realized and unrealized gain (loss) on investments, short sales, futures contracts, written options and foreign currency transactions | 1.04 | (1.82) | (0.44) | (0.08) | 0.31 |
| TOTAL FROM INVESTMENT OPERATIONS | 1.20 | (1.49) | (0.12) | 0.23 | 0.41 |
| Less Distributions: | | | | | |
| Distributions from net investment income | (0.42) | (0.46) | (0.35) | (0.22) | (0.22) |
| Distributions from net realized gain on investments, written options and foreign currency transactions | — | — | — | (0.80) | (0.19) |
| TOTAL DISTRIBUTIONS | (0.42) | (0.46) | (0.35) | (1.02) | (0.41) |
| Net Asset Value, End of Period | $10.99 | $10.21 | $12.16 | $12.63 | $13.42 |
| Total Return3 | 12.01% | (12.82)% | (0.96)% | 1.88% | 3.15% |
| Ratios to Average Net Assets: | | | | | |
| Net expenses | 2.14%4 | 1.95%4 | 1.97%4 | 1.97%4 | 1.99%4 |
| Net expenses excluding dividends on short positions | 1.99%4 | 1.95%4 | 1.97%4 | 1.97%4 | 1.99%4 |
| Net investment income | 1.54% | 2.69% | 2.56% | 2.34% | 0.89% |
| Expense waiver/reimbursement5 | 0.07% | 0.04% | 0.02% | 0.01% | 0.00%6 |
| Supplemental Data: | | | | | |
| Net assets, end of period (000 omitted) | $166,561 | $197,694 | $291,938 | $419,028 | $459,181 |
| Portfolio turnover | 191% | 255% | 79% | 124% | 61% |
| 1 | Beginning with the year ended October 31, 2006, the Fund was audited by KPMG LLP. The previous year was audited by another independent registered public accounting firm. |
| 2 | Per share numbers have been calculated using the average shares method. |
| 3 | Based on net asset value, which does not reflect the sales charge, redemption fee or contingent deferred sales charge, if applicable. |
| 4 | The net expense ratio is calculated without reduction for expense offset arrangements. The net expense ratios are 2.13%, 1.95%, 1.97%, 1.97% and 1.99%, after taking into account these expense reductions for the years ended October 31, 2009, 2008, 2007, 2006 and 2005, respectively. The net expense ratios excluding dividends on short positions are also calculated without reduction for these expense offset arrangements. |
| 5 | This expense decrease is reflected in both the net expense and net investment income ratios shown above. |
| 6 | Represents less than 0.01%. |
- See Notes which are an integral part of the Financial Statements
Annual Shareholder Report2
Financial Highlights-Class C Shares
(For a Share Outstanding Throughout Each Period)
| Year Ended October 31 | 2009 | 2008 | 2007 | 20061 | 2005 |
| Net Asset Value, Beginning of Period | $10.19 | $12.13 | $12.60 | $13.39 | $13.40 |
| Income From Investment Operations: | | | | | |
| Net investment income | 0.162 | 0.332 | 0.322 | 0.29 | 0.12 |
| Net realized and unrealized gain (loss) on investments, short sales, futures contracts, written options and foreign currency transactions | 1.03 | (1.81) | (0.44) | (0.05) | 0.29 |
| TOTAL FROM INVESTMENT OPERATIONS | 1.19 | (1.48) | (0.12) | 0.24 | 0.41 |
| Less Distributions: | | | | | |
| Distributions from net investment income | (0.42) | (0.46) | (0.35) | (0.23) | (0.23) |
| Distributions from net realized gain on investments, written options and foreign currency transactions | — | — | — | (0.80) | (0.19) |
| TOTAL DISTRIBUTIONS | (0.42) | (0.46) | (0.35) | (1.03) | (0.42) |
| Net Asset Value, End of Period | $10.96 | $10.19 | $12.13 | $12.60 | $13.39 |
| Total Return3 | 11.96% | (12.77)% | (0.96)% | 1.91% | 3.10% |
| Ratios to Average Net Assets: | | | | | |
| Net expenses | 2.14%4 | 1.95%4 | 1.97%4 | 1.97%4 | 1.99%4 |
| Net expenses excluding dividends on short positions | 1.99%4 | 1.95%4 | 1.97%4 | 1.97%4 | 1.99%4 |
| Net investment income | 1.50% | 2.70% | 2.56% | 2.35% | 0.89% |
| Expense waiver/reimbursement5 | 0.07% | 0.04% | 0.02% | 0.01% | 0.00%6 |
| Supplemental Data: | | | | | |
| Net assets, end of period (000 omitted) | $489,260 | $445,425 | $651,388 | $991,565 | $879,348 |
| Portfolio turnover | 191% | 255% | 79% | 124% | 61% |
| 1 | Beginning with the year ended October 31, 2006, the Fund was audited by KPMG LLP. The previous year was audited by another independent registered public accounting firm. |
| 2 | Per share numbers have been calculated using the average shares method. |
| 3 | Based on net asset value, which does not reflect the sales charge, redemption fee or contingent deferred sales charge, if applicable. |
| 4 | The net expense ratio is calculated without reduction for expense offset arrangements. The net expense ratios are 2.13%, 1.95%, 1.97%, 1.97% and 1.99%, after taking into account these expense reductions for the years ended October 31, 2009, 2008, 2007, 2006 and 2005, respectively. The net expense ratios excluding dividends on short positions are also calculated without reduction for these expense offset arrangements. |
| 5 | This expense decrease is reflected in both the net expense and net investment income ratios shown above. |
| 6 | Represents less than 0.01%. |
- See Notes which are an integral part of the Financial Statements
Annual Shareholder Report3
Shareholder Expense Example (unaudited)
As a shareholder of the Fund, you incur two types of costs: (1) transaction costs, including sales charges (loads) on purchase or redemption payments; and (2) ongoing costs, including management fees and to the extent applicable, distribution (12b-1) fees and/or shareholder services fees and other Fund expenses. This Example is intended to help you to understand your ongoing costs (in dollars) of investing in the Fund and to compare these costs with the ongoing costs of investing in other mutual funds. It is based on an investment of $1,000 invested at the beginning of the period and held for the entire period from May 1, 2009 to October 31, 2009.
ACTUAL EXPENSES
The first section of the table below provides information about actual account values and actual expenses. You may use the information in this section, together with the amount you invested, to estimate the expenses that you incurred over the period. Simply divide your account value by $1,000 (for example, an $8,600 account value divided by $1,000 = 8.6), then multiply the result by the number in the first section under the heading entitled “Expenses Paid During Period” to estimate the expenses attributable to your investment during this period.
HYPOTHETICAL EXAMPLE FOR COMPARISON PURPOSES
The second section of the table below provides information about hypothetical account values and hypothetical expenses based on the Fund's actual expense ratio and an assumed rate of return of 5% per year before expenses, which is not the Fund's actual return. Thus, you should not use the hypothetical account values and expenses to estimate the actual ending account balance or your expenses for the period. Rather, these figures are required to be provided to enable you to compare the ongoing costs of investing in the Fund with other funds. To do so, compare this 5% hypothetical example with the 5% hypothetical examples that appear in the shareholder reports of the other funds.
Annual Shareholder Report4
Please note that the expenses shown in the table are meant to highlight your ongoing costs only and do not reflect any transaction costs, such as sales charges (loads) on purchase or redemption payments. Therefore, the second section of the table is useful in comparing ongoing costs only, and will not help you determine the relative total costs of owning different funds. In addition, if these transaction costs were included, your costs would have been higher. | Beginning
Account Value
5/1/2009 | Ending
Account Value
10/31/2009 | Expenses Paid
During Period1 |
| Actual: | | | |
| Class A Shares | $1,000 | $1,022.10 | $7.70 |
| Class B Shares | $1,000 | $1,018.50 | $11.50 |
| Class C Shares | $1,000 | $1,017.60 | $11.49 |
Hypothetical (assuming a 5% return
before expenses): | | | |
| Class A Shares | $1,000 | $1,017.59 | $7.68 |
| Class B Shares | $1,000 | $1,013.81 | $11.47 |
| Class C Shares | $1,000 | $1,013.81 | $11.47 |
| 1 | Expenses are equal to the Fund's annualized net expense ratios, multiplied by the average account value over the period, multiplied by 184/365 (to reflect the one-half-year period). The annualized net expense ratios are as follows: |
| Class A Shares | 1.51% |
| Class B Shares | 2.26% |
| Class C Shares | 2.26% |
Annual Shareholder Report5
Performance data quoted represents past performance which is no guarantee of future results. Investment return and principal value will fluctuate so that an investor's shares, when redeemed, may be worth more or less than their original cost. Mutual fund performance changes over time and current performance may be lower or higher than what is stated. For current to the most recent month-end performance and after-tax returns, visit FederatedInvestors.com or call 1-800-341-7400.
Management's Discussion of Fund Performance (unaudited)
MARKET OVERVIEW
During the 12-month reporting period ended October 31, 2009, the Fund produced total returns of 12.88%, 12.01% and 11.96%, for Class A Shares, Class B Shares and Class C Shares, respectively, based on net asset value. The total return for the Fund's benchmark of 70% Russell 3000 Value Index/30% U.S. Treasury 3-month bill was 3.94%.1 The return of the Russell 3000 Value Index, a broad-based market index, for the 12-month reporting period was 4.56%. The Fund's total return reflected actual cash flows, transaction costs and other expenses which were not reflected in the total return of the index. The following discussion will focus on the performance of the Fund's Class A Shares.
MARKET OVERVIEW
The reporting period was a tale of two markets. The fiscal year started with global economies falling further into recession. Equity markets hit record high levels of volatility and suffered significant losses. In response, governments around the world coordinated efforts on interest-rate cuts and implemented a variety of capital- and financial-guarantee programs aimed at restoring the functioning of credit markets. The Federal Reserve Board, for example, lowered the federal funds target rate to a historic low, a range between 0% and 0.25%. The stock market bottomed in early March, about half way through the Fund's fiscal year.
The second half of the year featured an extraordinarily strong rally in stock prices. The Standard & Poor's 500 Index2 (S&P 500 Index) rallied 64% from the early March low to its high late in the fiscal year. The rally was supported by improved economic reports, as government stimulus measures helped third-quarter Gross Domestic Product rise by 3.5%. The S&P 500 Index ended the entire reporting period with a return of 9.80%.
| 1 | The 70% Russell 3000 Value Index/30% Merrill Lynch 91 Day Treasury Bill Index measures the performance of those Russell 3000 Index companies with lower price-to-book ratios and lower forecasted growth values. The stocks in this index are also members of either the Russell 1000 Value or the Russell 2000 Value indexes. Merrill Lynch 91 Day Treasury Bill Index measures the return on U.S. Treasury Bills maturing in 90 days. Indexes are unmanaged and it is not possible to invest directly in an index. |
| 2 | The S&P 500 Index is an unmanaged capitalization-weighted index of 500 stocks designed to measure performance of the broad domestic economy through changes in the aggregate market value of 500 stocks representing all major industries. It is not possible to invest directly in an index. |
Annual Shareholder Report6
FUND PERFORMANCE
The Fund had a strong return for the fiscal year. After the initial equity market collapse, valuations on stocks appeared much more compelling, and the Fund's managers substantially increased the Fund's equity holdings. This increased exposure to the stock market generated large gains for the portfolio.
As the sharp rebound in stock prices advanced later in the fiscal year, the Fund's managers reduced the Fund's net exposure to the stock market and eventually took a net short position late in the fiscal year, in anticipation of a decline in stock prices.3 The rationale for the strategy shift was that the history of stock market bubbles, and of stock market valuations in general, supported a highly risk-averse strategy. With economic and financial conditions still precarious in Fund management's assessment, there was substantial fundamental support for this strategy. Since stock prices continued to rise sharply into the end of the fiscal year, however, this negative (short) position relative to stock prices resulted in losses to the portfolio. Despite that, the Fund's fiscal-year performance significantly exceeded that of its benchmark.
Among the Fund's equity sector returns, virtually all had positive returns for the fiscal year. Gold stocks were the strongest performing sector for the Fund. Gold stock prices were at historically low levels compared to the price of gold bullion at the start of the reporting period. This, combined with gold bullion prices hitting record highs at the end of the reporting period, produced significant returns for gold stocks.4 Materials and Energy stocks also were especially strong, as they rebounded significantly from their lows after the commodity bubble popped in the fall of 2008. Currency forward contracts and international government debt holdings also added to the Fund's returns, while short stock and stock index futures positions resulted in losses.5 With the Fund now being able to invest directly in gold bullion, a small position was added late in the reporting period.
| 3 | The Fund may make short sales of securities, which involves unlimited risk including the possibility that losses may exceed the original amount invested. |
| 4 | Investments in gold and precious metals may be subject to additional risks. The Fund's investments in gold bullion may involve higher custody and transaction costs than other investments in securities. |
| 5 | International investing involves special risks including currency risk, increased volatility, political risks and differences in auditing and o ther financial standards. |
Annual Shareholder Report7
GROWTH OF A $10,000 INVESTMENT - CLASS A SHARES
The graph below illustrates the hypothetical investment of $10,0001 in Federated Market Opportunity Fund (Class A Shares) (the “Fund”) from December 4, 2000 (start of performance) to October 31, 2009, compared to the Russell 3000 Value Index (R3000V)2 and the 70% Russell 3000 Value Index/30% Merrill Lynch 91 Day Treasury Bill Index (70%R3000V/30%ML91DTB).2
| Average Annual Total Returns3 for the Period Ended 10/31/2009 | |
| 1 Year | 6.64% |
| 5 Years | (0.05)% |
| Start of Performance (12/4/2000) | 5.05% |
Performance data quoted represents past performance which is no guarantee of future results. Investment return and principal value will fluctuate so that an investor's shares, when redeemed, may be worth more or less than their original cost. Mutual fund performance changes over time and current performance may be lower or higher than what is stated. For current to the most recent month-end performance and after-tax returns, visit FederatedInvestors.com or call 1-800-341-7400. Returns shown do not reflect the deduction of taxes that a shareholder would pay on Fund distributions or the redemption of Fund shares. Mutual funds are not obligations of or guaranteed by any bank and are not federally insured. Total returns shown include the maximum sales charge of 5.50%.
| 1 | Represents a hypothetical investment of $10,000 in the Fund after deducting the maximum sales charge of 5.50% ($10,000 investment minus $550 sales charge = $9,450). The Fund's performance assumes the reinvestment of all dividends and distributions. The R3000V and the 70%R3000V/30%ML91DTB have been adjusted to reflect reinvestment of dividends on securities in the indexes. |
| 2 | The R3000V measures the performance of those Russell 3000 Index companies with lower price-to-book ratios and lower forecasted growth values. The stocks in this index are also members of either the Russell 1000 Value or the Russell 2000 Value indexes. The ML91DTB is an index tracking short-term U.S. government securities. The R3000V and the 70%R3000V/30%ML91DTB are not adjusted to reflect sales charges, expenses or other fees that the Securities and Exchange Commission (SEC) requires to be reflected in the Fund's performance. The indexes are unmanaged and, unlike the Fund, are not affected by cash flows. It is not possible to invest in an index. |
| 3 | Total returns quoted reflect all applicable sales charges. |
Annual Shareholder Report8
GROWTH OF A $10,000 INVESTMENT - CLASS B SHARES
The graph below illustrates the hypothetical investment of $10,0001 in Federated Market Opportunity Fund (Class B Shares) (the “Fund”) from December 4, 2000 (start of performance) to October 31, 2009, compared to the Russell 3000 Value Index (R3000V)2 and the 70% Russell 3000 Value Index/30% Merrill Lynch 91 Day Treasury Bill Index (70%R3000V/30%ML91DTB).2
| Average Annual Total Returns3 for the Period Ended 10/31/2009 | |
| 1 Year | 6.51% |
| 5 Years | 0.00% |
| Start of Performance (12/4/2000) | 5.01% |
Performance data quoted represents past performance which is no guarantee of future results. Investment return and principal value will fluctuate so that an investor's shares, when redeemed, may be worth more or less than their original cost. Mutual fund performance changes over time and current performance may be lower or higher than what is stated. For current to the most recent month-end performance and after-tax returns, visit FederatedInvestors.com or call 1-800-341-7400. Returns shown do not reflect the deduction of taxes that a shareholder would pay on Fund distributions or the redemption of Fund shares. Mutual funds are not obligations of or guaranteed by any bank and are not federally insured. Total returns shown include the maximum contingent deferred sales charge of 5.50% as applicable.
| 1 | Represents a hypothetical investment of $10,000 in the Fund. The maximum contingent deferred sales charge is 5.50% on any redemption less than one year from the purchase date. The Fund's performance assumes the reinvestment of all dividends and distributions. The R3000V and the 70%R3000V/30%ML91DTB have been adjusted to reflect reinvestment of dividends on securities in the indexes. |
| 2 | The R3000V measures the performance of those Russell 3000 Index companies with lower price-to-book ratios and lower forecasted growth values. The stocks in this index are also members of either the Russell 1000 Value or the Russell 2000 Value indexes. The ML91DTB is an index tracking short-term U.S. government securities. The R3000V and the 70%R3000/30%ML91DTB are not adjusted to reflect sales charges, expenses or other fees that the SEC requires to be reflected in the Fund's performance. The indexes are unmanaged and, unlike the Fund, are not affected by cash flows. It is not possible to invest in an index. |
| 3 | Total returns quoted reflect all applicable contingent deferred sales charges. |
Annual Shareholder Report9
GROWTH OF A $10,000 INVESTMENT - CLASS C SHARES
The graph below illustrates the hypothetical investment of $10,0001 in Federated Market Opportunity Fund (Class C Shares) (the “Fund”) from December 4, 2000 (start of performance) to October 31, 2009, compared to the Russell 3000 Value Index (R3000V)2 and the 70% Russell 3000 Value Index/30% Merrill Lynch 91 Day Treasury Bill Index (70%R3000V/30%ML91DTB).2
| Average Annual Total Returns3 for the Period Ended 10/31/2009 | |
| 1 Year | 10.88% |
| 5 Years | 0.32% |
| Start of Performance (12/4/2000) | 4.93% |
Performance data quoted represents past performance which is no guarantee of future results. Investment return and principal value will fluctuate so that an investor's shares, when redeemed, may be worth more or less than their original cost. Mutual fund performance changes over time and current performance may be lower or higher than what is stated. For current to the most recent month-end performance and after-tax returns, visit FederatedInvestors.com or call 1-800-341-7400. Returns shown do not reflect the deduction of taxes that a shareholder would pay on Fund distributions or the redemption of Fund shares. Mutual funds are not obligations of or guaranteed by any bank and are not federally insured. Total returns shown include the maximum contingent deferred sales charge of 1.00% as applicable.
| 1 | Represents a hypothetical investment of $10,000 in the Fund. The maximum contingent deferred sales charge is 1.00% on any redemption less than one year from the purchase date. The Fund's performance assumes the reinvestment of all dividends and distributions. The R3000V and the 70%R3000V/30%ML91DTB have been adjusted to reflect reinvestment of dividends on securities in the indexes. |
| 2 | The R3000V measures the performance of those Russell 3000 Index companies with lower price-to-book ratios and lower forecasted growth values. The stocks in this index are also members of either the Russell 1000 Value or the Russell 2000 Value indexes. The ML91DTB is an index tracking short-term U.S. government securities. The R3000V and the 70%R3000V/30%ML91DTB are not adjusted to reflect sales charges, expenses or other fees that the SEC requires to be reflected in the Fund's performance. The indexes are unmanaged and, unlike the Fund, are not affected by cash flows. It is not possible to invest in an index. |
| 3 | Total returns quoted reflect all applicable contingent deferred sales charges. |
Annual Shareholder Report10
Portfolio of Investments Summary
Tables (unaudited)
At October 31, 2009, the Fund's portfolio composition1 was as follows:
| Percentage of
Total Net Assets |
| Securities Sold Short | (56.2)% |
| Futures Contracts — Long (notional value)2 | 14.0% |
| U.S. Treasury Securities Held as Collateral for Securities Sold Short | 25.5% |
| International Equity Securities | 17.4% |
| U.S. Equity Securities | 16.0% |
| Mutual Funds | 2.3% |
| U.S. Treasury Securities | 6.8% |
| International Fixed-Income Securities | 5.8% |
| Other Securities3 | 11.1% |
| Other Derivative Contracts4 | (0.3)% |
| Cash Equivalents5 | 9.8% |
| Adjustment for Futures Contracts (notional value)2 | (14.1)% |
| Collateral on Deposit for Securities Sold Short | 58.6% |
| Other Assets and Liabilities — Net6 | 3.3% |
| TOTAL | 100.0% |
| 1 | See the Fund's Prospectus for a description of the principal types of securities in which the Fund invests. |
| 2 | More complete information regarding the Fund's direct investments in futures contracts, including unrealized appreciation (depreciation), value, and notional values or amounts of such contracts, can be found in the table at the end of the Portfolio of Investments included in this report. |
| 3 | Other Securities include exchange-traded funds, gold bullion and investment funds. |
| 4 | Based upon net unrealized appreciation (depreciation) or value of the derivative contracts as applicable. Other Derivative Contracts may consist of forwards, options and swaps. The impact of a derivative contract on the Fund's performance may be larger than its unrealized appreciation (depreciation) or value may indicate. In many cases, the notional value or amount of a derivative contract may provide a better indication of the contract's significance to the portfolio. More complete information regarding the Fund's direct investments in derivative contracts, including unrealized appreciation (depreciation), value, and notional values or amounts of such contracts, can be found in the table at the end of the Portfolio of Investments included in this report. |
| 5 | Cash Equivalents include any investments in money market mutual funds and/or overnight repurchase agreements. |
| 6 | Assets, other than investments in securities, securities sold short, derivative contracts and collateral on deposit for securities sold short, less liabilities. See Statement of Assets and Liabilities. |
Annual Shareholder Report11
At October 31, 2009, the Fund's sector composition7 for its equity securities was as follows:| Sector Composition | Percentage of
Equity Securities |
| Materials | 27.5% |
| Health Care | 24.4% |
| Energy | 19.2% |
| Consumer Staples | 12.5% |
| Telecommunication Services | 6.2% |
| Information Technology | 4.7% |
| Industrials | 2.9% |
| Consumer Discretionary | 2.6% |
| TOTAL | 100.0% |
At October 31, 2009, the Fund's sector composition7 for its short positions was as follows:
| Sector Composition | Percentage of Total
Securities Sold Short |
| Consumer Discretionary | 34.7% |
| Financials | 12.2% |
| Information Technology | 14.8% |
| Health Care | 6.9% |
| Consumer Staples | 6.8% |
| Industrials | 6.0% |
| Materials | 5.9% |
| Telecommunication Services | 1.8% |
| Energy | 1.6% |
| Other8 | 9.3% |
| TOTAL | 100.0% |
| 7 | Sector classifications are based upon, and individual portfolio securities are assigned to, the classifications of the Global Industry Classification Standard (GICS) except that the adviser assigns a classification to securities not classified by the GICS and to securities for which the adviser does not have access to the classification made by the GICS. |
| 8 | Other includes exchange-traded funds. |
Annual Shareholder Report12
Portfolio of Investments
October 31, 2009
| | | |
| Shares, Foreign Par Amount, Principal Amount or Troy Ounces | | | Value in U.S. Dollars |
| | COMMON STOCKS – 33.5% | |
| | Biotechnology – 4.6% | |
| 410,000 | 1 | Biogen Idec, Inc. | 17,273,300 |
| 390,000 | 1 | Cephalon, Inc. | 21,286,200 |
| 350,000 | 1 | Genzyme Corp. | 17,710,000 |
| 390,000 | 1 | Gilead Sciences, Inc. | 16,594,500 |
| | TOTAL | 72,864,000 |
| | Chemicals – 1.7% | |
| 532,000 | 1 | Intrepid Potash, Inc. | 13,704,320 |
| 270,000 | | The Mosaic Co. | 12,617,100 |
| | TOTAL | 26,321,420 |
| | Commercial Services & Supplies – 1.0% | |
| 330,000 | | Secom Co. Ltd. | 15,433,639 |
| | Energy Equipment & Services – 5.7% | |
| 350,000 | | Baker Hughes, Inc. | 14,724,500 |
| 320,000 | | ENSCO International, Inc. | 14,652,800 |
| 346,000 | | Noble Corp. | 14,096,040 |
| 590,000 | | Patterson-UTI Energy, Inc. | 9,192,200 |
| 930,000 | | Rowan Cos., Inc. | 21,622,500 |
| 415,000 | 1 | Unit Corp. | 16,218,200 |
| | TOTAL | 90,506,240 |
| | Food & Staples Retailing – 3.1% | |
| 420,000 | 1 | BJ's Wholesale Club, Inc. | 14,712,600 |
| 240,000 | | Familymart Co. Ltd. | 7,146,393 |
| 250,000 | | Lawson, Inc. | 11,162,741 |
| 700,000 | | Seven & I Holdings Co. Ltd. | 15,346,414 |
| | TOTAL | 48,368,148 |
| | Food Products – 1.1% | |
| 250,000 | | Archer-Daniels-Midland Co. | 7,530,000 |
| 170,000 | | Bunge Ltd. | 9,700,200 |
| | TOTAL | 17,230,200 |
| | Hotels Restaurants & Leisure – 0.9% | |
| 530,000 | | Greek Organization of Football Prognostics | 13,541,700 |
Annual Shareholder Report13
| | | |
| | Life Sciences Tools & Services – 1.0% | |
| 730,000 | | Pharmaceutical Product Development, Inc. | 15,731,500 |
| | Metals & Mining – 7.5% | |
| 820,000 | | Barrick Gold Corp. | 29,462,600 |
| 1,470,000 | | Kinross Gold Corp. | 27,312,600 |
| 440,000 | | Newmont Mining Corp. | 19,122,400 |
| 690,000 | 1 | Pan American Silver Corp. | 14,434,800 |
| 2,650,000 | | Yamana Gold, Inc. | 28,222,500 |
| | TOTAL | 118,554,900 |
| | Oil Gas & Consumable Fuels – 0.7% | |
| 493,945 | | Enerplus Resources Fund | 10,728,485 |
| | Pharmaceuticals – 2.5% | |
| 450,000 | | Bristol-Myers Squibb Co. | 9,810,000 |
| 740,000 | | Takeda Pharmaceutical Co. Ltd. | 29,758,080 |
| | TOTAL | 39,568,080 |
| | Software – 1.6% | |
| 97,600 | | Nintendo Co. Ltd. | 24,888,084 |
| | Wireless Telecommunication Services – 2.1% | |
| 22,500 | | NTT DoCoMo, Inc. | 32,776,271 |
| | TOTAL COMMON STOCKS
(IDENTIFIED COST $445,692,802) | 526,512,667 |
| | U.S. TREASURY – 32.3% | |
| $250,000 | 2 | United States Treasury Bill, 0.065%, 1/7/2010 | 249,988 |
| 70,000,000 | 2,3 | United States Treasury Bill, 0.070%, 1/28/2010 | 69,991,964 |
| 65,000,000 | 2,3 | United States Treasury Bill, 0.080%, 1/21/2010 | 64,995,307 |
| 30,000,000 | 2,3 | United States Treasury Bill, 0.135%, 12/10/2009 | 29,998,812 |
| 68,000,000 | 2,3 | United States Treasury Bill, 0.150%, 12/3/2009 | 67,999,123 |
| 200,000,000 | 2,3 | United States Treasury Bills, 0.170% — 0.290%, 11/19/2009 | 199,998,820 |
| 33,500,000 | 4 | United States Treasury Bond, 3.50%, 2/15/2039 | 29,370,080 |
| 46,000,000 | | United States Treasury Bond, 4.25%, 5/15/2039 | 46,100,625 |
| | TOTAL U.S. TREASURY
(IDENTIFIED COST $508,946,278) | 508,704,719 |
| | GOVERNMENTS/AGENCIES – 5.8% | |
| 23,500,000 | | Argentina, Government of, Bond, 0.943%, 8/3/2012 | 7,402,500 |
| 10,401,350 | | Argentina, Government of, Note, 8.28%, 12/31/2033 | 7,384,958 |
Annual Shareholder Report14
| | | |
| $22,200,000 | | Brazil, Government of, Note, 10.00%, 1/1/2012 | 12,643,553 |
| 11,900,000 | | Brazil, Government of, Note, 6.00%, 5/15/2015 | 12,470,350 |
| 11,850,000,000 | | Colombia, Government of, Unsub., 11.75%, 3/1/2010 | 6,042,878 |
| 1,595,000,000 | | Hungary, Government of, 8.00%, 2/12/2015 | 8,769,341 |
| 40,800,000 | | Poland, Government of, Bond, 5.25%, 10/25/2017 | 13,431,478 |
| 78,500,000 | | Republic of South Africa, Bond, 7.50%, 1/15/2014 | 9,630,091 |
| 21,200,000 | 5 | Turkey, Government of, 14.686%, 11/3/2010 | 13,020,812 |
| | TOTAL GOVERNMENTS/AGENCIES
(IDENTIFIED COST $73,150,171) | 90,795,961 |
| | INVESTMENT FUND – 4.8% | |
| 750,000 | | GML Agricultural Commodity Trade Finance Fund
(IDENTIFIED COST $75,000,000) | 74,978,850 |
| | BULLION – 3.2% | |
| 48,437 | | Gold
(IDENTIFIED COST $48,855,678) | 50,626,777 |
| | EXCHANGE-TRADED FUND – 3.1% | |
| 1,900,000 | | PowerShares DB Agriculture Fund
(IDENTIFIED COST $46,722,564) | 48,583,000 |
| | MUTUAL FUNDS – 12.1% | |
| 2,760,000 | | Central Fund of Canada Ltd. | 36,625,200 |
| 154,018,981 | 6,7 | Prime Value Obligations Fund, Institutional Shares, 0.22% | 154,018,981 |
| | TOTAL MUTUAL FUNDS
(IDENTIFIED COST $185,846,058) | 190,644,181 |
| | TOTAL INVESTMENTS — 94.8%
(IDENTIFIED COST $1,384,213,551)8 | 1,490,846,155 |
| | OTHER ASSETS AND LIABILITIES - NET — 5.2%9 | 82,411,327 |
| | TOTAL NET ASSETS — 100% | $1,573,257,482 |
Annual Shareholder Report15
Schedule of Securities Sold Short
Shares or
Principal
Amount | | Value |
| 130,000 | Amazon.com, Inc. | $15,445,300 |
| 1,233,600 | Amkor Technology, Inc. | 6,797,136 |
| 1,030,000 | AutoNation, Inc. | 17,757,200 |
| 1,600,000 | Avis Budget Group, Inc. | 13,440,000 |
| 340,000 | Bally Technologies, Inc. | 13,392,600 |
| 950,000 | CarMax, Inc. | 18,686,500 |
| 1,600,000 | CB Richard Ellis Services, Inc. | 16,560,000 |
| 750,000 | Coca-Cola Enterprises, Inc. | 14,302,500 |
| 340,000 | Credit Suisse Group AG, ADR | 18,122,000 |
| 400,000 | Cree, Inc. | 16,840,000 |
| 1,200,000 | Cypress Semiconductor Corp. | 10,116,000 |
| 1,700,000 | Delta Air Lines, Inc. | 12,138,000 |
| 520,000 | Dendreon Corp. | 13,140,400 |
| 325,000 | Digital Realty Trust, Inc. | 14,667,250 |
| 510,000 | Dr. Pepper Snapple Group, Inc. | 13,902,600 |
| 850,000 | Expedia, Inc. | 19,269,500 |
| 200,000 | Express Scripts, Inc., Class A | 15,984,000 |
| 380,000 | F5 Networks, Inc. | 17,058,200 |
| 760,000 | First Horizon National Corp. | 8,990,800 |
| 2,970,000 | Ford Motor Co. | 20,790,000 |
| 265,000 | Freeport-McMoRan Copper & Gold, Inc. | 19,440,400 |
| 840,000 | Gap (The), Inc. | 17,925,600 |
| 835,000 | Goodyear Tire & Rubber Co. | 10,754,800 |
| 1,420,000 | Hertz Global Holdings, Inc. | 13,220,200 |
| 375,000 | ICICI Bank Ltd., ADR | 11,793,750 |
| 450,000 | ISHARES FTSE/XINHUA CHINA 25 | 18,769,500 |
| 1,700,000 | IShares MSCI Emerging Mkt | 63,852,000 |
| 455,000 | J. Crew Group, Inc. | 18,554,900 |
| 775,000 | Jefferies Group, Inc. | 20,227,500 |
| 360,000 | Life Technologies, Inc. | 16,981,200 |
| 1,050,000 | Macy's, Inc. | 18,448,500 |
| 475,000 | Massey Energy Co. | 13,817,750 |
| 70,000 | Mastercard, Inc. | 15,331,400 |
Annual Shareholder Report16
Shares or
Principal
Amount | | Value |
| 1,650,000 | Micron Technology, Inc. | $11,203,500 |
| 360,000 | O'Reilly Automotive, Inc. | 13,420,800 |
| 650,000 | Owens Corning, Inc. | 14,371,500 |
| 750,000 | Penske Automotive Group, Inc. | 11,745,000 |
| 2,050,000 | PMC-Sierra, Inc. | 17,466,000 |
| 2,700,000 | RF Micro Devices, Inc. | 10,746,000 |
| 280,000 | Salesforce.com, Inc. | 15,890,000 |
| 570,000 | SBA Communications, Corp. | 16,079,700 |
| 435,000 | Scotts Co. | 17,669,700 |
| 900,000 | Skyworks Solutions, Inc. | 9,387,000 |
| 260,000 | Smucker (J.M.) Co. | 13,709,800 |
| 570,000 | Starwood Hotels & Resorts Worldwide, Inc. | 16,564,200 |
| 1,000,000 | Temple-Inland, Inc. | 15,450,000 |
| 3,000,000 | Tenet Healthcare Corp. | 15,360,000 |
| 450,000 | TJX Cos., Inc. | 16,807,500 |
| 1,250,000 | Virgin Media, Inc. | 17,462,500 |
| 630,000 | Wells Fargo & Co. | 17,337,600 |
| 560,000 | Whole Foods Market, Inc. | 17,953,600 |
| 430,000 | WMS Industries, Inc. | 17,191,400 |
| 1,050,000 | Wyndham Worldwide Corp. | 17,902,500 |
| 225,000 | Wynn Resorts Ltd. | 12,199,500 |
| 375,000 | Yum! Brands, Inc. | 12,356,250 |
| TOTAL SECURITIES SOLD SHORT
(PROCEEDS $811,851,249) | $884,791,536 |
- At October 31, 2009, the Fund had the following open futures contracts:
| Description | Number of
Contracts | Notional
Value | Expiration
Date | Unrealized
Depreciation |
| 1S&P 500 Index Long Futures | 855 | $220,803,750 | December 2009 | $(1,666,168) |
Annual Shareholder Report17
- At October 31, 2009, the Fund had outstanding foreign exchange contracts as follows:
Settlement
Date | Foreign
Currency
Units to
Receive/Deliver | In
Exchange
For | Contracts
at Value | Unrealized
Appreciation/
(Depreciation) |
| Contracts Purchased: | | | | |
| 1/11/2010 | 11,836,500 PEN | $4,135,022 | $4,068,309 | $(66,713) |
| 2/2/2010 | 26,489,190 SGD | 27,300,000 NZD | $18,886,824 | $558,812 |
| 2/2/2010 | 24,237,240 CAD | 32,700,000 NZD | $22,400,223 | $452,240 |
| 2/2/2010 | 2,028,392,280 JPY | 32,400,000 NZD | $22,547,635 | $724,467 |
| 2/3/2010 | 26,270,850 SGD | 22,300,000 AUD | $18,731,073 | $554,188 |
| 4/6/2010 | 82,698,640 NOK | 15,200,000 CAD | $14,345,516 | $267,139 |
| 4/8/2010 | 19,956,274 SGD | 14,583,047 CHF | $14,225,185 | $5,237 |
| 5/7/2010 | 5,868,120,000 KRW | $4,740,000 | $4,957,229 | $217,229 |
| 5/14/2010 | 165,900,000 RUB | $4,740,000 | $5,480,945 | $740,945 |
| Contracts Sold: | | | | |
| 11/23/2009 | 31,000,000 NZD | $20,791,390 | $22,208,167 | $(1,416,777) |
| 12/2/2009 | 54,120,000 BRL | $30,000,000 | $30,521,717 | $(521,717) |
| 12/16/2009 | 42,840,850,000 COP | $22,100,000 | $21,335,043 | $764,957 |
| 2/2/2010 | 32,400,000 NZD | 2,028,392,280 JPY | $23,091,025 | $(1,267,857) |
| 2/2/2010 | 32,700,000 NZD | 24,237,240 CAD | $23,304,831 | $(1,356,848) |
| 2/2/2010 | 27,300,000 NZD | 26,489,190 SGD | $19,456,326 | $(1,128,315) |
| 2/3/2010 | 22,300,000 AUD | 26,270,850 SGD | $19,877,902 | $(1,701,017) |
| 2/3/2010 | 35,700,000 AUD | $29,209,740 | $31,822,471 | $(2,612,731) |
| 2/10/2010 | 13,000,000 EUR | $18,454,150 | $19,123,572 | $(669,422) |
| 3/8/2010 | 34,700,000 AUD | $29,735,124 | $30,814,784 | $(1,079,660) |
| 3/8/2010 | 11,981,610,000 JPY | $134,135,012 | $133,232,819 | $902,193 |
| 3/8/2010 | 62,700,000 NZD | $44,477,499 | $44,570,984 | $(93,485) |
| 3/12/2010 | 128,356,800 NOK | $21,964,988 | $22,291,874 | $(326,886) |
| 3/12/2010 | 210,991,198 SEK | $29,986,526 | $29,771,480 | $215,046 |
| 4/1/2010 | 392,456,250 CZK | $22,371,740 | $21,695,437 | $676,303 |
| 4/1/2010 | 172,482,750 ZAR | $21,748,194 | $21,467,206 | $280,988 |
Annual Shareholder Report18
Settlement
Date | Foreign
Currency
Units to
Receive/Deliver | In
Exchange
For | Contracts
at Value | Unrealized
Appreciation/
(Depreciation) |
| 4/5/2010 | 69,512,603 CAD | $64,470,973 | $64,235,843 | $235,130 |
| 4/5/2010 | 82,684,196 CAD | $76,727,104 | $76,407,570 | $319,534 |
| 4/6/2010 | 15,200,000 CAD | 82,698,640 NOK | $14,046,126 | $32,251 |
| 4/6/2010 | 4,135,725,000 HUF | $21,857,856 | $21,675,636 | $182,220 |
| 4/6/2010 | 65,319,750 PLN | $22,179,128 | $22,333,792 | $(154,664) |
| 4/8/2010 | 14,583,047 CHF | 19,956,274 SGD | $14,232,516 | $(12,569) |
| 5/7/2010 | 5,868,120,000 KRW | $4,981,426 | $4,957,229 | $24,197 |
| NET UNREALIZED DEPRECIATION ON FOREIGN EXCHANGE CONTRACTS | | $(5,255,585) |
- Net Unrealized Depreciation on Futures Contracts and Foreign Exchange Contracts and Value of Securities Sold Short are included in “Other Assets and Liabilities — Net.”
- Note: The categories of investments are shown as a percentage of total net assets at October 31, 2009.
- Various inputs are used in determining the value of the Fund's investments. These inputs are summarized in the three broad levels listed below:
- Level 1 — quoted prices in active markets for identical securities
- Level 2 — other significant observable inputs (including quoted prices for similar securities, interest rates, prepayment speeds, credit risk, etc.)
- Level 3 — significant unobservable inputs (including the Fund's own assumptions in determining the fair value of investments)
- The inputs or methodology used for valuing securities are not an indication of the risk associated with investing in those securities.
Annual Shareholder Report19
- The following is a summary of the inputs used, as of October 31, 2009, in valuing the Fund's assets carried at fair value:
| Valuation Inputs | | | | |
| Level 1 -
Quoted
Prices And
Investments In
Mutual Funds | Level 2 -
Other
Significant
Observable
Inputs | Level 3 -
Significant
Unobservable
Inputs | Total |
| Equity Securities: | | | | |
| Domestic | $252,202,320 | $ — | $ — | $252,202,320 |
| International | 124,257,025 | 150,053,322 | — | 274,310,347 |
| Debt Securities: |
| U.S. Treasury | — | 508,704,719 | — | 508,704,719 |
| Governments/Agencies | — | 90,795,961 | — | 90,795,961 |
| Investment Fund | 74,978,850 | — | — | 74,978,850 |
| Bullion | 50,626,777 | — | — | 50,626,777 |
| Exchange-Traded Fund | 48,583,000 | — | — | 48,583,000 |
| Mutual Funds | 190,644,181 | — | — | 190,644,181 |
| TOTAL SECURITIES | $741,292,153 | $749,554,002 | $ — | $1,490,846,155 |
| OTHER FINANCIAL INSTRUMENTS* | $(886,457,704) | $(5,255,585) | $ — | $(891,713,289) |
| * | Other financial instruments include futures contracts, foreign exchange contracts and securities sold short. |
- Following is a reconciliation of assets in which significant unobservable inputs (Level 3) were used in determining fair value:
| Investments in
Hybrid Notes |
| Balance as of November 1, 2008 | $3,448,916 |
| Realized gain (loss) | (29,098,921) |
| Change in unrealized appreciation (depreciation) | 38,071,557 |
| Net purchases (sales) | (12,421,552) |
| Balance as of October 31, 2009 | $ — |
Annual Shareholder Report20
- The following acronyms are used throughout this portfolio:
| ADR | — American Depositary Receipt |
| AUD | — Australian Dollar |
| BRL | — Brazil Real |
| CAD | — Canadian Dollars |
| CHF | — Swiss Franc |
| COP | — Colombian Peso |
| CZK | — Czech Koruna |
| EUR | — Euro |
| HUF | — Hungarian Forint |
| JPY | — Japanese Yen |
| KRW | — South Korean Won |
| NOK | — Norwegian Krone |
| NZD | — New Zealand Dollar |
| PEN | — Peruvian Nuevo |
| PLN | — Polish Zloty |
| RUB | — Russian Ruble |
| SEK | — Swedish Krona |
| SGD | — Singapore Dollar |
| ZAR | — South African Rand |
- See Notes which are an integral part of the Financial Statements
Annual Shareholder Report21
Statement of Assets and Liabilities
October 31, 2009
| Assets: | | |
| Total investments in securities, at value, including $154,018,981 of an investment in an affiliated issuer (Note 5) (identified cost $1,384,213,551) | | $1,490,846,155 |
| Cash dominated in foreign currencies (identified cost $768,815) | | 753,486 |
| Deposit at broker for short sales | | 922,334,852 |
| Receivable for investments sold | | 29,436,491 |
| Receivable for shares sold | | 24,952,019 |
| Receivable for foreign exchange contracts | | 7,153,076 |
| Income receivable | | 4,879,816 |
| TOTAL ASSETS | | 2,480,355,895 |
| Liabilities: | | |
| Securities sold short, at value (proceeds $811,851,249) | $884,791,536 | |
| Payable for foreign exchange contracts | 12,408,661 | |
| Payable for shares redeemed | 3,940,824 | |
| Payable for investments purchased | 3,280,890 | |
| Payable for daily variation margin | 1,001,368 | |
| Dividends payable on short positions | 89,250 | |
| Payable for shareholder services fee (Note 5) | 672,856 | |
| Payable for distribution services fee (Note 5) | 404,074 | |
| Accrued expenses | 508,954 | |
| TOTAL LIABILITIES | | 907,098,413 |
| Net assets for 142,462,624 shares outstanding | | $1,573,257,482 |
| Net Assets Consist of: | | |
| Paid-in capital | | $1,844,249,499 |
| Net unrealized appreciation of investments, short sales, futures contracts and translation of assets and liabilities in foreign currency | | 18,862,059 |
| Accumulated net realized loss on investments, short sales, futures contracts, written options and foreign currency translations | | (320,611,386) |
| Undistributed net investment income | | 30,757,310 |
| TOTAL NET ASSETS | | $1,573,257,482 |
Annual Shareholder Report22
Statement of Assets and Liabilities — continued| Net Asset Value, Offering Price and Redemption Proceeds Per Share | | |
| Class A Shares: | | |
| Net asset value per share ($835,964,018÷75,367,733 shares outstanding), no par value, unlimited shares authorized | | $11.09 |
| Offering price per share (100/94.50 of $11.09) | | $11.74 |
| Redemption proceeds per share | | $11.09 |
| Class B Shares: | | |
| Net asset value per share ($166,560,582÷15,152,689 shares outstanding), no par value, unlimited shares authorized | | $10.99 |
| Offering price per share | | $10.99 |
| Redemption proceeds per share (94.50/100 of $10.99) | | $10.39 |
| Class C Shares: | | |
| Net asset value per share ($489,259,811÷44,631,713 shares outstanding), no par value, unlimited shares authorized | | $10.96 |
| Offering price per share | | $10.96 |
| Redemption proceeds per share (99.00/100 of $10.96) | | $10.85 |
| Institutional Shares: | | |
| Net asset value per share ($81,473,071÷7,310,489 shares outstanding), no par value, unlimited shares authorized | | $11.14 |
| Offering price per share | | $11.14 |
| Redemption proceeds per share | | $11.14 |
- See Notes which are an integral part of the Financial Statements
Annual Shareholder Report23
Statement of Operations
Year Ended October 31, 2009
| Investment Income: | | | |
| Dividends (including $3,756,884 received from an affiliated issuer (Note 5) and net of foreign taxes withheld of $874,461) | | | $19,680,712 |
| Interest | | | 30,599,791 |
| TOTAL INCOME | | | 50,280,503 |
| Expenses: | | | |
| Investment adviser fee (Note 5) | | $10,411,947 | |
| Administrative personnel and services fee (Note 5) | | 1,077,675 | |
| Custodian fees | | 127,966 | |
| Transfer and dividend disbursing agent fees and expenses | | 2,001,320 | |
| Directors'/Trustees' fees | | 10,225 | |
| Auditing fees | | 33,001 | |
| Legal fees | | 22,104 | |
| Portfolio accounting fees | | 188,710 | |
| Distribution services fee — Class B Shares (Note 5) | | 1,366,248 | |
| Distribution services fee — Class C Shares (Note 5) | | 3,375,331 | |
| Shareholder services fee — Class A Shares (Note 5) | | 1,750,038 | |
| Shareholder services fee — Class B Shares (Note 5) | | 455,416 | |
| Shareholder services fee — Class C Shares (Note 5) | | 1,095,824 | |
| Account administration fee — Class A Shares | | 6,247 | |
| Account administration fee — Class C Shares | | 409 | |
| Share registration costs | | 93,730 | |
| Printing and postage | | 710,391 | |
| Insurance premiums | | 8,272 | |
| Dividends on short positions | | 2,102,489 | |
| Miscellaneous | | 17,552 | |
| TOTAL EXPENSES | | 24,854,895 | |
Annual Shareholder Report24
Statement of Operations — continued| Waivers, Reimbursement and Expense Reductions: | | | |
| Waiver/reimbursement of investment adviser fee (Note 5) | $(869,888) | | |
| Waiver of administrative personnel and services fee (Note 5) | (21,210) | | |
| Fees paid indirectly from directed brokerage arrangements (Note 6) | (47,778) | | |
| Reduction of custodian fees (Note 6) | (6,531) | | |
| TOTAL WAIVERS, REIMBURSEMENT AND EXPENSE REDUCTIONS | | $(945,407) | |
| Net expenses | | | $23,909,488 |
| Net investment income | | | 26,371,015 |
| Realized and Unrealized Gain (Loss) on Investments, Short Sales, Futures Contracts, Written Options and Foreign Currency Transactions: | | | |
| Net realized loss on investments and foreign currency transactions | | | (200,781,502) |
| Net realized loss on short sales | | | (18,675,553) |
| Net realized loss on futures contracts | | | (59,403,274) |
| Net realized gain on written options | | | 5,018,882 |
| Net change in unrealized appreciation of investments and translation of assets and liabilities in foreign currency | | | 459,905,344 |
| Net change in unrealized depreciation of short sales | | | (72,940,287) |
| Net change in unrealized depreciation of futures contracts | | | (1,666,168) |
| Net change in unrealized depreciation on written options | | | 6,856,239 |
| Net realized and unrealized gain on investments, short sales, futures contracts, written options and foreign currency transactions | | | 118,313,681 |
| Change in net assets resulting from operations | | | $144,684,696 |
- See Notes which are an integral part of the Financial Statements
Annual Shareholder Report25
Statement of Changes in Net Assets
| Year Ended October 31 | 2009 | 2008 |
| Increase (Decrease) in Net Assets | | |
| Operations: | | |
| Net investment income | $26,371,015 | $56,142,405 |
| Net realized gain (loss) on investments, short sales, futures contracts, written options and foreign currency transactions | (273,841,447) | 100,621,766 |
| Net change in unrealized appreciation/depreciation of investments, short sales, futures contracts, written options and translation of assets and liabilities in foreign currency | 392,155,128 | (365,013,616) |
| CHANGE IN NET ASSETS RESULTING FROM OPERATIONS | 144,684,696 | (208,249,445) |
| Distributions to Shareholders: | | |
| Distributions from net investment income | | |
| Class A Shares | (28,826,874) | (42,762,897) |
| Class B Shares | (7,577,356) | (10,016,412) |
| Class C Shares | (17,195,671) | (22,300,645) |
| Institutional Shares | (346,178) | (111,676) |
| CHANGE IN NET ASSETS RESULTING FROM DISTRIBUTIONS TO SHAREHOLDERS | (53,946,079) | (75,191,630) |
| Share Transactions: | | |
| Proceeds from sale of shares | 671,401,676 | 526,356,457 |
| Net asset value of shares issued to shareholders in payment of distributions declared | 41,230,658 | 57,468,587 |
| Cost of shares redeemed | (601,415,722) | (854,744,051) |
| CHANGE IN NET ASSETS RESULTING FROM SHARE TRANSACTIONS | 111,216,612 | (270,919,007) |
| Change in net assets | 201,955,229 | (554,360,082) |
| Net Assets: | | |
| Beginning of period | 1,371,302,253 | 1,925,662,335 |
| End of period (including undistributed net investment income of $30,757,310 and $40,649,747, respectively) | $1,573,257,482 | $1,371,302,253 |
- See Notes which are an integral part of the Financial Statements
Annual Shareholder Report26
Notes to Financial Statements
October 31, 2009
1. Organization
Federated Equity Funds (the “Trust”) is registered under the Investment Company Act of 1940, as amended (the “Act”), as an open-end management investment company. The Trust consists of 13 diversified portfolios. The financial statements included herein are only those of Federated Market Opportunity Fund (the “Fund”). The financial statements of the other portfolios are presented separately. The assets of each portfolio are segregated and a shareholder's interest is limited to the portfolio in which shares are held. Each portfolio pays its own expenses. The Fund offers four classes of shares: Class A Shares, Class B Shares, Class C Shares and Institutional Shares. All shares of the Fund have equal rights with respect to voting, except on class-specific matters. The financial highlights of the Institutional Shares are presented separately. The investment objective of the Fund is to provide absolute (positive) returns with low correlation to the U.S. equity market.
2. Significant Accounting Policies
The following is a summary of significant accounting policies consistently followed by the Fund in the preparation of its financial statements. These policies are in conformity with U.S. generally accepted accounting principles (GAAP).
Investment Valuation
In calculating its net asset value (NAV), the Fund generally values investments as follows:
- Equity securities listed on an exchange or traded through a regulated market system are valued at their last reported sale price or official closing price in their principal exchange or market.
- Shares of other mutual funds are valued based upon their reported NAVs.
- Fixed-income securities acquired with remaining maturities greater than 60 days are fair valued using price evaluations provided by a pricing service approved by the Trustees.
- Fixed-income securities acquired with remaining maturities of 60 days or less are valued at their cost (adjusted for the accretion of any discount or amortization of any premium).
- Derivative contracts listed on exchanges are valued at their reported settlement or closing price.
- Over-the-counter (OTC) derivative contracts are fair valued using price evaluations provided by a pricing service approved by the Trustees.
If the Fund cannot obtain a price or price evaluation from a pricing service for an investment, the Fund may attempt to value the investment based upon the mean of bid and asked quotations or fair value the investment based on price evaluations, from one or more dealers. If any price, quotation, price evaluation or other pricing source is not readily available when the NAV is calculated, the Fund uses the fair value of the investment determined in accordance with the procedures described below. There can be no assurance that the Fund could purchase or sell an investment at the price used to calculate the Fund's NAV.
Fair Valuation and Significant Events Procedures
The Trustees have authorized the use of pricing services to provide evaluations of the current fair value of certain investments for purposes of calculating the NAV. Factors considered by pricing services in evaluating an investment include the yields or prices of investments of comparable quality, coupon, maturity, call rights and other potential prepayments, terms and type, reported transactions, indications as to values from dealers and general market Annual Shareholder Report27
conditions. Some pricing services provide a single price evaluation reflecting the bid side of the market for an investment (a “bid” evaluation). Other pricing services offer both bid evaluations and price evaluations indicative of a price between the prices bid and asked for the investment (a “mid” evaluation). The Fund normally uses bid evaluations for U.S. Treasury and Agency securities, mortgage-backed securities and municipal securities. The Fund normally uses mid evaluations for other types of fixed-income securities and OTC derivative contracts. In the event that market quotations and price evaluations are not available for an investment, the fair value of the investment is determined in accordance with procedures adopted by the Trustees.The Trustees also have adopted procedures requiring an investment to be priced at its fair value whenever the Adviser determines that a significant event affecting the value of the investment has occurred between the time as of which the price of the investment would otherwise be determined and the time as of which the NAV is computed. An event is considered significant if there is both an affirmative expectation that the investment's value will change in response to the event and a reasonable basis for quantifying the resulting change in value. Examples of significant events that may occur after the close of the principal market on which a security is traded, or after the time of a price evaluation provided by a pricing service or a dealer, include:
- With respect to securities traded in foreign markets, significant trends in U.S. equity markets or in the trading of foreign securities index futures or options contracts;
- With respect to price evaluations of fixed-income securities determined before the close of regular trading on the NYSE, actions by the Federal Reserve Open Market Committee and other significant trends in U.S. fixed-income markets;
- Political or other developments affecting the economy or markets in which an issuer conducts its operations or its securities are traded; and
- Announcements concerning matters such as acquisitions, recapitalizations, litigation developments, a natural disaster affecting the issuer's operations or regulatory changes or market developments affecting the issuer's industry.
The Trustees have approved the use of a pricing service to determine the fair value of equity securities traded principally in foreign markets when the Adviser determines that there has been a significant trend in the U.S. equity markets or in index futures trading. For other significant events, the Fund may seek to obtain more current quotations or price evaluations from alternative pricing sources. If a reliable alternative pricing source is not available, the Fund will determine the fair value of the investment using another method approved by the Trustees.
Repurchase Agreements
It is the policy of the Fund to require the other party to a repurchase agreement to transfer to the Fund's custodian or sub-custodian eligible securities or cash with a market value (after transaction costs) at least equal to the repurchase price to be paid under the repurchase agreement. The eligible securities are transferred to accounts with the custodian or sub-custodian in which the Fund holds a “securities entitlement” and exercises “control” as those terms are defined in the Uniform Commercial Code. The Fund has established procedures for monitoring the market value of the transferred securities and requiring the transfer of additional eligible securities if necessary to equal at least the repurchase price. These procedures also allow the other party to require securities to be transferred from the account to the extent that their market value exceeds the repurchase price or in exchange for other eligible securities of equivalent market value.
Annual Shareholder Report28
With respect to agreements to repurchase U.S. government securities and cash items, the Fund treats the repurchase agreement as an investment in the underlying securities and not as an obligation of the other party to the repurchase agreement. Other repurchase agreements are treated as obligations of the other party secured by the underlying securities. Nevertheless, the insolvency of the other party or other failure to repurchase the securities may delay the disposition of the underlying securities or cause the Fund to receive less than the full repurchase price. Under the terms of the repurchase agreement, any amounts received by the Fund in excess of the repurchase price and related transaction costs must be remitted to the other party.The Fund may enter into repurchase agreements in which eligible securities are transferred into joint trading accounts maintained by the custodian or sub-custodian for investment companies and other clients advised by the Fund's Adviser and its affiliates. The Fund will participate on a pro rata basis with the other investment companies and clients in its share of the securities transferred under such repurchase agreements and in its share of proceeds from any repurchase or other disposition of such securities.
Investment Income, Gains and Losses, Expenses and Distributions
Investment transactions are accounted for on a trade-date basis. Realized gains and losses from investment transactions are recorded on an identified cost basis. Interest income and expenses are accrued daily. Dividend income and distributions to shareholders are recorded on the ex-dividend date. Inflation adjustments on Treasury Inflation-Protected Securities are included in interest income. Foreign dividends are recorded on the ex-dividend date or when the Fund is informed of the ex-dividend date. Distributions of net investment income are declared and paid quarterly. Non-cash dividends included in dividend income, if any, are recorded at fair value. Investment income, realized and unrealized gains and losses, and certain fund-level expenses are allocated to each class based on relative average daily net assets, except that each class may bear certain expenses unique to that class such as account administration, distribution services and shareholder services fees. Dividends are declared separately for each class. No class has preferential dividend rights; differences in per share dividend rates are generally due to differences in separate class expenses.
Premium and Discount Amortization
All premiums and discounts on fixed-income securities are amortized/accreted for financial statement purposes.
Federal Taxes
It is the Fund's policy to comply with the Subchapter M provision of the Internal Revenue Code and to distribute to shareholders each year substantially all of its income. Accordingly, no provision for federal income tax is necessary. As of and during the year ended October 31, 2009, the Fund did not have a liability for any uncertain tax positions. The Fund recognizes interest and penalties, if any, related to tax liabilities as income tax expense in the Statement of Operations. As of October 31, 2009, tax years 2006 through 2009 remain subject to examination by the Fund's major tax jurisdictions, which include the United States of America and the Commonwealth of Massachusetts.
The Fund may be subject to taxes imposed by governments of countries in which it invests. Such taxes are generally based on either income or gains earned or repatriated. The Fund accrues and applies such taxes to net investment income, net realized gains and net unrealized gains as income and/or gains are earned.
Annual Shareholder Report29
When-Issued and Delayed Delivery TransactionsThe Fund may engage in when-issued or delayed delivery transactions. The Fund records when-issued securities on the trade date and maintains security positions such that sufficient liquid assets will be available to make payment for the securities purchased. Securities purchased on a when-issued or delayed delivery basis are marked to market daily and begin earning interest on the settlement date. Losses may occur on these transactions due to changes in market conditions or the failure of counterparties to perform under the contract.
Futures Contracts
The Fund purchases and sells financial futures contracts to manage cash flows, enhance yield, manage duration and to potentially reduce transaction costs. Upon entering into a financial futures contract with a broker, the Fund is required to deposit in a segregated account a specified amount of cash or U.S. government securities. Futures contracts are valued daily and unrealized gains or losses are recorded in a “variation margin” account. Daily, the Fund receives from or pays to the broker a specified amount of cash based upon changes in the variation margin account. When a contract is closed, the Fund recognizes a realized gain or loss. Futures contracts have market risks, including the risk that the change in the value of the contract may not correlate with the changes in the value of the underlying securities. There is minimal counterparty risk to the Fund since futures are exchange traded and the exchange's clearinghouse, as counterparty to all exchange traded futures, guarantees the futures against default.
Futures contracts outstanding at period end are listed after the Fund's Portfolio of Investments.
Foreign Exchange Contracts
The Fund may enter into foreign exchange contracts for the delayed delivery of securities or foreign currency exchange transactions. The Fund may enter into foreign exchange contracts to protect assets against adverse changes in foreign currency exchange rates or exchange control regulations. Purchased contracts are used to acquire exposure to foreign currencies, whereas, contracts to sell are used to hedge the Fund's securities against currency fluctuations. Risks may arise upon entering into these transactions from the potential inability of counterparties to meet the terms of their commitments and from unanticipated movements in security prices or foreign exchange rates. The foreign exchange contracts are adjusted by the daily exchange rate of the underlying currency and any gains or losses are recorded for financial statement purposes as unrealized until the settlement date.
Foreign exchange contracts outstanding at period end are listed after the Fund's Portfolio of Investments.
Foreign Currency Translation
The accounting records of the Fund are maintained in U.S. dollars. All assets and liabilities denominated in foreign currencies (FCs) are translated into U.S. dollars based on the rates of exchange of such currencies against U.S. dollars on the date of valuation. Purchases and sales of securities, income and expenses are translated at the rate of exchange quoted on the respective date that such transactions are recorded. The Fund does not isolate that portion of the results of operations resulting from changes in foreign exchange rates on investments from the fluctuations arising from changes in market prices of securities held. Such fluctuations are included with the net realized and unrealized gain or loss from investments.
Annual Shareholder Report30
Reported net realized foreign exchange gains or losses arise from sales of portfolio securities, sales and maturities of short-term securities, sales of FCs, currency gains or losses realized between the trade and settlement dates on securities transactions, the difference between the amounts of dividends, interest and foreign withholding taxes recorded on the Fund's books, and the U.S. dollar equivalent of the amounts actually received or paid. Net unrealized foreign exchange gains and losses arise from changes in the value of assets and liabilities other than investments in securities at fiscal year end, resulting from changes in the exchange rate.Short Sales
The Fund may sell a security short in an effort to take advantage of an anticipated decline in the price of the security. In a short sale, the Fund sells a security it does not own, and must borrow the security in order to deliver it at completion of the sale. The Fund then has an obligation to replace the borrowed security. If the Fund can buy the security back at a lower price than it sold it for, a gain is realized. If the Fund has to buy the security back at a higher price, a loss is realized. For the year ended October 31, 2009, the Fund had a net realized loss on short sales of $18,675,553.
Options Contracts
The Fund may buy or sell put and call options for hedging and asset allocation purposes. The seller (writer) of an option receives a payment or premium, from the buyer, which the writer keeps regardless of whether the buyer exercises the option. Premiums paid for purchasing options which expire are treated as realized losses. The risk associated with purchasing put and call options is limited to the premium paid. When the Fund writes a put or call option, an amount equal to the premium received is recorded as a liability and subsequently marked to market to reflect the current value of the option written. Premiums received from writing options which expire are treated as realized gains. Premiums received from writing options which are exercised or closed are added to the proceeds or offset against amounts paid on the underlying reference instrument to determine the realized gain or loss. The Fund, as a writer of an option, bears the market risk of an unfavorable change in the price of the underlying reference instrument. Options can trade on securities or commodities exchanges. In this case, the exchange sets all the terms of the contract except for the price. Most exchanges require investors to maintain margin accounts through their brokers to cover their potential obligations to the exchange. This protects investors against potential defaults by the counterparty.
The following is a summary of the Fund's written option activity:
| Contracts | Number of
Contracts | Premium |
| Outstanding at October 31, 2008 | 15,500 | $7,843,761 |
| Contracts exercised | (2,800) | (1,603,579) |
| Contracts bought back | (2,700) | (1,546,308) |
| Contracts expired | (10,000) | (4,693,874) |
| Outstanding at October 31, 2009 | — | $ — |
Annual Shareholder Report31
Additional Disclosure Related to Derivative Instruments
| Fair Value of Derivative Instruments |
| Asset | Liability |
| Statement of
Assets and
Liabilities
Location | Fair Value | Statement of
Assets and
Liabilities
Location | Fair Value |
| Derivatives not accounted for as hedging instruments under ASC Topic 815 | | | | |
| Foreign exchange contracts | Receivable for foreign exchange contracts | $7,153,076 | Payable for foreign exchange contracts | $12,408,661 |
| Equity contracts | | — | Payable for daily variation margin | 1,666,168* |
| Total derivatives not accounted for as hedging instruments under ASC Topic 815 | | $7,153,076 | | $14,074,829 |
| * | Includes cumulative appreciation/depreciation of futures contracts as reported in the footnotes to the Portfolio of Investments. Only the current day's variation margin is reported within the Statement of Assets and Liabilities. |
The Effect of Derivative Instruments on the Statement of Operations for the Year Ended October 31, 2009
| Amount of Realized Gain or (Loss) on Derivatives Recognized in Income |
| Futures | Forward
Currency
Contracts | Written
Options | Total |
| Foreign exchange contracts | — | $42,028,265 | — | $42,028,265 |
| Equity contracts | $(59,403,274) | — | $5,018,882 | (54,384,392) |
| Total | $(59,403,274) | $42,028,265 | $5,018,882 | $(12,356,127) |
| Change in Unrealized Appreciation or (Depreciation) on Derivatives Recognized in Income |
| Futures | Forward
Currency
Contracts | Written
Options | Total |
| Foreign exchange contracts | — | $(10,367,554) | — | $(10,367,554) |
| Equity contracts | $(1,666,168) | — | $6,856,239 | 5,190,071 |
| Total | $(1,666,168) | $(10,367,554) | $6,856,239 | $(5,177,483) |
Restricted Securities
Restricted securities are securities that either: (a) cannot be offered for public sale without first being registered, or being able to take advantage of an exemption from registration, under the Securities Act of 1933; or (b) are subject to contractual restrictions on public sales. In some cases, when a security cannot be offered for public sale without first being registered, the issuer of the restricted security has agreed to register such securities for resale, at the issuer's expense, either upon demand by the Fund or in connection with another registered Annual Shareholder Report32
offering of the securities. Many such restricted securities may be resold in the secondary market in transactions exempt from registration. Restricted securities may be determined to be liquid under criteria established by the Trustees. The Fund will not incur any registration costs upon such resales. The Fund's restricted securities are valued at the price provided by dealers in the secondary market or, if no market prices are available, at the fair value as determined in accordance with procedures established by and under the general supervision of the Trustees.Other
The preparation of financial statements in conformity with GAAP requires management to make estimates and assumptions that affect the amounts of assets, liabilities, expenses and revenues reported in the financial statements. Actual results could differ from those estimated.
3. Shares of Beneficial Interest
The following tables summarize share activity:
| Year Ended October 31 | 2009 | 2008 |
| Class A Shares: | Shares | Amount | Shares | Amount |
| Shares sold | 39,339,133 | $430,108,951 | 31,660,346 | $389,360,969 |
| Shares issued to shareholders in payment of distributions declared | 2,234,350 | 23,054,476 | 2,775,926 | 33,809,164 |
| Shares redeemed | (36,513,444) | (383,301,698) | (44,465,849) | (530,133,572) |
NET CHANGE RESULTING
FROM CLASS A
SHARE TRANSACTIONS | 5,060,039 | $69,861,729 | (10,029,577) | $(106,963,439) |
| Year Ended October 31 | 2009 | 2008 |
| Class B Shares: | Shares | Amount | Shares | Amount |
| Shares sold | 1,323,482 | $14,216,697 | 1,934,966 | $23,555,885 |
| Shares issued to shareholders in payment of distributions declared | 608,550 | 6,238,153 | 679,764 | 8,231,972 |
| Shares redeemed | (6,138,694) | (64,447,604) | (7,261,201) | (86,900,792) |
NET CHANGE RESULTING
FROM CLASS B
SHARE TRANSACTIONS | (4,206,662) | $(43,992,754) | (4,646,471) | $(55,112,935) |
| Year Ended October 31 | 2009 | 2008 |
| Class C Shares: | Shares | Amount | Shares | Amount |
| Shares sold | 12,963,665 | $140,108,028 | 8,668,337 | $105,602,213 |
| Shares issued to shareholders in payment of distributions declared | 1,145,371 | 11,710,051 | 1,270,437 | 15,343,355 |
| Shares redeemed | (13,205,369) | (137,704,151) | (19,907,692) | (237,038,784) |
NET CHANGE RESULTING
FROM CLASS C
SHARE TRANSACTIONS | 903,667 | $14,113,928 | (9,968,918) | $(116,093,216) |
Annual Shareholder Report33
| Year Ended October 31 | 2009 | 2008 |
| Institutional Shares: | Shares | Amount | Shares | Amount |
| Shares sold | 8,090,710 | $86,968,000 | 648,425 | $7,837,390 |
| Shares issued to shareholders in payment of distributions declared | 21,684 | 227,978 | 6,935 | 84,096 |
| Shares redeemed | (1,438,538) | (15,962,269) | (58,310) | (670,903) |
NET CHANGE RESULTING
FROM INSTITUTIONAL
SHARE TRANSACTIONS | 6,673,856 | $71,233,709 | 597,050 | $7,250,583 |
| NET CHANGE RESULTING FROM FUND SHARE TRANSACTIONS | 8,430,900 | $111,216,612 | (24,047,916) | $(270,919,007) |
4. Federal Tax Information
The timing and character of income and capital gain distributions are determined in accordance with income tax regulations, which may differ from GAAP. These differences are due in part to differing treatments for foreign currency transactions, defaulted securities, discount accretion/premium amortization on debt securities and partnership adjustments.
For the year ended October 31, 2009, permanent differences identified and reclassified among the components of net assets were as follows:
| Increase (Decrease) |
Undistributed
Net Investment
Income (Loss) | Accumulated
Net Realized
Gains (Losses) |
| $ 17,682,627 | $ (17,682,627) |
Net investment income (loss), net realized gains (losses) and net assets were not affected by this reclassification.
The tax character of distributions as reported on the Statement of Changes in Net Assets for the years ended October 31, 2009 and 2008, was as follows:
| 2009 | 2008 |
| Ordinary income | $53,946,079 | $75,191,630 |
As of October 31, 2009, the components of distributable earnings on a tax basis were as follows:
| Undistributed ordinary income | $32,320,037 |
| Net unrealized depreciation | $(19,402,174) |
| Capital loss carryforwards | $(283,909,880) |
The difference between book-basis and tax-basis net unrealized appreciation/depreciation is attributable to differing treatments for the deferral of losses on wash sales, defaulted bonds, passive foreign investment companies, and discount accretion/premium amortization on debt securities.
Annual Shareholder Report34
At October 31, 2009, the cost of investments for federal tax purposes was $1,418,950,275. The net unrealized appreciation of investments for federal tax purposes excluding any unrealized appreciation/depreciation resulting from changes in foreign currency exchange rates, securities sold short and futures contracts was $71,895,880. This consists of net unrealized appreciation from investments for those securities having an excess of value over cost of $79,817,099 and net unrealized depreciation from investments for those securities having an excess of cost over value of $7,921,219.At October 31, 2009, the Fund had a capital loss carryforward of $283,909,880 which will reduce the Fund's taxable income arising from future net realized gains on investments, if any, to the extent permitted by the Code and thus will reduce the amount of distributions to shareholders which would otherwise be necessary to relieve the Fund of any liability for federal income tax. Pursuant to the Code, such capital loss carryforward will expire as follows:
| Expiration Year | Expiration Amount |
| 2015 | $26,587,308 |
| 2017 | $257,322,572 |
5. Investment Adviser Fee and Other Transactions with Affiliates
Investment Adviser Fee
Federated Equity Management Company of Pennsylvania is the Fund's investment adviser (the “Adviser”). The advisory agreement between the Fund and the Adviser provides for an annual fee equal to 0.75% of the Fund's average daily net assets. Subject to the terms described in the Expense Limitation note, the Adviser may also voluntarily choose to waive any portion of its fee. The Adviser can modify or terminate this voluntary waiver at any time at its sole discretion. For the year ended October 31, 2009, the Adviser voluntarily waived $523,827 of its fee.
Certain of the Fund's assets are managed by Federated Investment Management Company (the “Sub-Adviser”). Under the terms of a sub-adviser agreement between the Adviser and the Sub-Adviser, the Sub-Adviser receives an allocable portion of the Fund's adviser fee. The fee is paid by the Adviser out of its resources and is not an incremental Fund expense. For the year ended October 31, 2009, the Sub-Adviser earned a fee of $922,389.
Administrative Fee
Federated Administrative Services (FAS), under the Administrative Services Agreement, provides the Fund with administrative personnel and services. The fee paid to FAS is based on the average aggregate daily net assets of certain Federated funds as specified below:
| Administrative Fee | Average Aggregate Daily Net Assets
of the Federated Funds |
| 0.150% | on the first $5 billion |
| 0.125% | on the next $5 billion |
| 0.100% | on the next $10 billion |
| 0.075% | on assets in excess of $20 billion |
Annual Shareholder Report35
The administrative fee received during any fiscal year shall be at least $150,000 per portfolio and $40,000 per each additional class of Shares. Subject to the terms described in the Expense Limitation note, FAS may voluntarily choose to waive any portion of its fee. FAS can modify or terminate this voluntary waiver at any time at its sole discretion. For the year ended October 31, 2009, the net fee paid to FAS was 0.076% of average daily net assets of the Fund. FAS waived $21,210 of its fee.
Distribution Services Fee
The Fund has adopted a Distribution Plan (the “Plan”) pursuant to Rule 12b-1 under the Act. Under the terms of the Plan, the Fund will compensate Federated Securities Corp. (FSC), the principal distributor, from the daily net assets of the Fund's Class A Shares, Class B Shares and Class C Shares to finance activities intended to result in the sale of these shares. The Plan provides that the Fund may incur distribution expenses at the following percentages of average daily net assets annually, to compensate FSC:
| Share Class Name | Percentage of Average Daily
Net Assets of Class |
| Class A Shares | 0.05% |
| Class B Shares | 0.75% |
| Class C Shares | 0.75% |
Subject to the terms described in the Expense Limitation note, FSC may voluntarily choose to waive any portion of its fee. FSC can modify or terminate this voluntary waiver at any time at its sole discretion. When FSC receives fees, it may pay some or all of them to financial intermediaries whose customers purchase shares. For the year ended October 31, 2009, FSC retained $532,081 of fees paid by the Fund. For the year ended October 31, 2009, the Fund's Class A Shares did not incur a distribution services fee; however, it may begin to incur this fee upon approval of the Trustees.
Sales Charges
Front-end sales charges and contingent deferred sales charges (“CDSC”) do not represent expenses of the Fund. They are deducted from the proceeds of sales of Fund shares prior to investment or from redemption proceeds prior to remittance, as applicable. For the year ended October 31, 2009, FSC retained $200,282 in sales charges from the sale of Class A Shares. FSC also retained $5,874 of contingent deferred sales charges relating to redemptions of Class A Shares and $34,801 relating to redemptions of Class C Shares.
Shareholder Services Fee
The Fund may pay fees (Service Fees) up to 0.25% of the average daily net assets of the Fund's Class A Shares, Class B Shares and Class C Shares to financial intermediaries or to Federated Shareholder Services Company (FSSC) for providing services to shareholders and maintaining shareholder accounts. Financial intermediaries may include a company affiliated with management of Federated Investors, Inc. A financial intermediary affiliated with management of Federated Investors, Inc. received $3,595 of Service Fees for the year ended October 31, 2009. Subject to the terms described in the Expense Limitation note, FSSC may voluntarily reimburse the Fund for shareholder services fees. This voluntary reimbursement can be modified or terminated at any time. For the year ended October 31, 2009, FSSC did not receive any fees paid by the Fund.
Annual Shareholder Report36
Expense LimitationThe Adviser and its affiliates (which may include FSC, FAS and FSSC) voluntarily agreed to waive their fees and/or reimburse expenses so that the total operating expenses (as shown in the financial highlights) paid by the Fund's Class A Shares, Class B Shares, Class C Shares and Institutional Shares (after the voluntary waivers and reimbursements, but excluding dividends on short positions) will not exceed 1.24%, 1.99%, 1.99% and 0.99%, respectively, through the later of (the “Termination Date”): (a) December 31, 2010; or (b) the date of the Fund's next effective Prospectus. While the Adviser and its affiliates currently do not anticipate terminating these arrangements prior to the Termination Date, these arrangements may only be terminated prior to the Termination Date with the agreement of the Fund's Board of Trustees.
General
Certain Officers and Trustees of the Fund are Officers and Directors or Trustees of the above companies.
Transactions with Affiliated Companies
Affiliated holdings are mutual funds which are managed by the Adviser or an affiliate of the Adviser. The Adviser has agreed to reimburse the Fund for certain investment adviser fees as a result of transactions in other affiliated mutual funds. For the year ended October 31, 2009, the Adviser reimbursed $346,061. Transactions with the affiliated company during the year ended October 31, 2009 were as follows:
| Affiliate | Balance of
Shares Held
10/31/2008 | Purchases/
Additions | Sales/
Reductions | Balance of
Shares Held
10/31/2009 | Value | Dividend
Income |
| Prime Value Obligations Fund, Institutional Shares | 193,695,807 | 1,753,060,735 | 1,792,737,561 | 154,018,981 | $154,018,981 | $3,756,884 |
6. Expense Reduction
Through arrangements with the Fund's custodian, net credits realized as a result of uninvested cash balances were used to reduce custody expenses. For the year ended October 31, 2009, the Fund's expenses were reduced by $6,531 under these arrangements.
The Fund directs portfolio trades to a broker that in turn pays a portion of the Fund's operating expenses. For the year ended October 31, 2009, the Fund's expenses were reduced by $47,778 under these arrangements.
7. Investment Transactions
Purchases and sales of investments, excluding long-term U.S. government securities and short-term obligations, for the year ended October 31, 2009, were as follows:
| Purchases | $1,450,099,345 |
| Sales | $2,195,297,522 |
Annual Shareholder Report37
8. Line of Credit
The Fund participates in a $100,000,000 unsecured, uncommitted revolving line of credit (LOC) agreement with PNC Bank. The LOC was made available for extraordinary or emergency purposes, primarily for financing redemption payments. Borrowings are charged interest at a rate offered to the Fund by PNC Bank at the time of the borrowing. As of October 31, 2009, there were no outstanding loans. During the year ended October 31, 2009, the Fund did not utilize the LOC.
9. Interfund Lending
Pursuant to an Exemptive Order issued by the Securities and Exchange Commission (SEC), the Fund, along with other funds advised by subsidiaries of Federated Investors, Inc., may participate in an interfund lending program. This program provides an alternative credit facility allowing the funds to borrow from other participating affiliated funds. As of October 31, 2009, there were no outstanding loans. During the year ended October 31, 2009, the program was not utilized.
10. Legal Proceedings
Since October 2003, Federated Investors, Inc. and related entities (collectively, “Federated”), and various Federated funds (“Funds”) have been named as defendants in several class action lawsuits now pending in the United States District Court for the District of Maryland. The lawsuits were purportedly filed on behalf of people who purchased, owned and/or redeemed shares of Federated-sponsored mutual funds during specified periods beginning November 1, 1998. The suits are generally similar in alleging that Federated engaged in illegal and improper trading practices including market timing and late trading in concert with certain institutional traders, which allegedly caused financial injury to the mutual fund shareholders. These lawsuits began to be filed shortly after Federated's first public announcement that it had received requests for information on shareholder trading activities in the Funds from the SEC, the Office of the New York State Attorney General (“NYAG”), and other authorities. In that regard, on November 28, 2005, Federated announced that it had reached final settlements with the SEC and the NYAG with respect to those matters. As Federated previously reported in 2004, it has already paid approximately $8.0 million to certain funds as determined by an independent consultant. As part of these settlements, Federated agreed to pay for the benefit of fund shareholders additional disgorgement and a civil money penalty in the aggregate amount of an additional $72 million. Federated entities have also been named as defendants in several additional lawsuits that are now pending in the United States District Court for the Western District of Pennsylvania, alleging, among other things, excessive advisory and Rule 12b-1 fees. The Board of the Funds retained the law firm of Dickstein Shapiro LLP to represent the Funds in these lawsuits. Federated and the Funds, and their respective counsel, have been defending this litigation and none of the Funds remains a defendant in any of the lawsuits (though some could potentially receive any recoveries as nominal defendants). Additional lawsuits based upon similar allegations may be filed in the future. The potential impact of these lawsuits, all of which seek unquantified damages, attorneys' fees and expenses, and future potential similar suits is uncertain. Although we do not believe that these lawsuits will have a material adverse effect on the Funds, there can be no assurance that these suits, the ongoing adverse publicity and/or other developments resulting from the regulatory investigations will not result in increased Fund redemptions, reduced sales of Fund shares, or other adverse consequences for the Funds.
Annual Shareholder Report38
11. Subsequent EventsManagement has evaluated subsequent events through December 24, 2009, the date the financial statements were issued, and determined that no events have occurred that require additional disclosure.
12. Federal Tax Information (unaudited)
For the fiscal year ended October 31, 2009, 11.87% of total ordinary income distributions made by the Fund are qualifying dividends which may be subject to a maximum tax rate of 15%, as provided for by the Jobs and Growth Tax Relief Act of 2003. Complete information is reported in conjunction with the reporting of your distributions on Form 1099-DIV.
Of the ordinary income distributions made by the Fund during the year ended October 31, 2009, 2.65% qualify for the dividend received deduction available to corporate shareholders.
Annual Shareholder Report39
Report of Independent Registered Public Accounting Firm
TO THE BOARD OF TRUSTEES OF THE FEDERATED EQUITY FUNDS AND SHAREHOLDERS OF FEDERATED MARKET OPPORTUNITY FUND:
We have audited the accompanying statement of assets and liabilities, including the portfolio of investments, of the Federated Market Opportunity Fund (the “Fund”), a portfolio of Federated Equity Funds, as of October 31, 2009, and the related statement of operations for the period then ended, statements of changes in net assets for each of the years in the two-year period then ended, and financial highlights for each of the years in the four-year period then ended. These financial statements and financial highlights are the responsibility of the Fund's management. Our responsibility is to express an opinion on these financial statements and financial highlights based on our audits. The financial highlights for the period presented prior to November 1, 2005, was audited by other independent registered public accountants whose report thereon dated December 20, 2005, expressed an unqualified opinion on those statements.
We conducted our audits in accordance with the standards of the Public Company Accounting Oversight Board (United States). Those standards require that we plan and perform the audit to obtain reasonable assurance about whether the financial statements and financial highlights are free of material misstatement. An audit includes examining, on a test basis, evidence supporting the amounts and disclosures in the financial statements. Our procedures included confirmation of securities owned as of October 31, 2009 by correspondence with the custodian and brokers or by other appropriate auditing procedures. An audit also includes assessing the accounting principles used and significant estimates made by management, as well as evaluating the overall financial statement presentation. We believe that our audits provide a reasonable basis for our opinion.
In our opinion, the financial statements and financial highlights referred to above present fairly, in all material respects, the financial position of the Federated Market Opportunity Fund as of October 31, 2009, the results of its operations for the year then ended, changes in its net assets for each of the years in the two-year period then ended, and financial highlights for each of the years in the four-year period then ended, in conformity with U.S. generally accepted accounting principles.
Boston, Massachusetts
December 24, 2009
Annual Shareholder Report40
Board of Trustees and Trust Officers
The Board is responsible for managing the Trust's business affairs and for exercising all the Trust's powers except those reserved for the shareholders. The following tables give information about each Board member and the senior officers of the Fund. Where required, the tables separately list Board members who are “interested persons” of the Fund (i.e., “Interested” Board members) and those who are not (i.e., “Independent” Board members). Unless otherwise noted, the address of each person listed is Federated Investors Tower, 1001 Liberty Avenue, Pittsburgh, PA 15222. The address of all Independent Board members listed is 4000 Ericsson Drive, Warrendale, PA 15086-7561; Attention: Mutual Fund Board. As of December 31, 2008, the Trust comprised ten portfolios, and the Federated Fund Complex consisted of 40 investment companies (comprising 149 portfolios). Unless otherwise noted, each Officer is elected annually. Unless otherwise noted, each Board member oversees all portfolios in the Federated Fund Complex and serves for an indefinite term. The Fund's Statement of Additional Information includes additional information about Trust Trustees and is available, without charge and upon request, by calling 1-800-341-7400.
Interested TRUSTEES Background
Name
Birth Date
Positions Held with Trust
Date Service Began | Principal Occupation(s) for Past Five Years,
Other Directorships Held and Previous Position(s) |
John F. Donahue*
Birth Date: July 28, 1924
TRUSTEE
Began serving: April 1984 | Principal Occupations: Director or Trustee of the Federated Fund Complex; Chairman and Director, Federated Investors, Inc.; Chairman of the Federated Fund Complex's Executive Committee.
Previous Positions: Chairman of the Federated Fund Complex; Trustee, Federated Investment Management Company; Chairman and Director, Federated Investment Counseling. |
J. Christopher Donahue*
Birth Date: April 11, 1949
PRESIDENT AND TRUSTEE
Began serving: January 2000 | Principal Occupations: Principal Executive Officer and President of the Federated Fund Complex; Director or Trustee of some of the Funds in the Federated Fund Complex; President, Chief Executive Officer and Director, Federated Investors, Inc.; Chairman and Trustee, Federated Investment Management Company; Trustee, Federated Investment Counseling; Chairman and Director, Federated Global Investment Management Corp.; Chairman, Federated Equity Management Company of Pennsylvania and Passport Research, Ltd. (investment advisory subsidiary of Federated); Trustee, Federated Shareholder Services Company; Director, Federated Services Company.
Previous Positions: President, Federated Investment Counseling; President and Chief Executive Officer, Federated Investment Management Company, Federated Global Investment Management Corp. and Passport Research, Ltd. |
| * | Family relationships and reasons for “interested” status: John F. Donahue is the father of J. Christopher Donahue; both are “interested” due to their beneficial ownership of shares of Federated Investors, Inc. and the positions they hold with Federated and its subsidiaries. |
Annual Shareholder Report41
INDEPENDENT TRUSTEES Background
Name
Birth Date
Positions Held with Trust
Date Service Began | Principal Occupation(s) for Past Five Years,
Other Directorships Held and Previous Position(s) |
John T. Conroy, Jr., Ph.D.
Birth Date: June 23, 1937
TRUSTEE
Began serving: November 1991 | Principal Occupations: Director or Trustee of the Federated Fund Complex; Chairman of the Board, Investment Properties Corporation; Partner or Trustee in private real estate ventures in Southwest Florida; Assistant Professor in Theology, Blessed Edmund Rice School for Pastoral Ministry.
Previous Positions: President, Investment Properties Corporation; Senior Vice President, John R. Wood and Associates, Inc., Realtors; President, Naples Property Management, Inc. and Northgate Village Development Corporation. |
Nicholas P. Constantakis
Birth Date: September 3, 1939
TRUSTEE
Began serving: February 1998 | Principal Occupation: Director or Trustee of the Federated Fund Complex.
Other Directorship Held: Director and Chairman of the Audit Committee, Michael Baker Corporation (architecture, engineering and construction services).
Previous Position: Partner, Andersen Worldwide SC. |
John F. Cunningham
Birth Date: March 5, 1943
TRUSTEE
Began serving: January 1999 | Principal Occupation: Director or Trustee of the Federated Fund Complex.
Other Directorships Held: Chairman, President and Chief Executive Officer, Cunningham & Co., Inc. (strategic business consulting); Trustee Associate, Boston College.
Previous Positions: Director, Redgate Communications and EMC Corporation (computer storage systems); Chairman of the Board and Chief Executive Officer, Computer Consoles, Inc.; President and Chief Operating Officer, Wang Laboratories; Director, First National Bank of Boston; Director, Apollo Computer, Inc. |
Maureen Lally-Green
Birth Date: July 5, 1949
TRUSTEE
Began serving: August 2009 | Principal Occupations: Director or Trustee of the Federated Fund Complex; Director, Office of Church Relations, Diocese of Pittsburgh; Adjunct Professor of Law, Duquesne University School of Law.
Other Directorships Held: Director, Auberle; Trustee St. Francis University; Director, Ireland Institute of Pittsburgh; Director, UPMC Mercy Hospital; Regent, St. Vincent Seminary; Director, Epilepsy Foundation of Western and Central Pennsylvania; Director, Saint Thomas More Society, Allegheny County; Director, Carlow University.
Previous Position: Pennsylvania Superior Court Judge. |
Annual Shareholder Report42
Name
Birth Date
Positions Held with Trust
Date Service Began | Principal Occupation(s) for Past Five Years,
Other Directorships Held and Previous Position(s) |
Peter E. Madden
Birth Date: March 16, 1942
TRUSTEE
Began serving: November 1991 | Principal Occupation: Director or Trustee and Chairman of the Board of the Federated Fund Complex.
Other Directorship Held: Board of Overseers, Babson College.
Previous Positions: Representative, Commonwealth of Massachusetts General Court; President, Chief Operating Officer and Director, State Street Bank and Trust Company and State Street Corporation (retired); Director, VISA USA and VISA International; Chairman and Director, Massachusetts Bankers Association; Director, Depository Trust Corporation; Director, The Boston Stock Exchange. |
Charles F. Mansfield, Jr.
Birth Date: April 10, 1945
TRUSTEE
Began serving: January 1999 | Principal Occupations: Director or Trustee and Chairman of the Audit Committee of the Federated Fund Complex; Management Consultant.
Previous Positions: Chief Executive Officer, PBTC International Bank; Partner, Arthur Young & Company (now Ernst & Young LLP); Chief Financial Officer of Retail Banking Sector, Chase Manhattan Bank; Senior Vice President, HSBC Bank USA (formerly, Marine Midland Bank); Vice President, Citibank; Assistant Professor of Banking and Finance, Frank G. Zarb School of Business, Hofstra University; Executive Vice President DVC Group, Inc. (marketing, communications and technology). |
R. James Nicholson
Birth Date: February 4, 1938
TRUSTEE
Began serving: April 2008 | Principal Occupations: Director or Trustee of the Federated Fund Complex; Senior Counsel, Brownstein Hyatt Farber Schrek, P.C.; Former Secretary of the U.S. Dept. of Veterans Affairs; Former U.S. Ambassador to the Holy See; Former Chairman of the Republican National Committee.
Other Directorships Held: Director, Horatio Alger Association; Director, The Daniels Fund.
Previous Positions: Colonel, U.S. Army Reserve; Partner, Calkins, Kramer, Grimshaw and Harring, P.C.; General Counsel, Colorado Association of Housing and Building; Chairman and CEO, Nicholson Enterprises, Inc. (real estate holding company); Chairman and CEO, Renaissance Homes of Colorado. |
Thomas M. O'Neill
Birth Date: June 14, 1951
TRUSTEE
Began serving: October 2006 | Principal Occupations: Director or Trustee of the Federated Fund Complex; Managing Director and Partner, Navigator Management Company, L.P. (investment and strategic consulting).
Other Directorships Held: Board of Overseers, Children's Hospital of Boston; Visiting Committee on Athletics, Harvard College.
Previous Positions: Chief Executive Officer and President, Managing Director and Chief Investment Officer, Fleet Investment Advisors; President and Chief Executive Officer, Aeltus Investment Management, Inc.; General Partner, Hellman, Jordan Management Co., Boston, MA; Chief Investment Officer, The Putnam Companies, Boston, MA; Credit Analyst and Lending Officer, Fleet Bank; Director and Consultant, EZE Castle Software (investment order management software); Director, Midway Pacific (lumber). |
Annual Shareholder Report43
Name
Birth Date
Positions Held with Trust
Date Service Began | Principal Occupation(s) for Past Five Years,
Other Directorships Held and Previous Position(s) |
John S. Walsh
Birth Date: November 28, 1957
TRUSTEE
Began serving: January 1999 | Principal Occupations: Director or Trustee of the Federated Fund Complex; President and Director, Heat Wagon, Inc. (manufacturer of construction temporary heaters); President and Director, Manufacturers Products, Inc. (distributor of portable construction heaters); President, Portable Heater Parts, a division of Manufacturers Products, Inc.
Previous Position: Vice President, Walsh & Kelly, Inc. |
James F. Will
Birth Date: October 12, 1938
TRUSTEE
Began serving: April 2006 | Principal Occupations: Director or Trustee of the Federated Fund Complex; formerly, Vice Chancellor and President, Saint Vincent College.
Other Directorships Held: Trustee, Saint Vincent College; Alleghany Corporation.
Previous Positions: Chairman, President and Chief Executive Officer, Armco, Inc.; President and Chief Executive Officer, Cyclops Industries; President and Chief Operating Officer, Kaiser Steel Corporation. |
OFFICERS
Name
Birth Date
Address
Positions Held with Trust
Date Service Began | Principal Occupation(s) for Past Five Years
and Previous Position(s) |
John W. McGonigle
Birth Date: October 26, 1938
EXECUTIVE VICE PRESIDENT AND SECRETARY
Began serving: April 1984 | Principal Occupations: Executive Vice President and Secretary of the Federated Fund Complex; Vice Chairman, Executive Vice President, Secretary and Director, Federated Investors, Inc.
Previous Positions: Trustee, Federated Investment Management Company and Federated Investment Counseling; Director, Federated Global Investment Management Corp., Federated Services Company and Federated Securities Corp. |
Richard A. Novak
Birth Date: December 25, 1963
TREASURER
Began serving: January 2006 | Principal Occupations: Principal Financial Officer and Treasurer of the Federated Fund Complex; Senior Vice President, Federated Administrative Services; Financial and Operations Principal for Federated Securities Corp., Edgewood Services, Inc. and Southpointe Distribution Services, Inc.
Previous Positions: Controller of Federated Investors, Inc.; Vice President, Finance of Federated Services Company; held various financial management positions within The Mercy Hospital of Pittsburgh; Auditor, Arthur Andersen & Co. |
Richard B. Fisher
Birth Date: May 17, 1923
VICE PRESIDENT
Began serving: April 1984 | Principal Occupations: Vice Chairman or Vice President of some of the Funds in the Federated Fund Complex; Vice Chairman, Federated Investors, Inc.; Chairman, Federated Securities Corp.
Previous Positions: President and Director or Trustee of some of the Funds in the Federated Fund Complex; Executive Vice President, Federated Investors, Inc.; Director and Chief Executive Officer, Federated Securities Corp. |
Annual Shareholder Report44
Name
Birth Date
Address
Positions Held with Trust
Date Service Began | Principal Occupation(s) for Past Five Years
and Previous Position(s) |
Brian P. Bouda
Birth Date: February 28, 1947
CHIEF COMPLIANCE OFFICER AND SENIOR VICE PRESIDENT
Began serving: August 2004 | Principal Occupations: Senior Vice President and Chief Compliance Officer of the Federated Fund Complex; Vice President and Chief Compliance Officer of Federated Investors, Inc. and Chief Compliance Officer of its subsidiaries. Mr. Bouda joined Federated in 1999 and is a member of the American Bar Association and the State Bar Association of Wisconsin. |
Stephen F. Auth
Birth Date: September 3, 1956
450 Lexington Avenue
Suite 3700
New York, NY 10017-3943
CHIEF INVESTMENT OFFICER
Began serving: November 2002 | Principal Occupations: Mr. Auth is Chief Investment Officer of this Fund and various other Funds in the Federated Fund Complex; Executive Vice President, Federated Investment Counseling, Federated Global Investment Management Corp. and Federated Equity Management Company of Pennsylvania.
Previous Positions: Executive Vice President, Federated Investment Management Company, and Passport Research, Ltd. (investment advisory subsidiary of Federated); Senior Vice President, Global Portfolio Management Services Division; Senior Vice President, Federated Investment Management Company and Passport Research, Ltd.; Senior Managing Director and Portfolio Manager, Prudential Investments. |
Lawrence Auriana
Birth Date: January 8, 1944
140 East 45th Street
New York, NY 10017
VICE PRESIDENT
Began serving: November 2001 | Principal Occupations: Lawrence Auriana is Vice President of the Trust. Mr. Auriana joined Federated in April 2001 as Co-Head of Investments/Federated Kaufmann. From August 1984 to April 2001, Mr. Auriana was President and Treasurer of Edgemont Asset Management Corp., and Chairman of the Board and Portfolio Manager to The Kaufmann Fund, Inc. (predecessor to the Federated Kaufmann Fund). Mr. Auriana earned a B.S. in economics from Fordham University and has been engaged in the securities business since 1965. |
Walter C. Bean
Birth Date: June 22, 1945
VICE PRESIDENT
Began serving: November 2006 | Principal Occupations: Walter C. Bean is Vice President of the Trust. Mr. Bean is a Senior Vice President, Senior Portfolio Manager and the Head of the Equity Income Management Team of the Fund's Adviser. Mr. Bean joined Federated in 2000. His previous associations included: various investment management and research positions with C.S. McKee & Company; First Chicago Investment Advisors; CIGNA Investment Advisors; and Mellon Bank. Mr. Bean earned a Bachelors Degree in Business Administration from Ohio University and an M.B.A. from the Pennsylvania State University. Mr. Bean is a Chartered Financial Analyst and has 40 years of investment experience. |
Hans P. Utsch
Birth Date: July 3, 1936
140 East 45th Street
New York, NY 10017
VICE PRESIDENT
Began serving: November 2001 | Principal Occupations: Hans P. Utsch is Vice President of the Trust. Mr. Utsch joined Federated in April 2001 as Co-Head of Investments/Federated Kaufmann. From August 1984 to April 2001, Mr. Utsch was Chairman of the Board and Secretary of Edgemont Asset Management Corp., and President and Portfolio Manager to The Kaufmann Fund, Inc. (predecessor to the Federated Kaufmann Fund). Mr. Utsch graduated from Amherst College and holds an M.B.A. from Columbia University. He has been engaged in the securities business since 1962. |
Annual Shareholder Report45
Evaluation and Approval of Advisory Contract - May 2009
Federated Market Opportunity Fund (the “Fund”)
The Fund's Board reviewed the Fund's investment advisory and subadvisory contracts at meetings held in May 2009. The Board's decision regarding these contracts reflects the exercise of its business judgment on whether to continue the existing arrangements.
In this connection, the Federated funds' Board had previously appointed a Senior Officer, whose duties include specified responsibilities relating to the process by which advisory fees are to be charged to a Federated fund. The Senior Officer has the authority to retain consultants, experts, or staff as may be reasonably necessary to assist in the performance of his duties, reports directly to the Board, and may be terminated only with the approval of a majority of the independent members of the Board. The Senior Officer prepared and furnished to the Board an independent, written evaluation that covered topics discussed below. The Board considered that evaluation, along with other information, in deciding to approve the advisory and subadvisory contracts.
During its review of these contracts, the Board considered compensation and benefits received by the Adviser and subadviser. This included the fees received for services provided to the Fund by other entities in the Federated organization and research services received by the Adviser from brokers that execute Federated fund trades, as well as advisory fees. The Board is also familiar with and considered judicial decisions concerning allegedly excessive investment advisory fees, which have indicated that the following factors may be relevant to an Adviser's fiduciary duty with respect to its receipt of compensation from a fund: the nature and quality of the services provided by the Adviser, including the performance of the fund; the Adviser's cost of providing the services; the extent to which the Adviser may realize “economies of scale” as a fund grows larger; any indirect benefits that may accrue to the Adviser and its affiliates as a result of the Adviser's relationship with a fund; performance and expenses of comparable funds; and the extent to which the independent Board members are fully informed about all facts the Board deems relevant bearing on the Adviser's services and fees. The Board further considered management fees (including any components thereof) charged to institutional and other clients of the Adviser and subadviser for what might be viewed as like services, and the cost to the Adviser and its affiliates of supplying services pursuant to the management fee agreements, excluding any intra-corporate profit and profit margins of the Adviser and its affiliates for supplying such services. The Board was aware of these factors and was guided by them in its review of the Fund's advisory and subadvisory contracts to the extent it considered them to be appropriate and relevant, as discussed further below.
Annual Shareholder Report46
The Board considered and weighed these circumstances in light of its substantial accumulated experience in governing the Fund and working with Federated on matters relating to the Federated funds, and was assisted in its deliberations by independent legal counsel. Throughout the year, the Board has requested and received substantial and detailed information about the Fund and the Federated organization that was in addition to the extensive materials that comprise and accompany the Senior Officer's evaluation. Federated provided much of this information at each regular meeting of the Board, and furnished additional reports in connection with the particular meeting at which the Board's formal review of the advisory and subadvisory contracts occurred. Between regularly scheduled meetings, the Board also received information on particular matters as the need arose. Thus, the Board's consideration of the advisory and subadvisory contracts included review of the Senior Officer's evaluation, accompanying data and additional reports covering such matters as: the Adviser's and subadviser's investment philosophy, revenue, profitability, personnel and processes; investment and operating strategies; the Fund's short- and long-term performance (in absolute terms, both on a gross basis and net of expenses, as well as in relationship to its particular investment program and certain competitor or “peer group” funds and/or other benchmarks, as appropriate), and comments on the reasons for performance; the Fund's investment objectives; the Fund's expenses (including the advisory fee itself and the overall expense structure of the Fund, both in absolute terms and relative to similar and/or competing funds, with due regard for contractual or voluntary expense limitations); the use and allocation of brokerage commissions derived from trading the Fund's portfolio securities (if any); and the nature, quality and extent of the advisory and other services provided to the Fund by the Adviser and its affiliates. The Board also considered the preferences and expectations of Fund shareholders and their relative sophistication; the continuing state of competition in the mutual fund industry and market practices; the range of comparable fees for similar funds in the mutual fund industry; the Fund's relationship to the Federated family of funds which include a comprehensive array of funds with different investment objectives, policies and strategies which are available for exchange without the incurrence of additional sales charges; compliance and audit reports concerning the Federated funds and the Federated companies that service them (including communications from regulatory agencies), as well as Federated's responses to any issues raised therein; and relevant developments in the mutual fund industry and how the Federated funds and/or Federated are responding to them. The Board's evaluation process is evolutionary. The criteria considered and the emphasis placed on relevant criteria change in recognition of changing circumstances in the mutual fund marketplace. Annual Shareholder Report47
With respect to the Fund's performance and expenses in particular, the Board has found the use of comparisons to other mutual funds with comparable investment programs to be particularly useful, given the high degree of competition in the mutual fund business. The Board focused on comparisons with other similar mutual funds more heavily than non-mutual fund products or services because it is believed that they are more relevant. For example, other mutual funds are the products most like the Fund, they are readily available to Fund shareholders as alternative investment vehicles, and they are the type of investment vehicle in fact chosen and maintained by the Fund's investors. The range of their fees and expenses therefore appears to be a generally reliable indication of what consumers have found to be reasonable in the precise marketplace in which the Fund competes. The Fund's ability to deliver competitive performance when compared to its peer group was a useful indicator of how the Adviser is executing the Fund's investment program, which in turn assisted the Board in reaching a conclusion that the nature, extent, and quality of the Adviser's investment management services were such as to warrant continuation of the advisory contract. In this regard, the Senior Officer has reviewed Federated's fees for providing advisory services to products outside the Federated family of funds (e.g., institutional and separate accounts). He concluded that mutual funds and institutional accounts are inherently different products. Those differences include, but are not limited to, different types of targeted investors; being subject to different laws and regulations; different legal structures; different average account sizes; different associated costs; different portfolio management techniques made necessary by different cash flows; and portfolio manager time spent in review of securities pricing. The Senior Officer did not consider these fee schedules to be determinative in judging the appropriateness of mutual fund advisory contracts.The Senior Officer reviewed reports compiled by Federated, using data supplied by independent fund ranking organizations, regarding the performance of, and fees charged by, other mutual funds, noting his view that comparisons to fund peer groups are highly important in judging the reasonableness of proposed fees.
For the periods covered by the report, the Fund's performance for the one-year period and the three-year period was above the median of the relevant peer group, and the Fund's performance fell below the median of the relevant peer group for the five-year period. The Board discussed the Fund's performance with the Adviser and recognized the efforts being undertaken by the Adviser. The Board will continue to monitor these efforts and the performance of the Fund.
The Board also received financial information about Federated, including reports on the compensation and benefits Federated derived from its relationships with the Federated funds. These reports covered not only the fees under the advisory contracts, but also fees received by Federated's subsidiaries for providing other services to the Federated funds under separate contracts Annual Shareholder Report48
(e.g., for serving as the Federated funds' administrator). The reports also discussed any indirect benefit Federated may derive from its receipt of research services from brokers who execute Federated fund trades. In addition, the Board considered the fact that, in order for a fund to be competitive in the marketplace, Federated and its affiliates frequently waived fees and/or reimbursed expenses and have disclosed to fund investors and/or indicated to the Board their intention to do so in the future, where appropriate. Moreover, the Board receives regular reports regarding the institution or elimination of these voluntary waivers.Federated furnished reports, requested by the Senior Officer, that reported revenues on a fund-by-fund basis and made estimates of the allocation of expenses on a fund-by-fund basis, using allocation methodologies specified by the Senior Officer. The Senior Officer noted that, although they may apply consistent allocation processes, the inherent difficulties in allocating costs (and the unavoidable arbitrary aspects of that exercise) and the lack of consensus on how to allocate those costs may render such allocation reports unreliable. The allocation reports were considered in the analysis by the Board but were determined to be of limited use.
The Board and the Senior Officer also reviewed a report compiled by Federated comparing profitability information for Federated to other publicly held fund management companies. In this regard, the Senior Officer noted the limited availability of such information, but nonetheless concluded that Federated's profit margins did not appear to be excessive and the Board agreed.
The Senior Officer's evaluation also discussed the notion of possible realization of “economies of scale” as a fund grows larger. The Board considered in this regard that the Adviser has made significant and long-term investments in areas that support all of the Federated funds, such as personnel and processes for the portfolio management, compliance, and risk management functions; and systems technology; and that the benefits of these efforts (as well as any economies, should they exist) were likely to be enjoyed by the fund complex as a whole. Finally, the Board also noted the absence of any applicable regulatory or industry guidelines on this subject, which (as discussed in the Senior Officer's evaluation) is compounded by the lack of any common industry practice or general pattern with respect to structuring fund advisory fees with “breakpoints” that serve to reduce the fee as the fund attains a certain size. The Senior Officer did not recommend institution of breakpoints in pricing Federated's fund advisory services at this time.
It was noted in the materials for the Board meeting that for the period covered by the report, the Fund's investment advisory fee, after waivers and expense reimbursements, if any, was above the median of the relevant peer group. The Board reviewed the fees and other expenses of the Fund with the Adviser and was satisfied that the overall expense structure of the Fund remained competitive. The Board will continue to monitor advisory fees and other expenses borne by the Fund.
Annual Shareholder Report49
The Senior Officer's evaluation noted his belief that the information and observations contained in his evaluation supported a finding that the proposed management fees are reasonable, and that Federated appeared to provide appropriate administrative services to the Fund for the fees paid. Under these circumstances, no changes were recommended to, and no objection was raised to, the continuation of the Fund's advisory and subadvisory contracts. The Board concluded that the nature, quality and scope of services provided the Fund by the Adviser and its affiliates were satisfactory.In its decision to continue an existing investment advisory contract, the Board was mindful of the potential disruptions of the Fund's operations and various risks, uncertainties and other effects that could occur as a result of a decision to terminate or not renew an advisory contract. In particular, the Board recognized that many shareholders have invested in the Fund on the strength of the Adviser's industry standing and reputation and with the expectation that the Adviser will have a continuing role in providing advisory services to the Fund. Thus, the Board's approval of the advisory contract reflected the fact that it is the shareholders who have effectively selected the Adviser by virtue of having invested in the Fund.
The Board based its decision to approve the advisory and subadvisory contracts on the totality of the circumstances and relevant factors and with a view to past and future long-term considerations. Not all of the factors and considerations identified above were necessarily relevant to the Fund, nor did the Board consider any one of them to be determinative. With respect to the factors that were relevant, the Board's decision to approve the contract reflects its determination that Federated's performance and actions provided a satisfactory basis to support the decision to continue the existing arrangements.
Annual Shareholder Report50
Voting Proxies on Fund Portfolio Securities
A description of the policies and procedures that the Fund uses to determine how to vote proxies, if any, relating to securities held in the Fund's portfolio is available, without charge and upon request, by calling 1-800-341-7400. A report on “Form N-PX” of how the Fund voted any such proxies during the most recent 12-month period ended June 30 is available from Federated's Web site at FederatedInvestors.com. To access this information from the “Products” section of the Web site, click on the “Prospectuses and Regulatory Reports” link under “Related Information,” then select the appropriate link opposite the name of the Fund; or select the name of the Fund and from the Fund's page, click on the “Prospectuses and Regulatory Reports” link. Form N-PX filings are also available at the SEC's Web site at www.sec.gov.
Quarterly Portfolio Schedule
The Fund files with the SEC a complete schedule of its portfolio holdings, as of the close of the first and third quarters of its fiscal year, on “Form N-Q.” These filings are available on the SEC's Web site at www.sec.gov and may be reviewed and copied at the SEC's Public Reference Room in Washington, DC. (Call 1-800-SEC-0330 for information on the operation of the Public Reference Room.) You may also access this information from the “Products” section of Federated's Web site at FederatedInvestors.com by clicking on “Portfolio Holdings” under “Related Information,” then selecting the appropriate link opposite the name of the Fund; or select the name of the Fund and from the Fund's page, click on the “Portfolio Holdings” link.
Annual Shareholder Report51
Mutual funds are not bank deposits or obligations, are not guaranteed by any bank and are not insured or guaranteed by the U.S. government, the Federal Deposit Insurance Corporation, the Federal Reserve Board or any other government agency. Investment in mutual funds involves investment risk, including the possible loss of principal.
This Report is authorized for distribution to prospective investors only when preceded or accompanied by the Fund's Prospectus, which contains facts concerning its objective and policies, management fees, expenses and other information.
Federated Market Opportunity Fund
Federated Investors Funds
4000 Ericsson Drive
Warrendale, PA 15086-7561
Contact us at FederatedInvestors.com
or call 1-800-341-7400.
Federated Securities Corp., Distributor
Cusip 314172743
Cusip 314172735
Cusip 314172727
26852 (12/09)
Federated is a registered mark of Federated Investors, Inc.
2009 Federated Investors, Inc.
Federated Market Opportunity Fund
A Portfolio of Federated Equity Funds
ANNUAL SHAREHOLDER REPORTOctober 31, 2009
Institutional Shares
FINANCIAL HIGHLIGHTS
SHAREHOLDER EXPENSE EXAMPLE
MANAGEMENT'S DISCUSSION OF FUND PERFORMANCE
PORTFOLIO OF INVESTMENTS SUMMARY TABLES
PORTFOLIO OF INVESTMENTS
STATEMENT OF ASSETS AND LIABILITIES
STATEMENT OF OPERATIONS
STATEMENT OF CHANGES IN NET ASSETS
NOTES TO FINANCIAL STATEMENTS
REPORT OF INDEPENDENT REGISTERED PUBLIC ACCOUNTING FIRM
BOARD OF TRUSTEES AND TRUST OFFICERS
EVALUATION AND APPROVAL OF ADVISORY CONTRACT
VOTING PROXIES ON FUND PORTFOLIO SECURITIES
QUARTERLY PORTFOLIO SCHEDULE
Financial Highlights - Institutional Shares
(For a Share Outstanding Throughout Each Period)
| Year Ended October 31, | Period
Ended
10/31/20071 |
| 2009 | 2008 |
| Net Asset Value, Beginning of Period | $10.29 | $12.23 | $12.16 |
| Income From Investment Operations: | | | |
| Net investment income | 0.232 | 0.502 | 0.172 |
| Net realized and unrealized gain (loss) on investments, short sales, futures contracts, written options and foreign currency transactions | 1.08 | (1.88) | 0.003 |
| TOTAL FROM INVESTMENT OPERATIONS | 1.31 | (1.38) | 0.17 |
| Less Distributions: | | | |
| Distributions from net investment income | (0.46) | (0.56) | (0.10) |
| Net Asset Value, End of Period | $11.14 | $10.29 | $12.23 |
| Total Return4 | 13.12% | (11.95)% | 1.43% |
| Ratios to Average Net Assets: | | | |
| Net expenses | 1.22%5 | 0.95%5 | 0.97%5,6 |
| Net expenses excluding dividends on short positions | 0.99%5 | 0.95%5 | 0.97%5,6 |
| Net investment income | 2.05% | 4.62% | 4.30%6 |
| Expense waiver/reimbursement7 | 0.07% | 0.04% | 0.03%6 |
| Supplemental Data: | | | |
| Net assets, end of period (000 omitted) | $81,473 | $6,551 | $484 |
| Portfolio turnover | 191% | 255% | 79%8 |
| 1 | Reflects operations for the period from June 29, 2007 (date of initial investment) to October 31, 2007. |
| 2 | Per share numbers have been calculated using the average shares method. |
| 3 | Represents less than $0.01. |
| 4 | Based on net asset value, which does not reflect the sales charge, redemption fee or contingent deferred sales charge, if applicable. Total returns for periods of less than one year are not annualized. |
| 5 | The net expense ratio is calculated without reduction for expense offset arrangements. The net expense ratios are 1.21%, 0.95% and 0.97%, after taking into account these expense reductions for the years ended October 31, 2009 and 2008, and the period ended October 31, 2007, respectively. The net expense ratios excluding dividends on short positions are also calculated without reduction for these expense offset arrangements. |
| 6 | Computed on an annualized basis. |
| 7 | This expense decrease is reflected in both the net expense and net investment income ratios shown above. |
| 8 | Portfolio turnover is calculated at the Fund level. Percentage indicated was calculated for the fiscal year ended October 31, 2007. |
- See Notes which are an integral part of the Financial Statements
Annual Shareholder Report1
Shareholder Expense Example (unaudited)
As a shareholder of the Fund, you incur ongoing costs, including management fees and to the extent applicable, distribution (12b-1) fees and/or shareholder services fees and other Fund expenses. This Example is intended to help you to understand your ongoing costs (in dollars) of investing in the Fund and to compare these costs with the ongoing costs of investing in other mutual funds. It is based on an investment of $1,000 invested at the beginning of the period and held for the entire period from May 1, 2009 to October 31, 2009.
ACTUAL EXPENSES
The first section of the table below provides information about actual account values and actual expenses. You may use the information in this section, together with the amount you invested, to estimate the expenses that you incurred over the period. Simply divide your account value by $1,000 (for example, an $8,600 account value divided by $1,000 = 8.6), then multiply the result by the number in the first section under the heading entitled “Expenses Paid During Period” to estimate the expenses attributable to your investment during this period.
HYPOTHETICAL EXAMPLE FOR COMPARISON PURPOSES
The second section of the table below provides information about hypothetical account values and hypothetical expenses based on the Fund's actual expense ratio and an assumed rate of return of 5% per year before expenses, which is not the Fund's actual return. Thus, you should not use the hypothetical account values and expenses to estimate the actual ending account balance or your expenses for the period. Rather, these figures are required to be provided to enable you to compare the ongoing costs of investing in the Fund with other funds. To do so, compare this 5% hypothetical example with the 5% hypothetical examples that appear in the shareholder reports of the other funds.
Annual Shareholder Report2
Please note that the expenses shown in the table are meant to highlight your ongoing costs only. Therefore, the second section of the table is useful in comparing ongoing costs only, and will not help you determine the relative total costs of owning different funds. | Beginning
Account Value
5/1/2009 | Ending
Account Value
10/31/2009 | Expenses Paid
During Period1 |
| Actual | $1,000 | $1,023.00 | $6.42 |
Hypothetical (assuming a 5% return
before expenses) | $1,000 | $1,018.85 | $6.41 |
| 1 | Expenses are equal to the Fund's annualized net expense ratio of 1.26%, multiplied by the average account value over the period, multiplied by 184/365 (to reflect the one-half-year period). |
Annual Shareholder Report3
Performance data quoted represents past performance which is no guarantee of future results. Investment return and principal value will fluctuate so that an investor's shares, when redeemed, may be worth more or less than their original cost. Mutual fund performance changes over time and current performance may be lower or higher than what is stated. For current to the most recent month-end performance and after-tax returns, visit FederatedInvestors.com or call 1-800-341-7400.
Management's Discussion of Fund Performance (unaudited)
During the 12-month reporting period ended October 31, 2009, the Fund produced a total return of 13.12%,1 based on net asset value. The total return for the Fund's benchmark of 70% Russell 3000 Value Index/30% U.S. Treasury 3-month bill was 3.94%.2 The return of the Russell 3000 Value Index, a broad-based market index, for the 12-month reporting period was 4.56%. The Fund's total return reflected actual cash flows, transaction costs and other expenses which were not reflected in the total return of the index.
MARKET OVERVIEW
The reporting period was a tale of two markets. The fiscal year started with global economies falling further into recession. Equity markets hit record high levels of volatility and suffered significant losses. In response, governments around the world coordinated efforts on interest-rate cuts and implemented a variety of capital- and financial-guarantee programs aimed at restoring the functioning of credit markets. The Federal Reserve Board, for example, lowered the federal funds target rate to a historic low, a range between 0% and 0.25%. The stock market bottomed in early March, about half way through the Fund's fiscal year.
The second half of the year featured an extraordinarily strong rally in stock prices. The Standard & Poor's 500 Index3 (S&P 500 Index) rallied 64% from the early March low to its high late in the fiscal year. The rally was supported by improved economic reports, as government stimulus measures helped third-quarter Gross Domestic Product rise by 3.5%. The S&P 500 Index ended the entire reporting period with a return of 9.80%.
| 1 | For the period prior to the Institutional Share's inception, performance shown is for the Fund's Class A Shares. The performance for Class A Shares has not been adjusted to reflect the expenses of the Institutional Shares, since the Institutional Shares are estimated to have a lower expense ratio than the expense ratio of the Class A Shares. The performance of the Class A Shares has been adjusted to remove any voluntary waiver of Fund expenses related to the Class A Shares that may have occurred during the period prior to commencement of operations of the Institutional Shares. |
| 2 | The 70% Russell 3000 Value Index/30% Merrill Lynch 91 Day Treasury Bill Index measures the performance of those Russell 3000 Index companies with lower price-to-book ratios and lower forecasted growth values. The stocks in this index are also members of either the Russell 1000 Value or the Russell 2000 Value indexes. Merrill Lynch 91 Day Treasury Bill Index measures the return on U.S. Treasury Bills maturing in 90 days. Indexes are unmanaged and it is not possible to invest directly in an index. |
| 3 | The S&P 500 Index is an unmanaged, capitalization-weighted index of 500 stocks designed to measure performance of the broad domestic economy through changes in the aggregate market value of 500 stocks representing all major industries. It is not possible to invest directly in an index. |
Annual Shareholder Report4
FUND PERFORMANCE
The Fund had a strong return for the fiscal year. After the initial equity market collapse, valuations on stocks appeared much more compelling, and the Fund's managers substantially increased the Fund's equity holdings. This increased exposure to the stock market generated large gains for the portfolio.
As the sharp rebound in stock prices advanced later in the fiscal year, the Fund's managers reduced the Fund's net exposure to the stock market and eventually took a net short position late in the fiscal year, in anticipation of a decline in stock prices.4 The rationale for the strategy shift was that the history of stock market bubbles, and of stock market valuations in general, supported a highly risk-averse strategy. With economic and financial conditions still precarious in Fund management's assessment, there was substantial fundamental support for this strategy. Since stock prices continued to rise sharply into the end of the fiscal year, however, this negative (short) position relative to stock prices resulted in losses to the portfolio. Despite that, the Fund's fiscal-year performance significantly exceeded that of its benchmark.
Among the Fund's equity sector returns, virtually all had positive returns for the fiscal year. Gold stocks were the strongest performing sector for the fund. Gold stock prices were at historically low levels compared to the price of gold bullion at the start of the reporting period. This, combined with gold bullion prices hitting record highs at the end of the reporting period, produced significant returns for gold stocks.5 Materials and Energy stocks also were especially strong, as they rebounded significantly from their lows after the commodity bubble popped in the fall of 2008. Currency forward contracts and international government debt holdings also added to the Fund's returns, while short stock and stock index futures positions resulted in losses.6 With the Fund now being able to invest directly in gold bullion, a small position was added late in the reporting period.
| 4 | The Fund may make short sales of securities, which involves unlimited risk including the possibility that losses may exceed the original amount invested. |
| 5 | Investments in gold and precious metals may be subject to additional risks. The Fund's investments in gold bullion may involve higher custody and transaction costs that investments in securities. |
| 6 | International investing involves special risks including currency risks, increased volatility, political risks and differences in audition and other financial standards. |
Annual Shareholder Report5
GROWTH OF A $10,000 INVESTMENT - INSTITUTIONAL SHARES
The Fund's Institutional Shares commenced operations on June 29, 2007. The Fund offers three other classes of shares: Class A Shares, Class B Shares and Class C Shares. For the period prior to commencement of operations of the Institutional Shares, the performance information shown is for the Fund's Class A Shares. The performance for Class A Shares has not been adjusted to reflect the expenses of the Institutional Shares since the Institutional Shares are estimated to have a lower expense ratio than the expense ratio of the Class A Shares. The performance of the Class A Shares has been adjusted to remove any voluntary waiver of Fund expenses related to the Class A Shares that may have occurred during the period prior to commencement of operations of the Institutional Shares. The graph below illustrates the hypothetical investment of $10,0001 in Federated Market Opportunity Fund (Institutional Shares) (the “Fund”) from December 4, 2000 (start of performance) to October 31, 2009, compared to the Russell 3000 Value Index (R3000V)2 and the 70% Russell 3000 Value Index/30% Merrill Lynch 91 Day Treasury Bill Index (70%R3000V/30%ML91DTB).2
| Average Annual Total Returns for the Period Ended 10/31/2009 | |
| 1 Year | 13.12% |
| 5 Years | 1.19% |
| Start of Performance (12/4/2000) | 5.68% |
| 1 | The Fund's performance assumes the reinvestment of all dividends and distributions. The R3000V and the 70%R3000V/30%ML91DTB have been adjusted to reflect reinvestment of dividends on securities in the indexes. |
| 2 | The R3000V measures the performance of those Russell 3000 Index companies with lower price-to-book ratios and lower forecasted growth values. The stocks in this index are also members of either the Russell 1000 Value or the Russell 2000 Value indexes. The ML91DTB is an index tracking short-term U.S. government securities. The R3000V and the 70%R3000V/30%ML91DTB are not adjusted to reflect expenses or other fees that the Securities and Exchange Commission (SEC) requires to be reflected in the Fund's performance. The indexes are unmanaged and, unlike the Fund, are not affected by cash flows. It is not possible to invest in an index. |
Annual Shareholder Report6
Performance data quoted represents past performance which is no guarantee of future results. Investment return and principal value will fluctuate so that an investor's shares, when redeemed, may be worth more or less than their original cost. Mutual fund performance changes over time and current performance may be lower or higher than what is stated. For current to the most recent month-end performance and after-tax returns, visit FederatedInvestors.com or call 1-800-341-7400. Returns shown do not reflect the deduction of taxes that a shareholder would pay on Fund distributions or the redemption of Fund shares. Mutual funds are not obligations of or guaranteed by any bank and are not federally insured.
Annual Shareholder Report7
Portfolio of Investments Summary
Tables (unaudited)
At October 31, 2009, the Fund's portfolio composition1 was as follows:
| Percentage of
Total Net Assets |
| Securities Sold Short | (56.2)% |
| Futures Contracts — Long (notional value)2 | 14.0% |
| U.S. Treasury Securities Held as Collateral for Securities Sold Short | 25.5% |
| International Equity Securities | 17.4% |
| U.S. Equity Securities | 16.0% |
| Mutual Funds | 2.3% |
| U.S. Treasury Securities | 6.8% |
| International Fixed-Income Securities | 5.8% |
| Other Securities3 | 11.1% |
| Other Derivative Contracts4 | (0.3)% |
| Cash Equivalents5 | 9.8% |
| Adjustment for Futures Contracts (notional value)2 | (14.1)% |
| Collateral on Deposit for Securities Sold Short | 58.6% |
| Other Assets and Liabilities — Net6 | 3.3% |
| TOTAL | 100.0% |
| 1 | See the Fund's Prospectus for a description of the principal types of securities in which the Fund invests. |
| 2 | More complete information regarding the Fund's direct investments in futures contracts, including unrealized appreciation (depreciation), value, and notional values or amounts of such contracts, can be found in the table at the end of the Portfolio of Investments included in this report. |
| 3 | Other Securities include exchange-traded funds, gold bullion and investment funds. |
| 4 | Based upon net unrealized appreciation (depreciation) or value of the derivative contracts as applicable. Other Derivative Contracts may consist of forwards, options and swaps. The impact of a derivative contract on the Fund's performance may be larger than its unrealized appreciation (depreciation) or value may indicate. In many cases, the notional value or amount of a derivative contract may provide a better indication of the contract's significance to the portfolio. More complete information regarding the Fund's direct investments in derivative contracts, including unrealized appreciation (depreciation), value, and notional values or amounts of such contracts, can be found in the table at the end of the Portfolio of Investments included in this report. |
| 5 | Cash Equivalents include any investments in money market mutual funds and/or overnight repurchase agreements. |
| 6 | Assets, other than investments in securities, securities sold short, derivative contracts and collateral on deposit for securities sold short, less liabilities. See Statement of Assets and Liabilities. |
Annual Shareholder Report8
At October 31, 2009, the Fund's sector composition7 for its equity securities was as follows:| Sector Composition | Percentage of
Equity Securities |
| Materials | 27.5% |
| Health Care | 24.4% |
| Energy | 19.2% |
| Consumer Staples | 12.5% |
| Telecommunication Services | 6.2% |
| Information Technology | 4.7% |
| Industrials | 2.9% |
| Consumer Discretionary | 2.6% |
| TOTAL | 100.0% |
At October 31, 2009, the Fund's sector composition7 for its short positions was as follows:
| Sector Composition | Percentage of Total
Securities Sold Short |
| Consumer Discretionary | 34.7% |
| Financials | 12.2% |
| Information Technology | 14.8% |
| Health Care | 6.9% |
| Consumer Staples | 6.8% |
| Industrials | 6.0% |
| Materials | 5.9% |
| Telecommunication Services | 1.8% |
| Energy | 1.6% |
| Other8 | 9.3% |
| TOTAL | 100.0% |
| 7 | Sector classifications are based upon, and individual portfolio securities are assigned to, the classifications of the Global Industry Classification Standard (GICS) except that the adviser assigns a classification to securities not classified by the GICS and to securities for which the adviser does not have access to the classification made by the GICS. |
| 8 | Other includes exchange-traded funds. |
Annual Shareholder Report9
Portfolio of Investments
October 31, 2009
| | | |
| Shares, Foreign Par Amount, Principal Amount or Troy Ounces | | | Value in U.S. Dollars |
| | COMMON STOCKS – 33.5% | |
| | Biotechnology – 4.6% | |
| 410,000 | 1 | Biogen Idec, Inc. | 17,273,300 |
| 390,000 | 1 | Cephalon, Inc. | 21,286,200 |
| 350,000 | 1 | Genzyme Corp. | 17,710,000 |
| 390,000 | 1 | Gilead Sciences, Inc. | 16,594,500 |
| | TOTAL | 72,864,000 |
| | Chemicals – 1.7% | |
| 532,000 | 1 | Intrepid Potash, Inc. | 13,704,320 |
| 270,000 | | The Mosaic Co. | 12,617,100 |
| | TOTAL | 26,321,420 |
| | Commercial Services & Supplies – 1.0% | |
| 330,000 | | Secom Co. Ltd. | 15,433,639 |
| | Energy Equipment & Services – 5.7% | |
| 350,000 | | Baker Hughes, Inc. | 14,724,500 |
| 320,000 | | ENSCO International, Inc. | 14,652,800 |
| 346,000 | | Noble Corp. | 14,096,040 |
| 590,000 | | Patterson-UTI Energy, Inc. | 9,192,200 |
| 930,000 | | Rowan Cos., Inc. | 21,622,500 |
| 415,000 | 1 | Unit Corp. | 16,218,200 |
| | TOTAL | 90,506,240 |
| | Food & Staples Retailing – 3.1% | |
| 420,000 | 1 | BJ's Wholesale Club, Inc. | 14,712,600 |
| 240,000 | | Familymart Co. Ltd. | 7,146,393 |
| 250,000 | | Lawson, Inc. | 11,162,741 |
| 700,000 | | Seven & I Holdings Co. Ltd. | 15,346,414 |
| | TOTAL | 48,368,148 |
| | Food Products – 1.1% | |
| 250,000 | | Archer-Daniels-Midland Co. | 7,530,000 |
| 170,000 | | Bunge Ltd. | 9,700,200 |
| | TOTAL | 17,230,200 |
| | Hotels Restaurants & Leisure – 0.9% | |
| 530,000 | | Greek Organization of Football Prognostics | 13,541,700 |
Annual Shareholder Report10
| | | |
| | Life Sciences Tools & Services – 1.0% | |
| 730,000 | | Pharmaceutical Product Development, Inc. | 15,731,500 |
| | Metals & Mining – 7.5% | |
| 820,000 | | Barrick Gold Corp. | 29,462,600 |
| 1,470,000 | | Kinross Gold Corp. | 27,312,600 |
| 440,000 | | Newmont Mining Corp. | 19,122,400 |
| 690,000 | 1 | Pan American Silver Corp. | 14,434,800 |
| 2,650,000 | | Yamana Gold, Inc. | 28,222,500 |
| | TOTAL | 118,554,900 |
| | Oil Gas & Consumable Fuels – 0.7% | |
| 493,945 | | Enerplus Resources Fund | 10,728,485 |
| | Pharmaceuticals – 2.5% | |
| 450,000 | | Bristol-Myers Squibb Co. | 9,810,000 |
| 740,000 | | Takeda Pharmaceutical Co. Ltd. | 29,758,080 |
| | TOTAL | 39,568,080 |
| | Software – 1.6% | |
| 97,600 | | Nintendo Co. Ltd. | 24,888,084 |
| | Wireless Telecommunication Services – 2.1% | |
| 22,500 | | NTT DoCoMo, Inc. | 32,776,271 |
| | TOTAL COMMON STOCKS
(IDENTIFIED COST $445,692,802) | 526,512,667 |
| | U.S. TREASURY – 32.3% | |
| $250,000 | 2 | United States Treasury Bill, 0.065%, 1/7/2010 | 249,988 |
| 70,000,000 | 2,3 | United States Treasury Bill, 0.070%, 1/28/2010 | 69,991,964 |
| 65,000,000 | 2,3 | United States Treasury Bill, 0.080%, 1/21/2010 | 64,995,307 |
| 30,000,000 | 2,3 | United States Treasury Bill, 0.135%, 12/10/2009 | 29,998,812 |
| 68,000,000 | 2,3 | United States Treasury Bill, 0.150%, 12/3/2009 | 67,999,123 |
| 200,000,000 | 2,3 | United States Treasury Bills, 0.170% — 0.290%, 11/19/2009 | 199,998,820 |
| 33,500,000 | 4 | United States Treasury Bond, 3.50%, 2/15/2039 | 29,370,080 |
| 46,000,000 | | United States Treasury Bond, 4.25%, 5/15/2039 | 46,100,625 |
| | TOTAL U.S. TREASURY
(IDENTIFIED COST $508,946,278) | 508,704,719 |
| | GOVERNMENTS/AGENCIES – 5.8% | |
| 23,500,000 | | Argentina, Government of, Bond, 0.943%, 8/3/2012 | 7,402,500 |
| 10,401,350 | | Argentina, Government of, Note, 8.28%, 12/31/2033 | 7,384,958 |
Annual Shareholder Report11
| | | |
| $22,200,000 | | Brazil, Government of, Note, 10.00%, 1/1/2012 | 12,643,553 |
| 11,900,000 | | Brazil, Government of, Note, 6.00%, 5/15/2015 | 12,470,350 |
| 11,850,000,000 | | Colombia, Government of, Unsub., 11.75%, 3/1/2010 | 6,042,878 |
| 1,595,000,000 | | Hungary, Government of, 8.00%, 2/12/2015 | 8,769,341 |
| 40,800,000 | | Poland, Government of, Bond, 5.25%, 10/25/2017 | 13,431,478 |
| 78,500,000 | | Republic of South Africa, Bond, 7.50%, 1/15/2014 | 9,630,091 |
| 21,200,000 | 5 | Turkey, Government of, 14.686%, 11/3/2010 | 13,020,812 |
| | TOTAL GOVERNMENTS/AGENCIES
(IDENTIFIED COST $73,150,171) | 90,795,961 |
| | INVESTMENT FUND – 4.8% | |
| 750,000 | | GML Agricultural Commodity Trade Finance Fund
(IDENTIFIED COST $75,000,000) | 74,978,850 |
| | BULLION – 3.2% | |
| 48,437 | | Gold
(IDENTIFIED COST $48,855,678) | 50,626,777 |
| | EXCHANGE-TRADED FUND – 3.1% | |
| 1,900,000 | | PowerShares DB Agriculture Fund
(IDENTIFIED COST $46,722,564) | 48,583,000 |
| | MUTUAL FUNDS – 12.1% | |
| 2,760,000 | | Central Fund of Canada Ltd. | 36,625,200 |
| 154,018,981 | 6,7 | Prime Value Obligations Fund, Institutional Shares, 0.22% | 154,018,981 |
| | TOTAL MUTUAL FUNDS
(IDENTIFIED COST $185,846,058) | 190,644,181 |
| | TOTAL INVESTMENTS — 94.8%
(IDENTIFIED COST $1,384,213,551)8 | 1,490,846,155 |
| | OTHER ASSETS AND LIABILITIES - NET — 5.2%9 | 82,411,327 |
| | TOTAL NET ASSETS — 100% | $1,573,257,482 |
Annual Shareholder Report12
Schedule of Securities Sold Short
Shares or
Principal
Amount | | Value |
| 130,000 | Amazon.com, Inc. | $15,445,300 |
| 1,233,600 | Amkor Technology, Inc. | 6,797,136 |
| 1,030,000 | AutoNation, Inc. | 17,757,200 |
| 1,600,000 | Avis Budget Group, Inc. | 13,440,000 |
| 340,000 | Bally Technologies, Inc. | 13,392,600 |
| 950,000 | CarMax, Inc. | 18,686,500 |
| 1,600,000 | CB Richard Ellis Services, Inc. | 16,560,000 |
| 750,000 | Coca-Cola Enterprises, Inc. | 14,302,500 |
| 340,000 | Credit Suisse Group AG, ADR | 18,122,000 |
| 400,000 | Cree, Inc. | 16,840,000 |
| 1,200,000 | Cypress Semiconductor Corp. | 10,116,000 |
| 1,700,000 | Delta Air Lines, Inc. | 12,138,000 |
| 520,000 | Dendreon Corp. | 13,140,400 |
| 325,000 | Digital Realty Trust, Inc. | 14,667,250 |
| 510,000 | Dr. Pepper Snapple Group, Inc. | 13,902,600 |
| 850,000 | Expedia, Inc. | 19,269,500 |
| 200,000 | Express Scripts, Inc., Class A | 15,984,000 |
| 380,000 | F5 Networks, Inc. | 17,058,200 |
| 760,000 | First Horizon National Corp. | 8,990,800 |
| 2,970,000 | Ford Motor Co. | 20,790,000 |
| 265,000 | Freeport-McMoRan Copper & Gold, Inc. | 19,440,400 |
| 840,000 | Gap (The), Inc. | 17,925,600 |
| 835,000 | Goodyear Tire & Rubber Co. | 10,754,800 |
| 1,420,000 | Hertz Global Holdings, Inc. | 13,220,200 |
| 375,000 | ICICI Bank Ltd., ADR | 11,793,750 |
| 450,000 | ISHARES FTSE/XINHUA CHINA 25 | 18,769,500 |
| 1,700,000 | IShares MSCI Emerging Mkt | 63,852,000 |
| 455,000 | J. Crew Group, Inc. | 18,554,900 |
| 775,000 | Jefferies Group, Inc. | 20,227,500 |
| 360,000 | Life Technologies, Inc. | 16,981,200 |
| 1,050,000 | Macy's, Inc. | 18,448,500 |
| 475,000 | Massey Energy Co. | 13,817,750 |
| 70,000 | Mastercard, Inc. | 15,331,400 |
Annual Shareholder Report13
Shares or
Principal
Amount | | Value |
| 1,650,000 | Micron Technology, Inc. | $11,203,500 |
| 360,000 | O'Reilly Automotive, Inc. | 13,420,800 |
| 650,000 | Owens Corning, Inc. | 14,371,500 |
| 750,000 | Penske Automotive Group, Inc. | 11,745,000 |
| 2,050,000 | PMC-Sierra, Inc. | 17,466,000 |
| 2,700,000 | RF Micro Devices, Inc. | 10,746,000 |
| 280,000 | Salesforce.com, Inc. | 15,890,000 |
| 570,000 | SBA Communications, Corp. | 16,079,700 |
| 435,000 | Scotts Co. | 17,669,700 |
| 900,000 | Skyworks Solutions, Inc. | 9,387,000 |
| 260,000 | Smucker (J.M.) Co. | 13,709,800 |
| 570,000 | Starwood Hotels & Resorts Worldwide, Inc. | 16,564,200 |
| 1,000,000 | Temple-Inland, Inc. | 15,450,000 |
| 3,000,000 | Tenet Healthcare Corp. | 15,360,000 |
| 450,000 | TJX Cos., Inc. | 16,807,500 |
| 1,250,000 | Virgin Media, Inc. | 17,462,500 |
| 630,000 | Wells Fargo & Co. | 17,337,600 |
| 560,000 | Whole Foods Market, Inc. | 17,953,600 |
| 430,000 | WMS Industries, Inc. | 17,191,400 |
| 1,050,000 | Wyndham Worldwide Corp. | 17,902,500 |
| 225,000 | Wynn Resorts Ltd. | 12,199,500 |
| 375,000 | Yum! Brands, Inc. | 12,356,250 |
| TOTAL SECURITIES SOLD SHORT
(PROCEEDS $811,851,249) | $884,791,536 |
- At October 31, 2009, the Fund had the following open futures contracts:
| Description | Number of
Contracts | Notional
Value | Expiration
Date | Unrealized
Depreciation |
| 1S&P 500 Index Long Futures | 855 | $220,803,750 | December 2009 | $(1,666,168) |
Annual Shareholder Report14
- At October 31, 2009, the Fund had outstanding foreign exchange contracts as follows:
Settlement
Date | Foreign
Currency
Units to
Receive/Deliver | In
Exchange
For | Contracts
at Value | Unrealized
Appreciation/
(Depreciation) |
| Contracts Purchased: | | | | |
| 1/11/2010 | 11,836,500 PEN | $4,135,022 | $4,068,309 | $(66,713) |
| 2/2/2010 | 26,489,190 SGD | 27,300,000 NZD | $18,886,824 | $558,812 |
| 2/2/2010 | 24,237,240 CAD | 32,700,000 NZD | $22,400,223 | $452,240 |
| 2/2/2010 | 2,028,392,280 JPY | 32,400,000 NZD | $22,547,635 | $724,467 |
| 2/3/2010 | 26,270,850 SGD | 22,300,000 AUD | $18,731,073 | $554,188 |
| 4/6/2010 | 82,698,640 NOK | 15,200,000 CAD | $14,345,516 | $267,139 |
| 4/8/2010 | 19,956,274 SGD | 14,583,047 CHF | $14,225,185 | $5,237 |
| 5/7/2010 | 5,868,120,000 KRW | $4,740,000 | $4,957,229 | $217,229 |
| 5/14/2010 | 165,900,000 RUB | $4,740,000 | $5,480,945 | $740,945 |
| Contracts Sold: | | | | |
| 11/23/2009 | 31,000,000 NZD | $20,791,390 | $22,208,167 | $(1,416,777) |
| 12/2/2009 | 54,120,000 BRL | $30,000,000 | $30,521,717 | $(521,717) |
| 12/16/2009 | 42,840,850,000 COP | $22,100,000 | $21,335,043 | $764,957 |
| 2/2/2010 | 32,400,000 NZD | 2,028,392,280 JPY | $23,091,025 | $(1,267,857) |
| 2/2/2010 | 32,700,000 NZD | 24,237,240 CAD | $23,304,831 | $(1,356,848) |
| 2/2/2010 | 27,300,000 NZD | 26,489,190 SGD | $19,456,326 | $(1,128,315) |
| 2/3/2010 | 22,300,000 AUD | 26,270,850 SGD | $19,877,902 | $(1,701,017) |
| 2/3/2010 | 35,700,000 AUD | $29,209,740 | $31,822,471 | $(2,612,731) |
| 2/10/2010 | 13,000,000 EUR | $18,454,150 | $19,123,572 | $(669,422) |
| 3/8/2010 | 34,700,000 AUD | $29,735,124 | $30,814,784 | $(1,079,660) |
| 3/8/2010 | 11,981,610,000 JPY | $134,135,012 | $133,232,819 | $902,193 |
| 3/8/2010 | 62,700,000 NZD | $44,477,499 | $44,570,984 | $(93,485) |
| 3/12/2010 | 128,356,800 NOK | $21,964,988 | $22,291,874 | $(326,886) |
| 3/12/2010 | 210,991,198 SEK | $29,986,526 | $29,771,480 | $215,046 |
| 4/1/2010 | 392,456,250 CZK | $22,371,740 | $21,695,437 | $676,303 |
| 4/1/2010 | 172,482,750 ZAR | $21,748,194 | $21,467,206 | $280,988 |
Annual Shareholder Report15
Settlement
Date | Foreign
Currency
Units to
Receive/Deliver | In
Exchange
For | Contracts
at Value | Unrealized
Appreciation/
(Depreciation) |
| 4/5/2010 | 69,512,603 CAD | $64,470,973 | $64,235,843 | $235,130 |
| 4/5/2010 | 82,684,196 CAD | $76,727,104 | $76,407,570 | $319,534 |
| 4/6/2010 | 15,200,000 CAD | 82,698,640 NOK | $14,046,126 | $32,251 |
| 4/6/2010 | 4,135,725,000 HUF | $21,857,856 | $21,675,636 | $182,220 |
| 4/6/2010 | 65,319,750 PLN | $22,179,128 | $22,333,792 | $(154,664) |
| 4/8/2010 | 14,583,047 CHF | 19,956,274 SGD | $14,232,516 | $(12,569) |
| 5/7/2010 | 5,868,120,000 KRW | $4,981,426 | $4,957,229 | $24,197 |
| NET UNREALIZED DEPRECIATION ON FOREIGN EXCHANGE CONTRACTS | | $(5,255,585) |
- Net Unrealized Depreciation on Futures Contracts and Foreign Exchange Contracts and Value of Securities Sold Short are included in “Other Assets and Liabilities — Net.”
- Note: The categories of investments are shown as a percentage of total net assets at October 31, 2009.
- Various inputs are used in determining the value of the Fund's investments. These inputs are summarized in the three broad levels listed below:
- Level 1 — quoted prices in active markets for identical securities
- Level 2 — other significant observable inputs (including quoted prices for similar securities, interest rates, prepayment speeds, credit risk, etc.)
- Level 3 — significant unobservable inputs (including the Fund's own assumptions in determining the fair value of investments)
- The inputs or methodology used for valuing securities are not an indication of the risk associated with investing in those securities.
Annual Shareholder Report16
- The following is a summary of the inputs used, as of October 31, 2009, in valuing the Fund's assets carried at fair value:
| Valuation Inputs | | | | |
| Level 1 -
Quoted
Prices And
Investments In
Mutual Funds | Level 2 -
Other
Significant
Observable
Inputs | Level 3 -
Significant
Unobservable
Inputs | Total |
| Equity Securities: | | | | |
| Domestic | $252,202,320 | $ — | $ — | $252,202,320 |
| International | 124,257,025 | 150,053,322 | — | 274,310,347 |
| Debt Securities: |
| U.S. Treasury | — | 508,704,719 | — | 508,704,719 |
| Governments/Agencies | — | 90,795,961 | — | 90,795,961 |
| Investment Fund | 74,978,850 | — | — | 74,978,850 |
| Bullion | 50,626,777 | — | — | 50,626,777 |
| Exchange-Traded Fund | 48,583,000 | — | — | 48,583,000 |
| Mutual Funds | 190,644,181 | — | — | 190,644,181 |
| TOTAL SECURITIES | $741,292,153 | $749,554,002 | $ — | $1,490,846,155 |
| OTHER FINANCIAL INSTRUMENTS* | $(886,457,704) | $(5,255,585) | $ — | $(891,713,289) |
| * | Other financial instruments include futures contracts, foreign exchange contracts and securities sold short. |
- Following is a reconciliation of assets in which significant unobservable inputs (Level 3) were used in determining fair value:
| Investments in
Hybrid Notes |
| Balance as of November 1, 2008 | $3,448,916 |
| Realized gain (loss) | (29,098,921) |
| Change in unrealized appreciation (depreciation) | 38,071,557 |
| Net purchases (sales) | (12,421,552) |
| Balance as of October 31, 2009 | $ — |
Annual Shareholder Report17
- The following acronyms are used throughout this portfolio:
| ADR | — American Depositary Receipt |
| AUD | — Australian Dollar |
| BRL | — Brazil Real |
| CAD | — Canadian Dollars |
| CHF | — Swiss Franc |
| COP | — Colombian Peso |
| CZK | — Czech Koruna |
| EUR | — Euro |
| HUF | — Hungarian Forint |
| JPY | — Japanese Yen |
| KRW | — South Korean Won |
| NOK | — Norwegian Krone |
| NZD | — New Zealand Dollar |
| PEN | — Peruvian Nuevo |
| PLN | — Polish Zloty |
| RUB | — Russian Ruble |
| SEK | — Swedish Krona |
| SGD | — Singapore Dollar |
| ZAR | — South African Rand |
- See Notes which are an integral part of the Financial Statements
Annual Shareholder Report18
Statement of Assets and Liabilities
October 31, 2009
| Assets: | | |
| Total investments in securities, at value, including $154,018,981 of an investment in an affiliated issuer (Note 5) (identified cost $1,384,213,551) | | $1,490,846,155 |
| Cash dominated in foreign currencies (identified cost $768,815) | | 753,486 |
| Deposit at broker for short sales | | 922,334,852 |
| Receivable for investments sold | | 29,436,491 |
| Receivable for shares sold | | 24,952,019 |
| Receivable for foreign exchange contracts | | 7,153,076 |
| Income receivable | | 4,879,816 |
| TOTAL ASSETS | | 2,480,355,895 |
| Liabilities: | | |
| Securities sold short, at value (proceeds $811,851,249) | $884,791,536 | |
| Payable for foreign exchange contracts | 12,408,661 | |
| Payable for shares redeemed | 3,940,824 | |
| Payable for investments purchased | 3,280,890 | |
| Payable for daily variation margin | 1,001,368 | |
| Dividends payable on short positions | 89,250 | |
| Payable for shareholder services fee (Note 5) | 672,856 | |
| Payable for distribution services fee (Note 5) | 404,074 | |
| Accrued expenses | 508,954 | |
| TOTAL LIABILITIES | | 907,098,413 |
| Net assets for 142,462,624 shares outstanding | | $1,573,257,482 |
| Net Assets Consist of: | | |
| Paid-in capital | | $1,844,249,499 |
| Net unrealized appreciation of investments, short sales, futures contracts and translation of assets and liabilities in foreign currency | | 18,862,059 |
| Accumulated net realized loss on investments, short sales, futures contracts, written options and foreign currency translations | | (320,611,386) |
| Undistributed net investment income | | 30,757,310 |
| TOTAL NET ASSETS | | $1,573,257,482 |
Annual Shareholder Report19
Statement of Assets and Liabilities — continued| Net Asset Value, Offering Price and Redemption Proceeds Per Share | | |
| Class A Shares: | | |
| Net asset value per share ($835,964,018÷75,367,733 shares outstanding), no par value, unlimited shares authorized | | $11.09 |
| Offering price per share (100/94.50 of $11.09) | | $11.74 |
| Redemption proceeds per share | | $11.09 |
| Class B Shares: | | |
| Net asset value per share ($166,560,582÷15,152,689 shares outstanding), no par value, unlimited shares authorized | | $10.99 |
| Offering price per share | | $10.99 |
| Redemption proceeds per share (94.50/100 of $10.99) | | $10.39 |
| Class C Shares: | | |
| Net asset value per share ($489,259,811÷44,631,713 shares outstanding), no par value, unlimited shares authorized | | $10.96 |
| Offering price per share | | $10.96 |
| Redemption proceeds per share (99.00/100 of $10.96) | | $10.85 |
| Institutional Shares: | | |
| Net asset value per share ($81,473,071÷7,310,489 shares outstanding), no par value, unlimited shares authorized | | $11.14 |
| Offering price per share | | $11.14 |
| Redemption proceeds per share | | $11.14 |
- See Notes which are an integral part of the Financial Statements
Annual Shareholder Report20
Statement of Operations
Year Ended October 31, 2009
| Investment Income: | | | |
| Dividends (including $3,756,884 received from an affiliated issuer (Note 5) and net of foreign taxes withheld of $874,461) | | | $19,680,712 |
| Interest | | | 30,599,791 |
| TOTAL INCOME | | | 50,280,503 |
| Expenses: | | | |
| Investment adviser fee (Note 5) | | $10,411,947 | |
| Administrative personnel and services fee (Note 5) | | 1,077,675 | |
| Custodian fees | | 127,966 | |
| Transfer and dividend disbursing agent fees and expenses | | 2,001,320 | |
| Directors'/Trustees' fees | | 10,225 | |
| Auditing fees | | 33,001 | |
| Legal fees | | 22,104 | |
| Portfolio accounting fees | | 188,710 | |
| Distribution services fee — Class B Shares (Note 5) | | 1,366,248 | |
| Distribution services fee — Class C Shares (Note 5) | | 3,375,331 | |
| Shareholder services fee — Class A Shares (Note 5) | | 1,750,038 | |
| Shareholder services fee — Class B Shares (Note 5) | | 455,416 | |
| Shareholder services fee — Class C Shares (Note 5) | | 1,095,824 | |
| Account administration fee — Class A Shares | | 6,247 | |
| Account administration fee — Class C Shares | | 409 | |
| Share registration costs | | 93,730 | |
| Printing and postage | | 710,391 | |
| Insurance premiums | | 8,272 | |
| Dividends on short positions | | 2,102,489 | |
| Miscellaneous | | 17,552 | |
| TOTAL EXPENSES | | 24,854,895 | |
Annual Shareholder Report21
Statement of Operations — continued| Waivers, Reimbursement and Expense Reductions: | | | |
| Waiver/reimbursement of investment adviser fee (Note 5) | $(869,888) | | |
| Waiver of administrative personnel and services fee (Note 5) | (21,210) | | |
| Fees paid indirectly from directed brokerage arrangements (Note 6) | (47,778) | | |
| Reduction of custodian fees (Note 6) | (6,531) | | |
| TOTAL WAIVERS, REIMBURSEMENT AND EXPENSE REDUCTIONS | | $(945,407) | |
| Net expenses | | | $23,909,488 |
| Net investment income | | | 26,371,015 |
| Realized and Unrealized Gain (Loss) on Investments, Short Sales, Futures Contracts, Written Options and Foreign Currency Transactions: | | | |
| Net realized loss on investments and foreign currency transactions | | | (200,781,502) |
| Net realized loss on short sales | | | (18,675,553) |
| Net realized loss on futures contracts | | | (59,403,274) |
| Net realized gain on written options | | | 5,018,882 |
| Net change in unrealized appreciation of investments and translation of assets and liabilities in foreign currency | | | 459,905,344 |
| Net change in unrealized depreciation of short sales | | | (72,940,287) |
| Net change in unrealized depreciation of futures contracts | | | (1,666,168) |
| Net change in unrealized depreciation on written options | | | 6,856,239 |
| Net realized and unrealized gain on investments, short sales, futures contracts, written options and foreign currency transactions | | | 118,313,681 |
| Change in net assets resulting from operations | | | $144,684,696 |
- See Notes which are an integral part of the Financial Statements
Annual Shareholder Report22
Statement of Changes in Net Assets
| Year Ended October 31 | 2009 | 2008 |
| Increase (Decrease) in Net Assets | | |
| Operations: | | |
| Net investment income | $26,371,015 | $56,142,405 |
| Net realized gain (loss) on investments, short sales, futures contracts, written options and foreign currency transactions | (273,841,447) | 100,621,766 |
| Net change in unrealized appreciation/depreciation of investments, short sales, futures contracts, written options and translation of assets and liabilities in foreign currency | 392,155,128 | (365,013,616) |
| CHANGE IN NET ASSETS RESULTING FROM OPERATIONS | 144,684,696 | (208,249,445) |
| Distributions to Shareholders: | | |
| Distributions from net investment income | | |
| Class A Shares | (28,826,874) | (42,762,897) |
| Class B Shares | (7,577,356) | (10,016,412) |
| Class C Shares | (17,195,671) | (22,300,645) |
| Institutional Shares | (346,178) | (111,676) |
| CHANGE IN NET ASSETS RESULTING FROM DISTRIBUTIONS TO SHAREHOLDERS | (53,946,079) | (75,191,630) |
| Share Transactions: | | |
| Proceeds from sale of shares | 671,401,676 | 526,356,457 |
| Net asset value of shares issued to shareholders in payment of distributions declared | 41,230,658 | 57,468,587 |
| Cost of shares redeemed | (601,415,722) | (854,744,051) |
| CHANGE IN NET ASSETS RESULTING FROM SHARE TRANSACTIONS | 111,216,612 | (270,919,007) |
| Change in net assets | 201,955,229 | (554,360,082) |
| Net Assets: | | |
| Beginning of period | 1,371,302,253 | 1,925,662,335 |
| End of period (including undistributed net investment income of $30,757,310 and $40,649,747, respectively) | $1,573,257,482 | $1,371,302,253 |
- See Notes which are an integral part of the Financial Statements
Annual Shareholder Report23
Notes to Financial Statements
October 31, 2009
1. Organization
Federated Equity Funds (the “Trust”) is registered under the Investment Company Act of 1940, as amended (the “Act”), as an open-end management investment company. The Trust consists of 13 diversified portfolios. The financial statements included herein are only those of Federated Market Opportunity Fund (the “Fund”). The financial statements of the other portfolios are presented separately. The assets of each portfolio are segregated and a shareholder's interest is limited to the portfolio in which shares are held. Each portfolio pays its own expenses. The Fund offers four classes of shares: Class A Shares, Class B Shares, Class C Shares and Institutional Shares. All shares of the Fund have equal rights with respect to voting, except on class-specific matters. The financial highlights of the Class A Shares, Class B Shares and Class C Shares are presented separately. The investment objective of the Fund is to provide absolute (positive) returns with low correlation to the U.S. equity market.
2. Significant Accounting Policies
The following is a summary of significant accounting policies consistently followed by the Fund in the preparation of its financial statements. These policies are in conformity with U.S. generally accepted accounting principles (GAAP).
Investment Valuation
In calculating its net asset value (NAV), the Fund generally values investments as follows:
- Equity securities listed on an exchange or traded through a regulated market system are valued at their last reported sale price or official closing price in their principal exchange or market.
- Shares of other mutual funds are valued based upon their reported NAVs.
- Fixed-income securities acquired with remaining maturities greater than 60 days are fair valued using price evaluations provided by a pricing service approved by the Trustees.
- Fixed-income securities acquired with remaining maturities of 60 days or less are valued at their cost (adjusted for the accretion of any discount or amortization of any premium).
- Derivative contracts listed on exchanges are valued at their reported settlement or closing price.
- Over-the-counter (OTC) derivative contracts are fair valued using price evaluations provided by a pricing service approved by the Trustees.
If the Fund cannot obtain a price or price evaluation from a pricing service for an investment, the Fund may attempt to value the investment based upon the mean of bid and asked quotations or fair value the investment based on price evaluations, from one or more dealers. If any price, quotation, price evaluation or other pricing source is not readily available when the NAV is calculated, the Fund uses the fair value of the investment determined in accordance with the procedures described below. There can be no assurance that the Fund could purchase or sell an investment at the price used to calculate the Fund's NAV.
Fair Valuation and Significant Events Procedures
The Trustees have authorized the use of pricing services to provide evaluations of the current fair value of certain investments for purposes of calculating the NAV. Factors considered by pricing services in evaluating an investment include the yields or prices of investments of comparable quality, coupon, maturity, call rights and other potential prepayments, terms and type, reported transactions, indications as to values from dealers and general market Annual Shareholder Report24
conditions. Some pricing services provide a single price evaluation reflecting the bid side of the market for an investment (a “bid” evaluation). Other pricing services offer both bid evaluations and price evaluations indicative of a price between the prices bid and asked for the investment (a “mid” evaluation). The Fund normally uses bid evaluations for U.S. Treasury and Agency securities, mortgage-backed securities and municipal securities. The Fund normally uses mid evaluations for other types of fixed-income securities and OTC derivative contracts. In the event that market quotations and price evaluations are not available for an investment, the fair value of the investment is determined in accordance with procedures adopted by the Trustees.The Trustees also have adopted procedures requiring an investment to be priced at its fair value whenever the Adviser determines that a significant event affecting the value of the investment has occurred between the time as of which the price of the investment would otherwise be determined and the time as of which the NAV is computed. An event is considered significant if there is both an affirmative expectation that the investment's value will change in response to the event and a reasonable basis for quantifying the resulting change in value. Examples of significant events that may occur after the close of the principal market on which a security is traded, or after the time of a price evaluation provided by a pricing service or a dealer, include:
- With respect to securities traded in foreign markets, significant trends in U.S. equity markets or in the trading of foreign securities index futures or options contracts;
- With respect to price evaluations of fixed-income securities determined before the close of regular trading on the NYSE, actions by the Federal Reserve Open Market Committee and other significant trends in U.S. fixed-income markets;
- Political or other developments affecting the economy or markets in which an issuer conducts its operations or its securities are traded; and
- Announcements concerning matters such as acquisitions, recapitalizations, litigation developments, a natural disaster affecting the issuer's operations or regulatory changes or market developments affecting the issuer's industry.
The Trustees have approved the use of a pricing service to determine the fair value of equity securities traded principally in foreign markets when the Adviser determines that there has been a significant trend in the U.S. equity markets or in index futures trading. For other significant events, the Fund may seek to obtain more current quotations or price evaluations from alternative pricing sources. If a reliable alternative pricing source is not available, the Fund will determine the fair value of the investment using another method approved by the Trustees.
Repurchase Agreements
It is the policy of the Fund to require the other party to a repurchase agreement to transfer to the Fund's custodian or sub-custodian eligible securities or cash with a market value (after transaction costs) at least equal to the repurchase price to be paid under the repurchase agreement. The eligible securities are transferred to accounts with the custodian or sub-custodian in which the Fund holds a “securities entitlement” and exercises “control” as those terms are defined in the Uniform Commercial Code. The Fund has established procedures for monitoring the market value of the transferred securities and requiring the transfer of additional eligible securities if necessary to equal at least the repurchase price. These procedures also allow the other party to require securities to be transferred from the account to the extent that their market value exceeds the repurchase price or in exchange for other eligible securities of equivalent market value.
Annual Shareholder Report25
With respect to agreements to repurchase U.S. government securities and cash items, the Fund treats the repurchase agreement as an investment in the underlying securities and not as an obligation of the other party to the repurchase agreement. Other repurchase agreements are treated as obligations of the other party secured by the underlying securities. Nevertheless, the insolvency of the other party or other failure to repurchase the securities may delay the disposition of the underlying securities or cause the Fund to receive less than the full repurchase price. Under the terms of the repurchase agreement, any amounts received by the Fund in excess of the repurchase price and related transaction costs must be remitted to the other party.The Fund may enter into repurchase agreements in which eligible securities are transferred into joint trading accounts maintained by the custodian or sub-custodian for investment companies and other clients advised by the Fund's Adviser and its affiliates. The Fund will participate on a pro rata basis with the other investment companies and clients in its share of the securities transferred under such repurchase agreements and in its share of proceeds from any repurchase or other disposition of such securities.
Investment Income, Gains and Losses, Expenses and Distributions
Investment transactions are accounted for on a trade-date basis. Realized gains and losses from investment transactions are recorded on an identified cost basis. Interest income and expenses are accrued daily. Dividend income and distributions to shareholders are recorded on the ex-dividend date. Inflation adjustments on Treasury Inflation-Protected Securities are included in interest income. Foreign dividends are recorded on the ex-dividend date or when the Fund is informed of the ex-dividend date. Distributions of net investment income are declared and paid quarterly. Non-cash dividends included in dividend income, if any, are recorded at fair value. Investment income, realized and unrealized gains and losses, and certain fund-level expenses are allocated to each class based on relative average daily net assets, except that each class may bear certain expenses unique to that class such as account administration, distribution services and shareholder services fees. Dividends are declared separately for each class. No class has preferential dividend rights; differences in per share dividend rates are generally due to differences in separate class expenses.
Premium and Discount Amortization
All premiums and discounts on fixed-income securities are amortized/accreted for financial statement purposes.
Federal Taxes
It is the Fund's policy to comply with the Subchapter M provision of the Internal Revenue Code and to distribute to shareholders each year substantially all of its income. Accordingly, no provision for federal income tax is necessary. As of and during the year ended October 31, 2009, the Fund did not have a liability for any uncertain tax positions. The Fund recognizes interest and penalties, if any, related to tax liabilities as income tax expense in the Statement of Operations. As of October 31, 2009, tax years 2006 through 2009 remain subject to examination by the Fund's major tax jurisdictions, which include the United States of America and the Commonwealth of Massachusetts.
The Fund may be subject to taxes imposed by governments of countries in which it invests. Such taxes are generally based on either income or gains earned or repatriated. The Fund accrues and applies such taxes to net investment income, net realized gains and net unrealized gains as income and/or gains are earned.
Annual Shareholder Report26
When-Issued and Delayed Delivery TransactionsThe Fund may engage in when-issued or delayed delivery transactions. The Fund records when-issued securities on the trade date and maintains security positions such that sufficient liquid assets will be available to make payment for the securities purchased. Securities purchased on a when-issued or delayed delivery basis are marked to market daily and begin earning interest on the settlement date. Losses may occur on these transactions due to changes in market conditions or the failure of counterparties to perform under the contract.
Futures Contracts
The Fund purchases and sells financial futures contracts to manage cash flows, enhance yield, manage duration and to potentially reduce transaction costs. Upon entering into a financial futures contract with a broker, the Fund is required to deposit in a segregated account a specified amount of cash or U.S. government securities. Futures contracts are valued daily and unrealized gains or losses are recorded in a “variation margin” account. Daily, the Fund receives from or pays to the broker a specified amount of cash based upon changes in the variation margin account. When a contract is closed, the Fund recognizes a realized gain or loss. Futures contracts have market risks, including the risk that the change in the value of the contract may not correlate with the changes in the value of the underlying securities. There is minimal counterparty risk to the Fund since futures are exchange traded and the exchange's clearinghouse, as counterparty to all exchange traded futures, guarantees the futures against default.
Futures contracts outstanding at period end are listed after the Fund's Portfolio of Investments.
Foreign Exchange Contracts
The Fund may enter into foreign exchange contracts for the delayed delivery of securities or foreign currency exchange transactions. The Fund may enter into foreign exchange contracts to protect assets against adverse changes in foreign currency exchange rates or exchange control regulations. Purchased contracts are used to acquire exposure to foreign currencies, whereas, contracts to sell are used to hedge the Fund's securities against currency fluctuations. Risks may arise upon entering into these transactions from the potential inability of counterparties to meet the terms of their commitments and from unanticipated movements in security prices or foreign exchange rates. The foreign exchange contracts are adjusted by the daily exchange rate of the underlying currency and any gains or losses are recorded for financial statement purposes as unrealized until the settlement date.
Foreign exchange contracts outstanding at period end are listed after the Fund's Portfolio of Investments.
Foreign Currency Translation
The accounting records of the Fund are maintained in U.S. dollars. All assets and liabilities denominated in foreign currencies (FCs) are translated into U.S. dollars based on the rates of exchange of such currencies against U.S. dollars on the date of valuation. Purchases and sales of securities, income and expenses are translated at the rate of exchange quoted on the respective date that such transactions are recorded. The Fund does not isolate that portion of the results of operations resulting from changes in foreign exchange rates on investments from the fluctuations arising from changes in market prices of securities held. Such fluctuations are included with the net realized and unrealized gain or loss from investments.
Annual Shareholder Report27
Reported net realized foreign exchange gains or losses arise from sales of portfolio securities, sales and maturities of short-term securities, sales of FCs, currency gains or losses realized between the trade and settlement dates on securities transactions, the difference between the amounts of dividends, interest and foreign withholding taxes recorded on the Fund's books, and the U.S. dollar equivalent of the amounts actually received or paid. Net unrealized foreign exchange gains and losses arise from changes in the value of assets and liabilities other than investments in securities at fiscal year end, resulting from changes in the exchange rate.Short Sales
The Fund may sell a security short in an effort to take advantage of an anticipated decline in the price of the security. In a short sale, the Fund sells a security it does not own, and must borrow the security in order to deliver it at completion of the sale. The Fund then has an obligation to replace the borrowed security. If the Fund can buy the security back at a lower price than it sold it for, a gain is realized. If the Fund has to buy the security back at a higher price, a loss is realized. For the year ended October 31, 2009, the Fund had a net realized loss on short sales of $18,675,553.
Options Contracts
The Fund may buy or sell put and call options for hedging and asset allocation purposes. The seller (writer) of an option receives a payment or premium, from the buyer, which the writer keeps regardless of whether the buyer exercises the option. Premiums paid for purchasing options which expire are treated as realized losses. The risk associated with purchasing put and call options is limited to the premium paid. When the Fund writes a put or call option, an amount equal to the premium received is recorded as a liability and subsequently marked to market to reflect the current value of the option written. Premiums received from writing options which expire are treated as realized gains. Premiums received from writing options which are exercised or closed are added to the proceeds or offset against amounts paid on the underlying reference instrument to determine the realized gain or loss. The Fund, as a writer of an option, bears the market risk of an unfavorable change in the price of the underlying reference instrument. Options can trade on securities or commodities exchanges. In this case, the exchange sets all the terms of the contract except for the price. Most exchanges require investors to maintain margin accounts through their brokers to cover their potential obligations to the exchange. This protects investors against potential defaults by the counterparty.
The following is a summary of the Fund's written option activity:
| Contracts | Number of
Contracts | Premium |
| Outstanding at October 31, 2008 | 15,500 | $7,843,761 |
| Contracts exercised | (2,800) | (1,603,579) |
| Contracts bought back | (2,700) | (1,546,308) |
| Contracts expired | (10,000) | (4,693,874) |
| Outstanding at October 31, 2009 | — | $ — |
Annual Shareholder Report28
Additional Disclosure Related to Derivative Instruments
| Fair Value of Derivative Instruments |
| Asset | Liability |
| Statement of
Assets and
Liabilities
Location | Fair Value | Statement of
Assets and
Liabilities
Location | Fair Value |
| Derivatives not accounted for as hedging instruments under ASC Topic 815 | | | | |
| Foreign exchange contracts | Receivable for foreign exchange contracts | $7,153,076 | Payable for foreign exchange contracts | $12,408,661 |
| Equity contracts | | — | Payable for daily variation margin | 1,666,168* |
| Total derivatives not accounted for as hedging instruments under ASC Topic 815 | | $7,153,076 | | $14,074,829 |
| * | Includes cumulative appreciation/depreciation of futures contracts as reported in the footnotes to the Portfolio of Investments. Only the current day's variation margin is reported within the Statement of Assets and Liabilities. |
The Effect of Derivative Instruments on the Statement of Operations for the Year Ended October 31, 2009
| Amount of Realized Gain or (Loss) on Derivatives Recognized in Income |
| Futures | Forward
Currency
Contracts | Written
Options | Total |
| Foreign exchange contracts | — | $42,028,265 | — | $42,028,265 |
| Equity contracts | $(59,403,274) | — | $5,018,882 | (54,384,392) |
| Total | $(59,403,274) | $42,028,265 | $5,018,882 | $(12,356,127) |
| Change in Unrealized Appreciation or (Depreciation) on Derivatives Recognized in Income |
| Futures | Forward
Currency
Contracts | Written
Options | Total |
| Foreign exchange contracts | — | $(10,367,554) | — | $(10,367,554) |
| Equity contracts | $(1,666,168) | — | $6,856,239 | 5,190,071 |
| Total | $(1,666,168) | $(10,367,554) | $6,856,239 | $(5,177,483) |
Restricted Securities
Restricted securities are securities that either: (a) cannot be offered for public sale without first being registered, or being able to take advantage of an exemption from registration, under the Securities Act of 1933; or (b) are subject to contractual restrictions on public sales. In some cases, when a security cannot be offered for public sale without first being registered, the issuer of the restricted security has agreed to register such securities for resale, at the issuer's expense, either upon demand by the Fund or in connection with another registered Annual Shareholder Report29
offering of the securities. Many such restricted securities may be resold in the secondary market in transactions exempt from registration. Restricted securities may be determined to be liquid under criteria established by the Trustees. The Fund will not incur any registration costs upon such resales. The Fund's restricted securities are valued at the price provided by dealers in the secondary market or, if no market prices are available, at the fair value as determined in accordance with procedures established by and under the general supervision of the Trustees.Other
The preparation of financial statements in conformity with GAAP requires management to make estimates and assumptions that affect the amounts of assets, liabilities, expenses and revenues reported in the financial statements. Actual results could differ from those estimated.
3. Shares of Beneficial Interest
The following tables summarize share activity:
| Year Ended October 31 | 2009 | 2008 |
| Class A Shares: | Shares | Amount | Shares | Amount |
| Shares sold | 39,339,133 | $430,108,951 | 31,660,346 | $389,360,969 |
| Shares issued to shareholders in payment of distributions declared | 2,234,350 | 23,054,476 | 2,775,926 | 33,809,164 |
| Shares redeemed | (36,513,444) | (383,301,698) | (44,465,849) | (530,133,572) |
NET CHANGE RESULTING
FROM CLASS A
SHARE TRANSACTIONS | 5,060,039 | $69,861,729 | (10,029,577) | $(106,963,439) |
| Year Ended October 31 | 2009 | 2008 |
| Class B Shares: | Shares | Amount | Shares | Amount |
| Shares sold | 1,323,482 | $14,216,697 | 1,934,966 | $23,555,885 |
| Shares issued to shareholders in payment of distributions declared | 608,550 | 6,238,153 | 679,764 | 8,231,972 |
| Shares redeemed | (6,138,694) | (64,447,604) | (7,261,201) | (86,900,792) |
NET CHANGE RESULTING
FROM CLASS B
SHARE TRANSACTIONS | (4,206,662) | $(43,992,754) | (4,646,471) | $(55,112,935) |
| Year Ended October 31 | 2009 | 2008 |
| Class C Shares: | Shares | Amount | Shares | Amount |
| Shares sold | 12,963,665 | $140,108,028 | 8,668,337 | $105,602,213 |
| Shares issued to shareholders in payment of distributions declared | 1,145,371 | 11,710,051 | 1,270,437 | 15,343,355 |
| Shares redeemed | (13,205,369) | (137,704,151) | (19,907,692) | (237,038,784) |
NET CHANGE RESULTING
FROM CLASS C
SHARE TRANSACTIONS | 903,667 | $14,113,928 | (9,968,918) | $(116,093,216) |
Annual Shareholder Report30
| Year Ended October 31 | 2009 | 2008 |
| Institutional Shares: | Shares | Amount | Shares | Amount |
| Shares sold | 8,090,710 | $86,968,000 | 648,425 | $7,837,390 |
| Shares issued to shareholders in payment of distributions declared | 21,684 | 227,978 | 6,935 | 84,096 |
| Shares redeemed | (1,438,538) | (15,962,269) | (58,310) | (670,903) |
NET CHANGE RESULTING
FROM INSTITUTIONAL
SHARE TRANSACTIONS | 6,673,856 | $71,233,709 | 597,050 | $7,250,583 |
NET CHANGE RESULTING
FROM FUND
SHARE TRANSACTIONS | 8,430,900 | $111,216,612 | (24,047,916) | $(270,919,007) |
4. Federal Tax Information
The timing and character of income and capital gain distributions are determined in accordance with income tax regulations, which may differ from GAAP. These differences are due in part to differing treatments for foreign currency transactions, defaulted securities, discount accretion/premium amortization on debt securities and partnership adjustments.
For the year ended October 31, 2009, permanent differences identified and reclassified among the components of net assets were as follows:
| Increase (Decrease) |
| Undistributed
Net Investment
Income (Loss) | Accumulated
Net Realized
Gains (Losses) |
| $ 17,682,627 | $ (17,682,627) |
Net investment income (loss), net realized gains (losses) and net assets were not affected by this reclassification.
The tax character of distributions as reported on the Statement of Changes in Net Assets for the years ended October 31, 2009 and 2008, was as follows:
| 2009 | 2008 |
| Ordinary income | $53,946,079 | $75,191,630 |
As of October 31, 2009, the components of distributable earnings on a tax basis were as follows:
| Undistributed ordinary income | $32,320,037 |
| Net unrealized depreciation | $(19,402,174) |
| Capital loss carryforwards | $(283,909,880) |
The difference between book-basis and tax-basis net unrealized appreciation/depreciation is attributable to differing treatments for the deferral of losses on wash sales, defaulted bonds, passive foreign investment companies and discount accretion/premium amortization on debt securities.
Annual Shareholder Report31
At October 31, 2009, the cost of investments for federal tax purposes was $1,418,950,275. The net unrealized appreciation of investments for federal tax purposes excluding any unrealized appreciation/depreciation resulting from changes in foreign currency exchange rates, securities sold short and futures contracts was $71,895,880. This consists of net unrealized appreciation from investments for those securities having an excess of value over cost of $79,817,099 and net unrealized depreciation from investments for those securities having an excess of cost over value of $7,921,219.At October 31, 2009, the Fund had a capital loss carryforward of $283,909,880 which will reduce the Fund's taxable income arising from future net realized gains on investments, if any, to the extent permitted by the Code and thus will reduce the amount of distributions to shareholders which would otherwise be necessary to relieve the Fund of any liability for federal income tax. Pursuant to the Code, such capital loss carryforward will expire as follows:
| Expiration Year | Expiration Amount |
| 2015 | $26,587,308 |
| 2017 | $257,322,572 |
5. Investment Adviser Fee and Other Transactions with Affiliates
Investment Adviser Fee
Federated Equity Management Company of Pennsylvania is the Fund's investment adviser (the “Adviser”). The advisory agreement between the Fund and the Adviser provides for an annual fee equal to 0.75% of the Fund's average daily net assets. Subject to the terms described in the Expense Limitation note, the Adviser may also voluntarily choose to waive any portion of its fee. The Adviser can modify or terminate this voluntary waiver at any time at its sole discretion. For the year ended October 31, 2009, the Adviser voluntarily waived $523,827 of its fee.
Certain of the Fund's assets are managed by Federated Investment Management Company (the “Sub-Adviser”). Under the terms of a sub-adviser agreement between the Adviser and the Sub-Adviser, the Sub-Adviser receives an allocable portion of the Fund's adviser fee. The fee is paid by the Adviser out of its resources and is not an incremental Fund expense. For the year ended October 31, 2009, the Sub-Adviser earned a fee of $922,389.
Administrative Fee
Federated Administrative Services (FAS), under the Administrative Services Agreement, provides the Fund with administrative personnel and services. The fee paid to FAS is based on the average aggregate daily net assets of certain Federated funds as specified below:
| Administrative Fee | Average Aggregate Daily Net Assets of
the Federated Funds |
| 0.150% | on the first $5 billion |
| 0.125% | on the next $5 billion |
| 0.100% | on the next $10 billion |
| 0.075% | on assets in excess of $20 billion |
Annual Shareholder Report32
The administrative fee received during any fiscal year shall be at least $150,000 per portfolio and $40,000 per each additional class of Shares. Subject to the terms described in the Expense Limitation note, FAS may voluntarily choose to waive any portion of its fee. FAS can modify or terminate this voluntary waiver at any time at its sole discretion. For the year ended October 31, 2009, the net fee paid to FAS was 0.076% of average daily net assets of the Fund. FAS waived $21,210 of its fee.
Distribution Services Fee
The Fund has adopted a Distribution Plan (the “Plan”) pursuant to Rule 12b-1 under the Act. Under the terms of the Plan, the Fund will compensate Federated Securities Corp. (FSC), the principal distributor, from the daily net assets of the Fund's Class A Shares, Class B Shares and Class C Shares to finance activities intended to result in the sale of these shares. The Plan provides that the Fund may incur distribution expenses at the following percentages of average daily net assets annually, to compensate FSC:
| Share Class Name | Percentage of Average Daily
Net Assets of Class |
| Class A Shares | 0.05% |
| Class B Shares | 0.75% |
| Class C Shares | 0.75% |
Subject to the terms described in the Expense Limitation note, FSC may voluntarily choose to waive any portion of its fee. FSC can modify or terminate this voluntary waiver at any time at its sole discretion. When FSC receives fees, it may pay some or all of them to financial intermediaries whose customers purchase shares. For the year ended October 31, 2009, FSC retained $532,081 of fees paid by the Fund. For the year ended October 31, 2009, the Fund's Class A Shares did not incur a distribution services fee; however, it may begin to incur this fee upon approval of the Trustees.
Sales Charges
Front-end sales charges and contingent deferred sales charges (“CDSC”) do not represent expenses of the Fund. They are deducted from the proceeds of sales of Fund shares prior to investment or from redemption proceeds prior to remittance, as applicable. For the year ended October 31, 2009, FSC retained $200,282 in sales charges from the sale of Class A Shares. FSC also retained $5,874 of contingent deferred sales charges relating to redemptions of Class A Shares and $34,801 relating to redemptions of Class C Shares.
Shareholder Services Fee
The Fund may pay fees (Service Fees) up to 0.25% of the average daily net assets of the Fund's Class A Shares, Class B Shares and Class C Shares to financial intermediaries or to Federated Shareholder Services Company (FSSC) for providing services to shareholders and maintaining shareholder accounts. Financial intermediaries may include a company affiliated with management of Federated Investors, Inc. A financial intermediary affiliated with management of Federated Investors, Inc. received $3,595 of Service Fees for the year ended October 31, 2009. Subject to the terms described in the Expense Limitation note, FSSC may voluntarily reimburse the Fund for shareholder services fees. This voluntary reimbursement can be modified or terminated at any time. For the year ended October 31, 2009, FSSC did not receive any fees paid by the Fund.
Annual Shareholder Report33
Expense LimitationThe Adviser and its affiliates (which may include FSC, FAS and FSSC) voluntarily agreed to waive their fees and/or reimburse expenses so that the total operating expenses (as shown in the financial highlights) paid by the Fund's Class A Shares, Class B Shares, Class C Shares and Institutional Shares (after the voluntary waivers and reimbursements, but excluding dividends on short positions) will not exceed 1.24%, 1.99%, 1.99% and 0.99%, respectively, through the later of (the “Termination Date”): (a) December 31, 2010; or (b) the date of the Fund's next effective Prospectus. While the Adviser and its affiliates currently do not anticipate terminating these arrangements prior to the Termination Date, these arrangements may only be terminated prior to the Termination Date with the agreement of the Fund's Board of Trustees.
General
Certain Officers and Trustees of the Fund are Officers and Directors or Trustees of the above companies.
Transactions with Affiliated Companies
Affiliated holdings are mutual funds which are managed by the Adviser or an affiliate of the Adviser. The Adviser has agreed to reimburse the Fund for certain investment adviser fees as a result of transactions in other affiliated mutual funds. For the year ended October 31, 2009, the Adviser reimbursed $346,061. Transactions with the affiliated company during the year ended October 31, 2009 were as follows:
| Affiliate | Balance of
Shares Held
10/31/2008 | Purchases/
Additions | Sales/
Reductions | Balance of
Shares Held
10/31/2009 | Value | Dividend
Income |
| Prime Value Obligations Fund, Institutional Shares | 193,695,807 | 1,753,060,735 | 1,792,737,561 | 154,018,981 | $154,018,981 | $3,756,884 |
6. Expense Reduction
Through arrangements with the Fund's custodian, net credits realized as a result of uninvested cash balances were used to reduce custody expenses. For the year ended October 31, 2009, the Fund's expenses were reduced by $6,531 under these arrangements.
The Fund directs portfolio trades to a broker that in turn pays a portion of the Fund's operating expenses. For the year ended October 31, 2009, the Fund's expenses were reduced by $47,778 under these arrangements.
7. Investment Transactions
Purchases and sales of investments, excluding long-term U.S. government securities and short-term obligations, for the year ended October 31, 2009, were as follows:
| Purchases | $1,450,099,345 |
| Sales | $2,195,297,522 |
Annual Shareholder Report34
8. Line of Credit
The Fund participates in a $100,000,000 unsecured, uncommitted revolving line of credit (LOC) agreement with PNC Bank. The LOC was made available for extraordinary or emergency purposes, primarily for financing redemption payments. Borrowings are charged interest at a rate offered to the Fund by PNC Bank at the time of the borrowing. As of October 31, 2009, there were no outstanding loans. During the year ended October 31, 2009, the Fund did not utilize the LOC.
9. Interfund Lending
Pursuant to an Exemptive Order issued by the Securities and Exchange Commission (SEC), the Fund, along with other funds advised by subsidiaries of Federated Investors, Inc., may participate in an interfund lending program. This program provides an alternative credit facility allowing the funds to borrow from other participating affiliated funds. As of October 31, 2009, there were no outstanding loans. During the year ended October 31, 2009, the program was not utilized.
10. Legal Proceedings
Since October 2003, Federated Investors, Inc. and related entities (collectively, “Federated”), and various Federated funds (“Funds”) have been named as defendants in several class action lawsuits now pending in the United States District Court for the District of Maryland. The lawsuits were purportedly filed on behalf of people who purchased, owned and/or redeemed shares of Federated-sponsored mutual funds during specified periods beginning November 1, 1998. The suits are generally similar in alleging that Federated engaged in illegal and improper trading practices including market timing and late trading in concert with certain institutional traders, which allegedly caused financial injury to the mutual fund shareholders. These lawsuits began to be filed shortly after Federated's first public announcement that it had received requests for information on shareholder trading activities in the Funds from the SEC, the Office of the New York State Attorney General (“NYAG”), and other authorities. In that regard, on November 28, 2005, Federated announced that it had reached final settlements with the SEC and the NYAG with respect to those matters. As Federated previously reported in 2004, it has already paid approximately $8.0 million to certain funds as determined by an independent consultant. As part of these settlements, Federated agreed to pay for the benefit of fund shareholders additional disgorgement and a civil money penalty in the aggregate amount of an additional $72 million. Federated entities have also been named as defendants in several additional lawsuits that are now pending in the United States District Court for the Western District of Pennsylvania, alleging, among other things, excessive advisory and Rule 12b-1 fees. The Board of the Funds retained the law firm of Dickstein Shapiro LLP to represent the Funds in these lawsuits. Federated and the Funds, and their respective counsel, have been defending this litigation and none of the Funds remains a defendant in any of the lawsuits (though some could potentially receive any recoveries as nominal defendants). Additional lawsuits based upon similar allegations may be filed in the future. The potential impact of these lawsuits, all of which seek unquantified damages, attorneys' fees and expenses, and future potential similar suits is uncertain. Although we do not believe that these lawsuits will have a material adverse effect on the Funds, there can be no assurance that these suits, the ongoing adverse publicity and/or other developments resulting from the regulatory investigations will not result in increased Fund redemptions, reduced sales of Fund shares, or other adverse consequences for the Funds.
Annual Shareholder Report35
11. Subsequent EventsManagement has evaluated subsequent events through December 24, 2009, the date the financial statements were issued, and determined that no events have occurred that require additional disclosure.
12. Federal Tax Information (unaudited)
For the fiscal year ended October 31, 2009, 11.87% of total ordinary income distributions made by the Fund are qualifying dividends which may be subject to a maximum tax rate of 15%, as provided for by the Jobs and Growth Tax Relief Act of 2003. Complete information is reported in conjunction with the reporting of your distributions on Form 1099-DIV.
Of the ordinary income distributions made by the Fund during the year ended October 31, 2009, 2.65% qualify for the dividend received deduction available to corporate shareholders.
Annual Shareholder Report36
Report of Independent Registered Public Accounting Firm
TO THE BOARD OF TRUSTEES OF THE FEDERATED EQUITY FUNDS AND SHAREHOLDERS OF FEDERATED MARKET OPPORTUNITY FUND:
We have audited the accompanying statement of assets and liabilities, including the portfolio of investments, of the Federated Market Opportunity Fund (the “Fund”), a portfolio of Federated Equity Funds, as of October 31, 2009, and the related statement of operations for the period then ended, statements of changes in net assets for each of the years in the two-year period then ended, and financial highlights for each of the years in the four-year period then ended. These financial statements and financial highlights are the responsibility of the Fund's management. Our responsibility is to express an opinion on these financial statements and financial highlights based on our audits. The financial highlights for the period presented prior to November 1, 2005, was audited by other independent registered public accountants whose report thereon dated December 20, 2005, expressed an unqualified opinion on those statements.
We conducted our audits in accordance with the standards of the Public Company Accounting Oversight Board (United States). Those standards require that we plan and perform the audit to obtain reasonable assurance about whether the financial statements and financial highlights are free of material misstatement. An audit includes examining, on a test basis, evidence supporting the amounts and disclosures in the financial statements. Our procedures included confirmation of securities owned as of October 31, 2009 by correspondence with the custodian and brokers or by other appropriate auditing procedures. An audit also includes assessing the accounting principles used and significant estimates made by management, as well as evaluating the overall financial statement presentation. We believe that our audits provide a reasonable basis for our opinion.
In our opinion, the financial statements and financial highlights referred to above present fairly, in all material respects, the financial position of the Federated Market Opportunity Fund as of October 31, 2009, the results of its operations for the year then ended, changes in its net assets for each of the years in the two-year period then ended, and financial highlights for each of the years in the four-year period then ended, in conformity with U.S. generally accepted accounting principles.
Boston, Massachusetts
December 24, 2009
Annual Shareholder Report37
Board of Trustees and Trust Officers
The Board is responsible for managing the Trust's business affairs and for exercising all the Trust's powers except those reserved for the shareholders. The following tables give information about each Board member and the senior officers of the Fund. Where required, the tables separately list Board members who are “interested persons” of the Fund (i.e., “Interested” Board members) and those who are not (i.e., “Independent” Board members). Unless otherwise noted, the address of each person listed is Federated Investors Tower, 1001 Liberty Avenue, Pittsburgh, PA 15222. The address of all Independent Board members listed is 4000 Ericsson Drive, Warrendale, PA 15086-7561; Attention: Mutual Fund Board. As of December 31, 2008, the Trust comprised ten portfolios, and the Federated Fund Complex consisted of 40 investment companies (comprising 149 portfolios). Unless otherwise noted, each Officer is elected annually. Unless otherwise noted, each Board member oversees all portfolios in the Federated Fund Complex and serves for an indefinite term. The Fund's Statement of Additional Information includes additional information about Trust Trustees and is available, without charge and upon request, by calling 1-800-341-7400.
Interested TRUSTEES Background
Name
Birth Date
Positions Held with Trust
Date Service Began | Principal Occupation(s) for Past Five Years,
Other Directorships Held and Previous Position(s) |
John F. Donahue*
Birth Date: July 28, 1924
TRUSTEE
Began serving: April 1984 | Principal Occupations: Director or Trustee of the Federated Fund Complex; Chairman and Director, Federated Investors, Inc.; Chairman of the Federated Fund Complex's Executive Committee.
Previous Positions: Chairman of the Federated Fund Complex; Trustee, Federated Investment Management Company; Chairman and Director, Federated Investment Counseling. |
J. Christopher Donahue*
Birth Date: April 11, 1949
PRESIDENT AND TRUSTEE
Began serving: January 2000 | Principal Occupations: Principal Executive Officer and President of the Federated Fund Complex; Director or Trustee of some of the Funds in the Federated Fund Complex; President, Chief Executive Officer and Director, Federated Investors, Inc.; Chairman and Trustee, Federated Investment Management Company; Trustee, Federated Investment Counseling; Chairman and Director, Federated Global Investment Management Corp.; Chairman, Federated Equity Management Company of Pennsylvania and Passport Research, Ltd. (investment advisory subsidiary of Federated); Trustee, Federated Shareholder Services Company; Director, Federated Services Company.
Previous Positions: President, Federated Investment Counseling; President and Chief Executive Officer, Federated Investment Management Company, Federated Global Investment Management Corp. and Passport Research, Ltd. |
| * | Family relationships and reasons for “interested” status: John F. Donahue is the father of J. Christopher Donahue; both are “interested” due to their beneficial ownership of shares of Federated Investors, Inc. and the positions they hold with Federated and its subsidiaries. |
Annual Shareholder Report38
INDEPENDENT TRUSTEES Background
Name
Birth Date
Positions Held with Trust
Date Service Began | Principal Occupation(s) for Past Five Years,
Other Directorships Held and Previous Position(s) |
John T. Conroy, Jr., Ph.D.
Birth Date: June 23, 1937
TRUSTEE
Began serving: November 1991 | Principal Occupations: Director or Trustee of the Federated Fund Complex; Chairman of the Board, Investment Properties Corporation; Partner or Trustee in private real estate ventures in Southwest Florida; Assistant Professor in Theology, Blessed Edmund Rice School for Pastoral Ministry.
Previous Positions: President, Investment Properties Corporation; Senior Vice President, John R. Wood and Associates, Inc., Realtors; President, Naples Property Management, Inc. and Northgate Village Development Corporation. |
Nicholas P. Constantakis
Birth Date: September 3, 1939
TRUSTEE
Began serving: February 1998 | Principal Occupation: Director or Trustee of the Federated Fund Complex.
Other Directorship Held: Director and Chairman of the Audit Committee, Michael Baker Corporation (architecture, engineering and construction services).
Previous Position: Partner, Andersen Worldwide SC. |
John F. Cunningham
Birth Date: March 5, 1943
TRUSTEE
Began serving: January 1999 | Principal Occupation: Director or Trustee of the Federated Fund Complex.
Other Directorships Held: Chairman, President and Chief Executive Officer, Cunningham & Co., Inc. (strategic business consulting); Trustee Associate, Boston College.
Previous Positions: Director, Redgate Communications and EMC Corporation (computer storage systems); Chairman of the Board and Chief Executive Officer, Computer Consoles, Inc.; President and Chief Operating Officer, Wang Laboratories; Director, First National Bank of Boston; Director, Apollo Computer, Inc. |
Maureen Lally-Green
Birth Date: July 5, 1949
TRUSTEE
Began serving: August 2009 | Principal Occupations: Director or Trustee of the Federated Fund Complex; Director, Office of Church Relations, Diocese of Pittsburgh; Adjunct Professor of Law, Duquesne University School of Law.
Other Directorships Held: Director, Auberle; Trustee St. Francis University; Director, Ireland Institute of Pittsburgh; Director, UPMC Mercy Hospital; Regent, St. Vincent Seminary; Director, Epilepsy Foundation of Western and Central Pennsylvania; Director, Saint Thomas More Society, Allegheny County; Director, Carlow University.
Previous Position: Pennsylvania Superior Court Judge. |
Annual Shareholder Report39
Name
Birth Date
Positions Held with Trust
Date Service Began | Principal Occupation(s) for Past Five Years,
Other Directorships Held and Previous Position(s) |
Peter E. Madden
Birth Date: March 16, 1942
TRUSTEE
Began serving: November 1991 | Principal Occupation: Director or Trustee and Chairman of the Board of the Federated Fund Complex.
Other Directorship Held: Board of Overseers, Babson College.
Previous Positions: Representative, Commonwealth of Massachusetts General Court; President, Chief Operating Officer and Director, State Street Bank and Trust Company and State Street Corporation (retired); Director, VISA USA and VISA International; Chairman and Director, Massachusetts Bankers Association; Director, Depository Trust Corporation; Director, The Boston Stock Exchange. |
Charles F. Mansfield, Jr.
Birth Date: April 10, 1945
TRUSTEE
Began serving: January 1999 | Principal Occupations: Director or Trustee and Chairman of the Audit Committee of the Federated Fund Complex; Management Consultant.
Previous Positions: Chief Executive Officer, PBTC International Bank; Partner, Arthur Young & Company (now Ernst & Young LLP); Chief Financial Officer of Retail Banking Sector, Chase Manhattan Bank; Senior Vice President, HSBC Bank USA (formerly, Marine Midland Bank); Vice President, Citibank; Assistant Professor of Banking and Finance, Frank G. Zarb School of Business, Hofstra University; Executive Vice President DVC Group, Inc. (marketing, communications and technology). |
R. James Nicholson
Birth Date: February 4, 1938
TRUSTEE
Began serving: April 2008 | Principal Occupations: Director or Trustee of the Federated Fund Complex; Senior Counsel, Brownstein Hyatt Farber Schrek, P.C.; Former Secretary of the U.S. Dept. of Veterans Affairs; Former U.S. Ambassador to the Holy See; Former Chairman of the Republican National Committee.
Other Directorships Held: Director, Horatio Alger Association; Director, The Daniels Fund.
Previous Positions: Colonel, U.S. Army Reserve; Partner, Calkins, Kramer, Grimshaw and Harring, P.C.; General Counsel, Colorado Association of Housing and Building; Chairman and CEO, Nicholson Enterprises, Inc. (real estate holding company); Chairman and CEO, Renaissance Homes of Colorado. |
Thomas M. O'Neill
Birth Date: June 14, 1951
TRUSTEE
Began serving: October 2006 | Principal Occupations: Director or Trustee of the Federated Fund Complex; Managing Director and Partner, Navigator Management Company, L.P. (investment and strategic consulting).
Other Directorships Held: Board of Overseers, Children's Hospital of Boston; Visiting Committee on Athletics, Harvard College.
Previous Positions: Chief Executive Officer and President, Managing Director and Chief Investment Officer, Fleet Investment Advisors; President and Chief Executive Officer, Aeltus Investment Management, Inc.; General Partner, Hellman, Jordan Management Co., Boston, MA; Chief Investment Officer, The Putnam Companies, Boston, MA; Credit Analyst and Lending Officer, Fleet Bank; Director and Consultant, EZE Castle Software (investment order management software); Director, Midway Pacific (lumber). |
Annual Shareholder Report40
Name
Birth Date
Positions Held with Trust
Date Service Began | Principal Occupation(s) for Past Five Years,
Other Directorships Held and Previous Position(s) |
John S. Walsh
Birth Date: November 28, 1957
TRUSTEE
Began serving: January 1999 | Principal Occupations: Director or Trustee of the Federated Fund Complex; President and Director, Heat Wagon, Inc. (manufacturer of construction temporary heaters); President and Director, Manufacturers Products, Inc. (distributor of portable construction heaters); President, Portable Heater Parts, a division of Manufacturers Products, Inc.
Previous Position: Vice President, Walsh & Kelly, Inc. |
James F. Will
Birth Date: October 12, 1938
TRUSTEE
Began serving: April 2006 | Principal Occupations: Director or Trustee of the Federated Fund Complex; formerly, Vice Chancellor and President, Saint Vincent College.
Other Directorships Held: Trustee, Saint Vincent College; Alleghany Corporation.
Previous Positions: Chairman, President and Chief Executive Officer, Armco, Inc.; President and Chief Executive Officer, Cyclops Industries; President and Chief Operating Officer, Kaiser Steel Corporation. |
OFFICERS
Name
Birth Date
Address
Positions Held with Trust
Date Service Began | Principal Occupation(s) for Past Five Years
and Previous Position(s) |
John W. McGonigle
Birth Date: October 26, 1938
EXECUTIVE VICE PRESIDENT AND SECRETARY
Began serving: April 1984 | Principal Occupations: Executive Vice President and Secretary of the Federated Fund Complex; Vice Chairman, Executive Vice President, Secretary and Director, Federated Investors, Inc.
Previous Positions: Trustee, Federated Investment Management Company and Federated Investment Counseling; Director, Federated Global Investment Management Corp., Federated Services Company and Federated Securities Corp. |
Richard A. Novak
Birth Date: December 25, 1963
TREASURER
Began serving: January 2006 | Principal Occupations: Principal Financial Officer and Treasurer of the Federated Fund Complex; Senior Vice President, Federated Administrative Services; Financial and Operations Principal for Federated Securities Corp., Edgewood Services, Inc. and Southpointe Distribution Services, Inc.
Previous Positions: Controller of Federated Investors, Inc.; Vice President, Finance of Federated Services Company; held various financial management positions within The Mercy Hospital of Pittsburgh; Auditor, Arthur Andersen & Co. |
Richard B. Fisher
Birth Date: May 17, 1923
VICE PRESIDENT
Began serving: April 1984 | Principal Occupations: Vice Chairman or Vice President of some of the Funds in the Federated Fund Complex; Vice Chairman, Federated Investors, Inc.; Chairman, Federated Securities Corp.
Previous Positions: President and Director or Trustee of some of the Funds in the Federated Fund Complex; Executive Vice President, Federated Investors, Inc.; Director and Chief Executive Officer, Federated Securities Corp. |
Annual Shareholder Report41
Name
Birth Date
Address
Positions Held with Trust
Date Service Began | Principal Occupation(s) for Past Five Years
and Previous Position(s) |
Brian P. Bouda
Birth Date: February 28, 1947
CHIEF COMPLIANCE OFFICER AND SENIOR VICE PRESIDENT
Began serving: August 2004 | Principal Occupations: Senior Vice President and Chief Compliance Officer of the Federated Fund Complex; Vice President and Chief Compliance Officer of Federated Investors, Inc. and Chief Compliance Officer of its subsidiaries. Mr. Bouda joined Federated in 1999 and is a member of the American Bar Association and the State Bar Association of Wisconsin. |
Stephen F. Auth
Birth Date: September 3, 1956
450 Lexington Avenue
Suite 3700
New York, NY 10017-3943
CHIEF INVESTMENT OFFICER
Began serving: November 2002 | Principal Occupations: Mr. Auth is Chief Investment Officer of this Fund and various other Funds in the Federated Fund Complex; Executive Vice President, Federated Investment Counseling, Federated Global Investment Management Corp. and Federated Equity Management Company of Pennsylvania.
Previous Positions: Executive Vice President, Federated Investment Management Company, and Passport Research, Ltd. (investment advisory subsidiary of Federated); Senior Vice President, Global Portfolio Management Services Division; Senior Vice President, Federated Investment Management Company and Passport Research, Ltd.; Senior Managing Director and Portfolio Manager, Prudential Investments. |
Lawrence Auriana
Birth Date: January 8, 1944
140 East 45th Street
New York, NY 10017
VICE PRESIDENT
Began serving: November 2001 | Principal Occupations: Lawrence Auriana is Vice President of the Trust. Mr. Auriana joined Federated in April 2001 as Co-Head of Investments/Federated Kaufmann. From August 1984 to April 2001, Mr. Auriana was President and Treasurer of Edgemont Asset Management Corp., and Chairman of the Board and Portfolio Manager to The Kaufmann Fund, Inc. (predecessor to the Federated Kaufmann Fund). Mr. Auriana earned a B.S. in economics from Fordham University and has been engaged in the securities business since 1965. |
Walter C. Bean
Birth Date: June 22, 1945
VICE PRESIDENT
Began serving: November 2006 | Principal Occupations: Walter C. Bean is Vice President of the Trust. Mr. Bean is a Senior Vice President, Senior Portfolio Manager and the Head of the Equity Income Management Team of the Fund's Adviser. Mr. Bean joined Federated in 2000. His previous associations included: various investment management and research positions with C.S. McKee & Company; First Chicago Investment Advisors; CIGNA Investment Advisors; and Mellon Bank. Mr. Bean earned a Bachelors Degree in Business Administration from Ohio University and an M.B.A. from the Pennsylvania State University. Mr. Bean is a Chartered Financial Analyst and has 40 years of investment experience. |
Hans P. Utsch
Birth Date: July 3, 1936
140 East 45th Street
New York, NY 10017
VICE PRESIDENT
Began serving: November 2001 | Principal Occupations: Hans P. Utsch is Vice President of the Trust. Mr. Utsch joined Federated in April 2001 as Co-Head of Investments/Federated Kaufmann. From August 1984 to April 2001, Mr. Utsch was Chairman of the Board and Secretary of Edgemont Asset Management Corp., and President and Portfolio Manager to The Kaufmann Fund, Inc. (predecessor to the Federated Kaufmann Fund). Mr. Utsch graduated from Amherst College and holds an M.B.A. from Columbia University. He has been engaged in the securities business since 1962. |
Annual Shareholder Report42
Evaluation and Approval of Advisory Contract - May 2009
Federated Market Opportunity Fund (the “Fund”)
The Fund's Board reviewed the Fund's investment advisory and subadvisory contracts at meetings held in May 2009. The Board's decision regarding these contracts reflects the exercise of its business judgment on whether to continue the existing arrangements.
In this connection, the Federated funds' Board had previously appointed a Senior Officer, whose duties include specified responsibilities relating to the process by which advisory fees are to be charged to a Federated fund. The Senior Officer has the authority to retain consultants, experts, or staff as may be reasonably necessary to assist in the performance of his duties, reports directly to the Board, and may be terminated only with the approval of a majority of the independent members of the Board. The Senior Officer prepared and furnished to the Board an independent, written evaluation that covered topics discussed below. The Board considered that evaluation, along with other information, in deciding to approve the advisory and subadvisory contracts.
During its review of these contracts, the Board considered compensation and benefits received by the Adviser and subadviser. This included the fees received for services provided to the Fund by other entities in the Federated organization and research services received by the Adviser from brokers that execute Federated fund trades, as well as advisory fees. The Board is also familiar with and considered judicial decisions concerning allegedly excessive investment advisory fees, which have indicated that the following factors may be relevant to an Adviser's fiduciary duty with respect to its receipt of compensation from a fund: the nature and quality of the services provided by the Adviser, including the performance of the fund; the Adviser's cost of providing the services; the extent to which the Adviser may realize “economies of scale” as a fund grows larger; any indirect benefits that may accrue to the Adviser and its affiliates as a result of the Adviser's relationship with a fund; performance and expenses of comparable funds; and the extent to which the independent Board members are fully informed about all facts the Board deems relevant bearing on the Adviser's services and fees. The Board further considered management fees (including any components thereof) charged to institutional and other clients of the Adviser and subadviser for what might be viewed as like services, and the cost to the Adviser and its affiliates of supplying services pursuant to the management fee agreements, excluding any intra-corporate profit and profit margins of the Adviser and its affiliates for supplying such services. The Board was aware of these factors and was guided by them in its review of the Fund's advisory and subadvisory contracts to the extent it considered them to be appropriate and relevant, as discussed further below.
Annual Shareholder Report43
The Board considered and weighed these circumstances in light of its substantial accumulated experience in governing the Fund and working with Federated on matters relating to the Federated funds, and was assisted in its deliberations by independent legal counsel. Throughout the year, the Board has requested and received substantial and detailed information about the Fund and the Federated organization that was in addition to the extensive materials that comprise and accompany the Senior Officer's evaluation. Federated provided much of this information at each regular meeting of the Board, and furnished additional reports in connection with the particular meeting at which the Board's formal review of the advisory and subadvisory contracts occurred. Between regularly scheduled meetings, the Board also received information on particular matters as the need arose. Thus, the Board's consideration of the advisory and subadvisory contracts included review of the Senior Officer's evaluation, accompanying data and additional reports covering such matters as: the Adviser's and subadviser's investment philosophy, revenue, profitability, personnel and processes; investment and operating strategies; the Fund's short- and long-term performance (in absolute terms, both on a gross basis and net of expenses, as well as in relationship to its particular investment program and certain competitor or “peer group” funds and/or other benchmarks, as appropriate), and comments on the reasons for performance; the Fund's investment objectives; the Fund's expenses (including the advisory fee itself and the overall expense structure of the Fund, both in absolute terms and relative to similar and/or competing funds, with due regard for contractual or voluntary expense limitations); the use and allocation of brokerage commissions derived from trading the Fund's portfolio securities (if any); and the nature, quality and extent of the advisory and other services provided to the Fund by the Adviser and its affiliates. The Board also considered the preferences and expectations of Fund shareholders and their relative sophistication; the continuing state of competition in the mutual fund industry and market practices; the range of comparable fees for similar funds in the mutual fund industry; the Fund's relationship to the Federated family of funds which include a comprehensive array of funds with different investment objectives, policies and strategies which are available for exchange without the incurrence of additional sales charges; compliance and audit reports concerning the Federated funds and the Federated companies that service them (including communications from regulatory agencies), as well as Federated's responses to any issues raised therein; and relevant developments in the mutual fund industry and how the Federated funds and/or Federated are responding to them. The Board's evaluation process is evolutionary. The criteria considered and the emphasis placed on relevant criteria change in recognition of changing circumstances in the mutual fund marketplace. Annual Shareholder Report44
With respect to the Fund's performance and expenses in particular, the Board has found the use of comparisons to other mutual funds with comparable investment programs to be particularly useful, given the high degree of competition in the mutual fund business. The Board focused on comparisons with other similar mutual funds more heavily than non-mutual fund products or services because it is believed that they are more relevant. For example, other mutual funds are the products most like the Fund, they are readily available to Fund shareholders as alternative investment vehicles, and they are the type of investment vehicle in fact chosen and maintained by the Fund's investors. The range of their fees and expenses therefore appears to be a generally reliable indication of what consumers have found to be reasonable in the precise marketplace in which the Fund competes. The Fund's ability to deliver competitive performance when compared to its peer group was a useful indicator of how the Adviser is executing the Fund's investment program, which in turn assisted the Board in reaching a conclusion that the nature, extent, and quality of the Adviser's investment management services were such as to warrant continuation of the advisory contract. In this regard, the Senior Officer has reviewed Federated's fees for providing advisory services to products outside the Federated family of funds (e.g., institutional and separate accounts). He concluded that mutual funds and institutional accounts are inherently different products. Those differences include, but are not limited to, different types of targeted investors; being subject to different laws and regulations; different legal structures; different average account sizes; different associated costs; different portfolio management techniques made necessary by different cash flows; and portfolio manager time spent in review of securities pricing. The Senior Officer did not consider these fee schedules to be determinative in judging the appropriateness of mutual fund advisory contracts.The Senior Officer reviewed reports compiled by Federated, using data supplied by independent fund ranking organizations, regarding the performance of, and fees charged by, other mutual funds, noting his view that comparisons to fund peer groups are highly important in judging the reasonableness of proposed fees.
For the periods covered by the report, the Fund's performance for the one-year period and the three-year period was above the median of the relevant peer group, and the Fund's performance fell below the median of the relevant peer group for the five-year period. The Board discussed the Fund's performance with the Adviser and recognized the efforts being undertaken by the Adviser. The Board will continue to monitor these efforts and the performance of the Fund.
The Board also received financial information about Federated, including reports on the compensation and benefits Federated derived from its relationships with the Federated funds. These reports covered not only the fees under the advisory contracts, but also fees received by Federated's subsidiaries for providing other services to the Federated funds under separate contracts Annual Shareholder Report45
(e.g., for serving as the Federated funds' administrator). The reports also discussed any indirect benefit Federated may derive from its receipt of research services from brokers who execute Federated fund trades. In addition, the Board considered the fact that, in order for a fund to be competitive in the marketplace, Federated and its affiliates frequently waived fees and/or reimbursed expenses and have disclosed to fund investors and/or indicated to the Board their intention to do so in the future, where appropriate. Moreover, the Board receives regular reports regarding the institution or elimination of these voluntary waivers.Federated furnished reports, requested by the Senior Officer, that reported revenues on a fund-by-fund basis and made estimates of the allocation of expenses on a fund-by-fund basis, using allocation methodologies specified by the Senior Officer. The Senior Officer noted that, although they may apply consistent allocation processes, the inherent difficulties in allocating costs (and the unavoidable arbitrary aspects of that exercise) and the lack of consensus on how to allocate those costs may render such allocation reports unreliable. The allocation reports were considered in the analysis by the Board but were determined to be of limited use.
The Board and the Senior Officer also reviewed a report compiled by Federated comparing profitability information for Federated to other publicly held fund management companies. In this regard, the Senior Officer noted the limited availability of such information, but nonetheless concluded that Federated's profit margins did not appear to be excessive and the Board agreed.
The Senior Officer's evaluation also discussed the notion of possible realization of “economies of scale” as a fund grows larger. The Board considered in this regard that the Adviser has made significant and long-term investments in areas that support all of the Federated funds, such as personnel and processes for the portfolio management, compliance, and risk management functions; and systems technology; and that the benefits of these efforts (as well as any economies, should they exist) were likely to be enjoyed by the fund complex as a whole. Finally, the Board also noted the absence of any applicable regulatory or industry guidelines on this subject, which (as discussed in the Senior Officer's evaluation) is compounded by the lack of any common industry practice or general pattern with respect to structuring fund advisory fees with “breakpoints” that serve to reduce the fee as the fund attains a certain size. The Senior Officer did not recommend institution of breakpoints in pricing Federated's fund advisory services at this time.
It was noted in the materials for the Board meeting that for the period covered by the report, the Fund's investment advisory fee, after waivers and expense reimbursements, if any, was above the median of the relevant peer group. The Board reviewed the fees and other expenses of the Fund with the Adviser and was satisfied that the overall expense structure of the Fund remained competitive. The Board will continue to monitor advisory fees and other expenses borne by the Fund.
Annual Shareholder Report46
The Senior Officer's evaluation noted his belief that the information and observations contained in his evaluation supported a finding that the proposed management fees are reasonable, and that Federated appeared to provide appropriate administrative services to the Fund for the fees paid. Under these circumstances, no changes were recommended to, and no objection was raised to, the continuation of the Fund's advisory and subadvisory contracts. The Board concluded that the nature, quality and scope of services provided the Fund by the Adviser and its affiliates were satisfactory.In its decision to continue an existing investment advisory contract, the Board was mindful of the potential disruptions of the Fund's operations and various risks, uncertainties and other effects that could occur as a result of a decision to terminate or not renew an advisory contract. In particular, the Board recognized that many shareholders have invested in the Fund on the strength of the Adviser's industry standing and reputation and with the expectation that the Adviser will have a continuing role in providing advisory services to the Fund. Thus, the Board's approval of the advisory contract reflected the fact that it is the shareholders who have effectively selected the Adviser by virtue of having invested in the Fund.
The Board based its decision to approve the advisory and subadvisory contracts on the totality of the circumstances and relevant factors and with a view to past and future long-term considerations. Not all of the factors and considerations identified above were necessarily relevant to the Fund, nor did the Board consider any one of them to be determinative. With respect to the factors that were relevant, the Board's decision to approve the contract reflects its determination that Federated's performance and actions provided a satisfactory basis to support the decision to continue the existing arrangements.
Annual Shareholder Report47
Voting Proxies on Fund Portfolio Securities
A description of the policies and procedures that the Fund uses to determine how to vote proxies, if any, relating to securities held in the Fund's portfolio is available, without charge and upon request, by calling 1-800-341-7400. A report on “Form N-PX” of how the Fund voted any such proxies during the most recent 12-month period ended June 30 is available from Federated's Web site at FederatedInvestors.com. To access this information from the “Products” section of the Web site, click on the “Prospectuses and Regulatory Reports” link under “Related Information,” then select the appropriate link opposite the name of the Fund; or select the name of the Fund and from the Fund's page, click on the “Prospectuses and Regulatory Reports” link. Form N-PX filings are also available at the SEC's Web site at www.sec.gov.
Quarterly Portfolio Schedule
The Fund files with the SEC a complete schedule of its portfolio holdings, as of the close of the first and third quarters of its fiscal year, on “Form N-Q.” These filings are available on the SEC's Web site at www.sec.gov and may be reviewed and copied at the SEC's Public Reference Room in Washington, DC. (Call 1-800-SEC-0330 for information on the operation of the Public Reference Room.) You may also access this information from the “Products” section of Federated's Web site at FederatedInvestors.com by clicking on “Portfolio Holdings” under “Related Information,” then selecting the appropriate link opposite the name of the Fund; or select the name of the Fund and from the Fund's page, click on the “Portfolio Holdings” link.
Annual Shareholder Report48
Mutual funds are not bank deposits or obligations, are not guaranteed by any bank and are not insured or guaranteed by the U.S. government, the Federal Deposit Insurance Corporation, the Federal Reserve Board or any other government agency. Investment in mutual funds involves investment risk, including the possible loss of principal.
This Report is authorized for distribution to prospective investors only when preceded or accompanied by the Fund's Prospectus, which contains facts concerning its objective and policies, management fees, expenses and other information.
Federated Market Opportunity Fund
Federated Investors Funds
4000 Ericsson Drive
Warrendale, PA 15086-7561
Contact us at FederatedInvestors.com
or call 1-800-341-7400.
Federated Securities Corp., Distributor
Cusip 314172453
37774 (12/09)
Federated is a registered mark of Federated Investors, Inc.
2009 Federated Investors, Inc.
Federated Mid Cap Growth Strategies FundEstablished 1984
A Portfolio of Federated Equity Funds
ANNUAL SHAREHOLDER REPORTOctober 31, 2009
Class A Shares
Class B Shares
Class C Shares
Class K Shares
FINANCIAL HIGHLIGHTS
SHAREHOLDER EXPENSE EXAMPLE
MANAGEMENT'S DISCUSSION OF FUND PERFORMANCE
PORTFOLIO OF INVESTMENTS SUMMARY TABLE
PORTFOLIO OF INVESTMENTS
STATEMENT OF ASSETS AND LIABILITIES
STATEMENT OF OPERATIONS
STATEMENT OF CHANGES IN NET ASSETS
NOTES TO FINANCIAL STATEMENTS
REPORT OF INDEPENDENT REGISTERED PUBLIC ACCOUNTING FIRM
BOARD OF TRUSTEES AND TRUST OFFICERS
EVALUATION AND APPROVAL OF ADVISORY CONTRACT
VOTING PROXIES ON FUND PORTFOLIO SECURITIES
QUARTERLY PORTFOLIO SCHEDULE
Financial Highlights - Class A Shares
(For a Share Outstanding Throughout Each Period)
| Year Ended October 31 | 2009 | 2008 | 2007 | 20061 | 2005 |
| Net Asset Value, Beginning of Period | $24.05 | $45.41 | $36.12 | $31.85 | $27.44 |
| Income From Investment Operations: | | | | | |
| Net investment income (loss) | 0.092 | (0.00)2,3 | (0.12)2 | (0.09)2 | (0.10)2 |
| Net realized and unrealized gain (loss) on investments and foreign currency transactions | 2.61 | (17.11) | 9.41 | 4.36 | 4.51 |
| TOTAL FROM INVESTMENT OPERATIONS | 2.70 | (17.11) | 9.29 | 4.27 | 4.41 |
| Less Distributions: | | | | | |
| Distributions from net realized gain on investments and foreign currency transactions | — | (4.25) | — | — | — |
| Regulatory Settlement Proceeds | 0.024 | — | — | — | — |
| Net Asset Value, End of Period | $26.77 | $24.05 | $45.41 | $36.12 | $31.85 |
| Total Return5 | 11.31%4 | (41.21)% | 25.72% | 13.41% | 16.07%6 |
| Ratios to Average Net Assets: | | | | | |
| Net expenses7 | 0.99%8 | 0.99%8 | 0.98%8 | 0.99%8 | 1.21%8 |
| Net investment income (loss) | 0.37% | (0.00)%9 | (0.29)% | (0.25)% | (0.32)% |
| Expense waiver/reimbursement10 | 0.45% | 0.32% | 0.28% | 0.28% | 0.06% |
| Supplemental Data: | | | | | |
| Net assets, end of period (000 omitted) | $298,431 | $293,777 | $544,647 | $492,751 | $537,322 |
| Portfolio turnover | 207% | 215% | 118% | 115% | 139% |
| 1 | Beginning with the year ended October 31, 2006, the Fund was audited by KPMG LLP. The previous year was audited by another independent registered public accounting firm. |
| 2 | Per share numbers have been calculated using the average shares method. |
| 3 | Represents less than $0.01. |
| 4 | During the year, the Fund received a regulatory settlement from an unaffiliated third party, which had an impact of 0.08% on the total return. (See Notes to Financial Statements, Note 8.) |
| 5 | Based on net asset value, which does not reflect the sales charge, redemption fee or contingent deferred sales charge, if applicable. |
| 6 | During the period, the Fund was reimbursed by an affiliated shareholder services provider, which had an impact of 0.07% on the total return. |
| 7 | Pursuant to a settlement with the New York Attorney General, the Adviser has agreed to waive management fees in compliance with an Assurance of Discontinuance dated November 17, 2005. The net management fee was reduced to 0.4975% effective January 1, 2006, and may not be increased until after December 31, 2010. |
| 8 | The net expense ratio is calculated without reduction for expense offset arrangements. The net expense ratios are 0.96%, 0.98%, 0.98%, 0.99% and 1.19% for the years ended October 31, 2009, 2008, 2007, 2006 and 2005, respectively, after taking into account these expense reductions. |
| 9 | Represents less than 0.01%. |
| 10 | This expense decrease is reflected in both the net expense and the net investment income (loss) ratios shown above. |
- See Notes which are an integral part of the Financial Statements
Annual Shareholder Report1
Financial Highlights - Class B Shares
(For a Share Outstanding Throughout Each Period)
| Year Ended October 31 | 2009 | 2008 | 2007 | 20061 | 2005 |
| Net Asset Value, Beginning of Period | $21.23 | $40.89 | $32.77 | $29.13 | $25.31 |
| Income from Investment Operations: | | | | | |
| Net investment income (loss) | (0.06)2 | (0.24)2 | (0.38)2 | (0.34)2 | (0.32)2 |
| Net realized and unrealized gain (loss) on investments and foreign currency transactions | 2.27 | (15.17) | 8.50 | 3.98 | 4.14 |
| TOTAL FROM INVESTMENT OPERATIONS | 2.21 | (15.41) | 8.12 | 3.64 | 3.82 |
| Less Distributions: | | | | | |
| Distributions from net realized gain on investments and foreign currency transactions | — | (4.25) | — | — | — |
| Regulatory Settlement Proceeds | 0.023 | — | — | — | — |
| Net Asset Value, End of Period | $23.46 | $21.23 | $40.89 | $32.77 | $29.13 |
| Total Return4 | 10.50%3 | (41.65)% | 24.78% | 12.50% | 15.09% |
| Ratios to Average Net Assets: | | | | | |
| Net expenses5 | 1.73%6 | 1.74%6 | 1.74%6 | 1.79%6 | 2.04%6 |
| Net investment loss | (0.28)% | (0.75)% | (1.05)% | (1.05)% | (1.13)% |
| Expense waiver/reimbursement7 | 0.52% | 0.39% | 0.34% | 0.26% | 0.00%8 |
| Supplemental Data: | | | | | |
| Net assets, end of period (000 omitted) | $11,669 | $21,592 | $76,376 | $92,883 | $129,155 |
| Portfolio turnover | 207% | 215% | 118% | 115% | 139% |
| 1 | Beginning with the year ended October 31, 2006, the Fund was audited by KPMG LLP. The previous year was audited by another independent registered public accounting firm. |
| 2 | Per share numbers have been calculated using the average shares method. |
| 3 | During the year, the Fund received a regulatory settlement from an unaffiliated third party, which had an impact of 0.14% on the total return. (See Notes to Financial Statements, Note 8.) |
| 4 | Based on net asset value, which does not reflect the sales charge, redemption fee or contingent deferred sales charge, if applicable. |
| 5 | Pursuant to a settlement with the New York Attorney General, the Adviser has agreed to waive management fees in compliance with an Assurance of Discontinuance dated November 17, 2005. The net management fee was reduced to 0.4975% effective January 1, 2006, and may not be increased until after December 31, 2010. |
| 6 | The net expense ratio is calculated without reduction for expense offset arrangements. The net expense ratios are 1.69%, 1.73%, 1.74%, 1.78% and 2.02% for the years ended October 31, 2009, 2008, 2007, 2006 and 2005, respectively, after taking into account these expense reductions. |
| 7 | This expense decrease is reflected in both the net expense and the net investment income (loss) ratios shown above. |
| 8 | Represents less than 0.01%. |
- See Notes which are an integral part of the Financial Statements
Annual Shareholder Report2
Financial Highlights - Class C Shares
(For a Share Outstanding Throughout Each Period)
| Year Ended October 31 | 2009 | 2008 | 2007 | 20061 | 2005 |
| Net Asset Value, Beginning of Period | $21.47 | $41.29 | $33.10 | $29.41 | $25.56 |
| Income from Investment Operations: | | | | | |
| Net investment income (loss) | (0.08)2 | (0.24)2 | (0.39)2 | (0.33)2 | (0.33)2 |
| Net realized and unrealized gain (loss) on investments and foreign currency transactions | 2.31 | (15.33) | 8.58 | 4.02 | 4.18 |
| TOTAL FROM INVESTMENT OPERATIONS | 2.23 | (15.57) | 8.19 | 3.69 | 3.85 |
| Less Distributions: | | | | | |
| Distributions from net realized gain on investments and foreign currency transactions | — | (4.25) | — | — | — |
| Regulatory Settlement Proceeds | 0.023 | — | — | — | — |
| Net Asset Value, End of Period | $23.72 | $21.47 | $41.29 | $33.10 | $29.41 |
| Total Return4 | 10.48%3 | (41.64)% | 24.74% | 12.55% | 15.06% |
| Ratios to Average Net Assets: | | | | | |
| Net expenses5 | 1.74%6 | 1.74%6 | 1.74%6 | 1.77%6 | 2.04%6 |
| Net investment loss | (0.36)% | (0.75)% | (1.04)% | (1.03)% | (1.13)% |
| Expense waiver/reimbursement7 | 0.49% | 0.35% | 0.29% | 0.26% | 0.00%8 |
| Supplemental Data: | | | | | |
| Net assets, end of period (000 omitted) | $11,880 | $13,227 | $27,366 | $29,341 | $30,903 |
| Portfolio turnover | 207% | 215% | 118% | 115% | 139% |
| 1 | Beginning with the year ended October 31, 2006, the Fund was audited by KPMG LLP. The previous year was audited by another independent registered public accounting firm. |
| 2 | Per share numbers have been calculated using the average shares method. |
| 3 | During the year, the Fund received a regulatory settlement from an unaffiliated third party, which had an impact of 0.09% on the total return. (See Notes to Financial Statements, Note 8.) |
| 4 | Based on net asset value, which does not reflect the sales charge, redemption fee or contingent deferred sales charge, if applicable. |
| 5 | Pursuant to a settlement with the New York Attorney General, the Adviser has agreed to waive management fees in compliance with an Assurance of Discontinuance dated November 17, 2005. The net management fee was reduced to 0.4975% effective January 1, 2006, and may not be increased until after December 31, 2010. |
| 6 | The net expense ratio is calculated without reduction for expense offset arrangements. The net expense ratios are 1.71%, 1.73%, 1.73%, 1.77% and 2.02% for the years ended October 31, 2009, 2008, 2007, 2006 and 2005, respectively, after taking into account these expense reductions. |
| 7 | This expense decrease is reflected in both the net expense and the net investment income (loss) ratios shown above. |
| 8 | Represents less than 0.01%. |
- See Notes which are an integral part of the Financial Statements
Annual Shareholder Report3
Financial Highlights - Class K Shares
(For a Share Outstanding Throughout Each Period)
| Year Ended October 31, | Period Ended
10/31/20071 |
| 2009 | 2008 |
| Net Asset Value, Beginning of Period | $23.97 | $45.41 | $37.77 |
| Income from Investment Operations: | | | |
| Net investment income (loss) | (0.06)2 | (0.18)2 | (0.16)2 |
| Net realized and unrealized gain (loss) on investments and foreign currency transactions | 2.63 | (17.01) | 7.80 |
| TOTAL FROM INVESTMENT OPERATIONS | 2.57 | (17.19) | 7.64 |
| Less Distributions: | | | |
| Distributions from net realized gain on investments and foreign currency transactions | — | (4.25) | — |
| Net Asset Value, End of Period | $26.54 | $23.97 | $45.41 |
| Total Return3 | 10.72% | (41.40)% | 20.23% |
| Ratios to Average Net Assets: | | | |
| Net expenses4 | 1.49%5 | 1.49%5 | 1.47%5,6 |
| Net investment income (loss) | (0.26)% | (0.51)% | (0.81)%6 |
| Expense waiver/reimbursement7 | 0.37% | 0.30% | 0.26%6 |
| Supplemental Data: | | | |
| Net assets, end of period (000 omitted) | $461 | $150 | $08 |
| Portfolio turnover | 207% | 215% | 118%9 |
| 1 | Reflects operations for the period from December 12, 2006 (date of initial public offering) to October 31, 2007. |
| 2 | Per share numbers have been calculated using the average shares method. |
| 3 | Based on net asset value, which does not reflect the sales charge, redemption fee or contingent deferred sales charge, if applicable. Total returns for periods of less than one year are not annualized. |
| 4 | Pursuant to a settlement with the New York Attorney General, the Adviser has agreed to waive management fees in compliance with an Assurance of Discontinuance dated November 17, 2005. The net management fee was reduced to 0.4975% effective January 1, 2006, and may not be increased until after December 31, 2010. |
| 5 | The net expense ratio is calculated without reduction for expense offset arrangements. The net expense ratios are 1.46%, 1.47% and 1.46% for the years ended October 31, 2009 and 2008, and for the period ended October 31, 2007, respectively, after taking into account these expense reductions. |
| 6 | Computed on an annualized basis. |
| 7 | This expense decrease is reflected in both the net expense and the net investment income (loss) ratios shown above. |
| 8 | Represents less than $1,000. |
| 9 | Portfolio turnover is calculated at the Fund level. Percentage indicated was calculated for the entire fiscal year ended October 31, 2007. |
- See Notes which are an integral part of the Financial Statements
Annual Shareholder Report4
Shareholder Expense Example (unaudited)
As a shareholder of the Fund, you incur two types of costs: (1) transaction costs, including sales charges (loads) on purchase or redemption payments; and (2) ongoing costs, including management fees and to the extent applicable, distribution (12b-1) fees and/or shareholder services fees and other Fund expenses. This Example is intended to help you to understand your ongoing costs (in dollars) of investing in the Fund and to compare these costs with the ongoing costs of investing in other mutual funds. It is based on an investment of $1,000 invested at the beginning of the period and held for the entire period from May 1, 2009 to October 31, 2009.
ACTUAL EXPENSES
The first section of the table below provides information about actual account values and actual expenses. You may use the information in this section, together with the amount you invested, to estimate the expenses that you incurred over the period. Simply divide your account value by $1,000 (for example, an $8,600 account value divided by $1,000 = 8.6), then multiply the result by the number in the first section under the heading entitled “Expenses Paid During Period” to estimate the expenses attributable to your investment during this period.
HYPOTHETICAL EXAMPLE FOR COMPARISON PURPOSES
The second section of the table below provides information about hypothetical account values and hypothetical expenses based on the Fund's actual expense ratio and an assumed rate of return of 5% per year before expenses, which is not the Fund's actual return. Thus, you should not use the hypothetical account values and expenses to estimate the actual ending account balance or your expenses for the period. Rather, these figures are required to be provided to enable you to compare the ongoing costs of investing in the Fund with other funds. To do so, compare this 5% hypothetical example with the 5% hypothetical examples that appear in the shareholder reports of the other funds.
Annual Shareholder Report5
Please note that the expenses shown in the table are meant to highlight your ongoing costs only and do not reflect any transaction costs, such as sales charges (loads) on purchase or redemption payments. Therefore, the second section of the table is useful in comparing ongoing costs only, and will not help you determine the relative total costs of owning different funds. In addition, if these transaction costs were included, your costs would have been higher. | Beginning
Account Value
5/1/2009 | Ending
Account Value
10/31/2009 | Expenses Paid
During Period1 |
| Actual: | | | |
| Class A Shares | $1,000 | $1,117.30 | $5.28 |
| Class B Shares | $1,000 | $1,113.40 | $9.06 |
| Class C Shares | $1,000 | $1,113.10 | $9.27 |
| Class K Shares | $1,000 | $1,114.20 | $7.94 |
Hypothetical (assuming a 5% return
before expenses): | | | |
| Class A Shares | $1,000 | $1,020.21 | $5.04 |
| Class B Shares | $1,000 | $1,016.64 | $8.64 |
| Class C Shares | $1,000 | $1,016.43 | $8.84 |
| Class K Shares | $1,000 | $1,017.69 | $7.58 |
| 1 | Expenses are equal to the Fund's annualized net expense ratios, multiplied by the average account value over the period, multiplied by 184/365 (to reflect the one-half-year period). The annualized net expense ratios are as follows: |
| Class A Shares | 0.99% |
| Class B Shares | 1.70% |
| Class C Shares | 1.74% |
| Class K Shares | 1.49% |
Annual Shareholder Report6
Performance data quoted represents past performance which is no guarantee of future results. Investment return and principal value will fluctuate so that an investor's shares, when redeemed, may be worth more or less than their original cost. Mutual fund performance changes over time and current performance may be lower or higher than what is stated. For current to the most recent month-end performance and after-tax returns, visit FederatedInvestors.com or call 1-800-341-7400.
Management's Discussion of Fund Performance (unaudited)
The Fund's total return, based on net asset value, for the fiscal year ended October 31, 2009, was 11.31% for the Class A Shares, 10.50% for the Class B Shares, 10.48% for the Class C Shares and 10.72% for the Class K Shares. The total return of the Russell Midcap Growth Index (RMCGI)1 was 22.48% for the same period. The Fund's total return for the fiscal year reflected actual cash flows, transaction costs and other expenses which were not reflected in the total return of the RMCGI.
MARKET OVERVIEW
Mid-cap growth stocks, as measured by the RMCGI, had a strong 12-month period. Mid-cap growth stocks outpaced mid cap value stocks by 796 basis points and also outperformed the Standard & Poor's 500 Index2 by 1268 basis points over the 12-month reporting period.
The biggest investment issues in the period were the sharp decline in global economic activity brought about by collapsing real estate prices and the strong rebound in equity markets after unprecedented fiscal and monetary stimuli.
| 1 | Russell Midcap® Growth Index measures the performance of those Russell Midcap companies with higher price-to-book ratios and higher forecasted growth values. The stocks are also members of the Russell 1000® Growth Index. Investments cannot be made directly in an index. |
| 2 | S&P 500 Index is an unmanaged capitalization-weighted index of 500 stocks designed to measure performance of the broad domestic economy through changes in the aggregate market value of 500 stocks representing all major industries. Investments cannot be made directly in an index. |
Annual Shareholder Report7
FUND PERFORMANCE
The Fund underperformed its benchmark RMCGI by 1117 basis points, and ranked in the 71 percentile of the Mid Cap Growth Peer Group of Morningstar3 and in the 73 percentile of the Lipper Mid Cap Peer Group.4
Equity market performance during the fiscal year was dominated by the market's preference for high beta, small capitalization, lower quality stocks, which is contrary to the Fund's investment style and detracted from the Fund's performance relative to its benchmark. The Consumer Discretionary, Materials and Information Technology sectors provided the highest market returns during the fiscal year.
The Fund's performance relative to its benchmark was aided by its stock selection in the Consumer Discretionary sector, and by its stock selection and overweighted position relative to its benchmark in the Materials sector. Positive individual contributors to Fund performance were Lubrizol Corp., Cognizant Technology Solutions Corp. and Kohl's Corp.
The Fund's overall underperformance relative to its benchmark resulted primarily from stock selection in Health Care (where the Fund's positions in biotech stocks were negative contributors), and in the Information Technology sector (where the market preference for lower quality stocks prevailed). Specific holdings that detracted from Fund performance included Cephalon, Inc., Penn Virginia Corp. and Genzyme.
| 3 | Morningstar Category identifies funds based on their actual investment styles as measured by their underlying portfolio holdings over the past three years. For the year ending October 31, 2009, the Fund ranked in the 56 percentile out of 636 funds and in the 74 percentile out of 328 funds for the five- and ten-year periods, respectively. 2009 Morningstar, Inc. All Rights Reserved. The information contained herein: (1) is proprietary to Morningstar and/or its content providers; (2) may not be copied or distributed; and (3) is not warranted to be accurate, complete or timely. Neither Morningstar nor its content providers are responsible for any damages or losses arising from any use of this information. Past performance is no guarantee of future results. |
| 4 | For the year ending October 31, 2009, the Fund ranked 143 out of 308 funds and 76 out of 161 funds for the five- and ten-year periods, respectively. Lipper Averages represent the average total returns reported by all mutual funds designated by Lipper, Inc. as falling into the respective categories indicated. These figures do not reflect sales charges. |
Annual Shareholder Report8
GROWTH OF A $10,000 INVESTMENT - CLASS A SHARES
The graph below illustrates the hypothetical investment of $10,0001 in Federated Mid Cap Growth Strategies Fund (Class A Shares) (the “Fund”) from October 31, 1999 to October 31, 2009, compared to the Russell Midcap Growth Index (RMCGI)2 and the Lipper Mid-Cap Growth Funds Average (LMCGFA).2
| Average Annual Total Returns3 for the Period Ended 10/31/2009 | |
| 1 Year | 5.19% |
| 5 Years | 0.46% |
| 10 Years | -1.11% |
Performance data quoted represents past performance which is no guarantee of future results. Investment return and principal value will fluctuate so that an investor's shares, when redeemed, may be worth more or less than their original cost. Mutual fund performance changes over time and current performance may be lower or higher than what is stated. For current to the most recent month-end performance and after-tax returns, visit FederatedInvestors.com or call 1-800-341-7400. Returns shown do not reflect the deduction of taxes that a shareholder would pay on Fund distributions or the redemption of Fund shares. Mutual funds are not obligations of or guaranteed by any bank and are not federally insured. Total returns shown include the maximum sales charge of 5.50%, as applicable.
| 1 | Represents a hypothetical investment of $10,000 in the Fund after deducting the maximum sales charge of 5.50% ($10,000 investment minus $550 sales charge = $9,450). The Fund's performance assumes the reinvestment of all dividends and distributions. The RMCGI and the LMCGFA have been adjusted to reflect reinvestment of dividends on securities in the index and the average. |
| 2 | The RMCGI is not adjusted to reflect sales loads, expenses or other fees that the Securities and Exchange Commission (SEC) requires to be reflected in the Fund's performance. The index is unmanaged and, unlike the Fund, is not affected by cash flows. It is not possible to invest directly in an index. The LMCGFA represents the average of the total returns reported by all the mutual funds designated by Lipper, Inc. as falling into the category, and is not adjusted to reflect any sales charges. However, these total returns are reported net of expenses or other fees that the SEC requires to be reflected in a Fund's performance. |
| 3 | Total returns quoted reflect all applicable sales charges. |
Annual Shareholder Report9
GROWTH OF A $10,000 INVESTMENT - CLASS B SHARES
The graph below illustrates the hypothetical investment of $10,0001 in Federated Mid Cap Growth Strategies Fund (Class B Shares) (the “Fund”) from October 31, 1999 to October 31, 2009, compared to the Russell Midcap Growth Index (RMCGI)2 and the Lipper Mid-Cap Growth Funds Average (LMCGFA).2
| Average Annual Total Returns3 for the Period Ended 10/31/2009 | |
| 1 Year | 5.00% |
| 5 Years | 0.46% |
| 10 Years | -1.16% |
Performance data quoted represents past performance which is no guarantee of future results. Investment return and principal value will fluctuate so that an investor's shares, when redeemed, may be worth more or less than their original cost. Mutual fund performance changes over time and current performance may be lower or higher than what is stated. For current to the most recent month-end performance and after-tax returns, visit FederatedInvestors.com or call 1-800-341-7400. Returns shown do not reflect the deduction of taxes that a shareholder would pay on Fund distributions or the redemption of Fund shares. Mutual funds are not obligations of or guaranteed by any bank and are not federally insured. Total returns shown include the maximum contingent deferred sales charge of 5.50%, as applicable.
| 1 | Represents a hypothetical investment of $10,000 in the Fund. The maximum contingent deferred sales charge is 5.50% on any redemption less than one year from the purchase date. The Fund's performance assumes the reinvestment of all dividends and distributions. The RMCGI and the LMCGFA have been adjusted to reflect reinvestment of dividends on securities in the index and the average. |
| 2 | The RMCGI is not adjusted to reflect sales loads, expenses or other fees that the SEC requires to be reflected in the Fund's performance. The index is unmanaged and, unlike the Fund, is not affected by cash flows. It is not possible to invest directly in an index. The LMCGFA represents the average of the total returns reported by all the mutual funds designated by Lipper, Inc. as falling into the category, and is not adjusted to reflect any sales charges. However, these total returns are reported net of expenses or other fees that the SEC requires to be reflected in a Fund's performance. |
| 3 | Total returns quoted reflect all applicable contingent deferred sales charges. |
Annual Shareholder Report10
GROWTH OF A $10,000 INVESTMENT - CLASS C SHARES
The graph below illustrates the hypothetical investment of $10,0001 in Federated Mid Cap Growth Strategies Fund (Class C Shares) (the “Fund”) from October 31, 1999 to October 31, 2009, compared to the Russell Midcap Growth Index (RMCGI)2 and the Lipper Mid-Cap Growth Funds Average (LMCGFA).2
| Average Annual Total Returns3 for the Period Ended 10/31/2009 | |
| 1 Year | 9.48 |
| 5 Years | 0.82% |
| 10 Years | -1.29% |
Performance data quoted represents past performance which is no guarantee of future results. Investment return and principal value will fluctuate so that an investor's shares, when redeemed, may be worth more or less than their original cost. Mutual fund performance changes over time and current performance may be lower or higher than what is stated. For current to the most recent month-end performance and after-tax returns, visit FederatedInvestors.com or call 1-800-341-7400. Returns shown do not reflect the deduction of taxes that a shareholder would pay on Fund distributions or the redemption of Fund shares. Mutual funds are not obligations of or guaranteed by any bank and are not federally insured. Total returns shown include the contingent deferred sales charge of 1.00%, as applicable.
| 1 | Represents a hypothetical investment of $10,000 in the Fund. A 1.00% contingent deferred sales charge would be applied to any redemption less than one year from purchase date. The Fund's performance assumes the reinvestment of all dividends and distributions. The RMCGI and the LMCGFA have been adjusted to reflect reinvestment of dividends on securities in the index and the average. |
| 2 | The RMCGI is not adjusted to reflect sales loads, expenses or other fees that the SEC requires to be reflected in the Fund's performance. The index is unmanaged and, unlike the Fund, is not affected by cash flows. It is not possible to invest directly in an index. The LMCGFA represents the average of the total returns reported by all the mutual funds designated by Lipper, Inc. as falling into the category, and is not adjusted to reflect any sales charges. However, these total returns are reported net of expenses or other fees that the SEC requires to be reflected in a Fund's performance. |
| 3 | Total returns quoted reflect all applicable contingent deferred sales charges. |
Annual Shareholder Report11
GROWTH OF A $10,000 INVESTMENT - CLASS K SHARES
The Federated Mid Cap Growth Strategies Fund (Class K Shares) (the “Fund”) commenced operations on December 12, 2006. The Fund offers three other classes of shares: Class A Shares, Class B Shares and Class C Shares. For the period prior to commencement of operations of Class K Shares, the performance information shown is for the Fund's Class A Shares, adjusted to reflect the expenses of Class K Shares. The graph below illustrates the hypothetical investment of $10,0001 in Class K Shares from October 31, 1999 to October 31, 2009, compared to the Russell Midcap Growth Index (RMCGI),2 and the Lipper Mid-Cap Growth Funds Average (LMCGFA).2
| Average Annual Total Returns for the Period Ended 10/31/2009 | |
| 1 Year | 10.72% |
| 5 Years | 1.16% |
| 10 Years | -1.02% |
Performance data quoted represents past performance which is no guarantee of future results. Investment return and principal value will fluctuate so that an investor's shares, when redeemed, may be worth more or less than their original cost. Mutual fund performance changes over time and current performance may be lower or higher than what is stated. For current to the most recent month-end performance and after-tax returns, visit FederatedInvestors.com or call 1-800-341-7400. Returns shown do not reflect the deduction of taxes that a shareholder would pay on Fund distributions or the redemption of Fund shares. Mutual funds are not obligations of or guaranteed by any bank and are not federally insured.
| 1 | Represents a hypothetical investment of $10,000 in the Fund with no sales load. The Fund's performance assumes the reinvestment of all dividends and distributions. The RMCGI and the LMCGFA have been adjusted to reflect reinvestment of dividends on securities in the index and the average. |
| 2 | The RMCGI is not adjusted to reflect sales loads, expenses or other fees that the SEC requires to be reflected in the Fund's performance. The index is unmanaged and, unlike the Fund, is not affected by cash flows. It is not possible to invest directly in an index. The LMCGFA represents the average of the total returns reported by all the mutual funds designated by Lipper, Inc. as falling into the category, and is not adjusted to reflect any sales charges. However, these total returns are reported net of expenses or other fees that the SEC requires to be reflected in a Fund's performance. |
Annual Shareholder Report12
Portfolio of Investments Summary Table (unaudited)
At October 31, 2009, the Fund's sector composition1 was as follows:
| Sector | | Percentage of
Total Net Assets |
| Information Technology | | 24.1% |
| Consumer Discretionary | | 17.0% |
| Industrials | | 12.4% |
| Health Care | | 12.3% |
| Materials | | 9.8% |
| Energy | | 7.8% |
| Financials | | 6.0% |
| Consumer Staples | | 4.2% |
| Telecommunication Services | | 1.1% |
| Utilities | | 0.4% |
| Other Securities2 | | 3.2% |
| Securities Lending Collateral3 | | 7.5% |
| Cash Equivalents4 | | 1.4% |
| Other Assets and Liabilities — Net5 | | (7.2)% |
| TOTAL | | 100.0% |
| 1 | Except for Other Securities, Securities Lending Collateral, Cash Equivalents and Other Assets and Liabilities, sector classifications are based upon, and individual securities are assigned to, the classifications of the Global Industry Classification System Standard (GICS) except that the Adviser assigns a classification to securities not classified by the GICS and to securities for which the Adviser does not have access to the classification made by the GICS. |
| 2 | Other Securities include Exchange-Traded Funds. |
| 3 | Cash collateral received from lending portfolio securities which is invested in short-term investments such as repurchase agreements or money market mutual funds. |
| 4 | Cash Equivalents include any investments in money market mutual funds and/or overnight repurchase agreements (other than those representing cash collateral for securities lending). |
| 5 | Assets, other than investments in securities, less liabilities. See Statement of Assets and Liabilities. |
Annual Shareholder Report13
Portfolio of Investments
October 31, 2009
|
| Shares | | | Value |
| | Common Stocks – 95.1% | |
| | Consumer Discretionary – 17.0% | |
| 24,200 | 1 | Apollo Group, Inc., Class A | 1,381,820 |
| 160,300 | 1 | Bed Bath & Beyond, Inc. | 5,644,163 |
| 93,080 | | BorgWarner, Inc. | 2,822,185 |
| 226,400 | 1 | Coach, Inc. | 7,464,408 |
| 62,900 | | Darden Restaurants, Inc. | 1,906,499 |
| 15,300 | | DeVRY, Inc. | 845,937 |
| 113,300 | 1 | Gymboree Corp. | 4,823,181 |
| 147,500 | 1 | Kohl's Corp. | 8,439,950 |
| 53,800 | | Magna International, Inc., Class A | 2,132,094 |
| 123,800 | 2 | Nordstrom, Inc. | 3,934,364 |
| 106,800 | | Penney (J.C.) Co., Inc. | 3,538,284 |
| 200,800 | | TJX Cos., Inc. | 7,499,880 |
| 41,700 | | Tiffany & Co. | 1,638,393 |
| 266,188 | | Wendy's/Arby's Group, Inc. | 1,051,443 |
| 52,300 | | Yum! Brands, Inc. | 1,723,285 |
| | TOTAL | 54,845,886 |
| | Consumer Staples – 4.2% | |
| 221,100 | | Avon Products, Inc. | 7,086,255 |
| 52,100 | | Clorox Corp. | 3,085,883 |
| 85,500 | | H.J. Heinz Co. | 3,440,520 |
| | TOTAL | 13,612,658 |
| | Energy – 7.8% | |
| 531,200 | 1 | Advantage Oil & Gas Ltd. | 3,272,192 |
| 93,266 | 1,2 | Alpha Natural Resources, Inc. | 3,168,246 |
| 48,400 | 1,2 | Cameron International Corp. | 1,789,348 |
| 49,000 | | Chesapeake Energy Corp. | 1,200,500 |
| 59,000 | 1 | Concho Resources, Inc. | 2,248,490 |
| 63,500 | | Murphy Oil Corp. | 3,882,390 |
| 91,124 | 1 | Petrohawk Energy Corp. | 2,143,237 |
| 60,700 | | Smith International, Inc. | 1,683,211 |
| 40,900 | 1 | Southwestern Energy Co. | 1,782,422 |
| 67,900 | 1 | Whiting Petroleum Corp. | 3,829,560 |
| | TOTAL | 24,999,596 |
Annual Shareholder Report14
|
| | Financials – 6.0% | |
| 124,700 | | Annaly Capital Management, Inc. | 2,108,677 |
| 10,400 | | Goldman Sachs Group, Inc. | 1,769,768 |
| 23,900 | 1 | InterContinentalExchange, Inc. | 2,394,541 |
| 253,818 | | Invesco Ltd. | 5,368,251 |
| 94,700 | | Lazard Ltd., Class A | 3,574,925 |
| 81,800 | 2 | T. Rowe Price Group, Inc. | 3,986,114 |
| | TOTAL | 19,202,276 |
| | Health Care – 12.3% | |
| 32,000 | 1 | Cephalon, Inc. | 1,746,560 |
| 17,900 | 1 | Edwards Lifesciences Corp. | 1,377,226 |
| 48,900 | 1 | Forest Laboratories, Inc., Class A | 1,353,063 |
| 76,900 | 1 | Gilead Sciences, Inc. | 3,272,095 |
| 361,100 | 1 | Health Management Association, Class A | 2,202,710 |
| 47,200 | 1,2 | Illumina, Inc. | 1,515,120 |
| 43,715 | | Life Technologies, Inc. | 2,062,035 |
| 60,700 | 1 | Medco Health Solutions, Inc. | 3,406,484 |
| 193,939 | 1 | Momenta Pharmaceuticals, Inc. | 1,768,724 |
| 54,400 | 1,2 | Myriad Genetics, Inc. | 1,320,832 |
| 139,200 | 1 | Regeneron Pharmaceuticals, Inc. | 2,185,440 |
| 415,900 | 1 | Seattle Genetics, Inc. | 3,776,372 |
| 161,700 | 1 | Talecris Biotherapeutics Holdings Corp. | 3,243,702 |
| 38,100 | | UnitedHealth Group, Inc. | 988,695 |
| 44,400 | | Universal Health Services, Inc., Class B | 2,470,860 |
| 89,700 | 1 | Vertex Pharmaceuticals, Inc. | 3,010,332 |
| 18,000 | 1 | Wellpoint, Inc. | 841,680 |
| 189,700 | 1 | Xenoport, Inc. | 3,169,887 |
| | TOTAL | 39,711,817 |
| | Industrials – 12.4% | |
| 129,800 | | AMETEK, Inc. | 4,528,722 |
| 89,600 | | C.H. Robinson Worldwide, Inc. | 4,937,856 |
| 146,500 | | Expeditors International Washington, Inc. | 4,720,230 |
| 19,500 | | Flowserve Corp. | 1,915,095 |
| 70,300 | | Fluor Corp. | 3,122,726 |
| 114,800 | 1 | Foster Wheeler AG | 3,213,252 |
| 38,400 | | Harsco Corp. | 1,209,216 |
| 30,000 | 1 | Jacobs Engineering Group, Inc. | 1,268,700 |
| 59,900 | | Precision Castparts Corp. | 5,722,247 |
Annual Shareholder Report15
|
| 136,800 | | Roper Industries, Inc. | 6,915,240 |
| 47,700 | | SPX Corp. | 2,517,606 |
| | TOTAL | 40,070,890 |
| | Information Technology – 24.1% | |
| 199,500 | 1 | Activision Blizzard, Inc. | 2,160,585 |
| 186,400 | 1 | Agilent Technologies, Inc. | 4,611,536 |
| 232,500 | 2 | Altera Corp. | 4,601,175 |
| 163,300 | 1 | Amdocs Ltd. | 4,115,160 |
| 126,900 | | Analog Devices, Inc. | 3,252,447 |
| 14,450 | 1 | Apple, Inc. | 2,723,825 |
| 274,400 | 1,2 | Broadcom Corp. | 7,301,784 |
| 92,400 | 1 | Citrix Systems, Inc. | 3,396,624 |
| 164,100 | 1 | Cognizant Technology Solutions Corp. | 6,342,465 |
| 177,700 | 1 | Electronic Arts, Inc. | 3,241,248 |
| 136,900 | 1 | FLIR Systems, Inc. | 3,807,189 |
| 46,300 | | Global Payments, Inc. | 2,279,349 |
| 247,300 | 1,2 | Juniper Networks, Inc. | 6,308,623 |
| 122,000 | 2 | Linear Technology Corp. | 3,157,360 |
| 402,500 | 1 | Marvell Technology Group Ltd. | 5,522,300 |
| 141,200 | 1 | McAfee, Inc. | 5,913,456 |
| 288,800 | 1,2 | NVIDIA Corp. | 3,454,048 |
| 127,200 | | Western Union Co. | 2,311,224 |
| 147,400 | | Xilinx, Inc. | 3,205,950 |
| | TOTAL | 77,706,348 |
Annual Shareholder Report16
|
| | Materials – 9.8% | |
| 84 | | Alcoa, Inc. | 1,043 |
| 39,800 | | CF Industries Holdings, Inc. | 3,313,350 |
| 105,723 | | Cliffs Natural Resources, Inc. | 3,760,567 |
| 197,500 | 1 | Crown Holdings, Inc. | 5,263,375 |
| 120,500 | | Lubrizol Corp. | 8,020,480 |
| 63,700 | | Newmont Mining Corp. | 2,768,402 |
| 140,600 | 1 | Pactiv Corp. | 3,246,454 |
| 170,800 | 1 | Thompson Creek Metals Co., Inc. | 1,738,744 |
| 136,700 | | Vale SA, ADR | 3,484,483 |
| | TOTAL | 31,596,898 |
| | Telecommunication Services – 1.1% | |
| 114,300 | 1,2 | Crown Castle International Corp. | 3,454,146 |
| | Utilities – 0.4% | |
| 50,000 | | Atmos Energy Corp. | 1,392,500 |
| | TOTAL COMMON STOCKS
(IDENTIFIED COST $272,849,712) | 306,593,015 |
| | Exchange-Traded FundS – 3.2% | |
| 146,138 | | iShares MSCI Emerging Market Index Fund | 5,488,943 |
| 117,534 | | iShares S&P Latin American 40 Index Fund | 5,062,190 |
| | TOTAL EXCHANGE-TRADED FUNDS
(IDENTIFIED COST $9,313,191) | 10,551,133 |
| | Mutual Fund – 8.9% | |
| 28,638,066 | 3,4,5 | Prime Value Obligations Fund, Institutional Shares, 0.22%
(AT NET ASSET VALUE) | 28,638,066 |
| | TOTAL INVESTMENTS — 107.2%
(IDENTIFIED COST $310,800,969)6 | 345,782,214 |
| | OTHER ASSETS AND LIABILITIES - NET — (7.2)%7 | (23,341,685) |
| | TOTAL NET ASSETS — 100% | $322,440,529 |
| 1 | Non-income producing security. |
| 2 | Certain or all shares are temporarily on loan to unaffiliated broker/dealers. |
| 3 | Affiliated company. |
| 4 | 7-Day net yield. |
| 5 | All or a portion of this security is held as collateral for securities lending. |
| 6 | The cost of investments for federal tax purposes amounts to $321,402,647. |
| 7 | Assets, other than investments in securities, less liabilities. See Statement of Assets and Liabilities. |
- Note: The categories of investments are shown as a percentage of total net assets at October 31, 2009.
Annual Shareholder Report17
- Various inputs are used in determining the value of the Fund's investments. These inputs are summarized in the three broad levels listed below:
- Level 1 - quoted prices in active markets for identical securities
- Level 2 - other significant observable inputs (including quoted prices for similar securities, interest rates, prepayment speeds, credit risk, etc.)
- Level 3 - significant unobservable inputs (including the Fund's own assumptions in determining the fair value of investments)
- The inputs or methodology used for valuing securities are not an indication of the risk associated with investing in those securities.
- The following is a summary of the inputs used, as of October 31, 2009, in valuing the Fund's assets carried at fair value:
| Valuation Inputs | | | | |
| Level 1 -
Quoted
Prices and
Investments in
Mutual Funds | Level 2 -
Other
Significant
Observable
Inputs | Level 3 -
Significant
Unobservable
Inputs | Total |
| Equity Securities: | | | | |
| Domestic | $278,286,775 | $ — | $ — | $278,286,775 |
| International | 28,306,240 | — | — | 28,306,240 |
| Exchange-Traded Funds | 10,551,133 | — | — | 10,551,133 |
| Mutual Fund | 28,638,066 | — | — | 28,638,066 |
| TOTAL SECURITIES | $345,782,214 | $ — | $ — | $345,782,214 |
- See Notes which are an integral part of the Financial Statements
Annual Shareholder Report18
Statement of Assets and Liabilities
October 31, 2009
| Assets: | | |
| Total investments in securities, at value including $28,638,066 of investments in an affiliated issuer (Note 5) and $22,789,302 of securities loaned (identified cost $310,800,969) | | $345,782,214 |
| Cash | | 708 |
| Income receivable | | 108,748 |
| Receivable for investments sold | | 7,432,313 |
| Receivable for shares sold | | 136,738 |
| TOTAL ASSETS | | 353,460,721 |
| Liabilities: | | |
| Payable for investments purchased | $5,323,440 | |
| Payable for shares redeemed | 1,068,552 | |
| Payable for collateral due to broker for securities lending | 24,264,761 | |
| Payable for Directors'/Trustees' fees | 2,321 | |
| Payable for distribution services fee (Note 5) | 16,402 | |
| Payable for shareholder services fee (Note 5) | 169,817 | |
| Accrued expenses | 174,899 | |
| TOTAL LIABILITIES | | 31,020,192 |
| Net assets for 12,164,682 shares outstanding | | $322,440,529 |
| Net Assets Consist of: | | |
| Paid-in capital | | $408,922,636 |
| Net unrealized appreciation of investments and translation of assets and liabilities in foreign currency | | 34,981,997 |
| Accumulated net realized loss on investments and foreign currency transactions | | (122,385,996) |
| Undistributed net investment income | | 921,892 |
| TOTAL NET ASSETS | | $322,440,529 |
Annual Shareholder Report19
Statement of Assets and Liabilities — continued| Net Asset Value, Offering Price and Redemption Proceeds Per Share | | |
| Class A Shares: | | |
| Net asset value per share ($298,430,689 ÷ 11,148,946 shares outstanding), no par value, unlimited shares authorized | | $26.77 |
| Offering price per share (100/94.50 of $26.77) | | $28.33 |
| Redemption proceeds per share | | $26.77 |
| Class B Shares: | | |
| Net asset value per share ($11,668,516 ÷ 497,424 shares outstanding), no par value, unlimited shares authorized | | $23.46 |
| Offering price per share | | $23.46 |
| Redemption proceeds per share (94.50/100 of $23.46) | | $22.17 |
| Class C Shares: | | |
| Net asset value per share ($11,879,902 ÷ 500,928 shares outstanding), no par value, unlimited shares authorized | | $23.72 |
| Offering price per share | | $23.72 |
| Redemption proceeds per share (99.00/100 of $23.72) | | $23.48 |
| Class K Shares: | | |
| Net asset value per share ($461,422 ÷ 17,384 shares outstanding), no par value, unlimited shares authorized | | $26.54 |
| Offering price per share | | $26.54 |
| Redemption proceeds per share | | $26.54 |
- See Notes which are an integral part of the Financial Statements
Annual Shareholder Report20
Statement of Operations
Year Ended October 31, 2009
| Investment Income: | | | |
| Dividends (including $114,807 received from an affiliated issuer (Note 5) and net of foreign taxes withheld of $10,144) | | | $3,830,096 |
| Interest received from securities loaned | | | 266,737 |
| TOTAL INCOME | | | 4,096,833 |
| Expenses: | | | |
| Investment adviser fee (Note 5) | | $2,303,905 | |
| Administrative personnel and services fee (Note 5) | | 270,000 | |
| Custodian fees | | 24,559 | |
| Transfer and dividend disbursing agent fees and expenses — Class A Shares | | 654,927 | |
| Transfer and dividend disbursing agent fees and expenses — Class B Shares | | 38,692 | |
| Transfer and dividend disbursing agent fees and expenses — Class C Shares | | 30,649 | |
| Transfer and dividend disbursing agent fees and expenses — Class K Shares | | 1,217 | |
| Directors'/Trustees' fees | | 5,295 | |
| Auditing fees | | 22,000 | |
| Legal fees | | 5,399 | |
| Portfolio accounting fees | | 121,270 | |
| Distribution services fee — Class B Shares (Note 5) | | 107,497 | |
| Distribution services fee — Class C Shares (Note 5) | | 87,255 | |
| Distribution services fee — Class K Shares (Note 5) | | 1,520 | |
| Shareholder services fee — Class A Shares (Note 5) | | 651,052 | |
| Shareholder services fee — Class B Shares (Note 5) | | 35,832 | |
| Shareholder services fee — Class C Shares (Note 5) | | 27,434 | |
| Account administration fee — Class A Shares | | 22,866 | |
| Account administration fee — Class C Shares | | 1,651 | |
| Share registration costs | | 54,119 | |
| Printing and postage | | 54,246 | |
| Insurance premiums | | 5,405 | |
| Miscellaneous | | 8,655 | |
| TOTAL EXPENSES | | 4,535,445 | |
Annual Shareholder Report21
Statement of Operations — continued| Waivers, Reimbursements and Expense Reduction: | | | |
| Waiver/reimbursement of investment adviser fee (Note 5) | $(1,023,837) | | |
| Waiver of administrative personnel and services fee (Note 5) | (36,232) | | |
| Reimbursement of shareholder services fee — Class B Shares (Note 5) | (2,505) | | |
| Reimbursement of transfer and dividend disbursing agent fees and expenses — Class A Shares (Note 5) | (194,395) | | |
| Reimbursement of transfer and dividend disbursing agent fees and expenses — Class B Shares (Note 5) | (16,167) | | |
| Reimbursement of transfer and dividend disbursing agent fees and expenses — Class C Shares (Note 5) | (12,667) | | |
| Fees paid indirectly from directed brokerage arrangements (Note 6) | (120,306) | | |
| TOTAL WAIVERS, REIMBURSEMENTS AND EXPENSE REDUCTION | | $(1,406,109) | |
| Net expenses | | | $3,129,336 |
| Net investment income | | | 967,497 |
| Realized and Unrealized Gain (Loss) on Investments and Foreign Currency Transactions: | | | |
| Net realized loss on investments and foreign currency transactions | | | (48,535,056) |
| Net change in unrealized depreciation of investments and translation of assets and liabilities in foreign currency | | | 78,910,528 |
| Net realized and unrealized gain on investments and foreign currency transactions | | | 30,375,472 |
| Change in net assets resulting from operations | | | $31,342,969 |
- See Notes which are an integral part of the Financial Statements
Annual Shareholder Report22
Statement of Changes in Net Assets
| Year Ended October 31 | 2009 | 2008 |
| Increase (Decrease) in Net Assets | | |
| Operations: | | |
| Net investment income (loss) | $967,497 | $(525,359) |
| Net realized loss on investments and foreign currency transactions | (48,535,056) | (72,156,075) |
| Net change in unrealized appreciation/depreciation of investments and translation of assets and liabilities in foreign currency | 78,910,528 | (169,382,965) |
| CHANGE IN NET ASSETS RESULTING FROM OPERATIONS | 31,342,969 | (242,064,399) |
| Distributions to Shareholders: | | |
| Distributions from net realized gain on investments and foreign currency transactions | | |
| Class A Shares | — | (50,829,370) |
| Class B Shares | — | (7,726,549) |
| Class C Shares | — | (2,812,069) |
| Class K Shares | — | (12) |
| CHANGE IN NET ASSETS RESULTING FROM DISTRIBUTIONS TO SHAREHOLDERS | — | (61,368,000) |
| Share Transactions: | | |
| Proceeds from sale of shares | 36,250,249 | 80,422,572 |
| Net asset value of shares issued to shareholders in payment of distributions declared | — | 54,664,337 |
| Cost of shares redeemed | (74,166,727) | (151,296,783) |
| CHANGE IN NET ASSETS RESULTING FROM SHARE TRANSACTIONS | (37,916,478) | (16,209,874) |
| Regulatory Settlement Proceeds: | | |
| Net increase from regulatory settlement (Note 8) | 267,507 | — |
| CHANGE IN NET ASSETS | (6,306,002) | (319,642,273) |
| Net Assets: | | |
| Beginning of period | 328,746,531 | 648,388,804 |
| End of period (including undistributed net investment income of $921,892 and $0, respectively) | $322,440,529 | $328,746,531 |
- See Notes which are an integral part of the Financial Statements
Annual Shareholder Report23
Notes to Financial Statements
October 31, 2009
1. ORGANIZATION
Federated Equity Funds (the “Trust”) is registered under the Investment Company Act of 1940, as amended (the “Act”), as an open-end management investment company. The Trust consists of 13 diversified portfolios. The financial statements included herein are only those of Federated Mid Cap Growth Strategies Fund (the “Fund”). The financial statements of the other portfolios are presented separately. The assets of each portfolio are segregated and a shareholder's interest is limited to the portfolio in which shares are held. Each portfolio pays its own expenses. The Fund offers four classes of shares: Class A Shares, Class B Shares, Class C Shares and Class K Shares. All shares of the Fund have equal rights with respect to voting, except on class-specific matters. The investment objective of the Fund is appreciation of capital.
2. SIGNIFICANT ACCOUNTING POLICIES
The following is a summary of significant accounting policies consistently followed by the Fund in the preparation of its financial statements. These policies are in conformity with U.S. generally accepted accounting principles (GAAP).
Investment Valuation
In calculating its net asset value (NAV), the Fund generally values investments as follows:
- Equity securities listed on an exchange or traded through a regulated market system are valued at their last reported sale price or official closing price in their principal exchange or market.
- Shares of other mutual funds are valued based upon their reported NAVs.
- Derivative contracts listed on exchanges are valued at their reported settlement or closing price.
- Over-the-counter (OTC) derivative contracts are fair valued using price evaluations provided by a pricing service approved by the Board of Trustees (the “Trustees”).
- Fixed-income securities acquired with remaining maturities greater than 60 days are fair valued using price evaluations provided by a pricing service approved by the Trustees.
- Fixed-income securities acquired with remaining maturities of 60 days or less are valued at their cost (adjusted for the accretion of any discount or amortization of any premium).
If the Fund cannot obtain a price or price evaluation from a pricing service for an investment, the Fund may attempt to value the investment based upon the mean of bid and asked quotations or fair value the investment based on price evaluations, from one or more dealers. If any price, quotation, price evaluation or other pricing source is not readily available when the NAV is calculated, the Fund uses the fair value of the investment determined in accordance with the procedures described below. There can be no assurance that the Fund could purchase or sell an investment at the price used to calculate the Fund's NAV.
Fair Valuation and Significant Events Procedures
The Trustees have authorized the use of pricing services to provide evaluations of the current fair value of certain investments for purposes of calculating the NAV. Factors considered by pricing services in evaluating an investment include the yields or prices of investments of comparable quality, coupon, maturity, call rights and other potential prepayments, terms and type, reported transactions, indications as to values from dealers and general market conditions. Some pricing services provide a single price evaluation reflecting the bid-side of Annual Shareholder Report24
the market for an investment (a “bid” evaluation). Other pricing services offer both bid evaluations and price evaluations indicative of a price between the prices bid and asked for the investment (a “mid” evaluation). The Fund normally uses bid evaluations for U.S. Treasury and Agency securities and mortgage-backed securities. The Fund normally uses mid evaluations for other types of fixed-income securities and OTC derivative contracts. In the event that market quotations and price evaluations are not available for an investment, the fair value of the investment is determined in accordance with procedures adopted by the Trustees.The Trustees also have adopted procedures requiring an investment to be priced at its fair value whenever the Adviser determines that a significant event affecting the value of the investment has occurred between the time as of which the price of the investment would otherwise be determined and the time as of which the NAV is computed. An event is considered significant if there is both an affirmative expectation that the investment's value will change in response to the event and a reasonable basis for quantifying the resulting change in value. Examples of significant events that may occur after the close of the principal market on which a security is traded, or after the time of a price evaluation provided by a pricing service or a dealer, include:
- With respect to securities traded in foreign markets, significant trends in U.S. equity markets or in the trading of foreign securities index futures or options contracts;
- With respect to price evaluations of fixed-income securities determined before the close of regular trading on the NYSE, actions by the Federal Reserve Open Market Committee and other significant trends in U.S. fixed-income markets;
- Political or other developments affecting the economy or markets in which an issuer conducts its operations or its securities are traded; and
- Announcements concerning matters such as acquisitions, recapitalizations, litigation developments, a natural disaster affecting the issuer's operations or regulatory changes or market developments affecting the issuer's industry.
The Trustees have approved the use of a pricing service to determine the fair value of equity securities traded principally in foreign markets when the Adviser determines that there has been a significant trend in the U.S. equity markets or in index futures trading. For other significant events, the Fund may seek to obtain more current quotations or price evaluations from alternative pricing sources. If a reliable alternative pricing source is not available, the Fund will determine the fair value of the investment using another method approved by the Trustees.
Repurchase Agreements
It is the policy of the Fund to require the other party to a repurchase agreement to transfer to the Fund's custodian or sub-custodian eligible securities or cash with a market value (after transaction costs) at least equal to the repurchase price to be paid under the repurchase agreement. The eligible securities are transferred to accounts with the custodian or sub-custodian in which the Fund holds a “securities entitlement” and exercises “control” as those terms are defined in the Uniform Commercial Code. The Fund has established procedures for monitoring the market value of the transferred securities and requiring the transfer of additional eligible securities if necessary to equal at least the repurchase price. These procedures also allow the other party to require securities to be transferred from the account to the extent that their market value exceeds the repurchase price or in exchange for other eligible securities of equivalent market value.
Annual Shareholder Report25
With respect to agreements to repurchase U.S. government securities and cash items, the Fund treats the repurchase agreement as an investment in the underlying securities and not as an obligation of the other party to the repurchase agreement. Other repurchase agreements are treated as obligations of the other party secured by the underlying securities. Nevertheless, the insolvency of the other party or other failure to repurchase the securities may delay the disposition of the underlying securities or cause the Fund to receive less than the full repurchase price. Under the terms of the repurchase agreement, any amounts received by the Fund in excess of the repurchase price and related transaction costs must be remitted to the other party.The Fund may enter into repurchase agreements in which eligible securities are transferred into joint trading accounts maintained by the custodian or sub-custodian for investment companies and other clients advised by the Fund's Adviser and its affiliates. The Fund will participate on a pro rata basis with the other investment companies and clients in its share of the securities transferred under such repurchase agreements and in its share of proceeds from any repurchase or other disposition of such securities.
Investment Income, Gains and Losses, Expenses and Distributions
Investment transactions are accounted for on a trade-date basis. Realized gains and losses from investment transactions are recorded on an identified-cost basis. Interest income and expenses are accrued daily. Dividend income and distributions to shareholders are recorded on the ex-dividend date. Foreign dividends are recorded on the ex-dividend date or when the Fund is informed of the ex-dividend date. Distributions of net investment income, if any, are declared and paid annually. Non-cash dividends included in dividend income, if any, are recorded at fair value. Investment income, realized and unrealized gains and losses and certain fund-level expenses are allocated to each class based on relative average daily net assets, except that Class A Shares, Class B Shares, Class C Shares and Class K Shares may bear distribution services fees, shareholder services fees, account administration fees and certain transfer and dividend disbursing agent fees unique to those classes. Dividends are declared separately for each class. No class has preferential dividend rights; differences in per share dividend rates are generally due to differences in separate class expenses.
Premium and Discount Amortization
All premiums and discounts on fixed-income securities are amortized/accreted for financial statement purposes.
Federal Taxes
It is the Fund's policy to comply with the Subchapter M provision of the Internal Revenue Code (the “Code”) and to distribute to shareholders each year substantially all of its income. Accordingly, no provision for federal income tax is necessary. As of and during the year ended October 31, 2009, the Fund did not have a liability for any uncertain tax positions. The Fund recognizes interest and penalties, if any, related to tax liabilities as income tax expense in the Statement of Operations. As of October 31, 2009, tax years 2006 through 2009 remain subject to examination by the Fund's major tax jurisdictions, which include the United States of America and the Commonwealth of Massachusetts.
The Fund may be subject to taxes imposed by governments of countries in which it invests. Such taxes are generally based on either income or gains earned or repatriated. The Fund accrues and applies such taxes to net investment income, net realized gains and net unrealized gains as income and/or gains are earned.
Annual Shareholder Report26
When-Issued and Delayed Delivery TransactionsThe Fund may engage in when-issued or delayed delivery transactions. The Fund records when-issued securities on the trade date and maintains security positions such that sufficient liquid assets will be available to make payment for the securities purchased. Securities purchased on a when-issued or delayed delivery basis are marked to market daily and begin earning interest on the settlement date. Losses may occur on these transactions due to changes in market conditions or the failure of counterparties to perform under the contract.
Foreign Currency Translation
The accounting records of the Fund are maintained in U.S. dollars. All assets and liabilities denominated in foreign currencies (FCs) are translated into U.S. dollars based on the rates of exchange of such currencies against U.S. dollars on the date of valuation. Purchases and sales of securities, income and expenses are translated at the rate of exchange quoted on the respective date that such transactions are recorded. The Fund does not isolate that portion of the results of operations resulting from changes in foreign exchange rates on investments from the fluctuations arising from changes in market prices of securities held. Such fluctuations are included with the net realized and unrealized gain or loss from investments.
Reported net realized foreign exchange gains or losses arise from sales of portfolio securities, sales and maturities of short-term securities, sales of FCs, currency gains or losses realized between the trade and settlement dates on securities transactions, the difference between the amounts of dividends, interest and foreign withholding taxes recorded on the Fund's books, and the U.S. dollar equivalent of the amounts actually received or paid. Net unrealized foreign exchange gains and losses arise from changes in the value of assets and liabilities other than investments in securities at fiscal year end, resulting from changes in the exchange rate.
Securities Lending
The Fund participates in a securities lending program providing for the lending of equity securities to qualified brokers. The Fund normally receives cash collateral for securities loaned that is invested in an affiliated money market fund or in short-term securities including repurchase agreements. Collateral is maintained at a minimum level of 100% of the market value of investments loaned, plus interest, if applicable. Earnings on collateral are allocated between the securities lending agent, as a fee for its services under the program, and the Fund, according to agreed-upon rates.
As of October 31, 2009, securities subject to this type of arrangement and related collateral were as follows:
Market Value of
Securities Loaned | Market Value
of Collateral |
| $22,789,302 | $24,264,761 |
Other
The preparation of financial statements in conformity with GAAP requires management to make estimates and assumptions that affect the amounts of assets, liabilities, expenses and revenues reported in the financial statements. Actual results could differ from those estimated.
Annual Shareholder Report27
3. SHARES OF BENEFICIAL INTERESTThe following tables summarize share activity:
| Year Ended October 31 | 2009 | 2008 |
| Class A Shares: | Shares | Amount | Shares | Amount |
| Shares sold | 1,397,467 | $33,045,630 | 2,070,217 | $74,911,380 |
| Shares issued to shareholders in payment of distributions declared | — | — | 1,162,440 | 44,928,319 |
| Shares redeemed | (2,461,333) | (58,201,438) | (3,014,115) | (107,655,130) |
NET CHANGE RESULTING
FROM CLASS A SHARE TRANSACTIONS | (1,063,866) | $(25,155,808) | 218,542 | $12,184,569 |
| Year Ended October 31 | 2009 | 2008 |
| Class B Shares: | Shares | Amount | Shares | Amount |
| Shares sold | 57,136 | $1,200,561 | 64,496 | $2,087,810 |
| Shares issued to shareholders in payment of distributions declared | — | — | 211,812 | 7,277,866 |
| Shares redeemed | (576,602) | (11,890,001) | (1,127,310) | (36,652,846) |
NET CHANGE RESULTING
FROM CLASS B SHARE TRANSACTIONS | (519,466) | $(10,689,440) | (851,002) | $(27,287,170) |
| Year Ended October 31 | 2009 | 2008 |
| Class C Shares: | Shares | Amount | Shares | Amount |
| Shares sold | 79,487 | $1,664,287 | 99,692 | $3,169,422 |
| Shares issued to shareholders in payment of distributions declared | — | — | 70,738 | 2,458,152 |
| Shares redeemed | (194,536) | (3,989,299) | (217,165) | (6,971,574) |
NET CHANGE RESULTING
FROM CLASS C SHARE TRANSACTIONS | (115,049) | $(2,325,012) | (46,735) | $(1,344,000) |
| Year Ended October 31 | 2009 | 2008 |
| Class K Shares: | Shares | Amount | Shares | Amount |
| Shares sold | 14,774 | $339,771 | 6,918 | $253,960 |
| Shares issued to shareholders in payment of distributions declared | — | — | — | — |
| Shares redeemed | (3,666) | (85,989) | (645) | (17,233) |
NET CHANGE RESULTING
FROM CLASS K SHARE TRANSACTIONS | 11,108 | $253,782 | 6,273 | $236,727 |
NET CHANGE RESULTING
FROM FUND SHARE TRANSACTIONS | (1,687,273) | $(37,916,478) | (672,922) | $(16,209,874) |
Annual Shareholder Report28
4. FEDERAL TAX INFORMATION
The timing and character of income and capital gain distributions are determined in accordance with income tax regulations, which may differ from GAAP. These differences are due in part to differing treatments for foreign currency transactions and regulatory settlement proceeds.
For the year ended October 31, 2009, permanent differences identified and reclassified among the components of net assets were as follows:
| Increase (Decrease) |
| Paid-In Capital | Undistributed
Net Investment
Income (Loss) | Accumulated
Net Realized
Gain (Loss) |
| $(400,495) | $(45,605) | $446,100 |
Net investment income (loss), net realized gains (losses) and net assets were not affected by this reclassification.
The tax character of distributions as reported on the Statement of Changes in Net Assets for the years ended October 31, 2009 and 2008, was as follows:
| 2009 | 2008 |
| Long-term capital gains | $ — | $61,368,000 |
As of October 31, 2009, the components of distributable earnings on a tax basis were as follows:
| Undistributed ordinary income | $921,892 |
| Net unrealized appreciation | $24,380,319 |
| Capital loss carryforwards | $(111,784,318) |
The difference between book-basis and tax-basis net unrealized appreciation/depreciation is attributable in part to differing treatments for the deferral of losses on wash sales.
At October 31, 2009, the cost of investments for federal tax purposes was $321,402,647. The net unrealized appreciation of investments for federal tax purposes was $24,379,567. This consists of net unrealized appreciation from investments for those securities having an excess of value over cost of $31,411,448 and net unrealized depreciation from investments for those securities having an excess of cost over value of $7,031,881.
At October 31, 2009, the Fund had a capital loss carryforward of $111,784,318 which will reduce the Fund's taxable income arising from future net realized gains on investments, if any, to the extent permitted by the Code and thus will reduce the amount of distributions to shareholders which would otherwise be necessary to relieve the Fund of any liability for federal income tax. Pursuant to the Code, such capital loss carryforward will expire as follows:
| Expiration Year | Expiration Amount |
| 2010 | $1,156,221 |
| 2016 | $41,404,093 |
| 2017 | $69,224,004 |
Annual Shareholder Report29
5. INVESTMENT ADVISER FEE AND OTHER TRANSACTIONS WITH AFFILIATES
Investment Adviser Fee
Federated Equity Management Company of Pennsylvania is the Fund's investment adviser (the “Adviser”). The advisory agreement between the Fund and the Adviser provides for an annual fee equal to 0.75% of the Fund's average daily net assets. Subject to the terms described in the Expense Limitation note, the Adviser may voluntarily choose to waive any portion of its fee. The Adviser can modify or terminate this voluntary waiver at any time at its sole discretion.
Pursuant to a settlement with the New York Attorney General, the Adviser has agreed to waive investment adviser fees in compliance with an Assurance of Discontinuance dated November 17, 2005. The net adviser fee was reduced to 0.4975% effective January 1, 2006 and may not be increased until after December 31, 2010. For the year ended October 31, 2009, the Adviser waived $983,061 of its fee. In addition, an affiliate of the Adviser reimbursed $223,229 of transfer and dividend disbursing agent fees and expenses.
Administrative Fee
Federated Administrative Services (FAS), under the Administrative Services Agreement, provides the Fund with administrative personnel and services. The fee paid to FAS is based on the average aggregate daily net assets of certain Federated funds as specified below:
| Administrative Fee | Average Aggregate Daily Net Assets
of the Federated Funds |
| 0.150% | on the first $5 billion |
| 0.125% | on the next $5 billion |
| 0.100% | on the next $10 billion |
| 0.075% | on assets in excess of $20 billion |
The administrative fee received during any fiscal year shall be at least $150,000 per portfolio and $40,000 per each additional class of Shares. Subject to the terms described in the Expense Limitation note, FAS may voluntarily choose to waive any portion of its fee. FAS can modify or terminate this voluntary waiver at any time at its sole discretion. For the year ended
October 31, 2009, the net fee paid to FAS was 0.076% of average daily net assets of the Fund. FAS waived $36,232 of its fee.
Distribution Services Fee
The Fund has adopted a Distribution Plan (the “Plan”) pursuant to Rule 12b-1 under the Act. Under the terms of the Plan, the Fund will compensate Federated Securities Corp. (FSC), the principal distributor, from the daily net assets of the Fund's Class B Shares, Class C Shares and Class K Shares to finance activities intended to result in the sale of these shares. The Plan provides that the Fund may incur distribution expenses at the following percentages of average daily net assets annually, to compensate FSC:
| Share Class Name | Percentage of Average Daily
Net Assets of Class |
| Class B Shares | 0.75% |
| Class C Shares | 0.75% |
| Class K Shares | 0.50% |
Annual Shareholder Report30
Subject to the terms described in the Expense Limitation note, FSC may voluntarily choose to waive any portion of its fee. FSC can modify or terminate this voluntary waiver at any time at its sole discretion. When FSC receives fees, it may pay some or all of them to financial intermediaries whose customers purchase shares. For the year ended October 31, 2009, FSC retained $7,817 of fees paid by the Fund.
Sales Charges
Front-end sales charges and contingent deferred sales charges (CDSC) do not represent expenses of the Fund. They are deducted from the proceeds of sales of Fund shares prior to investment or from redemption proceeds prior to remittance, as applicable. For the year ended October 31, 2009, FSC retained $6,173 in sales charges from the sale of Class A Shares. FSC also retained $471 of CDSC relating to redemptions of Class C Shares.
Shareholder Services Fee
The Fund may pay fees (Service Fees) up to 0.25% of the average daily net assets of the Fund's Class A Shares, Class B Shares and Class C Shares to financial intermediaries or to Federated Shareholder Services Company (FSSC) for providing services to shareholders and maintaining shareholder accounts. Financial intermediaries may include a company affiliated with management of Federated Investors, Inc. A financial intermediary affiliated with management of Federated Investors, Inc. received $15,375 of Service Fees for the year ended October 31, 2009. Subject to the terms described in the Expense Limitation note, FSSC may voluntarily reimburse the Fund for shareholder services fees. This voluntary reimbursement can be modified or terminated at any time. For the year ended September 30, 2009, FSSC voluntarily reimbursed $2,505 of shareholder services fees. For the year ended October 31, 2009, FSSC did not receive any fees paid by the Fund.
Expense Limitation
The Adviser and its affiliates (which may include FSC, FAS and FSSC) have voluntarily agreed to waive their fees and/or reimburse expenses so that the total operating expenses (as shown in the financial highlights) paid by the Fund's Class A Shares, Class B Shares, Class C Shares and Class K Shares (after the voluntary waivers and reimbursements) will not exceed 0.99%, 1.74%, 1.74% and 1.49%, respectively, through the later of (the “Termination Date”): (a) December 31, 2010; or (b) the date of the Fund's next effective prospectus. While the Adviser and its affiliates currently do not anticipate terminating these arrangements prior to the Termination Date, these arrangements may only be terminated prior to the Termination Date with the agreement of the Trustees.
General
Certain Officers and Trustees of the Fund are Officers and Directors or Trustees of the above companies.
Annual Shareholder Report31
Transactions with Affiliated CompaniesAffiliated holdings are mutual funds which are managed by the Adviser or an affiliate of the Adviser. The Adviser has agreed to reimburse the Fund for certain investment adviser fees as a result of transactions in other affiliated mutual funds. For the year ended October 31, 2009, the Adviser reimbursed $40,776. Transactions with the affiliated company during the year ended October 31, 2009 were as follows:
| Affiliate | Balance of
Shares Held
10/31/2008 | Purchases/
Additions | Sales/
Reductions | Balance of
Shares Held
10/31/2009 | Value | Dividend
Income |
| Prime Value Obligations Fund, Institutional Shares | 35,367,622 | 530,057,821 | 536,787,377 | 28,638,066 | $28,638,066 | $114,807 |
Interfund Transactions
During the year ended October 31, 2009, the Fund engaged in purchase and sale transactions with funds that have a common investment adviser (or affiliated investment advisers), common Directors/Trustees and/or common Officers. These purchase and sale transactions complied with Rule 17a-7 under the Act and amounted to $1,342,017 and $1,919,540, respectively.
6. EXPENSE Reduction
The Fund directs portfolio trades to a broker that in turn pays a portion of the Fund's operating expenses. For the year ended October 31, 2009, the Fund's expenses were reduced by $120,306 under these arrangements.
7. Investment TRANSACTIONS
Purchases and sales of investments, excluding long-term U.S. government securities and short-term obligations, for the year ended October 31, 2009, were as follows:
| Purchases | $618,773,333 |
| Sales | $653,016,495 |
8. REGULATORY SETTLEMENT PROCEEDS
The Fund received $267,507 in settlement of administrative proceedings against other unaffiliated third parties involving findings by the Securities and Exchange Commission (SEC) of market timing and/or late trading of mutual funds. The settlement is recorded as an increase to paid-in capital in the accompanying financial statements.
9. LINE OF CREDIT
The Fund participates in a $100,000,000 unsecured, uncommitted revolving line of credit (LOC) agreement with PNC Bank. The LOC was made available for extraordinary or emergency purposes, primarily for financing redemption payments. Borrowings are charged interest at a rate offered to the Fund by PNC Bank at the time of the borrowing. As of October 31, 2009, there were no outstanding loans. During the year ended October 31, 2009, the Fund did not utilize the LOC.
Annual Shareholder Report32
10. INTERFUND LENDINGPursuant to an Exemptive Order issued by the SEC, the Fund, along with other funds advised by subsidiaries of Federated Investors, Inc., may participate in an interfund lending program. This program provides an alternative credit facility allowing the Fund to borrow from other participating affiliated funds. As of October 31, 2009, there were no outstanding loans. During the year ended October 31, 2009, the program was not utilized.
11. Legal Proceedings
Since October 2003, Federated Investors, Inc. and related entities (collectively, “Federated”) and various Federated funds (Federated Funds) have been named as defendants in several class action lawsuits now pending in the United States District Court for the District of Maryland. The lawsuits were purportedly filed on behalf of people who purchased, owned and/or redeemed shares of Federated-sponsored mutual funds during specified periods beginning November 1, 1998. The suits are generally similar in alleging that Federated engaged in illegal and improper trading practices including market timing and late trading in concert with certain institutional traders, which allegedly caused financial injury to the mutual fund shareholders. These lawsuits began to be filed shortly after Federated's first public announcement that it had received requests for information on shareholder trading activities in the Federated Funds from the SEC, the Office of the New York State Attorney General (NYAG) and other authorities. In that regard, on November 28, 2005, Federated announced that it had reached final settlements with the SEC and the NYAG with respect to those matters. As Federated previously reported in 2004, it has already paid approximately $8.0 million to certain funds as determined by an independent consultant. As part of these settlements, Federated agreed to pay for the benefit of fund shareholders additional disgorgement and a civil money penalty in the aggregate amount of an additional $72 million. Federated entities have also been named as defendants in several additional lawsuits that are now pending in the United States District Court for the Western District of Pennsylvania, alleging, among other things, excessive advisory and Rule 12b-1 fees. The Board of the Federated Funds retained the law firm of Dickstein Shapiro LLP to represent the Federated Funds in these lawsuits. Federated and the Federated Funds and their respective counsel have been defending this litigation, and none of the Federated Funds remains a defendant in any of the lawsuits (though some could potentially receive any recoveries as nominal defendants). Additional lawsuits based upon similar allegations may be filed in the future. The potential impact of these lawsuits, all of which seek unquantified damages, attorneys' fees and expenses, and future potential similar suits is uncertain. Although we do not believe that these lawsuits will have a material adverse effect on the Federated Funds, there can be no assurance that these suits, the ongoing adverse publicity and/or other developments resulting from the regulatory investigations will not result in increased Federated Fund redemptions, reduced sales of Federated Fund shares or other adverse consequences for the Federated Funds.
12. Subsequent events
Management has evaluated subsequent events through December 24, 2009, the date the financial statements were issued, and determined that no events have occurred that require additional disclosure.
Annual Shareholder Report33
Report of Independent Registered Public Accounting Firm
TO THE BOARD OF TRUSTEES OF THE FEDERATED EQUITY FUNDS AND SHAREHOLDERS OF FEDERATED MID CAP GROWTH STRATEGIES FUND:
We have audited the accompanying statement of assets and liabilities, including the portfolio of investments, of the Federated Mid Cap Growth Strategies Fund (the “Fund”), a portfolio of Federated Equity Funds, as of October 31, 2009, and the related statement of operations for the year then ended, statement of changes in net assets for each of the years in the two-year period then ended, and financial highlights for each of the years in the four-year period then ended. These financial statements and financial highlights are the responsibility of the Fund's management. Our responsibility is to express an opinion on these financial statements and financial highlights based on our audits. The financial highlights for the period presented prior to November 1, 2005, was audited by other independent registered public accountants whose report thereon dated December 20, 2005, expressed an unqualified opinion on those statements.
We conducted our audits in accordance with the standards of the Public Company Accounting Oversight Board (United States). Those standards require that we plan and perform the audit to obtain reasonable assurance about whether the financial statements and financial highlights are free of material misstatement. An audit includes examining, on a test basis, evidence supporting the amounts and disclosures in the financial statements. Our procedures included confirmation of securities owned as of October 31, 2009 by correspondence with the custodian and brokers or by other appropriate auditing procedures. An audit also includes assessing the accounting principles used and significant estimates made by management, as well as evaluating the overall financial statement presentation. We believe that our audits provide a reasonable basis for our opinion.
In our opinion, the financial statements and financial highlights referred to above present fairly, in all material respects, the financial position of the Federated Mid Cap Growth Strategies Fund as of October 31, 2009, the results of its operations for the year then ended, changes in its net assets for each of the years in the two-year period then ended, and financial highlights for each of the years in the four-year period then ended, in conformity with U.S. generally accepted accounting principles.
Boston, Massachusetts
December 24, 2009
Annual Shareholder Report34
Board of Trustees and Trust Officers
The Board is responsible for managing the Trust's business affairs and for exercising all the Trust's powers except those reserved for the shareholders. The following tables give information about each Board member and the senior officers of the Fund. Where required, the tables separately list Board members who are “interested persons” of the Fund (i.e., “Interested” Board members) and those who are not (i.e., “Independent” Board members). Unless otherwise noted, the address of each person listed is Federated Investors Tower, 1001 Liberty Avenue, Pittsburgh, PA 15222. The address of all Independent Board members listed is 4000 Ericsson Drive, Warrendale, PA 15086-7561; Attention: Mutual Fund Board. As of December 31, 2008, the Trust comprised ten portfolios, and the Federated Fund Complex consisted of 40 investment companies (comprising 149 portfolios). Unless otherwise noted, each Officer is elected annually. Unless otherwise noted, each Board member oversees all portfolios in the Federated Fund Complex and serves for an indefinite term. The Fund's Statement of Additional Information includes additional information about Trust Trustees and is available, without charge and upon request, by calling 1-800-341-7400.
Interested TRUSTEES Background
Name
Birth Date
Positions Held with Trust
Date Service Began | Principal Occupation(s) for Past Five Years,
Other Directorships Held and Previous Position(s) |
John F. Donahue*
Birth Date: July 28, 1924
TRUSTEE
Began serving: April 1984 | Principal Occupations: Director or Trustee of the Federated Fund Complex; Chairman and Director, Federated Investors, Inc.; Chairman of the Federated Fund Complex's Executive Committee.
Previous Positions: Chairman of the Federated Fund Complex; Trustee, Federated Investment Management Company; Chairman and Director, Federated Investment Counseling. |
J. Christopher Donahue*
Birth Date: April 11, 1949
PRESIDENT AND TRUSTEE
Began serving: January 2000 | Principal Occupations: Principal Executive Officer and President of the Federated Fund Complex; Director or Trustee of some of the Funds in the Federated Fund Complex; President, Chief Executive Officer and Director, Federated Investors, Inc.; Chairman and Trustee, Federated Investment Management Company; Trustee, Federated Investment Counseling; Chairman and Director, Federated Global Investment Management Corp.; Chairman, Federated Equity Management Company of Pennsylvania and Passport Research, Ltd. (investment advisory subsidiary of Federated); Trustee, Federated Shareholder Services Company; Director, Federated Services Company.
Previous Positions: President, Federated Investment Counseling; President and Chief Executive Officer, Federated Investment Management Company, Federated Global Investment Management Corp. and Passport Research, Ltd. |
| * | Family relationships and reasons for “interested” status: John F. Donahue is the father of J. Christopher Donahue; both are “interested” due to their beneficial ownership of shares of Federated Investors, Inc. and the positions they hold with Federated and its subsidiaries. |
Annual Shareholder Report35
INDEPENDENT TRUSTEES Background
Name
Birth Date
Positions Held with Trust
Date Service Began | Principal Occupation(s) for Past Five Years,
Other Directorships Held and Previous Position(s) |
John T. Conroy, Jr., Ph.D.
Birth Date: June 23, 1937
TRUSTEE
Began serving: November 1991 | Principal Occupations: Director or Trustee of the Federated Fund Complex; Chairman of the Board, Investment Properties Corporation; Partner or Trustee in private real estate ventures in Southwest Florida; Assistant Professor in Theology, Blessed Edmund Rice School for Pastoral Ministry.
Previous Positions: President, Investment Properties Corporation; Senior Vice President, John R. Wood and Associates, Inc., Realtors; President, Naples Property Management, Inc. and Northgate Village Development Corporation. |
Nicholas P. Constantakis
Birth Date: September 3, 1939
TRUSTEE
Began serving: February 1998 | Principal Occupation: Director or Trustee of the Federated Fund Complex.
Other Directorship Held: Director and Chairman of the Audit Committee, Michael Baker Corporation (architecture, engineering and construction services).
Previous Position: Partner, Andersen Worldwide SC. |
John F. Cunningham
Birth Date: March 5, 1943
TRUSTEE
Began serving: January 1999 | Principal Occupation: Director or Trustee of the Federated Fund Complex.
Other Directorships Held: Chairman, President and Chief Executive Officer, Cunningham & Co., Inc. (strategic business consulting); Trustee Associate, Boston College.
Previous Positions: Director, Redgate Communications and EMC Corporation (computer storage systems); Chairman of the Board and Chief Executive Officer, Computer Consoles, Inc.; President and Chief Operating Officer, Wang Laboratories; Director, First National Bank of Boston; Director, Apollo Computer, Inc. |
Maureen Lally-Green
Birth Date: July 5, 1949
TRUSTEE
Began serving: August 2009 | Principal Occupations: Director or Trustee of the Federated Fund Complex; Director, Office of Church Relations, Diocese of Pittsburgh; Adjunct Professor of Law, Duquesne University School of Law.
Other Directorships Held: Director, Auberle; Trustee St. Francis University; Director, Ireland Institute of Pittsburgh; Director, UPMC Mercy Hospital; Regent, St. Vincent Seminary; Director, Epilepsy Foundation of Western and Central Pennsylvania; Director, Saint Thomas More Society, Allegheny County; Director, Carlow University.
Previous Position: Pennsylvania Superior Court Judge. |
Annual Shareholder Report36
Name
Birth Date
Positions Held with Trust
Date Service Began | Principal Occupation(s) for Past Five Years,
Other Directorships Held and Previous Position(s) |
Peter E. Madden
Birth Date: March 16, 1942
TRUSTEE
Began serving: November 1991 | Principal Occupation: Director or Trustee and Chairman of the Board of the Federated Fund Complex.
Other Directorship Held: Board of Overseers, Babson College.
Previous Positions: Representative, Commonwealth of Massachusetts General Court; President, Chief Operating Officer and Director, State Street Bank and Trust Company and State Street Corporation (retired); Director, VISA USA and VISA International; Chairman and Director, Massachusetts Bankers Association; Director, Depository Trust Corporation; Director, The Boston Stock Exchange. |
Charles F. Mansfield, Jr.
Birth Date: April 10, 1945
TRUSTEE
Began serving: January 1999 | Principal Occupations: Director or Trustee and Chairman of the Audit Committee of the Federated Fund Complex; Management Consultant.
Previous Positions: Chief Executive Officer, PBTC International Bank; Partner, Arthur Young & Company (now Ernst & Young LLP); Chief Financial Officer of Retail Banking Sector, Chase Manhattan Bank; Senior Vice President, HSBC Bank USA (formerly, Marine Midland Bank); Vice President, Citibank; Assistant Professor of Banking and Finance, Frank G. Zarb School of Business, Hofstra University; Executive Vice President DVC Group, Inc. (marketing, communications and technology). |
R. James Nicholson
Birth Date: February 4, 1938
TRUSTEE
Began serving: April 2008 | Principal Occupations: Director or Trustee of the Federated Fund Complex; Senior Counsel, Brownstein Hyatt Farber Schrek, P.C.; Former Secretary of the U.S. Dept. of Veterans Affairs; Former U.S. Ambassador to the Holy See; Former Chairman of the Republican National Committee.
Other Directorships Held: Director, Horatio Alger Association; Director, The Daniels Fund.
Previous Positions: Colonel, U.S. Army Reserve; Partner, Calkins, Kramer, Grimshaw and Harring, P.C.; General Counsel, Colorado Association of Housing and Building; Chairman and CEO, Nicholson Enterprises, Inc. (real estate holding company); Chairman and CEO, Renaissance Homes of Colorado. |
Thomas M. O'Neill
Birth Date: June 14, 1951
TRUSTEE
Began serving: October 2006 | Principal Occupations: Director or Trustee of the Federated Fund Complex; Managing Director and Partner, Navigator Management Company, L.P. (investment and strategic consulting).
Other Directorships Held: Board of Overseers, Children's Hospital of Boston; Visiting Committee on Athletics, Harvard College.
Previous Positions: Chief Executive Officer and President, Managing Director and Chief Investment Officer, Fleet Investment Advisors; President and Chief Executive Officer, Aeltus Investment Management, Inc.; General Partner, Hellman, Jordan Management Co., Boston, MA; Chief Investment Officer, The Putnam Companies, Boston, MA; Credit Analyst and Lending Officer, Fleet Bank; Director and Consultant, EZE Castle Software (investment order management software); Director, Midway Pacific (lumber). |
Annual Shareholder Report37
Name
Birth Date
Positions Held with Trust
Date Service Began | Principal Occupation(s) for Past Five Years,
Other Directorships Held and Previous Position(s) |
John S. Walsh
Birth Date: November 28, 1957
TRUSTEE
Began serving: January 1999 | Principal Occupations: Director or Trustee of the Federated Fund Complex; President and Director, Heat Wagon, Inc. (manufacturer of construction temporary heaters); President and Director, Manufacturers Products, Inc. (distributor of portable construction heaters); President, Portable Heater Parts, a division of Manufacturers Products, Inc.
Previous Position: Vice President, Walsh & Kelly, Inc. |
James F. Will
Birth Date: October 12, 1938
TRUSTEE
Began serving: April 2006 | Principal Occupations: Director or Trustee of the Federated Fund Complex; formerly, Vice Chancellor and President, Saint Vincent College.
Other Directorships Held: Trustee, Saint Vincent College; Alleghany Corporation.
Previous Positions: Chairman, President and Chief Executive Officer, Armco, Inc.; President and Chief Executive Officer, Cyclops Industries; President and Chief Operating Officer, Kaiser Steel Corporation. |
OFFICERS
Name
Birth Date
Address
Positions Held with Trust
Date Service Began | Principal Occupation(s) for Past Five Years
and Previous Position(s) |
John W. McGonigle
Birth Date: October 26, 1938
EXECUTIVE VICE PRESIDENT AND SECRETARY
Began serving: April 1984 | Principal Occupations: Executive Vice President and Secretary of the Federated Fund Complex; Vice Chairman, Executive Vice President, Secretary and Director, Federated Investors, Inc.
Previous Positions: Trustee, Federated Investment Management Company and Federated Investment Counseling; Director, Federated Global Investment Management Corp., Federated Services Company and Federated Securities Corp. |
Richard A. Novak
Birth Date: December 25, 1963
TREASURER
Began serving: January 2006 | Principal Occupations: Principal Financial Officer and Treasurer of the Federated Fund Complex; Senior Vice President, Federated Administrative Services; Financial and Operations Principal for Federated Securities Corp., Edgewood Services, Inc. and Southpointe Distribution Services, Inc.
Previous Positions: Controller of Federated Investors, Inc.; Vice President, Finance of Federated Services Company; held various financial management positions within The Mercy Hospital of Pittsburgh; Auditor, Arthur Andersen & Co. |
Richard B. Fisher
Birth Date: May 17, 1923
VICE PRESIDENT
Began serving: April 1984 | Principal Occupations: Vice Chairman or Vice President of some of the Funds in the Federated Fund Complex; Vice Chairman, Federated Investors, Inc.; Chairman, Federated Securities Corp.
Previous Positions: President and Director or Trustee of some of the Funds in the Federated Fund Complex; Executive Vice President, Federated Investors, Inc.; Director and Chief Executive Officer, Federated Securities Corp. |
Annual Shareholder Report38
Name
Birth Date
Address
Positions Held with Trust
Date Service Began | Principal Occupation(s) for Past Five Years
and Previous Position(s) |
Brian P. Bouda
Birth Date: February 28, 1947
CHIEF COMPLIANCE OFFICER AND SENIOR VICE PRESIDENT
Began serving: August 2004 | Principal Occupations: Senior Vice President and Chief Compliance Officer of the Federated Fund Complex; Vice President and Chief Compliance Officer of Federated Investors, Inc. and Chief Compliance Officer of its subsidiaries. Mr. Bouda joined Federated in 1999 and is a member of the American Bar Association and the State Bar Association of Wisconsin. |
Stephen F. Auth
Birth Date: September 3, 1956
450 Lexington Avenue
Suite 3700
New York, NY 10017-3943
CHIEF INVESTMENT OFFICER
Began serving: November 2002 | Principal Occupations: Mr. Auth is Chief Investment Officer of this Fund and various other Funds in the Federated Fund Complex; Executive Vice President, Federated Investment Counseling, Federated Global Investment Management Corp. and Federated Equity Management Company of Pennsylvania.
Previous Positions: Executive Vice President, Federated Investment Management Company, and Passport Research, Ltd. (investment advisory subsidiary of Federated); Senior Vice President, Global Portfolio Management Services Division; Senior Vice President, Federated Investment Management Company and Passport Research, Ltd.; Senior Managing Director and Portfolio Manager, Prudential Investments. |
Lawrence Auriana
Birth Date: January 8, 1944
140 East 45th Street
New York, NY 10017
VICE PRESIDENT
Began serving: November 2001 | Principal Occupations: Lawrence Auriana is Vice President of the Trust. Mr. Auriana joined Federated in April 2001 as Co-Head of Investments/Federated Kaufmann. From August 1984 to April 2001, Mr. Auriana was President and Treasurer of Edgemont Asset Management Corp., and Chairman of the Board and Portfolio Manager to The Kaufmann Fund, Inc. (predecessor to the Federated Kaufmann Fund). Mr. Auriana earned a B.S. in economics from Fordham University and has been engaged in the securities business since 1965. |
Walter C. Bean
Birth Date: June 22, 1945
VICE PRESIDENT
Began serving: November 2006 | Principal Occupations: Walter C. Bean is Vice President of the Trust. Mr. Bean is a Senior Vice President, Senior Portfolio Manager and the Head of the Equity Income Management Team of the Fund's Adviser. Mr. Bean joined Federated in 2000. His previous associations included: various investment management and research positions with C.S. McKee & Company; First Chicago Investment Advisors; CIGNA Investment Advisors; and Mellon Bank. Mr. Bean earned a Bachelors Degree in Business Administration from Ohio University and an M.B.A. from the Pennsylvania State University. Mr. Bean is a Chartered Financial Analyst and has 40 years of investment experience. |
Hans P. Utsch
Birth Date: July 3, 1936
140 East 45th Street
New York, NY 10017
VICE PRESIDENT
Began serving: November 2001 | Principal Occupations: Hans P. Utsch is Vice President of the Trust. Mr. Utsch joined Federated in April 2001 as Co-Head of Investments/Federated Kaufmann. From August 1984 to April 2001, Mr. Utsch was Chairman of the Board and Secretary of Edgemont Asset Management Corp., and President and Portfolio Manager to The Kaufmann Fund, Inc. (predecessor to the Federated Kaufmann Fund). Mr. Utsch graduated from Amherst College and holds an M.B.A. from Columbia University. He has been engaged in the securities business since 1962. |
Annual Shareholder Report39
Evaluation and Approval of Advisory Contract - May 2009
Federated Mid Cap Growth Strategies Fund (the “Fund”)
The Fund's Board reviewed the Fund's investment advisory contract at meetings held in May 2009. The Board's decision regarding the contract reflects the exercise of its business judgment on whether to continue the existing arrangements.
In this connection, the Federated funds' Board had previously appointed a Senior Officer, whose duties include specified responsibilities relating to the process by which advisory fees are to be charged to a Federated fund. The Senior Officer has the authority to retain consultants, experts, or staff as may be reasonably necessary to assist in the performance of his duties, reports directly to the Board, and may be terminated only with the approval of a majority of the independent members of the Board. The Senior Officer prepared and furnished to the Board an independent, written evaluation that covered topics discussed below. The Board considered that evaluation, along with other information, in deciding to approve the advisory contract.
During its review of the contract, the Board considered compensation and benefits received by the Adviser. This included the fees received for services provided to the Fund by other entities in the Federated organization and research services received by the Adviser from brokers that execute Federated fund trades, as well as advisory fees. The Board is also familiar with and considered judicial decisions concerning allegedly excessive investment advisory fees, which have indicated that the following factors may be relevant to an Adviser's fiduciary duty with respect to its receipt of compensation from a fund: the nature and quality of the services provided by the Adviser, including the performance of the fund; the Adviser's cost of providing the services; the extent to which the Adviser may realize “economies of scale” as a fund grows larger; any indirect benefits that may accrue to the Adviser and its affiliates as a result of the Adviser's relationship with a fund; performance and expenses of comparable funds; and the extent to which the independent Board members are fully informed about all facts the Board deems relevant bearing on the Adviser's services and fees. The Board further considered management fees (including any components thereof) charged to institutional and other clients of the Adviser for what might be viewed as like services, and the cost to the Adviser and its affiliates of supplying services pursuant to the management fee agreements, excluding any intra-corporate profit and profit margins of the Adviser and its affiliates for supplying such services. The Board was aware of these factors and was guided by them in its review of the Fund's advisory contract to the extent it considered them to be appropriate and relevant, as discussed further below.
Annual Shareholder Report40
The Board considered and weighed these circumstances in light of its substantial accumulated experience in governing the Fund and working with Federated on matters relating to the Federated funds, and was assisted in its deliberations by independent legal counsel. Throughout the year, the Board has requested and received substantial and detailed information about the Fund and the Federated organization that was in addition to the extensive materials that comprise and accompany the Senior Officer's evaluation. Federated provided much of this information at each regular meeting of the Board, and furnished additional reports in connection with the particular meeting at which the Board's formal review of the advisory contract occurred. Between regularly scheduled meetings, the Board also received information on particular matters as the need arose. Thus, the Board's consideration of the advisory contract included review of the Senior Officer's evaluation, accompanying data and additional reports covering such matters as: the Adviser's investment philosophy, revenue, profitability, personnel and processes; investment and operating strategies; the Fund's short- and long-term performance (in absolute terms, both on a gross basis and net of expenses, as well as in relationship to its particular investment program and certain competitor or “peer group” funds and/or other benchmarks, as appropriate), and comments on the reasons for performance; the Fund's investment objectives; the Fund's expenses (including the advisory fee itself and the overall expense structure of the Fund, both in absolute terms and relative to similar and/or competing funds, with due regard for contractual or voluntary expense limitations); the use and allocation of brokerage commissions derived from trading the Fund's portfolio securities (if any); and the nature, quality and extent of the advisory and other services provided to the Fund by the Adviser and its affiliates. The Board also considered the preferences and expectations of Fund shareholders and their relative sophistication; the continuing state of competition in the mutual fund industry and market practices; the range of comparable fees for similar funds in the mutual fund industry; the Fund's relationship to the Federated family of funds which include a comprehensive array of funds with different investment objectives, policies and strategies which are available for exchange without the incurrence of additional sales charges; compliance and audit reports concerning the Federated funds and the Federated companies that service them (including communications from regulatory agencies), as well as Federated's responses to any issues raised therein; and relevant developments in the mutual fund industry and how the Federated funds and/or Federated are responding to them. The Board's evaluation process is evolutionary. The criteria considered and the emphasis placed on relevant criteria change in recognition of changing circumstances in the mutual fund marketplace. With respect to the Fund's performance and expenses in particular, the Board has found the use of comparisons to other mutual funds with comparable investment programs to be particularly useful, given the high degree of competition in the mutual fund business. The Board focused on comparisons Annual Shareholder Report41
with other similar mutual funds more heavily than non-mutual fund products or services because, it is believed that, they are more relevant. For example, other mutual funds are the products most like the Fund, they are readily available to Fund shareholders as alternative investment vehicles, and they are the type of investment vehicle in fact chosen and maintained by the Fund's investors. The range of their fees and expenses therefore appears to be a generally reliable indication of what consumers have found to be reasonable in the precise marketplace in which the Fund competes. The Fund's ability to deliver competitive performance when compared to its peer group was a useful indicator of how the Adviser is executing the Fund's investment program, which in turn assisted the Board in reaching a conclusion that the nature, extent, and quality of the Adviser's investment management services were such as to warrant continuation of the advisory contract. In this regard, the Senior Officer has reviewed Federated's fees for providing advisory services to products outside the Federated family of funds (e.g., institutional and separate accounts). He concluded that mutual funds and institutional accounts are inherently different products. Those differences include, but are not limited to, different types of targeted investors; being subject to different laws and regulations; different legal structures; different average account sizes; different associated costs; different portfolio management techniques made necessary by different cash flows; and portfolio manager time spent in review of securities pricing. The Senior Officer did not consider these fee schedules to be determinative in judging the appropriateness of mutual fund advisory contracts.The Senior Officer reviewed reports compiled by Federated, using data supplied by independent fund ranking organizations, regarding the performance of, and fees charged by, other mutual funds, noting his view that comparisons to fund peer groups are highly important in judging the reasonableness of proposed fees.
For the one-year, three-year and five-year periods covered by the report, the Fund's performance was above the median of the relevant peer group.
The Board also received financial information about Federated, including reports on the compensation and benefits Federated derived from its relationships with the Federated funds. These reports covered not only the fees under the advisory contracts, but also fees received by Federated's subsidiaries for providing other services to the Federated funds under separate contracts (e.g., for serving as the Federated funds' administrator). The reports also discussed any indirect benefit Federated may derive from its receipt of research services from brokers who execute Federated fund trades. In addition, the Board considered the fact that, in order for a fund to be competitive in the marketplace, Federated and its affiliates frequently waived fees and/or reimbursed expenses and have disclosed to fund investors and/or indicated to the Board their intention to do so in the future, where appropriate. Moreover, Annual Shareholder Report42
the Board receives regular reports regarding the institution or elimination of these voluntary waivers. In this regard, it was noted that the Adviser has agreed to a reduction of 25 basis points in the Fund's advisory fee at least through December 31, 2010.Federated furnished reports, requested by the Senior Officer, that reported revenues on a fund-by-fund basis and made estimates of the allocation of expenses on a fund-by-fund basis, using allocation methodologies specified by the Senior Officer. The Senior Officer noted that, although they may apply consistent allocation processes, the inherent difficulties in allocating costs (and the unavoidable arbitrary aspects of that exercise) and the lack of consensus on how to allocate those costs may render such allocation reports unreliable. The allocation reports were considered in the analysis by the Board but were determined to be of limited use.
The Board and the Senior Officer also reviewed a report compiled by Federated comparing profitability information for Federated to other publicly held fund management companies. In this regard, the Senior Officer noted the limited availability of such information, but nonetheless concluded that Federated's profit margins did not appear to be excessive and the Board agreed.
The Senior Officer's evaluation also discussed the notion of possible realization of “economies of scale” as a fund grows larger. The Board considered in this regard that the Adviser has made significant and long-term investments in areas that support all of the Federated funds, such as personnel and processes for the portfolio management, compliance, and risk management functions; and systems technology; and that the benefits of these efforts (as well as any economies, should they exist) were likely to be enjoyed by the fund complex as a whole. Finally, the Board also noted the absence of any applicable regulatory or industry guidelines on this subject, which (as discussed in the Senior Officer's evaluation) is compounded by the lack of any common industry practice or general pattern with respect to structuring fund advisory fees with “breakpoints” that serve to reduce the fee as the fund attains a certain size. The Senior Officer did not recommend institution of breakpoints in pricing Federated's fund advisory services at this time.
It was noted in the materials for the Board meeting that for the period covered by the report, the Fund's investment advisory fee, after waivers and expense reimbursements, if any, was below the median of the relevant peer group. The Board reviewed the fees and other expenses of the Fund with the Adviser and was satisfied that the overall expense structure of the Fund remained competitive.
The Senior Officer's evaluation noted his belief that the information and observations contained in his evaluation supported a finding that the proposed management fees are reasonable, and that Federated appeared to provide appropriate administrative services to the Fund for the fees paid. Under these Annual Shareholder Report43
circumstances, no changes were recommended to, and no objection was raised to, the continuation of the Fund's advisory contract. The Board concluded that the nature, quality and scope of services provided the Fund by the Adviser and its affiliates were satisfactory.In its decision to continue an existing investment advisory contract, the Board was mindful of the potential disruptions of the Fund's operations and various risks, uncertainties and other effects that could occur as a result of a decision to terminate or not renew an advisory contract. In particular, the Board recognized that many shareholders have invested in the Fund on the strength of the Adviser's industry standing and reputation and with the expectation that the Adviser will have a continuing role in providing advisory services to the Fund. Thus, the Board's approval of the advisory contract reflected the fact that it is the shareholders who have effectively selected the Adviser by virtue of having invested in the Fund.
The Board based its decision to approve the advisory contract on the totality of the circumstances and relevant factors and with a view to past and future long-term considerations. Not all of the factors and considerations identified above were necessarily relevant to the Fund, nor did the Board consider any one of them to be determinative. With respect to the factors that were relevant, the Board's decision to approve the contract reflects its determination that Federated's performance and actions provided a satisfactory basis to support the decision to continue the existing arrangements.
Annual Shareholder Report44
Voting Proxies on Fund Portfolio Securities
A description of the policies and procedures that the Fund uses to determine how to vote proxies, if any, relating to securities held in the Fund's portfolio is available, without charge and upon request, by calling 1-800-341-7400. A report on “Form N-PX” of how the Fund voted any such proxies during the most recent 12-month period ended June 30 is available from Federated's Web site at FederatedInvestors.com. To access this information from the “Products” section of the Web site, click on the “Prospectuses and Regulatory Reports” link under “Related Information,” then select the appropriate link opposite the name of the Fund; or select the name of the Fund and from the Fund's page, click on the “Prospectuses and Regulatory Reports” link. Form N-PX filings are also available at the SEC's Web site at www.sec.gov.
Quarterly Portfolio Schedule
The Fund files with the SEC a complete schedule of its portfolio holdings, as of the close of the first and third quarters of its fiscal year, on “Form N-Q.” These filings are available on the SEC's Web site at www.sec.gov and may be reviewed and copied at the SEC's Public Reference Room in Washington, DC. (Call 1-800-SEC-0330 for information on the operation of the Public Reference Room.) You may also access this information from the “Products” section of Federated's Web site at FederatedInvestors.com by clicking on “Portfolio Holdings” under “Related Information,” then selecting the appropriate link opposite the name of the Fund; or select the name of the Fund and from the Fund's page, click on the “Portfolio Holdings” link.
Annual Shareholder Report45
Mutual funds are not bank deposits or obligations, are not guaranteed by any bank and are not insured or guaranteed by the U.S. government, the Federal Deposit Insurance Corporation, the Federal Reserve Board or any other government agency. Investment in mutual funds involves investment risk, including the possible loss of principal.
This Report is authorized for distribution to prospective investors only when preceded or accompanied by the Fund's Prospectus, which contains facts concerning its objective and policies, management fees, expenses and other information.
Federated Mid Cap Growth Strategies Fund
Federated Investors Funds
4000 Ericsson Drive
Warrendale, PA 15086-7561
Contact us at FederatedInvestors.com
or call 1-800-341-7400.
Federated Securities Corp., Distributor
Cusip 314172107
Cusip 314172206
Cusip 314172305
Cusip 314172529
G01228-08 (12/09)
Federated is a registered mark of Federated Investors, Inc.
2009 Federated Investors, Inc.
Federated Strategic Value FundEstablished 2005
A Portfolio of Federated Equity Funds
ANNUAL SHAREHOLDER REPORTOctober 31, 2009
Class A Shares
Class C Shares
FINANCIAL HIGHLIGHTS
SHAREHOLDER EXPENSE EXAMPLE
MANAGEMENT'S DISCUSSION OF FUND PERFORMANCE
PORTFOLIO OF INVESTMENTS SUMMARY TABLE
PORTFOLIO OF INVESTMENTS
STATEMENT OF ASSETS AND LIABILITIES
STATEMENT OF OPERATIONS
STATEMENT OF CHANGES IN NET ASSETS
NOTES TO FINANCIAL STATEMENTS
REPORT OF INDEPENDENT REGISTERED PUBLIC ACCOUNTING FIRM
BOARD OF TRUSTEES AND TRUST OFFICERS
EVALUATION AND APPROVAL OF ADVISORY CONTRACT
VOTING PROXIES ON FUND PORTFOLIO SECURITIES
QUARTERLY PORTFOLIO SCHEDULE
Financial Highlights - Class A Shares
(For a Share Outstanding Throughout Each Period)
| Year Ended October 31, | Period Ended
10/31/20051 |
| 2009 | 2008 | 2007 | 2006 |
| Net Asset Value, Beginning of Period | $4.01 | $6.36 | $6.27 | $5.21 | $5.00 |
| Income From Investment Operations: | | | | | |
| Net investment income | 0.15 | 0.27 | 0.27 | 0.252 | 0.122 |
| Net realized and unrealized gain (loss) on investments and foreign currency transactions | (0.15) | (2.05) | 0.16 | 1.05 | 0.19 |
| TOTAL FROM INVESTMENT OPERATIONS | — | (1.78) | 0.43 | 1.30 | 0.31 |
| Less Distributions: | | | | | |
| Distributions from net investment income | (0.16) | (0.28) | (0.25) | (0.22) | (0.10) |
| Distribution from net realized gain on investments and foreign currency transactions | — | (0.29) | (0.09) | (0.02) | — |
| TOTAL DISTRIBUTIONS | (0.16) | (0.57) | (0.34) | (0.24) | (0.10) |
| Net Asset Value, End of Period | $3.85 | $4.01 | $6.36 | $6.27 | $5.21 |
| Total Return3 | 0.31% | (30.13)% | 6.96% | 25.52% | 6.12% |
| Ratios to Average Net Assets: | | | | | |
| Net expenses | 1.04%4 | 1.00%4 | 1.00%4 | 0.90%4 | 0.47%5 |
| Net investment income | 4.38% | 5.14% | 4.03% | 4.38% | 3.96%5 |
| Expense waiver/reimbursement6 | 0.20% | 0.25% | 0.22% | 0.39% | 1.45%5 |
| Supplemental Data: | | | | | |
| Net assets, end of period (000 omitted) | $358,589 | $249,725 | $555,896 | $451,500 | $103,674 |
| Portfolio turnover | 42% | 48% | 66% | 27% | 16% |
| 1 | Reflects operations for the period from March 30, 2005 (date of initial investment) to October 31, 2005. |
| 2 | Per share numbers have been calculated using the average shares method. |
| 3 | Based on net asset value, which does not reflect the sales charge, redemption fee or contingent deferred sales charge, if applicable. Total returns for periods of less than one year are not annualized. |
| 4 | The net expense ratio is calculated without reduction for expense offset arrangements. The net expense ratios are 1.04%, 1.00%, 0.99% and 0.88%, for the years ended October 31, 2009, 2008, 2007 and 2006, respectively, after taking into account these expense reductions. |
| 5 | Computed on an annualized basis. |
| 6 | This expense decrease is reflected in both the net expense and the net investment income ratios shown above. |
- See Notes which are an integral part of the Financial Statements
Annual Shareholder Report1
Financial Highlights - Class C Shares
(For a Share Outstanding Throughout Each Period)
| Year Ended October 31, | Period Ended
10/31/20051 |
| 2009 | 2008 | 2007 | 2006 |
| Net Asset Value, Beginning of Period | $4.02 | $6.37 | $6.28 | $5.22 | $5.00 |
| Income From Investment Operations: | | | | | |
| Net investment income | 0.13 | 0.23 | 0.21 | 0.212 | 0.102 |
| Net realized and unrealized gain (loss) on investments and foreign currency transactions | (0.17) | (2.05) | 0.18 | 1.05 | 0.20 |
| TOTAL FROM INVESTMENT OPERATIONS | (0.04) | (1.82) | 0.39 | 1.26 | 0.30 |
| Less Distributions: | | | | | |
| Distributions from net investment income | (0.13) | (0.24) | (0.21) | (0.18) | (0.08) |
| Distribution from net realized gain on investments and foreign currency transactions | — | (0.29) | (0.09) | (0.02) | — |
| TOTAL DISTRIBUTIONS | (0.13) | (0.53) | (0.30) | (0.20) | (0.08) |
| Net Asset Value, End of Period | $3.85 | $4.02 | $6.37 | $6.28 | $5.22 |
| Total Return3 | (0.69)% | (30.57)% | 6.16% | 24.53% | 5.92% |
| Ratios to Average Net Assets: | | | | | |
| Net expenses | 1.79%4 | 1.75%4 | 1.75%4 | 1.65%4 | 1.22%5 |
| Net investment income | 3.65% | 4.44% | 3.33% | 3.69% | 3.26%5 |
| Expense waiver/reimbursement6 | 0.20% | 0.25% | 0.22% | 0.39% | 1.43%5 |
| Supplemental Data: | | | | | |
| Net assets, end of period (000 omitted) | $123,604 | $112,894 | $217,849 | $98,936 | $23,418 |
| Portfolio turnover | 42% | 48% | 66% | 27% | 16% |
| 1 | Reflects operations for the period from March 30, 2005 (date of initial investment) to October 31, 2005. |
| 2 | Per share numbers have been calculated using the average shares method. |
| 3 | Based on net asset value, which does not reflect the sales charge, redemption fee or contingent deferred sales charge, if applicable. Total returns for periods of less than one year are not annualized. |
| 4 | The net expense ratio is calculated without reduction for expense offset arrangements. The net expense ratios are 1.78%, 1.75%, 1.74% and 1.63%, for the years ended October 31, 2009, 2008, 2007 and 2006, respectively, after taking into account these expense reductions. |
| 5 | Computed on an annualized basis. |
| 6 | This expense decrease is reflected in both the net expense and the net investment income ratios shown above. |
- See Notes which are an integral part of the Financial Statements
Annual Shareholder Report2
Shareholder Expense Example (unaudited)
As a shareholder of the Fund, you incur two types of costs: (1) transaction costs, including sales charges (loads) on purchase or redemption payments; and (2) ongoing costs, including management fees and to the extent applicable, distribution (12b-1) fees and/or shareholder services fees and other Fund expenses. This Example is intended to help you to understand your ongoing costs (in dollars) of investing in the Fund and to compare these costs with the ongoing costs of investing in other mutual funds. It is based on an investment of $1,000 invested at the beginning of the period and held for the entire period from May 1, 2009 to October 31, 2009.
ACTUAL EXPENSES
The first section of the table below provides information about actual account values and actual expenses. You may use the information in this section, together with the amount you invested, to estimate the expenses that you incurred over the period. Simply divide your account value by $1,000 (for example, an $8,600 account value divided by $1,000 = 8.6), then multiply the result by the number in the first section under the heading entitled “Expenses Paid During Period” to estimate the expenses attributable to your investment during this period.
HYPOTHETICAL EXAMPLE FOR COMPARISON PURPOSES
The second section of the table below provides information about hypothetical account values and hypothetical expenses based on the Fund's actual expense ratio and an assumed rate of return of 5% per year before expenses, which is not the Fund's actual return. Thus, you should not use the hypothetical account values and expenses to estimate the actual ending account balance or your expenses for the period. Rather, these figures are required to be provided to enable you to compare the ongoing costs of investing in the Fund with other funds. To do so, compare this 5% hypothetical example with the 5% hypothetical examples that appear in the shareholder reports of the other funds.
Annual Shareholder Report3
Please note that the expenses shown in the table are meant to highlight your ongoing costs only and do not reflect any transaction costs, such as sales charges (loads) on purchase or redemption payments. Therefore, the second section of the table is useful in comparing ongoing costs only, and will not help you determine the relative total costs of owning different funds. In addition, if these transaction costs were included, your costs would have been higher. | Beginning
Account Value
5/1/2009 | Ending
Account Value
10/31/2009 | Expenses Paid
During Period1 |
| Actual: | | | |
| Class A Shares | $1,000 | $1,204.20 | $5.83 |
| Class C Shares | $1,000 | $1,196.00 | $9.96 |
Hypothetical (assuming a 5% return
before expenses): | | | |
| Class A Shares | $1,000 | $1,019.91 | $5.35 |
| Class C Shares | $1,000 | $1,016.13 | $9.15 |
| 1 | Expenses are equal to the Fund's annualized net expense ratios, multiplied by the average account value over the period, multiplied by 184/365 (to reflect the one-half year period). The annualized net expense ratios are as follows: |
| Class A Shares | 1.05% |
| Class C Shares | 1.80% |
Annual Shareholder Report4
Performance data quoted represents past performance which is no guarantee of future results. Investment return and principal value will fluctuate so that an investor's shares, when redeemed, may be worth more or less than their original cost. Mutual fund performance changes over time and current performance may be lower or higher than what is stated. For current to the most recent month-end performance and after-tax returns, visit FederatedInvestors.com or call 1-800-341-7400.
Management's Discussion of Fund Performance (unaudited)
The Fund's total return, at net asset value, for the fiscal year ended October 31, 2009 was 0.31% for Class A Shares and -0.69% for Class C Shares. The total returns of the Dow Jones Select Dividend Index1 and the S&P 500 Index2 were -8.35% and 9.80%, respectively, for the same period. The Fund's total return for the fiscal year reflected actual cash flows, transaction costs and other expenses, which were not reflected in the total return of the benchmarks.
The following discussion will focus on the performance of the Fund's
Class A Shares.
Market Overview
The fiscal year ended October 31, 2009 was a challenging environment for an equity income strategy as it marked the bottom of the longest recession in the post World War II era and endured a low-quality, post-recession rally. Over the course of the year, the stock market was buffeted by multiple head-winds as almost every major indicator trended downward, from retail sales and industrial production to record lows for home sales, home prices and home building. On the employment front, the jobless rate hit a 26-year high, fueled by the greatest job losses in decades. Attempting to stem further declines were the nearly $1 trillion in financial stimulus and the government's intervention into numerous failing financial institutions. Despite unknown and potentially negative long-term implications, these moves provided near-term support to economic activity and brought some hints of an eventual recovery.
| 1 | The Dow Jones Select Dividend Index is a dividend-weighted index intended to represent the 100 stocks in the Dow Jones U.S. Total Market Index that have the highest indicated annual dividend yield. It is not possible to invest directly in an index. |
| 2 | The S&P 500 Index is an unmanaged capitalization-weighted index of 500 stocks designed to measure performance of the broad domestic economy through changes in the aggregate market value of 500 stocks representing all major industries. It is not possible to invest directly in an index. |
Annual Shareholder Report5
Investor focus shifted from relief over avoiding further economic decline to debate about the strength and timing of a recovery. The reality is, despite a stock market rally that added more than $1 trillion to household net worth in the second quarter, households are down some $11 trillion from the collapse in stock and home prices, household debt is a near-record 122% of disposable income, and home foreclosures and mortgage delinquencies are on the rise - with one in eight homeowners in arrears on their mortgages and nearly one in three underwater (owing more than their home is worth). Fund Performance
On an absolute performance basis, the Fund continued to deliver on its objective of providing a substantially higher than market yield. While the overall dividend growth profile of the Fund was impaired by the widespread dividend declines in the marketplace, the product continued to focus on investing in those stocks that provide growth in dividend income over time. To this point, the portfolio experienced 27 dividend increases and four dividend cuts for the fiscal year. There was a revival in dividend increases toward the end of the fiscal year. The low risk features of the Fund remained intact with the product offering a three-year beta of 0.74 versus the S&P 500 Index.
Performance during the fiscal year was dominated by the market's preferences in the post-recession rally. Since the bounce off the market bottom in early March, investors have favored features contrary to the Fund's style including high beta, small capitalization and lowest quality stocks. Highest returns were focused in sectors that provide little to no dividend opportunity, including Consumer Discretionary, Materials and Information Technology. As a result, the Fund outperformed the universe of dividend-yielding stocks as represented by the Dow Jones Dividend Select Index yet lagged the broad market as measured by the S&P 500 Index.
Annual Shareholder Report6
The leading contributor to the Fund's outperformance to the Dow Jones Select Dividend Index was the Fund's comparative avoidance of the Financials sector. The Fund's 20% underweight position contributed 7.6% of positive group weight variance as the Financials sector was the worst performing sector in the index. The Fund gained another 4.3% of positive total variance from a 17.3% overweight position, coupled with positive stock selection, within Telecommunication Services. The Fund's holdings outperformed those in the benchmark by 11.5% with stocks in the Fund, but not in the benchmark, such as BCE and Windstream gaining 30.8% and 43.8%, respectively. Both the Fund and the benchmark held Centurytel and AT&T, each posting low single-digit returns.Underperformance to the S&P 500 was due to the rotation of low-quality, high-beta stocks back into market favor toward the end of the fiscal year. The Fund lagged most notably with its 17.4% underweight position in the Information Technology sector, which posted the highest returns, at 31.5%, in the period. The Fund was further penalized by 0.90% and 2.40%, respectively, of negative group weight variance from underweight positions in Consumer Discretionary and Financials sector holdings. Furthermore, negative stock selection within Consumer Discretionary cost the Fund 0.9%.
Annual Shareholder Report7
GROWTH OF A $10,000 INVESTMENT - CLASS A SHARES
The graph below illustrates the hypothetical investment of $10,0001 in the Federated Strategic Value Fund (Class A Shares) (the “Fund”) from March 30, 2005 (start of performance) to October 31, 2009, compared to the Standard & Poor's 500 Index (S&P 500)2 and the Dow Jones Select Dividend Index (DJSDI).2
| Average Annual Total Returns3 for the Period Ended 10/31/2009 | |
| 1 Year | -5.13% |
| Start of Performance (3/30/2005) | -1.25% |
Performance data quoted represents past performance which is no guarantee of future results. Investment return and principal value will fluctuate so that an investor's shares, when redeemed, may be worth more or less than their original cost. Mutual fund performance changes over time and current performance may be lower or higher than what is stated. For current to the most recent month-end performance and after-tax returns, visit FederatedInvestors.com or call 1-800-341-7400. Returns shown do not reflect the deduction of taxes that a shareholder would pay on Fund distributions or the redemption of Fund shares. Mutual funds are not obligations of or guaranteed by any bank and are not federally insured. Total returns shown include the maximum sales charge of 5.50%.
| 1 | Represents a hypothetical investment of $10,000 in the Fund after deducting the maximum sales charge of 5.50% ($10,000 investment minus $550 sales charge = $9,450).The Fund's performance assumes the reinvestment of all dividends and distributions. The S&P 500 and the DJSDI have been adjusted to reflect reinvestment of dividends on securities in the indexes. |
| 2 | The S&P 500 is a capitalization-weighted index of 500 stocks designed to measure performance of the broad domestic economy through changes in the aggregate market value of 500 stocks representing all major industries. The DJSDI is a dividend-weighted index intended to represent the 100 stocks in the Dow Jones U.S. Total Market Index that have the highest indicated annual dividend yield. The S&P 500 and the DJSDI are not adjusted to reflect sales loads, expenses or other fees that the Securities and Exchange Commission (SEC) requires to be reflected in the Fund's performance. The indexes are unmanaged and, unlike the Fund, are not affected by cash flows. It is not possible to invest in an index. |
| 3 | Total returns quoted reflect all applicable sales charges. |
Annual Shareholder Report8
GROWTH OF A $10,000 INVESTMENT - CLASS C SHARES
The graph below illustrates the hypothetical investment of $10,0001 in the Federated Strategic Value Fund (Class C Shares) (the “Fund”) from March 30, 2005 (start of performance) to October 31, 2009, compared to the Standard & Poor's 500 Index (S&P 500)2 and the Dow Jones Select Dividend Index (DJSDI).2
| Average Annual Total Returns3 for the Period Ended 10/31/2009 | |
| 1 Year | -1.65% |
| Start of Performance (3/30/2005) | -0.76% |
Performance data quoted represents past performance which is no guarantee of future results. Investment return and principal value will fluctuate so that an investor's shares, when redeemed, may be worth more or less than their original cost. Mutual fund performance changes over time and current performance may be lower or higher than what is stated. For current to the most recent month-end performance and after-tax returns, visit FederatedInvestors.com or call 1-800-341-7400. Returns shown do not reflect the deduction of taxes that a shareholder would pay on Fund distributions or the redemption of Fund shares. Mutual funds are not obligations of or guaranteed by any bank and are not federally insured. Total returns shown include the maximum contingent deferred sales charge of 1.00%, as applicable.
| 1 | Represents a hypothetical investment of $10,000 in the Fund. A 1.00% contingent deferred sales charge would be applied to any redemption less than one year from the purchase date. The Fund's performance assumes the reinvestment of all dividends and distributions. The S&P 500 and the DJSDI have been adjusted to reflect reinvestment of dividends on securities in the indexes. |
| 2 | The S&P 500 is a capitalization-weighted index of 500 stocks designed to measure performance of the broad domestic economy through changes in the aggregate market value of 500 stocks representing all major industries. The DJSDI is a dividend-weighted index intended to represent the 100 stocks in the Dow Jones U.S. Total Market Index that have the highest indicated annual dividend yield. The S&P 500 and the DJSDI are not adjusted to reflect sales loads, expenses or other fees that the SEC requires to be reflected in the Fund's performance. The indexes are unmanaged and, unlike the Fund, are not affected by cash flows. It is not possible to invest in an index. |
| 3 | Total returns quoted reflect all applicable contingent deferred sales charges. |
Annual Shareholder Report9
Portfolio of Investments Summary Table (unaudited)
At October 31, 2009, the Fund's sector composition1 was as follows:
| Sector Composition | | Percentage of
Total Net Assets |
| Consumer Staples | | 24.3% |
| Telecommunication Services | | 18.8% |
| Health Care | | 17.4% |
| Energy | | 16.2% |
| Utilities | | 13.9% |
| Consumer Discretionary | | 3.0% |
| Financials | | 3.0% |
| Industrials | | 1.8% |
| Information Technology | | 0.5% |
| Cash Equivalents2 | | 0.7% |
| Other Assets and Liabilities — Net3 | | 0.4% |
| TOTAL | | 100.0% |
| 1 | Except for Cash Equivalents and Other Assets and Liabilities, sector classifications are based upon, and individual portfolio securities are assigned to, the classifications of the Global Industry Classification Standard (GICS) except that the adviser assigns a classification to securities not classified by the GICS and to securities for which the adviser does not have access to the classification made by the GICS. |
| 2 | Cash Equivalents include any investments in money market mutual funds and/or overnight repurchase agreements. |
| 3 | Assets, other than investments in securities, less liabilities. See Statement of Assets and Liabilities. |
Annual Shareholder Report10
Portfolio of Investments
October 31, 2009
|
| Shares | | | Value |
| | Common Stocks – 98.9% | |
| | Consumer Discretionary – 3.0% | |
| 440,625 | | McDonald's Corp. | 25,825,031 |
| | Consumer Staples – 24.3% | |
| 991,585 | | Altria Group, Inc. | 17,957,604 |
| 134,500 | | Clorox Corp. | 7,966,435 |
| 994,865 | | Diageo PLC | 16,214,582 |
| 590,070 | | H.J. Heinz Co. | 23,744,417 |
| 446,725 | | Kimberly-Clark Corp. | 27,321,701 |
| 213,400 | | Lorillard, Inc. | 16,585,448 |
| 556,485 | | Philip Morris International, Inc. | 26,355,130 |
| 361,770 | | Procter & Gamble Co. | 20,982,660 |
| 407,931 | | Reynolds American, Inc. | 19,776,495 |
| 322,975 | | The Coca-Cola Co. | 17,217,797 |
| 541,802 | | Unilever PLC | 16,217,214 |
| | TOTAL | 210,339,483 |
| | Energy – 16.2% | |
| 541,345 | | BP PLC, ADR | 30,650,954 |
| 397,880 | | Chevron Corp. | 30,453,735 |
| 445,555 | | ConocoPhillips | 22,357,950 |
| 1,006,925 | | Royal Dutch Shell PLC, Class B | 29,168,363 |
| 462,840 | | Total S.A. | 27,560,613 |
| | TOTAL | 140,191,615 |
| | Financials – 3.0% | |
| 365,300 | | HCP, Inc. | 10,809,227 |
| 246,000 | | Health Care REIT, Inc. | 10,915,020 |
| 178,300 | | Realty Income Corp. | 4,132,994 |
| | TOTAL | 25,857,241 |
| | Health Care – 17.4% | |
| 368,500 | | Abbott Laboratories | 18,635,045 |
| 233,000 | | AstraZeneca PLC | 10,472,719 |
| 1,200,815 | | Bristol-Myers Squibb Co. | 26,177,767 |
| 792,815 | | Eli Lilly & Co. | 26,963,638 |
| 1,105,481 | | GlaxoSmithKline PLC | 22,702,732 |
| 360,315 | | Johnson & Johnson | 21,276,601 |
Annual Shareholder Report11
|
| 800,025 | | Merck & Co., Inc. | 24,744,773 |
| | TOTAL | 150,973,275 |
| | Industrials – 1.8% | |
| 217,800 | | Emerson Electric Co. | 8,221,950 |
| 259,300 | | Waste Management, Inc. | 7,747,884 |
| | TOTAL | 15,969,834 |
| | Information Technology – 0.5% | |
| 141,000 | | Paychex, Inc. | 4,005,810 |
| | Telecommunication Services – 18.8% | |
| 863,945 | | AT&T, Inc. | 22,177,468 |
| 962,710 | | BCE, Inc. | 23,034,575 |
| 364,330 | | CenturyTel, Inc. | 11,826,152 |
| 850,740 | | Deutsche Telekom AG, Class REG | 11,603,059 |
| 844,863 | | France Telecom SA | 20,889,986 |
| 827,698 | | Telefonica SA | 23,102,641 |
| 748,955 | | Verizon Communications, Inc. | 22,161,578 |
| 8,051,874 | | Vodafone Group PLC | 17,814,685 |
| 1,017,685 | | Windstream Corp. | 9,810,483 |
| | TOTAL | 162,420,627 |
| | Utilities – 13.9% | |
| 308,495 | | AGL Resources, Inc. | 10,784,985 |
| 665,995 | | Dominion Resources, Inc. | 22,703,770 |
| 1,582,000 | | Duke Energy Corp. | 25,027,240 |
| 276,192 | | NSTAR | 8,548,142 |
| 430,675 | | Progress Energy, Inc. | 16,163,233 |
| 320,040 | | SCANA Corp. | 10,830,154 |
| 843,928 | | Southern Co. | 26,322,114 |
| | TOTAL | 120,379,638 |
| | TOTAL COMMON STOCKS
(IDENTIFIED COST $859,437,521) | 855,962,554 |
| | MUTUAL FUND – 0.7% | |
| 6,587,253 | 1,2 | Prime Value Obligations Fund, Institutional Shares, 0.22%
(AT NET ASSET VALUE) | 6,587,253 |
| | TOTAL INVESTMENTS — 99.6%
(IDENTIFIED COST $866,024,774)3 | 862,549,807 |
| | OTHER ASSETS AND LIABILITIES - NET — 0.4%4 | 3,146,549 |
| | TOTAL NET ASSETS — 100% | $865,696,356 |
Annual Shareholder Report12
| 1 | Affiliated company. |
| 2 | 7-Day net yield. |
| 3 | The cost of investments for federal tax purposes amounts to $866,157,733. |
| 4 | Assets, other than investments in securities, less liabilities. See Statement of Assets and Liabilities. |
- Note: The categories of investments are shown as a percentage of total net assets at October 31, 2009.
- Various inputs are used in determining the value of the Fund's investments. These inputs are summarized in the three broad levels listed below:
- Level 1 — quoted prices in active markets for identical securities
- Level 2 — other significant observable inputs (including quoted prices for similar securities, interest rates, prepayment speeds, credit risk, etc.)
- Level 3 — significant unobservable inputs (including the Fund's own assumptions in determining the fair value of investments)
- The inputs or methodology used for valuing securities are not an indication of the risk associated with investing in those securities.
- The following is a summary of the inputs used, as of October 31, 2009, in valuing the Fund's assets carried at fair value:
| Valuation Inputs | | | | |
| Level 1 -
Quoted
Prices and
Investments in
Mutual Funds | Level 2 -
Other
Significant
Observable
Inputs | Level 3 -
Significant
Unobservable
Inputs | Total |
| Equity Securities: | | | | |
| Domestic | $606,530,432 | $ — | $ — | $606,530,432 |
| International | 53,685,529 | 195,746,593 | — | 249,432,122 |
| Mutual Fund | 6,587,253 | — | — | 6,587,253 |
| TOTAL SECURITIES | $666,803,214 | $195,746,593 | $ — | $862,549,807 |
- The following acronym is used throughout this portfolio:
- ADR — American Depositary Receipt
- See Notes which are an integral part of the Financial Statements
Annual Shareholder Report13
Statement of Assets and Liabilities
October 31, 2009
| Assets: | | |
| Total investments in securities, at value including $6,587,253 of investments in an affiliated issuer (Note 5) (identified cost $866,024,774) | | $862,549,807 |
| Cash | | 174,051 |
| Cash denominated in foreign currencies (identified cost $19,982) | | 19,596 |
| Income receivable | | 2,404,723 |
| Receivable for investments sold | | 4,778 |
| Receivable for shares sold | | 2,823,066 |
| TOTAL ASSETS | | 867,976,021 |
| Liabilities: | | |
| Payable for shares redeemed | $1,797,716 | |
| Payable for transfer and dividend disbursing agent fees and expenses | 74,627 | |
| Payable for distribution services fee (Note 5) | 78,401 | |
| Payable for shareholder services fee (Note 5) | 252,930 | |
| Payable for Directors'/Trustees' fees | 2,290 | |
| Accrued expenses | 73,701 | |
| TOTAL LIABILITIES | | 2,279,665 |
| Net assets for 224,804,341 shares outstanding | | $865,696,356 |
| Net Assets Consist of: | | |
| Paid-in capital | | $1,137,444,432 |
| Net unrealized depreciation of investments and translation of assets and liabilities in foreign currency | | (3,468,073) |
| Accumulated net realized loss on investments and foreign currency transactions | | (269,777,558) |
| Undistributed net investment income | | 1,497,555 |
| TOTAL NET ASSETS | | $865,696,356 |
Annual Shareholder Report14
Statement of Assets and Liabilities — continued| Net Asset Value, Offering Price and Redemption Proceeds Per Share | | |
| Institutional Shares: | | |
| Net asset value per share ($383,502,777 ÷ 99,455,842 shares outstanding), no par value, unlimited shares authorized | | $3.86 |
| Offering price per share | | $3.86 |
| Redemption proceeds per share | | $3.86 |
| Class A Shares: | | |
| Net asset value per share ($358,589,114 ÷ 93,259,245 shares outstanding), no par value, unlimited shares authorized | | $3.85 |
| Offering price per share (100/94.50 of $3.85) | | $4.07 |
| Redemption proceeds per share | | $3.85 |
| Class C Shares: | | |
| Net asset value per share ($123,604,465 ÷ 32,089,254 shares outstanding), no par value, unlimited shares authorized | | $3.85 |
| Offering price per share | | $3.85 |
| Redemption proceeds per share (99.00/100 of $3.85) | | $3.81 |
- See Notes which are an integral part of the Financial Statements
Annual Shareholder Report15
Statement of Operations
Year Ended October 31, 2009
| Investment Income: | | | |
| Dividends (including $279,844 received from an affiliated issuer (Note 5) and net of foreign taxes withheld of $505,864) | | | $34,769,678 |
| Expenses: | | | |
| Investment adviser fee (Note 5) | | $4,819,221 | |
| Administrative personnel and services fee (Note 5) | | 498,762 | |
| Custodian fees | | 59,698 | |
| Transfer and dividend disbursing agent fees and expenses | | 674,300 | |
| Directors'/Trustees' fees | | 6,040 | |
| Auditing fees | | 22,400 | |
| Legal fees | | 5,069 | |
| Portfolio accounting fees | | 129,287 | |
| Distribution services fee — Class C Shares (Note 5) | | 802,444 | |
| Shareholder services fee — Class A Shares (Note 5) | | 699,305 | |
| Shareholder services fee — Class C Shares (Note 5) | | 259,343 | |
| Account administration fee — Class A Shares | | 4,804 | |
| Account administration fee — Class C Shares | | 576 | |
| Share registration costs | | 53,199 | |
| Printing and postage | | 90,129 | |
| Insurance premiums | | 3,802 | |
| Miscellaneous | | 4,554 | |
| TOTAL EXPENSES | | 8,132,933 | |
Annual Shareholder Report16
Statement of Operations — continued| Waivers, Reimbursement and Expense Reduction: | | | |
| Waiver/reimbursement of investment adviser fee (Note 5) | $(1,228,557) | | |
| Waiver of administrative personnel and services fee (Note 5) | (9,772) | | |
| Fees paid indirectly from directed brokerage arrangements (Note 6) | (27,358) | | |
| TOTAL WAIVERS, REIMBURSEMENT AND EXPENSE REDUCTION | | $(1,265,687) | |
| Net expenses | | | $6,867,246 |
| Net investment income | | | 27,902,432 |
| Realized and Unrealized Gain (Loss) on Investments and Foreign Currency Transactions: | | | |
| Net realized loss on investments and foreign currency transactions | | | (111,299,565) |
| Net change in unrealized depreciation of investments and translation of assets and liabilities in foreign currency | | | 115,478,072 |
| Net realized and unrealized gain on investments and foreign currency transactions | | | 4,178,507 |
| Change in net assets resulting from operations | | | $32,080,939 |
- See Notes which are an integral part of the Financial Statements
Annual Shareholder Report17
Statement of Changes in Net Assets
| Year Ended October 31 | 2009 | 2008 |
| Increase (Decrease) in Net Assets | | |
| Operations: | | |
| Net investment income | $27,902,432 | $37,740,877 |
| Net realized loss on investments and foreign currency transactions | (111,299,565) | (159,158,300) |
| Net change in unrealized appreciation/depreciation of investments and translation of assets and liabilities in foreign currency | 115,478,072 | (138,352,041) |
| CHANGE IN NET ASSETS RESULTING FROM OPERATIONS | 32,080,939 | (259,769,464) |
| Distributions to Shareholders: | | |
| Distributions from net investment income | | |
| Institutional Shares | (11,149,598) | (10,312,929) |
| Class A Shares | (12,436,345) | (21,360,233) |
| Class C Shares | (3,870,108) | (7,482,872) |
| Distributions from net realized gain on investments and foreign currency transactions | | |
| Institutional Shares | — | (8,905,275) |
| Class A Shares | — | (24,168,884) |
| Class C Shares | — | (9,508,724) |
| CHANGE IN NET ASSETS RESULTING FROM DISTRIBUTIONS TO SHAREHOLDERS | (27,456,051) | (81,738,917) |
| Share Transactions: | | |
| Proceeds from sale of shares | 558,427,866 | 268,193,176 |
| Net asset value of shares issued to shareholders in payment of distributions declared | 17,675,948 | 63,505,448 |
| Cost of shares redeemed | (253,838,605) | (424,759,433) |
| CHANGE IN NET ASSETS RESULTING FROM SHARE TRANSACTIONS | 322,265,209 | (93,060,809) |
| Change in net assets | 326,890,097 | (434,569,190) |
| Net Assets: | | |
| Beginning of period | 538,806,259 | 973,375,449 |
| End of period (including undistributed net investment income of $1,497,555 and $1,121,022, respectively) | $865,696,356 | $538,806,259 |
- See Notes which are an integral part of the Financial Statements
Annual Shareholder Report18
Notes to Financial Statements
October 31, 2009
1. ORGANIZATION
Federated Equity Funds (the “Trust”) is registered under the Investment Company Act of 1940, as amended (the “Act”), as an open-end management investment company. The Trust consists of 13 portfolios. The financial statements included herein are only those of Federated Strategic Value Fund (the “Fund”), a diversified portfolio. The financial statements of the other portfolios are presented separately. The assets of each portfolio are segregated and a shareholder's interest is limited to the portfolio in which shares are held. Each portfolio pays its own expenses. The Fund offers three classes of shares: Institutional Shares, Class A Shares and Class C Shares. All shares of the Fund have equal rights with respect to voting, except on class-specific matters. The financial highlights of the Institutional Shares are presented separately. The investment objective of the Fund is to provide income and long-term capital appreciation.
2. SIGNIFICANT ACCOUNTING POLICIES
The following is a summary of significant accounting policies consistently followed by the Fund in the preparation of its financial statements. These policies are in conformity with U.S. generally accepted accounting principles (GAAP).
Investment Valuation
In calculating its net asset value (NAV), the Fund generally values investments as follows:
- Equity securities listed on an exchange or traded through a regulated market system are valued at their last reported sale price or official closing price in their principal exchange or market.
- Shares of other mutual funds are valued based upon their reported NAVs.
- Derivative contracts listed on exchanges are valued at their reported settlement or closing price.
- Over-the-counter (OTC) derivative contracts are fair valued using price evaluations provided by a pricing service approved by the Board of Trustees (the “Trustees”).
- Fixed-income securities acquired with remaining maturities greater than 60 days are fair valued using price evaluations provided by a pricing service approved by the Trustees.
- Fixed-income securities acquired with remaining maturities of 60 days or less are valued at their cost (adjusted for the accretion of any discount or amortization of any premium).
If the Fund cannot obtain a price or price evaluation from a pricing service for an investment, the Fund may attempt to value the investment based upon the mean of bid and asked quotations or fair value the investment based on price evaluations, from one or more dealers. If any price, quotation, price evaluation or other pricing source is not readily available when the NAV is calculated, the Fund uses the fair value of the investment determined in accordance with the procedures described below. There can be no assurance that the Fund could purchase or sell an investment at the price used to calculate the Fund's NAV.
Fair Valuation and Significant Events Procedures
The Trustees have authorized the use of pricing services to provide evaluations of the current fair value of certain investments for purposes of calculating the NAV. Factors considered by pricing services in evaluating an investment include the yields or prices of investments of comparable quality, coupon, maturity, call rights and other potential prepayments, terms and type, reported transactions, indications as to values from dealers and general market Annual Shareholder Report19
conditions. Some pricing services provide a single price evaluation reflecting the bid-side of the market for an investment (a “bid” evaluation). Other pricing services offer both bid evaluations and price evaluations indicative of a price between the prices bid and asked for the investment (a “mid” evaluation). The Fund normally uses bid evaluations for U.S. Treasury and Agency securities, mortgage-backed securities and municipal securities. The Fund normally uses mid evaluations for other types of fixed-income securities and OTC derivative contracts. In the event that market quotations and price evaluations are not available for an investment, the fair value of the investment is determined in accordance with procedures adopted by the Trustees.The Trustees also have adopted procedures requiring an investment to be priced at its fair value whenever the Adviser determines that a significant event affecting the value of the investment has occurred between the time as of which the price of the investment would otherwise be determined and the time as of which the NAV is computed. An event is considered significant if there is both an affirmative expectation that the investment's value will change in response to the event and a reasonable basis for quantifying the resulting change in value. Examples of significant events that may occur after the close of the principal market on which a security is traded, or after the time of a price evaluation provided by a pricing service or a dealer, include:
- With respect to securities traded in foreign markets, significant trends in U.S. equity markets or in the trading of foreign securities index futures or options contracts;
- With respect to price evaluations of fixed-income securities determined before the close of regular trading on the NYSE, actions by the Federal Reserve Open Market Committee and other significant trends in U.S. fixed-income markets;
- Political or other developments affecting the economy or markets in which an issuer conducts its operations or its securities are traded; and
- Announcements concerning matters such as acquisitions, recapitalizations, litigation developments, a natural disaster affecting the issuer's operations or regulatory changes or market developments affecting the issuer's industry.
The Trustees have approved the use of a pricing service to determine the fair value of equity securities traded principally in foreign markets when the Adviser determines that there has been a significant trend in the U.S. equity markets or in index futures trading. For other significant events, the Fund may seek to obtain more current quotations or price evaluations from alternative pricing sources. If a reliable alternative pricing source is not available, the Fund will determine the fair value of the investment using another method approved by the Trustees.
Repurchase Agreements
It is the policy of the Fund to require the other party to a repurchase agreement to transfer to the Fund's custodian or sub-custodian eligible securities or cash with a market value (after transaction costs) at least equal to the repurchase price to be paid under the repurchase agreement. The eligible securities are transferred to accounts with the custodian or sub-custodian in which the Fund holds a “securities entitlement” and exercises “control” as those terms are defined in the Uniform Commercial Code. The Fund has established procedures for monitoring the market value of the transferred securities and requiring the transfer of additional eligible securities if necessary to equal at least the repurchase price. These procedures also allow the other party to require securities to be transferred from the account to the extent that their market value exceeds the repurchase price or in exchange for other eligible securities of equivalent market value.
Annual Shareholder Report20
With respect to agreements to repurchase U.S. government securities and cash items, the Fund treats the repurchase agreement as an investment in the underlying securities and not as an obligation of the other party to the repurchase agreement. Other repurchase agreements are treated as obligations of the other party secured by the underlying securities. Nevertheless, the insolvency of the other party or other failure to repurchase the securities may delay the disposition of the underlying securities or cause the Fund to receive less than the full repurchase price. Under the terms of the repurchase agreement, any amounts received by the Fund in excess of the repurchase price and related transaction costs must be remitted to the other party.The Fund may enter into repurchase agreements in which eligible securities are transferred into joint trading accounts maintained by the custodian or sub-custodian for investment companies and other clients advised by the Fund's Adviser and its affiliates. The Fund will participate on a pro rata basis with the other investment companies and clients in its share of the securities transferred under such repurchase agreements and in its share of proceeds from any repurchase or other disposition of such securities.
Investment Income, Gains and Losses, Expenses and Distributions
Investment transactions are accounted for on a trade-date basis. Realized gains and losses from investment transactions are recorded on an identified-cost basis. Interest income and expenses are accrued daily. Dividend income and distributions to shareholders are recorded on the ex-dividend date. Foreign dividends are recorded on the ex-dividend date or when the Fund is informed of the ex-dividend date. Distributions of net investment income are declared and paid monthly. Non-cash dividends included in dividend income, if any, are recorded at fair value. Investment income, realized and unrealized gains and losses and certain fund-level expenses are allocated to each class based on relative average daily net assets, except that each class may bear certain expenses unique to that class such as account administration, distribution services and shareholder services fees. Dividends are declared separately for each class. No class has preferential dividend rights; differences in per share dividend rates are generally due to differences in separate class expenses.
Premium and Discount Amortization
All premiums and discounts on fixed-income securities are amortized/accreted for financial statement purposes.
Federal Taxes
It is the Fund's policy to comply with the Subchapter M provision of the Internal Revenue Code (the “Code”) and to distribute to shareholders each year substantially all of its income. Accordingly, no provision for federal income tax is necessary. As of and during the year ended October 31, 2009, the Fund did not have a liability for any uncertain tax positions. The Fund recognizes interest and penalties, if any, related to tax liabilities as income tax expense in the Statement of Operations. As of October 31, 2009, tax years 2006 through 2009 remain subject to examination by the Fund's major tax jurisdictions, which include the United States of America and the Commonwealth of Massachusetts.
The Fund may be subject to taxes imposed by governments of countries in which it invests. Such taxes are generally based on either income or gains earned or repatriated. The Fund accrues and applies such taxes to net investment income, net realized gains and net unrealized gains as income and/or gains are earned.
Annual Shareholder Report21
When-Issued and Delayed Delivery TransactionsThe Fund may engage in when-issued or delayed delivery transactions. The Fund records when-issued securities on the trade date and maintains security positions such that sufficient liquid assets will be available to make payment for the securities purchased. Securities purchased on a when-issued or delayed delivery basis are marked to market daily and begin earning interest on the settlement date. Losses may occur on these transactions due to changes in market conditions or the failure of counterparties to perform under the contract.
Foreign Currency Translation
The accounting records of the Fund are maintained in U.S. dollars. All assets and liabilities denominated in foreign currencies (FCs) are translated into U.S. dollars based on the rates of exchange of such currencies against U.S. dollars on the date of valuation. Purchases and sales of securities, income and expenses are translated at the rate of exchange quoted on the respective date that such transactions are recorded. The Fund does not isolate that portion of the results of operations resulting from changes in foreign exchange rates on investments from the fluctuations arising from changes in market prices of securities held. Such fluctuations are included with the net realized and unrealized gain or loss from investments.
Reported net realized foreign exchange gains or losses arise from sales of portfolio securities, sales and maturities of short-term securities, sales of FCs, currency gains or losses realized between the trade and settlement dates on securities transactions, the difference between the amounts of dividends, interest and foreign withholding taxes recorded on the Fund's books, and the U.S. dollar equivalent of the amounts actually received or paid. Net unrealized foreign exchange gains and losses arise from changes in the value of assets and liabilities other than investments in securities at fiscal year end, resulting from changes in the exchange rate.
Other
The preparation of financial statements in conformity with GAAP requires management to make estimates and assumptions that affect the amounts of assets, liabilities, expenses and revenues reported in the financial statements. Actual results could differ from those estimated.
3. SHARES OF BENEFICIAL INTEREST
The following tables summarize share activity:
| Year Ended October 31 | 2009 | 2008 |
| Institutional Shares: | Shares | Amount | Shares | Amount |
| Shares sold | 83,605,179 | $297,549,252 | 25,974,317 | $127,806,862 |
| Shares issued to shareholders in payment of distributions declared | 1,509,664 | 5,433,865 | 2,017,469 | 10,947,943 |
| Shares redeemed | (29,490,952) | (105,551,197) | (15,481,308) | (78,753,625) |
NET CHANGE RESULTING
FROM INSTITUTIONAL SHARE TRANSACTIONS | 55,623,891 | $197,431,920 | 12,510,478 | $60,001,180 |
Annual Shareholder Report22
| Year Ended October 31 | 2009 | 2008 |
| Class A Shares: | Shares | Amount | Shares | Amount |
| Shares sold | 61,006,487 | $216,116,030 | 21,162,592 | $107,920,645 |
| Shares issued to shareholders in payment of distributions declared | 2,533,845 | 9,093,307 | 6,937,960 | 37,946,847 |
| Shares redeemed | (32,564,324) | (114,933,297) | (53,217,904) | (267,747,175) |
NET CHANGE RESULTING
FROM CLASS A SHARE TRANSACTIONS | 30,976,008 | $110,276,040 | (25,117,352) | $(121,879,683) |
| Year Ended October 31 | 2009 | 2008 |
| Class C Shares: | Shares | Amount | Shares | Amount |
| Shares sold | 12,456,454 | $44,762,584 | 6,304,293 | $32,465,669 |
| Shares issued to shareholders in payment of distributions declared | 875,231 | 3,148,776 | 2,659,723 | 14,610,658 |
| Shares redeemed | (9,350,190) | (33,354,111) | (15,035,052) | (78,258,633) |
NET CHANGE RESULTING
FROM CLASS C SHARE TRANSACTIONS | 3,981,495 | $14,557,249 | (6,071,036) | $(31,182,306) |
| NET CHANGE RESULTING FROM FUND SHARE TRANSACTIONS | 90,581,394 | $322,265,209 | (18,677,910) | $(93,060,809) |
4. FEDERAL TAX INFORMATION
The timing and character of income and capital gain distributions are determined in accordance with income tax regulations, which may differ from GAAP. These differences are due to differing treatments for foreign currency transactions.
For the year ended October 31, 2009, permanent differences identified and reclassified among the components of net assets were as follows:
| Increase (Decrease) |
Undistributed
Net Investment
Income (Loss) | | Accumulated
Net Realized
Gain (Loss) |
| $(69,848) | | $69,848 |
Net investment income (loss), net realized gains (losses) and net assets were not affected by this reclassification.
The tax character of distributions as reported on the Statement of Changes in Net Assets for the years ended October 31, 2009 and 2008, was as follows:
| 2009 | 2008 |
| Ordinary income1 | $27,456,051 | $61,361,918 |
| Long-term capital gains | $ — | $20,376,999 |
| 1 | For tax purposes, short-term capital gain distributions are considered ordinary income distributions. |
Annual Shareholder Report23
As of October 31, 2009, the components of distributable earnings on a tax basis were as follows:
| Undistributed ordinary income | $1,497,555 |
| Net unrealized depreciation | $(3,601,032) |
| Capital loss carryforwards | $(269,644,599) |
At October 31, 2009, the cost of investments for federal tax purposes was $866,157,733. The net unrealized depreciation of investments for federal tax purposes excluding any unrealized appreciation/depreciation resulting from changes in foreign currency exchange rates was $3,607,926. This consists of net unrealized appreciation from investments for those securities having an excess of value over cost of $41,471,112 and net unrealized depreciation from investments for those securities having an excess of cost over value of $45,079,038.
At October 31, 2009, the Fund had a capital loss carryforward of $269,644,599 which will reduce the Fund's taxable income arising from future net realized gains on investments, if any, to the extent permitted by the Code and thus will reduce the amount of distributions to shareholders which would otherwise be necessary to relieve the Fund of any liability for federal income tax. Pursuant to the Code, such capital loss carryforward will expire as follows:
| Expiration Year | Expiration Amount |
| 2016 | $158,355,277 |
| 2017 | $111,289,322 |
5. INVESTMENT ADVISER FEE AND OTHER TRANSACTIONS WITH AFFILIATES
Investment Adviser Fee
Federated Equity Management Company of Pennsylvania is the Fund's investment adviser (the “Adviser”). The advisory agreement between the Fund and the Adviser provides for an annual fee equal to 0.75% of the Fund's average daily net assets. Subject to the terms described in the Expense Limitation note, the Adviser may voluntarily choose to waive any portion of its fee. The Adviser can modify or terminate this voluntary waiver at any time at its sole discretion. For the year ended October 31, 2009, the Adviser voluntarily waived $1,207,318 of its fee.
Administrative Fee
Federated Administrative Services (FAS), under the Administrative Services Agreement, provides the Fund with administrative personnel and services. The fee paid to FAS is based on the average aggregate daily net assets of certain Federated funds as specified below:
| Administrative Fee | Average Aggregate Daily Net Assets
of the Federated Funds |
| 0.150% | on the first $5 billion |
| 0.125% | on the next $5 billion |
| 0.100% | on the next $10 billion |
| 0.075% | on assets in excess of $20 billion |
Annual Shareholder Report24
The administrative fee received during any fiscal year shall be at least $150,000 per portfolio and $40,000 per each additional class of Shares. Subject to the terms described in the Expense Limitation note, FAS may voluntarily choose to waive any portion of its fee. FAS can modify or terminate this voluntary waiver at any time at its sole discretion. For the year ended
October 31, 2009, the net fee paid to FAS was 0.076% of average daily net assets of the Fund. FAS waived $9,772 of its fee.
Distribution Services Fee
The Fund has adopted a Distribution Plan (the “Plan”) pursuant to Rule 12b-1 under the Act. Under the terms of the Plan, the Fund will compensate Federated Securities Corp. (FSC), the principal distributor, from the daily net assets of the Fund's Class A Shares and Class C Shares to finance activities intended to result in the sale of these shares. The Plan provides that the Fund may incur distribution expenses at the following percentages of average daily net assets annually, to compensate FSC:
| Share Class Name | Percentage of Average Daily
Net Assets of Class |
| Class A Shares | 0.05% |
| Class C Shares | 0.75% |
Subject to the terms described in the Expense Limitation note, FSC may voluntarily choose to waive any portion of its fee. FSC can modify or terminate this voluntary waiver at any time at its sole discretion. When FSC receives fees, it may pay some or all of them to financial intermediaries whose customers purchase shares. For the year ended October 31, 2009, FSC retained $206,916 of fees paid by the Fund. For the year ended October 31, 2009, the Fund's Class A Shares did not incur a distribution services fee; however it may begin to incur this fee upon approval of the Trustees.
Sales Charges
Front-end sales charges and contingent deferred sales charges (CDSC) do not represent expenses of the Fund. They are deducted from the proceeds of sales of Fund shares prior to investment or from redemption proceeds prior to remittance, as applicable. For the year ended October 31, 2009, FSC retained $123,475 in sales charges from the sale of Class A Shares. FSC also retained $3,526 of CDSC relating to redemptions of Class A Shares and $15,635 relating to redemption of Class C Shares.
Shareholder Services Fee
The Fund may pay fees (Service Fees) up to 0.25% of the average daily net assets of the Fund's Class A Shares and Class C Shares to financial intermediaries or to Federated Shareholder Services Company (FSSC) for providing services to shareholders and maintaining shareholder accounts. Subject to the terms described in the Expense Limitation note, FSSC may voluntarily reimburse the Fund for shareholder services fees. This voluntary reimbursement can be modified or terminated at any time. For the year ended October 31, 2009, FSSC received $6,529 of fees paid by the Fund.
Interfund Transactions
During the year ended October 31, 2009, the Fund engaged in purchase and sale transactions with funds that have a common investment adviser (or affiliated investment advisers), common Directors/Trustees, and/or common Officers. These purchase and sale transactions complied with Rule 17a-7 under the Act and amounted to $381,254 and $0, respectively.
Annual Shareholder Report25
Expense LimitationThe Adviser and its affiliates (which may include FSC, FAS and FSSC) have voluntarily agreed to waive their fees and/or reimburse expenses so that the total operating expenses (as shown in the financial highlights) paid by the Fund's Institutional Shares, Class A Shares and Class C Shares (after the voluntary waivers and reimbursements) will not exceed 0.80%, 1.05% and 1.80%, respectively, through the later of (the “Termination Date”): (a) December 31, 2010; or (b) the date of the Fund's next effective Prospectus. While the Adviser and its affiliates currently do not anticipate terminating these arrangements prior to the Termination Date, these arrangements may only be terminated prior to the Termination Date with the agreement of the Fund's Board of Trustees.
General
Certain Officers and Trustees of the Fund are Officers and Directors or Trustees of the above companies.
Transactions with Affiliated Companies
Affiliated holdings are mutual funds which are managed by the Adviser or an affiliate of the Adviser. The Adviser has agreed to reimburse the Fund for certain investment adviser fees as a result of transactions in other affiliated mutual funds. For the year ended October 31, 2009, the Adviser reimbursed $21,239. Transactions with the affiliated company during the year ended October 31, 2009 were as follows:
| Affiliate | Balance of
Shares Held
10/31/2008 | Purchases/
Additions | Sales/
Reductions | Balance of
Shares Held
10/31/2009 | Value | Dividend
Income |
| Prime Value Obligations Fund, Institutionlal Shares | 25,326,593 | 302,743,516 | 321,482,856 | 6,587,253 | $6,587,253 | $279,844 |
6. EXPENSE Reduction
The Fund directs portfolio trades to a broker that in turn pays a portion of the Fund's operating expenses. For the year ended October 31, 2009, the Fund's expenses were reduced by $27,358 under these arrangements.
7. Investment TRANSACTIONS
Purchases and sales of investments, excluding long-term U.S. government securities and short-term obligations for the year ended October 31, 2009, were as follows:
| Purchases | $600,550,533 |
| Sales | $263,849,023 |
8. LINE OF CREDIT
The Fund participates in a $100,000,000 unsecured, uncommitted revolving line of credit (LOC) agreement with PNC Bank. The LOC was made available for extraordinary or emergency purposes, primarily for financing redemption payments. Borrowings are charged interest at a rate offered to the Fund by PNC Bank at the time of the borrowing. As of October 31, 2009, there were no outstanding loans. During the year ended October 31, 2009, the Fund did not utilize the LOC.
Annual Shareholder Report26
9. INTERFUND LENDINGPursuant to an Exemptive Order issued by the Securities and Exchange Commission (SEC), the Fund, along with other funds advised by subsidiaries of Federated Investors, Inc., may participate in an interfund lending program. This program provides an alternative credit facility allowing the Fund to borrow from other participating affiliated funds. As of October 31, 2009, there were no outstanding loans. During the year ended October 31, 2009, the program was not utilized.
10. Legal Proceedings
Since October 2003, Federated Investors, Inc. and related entities (collectively, “Federated”), and various Federated funds (Federated Funds) have been named as defendants in several class action lawsuits now pending in the United States District Court for the District of Maryland. The lawsuits were purportedly filed on behalf of people who purchased, owned and/or redeemed shares of Federated-sponsored mutual funds during specified periods beginning November 1, 1998. The suits are generally similar in alleging that Federated engaged in illegal and improper trading practices including market timing and late trading in concert with certain institutional traders, which allegedly caused financial injury to the mutual fund shareholders. These lawsuits began to be filed shortly after Federated's first public announcement that it had received requests for information on shareholder trading activities in the Federated Funds from the SEC, the Office of the New York State Attorney General (NYAG) and other authorities. In that regard, on November 28, 2005, Federated announced that it had reached final settlements with the SEC and the NYAG with respect to those matters. As Federated previously reported in 2004, it has already paid approximately $8.0 million to certain funds as determined by an independent consultant. As part of these settlements, Federated agreed to pay for the benefit of fund shareholders additional disgorgement and a civil money penalty in the aggregate amount of an additional $72 million. Federated entities have also been named as defendants in several additional lawsuits that are now pending in the United States District Court for the Western District of Pennsylvania, alleging, among other things, excessive advisory and Rule 12b-1 fees. The Board of the Federated Funds retained the law firm of Dickstein Shapiro LLP to represent the Federated Funds in these lawsuits. Federated and the Federated Funds and their respective counsel have been defending this litigation, and none of the Federated Funds remains a defendant in any of the lawsuits (though some could potentially receive any recoveries as nominal defendants). Additional lawsuits based upon similar allegations may be filed in the future. The potential impact of these lawsuits, all of which seek unquantified damages, attorneys' fees and expenses, and future potential similar suits is uncertain. Although we do not believe that these lawsuits will have a material adverse effect on the Federated Funds, there can be no assurance that these suits, the ongoing adverse publicity and/or other developments resulting from the regulatory investigations will not result in increased Federated Fund redemptions, reduced sales of Federated Fund shares or other adverse consequences for the Federated Funds.
11. Subsequent events
Management has evaluated subsequent events through December 24, 2009, the date the financial statements were issued, and determined that no events have occurred that require additional disclosure.
Annual Shareholder Report27
12. FEDERAL TAX INFORMATION (UNAUDITED)For the fiscal year ended October 31, 2009, 100% of total ordinary income (including short-term capital gain) distributions made by the Fund are qualifying dividends which may be subject to a maximum tax rate of 15%, as provided for by the Jobs and Growth Tax Relief Act of 2003. Complete information is reported in conjunction with the reporting of your distributions on Form 1099-DIV.
Of the ordinary income (including short-term capital gain) distributions made by the Fund during the year ended October 31, 2009, 91.60% qualify for the dividend received deduction available to corporate shareholders.
Annual Shareholder Report28
Report of Independent Registered Public Accounting Firm
TO THE BOARD OF Trustees OF Federated Equity Funds AND SHAREHOLDERS OF Federated Strategic Value Fund:
We have audited the accompanying statement of assets and liabilities of Federated Strategic Value Fund (the “Fund”), one of the portfolios constituting Federated Equity Funds, including the portfolio of investments, as of October 31, 2009, and the related statement of operations for the year then ended, the statement of changes in net assets for each of the two years in the period then ended, and the financial highlights for each of the periods indicated therein. These financial statements and financial highlights are the responsibility of the Fund's management. Our responsibility is to express an opinion on these financial statements and financial highlights based on our audits.
We conducted our audits in accordance with standards of the Public Company Accounting Oversight Board (United States). Those standards require that we plan and perform the audit to obtain reasonable assurance about whether the financial statements and financial highlights are free of material misstatement. We were not engaged to perform an audit of the Fund's internal control over financial reporting. Our audits included consideration of internal control over financial reporting as a basis for designing audit procedures that are appropriate in the circumstances, but not for the purpose of expressing an opinion on the effectiveness of the Fund's internal control over financial reporting. Accordingly, we express no such opinion. An audit also includes examining, on a test basis, evidence supporting the amounts and disclosures in the financial statements and financial highlights, assessing the accounting principles used and significant estimates made by management, and evaluating the overall financial statement presentation. Our procedures included confirmation of securities owned as of October 31, 2009, by correspondence with the custodian and brokers. We believe that our audits provide a reasonable basis for our opinion.
In our opinion, the financial statements and financial highlights referred to above present fairly, in all material respects, the financial position of Federated Strategic Value Fund, a portfolio of Federated Equity Funds, at October 31, 2009, the results of its operations for the year then ended, the changes in its net assets for each of the two years in the period then ended, and the financial highlights for each of the periods indicated therein, in conformity with U.S. generally accepted accounting principles.
Boston, Massachusetts
December 24, 2009
Annual Shareholder Report29
Board of Trustees and Trust Officers
The Board is responsible for managing the Trust's business affairs and for exercising all the Trust's powers except those reserved for the shareholders. The following tables give information about each Board member and the senior officers of the Fund. Where required, the tables separately list Board members who are “interested persons” of the Fund (i.e., “Interested” Board members) and those who are not (i.e., “Independent” Board members). Unless otherwise noted, the address of each person listed is Federated Investors Tower, 1001 Liberty Avenue, Pittsburgh, PA 15222. The address of all Independent Board members listed is 4000 Ericsson Drive, Warrendale, PA 15086-7561; Attention: Mutual Fund Board. As of December 31, 2008, the Trust comprised ten portfolios, and the Federated Fund Complex consisted of 40 investment companies (comprising 149 portfolios). Unless otherwise noted, each Officer is elected annually. Unless otherwise noted, each Board member oversees all portfolios in the Federated Fund Complex and serves for an indefinite term. The Fund's Statement of Additional Information includes additional information about Trust Trustees and is available, without charge and upon request, by calling 1-800-341-7400.
Interested TRUSTEES Background
Name
Birth Date
Positions Held with Trust
Date Service Began | Principal Occupation(s) for Past Five Years,
Other Directorships Held and Previous Position(s) |
John F. Donahue*
Birth Date: July 28, 1924
TRUSTEE
Began serving: April 1984 | Principal Occupations: Director or Trustee of the Federated Fund Complex; Chairman and Director, Federated Investors, Inc.; Chairman of the Federated Fund Complex's Executive Committee.
Previous Positions: Chairman of the Federated Fund Complex; Trustee, Federated Investment Management Company; Chairman and Director, Federated Investment Counseling. |
J. Christopher Donahue*
Birth Date: April 11, 1949
PRESIDENT AND TRUSTEE
Began serving: January 2000 | Principal Occupations: Principal Executive Officer and President of the Federated Fund Complex; Director or Trustee of some of the Funds in the Federated Fund Complex; President, Chief Executive Officer and Director, Federated Investors, Inc.; Chairman and Trustee, Federated Investment Management Company; Trustee, Federated Investment Counseling; Chairman and Director, Federated Global Investment Management Corp.; Chairman, Federated Equity Management Company of Pennsylvania and Passport Research, Ltd. (investment advisory subsidiary of Federated); Trustee, Federated Shareholder Services Company; Director, Federated Services Company.
Previous Positions: President, Federated Investment Counseling; President and Chief Executive Officer, Federated Investment Management Company, Federated Global Investment Management Corp. and Passport Research, Ltd. |
| * | Family relationships and reasons for “interested” status: John F. Donahue is the father of J. Christopher Donahue; both are “interested” due to their beneficial ownership of shares of Federated Investors, Inc. and the positions they hold with Federated and its subsidiaries. |
Annual Shareholder Report30
INDEPENDENT TRUSTEES Background
Name
Birth Date
Positions Held with Trust
Date Service Began | Principal Occupation(s) for Past Five Years,
Other Directorships Held and Previous Position(s) |
John T. Conroy, Jr., Ph.D.
Birth Date: June 23, 1937
TRUSTEE
Began serving: November 1991 | Principal Occupations: Director or Trustee of the Federated Fund Complex; Chairman of the Board, Investment Properties Corporation; Partner or Trustee in private real estate ventures in Southwest Florida; Assistant Professor in Theology, Blessed Edmund Rice School for Pastoral Ministry.
Previous Positions: President, Investment Properties Corporation; Senior Vice President, John R. Wood and Associates, Inc., Realtors; President, Naples Property Management, Inc. and Northgate Village Development Corporation. |
Nicholas P. Constantakis
Birth Date: September 3, 1939
TRUSTEE
Began serving: February 1998 | Principal Occupation: Director or Trustee of the Federated Fund Complex.
Other Directorship Held: Director and Chairman of the Audit Committee, Michael Baker Corporation (architecture, engineering and construction services).
Previous Position: Partner, Andersen Worldwide SC. |
John F. Cunningham
Birth Date: March 5, 1943
TRUSTEE
Began serving: January 1999 | Principal Occupation: Director or Trustee of the Federated Fund Complex.
Other Directorships Held: Chairman, President and Chief Executive Officer, Cunningham & Co., Inc. (strategic business consulting); Trustee Associate, Boston College.
Previous Positions: Director, Redgate Communications and EMC Corporation (computer storage systems); Chairman of the Board and Chief Executive Officer, Computer Consoles, Inc.; President and Chief Operating Officer, Wang Laboratories; Director, First National Bank of Boston; Director, Apollo Computer, Inc. |
Maureen Lally-Green
Birth Date: July 5, 1949
TRUSTEE
Began serving: August 2009 | Principal Occupations: Director or Trustee of the Federated Fund Complex; Director, Office of Church Relations, Diocese of Pittsburgh; Adjunct Professor of Law, Duquesne University School of Law.
Other Directorships Held: Director, Auberle; Trustee St. Francis University; Director, Ireland Institute of Pittsburgh; Director, UPMC Mercy Hospital; Regent, St. Vincent Seminary; Director, Epilepsy Foundation of Western and Central Pennsylvania; Director, Saint Thomas More Society, Allegheny County; Director, Carlow University.
Previous Position: Pennsylvania Superior Court Judge. |
Annual Shareholder Report31
Name
Birth Date
Positions Held with Trust
Date Service Began | Principal Occupation(s) for Past Five Years,
Other Directorships Held and Previous Position(s) |
Peter E. Madden
Birth Date: March 16, 1942
TRUSTEE
Began serving: November 1991 | Principal Occupation: Director or Trustee and Chairman of the Board of the Federated Fund Complex.
Other Directorship Held: Board of Overseers, Babson College.
Previous Positions: Representative, Commonwealth of Massachusetts General Court; President, Chief Operating Officer and Director, State Street Bank and Trust Company and State Street Corporation (retired); Director, VISA USA and VISA International; Chairman and Director, Massachusetts Bankers Association; Director, Depository Trust Corporation; Director, The Boston Stock Exchange. |
Charles F. Mansfield, Jr.
Birth Date: April 10, 1945
TRUSTEE
Began serving: January 1999 | Principal Occupations: Director or Trustee and Chairman of the Audit Committee of the Federated Fund Complex; Management Consultant.
Previous Positions: Chief Executive Officer, PBTC International Bank; Partner, Arthur Young & Company (now Ernst & Young LLP); Chief Financial Officer of Retail Banking Sector, Chase Manhattan Bank; Senior Vice President, HSBC Bank USA (formerly, Marine Midland Bank); Vice President, Citibank; Assistant Professor of Banking and Finance, Frank G. Zarb School of Business, Hofstra University; Executive Vice President DVC Group, Inc. (marketing, communications and technology). |
R. James Nicholson
Birth Date: February 4, 1938
TRUSTEE
Began serving: January 2008 | Principal Occupations: Director or Trustee of the Federated Fund Complex; Senior Counsel, Brownstein Hyatt Farber Schrek, P.C.; Former Secretary of the U.S. Dept. of Veterans Affairs; Former U.S. Ambassador to the Holy See; Former Chairman of the Republican National Committee.
Other Directorships Held: Director, Horatio Alger Association; Director, The Daniels Fund.
Previous Positions: Colonel, U.S. Army Reserve; Partner, Calkins, Kramer, Grimshaw and Harring, P.C.; General Counsel, Colorado Association of Housing and Building; Chairman and CEO, Nicholson Enterprises, Inc. (real estate holding company); Chairman and CEO, Renaissance Homes of Colorado. |
Thomas M. O'Neill
Birth Date: June 14, 1951
TRUSTEE
Began serving: October 2006 | Principal Occupations: Director or Trustee of the Federated Fund Complex; Managing Director and Partner, Navigator Management Company, L.P. (investment and strategic consulting).
Other Directorships Held: Board of Overseers, Children's Hospital of Boston; Visiting Committee on Athletics, Harvard College.
Previous Positions: Chief Executive Officer and President, Managing Director and Chief Investment Officer, Fleet Investment Advisors; President and Chief Executive Officer, Aeltus Investment Management, Inc.; General Partner, Hellman, Jordan Management Co., Boston, MA; Chief Investment Officer, The Putnam Companies, Boston, MA; Credit Analyst and Lending Officer, Fleet Bank; Director and Consultant, EZE Castle Software (investment order management software); Director, Midway Pacific (lumber). |
Annual Shareholder Report32
Name
Birth Date
Positions Held with Trust
Date Service Began | Principal Occupation(s) for Past Five Years,
Other Directorships Held and Previous Position(s) |
John S. Walsh
Birth Date: November 28, 1957
TRUSTEE
Began serving: January 1999 | Principal Occupations: Director or Trustee of the Federated Fund Complex; President and Director, Heat Wagon, Inc. (manufacturer of construction temporary heaters); President and Director, Manufacturers Products, Inc. (distributor of portable construction heaters); President, Portable Heater Parts, a division of Manufacturers Products, Inc.
Previous Position: Vice President, Walsh & Kelly, Inc. |
James F. Will
Birth Date: October 12, 1938
TRUSTEE
Began serving: April 2006 | Principal Occupations: Director or Trustee of the Federated Fund Complex; formerly, Vice Chancellor and President, Saint Vincent College.
Other Directorships Held: Trustee, Saint Vincent College; Alleghany Corporation.
Previous Positions: Chairman, President and Chief Executive Officer, Armco, Inc.; President and Chief Executive Officer, Cyclops Industries; President and Chief Operating Officer, Kaiser Steel Corporation. |
OFFICERS
Name
Birth Date
Address
Positions Held with Trust
Date Service Began | Principal Occupation(s) for Past Five Years
and Previous Position(s) |
John W. McGonigle
Birth Date: October 26, 1938
EXECUTIVE VICE PRESIDENT AND SECRETARY
Began serving: April 1984 | Principal Occupations: Executive Vice President and Secretary of the Federated Fund Complex; Vice Chairman, Executive Vice President, Secretary and Director, Federated Investors, Inc.
Previous Positions: Trustee, Federated Investment Management Company and Federated Investment Counseling; Director, Federated Global Investment Management Corp., Federated Services Company and Federated Securities Corp. |
Richard A. Novak
Birth Date: December 25, 1963
TREASURER
Began serving: January 2006 | Principal Occupations: Principal Financial Officer and Treasurer of the Federated Fund Complex; Senior Vice President, Federated Administrative Services; Financial and Operations Principal for Federated Securities Corp., Edgewood Services, Inc. and Southpointe Distribution Services, Inc.
Previous Positions: Controller of Federated Investors, Inc.; Vice President, Finance of Federated Services Company; held various financial management positions within The Mercy Hospital of Pittsburgh; Auditor, Arthur Andersen & Co. |
Richard B. Fisher
Birth Date: May 17, 1923
VICE PRESIDENT
Began serving: April 1984 | Principal Occupations: Vice Chairman or Vice President of some of the Funds in the Federated Fund Complex; Vice Chairman, Federated Investors, Inc.; Chairman, Federated Securities Corp.
Previous Positions: President and Director or Trustee of some of the Funds in the Federated Fund Complex; Executive Vice President, Federated Investors, Inc.; Director and Chief Executive Officer, Federated Securities Corp. |
Annual Shareholder Report33
Name
Birth Date
Address
Positions Held with Trust
Date Service Began | Principal Occupation(s) for Past Five Years
and Previous Position(s) |
Brian P. Bouda
Birth Date: February 28, 1947
CHIEF COMPLIANCE OFFICER AND SENIOR VICE PRESIDENT
Began serving: August 2004 | Principal Occupations: Senior Vice President and Chief Compliance Officer of the Federated Fund Complex; Vice President and Chief Compliance Officer of Federated Investors, Inc. and Chief Compliance Officer of its subsidiaries. Mr. Bouda joined Federated in 1999 and is a member of the American Bar Association and the State Bar Association of Wisconsin. |
Stephen F. Auth
Birth Date: September 3, 1956
450 Lexington Avenue
Suite 3700
New York, NY 10017-3943
CHIEF INVESTMENT OFFICER
Began serving: November 2002 | Principal Occupations: Mr. Auth is Chief Investment Officer of this Fund and various other Funds in the Federated Fund Complex; Executive Vice President, Federated Investment Counseling, Federated Global Investment Management Corp. and Federated Equity Management Company of Pennsylvania.
Previous Positions: Executive Vice President, Federated Investment Management Company, and Passport Research, Ltd. (investment advisory subsidiary of Federated); Senior Vice President, Global Portfolio Management Services Division; Senior Vice President, Federated Investment Management Company and Passport Research, Ltd.; Senior Managing Director and Portfolio Manager, Prudential Investments. |
Lawrence Auriana
Birth Date: January 8, 1944
140 East 45th Street
New York, NY 10017
VICE PRESIDENT
Began serving: November 2001 | Principal Occupations: Lawrence Auriana is Vice President of the Trust. Mr. Auriana joined Federated in April 2001 as Co-Head of Investments/Federated Kaufmann. From August 1984 to April 2001, Mr. Auriana was President and Treasurer of Edgemont Asset Management Corp., and Chairman of the Board and Portfolio Manager to The Kaufmann Fund, Inc. (predecessor to the Federated Kaufmann Fund). Mr. Auriana earned a B.S. in economics from Fordham University and has been engaged in the securities business since 1965. |
Walter C. Bean
Birth Date: June 22, 1945
VICE PRESIDENT
Began serving: November 2006 | Principal Occupations: Walter C. Bean has been the Fund's Portfolio Manager since inception. Walter C. Bean is Vice President of the Trust. Mr. Bean is a Senior Vice President, Senior Portfolio Manager and the Head of the Equity Income Management Team of the Fund's Adviser. Mr. Bean joined Federated in 2000. His previous associations included: various investment management and research positions with C.S. McKee & Company, First Chicago Investment Advisors, CIGNA Investment Advisors and Mellon Bank. Mr. Bean earned a Bachelors Degree in Business Administration from Ohio University and an M.B.A. from the Pennsylvania State University. Mr. Bean is a Chartered Financial Analyst and has 40 years of investment experience. |
Hans P. Utsch
Birth Date: July 3, 1936
140 East 45th Street
New York, NY 10017
VICE PRESIDENT
Began serving: November 2001 | Principal Occupations: Hans P. Utsch is Vice President of the Trust. Mr. Utsch joined Federated in April 2001 as Co-Head of Investments/Federated Kaufmann. From August 1984 to April 2001, Mr. Utsch was Chairman of the Board and Secretary of Edgemont Asset Management Corp., and President and Portfolio Manager to The Kaufmann Fund, Inc. (predecessor to the Federated Kaufmann Fund). Mr. Utsch graduated from Amherst College and holds an M.B.A. from Columbia University. He has been engaged in the securities business since 1962. |
Annual Shareholder Report34
Evaluation and Approval of Advisory Contract - May 2009
Federated Strategic Value Fund (the “Fund”)
The Fund's Board reviewed the Fund's investment advisory contract at meetings held in May 2009. The Board's decision regarding the contract reflects the exercise of its business judgment on whether to continue the existing arrangements.
In this connection, the Federated funds' Board had previously appointed a Senior Officer, whose duties include specified responsibilities relating to the process by which advisory fees are to be charged to a Federated fund. The Senior Officer has the authority to retain consultants, experts, or staff as may be reasonably necessary to assist in the performance of his duties, reports directly to the Board, and may be terminated only with the approval of a majority of the independent members of the Board. The Senior Officer prepared and furnished to the Board an independent, written evaluation that covered topics discussed below. The Board considered that evaluation, along with other information, in deciding to approve the advisory contract.
During its review of the contract, the Board considered compensation and benefits received by the Adviser. This included the fees received for services provided to the Fund by other entities in the Federated organization and research services received by the Adviser from brokers that execute Federated fund trades, as well as advisory fees. The Board is also familiar with and considered judicial decisions concerning allegedly excessive investment advisory fees, which have indicated that the following factors may be relevant to an Adviser's fiduciary duty with respect to its receipt of compensation from a fund: the nature and quality of the services provided by the Adviser, including the performance of the fund; the Adviser's cost of providing the services; the extent to which the Adviser may realize “economies of scale” as a fund grows larger; any indirect benefits that may accrue to the Adviser and its affiliates as a result of the Adviser's relationship with a fund; performance and expenses of comparable funds; and the extent to which the independent Board members are fully informed about all facts the Board deems relevant bearing on the Adviser's services and fees. The Board further considered management fees (including any components thereof) charged to institutional and other clients of the Adviser for what might be viewed as like services, and the cost to the Adviser and its affiliates of supplying services pursuant to the management fee agreements, excluding any intra-corporate profit and profit margins of the Adviser and its affiliates for supplying such services. The Board was aware of these factors and was guided by them in its review of the Fund's advisory contract to the extent it considered them to be appropriate and relevant, as discussed further below.
Annual Shareholder Report35
The Board considered and weighed these circumstances in light of its substantial accumulated experience in governing the Fund and working with Federated on matters relating to the Federated funds, and was assisted in its deliberations by independent legal counsel. Throughout the year, the Board has requested and received substantial and detailed information about the Fund and the Federated organization that was in addition to the extensive materials that comprise and accompany the Senior Officer's evaluation. Federated provided much of this information at each regular meeting of the Board, and furnished additional reports in connection with the particular meeting at which the Board's formal review of the advisory contract occurred. Between regularly scheduled meetings, the Board also received information on particular matters as the need arose. Thus, the Board's consideration of the advisory contract included review of the Senior Officer's evaluation, accompanying data and additional reports covering such matters as: the Adviser's investment philosophy, revenue, profitability, personnel and processes; investment and operating strategies; the Fund's short- and long-term performance (in absolute terms, both on a gross basis and net of expenses, as well as in relationship to its particular investment program and certain competitor or “peer group” funds and/or other benchmarks, as appropriate), and comments on the reasons for performance; the Fund's investment objectives; the Fund's expenses (including the advisory fee itself and the overall expense structure of the Fund, both in absolute terms and relative to similar and/or competing funds, with due regard for contractual or voluntary expense limitations); the use and allocation of brokerage commissions derived from trading the Fund's portfolio securities (if any); and the nature, quality and extent of the advisory and other services provided to the Fund by the Adviser and its affiliates. The Board also considered the preferences and expectations of Fund shareholders and their relative sophistication; the continuing state of competition in the mutual fund industry and market practices; the range of comparable fees for similar funds in the mutual fund industry; the Fund's relationship to the Federated family of funds which include a comprehensive array of funds with different investment objectives, policies and strategies which are available for exchange without the incurrence of additional sales charges; compliance and audit reports concerning the Federated funds and the Federated companies that service them (including communications from regulatory agencies), as well as Federated's responses to any issues raised therein; and relevant developments in the mutual fund industry and how the Federated funds and/or Federated are responding to them. The Board's evaluation process is evolutionary. The criteria considered and the emphasis placed on relevant criteria change in recognition of changing circumstances in the mutual fund marketplace. With respect to the Fund's performance and expenses in particular, the Board has found the use of comparisons to other mutual funds with comparable investment programs to be particularly useful, given the high degree of competition in the mutual fund business. The Board focused on comparisons Annual Shareholder Report36
with other similar mutual funds more heavily than non-mutual fund products or services because it is believed that they are more relevant. For example, other mutual funds are the products most like the Fund, they are readily available to Fund shareholders as alternative investment vehicles, and they are the type of investment vehicle in fact chosen and maintained by the Fund's investors. The range of their fees and expenses therefore appears to be a generally reliable indication of what consumers have found to be reasonable in the precise marketplace in which the Fund competes. The Fund's ability to deliver competitive performance when compared to its peer group was a useful indicator of how the Adviser is executing the Fund's investment program, which in turn assisted the Board in reaching a conclusion that the nature, extent, and quality of the Adviser's investment management services were such as to warrant continuation of the advisory contract. In this regard, the Senior Officer has reviewed Federated's fees for providing advisory services to products outside the Federated family of funds (e.g., institutional and separate accounts). He concluded that mutual funds and institutional accounts are inherently different products. Those differences include, but are not limited to, different types of targeted investors; being subject to different laws and regulations; different legal structures; different average account sizes; different associated costs; different portfolio management techniques made necessary by different cash flows; and portfolio manager time spent in review of securities pricing. The Senior Officer did not consider these fee schedules to be determinative in judging the appropriateness of mutual fund advisory contracts.The Senior Officer reviewed reports compiled by Federated, using data supplied by independent fund ranking organizations, regarding the performance of, and fees charged by, other mutual funds, noting his view that comparisons to fund peer groups are highly important in judging the reasonableness of proposed fees.
For both the one- and three-year periods covered by the report, the Fund's performance was above the median of the relevant peer group.
The Board also received financial information about Federated, including reports on the compensation and benefits Federated derived from its relationships with the Federated funds. These reports covered not only the fees under the advisory contracts, but also fees received by Federated's subsidiaries for providing other services to the Federated funds under separate contracts (e.g., for serving as the Federated funds' administrator). The reports also discussed any indirect benefit Federated may derive from its receipt of research services from brokers who execute Federated fund trades. In addition, the Board considered the fact that, in order for a fund to be competitive in the marketplace, Federated and its affiliates frequently waived fees and/or reimbursed expenses and have disclosed to fund investors and/or indicated to the Board their intention to do so in the future, where appropriate. Moreover, the Board receives regular reports regarding the institution or elimination of these voluntary waivers.
Annual Shareholder Report37
Federated furnished reports, requested by the Senior Officer, that reported revenues on a fund-by-fund basis and made estimates of the allocation of expenses on a fund-by-fund basis, using allocation methodologies specified by the Senior Officer. The Senior Officer noted that, although they may apply consistent allocation processes, the inherent difficulties in allocating costs (and the unavoidable arbitrary aspects of that exercise) and the lack of consensus on how to allocate those costs may render such allocation reports unreliable. The allocation reports were considered in the analysis by the Board but were determined to be of limited use.The Board and the Senior Officer also reviewed a report compiled by Federated comparing profitability information for Federated to other publicly held fund management companies. In this regard, the Senior Officer noted the limited availability of such information, but nonetheless concluded that Federated's profit margins did not appear to be excessive and the Board agreed.
The Senior Officer's evaluation also discussed the notion of possible realization of “economies of scale” as a fund grows larger. The Board considered in this regard that the Adviser has made significant and long-term investments in areas that support all of the Federated funds, such as personnel and processes for the portfolio management, compliance, and risk management functions; and systems technology; and that the benefits of these efforts (as well as any economies, should they exist) were likely to be enjoyed by the fund complex as a whole. Finally, the Board also noted the absence of any applicable regulatory or industry guidelines on this subject, which (as discussed in the Senior Officer's evaluation) is compounded by the lack of any common industry practice or general pattern with respect to structuring fund advisory fees with “breakpoints” that serve to reduce the fee as the fund attains a certain size. The Senior Officer did not recommend institution of breakpoints in pricing Federated's fund advisory services at this time.
It was noted in the materials for the Board meeting that for the period covered by the report, the Fund's investment advisory fee, after waivers and expense reimbursements, if any, was below the median of the relevant peer group. The Board reviewed the fees and other expenses of the Fund with the Adviser and was satisfied that the overall expense structure of the Fund remained competitive.
The Senior Officer's evaluation noted his belief that the information and observations contained in his evaluation supported a finding that the proposed management fees are reasonable, and that Federated appeared to provide appropriate administrative services to the Fund for the fees paid. Under these circumstances, no changes were recommended to, and no objection was raised to, the continuation of the Fund's advisory contract. The Board concluded that the nature, quality and scope of services provided the Fund by the Adviser and its affiliates were satisfactory.
Annual Shareholder Report38
In its decision to continue an existing investment advisory contract, the Board was mindful of the potential disruptions of the Fund's operations and various risks, uncertainties and other effects that could occur as a result of a decision to terminate or not renew an advisory contract. In particular, the Board recognized that many shareholders have invested in the Fund on the strength of the Adviser's industry standing and reputation and with the expectation that the Adviser will have a continuing role in providing advisory services to the Fund. Thus, the Board's approval of the advisory contract reflected the fact that it is the shareholders who have effectively selected the Adviser by virtue of having invested in the Fund.The Board based its decision to approve the advisory contract on the totality of the circumstances and relevant factors and with a view to past and future long-term considerations. Not all of the factors and considerations identified above were necessarily relevant to the Fund, nor did the Board consider any one of them to be determinative. With respect to the factors that were relevant, the Board's decision to approve the contract reflects its determination that Federated's performance and actions provided a satisfactory basis to support the decision to continue the existing arrangements.
Annual Shareholder Report39
Voting Proxies on Fund Portfolio Securities
A description of the policies and procedures that the Fund uses to determine how to vote proxies, if any, relating to securities held in the Fund's portfolio is available, without charge and upon request, by calling 1-800-341-7400. A report on “Form N-PX” of how the Fund voted any such proxies during the most recent 12-month period ended June 30 is available from Federated's Web site at FederatedInvestors.com. To access this information from the “Products” section of the Web site, click on the “Prospectuses and Regulatory Reports” link under “Related Information,” then select the appropriate link opposite the name of the Fund; or select the name of the Fund and from the Fund's page, click on the “Prospectuses and Regulatory Reports” link. Form N-PX filings are also available at the SEC's Web site at www.sec.gov.
Quarterly Portfolio Schedule
The Fund files with the SEC a complete schedule of its portfolio holdings, as of the close of the first and third quarters of its fiscal year, on “Form N-Q.” These filings are available on the SEC's Web site at www.sec.gov and may be reviewed and copied at the SEC's Public Reference Room in Washington, DC. (Call 1-800-SEC-0330 for information on the operation of the Public Reference Room.) You may also access this information from the “Products” section of Federated's Web site at FederatedInvestors.com by clicking on “Portfolio Holdings” under “Related Information,” then selecting the appropriate link opposite the name of the Fund; or select the name of the Fund and from the Fund's page, click on the “Portfolio Holdings” link.
Annual Shareholder Report40
Mutual funds are not bank deposits or obligations, are not guaranteed by any bank and are not insured or guaranteed by the U.S. government, the Federal Deposit Insurance Corporation, the Federal Reserve Board or any other government agency. Investment in mutual funds involves investment risk, including the possible loss of principal.
This Report is authorized for distribution to prospective investors only when preceded or accompanied by the Fund's Prospectus, which contains facts concerning its objective and policies, management fees, expenses and other information.
Federated Strategic Value Fund
Federated Investors Funds
4000 Ericsson Drive
Warrendale, PA 15086-7561
Contact us at FederatedInvestors.com
or call 1-800-341-7400.
Federated Securities Corp., Distributor
Cusip 314172586
Cusip 314172578
33982 (12/09)
Federated is a registered mark of Federated Investors, Inc.
2009 Federated Investors, Inc.
Federated Strategic Value Fund
A Portfolio of Federated Equity Funds
ANNUAL SHAREHOLDER REPORTOctober 31, 2009
Institutional Shares
FINANCIAL HIGHLIGHTS
SHAREHOLDER EXPENSE EXAMPLE
MANAGEMENT'S DISCUSSION OF FUND PERFORMANCE
PORTFOLIO OF INVESTMENTS SUMMARY TABLE
PORTFOLIO OF INVESTMENTS
STATEMENT OF ASSETS AND LIABILITIES
STATEMENT OF OPERATIONS
STATEMENT OF CHANGES IN NET ASSETS
NOTES TO FINANCIAL STATEMENTS
REPORT OF INDEPENDENT REGISTERED PUBLIC ACCOUNTING FIRM
BOARD OF TRUSTEES AND TRUST OFFICERS
EVALUATION AND APPROVAL OF ADVISORY CONTRACT
VOTING PROXIES ON FUND PORTFOLIO SECURITIES
QUARTERLY PORTFOLIO SCHEDULE
Financial Highlights - Institutional Shares
(For a Share Outstanding Throughout Each Period)
| Year Ended October 31, | Period
Ended
10/31/20051 |
| 2009 | 2008 | 2007 | 2006 |
| Net Asset Value, Beginning of Period | $4.02 | $6.37 | $6.28 | $5.22 | $5.00 |
| Income From Investment Operations: | | | | | |
| Net investment income | 0.17 | 0.28 | 0.27 | 0.262 | 0.132 |
Net realized and unrealized gain (loss)
on investments and foreign currency transactions | (0.16) | (2.05) | 0.18 | 1.05 | 0.19 |
| TOTAL FROM INVESTMENT OPERATIONS | 0.01 | (1.77) | 0.45 | 1.31 | 0.32 |
| Less Distributions: | | | | | |
| Distributions from net investment income | (0.17) | (0.29) | (0.27) | (0.23) | (0.10) |
Distribution from net realized gain
on investments and foreign currency transactions | — | (0.29) | (0.09) | (0.02) | — |
| TOTAL DISTRIBUTIONS | (0.17) | (0.58) | (0.36) | (0.25) | (0.10) |
| Net Asset Value, End of Period | $3.86 | $4.02 | $6.37 | $6.28 | $5.22 |
| Total Return3 | 0.55% | (29.92)% | 7.20% | 25.78% | 6.45% |
| Ratios to Average Net Assets: | | | | | |
| Net expenses | 0.80%4 | 0.75%4 | 0.75%4 | 0.65%4 | 0.22%5 |
| Net investment income | 4.59% | 5.67% | 4.29% | 4.65% | 4.37%5 |
| Expense waiver/reimbursement6 | 0.19% | 0.25% | 0.22% | 0.39% | 1.50%5 |
| Supplemental Data: | | | | | |
| Net assets, end of period (000 omitted) | $383,503 | $176,187 | $199,630 | $84,192 | $21,698 |
| Portfolio turnover | 42% | 48% | 66% | 27% | 16% |
| 1 | Reflects operations for the period from March 30, 2005 (date of initial investment) to October 31, 2005. |
| 2 | Per share numbers have been calculated using the average shares method. |
| 3 | Based on net asset value, which does not reflect the sales charge, redemption fee or contingent deferred sales charge, if applicable. Total returns for periods of less than one year are not annualized. |
| 4 | The net expense ratio is calculated without reduction for expense offset arrangements. The net expense ratios are 0.80%, 0.75%, 0.74% and 0.63%, for the years ended October 31, 2009, 2008, 2007 and 2006, respectively, after taking into account these expense reductions. |
| 5 | Computed on an annualized basis. |
| 6 | This expense decrease is reflected in both the net expense and the net investment income ratios shown above. |
- See Notes which are an integral part of the Financial Statements
Annual Shareholder Report1
Shareholder Expense Example (unaudited)
As a shareholder of the Fund, you incur ongoing costs, including management fees and to the extent applicable, distribution (12b-1) fees and/or shareholder services fees and other Fund expenses. This Example is intended to help you to understand your ongoing costs (in dollars) of investing in the Fund and to compare these costs with the ongoing costs of investing in other mutual funds. It is based on an investment of $1,000 invested at the beginning of the period and held for the entire period from May 1, 2009 to October 31, 2009.
ACTUAL EXPENSES
The first section of the table below provides information about actual account values and actual expenses. You may use the information in this section, together with the amount you invested, to estimate the expenses that you incurred over the period. Simply divide your account value by $1,000 (for example, an $8,600 account value divided by $1,000 = 8.6), then multiply the result by the number in the first section under the heading entitled “Expenses Paid During Period” to estimate the expenses attributable to your investment during this period.
HYPOTHETICAL EXAMPLE FOR COMPARISON PURPOSES
The second section of the table below provides information about hypothetical account values and hypothetical expenses based on the Fund's actual expense ratio and an assumed rate of return of 5% per year before expenses, which is not the Fund's actual return. Thus, you should not use the hypothetical account values and expenses to estimate the actual ending account balance or your expenses for the period. Rather, these figures are required to be provided to enable you to compare the ongoing costs of investing in the Fund with other funds. To do so, compare this 5% hypothetical example with the 5% hypothetical examples that appear in the shareholder reports of the other funds.
Annual Shareholder Report2
Please note that the expenses shown in the table are meant to highlight your ongoing costs only. Therefore, the second section of the table is useful in comparing ongoing costs only, and will not help you determine the relative total costs of owning different funds. | Beginning
Account Value
5/1/2009 | Ending
Account Value
10/31/2009 | Expenses Paid
During Period1 |
| Actual | $1,000 | $1,205.00 | $4.50 |
Hypothetical (assuming a 5% return
before expenses) | $1,000 | $1,021.12 | $4.13 |
| 1 | Expenses are equal to the Fund's annualized net expense ratio of 0.81%, multiplied by the average account value over the period, multiplied by 184/365 (to reflect the one-half-year period). |
Annual Shareholder Report3
Performance data quoted represents past performance which is no guarantee of future results. Investment return and principal value will fluctuate so that an investor's shares, when redeemed, may be worth more or less than their original cost. Mutual fund performance changes over time and current performance may be lower or higher than what is stated. For current to the most recent month-end performance and after-tax returns, visit FederatedInvestors.com or call 1-800-341-7400.
Management's Discussion of Fund Performance (unaudited)
The Fund's total return, at net asset value, for the fiscal year ended October 31, 2009 was 0.55%. The total returns of the Dow Jones Select Dividend Index1 and the S&P 500 Index2 were -8.35% and 9.80%, respectively, for the same period. The Fund's total return for the fiscal year reflected actual cash flows, transaction costs and other expenses, which were not reflected in the total return of the benchmarks.
Market Overview
The fiscal year ended October 31, 2009 was a challenging environment for an equity income strategy as it marked the bottom of the longest recession in the post World War II era and endured a low-quality, post-recession rally. Over the course of the year, the stock market was buffeted by multiple head-winds as almost every major indicator trended downward, from retail sales and industrial production to record lows for home sales, home prices and home building. On the employment front, the jobless rate hit a 26-year high, fueled by the greatest job losses in decades. Attempting to stem further declines were the nearly $1 trillion in financial stimulus and the government's intervention into numerous failing financial institutions. Despite unknown and potentially negative long-term implications, these moves provided near-term support to economic activity and brought some hints of an eventual recovery.
Investor focus shifted from relief over avoiding further economic decline to debate about the strength and timing of a recovery. The reality is, despite a stock market rally that added more than $1 trillion to household net worth in the second quarter, households are down some $11 trillion from the collapse in stock and home prices, household debt is a near-record 122% of disposable income, and home foreclosures and mortgage delinquencies are on the rise - with one in eight homeowners in arrears on their mortgages and nearly one in three underwater (owing more than their home is worth).
| 1 | The Dow Jones Select Dividend Index is a dividend-weighted index intended to represent the 100 stocks in the Dow Jones U.S. Total Market Index that have the highest indicated annual dividend yield. It is not possible to invest directly in an index. |
| 2 | The S&P 500 Index is an unmanaged capitalization-weighted index of 500 stocks designed to measure performance of the broad domestic economy through changes in the aggregate market value of 500 stocks representing all major industries. It is not possible to invest directly in an index. |
Annual Shareholder Report4
Fund PerformanceOn an absolute performance basis, the Fund continued to deliver on its objective of providing a substantially higher than market yield. While the overall dividend growth profile of the Fund was impaired by the widespread dividend declines in the marketplace, the product continued to focus on investing in those stocks that provide growth in dividend income over time. To this point, the portfolio experienced 27 dividend increases and four dividend cuts for the fiscal year. There was a revival in dividend increases toward the end of the fiscal year. The low risk features of the Fund remained intact with the product offering a three-year beta of 0.74 versus the S&P 500 Index.
Performance in the fiscal year was dominated by the market's preferences in the post-recession rally. Since the bounce off the market bottom in early March, investors have favored features contrary to the Fund's style including high beta, small capitalization and lowest quality stocks. Highest returns were focused in sectors that provide little to no dividend opportunity, including Consumer Discretionary, Materials and Information Technology. As a result, the Fund outperformed the universe of dividend-yielding stocks as represented by the Dow Jones Dividend Select Index yet lagged the broad market as measured by the S&P 500 Index.
The leading contributor to the Fund's outperformance to the Dow Jones Select Dividend Index was the Fund's comparative avoidance of the Financials sector. The Fund's 20% underweight position contributed 7.6% of positive group weight variance as the Financials sector was the worst performing sector in the index. The Fund gained another 4.3% of positive total variance from a 17.3% overweight position, coupled with positive stock selection, within Telecommunication Services. The Fund's holdings outperformed those in the benchmark by 11.5% with stocks in the Fund, but not in the benchmark, such as BCE and Windstream gaining 30.8% and 43.8%, respectively. Both the Fund and the benchmark held Centurytel and AT&T, each posting low single-digit returns.
Underperformance to the S&P 500 was due to the rotation of low-quality, high-beta stocks back into market favor toward the end of the fiscal year. The Fund lagged most notably with its 17.4% underweight position in the Information Technology sector, which posted the highest returns, at 31.5%, in the period. The fund was further penalized by 0.90% and 2.4%, respectively, of negative group weight variance from underweight positions in Consumer Discretionary and Financial stocks. Furthermore, negative stock selection within Consumer Discretionary cost the fund another 0.9%.
Annual Shareholder Report5
GROWTH OF A $10,000 INVESTMENT - INSTITUTIONAL SHARES
The graph below illustrates the hypothetical investment of $10,0001 in the Federated Strategic Value Fund (Institutional Shares) (the “Fund”) from March 30, 2005 (start of performance) to October 31, 2009, compared to the Standard & Poor's 500 Index (S&P 500),2 and the Dow Jones Select Dividend Index (DJSDI).2
| Average Annual Total Returns for the Period Ended 10/31/2009 | |
| 1 Year | 0.55% |
| Start of Performance (3/30/2005) | 0.24 % |
Performance data quoted represents past performance which is no guarantee of future results. Investment return and principal value will fluctuate so that an investor's shares, when redeemed, may be worth more or less than their original cost. Mutual fund performance changes over time and current performance may be lower or higher than what is stated. For current to the most recent month-end performance and after-tax returns, visit FederatedInvestors.com or call 1-800-341-7400. Returns shown do not reflect the deduction of taxes that a shareholder would pay on Fund distributions or the redemption of Fund shares. Mutual funds are not obligations of or guaranteed by any bank and are not federally insured.
| 1 | Represents a hypothetical investment of $10,000 in the Fund with no sales load. The Fund's performance assumes the reinvestment of all dividends and distributions. The S&P 500 and the DJSDI have been adjusted to reflect reinvestment of dividends on securities in the indexes. |
| 2 | The S&P 500 is a capitalization-weighted index of 500 stocks designed to measure performance of the broad domestic economy through changes in the aggregate market value of 500 stocks representing all major industries. The DJSDI is a divided-weighted index intended to represent the 100 stocks in the Dow Jones U.S. Total Market Index that have the highest indicated annual dividend yield. The S&P 500 and DJSDI are not adjusted to reflect sales loads, expenses, or other fees that the Securities and Exchange Commission (SEC) requires to be reflected in the Fund's performance. The indexes are unmanaged and, unlike the Fund, are not affected by cash flows. It is not possible to invest in an index. |
Annual Shareholder Report6
Portfolio of Investments Summary Table (unaudited)
At October 31, 2009, the Fund's sector composition1 was as follows:
| Sector Composition | | Percentage of
Total Net Assets |
| Consumer Staples | | 24.3% |
| Telecommunication Services | | 18.8% |
| Health Care | | 17.4% |
| Energy | | 16.2% |
| Utilities | | 13.9% |
| Consumer Discretionary | | 3.0% |
| Financials | | 3.0% |
| Industrials | | 1.8% |
| Information Technology | | 0.5% |
| Cash Equivalents2 | | 0.7% |
| Other Assets and Liabilities — Net3 | | 0.4% |
| TOTAL | | 100.0% |
| 1 | Except for Cash Equivalents and Other Assets and Liabilities, sector classifications are based upon, and individual portfolio securities are assigned to, the classifications of the Global Industry Classification Standard (GICS) except that the adviser assigns a classification to securities not classified by the GICS and to securities for which the adviser does not have access to the classification made by the GICS. |
| 2 | Cash Equivalents include any investments in money market mutual funds and/or overnight repurchase agreements. |
| 3 | Assets, other than investments in securities, less liabilities. See Statement of Assets and Liabilities. |
Annual Shareholder Report7
Portfolio of Investments
October 31, 2009
|
| Shares | | | Value |
| | Common Stocks – 98.9% | |
| | Consumer Discretionary – 3.0% | |
| 440,625 | | McDonald's Corp. | 25,825,031 |
| | Consumer Staples – 24.3% | |
| 991,585 | | Altria Group, Inc. | 17,957,604 |
| 134,500 | | Clorox Corp. | 7,966,435 |
| 994,865 | | Diageo PLC | 16,214,582 |
| 590,070 | | H.J. Heinz Co. | 23,744,417 |
| 446,725 | | Kimberly-Clark Corp. | 27,321,701 |
| 213,400 | | Lorillard, Inc. | 16,585,448 |
| 556,485 | | Philip Morris International, Inc. | 26,355,130 |
| 361,770 | | Procter & Gamble Co. | 20,982,660 |
| 407,931 | | Reynolds American, Inc. | 19,776,495 |
| 322,975 | | The Coca-Cola Co. | 17,217,797 |
| 541,802 | | Unilever PLC | 16,217,214 |
| | TOTAL | 210,339,483 |
| | Energy – 16.2% | |
| 541,345 | | BP PLC, ADR | 30,650,954 |
| 397,880 | | Chevron Corp. | 30,453,735 |
| 445,555 | | ConocoPhillips | 22,357,950 |
| 1,006,925 | | Royal Dutch Shell PLC, Class B | 29,168,363 |
| 462,840 | | Total S.A. | 27,560,613 |
| | TOTAL | 140,191,615 |
| | Financials – 3.0% | |
| 365,300 | | HCP, Inc. | 10,809,227 |
| 246,000 | | Health Care REIT, Inc. | 10,915,020 |
| 178,300 | | Realty Income Corp. | 4,132,994 |
| | TOTAL | 25,857,241 |
| | Health Care – 17.4% | |
| 368,500 | | Abbott Laboratories | 18,635,045 |
| 233,000 | | AstraZeneca PLC | 10,472,719 |
| 1,200,815 | | Bristol-Myers Squibb Co. | 26,177,767 |
| 792,815 | | Eli Lilly & Co. | 26,963,638 |
| 1,105,481 | | GlaxoSmithKline PLC | 22,702,732 |
| 360,315 | | Johnson & Johnson | 21,276,601 |
Annual Shareholder Report8
|
| 800,025 | | Merck & Co., Inc. | 24,744,773 |
| | TOTAL | 150,973,275 |
| | Industrials – 1.8% | |
| 217,800 | | Emerson Electric Co. | 8,221,950 |
| 259,300 | | Waste Management, Inc. | 7,747,884 |
| | TOTAL | 15,969,834 |
| | Information Technology – 0.5% | |
| 141,000 | | Paychex, Inc. | 4,005,810 |
| | Telecommunication Services – 18.8% | |
| 863,945 | | AT&T, Inc. | 22,177,468 |
| 962,710 | | BCE, Inc. | 23,034,575 |
| 364,330 | | CenturyTel, Inc. | 11,826,152 |
| 850,740 | | Deutsche Telekom AG, Class REG | 11,603,059 |
| 844,863 | | France Telecom SA | 20,889,986 |
| 827,698 | | Telefonica SA | 23,102,641 |
| 748,955 | | Verizon Communications, Inc. | 22,161,578 |
| 8,051,874 | | Vodafone Group PLC | 17,814,685 |
| 1,017,685 | | Windstream Corp. | 9,810,483 |
| | TOTAL | 162,420,627 |
| | Utilities – 13.9% | |
| 308,495 | | AGL Resources, Inc. | 10,784,985 |
| 665,995 | | Dominion Resources, Inc. | 22,703,770 |
| 1,582,000 | | Duke Energy Corp. | 25,027,240 |
| 276,192 | | NSTAR | 8,548,142 |
| 430,675 | | Progress Energy, Inc. | 16,163,233 |
| 320,040 | | SCANA Corp. | 10,830,154 |
| 843,928 | | Southern Co. | 26,322,114 |
| | TOTAL | 120,379,638 |
| | TOTAL COMMON STOCKS
(IDENTIFIED COST $859,437,521) | 855,962,554 |
| | MUTUAL FUND – 0.7% | |
| 6,587,253 | 1,2 | Prime Value Obligations Fund, Institutional Shares, 0.22%
(AT NET ASSET VALUE) | 6,587,253 |
| | TOTAL INVESTMENTS — 99.6%
(IDENTIFIED COST $866,024,774)3 | 862,549,807 |
| | OTHER ASSETS AND LIABILITIES - NET — 0.4%4 | 3,146,549 |
| | TOTAL NET ASSETS — 100% | $865,696,356 |
Annual Shareholder Report9
| 1 | Affiliated company. |
| 2 | 7-Day net yield. |
| 3 | The cost of investments for federal tax purposes amounts to $866,157,733. |
| 4 | Assets, other than investments in securities, less liabilities. See Statement of Assets and Liabilities. |
- Note: The categories of investments are shown as a percentage of total net assets at October 31, 2009.
- Various inputs are used in determining the value of the Fund's investments. These inputs are summarized in the three broad levels listed below:
- Level 1 — quoted prices in active markets for identical securities
- Level 2 — other significant observable inputs (including quoted prices for similar securities, interest rates, prepayment speeds, credit risk, etc.)
- Level 3 — significant unobservable inputs (including the Fund's own assumptions in determining the fair value of investments)
- The inputs or methodology used for valuing securities are not an indication of the risk associated with investing in those securities.
- The following is a summary of the inputs used, as of October 31, 2009, in valuing the Fund's assets carried at fair value:
| Valuation Inputs | | | | |
| Level 1 -
Quoted
Prices and
Investments in
Mutual Funds | Level 2 -
Other
Significant
Observable
Inputs | Level 3 -
Significant
Unobservable
Inputs | Total |
| Equity Securities: | | | | |
| Domestic | $606,530,432 | $ — | $ — | $606,530,432 |
| International | 53,685,529 | 195,746,593 | — | 249,432,122 |
| Mutual Fund | 6,587,253 | — | — | 6,587,253 |
| TOTAL SECURITIES | $666,803,214 | $195,746,593 | $ — | $862,549,807 |
- The following acronym is used throughout this portfolio:
- ADR — American Depositary Receipt
- See Notes which are an integral part of the Financial Statements
Annual Shareholder Report10
Statement of Assets and Liabilities
October 31, 2009
| Assets: | | |
| Total investments in securities, at value including $6,587,253 of investments in an affiliated issuer (Note 5) (identified cost $866,024,774) | | $862,549,807 |
| Cash | | 174,051 |
| Cash denominated in foreign currencies (identified cost $19,982) | | 19,596 |
| Income receivable | | 2,404,723 |
| Receivable for investments sold | | 4,778 |
| Receivable for shares sold | | 2,823,066 |
| TOTAL ASSETS | | 867,976,021 |
| Liabilities: | | |
| Payable for shares redeemed | $1,797,716 | |
| Payable for transfer and dividend disbursing agent fees and expenses | 74,627 | |
| Payable for distribution services fee (Note 5) | 78,401 | |
| Payable for shareholder services fee (Note 5) | 252,930 | |
| Payable for Directors'/Trustees' fees | 2,290 | |
| Accrued expenses | 73,701 | |
| TOTAL LIABILITIES | | 2,279,665 |
| Net assets for 224,804,341 shares outstanding | | $865,696,356 |
| Net Assets Consist of: | | |
| Paid-in capital | | $1,137,444,432 |
| Net unrealized depreciation of investments and translation of assets and liabilities in foreign currency | | (3,468,073) |
| Accumulated net realized loss on investments and foreign currency transactions | | (269,777,558) |
| Undistributed net investment income | | 1,497,555 |
| TOTAL NET ASSETS | | $865,696,356 |
Annual Shareholder Report11
Statement of Assets and Liabilities — continued| Net Asset Value, Offering Price and Redemption Proceeds Per Share | | |
| Institutional Shares: | | |
| Net asset value per share ($383,502,777 ÷ 99,455,842 shares outstanding), no par value, unlimited shares authorized | | $3.86 |
| Offering price per share | | $3.86 |
| Redemption proceeds per share | | $3.86 |
| Class A Shares: | | |
| Net asset value per share ($358,589,114 ÷ 93,259,245 shares outstanding), no par value, unlimited shares authorized | | $3.85 |
| Offering price per share (100/94.50 of $3.85) | | $4.07 |
| Redemption proceeds per share | | $3.85 |
| Class C Shares: | | |
| Net asset value per share ($123,604,465 ÷ 32,089,254 shares outstanding), no par value, unlimited shares authorized | | $3.85 |
| Offering price per share | | $3.85 |
| Redemption proceeds per share (99.00/100 of $3.85) | | $3.81 |
- See Notes which are an integral part of the Financial Statements
Annual Shareholder Report12
Statement of Operations
Year Ended October 31, 2009
| Investment Income: | | | |
| Dividends (including $279,844 received from an affiliated issuer (Note 5) and net of foreign taxes withheld of $505,864) | | | $34,769,678 |
| Expenses: | | | |
| Investment adviser fee (Note 5) | | $4,819,221 | |
| Administrative personnel and services fee (Note 5) | | 498,762 | |
| Custodian fees | | 59,698 | |
| Transfer and dividend disbursing agent fees and expenses | | 674,300 | |
| Directors'/Trustees' fees | | 6,040 | |
| Auditing fees | | 22,400 | |
| Legal fees | | 5,069 | |
| Portfolio accounting fees | | 129,287 | |
| Distribution services fee — Class C Shares (Note 5) | | 802,444 | |
| Shareholder services fee — Class A Shares (Note 5) | | 699,305 | |
| Shareholder services fee — Class C Shares (Note 5) | | 259,343 | |
| Account administration fee — Class A Shares | | 4,804 | |
| Account administration fee — Class C Shares | | 576 | |
| Share registration costs | | 53,199 | |
| Printing and postage | | 90,129 | |
| Insurance premiums | | 3,802 | |
| Miscellaneous | | 4,554 | |
| TOTAL EXPENSES | | 8,132,933 | |
Annual Shareholder Report13
Statement of Operations — continued| Waivers, Reimbursement and Expense Reduction: | | | |
| Waiver/reimbursement of investment adviser fee (Note 5) | $(1,228,557) | | |
| Waiver of administrative personnel and services fee (Note 5) | (9,772) | | |
| Fees paid indirectly from directed brokerage arrangements (Note 6) | (27,358) | | |
| TOTAL WAIVERS, REIMBURSEMENT AND EXPENSE REDUCTION | | $(1,265,687) | |
| Net expenses | | | $6,867,246 |
| Net investment income | | | 27,902,432 |
| Realized and Unrealized Gain (Loss) on Investments and Foreign Currency Transactions: | | | |
| Net realized loss on investments and foreign currency transactions | | | (111,299,565) |
| Net change in unrealized depreciation of investments and translation of assets and liabilities in foreign currency | | | 115,478,072 |
| Net realized and unrealized gain on investments and foreign currency transactions | | | 4,178,507 |
| Change in net assets resulting from operations | | | $32,080,939 |
- See Notes which are an integral part of the Financial Statements
Annual Shareholder Report14
Statement of Changes in Net Assets
| Year Ended October 31 | 2009 | 2008 |
| Increase (Decrease) in Net Assets | | |
| Operations: | | |
| Net investment income | $27,902,432 | $37,740,877 |
| Net realized loss on investments and foreign currency transactions | (111,299,565) | (159,158,300) |
| Net change in unrealized appreciation/depreciation of investments and translation of assets and liabilities in foreign currency | 115,478,072 | (138,352,041) |
| CHANGE IN NET ASSETS RESULTING FROM OPERATIONS | 32,080,939 | (259,769,464) |
| Distributions to Shareholders: | | |
| Distributions from net investment income | | |
| Institutional Shares | (11,149,598) | (10,312,929) |
| Class A Shares | (12,436,345) | (21,360,233) |
| Class C Shares | (3,870,108) | (7,482,872) |
| Distributions from net realized gain on investments and foreign currency transactions | | |
| Institutional Shares | — | (8,905,275) |
| Class A Shares | — | (24,168,884) |
| Class C Shares | — | (9,508,724) |
| CHANGE IN NET ASSETS RESULTING FROM DISTRIBUTIONS TO SHAREHOLDERS | (27,456,051) | (81,738,917) |
| Share Transactions: | | |
| Proceeds from sale of shares | 558,427,866 | 268,193,176 |
| Net asset value of shares issued to shareholders in payment of distributions declared | 17,675,948 | 63,505,448 |
| Cost of shares redeemed | (253,838,605) | (424,759,433) |
| CHANGE IN NET ASSETS RESULTING FROM SHARE TRANSACTIONS | 322,265,209 | (93,060,809) |
| Change in net assets | 326,890,097 | (434,569,190) |
| Net Assets: | | |
| Beginning of period | 538,806,259 | 973,375,449 |
| End of period (including undistributed net investment income of $1,497,555 and $1,121,022, respectively) | $865,696,356 | $538,806,259 |
- See Notes which are an integral part of the Financial Statements
Annual Shareholder Report15
Notes to Financial Statements
October 31, 2009
1. ORGANIZATION
Federated Equity Funds (the “Trust”) is registered under the Investment Company Act of 1940, as amended (the “Act”), as an open-end management investment company. The Trust consists of 13 portfolios. The financial statements included herein are only those of Federated Strategic Value Fund (the “Fund”), a diversified portfolio. The financial statements of the other portfolios are presented separately. The assets of each portfolio are segregated and a shareholder's interest is limited to the portfolio in which shares are held. Each portfolio pays its own expenses. The Fund offers three classes of shares: Institutional Shares, Class A Shares and Class C Shares. All shares of the Fund have equal rights with respect to voting, except on class-specific matters. The financial highlights of the Class A Shares and Class C Shares are presented separately. The investment objective of the Fund is to provide income and long-term capital appreciation.
2. SIGNIFICANT ACCOUNTING POLICIES
The following is a summary of significant accounting policies consistently followed by the Fund in the preparation of its financial statements. These policies are in conformity with U.S. generally accepted accounting principles (GAAP).
Investment Valuation
In calculating its net asset value (NAV), the Fund generally values investments as follows:
- Equity securities listed on an exchange or traded through a regulated market system are valued at their last reported sale price or official closing price in their principal exchange or market.
- Shares of other mutual funds are valued based upon their reported NAVs.
- Derivative contracts listed on exchanges are valued at their reported settlement or closing price.
- Over-the-counter (OTC) derivative contracts are fair valued using price evaluations provided by a pricing service approved by the Board of Trustees (the “Trustees”).
- Fixed-income securities acquired with remaining maturities greater than 60 days are fair valued using price evaluations provided by a pricing service approved by the Trustees.
- Fixed-income securities acquired with remaining maturities of 60 days or less are valued at their cost (adjusted for the accretion of any discount or amortization of any premium).
If the Fund cannot obtain a price or price evaluation from a pricing service for an investment, the Fund may attempt to value the investment based upon the mean of bid and asked quotations or fair value the investment based on price evaluations, from one or more dealers. If any price, quotation, price evaluation or other pricing source is not readily available when the NAV is calculated, the Fund uses the fair value of the investment determined in accordance with the procedures described below. There can be no assurance that the Fund could purchase or sell an investment at the price used to calculate the Fund's NAV.
Fair Valuation and Significant Events Procedures
The Trustees have authorized the use of pricing services to provide evaluations of the current fair value of certain investments for purposes of calculating the NAV. Factors considered by pricing services in evaluating an investment include the yields or prices of investments of comparable quality, coupon, maturity, call rights and other potential prepayments, terms and type, reported transactions, indications as to values from dealers and general market Annual Shareholder Report16
conditions. Some pricing services provide a single price evaluation reflecting the bid-side of the market for an investment (a “bid” evaluation). Other pricing services offer both bid evaluations and price evaluations indicative of a price between the prices bid and asked for the investment (a “mid” evaluation). The Fund normally uses bid evaluations for U.S. Treasury and Agency securities, mortgage-backed securities and municipal securities. The Fund normally uses mid evaluations for other types of fixed-income securities and OTC derivative contracts. In the event that market quotations and price evaluations are not available for an investment, the fair value of the investment is determined in accordance with procedures adopted by the Trustees.The Trustees also have adopted procedures requiring an investment to be priced at its fair value whenever the Adviser determines that a significant event affecting the value of the investment has occurred between the time as of which the price of the investment would otherwise be determined and the time as of which the NAV is computed. An event is considered significant if there is both an affirmative expectation that the investment's value will change in response to the event and a reasonable basis for quantifying the resulting change in value. Examples of significant events that may occur after the close of the principal market on which a security is traded, or after the time of a price evaluation provided by a pricing service or a dealer, include:
- With respect to securities traded in foreign markets, significant trends in U.S. equity markets or in the trading of foreign securities index futures or options contracts;
- With respect to price evaluations of fixed-income securities determined before the close of regular trading on the NYSE, actions by the Federal Reserve Open Market Committee and other significant trends in U.S. fixed-income markets;
- Political or other developments affecting the economy or markets in which an issuer conducts its operations or its securities are traded; and
- Announcements concerning matters such as acquisitions, recapitalizations, litigation developments, a natural disaster affecting the issuer's operations or regulatory changes or market developments affecting the issuer's industry.
The Trustees have approved the use of a pricing service to determine the fair value of equity securities traded principally in foreign markets when the Adviser determines that there has been a significant trend in the U.S. equity markets or in index futures trading. For other significant events, the Fund may seek to obtain more current quotations or price evaluations from alternative pricing sources. If a reliable alternative pricing source is not available, the Fund will determine the fair value of the investment using another method approved by the Trustees.
Repurchase Agreements
It is the policy of the Fund to require the other party to a repurchase agreement to transfer to the Fund's custodian or sub-custodian eligible securities or cash with a market value (after transaction costs) at least equal to the repurchase price to be paid under the repurchase agreement. The eligible securities are transferred to accounts with the custodian or sub-custodian in which the Fund holds a “securities entitlement” and exercises “control” as those terms are defined in the Uniform Commercial Code. The Fund has established procedures for monitoring the market value of the transferred securities and requiring the transfer of additional eligible securities if necessary to equal at least the repurchase price. These procedures also allow the other party to require securities to be transferred from the account to the extent that their market value exceeds the repurchase price or in exchange for other eligible securities of equivalent market value.
Annual Shareholder Report17
With respect to agreements to repurchase U.S. government securities and cash items, the Fund treats the repurchase agreement as an investment in the underlying securities and not as an obligation of the other party to the repurchase agreement. Other repurchase agreements are treated as obligations of the other party secured by the underlying securities. Nevertheless, the insolvency of the other party or other failure to repurchase the securities may delay the disposition of the underlying securities or cause the Fund to receive less than the full repurchase price. Under the terms of the repurchase agreement, any amounts received by the Fund in excess of the repurchase price and related transaction costs must be remitted to the other party.The Fund may enter into repurchase agreements in which eligible securities are transferred into joint trading accounts maintained by the custodian or sub-custodian for investment companies and other clients advised by the Fund's Adviser and its affiliates. The Fund will participate on a pro rata basis with the other investment companies and clients in its share of the securities transferred under such repurchase agreements and in its share of proceeds from any repurchase or other disposition of such securities.
Investment Income, Gains and Losses, Expenses and Distributions
Investment transactions are accounted for on a trade-date basis. Realized gains and losses from investment transactions are recorded on an identified-cost basis. Interest income and expenses are accrued daily. Dividend income and distributions to shareholders are recorded on the ex-dividend date. Foreign dividends are recorded on the ex-dividend date or when the Fund is informed of the ex-dividend date. Distributions of net investment income are declared and paid monthly. Non-cash dividends included in dividend income, if any, are recorded at fair value. Investment income, realized and unrealized gains and losses and certain fund-level expenses are allocated to each class based on relative average daily net assets, except that each class may bear certain expenses unique to that class such as account administration, distribution services and shareholder services fees. Dividends are declared separately for each class. No class has preferential dividend rights; differences in per share dividend rates are generally due to differences in separate class expenses.
Premium and Discount Amortization
All premiums and discounts on fixed-income securities are amortized/accreted for financial statement purposes.
Federal Taxes
It is the Fund's policy to comply with the Subchapter M provision of the Internal Revenue Code (the “Code”) and to distribute to shareholders each year substantially all of its income. Accordingly, no provision for federal income tax is necessary. As of and during the year ended October 31, 2009, the Fund did not have a liability for any uncertain tax positions. The Fund recognizes interest and penalties, if any, related to tax liabilities as income tax expense in the Statement of Operations. As of October 31, 2009, tax years 2006 through 2009 remain subject to examination by the Fund's major tax jurisdictions, which include the United States of America and the Commonwealth of Massachusetts.
The Fund may be subject to taxes imposed by governments of countries in which it invests. Such taxes are generally based on either income or gains earned or repatriated. The Fund accrues and applies such taxes to net investment income, net realized gains and net unrealized gains as income and/or gains are earned.
Annual Shareholder Report18
When-Issued and Delayed Delivery TransactionsThe Fund may engage in when-issued or delayed delivery transactions. The Fund records when-issued securities on the trade date and maintains security positions such that sufficient liquid assets will be available to make payment for the securities purchased. Securities purchased on a when-issued or delayed delivery basis are marked to market daily and begin earning interest on the settlement date. Losses may occur on these transactions due to changes in market conditions or the failure of counterparties to perform under the contract.
Foreign Currency Translation
The accounting records of the Fund are maintained in U.S. dollars. All assets and liabilities denominated in foreign currencies (FCs) are translated into U.S. dollars based on the rates of exchange of such currencies against U.S. dollars on the date of valuation. Purchases and sales of securities, income and expenses are translated at the rate of exchange quoted on the respective date that such transactions are recorded. The Fund does not isolate that portion of the results of operations resulting from changes in foreign exchange rates on investments from the fluctuations arising from changes in market prices of securities held. Such fluctuations are included with the net realized and unrealized gain or loss from investments.
Reported net realized foreign exchange gains or losses arise from sales of portfolio securities, sales and maturities of short-term securities, sales of FCs, currency gains or losses realized between the trade and settlement dates on securities transactions, the difference between the amounts of dividends, interest and foreign withholding taxes recorded on the Fund's books, and the U.S. dollar equivalent of the amounts actually received or paid. Net unrealized foreign exchange gains and losses arise from changes in the value of assets and liabilities other than investments in securities at fiscal year end, resulting from changes in the exchange rate.
Other
The preparation of financial statements in conformity with GAAP requires management to make estimates and assumptions that affect the amounts of assets, liabilities, expenses and revenues reported in the financial statements. Actual results could differ from those estimated.
3. SHARES OF BENEFICIAL INTEREST
The following tables summarize share activity:
| Year Ended October 31 | 2009 | 2008 |
| Institutional Shares: | Shares | Amount | Shares | Amount |
| Shares sold | 83,605,179 | $297,549,252 | 25,974,317 | $127,806,862 |
| Shares issued to shareholders in payment of distributions declared | 1,509,664 | 5,433,865 | 2,017,469 | 10,947,943 |
| Shares redeemed | (29,490,952) | (105,551,197) | (15,481,308) | (78,753,625) |
NET CHANGE RESULTING
FROM INSTITUTIONAL SHARE TRANSACTIONS | 55,623,891 | $197,431,920 | 12,510,478 | $60,001,180 |
Annual Shareholder Report19
| Year Ended October 31 | 2009 | 2008 |
| Class A Shares: | Shares | Amount | Shares | Amount |
| Shares sold | 61,006,487 | $216,116,030 | 21,162,592 | $107,920,645 |
| Shares issued to shareholders in payment of distributions declared | 2,533,845 | 9,093,307 | 6,937,960 | 37,946,847 |
| Shares redeemed | (32,564,324) | (114,933,297) | (53,217,904) | (267,747,175) |
NET CHANGE RESULTING
FROM CLASS A SHARE TRANSACTIONS | 30,976,008 | $110,276,040 | (25,117,352) | $(121,879,683) |
| Year Ended October 31 | 2009 | 2008 |
| Class C Shares: | Shares | Amount | Shares | Amount |
| Shares sold | 12,456,454 | $44,762,584 | 6,304,293 | $32,465,669 |
| Shares issued to shareholders in payment of distributions declared | 875,231 | 3,148,776 | 2,659,723 | 14,610,658 |
| Shares redeemed | (9,350,190) | (33,354,111) | (15,035,052) | (78,258,633) |
NET CHANGE RESULTING
FROM CLASS C SHARE TRANSACTIONS | 3,981,495 | $14,557,249 | (6,071,036) | $(31,182,306) |
| NET CHANGE RESULTING FROM FUND SHARE TRANSACTIONS | 90,581,394 | $322,265,209 | (18,677,910) | $(93,060,809) |
4. FEDERAL TAX INFORMATION
The timing and character of income and capital gain distributions are determined in accordance with income tax regulations, which may differ from GAAP. These differences are due to differing treatments for foreign currency transactions.
For the year ended October 31, 2009, permanent differences identified and reclassified among the components of net assets were as follows:
| Increase (Decrease) |
Undistributed
Net Investment
Income (Loss) | | Accumulated
Net Realized
Gain (Loss) |
| $(69,848) | | $69,848 |
Net investment income (loss), net realized gains (losses) and net assets were not affected by this reclassification.
The tax character of distributions as reported on the Statement of Changes in Net Assets for the years ended October 31, 2009 and 2008, was as follows:
| 2009 | 2008 |
| Ordinary income1 | $27,456,051 | $61,361,918 |
| Long-term capital gains | $ — | $20,376,999 |
| 1 | For tax purposes, short-term capital gain distributions are considered ordinary income distributions. |
Annual Shareholder Report20
As of October 31, 2009, the components of distributable earnings on a tax basis were as follows:
| Undistributed ordinary income | $1,497,555 |
| Net unrealized depreciation | $(3,601,032) |
| Capital loss carryforwards | $(269,644,599) |
At October 31, 2009, the cost of investments for federal tax purposes was $866,157,733. The net unrealized depreciation of investments for federal tax purposes excluding any unrealized appreciation/depreciation resulting from changes in foreign currency exchange rates was $3,607,926. This consists of net unrealized appreciation from investments for those securities having an excess of value over cost of $41,471,112 and net unrealized depreciation from investments for those securities having an excess of cost over value of $45,079,038.
At October 31, 2009, the Fund had a capital loss carryforward of $269,644,599 which will reduce the Fund's taxable income arising from future net realized gains on investments, if any, to the extent permitted by the Code and thus will reduce the amount of distributions to shareholders which would otherwise be necessary to relieve the Fund of any liability for federal income tax. Pursuant to the Code, such capital loss carryforward will expire as follows:
| Expiration Year | Expiration Amount |
| 2016 | $158,355,277 |
| 2017 | $111,289,322 |
5. INVESTMENT ADVISER FEE AND OTHER TRANSACTIONS WITH AFFILIATES
Investment Adviser Fee
Federated Equity Management Company of Pennsylvania is the Fund's investment adviser (the “Adviser”). The advisory agreement between the Fund and the Adviser provides for an annual fee equal to 0.75% of the Fund's average daily net assets. Subject to the terms described in the Expense Limitation note, the Adviser may voluntarily choose to waive any portion of its fee. The Adviser can modify or terminate this voluntary waiver at any time at its sole discretion. For the year ended October 31, 2009, the Adviser voluntarily waived $1,207,318 of its fee.
Administrative Fee
Federated Administrative Services (FAS), under the Administrative Services Agreement, provides the Fund with administrative personnel and services. The fee paid to FAS is based on the average aggregate daily net assets of certain Federated funds as specified below:
| Administrative Fee | Average Aggregate Daily Net Assets
of the Federated Funds |
| 0.150% | on the first $5 billion |
| 0.125% | on the next $5 billion |
| 0.100% | on the next $10 billion |
| 0.075% | on assets in excess of $20 billion |
Annual Shareholder Report21
The administrative fee received during any fiscal year shall be at least $150,000 per portfolio and $40,000 per each additional class of Shares. Subject to the terms described in the Expense Limitation note, FAS may voluntarily choose to waive any portion of its fee. FAS can modify or terminate this voluntary waiver at any time at its sole discretion. For the year ended
October 31, 2009, the net fee paid to FAS was 0.076% of average daily net assets of the Fund. FAS waived $9,772 of its fee.
Distribution Services Fee
The Fund has adopted a Distribution Plan (the “Plan”) pursuant to Rule 12b-1 under the Act. Under the terms of the Plan, the Fund will compensate Federated Securities Corp. (FSC), the principal distributor, from the daily net assets of the Fund's Class A Shares and Class C Shares to finance activities intended to result in the sale of these shares. The Plan provides that the Fund may incur distribution expenses at the following percentages of average daily net assets annually, to compensate FSC:
| Share Class Name | Percentage of Average Daily
Net Assets of Class |
| Class A Shares | 0.05% |
| Class C Shares | 0.75% |
Subject to the terms described in the Expense Limitation note, FSC may voluntarily choose to waive any portion of its fee. FSC can modify or terminate this voluntary waiver at any time at its sole discretion. When FSC receives fees, it may pay some or all of them to financial intermediaries whose customers purchase shares. For the year ended October 31, 2009, FSC retained $206,916 of fees paid by the Fund. For the year ended October 31, 2009, the Fund's Class A Shares did not incur a distribution services fee; however it may begin to incur this fee upon approval of the Trustees.
Sales Charges
Front-end sales charges and contingent deferred sales charges (CDSC) do not represent expenses of the Fund. They are deducted from the proceeds of sales of Fund shares prior to investment or from redemption proceeds prior to remittance, as applicable. For the year ended October 31, 2009, FSC retained $123,475 in sales charges from the sale of Class A Shares. FSC also retained $3,526 of CDSC relating to redemptions of Class A Shares and $15,635 relating to redemption of Class C Shares.
Shareholder Services Fee
The Fund may pay fees (Service Fees) up to 0.25% of the average daily net assets of the Fund's Class A Shares and Class C Shares to financial intermediaries or to Federated Shareholder Services Company (FSSC) for providing services to shareholders and maintaining shareholder accounts. Subject to the terms described in the Expense Limitation note, FSSC may voluntarily reimburse the Fund for shareholder services fees. This voluntary reimbursement can be modified or terminated at any time. For the year ended October 31, 2009, FSSC received $6,529 of fees paid by the Fund.
Interfund Transactions
During the year ended October 31, 2009, the Fund engaged in purchase and sale transactions with funds that have a common investment adviser (or affiliated investment advisers), common Directors/Trustees, and/or common Officers. These purchase and sale transactions complied with Rule 17a-7 under the Act and amounted to $381,254 and $0, respectively.
Annual Shareholder Report22
Expense LimitationThe Adviser and its affiliates (which may include FSC, FAS and FSSC) have voluntarily agreed to waive their fees and/or reimburse expenses so that the total operating expenses (as shown in the financial highlights) paid by the Fund's Institutional Shares, Class A Shares and Class C Shares (after the voluntary waivers and reimbursements) will not exceed 0.80%, 1.05% and 1.80%, respectively, through the later of (the “Termination Date”): (a) December 31, 2010; or (b) the date of the Fund's next effective Prospectus. While the Adviser and its affiliates currently do not anticipate terminating these arrangements prior to the Termination Date, these arrangements may only be terminated prior to the Termination Date with the agreement of the Fund's Board of Trustees.
General
Certain Officers and Trustees of the Fund are Officers and Directors or Trustees of the above companies.
Transactions with Affiliated Companies
Affiliated holdings are mutual funds which are managed by the Adviser or an affiliate of the Adviser. The Adviser has agreed to reimburse the Fund for certain investment adviser fees as a result of transactions in other affiliated mutual funds. For the year ended October 31, 2009, the Adviser reimbursed $21,239. Transactions with the affiliated company during the year ended October 31, 2009 were as follows:
| Affiliate | Balance of
Shares Held
10/31/2008 | Purchases/
Additions | Sales/
Reductions | Balance of
Shares Held
10/31/2009 | Value | Dividend
Income |
| Prime Value Obligations Fund, Institutionlal Shares | 25,326,593 | 302,743,516 | 321,482,856 | 6,587,253 | $6,587,253 | $279,844 |
6. EXPENSE Reduction
The Fund directs portfolio trades to a broker that in turn pays a portion of the Fund's operating expenses. For the year ended October 31, 2009, the Fund's expenses were reduced by $27,358 under these arrangements.
7. Investment TRANSACTIONS
Purchases and sales of investments, excluding long-term U.S. government securities and short-term obligations for the year ended October 31, 2009, were as follows:
| Purchases | $600,550,533 |
| Sales | $263,849,023 |
8. LINE OF CREDIT
The Fund participates in a $100,000,000 unsecured, uncommitted revolving line of credit (LOC) agreement with PNC Bank. The LOC was made available for extraordinary or emergency purposes, primarily for financing redemption payments. Borrowings are charged interest at a rate offered to the Fund by PNC Bank at the time of the borrowing. As of October 31, 2009, there were no outstanding loans. During the year ended October 31, 2009, the Fund did not utilize the LOC.
Annual Shareholder Report23
9. INTERFUND LENDINGPursuant to an Exemptive Order issued by the Securities and Exchange Commission (SEC), the Fund, along with other funds advised by subsidiaries of Federated Investors, Inc., may participate in an interfund lending program. This program provides an alternative credit facility allowing the Fund to borrow from other participating affiliated funds. As of October 31, 2009, there were no outstanding loans. During the year ended October 31, 2009, the program was not utilized.
10. Legal Proceedings
Since October 2003, Federated Investors, Inc. and related entities (collectively, “Federated”), and various Federated funds (Federated Funds) have been named as defendants in several class action lawsuits now pending in the United States District Court for the District of Maryland. The lawsuits were purportedly filed on behalf of people who purchased, owned and/or redeemed shares of Federated-sponsored mutual funds during specified periods beginning November 1, 1998. The suits are generally similar in alleging that Federated engaged in illegal and improper trading practices including market timing and late trading in concert with certain institutional traders, which allegedly caused financial injury to the mutual fund shareholders. These lawsuits began to be filed shortly after Federated's first public announcement that it had received requests for information on shareholder trading activities in the Federated Funds from the SEC, the Office of the New York State Attorney General (NYAG) and other authorities. In that regard, on November 28, 2005, Federated announced that it had reached final settlements with the SEC and the NYAG with respect to those matters. As Federated previously reported in 2004, it has already paid approximately $8.0 million to certain funds as determined by an independent consultant. As part of these settlements, Federated agreed to pay for the benefit of fund shareholders additional disgorgement and a civil money penalty in the aggregate amount of an additional $72 million. Federated entities have also been named as defendants in several additional lawsuits that are now pending in the United States District Court for the Western District of Pennsylvania, alleging, among other things, excessive advisory and Rule 12b-1 fees. The Board of the Federated Funds retained the law firm of Dickstein Shapiro LLP to represent the Federated Funds in these lawsuits. Federated and the Federated Funds and their respective counsel have been defending this litigation, and none of the Federated Funds remains a defendant in any of the lawsuits (though some could potentially receive any recoveries as nominal defendants). Additional lawsuits based upon similar allegations may be filed in the future. The potential impact of these lawsuits, all of which seek unquantified damages, attorneys' fees and expenses, and future potential similar suits is uncertain. Although we do not believe that these lawsuits will have a material adverse effect on the Federated Funds, there can be no assurance that these suits, the ongoing adverse publicity and/or other developments resulting from the regulatory investigations will not result in increased Federated Fund redemptions, reduced sales of Federated Fund shares or other adverse consequences for the Federated Funds.
11. Subsequent events
Management has evaluated subsequent events through December 24, 2009, the date the financial statements were issued, and determined that no events have occurred that require additional disclosure.
Annual Shareholder Report24
12. FEDERAL TAX INFORMATION (UNAUDITED)For the fiscal year ended October 31, 2009, 100% of total ordinary income (including short-term capital gain) distributions made by the Fund are qualifying dividends which may be subject to a maximum tax rate of 15%, as provided for by the Jobs and Growth Tax Relief Act of 2003. Complete information is reported in conjunction with the reporting of your distributions on Form 1099-DIV.
Of the ordinary income (including short-term capital gain) distributions made by the Fund during the year ended October 31, 2009, 91.60% qualify for the dividend received deduction available to corporate shareholders.
Annual Shareholder Report25
Report of Independent Registered Public Accounting Firm
TO THE BOARD OF Trustees OF Federated Equity Funds AND SHAREHOLDERS OF Federated Strategic Value Fund:
We have audited the accompanying statement of assets and liabilities of Federated Strategic Value Fund (the “Fund”), one of the portfolios constituting Federated Equity Funds, including the portfolio of investments, as of October 31, 2009, and the related statement of operations for the year then ended, the statement of changes in net assets for each of the two years in the period then ended, and the financial highlights for each of the periods indicated therein. These financial statements and financial highlights are the responsibility of the Fund's management. Our responsibility is to express an opinion on these financial statements and financial highlights based on our audits.
We conducted our audits in accordance with standards of the Public Company Accounting Oversight Board (United States). Those standards require that we plan and perform the audit to obtain reasonable assurance about whether the financial statements and financial highlights are free of material misstatement. We were not engaged to perform an audit of the Fund's internal control over financial reporting. Our audits included consideration of internal control over financial reporting as a basis for designing audit procedures that are appropriate in the circumstances, but not for the purpose of expressing an opinion on the effectiveness of the Fund's internal control over financial reporting. Accordingly, we express no such opinion. An audit also includes examining, on a test basis, evidence supporting the amounts and disclosures in the financial statements and financial highlights, assessing the accounting principles used and significant estimates made by management, and evaluating the overall financial statement presentation. Our procedures included confirmation of securities owned as of October 31, 2009, by correspondence with the custodian and brokers. We believe that our audits provide a reasonable basis for our opinion.
In our opinion, the financial statements and financial highlights referred to above present fairly, in all material respects, the financial position of Federated Strategic Value Fund, a portfolio of Federated Equity Funds, at October 31, 2009, the results of its operations for the year then ended, the changes in its net assets for each of the two years in the period then ended, and the financial highlights for each of the periods indicated therein, in conformity with U.S. generally accepted accounting principles.
Boston, Massachusetts
December 24, 2009
Annual Shareholder Report26
Board of Trustees and Trust Officers
The Board is responsible for managing the Trust's business affairs and for exercising all the Trust's powers except those reserved for the shareholders. The following tables give information about each Board member and the senior officers of the Fund. Where required, the tables separately list Board members who are “interested persons” of the Fund (i.e., “Interested” Board members) and those who are not (i.e., “Independent” Board members). Unless otherwise noted, the address of each person listed is Federated Investors Tower, 1001 Liberty Avenue, Pittsburgh, PA 15222. The address of all Independent Board members listed is 4000 Ericsson Drive, Warrendale, PA 15086-7561; Attention: Mutual Fund Board. As of December 31, 2008, the Trust comprised ten portfolios, and the Federated Fund Complex consisted of 40 investment companies (comprising 149 portfolios). Unless otherwise noted, each Officer is elected annually. Unless otherwise noted, each Board member oversees all portfolios in the Federated Fund Complex and serves for an indefinite term. The Fund's Statement of Additional Information includes additional information about Trust Trustees and is available, without charge and upon request, by calling 1-800-341-7400.
Interested TRUSTEES Background
Name
Birth Date
Positions Held with Trust
Date Service Began | Principal Occupation(s) for Past Five Years,
Other Directorships Held and Previous Position(s) |
John F. Donahue*
Birth Date: July 28, 1924
TRUSTEE
Began serving: April 1984 | Principal Occupations: Director or Trustee of the Federated Fund Complex; Chairman and Director, Federated Investors, Inc.; Chairman of the Federated Fund Complex's Executive Committee.
Previous Positions: Chairman of the Federated Fund Complex; Trustee, Federated Investment Management Company; Chairman and Director, Federated Investment Counseling. |
J. Christopher Donahue*
Birth Date: April 11, 1949
PRESIDENT AND TRUSTEE
Began serving: January 2000 | Principal Occupations: Principal Executive Officer and President of the Federated Fund Complex; Director or Trustee of some of the Funds in the Federated Fund Complex; President, Chief Executive Officer and Director, Federated Investors, Inc.; Chairman and Trustee, Federated Investment Management Company; Trustee, Federated Investment Counseling; Chairman and Director, Federated Global Investment Management Corp.; Chairman, Federated Equity Management Company of Pennsylvania and Passport Research, Ltd. (investment advisory subsidiary of Federated); Trustee, Federated Shareholder Services Company; Director, Federated Services Company.
Previous Positions: President, Federated Investment Counseling; President and Chief Executive Officer, Federated Investment Management Company, Federated Global Investment Management Corp. and Passport Research, Ltd. |
| * | Family relationships and reasons for “interested” status: John F. Donahue is the father of J. Christopher Donahue; both are “interested” due to their beneficial ownership of shares of Federated Investors, Inc. and the positions they hold with Federated and its subsidiaries. |
Annual Shareholder Report27
INDEPENDENT TRUSTEES Background
Name
Birth Date
Positions Held with Trust
Date Service Began | Principal Occupation(s) for Past Five Years,
Other Directorships Held and Previous Position(s) |
John T. Conroy, Jr., Ph.D.
Birth Date: June 23, 1937
TRUSTEE
Began serving: November 1991 | Principal Occupations: Director or Trustee of the Federated Fund Complex; Chairman of the Board, Investment Properties Corporation; Partner or Trustee in private real estate ventures in Southwest Florida; Assistant Professor in Theology, Blessed Edmund Rice School for Pastoral Ministry.
Previous Positions: President, Investment Properties Corporation; Senior Vice President, John R. Wood and Associates, Inc., Realtors; President, Naples Property Management, Inc. and Northgate Village Development Corporation. |
Nicholas P. Constantakis
Birth Date: September 3, 1939
TRUSTEE
Began serving: February 1998 | Principal Occupation: Director or Trustee of the Federated Fund Complex.
Other Directorship Held: Director and Chairman of the Audit Committee, Michael Baker Corporation (architecture, engineering and construction services).
Previous Position: Partner, Andersen Worldwide SC. |
John F. Cunningham
Birth Date: March 5, 1943
TRUSTEE
Began serving: January 1999 | Principal Occupation: Director or Trustee of the Federated Fund Complex.
Other Directorships Held: Chairman, President and Chief Executive Officer, Cunningham & Co., Inc. (strategic business consulting); Trustee Associate, Boston College.
Previous Positions: Director, Redgate Communications and EMC Corporation (computer storage systems); Chairman of the Board and Chief Executive Officer, Computer Consoles, Inc.; President and Chief Operating Officer, Wang Laboratories; Director, First National Bank of Boston; Director, Apollo Computer, Inc. |
Maureen Lally-Green
Birth Date: July 5, 1949
TRUSTEE
Began serving: August 2009 | Principal Occupations: Director or Trustee of the Federated Fund Complex; Director, Office of Church Relations, Diocese of Pittsburgh; Adjunct Professor of Law, Duquesne University School of Law.
Other Directorships Held: Director, Auberle; Trustee St. Francis University; Director, Ireland Institute of Pittsburgh; Director, UPMC Mercy Hospital; Regent, St. Vincent Seminary; Director, Epilepsy Foundation of Western and Central Pennsylvania; Director, Saint Thomas More Society, Allegheny County; Director, Carlow University.
Previous Position: Pennsylvania Superior Court Judge. |
Annual Shareholder Report28
Name
Birth Date
Positions Held with Trust
Date Service Began | Principal Occupation(s) for Past Five Years,
Other Directorships Held and Previous Position(s) |
Peter E. Madden
Birth Date: March 16, 1942
TRUSTEE
Began serving: November 1991 | Principal Occupation: Director or Trustee and Chairman of the Board of the Federated Fund Complex.
Other Directorship Held: Board of Overseers, Babson College.
Previous Positions: Representative, Commonwealth of Massachusetts General Court; President, Chief Operating Officer and Director, State Street Bank and Trust Company and State Street Corporation (retired); Director, VISA USA and VISA International; Chairman and Director, Massachusetts Bankers Association; Director, Depository Trust Corporation; Director, The Boston Stock Exchange. |
Charles F. Mansfield, Jr.
Birth Date: April 10, 1945
TRUSTEE
Began serving: January 1999 | Principal Occupations: Director or Trustee and Chairman of the Audit Committee of the Federated Fund Complex; Management Consultant.
Previous Positions: Chief Executive Officer, PBTC International Bank; Partner, Arthur Young & Company (now Ernst & Young LLP); Chief Financial Officer of Retail Banking Sector, Chase Manhattan Bank; Senior Vice President, HSBC Bank USA (formerly, Marine Midland Bank); Vice President, Citibank; Assistant Professor of Banking and Finance, Frank G. Zarb School of Business, Hofstra University; Executive Vice President DVC Group, Inc. (marketing, communications and technology). |
R. James Nicholson
Birth Date: February 4, 1938
TRUSTEE
Began serving: January 2008 | Principal Occupations: Director or Trustee of the Federated Fund Complex; Senior Counsel, Brownstein Hyatt Farber Schrek, P.C.; Former Secretary of the U.S. Dept. of Veterans Affairs; Former U.S. Ambassador to the Holy See; Former Chairman of the Republican National Committee.
Other Directorships Held: Director, Horatio Alger Association; Director, The Daniels Fund.
Previous Positions: Colonel, U.S. Army Reserve; Partner, Calkins, Kramer, Grimshaw and Harring, P.C.; General Counsel, Colorado Association of Housing and Building; Chairman and CEO, Nicholson Enterprises, Inc. (real estate holding company); Chairman and CEO, Renaissance Homes of Colorado. |
Thomas M. O'Neill
Birth Date: June 14, 1951
TRUSTEE
Began serving: October 2006 | Principal Occupations: Director or Trustee of the Federated Fund Complex; Managing Director and Partner, Navigator Management Company, L.P. (investment and strategic consulting).
Other Directorships Held: Board of Overseers, Children's Hospital of Boston; Visiting Committee on Athletics, Harvard College.
Previous Positions: Chief Executive Officer and President, Managing Director and Chief Investment Officer, Fleet Investment Advisors; President and Chief Executive Officer, Aeltus Investment Management, Inc.; General Partner, Hellman, Jordan Management Co., Boston, MA; Chief Investment Officer, The Putnam Companies, Boston, MA; Credit Analyst and Lending Officer, Fleet Bank; Director and Consultant, EZE Castle Software (investment order management software); Director, Midway Pacific (lumber). |
Annual Shareholder Report29
Name
Birth Date
Positions Held with Trust
Date Service Began | Principal Occupation(s) for Past Five Years,
Other Directorships Held and Previous Position(s) |
John S. Walsh
Birth Date: November 28, 1957
TRUSTEE
Began serving: January 1999 | Principal Occupations: Director or Trustee of the Federated Fund Complex; President and Director, Heat Wagon, Inc. (manufacturer of construction temporary heaters); President and Director, Manufacturers Products, Inc. (distributor of portable construction heaters); President, Portable Heater Parts, a division of Manufacturers Products, Inc.
Previous Position: Vice President, Walsh & Kelly, Inc. |
James F. Will
Birth Date: October 12, 1938
TRUSTEE
Began serving: April 2006 | Principal Occupations: Director or Trustee of the Federated Fund Complex; formerly, Vice Chancellor and President, Saint Vincent College.
Other Directorships Held: Trustee, Saint Vincent College; Alleghany Corporation.
Previous Positions: Chairman, President and Chief Executive Officer, Armco, Inc.; President and Chief Executive Officer, Cyclops Industries; President and Chief Operating Officer, Kaiser Steel Corporation. |
OFFICERS
Name
Birth Date
Address
Positions Held with Trust
Date Service Began | Principal Occupation(s) for Past Five Years
and Previous Position(s) |
John W. McGonigle
Birth Date: October 26, 1938
EXECUTIVE VICE PRESIDENT AND SECRETARY
Began serving: April 1984 | Principal Occupations: Executive Vice President and Secretary of the Federated Fund Complex; Vice Chairman, Executive Vice President, Secretary and Director, Federated Investors, Inc.
Previous Positions: Trustee, Federated Investment Management Company and Federated Investment Counseling; Director, Federated Global Investment Management Corp., Federated Services Company and Federated Securities Corp. |
Richard A. Novak
Birth Date: December 25, 1963
TREASURER
Began serving: January 2006 | Principal Occupations: Principal Financial Officer and Treasurer of the Federated Fund Complex; Senior Vice President, Federated Administrative Services; Financial and Operations Principal for Federated Securities Corp., Edgewood Services, Inc. and Southpointe Distribution Services, Inc.
Previous Positions: Controller of Federated Investors, Inc.; Vice President, Finance of Federated Services Company; held various financial management positions within The Mercy Hospital of Pittsburgh; Auditor, Arthur Andersen & Co. |
Richard B. Fisher
Birth Date: May 17, 1923
VICE PRESIDENT
Began serving: April 1984 | Principal Occupations: Vice Chairman or Vice President of some of the Funds in the Federated Fund Complex; Vice Chairman, Federated Investors, Inc.; Chairman, Federated Securities Corp.
Previous Positions: President and Director or Trustee of some of the Funds in the Federated Fund Complex; Executive Vice President, Federated Investors, Inc.; Director and Chief Executive Officer, Federated Securities Corp. |
Annual Shareholder Report30
Name
Birth Date
Address
Positions Held with Trust
Date Service Began | Principal Occupation(s) for Past Five Years
and Previous Position(s) |
Brian P. Bouda
Birth Date: February 28, 1947
CHIEF COMPLIANCE OFFICER AND SENIOR VICE PRESIDENT
Began serving: August 2004 | Principal Occupations: Senior Vice President and Chief Compliance Officer of the Federated Fund Complex; Vice President and Chief Compliance Officer of Federated Investors, Inc. and Chief Compliance Officer of its subsidiaries. Mr. Bouda joined Federated in 1999 and is a member of the American Bar Association and the State Bar Association of Wisconsin. |
Stephen F. Auth
Birth Date: September 3, 1956
450 Lexington Avenue
Suite 3700
New York, NY 10017-3943
CHIEF INVESTMENT OFFICER
Began serving: November 2002 | Principal Occupations: Mr. Auth is Chief Investment Officer of this Fund and various other Funds in the Federated Fund Complex; Executive Vice President, Federated Investment Counseling, Federated Global Investment Management Corp. and Federated Equity Management Company of Pennsylvania.
Previous Positions: Executive Vice President, Federated Investment Management Company, and Passport Research, Ltd. (investment advisory subsidiary of Federated); Senior Vice President, Global Portfolio Management Services Division; Senior Vice President, Federated Investment Management Company and Passport Research, Ltd.; Senior Managing Director and Portfolio Manager, Prudential Investments. |
Lawrence Auriana
Birth Date: January 8, 1944
140 East 45th Street
New York, NY 10017
VICE PRESIDENT
Began serving: November 2001 | Principal Occupations: Lawrence Auriana is Vice President of the Trust. Mr. Auriana joined Federated in April 2001 as Co-Head of Investments/Federated Kaufmann. From August 1984 to April 2001, Mr. Auriana was President and Treasurer of Edgemont Asset Management Corp., and Chairman of the Board and Portfolio Manager to The Kaufmann Fund, Inc. (predecessor to the Federated Kaufmann Fund). Mr. Auriana earned a B.S. in economics from Fordham University and has been engaged in the securities business since 1965. |
Walter C. Bean
Birth Date: June 22, 1945
VICE PRESIDENT
Began serving: November 2006 | Principal Occupations: Walter C. Bean has been the Fund's Portfolio Manager since inception. Walter C. Bean is Vice President of the Trust. Mr. Bean is a Senior Vice President, Senior Portfolio Manager and the Head of the Equity Income Management Team of the Fund's Adviser. Mr. Bean joined Federated in 2000. His previous associations included: various investment management and research positions with C.S. McKee & Company, First Chicago Investment Advisors, CIGNA Investment Advisors and Mellon Bank. Mr. Bean earned a Bachelors Degree in Business Administration from Ohio University and an M.B.A. from the Pennsylvania State University. Mr. Bean is a Chartered Financial Analyst and has 40 years of investment experience. |
Hans P. Utsch
Birth Date: July 3, 1936
140 East 45th Street
New York, NY 10017
VICE PRESIDENT
Began serving: November 2001 | Principal Occupations: Hans P. Utsch is Vice President of the Trust. Mr. Utsch joined Federated in April 2001 as Co-Head of Investments/Federated Kaufmann. From August 1984 to April 2001, Mr. Utsch was Chairman of the Board and Secretary of Edgemont Asset Management Corp., and President and Portfolio Manager to The Kaufmann Fund, Inc. (predecessor to the Federated Kaufmann Fund). Mr. Utsch graduated from Amherst College and holds an M.B.A. from Columbia University. He has been engaged in the securities business since 1962. |
Annual Shareholder Report31
Evaluation and Approval of Advisory Contract - May 2009
Federated Strategic Value Fund (the “Fund”)
The Fund's Board reviewed the Fund's investment advisory contract at meetings held in May 2009. The Board's decision regarding the contract reflects the exercise of its business judgment on whether to continue the existing arrangements.
In this connection, the Federated funds' Board had previously appointed a Senior Officer, whose duties include specified responsibilities relating to the process by which advisory fees are to be charged to a Federated fund. The Senior Officer has the authority to retain consultants, experts, or staff as may be reasonably necessary to assist in the performance of his duties, reports directly to the Board, and may be terminated only with the approval of a majority of the independent members of the Board. The Senior Officer prepared and furnished to the Board an independent, written evaluation that covered topics discussed below. The Board considered that evaluation, along with other information, in deciding to approve the advisory contract.
During its review of the contract, the Board considered compensation and benefits received by the Adviser. This included the fees received for services provided to the Fund by other entities in the Federated organization and research services received by the Adviser from brokers that execute Federated fund trades, as well as advisory fees. The Board is also familiar with and considered judicial decisions concerning allegedly excessive investment advisory fees, which have indicated that the following factors may be relevant to an Adviser's fiduciary duty with respect to its receipt of compensation from a fund: the nature and quality of the services provided by the Adviser, including the performance of the fund; the Adviser's cost of providing the services; the extent to which the Adviser may realize “economies of scale” as a fund grows larger; any indirect benefits that may accrue to the Adviser and its affiliates as a result of the Adviser's relationship with a fund; performance and expenses of comparable funds; and the extent to which the independent Board members are fully informed about all facts the Board deems relevant bearing on the Adviser's services and fees. The Board further considered management fees (including any components thereof) charged to institutional and other clients of the Adviser for what might be viewed as like services, and the cost to the Adviser and its affiliates of supplying services pursuant to the management fee agreements, excluding any intra-corporate profit and profit margins of the Adviser and its affiliates for supplying such services. The Board was aware of these factors and was guided by them in its review of the Fund's advisory contract to the extent it considered them to be appropriate and relevant, as discussed further below.
Annual Shareholder Report32
The Board considered and weighed these circumstances in light of its substantial accumulated experience in governing the Fund and working with Federated on matters relating to the Federated funds, and was assisted in its deliberations by independent legal counsel. Throughout the year, the Board has requested and received substantial and detailed information about the Fund and the Federated organization that was in addition to the extensive materials that comprise and accompany the Senior Officer's evaluation. Federated provided much of this information at each regular meeting of the Board, and furnished additional reports in connection with the particular meeting at which the Board's formal review of the advisory contract occurred. Between regularly scheduled meetings, the Board also received information on particular matters as the need arose. Thus, the Board's consideration of the advisory contract included review of the Senior Officer's evaluation, accompanying data and additional reports covering such matters as: the Adviser's investment philosophy, revenue, profitability, personnel and processes; investment and operating strategies; the Fund's short- and long-term performance (in absolute terms, both on a gross basis and net of expenses, as well as in relationship to its particular investment program and certain competitor or “peer group” funds and/or other benchmarks, as appropriate), and comments on the reasons for performance; the Fund's investment objectives; the Fund's expenses (including the advisory fee itself and the overall expense structure of the Fund, both in absolute terms and relative to similar and/or competing funds, with due regard for contractual or voluntary expense limitations); the use and allocation of brokerage commissions derived from trading the Fund's portfolio securities (if any); and the nature, quality and extent of the advisory and other services provided to the Fund by the Adviser and its affiliates. The Board also considered the preferences and expectations of Fund shareholders and their relative sophistication; the continuing state of competition in the mutual fund industry and market practices; the range of comparable fees for similar funds in the mutual fund industry; the Fund's relationship to the Federated family of funds which include a comprehensive array of funds with different investment objectives, policies and strategies which are available for exchange without the incurrence of additional sales charges; compliance and audit reports concerning the Federated funds and the Federated companies that service them (including communications from regulatory agencies), as well as Federated's responses to any issues raised therein; and relevant developments in the mutual fund industry and how the Federated funds and/or Federated are responding to them. The Board's evaluation process is evolutionary. The criteria considered and the emphasis placed on relevant criteria change in recognition of changing circumstances in the mutual fund marketplace. With respect to the Fund's performance and expenses in particular, the Board has found the use of comparisons to other mutual funds with comparable investment programs to be particularly useful, given the high degree of competition in the mutual fund business. The Board focused on comparisons Annual Shareholder Report33
with other similar mutual funds more heavily than non-mutual fund products or services because it is believed that they are more relevant. For example, other mutual funds are the products most like the Fund, they are readily available to Fund shareholders as alternative investment vehicles, and they are the type of investment vehicle in fact chosen and maintained by the Fund's investors. The range of their fees and expenses therefore appears to be a generally reliable indication of what consumers have found to be reasonable in the precise marketplace in which the Fund competes. The Fund's ability to deliver competitive performance when compared to its peer group was a useful indicator of how the Adviser is executing the Fund's investment program, which in turn assisted the Board in reaching a conclusion that the nature, extent, and quality of the Adviser's investment management services were such as to warrant continuation of the advisory contract. In this regard, the Senior Officer has reviewed Federated's fees for providing advisory services to products outside the Federated family of funds (e.g., institutional and separate accounts). He concluded that mutual funds and institutional accounts are inherently different products. Those differences include, but are not limited to, different types of targeted investors; being subject to different laws and regulations; different legal structures; different average account sizes; different associated costs; different portfolio management techniques made necessary by different cash flows; and portfolio manager time spent in review of securities pricing. The Senior Officer did not consider these fee schedules to be determinative in judging the appropriateness of mutual fund advisory contracts.The Senior Officer reviewed reports compiled by Federated, using data supplied by independent fund ranking organizations, regarding the performance of, and fees charged by, other mutual funds, noting his view that comparisons to fund peer groups are highly important in judging the reasonableness of proposed fees.
For both the one- and three-year periods covered by the report, the Fund's performance was above the median of the relevant peer group.
The Board also received financial information about Federated, including reports on the compensation and benefits Federated derived from its relationships with the Federated funds. These reports covered not only the fees under the advisory contracts, but also fees received by Federated's subsidiaries for providing other services to the Federated funds under separate contracts (e.g., for serving as the Federated funds' administrator). The reports also discussed any indirect benefit Federated may derive from its receipt of research services from brokers who execute Federated fund trades. In addition, the Board considered the fact that, in order for a fund to be competitive in the marketplace, Federated and its affiliates frequently waived fees and/or reimbursed expenses and have disclosed to fund investors and/or indicated to the Board their intention to do so in the future, where appropriate. Moreover, the Board receives regular reports regarding the institution or elimination of these voluntary waivers.
Annual Shareholder Report34
Federated furnished reports, requested by the Senior Officer, that reported revenues on a fund-by-fund basis and made estimates of the allocation of expenses on a fund-by-fund basis, using allocation methodologies specified by the Senior Officer. The Senior Officer noted that, although they may apply consistent allocation processes, the inherent difficulties in allocating costs (and the unavoidable arbitrary aspects of that exercise) and the lack of consensus on how to allocate those costs may render such allocation reports unreliable. The allocation reports were considered in the analysis by the Board but were determined to be of limited use.The Board and the Senior Officer also reviewed a report compiled by Federated comparing profitability information for Federated to other publicly held fund management companies. In this regard, the Senior Officer noted the limited availability of such information, but nonetheless concluded that Federated's profit margins did not appear to be excessive and the Board agreed.
The Senior Officer's evaluation also discussed the notion of possible realization of “economies of scale” as a fund grows larger. The Board considered in this regard that the Adviser has made significant and long-term investments in areas that support all of the Federated funds, such as personnel and processes for the portfolio management, compliance, and risk management functions; and systems technology; and that the benefits of these efforts (as well as any economies, should they exist) were likely to be enjoyed by the fund complex as a whole. Finally, the Board also noted the absence of any applicable regulatory or industry guidelines on this subject, which (as discussed in the Senior Officer's evaluation) is compounded by the lack of any common industry practice or general pattern with respect to structuring fund advisory fees with “breakpoints” that serve to reduce the fee as the fund attains a certain size. The Senior Officer did not recommend institution of breakpoints in pricing Federated's fund advisory services at this time.
It was noted in the materials for the Board meeting that for the period covered by the report, the Fund's investment advisory fee, after waivers and expense reimbursements, if any, was below the median of the relevant peer group. The Board reviewed the fees and other expenses of the Fund with the Adviser and was satisfied that the overall expense structure of the Fund remained competitive.
The Senior Officer's evaluation noted his belief that the information and observations contained in his evaluation supported a finding that the proposed management fees are reasonable, and that Federated appeared to provide appropriate administrative services to the Fund for the fees paid. Under these circumstances, no changes were recommended to, and no objection was raised to, the continuation of the Fund's advisory contract. The Board concluded that the nature, quality and scope of services provided the Fund by the Adviser and its affiliates were satisfactory.
Annual Shareholder Report35
In its decision to continue an existing investment advisory contract, the Board was mindful of the potential disruptions of the Fund's operations and various risks, uncertainties and other effects that could occur as a result of a decision to terminate or not renew an advisory contract. In particular, the Board recognized that many shareholders have invested in the Fund on the strength of the Adviser's industry standing and reputation and with the expectation that the Adviser will have a continuing role in providing advisory services to the Fund. Thus, the Board's approval of the advisory contract reflected the fact that it is the shareholders who have effectively selected the Adviser by virtue of having invested in the Fund.The Board based its decision to approve the advisory contract on the totality of the circumstances and relevant factors and with a view to past and future long-term considerations. Not all of the factors and considerations identified above were necessarily relevant to the Fund, nor did the Board consider any one of them to be determinative. With respect to the factors that were relevant, the Board's decision to approve the contract reflects its determination that Federated's performance and actions provided a satisfactory basis to support the decision to continue the existing arrangements.
Annual Shareholder Report36
Voting Proxies on Fund Portfolio Securities
A description of the policies and procedures that the Fund uses to determine how to vote proxies, if any, relating to securities held in the Fund's portfolio is available, without charge and upon request, by calling 1-800-341-7400. A report on “Form N-PX” of how the Fund voted any such proxies during the most recent 12-month period ended June 30 is available from Federated's Web site at FederatedInvestors.com. To access this information from the “Products” section of the Web site, click on the “Prospectuses and Regulatory Reports” link under “Related Information,” then select the appropriate link opposite the name of the Fund; or select the name of the Fund and from the Fund's page, click on the “Prospectuses and Regulatory Reports” link. Form N-PX filings are also available at the SEC's Web site at www.sec.gov.
Quarterly Portfolio Schedule
The Fund files with the SEC a complete schedule of its portfolio holdings, as of the close of the first and third quarters of its fiscal year, on “Form N-Q.” These filings are available on the SEC's Web site at www.sec.gov and may be reviewed and copied at the SEC's Public Reference Room in Washington, DC. (Call 1-800-SEC-0330 for information on the operation of the Public Reference Room.) You may also access this information from the “Products” section of Federated's Web site at FederatedInvestors.com by clicking on “Portfolio Holdings” under “Related Information,” then selecting the appropriate link opposite the name of the Fund; or select the name of the Fund and from the Fund's page, click on the “Portfolio Holdings” link.
Annual Shareholder Report37
Notes
38
Mutual funds are not bank deposits or obligations, are not guaranteed by any bank and are not insured or guaranteed by the U.S. government, the Federal Deposit Insurance Corporation, the Federal Reserve Board or any other government agency. Investment in mutual funds involves investment risk, including the possible loss of principal.
This Report is authorized for distribution to prospective investors only when preceded or accompanied by the Fund's Prospectus, which contains facts concerning its objective and policies, management fees, expenses and other information.
Federated Strategic Value Fund
Federated Investors Funds
4000 Ericsson Drive
Warrendale, PA 15086-7561
Contact us at FederatedInvestors.com
or call 1-800-341-7400.
Federated Securities Corp., Distributor
Cusip 314172560
37795 (12/09)
Federated is a registered mark of Federated Investors, Inc.
2009 Federated Investors, Inc.
Item 2. Code of Ethics
(a) As of the end of the period covered by this report, the registrant has adopted a code of ethics (the "Section 406 Standards for Investment Companies - Ethical Standards for Principal Executive and Financial Officers") that applies to the registrant's Principal Executive Officer and Principal Financial Officer; the registrant's Principal Financial Officer also serves as the Principal Accounting Officer.
(c) Not Applicable
(d) Not Applicable
(e) Not Applicable
(f)(3) The registrant hereby undertakes to provide any person, without charge, upon request, a copy of the code of ethics. To request a copy of the code of ethics, contact the registrant at 1-800-341-7400, and ask for a copy of the Section 406 Standards for Investment Companies - Ethical Standards for Principal Executive and Financial Officers.
Item 3. Audit Committee Financial Expert
The registrant's Board has determined that each of the following members of the Board's Audit Committee is an “audit committee financial expert,” and is "independent," for purposes of this Item: Nicholas P. Constantakis, Charles F. Mansfield, Jr. and Thomas M. O’Neill.
Item 4. Principal Accountant Fees and Services
(a) Audit Fees billed to the registrant for the two most recent fiscal years:
Fiscal year ended 2009 - $375,500
Fiscal year ended 2008 - $254,500
(b) Audit-Related Fees billed to the registrant for the two most recent fiscal years:
Fiscal year ended 2009 - $0
Fiscal year ended 2008 - $0
Amount requiring approval of the registrant’s audit committee pursuant to paragraph (c)(7)(ii) of Rule 2-01 of Regulation S-X, $5,000 and $9,857 respectively. Fiscal year ended 2009- Audit consent fee for N-14 merger documents. Fiscal year ended 2008- Audit consent fees for N-14 merger documents.
(c) Tax Fees billed to the registrant for the two most recent fiscal years:
Fiscal year ended 2009 - $0
Fiscal year ended 2008 - $0
Amount requiring approval of the registrant’s audit committee pursuant to paragraph (c)(7)(ii) of Rule 2-01 of Regulation S-X, $0 and $14,743 respectively. Fiscal year ended 2008- Tax preparation fees for fiscal year ended 2007.
(d) All Other Fees billed to the registrant for the two most recent fiscal years:
Fiscal year ended 2009 - $0
Fiscal year ended 2008 - $0
Amount requiring approval of the registrant’s audit committee pursuant to paragraph (c)(7)(ii) of Rule 2-01 of Regulation S-X, $148,527 and $10,461 respectively. Fiscal year ended 2009 – Discussion on accounting related to REMICs, fees related to technical assistance and valuation matters for various fund acquisitions, and service fee for analysis of potential Passive Foreign Investment Company holdings. Fiscal year ended 2008- Service fee for analysis of potential Passive Foreign Investment Company holdings.
(e)(1) Audit Committee Policies regarding Pre-approval of Services.
The Audit Committee is required to pre-approve audit and non-audit services performed by the independent auditor in order to assure that the provision of such services do not impair the auditor’s independence. Unless a type of service to be provided by the independent auditor has received general pre-approval, it will require specific pre-approval by the Audit Committee. Any proposed services exceeding pre-approved cost levels will require specific pre-approval by the Audit Committee.
Certain services have the general pre-approval of the Audit Committee. The term of the general pre-approval is 12 months from the date of pre-approval, unless the Audit Committee specifically provides for a different period. The Audit Committee will annually review the services that may be provided by the independent auditor without obtaining specific pre-approval from the Audit Committee and may grant general pre-approval for such services. The Audit Committee will revise the list of general pre-approved services from time to time, based on subsequent determinations. The Audit Committee will not delegate its responsibilities to pre-approve services performed by the independent auditor to management.
The Audit Committee has delegated pre-approval authority to its Chairman. The Chairman will report any pre-approval decisions to the Audit Committee at its next scheduled meeting. The Committee will designate another member with such pre-approval authority when the Chairman is unavailable.
AUDIT SERVICES
The annual Audit services engagement terms and fees will be subject to the specific pre-approval of the Audit Committee. The Audit Committee must approve any changes in terms, conditions and fees resulting from changes in audit scope, registered investment company (RIC) structure or other matters.
In addition to the annual Audit services engagement specifically approved by the Audit Committee, the Audit Committee may grant general pre-approval for other Audit Services, which are those services that only the independent auditor reasonably can provide. The Audit Committee has pre-approved certain Audit services, all other Audit services must be specifically pre-approved by the Audit Committee.
AUDIT-RELATED SERVICES
Audit-related services are assurance and related services that are reasonably related to the performance of the audit or review of the Company’s financial statements or that are traditionally performed by the independent auditor. The Audit Committee believes that the provision of Audit-related services does not impair the independence of the auditor, and has pre-approved certain Audit-related services, all other Audit-related services must be specifically pre-approved by the Audit Committee.
TAX SERVICES
The Audit Committee believes that the independent auditor can provide Tax services to the Company such as tax compliance, tax planning and tax advice without impairing the auditor’s independence. However, the Audit Committee will not permit the retention of the independent auditor in connection with a transaction initially recommended by the independent auditor, the purpose of which may be tax avoidance and the tax treatment of which may not be supported in the Internal Revenue Code and related regulations. The Audit Committee has pre-approved certain Tax services, all Tax services involving large and complex transactions must be specifically pre-approved by the Audit Committee.
ALL OTHER SERVICES
With respect to the provision of services other than audit, review or attest services the pre-approval requirement is waived if:
| (1) | The aggregate amount of all such services provided constitutes no more than five percent of the total amount of revenues paid by the registrant, the registrant’s adviser (not including any sub-adviser whose role is primarily portfolio management and is subcontracted with or overseen by another investment adviser), and any entity controlling, controlled by, or under common control with the investment adviser that provides ongoing services to the registrant to its accountant during the fiscal year in which the services are provided; |
| (2) | Such services were not recognized by the registrant, the registrant’s adviser (not including any sub-adviser whose role is primarily portfolio management and is subcontracted with or overseen by another investment adviser), and any entity controlling, controlled by, or under common control with the investment adviser that provides ongoing services to the registrant at the time of the engagement to be non-audit services; and |
| (3) | Such services are promptly brought to the attention of the Audit Committee of the issuer and approved prior to the completion of the audit by the Audit Committee or by one or more members of the Audit Committee who are members of the board of directors to whom authority to grant such approvals has been delegated by the Audit Committee. |
The Audit Committee may grant general pre-approval to those permissible non-audit services classified as All Other services that it believes are routine and recurring services, and would not impair the independence of the auditor.
The SEC’s rules and relevant guidance should be consulted to determine the precise definitions of prohibited non-audit services and the applicability of exceptions to certain of the prohibitions.
PRE-APPROVAL FEE LEVELS
Pre-approval fee levels for all services to be provided by the independent auditor will be established annually by the Audit Committee. Any proposed services exceeding these levels will require specific pre-approval by the Audit Committee.
PROCEDURES
Requests or applications to provide services that require specific approval by the Audit Committee will be submitted to the Audit Committee by both the independent auditor and the Principal Accounting Officer and/or Internal Auditor, and must include a joint statement as to whether, in their view, the request or application is consistent with the SEC’s rules on auditor independence.
(e)(2) Percentage of services identified in items 4(b) through 4(d) that were approved by the registrants audit committee pursuant to paragraph (c)(7)(i)(C) of Rule 2-01 of Regulation S-X:
4(b)
Fiscal year ended 2009 – 0%
Fiscal year ended 2008 - 0%
Percentage of services provided to the registrants investment adviser and any entity controlling, controlled by, or under common control with the investment adviser that provides ongoing services to the registrant that were approved by the registrants audit committee pursuant to paragraph (c)(7)(i)(C) of Rule 2-01 of Regulation S-X, 0% and 0% respectively.
4(c)
Fiscal year ended 2009 – 0%
Fiscal year ended 2008 – 0%
Percentage of services provided to the registrants investment adviser and any entity controlling, controlled by, or under common control with the investment adviser that provides ongoing services to the registrant that were approved by the registrants audit committee pursuant to paragraph (c)(7)(i)(C) of Rule 2-01 of Regulation S-X, 0% and 0% respectively.
4(d)
Fiscal year ended 2009 – 0%
Fiscal year ended 2008 – 0%
Percentage of services provided to the registrants investment adviser and any entity controlling, controlled by, or under common control with the investment adviser that provides ongoing services to the registrant that were approved by the registrants audit committee pursuant to paragraph (c)(7)(i)(C) of Rule 2-01 of Regulation S-X, 0% and 0% respectively.
| (g) | Non-Audit Fees billed to the registrant, the registrant’s investment adviser, and certain entities controlling, controlled by or under common control with the investment adviser: |
Fiscal year ended 2009 - $344,038
Fiscal year ended 2008 - $322,848
(h) The registrant’s Audit Committee has considered that the provision of non-audit services that were rendered to the registrant’s adviser (not including any sub-adviser whose role is primarily portfolio management and is subcontracted with or overseen by another investment adviser), and any entity controlling, controlled by, or under common control with the investment adviser that provides ongoing services to the registrant that were not pre-approved pursuant to paragraph (c)(7)(ii) of Rule 2-01 of Regulation S-X is compatible with maintaining the principal accountant’s independence.
Item 5. Audit Committee of Listed Registrants
Not Applicable
Item 6. Schedule of Investments
Not Applicable
| Item 7. | Disclosure of Proxy Voting Policies and Procedures for Closed-End Management Investment Companies |
| Item 8. | Portfolio Managers of Closed-End Management Investment Companies |
| Item 9. | Purchases of Equity Securities by Closed-End Management Investment Company and Affiliated Purchasers |
Item 10. Submission of Matters to a Vote of Security Holders
Not Applicable
Item 11. Controls and Procedures
(a) The registrant’s President and Treasurer have concluded that the
registrant’s disclosure controls and procedures (as defined in rule 30a-3(c) under the Act) are effective in design and operation and are sufficient to form the basis of the certifications required by Rule 30a-(2) under the Act, based on their evaluation of these disclosure controls and procedures within 90 days of the filing date of this report on Form N-CSR.
(b) There were no changes in the registrant’s internal control over financial reporting (as defined in rule 30a-3(d) under the Act) during the last fiscal quarter that have materially affected, or are reasonably likely to materially affect, the registrant’s internal control over financial reporting.
Item 12. Exhibits
SIGNATURES
Pursuant to the requirements of the Securities Exchange Act of 1934 and the Investment Company Act of 1940, the registrant has duly caused this report to be signed on its behalf by the undersigned, thereunto duly authorized.
| Registrant | Federated Equity Funds |
| | |
| By | /S/ Richard A. Novak |
| | Richard A. Novak, Principal Financial Officer |
| Date | December 22, 2009 |
| | |
| | |
| Pursuant to the requirements of the Securities Exchange Act of 1934 and the Investment Company Act of 1940, this report has been signed below by the following persons on behalf of the registrant and in the capacities and on the dates indicated. |
| | |
| | |
| By | /S/ J. Christopher Donahue |
| | J. Christopher Donahue, Principal Executive Officer |
| Date | December 22, 2009 |
| | |
| | |
| By | /S/ Richard A. Novak |
| | Richard A. Novak, Principal Financial Officer |
| Date | December 22, 2009 |