United States
Securities and Exchange Commission
Washington, D.C. 20549
Form N-CSR
Certified Shareholder Report of Registered Management Investment Companies
811-4017
(Investment Company Act File Number)
Federated Equity Funds
(Exact Name of Registrant as Specified in Charter)
Federated Investors Funds
4000 Ericsson Drive
Warrendale, Pennsylvania 15086-7561
(Address of Principal Executive Offices)
(412) 288-1900
(Registrant's Telephone Number)
John W. McGonigle, Esquire
Federated Investors Tower
1001 Liberty Avenue
Pittsburgh, Pennsylvania 15222-3779
(Name and Address of Agent for Service)
(Notices should be sent to the Agent for Service)
Date of Fiscal Year End: 09/30/09
Date of Reporting Period: 09/30/09
Item 1. Reports to Stockholders
Federated Clover Mid Value FundEstablished 2009
A Portfolio of Federated Equity Funds
ANNUAL SHAREHOLDER REPORTSeptember 30, 2009
Class A Shares
Class C Shares
FINANCIAL HIGHLIGHTS
SHAREHOLDER EXPENSE EXAMPLE
MANAGEMENT'S DISCUSSION OF FUND PERFORMANCE
PORTFOLIO OF INVESTMENTS SUMMARY TABLE
PORTFOLIO OF INVESTMENTS
STATEMENT OF ASSETS AND LIABILITIES
STATEMENT OF OPERATIONS
STATEMENT OF CHANGES IN NET ASSETS
NOTES TO FINANCIAL STATEMENTS
REPORT OF INDEPENDENT REGISTERED PUBLIC ACCOUNTING FIRM
BOARD OF TRUSTEES AND TRUST OFFICERS
EVALUATION AND APPROVAL OF ADVISORY CONTRACT
VOTING PROXIES ON FUND PORTFOLIO SECURITIES
QUARTERLY PORTFOLIO SCHEDULE
Not FDIC Insured * May Lose Value * No Bank Guarantee
Financial Highlights - Class A Shares
(For a Share Outstanding Throughout the Period)
| Period Ended September 30 | 20091 |
| Net Asset Value, Beginning of Period | $9.37 |
| Income From Investment Operations: | |
| Net investment income | 0.08 |
| Net realized and unrealized gain on investments | 4.16 |
| TOTAL FROM INVESTMENT OPERATIONS | 4.24 |
| Less Distributions: | |
| Distributions from net investment income | (0.08) |
| Net Asset Value, End of Period | $13.53 |
| Total Return2 | 45.42% |
| Ratios to Average Net Assets: | |
| Net expenses | 1.24%3 |
| Net investment income | 1.29%3 |
| Expense waiver/reimbursement4 | 36.03%3 |
| Supplemental Data: | |
| Net assets, end of period (000 omitted) | $249 |
| Portfolio turnover | 53% |
| 1 | Reflects operations for the period from March 16, 2009 (date of initial investment) to September 30, 2009. |
| 2 | Based on net asset value, which does not reflect the sales charge, redemption fee or contingent deferred sales charge, if applicable. Total returns for periods of less than one year are not annualized. |
| 3 | Computed on an annualized basis. |
| 4 | This expense decrease is reflected in both the net expense and the net investment income ratios shown above. |
- See Notes which are an integral part of the Financial Statements
Annual Shareholder Report1
Financial Highlights - Class C Shares
(For a Share Outstanding Throughout the Period)
| Period Ended September 30 | 20091 |
| Net Asset Value, Beginning of Period | $9.37 |
| Income from Investment Operations: | |
| Net investment income | 0.09 |
| Net realized and unrealized gain on investments | 4.17 |
| TOTAL FROM INVESTMENT OPERATIONS | 4.26 |
| Less Distributions: | |
| Distributions from net investment income | (0.09) |
| Net Asset Value, End of Period | $13.54 |
| Total Return2 | 45.63% |
| Ratios to Average Net Assets: | |
| Net expenses | 1.99%3 |
| Net investment income | 0.58%3 |
| Expense waiver/reimbursement4 | 52.28%3 |
| Supplemental Data: | |
| Net assets, end of period (000 omitted) | $7 |
| Portfolio turnover | 53% |
| 1 | Reflects operations for the period from March 16, 2009 (date of initial investment) to September 30, 2009. |
| 2 | Based on net asset value, which does not reflect the sales charge, redemption fee or contingent deferred sales charge, if applicable. Total returns for periods of less than one year are not annualized. |
| 3 | Computed on an annualized basis. |
| 4 | This expense decrease is reflected in both the net expense and the net investment income ratios shown above. |
- See Notes which are an integral part of the Financial Statements
Annual Shareholder Report2
Shareholder Expense Example (unaudited)
As a shareholder of the Fund, you incur two types of costs: (1) transaction costs, including sales charges (loads) on purchase or redemption payments; and (2) ongoing costs, including management fees and to the extent applicable, distribution (12b-1) fees and/or shareholder services fees and other Fund expenses. This Example is intended to help you to understand your ongoing costs (in dollars) of investing in the Fund and to compare these costs with the ongoing costs of investing in other mutual funds. It is based on an investment of $1,000 invested at the beginning of the period and held for the entire period from April 1, 2009 to September 30, 2009.
ACTUAL EXPENSES
The first section of the table below provides information about actual account values and actual expenses. You may use the information in this section, together with the amount you invested, to estimate the expenses that you incurred over the period. Simply divide your account value by $1,000 (for example, an $8,600 account value divided by $1,000 = 8.6), then multiply the result by the number in the first section under the heading entitled “Expenses Paid During Period” to estimate the expenses attributable to your investment during this period.
HYPOTHETICAL EXAMPLE FOR COMPARISON PURPOSES
The second section of the table below provides information about hypothetical account values and hypothetical expenses based on the Fund's actual expense ratio and an assumed rate of return of 5% per year before expenses, which is not the Fund's actual return. Thus, you should not use the hypothetical account values and expenses to estimate the actual ending account balance or your expenses for the period. Rather, these figures are required to be provided to enable you to compare the ongoing costs of investing in the Fund with other funds. To do so, compare this 5% hypothetical example with the 5% hypothetical examples that appear in the shareholder reports of the other funds.
Please note that the expenses shown in the table are meant to highlight your ongoing costs only and do not reflect any transaction costs, such as sales charges (loads) on purchase or redemption payments. Therefore, the second section of the table is useful in comparing ongoing costs only, and will not help you determine the relative total costs of owning different funds. In addition, if these transaction costs were included, your costs would have been higher.
Annual Shareholder Report3
| Beginning
Account Value
4/1/2009 | Ending
Account Value
9/30/2009 | Expenses Paid
During Period1 |
| Actual: | | | |
| Class A Shares | $1,000 | $1,371.00 | $7.37 |
| Class C Shares | $1,000 | $1,373.00 | $11.84 |
Hypothetical (assuming a 5% return
before expenses): | | | |
| Class A Shares | $1,000 | $1,018.85 | $6.28 |
| Class C Shares | $1,000 | $1,015.09 | $10.05 |
| 1 | Expenses are equal to the Fund's annualized net expense ratios, multiplied by the average account value over the period, multiplied by 183/365 (to reflect the full half-year period). The annualized net expense ratios are as follows: |
| Class A Shares | 1.24% |
| Class C Shares | 1.99% |
Annual Shareholder Report4
Performance data quoted represents past performance which is no guarantee of future results. Investment return and principal value will fluctuate so that an investor's shares, when redeemed, may be worth more or less than their original cost. Mutual fund performance changes over time and current performance may be lower or higher than what is stated. For current to the most recent month-end performance and after-tax returns, visit FederatedInvestors.com or call 1-800-341-7400.
Management's Discussion of Fund
Performance (unaudited)
For the fiscal year ended September 30, 2009, the Federated Clover Mid Value Fund produced a return of -7.77% for Class A Shares and -7.98% for Class C Shares.1 Over the same period, the benchmark Russell Midcap® Value Index (RMV) returned - -7.12%.2 The Fund's total return for the fiscal year reflected actual cash flows, transaction costs and other expenses which were not reflected in the total return of the RMV.
The following discussion will focus on the performance of the Fund's
Class A Shares.
Market Overview
The first half of the Fund's fiscal year was characterized by extreme downside volatility related to the financial and housing industry crises. A deleveraging consumer, high unemployment, and concerns regarding the impact of the government's stimulus programs on the value of the dollar weighed heavily on investor sentiment. During this period, the broad market, as measured by the Standard & Poor's 500 Index (S&P 500),3 declined approximately 40%. The second half of the fiscal year was characterized by “less worse and, maybe, slightly better” economic reports which were labeled as “green shoots” by the press. Despite lingering economic woes, the ever-forward-looking stock market took its cue accordingly in anticipation of stabilization in the near future. Off the March lows, the broad market staged the largest rally in decades, with the S&P 500 recording an astonishing gain of nearly 60% as of the close on September 30, 2009.
| 1 | The Federated Clover Mid Value Fund is the successor to the Clover Capital Mid Cap Value Equity Common Fund, LLC pursuant to a reorganization that took place on March 13, 2009. The information presented above, for the periods prior to March 13, 2009, is historical information for Clover Capital Mid Cap Value Equity Common Fund, LLC. The fiscal year end of Clover Capital Mid Cap Value Equity Common Fund, LLC was December 31. |
| 2 | The RMV is an unmanaged index that measures the performance of the mid-cap value segment of the U.S. equity universe. It includes those Russell MidCap Index companies with lower price-to-book ratios and lower forecasted growth values. It is not possible to invest directly in an index. |
| 3 | The S&P 500 is an unmanaged capitalization-weighted index of 500 stocks designed to measure performance of the broad domestic economy through changes in the aggregate market value of 500 stocks representing all major industries. It is not possible to invest directly in an index. |
Annual Shareholder Report5
Fund PerformanceRelative to the RMV benchmark, the Fund benefited from outperformance in the Financial Services and Health Care sectors. Successful stock selection in these sectors was at the heart of the Fund's outperformance. Stocks such as Annaly Capital Management Inc. and PartnerRe Ltd. paced returns in the Financial Services sector, while Watson Pharmaceuticals and CIGNA Corp. drove returns in the Health Care sector. Negatively impacting relative performance during the reporting period were the Information Technology and Utilities sectors. Stocks such as Lexmark International Inc. and MEMC Electronic Materials Inc. performed poorly in Information Technology, while American Electric Power Co. Inc. and Entergy Corp. detracted from performance in the Utilities sector. The Fund was able to post positive returns in the Consumer Discretionary and Materials sectors, despite these sectors having declined in the benchmark for the reporting period. Individual stock selection was the primary driver of relative returns within most of the sectors.
POSITIONING AND STRATEGY
During the reporting period, many of the Fund's stock selections focused on companies with the financial strength to weather the difficult environment. The Fund's emphasis on companies with consistent cash flows and strong balance sheets is an integral part of the Adviser's investment process. Across various industries during the fiscal year, reductions in productive capacity presented opportunities for stronger companies to maintain or increase market share while weaker competitors struggled to survive.
Elevated volatility of stock prices during the reporting period, especially during the first half of the fiscal year, presented opportunities for the Fund to purchase companies whose long-term intrinsic value appeared to be grossly underestimated by the market. Fund management observed situations in which concerns regarding issues, such as bank nationalization, debt refinancing and declining consumer demand, created what management believed to be attractive opportunities in several securities. Fund management's disciplined approach to evaluating these situations resulted in purchases across multiple sectors within the portfolio.
The Fund concluded the fiscal year overweighted relative to the benchmark in Information Technology and Industrials, while being underweighted in Financial Services, Utilities and Materials. The Fund's over or underweights relative to its benchmark are driven not by economic forecasts but, rather, by the analysts' view of company-specific opportunities within each sector. While the Fund's managers remain cognizant of macroeconomic factors that may affect Fund performance, the investment approach focuses instead on bottom-up, fundamental analysis that seeks to construct a well-diversified, risk-controlled portfolio.
Annual Shareholder Report6
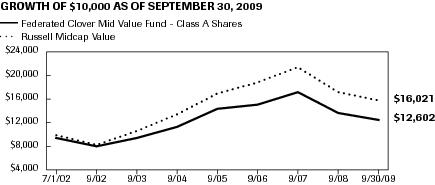
GROWTH OF A $10,000 INVESTMENT - CLASS A SHARES1The graph below illustrates the hypothetical investment of $10,0002 in the Federated Clover Mid Value Fund (the “Fund”) from July 1, 2002 (start of performance) to September 30, 2009, compared to the Russell Midcap Value Index (Russell Midcap Value).3
| Average Annual Total Returns4 for the Period Ended 9/30/2009 | |
| 1 Year | -7.77% |
| 5 Years | 0.87% |
| Start of performance (7/1/2002) | 3.24% |
Performance data quoted represents past performance which is no guarantee of future results. Investment return and principal value will fluctuate so that an investor's shares, when redeemed, may be worth more or less than their original cost. Mutual fund performance changes over time and current performance may be lower or higher than what is stated. For current to the most recent month-end performance and after-tax returns, visit FederatedInvestors.com or call 1-800-341-7400. Returns shown do not reflect the deduction of taxes that a shareholder would pay on Fund distributions or the redemption of Fund shares. Mutual funds are not obligations of or guaranteed by any bank and are not federally insured. Total returns shown include the maximum sales charge of 5.50%.
| 1 | The Federated Clover Mid Value Fund is the successor to the Clover Capital Mid Cap Value Equity Common Fund, LLC pursuant to a reorganization that took place on March 13, 2009. The information presented above, for the periods prior to March 13, 2009, is historical information for Clover Capital Mid Cap Value Equity Common Fund, LLC. The fiscal year end of Clover Capital Mid Cap Value Equity Common Fund, LLC was December 31. |
| 2 | Represents a hypothetical investment of $10,000 in the Fund after deducting the maximum sales charge of 5.50% ($10,000 investment minus $550 sales charges = $9,450). The Fund's performance assumes the reinvestment of all dividends and distributions. The Russell Midcap Value has been adjusted to reflect reinvestment of dividends on securities in the index. |
| 3 | The Russell Midcap Value is not adjusted to reflect sales charges, expenses or other fees that the Securities and Exchange Commission (SEC) requires to be reflected in the Fund's performance. The index is unmanaged, and unlike the Fund, is not affected by cash flows. It is not possible to invest directly in an index. |
| 4 | Total returns quoted reflect all applicable sales charges. |
Annual Shareholder Report7
GROWTH OF A $10,000 INVESTMENT - CLASS C SHARES1
The graph below illustrates the hypothetical investment of $10,0002 in the Federated Clover Mid Value Fund (the “Fund”) from July 1, 2002 (start of performance) to September 30, 2009, compared to the Russell Midcap Value Index (Russell Midcap Value).3
| Average Annual Total Returns4 for the Period Ended 9/30/2009 | |
| 1 Year | -7.98% |
| 5 Years | 1.37% |
| Start of performance (7/1/2002) | 3.35% |
Performance data quoted represents past performance which is no guarantee of future results. Investment return and principal value will fluctuate so that an investor's shares, when redeemed, may be worth more or less than their original cost. Mutual fund performance changes over time and current performance may be lower or higher than what is stated. For current to the most recent month-end performance and after-tax returns, visit FederatedInvestors.com or call 1-800-341-7400. Returns shown do not reflect the deduction of taxes that a shareholder would pay on Fund distributions or the redemption of Fund shares. Mutual funds are not obligations of or guaranteed by any bank and are not federally insured. Total returns shown include the contingent deferred sales charge as applicable.
| 1 | The Federated Clover Mid Value Fund is the successor to the Clover Capital Mid Cap Value Equity Common Fund, LLC pursuant to a reorganization that took place on March 13, 2009. The information presented above, for the periods prior to March 13, 2009, is historical information for Clover Capital Mid Cap Value Equity Common Fund, LLC. The fiscal year end of Clover Capital Mid Cap Value Equity Common Fund, LLC was December 31. |
| 2 | Represents a hypothetical investment of $10,000 in the Fund. A 1.00% contingent deferred sales charge would be applied on any redemption less than one year from the purchase date. The Fund's performance assumes the reinvestment of all dividends and distributions. The Russell Midcap Value has been adjusted to reflect reinvestment of dividends on securities in the index. |
| 3 | The Russell Midcap Value is not adjusted to reflect sales charges, expenses or other fees that the SEC requires to be reflected in the Fund's performance. The index is unmanaged, and unlike the Fund, is not affected by cash flows. It is not possible to invest directly in an index. |
| 4 | Total returns quoted reflect all applicable contingent deferred sales charges. |
Annual Shareholder Report8
Portfolio of Investments Summary
Table (unaudited)
At September 30, 2009 the Fund's sector composition1 was as follows:
| Sector Composition | | Percentage of
Total Net Assets |
| Financials | | 26.4% |
| Consumer Discretionary | | 12.1% |
| Industrials | | 11.7% |
| Utilities | | 9.7% |
| Information Technology | | 9.3% |
| Energy | | 9.2% |
| Materials | | 6.5% |
| Consumer Staples | | 5.8% |
| Health Care | | 5.1% |
| Telecommunication Services | | 2.7% |
| Other Securities2 | | 1.0% |
| Cash Equivalents3 | | 2.5% |
| Other Assets and Liabilities — Net4 | | (2.0)% |
| TOTAL | | 100.0% |
| 1 | Except for Other Securities, Cash Equivalents and Other Assets and Liabilities, sector classifications are based upon, and individual portfolio securities are assigned to, the classifications of the Global Industry Classification Standard (GICS) except that the adviser assigns a classification to securities not classified by the GICS and to securities for which the adviser does not have access to the classification made by the GICS. |
| 2 | Other Securities include an Exchange-Traded Mutual Fund. |
| 3 | Cash Equivalents include any investments in money market mutual funds and/or overnight repurchase agreements. |
| 4 | Assets, other than investments in securities, less liabilities. See Statement of Assets and Liabilities. |
Annual Shareholder Report9
Portfolio of Investments
September 30, 2009
|
| Shares | | | Value |
| | Common Stocks – 98.5% | |
| | Consumer Discretionary – 12.1% | |
| 1,950 | | CBS Corp. (New), Class B | 23,498 |
| 2,620 | 1 | Cabela's, Inc., Class A | 34,951 |
| 2,125 | | D.R. Horton, Inc. | 24,246 |
| 1,130 | 1 | Goodyear Tire & Rubber Co. | 19,244 |
| 1,600 | | Jarden Corp. | 44,912 |
| 1,010 | 1 | Liberty Media Corp. | 31,421 |
| 2,660 | 1 | Liberty Media Holding Corp. | 29,180 |
| 570 | 1 | Tractor Supply Co. | 27,599 |
| | TOTAL | 235,051 |
| | Consumer Staples – 5.8% | |
| 470 | | Bunge Ltd. | 29,426 |
| 800 | 1 | Dean Foods Co. | 14,232 |
| 1,840 | | Safeway Inc. | 36,285 |
| 2,850 | | Sara Lee Corp. | 31,749 |
| | TOTAL | 111,692 |
| | Energy – 9.2% | |
| 880 | | Cabot Oil & Gas Corp., Class A | 31,460 |
| 1,980 | 1 | Helix Energy Solutions Group, Inc. | 29,660 |
| 2,220 | 1 | Nabors Industries Ltd. | 46,398 |
| 610 | | Noble Energy, Inc. | 40,236 |
| 865 | | Pioneer Natural Resources, Inc. | 31,391 |
| | TOTAL | 179,145 |
| | Financials – 26.4% | |
| 1,105 | | Ameriprise Financial, Inc. | 40,145 |
| 2,120 | | Annaly Capital Management, Inc. | 38,457 |
| 800 | 1 | Arch Capital Group Ltd. | 54,032 |
| 620 | | Assurant, Inc. | 19,877 |
| 530 | | Boston Properties, Inc. | 34,741 |
| 560 | | Federal Realty Investment Trust | 34,367 |
| 2,345 | | Hudson City Bancorp, Inc. | 30,837 |
| 3,365 | | KeyCorp | 21,873 |
| 1,320 | | Legg Mason, Inc. | 40,960 |
| 890 | | Lincoln National Corp. | 23,060 |
| 510 | | PartnerRe Ltd. | 39,239 |
Annual Shareholder Report10
|
| 760 | | Principal Financial Group | 20,816 |
| 830 | | Reinsurance Group of America | 37,018 |
| 1,300 | | SunTrust Banks, Inc. | 29,315 |
| 490 | | Transatlantic Holdings, Inc. | 24,583 |
| 1,400 | | XL Capital Ltd., Class A | 24,444 |
| | TOTAL | 513,764 |
| | Health Care – 5.1% | |
| 680 | | CIGNA Corp. | 19,101 |
| 590 | 1 | Inverness Medical Innovations, Inc. | 22,851 |
| 440 | | McKesson HBOC, Inc. | 26,202 |
| 1,960 | 1 | Mylan Laboratories, Inc. | 31,379 |
| | TOTAL | 99,533 |
| | Industrials – 11.7% | |
| 1,170 | 1 | AGCO Corp. | 32,327 |
| 465 | | Dover Corp. | 18,023 |
| 270 | | Flowserve Corp. | 26,606 |
| 530 | | ITT Corp. | 27,639 |
| 490 | | SPX Corp. | 30,022 |
| 1,470 | 1 | Thomas & Betts Corp. | 44,218 |
| 490 | 1 | URS Corp. | 21,389 |
| 930 | 1 | WESCO International, Inc. | 26,784 |
| | TOTAL | 227,008 |
| | Information Technology – 9.3% | |
| 1,050 | 1 | Agilent Technologies, Inc. | 29,222 |
| 850 | 1 | Hewitt Associates, Inc. | 30,965 |
| 1,530 | 1 | MEMC Electronic Materials, Inc. | 25,444 |
| 1,260 | 1 | NetApp, Inc. | 33,617 |
| 925 | 1 | Western Digital Corp. | 33,790 |
| 3,500 | | Xerox Corp. | 27,090 |
| | TOTAL | 180,128 |
| | Materials – 6.5% | |
| 1,200 | | Cabot Corp. | 27,732 |
| 810 | 1 | Intrepid Potash, Inc. | 19,108 |
| 1,185 | | MeadWestvaco Corp. | 26,437 |
| 555 | | PPG Industries, Inc. | 32,307 |
| 780 | | Sonoco Products Co. | 21,481 |
| | TOTAL | 127,065 |
Annual Shareholder Report11
|
| | Telecommunication Services – 2.7% | |
| 637 | | CenturyTel, Inc. | 21,403 |
| 965 | 1 | Crown Castle International Corp. | 30,263 |
| | TOTAL | 51,666 |
| | Utilities – 9.7% | |
| 1,090 | | Atmos Energy Corp. | 30,716 |
| 520 | | National Fuel Gas Co. | 23,821 |
| 1,025 | | PG&E Corp. | 41,503 |
| 795 | | Progress Energy, Inc. | 31,053 |
| 610 | | Sempra Energy | 30,384 |
| 1,605 | | Xcel Energy, Inc. | 30,880 |
| | TOTAL | 188,357 |
| | TOTAL COMMON STOCKS
(IDENTIFIED COST $1,577,709) | 1,913,409 |
| | EXCHANGE-TRADED MUTUAL FUND – 1.0% | |
| 550 | | iShares Russell Midcap Value Index Fund
(IDENTIFIED COST $19,357) | 19,481 |
| | Mutual Fund – 2.5% | |
| 48,753 | 2,3 | Prime Value Obligations Fund, Institutional Shares, 0.30%
(AT NET ASSET VALUE) | 48,753 |
| | TOTAL INVESTMENTS — 102.0%
(IDENTIFIED COST $1,645,819)4 | 1,981,643 |
| | OTHER ASSETS AND LIABILITIES - NET — (2.0)%5 | (38,635) |
| | TOTAL NET ASSETS — 100% | $1,943,008 |
| 1 | Non-income producing security. |
| 2 | Affiliated company. |
| 3 | 7-Day net yield. |
| 4 | The cost of investments for federal tax purposes amounts to $1,645,870. |
| 5 | Assets, other than investments in securities, less liabilities. See Statement of Assets and Liabilities. |
- Note: The categories of investments are shown as a percentage of total net assets at September 30, 2009.
- Various inputs are used in determining the value of the Fund's investments. These inputs are summarized in the three broad levels listed below:
- Level 1 — quoted prices in active markets for identical securities
- Level 2 — other significant observable inputs (including quoted prices for similar securities, interest rates, prepayment speeds, credit risk, etc.)
- Level 3 — significant unobservable inputs (including the Fund's own assumptions in determining the fair value of investments)
- The inputs or methodology used for valuing securities are not an indication of the risk associated with investing in those securities.
Annual Shareholder Report12
- The following is a summary of the inputs used, as of September 30, 2009, in valuing the Fund's assets carried at fair value:
| Valuation Inputs | | | | |
| Level 1 -
Quoted
Prices and
Investments in
Mutual Funds | Level 2 -
Other
Significant
Observable
Inputs | Level 3 -
Significant
Unobservable
Inputs | Total |
| Equity Securities: | | | | |
| Domestic | $1,749,296 | $ — | $ — | $1,749,296 |
| International | 164,113 | — | — | 164,113 |
| Exchange-Traded Mutual Fund | 19,481 | — | — | 19,481 |
| Mutual Fund | 48,753 | — | — | 48,753 |
| TOTAL SECURITIES | $1,981,643 | $ — | $ — | $1,981,643 |
- See Notes which are an integral part of the Financial Statements
Annual Shareholder Report13
Statement of Assets and Liabilities
September 30, 2009
| Assets: | | |
| Total investments in securities, at value including $48,753 of investments in an affiliated issuer (Note 5) (identified cost $1,645,819) | | $1,981,643 |
| Cash | | 37,000 |
| Income receivable | | 4,596 |
| Receivable for investments sold | | 51,657 |
| Receivable for shares sold | | 1,910 |
| TOTAL ASSETS | | 2,076,806 |
| Liabilities: | | |
| Payable for investments purchased | $84,747 | |
| Payable for auditing fees | 26,000 | |
| Payable for portfolio accounting fees | 11,100 | |
| Payable for share registration costs | 5,486 | |
| Payable for shareholder services fee (Note 5) | 50 | |
| Accrued expenses | 6,415 | |
| TOTAL LIABILITIES | | 133,798 |
| Net assets for 143,515 shares outstanding | | $1,943,008 |
| Net Assets Consist of: | | |
| Paid-in capital | | $1,513,284 |
| Net unrealized appreciation of investments | | 335,824 |
| Accumulated net realized gain on investments | | 93,350 |
| Undistributed net investment income | | 550 |
| TOTAL NET ASSETS | | $1,943,008 |
| Net Asset Value, Offering Price and Redemption Proceeds Per Share | | |
| Class A Shares: | | |
| Net asset value per share ($249,360 ÷ 18,435 shares outstanding), no par value, unlimited shares authorized | | $13.53 |
| Offering price per share (100/94.50 of $13.53) | | $14.32 |
| Redemption proceeds per share | | $13.53 |
| Class C Shares: | | |
| Net asset value per share ($7,125.18 ÷ 526.136 shares outstanding), no par value, unlimited shares authorized | | $13.54 |
| Offering price per share | | $13.54 |
| Redemption proceeds per share (99.00/100 of $13.54) | | $13.40 |
| Institutional Shares: | | |
| Net asset value per share ($1,686,523 ÷ 124,554 shares outstanding), no par value, unlimited shares authorized | | $13.54 |
| Offering price per share | | $13.54 |
| Redemption proceeds per share | | $13.54 |
- See Notes which are an integral part of the Financial Statements
Annual Shareholder Report14
Statement of Operations
Period Ended September 30, 20091
| Investment Income: | | | |
| Dividends (including $174 received from an affiliated issuer (Note 5)) | | | $17,687 |
| Expenses: | | | |
| Investment adviser fee (Note 5) | | $5,103 | |
| Administrative personnel and services fee (Note 5) | | 125,398 | |
| Custodian fees | | 3,920 | |
| Transfer and dividend disbursing agent fees and expenses | | 10,800 | |
| Auditing fees | | 26,000 | |
| Legal fees | | 2,544 | |
| Portfolio accounting fees | | 36,256 | |
| Distribution services fee — Class C Shares (Note 5) | | 1 | |
| Shareholder services fee — Class A Shares (Note 5) | | 142 | |
| Share registration costs | | 62,951 | |
| Printing and postage | | 14,890 | |
| Miscellaneous | | 3,190 | |
| TOTAL EXPENSES | | 291,195 | |
| Waivers and Reimbursements (Note 5): | | | |
| Waiver/reimbursement of investment adviser fee | $(5,103) | | |
| Waiver of administrative personnel and services fee | (24,528) | | |
| Reimbursement of other operating expenses | (254,653) | | |
| TOTAL WAIVERS AND REIMBURSEMENTS | | (284,284) | |
| Net expenses | | | 6,911 |
| Net investment income | | | 10,776 |
| Realized and Unrealized Gain on Investments: | | | |
| Net realized gain on investments | | | 93,350 |
| Net change in unrealized appreciation of investments | | | 335,824 |
| Net realized and unrealized gain on investments | | | 429,174 |
| Change in net assets resulting from operations | | | $439,950 |
| 1 | Reflects operations for the period March 16, 2009 (date of initial investment) to September 30, 2009. |
- See Notes which are an integral part of the Financial Statements
Annual Shareholder Report15
Statement of Changes in Net Assets
| Period Ended September 30 | 20091 |
| Increase (Decrease) in Net Assets | |
| Operations: | |
| Net investment income | $10,776 |
| Net realized gain on investments | 93,350 |
| Net change in unrealized appreciation of investments | 335,824 |
| CHANGE IN NET ASSETS RESULTING FROM OPERATIONS | 439,950 |
| Distributions to Shareholders: | |
| Distributions from net investment income | |
| Class A Shares | (823) |
| Class C Shares | (1) |
| Institutional Shares | (9,402) |
| CHANGE IN NET ASSETS RESULTING FROM DISTRIBUTIONS TO SHAREHOLDERS | (10,226) |
| Share Transactions: | |
| Proceeds from sale of shares | 1,516,832 |
| Net asset value of shares issued to shareholders in payment of distributions declared | 8,567 |
| Cost of shares redeemed | (12,115) |
| CHANGE IN NET ASSETS RESULTING FROM SHARE TRANSACTIONS | 1,513,284 |
| Change in net assets | 1,943,008 |
| Net Assets: | |
| Beginning of period | — |
| End of period (including undistributed net investment income of $550) | $1,943,008 |
| 1 | Reflects operations for the period from March 16, 2009 (date of initial investment) to September 30, 2009. |
- See Notes which are an integral part of the Financial Statements
Annual Shareholder Report16
Notes to Financial Statements
September 30, 2009
1. Organizaton
Federated Equity Funds (the “Trust”) is registered under the Investment Company Act of 1940, as amended (the “Act”), as an open-end management investment company. The Trust consists of 13 portfolios. The financial statements included herein are only those of Federated Clover Mid Value Fund (the “Fund”), a diversified portfolio. The financial statements of the other portfolios are presented separately. The assets of each portfolio are segregated and a shareholder's interest is limited to the portfolio in which shares are held. Each portfolio pays its own expenses. The Fund offers three classes of shares: Class A Shares, Class C Shares and Institutional Shares. All shares of the Fund have equal rights with respect to voting, except on class-specific matters. The financial highlights of the Institutional Shares are presented separately. The investment objective of the Fund is to seek capital appreciation.
2. SIGNIFICANT ACCOUNTING POLICIES
The following is a summary of significant accounting policies consistently followed by the Fund in the preparation of its financial statements. These policies are in conformity with U.S. generally accepted accounting principles (GAAP).
Investment Valuation
In calculating its net asset value (NAV), the Fund generally values investments as follows:
- Equity securities listed on an exchange or traded through a regulated market system are valued at their last reported sale price or official closing price in their principal exchange or market.
- Fixed-income securities acquired with remaining maturities greater than 60 days are fair valued using price evaluations provided by a pricing service approved by the Board of Trustees (the “Trustees”).
- Fixed-income securities acquired with remaining maturities of 60 days or less are valued at their cost (adjusted for the accretion of any discount or amortization of any premium).
- Shares of other mutual funds are valued based upon their reported NAVs.
- Derivative contracts listed on exchanges are valued at their reported settlement or closing price.
- Over-the-counter (OTC) derivative contracts are fair valued using price evaluations provided by a pricing service approved by the Trustees.
If the Fund cannot obtain a price or price evaluation from a pricing service for an investment, the Fund may attempt to value the investment based upon the mean of bid and asked quotations or fair value the investment based on price evaluations, from one or more dealers. If any price, quotation, price evaluation or other pricing source is not readily available when the NAV is calculated, the Fund uses the fair value of the investment determined in accordance with the procedures described below. There can be no assurance that the Fund could purchase or sell an investment at the price used to calculate the Fund's NAV.
Fair Valuation and Significant Events Procedures
The Trustees have authorized the use of pricing services to provide evaluations of the current fair value of certain investments for purposes of calculating the NAV. Factors considered by pricing services in evaluating an investment include the yields or prices of investments of comparable quality, coupon, maturity, call rights and other potential prepayments, terms and type, reported transactions, indications as to values from dealers and general market Annual Shareholder Report17
conditions. Some pricing services provide a single price evaluation reflecting the bid-side of the market for an investment (a “bid” evaluation). Other pricing services offer both bid evaluations and price evaluations indicative of a price between the prices bid and asked for the investment (a “mid” evaluation). The Fund normally uses bid evaluations for U.S. Treasury and Agency securities, mortgage-backed securities and municipal securities. The Fund normally uses mid evaluations for other types of fixed-income securities and OTC derivative contracts. In the event that market quotations and price evaluations are not available for an investment, the fair value of the investment is determined in accordance with procedures adopted by the Trustees.The Trustees also have adopted procedures requiring an investment to be priced at its fair value whenever the Adviser determines that a significant event affecting the value of the investment has occurred between the time as of which the price of the investment would otherwise be determined and the time as of which the NAV is computed. An event is considered significant if there is both an affirmative expectation that the investment's value will change in response to the event and a reasonable basis for quantifying the resulting change in value. Examples of significant events that may occur after the close of the principal market on which a security is traded, or after the time of a price evaluation provided by a pricing service or a dealer, include:
- With respect to securities traded in foreign markets, significant trends in U.S. equity markets or in the trading of foreign securities index futures or options contracts;
- With respect to price evaluations of fixed-income securities determined before the close of regular trading on the NYSE, actions by the Federal Reserve Open Market Committee and other significant trends in U.S. fixed-income markets;
- Political or other developments affecting the economy or markets in which an issuer conducts its operations or its securities are traded; and
- Announcements concerning matters such as acquisitions, recapitalizations, litigation developments, a natural disaster affecting the issuer's operations or regulatory changes or market developments affecting the issuer's industry.
The Trustees have approved the use of a pricing service to determine the fair value of equity securities traded principally in foreign markets when the Adviser determines that there has been a significant trend in the U.S. equity markets or in index futures trading. For other significant events, the Fund may seek to obtain more current quotations or price evaluations from alternative pricing sources. If a reliable alternative pricing source is not available, the Fund will determine the fair value of the investment using another method approved by the Trustees.
Investment Income, Gains and Losses, Expenses and Distributions
Investment transactions are accounted for on a trade-date basis. Realized gains and losses from investment transactions are recorded on an identified-cost basis. Interest income and expenses are accrued daily. Dividend income and distributions to shareholders are recorded on the ex-dividend date. Foreign dividends are recorded on the ex-dividend date or when the Fund is informed of the ex-dividend date. Distributions of net investment income are declared and paid quarterly. Non-cash dividends included in dividend income, if any, are recorded at fair value. Investment income, realized and unrealized gains and losses, and certain fund-level expenses are allocated to each class based on relative average daily net assets, except that each class may bear certain expenses unique to that class such as distribution services and shareholder services fees. Dividends are declared separately for each class. No class has preferential dividend rights; differences in per share dividend rates are generally due to differences in separate class expenses.
Annual Shareholder Report18
Premium and Discount AmortizationAll premiums and discounts on fixed-income securities are amortized/accreted for financial statement purposes.
Federal Taxes
It is the Fund's policy to comply with the Subchapter M provision of the Internal Revenue Code (the “Code”) and to distribute to shareholders each year substantially all of its income. Accordingly, no provision for federal income tax is necessary. As of and during the period ended September 30, 2009, the Fund did not have a liability for any uncertain tax positions. The Fund recognizes interest and penalties, if any, related to tax liabilities as income tax expense in the Statement of Operations. As of September 30, 2009, tax year 2009 remains subject to examination by the Fund's major tax jurisdictions, which include the United States of America and the Commonwealth of Massachusetts.
When-Issued and Delayed Delivery Transactions
The Fund may engage in when-issued or delayed delivery transactions. The Fund records when-issued securities on the trade date and maintains security positions such that sufficient liquid assets will be available to make payment for the securities purchased. Securities purchased on a when-issued or delayed delivery basis are marked to market daily and begin earning interest on the settlement date. Losses may occur on these transactions due to changes in market conditions or the failure of counterparties to perform under the contract.
Other
The preparation of financial statements in conformity with GAAP requires management to make estimates and assumptions that affect the amounts of assets, liabilities, expenses and revenues reported in the financial statements. Actual results could differ from those estimated.
3. SHARES OF BENEFICIAL INTEREST
The following tables summarize share activity:
| Period Ended September 30 | 20091 |
| Class A Shares: | Shares | Amount |
| Shares sold | 19,391 | $228,696 |
| Shares issued to shareholders in payment of distributions declared | 66 | 822 |
| Shares redeemed | (1,022) | (11,915) |
| NET CHANGE RESULTING FROM CLASS A SHARE TRANSACTIONS | 18,435 | $217,603 |
| Period Ended September 30 | 20091 |
| Class C Shares: | Shares | Amount |
| Shares sold | 536 | $7,200 |
| Shares redeemed | (10) | (100) |
| NET CHANGE RESULTING FROM CLASS C SHARE TRANSACTIONS | 526 | $7,100 |
Annual Shareholder Report19
| Period Ended September 30 | 20091 |
| Institutional Shares: | Shares | Amount |
| Shares sold | 123,906 | $1,280,936 |
| Shares issued to shareholders in payment of distributions declared | 658 | 7,745 |
| Shares redeemed | (10) | (100) |
| NET CHANGE RESULTING FROM INSTITUTIONAL SHARE TRANSACTIONS | 124,554 | $1,288,581 |
| NET CHANGE RESULTING FROM FUND SHARE TRANSACTIONS | 143,515 | $1,513,284 |
| 1 | Reflects operations for the period from March 16, 2009 (date of initial investment) to September 30, 2009. |
4. FEDERAL TAX INFORMATION
The tax character of distributions as reported on the Statement of Changes in Net Assets for the period ended September 30, 2009, was as follows:
| 2009 |
| Ordinary income | $10,226 |
As of September 30, 2009, the components of distributable earnings on a tax basis were as follows:
| Undistributed ordinary income1 | $65,012 |
| Undistributed long-term capital gain | $28,939 |
| Net unrealized appreciation | $335,773 |
| 1 | For tax purposes, short-term capital gain distributions are considered ordinary income distributions. |
The difference between book-basis and tax-basis net unrealized appreciation/depreciation is attributable to differing treatments for the deferral of losses on wash sales.
At September 30, 2009, the cost of investments for federal tax purposes was $1,645,870. The net unrealized appreciation of investments for federal tax purposes was $335,773. This consists of net unrealized appreciation from investments for those securities having an excess of value over cost of $356,848 and net unrealized depreciation from investments for those securities having an excess of cost over value of $21,075.
5. INVESTMENT ADVISER FEE AND OTHER TRANSACTIONS
WITH AFFILIATES
Investment Adviser Fee
Federated Global Investment Management Corporation is the Fund's investment adviser (the “Adviser”). The advisory agreement between the Fund and the Adviser provides for an annual fee equal to 0.75% of the Fund's average daily net assets. Subject to the terms described in the Expense Limitation note, the Adviser may voluntarily choose to waive any portion of its fee and/or reimburse certain operating expenses of the Fund. The Adviser can modify or terminate this voluntary waiver and/or reimbursement at any time at its sole discretion. For the period ended September 30, 2009, the Adviser voluntarily waived $5,074 of its fee and voluntarily reimbursed $254,653 of other operating expenses.
Annual Shareholder Report20
Administrative FeeFederated Administrative Services (FAS), under the Administrative Services Agreement, provides the Fund with administrative personnel and services. The fee paid to FAS is based on the average aggregate daily net assets of certain Federated funds as specified below:
| Administrative Fee | Average Aggregate Daily Net Assets
of the Federated Funds |
| 0.150% | on the first $5 billion |
| 0.125% | on the next $5 billion |
| 0.100% | on the next $10 billion |
| 0.075% | on assets in excess of $20 billion |
The administrative fee received during any fiscal year shall be at least $150,000 per portfolio and $40,000 per each additional class of Shares. Subject to the terms described in the Expense Limitation note, FAS may voluntarily choose to waive any portion of its fee. FAS can modify or terminate this voluntary waiver at any time at its sole discretion. For the period ended September 30, 2009, FAS waived $24,528 of its fee. The net fee paid to FAS was 14.826% of average daily net assets of the Fund. The Fund is currently being charged the minimum administrative fee; therefore the fee as a percentage of average daily net assets is greater than the amounts presented in the chart above.
Distribution Services Fee
The Fund has adopted a Distribution Plan (the “Plan”) pursuant to Rule 12b-1 under the Act. Under the terms of the Plan, the Fund will compensate Federated Securities Corp. (FSC), the principal distributor, from the daily net assets of the Fund's Class A Shares and Class C Shares to finance activities intended to result in the sale of these shares. The Plan provides that the Fund may incur distribution expenses at the following percentages of average daily net assets annually, to compensate FSC:
| Share Class Name | Percentage of Average Daily
Net Assets of Class |
| Class A Shares | 0.05% |
| Class C Shares | 0.75% |
Subject to the terms described in the Expense Limitation note, FSC may voluntarily choose to waive any portion of its fee. FSC can modify or terminate this voluntary waiver at any time at its sole discretion. When FSC receives fees, it may pay some or all of them to financial intermediaries whose customers purchase shares. For the period ended September 30, 2009, the Fund's Class A Shares did not incur a distribution services fee; however it may begin to begin to incur this fee upon approval of the Trustees.
Sales Charges
Front-end sales charges and contingent deferred sales charges do not represent expenses of the Fund. They are deducted from the proceeds of sales of Fund shares prior to investment or from redemption proceeds prior to remittance, as applicable. For the period ended September 30, 2009, FSC retained $657 in sales charges from the sale of Class A Shares.
Annual Shareholder Report21
Shareholder Services FeeThe Fund may pay fees (Service Fees) up to 0.25% of the average daily net assets of the Fund's Class A Shares and Class C Shares to financial intermediaries or to Federated Shareholder Services Company (FSSC) for providing services to shareholders and maintaining shareholder accounts. Subject to the terms described in the Expense Limitation note, FSSC may voluntarily reimburse the Fund for shareholder services fees. This voluntary reimbursement can be modified or terminated at any time.
Expense Limitation
The Adviser and its affiliates (which may include FSC, FAS and FSSC) have voluntarily agreed to waive their fees and/or reimburse expenses so that the total operating expenses (as shown in the financial highlights) paid by the Fund's Institutional Shares, Class A Shares and Class C Shares (after the voluntary waivers and reimbursements) will not exceed 0.99%, 1.24% and 1.99%, respectively, through the later of (the “Termination Date”): (a) November 30, 2010 or (b) the date of the Fund's next effective Prospectus. While the Adviser and its affiliates currently do not anticipate terminating these arrangements prior to the Termination Date, these arrangements may only be terminated prior to the Termination Date with the agreement of the Fund's Board of Trustees.
General
Certain Officers and Trustees of the Fund are Officers and Directors or Trustees of the above companies.
Transactions with Affiliated Companies
Affiliated holdings are mutual funds which are managed by the Adviser or an affiliate of the Adviser. The Adviser has agreed to reimburse the Fund for certain investment adviser fees as a result of transactions in other affiliated mutual funds. For the period ended September 30, 2009, the Adviser reimbursed $29. Transactions with the affiliated company during the period ended September 30, 2009 were as follows:
| Affiliate | Balance of
Shares Held
3/16/2009 | Purchases/
Additions | Sales/
Reductions | Balance of
Shares Held
9/30/2009 | Value | Dividend
Income |
| Prime Value Obligations Fund, Institutional Shares | — | 1,169,703 | 1,120,950 | 48,753 | $48,753 | $174 |
6. Investment TRANSACTIONS
Purchases and sales of investments, excluding long-term U.S. government securities and short-term obligations, for the period ended September 30, 2009, were as follows:
| Purchases | $1,553,288 |
| Sales | $690,284 |
Annual Shareholder Report22
7. LINE OF CREDIT
The Fund participates in a $100,000,000 unsecured, uncommitted revolving line of credit (LOC) agreement with PNC Bank. The LOC was made available for extraordinary or emergency purposes, primarily for financing redemption payments. Borrowings are charged interest at a rate offered to the Fund by PNC Bank at the time of the borrowing. As of September 30, 2009, there were no outstanding loans. During the period ended September 30, 2009, the Fund did not utilize the LOC.
8. INTERFUND LENDING
Pursuant to an Exemptive Order issued by the Securities and Exchange Commission (SEC), the Fund, along with other funds advised by subsidiaries of Federated Investors, Inc., may participate in an interfund lending program. This program provides an alternative credit facility allowing the funds to borrow from other participating affiliated funds. As of September 30, 2009, there were no outstanding loans. During the period ended September 30, 2009, the program was not utilized.
9. Legal Proceedings
Since October 2003, Federated Investors, Inc. and related entities (collectively, “Federated”) and various Federated funds (Federated Funds) have been named as defendants in several class action lawsuits now pending in the United States District Court for the District of Maryland. The lawsuits were purportedly filed on behalf of people who purchased, owned and/or redeemed shares of Federated-sponsored mutual funds during specified periods beginning November 1, 1998. The suits are generally similar in alleging that Federated engaged in illegal and improper trading practices including market timing and late trading in concert with certain institutional traders, which allegedly caused financial injury to the mutual fund shareholders. These lawsuits began to be filed shortly after Federated's first public announcement that it had received requests for information on shareholder trading activities in the Federated Funds from the SEC, the Office of the New York State Attorney General (NYAG) and other authorities. In that regard, on November 28, 2005, Federated announced that it had reached final settlements with the SEC and the NYAG with respect to those matters. As Federated previously reported in 2004, it has already paid approximately $8.0 million to certain funds as determined by an independent consultant. As part of these settlements, Federated agreed to pay for the benefit of fund shareholders additional disgorgement and a civil money penalty in the aggregate amount of an additional $72 million. Federated entities have also been named as defendants in several additional lawsuits that are now pending in the United States District Court for the Western District of Pennsylvania, alleging, among other things, excessive advisory and Rule 12b-1 fees. The Board of the Federated Funds retained the law firm of Dickstein Shapiro LLP to represent the Federated Funds in these lawsuits. Federated and the Federated Funds, and their respective counsel have been defending this litigation, and none of the Federated Funds remains a defendant in any of the lawsuits (though some could potentially receive any recoveries as nominal defendants). Additional lawsuits based upon similar allegations may be filed in the future. The potential impact of these lawsuits, all of which seek unquantified damages, attorneys' fees and expenses, and future potential similar suits is uncertain. Although we do not believe that these lawsuits will have a material adverse effect on the Federated Funds, there can be no assurance that these suits, the ongoing adverse publicity and/or other developments resulting from the regulatory investigations will not result in increased Federated Fund redemptions, reduced sales of Federated Fund shares or other adverse consequences for the Federated Funds.
Annual Shareholder Report23
10. Subsequent eventsManagement has evaluated subsequent events through November 24, 2009, the date the financial statements were issued, and determined that no events have occurred that require additional disclosure.
11. FEDERAL TAX INFORMATION (UNAUDITED)
For the fiscal period ended September 30, 2009, 100.0% of total ordinary income distributions paid by the Fund are qualifying dividends which may be subject to a maximum tax rate of 15%, as provided for by the Jobs and Growth Tax Relief Act of 2003. Complete information is reported in conjunction with the reporting of your distributions on Form 1099-DIV.
Of the ordinary income distributions made by the Fund during the period ended September 30, 2009, 100.0% qualify for the dividend received deduction available to corporate shareholders.
Annual Shareholder Report24
Report of Independent Registered Public Accounting Firm
TO THE BOARD OF TRUSTEES OF THE FEDERATED EQUITY FUNDS AND SHAREHOLDERS OF Federated Clover MID Value Fund:
We have audited the accompanying statement of assets and liabilities, including the portfolio of investments, of the Federated Clover Mid Value Fund (the “Fund”), a portfolio of Federated Equity Funds, as of September 30, 2009, and the related statement of operations, the statements of changes in net assets, and the financial highlights for the period from March 16, 2009 (date of initial investment) to September 30, 2009. These financial statements and financial highlights are the responsibility of the Fund's management. Our responsibility is to express an opinion on these financial statements and financial highlights based on our audit.
We conducted our audit in accordance with the standards of the Public Company Accounting Oversight Board (United States). Those standards require that we plan and perform the audit to obtain reasonable assurance about whether the financial statements and financial highlights are free of material misstatement. An audit includes examining, on a test basis, evidence supporting the amounts and disclosures in the financial statements. Our procedures included confirmation of securities owned as of September 30, 2009 by correspondence with the custodian and brokers or by other appropriate auditing procedures. An audit also includes assessing the accounting principles used and significant estimates made by management, as well as evaluating the overall financial statement presentation. We believe that our audit provides a reasonable basis for our opinion.
In our opinion, the financial statements and financial highlights referred to above present fairly, in all material respects, the financial position of the Federated Clover Mid Value Fund as of September 30, 2009, and the results of its operations, the changes in its net assets, and the financial highlights for the period from March 16, 2009 (date of initial investment) to September 30, 2009, in conformity with U.S. generally accepted accounting principles.
Boston, Massachusetts
November 24, 2009
Annual Shareholder Report25
Board of Trustees and Trust Officers
The Board is responsible for managing the Trust's business affairs and for exercising all the Trust's powers except those reserved for the shareholders. The following tables give information about each Board member and the senior officers of the Fund. Where required, the tables separately list Board members who are “interested persons” of the Fund (i.e., “Interested” Board members) and those who are not (i.e., “Independent” Board members). Unless otherwise noted, the address of each person listed is Federated Investors Tower, 1001 Liberty Avenue, Pittsburgh, PA 15222. The address of all Independent Board members listed is 4000 Ericsson Drive, Warrendale, PA 15086-7561; Attention: Mutual Fund Board. As of December 31, 2008, the Trust comprised ten portfolios, and the Federated Fund Complex consisted of 40 investment companies (comprising 149 portfolios). Unless otherwise noted, each Officer is elected annually. Unless otherwise noted, each Board member oversees all portfolios in the Federated Fund Complex and serves for an indefinite term. The Fund's Statement of Additional Information includes additional information about Trust Trustees and is available, without charge and upon request, by calling 1-800-341-7400.
Interested TRUSTEES Background
Name
Birth Date
Positions Held with Trust
Date Service Began | Principal Occupation(s) for Past Five Years,
Other Directorships Held and Previous Position(s) |
John F. Donahue*
Birth Date: July 28, 1924
TRUSTEE
Began serving: April 1984 | Principal Occupations: Director or Trustee of the Federated Fund Complex; Chairman and Director, Federated Investors, Inc.; Chairman of the Federated Fund Complex's Executive Committee.
Previous Positions: Chairman of the Federated Fund Complex; Trustee, Federated Investment Management Company; Chairman and Director, Federated Investment Counseling. |
J. Christopher Donahue*
Birth Date: April 11, 1949
PRESIDENT AND TRUSTEE
Began serving: January 2000 | Principal Occupations: Principal Executive Officer and President of the Federated Fund Complex; Director or Trustee of some of the Funds in the Federated Fund Complex; President, Chief Executive Officer and Director, Federated Investors, Inc.; Chairman and Trustee, Federated Investment Management Company; Trustee, Federated Investment Counseling; Chairman and Director, Federated Global Investment Management Corp.; Chairman, Federated Equity Management Company of Pennsylvania and Passport Research, Ltd. (investment advisory subsidiary of Federated); Trustee, Federated Shareholder Services Company; Director, Federated Services Company.
Previous Positions: President, Federated Investment Counseling; President and Chief Executive Officer, Federated Investment Management Company, Federated Global Investment Management Corp. and Passport Research, Ltd. |
| * | Family relationships and reasons for “interested” status: John F. Donahue is the father of J. Christopher Donahue; both are “interested” due to their beneficial ownership of shares of Federated Investors, Inc. and the positions they hold with Federated and its subsidiaries. |
Annual Shareholder Report26
INDEPENDENT TRUSTEES Background
Name
Birth Date
Positions Held with Trust
Date Service Began | Principal Occupation(s) for Past Five Years,
Other Directorships Held and Previous Position(s) |
John T. Conroy, Jr., Ph.D.
Birth Date: June 23, 1937
TRUSTEE
Began serving: November 1991 | Principal Occupations: Director or Trustee of the Federated Fund Complex; Chairman of the Board, Investment Properties Corporation; Partner or Trustee in private real estate ventures in Southwest Florida; Assistant Professor in Theology at Barry University and Blessed Edmund Rice School for Pastoral Ministry.
Previous Positions: President, Investment Properties Corporation; Senior Vice President, John R. Wood and Associates, Inc., Realtors; President, Naples Property Management, Inc. and Northgate Village Development Corporation. |
Nicholas P. Constantakis
Birth Date: September 3, 1939
TRUSTEE
Began serving: February 1998 | Principal Occupation: Director or Trustee of the Federated Fund Complex.
Other Directorships Held: Director and Chairman of the Audit Committee, Michael Baker Corporation (architecture, engineering and construction services).
Previous Position: Partner, Andersen Worldwide SC. |
John F. Cunningham
Birth Date: March 5, 1943
TRUSTEE
Began serving: January 1999 | Principal Occupation: Director or Trustee of the Federated Fund Complex.
Other Directorships Held: Chairman, President and Chief Executive Officer, Cunningham & Co., Inc. (strategic business consulting); Trustee Associate, Boston College.
Previous Positions: Director, Redgate Communications and EMC Corporation (computer storage systems); Chairman of the Board and Chief Executive Officer, Computer Consoles, Inc.; President and Chief Operating Officer, Wang Laboratories; Director, First National Bank of Boston; Director, Apollo Computer, Inc. |
Maureen Lally-Green
Birth Date: July 5, 1949
TRUSTEE
Began serving: August 2009 | Principal Occupations: Director or Trustee of the Federated Fund Complex; Director, Office of Church Relations, Diocese of Pittsburgh; Adjunct Professor of Law, Duquesne University School of Law.
Other Directorships Held: Director, Auberle; Trustee St. Francis University; Director, Ireland Institute of Pittsburgh; Director, UPMC Mercy Hospital; Regent, St. Vincent Seminary; Director, Epilepsy Foundation of Western and Central Pennsylvania; Director, Saint Thomas More Society, Allegheny County; Director, Carlow University.
Previous Position: Pennsylvania Superior Court Judge. |
Annual Shareholder Report27
Name
Birth Date
Positions Held with Trust
Date Service Began | Principal Occupation(s) for Past Five Years,
Other Directorships Held and Previous Position(s) |
Peter E. Madden
Birth Date: March 16, 1942
TRUSTEE
Began serving: November 1991 | Principal Occupation: Director or Trustee and Chairman of the Board of the Federated Fund Complex.
Other Directorship Held: Board of Overseers, Babson College.
Previous Positions: Representative, Commonwealth of Massachusetts General Court; President, Chief Operating Officer and Director, State Street Bank and Trust Company and State Street Corporation (retired); Director, VISA USA and VISA International; Chairman and Director, Massachusetts Bankers Association; Director, Depository Trust Corporation; Director, The Boston Stock Exchange. |
Charles F. Mansfield, Jr.
Birth Date: April 10, 1945
TRUSTEE
Began serving: January 1999 | Principal Occupations: Director or Trustee and Chairman of the Audit Committee of the Federated Fund Complex; Management Consultant.
Previous Positions: Chief Executive Officer, PBTC International Bank; Partner, Arthur Young & Company (now Ernst & Young LLP); Chief Financial Officer of Retail Banking Sector, Chase Manhattan Bank; Senior Vice President, HSBC Bank USA (formerly, Marine Midland Bank); Vice President, Citibank; Assistant Professor of Banking and Finance, Frank G. Zarb School of Business, Hofstra University; Executive Vice President DVC Group, Inc. (marketing, communications and technology). |
R. James Nicholson
Birth Date: February 4, 1938
TRUSTEE
Began serving: November 2007 | Principal Occupations: Director or Trustee of the Federated Fund Complex; Senior Counsel, Brownstein Hyatt Farber Schrek, P.C.; Former Secretary of the U.S. Dept. of Veterans Affairs; Former U.S. Ambassador to the Holy See; Former Chairman of the Republican National Committee.
Other Directorships Held: Director, Horatio Alger Association; Director, The Daniels Fund.
Previous Positions: Colonel, U.S. Army Reserve; Partner, Calkins, Kramer, Grimshaw and Harring, P.C.; General Counsel, Colorado Association of Housing and Building; Chairman and CEO, Nicholson Enterprises, Inc. (real estate holding company); Chairman and CEO, Renaissance Homes of Colorado. |
Thomas M. O'Neill
Birth Date: June 14, 1951
TRUSTEE
Began serving: October 2006 | Principal Occupations: Director or Trustee of the Federated Fund Complex; Managing Director and Partner, Navigator Management Company, L.P. (investment and strategic consulting).
Other Directorships Held: Board of Overseers, Children's Hospital of Boston; Visiting Committee on Athletics, Harvard College.
Previous Positions: Chief Executive Officer and President, Managing Director and Chief Investment Officer, Fleet Investment Advisors; President and Chief Executive Officer, Aeltus Investment Management, Inc.; General Partner, Hellman, Jordan Management Co., Boston, MA; Chief Investment Officer, The Putnam Companies, Boston, MA; Credit Analyst and Lending Officer, Fleet Bank; Director and Consultant, EZE Castle Software (investment order management software); Director, Midway Pacific (lumber). |
Annual Shareholder Report28
Name
Birth Date
Positions Held with Trust
Date Service Began | Principal Occupation(s) for Past Five Years,
Other Directorships Held and Previous Position(s) |
John S. Walsh
Birth Date: November 28, 1957
TRUSTEE
Began serving: January 1999 | Principal Occupations: Director or Trustee of the Federated Fund Complex; President and Director, Heat Wagon, Inc. (manufacturer of construction temporary heaters); President and Director, Manufacturers Products, Inc. (distributor of portable construction heaters); President, Portable Heater Parts, a division of Manufacturers Products, Inc.
Previous Position: Vice President, Walsh & Kelly, Inc. |
James F. Will
Birth Date: October 12, 1938
TRUSTEE
Began serving: April 2006 | Principal Occupations: Director or Trustee of the Federated Fund Complex; formerly, Vice Chancellor and President, Saint Vincent College.
Other Directorships Held: Trustee, Saint Vincent College; Alleghany Corporation.
Previous Positions: Chairman, President and Chief Executive Officer, Armco, Inc.; President and Chief Executive Officer, Cyclops Industries; President and Chief Operating Officer, Kaiser Steel Corporation. |
OFFICERS
Name
Birth Date
Address
Positions Held with Trust
Date Service Began | Principal Occupation(s) for Past Five Years
and Previous Position(s) |
John W. McGonigle
Birth Date: October 26, 1938
EXECUTIVE VICE PRESIDENT AND SECRETARY
Began serving: April 1984 | Principal Occupations: Executive Vice President and Secretary of the Federated Fund Complex; Vice Chairman, Executive Vice President, Secretary and Director, Federated Investors, Inc.
Previous Positions: Trustee, Federated Investment Management Company and Federated Investment Counseling; Director, Federated Global Investment Management Corp., Federated Services Company and Federated Securities Corp. |
Richard A. Novak
Birth Date: December 25, 1963
TREASURER
Began serving: January 2006 | Principal Occupations: Principal Financial Officer and Treasurer of the Federated Fund Complex; Senior Vice President, Federated Administrative Services; Financial and Operations Principal for Federated Securities Corp., Edgewood Services, Inc. and Southpointe Distribution Services, Inc.
Previous Positions: Controller of Federated Investors, Inc.; Vice President, Finance of Federated Services Company; held various financial management positions within The Mercy Hospital of Pittsburgh; Auditor, Arthur Andersen & Co. |
Brian P. Bouda
Birth Date: February 28, 1947
CHIEF COMPLIANCE OFFICER AND SENIOR VICE PRESIDENT
Began serving: August 2004 | Principal Occupations: Senior Vice President and Chief Compliance Officer of the Federated Fund Complex; Vice President and Chief Compliance Officer of Federated Investors, Inc. and Chief Compliance Officer of its subsidiaries. Mr. Bouda joined Federated in 1999 and is a member of the American Bar Association and the State Bar Association of Wisconsin. |
Annual Shareholder Report29
Name
Birth Date
Address
Positions Held with Trust
Date Service Began | Principal Occupation(s) for Past Five Years
and Previous Position(s) |
Stephen F. Auth
Birth Date: September 3, 1956
450 Lexington Avenue
Suite 3700
New York, NY 10017-3943
CHIEF INVESTMENT OFFICER
Began serving: November 2002 | Principal Occupations: Mr. Auth is Chief Investment Officer of this Fund and various other Funds in the Federated Fund Complex; Executive Vice President, Federated Investment Counseling, Federated Global Investment Management Corp. and Federated Equity Management Company of Pennsylvania.
Previous Positions: Executive Vice President, Federated Investment Management Company, and Passport Research, Ltd. (investment advisory subsidiary of Federated); Senior Vice President, Global Portfolio Management Services Division; Senior Vice President, Federated Investment Management Company and Passport Research, Ltd.; Senior Managing Director and Portfolio Manager, Prudential Investments. |
Lawrence Auriana
Birth Date: January 8, 1944
140 East 45th Street
New York, NY 10017
VICE PRESIDENT
Began serving: November 2001 | Principal Occupations: Lawrence Auriana is Vice President of the Trust. Mr. Auriana joined Federated in April 2001 as Co-Head of Investments/Federated Kaufmann. From August 1984 to April 2001, Mr. Auriana was President and Treasurer of Edgemont Asset Management Corp., and Chairman of the Board and Portfolio Manager to The Kaufmann Fund, Inc. (predecessor to the Federated Kaufmann Fund). Mr. Auriana earned a B.S. in economics from Fordham University and has been engaged in the securities business since 1965. |
Walter C. Bean
Birth Date: June 22, 1945
VICE PRESIDENT
Began serving: November 2006 | Principal Occupations: Walter C. Bean is Vice President of the Trust. Mr. Bean is a Senior Vice President, Senior Portfolio Manager and Director of Investments for Managed Accounts. Mr. Bean joined Federated in 2000. Mr. Bean is responsible for the investment process for the managed accounts portfolios. His previous associations included: Chief Investment Officer and Portfolio Manager at C.S. McKee & Company; various investment management and research positions with First Chicago Investment Advisors, CIGNA Investment Advisors and Mellon Bank. Mr. Bean is a Chartered Financial Analyst. Mr. Bean earned a Bachelors Degree in Business Administration from Ohio University and an M.B.A. from Pennsylvania State University. Mr. Bean has 38 years of investment experience. |
Hans P. Utsch
Birth Date: July 3, 1936
140 East 45th Street
New York, NY 10017
VICE PRESIDENT
Began serving: November 2001 | Principal Occupations: Hans P. Utsch is Vice President of the Trust. Mr. Utsch joined Federated in April 2001 as Co-Head of Investments/Federated Kaufmann. From August 1984 to April 2001, Mr. Utsch was Chairman of the Board and Secretary of Edgemont Asset Management Corp., and President and Portfolio Manager to The Kaufmann Fund, Inc. (predecessor to the Federated Kaufmann Fund). Mr. Utsch graduated from Amherst College and holds an M.B.A. from Columbia University. He has been engaged in the securities business since 1962. |
Richard B. Fisher
Birth Date: May 17, 1923
VICE PRESIDENT
Began serving: April 1984 | Principal Occupations: Vice Chairman or Vice President of some of the Funds in the Federated Fund Complex; Vice Chairman, Federated Investors, Inc.; Chairman, Federated Securities Corp.
Previous Positions: President and Director or Trustee of some of the Funds in the Federated Fund Complex; Executive Vice President, Federated Investors, Inc.; Director and Chief Executive Officer, Federated Securities Corp. |
Annual Shareholder Report30
Evaluation and Approval of Advisory
Contract - May 2009
Federated Clover Mid Value Fund (the “Fund”)
The Fund's Board reviewed the Fund's investment advisory contract at meetings held in May 2009. Because the Fund did not yet have a meaningful operating history, the Board's decision to approve the contract reflects the exercise of its business judgment on whether to authorize the continued offering of this new investment vehicle, as originally proposed by, and based on information previously requested by the Board and provided by the Federated organization, and based on Federated's recommendation to go forward with the Fund.
Federated proposed the creation of the Fund in connection with its acquisition of certain assets of Clover Capital Management, Inc. (“Clover Capital”), the investment adviser to the Clover Capital Mid Cap Value Equity Common Fund (the “Predecessor Fund”), a privately offered pooled fund (the “Acquisition”). As part of the transaction, Federated proposed that the Predecessor Fund be reorganized with and into the Fund in a tax-free asset transfer which would provide shareholders of the Predecessor Fund the opportunity to become shareholders of a registered mutual fund with similar investment objectives and policies and the same key management personnel as the Predecessor Fund, but with sales, distribution and other fund and shareholder services provided by the same affiliates of Federated that provide such services to the other Federated funds. The Fund was declared effective on January 21, 2009, and the reorganization of the Predecessor Fund with and into the Fund was consummated after the close of business on March 13, 2009. The Fund commenced operations on March 16, 2009. Accordingly, the Board's deliberations at its May 2009 meetings were based to a significant degree on the information considered by the Board when it originally approved the contract at its November 2008 meetings.
The Federated funds' Board had previously appointed a Senior Officer, whose duties include specified responsibilities relating to the process by which advisory fees are to be charged to a Federated Fund. The Senior Officer has the authority to retain consultants, experts, or staff as may be reasonably necessary to assist in the performance of his duties, reports directly to the Board, and may be terminated only with the approval of a majority of the independent members of the Board. The Senior Officer prepared and furnished to the Board an independent, written evaluation that covered topics discussed below. The Board considered that evaluation, along with other information, in deciding to approve the proposed advisory contract.
The Board also considered the anticipated compensation and benefits to be received by the Adviser. This includes fees to be received for services provided to the Fund by other entities in the Federated organization and research services that may be received by the Adviser from brokers that execute fund trades, as well as advisory fees. The Board is also familiar with and considered judicial Annual Shareholder Report31
decisions concerning allegedly excessive investment advisory fees, which have indicated that the following factors may be relevant to an Adviser's fiduciary duty with respect to its receipt of compensation from a fund: the nature and quality of the services provided by the Adviser, including the performance of the Fund; the Adviser's cost of providing the services; the extent to which the Adviser may realize “economies of scale” as the Fund grows larger; any indirect benefits that may accrue to the Adviser and its affiliates as a result of the Adviser's relationship with the Fund; performance and expenses of comparable funds; and the extent to which the independent Board members are fully informed about all facts the Board deems relevant bearing on the Adviser's services and fees. The Board further considered management fees (including any components thereof) charged to institutional and other clients of the Adviser for what might be viewed as like services, and the cost to the Adviser and its affiliates of supplying services pursuant to the management fee agreements, excluding any intra-corporate profit and profit margins of the Adviser and its affiliates for supplying such services. The Board was aware of these factors and was guided by them in its review of the Fund's advisory contract to the extent it considered them to be appropriate and relevant, as discussed further below. The Board considered and weighed these circumstances in light of its substantial accumulated experience in working with Federated on matters relating to other Federated funds, and was assisted in its deliberations by independent legal counsel. The Board's consideration of the proposed advisory contract included review of the Senior Officer's evaluation, accompanying data and additional reports covering such matters as: the Adviser's investment philosophy, revenue, profitability, personnel and processes; investment and operating strategies; the Fund's investment objectives; the Fund's anticipated expenses (including the proposed advisory fee itself and the overall estimated expense structure of the Fund, both in absolute terms and relative to similar and/or competing funds, with due regard for contractual or voluntary expense limitations); and the nature, quality and extent of the advisory and other services to be provided to the Fund by the Adviser and its affiliates. The Board also considered the likely preferences and expectations of anticipated Fund shareholders and their relative sophistication; the continuing state of competition in the mutual fund industry and market practices; the range of comparable fees for similar funds in the mutual fund industry; the Fund's relationship to the Federated family of funds which include a comprehensive array of funds with different investment objectives, policies and strategies which are available for exchange without the incurrence of additional sales charges; compliance and audit reports concerning the Federated funds and the Federated companies that service them (including communications from regulatory agencies), as well as Federated's responses to any issues raised therein; and relevant developments in the mutual fund industry and how the Federated funds Annual Shareholder Report32
and/or Federated are responding to them. The Board's evaluation process is evolutionary. The criteria considered and the emphasis placed on relevant criteria change in recognition of changing circumstances in the mutual fund marketplace.With respect to the Fund's expenses in particular, the Board has found the use of comparisons to other mutual funds with comparable investment programs to be particularly useful, given the high degree of competition in the mutual fund business. The Board focused on comparisons with other similar mutual funds more heavily than non-mutual fund products or services because it is believed that they are more relevant. For example, other mutual funds are the products most like the Fund, they are readily available to Fund shareholders as alternative investment vehicles, and they are the type of investment vehicle in fact chosen and maintained by the Fund's anticipated investors. The range of their fees and expenses therefore appears to be a generally reliable indication of what consumers have found to be reasonable in the precise marketplace in which the Fund will compete. In this regard, the Senior Officer also reviewed Federated's fees for providing advisory services to products outside the Federated family of funds (e.g., institutional and separate accounts). He concluded that mutual funds and institutional accounts are inherently different products. Those differences included, but are not limited to, different types of targeted investors; being subject to different laws and regulations; different legal structures; different average account sizes; different associated costs; different portfolio management techniques made necessary by different cash flows; and portfolio manager time spent in review of securities pricing. The Senior Officer did not consider these fee schedules to be determinative in judging the appropriateness of mutual fund advisory contracts.
The Senior Officer reviewed information compiled by Federated, using data supplied by independent fund ranking organizations, regarding the fees charged by other mutual funds, noting his view that comparisons to fund peer groups are highly important in judging the reasonableness of proposed fees.
The Senior Officer's report produced in connection with the original approval of the advisory contract for the Fund in November 2008, noted that Clover Capital, as manager of the Predecessor Fund, direct accounts, a model portfolio and separate managed accounts, generated consistent and strong performance using substantially the same investment strategy to be utilized by the Fund. Because the Fund will employ the same key management personnel and investment strategy as the Predecessor Fund, the nature and quality of the management of the Fund is expected to reflect that of the Predecessor Fund. This in turn assisted the Board in reaching a conclusion that the nature, extent and quality of the Adviser's investment management services were such as to warrant the approval of the advisory contract.
Annual Shareholder Report33
The Board reviewed the proposed fees and other expenses of the Fund and was satisfied that the proposed overall expense structure of the Fund appeared to be appropriate. In this regard, the Senior Officer's report indicated that the proposed management fees, after projected waivers, were reasonable. The Board also concluded that the nature, quality and scope of other services to be provided to the Fund were reasonable.The Board also considered possible indirect benefits that may accrue to the Adviser and its affiliates as a result of the Acquisition. Other indirect benefits that may accrue to the Adviser and its affiliates as a result of the Adviser's relationship with the Fund are essentially impossible to apply before the Fund has experienced any meaningful operating history. Nevertheless, in connection with the Board's governance of other Federated funds, it should be noted that the Board regularly receives financial information about Federated, including reports on the compensation and benefits Federated derives from its relationships with the other Federated funds. These reports cover not only the fees under the advisory contracts, but also fees received by Federated's subsidiaries for providing other services to the Federated funds under separate contracts (e.g., for serving as the Federated funds' administrator). The reports also discuss any indirect benefit Federated may derive from its receipt of research services from brokers who execute Federated fund trades. In addition, the Board considered the fact that, in order for a fund to be competitive in the marketplace, Federated and its affiliates frequently waive fees and/or reimburse expenses and have disclosed to fund investors and/or indicated to the Board their intention to do so in the future, where appropriate.
The Senior Officer commented on reports furnished by Federated of estimates of components of the Fund's expenses using allocation methodologies specified by the Senior Officer and sales projections made by Federated. The Senior Officer noted that, although they may apply consistent allocation processes, the inherent difficulties in allocating costs (and the unavoidable arbitrary aspects of that exercise), particularly when projecting an uncertain asset base, and the lack of consensus on how to allocate those costs may render such allocation reports unreliable. The Senior Officer determined that such allocation reports were of limited use.
The Board and the Senior Officer also reviewed data compiled by Federated comparing profitability information for Federated to other publicly held fund management companies. In this regard, the Senior Officer noted the limited availability of such information, but nonetheless concluded that Federated's profit margins did not appear to be excessive and the Board agreed.
The Senior Officer's evaluation also discussed the notion of possible realization of “economies of scale” as a fund grows larger. The Board considered in this regard that the Adviser has made significant and long-term investments in areas that support all of the Federated funds, such as personnel and processes for the portfolio management, compliance, and risk management functions; and systems technology; and that the benefits of these efforts (as well as any Annual Shareholder Report34
economies, should they exist) were likely to be enjoyed by the fund complex as a whole. Finally, the Board also noted the absence of any applicable regulatory or industry guidelines on this subject, which (as discussed in the Senior Officer's evaluation) is compounded by the lack of any common industry practice or general pattern with respect to structuring fund advisory fees with “breakpoints” that serve to reduce the fee as the fund attains a certain size. The Senior Officer did not recommend institution of breakpoints in pricing Federated's proposed advisory services to the Fund at this time.The Board based its decision to approve the proposed advisory contract on the totality of the circumstances and relevant factors, and with a view to past and future long-term considerations. As noted, not all of the factors and considerations identified above were necessarily relevant to the Fund, nor did the Board consider any one of them to be determinative. With respect to the factors that are relevant, the Board's decision to approve the contract reflects its determination that, based upon the information previously requested and supplied, Federated's proposal to establish and manage the Fund, and its past performance and actions in providing services to other mutual funds (which the Board has found to be satisfactory with respect to such other funds), provide a satisfactory basis to support the business decision to continue the existing arrangements.
Annual Shareholder Report35
Voting Proxies on Fund Portfolio SecuritiesA description of the policies and procedures that the Fund uses to determine how to vote proxies, if any, relating to securities held in the Fund's portfolio is available, without charge and upon request, by calling 1-800-341-7400. A report on “Form N-PX” of how the Fund voted any such proxies during the most recent 12-month period ended June 30 is available from Federated's Web site at FederatedInvestors.com. To access this information from the “Products” section of the Web site, click on the “Prospectuses and Regulatory Reports” link under “Related Information,” then select the appropriate link opposite the name of the Fund; or select the name of the Fund and from the Fund's page, click on the “Prospectuses and Regulatory Reports” link. Form N-PX filings are also available at the SEC's Web site at www.sec.gov.
Quarterly Portfolio Schedule
The Fund files with the SEC a complete schedule of its portfolio holdings, as of the close of the first and third quarters of its fiscal year, on “Form N-Q.” These filings are available on the SEC's Web site at www.sec.gov and may be reviewed and copied at the SEC's Public Reference Room in Washington, DC. (Call 1-800-SEC-0330 for information on the operation of the Public Reference Room.) You may also access this information from the “Products” section of Federated's Web site at FederatedInvestors.com by clicking on “Portfolio Holdings” under “Related Information,” then selecting the appropriate link opposite the name of the Fund; or select the name of the Fund and from the Fund's page, click on the “Portfolio Holdings” link.
Annual Shareholder Report36
Mutual funds are not bank deposits or obligations, are not guaranteed by any bank and are not insured or guaranteed by the U.S. government, the Federal Deposit Insurance Corporation, the Federal Reserve Board or any other government agency. Investment in mutual funds involves investment risk, including the possible loss of principal.
This Report is authorized for distribution to prospective investors only when preceded or accompanied by the Fund's Prospectus, which contains facts concerning its objective and policies, management fees, expenses and other information.
Federated Clover Mid Value Fund
Federated Investors Funds
4000 Ericsson Drive
Warrendale, PA 15086-7561
Contact us at FederatedInvestors.com
or call 1-800-341-7400.
Federated Securities Corp., Distributor
Cusip 314172321
Cusip 314172313
41196 (11/09)
Federated is a registered mark of Federated Investors, Inc.
2009 Federated Investors, Inc.
Federated Clover Mid Value Fund
A Portfolio of Federated Equity Funds
ANNUAL SHAREHOLDER REPORTSeptember 30, 2009
Institutional Shares
FINANCIAL HIGHLIGHTS
SHAREHOLDER EXPENSE EXAMPLE
MANAGEMENT'S DISCUSSION OF FUND PERFORMANCE
PORTFOLIO OF INVESTMENTS SUMMARY TABLE
PORTFOLIO OF INVESTMENTS
STATEMENT OF ASSETS AND LIABILITIES
STATEMENT OF OPERATIONS
STATEMENT OF CHANGES IN NET ASSETS
NOTES TO FINANCIAL STATEMENTS
REPORT OF INDEPENDENT REGISTERED PUBLIC ACCOUNTING FIRM
BOARD OF TRUSTEES AND TRUST OFFICERS
EVALUATION AND APPROVAL OF ADVISORY CONTRACT
VOTING PROXIES ON FUND PORTFOLIO SECURITIES
QUARTERLY PORTFOLIO SCHEDULE
Financial Highlights - Institutional Shares
(For a Share Outstanding Throughout the Period)
| Period Ended September 30 | 20091 |
| Net Asset Value, Beginning of Period | $9.37 |
| Income From Investment Operations: | |
| Net investment income | 0.10 |
| Net realized and unrealized gain on investments | 4.16 |
| TOTAL FROM INVESTMENT OPERATIONS | 4.26 |
| Less Distributions: | |
| Distributions from net investment income | (0.09) |
| Net Asset Value, End of Period | $13.54 |
| Total Return2 | 45.63% |
| Ratios to Average Net Assets: | |
| Net expenses | 0.99%3 |
| Net investment income | 1.61%3 |
| Expense waiver/reimbursement4 | 42.31%3 |
| Supplemental Data: | |
| Net assets, end of period (000 omitted) | $1,687 |
| Portfolio turnover | 53% |
| 1 | Reflects operations for the period from March 16, 2009 (date of initial investment) to September 30, 2009. |
| 2 | Based on net asset value, which does not reflect the sales charge, redemption fee or contingent deferred sales charge, if applicable. Total returns for periods of less than one year are not annualized. |
| 3 | Computed on an annualized basis. |
| 4 | This expense decrease is reflected in both the net expense and the net investment income ratios shown above. |
- See Notes which are an integral part of the Financial Statements
Annual Shareholder Report1
Shareholder Expense Example (unaudited)
As a shareholder of the Fund, you incur ongoing costs, including management fees and to the extent applicable, distribution (12b-1) fees and/or shareholder services fees and other Fund expenses. This Example is intended to help you to understand your ongoing costs (in dollars) of investing in the Fund and to compare these costs with the ongoing costs of investing in other mutual funds. It is based on an investment of $1,000 invested at the beginning of the period and held for the entire period from April 1, 2009 to September 30, 2009.
ACTUAL EXPENSES
The first section of the table below provides information about actual account values and actual expenses. You may use the information in this section, together with the amount you invested, to estimate the expenses that you incurred over the period. Simply divide your account value by $1,000 (for example, an $8,600 account value divided by $1,000 = 8.6), then multiply the result by the number in the first section under the heading entitled “Expenses Paid During Period” to estimate the expenses attributable to your investment during this period.
HYPOTHETICAL EXAMPLE FOR COMPARISON PURPOSES
The second section of the table below provides information about hypothetical account values and hypothetical expenses based on the Fund's actual expense ratio and an assumed rate of return of 5% per year before expenses, which is not the Fund's actual return. Thus, you should not use the hypothetical account values and expenses to estimate the actual ending account balance or your expenses for the period. Rather, these figures are required to be provided to enable you to compare the ongoing costs of investing in the Fund with other funds. To do so, compare this 5% hypothetical example with the 5% hypothetical examples that appear in the shareholder reports of the other funds.
Annual Shareholder Report2
Please note that the expenses shown in the table are meant to highlight your ongoing costs only. Therefore, the second section of the table is useful in comparing ongoing costs only, and will not help you determine the relative total costs of owning different funds. | Beginning
Account Value
4/1/2009 | Ending
Account Value
9/30/2009 | Expenses Paid
During Period1 |
| Actual | $1,000 | $1,373.00 | $5.89 |
Hypothetical (assuming a 5% return
before expenses) | $1,000 | $1,020.10 | $5.01 |
| 1 | Expenses are equal to the Fund's annualized net expense ratio of 0.99%, multiplied by the average account value over the period, multiplied by 183/365 (to reflect the full half-year period). |
Annual Shareholder Report3
Performance data quoted represents past performance which is no guarantee of future results. Investment return and principal value will fluctuate so that an investor's shares, when redeemed, may be worth more or less than their original cost. Mutual fund performance changes over time and current performance may be lower or higher than what is stated. For current to the most recent month-end performance and after-tax returns, visit FederatedInvestors.com or call 1-800-341-7400.
Management's Discussion of Fund
Performance (unaudited)
For the fiscal year ended September 30, 2009, the Federated Clover Mid Value Fund Institutional Shares produced a total return, based on net asset value, of -7.52%.1 Over the same period, the benchmark Russell Midcap® Value Index (RMV) returned -7.12%.2 The Fund's total return for the fiscal year reflected actual cash flows, transaction costs and other expenses which were not reflected in the total return of the RMV.
Market Overview
The first half of the Fund's fiscal year was characterized by extreme downside volatility related to the financial and housing industry crises. A deleveraging consumer, high unemployment and concerns regarding the impact of the government's stimulus programs on the value of the dollar weighed heavily on investor sentiment. During this period, the broad market, as measured by the Standard & Poor's 500 Index (S&P 500),3 declined approximately 40%. The second half of the fiscal year was characterized by “less worse and, maybe, slightly better” economic reports which were labeled as “green shoots” by the press. Despite lingering economic woes, the ever-forward-looking stock market took its cue accordingly in anticipation of stabilization in the near future. Off the March lows, the broad market staged the largest rally in decades, with the S&P 500 recording an astonishing gain of nearly 60% as of the close on September 30, 2009.
| 1 | The Federated Clover Mid Value Fund is the successor to the Clover Capital Mid Cap Value Equity Common Fund, LLC pursuant to a reorganization that took place on March 13, 2009. The information presented above, for the periods prior to March 13, 2009, is historical information for Clover Capital Mid Cap Value Equity Common Fund, LLC. The fiscal year end of Clover Capital Mid Cap Value Equity Common Fund, LLC was December 31. |
| 2 | The RMV is an unmanaged index that measures the performance of the mid-cap value segment of the U.S. equity universe. It includes those Russell MidCap Index companies with lower price-to-book ratios and lower forecasted growth values. It is not possible to invest directly in an index. |
| 3 | The S&P 500 is an unmanaged capitalization-weighted index of 500 stocks designed to measure performance of the broad domestic economy through changes in the aggregate market value of 500 stocks representing all major industries. It is not possible to invest directly in an index. |
Annual Shareholder Report4
FUND PERFORMANCERelative to the RMV benchmark, the Fund benefited from outperformance in the Financial Services and Health Care sectors. Successful stock selection in these sectors was at the heart of the Fund's outperformance. Stocks such as Annaly Capital Management Inc. and PartnerRe Ltd. paced returns in the Financial Services sector, while Watson Pharmaceuticals and CIGNA Corp. drove returns in the Health Care sector. Negatively impacting relative performance during the reporting period were the Information Technology and Utilities sectors. Stocks such as Lexmark International Inc. and MEMC Electronic Materials Inc. performed poorly in Information Technology, while American Electric Power Co. Inc. and Entergy Corp. detracted from performance in the Utilities sector. The Fund was able to post positive returns in the Consumer Discretionary and Materials sectors, despite these sectors having declined in the benchmark for the reporting period. Individual stock selection was the primary driver of relative returns within most of the sectors.
POSITIONING AND STRATEGY
During the reporting period, many of the Fund's stock selections focused on companies with the financial strength to weather the difficult environment. The Fund's emphasis on companies with consistent cash flows and strong balance sheets is an integral part of the Adviser's investment process. Across various industries during the fiscal year, reductions in productive capacity presented opportunities for stronger companies to maintain or increase market share while weaker competitors struggled to survive.
Elevated volatility of stock prices during the reporting period, especially during the first half of the fiscal year, presented opportunities for the Fund to purchase companies whose long-term intrinsic value appeared to be grossly underestimated by the market. Fund management observed situations in which concerns regarding issues, such as bank nationalization, debt refinancing and declining consumer demand, created what management believed to be attractive opportunities in several securities. Fund management's disciplined approach to evaluating these situations resulted in purchases across multiple sectors within the portfolio.
The Fund concluded the fiscal year overweighted relative to the benchmark in Information Technology and Industrials, while being underweighted in Financial Services, Utilities and Materials. The Fund's over or underweights relative to its benchmark are driven not by economic forecasts but, rather, by the analysts' view of company-specific opportunities within each sector. While the Fund's managers remain cognizant of macroeconomic factors that may affect Fund performance, the investment approach focuses instead on bottom-up, fundamental analysis that seeks to construct a well-diversified, risk-controlled portfolio.
Annual Shareholder Report5
GROWTH OF A $10,000 INVESTMENT - Institutional Shares1The graph below illustrates the hypothetical investment of $10,0002 in the Federated Clover Mid Value Fund (the “Fund”) from July 1, 2002 (start of performance) to September 30, 2009, compared to the Russell Midcap Value Index (Russell Midcap Value).3
| Average Annual Total Returns for the Period Ended 9/30/2009 | |
| 1 Year | -7.52% |
| 5 Years | 2.28% |
| Start of performance (7/1/2002) | 4.31% |
Performance data quoted represents past performance which is no guarantee of future results. Investment return and principal value will fluctuate so that an investor's shares, when redeemed, may be worth more or less than their original cost. Mutual fund performance changes over time and current performance may be lower or higher than what is stated. For current to the most recent month-end performance and after-tax returns, visit FederatedInvestors.com or call 1-800-341-7400. Returns shown do not reflect the deduction of taxes that a shareholder would pay on Fund distributions or the redemption of Fund shares. Mutual funds are not obligations of or guaranteed by any bank and are not federally insured.
| 1 | The Federated Clover Mid Value Fund is the successor to the Clover Capital Mid Cap Value Equity Common Fund, LLC pursuant to a reorganization that took place on March 13, 2009. The information presented above, for the periods prior to March 13, 2009, is historical information for Clover Capital Mid Cap Value Equity Common Fund, LLC. The fiscal year end of Clover Capital Mid Cap Value Equity Common Fund, LLC was December 31. |
| 2 | The Fund's performance assumes the reinvestment of all dividends and distributions. The Russell Midcap Value has been adjusted to reflect reinvestment of dividends on securities in the index. |
| 3 | The Russell Midcap Value is not adjusted to reflect sales charges, expenses or other fees that the Securities and Exchange Commission requires to be reflected in the Fund's performance. The index is unmanaged, and unlike the Fund, is not affected by cash flows. It is not possible to invest directly in an index. |
Annual Shareholder Report6
Portfolio of Investments Summary
Table (unaudited)
At September 30, 2009 the Fund's sector composition1 was as follows:
| Sector Composition | | Percentage of
Total Net Assets |
| Financials | | 26.4% |
| Consumer Discretionary | | 12.1% |
| Industrials | | 11.7% |
| Utilities | | 9.7% |
| Information Technology | | 9.3% |
| Energy | | 9.2% |
| Materials | | 6.5% |
| Consumer Staples | | 5.8% |
| Health Care | | 5.1% |
| Telecommunication Services | | 2.7% |
| Other Securities2 | | 1.0% |
| Cash Equivalents3 | | 2.5% |
| Other Assets and Liabilities — Net4 | | (2.0)% |
| TOTAL | | 100.0% |
| 1 | Except for Other Securities, Cash Equivalents and Other Assets and Liabilities, sector classifications are based upon, and individual portfolio securities are assigned to, the classifications of the Global Industry Classification Standard (GICS) except that the adviser assigns a classification to securities not classified by the GICS and to securities for which the adviser does not have access to the classification made by the GICS. |
| 2 | Other Securities include an Exchange-Traded Mutual Fund. |
| 3 | Cash Equivalents include any investments in money market mutual funds and/or overnight repurchase agreements. |
| 4 | Assets, other than investments in securities, less liabilities. See Statement of Assets and Liabilities. |
Annual Shareholder Report7
Portfolio of Investments
September 30, 2009
|
| Shares | | | Value |
| | Common Stocks – 98.5% | |
| | Consumer Discretionary – 12.1% | |
| 1,950 | | CBS Corp. (New), Class B | 23,498 |
| 2,620 | 1 | Cabela's, Inc., Class A | 34,951 |
| 2,125 | | D.R. Horton, Inc. | 24,246 |
| 1,130 | 1 | Goodyear Tire & Rubber Co. | 19,244 |
| 1,600 | | Jarden Corp. | 44,912 |
| 1,010 | 1 | Liberty Media Corp. | 31,421 |
| 2,660 | 1 | Liberty Media Holding Corp. | 29,180 |
| 570 | 1 | Tractor Supply Co. | 27,599 |
| | TOTAL | 235,051 |
| | Consumer Staples – 5.8% | |
| 470 | | Bunge Ltd. | 29,426 |
| 800 | 1 | Dean Foods Co. | 14,232 |
| 1,840 | | Safeway Inc. | 36,285 |
| 2,850 | | Sara Lee Corp. | 31,749 |
| | TOTAL | 111,692 |
| | Energy – 9.2% | |
| 880 | | Cabot Oil & Gas Corp., Class A | 31,460 |
| 1,980 | 1 | Helix Energy Solutions Group, Inc. | 29,660 |
| 2,220 | 1 | Nabors Industries Ltd. | 46,398 |
| 610 | | Noble Energy, Inc. | 40,236 |
| 865 | | Pioneer Natural Resources, Inc. | 31,391 |
| | TOTAL | 179,145 |
| | Financials – 26.4% | |
| 1,105 | | Ameriprise Financial, Inc. | 40,145 |
| 2,120 | | Annaly Capital Management, Inc. | 38,457 |
| 800 | 1 | Arch Capital Group Ltd. | 54,032 |
| 620 | | Assurant, Inc. | 19,877 |
| 530 | | Boston Properties, Inc. | 34,741 |
| 560 | | Federal Realty Investment Trust | 34,367 |
| 2,345 | | Hudson City Bancorp, Inc. | 30,837 |
| 3,365 | | KeyCorp | 21,873 |
| 1,320 | | Legg Mason, Inc. | 40,960 |
| 890 | | Lincoln National Corp. | 23,060 |
| 510 | | PartnerRe Ltd. | 39,239 |
Annual Shareholder Report8
|
| 760 | | Principal Financial Group | 20,816 |
| 830 | | Reinsurance Group of America | 37,018 |
| 1,300 | | SunTrust Banks, Inc. | 29,315 |
| 490 | | Transatlantic Holdings, Inc. | 24,583 |
| 1,400 | | XL Capital Ltd., Class A | 24,444 |
| | TOTAL | 513,764 |
| | Health Care – 5.1% | |
| 680 | | CIGNA Corp. | 19,101 |
| 590 | 1 | Inverness Medical Innovations, Inc. | 22,851 |
| 440 | | McKesson HBOC, Inc. | 26,202 |
| 1,960 | 1 | Mylan Laboratories, Inc. | 31,379 |
| | TOTAL | 99,533 |
| | Industrials – 11.7% | |
| 1,170 | 1 | AGCO Corp. | 32,327 |
| 465 | | Dover Corp. | 18,023 |
| 270 | | Flowserve Corp. | 26,606 |
| 530 | | ITT Corp. | 27,639 |
| 490 | | SPX Corp. | 30,022 |
| 1,470 | 1 | Thomas & Betts Corp. | 44,218 |
| 490 | 1 | URS Corp. | 21,389 |
| 930 | 1 | WESCO International, Inc. | 26,784 |
| | TOTAL | 227,008 |
| | Information Technology – 9.3% | |
| 1,050 | 1 | Agilent Technologies, Inc. | 29,222 |
| 850 | 1 | Hewitt Associates, Inc. | 30,965 |
| 1,530 | 1 | MEMC Electronic Materials, Inc. | 25,444 |
| 1,260 | 1 | NetApp, Inc. | 33,617 |
| 925 | 1 | Western Digital Corp. | 33,790 |
| 3,500 | | Xerox Corp. | 27,090 |
| | TOTAL | 180,128 |
| | Materials – 6.5% | |
| 1,200 | | Cabot Corp. | 27,732 |
| 810 | 1 | Intrepid Potash, Inc. | 19,108 |
| 1,185 | | MeadWestvaco Corp. | 26,437 |
| 555 | | PPG Industries, Inc. | 32,307 |
| 780 | | Sonoco Products Co. | 21,481 |
| | TOTAL | 127,065 |
Annual Shareholder Report9
|
| | Telecommunication Services – 2.7% | |
| 637 | | CenturyTel, Inc. | 21,403 |
| 965 | 1 | Crown Castle International Corp. | 30,263 |
| | TOTAL | 51,666 |
| | Utilities – 9.7% | |
| 1,090 | | Atmos Energy Corp. | 30,716 |
| 520 | | National Fuel Gas Co. | 23,821 |
| 1,025 | | PG&E Corp. | 41,503 |
| 795 | | Progress Energy, Inc. | 31,053 |
| 610 | | Sempra Energy | 30,384 |
| 1,605 | | Xcel Energy, Inc. | 30,880 |
| | TOTAL | 188,357 |
| | TOTAL COMMON STOCKS
(IDENTIFIED COST $1,577,709) | 1,913,409 |
| | EXCHANGE-TRADED MUTUAL FUND – 1.0% | |
| 550 | | iShares Russell Midcap Value Index Fund
(IDENTIFIED COST $19,357) | 19,481 |
| | Mutual Fund – 2.5% | |
| 48,753 | 2,3 | Prime Value Obligations Fund, Institutional Shares, 0.30%
(AT NET ASSET VALUE) | 48,753 |
| | TOTAL INVESTMENTS — 102.0%
(IDENTIFIED COST $1,645,819)4 | 1,981,643 |
| | OTHER ASSETS AND LIABILITIES - NET — (2.0)%5 | (38,635) |
| | TOTAL NET ASSETS — 100% | $1,943,008 |
| 1 | Non-income producing security. |
| 2 | Affiliated company. |
| 3 | 7-Day net yield. |
| 4 | The cost of investments for federal tax purposes amounts to $1,645,870. |
| 5 | Assets, other than investments in securities, less liabilities. See Statement of Assets and Liabilities. |
- Note: The categories of investments are shown as a percentage of total net assets at September 30, 2009.
- Various inputs are used in determining the value of the Fund's investments. These inputs are summarized in the three broad levels listed below:
- Level 1 — quoted prices in active markets for identical securities
- Level 2 — other significant observable inputs (including quoted prices for similar securities, interest rates, prepayment speeds, credit risk, etc.)
- Level 3 — significant unobservable inputs (including the Fund's own assumptions in determining the fair value of investments)
- The inputs or methodology used for valuing securities are not an indication of the risk associated with investing in those securities.
Annual Shareholder Report10
- The following is a summary of the inputs used, as of September 30, 2009, in valuing the Fund's assets carried at fair value:
| Valuation Inputs | | | | |
| Level 1 -
Quoted
Prices and
Investments in
Mutual Funds | Level 2 -
Other
Significant
Observable
Inputs | Level 3 -
Significant
Unobservable
Inputs | Total |
| Equity Securities: | | | | |
| Domestic | $1,749,296 | $ — | $ — | $1,749,296 |
| International | 164,113 | — | — | 164,113 |
| Exchange-Traded Mutual Fund | 19,481 | — | — | 19,481 |
| Mutual Fund | 48,753 | — | — | 48,753 |
| TOTAL SECURITIES | $1,981,643 | $ — | $ — | $1,981,643 |
- See Notes which are an integral part of the Financial Statements
Annual Shareholder Report11
Statement of Assets and Liabilities
September 30, 2009
| Assets: | | |
| Total investments in securities, at value including $48,753 of investments in an affiliated issuer (Note 5) (identified cost $1,645,819) | | $1,981,643 |
| Cash | | 37,000 |
| Income receivable | | 4,596 |
| Receivable for investments sold | | 51,657 |
| Receivable for shares sold | | 1,910 |
| TOTAL ASSETS | | 2,076,806 |
| Liabilities: | | |
| Payable for investments purchased | $84,747 | |
| Payable for auditing fees | 26,000 | |
| Payable for portfolio accounting fees | 11,100 | |
| Payable for share registration costs | 5,486 | |
| Payable for shareholder services fee (Note 5) | 50 | |
| Accrued expenses | 6,415 | |
| TOTAL LIABILITIES | | 133,798 |
| Net assets for 143,515 shares outstanding | | $1,943,008 |
| Net Assets Consist of: | | |
| Paid-in capital | | $1,513,284 |
| Net unrealized appreciation of investments | | 335,824 |
| Accumulated net realized gain on investments | | 93,350 |
| Undistributed net investment income | | 550 |
| TOTAL NET ASSETS | | $1,943,008 |
| Net Asset Value, Offering Price and Redemption Proceeds Per Share | | |
| Class A Shares: | | |
| Net asset value per share ($249,360 ÷ 18,435 shares outstanding), no par value, unlimited shares authorized | | $13.53 |
| Offering price per share (100/94.50 of $13.53) | | $14.32 |
| Redemption proceeds per share | | $13.53 |
| Class C Shares: | | |
| Net asset value per share ($7,125.18 ÷ 526.136 shares outstanding), no par value, unlimited shares authorized | | $13.54 |
| Offering price per share | | $13.54 |
| Redemption proceeds per share (99.00/100 of $13.54) | | $13.40 |
| Institutional Shares: | | |
| Net asset value per share ($1,686,523 ÷ 124,554 shares outstanding), no par value, unlimited shares authorized | | $13.54 |
| Offering price per share | | $13.54 |
| Redemption proceeds per share | | $13.54 |
- See Notes which are an integral part of the Financial Statements
Annual Shareholder Report12
Statement of Operations
Period Ended September 30, 20091
| Investment Income: | | | |
| Dividends (including $174 received from an affiliated issuer (Note 5)) | | | $17,687 |
| Expenses: | | | |
| Investment adviser fee (Note 5) | | $5,103 | |
| Administrative personnel and services fee (Note 5) | | 125,398 | |
| Custodian fees | | 3,920 | |
| Transfer and dividend disbursing agent fees and expenses | | 10,800 | |
| Auditing fees | | 26,000 | |
| Legal fees | | 2,544 | |
| Portfolio accounting fees | | 36,256 | |
| Distribution services fee — Class C Shares (Note 5) | | 1 | |
| Shareholder services fee — Class A Shares (Note 5) | | 142 | |
| Share registration costs | | 62,951 | |
| Printing and postage | | 14,890 | |
| Miscellaneous | | 3,190 | |
| TOTAL EXPENSES | | 291,195 | |
| Waivers and Reimbursements (Note 5): | | | |
| Waiver/reimbursement of investment adviser fee | $(5,103) | | |
| Waiver of administrative personnel and services fee | (24,528) | | |
| Reimbursement of other operating expenses | (254,653) | | |
| TOTAL WAIVERS AND REIMBURSEMENTS | | (284,284) | |
| Net expenses | | | 6,911 |
| Net investment income | | | 10,776 |
| Realized and Unrealized Gain on Investments: | | | |
| Net realized gain on investments | | | 93,350 |
| Net change in unrealized appreciation of investments | | | 335,824 |
| Net realized and unrealized gain on investments | | | 429,174 |
| Change in net assets resulting from operations | | | $439,950 |
| 1 | Reflects operations for the period March 16, 2009 (date of initial investment) to September 30, 2009. |
- See Notes which are an integral part of the Financial Statements
Annual Shareholder Report13
Statement of Changes in Net Assets
| Period Ended September 30 | 20091 |
| Increase (Decrease) in Net Assets | |
| Operations: | |
| Net investment income | $10,776 |
| Net realized gain on investments | 93,350 |
| Net change in unrealized appreciation of investments | 335,824 |
| CHANGE IN NET ASSETS RESULTING FROM OPERATIONS | 439,950 |
| Distributions to Shareholders: | |
| Distributions from net investment income | |
| Class A Shares | (823) |
| Class C Shares | (1) |
| Institutional Shares | (9,402) |
| CHANGE IN NET ASSETS RESULTING FROM DISTRIBUTIONS TO SHAREHOLDERS | (10,226) |
| Share Transactions: | |
| Proceeds from sale of shares | 1,516,832 |
| Net asset value of shares issued to shareholders in payment of distributions declared | 8,567 |
| Cost of shares redeemed | (12,115) |
| CHANGE IN NET ASSETS RESULTING FROM SHARE TRANSACTIONS | 1,513,284 |
| Change in net assets | 1,943,008 |
| Net Assets: | |
| Beginning of period | — |
| End of period (including undistributed net investment income of $550) | $1,943,008 |
| 1 | Reflects operations for the period from March 16, 2009 (date of initial investment) to September 30, 2009. |
- See Notes which are an integral part of the Financial Statements
Annual Shareholder Report14
Notes to Financial Statements
September 30, 2009
1. Organizaton
Federated Equity Funds (‘the “Trust”) is registered under the Investment Company Act of 1940, as amended (the “Act”), as an open-end management investment company. The Trust consists of 13 portfolios. The financial statements included herein are only those of Federated Clover Mid Value Fund (the “Fund”), a diversified portfolio. The financial statements of the other portfolios are presented separately. The assets of each portfolio are segregated and a shareholder's interest is limited to the portfolio in which shares are held. Each portfolio pays its own expenses. The Fund offers three classes of shares: Class A Shares, Class C Shares and Institutional Shares. All shares of the Fund have equal rights with respect to voting, except on class-specific matters. The financial highlights of the Class A Shares and Class C Shares are presented separately. The investment objective of the Fund is to seek capital appreciation.
2. SIGNIFICANT ACCOUNTING POLICIES
The following is a summary of significant accounting policies consistently followed by the Fund in the preparation of its financial statements. These policies are in conformity with U.S. generally accepted accounting principles (GAAP).
Investment Valuation
In calculating its net asset value (NAV), the Fund generally values investments as follows:
- Equity securities listed on an exchange or traded through a regulated market system are valued at their last reported sale price or official closing price in their principal exchange or market.
- Fixed-income securities acquired with remaining maturities greater than 60 days are fair valued using price evaluations provided by a pricing service approved by the Board of Trustees (the “Trustees”).
- Fixed-income securities acquired with remaining maturities of 60 days or less are valued at their cost (adjusted for the accretion of any discount or amortization of any premium).
- Shares of other mutual funds are valued based upon their reported NAVs.
- Derivative contracts listed on exchanges are valued at their reported settlement or closing price.
- Over-the-counter (OTC) derivative contracts are fair valued using price evaluations provided by a pricing service approved by the Trustees.
If the Fund cannot obtain a price or price evaluation from a pricing service for an investment, the Fund may attempt to value the investment based upon the mean of bid and asked quotations or fair value the investment based on price evaluations, from one or more dealers. If any price, quotation, price evaluation or other pricing source is not readily available when the NAV is calculated, the Fund uses the fair value of the investment determined in accordance with the procedures described below. There can be no assurance that the Fund could purchase or sell an investment at the price used to calculate the Fund's NAV.
Fair Valuation and Significant Events Procedures
The Trustees have authorized the use of pricing services to provide evaluations of the current fair value of certain investments for purposes of calculating the NAV. Factors considered by pricing services in evaluating an investment include the yields or prices of investments of comparable quality, coupon, maturity, call rights and other potential prepayments, terms and type, reported transactions, indications as to values from dealers and general market Annual Shareholder Report15
conditions. Some pricing services provide a single price evaluation reflecting the bid-side of the market for an investment (a “bid” evaluation). Other pricing services offer both bid evaluations and price evaluations indicative of a price between the prices bid and asked for the investment (a “mid” evaluation). The Fund normally uses bid evaluations for U.S. Treasury and Agency securities, mortgage-backed securities and municipal securities. The Fund normally uses mid evaluations for other types of fixed-income securities and OTC derivative contracts. In the event that market quotations and price evaluations are not available for an investment, the fair value of the investment is determined in accordance with procedures adopted by the Trustees.The Trustees also have adopted procedures requiring an investment to be priced at its fair value whenever the Adviser determines that a significant event affecting the value of the investment has occurred between the time as of which the price of the investment would otherwise be determined and the time as of which the NAV is computed. An event is considered significant if there is both an affirmative expectation that the investment's value will change in response to the event and a reasonable basis for quantifying the resulting change in value. Examples of significant events that may occur after the close of the principal market on which a security is traded, or after the time of a price evaluation provided by a pricing service or a dealer, include:
- With respect to securities traded in foreign markets, significant trends in U.S. equity markets or in the trading of foreign securities index futures or options contracts;
- With respect to price evaluations of fixed-income securities determined before the close of regular trading on the NYSE, actions by the Federal Reserve Open Market Committee and other significant trends in U.S. fixed-income markets;
- Political or other developments affecting the economy or markets in which an issuer conducts its operations or its securities are traded; and
- Announcements concerning matters such as acquisitions, recapitalizations, litigation developments, a natural disaster affecting the issuer's operations or regulatory changes or market developments affecting the issuer's industry.
The Trustees have approved the use of a pricing service to determine the fair value of equity securities traded principally in foreign markets when the Adviser determines that there has been a significant trend in the U.S. equity markets or in index futures trading. For other significant events, the Fund may seek to obtain more current quotations or price evaluations from alternative pricing sources. If a reliable alternative pricing source is not available, the Fund will determine the fair value of the investment using another method approved by the Trustees.
Investment Income, Gains and Losses, Expenses and Distributions
Investment transactions are accounted for on a trade-date basis. Realized gains and losses from investment transactions are recorded on an identified-cost basis. Interest income and expenses are accrued daily. Dividend income and distributions to shareholders are recorded on the ex-dividend date. Foreign dividends are recorded on the ex-dividend date or when the Fund is informed of the ex-dividend date. Distributions of net investment income are declared and paid quarterly. Non-cash dividends included in dividend income, if any, are recorded at fair value. Investment income, realized and unrealized gains and losses, and certain fund-level expenses are allocated to each class based on relative average daily net assets, except that each class may bear certain expenses unique to that class such as distribution services and shareholder services fees. Dividends are declared separately for each class. No class has preferential dividend rights; differences in per share dividend rates are generally due to differences in separate class expenses.
Annual Shareholder Report16
Premium and Discount AmortizationAll premiums and discounts on fixed-income securities are amortized/accreted for financial statement purposes.
Federal Taxes
It is the Fund's policy to comply with the Subchapter M provision of the Internal Revenue Code (the “Code”) and to distribute to shareholders each year substantially all of its income. Accordingly, no provision for federal income tax is necessary. As of and during the period ended September 30, 2009, the Fund did not have a liability for any uncertain tax positions. The Fund recognizes interest and penalties, if any, related to tax liabilities as income tax expense in the Statement of Operations. As of September 30, 2009, tax year 2009 remains subject to examination by the Fund's major tax jurisdictions, which include the United States of America and the Commonwealth of Massachusetts.
When-Issued and Delayed Delivery Transactions
The Fund may engage in when-issued or delayed delivery transactions. The Fund records when-issued securities on the trade date and maintains security positions such that sufficient liquid assets will be available to make payment for the securities purchased. Securities purchased on a when-issued or delayed delivery basis are marked to market daily and begin earning interest on the settlement date. Losses may occur on these transactions due to changes in market conditions or the failure of counterparties to perform under the contract.
Other
The preparation of financial statements in conformity with GAAP requires management to make estimates and assumptions that affect the amounts of assets, liabilities, expenses and revenues reported in the financial statements. Actual results could differ from those estimated.
3. SHARES OF BENEFICIAL INTEREST
The following tables summarize share activity:
| Period Ended September 30 | 20091 |
| Class A Shares: | Shares | Amount |
| Shares sold | 19,391 | $228,696 |
| Shares issued to shareholders in payment of distributions declared | 66 | 822 |
| Shares redeemed | (1,022) | (11,915) |
| NET CHANGE RESULTING FROM CLASS A SHARE TRANSACTIONS | 18,435 | $217,603 |
| Period Ended September 30 | 20091 |
| Class C Shares: | Shares | Amount |
| Shares sold | 536 | $7,200 |
| Shares redeemed | (10) | (100) |
| NET CHANGE RESULTING FROM CLASS C SHARE TRANSACTIONS | 526 | $7,100 |
Annual Shareholder Report17
| Period Ended September 30 | 20091 |
| Institutional Shares: | Shares | Amount |
| Shares sold | 123,906 | $1,280,936 |
| Shares issued to shareholders in payment of distributions declared | 658 | 7,745 |
| Shares redeemed | (10) | (100) |
| NET CHANGE RESULTING FROM INSTITUTIONAL SHARE TRANSACTIONS | 124,554 | $1,288,581 |
| NET CHANGE RESULTING FROM FUND SHARE TRANSACTIONS | 143,515 | $1,513,284 |
| 1 | Reflects operations for the period from March 16, 2009 (date of initial investment) to September 30, 2009. |
4. FEDERAL TAX INFORMATION
The tax character of distributions as reported on the Statement of Changes in Net Assets for the period ended September 30, 2009, was as follows:
| 2009 |
| Ordinary income | $10,226 |
As of September 30, 2009, the components of distributable earnings on a tax basis were as follows:
| Undistributed ordinary income1 | $65,012 |
| Undistributed long-term capital gain | $28,939 |
| Net unrealized appreciation | $335,773 |
| 1 | For tax purposes, short-term capital gain distributions are considered ordinary income distributions. |
The difference between book-basis and tax-basis net unrealized appreciation/depreciation is attributable to differing treatments for the deferral of losses on wash sales.
At September 30, 2009, the cost of investments for federal tax purposes was $1,645,870. The net unrealized appreciation of investments for federal tax purposes was $335,773 consists of net unrealized appreciation from investments for those securities having an excess of value over cost of $356,848 and net unrealized depreciation from investments for those securities having an excess of cost over value of $21,075.
5. INVESTMENT ADVISER FEE AND OTHER TRANSACTIONS WITH AFFILIATES
Investment Adviser Fee
Federated Global Investment Management Corporation is the Fund's investment adviser (the “Adviser”). The advisory agreement between the Fund and the Adviser provides for an annual fee equal to 0.75% of the Fund's average daily net assets. Subject to the terms described in the Expense Limitation note, the Adviser may voluntarily choose to waive any portion of its fee and/or reimburse certain operating expenses of the Fund. The Adviser can modify or terminate this voluntary waiver and/or reimbursement at any time at its sole discretion. For the period ended September 30, 2009, the Adviser voluntarily waived $5,074 of its fee and voluntarily reimbursed $254,653 of other operating expenses.
Annual Shareholder Report18
Administrative FeeFederated Administrative Services (FAS), under the Administrative Services Agreement, provides the Fund with administrative personnel and services. The fee paid to FAS is based on the average aggregate daily net assets of certain Federated funds as specified below:
| Administrative Fee | Average Aggregate Daily Net Assets
of the Federated Funds |
| 0.150% | on the first $5 billion |
| 0.125% | on the next $5 billion |
| 0.100% | on the next $10 billion |
| 0.075% | on assets in excess of $20 billion |
The administrative fee received during any fiscal year shall be at least $150,000 per portfolio and $40,000 per each additional class of Shares. Subject to the terms described in the Expense Limitation note, FAS may voluntarily choose to waive any portion of its fee. FAS can modify or terminate this voluntary waiver at any time at its sole discretion. For the period ended September 30, 2009, FAS waived $24,528 of its fee. The net fee paid to FAS was 14.826% of average daily net assets of the Fund. The Fund is currently being charged the minimum administrative fee; therefore the fee as a percentage of average daily net assets is greater than the amounts presented in the chart above.
Distribution Services Fee
The Fund has adopted a Distribution Plan (the “Plan”) pursuant to Rule 12b-1 under the Act. Under the terms of the Plan, the Fund will compensate Federated Securities Corp. (FSC), the principal distributor, from the daily net assets of the Fund's Class A Shares and Class C Shares to finance activities intended to result in the sale of these shares. The Plan provides that the Fund may incur distribution expenses at the following percentages of average daily net assets annually, to compensate FSC:
| Share Class Name | Percentage of Average Daily
Net Assets of Class |
| Class A Shares | 0.05% |
| Class C Shares | 0.75% |
Subject to the terms described in the Expense Limitation note, FSC may voluntarily choose to waive any portion of its fee. FSC can modify or terminate this voluntary waiver at any time at its sole discretion. When FSC receives fees, it may pay some or all of them to financial intermediaries whose customers purchase shares. For the period ended September 30, 2009, the Fund's Class A Shares did not incur a distribution services fee; however it may begin to begin to incur this fee upon approval of the Trustees.
Sales Charges
Front-end sales charges and contingent deferred sales charges do not represent expenses of the Fund. They are deducted from the proceeds of sales of Fund shares prior to investment or from redemption proceeds prior to remittance, as applicable. For the period ended
September 30, 2009, FSC retained $657 in sales charges from the sale of Class A Shares.
Annual Shareholder Report19
Shareholder Services FeeThe Fund may pay fees (Service Fees) up to 0.25% of the average daily net assets of the Fund's Class A Shares and Class C Shares to financial intermediaries or to Federated Shareholder Services Company (FSSC) for providing services to shareholders and maintaining shareholder accounts. Subject to the terms described in the Expense Limitation note, FSSC may voluntarily reimburse the Fund for shareholder services fees. This voluntary reimbursement can be modified or terminated at any time.
Expense Limitation
The Adviser and its affiliates (which may include FSC, FAS and FSSC) have voluntarily agreed to waive their fees and/or reimburse expenses so that the total operating expenses (as shown in the financial highlights) paid by the Fund's Institutional Shares, Class A Shares and Class C Shares (after the voluntary waivers and reimbursements) will not exceed 0.99%, 1.24% and 1.99%, respectively, through the later of (the “Termination Date”): (a) November 30, 2010 or (b) the date of the Fund's next effective Prospectus. While the Adviser and its affiliates currently do not anticipate terminating these arrangements prior to the Termination Date, these arrangements may only be terminated prior to the Termination Date with the agreement of the Fund's Board of Trustees.
General
Certain Officers and Trustees of the Fund are Officers and Directors or Trustees of the above companies.
Transactions with Affiliated Companies
Affiliated holdings are mutual funds which are managed by the Adviser or an affiliate of the Adviser. The Adviser has agreed to reimburse the Fund for certain investment adviser fees as a result of transactions in other affiliated mutual funds. For the period ended September 30, 2009, the Adviser reimbursed $29. Transactions with the affiliated company during the period ended September 30, 2009 were as follows:
| Affiliate | Balance of
Shares Held
3/16/2009 | Purchases/
Additions | Sales/
Reductions | Balance of
Shares Held
9/30/2009 | Value | Dividend
Income |
| Prime Value Obligations Fund, Institutional Shares | — | 1,169,703 | 1,120,950 | 48,753 | $48,753 | $174 |
6. Investment TRANSACTIONS
Purchases and sales of investments, excluding long-term U.S. government securities and short-term obligations, for the period ended September 30, 2009, were as follows:
| Purchases | $1,553,288 |
| Sales | $690,284 |
Annual Shareholder Report20
7. LINE OF CREDIT
The Fund participates in a $100,000,000 unsecured, uncommitted revolving line of credit (LOC) agreement with PNC Bank. The LOC was made available for extraordinary or emergency purposes, primarily for financing redemption payments. Borrowings are charged interest at a rate offered to the Fund by PNC Bank at the time of the borrowing. As of September 30, 2009, there were no outstanding loans. During the period ended September 30, 2009, the Fund did not utilize the LOC.
8. INTERFUND LENDING
Pursuant to an Exemptive Order issued by the Securities and Exchange Commission (SEC), the Fund, along with other funds advised by subsidiaries of Federated Investors, Inc., may participate in an interfund lending program. This program provides an alternative credit facility allowing the funds to borrow from other participating affiliated funds. As of September 30, 2009, there were no outstanding loans. During the period ended September 30, 2009, the program was not utilized.
9. Legal Proceedings
Since October 2003, Federated Investors, Inc. and related entities (collectively, “Federated”) and various Federated funds (“Federated Funds”) have been named as defendants in several class action lawsuits now pending in the United States District Court for the District of Maryland. The lawsuits were purportedly filed on behalf of people who purchased, owned and/or redeemed shares of Federated-sponsored mutual funds during specified periods beginning November 1, 1998. The suits are generally similar in alleging that Federated engaged in illegal and improper trading practices including market timing and late trading in concert with certain institutional traders, which allegedly caused financial injury to the mutual fund shareholders. These lawsuits began to be filed shortly after Federated's first public announcement that it had received requests for information on shareholder trading activities in the Federated Funds from the SEC, the Office of the New York State Attorney General (NYAG), and other authorities. In that regard, on November 28, 2005, Federated announced that it had reached final settlements with the SEC and the NYAG with respect to those matters. As Federated previously reported in 2004, it has already paid approximately $8.0 million to certain funds as determined by an independent consultant. As part of these settlements, Federated agreed to pay for the benefit of fund shareholders additional disgorgement and a civil money penalty in the aggregate amount of an additional $72 million. Federated entities have also been named as defendants in several additional lawsuits that are now pending in the United States District Court for the Western District of Pennsylvania, alleging, among other things, excessive advisory and Rule 12b-1 fees. The Board of the Federated Funds retained the law firm of Dickstein Shapiro LLP to represent the Federated Funds in these lawsuits. Federated and the Federated Funds, and their respective counsel have been defending this litigation, and none of the Federated Funds remains a defendant in any of the lawsuits (though some could potentially receive any recoveries as nominal defendants). Additional lawsuits based upon similar allegations may be filed in the future. The potential impact of these lawsuits, all of which seek unquantified damages, attorneys' fees and expenses, and future potential similar suits is uncertain. Although we do not believe that these lawsuits will have a material adverse effect on the Federated Funds, there can be no assurance that these suits, the ongoing adverse publicity and/or other developments resulting from the regulatory investigations will not result in increased Federated Fund redemptions, reduced sales of Federated Fund shares or other adverse consequences for the Federated Funds.
Annual Shareholder Report21
10. Subsequent eventsManagement has evaluated subsequent events through November 24, 2009, the date the financial statements were issued, and determined that no events have occurred that require additional disclosure.
11. FEDERAL TAX INFORMATION (UNAUDITED)
For the fiscal period ended September 30, 2009, 100.0% of total ordinary income distributions paid by the Fund are qualifying dividends which may be subject to a maximum tax rate of 15%, as provided for by the Jobs and Growth Tax Relief Act of 2003. Complete information is reported in conjunction with the reporting of your distributions on Form 1099-DIV.
Of the ordinary income distributions made by the Fund during the period ended September 30, 2009, 100.0% qualify for the dividend received deduction available to corporate shareholders.
Annual Shareholder Report22
Report of Independent Registered Public Accounting Firm
TO THE BOARD OF TRUSTEES OF THE FEDERATED EQUITY FUNDS AND SHAREHOLDERS OF Federated Clover MID Value Fund:
We have audited the accompanying statement of assets and liabilities, including the portfolio of investments, of the Federated Clover Mid Value Fund (the “Fund”), a portfolio of Federated Equity Funds, as of September 30, 2009, and the related statement of operations, the statements of changes in net assets, and the financial highlights for the period from March 16, 2009 (date of initial investment) to September 30, 2009. These financial statements and financial highlights are the responsibility of the Fund's management. Our responsibility is to express an opinion on these financial statements and financial highlights based on our audit.
We conducted our audit in accordance with the standards of the Public Company Accounting Oversight Board (United States). Those standards require that we plan and perform the audit to obtain reasonable assurance about whether the financial statements and financial highlights are free of material misstatement. An audit includes examining, on a test basis, evidence supporting the amounts and disclosures in the financial statements. Our procedures included confirmation of securities owned as of September 30, 2009 by correspondence with the custodian and brokers or by other appropriate auditing procedures. An audit also includes assessing the accounting principles used and significant estimates made by management, as well as evaluating the overall financial statement presentation. We believe that our audit provides a reasonable basis for our opinion.
In our opinion, the financial statements and financial highlights referred to above present fairly, in all material respects, the financial position of the Federated Clover Mid Value Fund as of September 30, 2009, and the results of its operations, the changes in its net assets, and the financial highlights for the period from March 16, 2009 (date of initial investment) to September 30, 2009, in conformity with U.S. generally accepted accounting principles.
Boston, Massachusetts
November 24, 2009
Annual Shareholder Report23
Board of Trustees and Trust Officers
The Board is responsible for managing the Trust's business affairs and for exercising all the Trust's powers except those reserved for the shareholders. The following tables give information about each Board member and the senior officers of the Fund. Where required, the tables separately list Board members who are “interested persons” of the Fund (i.e., “Interested” Board members) and those who are not (i.e., “Independent” Board members). Unless otherwise noted, the address of each person listed is Federated Investors Tower, 1001 Liberty Avenue, Pittsburgh, PA 15222. The address of all Independent Board members listed is 4000 Ericsson Drive, Warrendale, PA 15086-7561; Attention: Mutual Fund Board. As of December 31, 2008, the Trust comprised ten portfolios, and the Federated Fund Complex consisted of 40 investment companies (comprising 149 portfolios). Unless otherwise noted, each Officer is elected annually. Unless otherwise noted, each Board member oversees all portfolios in the Federated Fund Complex and serves for an indefinite term. The Fund's Statement of Additional Information includes additional information about Trust Trustees and is available, without charge and upon request, by calling 1-800-341-7400.
Interested TRUSTEES Background
Name
Birth Date
Positions Held with Trust
Date Service Began | Principal Occupation(s) for Past Five Years,
Other Directorships Held and Previous Position(s) |
John F. Donahue*
Birth Date: July 28, 1924
TRUSTEE
Began serving: April 1984 | Principal Occupations: Director or Trustee of the Federated Fund Complex; Chairman and Director, Federated Investors, Inc.; Chairman of the Federated Fund Complex's Executive Committee.
Previous Positions: Chairman of the Federated Fund Complex; Trustee, Federated Investment Management Company; Chairman and Director, Federated Investment Counseling. |
J. Christopher Donahue*
Birth Date: April 11, 1949
PRESIDENT AND TRUSTEE
Began serving: January 2000 | Principal Occupations: Principal Executive Officer and President of the Federated Fund Complex; Director or Trustee of some of the Funds in the Federated Fund Complex; President, Chief Executive Officer and Director, Federated Investors, Inc.; Chairman and Trustee, Federated Investment Management Company; Trustee, Federated Investment Counseling; Chairman and Director, Federated Global Investment Management Corp.; Chairman, Federated Equity Management Company of Pennsylvania and Passport Research, Ltd. (investment advisory subsidiary of Federated); Trustee, Federated Shareholder Services Company; Director, Federated Services Company.
Previous Positions: President, Federated Investment Counseling; President and Chief Executive Officer, Federated Investment Management Company, Federated Global Investment Management Corp. and Passport Research, Ltd. |
| * | Family relationships and reasons for “interested” status: John F. Donahue is the father of J. Christopher Donahue; both are “interested” due to their beneficial ownership of shares of Federated Investors, Inc. and the positions they hold with Federated and its subsidiaries. |
Annual Shareholder Report24
INDEPENDENT TRUSTEES Background
Name
Birth Date
Positions Held with Trust
Date Service Began | Principal Occupation(s) for Past Five Years,
Other Directorships Held and Previous Position(s) |
John T. Conroy, Jr., Ph.D.
Birth Date: June 23, 1937
TRUSTEE
Began serving: November 1991 | Principal Occupations: Director or Trustee of the Federated Fund Complex; Chairman of the Board, Investment Properties Corporation; Partner or Trustee in private real estate ventures in Southwest Florida; Assistant Professor in Theology at Barry University and Blessed Edmund Rice School for Pastoral Ministry.
Previous Positions: President, Investment Properties Corporation; Senior Vice President, John R. Wood and Associates, Inc., Realtors; President, Naples Property Management, Inc. and Northgate Village Development Corporation. |
Nicholas P. Constantakis
Birth Date: September 3, 1939
TRUSTEE
Began serving: February 1998 | Principal Occupation: Director or Trustee of the Federated Fund Complex.
Other Directorships Held: Director and Chairman of the Audit Committee, Michael Baker Corporation (architecture, engineering and construction services).
Previous Position: Partner, Andersen Worldwide SC. |
John F. Cunningham
Birth Date: March 5, 1943
TRUSTEE
Began serving: January 1999 | Principal Occupation: Director or Trustee of the Federated Fund Complex.
Other Directorships Held: Chairman, President and Chief Executive Officer, Cunningham & Co., Inc. (strategic business consulting); Trustee Associate, Boston College.
Previous Positions: Director, Redgate Communications and EMC Corporation (computer storage systems); Chairman of the Board and Chief Executive Officer, Computer Consoles, Inc.; President and Chief Operating Officer, Wang Laboratories; Director, First National Bank of Boston; Director, Apollo Computer, Inc. |
Maureen Lally-Green
Birth Date: July 5, 1949
TRUSTEE
Began serving: August 2009 | Principal Occupations: Director or Trustee of the Federated Fund Complex; Director, Office of Church Relations, Diocese of Pittsburgh; Adjunct Professor of Law, Duquesne University School of Law.
Other Directorships Held: Director, Auberle; Trustee St. Francis University; Director, Ireland Institute of Pittsburgh; Director, UPMC Mercy Hospital; Regent, St. Vincent Seminary; Director, Epilepsy Foundation of Western and Central Pennsylvania; Director, Saint Thomas More Society, Allegheny County; Director, Carlow University.
Previous Position: Pennsylvania Superior Court Judge. |
Annual Shareholder Report25
Name
Birth Date
Positions Held with Trust
Date Service Began | Principal Occupation(s) for Past Five Years,
Other Directorships Held and Previous Position(s) |
Peter E. Madden
Birth Date: March 16, 1942
TRUSTEE
Began serving: November 1991 | Principal Occupation: Director or Trustee and Chairman of the Board of the Federated Fund Complex.
Other Directorship Held: Board of Overseers, Babson College.
Previous Positions: Representative, Commonwealth of Massachusetts General Court; President, Chief Operating Officer and Director, State Street Bank and Trust Company and State Street Corporation (retired); Director, VISA USA and VISA International; Chairman and Director, Massachusetts Bankers Association; Director, Depository Trust Corporation; Director, The Boston Stock Exchange. |
Charles F. Mansfield, Jr.
Birth Date: April 10, 1945
TRUSTEE
Began serving: January 1999 | Principal Occupations: Director or Trustee and Chairman of the Audit Committee of the Federated Fund Complex; Management Consultant.
Previous Positions: Chief Executive Officer, PBTC International Bank; Partner, Arthur Young & Company (now Ernst & Young LLP); Chief Financial Officer of Retail Banking Sector, Chase Manhattan Bank; Senior Vice President, HSBC Bank USA (formerly, Marine Midland Bank); Vice President, Citibank; Assistant Professor of Banking and Finance, Frank G. Zarb School of Business, Hofstra University; Executive Vice President DVC Group, Inc. (marketing, communications and technology). |
R. James Nicholson
Birth Date: February 4, 1938
TRUSTEE
Began serving: November 2007 | Principal Occupations: Director or Trustee of the Federated Fund Complex; Senior Counsel, Brownstein Hyatt Farber Schrek, P.C.; Former Secretary of the U.S. Dept. of Veterans Affairs; Former U.S. Ambassador to the Holy See; Former Chairman of the Republican National Committee.
Other Directorships Held: Director, Horatio Alger Association; Director, The Daniels Fund.
Previous Positions: Colonel, U.S. Army Reserve; Partner, Calkins, Kramer, Grimshaw and Harring, P.C.; General Counsel, Colorado Association of Housing and Building; Chairman and CEO, Nicholson Enterprises, Inc. (real estate holding company); Chairman and CEO, Renaissance Homes of Colorado. |
Thomas M. O'Neill
Birth Date: June 14, 1951
TRUSTEE
Began serving: October 2006 | Principal Occupations: Director or Trustee of the Federated Fund Complex; Managing Director and Partner, Navigator Management Company, L.P. (investment and strategic consulting).
Other Directorships Held: Board of Overseers, Children's Hospital of Boston; Visiting Committee on Athletics, Harvard College.
Previous Positions: Chief Executive Officer and President, Managing Director and Chief Investment Officer, Fleet Investment Advisors; President and Chief Executive Officer, Aeltus Investment Management, Inc.; General Partner, Hellman, Jordan Management Co., Boston, MA; Chief Investment Officer, The Putnam Companies, Boston, MA; Credit Analyst and Lending Officer, Fleet Bank; Director and Consultant, EZE Castle Software (investment order management software); Director, Midway Pacific (lumber). |
Annual Shareholder Report26
Name
Birth Date
Positions Held with Trust
Date Service Began | Principal Occupation(s) for Past Five Years,
Other Directorships Held and Previous Position(s) |
John S. Walsh
Birth Date: November 28, 1957
TRUSTEE
Began serving: January 1999 | Principal Occupations: Director or Trustee of the Federated Fund Complex; President and Director, Heat Wagon, Inc. (manufacturer of construction temporary heaters); President and Director, Manufacturers Products, Inc. (distributor of portable construction heaters); President, Portable Heater Parts, a division of Manufacturers Products, Inc.
Previous Position: Vice President, Walsh & Kelly, Inc. |
James F. Will
Birth Date: October 12, 1938
TRUSTEE
Began serving: April 2006 | Principal Occupations: Director or Trustee of the Federated Fund Complex; formerly, Vice Chancellor and President, Saint Vincent College.
Other Directorships Held: Trustee, Saint Vincent College; Alleghany Corporation.
Previous Positions: Chairman, President and Chief Executive Officer, Armco, Inc.; President and Chief Executive Officer, Cyclops Industries; President and Chief Operating Officer, Kaiser Steel Corporation. |
OFFICERS
Name
Birth Date
Address
Positions Held with Trust
Date Service Began | Principal Occupation(s) for Past Five Years
and Previous Position(s) |
John W. McGonigle
Birth Date: October 26, 1938
EXECUTIVE VICE PRESIDENT AND SECRETARY
Began serving: April 1984 | Principal Occupations: Executive Vice President and Secretary of the Federated Fund Complex; Vice Chairman, Executive Vice President, Secretary and Director, Federated Investors, Inc.
Previous Positions: Trustee, Federated Investment Management Company and Federated Investment Counseling; Director, Federated Global Investment Management Corp., Federated Services Company and Federated Securities Corp. |
Richard A. Novak
Birth Date: December 25, 1963
TREASURER
Began serving: January 2006 | Principal Occupations: Principal Financial Officer and Treasurer of the Federated Fund Complex; Senior Vice President, Federated Administrative Services; Financial and Operations Principal for Federated Securities Corp., Edgewood Services, Inc. and Southpointe Distribution Services, Inc.
Previous Positions: Controller of Federated Investors, Inc.; Vice President, Finance of Federated Services Company; held various financial management positions within The Mercy Hospital of Pittsburgh; Auditor, Arthur Andersen & Co. |
Brian P. Bouda
Birth Date: February 28, 1947
CHIEF COMPLIANCE OFFICER AND SENIOR VICE PRESIDENT
Began serving: August 2004 | Principal Occupations: Senior Vice President and Chief Compliance Officer of the Federated Fund Complex; Vice President and Chief Compliance Officer of Federated Investors, Inc. and Chief Compliance Officer of its subsidiaries. Mr. Bouda joined Federated in 1999 and is a member of the American Bar Association and the State Bar Association of Wisconsin. |
Annual Shareholder Report27
Name
Birth Date
Address
Positions Held with Trust
Date Service Began | Principal Occupation(s) for Past Five Years
and Previous Position(s) |
Stephen F. Auth
Birth Date: September 3, 1956
450 Lexington Avenue
Suite 3700
New York, NY 10017-3943
CHIEF INVESTMENT OFFICER
Began serving: November 2002 | Principal Occupations: Mr. Auth is Chief Investment Officer of this Fund and various other Funds in the Federated Fund Complex; Executive Vice President, Federated Investment Counseling, Federated Global Investment Management Corp. and Federated Equity Management Company of Pennsylvania.
Previous Positions: Executive Vice President, Federated Investment Management Company, and Passport Research, Ltd. (investment advisory subsidiary of Federated); Senior Vice President, Global Portfolio Management Services Division; Senior Vice President, Federated Investment Management Company and Passport Research, Ltd.; Senior Managing Director and Portfolio Manager, Prudential Investments. |
Lawrence Auriana
Birth Date: January 8, 1944
140 East 45th Street
New York, NY 10017
VICE PRESIDENT
Began serving: November 2001 | Principal Occupations: Lawrence Auriana is Vice President of the Trust. Mr. Auriana joined Federated in April 2001 as Co-Head of Investments/Federated Kaufmann. From August 1984 to April 2001, Mr. Auriana was President and Treasurer of Edgemont Asset Management Corp., and Chairman of the Board and Portfolio Manager to The Kaufmann Fund, Inc. (predecessor to the Federated Kaufmann Fund). Mr. Auriana earned a B.S. in economics from Fordham University and has been engaged in the securities business since 1965. |
Walter C. Bean
Birth Date: June 22, 1945
VICE PRESIDENT
Began serving: November 2006 | Principal Occupations: Walter C. Bean is Vice President of the Trust. Mr. Bean is a Senior Vice President, Senior Portfolio Manager and Director of Investments for Managed Accounts. Mr. Bean joined Federated in 2000. Mr. Bean is responsible for the investment process for the managed accounts portfolios. His previous associations included: Chief Investment Officer and Portfolio Manager at C.S. McKee & Company; various investment management and research positions with First Chicago Investment Advisors, CIGNA Investment Advisors and Mellon Bank. Mr. Bean is a Chartered Financial Analyst. Mr. Bean earned a Bachelors Degree in Business Administration from Ohio University and an M.B.A. from Pennsylvania State University. Mr. Bean has 38 years of investment experience. |
Hans P. Utsch
Birth Date: July 3, 1936
140 East 45th Street
New York, NY 10017
VICE PRESIDENT
Began serving: November 2001 | Principal Occupations: Hans P. Utsch is Vice President of the Trust. Mr. Utsch joined Federated in April 2001 as Co-Head of Investments/Federated Kaufmann. From August 1984 to April 2001, Mr. Utsch was Chairman of the Board and Secretary of Edgemont Asset Management Corp., and President and Portfolio Manager to The Kaufmann Fund, Inc. (predecessor to the Federated Kaufmann Fund). Mr. Utsch graduated from Amherst College and holds an M.B.A. from Columbia University. He has been engaged in the securities business since 1962. |
Richard B. Fisher
Birth Date: May 17, 1923
VICE PRESIDENT
Began serving: April 1984 | Principal Occupations: Vice Chairman or Vice President of some of the Funds in the Federated Fund Complex; Vice Chairman, Federated Investors, Inc.; Chairman, Federated Securities Corp.
Previous Positions: President and Director or Trustee of some of the Funds in the Federated Fund Complex; Executive Vice President, Federated Investors, Inc.; Director and Chief Executive Officer, Federated Securities Corp. |
Annual Shareholder Report28
Evaluation and Approval of Advisory
Contract - May 2009
Federated Clover Mid Value Fund (the “Fund”)
The Fund's Board reviewed the Fund's investment advisory contract at meetings held in May 2009. Because the Fund did not yet have a meaningful operating history, the Board's decision to approve the contract reflects the exercise of its business judgment on whether to authorize the continued offering of this new investment vehicle, as originally proposed by, and based on information previously requested by the Board and provided by the Federated organization, and based on Federated's recommendation to go forward with the Fund.
Federated proposed the creation of the Fund in connection with its acquisition of certain assets of Clover Capital Management, Inc. (“Clover Capital”), the investment adviser to the Clover Capital Mid Cap Value Equity Common Fund (the “Predecessor Fund”), a privately offered pooled fund (the “Acquisition”). As part of the transaction, Federated proposed that the Predecessor Fund be reorganized with and into the Fund in a tax-free asset transfer which would provide shareholders of the Predecessor Fund the opportunity to become shareholders of a registered mutual fund with similar investment objectives and policies and the same key management personnel as the Predecessor Fund, but with sales, distribution and other fund and shareholder services provided by the same affiliates of Federated that provide such services to the other Federated funds. The Fund was declared effective on January 21, 2009, and the reorganization of the Predecessor Fund with and into the Fund was consummated after the close of business on March 13, 2009. The Fund commenced operations on March 16, 2009. Accordingly, the Board's deliberations at its May 2009 meetings were based to a significant degree on the information considered by the Board when it originally approved the contract at its November 2008 meetings.
The Federated funds' Board had previously appointed a Senior Officer, whose duties include specified responsibilities relating to the process by which advisory fees are to be charged to a Federated Fund. The Senior Officer has the authority to retain consultants, experts, or staff as may be reasonably necessary to assist in the performance of his duties, reports directly to the Board, and may be terminated only with the approval of a majority of the independent members of the Board. The Senior Officer prepared and furnished to the Board an independent, written evaluation that covered topics discussed below. The Board considered that evaluation, along with other information, in deciding to approve the proposed advisory contract.
The Board also considered the anticipated compensation and benefits to be received by the Adviser. This includes fees to be received for services provided to the Fund by other entities in the Federated organization and research services that may be received by the Adviser from brokers that execute fund trades, as well as advisory fees. The Board is also familiar with and considered judicial Annual Shareholder Report29
decisions concerning allegedly excessive investment advisory fees, which have indicated that the following factors may be relevant to an Adviser's fiduciary duty with respect to its receipt of compensation from a fund: the nature and quality of the services provided by the Adviser, including the performance of the Fund; the Adviser's cost of providing the services; the extent to which the Adviser may realize “economies of scale” as the Fund grows larger; any indirect benefits that may accrue to the Adviser and its affiliates as a result of the Adviser's relationship with the Fund; performance and expenses of comparable funds; and the extent to which the independent Board members are fully informed about all facts the Board deems relevant bearing on the Adviser's services and fees. The Board further considered management fees (including any components thereof) charged to institutional and other clients of the Adviser for what might be viewed as like services, and the cost to the Adviser and its affiliates of supplying services pursuant to the management fee agreements, excluding any intra-corporate profit and profit margins of the Adviser and its affiliates for supplying such services. The Board was aware of these factors and was guided by them in its review of the Fund's advisory contract to the extent it considered them to be appropriate and relevant, as discussed further below. The Board considered and weighed these circumstances in light of its substantial accumulated experience in working with Federated on matters relating to other Federated funds, and was assisted in its deliberations by independent legal counsel. The Board's consideration of the proposed advisory contract included review of the Senior Officer's evaluation, accompanying data and additional reports covering such matters as: the Adviser's investment philosophy, revenue, profitability, personnel and processes; investment and operating strategies; the Fund's investment objectives; the Fund's anticipated expenses (including the proposed advisory fee itself and the overall estimated expense structure of the Fund, both in absolute terms and relative to similar and/or competing funds, with due regard for contractual or voluntary expense limitations); and the nature, quality and extent of the advisory and other services to be provided to the Fund by the Adviser and its affiliates. The Board also considered the likely preferences and expectations of anticipated Fund shareholders and their relative sophistication; the continuing state of competition in the mutual fund industry and market practices; the range of comparable fees for similar funds in the mutual fund industry; the Fund's relationship to the Federated family of funds which include a comprehensive array of funds with different investment objectives, policies and strategies which are available for exchange without the incurrence of additional sales charges; compliance and audit reports concerning the Federated funds and the Federated companies that service them (including communications from regulatory agencies), as well as Federated's responses to any issues raised therein; and relevant developments in the mutual fund industry and how the Federated funds Annual Shareholder Report30
and/or Federated are responding to them. The Board's evaluation process is evolutionary. The criteria considered and the emphasis placed on relevant criteria change in recognition of changing circumstances in the mutual fund marketplace.With respect to the Fund's expenses in particular, the Board has found the use of comparisons to other mutual funds with comparable investment programs to be particularly useful, given the high degree of competition in the mutual fund business. The Board focused on comparisons with other similar mutual funds more heavily than non-mutual fund products or services because it is believed that they are more relevant. For example, other mutual funds are the products most like the Fund, they are readily available to Fund shareholders as alternative investment vehicles, and they are the type of investment vehicle in fact chosen and maintained by the Fund's anticipated investors. The range of their fees and expenses therefore appears to be a generally reliable indication of what consumers have found to be reasonable in the precise marketplace in which the Fund will compete. In this regard, the Senior Officer also reviewed Federated's fees for providing advisory services to products outside the Federated family of funds (e.g., institutional and separate accounts). He concluded that mutual funds and institutional accounts are inherently different products. Those differences included, but are not limited to, different types of targeted investors; being subject to different laws and regulations; different legal structures; different average account sizes; different associated costs; different portfolio management techniques made necessary by different cash flows; and portfolio manager time spent in review of securities pricing. The Senior Officer did not consider these fee schedules to be determinative in judging the appropriateness of mutual fund advisory contracts.
The Senior Officer reviewed information compiled by Federated, using data supplied by independent fund ranking organizations, regarding the fees charged by other mutual funds, noting his view that comparisons to fund peer groups are highly important in judging the reasonableness of proposed fees.
The Senior Officer's report produced in connection with the original approval of the advisory contract for the Fund in November 2008, noted that Clover Capital, as manager of the Predecessor Fund, direct accounts, a model portfolio and separate managed accounts, generated consistent and strong performance using substantially the same investment strategy to be utilized by the Fund. Because the Fund will employ the same key management personnel and investment strategy as the Predecessor Fund, the nature and quality of the management of the Fund is expected to reflect that of the Predecessor Fund. This in turn assisted the Board in reaching a conclusion that the nature, extent and quality of the Adviser's investment management services were such as to warrant the approval of the advisory contract.
Annual Shareholder Report31
The Board reviewed the proposed fees and other expenses of the Fund and was satisfied that the proposed overall expense structure of the Fund appeared to be appropriate. In this regard, the Senior Officer's report indicated that the proposed management fees, after projected waivers, were reasonable. The Board also concluded that the nature, quality and scope of other services to be provided to the Fund were reasonable.The Board also considered possible indirect benefits that may accrue to the Adviser and its affiliates as a result of the Acquisition. Other indirect benefits that may accrue to the Adviser and its affiliates as a result of the Adviser's relationship with the Fund are essentially impossible to apply before the Fund has experienced any meaningful operating history. Nevertheless, in connection with the Board's governance of other Federated funds, it should be noted that the Board regularly receives financial information about Federated, including reports on the compensation and benefits Federated derives from its relationships with the other Federated funds. These reports cover not only the fees under the advisory contracts, but also fees received by Federated's subsidiaries for providing other services to the Federated funds under separate contracts (e.g., for serving as the Federated funds' administrator). The reports also discuss any indirect benefit Federated may derive from its receipt of research services from brokers who execute Federated fund trades. In addition, the Board considered the fact that, in order for a fund to be competitive in the marketplace, Federated and its affiliates frequently waive fees and/or reimburse expenses and have disclosed to fund investors and/or indicated to the Board their intention to do so in the future, where appropriate.
The Senior Officer commented on reports furnished by Federated of estimates of components of the Fund's expenses using allocation methodologies specified by the Senior Officer and sales projections made by Federated. The Senior Officer noted that, although they may apply consistent allocation processes, the inherent difficulties in allocating costs (and the unavoidable arbitrary aspects of that exercise), particularly when projecting an uncertain asset base, and the lack of consensus on how to allocate those costs may render such allocation reports unreliable. The Senior Officer determined that such allocation reports were of limited use.
The Board and the Senior Officer also reviewed data compiled by Federated comparing profitability information for Federated to other publicly held fund management companies. In this regard, the Senior Officer noted the limited availability of such information, but nonetheless concluded that Federated's profit margins did not appear to be excessive and the Board agreed.
The Senior Officer's evaluation also discussed the notion of possible realization of “economies of scale” as a fund grows larger. The Board considered in this regard that the Adviser has made significant and long-term investments in areas that support all of the Federated funds, such as personnel and processes for the portfolio management, compliance, and risk management functions; and systems technology; and that the benefits of these efforts (as well as any Annual Shareholder Report32
economies, should they exist) were likely to be enjoyed by the fund complex as a whole. Finally, the Board also noted the absence of any applicable regulatory or industry guidelines on this subject, which (as discussed in the Senior Officer's evaluation) is compounded by the lack of any common industry practice or general pattern with respect to structuring fund advisory fees with “breakpoints” that serve to reduce the fee as the fund attains a certain size. The Senior Officer did not recommend institution of breakpoints in pricing Federated's proposed advisory services to the Fund at this time.The Board based its decision to approve the proposed advisory contract on the totality of the circumstances and relevant factors, and with a view to past and future long-term considerations. As noted, not all of the factors and considerations identified above were necessarily relevant to the Fund, nor did the Board consider any one of them to be determinative. With respect to the factors that are relevant, the Board's decision to approve the contract reflects its determination that, based upon the information previously requested and supplied, Federated's proposal to establish and manage the Fund, and its past performance and actions in providing services to other mutual funds (which the Board has found to be satisfactory with respect to such other funds), provide a satisfactory basis to support the business decision to continue the existing arrangements.
Annual Shareholder Report33
Voting Proxies on Fund Portfolio SecuritiesA description of the policies and procedures that the Fund uses to determine how to vote proxies, if any, relating to securities held in the Fund's portfolio is available, without charge and upon request, by calling 1-800-341-7400. A report on “Form N-PX” of how the Fund voted any such proxies during the most recent 12-month period ended June 30 is available from Federated's Web site at FederatedInvestors.com. To access this information from the “Products” section of the Web site, click on the “Prospectuses and Regulatory Reports” link under “Related Information,” then select the appropriate link opposite the name of the Fund; or select the name of the Fund and from the Fund's page, click on the “Prospectuses and Regulatory Reports” link. Form N-PX filings are also available at the SEC's Web site at www.sec.gov.
Quarterly Portfolio Schedule
The Fund files with the SEC a complete schedule of its portfolio holdings, as of the close of the first and third quarters of its fiscal year, on “Form N-Q.” These filings are available on the SEC's Web site at www.sec.gov and may be reviewed and copied at the SEC's Public Reference Room in Washington, DC. (Call 1-800-SEC-0330 for information on the operation of the Public Reference Room.) You may also access this information from the “Products” section of Federated's Web site at FederatedInvestors.com by clicking on “Portfolio Holdings” under “Related Information,” then selecting the appropriate link opposite the name of the Fund; or select the name of the Fund and from the Fund's page, click on the “Portfolio Holdings” link.
Annual Shareholder Report34
Mutual funds are not bank deposits or obligations, are not guaranteed by any bank and are not insured or guaranteed by the U.S. government, the Federal Deposit Insurance Corporation, the Federal Reserve Board or any other government agency. Investment in mutual funds involves investment risk, including the possible loss of principal.
This Report is authorized for distribution to prospective investors only when preceded or accompanied by the Fund's Prospectus, which contains facts concerning its objective and policies, management fees, expenses and other information.
Federated Clover Mid Value Fund
Federated Investors Funds
4000 Ericsson Drive
Warrendale, PA 15086-7561
Contact us at FederatedInvestors.com
or call 1-800-341-7400.
Federated Securities Corp., Distributor
Cusip 314172297
41197 (11/09)
Federated is a registered mark of Federated Investors, Inc.
2009 Federated Investors, Inc.
Federated Clover Small Value Fund(Successor to the Touchstone Diversified Small Cap Value Fund Established 1996)
A Portfolio of Federated Equity Funds
ANNUAL SHAREHOLDER REPORTSeptember 30, 2009
Class A Shares
Class C Shares
FINANCIAL HIGHLIGHTS
SHAREHOLDER EXPENSE EXAMPLE
MANAGEMENT'S DISCUSSION OF FUND PERFORMANCE
PORTFOLIO OF INVESTMENTS SUMMARY TABLE
PORTFOLIO OF INVESTMENTS
STATEMENT OF ASSETS AND LIABILITIES
STATEMENT OF OPERATIONS
STATEMENT OF CHANGES IN NET ASSETS
NOTES TO FINANCIAL STATEMENTS
REPORT OF INDEPENDENT REGISTERED PUBLIC ACCOUNTING FIRM
BOARD OF TRUSTEES AND TRUST OFFICERS
EVALUATION AND APPROVAL OF ADVISORY CONTRACT
VOTING PROXIES ON FUND PORTFOLIO SECURITIES
QUARTERLY PORTFOLIO SCHEDULE
Not FDIC Insured * May Lose Value * No Bank Guarantee
Financial Highlights - Class A Shares
(For a Share Outstanding Throughout Each Period)
| Year Ended September 30 | 20091,2 | 20081,3 | 20071,3,4 |
| Net Asset Value, Beginning of Period | $17.97 | $27.81 | $38.31 |
| Income From Investment Operations: | | | |
| Net investment income | 0.105 | 0.05 | 0.03 |
| Net realized and unrealized gain (loss) on investments | (1.07) | (2.30) | 0.54 |
| TOTAL FROM INVESTMENT OPERATIONS | (0.97) | (2.25) | 0.57 |
| Less Distributions: | | | |
| Distributions from net investment income | (0.12) | (0.11) | — |
| Distributions from net realized gain on investments | (0.81) | (7.48) | (11.07) |
| TOTAL DISTRIBUTIONS | (0.93) | (7.59) | (11.07) |
| Net Asset Value, End of Period | $16.07 | $17.97 | $27.81 |
| Total Return6 | (3.41)% | (8.85)% | 1.68% |
| Ratios to Average Net Assets: | | | |
| Net expenses | 1.45% | 1.45% | 1.28%7 |
| Net investment income | 1.12% | 0.67% | 0.23%7 |
| Expense waiver/reimbursement8 | 0.11% | 4.42% | 0.53%7 |
| Supplemental Data: | | | |
| Net assets, end of period (000 omitted) | $102,599 | $625 | $205 |
| Portfolio turnover | 68% | 67% | 79% |
| 1 | Touchstone Diversified Small Cap Value Fund (the “Predecessor Fund”) was reorganized into Federated Clover Small Value Fund (the “Fund”) as of the close of business on August 28, 2009. The Fund is the successor to the Predecessor Fund. The performance information and financial information presented incorporates the operations of the Predecessor Fund, which, as a result of the reorganization, are the Fund's operations. See Note 2 to the Financial Statements. |
| 2 | Beginning with the year ended September 30, 2009, the Fund was audited by KPMG LLP. The previous years were audited by another independent registered public accounting firm. |
| 3 | Due to the reorganization: (1) the number of outstanding shares of the Predecessor Fund decreased by a factor of 1.42; and (2) since the Predecessor Fund's total number of shares outstanding decreased, the net asset value increased. The reorganization did not affect the value of the Predecessor Fund's net assets or each shareholder's proportional ownership interest in those assets. Per share data has been restated, where applicable. |
| 4 | Reflects operations for the period from November 20, 2006 (commencement of operations) to September 30, 2007. |
| 5 | Per share number has been calculated using the average shares method. |
| 6 | Based on net asset value, which does not reflect the sales charge, redemption fee or contingent deferred sales charge, if applicable. Total returns for periods of less than one year are not annualized. |
| 7 | Computed on an annualized basis. |
| 8 | This expense decrease is reflected in both the net expense and the net investment income ratios shown above. |
- See Notes which are an integral part of the Financial Statements
Annual Shareholder Report1
Financial Highlights - Class C Shares
(For a Share Outstanding Throughout Each Period)
| Year Ended September 30 | 20091,2 | 20081,3 | 20071,3,4 |
| Net Asset Value, Beginning of Period | $17.88 | $27.90 | $38.60 |
| Income From Investment Operations: | | | |
| Net investment income (loss) | 0.015 | (0.01) | (0.06) |
| Net realized and unrealized gain (loss) on investments | (1.01) | (2.44) | 0.43 |
| TOTAL FROM INVESTMENT OPERATIONS | (1.00) | (2.45) | 0.37 |
| Less Distributions: | | | |
| Distributions from net investment income | (0.05) | (0.09) | — |
| Distributions from net realized gain on investments | (0.81) | (7.48) | (11.07) |
| TOTAL DISTRIBUTIONS | (0.86) | (7.57) | (11.07) |
| Net Asset Value, End of Period | $16.02 | $17.88 | $27.90 |
| Total Return6 | (3.64)% | (9.56)% | 1.26% |
| Ratios to Average Net Assets: | | | |
| Net expenses | 2.20% | 2.20% | 1.86%7 |
| Net investment income (loss) | 0.08% | (0.09)% | (0.38)%7 |
| Expense waiver/reimbursement8 | 0.93% | 2.19% | — |
| Supplemental Data: | | | |
| Net assets, end of period (000 omitted) | $5,071 | $619 | $79 |
| Portfolio turnover | 68% | 67% | 79% |
| 1 | Touchstone Diversified Small Cap Value Fund (the “Predecessor Fund”) was reorganized into Federated Clover Small Value Fund (the “Fund”) as of the close of business on August 28, 2009. The Fund is the successor to the Predecessor Fund. The performance information and financial information presented incorporates the operations of the Predecessor Fund, which, as a result of the reorganization, are the Fund's operations. See Note 2 to the Financial Statements. |
| 2 | Beginning with the year ended September 30, 2009, the Fund was audited by KPMG LLP. The previous years were audited by another independent registered public accounting firm. |
| 3 | Due to the reorganization: (1) the number of outstanding shares of the Predecessor Fund decreased by a factor of 1.43; and (2) since the Predecessor Fund's total number of shares outstanding decreased, the net asset value increased. The reorganization did not affect the value of the Predecessor Fund's net assets or each shareholder's proportional ownership interest in those assets. Per share data has been restated, where applicable. |
| 4 | Reflects operations for the period from November 20, 2006 (commencement of operations) to September 30, 2007. |
| 5 | Per share number has been calculated using the average shares method. |
| 6 | Based on net asset value, which does not reflect the sales charge, redemption fee or contingent deferred sales charge, if applicable. Total returns for periods of less than one year are not annualized. |
| 7 | Computed on an annualized basis. |
| 8 | This expense decrease is reflected in both the net expense and the net investment income ratios shown above. |
- See Notes which are an integral part of the Financial Statements
Annual Shareholder Report2
Shareholder Expense Example (unaudited)
As a shareholder of the Fund, you incur two types of costs: (1) transaction costs, including sales charges (loads) on purchase or redemption payments; and (2) ongoing costs, including management fees and to the extent applicable, distribution (12b-1) fees and/or shareholder services fees and other Fund expenses. This Example is intended to help you to understand your ongoing costs (in dollars) of investing in the Fund and to compare these costs with the ongoing costs of investing in other mutual funds. It is based on an investment of $1,000 invested at the beginning of the period and held for the entire period from April 1, 2009 to September 30, 2009.
ACTUAL EXPENSES
The first section of the table below provides information about actual account values and actual expenses. You may use the information in this section, together with the amount you invested, to estimate the expenses that you incurred over the period. Simply divide your account value by $1,000 (for example, an $8,600 account value divided by $1,000 = 8.6), then multiply the result by the number in the first section under the heading entitled “Expenses Paid During Period” to estimate the expenses attributable to your investment during this period.
HYPOTHETICAL EXAMPLE FOR COMPARISON PURPOSES
The second section of the table below provides information about hypothetical account values and hypothetical expenses based on the Fund's actual expense ratio and an assumed rate of return of 5% per year before expenses, which is not the Fund's actual return. Thus, you should not use the hypothetical account values and expenses to estimate the actual ending account balance or your expenses for the period. Rather, these figures are required to be provided to enable you to compare the ongoing costs of investing in the Fund with other funds. To do so, compare this 5% hypothetical example with the 5% hypothetical examples that appear in the shareholder reports of the other funds.
Annual Shareholder Report3
Please note that the expenses shown in the table are meant to highlight your ongoing costs only and do not reflect any transaction costs, such as sales charges (loads) on purchase or redemption payments. Therefore, the second section of the table is useful in comparing ongoing costs only, and will not help you determine the relative total costs of owning different funds. In addition, if these transaction costs were included, your costs would have been higher. | Beginning
Account Value
4/1/2009 | Ending
Account Value
9/30/2009 | Expenses Paid
During Period1 |
| Actual: | | | |
| Class A Shares | $1,000 | $1,499.50 | $9.09 |
| Class C Shares | $1,000 | $1,494.60 | $13.76 |
Hypothetical (assuming a 5% return
before expenses): | | | |
| Class A Shares | $1,000 | $1,017.80 | $7.33 |
| Class C Shares | $1,000 | $1,014.04 | $11.11 |
| 1 | Expenses are equal to the Fund's annualized net expense ratios, multiplied by the average account value over the period, multiplied by 183/365 (to reflect the one-half year period). The annualized net expense ratios are as follows: |
| Class A Shares | 1.45% |
| Class C Shares | 2.20% |
Annual Shareholder Report4
Performance data quoted represents past performance which is no guarantee of future results. Investment return and principal value will fluctuate so that an investor's shares, when redeemed, may be worth more or less than their original cost. Mutual fund performance changes over time and current performance may be lower or higher than what is stated. For current to the most recent month-end performance and after-tax returns, visit FederatedInvestors.com or call 1-800-341-7400.
Management's Discussion of Fund Performance (unaudited)
For the fiscal year ending September 30, 2009, the Federated Clover Small Value Fund1 produced a total return, based on net asset value, of -3.41% for Class A Shares and - -3.64% for Class C Shares. For the same period, the total return for the Russell 2000® Value Index2 benchmark was -12.61%. The Fund's total return for the fiscal year reflected actual cash flows, transaction costs and other expenses which were not reflected in the total return of the Russell 2000® Value Index.
The following discussion will focus on the performance of the Fund's
Class A Shares.
MARKET OVERVIEW
The first half of the Fund's fiscal year was characterized by extreme downside volatility related to the financial and housing industry crises. A deleveraging consumer, high unemployment and concerns regarding the impact of the government's stimulus programs on the value of the dollar weighed heavily on investor sentiment. During this period, the broad market, as measured by the Standard & Poor's 500 Index (S&P 500),3 declined approximately 40%. The second half of the fiscal year was characterized by “less worse and, maybe, slightly better” economic reports which were labeled as “green shoots” by the press. Despite lingering economic woes, the ever-forward-looking stock market took its cue accordingly in anticipation of stabilization in the near future. Off the March lows, the broad market staged the largest rally in decades, with the S&P 500 recording an astonishing gain of nearly 60% as of the close on September 30, 2009.
| 1 | Federated Clover Small Value Fund is the successor to Touchstone Diversified Small Cap Value Fund, a portfolio of Touchstone Funds Group Trust, pursuant to a reorganization that took place as of the close of business on August 28, 2009. The information presented above, for the periods prior to August 28, 2009, is historical information for Touchstone Diversified Small Cap Value Fund. |
| 2 | The Russell 2000® Value Index offers investors access to the small-cap value segment of the U.S. equity universe. The Russell 2000® Value Index is constructed to provide a comprehensive and unbiased barometer of the small-cap value market. Based on ongoing empirical research of investment manager behavior, the methodology used to determine value probability approximates the aggregate small-cap value manager's opportunity set. The index is unmanaged, and unlike the Fund, is not affected by cash flows. It is not possible to invest directly in an index. |
| 3 | The S&P 500 Index is an unmanaged capitalization-weighted index of 500 stocks designed to measure performance of the broad domestic economy through changes in the aggregate market value of 500 stocks representing all major industries. The index is unmanaged and, unlike the Fund, is not affected by cash flows. It is not possible to invest directly in an index. |
Annual Shareholder Report5
FUND PERFORMANCE
The key driver of performance for the Federated Clover Small Value Fund4 versus the Russell 2000® Value Index was strong stock selection across multiple sectors and industries. Specifically, there was good stock selection within the Financials, Technology, Energy and Health Care sectors. Small sector over and underweights relative to the Russell 2000® Value Index also contributed positively to performance. Detracting from performance during the reporting period was stock selection within the Consumer Discretionary space. The Fund's outperformance during a volatile year was due to a focus on deploying capital to inexpensive stocks with improving fundamentals and Fund management's adherence to prudent risk controls in the Fund.
Individual stocks that contributed to the Fund's outperformance resided in multiple sectors across the Fund. Cliffs Natural Resources in the Materials sector, up 122%, an iron ore producer, benefitted from strong demand for its natural resources. NBTY, a vitamin manufacturer and supplier, increased 166% due to strong demand for its products and the accretion from acquisitions realized during the year. Cooper Tire and Rubber increased 209% in the Fund's portfolio which was opportunistically purchased when it was inexpensive relative to its fundamental outlook. TriQuint Semiconductor increased 72% within the Fund as demand for their semiconductor products improved throughout the year.
The top five positive contributors were: TriQuint Semiconductor, NBTY, Cooper Tire, URS Corp. and Cliffs Natural Resources.
POSITIONING AND STRATEGY
During the reporting period, many of the Fund's stock selections focused on companies with the financial strength to weather the difficult environment. The Fund's emphasis on companies with consistent cash flows and strong balance sheets is an integral part of the Advisers investment process. Across various industries during the fiscal year, reductions in productive capacity presented opportunities for stronger companies to maintain or increase market share while weaker competitors struggled to survive.
| 4 | Because the Fund invests in smaller companies, it may be more volatile and subject to greater short-term risk than funds that invest in larger companies. Smaller companies may have limited resources, product lines and markets and their securities may trade less frequently and in more limited volumes than securities of larger companies. |
Annual Shareholder Report6
Elevated volatility of stock prices during the reporting period, especially during the first half of the fiscal year, presented opportunities for the Fund to purchase companies whose long-term intrinsic value appeared to be grossly underestimated by the market. Fund management observed situations in which concerns regarding issues, such as bank nationalization, debt refinancing and declining consumer demand, created what management believed to be attractive opportunities in several securities. Fund management's disciplined approach to evaluating these situations resulted in purchases across multiple sectors within the portfolio.The Fund concluded the fiscal year overweight relative to the benchmark in Information Technology, Materials and Energy, while being underweight in the Financial Services, Utilities and Consumer Discretionary sectors. The Fund's over or underweight relative to its benchmark are driven not by economic forecasts; but rather, by the analysts' view of company-specific opportunities within each sector. While the Fund's managers remain cognizant of macroeconomic factors that may affect fund performance, the investment approach focuses instead on bottom-up, fundamental analysis that seeks to construct a well-diversified,5 risk-controlled portfolio.
The Fund continued to generate alpha based on fundamental, bottom-up stock selection and to a lesser degree from deviations to our sector weightings versus our benchmark. The sector deviations that impacted the Fund were an underweight in Financials and small overweights in the Technology and Materials sectors.
| 5 | Diversification does not assure a profit nor protect against loss. |
Annual Shareholder Report7
GROWTH OF A $10,000 INVESTMENT - CLASS a SHARES1
The graph below illustrates the hypothetical investment of $10,0002 in the Federated Clover Small Value Fund (the “Fund”) from September 30, 1999 to September 30, 2009, compared to the Russell 2000® Value Index (Russell 2000® Value).3
| Average Annual Total Returns4 for the Period Ended 9/30/2009 | |
| 1 Year | -8.72% |
| 5 Years | 2.76% |
| 10 Years | 9.07% |
Performance data quoted represents past performance which is no guarantee of future results. Investment return and principal value will fluctuate so that an investor's shares, when redeemed, may be worth more or less than their original cost. Mutual fund performance changes over time and current performance may be lower or higher than what is stated. For current to the most recent month-end performance and after-tax returns, visit FederatedInvestors.com or call 1-800-341-7400. Returns shown do not reflect the deduction of taxes that a shareholder would pay on fund distributions or the redemption of fund shares. Mutual funds are not obligations of or guaranteed by any bank and are not federally insured. Total returns shown include the maximum sales charge of 5.50%.
| 1 | Federated Clover Small Value Fund is the successor to Touchstone Diversified Small Cap Value Fund, a portfolio of Touchstone Funds Group Trust, pursuant to a reorganization that took place as of the close of business on August 28, 2009. The information presented above, for the periods prior to August 28, 2009, is historical information for Touchstone Diversified Small Cap Value Fund. |
| 2 | Represents a hypothetical investment of $10,000 in the Fund after deducting the maximum sales charge of 5.50% ($10,000 investment minus $550 sales charges = $9,450). The Fund's performance assumes the reinvestment of all dividends and distributions. The Russell 2000® Value has been adjusted to reflect reinvestment of dividends on securities in the index. |
| 3 | The Russell 2000® Value is not adjusted to reflect sales charges, expenses or other fees that the Securities and Exchange Commission (SEC) requires to be reflected in the Fund's performance. The index is unmanaged, and unlike the Fund, is not affected by cash flows. It is not possible to invest directly in an index. |
| 4 | Total returns quoted reflect all applicable sales charges. |
Annual Shareholder Report8
GROWTH OF A $10,000 INVESTMENT - CLASS c SHARES1
The graph below illustrates the hypothetical investment of $10,0002 in the Federated Clover Small Value Fund (the “Fund”) from September 30, 1999 to September 30, 2009, compared to the Russell 2000® Value Index (Russell 2000® Value).3
| Average Annual Total Returns4 for the Period Ended 9/30/2009 | |
| 1 Year | -4.54% |
| 5 Years | 3.30% |
| 10 Years | 8.95% |
Performance data quoted represents past performance which is no guarantee of future results. Investment return and principal value will fluctuate so that an investor's shares, when redeemed, may be worth more or less than their original cost. Mutual fund performance changes over time and current performance may be lower or higher than what is stated. For current to the most recent month-end performance and after-tax returns, visit FederatedInvestors.com or call 1-800-341-7400. Returns shown do not reflect the deduction of taxes that a shareholder would pay on fund distributions or the redemption of fund shares. Mutual funds are not obligations of or guaranteed by any bank and are not federally insured. Total returns shown include the maximum contingent deferred sales charge of 1.00%.
| 1 | Federated Clover Small Value Fund is the successor to Touchstone Diversified Small Cap Value Fund, a portfolio of Touchstone Funds Group Trust, pursuant to a reorganization that took place as of the close of business on August 28, 2009. The information presented above, for the periods prior to August 28, 2009, is historical information for Touchstone Diversified Small Cap Value Fund. |
| 2 | Represents a hypothetical investment of $10,000 in the Fund. A 1.00% contingent deferred sales charge would be applied in any redemption less than one year from the purchase date. The Fund's performance assumes the reinvestment of all dividends and distributions. The Russell 2000® Value has been adjusted to reflect reinvestment of dividends on securities in the index. |
| 3 | The Russell 2000® Value is not adjusted to reflect sales charges, expenses or other fees that the SEC requires to be reflected in the Fund's performance. The index is unmanaged, and unlike the Fund, is not affected by cash flows. It is not possible to invest directly in an index. |
| 4 | Total returns quoted reflect all applicable contingent deferred sales charges. |
Annual Shareholder Report9
Portfolio of Investments Summary Table (unaudited)
At September 30, 2009, the Fund's sector composition1 was as follows:
| Sector Composition | | Percentage of
Total Net Assets |
| Financials | | 27.5% |
| Industrials | | 16.6% |
| Information Technology | | 14.3% |
| Consumer Discretionary | | 9.7% |
| Materials | | 8.6% |
| Energy | | 7.4% |
| Health Care | | 4.5% |
| Utilities | | 4.4% |
| Consumer Staples | | 3.2% |
| Cash Equivalents2 | | 3.1% |
| Other Assets and Liabilities — Net3 | | 0.7% |
| TOTAL | | 100.0% |
| 1 | Except for Cash Equivalents and Other Assets and Liabilities, sector classifications are based upon, and individual portfolio securities are assigned to, the classifications of the Global Industry Classification Standard (GICS) except that the Adviser assigns a classification to securities not classified by the GICS and to securities for which the Adviser does not have access to the classification made by the GICS. |
| 2 | Cash Equivalents include any investments in money market mutual funds and/or overnight repurchase agreements. |
| 3 | Assets, other than investments in securities, less liabilities. See Statement of Assets and Liabilities. |
Annual Shareholder Report10
Portfolio of Investments
September 30, 2009
|
| Shares | | | Value |
| | COMMON STOCKS – 96.2% | |
| | Consumer Discretionary – 9.7% | |
| 64,180 | | Asbury Automotive Group, Inc. | 813,802 |
| 147,940 | | Brown Shoe Co., Inc. | 1,186,479 |
| 89,442 | 1 | Build-A-Bear Workshop, Inc. | 435,583 |
| 79,470 | 1 | Chicos Fas, Inc. | 1,033,110 |
| 52,660 | | Cooper Tire & Rubber Co. | 925,763 |
| 22,650 | | Ethan Allen Interiors, Inc. | 373,725 |
| 97,080 | 1 | Hot Topic, Inc. | 727,129 |
| 40,150 | 1 | JAKKS Pacific, Inc. | 574,948 |
| 133,575 | | Jackson Hewitt Tax Service, Inc. | 681,233 |
| 2,250 | | Ryland Group, Inc. | 47,408 |
| 64,210 | | Service Corp. International | 450,112 |
| 72,625 | 1 | Skechers USA, Inc., Class A | 1,244,792 |
| 85,500 | | Spartan Motors, Inc. | 439,470 |
| 12,400 | 1 | Standard Pacific Corp. | 45,756 |
| 45,010 | 1 | Tenneco Automotive, Inc. | 586,930 |
| 187,445 | 1 | Wet Seal, Inc., Class A | 708,542 |
| 65,635 | 1 | Zumiez Inc. | 1,077,070 |
| | TOTAL | 11,351,852 |
| | Consumer Staples – 3.2% | |
| 158,875 | 1 | Alliance One International, Inc. | 711,760 |
| 42,750 | 1 | Elizabeth Arden, Inc. | 503,168 |
| 34,875 | 1 | NBTY, Inc. | 1,380,352 |
| 27,245 | | Spartan Stores, Inc. | 384,972 |
| 20,055 | 1 | TreeHouse Foods, Inc. | 715,362 |
| | TOTAL | 3,695,614 |
| | Energy – 7.4% | |
| 37,200 | | Cabot Oil & Gas Corp., Class A | 1,329,900 |
| 21,919 | 1 | Forest Oil Corp. | 428,955 |
| 19,360 | | Gulf Island Fabrication, Inc. | 362,806 |
| 11,400 | 1 | Gulfmark Offshore, Inc. | 373,236 |
| 108,030 | 1 | Helix Energy Solutions Group, Inc. | 1,618,289 |
| 29,970 | | Holly Corp. | 767,831 |
| 12,765 | 1 | Hornbeck Offshore Services, Inc. | 351,803 |
| 25,610 | 1 | Mariner Energy, Inc. | 363,150 |
Annual Shareholder Report11
|
| 49,935 | 1 | Natural Gas Services Group, Inc. | 879,855 |
| 8,325 | | Nordic American Tanker Shipping Ltd. | 246,254 |
| 16,135 | | Penn Virginia Corp. | 369,653 |
| 11,490 | | St. Mary Land & Exploration Co. | 372,965 |
| 155,025 | 1 | USEC, Inc. | 727,067 |
| 8,675 | 1 | Whiting Petroleum Corp. | 499,507 |
| | TOTAL | 8,691,271 |
| | Financials – 27.5% | |
| 48,615 | | American Campus Communities, Inc. | 1,305,313 |
| 133,945 | | Anworth Mortgage Asset Corp. | 1,055,487 |
| 103,055 | | Apollo Investment Corp. | 984,175 |
| 77,045 | | Ares Capital Corp. | 849,036 |
| 29,483 | 1 | Argo Group International Holdings Ltd. | 992,987 |
| 33,205 | | Aspen Insurance Holdings Ltd. | 878,936 |
| 18,075 | | Assured Guaranty Ltd. | 351,017 |
| 12,325 | | Cash America International, Inc. | 371,722 |
| 17,950 | | City Holding Co. | 535,090 |
| 42,380 | | Columbia Banking Systems, Inc. | 701,389 |
| 20,900 | | Delphi Financial Group, Inc., Class A | 472,967 |
| 54,420 | | Dime Community Bancorp, Inc. | 622,021 |
| 88,070 | | FNB Corp. (PA) | 626,178 |
| 49,975 | | First Niagara Financial Group, Inc. | 616,192 |
| 35,394 | | FirstMerit Corp. | 673,548 |
| 61,690 | | Flushing Financial Corp. | 703,266 |
| 27,890 | | Highwoods Properties, Inc. | 877,140 |
| 22,455 | | Home Properties, Inc. | 967,586 |
| 23,005 | | Iberiabank Corp. | 1,048,108 |
| 33,080 | | Independent Bank Corp. - - Massachusetts | 732,060 |
| 44,545 | | LTC Properties, Inc. | 1,070,862 |
| 102,910 | | MFA Mortgage Investments, Inc. | 819,164 |
| 98,030 | | MGIC Investment Corp. | 726,402 |
| 119,245 | | Maiden Holdings Ltd. | 866,911 |
| 57,255 | | Montpelier Re Holdings Ltd. | 934,402 |
| 47,350 | | Nara Bancorp, Inc. | 329,083 |
| 98,885 | | National Penn Bancshares, Inc. | 604,187 |
| 59,675 | | National Retail Properties, Inc. | 1,281,222 |
| 77,895 | | Newalliance Bancshares, Inc. | 833,476 |
Annual Shareholder Report12
|
| 55,225 | 1 | Ocwen Financial Corp. | 625,147 |
| 37,935 | | Platinum Underwriters Holdings Ltd. | 1,359,590 |
| 22,696 | | Potlatch Corp. | 645,701 |
| 16,625 | 1 | ProAssurance Corp. | 867,659 |
| 19,675 | | Prosperity Bancshares, Inc. | 684,493 |
| 15,100 | 1 | SVB Financial Group | 653,377 |
| 266,485 | | South Financial Group, Inc. | 391,733 |
| 104,742 | | Sterling Bancshares, Inc. | 765,664 |
| 17,675 | | Stewart Information Services Corp. | 218,640 |
| 57,785 | | Sun Communities, Inc. | 1,243,533 |
| 37,280 | | Trustmark Corp. | 710,184 |
| 77,600 | | Umpqua Holdings Corp. | 822,560 |
| 20,720 | | Washington Federal, Inc. | 349,339 |
| | TOTAL | 32,167,547 |
| | Health Care – 4.5% | |
| 178,760 | 1 | Akorn, Inc. | 244,901 |
| 38,920 | 1 | Albany Molecular Research, Inc. | 337,047 |
| 19,025 | 1 | Amerigroup Corp. | 421,784 |
| 36,040 | 1 | Celera Corporation | 224,529 |
| 9,120 | | Chemed Corp. | 400,277 |
| 14,650 | 1 | Endo Pharmaceuticals Holdings, Inc. | 331,530 |
| 47,420 | 1 | Inspire Pharmaceuticals, Inc. | 247,533 |
| 45,955 | | MDS, Inc. | 376,372 |
| 16,005 | 1 | Magellan Health Services, Inc. | 497,115 |
| 28,955 | 1 | Par Pharmaceutical Cos., Inc. | 622,822 |
| 21,950 | 1 | Parexel International Corp. | 298,301 |
| 21,370 | 1 | Salix Pharmaceuticals Ltd. | 454,326 |
| 9,530 | | Teleflex, Inc. | 460,394 |
| 32,165 | 1 | ViroPharma, Inc. | 309,427 |
| | TOTAL | 5,226,358 |
| | Industrials – 16.6% | |
| 17,448 | 1 | American Commercial Lines, Inc. | 508,086 |
| 25,705 | | Ampco-Pittsburgh Corp. | 683,496 |
| 51,420 | | Barnes Group, Inc. | 878,768 |
| 36,650 | | CDI Corp. | 514,933 |
| 39,905 | 1 | Ceradyne, Inc. | 731,459 |
| 53,775 | | Chicago Bridge & Iron Co., N.V. | 1,004,517 |
Annual Shareholder Report13
|
| 15,290 | 1 | Consolidated Graphics, Inc. | 381,486 |
| 17,710 | | Curtiss Wright Corp. | 604,442 |
| 32,360 | | Deluxe Corp. | 553,356 |
| 39,590 | 1 | Dyncorp International, Inc., Class A | 712,620 |
| 64,345 | | Eagle Bulk Shipping, Inc. | 330,090 |
| 25,785 | 1 | EnPro Industries, Inc. | 589,445 |
| 22,435 | 1 | Esterline Technologies Corp. | 879,676 |
| 36,275 | 1 | GrafTech International Ltd. | 533,243 |
| 35,550 | 1 | Hub Group, Inc. | 812,317 |
| 28,640 | | Hubbell, Inc., Class B | 1,202,880 |
| 75,900 | 1 | Interline Brands, Inc. | 1,278,915 |
| 201,725 | 1 | Jet Blue Airways Corp. | 1,206,315 |
| 27,635 | | OshKosh Truck Corp. | 854,751 |
| 54,980 | 1 | Pike Electric Corp. | 658,660 |
| 30,390 | 1 | School Specialty, Inc. | 720,851 |
| 69,000 | 1 | Seaspan Corp. | 617,550 |
| 16,000 | 1 | Thomas & Betts Corp. | 481,280 |
| 20,390 | | Triumph Group, Inc. | 978,516 |
| 106,625 | 1 | UAL Corp. | 983,082 |
| 15,433 | 1 | URS Corp. | 673,650 |
| | TOTAL | 19,374,384 |
| | Information Technology – 14.3% | |
| 76,225 | 1 | Arris Group, Inc. | 991,687 |
| 30,125 | 1 | Avocent Corp. | 610,634 |
| 31,465 | | Black Box Corp. | 789,457 |
| 96,020 | 1 | Brocade Communications Systems, Inc. | 754,717 |
| 27,810 | 1 | CSG Systems International, Inc. | 445,238 |
| 42,595 | | CTS Corp. | 396,134 |
| 16,900 | 1 | CommScope, Inc. | 505,817 |
| 18,640 | 1 | Digital River, Inc. | 751,565 |
| 99,530 | | EarthLink Network, Inc. | 837,047 |
| 71,440 | 1 | Fairchild Semiconductor International, Inc., Class A | 730,831 |
| 47,312 | 1 | Finisar Corp. | 457,978 |
| 52,570 | 1 | Insight Enterprises, Inc. | 641,880 |
| 29,360 | 1 | NICE-Systems Ltd., ADR | 893,718 |
| 127,595 | 1 | SeaChange International, Inc. | 956,962 |
| 92,475 | 1 | Sonicwall, Inc. | 776,790 |
Annual Shareholder Report14
|
| 74,610 | 1 | Symmetricom, Inc. | 386,480 |
| 104,275 | | Technitrol, Inc. | 960,373 |
| 225,245 | 1 | TriQuint Semiconductor, Inc. | 1,738,891 |
| 110,105 | | United Online, Inc. | 885,244 |
| 36,095 | 1 | Verifone Holdings, Inc. | 573,550 |
| 77,200 | 1 | Zoran Corp. | 889,344 |
| 32,785 | 1 | j2 Global Communications, Inc. | 754,383 |
| | TOTAL | 16,728,720 |
| | Materials – 8.6% | |
| 30,045 | 1 | Brush Engineered Materials, Inc. | 734,901 |
| 23,050 | | Cabot Corp. | 532,685 |
| 25,685 | | Carpenter Technology Corp. | 600,772 |
| 51,825 | 1 | Century Aluminum Co. | 484,564 |
| 25,910 | | Cliffs Natural Resources, Inc. | 838,448 |
| 149,325 | 1 | Hecla Mining Co. | 655,537 |
| 30,365 | | Innospec, Inc. | 447,884 |
| 22,345 | 1 | Intrepid Potash, Inc. | 527,118 |
| 98,210 | 1 | Louisiana-Pacific Corp. | 655,061 |
| 61,685 | | Myers Industries, Inc. | 664,347 |
| 20,555 | 1 | OM Group, Inc. | 624,666 |
| 22,825 | | Olympic Steel, Inc. | 654,849 |
| 38,800 | 1 | RTI International Metals | 966,508 |
| 47,135 | 1 | Rockwood Holdings, Inc. | 969,567 |
| 58,940 | | Spartech Corp. | 634,784 |
| | TOTAL | 9,991,691 |
| | Utilities – 4.4% | |
| 18,390 | | AGL Resources, Inc. | 648,615 |
| 33,030 | | Atmos Energy Corp. | 930,785 |
| 53,795 | | Avista Corp. | 1,087,735 |
| 18,425 | | Cleco Corp. | 462,099 |
| 20,420 | | MGE Energy, Inc. | 744,922 |
| 20,945 | | Northwestern Corp. | 511,686 |
| 40,105 | | Westar Energy, Inc. | 782,449 |
| | TOTAL | 5,168,291 |
| | TOTAL COMMON STOCKS
(IDENTIFIED COST $107,126,833) | 112,395,728 |
Annual Shareholder Report15
|
| | Mutual Fund – 3.1% | |
| 3,636,312 | 2,3 | Prime Value Obligations Fund, Institutional Shares, 0.30%
(AT NET ASSET VALUE) | 3,636,312 |
| | TOTAL INVESTMENTS — 99.3%
(IDENTIFIED COST $110,763,145)4 | 116,032,040 |
| | OTHER ASSETS AND LIABILITIES - NET — 0.7%5 | 799,865 |
| | TOTAL NET ASSETS — 100% | $116,831,905 |
| 1 | Non-income producing security. |
| 2 | Affiliated company. |
| 3 | 7-Day net yield. |
| 4 | The cost of investments for federal tax purposes amounts to $112,459,860. |
| 5 | Assets, other than investments in securities, less liabilities. See Statement of Assets and Liabilities. |
- Note: The categories of investments are shown as a percentage of total net assets at September 30, 2009.
- Various inputs are used in determining the value of the Fund's investments. These inputs are summarized in the three broad levels listed below:
- Level 1 — quoted prices in active markets for identical securities
- Level 2 — other significant observable inputs (including quoted prices for similar securities, interest rates, prepayment speeds, credit risk, etc.)
- Level 3 — significant unobservable inputs (including the Fund's own assumptions in determining the fair value of investments)
- The inputs or methodology used for valuing securities are not an indication of the risk associated with investing in those securities.
- The following is a summary of the inputs used, as of September 30, 2009, in valuing the Fund's assets carried at fair value:
| Valuation Inputs | | | | |
| Level 1 -
Quoted
Prices and
Investments in
Mutual Funds | Level 2 -
Other
Significant
Observable
Inputs | Level 3 -
Significant
Unobservable
Inputs | Total |
| Equity Securities: | | | | |
| Domestic | $104,160,934 | $ — | $ — | $104,160,934 |
| International | 8,234,794 | — | — | 8,234,794 |
| Mutual Fund | 3,636,312 | — | — | 3,636,312 |
| TOTAL | $116,032,040 | $ — | $ — | $116,032,040 |
- The following acronym is used throughout this portfolio:
- ADR — American Depositary Receipt
- See Notes which are an integral part of the Financial Statements
Annual Shareholder Report16
Statement of Assets and Liabilities
September 30, 2009
| Assets: | | |
| Total investments in securities, at value including $3,636,312 of investments in an affiliated issuer (Note 6) (identified cost $110,763,145) | | $116,032,040 |
| Cash | | 26,873 |
| Income receivable | | 107,136 |
| Receivable for investments sold | | 1,007,495 |
| Receivable for shares sold | | 34,888 |
| Other assets | | 158,018 |
| TOTAL ASSETS | | 117,366,450 |
| Liabilities: | | |
| Payable for shares redeemed | $369,045 | |
| Payable for investment adviser fee (Note 6) | 64,727 | |
| Payable for administrative personnel and services fee (Note 6) | 15,300 | |
| Payable for auditing fees | 26,000 | |
| Payable for portfolio accounting fees | 10,296 | |
| Payable for distribution services fee (Note 6) | 3,092 | |
| Payable for shareholder services fee (Note 6) | 22,202 | |
| Accrued expenses | 23,883 | |
| TOTAL LIABILITIES | | 534,545 |
| Net assets for 7,271,843 shares outstanding | | $116,831,905 |
| Net Assets Consist of: | | |
| Paid-in capital | | $134,332,379 |
| Net unrealized appreciation of investments | | 5,268,895 |
| Accumulated net realized loss on investments | | (22,819,247) |
| Undistributed net investment income | | 49,878 |
| TOTAL NET ASSETS | | $116,831,905 |
Annual Shareholder Report17
Statement of Assets and Liabilities — continued| Net Asset Value, Offering Price and Redemption Proceeds Per Share | | |
| Class A Shares: | | |
Net asset value per share ($102,599,036 ÷ 6,385,748 shares outstanding),
no par value, unlimited shares authorized | | $16.07 |
| Offering price per share (100/94.50 of $16.07) | | $17.01 |
| Redemption proceeds per share | | $16.07 |
| Class C Shares: | | |
Net asset value per share ($5,071,470 ÷ 316,602 shares outstanding),
no par value, unlimited shares authorized | | $16.02 |
| Offering price per share | | $16.02 |
| Redemption proceeds per share (99.00/100 of $16.02) | | $15.86 |
| Institutional Shares: | | |
Net asset value per share ($9,161,399 ÷ 569,493 shares outstanding),
no par value, unlimited shares authorized | | $16.09 |
| Offering price per share | | $16.09 |
| Redemption proceeds per share | | $16.09 |
- See Notes which are an integral part of the Financial Statements
Annual Shareholder Report18
Statement of Operations
Year Ended September 30, 2009
| Investment Income: | | | |
| Dividends (including $30,726 received from affiliated issuers (Note 6) ) | | | $2,133,950 |
| Income on securities loaned (Note 3) | | | 100,421 |
| TOTAL INCOME | | | 2,234,371 |
| Expenses: | | | |
| Investment adviser fee (Note 6) | | $746,701 | |
| Administrative personnel and services fee (Note 6) | | 174,517 | |
| Custodian fees | | 6,473 | |
| Transfer and dividend disbursing agent fees and expenses | | 123,953 | |
| Directors'/Trustees' fees | | 4,036 | |
| Auditing fees | | 10,643 | |
| Legal fees | | 10,536 | |
| Portfolio accounting fees | | 9,733 | |
| Distribution services fee — Class A Shares (Note 6) | | 3,766 | |
| Distribution services fee — Class C Shares (Note 6) | | 8,805 | |
| Shareholder services fee — Class A Shares (Note 6) | | 182,783 | |
| Shareholder services fee — Class C Shares (Note 6) | | 1,065 | |
| Share registration costs | | 49,256 | |
| Printing and postage | | 22,508 | |
| Miscellaneous | | 19,139 | |
| TOTAL EXPENSES | | 1,373,914 | |
| Waivers and Reimbursement (Note 6): | | | |
| Waiver/reimbursement of investment adviser fee | $(21,066) | | |
| Waiver of administrative personnel and services fee | (82,941) | | |
| TOTAL WAIVERS AND REIMBURSEMENT | | (104,007) | |
| Net expenses | | | 1,269,907 |
| Net investment income | | | 964,464 |
Realized and Unrealized Gain (Loss)
on Investments: | | | |
| Net realized loss on investments | | | (22,889,037) |
| Net change in unrealized depreciation of investments | | | 13,402,567 |
| Net realized and unrealized loss on investments | | | (9,486,470) |
| Change in net assets resulting from operations | | | $(8,522,006) |
- See Notes which are an integral part of the Financial Statements
Annual Shareholder Report19
Statement of Changes in Net Assets
| Year Ended September 30 |
2009 | 2008 |
| Increase (Decrease) in Net Assets | | |
| Operations: | | |
| Net investment income | $964,464 | $864,380 |
| Net realized gain (loss) on investments | (22,889,037) | 6,992,973 |
| Net change in unrealized appreciation/depreciation of investments | 13,402,567 | (21,709,390) |
| CHANGE IN NET ASSETS RESULTING FROM OPERATIONS | (8,522,006) | (13,852,037) |
| Distributions to Shareholders: | | |
| Distributions from net investment income | | |
| Class A Shares | (810,062) | (3,956) |
| Class C Shares | (2,791) | (2,925) |
| Class Z Shares | — | (857,493) |
| Distributions from net realized gain on investments | | |
| Class A Shares | (5,479,391) | (63,928) |
| Class C Shares | (30,402) | (23,056) |
| Class Z Shares | — | (41,283,195) |
| CHANGE IN NET ASSETS RESULTING FROM DISTRIBUTIONS TO SHAREHOLDERS | (6,322,646) | (42,234,553) |
| Share Transactions: | | |
| Proceeds from sale of shares | 17,673,694 | 20,865,758 |
| Exchange of Successor Fund shares in connection with the tax-free reorganization of Touchstone Diversified Small Cap Value Fund (Note 2) | 19,896,773 | — |
| Net asset value of shares issued to shareholders in payment of distributions declared | 6,154,348 | 41,170,287 |
| Cost of shares redeemed | (36,016,916) | (60,260,861) |
| CHANGE IN NET ASSETS RESULTING FROM SHARE TRANSACTIONS | 7,707,899 | 1,775,184 |
| Change in net assets | (7,136,753) | (54,311,406) |
| Net assets: | | |
| Beginning of period | 123,968,658 | 178,280,064 |
| End of period (including undistributed net investment income of $49,878 and $158,648, respectively) | $116,831,905 | $123,968,658 |
- See Notes which are an integral part of the Financial Statements
Annual Shareholder Report20
Notes to Financial Statements
September 30, 2009
1. ORGANIZATION
Federated Equity Funds (the “Trust”) is registered under the Investment Company Act of 1940, as amended (the “Act”), as an open-end management investment company. The Trust consists of 13 diversified portfolios. The financial statements included herein are only those of Federated Clover Small Value Fund (the “Fund”). The financial statements of the other portfolios are presented separately. The assets of each portfolio are segregated and a shareholder's interest is limited to the portfolio in which shares are held. Each portfolio pays its own expenses. The Fund offers three classes of shares: Class A Shares, Class C Shares and Institutional Shares. All shares of the Fund have equal rights with respect to voting, except on class-specific matters. The financial highlights of Institutional Shares are presented separately. The investment objective of the Fund is to seek capital appreciation.
2. REORGANIZATION
The Fund is the successor (Successor Fund) to Touchstone Diversified Small Cap Value Fund (the “Predecessor Fund”), a portfolio of Touchstone Funds Group Trust, pursuant to a reorganization that took place as of the close of business on August 28, 2009. On that date, Class A Shares, Class C Shares and Class Z Shares of the Predecessor Fund were exchanged for Class A Shares, Class C Shares and Class A Shares of the Fund, respectively. As a result of the reorganization on August 28, 2009, the Predecessor Fund became the accounting survivor. Accordingly, the performance information presented in the financial statements for the periods prior to August 28, 2009, is historical information of the Predecessor Fund.
On August 28, 2009, the Fund received a tax-free transfer of assets from Touchstone Diversified Small Cap Value Fund, as follows:
Shares of the
Fund Issued | Touchstone
Diversified Small
Cap Value
Fund
Net Assets
Received | Unrealized
Depreciation1 | Net Assets
of the Fund
Immediately
Prior to
Combination | Net Assets
of the Fund
Immediately
After
Combination |
| 6,128,495 | $94,465,611 | $(1,599,031) | $19,896,773 | $114,362,384 |
| 1 | Unrealized depreciation is included in the Touchstone Diversified Small Cap Value Fund Net Assets Received amount shown above. |
On the date of the reorganization, the Successor Fund's net assets included $2,163,853 of net unrealized appreciation.
3. SIGNIFICANT ACCOUNTING POLICIES
The following is a summary of significant accounting policies consistently followed by the Fund in the preparation of its financial statements. These policies are in conformity with U.S. generally accepted accounting principles (GAAP).
Annual Shareholder Report21
Investment ValuationIn calculating its net asset value (NAV), the Fund generally values investments as follows:
- Equity securities listed on an exchange or traded through a regulated market system are valued at their last reported sale price or official closing price in their principal exchange or market.
- Shares of other mutual funds are valued based upon their reported NAVs.
- Fixed-income securities acquired with remaining maturities greater than 60 days are fair valued using price evaluations provided by a pricing service approved by the Board of Trustees (the “Trustees”).
- Fixed-income securities acquired with remaining maturities of 60 days or less are valued at their cost (adjusted for the accretion of any discount or amortization of any premium).
- Derivative contracts listed on exchanges are valued at their reported settlement or closing price.
- Over-the-counter (OTC) derivative contracts are fair valued using price evaluations provided by a pricing service approved by the Trustees.
If the Fund cannot obtain a price or price evaluation from a pricing service for an investment, the Fund may attempt to value the investment based upon the mean of bid and asked quotations or fair value the investment based on price evaluations, from one or more dealers. If any price, quotation, price evaluation or other pricing source is not readily available when the NAV is calculated, the Fund uses the fair value of the investment determined in accordance with the procedures described below. There can be no assurance that the Fund could purchase or sell an investment at the price used to calculate the Fund's NAV.
Fair Valuation and Significant Events Procedures
The Trustees have authorized the use of pricing services to provide evaluations of the current fair value of certain investments for purposes of calculating the NAV. Factors considered by pricing services in evaluating an investment include the yields or prices of investments of comparable quality, coupon, maturity, call rights and other potential prepayments, terms and type, reported transactions, indications as to values from dealers, and general market conditions. Some pricing services provide a single price evaluation reflecting the bid-side of the market for an investment (a “bid” evaluation). Other pricing services offer both bid evaluations and price evaluations indicative of a price between the prices bid and asked for the investment (a “mid” evaluation). The Fund normally uses bid evaluations for U.S. Treasury and Agency securities, mortgage-backed securities and municipal securities. The Fund normally uses mid evaluations for other types of fixed-income securities and OTC derivative contracts. In the event that market quotations and price evaluations are not available for an investment, the fair value of the investment is determined in accordance with procedures adopted by the Trustees.
The Trustees also have adopted procedures requiring an investment to be priced at its fair value whenever the Adviser determines that a significant event affecting the value of the investment has occurred between the time as of which the price of the investment would otherwise be determined and the time as of which the NAV is computed. An event is considered significant if there is both an affirmative expectation that the investment's value will change in response to the event and a reasonable basis for quantifying the resulting change in value. Examples of significant events that may occur after the close of the principal market on which a security is traded, or after the time of a price evaluation provided by a pricing service or a dealer, include:
- With respect to securities traded in foreign markets, significant trends in U.S. equity markets or in the trading of foreign securities index futures or options contracts;
Annual Shareholder Report22
- With respect to price evaluations of fixed-income securities determined before the close of regular trading on the NYSE, actions by the Federal Reserve Open Market Committee and other significant trends in U.S. fixed-income markets;
- Political or other developments affecting the economy or markets in which an issuer conducts its operations or its securities are traded; and
- Announcements concerning matters such as acquisitions, recapitalizations, litigation developments, a natural disaster affecting the issuer's operations or regulatory changes or market developments affecting the issuer's industry.
The Trustees have approved the use of a pricing service to determine the fair value of equity securities traded principally in foreign markets when the Adviser determines that there has been a significant trend in the U.S. equity markets or in index futures trading. For other significant events, the Fund may seek to obtain more current quotations or price evaluations from alternative pricing sources. If a reliable alternative pricing source is not available, the Fund will determine the fair value of the investment using another method approved by the Trustees.
Investment Income, Gains and Losses, Expenses and Distributions
Investment transactions are accounted for on a trade-date basis. Realized gains and losses from investment transactions are recorded on an identified-cost basis. Interest income and expenses are accrued daily. Dividend income and distributions to shareholders are recorded on the ex-dividend date. Foreign dividends are recorded on the ex-dividend date or when the Fund is informed of the ex-dividend date. Distributions of net investment income are declared and paid annually. Non-cash dividends included in dividend income, if any, are recorded at fair value. Investment income, realized and unrealized gains and losses, and certain fund-level expenses are allocated to each class based on relative average daily net assets, except that each class may bear certain expenses unique to that class such as distribution services and shareholder services fees. Dividends are declared separately for each class. No class has preferential dividend rights; differences in per share dividend rates are generally due to differences in separate class expenses.
Premium and Discount Amortization
All premiums and discounts on fixed-income securities are amortized/accreted for financial statement purposes.
Federal Taxes
It is the Fund's policy to comply with the Subchapter M provision of the Internal Revenue Code (the “Code”) and to distribute to shareholders each year substantially all of its income. Accordingly, no provision for federal income tax is necessary. As of and during the year ended September 30, 2009, the Fund did not have a liability for any uncertain tax positions. The Fund recognizes interest and penalties, if any, related to tax liabilities as income tax expense in the Statement of Operations. As of September 30, 2009, tax year 2009 remains subject to examination by the Fund's major tax jurisdictions, which include the United States of America and the Commonwealth of Massachusetts.
Annual Shareholder Report23
When-Issued and Delayed Delivery TransactionsThe Fund may engage in when-issued or delayed delivery transactions. The Fund records when-issued securities on the trade date and maintains security positions such that sufficient liquid assets will be available to make payment for the securities purchased. Securities purchased on a when-issued or delayed delivery basis are marked to market daily and begin earning interest on the settlement date. Losses may occur on these transactions due to changes in market conditions or the failure of counterparties to perform under the contract.
Securities Lending
The Fund participates in a securities lending program providing for the lending of equity securities to qualified brokers. The Fund normally receives cash collateral for securities loaned that is invested in an affiliated money market fund or short-term securities including repurchase agreements. Collateral is maintained at a minimum level of 100% of the market value of investments loaned, plus interest, if applicable. In accordance with the Fund's securities lending agreement, the market value of securities on loan is determined each day at the close of business and any additional collateral required to cover the value of securities on loan is delivered to the Fund on the next business day. Earnings on collateral are allocated between the securities lending agent, as a fee for its services under the program, and the Fund, according to agreed-upon rates.
As of September 30, 2009, the Fund had no outstanding securities on loan.
Other
The preparation of financial statements in conformity with GAAP requires management to make estimates and assumptions that affect the amounts of assets, liabilities, expenses and revenues reported in the financial statements. Actual results could differ from those estimated.
4. SHARES OF BENEFICIAL INTEREST
The following tables summarize share activity:
| Year Ended September 30 | 2009 | 2008 |
| Class A Shares: | Shares | Amount | Shares | Amount |
| Shares sold | 411,102 | $4,295,554 | 40,375 | $549,659 |
| Transfer in of Class Z Shares1 | 8,469,843 | 116,130,888 | — | — |
| Shares issued to shareholders in payment of distributions declared | 21,333 | 176,843 | 5,193 | 67,890 |
| Exchange of Successor Fund shares in connection with the tax-free reorganization of Touchstone Diversified Small Cap Value Fund | 511,629 | 7,886,533 | — | — |
Adjustment of Predecessor
Fund shares in connection with
tax-free reorganization | (2,538,389) | — | — | — |
| Shares redeemed | (539,185) | (6,137,710) | (6,641) | (88,324) |
NET CHANGE RESULTING
FROM CLASS A SHARE TRANSACTIONS | 6,336,333 | $122,352,108 | 38,927 | $529,225 |
Annual Shareholder Report24
| Year Ended September 30 | 2009 | 2008 |
| Class C Shares: | Shares | Amount | Shares | Amount |
| Shares sold | 42,358 | $394,233 | 49,334 | $631,196 |
| Shares issued to shareholders in payment of distributions declared | 1,978 | 16,109 | 1,702 | 22,064 |
| Exchange of Successor Fund shares in connection with the tax-free reorganization of Touchstone Diversified Small Cap Value Fund | 264,944 | 4,073,170 | — | — |
Adjustment of Predecessor
Fund shares in connection with
tax-free reorganization | (25,050) | — | — | — |
| Shares redeemed | (17,176) | (215,460) | (5,548) | (69,868) |
NET CHANGE RESULTING
FROM CLASS C SHARE TRANSACTIONS | 267,054 | $4,268,052 | 45,488 | $583,392 |
| Year Ended September 30 | 2009 | 2008 |
| Class Z Shares:1 | Shares | Amount | Shares | Amount |
| Shares sold | 1,326,917 | $12,098,477 | 1,467,825 | $19,684,903 |
| Shares issued to shareholders in payment of distributions declared | 720,122 | 5,961,396 | 3,138,321 | 41,080,333 |
| Shares redeemed | (3,299,698) | (29,663,746) | (3,986,333) | (60,102,669) |
NET CHANGE RESULTING
FROM CLASS Z SHARE TRANSACTIONS | (1,252,659) | $(11,603,873) | 619,813 | $662,567 |
FINAL REDEMPTION FROM
CLASS Z SHARES | (8,469,843) | $(116,130,888) | — | $ — |
| Period Ended
9/30/20092 | Year Ended
9/30/2008 |
| Institutional Shares: | Shares | Amount | Shares | Amount |
| Shares sold | 54,875 | $885,430 | — | $ — |
| Exchange of Successor Fund shares in connection with the tax-free reorganization of Touchstone Diversified Small Cap Value Fund | 514,618 | 7,937,070 | — | — |
NET CHANGE RESULTING
FROM INSTITUTIONAL SHARE TRANSACTIONS | 569,493 | $8,822,500 | — | $ — |
| NET CHANGE RESULTING FROM FUND SHARE TRANSACTIONS | (2,549,622) | $7,707,899 | 704,228 | $1,775,184 |
| 1 | At the close of business on August 28, 2009, Class Z Shares were reorganized into Class A Shares. |
| 2 | Reflects operations for the period from August 29, 2009 (deemed the date of initial investment, pursuant to a reorganization that took place on August 28, 2009) to September 30, 2009. |
Annual Shareholder Report25
5. FEDERAL TAX INFORMATION
The timing and character of income and capital gain distributions are determined in accordance with income tax regulations, which may differ from GAAP. These differences are due to differing treatments for REIT adjustments, capital loss carryforwards and wash sale loss deferrals from the tax-free transfer of assets from Touchstone Diversified Small Cap Value Fund.
For the year ended September 30, 2009, permanent differences identified and reclassified among the components of net assets were as follows:
| Increase (Decrease) |
| Paid-In Capital | Undistributed
Net Investment
Income (Loss) | Accumulated
Net Realized
Gain (Loss) |
| $(402,833) | $(260,381) | $663,214 |
Net investment income (loss), net realized gains (losses), and net assets were not affected by this reclassification.
The tax character of distributions as reported on the Statement of Changes in Net Assets for the years ended September 30, 2009 and 2008, was as follows:
| 2009 | 2008 |
| Ordinary income1 | $812,853 | $15,124,522 |
| Long-term capital gains | $5,509,793 | $27,110,031 |
As of September 30, 2009, the components of distributable earnings on a tax basis were as follows:
| Undistributed ordinary income1 | $1,031,685 |
| Net unrealized appreciation | $3,572,180 |
| Capital loss carryforwards and deferrals | $(22,104,339) |
| 1 | For tax purposes, short-term capital gain distributions are considered ordinary income distributions. |
The difference between book-basis and tax-basis net unrealized appreciation/depreciation is attributable in part to differing treatments for the deferral of losses on wash sales and REIT adjustments.
At September 30, 2009, the cost of investments for federal tax purposes was $112,459,860. The net unrealized appreciation of investments for federal tax purposes was $3,572,180. This consists of net unrealized appreciation from investments for those securities having an excess of value over cost of $13,701,602 and net unrealized depreciation from investments for those securities having an excess of cost over value of $10,129,422.
Annual Shareholder Report26
At September 30, 2009, the Fund had a capital loss carryforward of $21,516,172 which will reduce the Fund's taxable income arising from future net realized gains on investments, if any, to the extent permitted by the Code and thus will reduce the amount of distributions to shareholders which would otherwise be necessary to relieve the Fund of any liability for federal income tax. Pursuant to the Code, such capital loss carryforward will expire as follows:| Expiration Year | Expiration Amount |
| 2016 | $4,168,204 |
| 2017 | $17,347,968 |
As a result of the tax-free transfer of assets from Touchstone Diversified Small Cap Value Fund, the use of certain capital loss carryforwards listed above may be limited.
The Fund used capital loss carryforwards of $192,309 to offset taxable capital gains realized during the year ended September 30, 2009.
Under current tax regulations, capital losses on securities transactions realized after October 31 may be deferred and treated as occurring on the first day of the following fiscal year. As of September 30, 2009, for federal income tax purposes, post October losses of $588,167 were deferred to October 1, 2009.
6. INVESTMENT ADVISER FEE AND OTHER TRANSACTIONS WITH AFFILIATES
Investment Adviser Fee
Federated Global Investment Management Corporation is the Fund's investment adviser (the “Adviser”). The advisory agreement between the Fund and the Adviser provides for an annual fee equal to 0.90% of the Fund's average daily net assets. Subject to the terms described in the Expense Limitation note, the Adviser may voluntarily choose to waive any portion of its fee and/or reimburse certain operating expenses of the Fund. The Adviser can modify or terminate this voluntary waiver and/or reimbursement at any time at its sole discretion. For the period from August 29, 2009 to September 30, 2009, the Adviser voluntarily waived $20,823 of its fee.
For the period from August 29, 2009 to September 30, 2009, the net fee paid to the Adviser was $66,963.
Prior to close of business on August 28, 2009, the Predecessor Fund's investment adviser was Touchstone Advisors, Inc. After the close of business on August 28, 2009, the Predecessor Fund was reorganized into the Fund. The annual rate did not change due to this reorganization. For the period from October 1, 2008 to August 28, 2009, the net fee paid to Touchstone Advisors, Inc. was $658,672.
Annual Shareholder Report27
Administrative FeeFederated Administrative Services (FAS), under the Administrative Services Agreement, provides the Fund with administrative personnel and services. The fee paid to FAS is based on the average aggregate daily net assets of certain Federated funds as specified below:
| Administrative Fee | Average Aggregate Daily Net Assets
of the Federated Funds |
| 0.150% | on the first $5 billion |
| 0.125% | on the next $5 billion |
| 0.100% | on the next $10 billion |
| 0.075% | on assets in excess of $20 billion |
The administrative fee received during any fiscal year shall be at least $150,000 per portfolio and $40,000 per each additional class of shares. Subject to the terms described in the Expense Limitation note, FAS may voluntarily choose to waive any portion of its fee. FAS can modify or terminate this voluntary waiver at any time at its sole discretion. For the period from August 29, 2009 to September 30, 2009, the net fee paid to FAS was $15,810 and represented 0.185% of average daily net assets of the Fund. FAS waived $3,724 of its fee. The Fund is currently being charged the minimum administrative fee; therefore the fee as a percentage of average daily net assets is greater than the amounts presented in the chart above.
Prior to close of business on August 28, 2009, Touchstone Advisors, Inc. provided administrative services to the Predecessor Fund. For the period from October 1, 2008 to August 28, 2009, the net fee paid to Touchstone Advisors, Inc. was $75,766. For the period from October 1, 2008 to August 28, 2009, Touchstone Advisors, Inc. waived $79,217 of its fee.
Distribution Services Fee
The Fund has adopted a Distribution Plan (the “Plan”) pursuant to Rule 12b-1 under the Act. Under the terms of the Plan, the Fund will compensate Federated Securities Corp. (FSC), the principal distributor, from the daily net assets of the Fund's Class A Shares and Class C Shares to finance activities intended to result in the sale of these shares. The Plan provides that the Fund may incur distribution expenses at the following percentages of average daily net assets annually, to compensate FSC:
| Share Class Name | Percentage of Average Daily
Net Assets of Class |
| Class A Shares | 0.05% |
| Class C Shares | 0.75% |
Subject to the terms described in the Expense Limitation note, FSC may voluntarily choose to waive any portion of its fee. FSC can modify or terminate this voluntary waiver at any time at its sole discretion. When FSC receives fees, it may pay some or all of them to financial intermediaries whose customers purchase shares. For the period from August 29, 2009 to September 30, 2009, FSC retained $3,193 of fees paid by the Fund. For the period from August 29, 2009 to September 30, 2009, the Fund's Class A Shares did not incur a distribution services fee; however, it may begin to incur this fee upon approval of the Trustees.
For the period from August 29, 2009 to September 30, 2009, the net fee paid to FSC was $3,193.
Annual Shareholder Report28
Prior to close of business on August 28, 2009, Touchstone Securities, Inc. was the principal distributor for the Predecessor Fund. For the period from October 1, 2008 to August 28, 2009, the net fee paid to Touchstone Securities, Inc. was $9,378.Sales Charges
Front-end sales charges and contingent deferred sales charges (CDSC) do not represent expenses of the Fund. They are deducted from the proceeds of sales of Fund Shares prior to investment or from redemption proceeds prior to remittance, as applicable. For the period from August 29, 2009 to September 30, 2009, FSC retained $767 in sales charges from the sale of Class A Shares.
Prior to close of business on August 28, 2009, Touchstone Securities, Inc., served as distributor of the Predecessor Fund's Shares. For the period from October 1, 2008 to August 28, 2009, Touchstone Securities, Inc. retained $13,472 in sales charges from the sale of the Predecessor Fund's Class A Shares. Touchstone Securities, Inc. also retained $330 of CDSC relating to redemptions of the Predecessor Fund's Class C Shares.
Shareholder Services Fee
The Fund may pay fees (Service Fees) up to 0.25% of the average daily net assets of the Fund's Class A Shares and Class C Shares to financial intermediaries or to Federated Shareholder Services Company (FSSC) for providing services to shareholders and maintaining shareholder accounts. Subject to the terms described in the Expense Limitation note, FSSC may voluntarily reimburse the Fund for shareholder services fees. This voluntary reimbursement can be modified or terminated at any time. For the period from August 29, 2009 to September 30, 2009, FSSC did not receive any fees paid by the Fund.
For the period from August 29, 2009 to September 30, 2009, the net fee paid to financial intermediaries was $22,660.
Prior to close of business on August 28, 2009, Touchstone Securities, Inc. received Service Fees from the Predecessor Fund. For the period from October 1, 2008 to August 28, 2009, the net fee paid to Touchstone Securities, Inc. was $161,188.
Expense Limitation
The Adviser and its affiliates (which may include FSC, FAS and FSSC) have voluntarily agreed to waive their fees and/or reimburse expenses so that the total operating expenses (as shown in the financial highlights) paid by the Fund's Class A Shares, Class C Shares and Institutional Shares (after the voluntary waivers and reimbursements) will not exceed 1.31%, 2.06% and 1.06%, respectively, through the later of (the “Termination Date”): (a) November 30, 2010 or (b) the date of the Fund's next effective prospectus. While the Adviser and its affiliates currently do not anticipate terminating these arrangements prior to the Termination Date, these arrangements may only be terminated prior to the Termination Date with the agreement of the Fund's Board of Trustees.
General
Certain Officers and Trustees of the Fund are Officers and Directors or Trustees of the above companies.
Annual Shareholder Report29
Transactions with Affiliated CompaniesAffiliated holdings are mutual funds which are managed by the Adviser or an affiliate of the Adviser. The Adviser has agreed to reimburse the Fund for certain investment adviser fees as a result of transactions in other affiliated mutual funds. For the period from August 29, 2009 to September 30, 2009, the Adviser reimbursed $243. Transactions with affiliated companies during the year ended September 30, 2009, were as follows:
| Affiliate | Balance of
Shares Held
9/30/2008 | Purchases/
Additions | Sales/
Reductions | Balance of
Shares Held
9/30/2009 | Value | Dividend
Income |
| Prime Value Obligations Fund, Institutional Shares | — | 18,022,451 | 14,386,139 | 3,636,312 | $3,636,312 | $2,021 |
In addition, prior to the close of business on August 28, 2009, the Predecessor Fund invested in an affiliated mutual fund. For the period from October 1, 2008 to August 28, 2009, transactions with the affiliated company were as follows:
| Affiliate | Balance of
Shares Held
9/30/2008 | Purchases/
Additions | Sales/
Reductions | Balance of
Shares Held
9/30/2009 | Value | Dividend
Income |
| Touchstone Institutional Money Market Fund | 3,533,567 | 34,543,409 | 38,076,976 | — | $ — | $28,705 |
7. Investment TRANSACTIONS
Purchases and sales of investments, excluding long-term U.S. government securities and short-term obligations, for the year ended September 30, 2009, were as follows:
| Purchases | $67,117,759 |
| Sales | $68,712,697 |
8. LINE OF CREDIT
The Fund participates in a $100,000,000 unsecured, uncommitted revolving line of credit (LOC) agreement with PNC Bank. The LOC was made available for extraordinary or emergency purposes, primarily for financing redemption payments. Borrowings are charged interest at a rate offered to the Fund by PNC Bank at the time of the borrowing. As of September 30, 2009, there were no outstanding loans. During the period from August 29, 2009 to September 30, 2009, the Fund did not utilize the LOC.
9. INTERFUND LENDING
Pursuant to an Exemptive Order issued by the Securities and Exchange Commission (SEC), the Fund, along with other funds advised by subsidiaries of Federated Investors, Inc., may participate in an interfund lending program. This program provides an alternative credit facility allowing the funds to borrow from other participating affiliated funds. As of September 30, 2009, there were no outstanding loans. During the period from August 29, 2009 to September 30, 2009, the Fund did not utilize the LOC.
Annual Shareholder Report30
10. Legal ProceedingsSince October 2003, Federated Investors, Inc. and related entities (collectively, “Federated”) and various Federated funds (Federated Funds) have been named as defendants in several class action lawsuits now pending in the United States District Court for the District of Maryland. The lawsuits were purportedly filed on behalf of people who purchased, owned and/or redeemed shares of Federated-sponsored mutual funds during specified periods beginning November 1, 1998. The suits are generally similar in alleging that Federated engaged in illegal and improper trading practices including market timing and late trading in concert with certain institutional traders, which allegedly caused financial injury to the mutual fund shareholders. These lawsuits began to be filed shortly after Federated's first public announcement that it had received requests for information on shareholder trading activities in the Federated Funds from the SEC, the Office of the New York State Attorney General (NYAG), and other authorities. In that regard, on November 28, 2005, Federated announced that it had reached final settlements with the SEC and the NYAG with respect to those matters. As Federated previously reported in 2004, it has already paid approximately $8.0 million to certain funds as determined by an independent consultant. As part of these settlements, Federated agreed to pay for the benefit of Fund shareholders additional disgorgement and a civil money penalty in the aggregate amount of an additional $72 million. Federated entities have also been named as defendants in several additional lawsuits that are now pending in the United States District Court for the Western District of Pennsylvania, alleging, among other things, excessive advisory and Rule 12b-1 fees. The Board of the Federated Funds retained the law firm of Dickstein Shapiro LLP to represent the Federated Funds in these lawsuits. Federated and the Federated Funds, and their respective counsel have been defending this litigation, and none of the Federated Funds remains a defendant in any of the lawsuits (though some could potentially receive any recoveries as nominal defendants). Additional lawsuits based upon similar allegations may be filed in the future. The potential impact of these lawsuits, all of which seek unquantified damages, attorneys' fees and expenses, and future potential similar suits is uncertain. Although we do not believe that these lawsuits will have a material adverse effect on the Federated Funds, there can be no assurance that these suits, the ongoing adverse publicity and/or other developments resulting from the regulatory investigations will not result in increased Federated Fund redemptions, reduced sales of Federated Fund shares, or other adverse consequences for the Federated Funds.
11. Subsequent events
Management has evaluated subsequent events through November 24, 2009, the date the financial statements were issued, and determined that no events have occurred that require additional disclosure.
Annual Shareholder Report31
Report of Independent Registered Public Accounting Firm
TO THE BOARD OF TRUSTEES OF THE FEDERATED EQUITY FUNDS AND SHAREHOLDERS OF Federated Clover small Value Fund:
We have audited the accompanying statement of assets and liabilities, including the portfolio of investments, of the Federated Clover Small Value Fund (the “Fund”), a portfolio of Federated Equity Funds, as of September 30, 2009, and the related statement of operations, changes in net assets and the financial highlights for the year then ended. These financial statements and financial highlights are the responsibility of the Fund's management. Our responsibility is to express an opinion on these financial statements and financial highlights based on our audit. The statement of changes in net assets and the financial highlights for the periods presented prior to October 1, 2008, were audited by other independent registered public accountants whose report thereon dated November 25, 2008, expressed an unqualified opinion on those statements.
We conducted our audit in accordance with the standards of the Public Company Accounting Oversight Board (United States). Those standards require that we plan and perform the audit to obtain reasonable assurance about whether the financial statements and financial highlights are free of material misstatement. An audit includes examining, on a test basis, evidence supporting the amounts and disclosures in the financial statements. Our procedures included confirmation of securities owned as of September 30, 2009, by correspondence with the custodian and brokers or by other appropriate auditing procedures. An audit also includes assessing the accounting principles used and significant estimates made by management, as well as evaluating the overall financial statement presentation. We believe that our audit provides a reasonable basis for our opinion.
In our opinion, the financial statements and financial highlights referred to above present fairly, in all material respects, the financial position of the Federated Clover Small Value Fund as of September 30, 2009, and the results of its operations, the changes in its net assets and the financial highlights for the year then ended, in conformity with U.S. generally accepted accounting principles.
Boston, Massachusetts
November 24, 2009
Annual Shareholder Report32
Board of Trustees and Trust Officers
The Board is responsible for managing the Trust's business affairs and for exercising all the Trust's powers except those reserved for the shareholders. The following tables give information about each Board member and the senior officers of the Fund. Where required, the tables separately list Board members who are “interested persons” of the Fund (i.e., “Interested” Board members) and those who are not (i.e., “Independent” Board members). Unless otherwise noted, the address of each person listed is Federated Investors Tower, 1001 Liberty Avenue, Pittsburgh, PA 15222. The address of all Independent Board members listed is 4000 Ericsson Drive, Warrendale, PA 15086-7561; Attention: Mutual Fund Board. As of December 31, 2008, the Trust comprised ten portfolios, and the Federated Fund Complex consisted of 40 investment companies (comprising 149 portfolios). Unless otherwise noted, each Officer is elected annually. Unless otherwise noted, each Board member oversees all portfolios in the Federated Fund Complex and serves for an indefinite term. The Fund's Statement of Additional Information includes additional information about Trust Trustees and is available, without charge and upon request, by calling 1-800-341-7400.
Interested TRUSTEES Background
Name
Birth Date
Positions Held with Trust
Date Service Began | Principal Occupation(s) for Past Five Years,
Other Directorships Held and Previous Position(s) |
John F. Donahue*
Birth Date: July 28, 1924
TRUSTEE
Began serving: April 1984 | Principal Occupations: Director or Trustee of the Federated Fund Complex; Chairman and Director, Federated Investors, Inc.; Chairman of the Federated Fund Complex's Executive Committee.
Previous Positions: Chairman of the Federated Fund Complex; Trustee, Federated Investment Management Company; Chairman and Director, Federated Investment Counseling. |
J. Christopher Donahue*
Birth Date: April 11, 1949
PRESIDENT AND TRUSTEE
Began serving: January 2000 | Principal Occupations: Principal Executive Officer and President of the Federated Fund Complex; Director or Trustee of some of the Funds in the Federated Fund Complex; President, Chief Executive Officer and Director, Federated Investors, Inc.; Chairman and Trustee, Federated Investment Management Company; Trustee, Federated Investment Counseling; Chairman and Director, Federated Global Investment Management Corp.; Chairman, Federated Equity Management Company of Pennsylvania and Passport Research, Ltd. (investment advisory subsidiary of Federated); Trustee, Federated Shareholder Services Company; Director, Federated Services Company.
Previous Positions: President, Federated Investment Counseling; President and Chief Executive Officer, Federated Investment Management Company, Federated Global Investment Management Corp. and Passport Research, Ltd. |
| * | Family relationships and reasons for “interested” status: John F. Donahue is the father of J. Christopher Donahue; both are “interested” due to their beneficial ownership of shares of Federated Investors, Inc. and the positions they hold with Federated and its subsidiaries. |
Annual Shareholder Report33
INDEPENDENT TRUSTEES Background
Name
Birth Date
Positions Held with Trust
Date Service Began | Principal Occupation(s) for Past Five Years,
Other Directorships Held and Previous Position(s) |
John T. Conroy, Jr., Ph.D.
Birth Date: June 23, 1937
TRUSTEE
Began serving: November 1991 | Principal Occupations: Director or Trustee of the Federated Fund Complex; Chairman of the Board, Investment Properties Corporation; Partner or Trustee in private real estate ventures in Southwest Florida; Assistant Professor in Theology at Barry University and Blessed Edmund Rice School for Pastoral Ministry.
Previous Positions: President, Investment Properties Corporation; Senior Vice President, John R. Wood and Associates, Inc., Realtors; President, Naples Property Management, Inc. and Northgate Village Development Corporation. |
Nicholas P. Constantakis
Birth Date: September 3, 1939
TRUSTEE
Began serving: February 1998 | Principal Occupation: Director or Trustee of the Federated Fund Complex.
Other Directorships Held: Director and Chairman of the Audit Committee, Michael Baker Corporation (architecture, engineering and construction services).
Previous Position: Partner, Andersen Worldwide SC. |
John F. Cunningham
Birth Date: March 5, 1943
TRUSTEE
Began serving: January 1999 | Principal Occupation: Director or Trustee of the Federated Fund Complex.
Other Directorships Held: Chairman, President and Chief Executive Officer, Cunningham & Co., Inc. (strategic business consulting); Trustee Associate, Boston College.
Previous Positions: Director, Redgate Communications and EMC Corporation (computer storage systems); Chairman of the Board and Chief Executive Officer, Computer Consoles, Inc.; President and Chief Operating Officer, Wang Laboratories; Director, First National Bank of Boston; Director, Apollo Computer, Inc. |
Maureen Lally-Green
Birth Date: July 5, 1949
TRUSTEE
Began serving: August 2009 | Principal Occupations: Director or Trustee of the Federated Fund Complex; Director, Office of Church Relations, Diocese of Pittsburgh; Adjunct Professor of Law, Duquesne University School of Law.
Other Directorships Held: Director, Auberle; Trustee St. Francis University; Director, Ireland Institute of Pittsburgh; Director, UPMC Mercy Hospital; Regent, St. Vincent Seminary; Director, Epilepsy Foundation of Western and Central Pennsylvania; Director, Saint Thomas More Society, Allegheny County; Director, Carlow University.
Previous Position: Pennsylvania Superior Court Judge. |
Annual Shareholder Report34
Name
Birth Date
Positions Held with Trust
Date Service Began | Principal Occupation(s) for Past Five Years,
Other Directorships Held and Previous Position(s) |
Peter E. Madden
Birth Date: March 16, 1942
TRUSTEE
Began serving: November 1991 | Principal Occupation: Director or Trustee and Chairman of the Board of the Federated Fund Complex.
Other Directorship Held: Board of Overseers, Babson College.
Previous Positions: Representative, Commonwealth of Massachusetts General Court; President, Chief Operating Officer and Director, State Street Bank and Trust Company and State Street Corporation (retired); Director, VISA USA and VISA International; Chairman and Director, Massachusetts Bankers Association; Director, Depository Trust Corporation; Director, The Boston Stock Exchange. |
Charles F. Mansfield, Jr.
Birth Date: April 10, 1945
TRUSTEE
Began serving: January 1999 | Principal Occupations: Director or Trustee and Chairman of the Audit Committee of the Federated Fund Complex; Management Consultant.
Previous Positions: Chief Executive Officer, PBTC International Bank; Partner, Arthur Young & Company (now Ernst & Young LLP); Chief Financial Officer of Retail Banking Sector, Chase Manhattan Bank; Senior Vice President, HSBC Bank USA (formerly, Marine Midland Bank); Vice President, Citibank; Assistant Professor of Banking and Finance, Frank G. Zarb School of Business, Hofstra University; Executive Vice President DVC Group, Inc. (marketing, communications and technology). |
R. James Nicholson
Birth Date: February 4, 1938
TRUSTEE
Began serving: January 2008 | Principal Occupations: Director or Trustee of the Federated Fund Complex; Senior Counsel, Brownstein Hyatt Farber Schrek, P.C.; Former Secretary of the U.S. Dept. of Veterans Affairs; Former U.S. Ambassador to the Holy See; Former Chairman of the Republican National Committee.
Other Directorships Held: Director, Horatio Alger Association; Director, The Daniels Fund.
Previous Positions: Colonel, U.S. Army Reserve; Partner, Calkins, Kramer, Grimshaw and Harring, P.C.; General Counsel, Colorado Association of Housing and Building; Chairman and CEO, Nicholson Enterprises, Inc. (real estate holding company); Chairman and CEO, Renaissance Homes of Colorado. |
Thomas M. O'Neill
Birth Date: June 14, 1951
TRUSTEE
Began serving: October 2006 | Principal Occupations: Director or Trustee of the Federated Fund Complex; Managing Director and Partner, Navigator Management Company, L.P. (investment and strategic consulting).
Other Directorships Held: Board of Overseers, Children's Hospital of Boston; Visiting Committee on Athletics, Harvard College.
Previous Positions: Chief Executive Officer and President, Managing Director and Chief Investment Officer, Fleet Investment Advisors; President and Chief Executive Officer, Aeltus Investment Management, Inc.; General Partner, Hellman, Jordan Management Co., Boston, MA; Chief Investment Officer, The Putnam Companies, Boston, MA; Credit Analyst and Lending Officer, Fleet Bank; Director and Consultant, EZE Castle Software (investment order management software); Director, Midway Pacific (lumber). |
Annual Shareholder Report35
Name
Birth Date
Positions Held with Trust
Date Service Began | Principal Occupation(s) for Past Five Years,
Other Directorships Held and Previous Position(s) |
John S. Walsh
Birth Date: November 28, 1957
TRUSTEE
Began serving: January 1999 | Principal Occupations: Director or Trustee of the Federated Fund Complex; President and Director, Heat Wagon, Inc. (manufacturer of construction temporary heaters); President and Director, Manufacturers Products, Inc. (distributor of portable construction heaters); President, Portable Heater Parts, a division of Manufacturers Products, Inc.
Previous Position: Vice President, Walsh & Kelly, Inc. |
James F. Will
Birth Date: October 12, 1938
TRUSTEE
Began serving: April 2006 | Principal Occupations: Director or Trustee of the Federated Fund Complex; formerly, Vice Chancellor and President, Saint Vincent College.
Other Directorships Held: Trustee, Saint Vincent College; Alleghany Corporation.
Previous Positions: Chairman, President and Chief Executive Officer, Armco, Inc.; President and Chief Executive Officer, Cyclops Industries; President and Chief Operating Officer, Kaiser Steel Corporation. |
OFFICERS
Name
Birth Date
Address
Positions Held with Trust
Date Service Began | Principal Occupation(s) for Past Five Years
and Previous Position(s) |
John W. McGonigle
Birth Date: October 26, 1938
EXECUTIVE VICE PRESIDENT AND SECRETARY
Began serving: April 1984 | Principal Occupations: Executive Vice President and Secretary of the Federated Fund Complex; Vice Chairman, Executive Vice President, Secretary and Director, Federated Investors, Inc.
Previous Positions: Trustee, Federated Investment Management Company and Federated Investment Counseling; Director, Federated Global Investment Management Corp., Federated Services Company and Federated Securities Corp. |
Richard A. Novak
Birth Date: December 25, 1963
TREASURER
Began serving: January 2006 | Principal Occupations: Principal Financial Officer and Treasurer of the Federated Fund Complex; Senior Vice President, Federated Administrative Services; Financial and Operations Principal for Federated Securities Corp., Edgewood Services, Inc. and Southpointe Distribution Services, Inc.
Previous Positions: Controller of Federated Investors, Inc.; Vice President, Finance of Federated Services Company; held various financial management positions within The Mercy Hospital of Pittsburgh; Auditor, Arthur Andersen & Co. |
Brian P. Bouda
Birth Date: February 28, 1947
CHIEF COMPLIANCE OFFICER AND SENIOR VICE PRESIDENT
Began serving: August 2004 | Principal Occupations: Senior Vice President and Chief Compliance Officer of the Federated Fund Complex; Vice President and Chief Compliance Officer of Federated Investors, Inc. and Chief Compliance Officer of its subsidiaries. Mr. Bouda joined Federated in 1999 and is a member of the American Bar Association and the State Bar Association of Wisconsin. |
Annual Shareholder Report36
Name
Birth Date
Address
Positions Held with Trust
Date Service Began | Principal Occupation(s) for Past Five Years
and Previous Position(s) |
Stephen F. Auth
Birth Date: September 3, 1956
450 Lexington Avenue
Suite 3700
New York, NY 10017-3943
CHIEF INVESTMENT OFFICER
Began serving: November 2002 | Principal Occupations: Mr. Auth is Chief Investment Officer of this Fund and various other Funds in the Federated Fund Complex; Executive Vice President, Federated Investment Counseling, Federated Global Investment Management Corp. and Federated Equity Management Company of Pennsylvania.
Previous Positions: Executive Vice President, Federated Investment Management Company, and Passport Research, Ltd. (investment advisory subsidiary of Federated); Senior Vice President, Global Portfolio Management Services Division; Senior Vice President, Federated Investment Management Company and Passport Research, Ltd.; Senior Managing Director and Portfolio Manager, Prudential Investments. |
Lawrence Auriana
Birth Date: January 8, 1944
140 East 45th Street
New York, NY 10017
VICE PRESIDENT
Began serving: November 2001 | Principal Occupations: Lawrence Auriana is Vice President of the Trust. Mr. Auriana joined Federated in April 2001 as Co-Head of Investments/Federated Kaufmann. From August 1984 to April 2001, Mr. Auriana was President and Treasurer of Edgemont Asset Management Corp., and Chairman of the Board and Portfolio Manager to The Kaufmann Fund, Inc. (predecessor to the Federated Kaufmann Fund). Mr. Auriana earned a B.S. in economics from Fordham University and has been engaged in the securities business since 1965. |
Walter C. Bean
Birth Date: June 22, 1945
VICE PRESIDENT
Began serving: November 2006 | Principal Occupations: Walter C. Bean is Vice President of the Trust. Mr. Bean is a Senior Vice President, Senior Portfolio Manager and Director of Investments for Managed Accounts. Mr. Bean joined Federated in 2000. Mr. Bean is responsible for the investment process for the managed accounts portfolios. His previous associations included: Chief Investment Officer and Portfolio Manager at C.S. McKee & Company; various investment management and research positions with First Chicago Investment Advisors, CIGNA Investment Advisors and Mellon Bank. Mr. Bean is a Chartered Financial Analyst. Mr. Bean earned a Bachelors Degree in Business Administration from Ohio University and an M.B.A. from Pennsylvania State University. Mr. Bean has 36 years of investment experience. |
Richard B. Fisher
Birth Date: May 17, 1923
VICE PRESIDENT
Began serving: August 2002 | Principal Occupations: Vice Chairman or Vice President of some of the Funds in the Federated Fund Complex; Vice Chairman, Federated Investors, Inc.; Chairman, Federated Securities Corp.
Previous Positions: President and Director or Trustee of some of the Funds in the Federated Fund Complex; Executive Vice President, Federated Investors, Inc.; Director and Chief Executive Officer, Federated Securities Corp. |
Hans P. Utsch
Birth Date: July 3, 1936
140 East 45th Street
New York, NY 10017
VICE PRESIDENT
Began serving: November 2001 | Principal Occupations: Hans P. Utsch is Vice President of the Trust. Mr. Utsch joined Federated in April 2001 as Co-Head of Investments/Federated Kaufmann. From August 1984 to April 2001, Mr. Utsch was Chairman of the Board and Secretary of Edgemont Asset Management Corp., and President and Portfolio Manager to The Kaufmann Fund, Inc. (predecessor to the Federated Kaufmann Fund). Mr. Utsch graduated from Amherst College and holds an M.B.A. from Columbia University. He has been engaged in the securities business since 1962. |
Annual Shareholder Report37
Evaluation and Approval of Advisory
Contract - May 2009
Federated Clover Small Value Fund (the “Fund”)
The Fund's Board reviewed the Fund's investment advisory contract at meetings held in May 2009. Because the Fund did not yet have a meaningful operating history, the Board's decision to approve the contract reflects the exercise of its business judgment on whether to authorize the continued offering of this new investment vehicle, as originally proposed by, and based on information previously requested by the Board and provided by the Federated organization, and based on Federated's recommendation to go forward with the Fund.
Federated proposed the creation of the Fund in connection with its acquisition of certain assets of Clover Capital Management, Inc. (“Clover Capital”), the investment adviser to the Clover Capital Enhanced Small Cap Value Equity Common Fund (the “Clover Small Cap”), a privately offered pooled fund (the “Acquisition”). As part of the transaction, Federated proposed that the Clover Small Cap be reorganized with and into the Fund in a tax-free asset transfer which would provide shareholders of the Clover Small Cap the opportunity to become shareholders of a registered mutual fund with similar investment objectives and policies and the same key management personnel as the Clover Small Cap, but with sales, distribution and other fund and shareholder services provided by the same affiliates of Federated that provide such services to the other Federated funds. The Fund was declared effective on January 21, 2009, and the reorganization of the Clover Small Cap with and into the Fund was consummated after the close of business on March 13, 2009. The Fund commenced operations on March 16, 2009. Accordingly, the Board's deliberations at its May 2009 meetings were based to a significant degree on the information considered by the Board when it originally approved the contract at its November 2008 meetings.
The Federated funds' Board had previously appointed a Senior Officer, whose duties include specified responsibilities relating to the process by which advisory fees are to be charged to a Federated Fund. The Senior Officer has the authority to retain consultants, experts, or staff as may be reasonably necessary to assist in the performance of his duties, reports directly to the Board, and may be terminated only with the approval of a majority of the independent members of the Board. The Senior Officer prepared and furnished to the Board an independent, written evaluation that covered topics discussed below. The Board considered that evaluation, along with other information, in deciding to approve the proposed advisory contract.
The Board also considered the anticipated compensation and benefits to be received by the Adviser. This includes fees to be received for services provided to the Fund by other entities in the Federated organization and research services that may be received by the Adviser from brokers that execute fund trades, as well as advisory fees. The Board is also familiar with and considered judicial Annual Shareholder Report38
decisions concerning allegedly excessive investment advisory fees, which have indicated that the following factors may be relevant to an Adviser's fiduciary duty with respect to its receipt of compensation from a fund: the nature and quality of the services provided by the Adviser, including the performance of the Fund; the Adviser's cost of providing the services; the extent to which the Adviser may realize “economies of scale” as the Fund grows larger; any indirect benefits that may accrue to the Adviser and its affiliates as a result of the Adviser's relationship with the Fund; performance and expenses of comparable funds; and the extent to which the independent Board members are fully informed about all facts the Board deems relevant bearing on the Adviser's services and fees. The Board further considered management fees (including any components thereof) charged to institutional and other clients of the Adviser for what might be viewed as like services, and the cost to the Adviser and its affiliates of supplying services pursuant to the management fee agreements, excluding any intra-corporate profit and profit margins of the Adviser and its affiliates for supplying such services. The Board was aware of these factors and was guided by them in its review of the Fund's advisory contract to the extent it considered them to be appropriate and relevant, as discussed further below. The Board considered and weighed these circumstances in light of its substantial accumulated experience in working with Federated on matters relating to other Federated funds, and was assisted in its deliberations by independent legal counsel. The Board's consideration of the proposed advisory contract included review of the Senior Officer's evaluation, accompanying data and additional reports covering such matters as: the Adviser's investment philosophy, revenue, profitability, personnel and processes; investment and operating strategies; the Fund's investment objectives; the Fund's anticipated expenses (including the proposed advisory fee itself and the overall estimated expense structure of the Fund, both in absolute terms and relative to similar and/or competing funds, with due regard for contractual or voluntary expense limitations); and the nature, quality and extent of the advisory and other services to be provided to the Fund by the Adviser and its affiliates. The Board also considered the likely preferences and expectations of anticipated Fund shareholders and their relative sophistication; the continuing state of competition in the mutual fund industry and market practices; the range of comparable fees for similar funds in the mutual fund industry; the Fund's relationship to the Federated family of funds which include a comprehensive array of funds with different investment objectives, policies and strategies which are available for exchange without the incurrence of additional sales charges; compliance and audit reports concerning the Federated funds and the Federated companies that service them (including communications from regulatory agencies), as well as Federated's responses to any issues raised therein; and relevant developments in the mutual fund industry and how the Federated funds Annual Shareholder Report39
and/or Federated are responding to them. The Board's evaluation process is evolutionary. The criteria considered and the emphasis placed on relevant criteria change in recognition of changing circumstances in the mutual fund marketplace.With respect to the Fund's expenses in particular, the Board has found the use of comparisons to other mutual funds with comparable investment programs to be particularly useful, given the high degree of competition in the mutual fund business. The Board focused on comparisons with other similar mutual funds more heavily than non-mutual fund products or services because it is believed that they are more relevant. For example, other mutual funds are the products most like the Fund, they are readily available to Fund shareholders as alternative investment vehicles, and they are the type of investment vehicle in fact chosen and maintained by the Fund's anticipated investors. The range of their fees and expenses therefore appears to be a generally reliable indication of what consumers have found to be reasonable in the precise marketplace in which the Fund will compete. In this regard, the Senior Officer also reviewed Federated's fees for providing advisory services to products outside the Federated family of funds (e.g., institutional and separate accounts). He concluded that mutual funds and institutional accounts are inherently different products. Those differences included, but are not limited to, different types of targeted investors; being subject to different laws and regulations; different legal structures; different average account sizes; different associated costs; different portfolio management techniques made necessary by different cash flows; and portfolio manager time spent in review of securities pricing. The Senior Officer did not consider these fee schedules to be determinative in judging the appropriateness of mutual fund advisory contracts.
The Senior Officer reviewed information compiled by Federated, using data supplied by independent fund ranking organizations, regarding the fees charged by other mutual funds, noting his view that comparisons to fund peer groups are highly important in judging the reasonableness of proposed fees.
The Senior Officer's report produced in connection with the original approval of the advisory contract for the Fund in November 2008, noted that Clover Capital, as manager of the Clover Small Cap, subadviser to a mutual fund and adviser to a group trust and separate managed accounts, generated consistent and strong performance using substantially the same investment strategy to be utilized by the Fund. Because the Fund will employ the same key management personnel and a similar investment strategy as the Clover Small Cap, the nature and quality of the management of the Fund is expected to reflect that of the Clover Small Cap. This in turn assisted the Board in reaching a conclusion that the nature, extent and quality of the Adviser's investment management services were such as to warrant the approval of the advisory contract.
Annual Shareholder Report40
The Board reviewed the proposed fees and other expenses of the Fund and was satisfied that the proposed overall expense structure of the Fund appeared to be appropriate. In this regard, the Senior Officer's report indicated that the proposed management fees, after projected waivers, were reasonable. The Board also concluded that the nature, quality and scope of other services to be provided to the Fund were reasonable.The Board also considered possible indirect benefits that may accrue to the Adviser and its affiliates as a result of the Acquisition. Other indirect benefits that may accrue to the Adviser and its affiliates as a result of the Adviser's relationship with the Fund are essentially impossible to apply before the Fund has experienced any meaningful operating history. Nevertheless, in connection with the Board's governance of other Federated funds, it should be noted that the Board regularly receives financial information about Federated, including reports on the compensation and benefits Federated derives from its relationships with the other Federated funds. These reports cover not only the fees under the advisory contracts, but also fees received by Federated's subsidiaries for providing other services to the Federated funds under separate contracts (e.g., for serving as the Federated funds' administrator). The reports also discuss any indirect benefit Federated may derive from its receipt of research services from brokers who execute Federated fund trades. In addition, the Board considered the fact that, in order for a fund to be competitive in the marketplace, Federated and its affiliates frequently waive fees and/or reimburse expenses and have disclosed to fund investors and/or indicated to the Board their intention to do so in the future, where appropriate.
The Senior Officer commented on reports furnished by Federated of estimates of components of the Fund's expenses using allocation methodologies specified by the Senior Officer and sales projections made by Federated. The Senior Officer noted that, although they may apply consistent allocation processes, the inherent difficulties in allocating costs (and the unavoidable arbitrary aspects of that exercise), particularly when projecting an uncertain asset base, and the lack of consensus on how to allocate those costs may render such allocation reports unreliable. The Senior Officer determined that such allocation reports were of limited use.
The Board and the Senior Officer also reviewed data compiled by Federated comparing profitability information for Federated to other publicly held fund management companies. In this regard, the Senior Officer noted the limited availability of such information, but nonetheless concluded that Federated's profit margins did not appear to be excessive and the Board agreed.
The Senior Officer's evaluation also discussed the notion of possible realization of “economies of scale” as a fund grows larger. The Board considered in this regard that the Adviser has made significant and long-term investments in areas that support all of the Federated funds, such as personnel and processes for the portfolio management, compliance, and risk management functions; and systems technology; and that the benefits of these efforts (as well as any Annual Shareholder Report41
economies, should they exist) were likely to be enjoyed by the fund complex as a whole. Finally, the Board also noted the absence of any applicable regulatory or industry guidelines on this subject, which (as discussed in the Senior Officer's evaluation) is compounded by the lack of any common industry practice or general pattern with respect to structuring fund advisory fees with “breakpoints” that serve to reduce the fee as the fund attains a certain size. The Senior Officer did not recommend institution of breakpoints in pricing Federated's proposed advisory services to the Fund at this time.The Board based its decision to approve the proposed advisory contract on the totality of the circumstances and relevant factors, and with a view to past and future long-term considerations. As noted, not all of the factors and considerations identified above were necessarily relevant to the Fund, nor did the Board consider any one of them to be determinative. With respect to the factors that are relevant, the Board's decision to approve the contract reflects its determination that, based upon the information previously requested and supplied, Federated's proposal to establish and manage the Fund, and its past performance and actions in providing services to other mutual funds (which the Board has found to be satisfactory with respect to such other funds), provide a satisfactory basis to support the business decision to continue the existing arrangements.
Annual Shareholder Report42
Voting Proxies on Fund Portfolio SecuritiesA description of the policies and procedures that the Fund uses to determine how to vote proxies, if any, relating to securities held in the Fund's portfolio is available, without charge and upon request, by calling 1-800-341-7400. A report on “Form N-PX” of how the Fund voted any such proxies during the most recent 12-month period ended June 30 is available from Federated's Web site at FederatedInvestors.com. To access this information from the “Products” section of the Web site, click on the “Prospectuses and Regulatory Reports” link under “Related Information,” then select the appropriate link opposite the name of the Fund; or select the name of the Fund and from the Fund's page, click on the “Prospectuses and Regulatory Reports” link. Form N-PX filings are also available at the SEC's Web site at www.sec.gov.
Quarterly Portfolio Schedule
The Fund files with the SEC a complete schedule of its portfolio holdings, as of the close of the first and third quarters of its fiscal year, on “Form N-Q.” These filings are available on the SEC's Web site at www.sec.gov and may be reviewed and copied at the SEC's Public Reference Room in Washington, DC. (Call 1-800-SEC-0330 for information on the operation of the Public Reference Room.) You may also access this information from the “Products” section of Federated's Web site at FederatedInvestors.com by clicking on “Portfolio Holdings” under “Related Information,” then selecting the appropriate link opposite the name of the Fund; or select the name of the Fund and from the Fund's page, click on the “Portfolio Holdings” link.
Annual Shareholder Report43
Mutual funds are not bank deposits or obligations, are not guaranteed by any bank and are not insured or guaranteed by the U.S. government, the Federal Deposit Insurance Corporation, the Federal Reserve Board or any other government agency. Investment in mutual funds involves investment risk, including the possible loss of principal.
This Report is authorized for distribution to prospective investors only when preceded or accompanied by the Fund's Prospectus, which contains facts concerning its objective and policies, management fees, expenses and other information.
Federated Clover Small Value Fund
Federated Investors Funds
4000 Ericsson Drive
Warrendale, PA 15086-7561
Contact us at FederatedInvestors.com
or call 1-800-341-7400.
Federated Securities Corp., Distributor
Cusip 314172289
Cusip 314172271
41198 (11/09)
Federated is a registered mark of Federated Investors, Inc.
2009 Federated Investors, Inc.
Federated Clover Small Value Fund
(Successor to the Touchstone Diversified Small Cap Value Fund Established 1996)
A Portfolio of Federated Equity Funds
ANNUAL SHAREHOLDER REPORTSeptember 30, 2009
Institutional Shares
FINANCIAL HIGHLIGHTS
SHAREHOLDER EXPENSE EXAMPLE
MANAGEMENT'S DISCUSSION OF FUND PERFORMANCE
PORTFOLIO OF INVESTMENTS SUMMARY TABLE
PORTFOLIO OF INVESTMENTS
STATEMENT OF ASSETS AND LIABILITIES
STATEMENT OF OPERATIONS
STATEMENT OF CHANGES IN NET ASSETS
NOTES TO FINANCIAL STATEMENTS
REPORT OF INDEPENDENT REGISTERED PUBLIC ACCOUNTING FIRM
BOARD OF TRUSTEES AND TRUST OFFICERS
EVALUATION AND APPROVAL OF ADVISORY CONTRACT
VOTING PROXIES ON FUND PORTFOLIO SECURITIES
QUARTERLY PORTFOLIO SCHEDULE
Financial Highlights - Institutional Shares
(For a Share Outstanding Throughout the Period)
| Period Ended September 30 | 20091 |
| Net Asset Value, Beginning of Period | $15.42 |
| Income From Investment Operations: | |
| Net investment income | 0.012 |
| Net realized and unrealized gain on investments | 0.66 |
| TOTAL FROM INVESTMENT OPERATIONS | 0.67 |
| Net Asset Value, End of Period | $16.09 |
| Total Return3 | 4.35% |
| Ratios to Average Net Assets: | |
| Net expenses | 1.19%4 |
| Net investment income | 0.70%4 |
| Expense waiver/reimbursement5 | 0.25%4 |
| Supplemental Data: | |
| Net assets, end of period (000 omitted) | $9,161 |
| Portfolio turnover | 68%6 |
| 1 | Reflects operations for the period from August 29, 2009 (deemed the date of initial investment, pursuant to a reorganization that took place on August 28, 2009) to September 30, 2009. See Note 2 to the Financial Statements. |
| 2 | Per share number has been calculated using the average shares method. |
| 3 | Based on net asset value, which does not reflect the sales charge, redemption fee or contingent deferred sales charge, if applicable. Total returns for periods of less than one year are not annualized. |
| 4 | Computed on an annualized basis. |
| 5 | This expense decrease is reflected in both the net expense and the net investment income ratios shown above. |
| 6 | Portfolio turnover is calculated at the Fund level. Percentage indicated was calculated for the entire fiscal year ended September 30, 2009. |
- See Notes which are an integral part of the Financial Statements
Annual Shareholder Report1
Shareholder Expense Example (unaudited)
As a shareholder of the Fund, you incur ongoing costs, including management fees and to the extent applicable, distribution (12b-1) fees and/or shareholder services fees and other Fund expenses. This Example is intended to help you to understand your ongoing costs (in dollars) of investing in the Fund and to compare these costs with the ongoing costs of investing in other mutual funds. It is based on an investment of $1,000 invested at the beginning of the period and held for the entire period from April 1, 20091 to September 30, 2009.
ACTUAL EXPENSES
The first section of the table below provides information about actual account values and actual expenses. You may use the information in this section, together with the amount you invested, to estimate the expenses that you incurred over the period. Simply divide your account value by $1,000 (for example, an $8,600 account value divided by $1,000 = 8.6), then multiply the result by the number in the first section under the heading entitled “Expenses Paid During Period” to estimate the expenses attributable to your investment during this period.
HYPOTHETICAL EXAMPLE FOR COMPARISON PURPOSES
The second section of the table below provides information about hypothetical account values and hypothetical expenses based on the Fund's actual expense ratio and an assumed rate of return of 5% per year before expenses, which is not the Fund's actual return. Thus, you should not use the hypothetical account values and expenses to estimate the actual ending account balance or your expenses for the period. Rather, these figures are required to be provided to enable you to compare the ongoing costs of investing in the Fund with other funds. To do so, compare this 5% hypothetical example with the 5% hypothetical examples that appear in the shareholder reports of the other funds.
Annual Shareholder Report2
Please note that the expenses shown in the table are meant to highlight your ongoing costs only. Therefore, the second section of the table is useful in comparing ongoing costs only, and will not help you determine the relative total costs of owning different funds. | Beginning
Account Value
4/1/2009 | Ending
Account Value
9/30/2009 | Expenses Paid
During Period1 |
| Actual | $1,000 | $1,043.50 | $1.10 |
Hypothetical (assuming a 5% return
before expenses) | $1,000 | $1,019.10 | $6.02 |
| 1 | “Actual” expense information is for the period from August 29, 2009 (deemed the date of initial investment, pursuant to a reorganization that took place on August 28, 2009) to September 30, 2009. Actual expenses are equal to the Fund's annualized net expense ratio of 1.19%, multiplied by 33/365 (to reflect the period from initial investment to September 30, 2009). “Hypothetical” expense information is presented on the basis of the full one-half-year period to enable comparison to other funds. It is based on assuming the same net expense ratio and average account value over the period, but it is multiplied by 183/365 (to reflect the full half-year period). |
Annual Shareholder Report3
Performance data quoted represents past performance which is no guarantee of future results. Investment return and principal value will fluctuate so that an investor's shares, when redeemed, may be worth more or less than their original cost. Mutual fund performance changes over time and current performance may be lower or higher than what is stated. For current to the most recent month-end performance and after-tax returns, visit FederatedInvestors.com or call 1-800-341-7400.
Management's Discussion of Fund Performance (unaudited)
For the fiscal year ending September 30, 2009, the Federated Clover Small Value Fund1 Institutional Shares produced a total return, based on net asset value, of - -3.36%. For the same period, the total return for the Russell 2000® Value Index2 benchmark was -12.61%. The Fund's total return for the fiscal year reflected actual cash flows, transaction costs and other expenses which were not reflected in the total return of the Russell 2000® Value Index.
MARKET OVERVIEW
The first half of the Fund's fiscal year was characterized by extreme downside volatility related to the financial and housing industry crises. A deleveraging consumer, high unemployment and concerns regarding the impact of the government's stimulus programs on the value of the dollar weighed heavily on investor sentiment. During this period, the broad market, as measured by the Standard & Poor's 500 Index (S&P 500),3 declined approximately 40%. The second half of the fiscal year was characterized by “less worse and, maybe, slightly better” economic reports which were labeled as “green shoots” by the press. Despite lingering economic woes, the ever-forward-looking stock market took its cue accordingly in anticipation of stabilization in the near future. Off the March lows, the broad market staged the largest rally in decades, with the S&P 500 recording an astonishing gain of nearly 60% as of the close on September 30, 2009.
| 1 | Federated Clover Small Value Fund is the successor to Touchstone Diversified Small Cap Value Fund, a portfolio of Touchstone Funds Group Trust, pursuant to a reorganization that took place as of the close of business on August 28, 2009. The information presented above, for the periods prior to August 28, 2009, is historical information for Touchstone Diversified Small Cap Value Fund. |
| 2 | The Russell 2000® Value Index offers investors access to the small-cap value segment of the U.S. equity universe. The Russell 2000® Value Index is constructed to provide a comprehensive and unbiased barometer of the small-cap value market. Based on ongoing empirical research of the investment manager behavior, the methodology used to determine value probability approximates the aggregate small-cap value manager's opportunity set. The index is unmanaged, and unlike the Fund, is not affected by cash flows. It is not possible to invest directly in an index. |
| 3 | The S&P 500 Index is an unmanaged capitalization-weighted index of 500 stocks designed to measure performance of the broad domestic economy through changes in the aggregate market value of 500 stocks representing all major industries. The index is unmanaged, and unlike the Fund, is not affected by cash flows. It is not possible to invest directly in an index. |
Annual Shareholder Report4
FUND PERFORMANCE
The key driver of performance for the Federated Clover Small Value Fund4 versus the Russell 2000® Value Index was strong stock selection across multiple sectors and industries. Specifically, there was good stock selection within the Financials, Technology, Energy and Health Care sectors. Small sector over and underweights relative to the Russell 2000® Value Index also contributed positively to performance. Detracting from performance during the reporting period was stock selection within the Consumer Discretionary space. The Fund's outperformance during a volatile year was due to a focus on deploying capital to inexpensive stocks with improving fundamentals and Fund management's adherence to prudent risk controls in the Fund.
Individual stocks that contributed to the Fund's outperformance resided in multiple sectors across the Fund. Cliffs Natural Resources in the Materials sector, up 122%, an iron ore producer, benefitted from strong demand for its natural resources. NBTY, a vitamin manufacturer and supplier, increased 166% due to strong demand for its products and the accretion from acquisitions realized during the year. Cooper Tire and Rubber increased 209% in the Fund's portfolio which was opportunistically purchased when it was inexpensive relative to its fundamental outlook. TriQuint Semiconductor increased 72% within the Fund as demand for their semiconductor products improved throughout the year.
The top five positive contributors were: TriQuint Semiconductor, NBTY, Cooper Tire, URS Corp. and Cliffs Natural Resources.
The Fund generated alpha based on fundamental, bottom-up stock selection and to a lesser degree from deviations to our sector weightings versus our benchmark. The sector deviations that impacted the Fund were an underweight in Financials and small overweights in the Technology and Materials sectors.
| 4 | Because the Fund invests in smaller companies, it may be more volatile, and subject to greater short-term risk, than funds that invest in larger companies. Smaller companies may have limited resources, product lines and markets and their securities may trade less frequently and in more limited volumes than securities of larger companies. |
Annual Shareholder Report5
POSITIONING AND STRATEGYDuring the reporting period, many of the Fund's stock selections focused on companies with the financial strength to weather the difficult environment. The Fund's emphasis on companies with consistent cash flows and strong balance sheets is an integral part of the Advisers investment process. Across various industries during the fiscal year, reductions in productive capacity presented opportunities for stronger companies to maintain or increase market share while weaker competitors struggled to survive.
Elevated volatility of stock prices during the reporting period, especially during the first half of the fiscal year, presented opportunities for the Fund to purchase companies whose long-term intrinsic value appeared to be grossly underestimated by the market. Fund management observed situations in which concerns regarding issues, such as bank nationalization, debt refinancing and declining consumer demand, created what management believed to be attractive opportunities in several securities. Fund management's disciplined approach to evaluating these situations resulted in purchases across multiple sectors within the portfolio.
The Fund concluded the fiscal year overweight relative to the benchmark in Information Technology, Materials and Energy, while being underweight in the Financial Services, Utilities and Consumer Discretionary sectors. The Fund's over or underweight relative to its benchmark are driven not by economic forecasts, but rather, by the analysts' view of company-specific opportunities within each sector. While the Fund's managers remain cognizant of macroeconomic factors that may affect Fund performance, the investment approach focuses instead on bottom-up, fundamental analysis that seeks to construct a well-diversified5 risk-controlled portfolio.
| 5 | Diversification does not assure a profit nor protect against loss. |
Annual Shareholder Report6
GROWTH OF A $10,000 INVESTMENT - institutional shares
The Fund's Institutional Shares commenced operations on August 29, 2009. The Fund offers two other classes of shares: Class A Shares and Class C Shares. For the period prior to commencement of operations of the Institutional Shares, the performance information shown is for the Fund's Class A Shares. The performance of Class A Shares has not been adjusted to reflect the expenses of the Institutional Shares since the Institutional Shares have a lower expense ratio than the expense ratio of the Class A Shares. The performance of Class A Shares has been adjusted to remove any voluntary waiver of Fund expenses related to the Class A Shares that may have occurred during the period prior to commencement of operations of the Institutional Shares. The graph below illustrates the hypothetical investment of $10,0001 in Federated Clover Small Value Fund (Institutional Shares) (the “Fund”) from September 30,1999 to September 30, 2009, compared to the Russell 2000® Value Index (Russell 2000® Value).2
| Average Annual Total Returns for the Period Ended 9/30/2009 | |
| 1 Year | -3.36% |
| 5 Years | 3.94% |
| 10 Years | 9.69% |
| 1 | Represents a hypothetical investment of $10,000 in the Fund. The Fund's performance assumes the reinvestment of all dividends and distributions. The Russell 2000® Value has been adjusted to reflect reinvestment of dividends on securities in the index. |
| 2 | The Russell 2000® Value is not adjusted to reflect sales charges, expenses or other fees that the Securities and Exchange Commission (SEC) requires to be reflected in the Fund's performance. The index is unmanaged, and unlike the Fund, is not affected by cash flows. It is not possible to invest directly in an index. |
Annual Shareholder Report7
Performance data quoted represents past performance which is no guarantee of future results. Investment return and principal value will fluctuate so that an investor's shares, when redeemed, may be worth more or less than their original cost. Mutual fund performance changes over time and current performance may be lower or higher than what is stated. For current to the most recent month-end performance and after-tax returns, visit FederatedInvestors.com or call 1-800-341-7400. Returns shown do not reflect the deduction of taxes that a shareholder would pay on fund distributions or the redemption of fund shares. Mutual funds are not obligations of or guaranteed by any bank and are not federally insured.
Annual Shareholder Report8
Portfolio of Investments Summary Table (unaudited)
At September 30, 2009, the Fund's sector composition1 was as follows:
| Sector Composition | | Percentage of
Total Net Assets |
| Financials | | 27.5% |
| Industrials | | 16.6% |
| Information Technology | | 14.3% |
| Consumer Discretionary | | 9.7% |
| Materials | | 8.6% |
| Energy | | 7.4% |
| Health Care | | 4.5% |
| Utilities | | 4.4% |
| Consumer Staples | | 3.2% |
| Cash Equivalents2 | | 3.1% |
| Other Assets and Liabilities — Net3 | | 0.7% |
| TOTAL | | 100.0% |
| 1 | Except for Cash Equivalents and Other Assets and Liabilities, sector classifications are based upon, and individual portfolio securities are assigned to, the classifications of the Global Industry Classification Standard (GICS) except that the Adviser assigns a classification to securities not classified by the GICS and to securities for which the Adviser does not have access to the classification made by the GICS. |
| 2 | Cash Equivalents include any investments in money market mutual funds and/or overnight repurchase agreements. |
| 3 | Assets, other than investments in securities, less liabilities. See Statement of Assets and Liabilities. |
Annual Shareholder Report9
Portfolio of Investments
September 30, 2009
|
| Shares | | | Value |
| | COMMON STOCKS – 96.2% | |
| | Consumer Discretionary – 9.7% | |
| 64,180 | | Asbury Automotive Group, Inc. | 813,802 |
| 147,940 | | Brown Shoe Co., Inc. | 1,186,479 |
| 89,442 | 1 | Build-A-Bear Workshop, Inc. | 435,583 |
| 79,470 | 1 | Chicos Fas, Inc. | 1,033,110 |
| 52,660 | | Cooper Tire & Rubber Co. | 925,763 |
| 22,650 | | Ethan Allen Interiors, Inc. | 373,725 |
| 97,080 | 1 | Hot Topic, Inc. | 727,129 |
| 40,150 | 1 | JAKKS Pacific, Inc. | 574,948 |
| 133,575 | | Jackson Hewitt Tax Service, Inc. | 681,233 |
| 2,250 | | Ryland Group, Inc. | 47,408 |
| 64,210 | | Service Corp. International | 450,112 |
| 72,625 | 1 | Skechers USA, Inc., Class A | 1,244,792 |
| 85,500 | | Spartan Motors, Inc. | 439,470 |
| 12,400 | 1 | Standard Pacific Corp. | 45,756 |
| 45,010 | 1 | Tenneco Automotive, Inc. | 586,930 |
| 187,445 | 1 | Wet Seal, Inc., Class A | 708,542 |
| 65,635 | 1 | Zumiez Inc. | 1,077,070 |
| | TOTAL | 11,351,852 |
| | Consumer Staples – 3.2% | |
| 158,875 | 1 | Alliance One International, Inc. | 711,760 |
| 42,750 | 1 | Elizabeth Arden, Inc. | 503,168 |
| 34,875 | 1 | NBTY, Inc. | 1,380,352 |
| 27,245 | | Spartan Stores, Inc. | 384,972 |
| 20,055 | 1 | TreeHouse Foods, Inc. | 715,362 |
| | TOTAL | 3,695,614 |
| | Energy – 7.4% | |
| 37,200 | | Cabot Oil & Gas Corp., Class A | 1,329,900 |
| 21,919 | 1 | Forest Oil Corp. | 428,955 |
| 19,360 | | Gulf Island Fabrication, Inc. | 362,806 |
| 11,400 | 1 | Gulfmark Offshore, Inc. | 373,236 |
| 108,030 | 1 | Helix Energy Solutions Group, Inc. | 1,618,289 |
| 29,970 | | Holly Corp. | 767,831 |
| 12,765 | 1 | Hornbeck Offshore Services, Inc. | 351,803 |
| 25,610 | 1 | Mariner Energy, Inc. | 363,150 |
Annual Shareholder Report10
|
| 49,935 | 1 | Natural Gas Services Group, Inc. | 879,855 |
| 8,325 | | Nordic American Tanker Shipping Ltd. | 246,254 |
| 16,135 | | Penn Virginia Corp. | 369,653 |
| 11,490 | | St. Mary Land & Exploration Co. | 372,965 |
| 155,025 | 1 | USEC, Inc. | 727,067 |
| 8,675 | 1 | Whiting Petroleum Corp. | 499,507 |
| | TOTAL | 8,691,271 |
| | Financials – 27.5% | |
| 48,615 | | American Campus Communities, Inc. | 1,305,313 |
| 133,945 | | Anworth Mortgage Asset Corp. | 1,055,487 |
| 103,055 | | Apollo Investment Corp. | 984,175 |
| 77,045 | | Ares Capital Corp. | 849,036 |
| 29,483 | 1 | Argo Group International Holdings Ltd. | 992,987 |
| 33,205 | | Aspen Insurance Holdings Ltd. | 878,936 |
| 18,075 | | Assured Guaranty Ltd. | 351,017 |
| 12,325 | | Cash America International, Inc. | 371,722 |
| 17,950 | | City Holding Co. | 535,090 |
| 42,380 | | Columbia Banking Systems, Inc. | 701,389 |
| 20,900 | | Delphi Financial Group, Inc., Class A | 472,967 |
| 54,420 | | Dime Community Bancorp, Inc. | 622,021 |
| 88,070 | | FNB Corp. (PA) | 626,178 |
| 49,975 | | First Niagara Financial Group, Inc. | 616,192 |
| 35,394 | | FirstMerit Corp. | 673,548 |
| 61,690 | | Flushing Financial Corp. | 703,266 |
| 27,890 | | Highwoods Properties, Inc. | 877,140 |
| 22,455 | | Home Properties, Inc. | 967,586 |
| 23,005 | | Iberiabank Corp. | 1,048,108 |
| 33,080 | | Independent Bank Corp. - - Massachusetts | 732,060 |
| 44,545 | | LTC Properties, Inc. | 1,070,862 |
| 102,910 | | MFA Mortgage Investments, Inc. | 819,164 |
| 98,030 | | MGIC Investment Corp. | 726,402 |
| 119,245 | | Maiden Holdings Ltd. | 866,911 |
| 57,255 | | Montpelier Re Holdings Ltd. | 934,402 |
| 47,350 | | Nara Bancorp, Inc. | 329,083 |
| 98,885 | | National Penn Bancshares, Inc. | 604,187 |
| 59,675 | | National Retail Properties, Inc. | 1,281,222 |
| 77,895 | | Newalliance Bancshares, Inc. | 833,476 |
Annual Shareholder Report11
|
| 55,225 | 1 | Ocwen Financial Corp. | 625,147 |
| 37,935 | | Platinum Underwriters Holdings Ltd. | 1,359,590 |
| 22,696 | | Potlatch Corp. | 645,701 |
| 16,625 | 1 | ProAssurance Corp. | 867,659 |
| 19,675 | | Prosperity Bancshares, Inc. | 684,493 |
| 15,100 | 1 | SVB Financial Group | 653,377 |
| 266,485 | | South Financial Group, Inc. | 391,733 |
| 104,742 | | Sterling Bancshares, Inc. | 765,664 |
| 17,675 | | Stewart Information Services Corp. | 218,640 |
| 57,785 | | Sun Communities, Inc. | 1,243,533 |
| 37,280 | | Trustmark Corp. | 710,184 |
| 77,600 | | Umpqua Holdings Corp. | 822,560 |
| 20,720 | | Washington Federal, Inc. | 349,339 |
| | TOTAL | 32,167,547 |
| | Health Care – 4.5% | |
| 178,760 | 1 | Akorn, Inc. | 244,901 |
| 38,920 | 1 | Albany Molecular Research, Inc. | 337,047 |
| 19,025 | 1 | Amerigroup Corp. | 421,784 |
| 36,040 | 1 | Celera Corporation | 224,529 |
| 9,120 | | Chemed Corp. | 400,277 |
| 14,650 | 1 | Endo Pharmaceuticals Holdings, Inc. | 331,530 |
| 47,420 | 1 | Inspire Pharmaceuticals, Inc. | 247,533 |
| 45,955 | | MDS, Inc. | 376,372 |
| 16,005 | 1 | Magellan Health Services, Inc. | 497,115 |
| 28,955 | 1 | Par Pharmaceutical Cos., Inc. | 622,822 |
| 21,950 | 1 | Parexel International Corp. | 298,301 |
| 21,370 | 1 | Salix Pharmaceuticals Ltd. | 454,326 |
| 9,530 | | Teleflex, Inc. | 460,394 |
| 32,165 | 1 | ViroPharma, Inc. | 309,427 |
| | TOTAL | 5,226,358 |
| | Industrials – 16.6% | |
| 17,448 | 1 | American Commercial Lines, Inc. | 508,086 |
| 25,705 | | Ampco-Pittsburgh Corp. | 683,496 |
| 51,420 | | Barnes Group, Inc. | 878,768 |
| 36,650 | | CDI Corp. | 514,933 |
| 39,905 | 1 | Ceradyne, Inc. | 731,459 |
| 53,775 | | Chicago Bridge & Iron Co., N.V. | 1,004,517 |
Annual Shareholder Report12
|
| 15,290 | 1 | Consolidated Graphics, Inc. | 381,486 |
| 17,710 | | Curtiss Wright Corp. | 604,442 |
| 32,360 | | Deluxe Corp. | 553,356 |
| 39,590 | 1 | Dyncorp International, Inc., Class A | 712,620 |
| 64,345 | | Eagle Bulk Shipping, Inc. | 330,090 |
| 25,785 | 1 | EnPro Industries, Inc. | 589,445 |
| 22,435 | 1 | Esterline Technologies Corp. | 879,676 |
| 36,275 | 1 | GrafTech International Ltd. | 533,243 |
| 35,550 | 1 | Hub Group, Inc. | 812,317 |
| 28,640 | | Hubbell, Inc., Class B | 1,202,880 |
| 75,900 | 1 | Interline Brands, Inc. | 1,278,915 |
| 201,725 | 1 | Jet Blue Airways Corp. | 1,206,315 |
| 27,635 | | OshKosh Truck Corp. | 854,751 |
| 54,980 | 1 | Pike Electric Corp. | 658,660 |
| 30,390 | 1 | School Specialty, Inc. | 720,851 |
| 69,000 | 1 | Seaspan Corp. | 617,550 |
| 16,000 | 1 | Thomas & Betts Corp. | 481,280 |
| 20,390 | | Triumph Group, Inc. | 978,516 |
| 106,625 | 1 | UAL Corp. | 983,082 |
| 15,433 | 1 | URS Corp. | 673,650 |
| | TOTAL | 19,374,384 |
| | Information Technology – 14.3% | |
| 76,225 | 1 | Arris Group, Inc. | 991,687 |
| 30,125 | 1 | Avocent Corp. | 610,634 |
| 31,465 | | Black Box Corp. | 789,457 |
| 96,020 | 1 | Brocade Communications Systems, Inc. | 754,717 |
| 27,810 | 1 | CSG Systems International, Inc. | 445,238 |
| 42,595 | | CTS Corp. | 396,134 |
| 16,900 | 1 | CommScope, Inc. | 505,817 |
| 18,640 | 1 | Digital River, Inc. | 751,565 |
| 99,530 | | EarthLink Network, Inc. | 837,047 |
| 71,440 | 1 | Fairchild Semiconductor International, Inc., Class A | 730,831 |
| 47,312 | 1 | Finisar Corp. | 457,978 |
| 52,570 | 1 | Insight Enterprises, Inc. | 641,880 |
| 29,360 | 1 | NICE-Systems Ltd., ADR | 893,718 |
| 127,595 | 1 | SeaChange International, Inc. | 956,962 |
| 92,475 | 1 | Sonicwall, Inc. | 776,790 |
Annual Shareholder Report13
|
| 74,610 | 1 | Symmetricom, Inc. | 386,480 |
| 104,275 | | Technitrol, Inc. | 960,373 |
| 225,245 | 1 | TriQuint Semiconductor, Inc. | 1,738,891 |
| 110,105 | | United Online, Inc. | 885,244 |
| 36,095 | 1 | Verifone Holdings, Inc. | 573,550 |
| 77,200 | 1 | Zoran Corp. | 889,344 |
| 32,785 | 1 | j2 Global Communications, Inc. | 754,383 |
| | TOTAL | 16,728,720 |
| | Materials – 8.6% | |
| 30,045 | 1 | Brush Engineered Materials, Inc. | 734,901 |
| 23,050 | | Cabot Corp. | 532,685 |
| 25,685 | | Carpenter Technology Corp. | 600,772 |
| 51,825 | 1 | Century Aluminum Co. | 484,564 |
| 25,910 | | Cliffs Natural Resources, Inc. | 838,448 |
| 149,325 | 1 | Hecla Mining Co. | 655,537 |
| 30,365 | | Innospec, Inc. | 447,884 |
| 22,345 | 1 | Intrepid Potash, Inc. | 527,118 |
| 98,210 | 1 | Louisiana-Pacific Corp. | 655,061 |
| 61,685 | | Myers Industries, Inc. | 664,347 |
| 20,555 | 1 | OM Group, Inc. | 624,666 |
| 22,825 | | Olympic Steel, Inc. | 654,849 |
| 38,800 | 1 | RTI International Metals | 966,508 |
| 47,135 | 1 | Rockwood Holdings, Inc. | 969,567 |
| 58,940 | | Spartech Corp. | 634,784 |
| | TOTAL | 9,991,691 |
| | Utilities – 4.4% | |
| 18,390 | | AGL Resources, Inc. | 648,615 |
| 33,030 | | Atmos Energy Corp. | 930,785 |
| 53,795 | | Avista Corp. | 1,087,735 |
| 18,425 | | Cleco Corp. | 462,099 |
| 20,420 | | MGE Energy, Inc. | 744,922 |
| 20,945 | | Northwestern Corp. | 511,686 |
| 40,105 | | Westar Energy, Inc. | 782,449 |
| | TOTAL | 5,168,291 |
| | TOTAL COMMON STOCKS
(IDENTIFIED COST $107,126,833) | 112,395,728 |
Annual Shareholder Report14
|
| | Mutual Fund – 3.1% | |
| 3,636,312 | 2,3 | Prime Value Obligations Fund, Institutional Shares, 0.30%
(AT NET ASSET VALUE) | 3,636,312 |
| | TOTAL INVESTMENTS — 99.3%
(IDENTIFIED COST $110,763,145)4 | 116,032,040 |
| | OTHER ASSETS AND LIABILITIES - NET — 0.7%5 | 799,865 |
| | TOTAL NET ASSETS — 100% | $116,831,905 |
| 1 | Non-income producing security. |
| 2 | Affiliated company. |
| 3 | 7-Day net yield. |
| 4 | The cost of investments for federal tax purposes amounts to $112,459,860. |
| 5 | Assets, other than investments in securities, less liabilities. See Statement of Assets and Liabilities. |
- Note: The categories of investments are shown as a percentage of total net assets at September 30, 2009.
- Various inputs are used in determining the value of the Fund's investments. These inputs are summarized in the three broad levels listed below:
- Level 1 — quoted prices in active markets for identical securities
- Level 2 — other significant observable inputs (including quoted prices for similar securities, interest rates, prepayment speeds, credit risk, etc.)
- Level 3 — significant unobservable inputs (including the Fund's own assumptions in determining the fair value of investments)
- The inputs or methodology used for valuing securities are not an indication of the risk associated with investing in those securities.
- The following is a summary of the inputs used, as of September 30, 2009, in valuing the Fund's assets carried at fair value:
| Valuation Inputs | | | | |
| Level 1 -
Quoted
Prices and
Investments in
Mutual Funds | Level 2 -
Other
Significant
Observable
Inputs | Level 3 -
Significant
Unobservable
Inputs | Total |
| Equity Securities: | | | | |
| Domestic | $104,160,934 | $ — | $ — | $104,160,934 |
| International | 8,234,794 | — | — | 8,234,794 |
| Mutual Fund | 3,636,312 | — | — | 3,636,312 |
| TOTAL | $116,032,040 | $ — | $ — | $116,032,040 |
- The following acronym is used throughout this portfolio:
- ADR — American Depositary Receipt
- See Notes which are an integral part of the Financial Statements
Annual Shareholder Report15
Statement of Assets and Liabilities
September 30, 2009
| Assets: | | |
| Total investments in securities, at value including $3,636,312 of investments in an affiliated issuer (Note 6) (identified cost $110,763,145) | | $116,032,040 |
| Cash | | 26,873 |
| Income receivable | | 107,136 |
| Receivable for investments sold | | 1,007,495 |
| Receivable for shares sold | | 34,888 |
| Other assets | | 158,018 |
| TOTAL ASSETS | | 117,366,450 |
| Liabilities: | | |
| Payable for shares redeemed | $369,045 | |
| Payable for investment adviser fee (Note 6) | 64,727 | |
| Payable for administrative personnel and services fee (Note 6) | 15,300 | |
| Payable for auditing fees | 26,000 | |
| Payable for portfolio accounting fees | 10,296 | |
| Payable for distribution services fee (Note 6) | 3,092 | |
| Payable for shareholder services fee (Note 6) | 22,202 | |
| Accrued expenses | 23,883 | |
| TOTAL LIABILITIES | | 534,545 |
| Net assets for 7,271,843 shares outstanding | | $116,831,905 |
| Net Assets Consist of: | | |
| Paid-in capital | | $134,332,379 |
| Net unrealized appreciation of investments | | 5,268,895 |
| Accumulated net realized loss on investments | | (22,819,247) |
| Undistributed net investment income | | 49,878 |
| TOTAL NET ASSETS | | $116,831,905 |
Annual Shareholder Report16
Statement of Assets and Liabilities — continued| Net Asset Value, Offering Price and Redemption Proceeds Per Share | | |
| Class A Shares: | | |
Net asset value per share ($102,599,036 ÷ 6,385,748 shares outstanding),
no par value, unlimited shares authorized | | $16.07 |
| Offering price per share (100/94.50 of $16.07) | | $17.01 |
| Redemption proceeds per share | | $16.07 |
| Class C Shares: | | |
Net asset value per share ($5,071,470 ÷ 316,602 shares outstanding),
no par value, unlimited shares authorized | | $16.02 |
| Offering price per share | | $16.02 |
| Redemption proceeds per share (99.00/100 of $16.02) | | $15.86 |
| Institutional Shares: | | |
Net asset value per share ($9,161,399 ÷ 569,493 shares outstanding),
no par value, unlimited shares authorized | | $16.09 |
| Offering price per share | | $16.09 |
| Redemption proceeds per share | | $16.09 |
- See Notes which are an integral part of the Financial Statements
Annual Shareholder Report17
Statement of Operations
Year Ended September 30, 2009
| Investment Income: | | | |
| Dividends (including $30,726 received from affiliated issuers (Note 6) ) | | | $2,133,950 |
| Income on securities loaned (Note 3) | | | 100,421 |
| TOTAL INCOME | | | 2,234,371 |
| Expenses: | | | |
| Investment adviser fee (Note 6) | | $746,701 | |
| Administrative personnel and services fee (Note 6) | | 174,517 | |
| Custodian fees | | 6,473 | |
| Transfer and dividend disbursing agent fees and expenses | | 123,953 | |
| Directors'/Trustees' fees | | 4,036 | |
| Auditing fees | | 10,643 | |
| Legal fees | | 10,536 | |
| Portfolio accounting fees | | 9,733 | |
| Distribution services fee — Class A Shares (Note 6) | | 3,766 | |
| Distribution services fee — Class C Shares (Note 6) | | 8,805 | |
| Shareholder services fee — Class A Shares (Note 6) | | 182,783 | |
| Shareholder services fee — Class C Shares (Note 6) | | 1,065 | |
| Share registration costs | | 49,256 | |
| Printing and postage | | 22,508 | |
| Miscellaneous | | 19,139 | |
| TOTAL EXPENSES | | 1,373,914 | |
| Waivers and Reimbursement (Note 6): | | | |
| Waiver/reimbursement of investment adviser fee | $(21,066) | | |
| Waiver of administrative personnel and services fee | (82,941) | | |
| TOTAL WAIVERS AND REIMBURSEMENT | | (104,007) | |
| Net expenses | | | 1,269,907 |
| Net investment income | | | 964,464 |
Realized and Unrealized Gain (Loss)
on Investments: | | | |
| Net realized loss on investments | | | (22,889,037) |
| Net change in unrealized depreciation of investments | | | 13,402,567 |
| Net realized and unrealized loss on investments | | | (9,486,470) |
| Change in net assets resulting from operations | | | $(8,522,006) |
- See Notes which are an integral part of the Financial Statements
Annual Shareholder Report18
Statement of Changes in Net Assets
| Year Ended September 30 |
2009 | 2008 |
| Increase (Decrease) in Net Assets | | |
| Operations: | | |
| Net investment income | $964,464 | $864,380 |
| Net realized gain (loss) on investments | (22,889,037) | 6,992,973 |
| Net change in unrealized appreciation/depreciation of investments | 13,402,567 | (21,709,390) |
| CHANGE IN NET ASSETS RESULTING FROM OPERATIONS | (8,522,006) | (13,852,037) |
| Distributions to Shareholders: | | |
| Distributions from net investment income | | |
| Class A Shares | (810,062) | (3,956) |
| Class C Shares | (2,791) | (2,925) |
| Class Z Shares | — | (857,493) |
| Distributions from net realized gain on investments | | |
| Class A Shares | (5,479,391) | (63,928) |
| Class C Shares | (30,402) | (23,056) |
| Class Z Shares | — | (41,283,195) |
| CHANGE IN NET ASSETS RESULTING FROM DISTRIBUTIONS TO SHAREHOLDERS | (6,322,646) | (42,234,553) |
| Share Transactions: | | |
| Proceeds from sale of shares | 17,673,694 | 20,865,758 |
| Exchange of Successor Fund shares in connection with the tax-free reorganization of Touchstone Diversified Small Cap Value Fund (Note 2) | 19,896,773 | — |
| Net asset value of shares issued to shareholders in payment of distributions declared | 6,154,348 | 41,170,287 |
| Cost of shares redeemed | (36,016,916) | (60,260,861) |
| CHANGE IN NET ASSETS RESULTING FROM SHARE TRANSACTIONS | 7,707,899 | 1,775,184 |
| Change in net assets | (7,136,753) | (54,311,406) |
| Net assets: | | |
| Beginning of period | 123,968,658 | 178,280,064 |
| End of period (including undistributed net investment income of $49,878 and $158,648, respectively) | $116,831,905 | $123,968,658 |
- See Notes which are an integral part of the Financial Statements
Annual Shareholder Report19
Notes to Financial Statements
September 30, 2009
1. ORGANIZATION
Federated Equity Funds (the “Trust”) is registered under the Investment Company Act of 1940, as amended (the “Act”), as an open-end management investment company. The Trust consists of 13 diversified portfolios. The financial statements included herein are only those of Federated Clover Small Value Fund (the “Fund”). The financial statements of the other portfolios are presented separately. The assets of each portfolio are segregated and a shareholder's interest is limited to the portfolio in which shares are held. Each portfolio pays its own expenses. The Fund offers three classes of shares: Class A Shares, Class C Shares and Institutional Shares. All shares of the Fund have equal rights with respect to voting, except on class-specific matters. The financial highlights of the Class A Shares and Class C Shares are presented separately. The investment objective of the Fund is to seek capital appreciation.
2. REORGANIZATION
The Fund is the successor (Successor Fund) to Touchstone Diversified Small Cap Value Fund (the “Predecessor Fund”), a portfolio of Touchstone Funds Group Trust, pursuant to a reorganization that took place as of the close of business on August 28, 2009. On that date, Class A Shares, Class C Shares and Class Z Shares of the Predecessor Fund were exchanged for Class A Shares, Class C Shares and Class A Shares of the Fund, respectively. As a result of the reorganization on August 28, 2009, the Predecessor Fund became the accounting survivor. Accordingly, the performance information presented in the financial statements for the periods prior to August 28, 2009, is historical information of the Predecessor Fund.
On August 28, 2009, the Fund received a tax-free transfer of assets from Touchstone Diversified Small Cap Value Fund, as follows:
Shares of the
Fund Issued | Touchstone
Diversified Small
Cap Value
Fund
Net Assets
Received | Unrealized
Depreciation1 | Net Assets
of the Fund
Immediately
Prior to
Combination | Net Assets
of the Fund
Immediately
After
Combination |
| 6,128,495 | $94,465,611 | $(1,599,031) | $19,896,773 | $114,362,384 |
| 1 | Unrealized depreciation is included in the Touchstone Diversified Small Cap Value Fund Net Assets Received amount shown above. |
On the date of the reorganization, the Successor Fund's net assets included $2,163,853 of net unrealized appreciation.
3. SIGNIFICANT ACCOUNTING POLICIES
The following is a summary of significant accounting policies consistently followed by the Fund in the preparation of its financial statements. These policies are in conformity with U.S. generally accepted accounting principles (GAAP).
Annual Shareholder Report20
Investment ValuationIn calculating its net asset value (NAV), the Fund generally values investments as follows:
- Equity securities listed on an exchange or traded through a regulated market system are valued at their last reported sale price or official closing price in their principal exchange or market.
- Shares of other mutual funds are valued based upon their reported NAVs.
- Fixed-income securities acquired with remaining maturities greater than 60 days are fair valued using price evaluations provided by a pricing service approved by the Board of Trustees (the “Trustees”).
- Fixed-income securities acquired with remaining maturities of 60 days or less are valued at their cost (adjusted for the accretion of any discount or amortization of any premium).
- Derivative contracts listed on exchanges are valued at their reported settlement or closing price.
- Over-the-counter (OTC) derivative contracts are fair valued using price evaluations provided by a pricing service approved by the Trustees.
If the Fund cannot obtain a price or price evaluation from a pricing service for an investment, the Fund may attempt to value the investment based upon the mean of bid and asked quotations or fair value the investment based on price evaluations, from one or more dealers. If any price, quotation, price evaluation or other pricing source is not readily available when the NAV is calculated, the Fund uses the fair value of the investment determined in accordance with the procedures described below. There can be no assurance that the Fund could purchase or sell an investment at the price used to calculate the Fund's NAV.
Fair Valuation and Significant Events Procedures
The Trustees have authorized the use of pricing services to provide evaluations of the current fair value of certain investments for purposes of calculating the NAV. Factors considered by pricing services in evaluating an investment include the yields or prices of investments of comparable quality, coupon, maturity, call rights and other potential prepayments, terms and type, reported transactions, indications as to values from dealers, and general market conditions. Some pricing services provide a single price evaluation reflecting the bid-side of the market for an investment (a “bid” evaluation). Other pricing services offer both bid evaluations and price evaluations indicative of a price between the prices bid and asked for the investment (a “mid” evaluation). The Fund normally uses bid evaluations for U.S. Treasury and Agency securities, mortgage-backed securities and municipal securities. The Fund normally uses mid evaluations for other types of fixed-income securities and OTC derivative contracts. In the event that market quotations and price evaluations are not available for an investment, the fair value of the investment is determined in accordance with procedures adopted by the Trustees.
The Trustees also have adopted procedures requiring an investment to be priced at its fair value whenever the Adviser determines that a significant event affecting the value of the investment has occurred between the time as of which the price of the investment would otherwise be determined and the time as of which the NAV is computed. An event is considered significant if there is both an affirmative expectation that the investment's value will change in response to the event and a reasonable basis for quantifying the resulting change in value. Examples of significant events that may occur after the close of the principal market on which a security is traded, or after the time of a price evaluation provided by a pricing service or a dealer, include:
- With respect to securities traded in foreign markets, significant trends in U.S. equity markets or in the trading of foreign securities index futures or options contracts;
Annual Shareholder Report21
- With respect to price evaluations of fixed-income securities determined before the close of regular trading on the NYSE, actions by the Federal Reserve Open Market Committee and other significant trends in U.S. fixed-income markets;
- Political or other developments affecting the economy or markets in which an issuer conducts its operations or its securities are traded; and
- Announcements concerning matters such as acquisitions, recapitalizations, litigation developments, a natural disaster affecting the issuer's operations or regulatory changes or market developments affecting the issuer's industry.
The Trustees have approved the use of a pricing service to determine the fair value of equity securities traded principally in foreign markets when the Adviser determines that there has been a significant trend in the U.S. equity markets or in index futures trading. For other significant events, the Fund may seek to obtain more current quotations or price evaluations from alternative pricing sources. If a reliable alternative pricing source is not available, the Fund will determine the fair value of the investment using another method approved by the Trustees.
Investment Income, Gains and Losses, Expenses and Distributions
Investment transactions are accounted for on a trade-date basis. Realized gains and losses from investment transactions are recorded on an identified-cost basis. Interest income and expenses are accrued daily. Dividend income and distributions to shareholders are recorded on the ex-dividend date. Foreign dividends are recorded on the ex-dividend date or when the Fund is informed of the ex-dividend date. Distributions of net investment income are declared and paid annually. Non-cash dividends included in dividend income, if any, are recorded at fair value. Investment income, realized and unrealized gains and losses, and certain fund-level expenses are allocated to each class based on relative average daily net assets, except that each class may bear certain expenses unique to that class such as distribution services and shareholder services fees. Dividends are declared separately for each class. No class has preferential dividend rights; differences in per share dividend rates are generally due to differences in separate class expenses.
Premium and Discount Amortization
All premiums and discounts on fixed-income securities are amortized/accreted for financial statement purposes.
Federal Taxes
It is the Fund's policy to comply with the Subchapter M provision of the Internal Revenue Code (the “Code”) and to distribute to shareholders each year substantially all of its income. Accordingly, no provision for federal income tax is necessary. As of and during the year ended September 30, 2009, the Fund did not have a liability for any uncertain tax positions. The Fund recognizes interest and penalties, if any, related to tax liabilities as income tax expense in the Statement of Operations. As of September 30, 2009, tax year 2009 remains subject to examination by the Fund's major tax jurisdictions, which include the United States of America and the Commonwealth of Massachusetts.
Annual Shareholder Report22
When-Issued and Delayed Delivery TransactionsThe Fund may engage in when-issued or delayed delivery transactions. The Fund records when-issued securities on the trade date and maintains security positions such that sufficient liquid assets will be available to make payment for the securities purchased. Securities purchased on a when-issued or delayed delivery basis are marked to market daily and begin earning interest on the settlement date. Losses may occur on these transactions due to changes in market conditions or the failure of counterparties to perform under the contract.
Securities Lending
The Fund participates in a securities lending program providing for the lending of equity securities to qualified brokers. The Fund normally receives cash collateral for securities loaned that is invested in an affiliated money market fund or short-term securities including repurchase agreements. Collateral is maintained at a minimum level of 100% of the market value of investments loaned, plus interest, if applicable. In accordance with the Fund's securities lending agreement, the market value of securities on loan is determined each day at the close of business and any additional collateral required to cover the value of securities on loan is delivered to the Fund on the next business day. Earnings on collateral are allocated between the securities lending agent, as a fee for its services under the program, and the Fund, according to agreed-upon rates.
As of September 30, 2009, the Fund had no outstanding securities on loan.
Other
The preparation of financial statements in conformity with GAAP requires management to make estimates and assumptions that affect the amounts of assets, liabilities, expenses and revenues reported in the financial statements. Actual results could differ from those estimated.
4. SHARES OF BENEFICIAL INTEREST
The following tables summarize share activity:
| Year Ended September 30 | 2009 | 2008 |
| Class A Shares: | Shares | Amount | Shares | Amount |
| Shares sold | 411,102 | $4,295,554 | 40,375 | $549,659 |
| Transfer in of Class Z Shares1 | 8,469,843 | 116,130,888 | — | — |
| Shares issued to shareholders in payment of distributions declared | 21,333 | 176,843 | 5,193 | 67,890 |
| Exchange of Successor Fund shares in connection with the tax-free reorganization of Touchstone Diversified Small Cap Value Fund | 511,629 | 7,886,533 | — | — |
Adjustment of Predecessor
Fund shares in connection with
tax-free reorganization | (2,538,389) | — | — | — |
| Shares redeemed | (539,185) | (6,137,710) | (6,641) | (88,324) |
NET CHANGE RESULTING
FROM CLASS A SHARE TRANSACTIONS | 6,336,333 | $122,352,108 | 38,927 | $529,225 |
Annual Shareholder Report23
| Year Ended September 30 | 2009 | 2008 |
| Class C Shares: | Shares | Amount | Shares | Amount |
| Shares sold | 42,358 | $394,233 | 49,334 | $631,196 |
| Shares issued to shareholders in payment of distributions declared | 1,978 | 16,109 | 1,702 | 22,064 |
| Exchange of Successor Fund shares in connection with the tax-free reorganization of Touchstone Diversified Small Cap Value Fund | 264,944 | 4,073,170 | — | — |
Adjustment of Predecessor
Fund shares in connection with
tax-free reorganization | (25,050) | — | — | — |
| Shares redeemed | (17,176) | (215,460) | (5,548) | (69,868) |
NET CHANGE RESULTING
FROM CLASS C SHARE TRANSACTIONS | 267,054 | $4,268,052 | 45,488 | $583,392 |
| Year Ended September 30 | 2009 | 2008 |
| Class Z Shares:1 | Shares | Amount | Shares | Amount |
| Shares sold | 1,326,917 | $12,098,477 | 1,467,825 | $19,684,903 |
| Shares issued to shareholders in payment of distributions declared | 720,122 | 5,961,396 | 3,138,321 | 41,080,333 |
| Shares redeemed | (3,299,698) | (29,663,746) | (3,986,333) | (60,102,669) |
NET CHANGE RESULTING
FROM CLASS Z SHARE TRANSACTIONS | (1,252,659) | $(11,603,873) | 619,813 | $662,567 |
FINAL REDEMPTION FROM
CLASS Z SHARES | (8,469,843) | $(116,130,888) | — | $ — |
| Period Ended
9/30/20092 | Year Ended
9/30/2008 |
| Institutional Shares: | Shares | Amount | Shares | Amount |
| Shares sold | 54,875 | $885,430 | — | $ — |
| Exchange of Successor Fund shares in connection with the tax-free reorganization of Touchstone Diversified Small Cap Value Fund | 514,618 | 7,937,070 | — | — |
NET CHANGE RESULTING
FROM INSTITUTIONAL SHARE TRANSACTIONS | 569,493 | $8,822,500 | — | $ — |
| NET CHANGE RESULTING FROM FUND SHARE TRANSACTIONS | (2,549,622) | $7,707,899 | 704,228 | $1,775,184 |
| 1 | At the close of business on August 28, 2009, Class Z Shares were reorganized into Class A Shares. |
| 2 | Reflects operations for the period from August 29, 2009 (deemed the date of initial investment, pursuant to a reorganization that took place on August 28, 2009) to September 30, 2009. |
Annual Shareholder Report24
5. FEDERAL TAX INFORMATION
The timing and character of income and capital gain distributions are determined in accordance with income tax regulations, which may differ from GAAP. These differences are due to differing treatments for REIT adjustments, capital loss carryforwards and wash sale loss deferrals from the tax-free transfer of assets from Touchstone Diversified Small Cap Value Fund.
For the year ended September 30, 2009, permanent differences identified and reclassified among the components of net assets were as follows:
| Increase (Decrease) |
| Paid-In Capital | Undistributed
Net Investment
Income (Loss) | Accumulated
Net Realized
Gain (Loss) |
| $(402,833) | $(260,381) | $663,214 |
Net investment income (loss), net realized gains (losses), and net assets were not affected by this reclassification.
The tax character of distributions as reported on the Statement of Changes in Net Assets for the years ended September 30, 2009 and 2008, was as follows:
| 2009 | 2008 |
| Ordinary income1 | $812,853 | $15,124,522 |
| Long-term capital gains | $5,509,793 | $27,110,031 |
As of September 30, 2009, the components of distributable earnings on a tax basis were as follows:
| Undistributed ordinary income1 | $1,031,685 |
| Net unrealized appreciation | $3,572,180 |
| Capital loss carryforwards and deferrals | $(22,104,339) |
| 1 | For tax purposes, short-term capital gain distributions are considered ordinary income distributions. |
The difference between book-basis and tax-basis net unrealized appreciation/depreciation is attributable in part to differing treatments for the deferral of losses on wash sales and REIT adjustments.
At September 30, 2009, the cost of investments for federal tax purposes was $112,459,860. The net unrealized appreciation of investments for federal tax purposes was $3,572,180. This consists of net unrealized appreciation from investments for those securities having an excess of value over cost of $13,701,602 and net unrealized depreciation from investments for those securities having an excess of cost over value of $10,129,422.
Annual Shareholder Report25
At September 30, 2009, the Fund had a capital loss carryforward of $21,516,172 which will reduce the Fund's taxable income arising from future net realized gains on investments, if any, to the extent permitted by the Code and thus will reduce the amount of distributions to shareholders which would otherwise be necessary to relieve the Fund of any liability for federal income tax. Pursuant to the Code, such capital loss carryforward will expire as follows:| Expiration Year | Expiration Amount |
| 2016 | $4,168,204 |
| 2017 | $17,347,968 |
As a result of the tax-free transfer of assets from Touchstone Diversified Small Cap Value Fund, the use of certain capital loss carryforwards listed above may be limited.
The Fund used capital loss carryforwards of $192,309 to offset taxable capital gains realized during the year ended September 30, 2009.
Under current tax regulations, capital losses on securities transactions realized after October 31 may be deferred and treated as occurring on the first day of the following fiscal year. As of September 30, 2009, for federal income tax purposes, post October losses of $588,167 were deferred to October 1, 2009.
6. INVESTMENT ADVISER FEE AND OTHER TRANSACTIONS WITH AFFILIATES
Investment Adviser Fee
Federated Global Investment Management Corporation is the Fund's investment adviser (the “Adviser”). The advisory agreement between the Fund and the Adviser provides for an annual fee equal to 0.90% of the Fund's average daily net assets. Subject to the terms described in the Expense Limitation note, the Adviser may voluntarily choose to waive any portion of its fee and/or reimburse certain operating expenses of the Fund. The Adviser can modify or terminate this voluntary waiver and/or reimbursement at any time at its sole discretion. For the period from August 29, 2009 to September 30, 2009, the Adviser voluntarily waived $20,823 of its fee.
For the period from August 29, 2009 to September 30, 2009, the net fee paid to the Adviser was $66,963.
Prior to close of business on August 28, 2009, the Predecessor Fund's investment adviser was Touchstone Advisors, Inc. After the close of business on August 28, 2009, the Predecessor Fund was reorganized into the Fund. The annual rate did not change due to this reorganization. For the period from October 1, 2008 to August 28, 2009, the net fee paid to Touchstone Advisors, Inc. was $658,672.
Annual Shareholder Report26
Administrative FeeFederated Administrative Services (FAS), under the Administrative Services Agreement, provides the Fund with administrative personnel and services. The fee paid to FAS is based on the average aggregate daily net assets of certain Federated funds as specified below:
| Administrative Fee | Average Aggregate Daily Net Assets
of the Federated Funds |
| 0.150% | on the first $5 billion |
| 0.125% | on the next $5 billion |
| 0.100% | on the next $10 billion |
| 0.075% | on assets in excess of $20 billion |
The administrative fee received during any fiscal year shall be at least $150,000 per portfolio and $40,000 per each additional class of shares. Subject to the terms described in the Expense Limitation note, FAS may voluntarily choose to waive any portion of its fee. FAS can modify or terminate this voluntary waiver at any time at its sole discretion. For the period from August 29, 2009 to September 30, 2009, the net fee paid to FAS was $15,810 and represented 0.185% of average daily net assets of the Fund. FAS waived $3,724 of its fee. The Fund is currently being charged the minimum administrative fee; therefore the fee as a percentage of average daily net assets is greater than the amounts presented in the chart above.
Prior to close of business on August 28, 2009, Touchstone Advisors, Inc. provided administrative services to the Predecessor Fund. For the period from October 1, 2008 to August 28, 2009, the net fee paid to Touchstone Advisors, Inc. was $75,766. For the period from October 1, 2008 to August 28, 2009, Touchstone Advisors, Inc. waived $79,217 of its fee.
Distribution Services Fee
The Fund has adopted a Distribution Plan (the “Plan”) pursuant to Rule 12b-1 under the Act. Under the terms of the Plan, the Fund will compensate Federated Securities Corp. (FSC), the principal distributor, from the daily net assets of the Fund's Class A Shares and Class C Shares to finance activities intended to result in the sale of these shares. The Plan provides that the Fund may incur distribution expenses at the following percentages of average daily net assets annually, to compensate FSC:
| Share Class Name | Percentage of Average Daily
Net Assets of Class |
| Class A Shares | 0.05% |
| Class C Shares | 0.75% |
Subject to the terms described in the Expense Limitation note, FSC may voluntarily choose to waive any portion of its fee. FSC can modify or terminate this voluntary waiver at any time at its sole discretion. When FSC receives fees, it may pay some or all of them to financial intermediaries whose customers purchase shares. For the period from August 29, 2009 to September 30, 2009, FSC retained $3,193 of fees paid by the Fund. For the period from August 29, 2009 to September 30, 2009, the Fund's Class A Shares did not incur a distribution services fee; however, it may begin to incur this fee upon approval of the Trustees.
For the period from August 29, 2009 to September 30, 2009, the net fee paid to FSC was $3,193.
Annual Shareholder Report27
Prior to close of business on August 28, 2009, Touchstone Securities, Inc. was the principal distributor for the Predecessor Fund. For the period from October 1, 2008 to August 28, 2009, the net fee paid to Touchstone Securities, Inc. was $9,378.Sales Charges
Front-end sales charges and contingent deferred sales charges (CDSC) do not represent expenses of the Fund. They are deducted from the proceeds of sales of Fund Shares prior to investment or from redemption proceeds prior to remittance, as applicable. For the period from August 29, 2009 to September 30, 2009, FSC retained $767 in sales charges from the sale of Class A Shares.
Prior to close of business on August 28, 2009, Touchstone Securities, Inc., served as distributor of the Predecessor Fund's Shares. For the period from October 1, 2008 to August 28, 2009, Touchstone Securities, Inc. retained $13,472 in sales charges from the sale of the Predecessor Fund's Class A Shares. Touchstone Securities, Inc. also retained $330 of CDSC relating to redemptions of the Predecessor Fund's Class C Shares.
Shareholder Services Fee
The Fund may pay fees (Service Fees) up to 0.25% of the average daily net assets of the Fund's Class A Shares and Class C Shares to financial intermediaries or to Federated Shareholder Services Company (FSSC) for providing services to shareholders and maintaining shareholder accounts. Subject to the terms described in the Expense Limitation note, FSSC may voluntarily reimburse the Fund for shareholder services fees. This voluntary reimbursement can be modified or terminated at any time. For the period from August 29, 2009 to September 30, 2009, FSSC did not receive any fees paid by the Fund.
For the period from August 29, 2009 to September 30, 2009, the net fee paid to financial intermediaries was $22,660.
Prior to close of business on August 28, 2009, Touchstone Securities, Inc. received Service Fees from the Predecessor Fund. For the period from October 1, 2008 to August 28, 2009, the net fee paid to Touchstone Securities, Inc. was $161,188.
Expense Limitation
The Adviser and its affiliates (which may include FSC, FAS and FSSC) have voluntarily agreed to waive their fees and/or reimburse expenses so that the total operating expenses (as shown in the financial highlights) paid by the Fund's Class A Shares, Class C Shares and Institutional Shares (after the voluntary waivers and reimbursements) will not exceed 1.31%, 2.06% and 1.06%, respectively, through the later of (the “Termination Date”): (a) November 30, 2010 or (b) the date of the Fund's next effective prospectus. While the Adviser and its affiliates currently do not anticipate terminating these arrangements prior to the Termination Date, these arrangements may only be terminated prior to the Termination Date with the agreement of the Fund's Board of Trustees.
General
Certain Officers and Trustees of the Fund are Officers and Directors or Trustees of the above companies.
Annual Shareholder Report28
Transactions with Affiliated CompaniesAffiliated holdings are mutual funds which are managed by the Adviser or an affiliate of the Adviser. The Adviser has agreed to reimburse the Fund for certain investment adviser fees as a result of transactions in other affiliated mutual funds. For the period from August 29, 2009 to September 30, 2009, the Adviser reimbursed $243. Transactions with affiliated companies during the year ended September 30, 2009, were as follows:
| Affiliate | Balance of
Shares Held
9/30/2008 | Purchases/
Additions | Sales/
Reductions | Balance of
Shares Held
9/30/2009 | Value | Dividend
Income |
| Prime Value Obligations Fund, Institutional Shares | — | 18,022,451 | 14,386,139 | 3,636,312 | $3,636,312 | $2,021 |
In addition, prior to the close of business on August 28, 2009, the Predecessor Fund invested in an affiliated mutual fund. For the period from October 1, 2008 to August 28, 2009, transactions with the affiliated company were as follows:
| Affiliate | Balance of
Shares Held
9/30/2008 | Purchases/
Additions | Sales/
Reductions | Balance of
Shares Held
9/30/2009 | Value | Dividend
Income |
| Touchstone Institutional Money Market Fund | 3,533,567 | 34,543,409 | 38,076,976 | — | $ — | $28,705 |
7. Investment TRANSACTIONS
Purchases and sales of investments, excluding long-term U.S. government securities and short-term obligations, for the year ended September 30, 2009, were as follows:
| Purchases | $67,117,759 |
| Sales | $68,712,697 |
8. LINE OF CREDIT
The Fund participates in a $100,000,000 unsecured, uncommitted revolving line of credit (LOC) agreement with PNC Bank. The LOC was made available for extraordinary or emergency purposes, primarily for financing redemption payments. Borrowings are charged interest at a rate offered to the Fund by PNC Bank at the time of the borrowing. As of September 30, 2009, there were no outstanding loans. During the period from August 29, 2009 to September 30, 2009, the Fund did not utilize the LOC.
9. INTERFUND LENDING
Pursuant to an Exemptive Order issued by the Securities and Exchange Commission (SEC), the Fund, along with other funds advised by subsidiaries of Federated Investors, Inc., may participate in an interfund lending program. This program provides an alternative credit facility allowing the funds to borrow from other participating affiliated funds. As of September 30, 2009, there were no outstanding loans. During the period from August 29, 2009 to September 30, 2009, the Fund did not utilize the LOC.
Annual Shareholder Report29
10. Legal ProceedingsSince October 2003, Federated Investors, Inc. and related entities (collectively, “Federated”) and various Federated funds (Federated Funds) have been named as defendants in several class action lawsuits now pending in the United States District Court for the District of Maryland. The lawsuits were purportedly filed on behalf of people who purchased, owned and/or redeemed shares of Federated-sponsored mutual funds during specified periods beginning November 1, 1998. The suits are generally similar in alleging that Federated engaged in illegal and improper trading practices including market timing and late trading in concert with certain institutional traders, which allegedly caused financial injury to the mutual fund shareholders. These lawsuits began to be filed shortly after Federated's first public announcement that it had received requests for information on shareholder trading activities in the Federated Funds from the SEC, the Office of the New York State Attorney General (NYAG), and other authorities. In that regard, on November 28, 2005, Federated announced that it had reached final settlements with the SEC and the NYAG with respect to those matters. As Federated previously reported in 2004, it has already paid approximately $8.0 million to certain funds as determined by an independent consultant. As part of these settlements, Federated agreed to pay for the benefit of Fund shareholders additional disgorgement and a civil money penalty in the aggregate amount of an additional $72 million. Federated entities have also been named as defendants in several additional lawsuits that are now pending in the United States District Court for the Western District of Pennsylvania, alleging, among other things, excessive advisory and Rule 12b-1 fees. The Board of the Federated Funds retained the law firm of Dickstein Shapiro LLP to represent the Federated Funds in these lawsuits. Federated and the Federated Funds, and their respective counsel have been defending this litigation, and none of the Federated Funds remains a defendant in any of the lawsuits (though some could potentially receive any recoveries as nominal defendants). Additional lawsuits based upon similar allegations may be filed in the future. The potential impact of these lawsuits, all of which seek unquantified damages, attorneys' fees and expenses, and future potential similar suits is uncertain. Although we do not believe that these lawsuits will have a material adverse effect on the Federated Funds, there can be no assurance that these suits, the ongoing adverse publicity and/or other developments resulting from the regulatory investigations will not result in increased Federated Fund redemptions, reduced sales of Federated Fund shares, or other adverse consequences for the Federated Funds.
11. Subsequent events
Management has evaluated subsequent events through November 24, 2009, the date the financial statements were issued, and determined that no events have occurred that require additional disclosure.
Annual Shareholder Report30
Report of Independent Registered Public Accounting Firm
TO THE BOARD OF TRUSTEES OF THE FEDERATED EQUITY FUNDS AND SHAREHOLDERS OF Federated Clover small Value Fund:
We have audited the accompanying statement of assets and liabilities, including the portfolio of investments, of the Federated Clover Small Value Fund (the “Fund”), a portfolio of Federated Equity Funds, as of September 30, 2009, and the related statement of operations, changes in net assets and the financial highlights for the year then ended. These financial statements and financial highlights are the responsibility of the Fund's management. Our responsibility is to express an opinion on these financial statements and financial highlights based on our audit. The statement of changes in net assets and the financial highlights for the periods presented prior to October 1, 2008, were audited by other independent registered public accountants whose report thereon dated November 25, 2008, expressed an unqualified opinion on those statements.
We conducted our audit in accordance with the standards of the Public Company Accounting Oversight Board (United States). Those standards require that we plan and perform the audit to obtain reasonable assurance about whether the financial statements and financial highlights are free of material misstatement. An audit includes examining, on a test basis, evidence supporting the amounts and disclosures in the financial statements. Our procedures included confirmation of securities owned as of September 30, 2009, by correspondence with the custodian and brokers or by other appropriate auditing procedures. An audit also includes assessing the accounting principles used and significant estimates made by management, as well as evaluating the overall financial statement presentation. We believe that our audit provides a reasonable basis for our opinion.
In our opinion, the financial statements and financial highlights referred to above present fairly, in all material respects, the financial position of the Federated Clover Small Value Fund as of September 30, 2009, and the results of its operations, the changes in its net assets and the financial highlights for the year then ended, in conformity with U.S. generally accepted accounting principles.
Boston, Massachusetts
November 24, 2009
Annual Shareholder Report31
Board of Trustees and Trust Officers
The Board is responsible for managing the Trust's business affairs and for exercising all the Trust's powers except those reserved for the shareholders. The following tables give information about each Board member and the senior officers of the Fund. Where required, the tables separately list Board members who are “interested persons” of the Fund (i.e., “Interested” Board members) and those who are not (i.e., “Independent” Board members). Unless otherwise noted, the address of each person listed is Federated Investors Tower, 1001 Liberty Avenue, Pittsburgh, PA 15222. The address of all Independent Board members listed is 4000 Ericsson Drive, Warrendale, PA 15086-7561; Attention: Mutual Fund Board. As of December 31, 2008, the Trust comprised ten portfolios, and the Federated Fund Complex consisted of 40 investment companies (comprising 149 portfolios). Unless otherwise noted, each Officer is elected annually. Unless otherwise noted, each Board member oversees all portfolios in the Federated Fund Complex and serves for an indefinite term. The Fund's Statement of Additional Information includes additional information about Trust Trustees and is available, without charge and upon request, by calling 1-800-341-7400.
Interested TRUSTEES Background
Name
Birth Date
Positions Held with Trust
Date Service Began | Principal Occupation(s) for Past Five Years,
Other Directorships Held and Previous Position(s) |
John F. Donahue*
Birth Date: July 28, 1924
TRUSTEE
Began serving: April 1984 | Principal Occupations: Director or Trustee of the Federated Fund Complex; Chairman and Director, Federated Investors, Inc.; Chairman of the Federated Fund Complex's Executive Committee.
Previous Positions: Chairman of the Federated Fund Complex; Trustee, Federated Investment Management Company; Chairman and Director, Federated Investment Counseling. |
J. Christopher Donahue*
Birth Date: April 11, 1949
PRESIDENT AND TRUSTEE
Began serving: January 2000 | Principal Occupations: Principal Executive Officer and President of the Federated Fund Complex; Director or Trustee of some of the Funds in the Federated Fund Complex; President, Chief Executive Officer and Director, Federated Investors, Inc.; Chairman and Trustee, Federated Investment Management Company; Trustee, Federated Investment Counseling; Chairman and Director, Federated Global Investment Management Corp.; Chairman, Federated Equity Management Company of Pennsylvania and Passport Research, Ltd. (investment advisory subsidiary of Federated); Trustee, Federated Shareholder Services Company; Director, Federated Services Company.
Previous Positions: President, Federated Investment Counseling; President and Chief Executive Officer, Federated Investment Management Company, Federated Global Investment Management Corp. and Passport Research, Ltd. |
| * | Family relationships and reasons for “interested” status: John F. Donahue is the father of J. Christopher Donahue; both are “interested” due to their beneficial ownership of shares of Federated Investors, Inc. and the positions they hold with Federated and its subsidiaries. |
Annual Shareholder Report32
INDEPENDENT TRUSTEES Background
Name
Birth Date
Positions Held with Trust
Date Service Began | Principal Occupation(s) for Past Five Years,
Other Directorships Held and Previous Position(s) |
John T. Conroy, Jr., Ph.D.
Birth Date: June 23, 1937
TRUSTEE
Began serving: November 1991 | Principal Occupations: Director or Trustee of the Federated Fund Complex; Chairman of the Board, Investment Properties Corporation; Partner or Trustee in private real estate ventures in Southwest Florida; Assistant Professor in Theology at Barry University and Blessed Edmund Rice School for Pastoral Ministry.
Previous Positions: President, Investment Properties Corporation; Senior Vice President, John R. Wood and Associates, Inc., Realtors; President, Naples Property Management, Inc. and Northgate Village Development Corporation. |
Nicholas P. Constantakis
Birth Date: September 3, 1939
TRUSTEE
Began serving: February 1998 | Principal Occupation: Director or Trustee of the Federated Fund Complex.
Other Directorships Held: Director and Chairman of the Audit Committee, Michael Baker Corporation (architecture, engineering and construction services).
Previous Position: Partner, Andersen Worldwide SC. |
John F. Cunningham
Birth Date: March 5, 1943
TRUSTEE
Began serving: January 1999 | Principal Occupation: Director or Trustee of the Federated Fund Complex.
Other Directorships Held: Chairman, President and Chief Executive Officer, Cunningham & Co., Inc. (strategic business consulting); Trustee Associate, Boston College.
Previous Positions: Director, Redgate Communications and EMC Corporation (computer storage systems); Chairman of the Board and Chief Executive Officer, Computer Consoles, Inc.; President and Chief Operating Officer, Wang Laboratories; Director, First National Bank of Boston; Director, Apollo Computer, Inc. |
Maureen Lally-Green
Birth Date: July 5, 1949
TRUSTEE
Began serving: August 2009 | Principal Occupations: Director or Trustee of the Federated Fund Complex; Director, Office of Church Relations, Diocese of Pittsburgh; Adjunct Professor of Law, Duquesne University School of Law.
Other Directorships Held: Director, Auberle; Trustee St. Francis University; Director, Ireland Institute of Pittsburgh; Director, UPMC Mercy Hospital; Regent, St. Vincent Seminary; Director, Epilepsy Foundation of Western and Central Pennsylvania; Director, Saint Thomas More Society, Allegheny County; Director, Carlow University.
Previous Position: Pennsylvania Superior Court Judge. |
Annual Shareholder Report33
Name
Birth Date
Positions Held with Trust
Date Service Began | Principal Occupation(s) for Past Five Years,
Other Directorships Held and Previous Position(s) |
Peter E. Madden
Birth Date: March 16, 1942
TRUSTEE
Began serving: November 1991 | Principal Occupation: Director or Trustee and Chairman of the Board of the Federated Fund Complex.
Other Directorship Held: Board of Overseers, Babson College.
Previous Positions: Representative, Commonwealth of Massachusetts General Court; President, Chief Operating Officer and Director, State Street Bank and Trust Company and State Street Corporation (retired); Director, VISA USA and VISA International; Chairman and Director, Massachusetts Bankers Association; Director, Depository Trust Corporation; Director, The Boston Stock Exchange. |
Charles F. Mansfield, Jr.
Birth Date: April 10, 1945
TRUSTEE
Began serving: January 1999 | Principal Occupations: Director or Trustee and Chairman of the Audit Committee of the Federated Fund Complex; Management Consultant.
Previous Positions: Chief Executive Officer, PBTC International Bank; Partner, Arthur Young & Company (now Ernst & Young LLP); Chief Financial Officer of Retail Banking Sector, Chase Manhattan Bank; Senior Vice President, HSBC Bank USA (formerly, Marine Midland Bank); Vice President, Citibank; Assistant Professor of Banking and Finance, Frank G. Zarb School of Business, Hofstra University; Executive Vice President DVC Group, Inc. (marketing, communications and technology). |
R. James Nicholson
Birth Date: February 4, 1938
TRUSTEE
Began serving: January 2008 | Principal Occupations: Director or Trustee of the Federated Fund Complex; Senior Counsel, Brownstein Hyatt Farber Schrek, P.C.; Former Secretary of the U.S. Dept. of Veterans Affairs; Former U.S. Ambassador to the Holy See; Former Chairman of the Republican National Committee.
Other Directorships Held: Director, Horatio Alger Association; Director, The Daniels Fund.
Previous Positions: Colonel, U.S. Army Reserve; Partner, Calkins, Kramer, Grimshaw and Harring, P.C.; General Counsel, Colorado Association of Housing and Building; Chairman and CEO, Nicholson Enterprises, Inc. (real estate holding company); Chairman and CEO, Renaissance Homes of Colorado. |
Thomas M. O'Neill
Birth Date: June 14, 1951
TRUSTEE
Began serving: October 2006 | Principal Occupations: Director or Trustee of the Federated Fund Complex; Managing Director and Partner, Navigator Management Company, L.P. (investment and strategic consulting).
Other Directorships Held: Board of Overseers, Children's Hospital of Boston; Visiting Committee on Athletics, Harvard College.
Previous Positions: Chief Executive Officer and President, Managing Director and Chief Investment Officer, Fleet Investment Advisors; President and Chief Executive Officer, Aeltus Investment Management, Inc.; General Partner, Hellman, Jordan Management Co., Boston, MA; Chief Investment Officer, The Putnam Companies, Boston, MA; Credit Analyst and Lending Officer, Fleet Bank; Director and Consultant, EZE Castle Software (investment order management software); Director, Midway Pacific (lumber). |
Annual Shareholder Report34
Name
Birth Date
Positions Held with Trust
Date Service Began | Principal Occupation(s) for Past Five Years,
Other Directorships Held and Previous Position(s) |
John S. Walsh
Birth Date: November 28, 1957
TRUSTEE
Began serving: January 1999 | Principal Occupations: Director or Trustee of the Federated Fund Complex; President and Director, Heat Wagon, Inc. (manufacturer of construction temporary heaters); President and Director, Manufacturers Products, Inc. (distributor of portable construction heaters); President, Portable Heater Parts, a division of Manufacturers Products, Inc.
Previous Position: Vice President, Walsh & Kelly, Inc. |
James F. Will
Birth Date: October 12, 1938
TRUSTEE
Began serving: April 2006 | Principal Occupations: Director or Trustee of the Federated Fund Complex; formerly, Vice Chancellor and President, Saint Vincent College.
Other Directorships Held: Trustee, Saint Vincent College; Alleghany Corporation.
Previous Positions: Chairman, President and Chief Executive Officer, Armco, Inc.; President and Chief Executive Officer, Cyclops Industries; President and Chief Operating Officer, Kaiser Steel Corporation. |
OFFICERS
Name
Birth Date
Address
Positions Held with Trust
Date Service Began | Principal Occupation(s) for Past Five Years
and Previous Position(s) |
John W. McGonigle
Birth Date: October 26, 1938
EXECUTIVE VICE PRESIDENT AND SECRETARY
Began serving: April 1984 | Principal Occupations: Executive Vice President and Secretary of the Federated Fund Complex; Vice Chairman, Executive Vice President, Secretary and Director, Federated Investors, Inc.
Previous Positions: Trustee, Federated Investment Management Company and Federated Investment Counseling; Director, Federated Global Investment Management Corp., Federated Services Company and Federated Securities Corp. |
Richard A. Novak
Birth Date: December 25, 1963
TREASURER
Began serving: January 2006 | Principal Occupations: Principal Financial Officer and Treasurer of the Federated Fund Complex; Senior Vice President, Federated Administrative Services; Financial and Operations Principal for Federated Securities Corp., Edgewood Services, Inc. and Southpointe Distribution Services, Inc.
Previous Positions: Controller of Federated Investors, Inc.; Vice President, Finance of Federated Services Company; held various financial management positions within The Mercy Hospital of Pittsburgh; Auditor, Arthur Andersen & Co. |
Brian P. Bouda
Birth Date: February 28, 1947
CHIEF COMPLIANCE OFFICER AND SENIOR VICE PRESIDENT
Began serving: August 2004 | Principal Occupations: Senior Vice President and Chief Compliance Officer of the Federated Fund Complex; Vice President and Chief Compliance Officer of Federated Investors, Inc. and Chief Compliance Officer of its subsidiaries. Mr. Bouda joined Federated in 1999 and is a member of the American Bar Association and the State Bar Association of Wisconsin. |
Annual Shareholder Report35
Name
Birth Date
Address
Positions Held with Trust
Date Service Began | Principal Occupation(s) for Past Five Years
and Previous Position(s) |
Stephen F. Auth
Birth Date: September 3, 1956
450 Lexington Avenue
Suite 3700
New York, NY 10017-3943
CHIEF INVESTMENT OFFICER
Began serving: November 2002 | Principal Occupations: Mr. Auth is Chief Investment Officer of this Fund and various other Funds in the Federated Fund Complex; Executive Vice President, Federated Investment Counseling, Federated Global Investment Management Corp. and Federated Equity Management Company of Pennsylvania.
Previous Positions: Executive Vice President, Federated Investment Management Company, and Passport Research, Ltd. (investment advisory subsidiary of Federated); Senior Vice President, Global Portfolio Management Services Division; Senior Vice President, Federated Investment Management Company and Passport Research, Ltd.; Senior Managing Director and Portfolio Manager, Prudential Investments. |
Lawrence Auriana
Birth Date: January 8, 1944
140 East 45th Street
New York, NY 10017
VICE PRESIDENT
Began serving: November 2001 | Principal Occupations: Lawrence Auriana is Vice President of the Trust. Mr. Auriana joined Federated in April 2001 as Co-Head of Investments/Federated Kaufmann. From August 1984 to April 2001, Mr. Auriana was President and Treasurer of Edgemont Asset Management Corp., and Chairman of the Board and Portfolio Manager to The Kaufmann Fund, Inc. (predecessor to the Federated Kaufmann Fund). Mr. Auriana earned a B.S. in economics from Fordham University and has been engaged in the securities business since 1965. |
Walter C. Bean
Birth Date: June 22, 1945
VICE PRESIDENT
Began serving: November 2006 | Principal Occupations: Walter C. Bean is Vice President of the Trust. Mr. Bean is a Senior Vice President, Senior Portfolio Manager and Director of Investments for Managed Accounts. Mr. Bean joined Federated in 2000. Mr. Bean is responsible for the investment process for the managed accounts portfolios. His previous associations included: Chief Investment Officer and Portfolio Manager at C.S. McKee & Company; various investment management and research positions with First Chicago Investment Advisors, CIGNA Investment Advisors and Mellon Bank. Mr. Bean is a Chartered Financial Analyst. Mr. Bean earned a Bachelors Degree in Business Administration from Ohio University and an M.B.A. from Pennsylvania State University. Mr. Bean has 36 years of investment experience. |
Richard B. Fisher
Birth Date: May 17, 1923
VICE PRESIDENT
Began serving: APRIL 1984 | Principal Occupations: Vice Chairman or Vice President of some of the Funds in the Federated Fund Complex; Vice Chairman, Federated Investors, Inc.; Chairman, Federated Securities Corp.
Previous Positions: President and Director or Trustee of some of the Funds in the Federated Fund Complex; Executive Vice President, Federated Investors, Inc.; Director and Chief Executive Officer, Federated Securities Corp. |
Hans P. Utsch
Birth Date: July 3, 1936
140 East 45th Street
New York, NY 10017
VICE PRESIDENT
Began serving: November 2001 | Principal Occupations: Hans P. Utsch is Vice President of the Trust. Mr. Utsch joined Federated in April 2001 as Co-Head of Investments/Federated Kaufmann. From August 1984 to April 2001, Mr. Utsch was Chairman of the Board and Secretary of Edgemont Asset Management Corp., and President and Portfolio Manager to The Kaufmann Fund, Inc. (predecessor to the Federated Kaufmann Fund). Mr. Utsch graduated from Amherst College and holds an M.B.A. from Columbia University. He has been engaged in the securities business since 1962. |
Annual Shareholder Report36
Evaluation and Approval of Advisory
Contract - May 2009
Federated Clover Small Value Fund (the “Fund”)
The Fund's Board reviewed the Fund's investment advisory contract at meetings held in May 2009. Because the Fund did not yet have a meaningful operating history, the Board's decision to approve the contract reflects the exercise of its business judgment on whether to authorize the continued offering of this new investment vehicle, as originally proposed by, and based on information previously requested by the Board and provided by the Federated organization, and based on Federated's recommendation to go forward with the Fund.
Federated proposed the creation of the Fund in connection with its acquisition of certain assets of Clover Capital Management, Inc. (“Clover Capital”), the investment adviser to the Clover Capital Enhanced Small Cap Value Equity Common Fund (the “Clover Small Cap”), a privately offered pooled fund (the “Acquisition”). As part of the transaction, Federated proposed that the Clover Small Cap be reorganized with and into the Fund in a tax-free asset transfer which would provide shareholders of the Clover Small Cap the opportunity to become shareholders of a registered mutual fund with similar investment objectives and policies and the same key management personnel as the Clover Small Cap, but with sales, distribution and other fund and shareholder services provided by the same affiliates of Federated that provide such services to the other Federated funds. The Fund was declared effective on January 21, 2009, and the reorganization of the Clover Small Cap with and into the Fund was consummated after the close of business on March 13, 2009. The Fund commenced operations on March 16, 2009. Accordingly, the Board's deliberations at its May 2009 meetings were based to a significant degree on the information considered by the Board when it originally approved the contract at its November 2008 meetings.
The Federated funds' Board had previously appointed a Senior Officer, whose duties include specified responsibilities relating to the process by which advisory fees are to be charged to a Federated Fund. The Senior Officer has the authority to retain consultants, experts, or staff as may be reasonably necessary to assist in the performance of his duties, reports directly to the Board, and may be terminated only with the approval of a majority of the independent members of the Board. The Senior Officer prepared and furnished to the Board an independent, written evaluation that covered topics discussed below. The Board considered that evaluation, along with other information, in deciding to approve the proposed advisory contract.
The Board also considered the anticipated compensation and benefits to be received by the Adviser. This includes fees to be received for services provided to the Fund by other entities in the Federated organization and research services that may be received by the Adviser from brokers that execute fund trades, as well as advisory fees. The Board is also familiar with and considered judicial Annual Shareholder Report37
decisions concerning allegedly excessive investment advisory fees, which have indicated that the following factors may be relevant to an Adviser's fiduciary duty with respect to its receipt of compensation from a fund: the nature and quality of the services provided by the Adviser, including the performance of the Fund; the Adviser's cost of providing the services; the extent to which the Adviser may realize “economies of scale” as the Fund grows larger; any indirect benefits that may accrue to the Adviser and its affiliates as a result of the Adviser's relationship with the Fund; performance and expenses of comparable funds; and the extent to which the independent Board members are fully informed about all facts the Board deems relevant bearing on the Adviser's services and fees. The Board further considered management fees (including any components thereof) charged to institutional and other clients of the Adviser for what might be viewed as like services, and the cost to the Adviser and its affiliates of supplying services pursuant to the management fee agreements, excluding any intra-corporate profit and profit margins of the Adviser and its affiliates for supplying such services. The Board was aware of these factors and was guided by them in its review of the Fund's advisory contract to the extent it considered them to be appropriate and relevant, as discussed further below. The Board considered and weighed these circumstances in light of its substantial accumulated experience in working with Federated on matters relating to other Federated funds, and was assisted in its deliberations by independent legal counsel. The Board's consideration of the proposed advisory contract included review of the Senior Officer's evaluation, accompanying data and additional reports covering such matters as: the Adviser's investment philosophy, revenue, profitability, personnel and processes; investment and operating strategies; the Fund's investment objectives; the Fund's anticipated expenses (including the proposed advisory fee itself and the overall estimated expense structure of the Fund, both in absolute terms and relative to similar and/or competing funds, with due regard for contractual or voluntary expense limitations); and the nature, quality and extent of the advisory and other services to be provided to the Fund by the Adviser and its affiliates. The Board also considered the likely preferences and expectations of anticipated Fund shareholders and their relative sophistication; the continuing state of competition in the mutual fund industry and market practices; the range of comparable fees for similar funds in the mutual fund industry; the Fund's relationship to the Federated family of funds which include a comprehensive array of funds with different investment objectives, policies and strategies which are available for exchange without the incurrence of additional sales charges; compliance and audit reports concerning the Federated funds and the Federated companies that service them (including communications from regulatory agencies), as well as Federated's responses to any issues raised therein; and relevant developments in the mutual fund industry and how the Federated funds Annual Shareholder Report38
and/or Federated are responding to them. The Board's evaluation process is evolutionary. The criteria considered and the emphasis placed on relevant criteria change in recognition of changing circumstances in the mutual fund marketplace.With respect to the Fund's expenses in particular, the Board has found the use of comparisons to other mutual funds with comparable investment programs to be particularly useful, given the high degree of competition in the mutual fund business. The Board focused on comparisons with other similar mutual funds more heavily than non-mutual fund products or services because it is believed that they are more relevant. For example, other mutual funds are the products most like the Fund, they are readily available to Fund shareholders as alternative investment vehicles, and they are the type of investment vehicle in fact chosen and maintained by the Fund's anticipated investors. The range of their fees and expenses therefore appears to be a generally reliable indication of what consumers have found to be reasonable in the precise marketplace in which the Fund will compete. In this regard, the Senior Officer also reviewed Federated's fees for providing advisory services to products outside the Federated family of funds (e.g., institutional and separate accounts). He concluded that mutual funds and institutional accounts are inherently different products. Those differences included, but are not limited to, different types of targeted investors; being subject to different laws and regulations; different legal structures; different average account sizes; different associated costs; different portfolio management techniques made necessary by different cash flows; and portfolio manager time spent in review of securities pricing. The Senior Officer did not consider these fee schedules to be determinative in judging the appropriateness of mutual fund advisory contracts.
The Senior Officer reviewed information compiled by Federated, using data supplied by independent fund ranking organizations, regarding the fees charged by other mutual funds, noting his view that comparisons to fund peer groups are highly important in judging the reasonableness of proposed fees.
The Senior Officer's report produced in connection with the original approval of the advisory contract for the Fund in November 2008, noted that Clover Capital, as manager of the Clover Small Cap, subadviser to a mutual fund and adviser to a group trust and separate managed accounts, generated consistent and strong performance using substantially the same investment strategy to be utilized by the Fund. Because the Fund will employ the same key management personnel and a similar investment strategy as the Clover Small Cap, the nature and quality of the management of the Fund is expected to reflect that of the Clover Small Cap. This in turn assisted the Board in reaching a conclusion that the nature, extent and quality of the Adviser's investment management services were such as to warrant the approval of the advisory contract.
Annual Shareholder Report39
The Board reviewed the proposed fees and other expenses of the Fund and was satisfied that the proposed overall expense structure of the Fund appeared to be appropriate. In this regard, the Senior Officer's report indicated that the proposed management fees, after projected waivers, were reasonable. The Board also concluded that the nature, quality and scope of other services to be provided to the Fund were reasonable.The Board also considered possible indirect benefits that may accrue to the Adviser and its affiliates as a result of the Acquisition. Other indirect benefits that may accrue to the Adviser and its affiliates as a result of the Adviser's relationship with the Fund are essentially impossible to apply before the Fund has experienced any meaningful operating history. Nevertheless, in connection with the Board's governance of other Federated funds, it should be noted that the Board regularly receives financial information about Federated, including reports on the compensation and benefits Federated derives from its relationships with the other Federated funds. These reports cover not only the fees under the advisory contracts, but also fees received by Federated's subsidiaries for providing other services to the Federated funds under separate contracts (e.g., for serving as the Federated funds' administrator). The reports also discuss any indirect benefit Federated may derive from its receipt of research services from brokers who execute Federated fund trades. In addition, the Board considered the fact that, in order for a fund to be competitive in the marketplace, Federated and its affiliates frequently waive fees and/or reimburse expenses and have disclosed to fund investors and/or indicated to the Board their intention to do so in the future, where appropriate.
The Senior Officer commented on reports furnished by Federated of estimates of components of the Fund's expenses using allocation methodologies specified by the Senior Officer and sales projections made by Federated. The Senior Officer noted that, although they may apply consistent allocation processes, the inherent difficulties in allocating costs (and the unavoidable arbitrary aspects of that exercise), particularly when projecting an uncertain asset base, and the lack of consensus on how to allocate those costs may render such allocation reports unreliable. The Senior Officer determined that such allocation reports were of limited use.
The Board and the Senior Officer also reviewed data compiled by Federated comparing profitability information for Federated to other publicly held fund management companies. In this regard, the Senior Officer noted the limited availability of such information, but nonetheless concluded that Federated's profit margins did not appear to be excessive and the Board agreed.
The Senior Officer's evaluation also discussed the notion of possible realization of “economies of scale” as a fund grows larger. The Board considered in this regard that the Adviser has made significant and long-term investments in areas that support all of the Federated funds, such as personnel and processes for the portfolio management, compliance, and risk management functions; and systems technology; and that the benefits of these efforts (as well as any Annual Shareholder Report40
economies, should they exist) were likely to be enjoyed by the fund complex as a whole. Finally, the Board also noted the absence of any applicable regulatory or industry guidelines on this subject, which (as discussed in the Senior Officer's evaluation) is compounded by the lack of any common industry practice or general pattern with respect to structuring fund advisory fees with “breakpoints” that serve to reduce the fee as the fund attains a certain size. The Senior Officer did not recommend institution of breakpoints in pricing Federated's proposed advisory services to the Fund at this time.The Board based its decision to approve the proposed advisory contract on the totality of the circumstances and relevant factors, and with a view to past and future long-term considerations. As noted, not all of the factors and considerations identified above were necessarily relevant to the Fund, nor did the Board consider any one of them to be determinative. With respect to the factors that are relevant, the Board's decision to approve the contract reflects its determination that, based upon the information previously requested and supplied, Federated's proposal to establish and manage the Fund, and its past performance and actions in providing services to other mutual funds (which the Board has found to be satisfactory with respect to such other funds), provide a satisfactory basis to support the business decision to continue the existing arrangements.
Annual Shareholder Report41
Voting Proxies on Fund Portfolio SecuritiesA description of the policies and procedures that the Fund uses to determine how to vote proxies, if any, relating to securities held in the Fund's portfolio is available, without charge and upon request, by calling 1-800-341-7400. A report on “Form N-PX” of how the Fund voted any such proxies during the most recent 12-month period ended June 30 is available from Federated's Web site at FederatedInvestors.com. To access this information from the “Products” section of the Web site, click on the “Prospectuses and Regulatory Reports” link under “Related Information,” then select the appropriate link opposite the name of the Fund; or select the name of the Fund and from the Fund's page, click on the “Prospectuses and Regulatory Reports” link. Form N-PX filings are also available at the SEC's Web site at www.sec.gov.
Quarterly Portfolio Schedule
The Fund files with the SEC a complete schedule of its portfolio holdings, as of the close of the first and third quarters of its fiscal year, on “Form N-Q.” These filings are available on the SEC's Web site at www.sec.gov and may be reviewed and copied at the SEC's Public Reference Room in Washington, DC. (Call 1-800-SEC-0330 for information on the operation of the Public Reference Room.) You may also access this information from the “Products” section of Federated's Web site at FederatedInvestors.com by clicking on “Portfolio Holdings” under “Related Information,” then selecting the appropriate link opposite the name of the Fund; or select the name of the Fund and from the Fund's page, click on the “Portfolio Holdings” link.
Annual Shareholder Report42
Mutual funds are not bank deposits or obligations, are not guaranteed by any bank and are not insured or guaranteed by the U.S. government, the Federal Deposit Insurance Corporation, the Federal Reserve Board or any other government agency. Investment in mutual funds involves investment risk, including the possible loss of principal.
This Report is authorized for distribution to prospective investors only when preceded or accompanied by the Fund's Prospectus, which contains facts concerning its objective and policies, management fees, expenses and other information.
Federated Clover Small Value Fund
Federated Investors Funds
4000 Ericsson Drive
Warrendale, PA 15086-7561
Contact us at FederatedInvestors.com
or call 1-800-341-7400.
Federated Securities Corp., Distributor
Cusip 314172263
41199 (11/09)
Federated is a registered mark of Federated Investors, Inc.
2009 Federated Investors, Inc.
Federated Clover Value Fund(Successor to the Touchstone Value Opportunities Fund Established 1991)
A Portfolio of Federated Equity Funds
ANNUAL SHAREHOLDER REPORTSeptember 30, 2009
Class A Shares
Class B Shares
Class C Shares
Class K Shares
FINANCIAL HIGHLIGHTS
SHAREHOLDER EXPENSE EXAMPLE
MANAGEMENT'S DISCUSSION OF FUND PERFORMANCE
PORTFOLIO OF INVESTMENTS SUMMARY TABLE
PORTFOLIO OF INVESTMENTS
STATEMENT OF ASSETS AND LIABILITIES
STATEMENT OF OPERATIONS
STATEMENT OF CHANGES IN NET ASSETS
NOTES TO FINANCIAL STATEMENTS
REPORT OF INDEPENDENT REGISTERED PUBLIC ACCOUNTING FIRM
BOARD OF TRUSTEES AND TRUST OFFICERS
EVALUATION AND APPROVAL OF ADVISORY CONTRACT
VOTING PROXIES ON FUND PORTFOLIO SECURITIES
QUARTERLY PORTFOLIO SCHEDULE
Not FDIC Insured * May Lose Value * No Bank Guarantee
Financial Highlights - Class A Shares
(For a Share Outstanding Throughout Each Period)
| Year Ended September 30 | 20091,2 | 20081,3 | 20071,3,4 |
| Net Asset Value, Beginning of Period | $14.10 | $18.70 | $20.44 |
| Income From Investment Operations: | | | |
| Net investment income | 0.185 | 0.19 | 0.10 |
| Net realized and unrealized gain (loss) on investments | (1.48) | (3.11) | 2.04 |
| TOTAL FROM INVESTMENT OPERATIONS | (1.30) | (2.92) | 2.14 |
| Less Distributions: | | | |
| Distributions from net investment income | (0.19) | (0.18) | (0.13) |
| Distributions from net realized gain on investments | — | (1.50) | (3.75) |
| TOTAL DISTRIBUTIONS | (0.19) | (1.68) | (3.88) |
| Net Asset Value, End of Period | $12.61 | $14.10 | $18.70 |
| Total Return6 | (9.03)% | (17.01)% | 11.90% |
| Ratios to Average Net Assets: | | | |
| Net expenses | 1.19%7 | 1.20% | 1.31%8 |
| Net investment income | 1.70% | 1.25% | 0.77%8 |
| Expense waiver/reimbursement9 | 0.19% | 0.48% | 0.00%8,10 |
| Supplemental Data: | | | |
| Net assets, end of period (000 omitted) | $707,394 | $8,231 | $472 |
| Portfolio turnover | 73% | 96% | 62% |
| 1 | Touchstone Value Opportunities Fund (the “Predecessor Fund”) was reorganized into Federated Clover Value Fund (the “Fund”) as of the close of business on August 28, 2009. The Fund is the successor to the Predecessor Fund. The performance information and financial information presented incorporates the operations of the Predecessor Fund, which, as a result of the reorganization, are the Fund's operations. See Note 2 to the Financial Statements. |
| 2 | Beginning with the year ended September 30, 2009, the Fund was audited by KPMG LLP. The previous years were audited by another independent registered public accounting firm. |
| 3 | Due to the reorganization: (1) the number of outstanding shares of the Predecessor Fund decreased by a factor of 1.05; and (2) since the Predecessor Fund's total number of shares outstanding decreased, the net asset value increased. The reorganization did not affect the value of the Predecessor Fund's net assets or each shareholder's proportional ownership interest in those assets. Per share data has been restated, where applicable. |
| 4 | Reflects operations for the period from November 20, 2006 (commencement of operations) to September 30, 2007. |
| 5 | Per share number has been calculated using the average shares method. |
| 6 | Based on net asset value, which does not reflect the sales charge, redemption fee or contingent deferred sales charge, if applicable. Total returns for periods of less than one year are not annualized. |
| 7 | The net expense ratio is calculated without reduction for fees paid indirectly for expense offset arrangements. The net expense ratio is 1.19% for the year ended September 30, 2009, after taking into account this expense reduction. |
| 8 | Computed on an annualized basis. |
| 9 | This expense decrease is reflected in both the net expense and the net investment income ratios shown above. |
| 10 | Represents less than 0.01%. |
- See Notes which are an integral part of the Financial Statements
Annual Shareholder Report1
Financial Highlights - Class B Shares
(For a Share Outstanding Throughout the Period)
| Period Ended September 30 | 20091 |
| Net Asset Value, Beginning of Period | $12.26 |
| Income From Investment Operations: | |
| Net investment income (loss) | (0.00)2,3 |
| Net realized and unrealized gain on investments | 0.33 |
| TOTAL FROM INVESTMENT OPERATIONS | 0.33 |
| Net Asset Value, End of Period | $12.59 |
| Total Return4 | 2.69% |
| Ratios to Average Net Assets: | |
| Net expenses | 1.92%5,6 |
| Net investment income (loss) | (0.23)%5 |
| Expense waiver/reimbursement7 | 0.69%5 |
| Supplemental Data: | |
| Net assets, end of period (000 omitted) | $79,164 |
| Portfolio turnover | 73%8 |
| 1 | Reflects operations for the period from August 29, 2009 (deemed the date of initial investment, pursuant to a reorganization that took place on August 28, 2009) to September 30, 2009. See Note 2 to the Financial Statements. |
| 2 | Per share number has been calculated using the average shares method. |
| 3 | Represents less than $0.01. |
| 4 | Based on net asset value, which does not reflect the sales charge, redemption fee or contingent deferred sales charge, if applicable. Total returns for periods of less than one year are not annualized. |
| 5 | Computed on an annualized basis. |
| 6 | The net expense ratio is calculated without reduction for fees paid indirectly for expense offset arrangements. The net expense ratio is 1.92% for the period ended September 30, 2009, after taking into account this expense reduction. |
| 7 | This expense decrease is reflected in both the net expense and the net investment income (loss) ratios shown above. |
| 8 | Portfolio turnover is calculated at the Fund level. Percentage indicated was calculated for the year ended September 30, 2009. |
- See Notes which are an integral part of the Financial Statements
Annual Shareholder Report2
Financial Highlights - Class C Shares
(For a Share Outstanding Throughout Each Period)
| Year Ended September 30 | 20091,2 | 20081,3 | 20071,3,4 |
| Net Asset Value, Beginning of Period | $14.10 | $18.71 | $20.49 |
| Income From Investment Operations: | | | |
| Net investment income | 0.095 | 0.12 | 0.05 |
| Net realized and unrealized gain (loss) on investments | (1.47) | (3.17) | 2.02 |
| TOTAL FROM INVESTMENT OPERATIONS | (1.38) | (3.05) | 2.07 |
| Less Distributions: | | | |
| Distributions from net investment income | (0.11) | (0.06) | (0.10) |
| Distributions from net realized gain on investments | — | (1.50) | (3.75) |
| TOTAL DISTRIBUTIONS | (0.11) | (1.56) | (3.85) |
| Net Asset Value, End of Period | $12.61 | $14.10 | $18.71 |
| Total Return6 | (9.67)% | (17.62)% | 11.52% |
| Ratios to Average Net Assets: | | | |
| Net expenses | 1.94%7 | 1.95% | 1.86%8 |
| Net investment income | 0.84% | 0.55% | 0.20%8 |
| Expense waiver/reimbursement9 | 0.67% | 0.61% | 0.00%8,10 |
| Supplemental Data: | | | |
| Net assets, end of period (000 omitted) | $39,007 | $3,865 | $423 |
| Portfolio turnover | 73% | 96% | 62% |
| 1 | Touchstone Value Opportunities Fund (the “Predecessor Fund”) was reorganized into Federated Clover Value Fund (the “Fund”) as of the close of business on August 28, 2009. The Fund is the successor to the Predecessor Fund. The performance information and financial information presented incorporates the operations of the Predecessor Fund, which, as a result of the reorganization, are the Fund's operations. See Note 2 to the Financial Statements. |
| 2 | Beginning with the year ended September 30, 2009, the Fund was audited by KPMG LLP. The previous years were audited by another independent registered public accounting firm. |
| 3 | Due to the reorganization: (1) the number of outstanding shares of the Predecessor Fund decreased by a factor of 1.05; and (2) since the Predecessor Fund's total number of shares outstanding decreased, the net asset value increased. The reorganization did not affect the value of the Predecessor Fund's net assets or each shareholder's proportional ownership interest in those assets. Per share data has been restated, where applicable. |
| 4 | Reflects operations for the period from November 20, 2006 (commencement of operations) to September 30, 2007. |
| 5 | Per share number has been calculated using the average shares method. |
| 6 | Based on net asset value, which does not reflect the sales charge, redemption fee or contingent deferred sales charge, if applicable. Total returns for periods of less than one year are not annualized. |
| 7 | The net expense ratio is calculated without reduction for fees paid indirectly for expense offset arrangements. The net expense ratio is 1.94% for the year ended September 30, 2009, after taking into account this expense reduction. |
| 8 | Computed on an annualized basis. |
| 9 | This expense decrease is reflected in both the net expense and the net investment income ratios shown above. |
| 10 | Represents less than 0.01%. |
- See Notes which are an integral part of the Financial Statements
Annual Shareholder Report3
Financial Highlights - Class K Shares
(For a Share Outstanding Throughout the Period)
| Period Ended September 30 | 20091 |
| Net Asset Value, Beginning of Period | $12.29 |
| Income From Investment Operations: | |
| Net investment income | 0.002,3 |
| Net realized and unrealized gain on investments | 0.33 |
| TOTAL FROM INVESTMENT OPERATIONS | 0.33 |
| Net Asset Value, End of Period | $12.62 |
| Total Return4 | 2.69% |
| Ratios to Average Net Assets: | |
| Net expenses | 1.67%5,6 |
| Net investment income | 0.04%5 |
| Expense waiver/reimbursement7 | 0.55%5 |
| Supplemental Data: | |
| Net assets, end of period (000 omitted) | $12,462 |
| Portfolio turnover | 73%8 |
| 1 | Reflects operations for the period from August 29, 2009 (deemed the date of initial investment, pursuant to a reorganization that took place on August 28, 2009) to September 30, 2009. See Note 2 to the Financial Statements. |
| 2 | Per share number has been calculated using the average shares method. |
| 3 | Represents less than $0.01. |
| 4 | Based on net asset value, which does not reflect the sales charge, redemption fee or contingent deferred sales charge, if applicable. Total returns for periods of less than one year are not annualized. |
| 5 | Computed on an annualized basis. |
| 6 | The net expense ratio is calculated without reduction for fees paid indirectly for expense offset arrangements. The net expense ratio is 1.67% for the period ended September 30, 2009, after taking into account this expense reduction. |
| 7 | This expense decrease is reflected in both the net expense and the net investment income ratios shown above. |
| 8 | Portfolio turnover is calculated at the Fund level. Percentage indicated was calculated for the year ended September 30, 2009. |
- See Notes which are an integral part of the Financial Statements
Annual Shareholder Report4
Shareholder Expense Example (unaudited)
As a shareholder of the Fund, you incur two types of costs: (1) transaction costs, including sales charges (loads) on purchase or redemption payments; and (2) ongoing costs, including management fees and to the extent applicable, distribution (12b-1) fees and/or shareholder services fees and other Fund expenses. This Example is intended to help you to understand your ongoing costs (in dollars) of investing in the Fund and to compare these costs with the ongoing costs of investing in other mutual funds. It is based on an investment of $1,000 invested at the beginning of the period and held for the entire period from April 1, 20091 to September 30, 2009.
ACTUAL EXPENSES
The first section of the table below provides information about actual account values and actual expenses. You may use the information in this section, together with the amount you invested, to estimate the expenses that you incurred over the period. Simply divide your account value by $1,000 (for example, an $8,600 account value divided by $1,000 = 8.6), then multiply the result by the number in the first section under the heading entitled “Expenses Paid During Period” to estimate the expenses attributable to your investment during this period.
HYPOTHETICAL EXAMPLE FOR COMPARISON PURPOSES
The second section of the table below provides information about hypothetical account values and hypothetical expenses based on the Fund's actual expense ratio and an assumed rate of return of 5% per year before expenses, which is not the Fund's actual return. Thus, you should not use the hypothetical account values and expenses to estimate the actual ending account balance or your expenses for the period. Rather, these figures are required to be provided to enable you to compare the ongoing costs of investing in the Fund with other funds. To do so, compare this 5% hypothetical example with the 5% hypothetical examples that appear in the shareholder reports of the other funds.
Please note that the expenses shown in the table are meant to highlight your ongoing costs only and do not reflect any transaction costs, such as sales charges (loads) on purchase or redemption payments. Therefore, the second section of the table is useful in comparing ongoing costs only, and will not help you determine the relative total costs of owning different funds. In addition, if these transaction costs were included, your costs would have been higher.
Annual Shareholder Report5
| Beginning
Account Value
4/1/2009 | Ending
Account Value
9/30/2009 | Expenses Paid
During Period1 |
| Actual: | | | |
| Class A Shares | $1,000 | $1,302.70 | $6.87 |
| Class B Shares | $1,000 | $1,026.90 | $1.76 |
| Class C Shares | $1,000 | $1,297.20 | $11.17 |
| Class K Shares | $1,000 | $1,026.90 | $1.53 |
Hypothetical (assuming a 5% return
before expenses): | | | |
| Class A Shares | $1,000 | $1,019.10 | $6.02 |
| Class B Shares | $1,000 | $1,015.44 | $9.70 |
| Class C Shares | $1,000 | $1,015.34 | $9.80 |
| Class K Shares | $1,000 | $1,016.70 | $8.44 |
| 1 | “Actual” expense information for the Class B Shares and Class K Shares is for the period from August 29, 2009 (deemed the date of initial investment, pursuant to a reorganization that took place on August 28, 2009) to September 30, 2009. Actual expenses are equal to the Fund's annualized net expense ratio for Class B Shares and Class K Shares, multiplied by 33/365 (to reflect the period from initial investment to September 30, 2009). “Hypothetical” expense information for Class A Shares, Class B Shares, Class C Shares and Class K Shares is presented on the basis of the full one-half-year period to enable comparison to other funds. It is based on assuming the same net expense ratios and average account value over the period, but it is multiplied by 183/365 (to reflect the full half-year period). The annualized net expense ratios are as follows: |
| Class A Shares | 1.19% |
| Class B Shares | 1.92% |
| Class C Shares | 1.94% |
| Class K Shares | 1.67% |
Annual Shareholder Report6
Performance data quoted represents past performance which is no guarantee of future results. Investment return and principal value will fluctuate so that an investor's shares, when redeemed, may be worth more or less than their original cost. Mutual fund performance changes over time and current performance may be lower or higher than what is stated. For current to the most recent month-end performance and after-tax returns, visit FederatedInvestors.com or call 1-800-341-7400.
Management's Discussion of Fund
Performance (unaudited)
For the fiscal year ended September 30, 2009, the Federated Clover Value Fund1 produced a total return, based on net asset value, of - -9.03% for Class A Shares, -9.66% for Class B Shares, -9.67% for Class C Shares and -9.43% for Class K Shares. Over the same period, the Fund's benchmark, the Russell 1000® Value Index2 returned -10.62%. The Fund's total return for the fiscal year reflected actual cash flows, transaction costs and other expenses which were not reflected in the total return of the Russell 1000® Value Index.
The following discussion will focus on the performance of the Fund's
Class A Shares.
| 1 | Federated Clover Value Fund is the successor to Touchstone Value Opportunities Fund, a portfolio of Touchstone Funds Group Trust, pursuant to a reorganization that took place as of the close of business on August 28, 2009. The Fund commenced operations on March 16, 2009, when the Fund became the successor to Clover Capital Multi Value Equity Common Fund, LLC, organized as a Delaware limited company only available to accredited investors. The Fund assumed the performance of the predecessor common fund. As a result of the reorganization on August 28, 2009, the Touchstone Value Opportunities Fund became the accounting survivor. Accordingly, the performance information presented above, for the periods prior to August 28, 2009, is historical information of the Touchstone Value Opportunities Fund. The performance shown for the fund's Class B Shares is historical performance of the Touchstone Value Fund's Class A Shares adjusted to reflect the expenses of the Class B Shares. The performance information for the fund's Class K Shares is historical information of the Class A Shares of the Touchstone Value Fund adjusted to reflect the expenses of the Class K Shares. |
| 2 | The Russell 1000® Value Index measures the performance of the 1,000 largest of the 3,000 largest U.S.-domiciled companies (based on total market capitalization) with lower price-to-book ratios and lower forecasted growth values. The index is unmanaged and, unlike the Fund, is not affected by cash flows. It is not possible to invest directly in an index. |
Annual Shareholder Report7
market overview
The first half of the Fund's fiscal year was characterized by extreme downside volatility related to the financial and housing industry crises. A deleveraging consumer, high unemployment and concerns regarding the impact of the government's stimulus programs on the value of the dollar weighed heavily on investor sentiment. During this period, the broad market, as measured by the Standard & Poor's 500 Index (S&P 500),3 declined approximately 40%. The second half of the fiscal year was characterized by “less worse and, maybe, slightly better” economic reports which were labeled as “green shoots” by the press. Despite lingering economic woes, the ever-forward-looking stock market took its cue accordingly in anticipation of stabilization in the near future. Off the March lows, the broad market staged the largest rally in decades, with the S&P 500 recording an astonishing gain of nearly 60% as of the close on September 30, 2009.
FUND PERFORMANCE
Relative to the Russell 1000® Value benchmark, the Fund benefited from outperformance in the Industrials and Health Care sectors. Successful stock selection in these sectors was at the heart of the fund's outperformance. Stocks such as General Electric and Shaw Group paced returns in the Industrial sector, while Wyeth and Merck drove returns in the Health Care sector. Negatively impacting relative performance during the reporting period were the Financial Services and Information Technology sectors. Stocks such as Citigroup, Lincoln National and Assurant performed poorly in Financials, while TriQuint Semiconductor Inc. and Nokia Corp. detracted from performance in the Information Technology sector. The Fund was able to post positive returns in the Consumer Discretionary, Telecommunications and Materials sectors, despite these sectors having declined in the benchmark for the reporting period. Successful stock selection was the primary driver of relative returns within most of the sectors.
| 3 | The S&P 500 is an unmanaged capitalization-weighted index of 500 stocks designed to measure performance of the broad domestic economy through changes in the aggregate market value of 500 stocks representing all major industries. The index is unmanaged and, unlike the fund, not affected by cash flows. It is not possible to invest directly in an index. |
Annual Shareholder Report8
POSITIONING AND STRATEGY
During the reporting period, many of the Fund's stock selections focused on companies with the financial strength to weather the difficult environment. The Fund's emphasis on companies with consistent cash flows and strong balance sheets is an integral part of the Adviser's investment process. Across various industries during the fiscal year, reductions in productive capacity presented opportunities for stronger companies to maintain or increase market share while weaker competitors struggled to survive.
Elevated stock price volatility during the reporting period, especially during the first half of the fiscal year, presented opportunities for the fund to purchase companies whose long-term intrinsic value appeared to be grossly underestimated by the market. Fund management observed situations in which concerns such as bank nationalization, debt refinancing and declining consumer demand, created what management believed to be attractive opportunities in several securities. Fund management's disciplined approach to evaluating these situations resulted in purchases across multiple sectors within the portfolio.
The Fund concluded the fiscal year overweighted relative to the benchmark in Consumer Discretionary, Consumer Staples and Information Technology, while being underweighted in Financial Services, Industrials and Telecommunications. The Fund's over or underweights relative to its benchmark are driven not by economic forecasts but, rather, by the analysts' view of company-specific opportunities within each sector. While the fund's managers remain cognizant of macroeconomic factors that may affect fund performance, the investment approach focuses instead on bottom-up, fundamental analysis that seeks to construct a well-diversified, risk-controlled portfolio.
Annual Shareholder Report9
GROWTH OF A $10,000 INVESTMENT - CLASS A SHARES1The graph below illustrates the hypothetical investment of $10,0002 in Federated Clover Value Fund (Class A Shares) (the “Fund”) from September 30, 1999 to September 30, 2009, compared to the Russell 1000® Value Index3 and the Russell 3000® Value Index.3
| Average Annual Total Returns4 for the Period Ended 9/30/2009 | |
| 1 Year | -14.03% |
| 5 Years | 2.21% |
| 10 Years | 6.18% |
Performance data quoted represents past performance which is no guarantee of future results. Investment return and principal value will fluctuate so that an investor's shares, when redeemed, may be worth more or less than their original cost. Mutual fund performance changes over time and current performance may be lower or higher than what is stated. For current to the most recent month-end performance and after-tax returns, visit FederatedInvestors.com or call 1-800-341-7400. Returns shown do not reflect the deduction of taxes that a shareholder would pay on Fund distributions or the redemption of Fund shares. Mutual funds are not obligations of or guaranteed by any bank and are not federally insured. Total returns shown include the maximum sales charge of 5.50%.
Annual Shareholder Report10
| 1 | Federated Clover Value Fund is the successor to Touchstone Value Opportunities Fund, a portfolio of Touchstone Funds Group Trust, pursuant to a reorganization that took place as of the close of business on August 28, 2009. The Fund commenced operations on March 16, 2009, when the Fund became the successor to Clover Capital Multi Value Equity Common Fund, LLC, organized as a Delaware limited company only available to accredited investors. The Fund assumed the performance of the predecessor common fund. As a result of the reorganization on August 28, 2009, the Touchstone Value Opportunities Fund became the accounting survivor. Accordingly, the performance information presented above, for the periods prior to August 28, 2009, is historical information for the Class A Shares of the Touchstone Value Opportunities Fund. |
| 2 | Represents a hypothetical investment of $10,000 in the Fund after deducting the maximum sales charge of 5.50% ($10,000 investment minus $550 sales charge=$9,450). The Fund's performance assumes the reinvestment of dividends and distributions. The Russell 1000® Value Index and the Russell 3000® Value Index have been adjusted to reflect reinvestment of dividends on securities in the indexes. |
| 3 | The Russell 1000® Value Index and the Russell 3000® Value Index are not adjusted to reflect sales charges, expenses or other fees that the Securities and Exchange Commission (SEC) requires to be reflected in the Fund's performance. The Russell 3000® Value Index measures the performance of those Russell 3000® Index companies with lower price-to-book ratios and lower forecasted growth values. The stocks in this index are also members of either the Russell 1000® Value or the Russell 2000® Value indexes. The indexes are unmanaged, and unlike the Fund, are not affected by cash flows. It is not possible to invest directly in an index. |
| 4 | Total returns quoted reflect all applicable sales charges. |
Annual Shareholder Report11
GROWTH OF A $10,000 INVESTMENT - CLASS B SHARES1
The Fund's Class B Shares commenced operations on August 29, 2009. For the period prior to commencement of operations of Class B Shares, the performance information shown is for the Fund's Class A Shares, adjusted to reflect the expenses of Class B Shares. The graph below illustrates the hypothetical investment of $10,0002 in Federated Clover Value Fund (Class B Shares) (the “Fund”) from September 30, 1999 to September 30, 2009, compared to the Russell 1000® Value Index3 and the Russell 3000® Value Index.3
| Average Annual Total Returns4 for the Period Ended 9/30/2009 | |
| 1 Year | -14.57% |
| 5 Years | 2.34% |
| 10 Years | 6.14% |
Performance data quoted represents past performance which is no guarantee of future results. Investment return and principal value will fluctuate so that an investor's shares, when redeemed, may be worth more or less than their original cost. Mutual fund performance changes over time and current performance may be lower or higher than what is stated. For current to the most recent month-end performance and after-tax returns, visit FederatedInvestors.com or call 1-800-341-7400. Returns shown do not reflect the deduction of taxes that a shareholder would pay on Fund distributions or the redemption of Fund shares. Mutual funds are not obligations of or guaranteed by any bank and are not federally insured. Total returns shown include the maximum contingent deferred sales charge of 5.50%, as applicable.
Annual Shareholder Report12
| 1 | Federated Clover Value Fund is the successor to Touchstone Value Opportunities Fund, a portfolio of Touchstone Funds Group Trust, pursuant to a reorganization that took place as of the close of business on August 28, 2009. The Fund commenced operations on March 16, 2009, when the Fund became the successor to Clover Capital Multi Value Equity Common Fund, LLC, organized as a Delaware limited company only available to accredited investors. The Fund assumed the performance of the predecessor common fund. As a result of the reorganization on August 28, 2009, the Touchstone Value Opportunities Fund became the accounting survivor. Accordingly, the performance information presented above, for the periods prior to August 28, 2009, is historical information for the Class A Shares of the Touchstone Value Opportunities Fund adjusted to reflect the expenses of Class B Shares. |
| 2 | Represents a hypothetical investment of $10,000 in the Fund. The maximum contingent deferred sales charge is 5.50% on any redemption less than one year from the purchase date. The Fund's performance assumes the reinvestment of all dividends and distributions. The Russell 1000® Value Index and the Russell 3000® Value Index have been adjusted to reflect reinvestment of dividends on securities in the indexes. |
| 3 | The Russell 1000® Value Index and the Russell 3000® Value Index are not adjusted to reflect sales charges, expenses or other fees that the SEC requires to be reflected in the Fund's performance. The indexes are unmanaged, and unlike the Fund, are not affected by cash flows. It is not possible to invest directly in an index. |
| 4 | Total returns quoted reflect all applicable contingent deferred sales charges. |
Annual Shareholder Report13
GROWTH OF A $10,000 INVESTMENT - CLASS C SHARES1
The graph below illustrates the hypothetical investment of $10, 0002 in Federated Clover Value Fund (Class C Shares) (the “Fund”) from September 30, 1999 to September 30, 2009, compared to the Russell 1000® Value Index3 and the Russell 3000® Value Index.3
| Average Annual Total Returns4 for the Period Ended 9/30/2009 | |
| 1 Year | -10.57% |
| 5 Years | 2.68% |
| 10 Years | 6.02% |
Performance data quoted represents past performance which is no guarantee of future results. Investment return and principal value will fluctuate so that an investor's shares, when redeemed, may be worth more or less than their original cost. Mutual fund performance changes over time and current performance may be lower or higher than what is stated. For current to the most recent month-end performance and after-tax returns, visit FederatedInvestors.com or call 1-800-341-7400. Returns shown do not reflect the deduction of taxes that a shareholder would pay on Fund distributions or the redemption of Fund shares. Mutual funds are not obligations of or guaranteed by any bank and are not federally insured. Total returns shown include the maximum contingent deferred sales charge of 1.00%, as applicable.
Annual Shareholder Report14
| 1 | Federated Clover Value Fund is the successor to Touchstone Value Opportunities Fund, a portfolio of Touchstone Funds Group Trust, pursuant to a reorganization that took place as of the close of business on August 28, 2009. The Fund commenced operations on March 16, 2009, when the Fund became the successor to Clover Capital Multi Value Equity Common Fund, LLC, organized as a Delaware limited liability company only available to accredited investors. The Fund assumed the performance of the predecessor common fund. As a result of the reorganization on August 28, 2009, the Touchstone Value Opportunities Fund became the accounting survivor. Accordingly, the performance information presented above, for the periods prior to August 28, 2009, is historical information for the Class C Shares of the Touchstone Value Opportunities Fund. |
| 2 | Represents a hypothetical investment of $10,000 in the Fund after deducting the maximum sales charge of 5.50% ($10,000 investment minus $550 sales charge=$9,450). The Fund's performance assumes the reinvestment of all dividends and distributions. The Russell 1000® Value Index and the Russell 3000® Value Index have been adjusted to reflect reinvestment of dividends on securities in the indexes. |
| 3 | The Russell 1000® Value Index and the Russell 3000® Value Index are not adjusted to reflect sales charges, expenses or other fees that the SEC requires to be reflected in the Fund's performance. The indexes are unmanaged, and unlike the Fund, are not affected by cash flows. It is not possible to invest directly in an index. |
| 4 | Total returns quoted reflect all applicable contingent deferred sales charges. |
Annual Shareholder Report15
GROWTH OF A $10,000 INVESTMENT - CLASS K SHARES1
The Fund's Class K Shares commenced operations on August 29, 2009. For the period prior to commencement of operations of Class K Shares, the performance information shown is for the Fund's Class A Shares, adjusted to reflect the expenses of Class K Shares. The graph below illustrates the hypothetical investment of $10,0002 in Federated Clover Value Fund (Class K Shares) (the “Fund”) from September 30, 1999 to September 30, 2009, compared to the Russell 1000® Value Index³ and the Russell 3000® Value Index.³
| Average Annual Total Returns for the Period Ended 9/30/2009 | |
| 1 Year | -9.43% |
| 5 Years | 2.88% |
| 10 Years | 6.27% |
Performance data quoted represents past performance which is no guarantee of future results. Investment return and principal value will fluctuate so that an investor's shares, when redeemed, may be worth more or less than their original cost. Mutual fund performance changes over time and current performance may be lower or higher than what is stated. For current to the most recent month-end performance and after-tax returns, visit FederatedInvestors.com or call 1-800-341-7400. Returns shown do not reflect the deduction of taxes that a shareholder would pay on Fund distributions or the redemption of Fund shares. Mutual funds are not obligations of or guaranteed by any bank and are not federally insured.
Annual Shareholder Report16
| 1 | Federated Clover Value Fund is the successor to Touchstone Value Opportunities Fund, a portfolio of Touchstone Funds Group Trust, pursuant to a reorganization that took place as of the close of business on August 28, 2009. The Fund commenced operations on March 16, 2009, when the Fund became the successor to Clover Capital Multi Value Equity Common Fund, LLC, organized as a Delaware limited company only available to accredited investors. The Fund assumed the performance of the predecessor common fund. As a result of the reorganization on August 28, 2009, the Touchstone Value Opportunities Fund became the accounting survivor. Accordingly, the performance information presented above, for the periods prior to August 28, 2009, is historical information for the Class A Shares of the Touchstone Value Opportunities Fund adjusted to reflect the expenses of Class K Shares. |
| 2 | Represents a hypothetical investment of $10,000 in the Fund. The Fund's performance assumes the reinvestment of all dividends and distributions. The Russell 1000® Value Index and the Russell 3000® Value Index have been adjusted to reflect reinvestment of dividends on securities in the indexes. |
| 3 | The Russell 1000® Value Index and the Russell 3000® Value Index are not adjusted to reflect sales charges, expenses or other fees that the SEC requires to be reflected in the Fund's performance. The indexes are unmanaged, and unlike the Fund, are not affected by cash flows. It is not possible to invest directly in an index. |
Annual Shareholder Report17
Portfolio of Investments Summary Table (unaudited)
At September 30, 2009, the Fund's sector composition1 was as follows:
| Sector Composition | Percentage of
Total Net Assets |
| Financials | 23.2% |
| Energy | 17.3% |
| Health Care | 10.9% |
| Industrials | 10.1% |
| Consumer Discretionary | 9.9% |
| Consumer Staples | 7.4% |
| Information Technology | 6.8% |
| Utilities | 5.7% |
| Materials | 4.1% |
| Telecommunication Services | 4.0% |
| Cash Equivalents2 | 0.6% |
| Other Assets and Liabilities — Net3,4 | 0.0% |
| TOTAL | 100.0% |
| 1 | Except for Cash Equivalents and Other Assets and Liabilities, sector classifications are based upon, and individual portfolio securities are assigned to, the classifications of the Global Industry Classification Standard (GICS) except that the Adviser assigns a classification to securities not classified by the GICS and to securities for which the Adviser does not have access to the classification made by the GICS. |
| 2 | Cash Equivalents include any investments in money market mutual funds and/or overnight repurchase agreements. |
| 3 | Assets, other than investments in securities, less liabilities. See Statement of Assets and Liabilities. |
| 4 | Represents less than 0.1%. |
Annual Shareholder Report18
Portfolio of Investments
September 30, 2009
|
| Shares | | | Value |
| | Common Stocks – 99.4% | |
| | Consumer Discretionary – 9.9% | |
| 799,050 | 1 | Goodyear Tire & Rubber Co. | 13,607,822 |
| 294,950 | | Home Depot, Inc. | 7,857,468 |
| 431,895 | 1 | Liberty Media Corp. | 13,436,253 |
| 2,046,500 | 1 | Liberty Media Holding Corp. | 22,450,105 |
| 587,568 | | Time Warner, Inc. | 16,910,207 |
| 358,940 | | Walt Disney Co. | 9,856,492 |
| | TOTAL | 84,118,347 |
| | Consumer Staples – 7.4% | |
| 296,880 | | CVS Caremark Corp. | 10,610,491 |
| 264,315 | | H.J. Heinz Co. | 10,506,521 |
| 296,005 | | Kraft Foods, Inc., Class A | 7,776,051 |
| 147,352 | | Lorillard, Inc. | 10,948,254 |
| 192,490 | | Procter & Gamble Co. | 11,149,021 |
| 312,130 | | Walgreen Co. | 11,695,511 |
| | TOTAL | 62,685,849 |
| | Energy – 17.3% | |
| 323,425 | | Anadarko Petroleum Corp. | 20,288,450 |
| 318,545 | | Cabot Oil & Gas Corp., Class A | 11,387,984 |
| 525,920 | | Chevron Corp. | 37,040,546 |
| 214,425 | | Devon Energy Corp. | 14,437,235 |
| 471,400 | | Exxon Mobil Corp. | 32,342,754 |
| 262,105 | | Noble Energy, Inc. | 17,288,446 |
| 397,270 | | Peabody Energy Corp. | 14,786,389 |
| | TOTAL | 147,571,804 |
| | Financials – 23.2% | |
| 399,681 | | Axis Capital Holdings Ltd. | 12,062,373 |
| 1,304,550 | | Bank of America Corp. | 22,072,986 |
| 284,630 | | Bank of New York Mellon Corp. | 8,251,424 |
| 104,770 | | Goldman Sachs Group, Inc. | 19,314,349 |
| 764,480 | | J.P. Morgan Chase & Co. | 33,499,514 |
| 694,750 | | Marsh & McLennan Cos., Inc. | 17,181,167 |
| 331,500 | | MetLife, Inc. | 12,620,205 |
| 464,975 | | Morgan Stanley | 14,358,428 |
Annual Shareholder Report19
|
| 235,471 | | Simon Property Group, Inc. | 16,348,751 |
| 613,880 | | U.S. Bancorp | 13,419,417 |
| 443,570 | | Wells Fargo & Co. | 12,499,803 |
| 898,050 | | XL Capital Ltd., Class A | 15,679,953 |
| | TOTAL | 197,308,370 |
| | Health Care – 10.9% | |
| 394,225 | | CIGNA Corp. | 11,073,780 |
| 272,500 | | Covidien PLC | 11,788,350 |
| 279,055 | | Johnson & Johnson | 16,991,659 |
| 314,065 | 1 | Merck & Co., Inc. | 9,933,876 |
| 1,170,295 | | Pfizer, Inc. | 19,368,382 |
| 255,200 | 1 | Thermo Fisher Scientific Inc. | 11,144,584 |
| 263,265 | 1 | Wellpoint, Inc. | 12,468,231 |
| | TOTAL | 92,768,862 |
| | Industrials – 10.1% | |
| 1,707,650 | | General Electric Co. | 28,039,613 |
| 344,200 | | Honeywell International, Inc. | 12,787,030 |
| 258,005 | | Raytheon Co. | 12,376,500 |
| 224,752 | | SPX Corp. | 13,770,555 |
| 427,850 | 1 | URS Corp. | 18,675,652 |
| | TOTAL | 85,649,350 |
| | Information Technology – 6.8% | |
| 748,525 | | Corning, Inc. | 11,459,918 |
| 872,130 | 1 | EMC Corp. | 14,861,095 |
| 488,455 | | Intel Corp. | 9,559,064 |
| 728,030 | | Nokia Oyj, Class A, ADR | 10,643,799 |
| 664,905 | 1 | Symantec Corp. | 10,950,985 |
| | TOTAL | 57,474,861 |
| | Materials – 4.1% | |
| 274,175 | | Du Pont (E.I.) de Nemours & Co. | 8,811,985 |
| 162,975 | | Potash Corp. of Saskatchewan, Inc. | 14,723,161 |
| 69,250 | | Rio Tinto PLC, ADR | 11,792,583 |
| | TOTAL | 35,327,729 |
| | Telecommunication Services – 4.0% | |
| 770,205 | | AT&T, Inc. | 20,803,237 |
| 442,782 | | Verizon Communications, Inc. | 13,403,011 |
| | TOTAL | 34,206,248 |
Annual Shareholder Report20
|
| | Utilities – 5.7% | |
| 388,935 | | DPL, Inc. | 10,151,204 |
| 408,365 | | Exelon Corp. | 20,263,071 |
| 369,133 | | National Fuel Gas Co. | 16,909,983 |
| | TOTAL | 47,324,258 |
| | TOTAL COMMON STOCKS
(IDENTIFIED COST $860,037,883) | 844,435,678 |
| | Mutual Fund – 0.6% | |
| 5,264,453 | 2,3 | Prime Value Obligations Fund, Institutional Shares, 0.30%
(AT NET ASSET VALUE) | 5,264,453 |
| | TOTAL INVESTMENTS — 100.0%
(IDENTIFIED COST $865,302,336)4 | 849,700,131 |
| | OTHER ASSETS AND LIABILITIES - NET — 0.0%5 | 360,455 |
| | TOTAL NET ASSETS — 100% | $850,060,586 |
| 1 | Non-income producing security. |
| 2 | Affiliated company. |
| 3 | 7-Day net yield. |
| 4 | The cost of investments for federal tax purposes amounts to $869,437,645. |
| 5 | Assets, other than investments in securities, less liabilities. See Statement of Assets and Liabilities. |
- Note: The categories of investments are shown as a percentage of total net assets at September 30, 2009.
- Various inputs are used in determining the value of the Fund's investments. These inputs are summarized in the three broad levels listed below:
- Level 1 — quoted prices in active markets for identical securities
- Level 2 — other significant observable inputs (including quoted prices for similar securities, interest rates, prepayment speeds, credit risk, etc.)
- Level 3 — significant unobservable inputs (including the Fund's own assumptions in determining the fair value of investments)
- The inputs or methodology used for valuing securities are not an indication of the risk associated with investing in those securities.
Annual Shareholder Report21
- The following is a summary of the inputs used, as of September 30, 2009, in valuing the Fund's assets carried at fair value:
| Valuation Inputs | | | | |
| Level 1 -
Quoted
Prices and
Investments in
Mutual Funds | Level 2 -
Other
Significant
Observable
Inputs | Level 3 -
Significant
Unobservable
Inputs | Total |
| Equity Securities: | | | | |
| Domestic | $767,745,460 | $ — | $ — | $767,745,460 |
| International | 76,690,218 | — | — | 76,690,218 |
| Mutual Fund | 5,264,453 | — | — | 5,264,453 |
| TOTAL SECURITIES | $849,700,131 | $ — | $ — | $849,700,131 |
- The following acronym is used throughout this portfolio:
- ADR — American Depositary Receipt
- See Notes which are an integral part of the Financial Statements.
Annual Shareholder Report22
Statement of Assets and Liabilities
September 30, 2009
| Assets: | | |
| Total investments in securities, at value including $5,264,453 of investments in an affiliated issuer (Note 6) (identified cost $865,302,336) | | $849,700,131 |
| Income receivable | | 1,393,112 |
| Receivable for investments sold | | 28,984,100 |
| Receivable for shares sold | | 392,043 |
| TOTAL ASSETS | | 880,469,386 |
| Liabilities: | | |
| Payable for investments purchased | $28,278,381 | |
| Payable for shares redeemed | 1,690,891 | |
| Bank overdraft | 4,569 | |
| Payable for investment adviser fee (Note 6) | 87,865 | |
| Payable for distribution services fee (Note 6) | 26,049 | |
| Payable for shareholder services fee (Note 6) | 77,642 | |
| Accrued expenses | 243,403 | |
| TOTAL LIABILITIES | | 30,408,800 |
| Net assets for 67,414,014 shares outstanding | | $850,060,586 |
| Net Assets Consist of: | | |
| Paid-in capital | | $1,374,249,348 |
| Net unrealized depreciation of investments | | (15,602,205) |
| Accumulated net realized loss on investments | | (508,680,816) |
| Undistributed net investment income | | 94,259 |
| TOTAL NET ASSETS | | $850,060,586 |
Annual Shareholder Report23
Statement of Assets and Liabilities — continued| Net Asset Value, Offering Price and Redemption Proceeds Per Share | | |
| Institutional Shares: | | |
Net asset value per share ($12,033,331 ÷ 952,628 shares outstanding),
no par value, unlimited shares authorized | | $12.63 |
| Offering price per share | | $12.63 |
| Redemption proceeds per share | | $12.63 |
| Class A Shares: | | |
Net asset value per share ($707,394,072 ÷ 56,091,431 shares outstanding),
no par value, unlimited shares authorized | | $12.61 |
| Offering price per share (100/94.50 of $12.61) | | $13.34 |
| Redemption proceeds per share | | $12.61 |
| Class B Shares: | | |
Net asset value per share ($79,163,713 ÷ 6,288,538 shares outstanding),
no par value, unlimited shares authorized | | $12.59 |
| Offering price per share | | $12.59 |
| Redemption proceeds per share (94.50/100 of $12.59) | | $11.90 |
| Class C Shares: | | |
Net asset value per share ($39,007,045 ÷ 3,093,848 shares outstanding),
no par value, unlimited shares authorized | | $12.61 |
| Offering price per share | | $12.61 |
| Redemption proceeds per share (99.00/100 of $12.61) | | $12.48 |
| Class K Shares: | | |
Net asset value per share ($12,462,425 ÷ 987,569 shares outstanding),
no par value, unlimited shares authorized | | $12.62 |
| Offering price per share | | $12.62 |
| Redemption proceeds per share | | $12.62 |
- See Notes which are an integral part of the Financial Statements
Annual Shareholder Report24
Statement of Operations
Year Ended September 30, 2009
| Investment Income: | | | |
| Dividends (including $67,151 received from affiliated issuers (Note 6) and net of foreign taxes withheld of $843) | | | $4,445,633 |
| Interest (including income on securities loaned of $132,451) (Note 3) | | | 142,414 |
| TOTAL INCOME | | | 4,588,047 |
| Expenses: | | | |
| Investment adviser fee (Note 6) | | $1,191,831 | |
| Administrative personnel and services fee (Note 6) | | 282,857 | |
| Custodian fees | | 15,891 | |
| Transfer and dividend disbursing agent fees and expenses — Institutional Shares | | 915 | |
| Transfer and dividend disbursing agent fees and expenses — Class A Shares | | 238,000 | |
| Transfer and dividend disbursing agent fees and expenses — Class B Shares | | 9,076 | |
| Transfer and dividend disbursing agent fees and expenses — Class C Shares | | 11,376 | |
| Transfer and dividend disbursing agent fees and expenses — Class K Shares | | 1,732 | |
| Directors'/Trustees' fees | | 7,254 | |
| Auditing fees | | 10,641 | |
| Legal fees | | 20,504 | |
| Portfolio accounting fees | | 32,286 | |
| Distribution services fee — Class A Shares (Note 6) | | 20,883 | |
| Distribution services fee — Class B Shares (Note 6) | | 15,372 | |
| Distribution services fee — Class C Shares (Note 6) | | 43,353 | |
| Distribution services fee — Class K Shares (Note 6) | | 1,553 | |
| Shareholder services fee — Class A Shares (Note 6) | | 179,071 | |
| Shareholder services fee — Class B Shares (Note 6) | | 5,124 | |
| Shareholder services fee — Class C Shares (Note 6) | | 3,072 | |
| Share registration costs | | 154,949 | |
| Printing and postage | | 34,468 | |
| Insurance premiums | | 1,727 | |
| Miscellaneous | | 23,899 | |
| TOTAL EXPENSES | | 2,305,834 | |
Annual Shareholder Report25
Statement of Operations — continued| Waivers, Reimbursements and Expense Reduction: | | | |
| Waiver/reimbursement of investment adviser fee (Note 6) | $(151,960) | | |
| Waiver of administrative personnel and services fee (Note 6) | (174,933) | | |
| Reimbursement of shareholder services fee — Class B Shares (Note 6) | (325) | | |
| Reimbursement of transfer and dividend disbursing agent fees and expenses — Class A Shares | (13,888) | | |
| Reimbursement of transfer and dividend disbursing agent fees and expenses — Class B Shares | (2,665) | | |
| Reimbursement of transfer and dividend disbursing agent fees and expenses — Class C Shares | (1,106) | | |
| Fees paid indirectly from directed brokerage arrangements (Note 7) | (246) | | |
| TOTAL WAIVERS, REIMBURSEMENTS AND EXPENSE REDUCTION | | $(345,123) | |
| Net expenses | | | $1,960,711 |
| Net investment income | | | 2,627,336 |
Realized and Unrealized Gain (Loss)
on Investments: | | | |
| Net realized loss on investments | | | (44,452,076) |
| Net change in unrealized depreciation of investments | | | 15,196,239 |
| Net realized and unrealized loss on investments | | | (29,255,837) |
| Change in net assets resulting from operations | | | $(26,628,501) |
- See Notes which are an integral part of the Financial Statements
Annual Shareholder Report26
Statement of Changes in Net Assets
| Year Ended September 30 | 2009 | 2008 |
| Increase (Decrease) in Net Assets | | |
| Operations: | | |
| Net investment income | $2,627,336 | $1,698,832 |
| Net realized loss on investments | (44,452,076) | (1,035,681) |
| Net change in unrealized appreciation/depreciation of investments | 15,196,239 | (31,094,111) |
| CHANGE IN NET ASSETS RESULTING FROM OPERATIONS | (26,628,501) | (30,430,960) |
| Distributions to Shareholders: | | |
| Distributions from net investment income | | |
| Class A Shares | (2,419,186) | (56,168) |
| Class C Shares | (38,355) | (10,708) |
| Class Z Shares | — | (1,663,047) |
| Distributions from net realized gain on investments | | |
| Class A Shares | — | (92,498) |
| Class C Shares | — | (51,999) |
| Class Z Shares | — | (8,553,559) |
| CHANGE IN NET ASSETS RESULTING FROM DISTRIBUTIONS TO SHAREHOLDERS | (2,457,541) | (10,427,979) |
| Share Transactions: | | |
| Proceeds from sale of shares | 68,273,280 | 132,970,316 |
| Exchange of Successor Fund shares in connection with the tax-free reorganization of Touchstone Value Opportunities Fund (Note 2) | 12,565,926 | — |
| Proceeds from shares issued in connection with the tax-free transfer of assets from Federated American Leaders Fund, Inc. (Note 2) | 679,733,197 | — |
| Net asset value of shares issued to shareholders in payment of distributions declared | 2,285,810 | 9,836,347 |
| Cost of shares redeemed | (64,567,685) | (28,898,711) |
| CHANGE IN NET ASSETS RESULTING FROM SHARE TRANSACTIONS | 698,290,528 | 113,907,952 |
| Change in net assets | 669,204,486 | 73,049,013 |
| Net Assets: | | |
| Beginning of period | 180,856,100 | 107,807,087 |
| End of period (including undistributed (distributions in excess of) net investment income of $94,259 and $(50,745), respectively) | $850,060,586 | $180,856,100 |
- See Notes which are an integral part of the Financial Statements
Annual Shareholder Report27
Notes to Financial Statements
September 30, 2009
1. ORGANIZATION
Federated Equity Funds (the “Trust”) is registered under the Investment Company Act of 1940, as amended (the “Act”), as an open-end management investment company. The Trust consists of 13 diversified portfolios. The financial statements included herein are only those of Federated Clover Value Fund (the “Fund”). The financial statements of the other portfolios are presented separately. The assets of each portfolio are segregated and a shareholder's interest is limited to the portfolio in which shares are held. Each portfolio pays its own expenses. The Fund offers five classes of shares: Institutional Shares, Class A Shares, Class B Shares, Class C Shares and Class K Shares. All shares of the Fund have equal rights with respect to voting, except on class-specific matters. The financial highlights of the Institutional Shares are presented separately. The investment objective of the Fund is to seek capital appreciation.
2. REORGANIZATION
The Fund is the successor (Successor Fund) to Touchstone Value Opportunities Fund (the “Predecessor Fund”), a portfolio of Touchstone Funds Group Trust, pursuant to a reorganization that took place as of the close of business on August 28, 2009. On that date, Class A Shares, Class C Shares and Class Z Shares of the Predecessor Fund were exchanged for Class A Shares, Class C Shares and Class A Shares of the Fund, respectively. As a result of the reorganization on August 28, 2009, the Predecessor Fund became the accounting survivor. Accordingly, the performance information presented in the financial statements for the periods prior to August 28, 2009, is historical information of the Predecessor Fund.
On August 28, 2009, the Fund received a tax-free transfer of assets from Touchstone Value Opportunities Fund, as follows:
Shares of
the Fund
Issued | Touchstone
Value
Opportunities
Fund
Net Assets
Received | Unrealized
Appreciation1 | Net Assets
of the Fund
Immediately
Prior to
Combination | Net Assets
of the Fund
Immediately
After
Combination |
| 13,258,411 | $162,851,244 | $2,221,563 | $12,565,926 | $175,417,170 |
| 1 | Unrealized appreciation is included in the Touchstone Value Opportunities Fund Net Assets Received amount shown above. |
On the date of the reorganization, the Successor Fund's net assets included $2,119,296 of net unrealized appreciation.
Annual Shareholder Report28
On September 18, 2009, the Fund received a tax-free transfer of assets from Federated American Leaders Fund, Inc., as follows:Shares of
the Fund
Issued | Federated
American Leaders
Fund, Inc.
Net Assets
Received | Unrealized
Depreciation1 | Net Assets
of the Fund
Immediately
Prior to
Combination | Net Assets
of the Fund
Immediately
After
Combination |
| 52,783,178 | $679,733,197 | $(16,944,166) | $193,844,924 | $873,578,121 |
| 1 | Unrealized depreciation is included in the Federated American Leaders Fund, Inc. Net Assets Received amount shown above. |
3. SIGNIFICANT ACCOUNTING POLICIES
The following is a summary of significant accounting policies consistently followed by the Fund in the preparation of its financial statements. These policies are in conformity with U.S. generally accepted accounting principles (GAAP).
Investment Valuation
In calculating its net asset value (NAV), the Fund generally values investments as follows:
- Equity securities listed on an exchange or traded through a regulated market system are valued at their last reported sale price or official closing price in their principal exchange or market.
- Fixed-income securities acquired with remaining maturities greater than 60 days are fair valued using price evaluations provided by a pricing service approved by the Board of Trustees (the “Trustees”).
- Fixed-income securities acquired with remaining maturities of 60 days or less are valued at their cost (adjusted for the accretion of any discount or amortization of any premium).
- Shares of other mutual funds are valued based upon their reported NAVs.
- Derivative contracts listed on exchanges are valued at their reported settlement or closing price.
- Over-the-counter (OTC) derivative contracts are fair valued using price evaluations provided by a pricing service approved by the Trustees.
If the Fund cannot obtain a price or price evaluation from a pricing service for an investment, the Fund may attempt to value the investment based upon the mean of bid and asked quotations or fair value the investment based on price evaluations, from one or more dealers. If any price, quotation, price evaluation or other pricing source is not readily available when the NAV is calculated, the Fund uses the fair value of the investment determined in accordance with the procedures described below. There can be no assurance that the Fund could purchase or sell an investment at the price used to calculate the Fund's NAV.
Fair Valuation and Significant Events Procedures
The Trustees have authorized the use of pricing services to provide evaluations of the current fair value of certain investments for purposes of calculating the NAV. Factors considered by pricing services in evaluating an investment include the yields or prices of investments of comparable quality, coupon, maturity, call rights and other potential prepayments, terms and type, reported transactions, indications as to values from dealers and general market conditions. Some pricing services provide a single price evaluation reflecting the bid-side of the market for an investment (a “bid” evaluation). Other pricing services offer both bid evaluations and price evaluations indicative of a price between the prices bid and asked for the investment (a “mid” evaluation). The Fund normally uses bid evaluations for U.S. Treasury Annual Shareholder Report29
and Agency securities, mortgage-backed securities and municipal securities. The Fund normally uses mid evaluations for other types of fixed-income securities and OTC derivative contracts. In the event that market quotations and price evaluations are not available for an investment, the fair value of the investment is determined in accordance with procedures adopted by the Trustees.The Trustees also have adopted procedures requiring an investment to be priced at its fair value whenever the Adviser determines that a significant event affecting the value of the investment has occurred between the time as of which the price of the investment would otherwise be determined and the time as of which the NAV is computed. An event is considered significant if there is both an affirmative expectation that the investment's value will change in response to the event and a reasonable basis for quantifying the resulting change in value. Examples of significant events that may occur after the close of the principal market on which a security is traded, or after the time of a price evaluation provided by a pricing service or a dealer, include:
- With respect to securities traded in foreign markets, significant trends in U.S. equity markets or in the trading of foreign securities index futures or options contracts;
- With respect to price evaluations of fixed-income securities determined before the close of regular trading on the NYSE, actions by the Federal Reserve Open Market Committee and other significant trends in U.S. fixed-income markets;
- Political or other developments affecting the economy or markets in which an issuer conducts its operations or its securities are traded; and
- Announcements concerning matters such as acquisitions, recapitalizations, litigation developments, a natural disaster affecting the issuer's operations or regulatory changes or market developments affecting the issuer's industry.
The Trustees have approved the use of a pricing service to determine the fair value of equity securities traded principally in foreign markets when the Adviser determines that there has been a significant trend in the U.S. equity markets or in index futures trading. For other significant events, the Fund may seek to obtain more current quotations or price evaluations from alternative pricing sources. If a reliable alternative pricing source is not available, the Fund will determine the fair value of the investment using another method approved by the Trustees.
Investment Income, Gains and Losses, Expenses and Distributions
Investment transactions are accounted for on a trade-date basis. Realized gains and losses from investment transactions are recorded on an identified-cost basis. Interest income and expenses are accrued daily. Dividend income and distributions to shareholders are recorded on the ex-dividend date. Foreign dividends are recorded on the ex-dividend date or when the Fund is informed of the ex-dividend date. Distributions of net investment income are declared and paid quarterly. Non-cash dividends included in dividend income, if any, are recorded at fair value. Investment income, realized and unrealized gains and losses and certain fund-level expenses are allocated to each class based on relative average daily net assets, except that Institutional Shares, Class A Shares, Class B Shares, Class C Shares and Class K Shares may bear distribution services fees, shareholder services fees and certain transfer and dividend disbursing agent fees unique to those classes. Dividends are declared separately for each class. No class has preferential dividend rights; differences in per share dividend rates are generally due to differences in separate class expenses.
Annual Shareholder Report30
Premium and Discount AmortizationAll premiums and discounts on fixed-income securities are amortized/accreted for financial statement purposes.
Federal Taxes
It is the Fund's policy to comply with the Subchapter M provision of the Internal Revenue Code (the “Code”) and to distribute to shareholders each year substantially all of its income. Accordingly, no provision for federal income tax is necessary. As of and during the year ended September 30, 2009, the Fund did not have a liability for any uncertain tax positions. The Fund recognizes interest and penalties, if any, related to tax liabilities as income tax expense in the Statement of Operations. As of September 30, 2009, tax year 2009 remains subject to examination by the Fund's major tax jurisdictions, which include the United States of America and the Commonwealth of Massachusetts.
The Fund may be subject to taxes imposed by governments of countries in which it invests. Such taxes are generally based on either income or gains earned or repatriated. The Fund accrues and applies such taxes to net investment income, net realized gains and net unrealized gains as income and/or gains are earned.
When-Issued and Delayed Delivery Transactions
The Fund may engage in when-issued or delayed delivery transactions. The Fund records when-issued securities on the trade date and maintains security positions such that sufficient liquid assets will be available to make payment for the securities purchased. Securities purchased on a when-issued or delayed delivery basis are marked to market daily and begin earning interest on the settlement date. Losses may occur on these transactions due to changes in market conditions or the failure of counterparties to perform under the contract.
Securities Lending
The Fund participates in a securities lending program providing for the lending of equity securities to qualified brokers. The Fund normally receives cash collateral for securities loaned that is invested in an affiliated money market fund or in short-term securities including repurchase agreements. Collateral is maintained at a minimum level of 100% of the market value of investments loaned, plus interest, if applicable. In accordance with the Fund's securities lending agreement, the market value of securities on loan is determined each day at the close of business and any additional collateral required to cover the value of securities on loan is delivered to the Fund on the next business day. Earnings on collateral are allocated between the securities lending agent, as a fee for its services under the program, and the Fund, according to agreed-upon rates.
Other
The preparation of financial statements in conformity with GAAP requires management to make estimates and assumptions that affect the amounts of assets, liabilities, expenses and revenues reported in the financial statements. Actual results could differ from those estimated.
Annual Shareholder Report31
4. SHARES OF BENEFICIAL INTERESTThe following tables summarize share activity:
| Period Ended
9/30/20091 | Year Ended
9/30/2008 |
| Institutional Shares: | Shares | Amount | Shares | Amount |
| Shares sold | 46,315 | $574,933 | — | $ — |
| Exchange of Successor Fund shares in connection with the tax-free reorganization of Touchstone Value Opportunities Fund | 908,665 | 11,171,864 | — | — |
| Shares issued to shareholders in payment of distributions declared | — | — | — | — |
| Shares redeemed | (2,352) | (28,168) | — | — |
NET CHANGE RESULTING
FROM INSTITUTIONAL SHARE TRANSACTIONS | 952,628 | $11,718,629 | — | $ — |
| Year Ended
9/30/2009 | Year Ended
9/30/2008 |
| Class A Shares: | Shares | Amount | Shares | Amount |
| Shares sold | 1,754,894 | $19,558,947 | 675,272 | $10,517,094 |
| Transfer in of Class Z Shares2 | 12,596,617 | 182,078,468 | | |
| Exchange of Successor Fund shares in connection with the tax-free reorganization of Touchstone Value Opportunities Fund | 76,192 | 935,852 | — | — |
| Proceeds from shares issued in connection with the tax-free transfer of assets from Federated American Leaders Fund, Inc. | 42,830,686 | 551,659,234 | — | — |
| Shares issued to shareholders in payment of distributions declared | 16,760 | 179,185 | 9,547 | 147,326 |
| Adjustment of Predecessor Fund shares in connection with tax-free reorganization | (637,282) | — | — | — |
| Shares redeemed | (1,157,857) | (13,324,756) | (99,826) | (1,512,627) |
NET CHANGE RESULTING
FROM CLASS A SHARE TRANSACTIONS | 55,480,010 | $741,086,930 | 584,993 | $9,151,793 |
Annual Shareholder Report32
| Period Ended
9/30/20091 | Year Ended
9/30/2008 |
| Class B Shares: | Shares | Amount | Shares | Amount |
| Shares sold | 112,935 | $1,393,248 | — | $ — |
| Exchange of Successor Fund shares in connection with the tax-free reorganization of Touchstone Value Opportunities Fund | 34,767 | 426,380 | — | — |
| Proceeds from shares issued in connection with the tax-free transfer of assets from Federated American Leaders Fund, Inc. | 6,195,909 | 79,679,394 | — | — |
| Shares issued to shareholders in payment of distributions declared | — | — | — | — |
| Shares redeemed | (55,073) | (694,836) | — | — |
NET CHANGE RESULTING
FROM CLASS B SHARE TRANSACTIONS | 6,288,538 | $80,804,186 | — | $ — |
| Year Ended
9/30/2009 | Year Ended
9/30/2008 |
| Class C Shares: | Shares | Amount | Shares | Amount |
| Shares sold | 271,399 | $2,870,136 | 276,218 | $4,244,880 |
| Exchange of Successor Fund shares in connection with the tax-free reorganization of Touchstone Value Opportunities Fund | 2,358 | 28,964 | — | — |
| Proceeds from shares issued in connection with the tax-free transfer of assets from Federated American Leaders Fund, Inc. | 2,778,973 | 35,793,174 | — | — |
| Shares issued to shareholders in payment of distributions declared | 3,374 | 36,153 | 3,269 | 51,418 |
| Adjustment of Predecessor Fund shares in connection with tax-free reorganization | (16,484) | — | — | — |
| Shares redeemed | (233,730) | (2,456,544) | (15,293) | (245,732) |
NET CHANGE RESULTING
FROM CLASS C SHARE TRANSACTIONS | 2,805,890 | $36,271,883 | 264,194 | $4,050,566 |
Annual Shareholder Report33
| Period Ended
9/30/20091 | Year Ended
9/30/2008 |
| Class K Shares: | Shares | Amount | Shares | Amount |
| Shares sold | 16,424 | $207,777 | — | $ — |
| Exchange of Successor Fund shares in connection with the tax-free reorganization of Touchstone Value Opportunities Fund | 233 | 2,866 | — | — |
| Proceeds from shares issued in connection with the tax-free transfer of assets from Federated American Leaders Fund, Inc. | 977,610 | 12,601,395 | — | — |
| Shares issued to shareholders in payment of distributions declared | — | — | — | — |
| Shares redeemed | (6,698) | (84,963) | — | — |
NET CHANGE RESULTING
FROM CLASS K SHARE TRANSACTIONS | 987,569 | $12,727,075 | — | $ — |
| Year Ended
9/30/2009 | Year Ended
9/30/2008 |
| Class Z Shares:2 | Shares | Amount | Shares | Amount |
| Shares sold | 4,420,419 | $43,668,239 | 7,691,116 | $118,208,342 |
| Shares issued to shareholders in payment of distributions declared | 200,218 | 2,070,472 | 605,666 | 9,637,603 |
| Shares redeemed | (4,574,307) | (47,978,418) | (1,742,914) | (27,140,352) |
NET CHANGE RESULTING
FROM CLASS Z SHARE TRANSACTIONS | 46,330 | $(2,239,707) | 6,553,868 | $100,705,593 |
FINAL REDEMPTION FROM
CLASS Z SHARES2 | (12,596,617) | $(182,078,468) | — | $ — |
| NET CHANGE RESULTING FROM FUND SHARE TRANSACTIONS | 53,964,348 | $698,290,528 | 7,403,055 | $113,907,952 |
| 1 | Reflects operations for the period from August 29, 2009 (deemed the date of initial investment, pursuant to a reorganization that took place on August 28, 2009) to September 30, 2009. |
| 2 | At the close of business on August 28, 2009, Class Z Shares were reorganized into Class A Shares. |
5. FEDERAL TAX INFORMATION
The timing and character of income and capital gain distributions are determined in accordance with income tax regulations, which may differ from GAAP. These differences are due to differing treatments for expiration of capital loss carryforwards, unreversed wash sales from mergers and REIT adjustments.
Annual Shareholder Report34
For the year ended September 30, 2009, permanent differences identified and reclassified among the components of net assets were as follows:| Increase (Decrease) |
| Paid-In Capital | Undistributed
Net Investment
Income (Loss) | Accumulated
Net Realized
Gain (Loss) |
| $462,746,427 | $(24,791) | $(462,721,636) |
Net investment income (loss), net realized gains (losses) and net assets were not affected by this reclassification.
The tax character of distributions as reported on the Statement of Changes in Net Assets for the years ended September 30, 2009 and 2008, was as follows:
| 2009 | 2008 |
| Ordinary income1 | $2,457,541 | $1,739,423 |
| Long-term capital gains | $ — | $8,688,556 |
| 1 | For tax purposes, short-term capital gain distributions are considered ordinary income distributions. |
As of September 30, 2009, the components of distributable earnings on a tax basis were as follows:
| Undistributed ordinary income | $80,118 |
| Net unrealized depreciation | $(19,737,514) |
| Capital loss carryforwards and deferrals | $(504,531,366) |
The difference between book-basis and tax-basis net unrealized appreciation/depreciation is attributable to differing treatments for the deferral of losses on wash sales and REIT adjustments.
At September 30, 2009, the cost of investments for federal tax purposes was $869,437,645. The net unrealized depreciation of investments for federal tax purposes was $19,737,514. This consists of net unrealized appreciation from investments for those securities having an excess of value over cost of $32,036,957 and net unrealized depreciation from investments for those securities having an excess of cost over value of $51,774,471.
At September 30, 2009, the Fund had a capital loss carryforward of $498,219,452 which will reduce the Fund's taxable income arising from future net realized gains on investments, if any, to the extent permitted by the Code and thus will reduce the amount of distributions to shareholders which would otherwise be necessary to relieve the Fund of any liability for federal income tax. Pursuant to the Code, such capital loss carryforward will expire as follows:
| Expiration Year | Expiration Amount |
| 2015 | $342,110,357 |
| 2016 | $125,794,854 |
| 2017 | $30,314,241 |
As a result of the tax-free transfer of assets from Touchstone Value Opportunities Fund and Federated American Leaders Fund, Inc., the use of certain capital loss carryforwards listed above may be limited.
Annual Shareholder Report35
Under current tax regulations, capital losses on securities transactions realized after October 31 may be deferred and treated as occurring on the first day of the following fiscal year. As of September 30, 2009, for federal income tax purposes, post October losses of $6,311,914 were deferred to October 1, 2009.6. INVESTMENT ADVISER FEE AND OTHER TRANSACTIONS WITH AFFILIATES
Investment Adviser Fee
Federated Global Investment Management Corporation is the Fund's investment adviser (the “Adviser”). The advisory agreement between the Fund and the Adviser provides for an annual fee equal to 0.75% of the Fund's average daily net assets. Subject to the terms described in the Expense Limitation note, the Adviser may voluntarily choose to waive any portion of its fee. The Adviser can modify or terminate this voluntary waiver at any time at its sole discretion. For the period from August 29, 2009 to September 30, 2009, the Adviser voluntarily waived $151,175 of its fee.
For the period from August 29, 2009 to September 30, 2009, the net fee paid to the Adviser was $90,723.
Prior to close of business on August 28, 2009, the Predecessor Fund's investment adviser was Touchstone Advisors, Inc. After the close of business on August 28, 2009, the Predecessor Fund was reorganized into the Fund. The annual rate did not change due to this reorganization. For the period from October 1, 2008 to August 28, 2009, the net fee paid to Touchstone Advisors, Inc. was $949,148.
Administrative Fee
Federated Administrative Services (FAS), under the Administrative Services Agreement, provides the Fund with administrative personnel and services. The fee paid to FAS is based on the average aggregate daily net assets of certain Federated funds as specified below:
| Administrative Fee | Average Aggregate Daily Net Assets
of the Federated Funds |
| 0.150% | on the first $5 billion |
| 0.125% | on the next $5 billion |
| 0.100% | on the next $10 billion |
| 0.075% | on assets in excess of $20 billion |
The administrative fee received during any fiscal year shall be at least $150,000 per portfolio and $40,000 per each additional class of Shares. Subject to the terms described in the Expense Limitation note, FAS may voluntarily choose to waive any portion of its fee. FAS can modify or terminate this voluntary waiver at any time at its sole discretion. The fee for the period from August 29, 2009 through September 30, 2009, is pro-rated. For the period from August 29, 2009 to September 30, 2009, the net fee paid to FAS was $21,132 and 0.066% of average daily net assets of the Fund. FAS waived $5,197 of its fee.
Prior to close of business on August 28, 2009, Touchstone Advisors, Inc. provided administrative services to the Predecessor Fund. For the period from October 1, 2008 to
August 28, 2009, the net fee paid to Touchstone Advisors, Inc. was $86,792. For the period from October 1, 2008 to August 28, 2009, Touchstone Advisors, Inc. waived $169,736 of its fee.
Annual Shareholder Report36
Distribution Services FeeThe Fund has adopted a Distribution Plan (the “Plan”) pursuant to Rule 12b-1 under the Act. Under the terms of the Plan, the Fund will compensate Federated Securities Corp. (FSC), the principal distributor, from the daily net assets of the Fund's Class A Shares, Class B Shares, Class C Shares and Class K Shares to finance activities intended to result in the sale of these shares. The Plan provides that the Fund may incur distribution expenses at the following percentages of average daily net assets annually, to compensate FSC:
| Share Class Name | Percentage of Average Daily
Net Assets of Class |
| Class A Shares | 0.05% |
| Class B Shares | 0.75% |
| Class C Shares | 0.75% |
| Class K Shares | 0.50% |
Subject to the terms described in the Expense Limitation note, FSC may voluntarily choose to waive any portion of its fee. FSC can modify or terminate this voluntary waiver at any time at its sole discretion. When FSC receives fees, it may pay some or all of them to financial intermediaries whose customers purchase shares. For the period from August 29, 2009 to September 30, 2009, FSC retained $10,771 of fees paid by the Fund.
For the period from August 29, 2009 to September 30, 2009, the net fee paid to FSC was $26,140.
Prior to close of business on August 28, 2009, Touchstone Securities, Inc. was the principal distributor for the Predecessor Fund. For the period from October 1, 2008 to August 28, 2009, the net fee paid to Touchstone Securities, Inc. was $55,021.
Sales Charges
Front-end sales charges and contingent deferred sales charges (CDSC) do not represent expenses of the Fund. They are deducted from the proceeds of sales of Fund shares prior to investment or from redemption proceeds prior to remittance, as applicable. For the period from August 29, 2009 to September 30, 2009, FSC retained $12,035 in sales charges from the sale of Class A Shares. FSC also retained $1,363 of CDSC relating to redemptions of Class C Shares.
Prior to close of business on August 28, 2009, Touchstone Securities, Inc., served as distributor of the Predecessor Fund's shares. For the period from October 1, 2008 to August 28, 2009, Touchstone Securities, Inc. retained $28,902 in sales charges from the sale of the Predecessor Fund's Class A Shares. Touchstone Securities, Inc. also retained $4,295 of CDSC relating to redemptions of the Predecessor Fund's Class C Shares.
Shareholder Services Fee
The Fund may pay fees (Service Fees) up to 0.25% of the average daily net assets of the Fund's Class A Shares, Class B Shares and Class C Shares to financial intermediaries or to Federated Shareholder Services Company (FSSC) for providing services to shareholders and maintaining shareholder accounts. Subject to the terms described in the Expense Limitation note, FSSC may voluntarily reimburse the Fund for shareholder services fees. This voluntary reimbursement can be modified or terminated at any time. For the period from August 29, 2009 to September 30, 2009, FSSC voluntarily reimbursed $325 of shareholder services fees. For the period from August 29, 2009 to September 30, 2009, FSSC did not receive any fees paid by the Fund.
Annual Shareholder Report37
For the period from August 29, 2009 to September 30, 2009, the net fee paid to financial intermediaries was $77,311.Prior to close of business on August 28, 2009, Touchstone Securities, Inc. received Service Fees from the Predecessor Fund. For the period from October 1, 2008 to August 28, 2009, the net fee paid to Touchstone Securities, Inc. was $109,631.
Expense Limitation
The Adviser and its affiliates (which may include FSC, FAS and FSSC) have voluntarily agreed to waive their fees and/or reimburse expenses so that the total operating expenses (as shown in the financial highlights) paid by the Fund's Institutional Shares, Class A Shares, Class B Shares, Class C Shares and Class K Shares (after the voluntary waivers and reimbursements) will not exceed 0.94%, 1.19%, 1.92%, 1.92% and 1.67%, respectively, through the later of (the “Termination Date”): (a) November 30, 2010; or (b) the date of the Fund's next effective Prospectus. While the Adviser and its affiliates currently do not anticipate terminating these arrangements prior to the Termination Date, these arrangements may only be terminated prior to the Termination Date with the agreement of the Fund's Board of Trustees.
General
Certain Officers and Trustees of the Fund are Officers and Directors or Trustees of the above companies.
Transactions with Affiliated Companies
Affiliated holdings are mutual funds which are managed by the Adviser or an affiliate of the Adviser. The Adviser has agreed to reimburse the Fund for certain investment adviser fees as a result of transactions in other affiliated mutual funds. For the period from August 29, 2009 to September 30, 2009, the Adviser reimbursed $785. Transactions with the affiliated company during the year ended September 30, 2009 were as follows:
| Affiliate | Balance of
Shares Held
9/30/2008 | Purchases/
Additions | Sales/
Reductions | Balance of
Shares Held
9/30/2009 | Value | Dividend
Income |
| Prime Value Obligations Fund, Institutional Shares | — | 43,279,168 | 38,014,715 | 5,264,453 | $5,264,453 | $7,018 |
In addition, prior to the close of business on August 28, 2009, the Predecessor Fund invested in an affiliated mutual fund. For the period from October 1, 2008 to August 28, 2009, transactions with the affiliated company were as follows:
| Affiliate | Balance of
Shares Held
9/30/2008 | Purchases/
Additions | Sales/
Reductions | Balance of
Shares Held
9/30/2009 | Value | Dividend
Income |
| Touchstone Institutional Money Market Fund | 4,653,025 | 61,427,504 | 66,080,529 | — - | $ — | $60,133 |
7. EXPENSE Reduction
The Fund directs portfolio trades to a broker that in turn pays a portion of the Fund's operating expenses. For the year ended September 30, 2009, the Fund's expenses were reduced by $246 under these arrangements.
Annual Shareholder Report38
8. Investment TRANSACTIONSPurchases and sales of investments, excluding long-term U.S. government securities and short-term obligations, for the year ended September 30, 2009, were as follows:
| Purchases | $153,956,085 |
| Sales | $140,200,006 |
9. LINE OF CREDIT
The Fund participates in a $100,000,000 unsecured, uncommitted revolving line of credit (LOC) agreement with PNC Bank. The LOC was made available for extraordinary or emergency purposes, primarily for financing redemption payments. Borrowings are charged interest at a rate offered to the Fund by PNC Bank at the time of the borrowing. As of September 30, 2009, there were no outstanding loans. During the period from August 29, 2009 to September 30, 2009, the Fund did not utilize the LOC.
10. INTERFUND LENDING
Pursuant to an Exemptive Order issued by the Securities and Exchange Commission (SEC), the Fund, along with other funds advised by subsidiaries of Federated Investors, Inc., may participate in an interfund lending program. This program provides an alternative credit facility allowing the funds to borrow from other participating affiliated funds. As of September 30, 2009, there were no outstanding loans. During the period from August 29, 2009 to September 30, 2009, the program was not utilized.
11. Legal Proceedings
Since October 2003, Federated Investors, Inc. and related entities (collectively, “Federated”) and various Federated funds (“Federated Funds”) have been named as defendants in several class action lawsuits now pending in the United States District Court for the District of Maryland. The lawsuits were purportedly filed on behalf of people who purchased, owned and/or redeemed shares of Federated-sponsored mutual funds during specified periods beginning November 1, 1998. The suits are generally similar in alleging that Federated engaged in illegal and improper trading practices including market timing and late trading in concert with certain institutional traders, which allegedly caused financial injury to the mutual fund shareholders. These lawsuits began to be filed shortly after Federated's first public announcement that it had received requests for information on shareholder trading activities in the Federated Funds from the SEC, the Office of the New York State Attorney General (“NYAG”) and other authorities. In that regard, on November 28, 2005, Federated announced that it had reached final settlements with the SEC and the NYAG with respect to those matters. As Federated previously reported in 2004, it has already paid approximately $8.0 million to certain funds as determined by an independent consultant. As part of these settlements, Federated agreed to pay for the benefit of fund shareholders additional disgorgement and a civil money penalty in the aggregate amount of an additional $72 million. Federated entities have also been named as defendants in several additional lawsuits that are now pending in the United States District Court for the Western District of Pennsylvania, alleging, among other things, excessive advisory and Rule 12b-1 fees. The Board of the Federated Funds retained the law firm of Dickstein Shapiro LLP to represent the Federated Funds in these lawsuits. Federated and the Federated Funds, and their respective counsel have been defending this litigation, and none of the Federated Funds remains a defendant in any of the lawsuits (though some could potentially receive any recoveries as nominal defendants). Additional lawsuits Annual Shareholder Report39
based upon similar allegations may be filed in the future. The potential impact of these lawsuits, all of which seek unquantified damages, attorneys' fees and expenses, and future potential similar suits is uncertain. Although we do not believe that these lawsuits will have a material adverse effect on the Federated Funds, there can be no assurance that these suits, the ongoing adverse publicity and/or other developments resulting from the regulatory investigations will not result in increased Federated Fund redemptions, reduced sales of Federated Fund shares or other adverse consequences for the Federated Funds.12. Subsequent events
Management has evaluated subsequent events through November 24, 2009, the date the financial statements were issued, and determined that no events have occurred that require additional disclosure.
13. FEDERAL TAX INFORMATION (UNAUDITED)
For the fiscal year ended September 30, 2009, 100.0% of total ordinary income (including short-term capital gain) distributions paid by the Successor Fund are qualifying dividends which may be subject to a maximum tax rate of 15%, as provided for by the Jobs and Growth Tax Relief Act of 2003. Complete information is reported in conjunction with the reporting of your distributions on Form 1099-DIV.
Of the ordinary income (including short-term capital gain) distributions made by the Successor Fund during the year ended September 30, 2009, 100.0% qualify for the dividend received deduction available to corporate shareholders.
Annual Shareholder Report40
Report of Independent Registered Public Accounting Firm
TO THE BOARD OF TRUSTEES OF THE FEDERATED EQUITY FUNDS AND SHAREHOLDERS OF Federated Clover Value Fund:
We have audited the accompanying statement of assets and liabilities, including the portfolio of investments, of the Federated Clover Value Fund (the “Fund”), a portfolio of Federated Equity Funds, as of September 30, 2009, and the related statement of operations, changes in net assets and the financial highlights for the year then ended. These financial statements and financial highlights are the responsibility of the Fund's management. Our responsibility is to express an opinion on these financial statements and financial highlights based on our audits. The statement of changes in net assets and the financial highlights for the periods presented prior to October 1, 2008, were audited by other independent registered public accountants whose report thereon dated November 25, 2008, expressed an unqualified opinion on those statements.
We conducted our audits in accordance with the standards of the Public Company Accounting Oversight Board (United States). Those standards require that we plan and perform the audit to obtain reasonable assurance about whether the financial statements and financial highlights are free of material misstatement. An audit includes examining, on a test basis, evidence supporting the amounts and disclosures in the financial statements. Our procedures included confirmation of securities owned as of September 30, 2009, by correspondence with the custodian and brokers or by other appropriate auditing procedures. An audit also includes assessing the accounting principles used and significant estimates made by management, as well as evaluating the overall financial statement presentation. We believe that our audit provides a reasonable basis for our opinion.
In our opinion, the financial statements and financial highlights referred to above present fairly, in all material respects, the financial position of the Federated Clover Value Fund as of September 30, 2009, and the results of its operations, the changes in its net assets and the financial highlights for the year then ended, in conformity with U.S. generally accepted accounting principles.
Boston, Massachusetts
November 24, 2009
Annual Shareholder Report41
Board of Trustees and Trust Officers
The Board is responsible for managing the Trust's business affairs and for exercising all the Trust's powers except those reserved for the shareholders. The following tables give information about each Board member and the senior officers of the Fund. Where required, the tables separately list Board members who are “interested persons” of the Fund (i.e., “Interested” Board members) and those who are not (i.e., “Independent” Board members). Unless otherwise noted, the address of each person listed is Federated Investors Tower, 1001 Liberty Avenue, Pittsburgh, PA 15222. The address of all Independent Board members listed is 4000 Ericsson Drive, Warrendale, PA 15086-7561; Attention: Mutual Fund Board. As of December 31, 2008, the Trust comprised ten portfolios, and the Federated Fund Complex consisted of 40 investment companies (comprising 149 portfolios). Unless otherwise noted, each Officer is elected annually. Unless otherwise noted, each Board member oversees all portfolios in the Federated Fund Complex and serves for an indefinite term. The Fund's Statement of Additional Information includes additional information about Trust Trustees and is available, without charge and upon request, by calling 1-800-341-7400.
Interested TRUSTEES Background
Name
Birth Date
Positions Held with Trust
Date Service Began | Principal Occupation(s) for Past Five Years,
Other Directorships Held and Previous Position(s) |
John F. Donahue*
Birth Date: July 28, 1924
TRUSTEE
Began serving: April 1984 | Principal Occupations: Director or Trustee of the Federated Fund Complex; Chairman and Director, Federated Investors, Inc.; Chairman of the Federated Fund Complex's Executive Committee.
Previous Positions: Chairman of the Federated Fund Complex; Trustee, Federated Investment Management Company; Chairman and Director, Federated Investment Counseling. |
J. Christopher Donahue*
Birth Date: April 11, 1949
PRESIDENT AND TRUSTEE
Began serving: January 2000 | Principal Occupations: Principal Executive Officer and President of the Federated Fund Complex; Director or Trustee of some of the Funds in the Federated Fund Complex; President, Chief Executive Officer and Director, Federated Investors, Inc.; Chairman and Trustee, Federated Investment Management Company; Trustee, Federated Investment Counseling; Chairman and Director, Federated Global Investment Management Corp.; Chairman, Federated Equity Management Company of Pennsylvania and Passport Research, Ltd. (investment advisory subsidiary of Federated); Trustee, Federated Shareholder Services Company; Director, Federated Services Company.
Previous Positions: President, Federated Investment Counseling; President and Chief Executive Officer, Federated Investment Management Company, Federated Global Investment Management Corp. and Passport Research, Ltd. |
| * | Family relationships and reasons for “interested” status: John F. Donahue is the father of J. Christopher Donahue; both are “interested” due to their beneficial ownership of shares of Federated Investors, Inc. and the positions they hold with Federated and its subsidiaries. |
Annual Shareholder Report42
INDEPENDENT TRUSTEES Background
Name
Birth Date
Positions Held with Trust
Date Service Began | Principal Occupation(s) for Past Five Years,
Other Directorships Held and Previous Position(s) |
John T. Conroy, Jr., Ph.D.
Birth Date: June 23, 1937
TRUSTEE
Began serving: November 1991 | Principal Occupations: Director or Trustee of the Federated Fund Complex; Chairman of the Board, Investment Properties Corporation; Partner or Trustee in private real estate ventures in Southwest Florida; Assistant Professor in Theology at Barry University and Blessed Edmund Rice School for Pastoral Ministry.
Previous Positions: President, Investment Properties Corporation; Senior Vice President, John R. Wood and Associates, Inc., Realtors; President, Naples Property Management, Inc. and Northgate Village Development Corporation. |
Nicholas P. Constantakis
Birth Date: September 3, 1939
TRUSTEE
Began serving: February 1998 | Principal Occupation: Director or Trustee of the Federated Fund Complex.
Other Directorships Held: Director and Chairman of the Audit Committee, Michael Baker Corporation (architecture, engineering and construction services).
Previous Position: Partner, Andersen Worldwide SC. |
John F. Cunningham
Birth Date: March 5, 1943
TRUSTEE
Began serving: January 1999 | Principal Occupation: Director or Trustee of the Federated Fund Complex.
Other Directorships Held: Chairman, President and Chief Executive Officer, Cunningham & Co., Inc. (strategic business consulting); Trustee Associate, Boston College.
Previous Positions: Director, Redgate Communications and EMC Corporation (computer storage systems); Chairman of the Board and Chief Executive Officer, Computer Consoles, Inc.; President and Chief Operating Officer, Wang Laboratories; Director, First National Bank of Boston; Director, Apollo Computer, Inc. |
Maureen Lally-Green
Birth Date: July 5, 1949
TRUSTEE
Began serving: August 2009 | Principal Occupations: Director or Trustee of the Federated Fund Complex; Director, Office of Church Relations, Diocese of Pittsburgh; Adjunct Professor of Law, Duquesne University School of Law.
Other Directorships Held: Director, Auberle; Trustee St. Francis University; Director, Ireland Institute of Pittsburgh; Director, UPMC Mercy Hospital; Regent, St. Vincent Seminary; Director, Epilepsy Foundation of Western and Central Pennsylvania; Director, Saint Thomas More Society, Allegheny County; Director, Carlow University.
Previous Position: Pennsylvania Superior Court Judge. |
Annual Shareholder Report43
Name
Birth Date
Positions Held with Trust
Date Service Began | Principal Occupation(s) for Past Five Years,
Other Directorships Held and Previous Position(s) |
Peter E. Madden
Birth Date: March 16, 1942
TRUSTEE
Began serving: November 1991 | Principal Occupation: Director or Trustee and Chairman of the Board of the Federated Fund Complex.
Other Directorship Held: Board of Overseers, Babson College.
Previous Positions: Representative, Commonwealth of Massachusetts General Court; President, Chief Operating Officer and Director, State Street Bank and Trust Company and State Street Corporation (retired); Director, VISA USA and VISA International; Chairman and Director, Massachusetts Bankers Association; Director, Depository Trust Corporation; Director, The Boston Stock Exchange. |
Charles F. Mansfield, Jr.
Birth Date: April 10, 1945
TRUSTEE
Began serving: January 1999 | Principal Occupations: Director or Trustee and Chairman of the Audit Committee of the Federated Fund Complex; Management Consultant.
Previous Positions: Chief Executive Officer, PBTC International Bank; Partner, Arthur Young & Company (now Ernst & Young LLP); Chief Financial Officer of Retail Banking Sector, Chase Manhattan Bank; Senior Vice President, HSBC Bank USA (formerly, Marine Midland Bank); Vice President, Citibank; Assistant Professor of Banking and Finance, Frank G. Zarb School of Business, Hofstra University; Executive Vice President DVC Group, Inc. (marketing, communications and technology). |
R. James Nicholson
Birth Date: February 4, 1938
TRUSTEE
Began serving: January 2008 | Principal Occupations: Director or Trustee of the Federated Fund Complex; Senior Counsel, Brownstein Hyatt Farber Schrek, P.C.; Former Secretary of the U.S. Dept. of Veterans Affairs; Former U.S. Ambassador to the Holy See; Former Chairman of the Republican National Committee.
Other Directorships Held: Director, Horatio Alger Association; Director, The Daniels Fund.
Previous Positions: Colonel, U.S. Army Reserve; Partner, Calkins, Kramer, Grimshaw and Harring, P.C.; General Counsel, Colorado Association of Housing and Building; Chairman and CEO, Nicholson Enterprises, Inc. (real estate holding company); Chairman and CEO, Renaissance Homes of Colorado. |
Thomas M. O'Neill
Birth Date: June 14, 1951
TRUSTEE
Began serving: October 2006 | Principal Occupations: Director or Trustee of the Federated Fund Complex; Managing Director and Partner, Navigator Management Company, L.P. (investment and strategic consulting).
Other Directorships Held: Board of Overseers, Children's Hospital of Boston; Visiting Committee on Athletics, Harvard College.
Previous Positions: Chief Executive Officer and President, Managing Director and Chief Investment Officer, Fleet Investment Advisors; President and Chief Executive Officer, Aeltus Investment Management, Inc.; General Partner, Hellman, Jordan Management Co., Boston, MA; Chief Investment Officer, The Putnam Companies, Boston, MA; Credit Analyst and Lending Officer, Fleet Bank; Director and Consultant, EZE Castle Software (investment order management software); Director, Midway Pacific (lumber). |
Annual Shareholder Report44
Name
Birth Date
Positions Held with Trust
Date Service Began | Principal Occupation(s) for Past Five Years,
Other Directorships Held and Previous Position(s) |
John S. Walsh
Birth Date: November 28, 1957
TRUSTEE
Began serving: January 1999 | Principal Occupations: Director or Trustee of the Federated Fund Complex; President and Director, Heat Wagon, Inc. (manufacturer of construction temporary heaters); President and Director, Manufacturers Products, Inc. (distributor of portable construction heaters); President, Portable Heater Parts, a division of Manufacturers Products, Inc.
Previous Position: Vice President, Walsh & Kelly, Inc. |
James F. Will
Birth Date: October 12, 1938
TRUSTEE
Began serving: April 2006 | Principal Occupations: Director or Trustee of the Federated Fund Complex; formerly, Vice Chancellor and President, Saint Vincent College.
Other Directorships Held: Trustee, Saint Vincent College; Alleghany Corporation.
Previous Positions: Chairman, President and Chief Executive Officer, Armco, Inc.; President and Chief Executive Officer, Cyclops Industries; President and Chief Operating Officer, Kaiser Steel Corporation. |
OFFICERS
Name
Birth Date
Address
Positions Held with Trust
Date Service Began | Principal Occupation(s) for Past Five Years
and Previous Position(s) |
John W. McGonigle
Birth Date: October 26, 1938
EXECUTIVE VICE PRESIDENT AND SECRETARY
Began serving: April 1984 | Principal Occupations: Executive Vice President and Secretary of the Federated Fund Complex; Vice Chairman, Executive Vice President, Secretary and Director, Federated Investors, Inc.
Previous Positions: Trustee, Federated Investment Management Company and Federated Investment Counseling; Director, Federated Global Investment Management Corp., Federated Services Company and Federated Securities Corp. |
Richard A. Novak
Birth Date: December 25, 1963
TREASURER
Began serving: January 2006 | Principal Occupations: Principal Financial Officer and Treasurer of the Federated Fund Complex; Senior Vice President, Federated Administrative Services; Financial and Operations Principal for Federated Securities Corp., Edgewood Services, Inc. and Southpointe Distribution Services, Inc.
Previous Positions: Controller of Federated Investors, Inc.; Vice President, Finance of Federated Services Company; held various financial management positions within The Mercy Hospital of Pittsburgh; Auditor, Arthur Andersen & Co. |
Richard B. Fisher
Birth Date: May 17, 1923
VICE CHAIRMAN
Began serving: April 1984 | Principal Occupations: Vice Chairman or Vice President of some of the Funds in the Federated Fund Complex; Vice Chairman, Federated Investors, Inc.; Chairman, Federated Securities Corp.
Previous Positions: President and Director or Trustee of some of the Funds in the Federated Fund Complex; Executive Vice President, Federated Investors, Inc.; Director and Chief Executive Officer, Federated Securities Corp. |
Annual Shareholder Report45
Name
Birth Date
Address
Positions Held with Trust
Date Service Began | Principal Occupation(s) for Past Five Years
and Previous Position(s) |
Brian P. Bouda
Birth Date: February 28, 1947
CHIEF COMPLIANCE OFFICER AND SENIOR VICE PRESIDENT
Began serving: August 2004 | Principal Occupations: Senior Vice President and Chief Compliance Officer of the Federated Fund Complex; Vice President and Chief Compliance Officer of Federated Investors, Inc. and Chief Compliance Officer of its subsidiaries. Mr. Bouda joined Federated in 1999 and is a member of the American Bar Association and the State Bar Association of Wisconsin. |
Stephen F. Auth
Birth Date: September 3, 1956
450 Lexington Avenue
Suite 3700
New York, NY 10017-3943
CHIEF INVESTMENT OFFICER
Began serving: November 2002 | Principal Occupations: Mr. Auth is Chief Investment Officer of this Fund and various other Funds in the Federated Fund Complex; Executive Vice President, Federated Investment Counseling, Federated Global Investment Management Corp. and Federated Equity Management Company of Pennsylvania.
Previous Positions: Executive Vice President, Federated Investment Management Company, and Passport Research, Ltd. (investment advisory subsidiary of Federated); Senior Vice President, Global Portfolio Management Services Division; Senior Vice President, Federated Investment Management Company and Passport Research, Ltd.; Senior Managing Director and Portfolio Manager, Prudential Investments. |
Lawrence Auriana
Birth Date: January 8, 1944
140 East 45th Street
New York, NY 10017
VICE PRESIDENT
Began serving: November 2001 | Principal Occupations: Lawrence Auriana is Vice President of the Trust. Mr. Auriana joined Federated in April 2001 as Co-Head of Investments/Federated Kaufmann. From August 1984 to April 2001, Mr. Auriana was President and Treasurer of Edgemont Asset Management Corp., and Chairman of the Board and Portfolio Manager to The Kaufmann Fund, Inc. (predecessor to the Federated Kaufmann Fund). Mr. Auriana earned a B.S. in economics from Fordham University and has been engaged in the securities business since 1965. |
Walter C. Bean
Birth Date: June 22, 1945
VICE PRESIDENT
Began serving: November 2006 | Principal Occupations: Walter C. Bean is Vice President of the Trust. Mr. Bean is a Senior Vice President, Senior Portfolio Manager and Director of Investments for Managed Accounts. Mr. Bean joined Federated in 2000. Mr. Bean is responsible for the investment process for the managed accounts portfolios. His previous associations included: Chief Investment Officer and Portfolio Manager at C.S. McKee & Company; various investment management and research positions with First Chicago Investment Advisors, CIGNA Investment Advisors and Mellon Bank. Mr. Bean is a Chartered Financial Analyst. Mr. Bean earned a Bachelors Degree in Business Administration from Ohio University and an M.B.A. from Pennsylvania State University. Mr. Bean has 35 years of investment experience. |
Hans P. Utsch
Birth Date: July 3, 1936
140 East 45th Street
New York, NY 10017
VICE PRESIDENT
Began serving: November 2001 | Principal Occupations: Hans P. Utsch is Vice President of the Trust. Mr. Utsch joined Federated in April 2001 as Co-Head of Investments/Federated Kaufmann. From August 1984 to April 2001, Mr. Utsch was Chairman of the Board and Secretary of Edgemont Asset Management Corp., and President and Portfolio Manager to The Kaufmann Fund, Inc. (predecessor to the Federated Kaufmann Fund). Mr. Utsch graduated from Amherst College and holds an M.B.A. from Columbia University. He has been engaged in the securities business since 1962. |
Annual Shareholder Report46
Evaluation and Approval of Advisory
Contract - May 2009
Federated Clover Value Fund (the “Fund”)
The Fund's Board reviewed the Fund's investment advisory contract at meetings held in May 2009. Because the Fund did not yet have a meaningful operating history, the Board's decision to approve the contract reflects the exercise of its business judgment on whether to authorize the continued offering of this new investment vehicle, as originally proposed by, and based on information previously requested by the Board and provided by the Federated organization, and based on Federated's recommendation to go forward with the Fund.
Federated proposed the creation of the Fund in connection with its acquisition of certain assets of Clover Capital Management, Inc. (“Clover Capital”), the investment adviser to the Clover Capital Multi Cap Value Equity Common Fund (the “Predecessor Fund”), a privately offered pooled fund (the “Acquisition”). As part of the transaction, Federated proposed that the Predecessor Fund be reorganized with and into the Fund in a tax-free asset transfer which would provide shareholders of the Predecessor Fund the opportunity to become shareholders of a registered mutual fund with similar investment objectives and policies and the same key management personnel as the Predecessor Fund, but with sales, distribution and other fund and shareholder services provided by the same affiliates of Federated that provide such services to the other Federated funds. The Fund was declared effective on January 21, 2009, and the reorganization of the Predecessor Fund with and into the Fund was consummated after the close of business on March 13, 2009. The Fund commenced operations on March 16, 2009. Accordingly, the Board's deliberations at its May 2009 meetings were based to a significant degree on the information considered by the Board when it originally approved the contract at its November 2008 meetings.
The Federated funds' Board had previously appointed a Senior Officer, whose duties include specified responsibilities relating to the process by which advisory fees are to be charged to a Federated Fund. The Senior Officer has the authority to retain consultants, experts, or staff as may be reasonably necessary to assist in the performance of his duties, reports directly to the Board, and may be terminated only with the approval of a majority of the independent members of the Board. The Senior Officer prepared and furnished to the Board an independent, written evaluation that covered topics discussed below. The Board considered that evaluation, along with other information, in deciding to approve the proposed advisory contract.
The Board also considered the anticipated compensation and benefits to be received by the Adviser. This includes fees to be received for services provided to the Fund by other entities in the Federated organization and research services that may be received by the Adviser from brokers that execute fund trades, as well as advisory fees. The Board is also familiar with and considered judicial Annual Shareholder Report47
decisions concerning allegedly excessive investment advisory fees, which have indicated that the following factors may be relevant to an Adviser's fiduciary duty with respect to its receipt of compensation from a fund: the nature and quality of the services provided by the Adviser, including the performance of the Fund; the Adviser's cost of providing the services; the extent to which the Adviser may realize “economies of scale” as the Fund grows larger; any indirect benefits that may accrue to the Adviser and its affiliates as a result of the Adviser's relationship with the Fund; performance and expenses of comparable funds; and the extent to which the independent Board members are fully informed about all facts the Board deems relevant bearing on the Adviser's services and fees. The Board further considered management fees (including any components thereof) charged to institutional and other clients of the Adviser for what might be viewed as like services, and the cost to the Adviser and its affiliates of supplying services pursuant to the management fee agreements, excluding any intra-corporate profit and profit margins of the Adviser and its affiliates for supplying such services. The Board was aware of these factors and was guided by them in its review of the Fund's advisory contract to the extent it considered them to be appropriate and relevant, as discussed further below. The Board considered and weighed these circumstances in light of its substantial accumulated experience in working with Federated on matters relating to other Federated funds, and was assisted in its deliberations by independent legal counsel. The Board's consideration of the proposed advisory contract included review of the Senior Officer's evaluation, accompanying data and additional reports covering such matters as: the Adviser's investment philosophy, revenue, profitability, personnel and processes; investment and operating strategies; the Fund's investment objectives; the Fund's anticipated expenses (including the proposed advisory fee itself and the overall estimated expense structure of the Fund, both in absolute terms and relative to similar and/or competing funds, with due regard for contractual or voluntary expense limitations); and the nature, quality and extent of the advisory and other services to be provided to the Fund by the Adviser and its affiliates. The Board also considered the likely preferences and expectations of anticipated Fund shareholders and their relative sophistication; the continuing state of competition in the mutual fund industry and market practices; the range of comparable fees for similar funds in the mutual fund industry; the Fund's relationship to the Federated family of funds which include a comprehensive array of funds with different investment objectives, policies and strategies which are available for exchange without the incurrence of additional sales charges; compliance and audit reports concerning the Federated funds and the Federated companies that service them (including communications from regulatory agencies), as well as Federated's responses to any issues raised therein; and relevant developments in the mutual fund industry and how the Federated funds Annual Shareholder Report48
and/or Federated are responding to them. The Board's evaluation process is evolutionary. The criteria considered and the emphasis placed on relevant criteria change in recognition of changing circumstances in the mutual fund marketplace.With respect to the Fund's expenses in particular, the Board has found the use of comparisons to other mutual funds with comparable investment programs to be particularly useful, given the high degree of competition in the mutual fund business. The Board focused on comparisons with other similar mutual funds more heavily than non-mutual fund products or services because it is believed that they are more relevant. For example, other mutual funds are the products most like the Fund, they are readily available to Fund shareholders as alternative investment vehicles, and they are the type of investment vehicle in fact chosen and maintained by the Fund's anticipated investors. The range of their fees and expenses therefore appears to be a generally reliable indication of what consumers have found to be reasonable in the precise marketplace in which the Fund will compete. In this regard, the Senior Officer also reviewed Federated's fees for providing advisory services to products outside the Federated family of funds (e.g., institutional and separate accounts). He concluded that mutual funds and institutional accounts are inherently different products. Those differences included, but are not limited to, different types of targeted investors; being subject to different laws and regulations; different legal structures; different average account sizes; different associated costs; different portfolio management techniques made necessary by different cash flows; and portfolio manager time spent in review of securities pricing. The Senior Officer did not consider these fee schedules to be determinative in judging the appropriateness of mutual fund advisory contracts.
The Senior Officer reviewed information compiled by Federated, using data supplied by independent fund ranking organizations, regarding the fees charged by other mutual funds, noting his view that comparisons to fund peer groups are highly important in judging the reasonableness of proposed fees.
The Senior Officer's report produced in connection with the original approval of the advisory contract for the Fund in November 2008, noted that Clover Capital, as manager of the Predecessor Fund, generated consistently strong performance using substantially the same investment strategy to be utilized by the Fund. Because the Fund will employ the same key management personnel and investment strategy as the Predecessor Fund, the nature and quality of the management of the Fund is expected to reflect that of the Predecessor Fund. This in turn assisted the Board in reaching a conclusion that the nature, extent and quality of the Adviser's investment management services were such as to warrant the approval of the advisory contract. The Board also noted the strong performance achieved by Clover Capital as subadviser to a mutual fund and adviser to a group trust and separate managed accounts pursuing a similar investment objective.
Annual Shareholder Report49
The Board reviewed the proposed fees and other expenses of the Fund and was satisfied that the proposed overall expense structure of the Fund appeared to be appropriate. In this regard, the Senior Officer's report indicated that the proposed management fees, after projected waivers, were reasonable. The Board also concluded that the nature, quality and scope of other services to be provided to the Fund were reasonable.The Board also considered possible indirect benefits that may accrue to the Adviser and its affiliates as a result of the Acquisition. Other indirect benefits that may accrue to the Adviser and its affiliates as a result of the Adviser's relationship with the Fund are essentially impossible to apply before the Fund has experienced any meaningful operating history. Nevertheless, in connection with the Board's governance of other Federated funds, it should be noted that the Board regularly receives financial information about Federated, including reports on the compensation and benefits Federated derives from its relationships with the other Federated funds. These reports cover not only the fees under the advisory contracts, but also fees received by Federated's subsidiaries for providing other services to the Federated funds under separate contracts (e.g., for serving as the Federated funds' administrator). The reports also discuss any indirect benefit Federated may derive from its receipt of research services from brokers who execute Federated fund trades. In addition, the Board considered the fact that, in order for a fund to be competitive in the marketplace, Federated and its affiliates frequently waive fees and/or reimburse expenses and have disclosed to fund investors and/or indicated to the Board their intention to do so in the future, where appropriate.
The Senior Officer commented on reports furnished by Federated of estimates of components of the Fund's expenses using allocation methodologies specified by the Senior Officer and sales projections made by Federated. The Senior Officer noted that, although they may apply consistent allocation processes, the inherent difficulties in allocating costs (and the unavoidable arbitrary aspects of that exercise), particularly when projecting an uncertain asset base, and the lack of consensus on how to allocate those costs may render such allocation reports unreliable. The Senior Officer determined that such allocation reports were of limited use.
The Board and the Senior Officer also reviewed data compiled by Federated comparing profitability information for Federated to other publicly held fund management companies. In this regard, the Senior Officer noted the limited availability of such information, but nonetheless concluded that Federated's profit margins did not appear to be excessive and the Board agreed.
The Senior Officer's evaluation also discussed the notion of possible realization of “economies of scale” as a fund grows larger. The Board considered in this regard that the Adviser has made significant and long-term investments in areas that support all of the Federated funds, such as personnel and processes for the portfolio management, compliance, and risk management functions; and systems technology; and that the benefits of these efforts (as well as any Annual Shareholder Report50
economies, should they exist) were likely to be enjoyed by the fund complex as a whole. Finally, the Board also noted the absence of any applicable regulatory or industry guidelines on this subject, which (as discussed in the Senior Officer's evaluation) is compounded by the lack of any common industry practice or general pattern with respect to structuring fund advisory fees with “breakpoints” that serve to reduce the fee as the fund attains a certain size. The Senior Officer did not recommend institution of breakpoints in pricing Federated's proposed advisory services to the Fund at this time.The Board based its decision to approve the proposed advisory contract on the totality of the circumstances and relevant factors, and with a view to past and future long-term considerations. As noted, not all of the factors and considerations identified above were necessarily relevant to the Fund, nor did the Board consider any one of them to be determinative. With respect to the factors that are relevant, the Board's decision to approve the contract reflects its determination that, based upon the information previously requested and supplied, Federated's proposal to establish and manage the Fund, and its past performance and actions in providing services to other mutual funds (which the Board has found to be satisfactory with respect to such other funds), provide a satisfactory basis to support the business decision to continue the existing arrangements.
Annual Shareholder Report51
Voting Proxies on Fund Portfolio SecuritiesA description of the policies and procedures that the Fund uses to determine how to vote proxies, if any, relating to securities held in the Fund's portfolio is available, without charge and upon request, by calling 1-800-341-7400. A report on “Form N-PX” of how the Fund voted any such proxies during the most recent 12-month period ended June 30 is available from Federated's Web site at FederatedInvestors.com. To access this information from the “Products” section of the Web site, click on the “Prospectuses and Regulatory Reports” link under “Related Information,” then select the appropriate link opposite the name of the Fund; or select the name of the Fund and from the Fund's page, click on the “Prospectuses and Regulatory Reports” link. Form N-PX filings are also available at the SEC's Web site at www.sec.gov.
Quarterly Portfolio Schedule
The Fund files with the SEC a complete schedule of its portfolio holdings, as of the close of the first and third quarters of its fiscal year, on “Form N-Q.” These filings are available on the SEC's Web site at www.sec.gov and may be reviewed and copied at the SEC's Public Reference Room in Washington, DC. (Call 1-800-SEC-0330 for information on the operation of the Public Reference Room.) You may also access this information from the “Products” section of Federated's Web site at FederatedInvestors.com by clicking on “Portfolio Holdings” under “Related Information,” then selecting the appropriate link opposite the name of the Fund; or select the name of the Fund and from the Fund's page, click on the “Portfolio Holdings” link.
Annual Shareholder Report52
Mutual funds are not bank deposits or obligations, are not guaranteed by any bank and are not insured or guaranteed by the U.S. government, the Federal Deposit Insurance Corporation, the Federal Reserve Board or any other government agency. Investment in mutual funds involves investment risk, including the possible loss of principal.
This Report is authorized for distribution to prospective investors only when preceded or accompanied by the Fund's Prospectus, which contains facts concerning its objective and policies, management fees, expenses and other information.
Federated Clover Value Fund
Federated Investors Funds
4000 Ericsson Drive
Warrendale, PA 15086-7561
Contact us at FederatedInvestors.com
or call 1-800-341-7400.
Federated Securities Corp., Distributor
Cusip 314172255
Cusip 314172248
Cusip 314172230
Cusip 314172222
41200 (11/09)
Federated is a registered mark of Federated Investors, Inc.
2009 Federated Investors, Inc.
Federated Clover Value Fund
(Successor to the Touchstone Value Opportunities Fund Established 1991)
A Portfolio of Federated Equity Funds
ANNUAL SHAREHOLDER REPORTSeptember 30, 2009
Institutional Shares
FINANCIAL HIGHLIGHTS
SHAREHOLDER EXPENSE EXAMPLE
MANAGEMENT'S DISCUSSION OF FUND PERFORMANCE
PORTFOLIO OF INVESTMENTS SUMMARY TABLE
PORTFOLIO OF INVESTMENTS
STATEMENT OF ASSETS AND LIABILITIES
STATEMENT OF OPERATIONS
STATEMENT OF CHANGES IN NET ASSETS
NOTES TO FINANCIAL STATEMENTS
REPORT OF INDEPENDENT REGISTERED PUBLIC ACCOUNTING FIRM
BOARD OF TRUSTEES AND TRUST OFFICERS
EVALUATION AND APPROVAL OF ADVISORY CONTRACT
VOTING PROXIES ON FUND PORTFOLIO SECURITIES
QUARTERLY PORTFOLIO SCHEDULE
Financial Highlights - Institutional Shares
(For a Share Outstanding Throughout the Period)
| Period Ended September 30 | 20091 |
| Net Asset Value, Beginning of Period | $12.29 |
| Income From Investment Operations: | |
| Net investment income | 0.012 |
| Net realized and unrealized gain on investments | 0.33 |
| TOTAL FROM INVESTMENT OPERATIONS | 0.34 |
| Net Asset Value, End of Period | $12.63 |
| Total Return3 | 2.77% |
| Ratios to Average Net Assets: | |
| Net expenses | 0.94%4.5 |
| Net investment income | 0.54%4 |
| Expense waiver/reimbursement6 | 0.44%4 |
| Supplemental Data: | |
| Net assets, end of period (000 omitted) | $12,033 |
| Portfolio turnover | 73%7 |
| 1 | Reflects operations for the period from August 29, 2009 (deemed the date of initial investment, pursuant to a reorganization that took place on August 28, 2009) to September 30, 2009. See Note 2 to the Financial Statements. |
| 2 | Per share number has been calculated using the average shares method. |
| 3 | Based on net asset value, which does not reflect the sales charge, redemption fee or contingent deferred sales charge, if applicable. Total returns for periods of less than one year are not annualized. |
| 4 | Computed on an annualized basis. |
| 5 | The net expense ratio is calculated without reduction for fees paid indirectly for expense offset arrangements. The net expense ratio is 0.94% for the period ended September 30, 2009, after taking into account this expense reduction. |
| 6 | This expense decrease is reflected in both the net expense and the net investment income ratios shown above. |
| 7 | Portfolio turnover is calculated at the Fund level. Percentage indicated was calculated for the year ended September 30, 2009. |
- See Notes which are an integral part of the Financial Statements
Annual Shareholder Report1
Shareholder Expense Example (unaudited)
As a shareholder of the Fund, you incur ongoing costs, including management fees and to the extent applicable, distribution (12b-1) fees and/or shareholder services fees and other Fund expenses. This Example is intended to help you to understand your ongoing costs (in dollars) of investing in the Fund and to compare these costs with the ongoing costs of investing in other mutual funds. It is based on an investment of $1,000 invested at the beginning of the period and held for the entire period from April 1, 20091 to September 30, 2009.
ACTUAL EXPENSES
The first section of the table below provides information about actual account values and actual expenses. You may use the information in this section, together with the amount you invested, to estimate the expenses that you incurred over the period. Simply divide your account value by $1,000 (for example, an $8,600 account value divided by $1,000 = 8.6), then multiply the result by the number in the first section under the heading entitled “Expenses Paid During Period” to estimate the expenses attributable to your investment during this period.
HYPOTHETICAL EXAMPLE FOR COMPARISON PURPOSES
The second section of the table below provides information about hypothetical account values and hypothetical expenses based on the Fund's actual expense ratio and an assumed rate of return of 5% per year before expenses, which is not the Fund's actual return. Thus, you should not use the hypothetical account values and expenses to estimate the actual ending account balance or your expenses for the period. Rather, these figures are required to be provided to enable you to compare the ongoing costs of investing in the Fund with other funds. To do so, compare this 5% hypothetical example with the 5% hypothetical examples that appear in the shareholder reports of the other funds.
Annual Shareholder Report2
Please note that the expenses shown in the table are meant to highlight your ongoing costs only. Therefore, the second section of the table is useful in comparing ongoing costs only, and will not help you determine the relative total costs of owning different funds. | Beginning
Account Value
4/1/2009 | Ending
Account Value
9/30/2009 | Expenses Paid
During Period1 |
| Actual | $1,000 | $1,027.70 | $0.86 |
Hypothetical (assuming a 5% return
before expenses) | $1,000 | $1,020.36 | $4.76 |
| 1 | “Actual” expense information for the Fund's Institutional Shares is for the period from August 29, 2009 (deemed the date of initial investment, pursuant to a reorganization that took place on August 28, 2009) to September 30, 2009. Actual expenses are equal to the Fund's annualized net expense ratio of 0.94%, multiplied by 33/365 (to reflect the period from initial investment to September 30, 2009). “Hypothetical” expense information is presented on the basis of the full one-half-year period to enable comparison to other funds. It is based on assuming the same net expense ratio and average account value over the period, but it is multiplied by 183/365 (to reflect the full half-year period). |
Annual Shareholder Report3
Performance data quoted represents past performance which is no guarantee of future results. Investment return and principal value will fluctuate so that an investor's shares, when redeemed, may be worth more or less than their original cost. Mutual fund performance changes over time and current performance may be lower or higher than what is stated. For current to the most recent month-end performance and after-tax returns, visit FederatedInvestors.com or call 1-800-341-7400.
Management's Discussion of Fund
Performance (unaudited)
For the fiscal year ended September 30, 2009, the Federated Clover Value Fund1 Institutional Shares produced a return, based on net asset value, of -8.96%. Over the same period, the Fund's benchmark, the Russell 1000® Value Index2 returned - -10.62%. The Fund's total return for the fiscal year reflected actual cash flows, transaction costs and other expenses which were not reflected in the total return of the Russell 1000® Value Index.
market overview
The first half of the Fund's fiscal year was characterized by extreme downside volatility related to the financial and housing industry crises. A deleveraging consumer, high unemployment and concerns regarding the impact of the government's stimulus programs on the value of the dollar weighed heavily on investor sentiment. During this period, the broad market, as measured by the Standard & Poor's 500 Index (S&P 500),3 declined approximately 40%. The second half of the fiscal year was characterized by “less worse and, maybe, slightly better” economic reports which were labeled as “green shoots” by the press. Despite lingering economic woes, the ever-forward-looking stock market took its cue accordingly in anticipation of stabilization in the near future. Off the March lows, the broad market staged the largest rally in decades, with the S&P 500 recording an astonishing gain of nearly 60% as of the close on September 30, 2009.
| 1 | Federated Clover Value Fund is the successor to Touchstone Value Opportunities Fund, a portfolio of Touchstone Funds Group Trust, pursuant to a reorganization that took place as of the close of business on August 28, 2009. The Fund commenced operations on March 16, 2009, when the Fund became the successor to Clover Capital Multi Value Equity Common Fund, LLC, organized as a Delaware limited company only available to accredited investors. The Fund assumed the performance of the predecessor common fund. As a result of the reorganization on August 28, 2009, the Touchstone Value Opportunities Fund became the accounting survivor. Accordingly, the performance information presented above, for the periods prior to August 28, 2009, is historical information of the Touchstone Value Opportunities Fund. |
| 2 | The Russell 1000® Value Index measures the performance of the 1,000 largest of the 3,000 largest U.S.-domiciled companies (based on total market capitalization) with lower price-to-book ratios and lower forecasted growth values. The index is unmanaged and, unlike the fund, is not affected by cash flows. It is not possible to invest directly in an index. |
| 3 | The S&P 500 is an unmanaged, capitalization-weighted index of 500 stocks designed to measure performance of the broad domestic economy through changes in the aggregate market value of 500 stocks representing all major industries. The index is unmanaged and, unlike the fund, not affected by cash flows. It is not possible to invest directly in an index. |
Annual Shareholder Report4
FUND PERFORMANCE
Relative to the Russell 1000® Value Index, the Fund benefited from outperformance in the Industrials and Healthcare sectors. Successful stock selection in these sectors was at the heart of the Fund's outperformance. Stocks such as General Electric and Shaw Group paced returns in the Industrial sector, while Wyeth and Merck drove returns in the Health Care sector. Negatively impacting relative performance during the reporting period were the Financial Services and Information Technology sectors. Stocks such as Citigroup, Lincoln National and Assurant performed poorly in Financials, while TriQuint Semiconductor Inc. and Nokia Corp. detracted from performance in the Information Technology sector. The Fund was able to post positive returns in the Consumer Discretionary, Telecommunications and Materials sectors, despite these sectors having declined in the benchmark for the reporting period. Successful stock selection was the primary driver of relative returns within most of the sectors.
POSITIONING AND STRATEGY
During the reporting period, many of the fund's stock selections focused on companies with the financial strength to weather the difficult environment. The Fund's emphasis on companies with consistent cash flows and strong balance sheets is an integral part of the Adviser's investment process. Across various industries during the fiscal year, reductions in productive capacity presented opportunities for stronger companies to maintain or increase market share while weaker competitors struggled to survive.
Elevated stock price volatility during the reporting period, especially during the first half of the fiscal year, presented opportunities for the Fund to purchase companies whose long-term intrinsic value appeared to be grossly underestimated by the market. Fund management observed situations in which concerns such as bank nationalization, debt refinancing and declining consumer demand created what management believed to be attractive opportunities in several securities. Fund management's disciplined approach to evaluating these situations resulted in purchases across multiple sectors within the portfolio.
The Fund concluded the fiscal year overweighted relative to the benchmark in Consumer Discretionary, Consumer Staples and Information Technology, while being underweighted in Financial Services, Industrials and Telecommunications. The Fund's over or underweights relative to its benchmark are driven not by economic forecasts, but rather, by the analysts' view of company-specific opportunities within each sector. While the Fund's managers remain cognizant of macroeconomic factors that may affect Fund performance, the investment approach focuses instead on bottom-up, fundamental analysis that seeks to construct a well-diversified, risk-controlled portfolio.
Annual Shareholder Report5
GROWTH OF A $10,000 INVESTMENT - institutional shares1The Fund's Institutional Shares commenced operations on August 29, 2009. For the period prior to commencement of operations of Institutional Shares, the performance information shown is for the Fund's Class A Shares. The performance of Class A Shares has not been adjusted to reflect the expenses of the Institutional Shares since the Institutional Shares have a lower expense ratio than the expense ratio of the Class A Shares. The performance of Class A Shares has been adjusted to remove any voluntary waiver of Fund expenses related to the Class A Shares that may have occurred during the period prior to commencement of operations of the Institutional Shares. The graph below illustrates the hypothetical investment of $10,0002 in the Federated Clover Value Fund (Institutional Shares) (the “Fund”) from September 30, 1999 to September 30, 2009, compared to the Russell 1000® Value Index3 and the Russell 3000® Value Index.3
| Average Annual Total Returns for the Period Ended 9/30/2009 | |
| 1 Year | -8.96% |
| 5 Years | 3.39% |
| 10 Years | 6.79% |
Performance data quoted represents past performance which is no guarantee of future results. Investment return and principal value will fluctuate so that an investor's shares, when redeemed, may be worth more or less than their original cost. Mutual fund performance changes over time and current performance may be lower or higher than what is stated. For current to the most recent month-end performance and after-tax returns, visit FederatedInvestors.com or call 1-800-341-7400. Returns shown do not reflect the deduction of taxes that a shareholder would pay on Fund distributions or the redemption of Fund shares. Mutual funds are not obligations of or guaranteed by any bank and are not federally insured.
Annual Shareholder Report6
| 1 | Federated Clover Value Fund is the successor to Touchstone Value Opportunities Fund, a portfolio of Touchstone Funds Group Trust, pursuant to a reorganization that took place as of the close of business on August 28, 2009. The Fund commenced operations on March 16, 2009, when the Fund became the successor to Clover Capital Multi Value Equity Common Fund, LLC, organized as a Delaware limited company only available to accredited investors. The Fund assumed the performance of the predecessor common fund. As a result of the reorganization on August 28, 2009, the Touchstone Value Opportunities Fund became the accounting survivor. Accordingly, the performance information presented above, for the periods prior to August 28, 2009, is historical information for the Class A Shares of the Touchstone Value Opportunities Fund. |
| 2 | Represents a hypothetical investment of $10,000 in the Fund. The Fund's performance assumes the reinvestment of all dividends and distributions. The Russell 1000® Value Index and the Russell 3000® Value Index have been adjusted to reflect reinvestment of dividends on securities in the indexes. |
| 3 | The Russell 1000® Value Index and Russell 3000® Value Index are not adjusted to reflect sales charges, expenses or other fees that the Securities and Exchange Commission (SEC) requires to be reflected in the Fund's performance. The Russell 3000® Value Index measures the performance of those Russell 3000® Index companies with lower price-to-book ratios and lower forecasted growth values. The stocks in this index are also members of either the Russell 1000® Value or the Russell 2000® Value indexes. The indexes are unmanaged, and unlike the Fund, are not affected by cash flows. It is not possible to invest directly in an index. |
Annual Shareholder Report7
Portfolio of Investments Summary Table (unaudited)
At September 30, 2009, the Fund's sector composition1 was as follows:
| Sector Composition | Percentage of
Total Net Assets |
| Financials | 23.2% |
| Energy | 17.3% |
| Health Care | 10.9% |
| Industrials | 10.1% |
| Consumer Discretionary | 9.9% |
| Consumer Staples | 7.4% |
| Information Technology | 6.8% |
| Utilities | 5.7% |
| Materials | 4.1% |
| Telecommunication Services | 4.0% |
| Cash Equivalents2 | 0.6% |
| Other Assets and Liabilities — Net3,4 | 0.0% |
| TOTAL | 100.0% |
| 1 | Except for Cash Equivalents and Other Assets and Liabilities, sector classifications are based upon, and individual portfolio securities are assigned to, the classifications of the Global Industry Classification Standard (GICS) except that the Adviser assigns a classification to securities not classified by the GICS and to securities for which the Adviser does not have access to the classification made by the GICS. |
| 2 | Cash Equivalents include any investments in money market mutual funds and/or overnight repurchase agreements. |
| 3 | Assets, other than investments in securities, less liabilities. See Statement of Assets and Liabilities. |
| 4 | Represents less than 0.1%. |
Annual Shareholder Report8
Portfolio of Investments
September 30, 2009
|
| Shares | | | Value |
| | Common Stocks – 99.4% | |
| | Consumer Discretionary – 9.9% | |
| 799,050 | 1 | Goodyear Tire & Rubber Co. | 13,607,822 |
| 294,950 | | Home Depot, Inc. | 7,857,468 |
| 431,895 | 1 | Liberty Media Corp. | 13,436,253 |
| 2,046,500 | 1 | Liberty Media Holding Corp. | 22,450,105 |
| 587,568 | | Time Warner, Inc. | 16,910,207 |
| 358,940 | | Walt Disney Co. | 9,856,492 |
| | TOTAL | 84,118,347 |
| | Consumer Staples – 7.4% | |
| 296,880 | | CVS Caremark Corp. | 10,610,491 |
| 264,315 | | H.J. Heinz Co. | 10,506,521 |
| 296,005 | | Kraft Foods, Inc., Class A | 7,776,051 |
| 147,352 | | Lorillard, Inc. | 10,948,254 |
| 192,490 | | Procter & Gamble Co. | 11,149,021 |
| 312,130 | | Walgreen Co. | 11,695,511 |
| | TOTAL | 62,685,849 |
| | Energy – 17.3% | |
| 323,425 | | Anadarko Petroleum Corp. | 20,288,450 |
| 318,545 | | Cabot Oil & Gas Corp., Class A | 11,387,984 |
| 525,920 | | Chevron Corp. | 37,040,546 |
| 214,425 | | Devon Energy Corp. | 14,437,235 |
| 471,400 | | Exxon Mobil Corp. | 32,342,754 |
| 262,105 | | Noble Energy, Inc. | 17,288,446 |
| 397,270 | | Peabody Energy Corp. | 14,786,389 |
| | TOTAL | 147,571,804 |
| | Financials – 23.2% | |
| 399,681 | | Axis Capital Holdings Ltd. | 12,062,373 |
| 1,304,550 | | Bank of America Corp. | 22,072,986 |
| 284,630 | | Bank of New York Mellon Corp. | 8,251,424 |
| 104,770 | | Goldman Sachs Group, Inc. | 19,314,349 |
| 764,480 | | J.P. Morgan Chase & Co. | 33,499,514 |
| 694,750 | | Marsh & McLennan Cos., Inc. | 17,181,167 |
| 331,500 | | MetLife, Inc. | 12,620,205 |
| 464,975 | | Morgan Stanley | 14,358,428 |
Annual Shareholder Report9
|
| 235,471 | | Simon Property Group, Inc. | 16,348,751 |
| 613,880 | | U.S. Bancorp | 13,419,417 |
| 443,570 | | Wells Fargo & Co. | 12,499,803 |
| 898,050 | | XL Capital Ltd., Class A | 15,679,953 |
| | TOTAL | 197,308,370 |
| | Health Care – 10.9% | |
| 394,225 | | CIGNA Corp. | 11,073,780 |
| 272,500 | | Covidien PLC | 11,788,350 |
| 279,055 | | Johnson & Johnson | 16,991,659 |
| 314,065 | 1 | Merck & Co., Inc. | 9,933,876 |
| 1,170,295 | | Pfizer, Inc. | 19,368,382 |
| 255,200 | 1 | Thermo Fisher Scientific Inc. | 11,144,584 |
| 263,265 | 1 | Wellpoint, Inc. | 12,468,231 |
| | TOTAL | 92,768,862 |
| | Industrials – 10.1% | |
| 1,707,650 | | General Electric Co. | 28,039,613 |
| 344,200 | | Honeywell International, Inc. | 12,787,030 |
| 258,005 | | Raytheon Co. | 12,376,500 |
| 224,752 | | SPX Corp. | 13,770,555 |
| 427,850 | 1 | URS Corp. | 18,675,652 |
| | TOTAL | 85,649,350 |
| | Information Technology – 6.8% | |
| 748,525 | | Corning, Inc. | 11,459,918 |
| 872,130 | 1 | EMC Corp. | 14,861,095 |
| 488,455 | | Intel Corp. | 9,559,064 |
| 728,030 | | Nokia Oyj, Class A, ADR | 10,643,799 |
| 664,905 | 1 | Symantec Corp. | 10,950,985 |
| | TOTAL | 57,474,861 |
| | Materials – 4.1% | |
| 274,175 | | Du Pont (E.I.) de Nemours & Co. | 8,811,985 |
| 162,975 | | Potash Corp. of Saskatchewan, Inc. | 14,723,161 |
| 69,250 | | Rio Tinto PLC, ADR | 11,792,583 |
| | TOTAL | 35,327,729 |
| | Telecommunication Services – 4.0% | |
| 770,205 | | AT&T, Inc. | 20,803,237 |
| 442,782 | | Verizon Communications, Inc. | 13,403,011 |
| | TOTAL | 34,206,248 |
Annual Shareholder Report10
|
| | Utilities – 5.7% | |
| 388,935 | | DPL, Inc. | 10,151,204 |
| 408,365 | | Exelon Corp. | 20,263,071 |
| 369,133 | | National Fuel Gas Co. | 16,909,983 |
| | TOTAL | 47,324,258 |
| | TOTAL COMMON STOCKS
(IDENTIFIED COST $860,037,883) | 844,435,678 |
| | Mutual Fund – 0.6% | |
| 5,264,453 | 2,3 | Prime Value Obligations Fund, Institutional Shares, 0.30%
(AT NET ASSET VALUE) | 5,264,453 |
| | TOTAL INVESTMENTS — 100.0%
(IDENTIFIED COST $865,302,336)4 | 849,700,131 |
| | OTHER ASSETS AND LIABILITIES - NET — 0.0%5 | 360,455 |
| | TOTAL NET ASSETS — 100% | $850,060,586 |
| 1 | Non-income producing security. |
| 2 | Affiliated company. |
| 3 | 7-Day net yield. |
| 4 | The cost of investments for federal tax purposes amounts to $869,437,645. |
| 5 | Assets, other than investments in securities, less liabilities. See Statement of Assets and Liabilities. |
- Note: The categories of investments are shown as a percentage of total net assets at September 30, 2009.
- Various inputs are used in determining the value of the Fund's investments. These inputs are summarized in the three broad levels listed below:
- Level 1 — quoted prices in active markets for identical securities
- Level 2 — other significant observable inputs (including quoted prices for similar securities, interest rates, prepayment speeds, credit risk, etc.)
- Level 3 — significant unobservable inputs (including the Fund's own assumptions in determining the fair value of investments)
- The inputs or methodology used for valuing securities are not an indication of the risk associated with investing in those securities.
Annual Shareholder Report11
- The following is a summary of the inputs used, as of September 30, 2009, in valuing the Fund's assets carried at fair value:
| Valuation Inputs | | | | |
| Level 1 -
Quoted
Prices and
Investments in
Mutual Funds | Level 2 -
Other
Significant
Observable
Inputs | Level 3 -
Significant
Unobservable
Inputs | Total |
| Equity Securities: | | | | |
| Domestic | $767,745,460 | $ — | $ — | $767,745,460 |
| International | 76,690,218 | — | — | 76,690,218 |
| Mutual Fund | 5,264,453 | — | — | 5,264,453 |
| TOTAL SECURITIES | $849,700,131 | $ — | $ — | $849,700,131 |
- The following acronym is used throughout this portfolio:
- ADR — American Depositary Receipt
- See Notes which are an integral part of the Financial Statements.
Annual Shareholder Report12
Statement of Assets and Liabilities
September 30, 2009
| Assets: | | |
| Total investments in securities, at value including $5,264,453 of investments in an affiliated issuer (Note 6) (identified cost $865,302,336) | | $849,700,131 |
| Income receivable | | 1,393,112 |
| Receivable for investments sold | | 28,984,100 |
| Receivable for shares sold | | 392,043 |
| TOTAL ASSETS | | 880,469,386 |
| Liabilities: | | |
| Payable for investments purchased | $28,278,381 | |
| Payable for shares redeemed | 1,690,891 | |
| Bank overdraft | 4,569 | |
| Payable for investment adviser fee (Note 6) | 87,865 | |
| Payable for distribution services fee (Note 6) | 26,049 | |
| Payable for shareholder services fee (Note 6) | 77,642 | |
| Accrued expenses | 243,403 | |
| TOTAL LIABILITIES | | 30,408,800 |
| Net assets for 67,414,014 shares outstanding | | $850,060,586 |
| Net Assets Consist of: | | |
| Paid-in capital | | $1,374,249,348 |
| Net unrealized depreciation of investments | | (15,602,205) |
| Accumulated net realized loss on investments | | (508,680,816) |
| Undistributed net investment income | | 94,259 |
| TOTAL NET ASSETS | | $850,060,586 |
Annual Shareholder Report13
Statement of Assets and Liabilities — continued| Net Asset Value, Offering Price and Redemption Proceeds Per Share | | |
| Institutional Shares: | | |
Net asset value per share ($12,033,331 ÷ 952,628 shares outstanding),
no par value, unlimited shares authorized | | $12.63 |
| Offering price per share | | $12.63 |
| Redemption proceeds per share | | $12.63 |
| Class A Shares: | | |
Net asset value per share ($707,394,072 ÷ 56,091,431 shares outstanding),
no par value, unlimited shares authorized | | $12.61 |
| Offering price per share (100/94.50 of $12.61) | | $13.34 |
| Redemption proceeds per share | | $12.61 |
| Class B Shares: | | |
Net asset value per share ($79,163,713 ÷ 6,288,538 shares outstanding),
no par value, unlimited shares authorized | | $12.59 |
| Offering price per share | | $12.59 |
| Redemption proceeds per share (94.50/100 of $12.59) | | $11.90 |
| Class C Shares: | | |
Net asset value per share ($39,007,045 ÷ 3,093,848 shares outstanding),
no par value, unlimited shares authorized | | $12.61 |
| Offering price per share | | $12.61 |
| Redemption proceeds per share (99.00/100 of $12.61) | | $12.48 |
| Class K Shares: | | |
Net asset value per share ($12,462,425 ÷ 987,569 shares outstanding),
no par value, unlimited shares authorized | | $12.62 |
| Offering price per share | | $12.62 |
| Redemption proceeds per share | | $12.62 |
- See Notes which are an integral part of the Financial Statements
Annual Shareholder Report14
Statement of Operations
Year Ended September 30, 2009
| Investment Income: | | | |
| Dividends (including $67,151 received from affiliated issuers (Note 6) and net of foreign taxes withheld of $843) | | | $4,445,633 |
| Interest (including income on securities loaned of $132,451) (Note 3) | | | 142,414 |
| TOTAL INCOME | | | 4,588,047 |
| Expenses: | | | |
| Investment adviser fee (Note 6) | | $1,191,831 | |
| Administrative personnel and services fee (Note 6) | | 282,857 | |
| Custodian fees | | 15,891 | |
| Transfer and dividend disbursing agent fees and expenses — Institutional Shares | | 915 | |
| Transfer and dividend disbursing agent fees and expenses — Class A Shares | | 238,000 | |
| Transfer and dividend disbursing agent fees and expenses — Class B Shares | | 9,076 | |
| Transfer and dividend disbursing agent fees and expenses — Class C Shares | | 11,376 | |
| Transfer and dividend disbursing agent fees and expenses — Class K Shares | | 1,732 | |
| Directors'/Trustees' fees | | 7,254 | |
| Auditing fees | | 10,641 | |
| Legal fees | | 20,504 | |
| Portfolio accounting fees | | 32,286 | |
| Distribution services fee — Class A Shares (Note 6) | | 20,883 | |
| Distribution services fee — Class B Shares (Note 6) | | 15,372 | |
| Distribution services fee — Class C Shares (Note 6) | | 43,353 | |
| Distribution services fee — Class K Shares (Note 6) | | 1,553 | |
| Shareholder services fee — Class A Shares (Note 6) | | 179,071 | |
| Shareholder services fee — Class B Shares (Note 6) | | 5,124 | |
| Shareholder services fee — Class C Shares (Note 6) | | 3,072 | |
| Share registration costs | | 154,949 | |
| Printing and postage | | 34,468 | |
| Insurance premiums | | 1,727 | |
| Miscellaneous | | 23,899 | |
| TOTAL EXPENSES | | 2,305,834 | |
Annual Shareholder Report15
Statement of Operations — continued| Waivers, Reimbursements and Expense Reduction: | | | |
| Waiver/reimbursement of investment adviser fee (Note 6) | $(151,960) | | |
| Waiver of administrative personnel and services fee (Note 6) | (174,933) | | |
| Reimbursement of shareholder services fee — Class B Shares (Note 6) | (325) | | |
| Reimbursement of transfer and dividend disbursing agent fees and expenses — Class A Shares | (13,888) | | |
| Reimbursement of transfer and dividend disbursing agent fees and expenses — Class B Shares | (2,665) | | |
| Reimbursement of transfer and dividend disbursing agent fees and expenses — Class C Shares | (1,106) | | |
| Fees paid indirectly from directed brokerage arrangements (Note 7) | (246) | | |
| TOTAL WAIVERS, REIMBURSEMENTS AND EXPENSE REDUCTION | | $(345,123) | |
| Net expenses | | | $1,960,711 |
| Net investment income | | | 2,627,336 |
Realized and Unrealized Gain (Loss)
on Investments: | | | |
| Net realized loss on investments | | | (44,452,076) |
| Net change in unrealized depreciation of investments | | | 15,196,239 |
| Net realized and unrealized loss on investments | | | (29,255,837) |
| Change in net assets resulting from operations | | | $(26,628,501) |
- See Notes which are an integral part of the Financial Statements
Annual Shareholder Report16
Statement of Changes in Net Assets
| Year Ended September 30 | 2009 | 2008 |
| Increase (Decrease) in Net Assets | | |
| Operations: | | |
| Net investment income | $2,627,336 | $1,698,832 |
| Net realized loss on investments | (44,452,076) | (1,035,681) |
| Net change in unrealized appreciation/depreciation of investments | 15,196,239 | (31,094,111) |
| CHANGE IN NET ASSETS RESULTING FROM OPERATIONS | (26,628,501) | (30,430,960) |
| Distributions to Shareholders: | | |
| Distributions from net investment income | | |
| Class A Shares | (2,419,186) | (56,168) |
| Class C Shares | (38,355) | (10,708) |
| Class Z Shares | — | (1,663,047) |
| Distributions from net realized gain on investments | | |
| Class A Shares | — | (92,498) |
| Class C Shares | — | (51,999) |
| Class Z Shares | — | (8,553,559) |
| CHANGE IN NET ASSETS RESULTING FROM DISTRIBUTIONS TO SHAREHOLDERS | (2,457,541) | (10,427,979) |
| Share Transactions: | | |
| Proceeds from sale of shares | 68,273,280 | 132,970,316 |
| Exchange of Successor Fund shares in connection with the tax-free reorganization of Touchstone Value Opportunities Fund (Note 2) | 12,565,926 | — |
| Proceeds from shares issued in connection with the tax-free transfer of assets from Federated American Leaders Fund, Inc. (Note 2) | 679,733,197 | — |
| Net asset value of shares issued to shareholders in payment of distributions declared | 2,285,810 | 9,836,347 |
| Cost of shares redeemed | (64,567,685) | (28,898,711) |
| CHANGE IN NET ASSETS RESULTING FROM SHARE TRANSACTIONS | 698,290,528 | 113,907,952 |
| Change in net assets | 669,204,486 | 73,049,013 |
| Net Assets: | | |
| Beginning of period | 180,856,100 | 107,807,087 |
| End of period (including undistributed (distributions in excess of) net investment income of $94,259 and $(50,745), respectively) | $850,060,586 | $180,856,100 |
- See Notes which are an integral part of the Financial Statements
Annual Shareholder Report17
Notes to Financial Statements
September 30, 2009
1. ORGANIZATION
Federated Equity Funds (the “Trust”) is registered under the Investment Company Act of 1940, as amended (the “Act”), as an open-end management investment company. The Trust consists of 13 diversified portfolios. The financial statements included herein are only those of Federated Clover Value Fund (the “Fund”). The financial statements of the other portfolios are presented separately. The assets of each portfolio are segregated and a shareholder's interest is limited to the portfolio in which shares are held. Each portfolio pays its own expenses. The Fund offers five classes of shares: Institutional Shares, Class A Shares, Class B Shares, Class C Shares and Class K Shares. All shares of the Fund have equal rights with respect to voting, except on class-specific matters. The financial highlights of the Class A Shares, Class B Shares, Class C Shares and Class K Shares are presented separately. The investment objective of the Fund is to seek long-term capital appreciation.
2. REORGANIZATION
The Fund is the successor (Successor Fund) to Touchstone Value Opportunities Fund (the “Predecessor Fund”), a portfolio of Touchstone Funds Group Trust, pursuant to a reorganization that took place as of the close of business on August 28, 2009. On that date, Class A Shares, Class C Shares and Class Z Shares of the Predecessor Fund were exchanged for Class A Shares, Class C Shares and Class A Shares of the Fund, respectively. As a result of the reorganization on August 28, 2009, the Predecessor Fund became the accounting survivor. Accordingly, the performance information presented in the financial statements for the periods prior to August 28, 2009, is historical information of the Predecessor Fund.
On August 28, 2009, the Fund received a tax-free transfer of assets from Touchstone Value Opportunities Fund, as follows:
Shares of
the Fund
Issued | Touchstone
Value
Opportunities
Fund
Net Assets
Received | Unrealized
Appreciation1 | Net Assets
of the Fund
Immediately
Prior to
Combination | Net Assets
of the Fund
Immediately
After
Combination |
| 13,258,411 | $162,851,244 | $2,221,563 | $12,565,926 | $175,417,170 |
| 1 | Unrealized appreciation is included in the Touchstone Value Opportunities Fund Net Assets Received amount shown above. |
On the date of the reorganization, the Successor Fund's net assets included $2,119,296 of net unrealized appreciation.
Annual Shareholder Report18
On September 18, 2009, the Fund received a tax-free transfer of assets from Federated American Leaders Fund, Inc., as follows:Shares of
the Fund
Issued | Federated
American Leaders
Fund, Inc.
Net Assets
Received | Unrealized
Depreciation1 | Net Assets
of the Fund
Immediately
Prior to
Combination | Net Assets
of the Fund
Immediately
After
Combination |
| 52,783,178 | $679,733,197 | $(16,944,166) | $193,844,924 | $873,578,121 |
| 1 | Unrealized depreciation is included in the Federated American Leaders Fund, Inc. Net Assets Received amount shown above. |
3. SIGNIFICANT ACCOUNTING POLICIES
The following is a summary of significant accounting policies consistently followed by the Fund in the preparation of its financial statements. These policies are in conformity with U.S. generally accepted accounting principles (GAAP).
Investment Valuation
In calculating its net asset value (NAV), the Fund generally values investments as follows:
- Equity securities listed on an exchange or traded through a regulated market system are valued at their last reported sale price or official closing price in their principal exchange or market.
- Fixed-income securities acquired with remaining maturities greater than 60 days are fair valued using price evaluations provided by a pricing service approved by the Board of Trustees (the “Trustees”).
- Fixed-income securities acquired with remaining maturities of 60 days or less are valued at their cost (adjusted for the accretion of any discount or amortization of any premium).
- Shares of other mutual funds are valued based upon their reported NAVs.
- Derivative contracts listed on exchanges are valued at their reported settlement or closing price.
- Over-the-counter (OTC) derivative contracts are fair valued using price evaluations provided by a pricing service approved by the Trustees.
If the Fund cannot obtain a price or price evaluation from a pricing service for an investment, the Fund may attempt to value the investment based upon the mean of bid and asked quotations or fair value the investment based on price evaluations, from one or more dealers. If any price, quotation, price evaluation or other pricing source is not readily available when the NAV is calculated, the Fund uses the fair value of the investment determined in accordance with the procedures described below. There can be no assurance that the Fund could purchase or sell an investment at the price used to calculate the Fund's NAV.
Fair Valuation and Significant Events Procedures
The Trustees have authorized the use of pricing services to provide evaluations of the current fair value of certain investments for purposes of calculating the NAV. Factors considered by pricing services in evaluating an investment include the yields or prices of investments of comparable quality, coupon, maturity, call rights and other potential prepayments, terms and type, reported transactions, indications as to values from dealers and general market conditions. Some pricing services provide a single price evaluation reflecting the bid-side of the market for an investment (a “bid” evaluation). Other pricing services offer both bid evaluations and price evaluations indicative of a price between the prices bid and asked for the investment (a “mid” evaluation). The Fund normally uses bid evaluations for U.S. Treasury Annual Shareholder Report19
and Agency securities, mortgage-backed securities and municipal securities. The Fund normally uses mid evaluations for other types of fixed-income securities and OTC derivative contracts. In the event that market quotations and price evaluations are not available for an investment, the fair value of the investment is determined in accordance with procedures adopted by the Trustees.The Trustees also have adopted procedures requiring an investment to be priced at its fair value whenever the Adviser determines that a significant event affecting the value of the investment has occurred between the time as of which the price of the investment would otherwise be determined and the time as of which the NAV is computed. An event is considered significant if there is both an affirmative expectation that the investment's value will change in response to the event and a reasonable basis for quantifying the resulting change in value. Examples of significant events that may occur after the close of the principal market on which a security is traded, or after the time of a price evaluation provided by a pricing service or a dealer, include:
- With respect to securities traded in foreign markets, significant trends in U.S. equity markets or in the trading of foreign securities index futures or options contracts;
- With respect to price evaluations of fixed-income securities determined before the close of regular trading on the NYSE, actions by the Federal Reserve Open Market Committee and other significant trends in U.S. fixed-income markets;
- Political or other developments affecting the economy or markets in which an issuer conducts its operations or its securities are traded; and
- Announcements concerning matters such as acquisitions, recapitalizations, litigation developments, a natural disaster affecting the issuer's operations or regulatory changes or market developments affecting the issuer's industry.
The Trustees have approved the use of a pricing service to determine the fair value of equity securities traded principally in foreign markets when the Adviser determines that there has been a significant trend in the U.S. equity markets or in index futures trading. For other significant events, the Fund may seek to obtain more current quotations or price evaluations from alternative pricing sources. If a reliable alternative pricing source is not available, the Fund will determine the fair value of the investment using another method approved by the Trustees.
Investment Income, Gains and Losses, Expenses and Distributions
Investment transactions are accounted for on a trade-date basis. Realized gains and losses from investment transactions are recorded on an identified-cost basis. Interest income and expenses are accrued daily. Dividend income and distributions to shareholders are recorded on the ex-dividend date. Foreign dividends are recorded on the ex-dividend date or when the Fund is informed of the ex-dividend date. Distributions of net investment income are declared and paid quarterly. Non-cash dividends included in dividend income, if any, are recorded at fair value. Investment income, realized and unrealized gains and losses and certain fund-level expenses are allocated to each class based on relative average daily net assets, except that Institutional Shares, Class A Shares, Class B Shares, Class C Shares and Class K Shares may bear distribution services fees, shareholder services fees and certain transfer and dividend disbursing agent fees unique to those classes. Dividends are declared separately for each class. No class has preferential dividend rights; differences in per share dividend rates are generally due to differences in separate class expenses.
Annual Shareholder Report20
Premium and Discount AmortizationAll premiums and discounts on fixed-income securities are amortized/accreted for financial statement purposes.
Federal Taxes
It is the Fund's policy to comply with the Subchapter M provision of the Internal Revenue Code (the “Code”) and to distribute to shareholders each year substantially all of its income. Accordingly, no provision for federal income tax is necessary. As of and during the year ended September 30, 2009, the Fund did not have a liability for any uncertain tax positions. The Fund recognizes interest and penalties, if any, related to tax liabilities as income tax expense in the Statement of Operations. As of September 30, 2009, tax year 2009 remains subject to examination by the Fund's major tax jurisdictions, which include the United States of America and the Commonwealth of Massachusetts.
The Fund may be subject to taxes imposed by governments of countries in which it invests. Such taxes are generally based on either income or gains earned or repatriated. The Fund accrues and applies such taxes to net investment income, net realized gains and net unrealized gains as income and/or gains are earned.
When-Issued and Delayed Delivery Transactions
The Fund may engage in when-issued or delayed delivery transactions. The Fund records when-issued securities on the trade date and maintains security positions such that sufficient liquid assets will be available to make payment for the securities purchased. Securities purchased on a when-issued or delayed delivery basis are marked to market daily and begin earning interest on the settlement date. Losses may occur on these transactions due to changes in market conditions or the failure of counterparties to perform under the contract.
Securities Lending
The Fund participates in a securities lending program providing for the lending of equity securities to qualified brokers. The Fund normally receives cash collateral for securities loaned that is invested in an affiliated money market fund or in short-term securities including repurchase agreements. Collateral is maintained at a minimum level of 100% of the market value of investments loaned, plus interest, if applicable. In accordance with the Fund's securities lending agreement, the market value of securities on loan is determined each day at the close of business and any additional collateral required to cover the value of securities on loan is delivered to the Fund on the next business day. Earnings on collateral are allocated between the securities lending agent, as a fee for its services under the program, and the Fund, according to agreed-upon rates.
Other
The preparation of financial statements in conformity with GAAP requires management to make estimates and assumptions that affect the amounts of assets, liabilities, expenses and revenues reported in the financial statements. Actual results could differ from those estimated.
Annual Shareholder Report21
4. SHARES OF BENEFICIAL INTERESTThe following tables summarize share activity:
| Period Ended
9/30/20091 | Year Ended
9/30/2008 |
| Institutional Shares: | Shares | Amount | Shares | Amount |
| Shares sold | 46,315 | $574,933 | — | $ — |
| Exchange of Successor Fund shares in connection with the tax-free reorganization of Touchstone Value Opportunities Fund | 908,665 | 11,171,864 | — | — |
| Shares issued to shareholders in payment of distributions declared | — | — | — | — |
| Shares redeemed | (2,352) | (28,168) | — | — |
NET CHANGE RESULTING
FROM INSTITUTIONAL SHARE TRANSACTIONS | 952,628 | $11,718,629 | — | $ — |
| Year Ended
9/30/2009 | Year Ended
9/30/2008 |
| Class A Shares: | Shares | Amount | Shares | Amount |
| Shares sold | 1,754,894 | $19,558,947 | 675,272 | $10,517,094 |
| Transfer in of Class Z Shares2 | 12,596,617 | 182,078,468 | | |
| Exchange of Successor Fund shares in connection with the tax-free reorganization of Touchstone Value Opportunities Fund | 76,192 | 935,852 | — | — |
| Proceeds from shares issued in connection with the tax-free transfer of assets from Federated American Leaders Fund, Inc. | 42,830,686 | 551,659,234 | — | — |
| Shares issued to shareholders in payment of distributions declared | 16,760 | 179,185 | 9,547 | 147,326 |
| Adjustment of Predecessor Fund shares in connection with tax-free reorganization | (637,282) | — | — | — |
| Shares redeemed | (1,157,857) | (13,324,756) | (99,826) | (1,512,627) |
NET CHANGE RESULTING
FROM CLASS A SHARE TRANSACTIONS | 55,480,010 | $741,086,930 | 584,993 | $9,151,793 |
Annual Shareholder Report22
| Period Ended
9/30/20091 | Year Ended
9/30/2008 |
| Class B Shares: | Shares | Amount | Shares | Amount |
| Shares sold | 112,935 | $1,393,248 | — | $ — |
| Exchange of Successor Fund shares in connection with the tax-free reorganization of Touchstone Value Opportunities Fund | 34,767 | 426,380 | — | — |
| Proceeds from shares issued in connection with the tax-free transfer of assets from Federated American Leaders Fund, Inc. | 6,195,909 | 79,679,394 | — | — |
| Shares issued to shareholders in payment of distributions declared | — | — | — | — |
| Shares redeemed | (55,073) | (694,836) | — | — |
NET CHANGE RESULTING
FROM CLASS B SHARE TRANSACTIONS | 6,288,538 | $80,804,186 | — | $ — |
| Year Ended
9/30/2009 | Year Ended
9/30/2008 |
| Class C Shares: | Shares | Amount | Shares | Amount |
| Shares sold | 271,399 | $2,870,136 | 276,218 | $4,244,880 |
| Exchange of Successor Fund shares in connection with the tax-free reorganization of Touchstone Value Opportunities Fund | 2,358 | 28,964 | — | — |
| Proceeds from shares issued in connection with the tax-free transfer of assets from Federated American Leaders Fund, Inc. | 2,778,973 | 35,793,174 | — | — |
| Shares issued to shareholders in payment of distributions declared | 3,374 | 36,153 | 3,269 | 51,418 |
| Adjustment of Predecessor Fund shares in connection with tax-free reorganization | (16,484) | — | — | — |
| Shares redeemed | (233,730) | (2,456,544) | (15,293) | (245,732) |
NET CHANGE RESULTING
FROM CLASS C SHARE TRANSACTIONS | 2,805,890 | $36,271,883 | 264,194 | $4,050,566 |
Annual Shareholder Report23
| Period Ended
9/30/20091 | Year Ended
9/30/2008 |
| Class K Shares: | Shares | Amount | Shares | Amount |
| Shares sold | 16,424 | $207,777 | — | $ — |
| Exchange of Successor Fund shares in connection with the tax-free reorganization of Touchstone Value Opportunities Fund | 233 | 2,866 | — | — |
| Proceeds from shares issued in connection with the tax-free transfer of assets from Federated American Leaders Fund, Inc. | 977,610 | 12,601,395 | — | — |
| Shares issued to shareholders in payment of distributions declared | — | — | — | — |
| Shares redeemed | (6,698) | (84,963) | — | — |
NET CHANGE RESULTING
FROM CLASS K SHARE TRANSACTIONS | 987,569 | $12,727,075 | — | $ — |
| Year Ended
9/30/2009 | Year Ended
9/30/2008 |
| Class Z Shares:2 | Shares | Amount | Shares | Amount |
| Shares sold | 4,420,419 | $43,668,239 | 7,691,116 | $118,208,342 |
| Shares issued to shareholders in payment of distributions declared | 200,218 | 2,070,472 | 605,666 | 9,637,603 |
| Shares redeemed | (4,574,307) | (47,978,418) | (1,742,914) | (27,140,352) |
NET CHANGE RESULTING
FROM CLASS Z SHARE TRANSACTIONS | 46,330 | $(2,239,707) | 6,553,868 | $100,705,593 |
FINAL REDEMPTION FROM
CLASS Z SHARES2 | (12,596,617) | $(182,078,468) | — | $ — |
| NET CHANGE RESULTING FROM FUND SHARE TRANSACTIONS | 53,964,348 | $698,290,528 | 7,403,055 | $113,907,952 |
| 1 | Reflects operations for the period from August 29, 2009 (deemed the date of initial investment, pursuant to a reorganization that took place on August 28, 2009) to September 30, 2009. |
| 2 | At the close of business on August 28, 2009, Class Z Shares were reorganized into Class A Shares. |
5. FEDERAL TAX INFORMATION
The timing and character of income and capital gain distributions are determined in accordance with income tax regulations, which may differ from GAAP. These differences are due to differing treatments for expiration of capital loss carryforwards, unreversed wash sales from mergers and REIT adjustments.
Annual Shareholder Report24
For the year ended September 30, 2009, permanent differences identified and reclassified among the components of net assets were as follows:| Increase (Decrease) |
| Paid-In Capital | Undistributed
Net Investment
Income (Loss) | Accumulated
Net Realized
Gain (Loss) |
| $462,746,427 | $(24,791) | $(462,721,636) |
Net investment income (loss), net realized gains (losses) and net assets were not affected by this reclassification.
The tax character of distributions as reported on the Statement of Changes in Net Assets for the years ended September 30, 2009 and 2008, was as follows:
| 2009 | 2008 |
| Ordinary income1 | $2,457,541 | $1,739,423 |
| Long-term capital gains | $ — | $8,688,556 |
| 1 | For tax purposes, short-term capital gain distributions are considered ordinary income distributions. |
As of September 30, 2009, the components of distributable earnings on a tax basis were as follows:
| Undistributed ordinary income | $80,118 |
| Net unrealized depreciation | $(19,737,514) |
| Capital loss carryforwards and deferrals | $(504,531,366) |
The difference between book-basis and tax-basis net unrealized appreciation/depreciation is attributable to differing treatments for the deferral of losses on wash sales and REIT adjustments.
At September 30, 2009, the cost of investments for federal tax purposes was $869,437,645. The net unrealized depreciation of investments for federal tax purposes was $19,737,514. This consists of net unrealized appreciation from investments for those securities having an excess of value over cost of $32,036,957 and net unrealized depreciation from investments for those securities having an excess of cost over value of $51,774,471.
At September 30, 2009, the Fund had a capital loss carryforward of $498,219,452 which will reduce the Fund's taxable income arising from future net realized gains on investments, if any, to the extent permitted by the Code and thus will reduce the amount of distributions to shareholders which would otherwise be necessary to relieve the Fund of any liability for federal income tax. Pursuant to the Code, such capital loss carryforward will expire as follows:
| Expiration Year | Expiration Amount |
| 2015 | $342,110,357 |
| 2016 | $125,794,854 |
| 2017 | $30,314,241 |
As a result of the tax-free transfer of assets from Touchstone Value Opportunities Fund and Federated American Leaders Fund, Inc., the use of certain capital loss carryforwards listed above may be limited.
Annual Shareholder Report25
Under current tax regulations, capital losses on securities transactions realized after October 31 may be deferred and treated as occurring on the first day of the following fiscal year. As of September 30, 2009, for federal income tax purposes, post October losses of $6,311,914 were deferred to October 1, 2009.6. INVESTMENT ADVISER FEE AND OTHER TRANSACTIONS WITH AFFILIATES
Investment Adviser Fee
Federated Global Investment Management Corporation is the Fund's investment adviser (the “Adviser”). The advisory agreement between the Fund and the Adviser provides for an annual fee equal to 0.75% of the Fund's average daily net assets. Subject to the terms described in the Expense Limitation note, the Adviser may voluntarily choose to waive any portion of its fee. The Adviser can modify or terminate this voluntary waiver at any time at its sole discretion. For the period from August 29, 2009 to September 30, 2009, the Adviser voluntarily waived $151,175 of its fee.
For the period from August 29, 2009 to September 30, 2009, the net fee paid to the Adviser was $90,723.
Prior to close of business on August 28, 2009, the Predecessor Fund's investment adviser was Touchstone Advisors, Inc. After the close of business on August 28, 2009, the Predecessor Fund was reorganized into the Fund. The annual rate did not change due to this reorganization. For the period from October 1, 2008 to August 28, 2009, the net fee paid to Touchstone Advisors, Inc. was $949,148.
Administrative Fee
Federated Administrative Services (FAS), under the Administrative Services Agreement, provides the Fund with administrative personnel and services. The fee paid to FAS is based on the average aggregate daily net assets of certain Federated funds as specified below:
| Administrative Fee | Average Aggregate Daily Net Assets
of the Federated Funds |
| 0.150% | on the first $5 billion |
| 0.125% | on the next $5 billion |
| 0.100% | on the next $10 billion |
| 0.075% | on assets in excess of $20 billion |
The administrative fee received during any fiscal year shall be at least $150,000 per portfolio and $40,000 per each additional class of Shares. Subject to the terms described in the Expense Limitation note, FAS may voluntarily choose to waive any portion of its fee. FAS can modify or terminate this voluntary waiver at any time at its sole discretion. The fee for the period from August 29, 2009 through September 30, 2009, is pro-rated. For the period from August 29, 2009 to September 30, 2009, the net fee paid to FAS was $21,132 and 0.066% of average daily net assets of the Fund. FAS waived $5,197 of its fee.
Prior to close of business on August 28, 2009, Touchstone Advisors, Inc. provided administrative services to the Predecessor Fund. For the period from October 1, 2008 to
August 28, 2009, the net fee paid to Touchstone Advisors, Inc. was $86,792. For the period from October 1, 2008 to August 28, 2009, Touchstone Advisors, Inc. waived $169,736 of its fee.
Annual Shareholder Report26
Distribution Services FeeThe Fund has adopted a Distribution Plan (the “Plan”) pursuant to Rule 12b-1 under the Act. Under the terms of the Plan, the Fund will compensate Federated Securities Corp. (FSC), the principal distributor, from the daily net assets of the Fund's Class A Shares, Class B Shares, Class C Shares and Class K Shares to finance activities intended to result in the sale of these shares. The Plan provides that the Fund may incur distribution expenses at the following percentages of average daily net assets annually, to compensate FSC:
| Share Class Name | Percentage of Average Daily
Net Assets of Class |
| Class A Shares | 0.05% |
| Class B Shares | 0.75% |
| Class C Shares | 0.75% |
| Class K Shares | 0.50% |
Subject to the terms described in the Expense Limitation note, FSC may voluntarily choose to waive any portion of its fee. FSC can modify or terminate this voluntary waiver at any time at its sole discretion. When FSC receives fees, it may pay some or all of them to financial intermediaries whose customers purchase shares. For the period from August 29, 2009 to September 30, 2009, FSC retained $10,771 of fees paid by the Fund.
For the period from August 29, 2009 to September 30, 2009, the net fee paid to FSC was $26,140.
Prior to close of business on August 28, 2009, Touchstone Securities, Inc. was the principal distributor for the Predecessor Fund. For the period from October 1, 2008 to August 28, 2009, the net fee paid to Touchstone Securities, Inc. was $55,021.
Sales Charges
Front-end sales charges and contingent deferred sales charges (CDSC) do not represent expenses of the Fund. They are deducted from the proceeds of sales of Fund shares prior to investment or from redemption proceeds prior to remittance, as applicable. For the period from August 29, 2009 to September 30, 2009, FSC retained $12,035 in sales charges from the sale of Class A Shares. FSC also retained $1,363 of CDSC relating to redemptions of Class C Shares.
Prior to close of business on August 28, 2009, Touchstone Securities, Inc., served as distributor of the Predecessor Fund's shares. For the period from October 1, 2008 to August 28, 2009, Touchstone Securities, Inc. retained $28,902 in sales charges from the sale of the Predecessor Fund's Class A Shares. Touchstone Securities, Inc. also retained $4,295 of CDSC relating to redemptions of the Predecessor Fund's Class C Shares.
Shareholder Services Fee
The Fund may pay fees (Service Fees) up to 0.25% of the average daily net assets of the Fund's Class A Shares, Class B Shares and Class C Shares to financial intermediaries or to Federated Shareholder Services Company (FSSC) for providing services to shareholders and maintaining shareholder accounts. Subject to the terms described in the Expense Limitation note, FSSC may voluntarily reimburse the Fund for shareholder services fees. This voluntary reimbursement can be modified or terminated at any time. For the period from August 29, 2009 to September 30, 2009, FSSC voluntarily reimbursed $325 of shareholder services fees. For the period from August 29, 2009 to September 30, 2009, FSSC did not receive any fees paid by the Fund.
Annual Shareholder Report27
For the period from August 29, 2009 to September 30, 2009, the net fee paid to financial intermediaries was $77,311.Prior to close of business on August 28, 2009, Touchstone Securities, Inc. received Service Fees from the Predecessor Fund. For the period from October 1, 2008 to August 28, 2009, the net fee paid to Touchstone Securities, Inc. was $109,631.
Expense Limitation
The Adviser and its affiliates (which may include FSC, FAS and FSSC) have voluntarily agreed to waive their fees and/or reimburse expenses so that the total operating expenses (as shown in the financial highlights) paid by the Fund's Institutional Shares, Class A Shares, Class B Shares, Class C Shares and Class K Shares (after the voluntary waivers and reimbursements) will not exceed 0.94%, 1.19%, 1.92%, 1.92% and 1.67%, respectively, through the later of (the “Termination Date”): (a) November 30, 2010; or (b) the date of the Fund's next effective Prospectus. While the Adviser and its affiliates currently do not anticipate terminating these arrangements prior to the Termination Date, these arrangements may only be terminated prior to the Termination Date with the agreement of the Fund's Board of Trustees.
General
Certain Officers and Trustees of the Fund are Officers and Directors or Trustees of the above companies.
Transactions with Affiliated Companies
Affiliated holdings are mutual funds which are managed by the Adviser or an affiliate of the Adviser. The Adviser has agreed to reimburse the Fund for certain investment adviser fees as a result of transactions in other affiliated mutual funds. For the period from August 29, 2009 to September 30, 2009, the Adviser reimbursed $785. Transactions with the affiliated company during the year ended September 30, 2009 were as follows:
| Affiliate | Balance of
Shares Held
9/30/2008 | Purchases/
Additions | Sales/
Reductions | Balance of
Shares Held
9/30/2009 | Value | Dividend
Income |
| Prime Value Obligations Fund, Institutional Shares | — | 43,279,168 | 38,014,715 | 5,264,453 | $5,264,453 | $7,018 |
In addition, prior to the close of business on August 28, 2009, the Predecessor Fund invested in an affiliated mutual fund. For the period from October 1, 2008 to August 28, 2009, transactions with the affiliated company were as follows:
| Affiliate | Balance of
Shares Held
9/30/2008 | Purchases/
Additions | Sales/
Reductions | Balance of
Shares Held
9/30/2009 | Value | Dividend
Income |
| Touchstone Institutional Money Market Fund | 4,653,025 | 61,427,504 | 66,080,529 | — | $ — | $60,133 |
7. EXPENSE Reduction
The Fund directs portfolio trades to a broker that in turn pays a portion of the Fund's operating expenses. For the year ended September 30, 2009, the Fund's expenses were reduced by $246 under these arrangements.
Annual Shareholder Report28
8. Investment TRANSACTIONSPurchases and sales of investments, excluding long-term U.S. government securities and short-term obligations, for the year ended September 30, 2009, were as follows:
| Purchases | $153,956,085 |
| Sales | $140,200,006 |
9. LINE OF CREDIT
The Fund participates in a $100,000,000 unsecured, uncommitted revolving line of credit (LOC) agreement with PNC Bank. The LOC was made available for extraordinary or emergency purposes, primarily for financing redemption payments. Borrowings are charged interest at a rate offered to the Fund by PNC Bank at the time of the borrowing. As of September 30, 2009, there were no outstanding loans. During the period from August 29, 2009 to September 30, 2009, the Fund did not utilize the LOC.
10. INTERFUND LENDING
Pursuant to an Exemptive Order issued by the Securities and Exchange Commission (SEC), the Fund, along with other funds advised by subsidiaries of Federated Investors, Inc., may participate in an interfund lending program. This program provides an alternative credit facility allowing the funds to borrow from other participating affiliated funds. As of September 30, 2009, there were no outstanding loans. During the period from August 29, 2009 to September 30, 2009, the program was not utilized.
11. Legal Proceedings
Since October 2003, Federated Investors, Inc. and related entities (collectively, “Federated”) and various Federated funds (“Federated Funds”) have been named as defendants in several class action lawsuits now pending in the United States District Court for the District of Maryland. The lawsuits were purportedly filed on behalf of people who purchased, owned and/or redeemed shares of Federated-sponsored mutual funds during specified periods beginning November 1, 1998. The suits are generally similar in alleging that Federated engaged in illegal and improper trading practices including market timing and late trading in concert with certain institutional traders, which allegedly caused financial injury to the mutual fund shareholders. These lawsuits began to be filed shortly after Federated's first public announcement that it had received requests for information on shareholder trading activities in the Federated Funds from the SEC, the Office of the New York State Attorney General (“NYAG”) and other authorities. In that regard, on November 28, 2005, Federated announced that it had reached final settlements with the SEC and the NYAG with respect to those matters. As Federated previously reported in 2004, it has already paid approximately $8.0 million to certain funds as determined by an independent consultant. As part of these settlements, Federated agreed to pay for the benefit of fund shareholders additional disgorgement and a civil money penalty in the aggregate amount of an additional $72 million. Federated entities have also been named as defendants in several additional lawsuits that are now pending in the United States District Court for the Western District of Pennsylvania, alleging, among other things, excessive advisory and Rule 12b-1 fees. The Board of the Federated Funds retained the law firm of Dickstein Shapiro LLP to represent the Federated Funds in these lawsuits. Federated and the Federated Funds, and their respective counsel have been defending this litigation, and none of the Federated Funds remains a defendant in any of the lawsuits (though some could potentially receive any recoveries as nominal defendants). Additional lawsuits Annual Shareholder Report29
based upon similar allegations may be filed in the future. The potential impact of these lawsuits, all of which seek unquantified damages, attorneys' fees and expenses, and future potential similar suits is uncertain. Although we do not believe that these lawsuits will have a material adverse effect on the Federated Funds, there can be no assurance that these suits, the ongoing adverse publicity and/or other developments resulting from the regulatory investigations will not result in increased Federated Fund redemptions, reduced sales of Federated Fund shares or other adverse consequences for the Federated Funds.12. Subsequent events
Management has evaluated subsequent events through November 24, 2009, the date the financial statements were issued, and determined that no events have occurred that require additional disclosure.
13. FEDERAL TAX INFORMATION (UNAUDITED)
For the fiscal year ended September 30, 2009, 100.0% of total ordinary income (including short-term capital gain) distributions paid by the Successor Fund are qualifying dividends which may be subject to a maximum tax rate of 15%, as provided for by the Jobs and Growth Tax Relief Act of 2003. Complete information is reported in conjunction with the reporting of your distributions on Form 1099-DIV.
Of the ordinary income (including short-term capital gain) distributions made by the Successor Fund during the year ended September 30, 2009, 100.0% qualify for the dividend received deduction available to corporate shareholders.
Annual Shareholder Report30
Report of Independent Registered Public Accounting Firm
TO THE BOARD OF TRUSTEES OF THE FEDERATED EQUITY FUNDS AND SHAREHOLDERS OF Federated Clover Value Fund:
We have audited the accompanying statement of assets and liabilities, including the portfolio of investments, of the Federated Clover Value Fund (the “Fund”), a portfolio of Federated Equity Funds, as of September 30, 2009, and the related statement of operations, changes in net assets and the financial highlights for the year then ended. These financial statements and financial highlights are the responsibility of the Fund's management. Our responsibility is to express an opinion on these financial statements and financial highlights based on our audits. The statement of changes in net assets and the financial highlights for the periods presented prior to October 1, 2008, were audited by other independent registered public accountants whose report thereon dated November 25, 2008, expressed an unqualified opinion on those statements.
We conducted our audits in accordance with the standards of the Public Company Accounting Oversight Board (United States). Those standards require that we plan and perform the audit to obtain reasonable assurance about whether the financial statements and financial highlights are free of material misstatement. An audit includes examining, on a test basis, evidence supporting the amounts and disclosures in the financial statements. Our procedures included confirmation of securities owned as of September 30, 2009, by correspondence with the custodian and brokers or by other appropriate auditing procedures. An audit also includes assessing the accounting principles used and significant estimates made by management, as well as evaluating the overall financial statement presentation. We believe that our audit provides a reasonable basis for our opinion.
In our opinion, the financial statements and financial highlights referred to above present fairly, in all material respects, the financial position of the Federated Clover Value Fund as of September 30, 2009, and the results of its operations, the changes in its net assets and the financial highlights for the year then ended, in conformity with U.S. generally accepted accounting principles.
Boston, Massachusetts
November 24, 2009
Annual Shareholder Report31
Board of Trustees and Trust Officers
The Board is responsible for managing the Trust's business affairs and for exercising all the Trust's powers except those reserved for the shareholders. The following tables give information about each Board member and the senior officers of the Fund. Where required, the tables separately list Board members who are “interested persons” of the Fund (i.e., “Interested” Board members) and those who are not (i.e., “Independent” Board members). Unless otherwise noted, the address of each person listed is Federated Investors Tower, 1001 Liberty Avenue, Pittsburgh, PA 15222. The address of all Independent Board members listed is 4000 Ericsson Drive, Warrendale, PA 15086-7561; Attention: Mutual Fund Board. As of December 31, 2008, the Trust comprised ten portfolios, and the Federated Fund Complex consisted of 40 investment companies (comprising 149 portfolios). Unless otherwise noted, each Officer is elected annually. Unless otherwise noted, each Board member oversees all portfolios in the Federated Fund Complex and serves for an indefinite term. The Fund's Statement of Additional Information includes additional information about Trust Trustees and is available, without charge and upon request, by calling 1-800-341-7400.
Interested TRUSTEES Background
Name
Birth Date
Positions Held with Trust
Date Service Began | Principal Occupation(s) for Past Five Years,
Other Directorships Held and Previous Position(s) |
John F. Donahue*
Birth Date: July 28, 1924
TRUSTEE
Began serving: April 1984 | Principal Occupations: Director or Trustee of the Federated Fund Complex; Chairman and Director, Federated Investors, Inc.; Chairman of the Federated Fund Complex's Executive Committee.
Previous Positions: Chairman of the Federated Fund Complex; Trustee, Federated Investment Management Company; Chairman and Director, Federated Investment Counseling. |
J. Christopher Donahue*
Birth Date: April 11, 1949
PRESIDENT AND TRUSTEE
Began serving: January 2000 | Principal Occupations: Principal Executive Officer and President of the Federated Fund Complex; Director or Trustee of some of the Funds in the Federated Fund Complex; President, Chief Executive Officer and Director, Federated Investors, Inc.; Chairman and Trustee, Federated Investment Management Company; Trustee, Federated Investment Counseling; Chairman and Director, Federated Global Investment Management Corp.; Chairman, Federated Equity Management Company of Pennsylvania and Passport Research, Ltd. (investment advisory subsidiary of Federated); Trustee, Federated Shareholder Services Company; Director, Federated Services Company.
Previous Positions: President, Federated Investment Counseling; President and Chief Executive Officer, Federated Investment Management Company, Federated Global Investment Management Corp. and Passport Research, Ltd. |
| * | Family relationships and reasons for “interested” status: John F. Donahue is the father of J. Christopher Donahue; both are “interested” due to their beneficial ownership of shares of Federated Investors, Inc. and the positions they hold with Federated and its subsidiaries. |
Annual Shareholder Report32
INDEPENDENT TRUSTEES Background
Name
Birth Date
Positions Held with Trust
Date Service Began | Principal Occupation(s) for Past Five Years,
Other Directorships Held and Previous Position(s) |
John T. Conroy, Jr., Ph.D.
Birth Date: June 23, 1937
TRUSTEE
Began serving: November 1991 | Principal Occupations: Director or Trustee of the Federated Fund Complex; Chairman of the Board, Investment Properties Corporation; Partner or Trustee in private real estate ventures in Southwest Florida; Assistant Professor in Theology at Barry University and Blessed Edmund Rice School for Pastoral Ministry.
Previous Positions: President, Investment Properties Corporation; Senior Vice President, John R. Wood and Associates, Inc., Realtors; President, Naples Property Management, Inc. and Northgate Village Development Corporation. |
Nicholas P. Constantakis
Birth Date: September 3, 1939
TRUSTEE
Began serving: February 1998 | Principal Occupation: Director or Trustee of the Federated Fund Complex.
Other Directorships Held: Director and Chairman of the Audit Committee, Michael Baker Corporation (architecture, engineering and construction services).
Previous Position: Partner, Andersen Worldwide SC. |
John F. Cunningham
Birth Date: March 5, 1943
TRUSTEE
Began serving: January 1999 | Principal Occupation: Director or Trustee of the Federated Fund Complex.
Other Directorships Held: Chairman, President and Chief Executive Officer, Cunningham & Co., Inc. (strategic business consulting); Trustee Associate, Boston College.
Previous Positions: Director, Redgate Communications and EMC Corporation (computer storage systems); Chairman of the Board and Chief Executive Officer, Computer Consoles, Inc.; President and Chief Operating Officer, Wang Laboratories; Director, First National Bank of Boston; Director, Apollo Computer, Inc. |
Maureen Lally-Green
Birth Date: July 5, 1949
TRUSTEE
Began serving: August 2009 | Principal Occupations: Director or Trustee of the Federated Fund Complex; Director, Office of Church Relations, Diocese of Pittsburgh; Adjunct Professor of Law, Duquesne University School of Law.
Other Directorships Held: Director, Auberle; Trustee St. Francis University; Director, Ireland Institute of Pittsburgh; Director, UPMC Mercy Hospital; Regent, St. Vincent Seminary; Director, Epilepsy Foundation of Western and Central Pennsylvania; Director, Saint Thomas More Society, Allegheny County; Director, Carlow University.
Previous Position: Pennsylvania Superior Court Judge. |
Annual Shareholder Report33
Name
Birth Date
Positions Held with Trust
Date Service Began | Principal Occupation(s) for Past Five Years,
Other Directorships Held and Previous Position(s) |
Peter E. Madden
Birth Date: March 16, 1942
TRUSTEE
Began serving: November 1991 | Principal Occupation: Director or Trustee and Chairman of the Board of the Federated Fund Complex.
Other Directorship Held: Board of Overseers, Babson College.
Previous Positions: Representative, Commonwealth of Massachusetts General Court; President, Chief Operating Officer and Director, State Street Bank and Trust Company and State Street Corporation (retired); Director, VISA USA and VISA International; Chairman and Director, Massachusetts Bankers Association; Director, Depository Trust Corporation; Director, The Boston Stock Exchange. |
Charles F. Mansfield, Jr.
Birth Date: April 10, 1945
TRUSTEE
Began serving: January 1999 | Principal Occupations: Director or Trustee and Chairman of the Audit Committee of the Federated Fund Complex; Management Consultant.
Previous Positions: Chief Executive Officer, PBTC International Bank; Partner, Arthur Young & Company (now Ernst & Young LLP); Chief Financial Officer of Retail Banking Sector, Chase Manhattan Bank; Senior Vice President, HSBC Bank USA (formerly, Marine Midland Bank); Vice President, Citibank; Assistant Professor of Banking and Finance, Frank G. Zarb School of Business, Hofstra University; Executive Vice President DVC Group, Inc. (marketing, communications and technology). |
R. James Nicholson
Birth Date: February 4, 1938
TRUSTEE
Began serving: January 2008 | Principal Occupations: Director or Trustee of the Federated Fund Complex; Senior Counsel, Brownstein Hyatt Farber Schrek, P.C.; Former Secretary of the U.S. Dept. of Veterans Affairs; Former U.S. Ambassador to the Holy See; Former Chairman of the Republican National Committee.
Other Directorships Held: Director, Horatio Alger Association; Director, The Daniels Fund.
Previous Positions: Colonel, U.S. Army Reserve; Partner, Calkins, Kramer, Grimshaw and Harring, P.C.; General Counsel, Colorado Association of Housing and Building; Chairman and CEO, Nicholson Enterprises, Inc. (real estate holding company); Chairman and CEO, Renaissance Homes of Colorado. |
Thomas M. O'Neill
Birth Date: June 14, 1951
TRUSTEE
Began serving: October 2006 | Principal Occupations: Director or Trustee of the Federated Fund Complex; Managing Director and Partner, Navigator Management Company, L.P. (investment and strategic consulting).
Other Directorships Held: Board of Overseers, Children's Hospital of Boston; Visiting Committee on Athletics, Harvard College.
Previous Positions: Chief Executive Officer and President, Managing Director and Chief Investment Officer, Fleet Investment Advisors; President and Chief Executive Officer, Aeltus Investment Management, Inc.; General Partner, Hellman, Jordan Management Co., Boston, MA; Chief Investment Officer, The Putnam Companies, Boston, MA; Credit Analyst and Lending Officer, Fleet Bank; Director and Consultant, EZE Castle Software (investment order management software); Director, Midway Pacific (lumber). |
Annual Shareholder Report34
Name
Birth Date
Positions Held with Trust
Date Service Began | Principal Occupation(s) for Past Five Years,
Other Directorships Held and Previous Position(s) |
John S. Walsh
Birth Date: November 28, 1957
TRUSTEE
Began serving: January 1999 | Principal Occupations: Director or Trustee of the Federated Fund Complex; President and Director, Heat Wagon, Inc. (manufacturer of construction temporary heaters); President and Director, Manufacturers Products, Inc. (distributor of portable construction heaters); President, Portable Heater Parts, a division of Manufacturers Products, Inc.
Previous Position: Vice President, Walsh & Kelly, Inc. |
James F. Will
Birth Date: October 12, 1938
TRUSTEE
Began serving: April 2006 | Principal Occupations: Director or Trustee of the Federated Fund Complex; formerly, Vice Chancellor and President, Saint Vincent College.
Other Directorships Held: Trustee, Saint Vincent College; Alleghany Corporation.
Previous Positions: Chairman, President and Chief Executive Officer, Armco, Inc.; President and Chief Executive Officer, Cyclops Industries; President and Chief Operating Officer, Kaiser Steel Corporation. |
OFFICERS
Name
Birth Date
Address
Positions Held with Trust
Date Service Began | Principal Occupation(s) for Past Five Years
and Previous Position(s) |
John W. McGonigle
Birth Date: October 26, 1938
EXECUTIVE VICE PRESIDENT AND SECRETARY
Began serving: April 1984 | Principal Occupations: Executive Vice President and Secretary of the Federated Fund Complex; Vice Chairman, Executive Vice President, Secretary and Director, Federated Investors, Inc.
Previous Positions: Trustee, Federated Investment Management Company and Federated Investment Counseling; Director, Federated Global Investment Management Corp., Federated Services Company and Federated Securities Corp. |
Richard A. Novak
Birth Date: December 25, 1963
TREASURER
Began serving: January 2006 | Principal Occupations: Principal Financial Officer and Treasurer of the Federated Fund Complex; Senior Vice President, Federated Administrative Services; Financial and Operations Principal for Federated Securities Corp., Edgewood Services, Inc. and Southpointe Distribution Services, Inc.
Previous Positions: Controller of Federated Investors, Inc.; Vice President, Finance of Federated Services Company; held various financial management positions within The Mercy Hospital of Pittsburgh; Auditor, Arthur Andersen & Co. |
Richard B. Fisher
Birth Date: May 17, 1923
VICE CHAIRMAN
Began serving: April 1984
| Principal Occupations: Vice Chairman or Vice President of some of the Funds in the Federated Fund Complex; Vice Chairman, Federated Investors, Inc.; Chairman, Federated Securities Corp.
Previous Positions: President and Director or Trustee of some of the Funds in the Federated Fund Complex; Executive Vice President, Federated Investors, Inc.; Director and Chief Executive Officer, Federated Securities Corp. |
Annual Shareholder Report35
Name
Birth Date
Address
Positions Held with Trust
Date Service Began | Principal Occupation(s) for Past Five Years
and Previous Position(s) |
Brian P. Bouda
Birth Date: February 28, 1947
CHIEF COMPLIANCE OFFICER AND SENIOR VICE PRESIDENT
Began serving: August 2004 | Principal Occupations: Senior Vice President and Chief Compliance Officer of the Federated Fund Complex; Vice President and Chief Compliance Officer of Federated Investors, Inc. and Chief Compliance Officer of its subsidiaries. Mr. Bouda joined Federated in 1999 and is a member of the American Bar Association and the State Bar Association of Wisconsin. |
Stephen F. Auth
Birth Date: September 3, 1956
450 Lexington Avenue
Suite 3700
New York, NY 10017-3943
CHIEF INVESTMENT OFFICER
Began serving: November 2002 | Principal Occupations: Mr. Auth is Chief Investment Officer of this Fund and various other Funds in the Federated Fund Complex; Executive Vice President, Federated Investment Counseling, Federated Global Investment Management Corp. and Federated Equity Management Company of Pennsylvania.
Previous Positions: Executive Vice President, Federated Investment Management Company, and Passport Research, Ltd. (investment advisory subsidiary of Federated); Senior Vice President, Global Portfolio Management Services Division; Senior Vice President, Federated Investment Management Company and Passport Research, Ltd.; Senior Managing Director and Portfolio Manager, Prudential Investments. |
Lawrence Auriana
Birth Date: January 8, 1944
140 East 45th Street
New York, NY 10017
VICE PRESIDENT
Began serving: November 2001 | Principal Occupations: Lawrence Auriana is Vice President of the Trust. Mr. Auriana joined Federated in April 2001 as Co-Head of Investments/Federated Kaufmann. From August 1984 to April 2001, Mr. Auriana was President and Treasurer of Edgemont Asset Management Corp., and Chairman of the Board and Portfolio Manager to The Kaufmann Fund, Inc. (predecessor to the Federated Kaufmann Fund). Mr. Auriana earned a B.S. in economics from Fordham University and has been engaged in the securities business since 1965. |
Walter C. Bean
Birth Date: June 22, 1945
VICE PRESIDENT
Began serving: November 2006 | Principal Occupations: Walter C. Bean is Vice President of the Trust. Mr. Bean is a Senior Vice President, Senior Portfolio Manager and Director of Investments for Managed Accounts. Mr. Bean joined Federated in 2000. Mr. Bean is responsible for the investment process for the managed accounts portfolios. His previous associations included: Chief Investment Officer and Portfolio Manager at C.S. McKee & Company; various investment management and research positions with First Chicago Investment Advisors, CIGNA Investment Advisors and Mellon Bank. Mr. Bean is a Chartered Financial Analyst. Mr. Bean earned a Bachelors Degree in Business Administration from Ohio University and an M.B.A. from Pennsylvania State University. Mr. Bean has 35 years of investment experience. |
Hans P. Utsch
Birth Date: July 3, 1936
140 East 45th Street
New York, NY 10017
VICE PRESIDENT
Began serving: November 2001 | Principal Occupations: Hans P. Utsch is Vice President of the Trust. Mr. Utsch joined Federated in April 2001 as Co-Head of Investments/Federated Kaufmann. From August 1984 to April 2001, Mr. Utsch was Chairman of the Board and Secretary of Edgemont Asset Management Corp., and President and Portfolio Manager to The Kaufmann Fund, Inc. (predecessor to the Federated Kaufmann Fund). Mr. Utsch graduated from Amherst College and holds an M.B.A. from Columbia University. He has been engaged in the securities business since 1962. |
Annual Shareholder Report36
Evaluation and Approval of Advisory
Contract - May 2009
Federated Clover Value Fund (the “Fund”)
The Fund's Board reviewed the Fund's investment advisory contract at meetings held in May 2009. Because the Fund did not yet have a meaningful operating history, the Board's decision to approve the contract reflects the exercise of its business judgment on whether to authorize the continued offering of this new investment vehicle, as originally proposed by, and based on information previously requested by the Board and provided by the Federated organization, and based on Federated's recommendation to go forward with the Fund.
Federated proposed the creation of the Fund in connection with its acquisition of certain assets of Clover Capital Management, Inc. (“Clover Capital”), the investment adviser to the Clover Capital Multi Cap Value Equity Common Fund (the “Predecessor Fund”), a privately offered pooled fund (the “Acquisition”). As part of the transaction, Federated proposed that the Predecessor Fund be reorganized with and into the Fund in a tax-free asset transfer which would provide shareholders of the Predecessor Fund the opportunity to become shareholders of a registered mutual fund with similar investment objectives and policies and the same key management personnel as the Predecessor Fund, but with sales, distribution and other fund and shareholder services provided by the same affiliates of Federated that provide such services to the other Federated funds. The Fund was declared effective on January 21, 2009, and the reorganization of the Predecessor Fund with and into the Fund was consummated after the close of business on March 13, 2009. The Fund commenced operations on March 16, 2009. Accordingly, the Board's deliberations at its May 2009 meetings were based to a significant degree on the information considered by the Board when it originally approved the contract at its November 2008 meetings.
The Federated funds' Board had previously appointed a Senior Officer, whose duties include specified responsibilities relating to the process by which advisory fees are to be charged to a Federated Fund. The Senior Officer has the authority to retain consultants, experts, or staff as may be reasonably necessary to assist in the performance of his duties, reports directly to the Board, and may be terminated only with the approval of a majority of the independent members of the Board. The Senior Officer prepared and furnished to the Board an independent, written evaluation that covered topics discussed below. The Board considered that evaluation, along with other information, in deciding to approve the proposed advisory contract.
The Board also considered the anticipated compensation and benefits to be received by the Adviser. This includes fees to be received for services provided to the Fund by other entities in the Federated organization and research services that may be received by the Adviser from brokers that execute fund trades, as well as advisory fees. The Board is also familiar with and considered judicial Annual Shareholder Report37
decisions concerning allegedly excessive investment advisory fees, which have indicated that the following factors may be relevant to an Adviser's fiduciary duty with respect to its receipt of compensation from a fund: the nature and quality of the services provided by the Adviser, including the performance of the Fund; the Adviser's cost of providing the services; the extent to which the Adviser may realize “economies of scale” as the Fund grows larger; any indirect benefits that may accrue to the Adviser and its affiliates as a result of the Adviser's relationship with the Fund; performance and expenses of comparable funds; and the extent to which the independent Board members are fully informed about all facts the Board deems relevant bearing on the Adviser's services and fees. The Board further considered management fees (including any components thereof) charged to institutional and other clients of the Adviser for what might be viewed as like services, and the cost to the Adviser and its affiliates of supplying services pursuant to the management fee agreements, excluding any intra-corporate profit and profit margins of the Adviser and its affiliates for supplying such services. The Board was aware of these factors and was guided by them in its review of the Fund's advisory contract to the extent it considered them to be appropriate and relevant, as discussed further below. The Board considered and weighed these circumstances in light of its substantial accumulated experience in working with Federated on matters relating to other Federated funds, and was assisted in its deliberations by independent legal counsel. The Board's consideration of the proposed advisory contract included review of the Senior Officer's evaluation, accompanying data and additional reports covering such matters as: the Adviser's investment philosophy, revenue, profitability, personnel and processes; investment and operating strategies; the Fund's investment objectives; the Fund's anticipated expenses (including the proposed advisory fee itself and the overall estimated expense structure of the Fund, both in absolute terms and relative to similar and/or competing funds, with due regard for contractual or voluntary expense limitations); and the nature, quality and extent of the advisory and other services to be provided to the Fund by the Adviser and its affiliates. The Board also considered the likely preferences and expectations of anticipated Fund shareholders and their relative sophistication; the continuing state of competition in the mutual fund industry and market practices; the range of comparable fees for similar funds in the mutual fund industry; the Fund's relationship to the Federated family of funds which include a comprehensive array of funds with different investment objectives, policies and strategies which are available for exchange without the incurrence of additional sales charges; compliance and audit reports concerning the Federated funds and the Federated companies that service them (including communications from regulatory agencies), as well as Federated's responses to any issues raised therein; and relevant developments in the mutual fund industry and how the Federated funds Annual Shareholder Report38
and/or Federated are responding to them. The Board's evaluation process is evolutionary. The criteria considered and the emphasis placed on relevant criteria change in recognition of changing circumstances in the mutual fund marketplace.With respect to the Fund's expenses in particular, the Board has found the use of comparisons to other mutual funds with comparable investment programs to be particularly useful, given the high degree of competition in the mutual fund business. The Board focused on comparisons with other similar mutual funds more heavily than non-mutual fund products or services because it is believed that they are more relevant. For example, other mutual funds are the products most like the Fund, they are readily available to Fund shareholders as alternative investment vehicles, and they are the type of investment vehicle in fact chosen and maintained by the Fund's anticipated investors. The range of their fees and expenses therefore appears to be a generally reliable indication of what consumers have found to be reasonable in the precise marketplace in which the Fund will compete. In this regard, the Senior Officer also reviewed Federated's fees for providing advisory services to products outside the Federated family of funds (e.g., institutional and separate accounts). He concluded that mutual funds and institutional accounts are inherently different products. Those differences included, but are not limited to, different types of targeted investors; being subject to different laws and regulations; different legal structures; different average account sizes; different associated costs; different portfolio management techniques made necessary by different cash flows; and portfolio manager time spent in review of securities pricing. The Senior Officer did not consider these fee schedules to be determinative in judging the appropriateness of mutual fund advisory contracts.
The Senior Officer reviewed information compiled by Federated, using data supplied by independent fund ranking organizations, regarding the fees charged by other mutual funds, noting his view that comparisons to fund peer groups are highly important in judging the reasonableness of proposed fees.
The Senior Officer's report produced in connection with the original approval of the advisory contract for the Fund in November 2008, noted that Clover Capital, as manager of the Predecessor Fund, generated consistently strong performance using substantially the same investment strategy to be utilized by the Fund. Because the Fund will employ the same key management personnel and investment strategy as the Predecessor Fund, the nature and quality of the management of the Fund is expected to reflect that of the Predecessor Fund. This in turn assisted the Board in reaching a conclusion that the nature, extent and quality of the Adviser's investment management services were such as to warrant the approval of the advisory contract. The Board also noted the strong performance achieved by Clover Capital as subadviser to a mutual fund and adviser to a group trust and separate managed accounts pursuing a similar investment objective.
Annual Shareholder Report39
The Board reviewed the proposed fees and other expenses of the Fund and was satisfied that the proposed overall expense structure of the Fund appeared to be appropriate. In this regard, the Senior Officer's report indicated that the proposed management fees, after projected waivers, were reasonable. The Board also concluded that the nature, quality and scope of other services to be provided to the Fund were reasonable.The Board also considered possible indirect benefits that may accrue to the Adviser and its affiliates as a result of the Acquisition. Other indirect benefits that may accrue to the Adviser and its affiliates as a result of the Adviser's relationship with the Fund are essentially impossible to apply before the Fund has experienced any meaningful operating history. Nevertheless, in connection with the Board's governance of other Federated funds, it should be noted that the Board regularly receives financial information about Federated, including reports on the compensation and benefits Federated derives from its relationships with the other Federated funds. These reports cover not only the fees under the advisory contracts, but also fees received by Federated's subsidiaries for providing other services to the Federated funds under separate contracts (e.g., for serving as the Federated funds' administrator). The reports also discuss any indirect benefit Federated may derive from its receipt of research services from brokers who execute Federated fund trades. In addition, the Board considered the fact that, in order for a fund to be competitive in the marketplace, Federated and its affiliates frequently waive fees and/or reimburse expenses and have disclosed to fund investors and/or indicated to the Board their intention to do so in the future, where appropriate.
The Senior Officer commented on reports furnished by Federated of estimates of components of the Fund's expenses using allocation methodologies specified by the Senior Officer and sales projections made by Federated. The Senior Officer noted that, although they may apply consistent allocation processes, the inherent difficulties in allocating costs (and the unavoidable arbitrary aspects of that exercise), particularly when projecting an uncertain asset base, and the lack of consensus on how to allocate those costs may render such allocation reports unreliable. The Senior Officer determined that such allocation reports were of limited use.
The Board and the Senior Officer also reviewed data compiled by Federated comparing profitability information for Federated to other publicly held fund management companies. In this regard, the Senior Officer noted the limited availability of such information, but nonetheless concluded that Federated's profit margins did not appear to be excessive and the Board agreed.
The Senior Officer's evaluation also discussed the notion of possible realization of “economies of scale” as a fund grows larger. The Board considered in this regard that the Adviser has made significant and long-term investments in areas that support all of the Federated funds, such as personnel and processes for the portfolio management, compliance, and risk management functions; and systems technology; and that the benefits of these efforts (as well as any Annual Shareholder Report40
economies, should they exist) were likely to be enjoyed by the fund complex as a whole. Finally, the Board also noted the absence of any applicable regulatory or industry guidelines on this subject, which (as discussed in the Senior Officer's evaluation) is compounded by the lack of any common industry practice or general pattern with respect to structuring fund advisory fees with “breakpoints” that serve to reduce the fee as the fund attains a certain size. The Senior Officer did not recommend institution of breakpoints in pricing Federated's proposed advisory services to the Fund at this time.The Board based its decision to approve the proposed advisory contract on the totality of the circumstances and relevant factors, and with a view to past and future long-term considerations. As noted, not all of the factors and considerations identified above were necessarily relevant to the Fund, nor did the Board consider any one of them to be determinative. With respect to the factors that are relevant, the Board's decision to approve the contract reflects its determination that, based upon the information previously requested and supplied, Federated's proposal to establish and manage the Fund, and its past performance and actions in providing services to other mutual funds (which the Board has found to be satisfactory with respect to such other funds), provide a satisfactory basis to support the business decision to continue the existing arrangements.
Annual Shareholder Report41
Voting Proxies on Fund Portfolio SecuritiesA description of the policies and procedures that the Fund uses to determine how to vote proxies, if any, relating to securities held in the Fund's portfolio is available, without charge and upon request, by calling 1-800-341-7400. A report on “Form N-PX” of how the Fund voted any such proxies during the most recent 12-month period ended June 30 is available from Federated's Web site at FederatedInvestors.com. To access this information from the “Products” section of the Web site, click on the “Prospectuses and Regulatory Reports” link under “Related Information,” then select the appropriate link opposite the name of the Fund; or select the name of the Fund and from the Fund's page, click on the “Prospectuses and Regulatory Reports” link. Form N-PX filings are also available at the SEC's Web site at www.sec.gov.
Quarterly Portfolio Schedule
The Fund files with the SEC a complete schedule of its portfolio holdings, as of the close of the first and third quarters of its fiscal year, on “Form N-Q.” These filings are available on the SEC's Web site at www.sec.gov and may be reviewed and copied at the SEC's Public Reference Room in Washington, DC. (Call 1-800-SEC-0330 for information on the operation of the Public Reference Room.) You may also access this information from the “Products” section of Federated's Web site at FederatedInvestors.com by clicking on “Portfolio Holdings” under “Related Information,” then selecting the appropriate link opposite the name of the Fund; or select the name of the Fund and from the Fund's page, click on the “Portfolio Holdings” link.
Annual Shareholder Report42
Mutual funds are not bank deposits or obligations, are not guaranteed by any bank and are not insured or guaranteed by the U.S. government, the Federal Deposit Insurance Corporation, the Federal Reserve Board or any other government agency. Investment in mutual funds involves investment risk, including the possible loss of principal.
This Report is authorized for distribution to prospective investors only when preceded or accompanied by the Fund's Prospectus, which contains facts concerning its objective and policies, management fees, expenses and other information.
Federated Clover Value Fund
Federated Investors Funds
4000 Ericsson Drive
Warrendale, PA 15086-7561
Contact us at FederatedInvestors.com
or call 1-800-341-7400.
Federated Securities Corp., Distributor
Cusip 314172214
41201 (11/09)
Federated is a registered mark of Federated Investors, Inc.
2009 Federated Investors, Inc.
Federated Prudent Bear Fund(Successor to the Prudent Bear Fund Established 1995)
A Portfolio of Federated Equity Funds
ANNUAL SHAREHOLDER REPORTSeptember 30, 2009
Class A Shares
Class C Shares
FINANCIAL HIGHLIGHTS
SHAREHOLDER EXPENSE EXAMPLE
MANAGEMENT'S DISCUSSION OF FUND PERFORMANCE
PORTFOLIO OF INVESTMENTS SUMMARY TABLES
PORTFOLIO OF INVESTMENTS
STATEMENT OF ASSETS AND LIABILITIES
STATEMENT OF OPERATIONS
STATEMENT OF CHANGES IN NET ASSETS
NOTES TO FINANCIAL STATEMENTS
REPORT OF INDEPENDENT REGISTERED PUBLIC ACCOUNTING FIRM
BOARD OF TRUSTEES AND TRUST OFFICERS
EVALUATION AND APPROVAL OF ADVISORY CONTRACT
VOTING PROXIES ON FUND PORTFOLIO SECURITIES
QUARTERLY PORTFOLIO SCHEDULE
Not FDIC Insured * May Lose Value * No Bank Guarantee
Financial Highlights - Class A Shares
(For a Share Outstanding Throughout Each Period)
| Year Ended September 30 | 20091 | 2008 | 2007 | 2006 | 2005 |
| Net Asset Value, Beginning of Period | $6.82 | $5.96 | $5.84 | $5.47 | $5.71 |
| Income From Investment Operations: | | | | | |
| Net investment income (loss) | (0.15)2 | 0.05 | 0.19 | 0.15 | (0.00)3 |
Net realized and unrealized gain
(loss) on investments, short sales,
futures contracts and foreign
currency transactions | 0.41 | 1.00 | 0.12 | 0.28 | (0.24) |
| TOTAL FROM INVESTMENT OPERATIONS | 0.26 | 1.05 | 0.31 | 0.43 | (0.24) |
| Less Distributions: | | | | | |
| Distributions from net investment income | — | (0.19) | (0.19) | (0.06) | — |
Distributions from net realized
gain on investments, short sales,
futures contracts and foreign
currency transactions | (1.33) | — | — | — | — |
| Return of capital4 | (0.01) | — | — | — | — |
| TOTAL DISTRIBUTIONS | (1.34) | (0.19) | (0.19) | (0.06) | — |
| Redemption Fees | — | 0.003 | 0.003 | 0.003 | 0.003 |
| Net Asset Value, End of Period | $5.74 | $6.82 | $5.96 | $5.84 | $5.47 |
| Total Return5 | 0.06% | 17.98% | 5.49% | 7.92% | (4.20)% |
| Ratios to Average Net Assets: | | | | | |
| Net expenses | 2.84%6 | 2.56%6 | 2.33%6 | 2.49% | 2.58% |
| Net expenses excluding dividends on short positions | 1.73% | 1.72% | 1.76% | 1.77% | 1.85% |
| Net investment income (loss) | (2.18)% | 0.80% | 3.31% | 2.60% | (0.03)% |
| Expense waiver/reimbursement7 | 0.03% | 0.04% | 0.03% | — | — |
| Supplemental Data: | | | | | |
| Net assets, end of period (000 omitted) | $1,079,143 | $1,054,341 | $747,610 | $650,305 | $411,780 |
| Portfolio turnover | 392% | 277% | 119% | 104% | 129% |
| 1 | Prudent Bear Fund (the “Predecessor Fund”) was reorganized into Federated Prudent Bear Fund (the “Fund”) as of the close of business on December 5, 2008. Prior to the reorganization, the Fund had no investment operations. The Fund is the successor to the Predecessor Fund. The performance information and financial information presented incorporates the operations of the Predecessor Fund, which, as a result of the reorganization, are the Fund's operations. Beginning with the year ended September 30, 2009, the Fund was audited by KPMG LLP. The previous years were audited by another independent registered public accounting firm. |
| 2 | Per share numbers have been calculated using the average shares method. |
| 3 | Represents less than $0.01. |
| 4 | Represents a return of capital for federal income tax purposes. |
| 5 | Based on net asset value, which does not reflect the sales charge, redemption fee or contingent deferred sales charge, if applicable. |
| 6 | The net expense ratios are calculated without reduction for fees paid indirectly for expense offset arrangements. The net expense ratios are 2.82%, 2.52% and 2.30% for the years ended September 30, 2009, 2008 and 2007, respectively, after taking into account these expense reductions. |
| 7 | This expense decrease is reflected in both the net expense and the net investment income (loss) ratios shown above. |
- See Notes which are an integral part of the Financial Statements
Annual Shareholder Report1
Financial Highlights - Class C Shares
(For a Share Outstanding Throughout Each Period)
| Year Ended September 30 | 20091 | 2008 | 2007 | 2006 | 2005 |
| Net Asset Value, Beginning of Period | $6.52 | $5.72 | $5.62 | $5.29 | $5.56 |
| Income From Investment Operations: | | | | | |
| Net investment income (loss) | (0.19)2 | 0.01 | 0.14 | 0.11 | (0.04) |
Net realized and unrealized gain
(loss) on investments, short sales,
futures contracts and foreign
currency transactions | 0.41 | 0.96 | 0.11 | 0.26 | (0.24) |
| TOTAL FROM INVESTMENT OPERATIONS | 0.22 | 0.97 | 0.25 | 0.37 | (0.28) |
| Less Distributions: | | | | | |
| Distributions from net investment income | — | (0.17) | (0.15) | (0.04) | — |
Distributions from net realized
gain on investments, short sales,
futures contracts and foreign
currency transactions | (1.33) | — | — | — | — |
| Return of capital3 | (0.01) | — | — | — | — |
| TOTAL DISTRIBUTIONS | (1.34) | (0.17) | (0.15) | (0.04) | — |
| Redemption Fees | — | 0.004 | 0.004 | 0.004 | 0.01 |
| Net Asset Value, End of Period | $5.40 | $6.52 | $5.72 | $5.62 | $5.29 |
| Total Return5 | (0.65)% | 17.13% | 4.61% | 7.14% | (4.86)% |
| Ratios to Average Net Assets: | | | | | |
| Net expenses | 3.61%6 | 3.31%6 | 3.08%6 | 3.24% | 3.33% |
| Net expenses excluding dividends on short positions | 2.46% | 2.47% | 2.51% | 2.52% | 2.60% |
| Net investment income (loss) | (3.03)% | 0.09% | 2.56% | 1.85% | (0.78)% |
| Expense waiver/reimbursement7 | 0.03% | 0.04% | 0.03% | — | — |
| Supplemental Data: | | | | | |
| Net assets, end of period (000 omitted) | $96,518 | $65,831 | $45,173 | $31,283 | $19,029 |
| Portfolio turnover | 392% | 277% | 119% | 104% | 129% |
| 1 | The Predecessor Fund was reorganized into the Fund as of the close of business on December 5, 2008. Prior to the reorganization, the Fund had no investment operations. The Fund is the successor to the Predecessor Fund. The performance information and financial information presented incorporates the operations of the Predecessor Fund, which, as a result of the reorganization, are the Fund's operations. Beginning with the year ended September 30, 2009, the Fund was audited by KPMG LLP. The previous years were audited by another independent registered public accounting firm. |
| 2 | Per share numbers have been calculated using the average shares method. |
| 3 | Represents a return of capital for federal income tax purposes. |
| 4 | Represents less than $0.01. |
| 5 | Based on net asset value, which does not reflect the sales charge, redemption fee or contingent deferred sales charge, if applicable. |
| 6 | The net expense ratios are calculated without reduction for fees paid indirectly for expense offset arrangements. The net expense ratios are 3.59%, 3.27% and 3.05% for the years ended September 30, 2009, 2008 and 2007, respectively, after taking into account these expense reductions. |
| 7 | This expense decrease is reflected in both the net expense and the net investment income (loss) ratios shown above. |
- See Notes which are an integral part of the Financial Statements
Annual Shareholder Report2
Shareholder Expense Example (unaudited)
As a shareholder of the Fund, you incur two types of costs: (1) transaction costs, including sales charges (loads) on purchase or redemption payments; and (2) ongoing costs, including management fees and to the extent applicable, distribution (12b-1) fees and/or shareholder services fees and other Fund expenses. This Example is intended to help you to understand your ongoing costs (in dollars) of investing in the Fund and to compare these costs with the ongoing costs of investing in other mutual funds. It is based on an investment of $1,000 invested at the beginning of the period and held for the entire period from April 1, 2009 to September 30, 2009.
ACTUAL EXPENSES
The first section of the table below provides information about actual account values and actual expenses. You may use the information in this section, together with the amount you invested, to estimate the expenses that you incurred over the period. Simply divide your account value by $1,000 (for example, an $8,600 account value divided by $1,000 = 8.6), then multiply the result by the number in the first section under the heading entitled “Expenses Paid During Period” to estimate the expenses attributable to your investment during this period.
HYPOTHETICAL EXAMPLE FOR COMPARISON PURPOSES
The second section of the table below provides information about hypothetical account values and hypothetical expenses based on the Fund's actual expense ratio and an assumed rate of return of 5% per year before expenses, which is not the Fund's actual return. Thus, you should not use the hypothetical account values and expenses to estimate the actual ending account balance or your expenses for the period. Rather, these figures are required to be provided to enable you to compare the ongoing costs of investing in the Fund with other funds. To do so, compare this 5% hypothetical example with the 5% hypothetical examples that appear in the shareholder reports of the other funds.
Annual Shareholder Report3
Please note that the expenses shown in the table are meant to highlight your ongoing costs only and do not reflect any transaction costs, such as sales charges (loads) on purchase or redemption payments. Therefore, the second section of the table is useful in comparing ongoing costs only, and will not help you determine the relative total costs of owning different funds. In addition, if these transaction costs were included, your costs would have been higher. | Beginning
Account Value
4/1/2009 | Ending
Account Value
9/30/2009 | Expenses Paid
During Period1 |
| Actual: | | | |
| Class A Shares | $1,000 | $810.70 | $13.03 |
| Class C Shares | $1,000 | $808.40 | $16.73 |
Hypothetical (assuming a 5% return
before expenses): | | | |
| Class A Shares | $1,000 | $1,010.68 | $14.47 |
| Class C Shares | $1,000 | $1,006.57 | $18.56 |
| 1 | Expenses are equal to the Fund's annualized net expense ratios, multiplied by the average account value over the period, multiplied by 183/365 (to reflect the one-half-year period). The annualized net expense ratios are as follows: |
| Class A Shares | 2.87% |
| Class C Shares | 3.69% |
Annual Shareholder Report4
Performance data quoted represents past performance which is no guarantee of future results. Investment return and principal value will fluctuate so that an investor's shares, when redeemed, may be worth more or less than their original cost. Mutual fund performance changes over time and current performance may be lower or higher than what is stated. For current to the most recent month-end performance and after-tax returns, visit FederatedInvestors.com or call 1-800-341-7400.
Management's Discussion of Fund Performance (unaudited)
The Fund's total return, based on net asset value, for the fiscal year ended September 30, 2009, was 0.06% for Class A Shares and -0.65% for Class C Shares. The total return of the Standard & Poor's 500 Index (S&P 500),1 the Fund's broad-based securities market index, was -6.91% for the same period. The total return for the Fund's market benchmark, the S&P 500 Inverse Daily Index,1 was -9.79% for the same period. The Fund's total return for the fiscal year reflected actual cash flows, transaction costs and other expenses which were not reflected in the total return of the S&P 500.
The following discussion will focus on the performance of the Fund's
Class A Shares.
MARKET OVERVIEW
The fiscal year encompassed an extraordinary period of crisis and recovery for global markets. For the period October 1, 2008 to the market lows set in early March 2009, the S&P 500 declined 42.8% and the Standard & Poor's 400 Mid-Cap Index (S&P 400 Index)2 declined 45.3%. From the March low to closing prices on September 30, 2009, the S&P 500 rallied 58.5%. The broader market recovered even more robustly than the S&P 500. The S&P 400 Index rallied 73.6%. Many stocks, most notably those commonly shorted, more than doubled in price during the market rebound.
FUND PERFORMANCE
The Fund's underperformance versus its benchmark for the reporting period was due to the extraordinary percentage gains posted by the stock market during the rally off of the March 2009 lows. Fund losses during this rally period, while significantly less in percentage terms than the market's advance, were from a much higher base after the Fund had posted strong returns during the preceding market decline.
| 1 | The S&P 500 is a broad-based market index that measures the performance of the broad domestic economy through changes in the aggregate market value of 500 stocks representing all major industries. The Index is unmanaged and investments cannot be made in an index. The S&P 500 Inverse Daily Index is designed to provide the inverse performance of the S&P 500, representing a short position in the index. |
| 2 | The S&P 400 Index is an unmanaged capitalization weighted index of common stocks representing all major industries in the mid-range of the U.S. stock market. |
Annual Shareholder Report5
For the period October 1, 2008 through February 28, 2009, the Fund returned 31.96% versus a decline of 36.13% for the S&P 500. For the period March 1, 2009 through September 30, 2009, the Fund returned -24.17% versus the S&P 500 gain of 45.76%.
Despite the S&P 500 having recorded a one-year loss, Fund performance benefited from being positioned cautiously for much of the reporting period from: reduced overall short exposure; scaled-back exposure to individual company shorts; and particularly, minimal exposure to stocks with large short positions.3 Additionally, strong gains from its long investments in natural resources companies positively contributed to Fund performance during the reporting period.
Positioning and Strategy
With the passing of the one-year anniversary of the Lehman Brothers collapse, market recollection of that chaotic episode has increasingly faded from memory. Indeed, 2009 has thus far been a year of spectacular returns for risk assets. It has also proven an exceptionally difficult period for those positioned bearishly in the marketplace. The Fund has remained cautiously positioned since implementing major changes to portfolio positions in the fourth quarter of 2008.
The advantage of hindsight confirms the Fund managers' view at the time: late 2008 was a critical juncture for the markets. Bearish sentiment had turned extreme. There was an unprecedented amount of shorting in the stock market, and perhaps too much of the selling was “indiscriminate.” Hedging strategies had also proliferated in the derivative markets. The credit freeze and stock market weakness were feeding on each other.
The Fund managers were at that time also carefully monitoring developments in Washington. It had become increasingly apparent that our policymakers were prepared to implement incredible monetary and fiscal measures to avert systemic meltdown. Analyzing macro circumstances was essential. The Fund managers became of the view that if policymakers were successful in stabilizing the credit system, the risk backdrop would turn decisively against shorting. System stabilization would increase the likelihood of a major short squeeze, a self-reinforcing unwind of bearish hedges, a market rally and a resulting boost to general confidence. Moreover, such a backdrop would foster heightened speculation and market uncertainty.
| 3 | The Fund regularly makes short sales of securities, which involves unlimited risk including the possibility that losses may exceed the original amount invested. The Fund may also use options and futures contracts, which have risks associated with unlimited losses of the underlying holdings due to unanticipated market movements and failure to correctly predict the direction of securities prices, interest rates and currency exchanges rates. However, a mutual fund investor's risk is limited to the amount of investment in a mutual fund. The Fund may also hold restricted securities purchased through private placements. Such securities may be difficult to sell without experiencing delays or additional costs. Please see the Prospectus for further details. Considering the increased risks, the Fund may not be suitable for all investors. |
Annual Shareholder Report6
During the fourth quarter of 2008 and into 2009, the Fund managers significantly lowered the Fund's risk profile. Overall short exposure was reduced and, as importantly, the composition of the exposure was modified. The Fund pared back heavily shorted individual company positions and cut exposure to more volatile stocks and sectors. Short exposure was also decreased for stocks viewed as likely beneficiaries of emerging global reflation dynamics. Additionally, the Fund managers liquidated holdings of put options and then remained largely out of the options market for the remainder of the reporting period. In short, the Fund managers “hunkered down” - with reduced short exposure achieved primarily by shorting liquid S&P 500 instruments and lower volatility stocks. These moves mitigated losses and improved Fund performance.
The Fund managers' confidence in the secular bear market thesis remained intact at the end of the reporting period. They view the recent backdrop as one commanded by government intervention and a resulting bear market rally. Resurgent risk markets have been powered by extreme monetary and fiscal policy responses at home and around the world. While challenging, it is an environment that differentiates the various bear Fund strategies and investment philosophies. To be sure, this year's market rebound has illuminated the weaknesses inherent in leveraged and always fully short bear products. A very tough period for bear funds has also highlighted the merits of the Fund's risk-based actively managed strategy.
While not drifting from their mandate of the Fund providing a reliable market hedge, the Fund managers successfully implemented the Fund's risk management strategy. Throughout the rally off of March lows, the average stock significantly outperformed the S&P 500, and heavily-shorted stocks easily outperformed most equities. Bear funds that did not reduce overall short exposure and/or exposure to commonly shorted stocks suffered huge losses.
It is fundamental to the Fund managers' investment philosophy to remain flexible, tactical and disciplined with respect to managing Fund short exposure. Micro company research and analysis on the short side proved, as it has on occasion, especially challenging for much of the reporting period. Fund performance, however, benefited from the other two “prongs” of the Fund managers' philosophy: diligent “top-down” macro analysis and disciplined risk-based portfolio management.
Annual Shareholder Report7
GROWTH OF A $10,000 INVESTMENT - CLASS A SHARES1The graph below illustrates the hypothetical investment of $10,0002 in the Federated Prudent Bear Fund (Class A Shares) (the “Fund”) from September 30, 1999 to September 30, 2009, compared to the Standard & Poor's 500 Index (S&P 500)3 and the S&P 500 Inverse Daily Index (S&P 500 Inverse).3
| Average Annual Total Returns4 for the Period Ended 9/30/2009 | |
| 1 Year | -5.48% |
| 5 Years | 4.01% |
| 10 Years | 6.83% |
Performance data quoted represents past performance which is no guarantee of future results. Investment return and principal value will fluctuate so that an investor's shares, when redeemed, may be worth more or less than their original cost. Mutual fund performance changes over time and current performance may be lower or higher than what is stated. For current to the most recent month-end performance and after-tax returns, visit FederatedInvestors.com or call 1-800-341-7400. Returns shown do not reflect the deduction of taxes that a shareholder would pay on Fund distributions or the redemption of Fund shares. Mutual funds are not obligations of or guaranteed by any bank and are not federally insured. Total returns shown include the maximum sales charge of 5.50%.
Annual Shareholder Report8
| 1 | Federated Prudent Bear Fund is the successor to Prudent Bear Fund pursuant to a reorganization that took place on December 5, 2008. The information presented above, for the periods prior to December 5, 2008, is historical information for the No Load Shares of the Prudent Bear Fund. |
| 2 | Represents a hypothetical investment of $10,000 in the Fund after deducting the maximum sales charge of 5.50% ($10,000 investment minus $550 sales charge = $9,450). The Fund's performance assumes the reinvestment of all dividends and distributions. The S&P 500 and the S&P 500 Inverse have been adjusted to reflect reinvestment of dividends on securities in the indexes. |
| 3 | The S&P 500 and the S&P 500 Inverse are not adjusted to reflect taxes, sales charges, expenses or other fees that the Securities and Exchange Commission (SEC) requires to be reflected in the Fund's performance. The S&P 500 and the S&P 500 Inverse are unmanaged and, unlike the Fund, are not affected by cash flows. It is not possible to invest directly in an index. |
| 4 | Total returns quoted reflect all applicable sales charges. |
Annual Shareholder Report9
GROWTH OF A $10,000 INVESTMENT - CLASS C SHARES1
The graph below illustrates the hypothetical investment of $10,0002 in the Federated Prudent Bear Fund (Class C Shares) (the “Fund”) from September 30, 1999 to September 30, 2009, compared to the Standard & Poor's 500 Index (S&P 500)3 and the S&P 500 Inverse Daily Index (S&P 500 Inverse).3
| Average Annual Total Returns4 for the Period Ended 9/30/2009 | |
| 1 Year | -1.48% |
| 5 Years | 4.41% |
| 10 Years | 6.59% |
Performance data quoted represents past performance which is no guarantee of future results. Investment return and principal value will fluctuate so that an investor's shares, when redeemed, may be worth more or less than their original cost. Mutual fund performance changes over time and current performance may be lower or higher than what is stated. For current to the most recent month-end performance and after-tax returns, visit FederatedInvestors.com or call 1-800-341-7400. Returns shown do not reflect the deduction of taxes that a shareholder would pay on Fund distributions or the redemption of Fund shares. Mutual funds are not obligations of or guaranteed by any bank and are not federally insured. Total returns shown include the maximum contingent deferred sales charge of 1.00%, as applicable.
Annual Shareholder Report10
| 1 | Federated Prudent Bear Fund is the successor to Prudent Bear Fund pursuant to a reorganization that took place on December 5, 2008. The information presented above, for the periods prior to December 5, 2008, is historical information for the Class C Shares of the Prudent Bear Fund. |
| 2 | Represents a hypothetical investment of $10,000 in the Fund. A 1.00% contingent deferred sales charge would be applied on any redemption less than one year from the purchase date. The Fund's performance assumes the reinvestment of all dividends and distributions. The S&P 500 and S&P 500 Inverse have been adjusted to reflect reinvestment of dividends on securities in the indexes. |
| 3 | The S&P 500 and the S&P 500 Inverse are not adjusted to reflect taxes, sales charges, expenses or other fees that the SEC requires to be reflected in the Fund's performance. The S&P 500 and the S&P 500 Inverse are unmanaged and, unlike the Fund, are not affected by cash flows. It is not possible to invest directly in an index. |
| 4 | Total returns quoted reflect all applicable contingent deferred sales charges. |
Annual Shareholder Report11
Portfolio of Investments Summary Tables (unaudited)
At September 30, 2009, the Fund's portfolio composition was as follows:
| Percentage of
Total Net Assets |
| Securities Sold Short | (49.6)% |
| Derivative Contracts — Short (notional value)1 | (22.0)% |
| U.S. Treasury Securities | 78.8% |
| U.S. Treasury Securities Held as Collateral for Securities Sold Short | 23.1% |
| Common Stock | 8.1% |
| Other Securities2,3 | 0.0% |
| Cash Equivalents4 | 9.7% |
| Adjustment for Derivative Contracts (notional value)1 | 21.8% |
| Collateral on Deposit for Securities Sold Short | 49.5% |
| Other Assets and Liabilities — Net5 | (19.4)% |
| TOTAL | 100.0% |
| 1 | Derivative contracts may consist of futures, forwards, options and swaps. More complete information regarding the Fund's direct investments in derivative contracts, including unrealized appreciation (depreciation), value, and notional values or amounts of such contracts, can be found in the table at the end of the Portfolio of Investments included in this Report. |
| 2 | Other Securities include warrants and purchased put options. |
| 3 | Represents less than 0.1%. |
| 4 | Cash Equivalents include any investments in money market mutual funds and/or overnight repurchase agreements. |
| 5 | Assets, other than investments in securities, securities sold short, derivative contracts and collateral on deposit for securities sold short, less liabilities. See Statement of Assets and Liabilities. |
Annual Shareholder Report12
At September 30, 2009, the Fund's sector composition6 for its short positions was as follows:| Sector Composition | Percentage of
Total Securities
Sold Short |
| Broad Equity Index | 54.2% |
| Consumer Discretionary | 11.9% |
| Consumer Staples | 8.2% |
| Health Care | 5.1% |
| Industrials | 4.6% |
| Financials | 3.4% |
| Information Technology | 2.6% |
| Telecommunication Services | 2.2% |
| Energy | 1.0% |
| Materials | 1.0% |
| Other7 | 5.8% |
| TOTAL | 100.0% |
| 6 | Sector classifications are based upon, and individual portfolio securities are assigned to, the classifications of the Global Industry Classification Standard (GICS) except that the adviser assigns a classification to securities not classified by the GICS and to securities for which the adviser does not have access to the classification made by the GICS. |
| 7 | Other includes exchange-traded funds. |
Annual Shareholder Report13
Portfolio of Investments
September 30, 2009
|
| Shares, Principal Amount or Units Held | | | Value |
| | Common Stocks – 8.1% | |
| | Energy – 0.0% | |
| 30,000 | 1 | Bankers Petroleum Ltd. | 132,536 |
| 1,000,000 | 1 | Powertech Uranium Corp., Class A | 312,894 |
| | TOTAL | 445,430 |
| | Materials – 8.1% | |
| 3,500,000 | 1 | Abacus Mining & Exploration Corp. | 833,606 |
| 77,400 | | Agnico Eagle Mines Ltd. | 5,251,590 |
| 1,282,000 | 1 | Antares Minerals, Inc. | 1,855,975 |
| 78,125 | 1,2,3 | Aquiline Resources, Inc. | 321,067 |
| 564,715 | 1 | Aquiline Resources, Inc. | 2,291,444 |
| 78,125 | 1,2,3 | Aquiline Resources, Inc. | 321,067 |
| 1,500,000 | 1,4 | Ascot Resources Ltd. | 980,713 |
| 1,140,000 | 1,2,3,4 | Ascot Resources Ltd. | 745,342 |
| 360,000 | 1,2,3,4 | Ascot Resources Ltd. | 235,371 |
| 3,000,000 | 1 | Benton Resources Corp. | 1,401,018 |
| 1,000,000 | 1 | Callinan Mines Ltd. | 840,611 |
| 400,000 | 1 | Cardero Resource Corp. | 440,854 |
| 3,204,000 | 1 | Centamin Egypt Ltd. | 4,907,822 |
| 137,300 | | Cia de Minas Buenaventura SA, Class B, ADR | 4,834,333 |
| 1,000,000 | 1 | Duran Ventures, Inc. | 88,731 |
| 2,171,098 | 1 | East Asia Minerals Corp. | 5,373,754 |
| 150,000 | 1,2,3 | East Asia Minerals Corp. | 371,270 |
| 807,000 | 1 | Evolving Gold Corp. | 934,647 |
| 950,000 | 1,2,3 | Evolving Gold Corp. | 1,100,266 |
| 1,828,200 | 1 | Fortuna Silver Mines, Inc. | 2,561,341 |
| 530,000 | 1,2,3 | Fortuna Silver Mines, Inc. | 742,540 |
| 112,100 | | Goldcorp, Inc., Class A | 4,525,477 |
| 175,000 | 1 | Golden Predator Royalty & Development Corp. | 94,802 |
| 920,000 | 1 | Golden Star Resources Ltd. | 3,136,413 |
| 1,400,000 | 1 | Grayd Resource Corp. | 490,356 |
| 973,800 | 1 | International Tower Hill Mines Ltd. | 3,929,217 |
| 350,000 | 1,2,3 | International Tower Hill Mines Ltd. | 1,412,226 |
Annual Shareholder Report14
|
| 150,000 | 1 | Jaguar Mining, Inc. | 1,342,175 |
| 538,000 | 1 | Kirkland Lake Gold, Inc. | 4,622,986 |
| 1,000,000 | 1,4 | Kootenay Gold, Inc. | 719,189 |
| 500,000 | 1,2,3,4 | Kootenay Gold, Inc. | 359,595 |
| 825,000 | 1,2,3,4 | Kootenay Gold, Inc. | 593,331 |
| 193,500 | 1 | Lake Shore Gold Corp. | 530,345 |
| 1,741,500 | 1 | Lake Shore Gold Corp. | 4,668,290 |
| 1,500,000 | 1,4 | MacArthur Minerals Ltd. | 1,190,865 |
| 800,000 | 1 | Mansfield Minerals, Inc. | 784,570 |
| 72,600 | | Newmont Mining Corp. | 3,195,852 |
| 690,000 | 1 | Osisko Exploration Ltd. | 5,129,968 |
| 2,000,000 | 1 | Palladon Ventures Ltd. | 196,143 |
| 69,100 | | Randgold Resources Ltd., ADR | 4,828,708 |
| 361,400 | 1 | Red Back Mining, Inc. | 4,060,750 |
| 1,500,000 | 1 | Rockgate Capital Corp. | 700,509 |
| 63,500 | | Royal Gold, Inc. | 2,895,600 |
| 1,345,000 | 1 | San Gold Corp. | 3,705,926 |
| 4,000,000 | 1 | Selkirk Metals Corp. | 541,727 |
| 526,238 | 1 | Silver Wheaton Corp. | 6,679,654 |
| 800,000 | 1 | Trevali Resources Corp. | 470,742 |
| 100,000 | 1 | Underworld Resources, Inc. | 121,422 |
| 477,000 | | Yamana Gold, Inc. | 5,108,670 |
| | TOTAL | 102,468,870 |
| | TOTAL COMMON STOCKS
(IDENTIFIED COST $96,892,170) | 102,914,300 |
| | Warrants – 0.0% | |
| | Industrials – 0.0% | |
| 105,990 | 1 | Aura Systems, Inc., Warrants | 7,743 |
| | Materials – 0.0% | |
| 570,000 | 1 | Ascot Resources Ltd., Warrants | 729 |
| 43,500 | 1 | Chesapeake Gold Corp., Warrants | 17,988 |
| 1,050,000 | 1 | EMC Metals Corp., Warrants | 33,074 |
| 475,000 | 1 | Evolving Gold Corp., Warrants | 116,276 |
| 262,500 | 1 | Golden Predator Royalty & Development Corp., Warrants | 0 |
| 412,500 | 1 | Kootenay Gold, Inc., Warrants | 1,855 |
Annual Shareholder Report15
|
| 250,000 | 1 | Kootenay Gold, Inc., Warrants | 17,880 |
| 313,333 | 1 | Northrock Resources, Inc., Warrants | 0 |
| | TOTAL | 187,802 |
| | TOTAL WARRANTS
(IDENTIFIED COST $18,135) | 195,545 |
| | Purchased Put Options – 0.0% | |
| 650 | 1 | Juniper Networks, Inc., Strike Price $21, Expiration Date 10/17/2009 | 4,875 |
| 3,000 | 1 | Semiconductor Holders Trust, Strike Price $24, Expiration Date 11/21/2009 | 204,000 |
| 700 | 1 | Western Digital Corp., Strike Price $22.50, Expiration Date 10/17/2009 | 5,250 |
| | TOTAL PURCHASED PUT OPTIONS
(IDENTIFIED COST $405,260) | 214,125 |
| | U.S. Treasury – 101.9%;5 | |
| | U.S. Treasury Bills – 101.9% | |
| $277,200,000 | | U.S. Treasury Bill, 0.085%, 10/1/2009 | 277,200,000 |
| 186,000,000 | 6 | U.S. Treasury Bill, 0.04%, 10/22/2009 | 185,996,466 |
| 23,000,000 | | U.S. Treasury Bill, 0.04%, 10/29/2009 | 22,999,038 |
| 66,000,000 | | U.S. Treasury Bill, 0.05%, 11/12/2009 | 65,996,535 |
| 108,000,000 | 6 | U.S. Treasury Bill, 0.18%, 11/19/2009 | 107,991,544 |
| 40,000,000 | | U.S. Treasury Bill, 0.14%, 12/10/2009 | 39,995,140 |
| 250,000,000 | | U.S. Treasury Bill, 0.285%, 2/11/2010 | 249,894,315 |
| 349,000,000 | | U.S. Treasury Bill, 0.275%, 2/4/2010 | 348,877,850 |
| | TOTAL U.S. TREASURY
(IDENTIFIED COST $1,298,906,945) | 1,298,950,888 |
| | Mutual Fund – 9.7% | |
| 123,052,804 | 4,7 | U.S. Treasury Cash Reserves Fund, Institutional Shares, 0.00%
(AT NET ASSET VALUE) | 123,052,804 |
| | TOTAL INVESTMENTS — 119.7%
(IDENTIFIED COST $1,519,275,314)8 | 1,525,327,662 |
| | OTHER ASSETS AND LIABILITIES - NET — (19.7)%9 | (250,934,990) |
| | TOTAL NET ASSETS — 100% | $1,274,392,672 |
Annual Shareholder Report16
SCHEDULE OF SECURITIES SOLD SHORT
| Shares | | Value |
| 680,000 | Amex Financial Select Standard & Poor Depository Receipt | $10,159,200 |
| 135,000 | Au Optronics Corp., Class ADR | 1,306,800 |
| 160,000 | Bard (C.R.), Inc. | 12,577,600 |
| 800,000 | Burger King Holdings, Inc. | 14,072,000 |
| 145,000 | Comcast Corp., Class A | 2,449,050 |
| 355,000 | Consumer Discretionary Select Sector SPDR Fund | 9,751,850 |
| 230,000 | Consumer Staples Select Sector SPDR Fund | 5,855,800 |
| 85,000 | Corning, Inc. | 1,301,350 |
| 130,000 | Danaher Corp. | 8,751,600 |
| 347,500 | Darden Restaurants, Inc. | 11,860,175 |
| 135,000 | Ecolab, Inc. | 6,241,050 |
| 240,000 | Estee Lauder Cos., Inc., Class A | 8,899,200 |
| 50,000 | FTI Consulting, Inc. | 2,130,500 |
| 829,000 | Hologic, Inc. | 13,545,860 |
| 500,000 | Home Depot, Inc. | 13,320,000 |
| 390,000 | Industrial Select Sect SPDR | 10,272,600 |
| 25,000 | Juniper Networks, Inc. | 675,500 |
| 170,000 | Kimberly-Clark Corp. | 10,026,600 |
| 115,000 | Kinder Morgan Energy Partners LP | 6,212,300 |
| 130,000 | Kraft Foods, Inc., Class A | 3,415,100 |
| 170,000 | Landstar System, Inc. | 6,470,200 |
| 250,000 | Lowe's Cos., Inc. | 5,235,000 |
| 1 | Marriott International Inc. | 21 |
| 235,000 | Materials Select Sector SPDR Trust | 7,261,500 |
| 280,000 | McCormick & Co., Inc. | 9,503,200 |
| 420,000 | Nokia Oyj, Class A, ADR | 6,140,400 |
| 35,000 | Novellus Systems, Inc. | 734,300 |
| 485,000 | Pitney Bowes, Inc. | 12,052,250 |
| 370,000 | Plum Creek Timber Co., Inc. | 11,336,800 |
| 70,000 | Research in Motion Ltd. | 4,728,500 |
| 3,244,300 | S&P Depositary Receipts Trust | 342,468,308 |
| 555,000 | Sara Lee Corp. | 6,182,700 |
| 100,000 | SPDR S&P Retail ETF | 3,413,000 |
| 595,000 | Staples, Inc. | 13,815,900 |
| 560,000 | Sysco Corp. | 13,916,000 |
Annual Shareholder Report17
| Shares | | Value |
| 140,000 | Varian Medical Systems, Inc. | $5,898,200 |
| 450,000 | Verizon Communications, Inc. | 13,621,500 |
| 27,000 | Visa, Inc., Class A | 1,865,970 |
| 420,000 | Yum! Brands, Inc. | 14,179,200 |
| TOTAL SECURITIES SOLD SHORT (PROCEEDS $553,772,282) | $631,647,084 |
- At September 30, 2009, the Fund had the following outstanding futures contracts:
| Description | Number of
Contracts | Notional
Value | Expiration
Date | Unrealized
Depreciation |
| 1S&P 500 Index Short Futures | 1,065 | $280,334,625 | December 2009 | $(2,123,197) |
- Unrealized Depreciation on Futures Contracts and Value of Securities Sold Short are included in “Other Assets and Liabilities - Net.”
- Note: The categories of investments are shown as a percentage of total net assets at September 30, 2009.
Annual Shareholder Report18
- Various inputs are used in determining the value of the Fund's investments. These inputs are summarized in the three broad levels listed below:
- Level 1 — quoted prices in active markets for identical securities
- Level 2 — other significant observable inputs (including quoted prices for similar securities, interest rates, prepayment speeds, credit risk, etc.)
- Level 3 — significant unobservable inputs (including the Fund's own assumptions in determining the fair value of investments)
- The inputs or methodology used for valuing securities are not an indication of the risk associated with investing in those securities.
- The following is a summary of the inputs used, as of September 30, 2009, in valuing the Fund's assets carried at fair value:
| Valuation Inputs | | | | |
| Level 1 —
Quoted
Prices and
Investments in
Mutual Funds | Level 2 —
Other
Significant
Observable
Inputs | Level 3 —
Significant
Unobservable
Inputs | Total |
| Equity Securities: | | | | |
| Domestic | $6,091,452 | $ — | $ — | $6,091,452 |
| International | 96,822,848 | — | — | 96,822,848 |
| Warrants | — | 195,545 | — | 195,545 |
| Purchased Put Options | 214,125 | — | — | 214,125 |
| Debt Securities: | | | | |
| U.S. Treasury | — | 1,298,950,888 | — | 1,298,950,888 |
| Mutual Fund | 123,052,804 | — | — | 123,052,804 |
| TOTAL SECURITIES | $226,181,229 | $1,299,146,433 | $ — | $1,525,327,662 |
| OTHER FINANCIAL INSTRUMENTS* | $(633,770,281) | $ — | $ — | $(633,770,281) |
| * | Other financial instruments include securities sold short and futures contracts. |
- The following acronym is used throughout this portfolio:
- ADR — American Depositary Receipt
- See Notes which are an integral part of the Financial Statements
Annual Shareholder Report19
Statement of Assets and Liabilities
September 30, 2009
| Assets: | | |
| Total investments in securities, at value including $127,877,210 of investments in affiliated issuers (Note 5) (identified cost $1,519,275,314) | | $1,525,327,662 |
| Deposit at brokers for short sales | | 630,229,741 |
| Income receivable | | 9,134 |
| Receivable for investments sold | | 23,068,686 |
| Receivable for shares sold | | 25,709,462 |
| Receivable for daily variation margin | | 421,946 |
| TOTAL ASSETS | | 2,204,766,631 |
| Liabilities: | | |
| Securities sold short, at value (proceeds $553,772,282) | $631,647,084 | |
| Dividends payable on short positions | 2,175,676 | |
| Payable for investments purchased | 292,902,627 | |
| Payable for shares redeemed | 2,824,109 | |
| Payable for distribution services fee (Note 5) | 101,950 | |
| Payable for shareholder services fee (Note 5) | 418,246 | |
| Accrued expenses | 304,267 | |
| TOTAL LIABILITIES | | 930,373,959 |
| Net assets for 222,864,256 shares outstanding | | $1,274,392,672 |
| Net Assets Consist of: | | |
| Paid-in capital | | $1,435,308,720 |
| Net unrealized depreciation of investments, short sales, futures contracts and translation of assets and liabilities in foreign currency | | (73,945,658) |
| Accumulated net realized loss on investments, short sales, futures contracts and foreign currency transactions | | (84,537,135) |
| Distributions in excess of net investment income | | (2,433,255) |
| TOTAL NET ASSETS | | $1,274,392,672 |
Annual Shareholder Report20
Statement of Assets and Liabilities — continued| Net Asset Value, Offering Price and Redemption Proceeds Per Share | | |
| Class A Shares: | | |
| Net asset value per share ($1,079,142,598 ÷ 187,863,312 shares outstanding), no par value, unlimited shares authorized | | $5.74 |
| Offering price per share (100/94.50 of $5.74) | | $6.07 |
| Redemption proceeds per share | | $5.74 |
| Class C Shares: | | |
| Net asset value per share ($96,517,691 ÷ 17,859,796 shares outstanding), no par value, unlimited shares authorized | | $5.40 |
| Offering price per share | | $5.40 |
| Redemption proceeds per share (99.00/100 of $5.40) | | $5.35 |
| Institutional Shares: | | |
| Net asset value per share ($98,732,383 ÷ 17,141,148 shares outstanding), no par value, unlimited shares authorized | | $5.76 |
| Offering price per share | | $5.76 |
| Redemption proceeds per share | | $5.76 |
- See Notes which are an integral part of the Financial Statements
Annual Shareholder Report21
Statement of Operations
Year Ended September 30, 2009
| Investment Income: | | | |
| Dividends (including $30,443 received from affiliated issuers (Note 5) and net of foreign taxes withheld of $8,053) | | | $387,121 |
| Interest | | | 6,521,840 |
| TOTAL INCOME | | | 6,908,961 |
| Expenses: | | | |
| Investment adviser fee (Note 5) | | $14,081,214 | |
| Administrative personnel and services fee (Note 5) | | 854,047 | |
| Custodian fees | | 96,611 | |
| Transfer and dividend disbursing agent fees and expenses | | 983,636 | |
| Directors'/Trustees' fees | | 75 | |
| Auditing fees | | 18,104 | |
| Legal fees | | 12,145 | |
| Portfolio accounting fees | | 177,094 | |
| Distribution services fee — Class A Shares (Note 5) | | 533,746 | |
| Distribution services fee — Class C Shares (Note 5) | | 517,958 | |
| Shareholder services fee — Class A Shares (Note 5) | | 2,034,715 | |
| Shareholder services fee — Class C Shares (Note 5) | | 136,038 | |
| Share registration costs | | 321,430 | |
| Printing and postage | | 62,478 | |
| Insurance premiums | | 16,326 | |
| Dividends on short positions | | 12,622,974 | |
| Miscellaneous | | 80,265 | |
| TOTAL EXPENSES | | 32,548,856 | |
Annual Shareholder Report22
Statement of Operations — continued| Reimbursement, Waiver and Expense Reduction: | | | |
| Reimbursement of investment adviser fee (Note 5) | $(66,204) | | |
| Waiver of administrative personnel and services fee (Note 5) | (13,339) | | |
| Fees paid indirectly from directed brokerage arrangements (Note 6) | (258,530) | | |
| TOTAL REIMBURSEMENT, WAIVER AND EXPENSE REDUCTION | | $(338,073) | |
| Net expenses | | | $32,210,783 |
| Net investment income (loss) | | | (25,301,822) |
| Realized and Unrealized Gain (Loss) on Investments, Short Sales, Futures Contracts and Foreign Currency Transactions: | | | |
| Net realized gain on investments and foreign currency transactions | | | 22,959,834 |
| Net realized gain on short sales | | | 49,135,989 |
| Net realized gain on futures contracts | | | 52,789,941 |
| Net change in unrealized depreciation of investments and translation of assets and liabilities in foreign currency | | | 51,070,652 |
| Net change in unrealized appreciation of short sales | | | (121,604,265) |
| Net change in unrealized appreciation of futures contracts | | | (19,955,759) |
| Net realized and unrealized gain on investments, short sales, futures contracts and foreign currency transactions | | | 34,396,392 |
| Change in net assets resulting from operations | | | $9,094,570 |
- See Notes which are an integral part of the Financial Statements
Annual Shareholder Report23
Statement of Changes in Net Assets
| Year Ended September 30 | 2009 | 2008 |
| Increase (Decrease) in Net Assets | | |
| Operations: | | |
| Net investment income (loss) | $(25,301,822) | $8,480,093 |
| Net realized gain on investments, short sales, futures contracts and foreign currency transactions | 124,885,764 | 127,804,837 |
| Net change in unrealized appreciation/depreciation of investments, short sales, futures contracts and translation of assets and liabilities in foreign currency | (90,489,372) | 5,530,726 |
| CHANGE IN NET ASSETS RESULTING FROM OPERATIONS | 9,094,570 | 141,815,656 |
| Distributions to Shareholders: | | |
| Distributions from net investment income | | |
| Class A Shares | — | (26,200,904) |
| Class C Shares | — | (1,491,647) |
Distributions from net realized gain on investments, short sales,
futures contracts and foreign currency transactions | | |
| Class A Shares | (173,510,350) | — |
| Class C Shares | (10,042,019) | — |
| Return of capital | | |
| Class A Shares | (1,818,702) | — |
| Class C Shares | (105,258) | — |
| CHANGE IN NET ASSETS RESULTING FROM DISTRIBUTIONS TO SHAREHOLDERS | (185,476,329) | (27,692,551) |
| Share Transactions: | | |
| Proceeds from sale of shares | 1,467,215,872 | 1,035,095,704 |
| Net asset value of shares issued to shareholders in payment of distributions declared | 169,504,332 | 24,569,158 |
| Cost of shares redeemed | (1,306,118,568) | (846,993,617) |
| CHANGE IN NET ASSETS RESULTING FROM SHARE TRANSACTIONS | 330,601,636 | 212,671,245 |
| Redemption fees | — | 595,501 |
| Change in net assets | 154,219,877 | 327,389,851 |
| Net Assets: | | |
| Beginning of period | 1,120,172,795 | 792,782,944 |
| End of period (including distributions in excess of net investment income of $(2,433,255) and $(7,781,610), respectively) | $1,274,392,672 | $1,120,172,795 |
- See Notes which are an integral part of the Financial Statements
Annual Shareholder Report24
Notes to Financial Statements
September 30, 2009
1. ORGANIZATION
Federated Equity Funds (the “Trust”) is registered under the Investment Company Act of 1940, as amended (the “Act”), as a diversified, open-end management investment company. The Trust consists of thirteen portfolios. The financial statements included herein are only those of the Federated Prudent Bear Fund (the “Fund”). The financial statements of the other portfolios are presented separately. The assets of each portfolio are segregated and a shareholder's interest is limited to the portfolio in which shares are held. Each portfolio pays its own expenses. The Fund offers three classes of shares: Class A Shares, Class C Shares and Institutional Shares. All Shares of the Fund have equal rights with respect to voting, except on class-specific matters. The financial highlights of the Institutional Shares are presented separately. The investment objective of the Fund is to seek capital appreciation.
Prudent Bear Fund (the “Predecessor Fund”) was reorganized into the Fund as of the close of business on December 5, 2008. Prior to the reorganization, the Fund had no investment operations.
The Fund commenced offering Institutional Shares on December 8, 2008.
2. SIGNIFICANT ACCOUNTING POLICIES
The following is a summary of significant accounting policies consistently followed by the Fund in the preparation of its financial statements. These policies are in conformity with U.S. generally accepted accounting principles (GAAP).
Investment Valuation
In calculating its net asset value (NAV), the Fund generally values investments as follows:
- Equity securities including shares of Exchange Traded Funds listed on an exchange or traded through a regulated market system are valued at their last reported sale price or official closing price in their principal exchange or market.
- Fixed-income securities acquired with remaining maturities greater than 60 days are fair valued using price evaluations provided by a pricing service approved by the Trustees.
- Fixed-income securities acquired with remaining maturities of 60 days or less are valued at their cost (adjusted for the accretion of any discount or amortization of any premium).
- Shares of other mutual funds are valued based upon their reported NAVs.
- Derivative contracts listed on exchanges are valued at their reported settlement or closing price.
- Over-the-counter (OTC) derivative contracts are fair valued using price evaluations provided by a pricing service approved by the Trustees.
If the Fund cannot obtain a price or price evaluation from a pricing service for an investment, the Fund may attempt to value the investment based upon the mean of bid and asked quotations or fair value the investment based on price evaluations, from one or more dealers. If any price, quotation, price evaluation or other pricing source is not readily available when the NAV is calculated, the Fund uses the fair value of the investment determined in accordance with the procedures described below. There can be no assurance that the Fund could purchase or sell an investment at the price used to calculate the Fund's NAV.
Annual Shareholder Report25
Fair Valuation and Significant Events ProceduresThe Trustees have authorized the use of pricing services to provide evaluations of the current fair value of certain investments for purposes of calculating the NAV. Factors considered by pricing services in evaluating an investment include the yields or prices of investments of comparable quality, coupon, maturity, call rights and other potential prepayments, terms and type, reported transactions, indications as to values from dealers, and general market conditions. Some pricing services provide a single price evaluation reflecting the bid-side of the market for an investment (a “bid” evaluation). Other pricing services offer both bid evaluations and price evaluations indicative of a price between the prices bid and asked for the investment (a “mid” evaluation). The Fund normally uses bid evaluations for U.S. Treasury and Agency securities, mortgage-backed securities and municipal securities. The Fund normally uses mid evaluations for other types of fixed-income securities and OTC derivative contracts. In the event that market quotations and price evaluations are not available for an investment, the fair value of the investment is determined in accordance with procedures adopted by the Trustees.
The Trustees also have adopted procedures requiring an investment to be priced at its fair value whenever the Adviser determines that a significant event affecting the value of the investment has occurred between the time as of which the price of the investment would otherwise be determined and the time as of which the NAV is computed. An event is considered significant if there is both an affirmative expectation that the investment's value will change in response to the event and a reasonable basis for quantifying the resulting change in value. Examples of significant events that may occur after the close of the principal market on which a security is traded, or after the time of a price evaluation provided by a pricing service or a dealer, include:
- With respect to securities traded in foreign markets, significant trends in U.S. equity markets or in the trading of foreign securities index futures or options contracts;
- With respect to price evaluations of fixed-income securities determined before the close of regular trading on the NYSE, actions by the Federal Reserve Open Market Committee and other significant trends in U.S. fixed-income markets;
- Political or other developments affecting the economy or markets in which an issuer conducts its operations or its securities are traded; and
- Announcements concerning matters such as acquisitions, recapitalizations, litigation developments, a natural disaster affecting the issuer's operations or regulatory changes or market developments affecting the issuer's industry.
The Trustees have approved the use of a pricing service to determine the fair value of equity securities traded principally in foreign markets when the Adviser determines that there has been a significant trend in the U.S. equity markets or in index futures trading. For other significant events, the Fund may seek to obtain more current quotations or price evaluations from alternative pricing sources. If a reliable alternative pricing source is not available, the Fund will determine the fair value of the investment using another method approved by the Trustees.
Repurchase Agreements
It is the policy of the Fund to require the other party to a repurchase agreement to transfer to the Fund's custodian or sub-custodian eligible securities or cash with a market value (after transaction costs) at least equal to the repurchase price to be paid under the repurchase agreement. The eligible securities are transferred to accounts with the custodian or sub-custodian in which the Fund holds a “securities entitlement” and exercises “control” as those terms are defined in the Uniform Commercial Code. The Fund has established procedures for Annual Shareholder Report26
monitoring the market value of the transferred securities and requiring the transfer of additional eligible securities if necessary to equal at least the repurchase price. These procedures also allow the other party to require securities to be transferred from the account to the extent that their market value exceeds the repurchase price or in exchange for other eligible securities of equivalent market value.With respect to agreements to repurchase U.S. government securities and cash items, the Fund treats the repurchase agreement as an investment in the underlying securities and not as an obligation of the other party to the repurchase agreement. Other repurchase agreements are treated as obligations of the other party secured by the underlying securities. Nevertheless, the insolvency of the other party or other failure to repurchase the securities may delay the disposition of the underlying securities or cause the Fund to receive less than the full repurchase price. Under the terms of the repurchase agreement, any amounts received by the Fund in excess of the repurchase price and related transaction costs must be remitted to the other party.
The Fund may enter into repurchase agreements in which eligible securities are transferred into joint trading accounts maintained by the custodian or sub-custodian for investment companies and other clients advised by the Fund's Adviser and its affiliates. The Fund will participate on a pro-rata basis with the other investment companies and clients in its share of the securities transferred under such repurchase agreements and in its share of proceeds from any repurchase or other disposition of such securities.
Investment Income, Gains and Losses, Expenses and Distributions
Investment transactions are accounted for on a trade-date basis. Realized gains and losses from investment transactions are recorded on an identified-cost basis. Interest income and expenses are accrued daily. Dividend income and distributions to shareholders are recorded on the ex-dividend date. Foreign dividends are recorded on the ex-dividend date or when the Fund is informed of the ex-dividend date. Distributions of net investment income, if any, are declared and paid annually. Non-cash dividends included in dividend income, if any, are recorded at fair value. Investment income, realized and unrealized gains and losses, and certain fund-level expenses are allocated to each class based on relative average daily net assets, except that each class may bear certain expenses unique to that class such as distribution services and shareholder services fees. Dividends are declared separately for each class. No class has preferential dividend rights; differences in per share dividend rates are generally due to differences in separate class expenses.
Premium and Discount Amortization
All premiums and discounts on fixed-income securities are amortized/accreted for financial statement purposes.
Federal Taxes
It is the Fund's policy to comply with the Subchapter M provision of the Internal Revenue Code (the “Code”) and to distribute to shareholders each year substantially all of its income. Accordingly, no provision for federal income tax is necessary. As of and during the year ended September 30, 2009, the Fund did not have a liability for any uncertain tax positions. The Fund recognizes interest and penalties, if any, related to tax liabilities as income tax expense in the Statement of Operations. As of September 30, 2009, the following tax years remain subject to examination by the Fund's major tax jurisdictions, the United States of America (2006 through 2009), the state of Maryland (2006 through 2008) and the Commonwealth of Massachusetts (2009).
Annual Shareholder Report27
The Fund may be subject to taxes imposed by governments of countries in which it invests. Such taxes are generally based on either income or gains earned or repatriated. The Fund accrues and applies such taxes to net investment income, net realized gains and net unrealized gains as income and/or gains are earned.When-Issued and Delayed Delivery Transactions
The Fund may engage in when-issued or delayed delivery transactions. The Fund records when-issued securities on the trade date and maintains security positions such that sufficient liquid assets will be available to make payment for the securities purchased. Securities purchased on a when-issued or delayed delivery basis are marked to market daily and begin earning interest on the settlement date. Losses may occur on these transactions due to changes in market conditions or the failure of counterparties to perform under the contract.
Futures Contracts
The Fund purchases and sells financial futures contracts to manage cash flows, enhance yield, manage duration and to potentially reduce transaction costs. Upon entering into a financial futures contract with a broker, the Fund is required to deposit in a segregated account a specified amount of cash or U.S. government securities. Futures contracts are valued daily and unrealized gains or losses are recorded in a “variation margin” account. Daily, the Fund receives from or pays to the broker a specified amount of cash based upon changes in the variation margin account. When a contract is closed, the Fund recognizes a realized gain or loss. Futures contracts have market risks, including the risk that the change in the value of the contract may not correlate with the changes in the value of the underlying securities. There is minimal counterparty risk to the Fund since futures are exchange traded and the exchange's clearing house, as counterparty to all exchange traded futures, guarantees the futures against default.
Futures contracts outstanding at period end are listed after the Fund's Portfolio of Investments.
Foreign Exchange Contracts
The Fund may enter into foreign exchange contracts for the delayed delivery of securities or foreign currency exchange transactions. The Fund may enter into foreign exchange contracts to protect assets against adverse changes in foreign currency exchange rates or exchange control regulations. Purchased contracts are used to acquire exposure to foreign currencies, whereas, contracts to sell are used to hedge the Fund's securities against currency fluctuations. Risks may arise upon entering into these transactions from the potential inability of counterparties to meet the terms of their commitments and from unanticipated movements in security prices or foreign exchange rates. The foreign exchange contracts are adjusted by the daily exchange rate of the underlying currency and any gains or losses are recorded for financial statement purposes as unrealized until the settlement date.
At September 30, 2009, the Fund had no outstanding foreign exchange contracts.
Foreign Currency Translation
The accounting records of the Fund are maintained in U.S. dollars. All assets and liabilities denominated in foreign currencies (FCs) are translated into U.S. dollars based on the rates of exchange of such currencies against U.S. dollars on the date of valuation. Purchases and sales of securities, income and expenses are translated at the rate of exchange quoted on the Annual Shareholder Report28
respective date that such transactions are recorded. The Fund does not isolate that portion of the results of operations resulting from changes in foreign exchange rates on investments from the fluctuations arising from changes in market prices of securities held. Such fluctuations are included with the net realized and unrealized gain or loss from investments.Reported net realized foreign exchange gains or losses arise from sales of portfolio securities, sales and maturities of short-term securities, sales of FCs, currency gains or losses realized between the trade and settlement dates on securities transactions, the difference between the amounts of dividends, interest and foreign withholding taxes recorded on the Fund's books and the U.S. dollar equivalent of the amounts actually received or paid. Net unrealized foreign exchange gains and losses arise from changes in the value of assets and liabilities other than investments in securities at fiscal year end, resulting from changes in the exchange rate.
Short Sales
The Fund may sell a security in an effort to take advantage of an anticipated decline in the price of a security. In a short sale, the Fund sells a security it does not own, and must borrow the security in order to deliver it at completion of the sale. The Fund then has an obligation to replace the borrowed security. If the Fund can buy the security back at a lower price than it sold it for, a gain is realized. If the Fund has to buy the security back at a higher price, a loss is realized. For the year ended September 30, 2009, the Fund had a net realized gain on short sales of $49,135,989.
Restricted Securities
Restricted securities are securities that either: (a) cannot be offered for public sale without first being registered, or being able to take advantage of an exemption from registration, under the Securities Act of 1933; or (b) are subject to contractual restrictions on public sales. In some cases, when a security cannot be offered for public sale without first being registered, the issuer of the restricted security has agreed to register such securities for resale, at the issuer's expense, either upon demand by the Fund or in connection with another registered offering of the securities. Many such restricted securities may be resold in the secondary market in transactions exempt from registration. Restricted securities may be determined to be liquid under criteria established by the Trustees. The Fund will not incur any registration costs upon such resales. The Fund's restricted securities are valued at the price provided by dealers in the secondary market or, if no market prices are available, at the fair value as determined in accordance with procedures established by and under the general supervision of the Trustees.
Annual Shareholder Report29
Additional Disclosure Related to Derivative Instruments| Fair Value of Derivative Instruments |
| Asset | Liability |
| Statement of
Assets and
Liabilities
Location | Fair
Value | Statement of
Assets and
Liabilities
Location | Fair
Value |
| Derivatives not accounted for as hedging instruments under ASC Topic 815 | | | | |
| Equity contracts | Total investments in securities, at value | $214,125 | Payable for daily variation margin | $2,123,197* |
| Total derivatives not accounted for as hedging instruments under ASC Topic 815 | | $214,125 | | $2,123,197* |
| * | Includes cumulative appreciation/depreciation of futures contracts as reported in the footnotes to the Portfolio of Investments. Only the current day's variation margin is reported within the Statement of Assets and Liabilities. |
The Effect of Derivative Instruments on the Statement of Operations for the Year Ended September 30, 2009
| Amount of Realized Gain or (Loss) on Derivatives Recognized in Income |
| Futures | Options Purchased | Total |
| Equity contracts | $52,789,941 | $56,166,012 | $108,955,953 |
| Change in Unrealized Appreciation or (Depreciation) on Derivatives Recognized in Income |
| Futures | Options Purchased | Total |
| Equity contracts | $(19,955,759) | $(10,836,557) | $(30,792,316) |
Other
The preparation of financial statements in conformity with GAAP requires management to make estimates and assumptions that affect the amounts of assets, liabilities, expenses and revenues reported in the financial statements. Actual results could differ from those estimated.
3. SHARES OF BENEFICIAL INTEREST
The following tables summarize share activity:
| Year Ended September 30 |
2009 |
2008 |
| Class A Shares: | Shares | Amount | Shares | Amount |
| Shares sold | 181,643,280 | $1,239,068,201 | 151,743,434 | $993,068,972 |
| Shares issued to shareholders in payment of distributions declared | 22,521,701 | 159,903,968 | 3,739,564 | 23,372,279 |
| Shares redeemed | (170,901,800) | (1,222,208,200) | (126,354,362) | (817,484,352) |
NET CHANGE RESULTING
FROM CLASS A
SHARE TRANSACTIONS | 33,263,181 | $176,763,969 | 29,128,636 | $198,956,899 |
Annual Shareholder Report30
| Year Ended September 30 |
2009 |
2008 |
| Class C Shares: | Shares | Amount | Shares | Amount |
| Shares sold | 15,576,712 | $95,640,248 | 6,724,197 | $42,026,732 |
| Shares issued to shareholders in payment of distributions declared | 1,428,625 | 9,600,364 | 199,148 | 1,196,879 |
| Shares redeemed | (9,234,650) | (63,425,320) | (4,725,762) | (29,509,265) |
NET CHANGE RESULTING
FROM CLASS C
SHARE TRANSACTIONS | 7,770,687 | $41,815,292 | 2,197,583 | $13,714,346 |
| Period Ended
9/30/20091 | Year Ended
9/30/2008 |
| Institutional Shares: | Shares | Amount | Shares | Amount |
| Shares sold | 20,490,104 | $132,507,423 | — | $ — |
| Shares redeemed | (3,348,956) | (20,485,048) | — | — |
NET CHANGE RESULTING
FROM INSTITUTIONAL
SHARE TRANSACTIONS | 17,141,148 | $112,022,375 | — | $ — |
| NET CHANGE RESULTING FROM FUND SHARE TRANSACTIONS | 58,175,016 | $330,601,636 | 31,326,219 | $212,671,245 |
| 1 | Reflects operations for the period from December 8, 2008 (date of initial investment) to September 30, 2009. |
Redemption Fees
Prior to December 5, 2008, the Predecessor Fund imposed a 1.00% redemption fee to shareholders of the Fund's Class A Shares and Class C Shares who redeemed shares held for 30 days or less. Shares acquired by reinvestment of dividends or distributions of the Fund, or purchased pursuant to the Systematic Investment Program or withdrawn pursuant to the Systematic Withdrawal Program, were not subject to the redemption fee. All redemption fees were recorded by the Predecessor Fund as additions to paid-in capital. For the year ended September 30, 2008, the redemption fees for Class A Shares and Class C Shares amounted to $588,061 and $7,440, respectively.
4. FEDERAL TAX INFORMATION
The timing and character of income and capital gain distributions are determined in accordance with income tax regulations, which may differ from GAAP. These differences are due in part to differing treatments for foreign currency transactions, dividends paid on short positions, passive foreign investment company adjustments and net operating loss.
For the year ended September 30, 2009, permanent differences identified and reclassified among the components of net assets were as follows:
| Increase (Decrease) |
| Paid-In Capital | Undistributed
Net Investment
Income (Loss) | Accumulated
Net Realized
Gain (Loss) |
| $(21,180,550) | $30,650,177 | $(9,469,627) |
Annual Shareholder Report31
Net investment income (loss), net realized gains (losses) and net assets were not affected by this reclassification.
The tax character of distributions as reported on the Statement of Changes in Net Assets for the years ended September 30, 2009 and 2008 was as follows:
| 2009 | 2008 |
| Ordinary income1 | $121,757,399 | $27,692,551 |
| Long-term capital gains | $61,794,970 | $ — |
| Return of capital | $1,923,960 | $ — |
| 1 | For tax purposes, short-term capital gain distributions are considered ordinary income distributions. |
As of September 30, 2009, the components of distributable earnings on a tax basis were as follows:
| Net unrealized depreciation | $(119,694,427) |
| Capital and currency loss deferrals | $(41,221,621) |
The difference between book-basis and tax-basis net unrealized appreciation/depreciation is attributable in part to differing treatments for the deferral of losses on wash sales and the realization for tax purposes of unrealized gains on investments in passive foreign investment companies.
At September 30, 2009, the cost of investments for federal tax purposes was $1,564,030,219. The net unrealized depreciation of investments for federal tax purposes excluding any unrealized depreciation resulting from changes in foreign currency exchange rates, securities sold short and futures contracts was $38,702,557. This consists of net unrealized depreciation from investments for those securities having an excess of cost over value of $38,702,557.
Under current tax regulations, capital losses on security transactions and foreign currency losses realized after October 31 may be deferred and treated as occurring on the first day of the following fiscal year. As of September 30, 2009, for federal income tax purposes, post-October losses of $41,057,248 on capital losses on security transactions and $164,373 on foreign currency losses were deferred to October 1, 2009.
5. INVESTMENT ADVISER FEE AND OTHER TRANSACTIONS WITH AFFILIATES
Investment Adviser Fee
Federated Equity Management Company of Pennsylvania is the Fund's investment adviser (the “Adviser”). The advisory agreement between the Fund and the Adviser provides for an annual fee equal to 1.25% of the Fund's average daily net assets. Subject to the terms described in the Expense Limitation note, the Adviser may voluntarily choose to waive any portion of its fee and/or reimburse certain operating expenses of the Fund. The Adviser can modify or terminate this voluntary waiver and/or reimbursement at any time at its sole discretion.
For the period from December 6, 2008 to September 30, 2009, the net fee paid to the Adviser was $11,260,773.
Prior to the close of business on December 5, 2008, the Predecessor Fund's investment adviser was David W. Tice & Associates, LLC. After the close of business on December 5, 2008, the Predecessor Fund was reorganized into the Fund. The annual rate did not change due to this reorganization. For the period from October 1, 2008 to December 5, 2008, the net fee paid to David W. Tice & Associates, LLC was $2,754,237.
Annual Shareholder Report32
Administrative FeeEffective close of business on December 5, 2008, Federated Administrative Services (FAS), under the Administrative Services Agreement, provides the Fund with administrative personnel and services. The fee paid to FAS is based on the average aggregate daily net assets of certain Federated funds as specified below:
| Administrative Fee | Average Aggregate Daily Net Assets
of the Federated Funds |
| 0.150% | on the first $5 billion |
| 0.125% | on the next $5 billion |
| 0.100% | on the next $10 billion |
| 0.075% | on assets in excess of $20 billion |
The administrative fee received during any fiscal year shall be at least $150,000 per portfolio and $40,000 per each additional class of Shares. Subject to the terms described in the Expense Limitation note, FAS may voluntarily choose to waive any portion of its fee. FAS can modify or terminate this voluntary waiver at any time at its sole discretion. The fee for the period from December 6, 2008 to September 30, 2009 is pro-rated. For the period from December 6, 2008 to September 30, 2009, the net fee paid to FAS was $689,586 and represented 0.076% of average daily net assets of the Fund. FAS waived $13,339 of its fee.
Prior to close of business on December 5, 2008, U.S. Bancorp Fund Services, LLC provided administrative services to the Predecessor Fund. For the period from October 1, 2008 to December 5, 2008, the net fee paid to U.S. Bancorp Fund Services, LLC was $151,122.
Annual Shareholder Report33
Distribution Services FeeThe Fund has adopted a Distribution Plan (the “Plan”) pursuant to Rule 12b-1 under the Act. Under the terms of the Plan, the Fund will compensate Federated Securities Corp. (FSC), the principal distributor, from the daily net assets of the Fund's Class A Shares and Class C Shares to finance activities intended to result in the sale of these shares. The Plan provides that the Fund may incur distribution expenses at the following percentages of average daily net assets annually, to compensate FSC:
| Share Class Name | Percentage of Average Daily
Net Assets of Class |
| Class A Shares | 0.05% |
| Class C Shares | 0.75% |
Subject to the terms described in the Expense Limitation note, FSC may voluntarily choose to waive any portion of its fee. FSC can modify or terminate this voluntary waiver at any time at its sole discretion. When FSC receives fees, it may pay some or all of them to financial intermediaries whose customers purchase shares. For the period from December 6, 2008 to September 30, 2009, the net fee paid to FSC was $412,792. For the period from December 6, 2008 to September 30, 2009, FSC retained $205,647 of fees paid by the Fund.
Prior to close of business on December 5, 2008, Quasar Distributions, LLC was the principal distributor for the Predecessor Fund. The Predecessor Fund adopted a Service and Distribution Plan pursuant to Rule 12b-1 under the Act. The Predecessor Fund's plan authorized payments by the Fund inconnection with the distribution of its shares at an annual rate of up to 0.25% of the Fund's average daily net assets for the Class A Shares and 1.00% for the Class C Shares. For the period from October 1, 2008 to December 5, 2008, the net fee paid to Quasar Distributors, LLC was $638,912.
Sales Charges
Front-end sales charges and contingent deferred sales charges (CDSC) do not represent expenses of the Fund. They are deducted from the proceeds of sales of Fund shares prior to investment or from redemption proceeds prior to remittance, as applicable. For the period from December 6, 2008 to September 30, 2009, FSC retained $250,506 in sales charges from the sale of Class A Shares. FSC also retained $27,284 of CDSC relating to redemptions of
Class C Shares.
Prior to close of business on December 5, 2008, Quasar Distributors, LLC served as distributor of the Predecessor Fund's shares. For the period from October 1, 2008 to December 5, 2008, the Predecessor Fund did not charge any sales charges on the sale of its Shares.
Shareholder Services Fee
The Fund may pay fees (Service Fees) up to 0.25% of the average daily net assets of the Fund's Class A Shares and Class C Shares to financial intermediaries or to Federated Shareholder Services Company (FSSC) for providing services to shareholders and maintaining shareholder accounts. Subject to the terms described in the Expense Limitation note, FSSC may voluntarily reimburse the Fund for shareholder services fees. This voluntary reimbursement can be modified or terminated at any time. For the period from December 6, 2008 to September 30, 2009, FSSC received $175,489 of fees paid by the Fund.
Prior to close of business on December 5, 2008, the Predecessor Fund did not charge a shareholder services fee.
Annual Shareholder Report34
Interfund TransactionsDuring the year ended September 30, 2009, the Fund engaged in purchase transactions with funds that have a common investment adviser (or affiliated investment advisers), common Directors/Trustees, and/or common Officers. These purchase transactions complied with
Rule 17a-7 under the Act and amounted to $455,834.
Expense Limitation
The Adviser and its affiliates (which may include FSC, FAS and FSSC) have voluntarily agreed to waive their fees and/or reimburse expenses so that the total operating expenses (as shown in the financial highlights) paid by the Fund's Class A Shares, Class C Shares and Institutional Shares (after the voluntary waivers and reimbursements) will not exceed 1.76%, 2.51% and 1.51%, respectively, through the later of (the “Termination Date”): (a) November 30, 2010 or (b) the date of the Fund's next effective Prospectus. While the Adviser and its affiliates currently do not anticipate terminating these arrangements prior to the Termination Date, these arrangements may only be terminated prior to the Termination Date with the agreement of the Fund's Board of Trustees.
General
Certain Officers and Trustees of the Fund are Officers and Directors or Trustees of the above companies.
Transactions with Affiliated Companies and Affiliated Holdings
An affiliated company is a company in which the Fund has ownership of at least 5% of the voting shares. Transactions with the affiliated companies during the year ended September 30, 2009, were as follows:
| Affiliate | Balance of
Shares Held
9/30/2008 | Purchases/
Additions | Sales/
Reductions | Balance of
Shares Held
9/30/2009 | Value | Dividend
Income |
| Ascot Resources Ltd. | 1,500,000 | — | — | 1,500,000 | $980,713 | $ — |
| Ascot Resources Ltd. | 1,140,000 | — | — | 1,140,000 | $745,342 | $ — |
| Ascot Resources Ltd. | 360,000 | — | — | 360,000 | $235,371 | $ — |
| Kootenay Gold, Inc. | 825,000 | — | — | 825,000 | $593,331 | $ — |
| Kootenay Gold, Inc. | 500,000 | — | — | 500,000 | $359,595 | $ — |
| Kootenay Gold, Inc. | 1,000,000 | — | — | 1,000,000 | $719,189 | $ — |
| MacArthur Minerals Ltd. | 1,500,000 | — | — | 1,500,000 | $1,190,865 | $ — |
TOTAL OF
AFFILIATED
COMPANIES | 6,825,000 | — | — | 6,825,000 | $4,824,406 | $ — |
Annual Shareholder Report35
Affiliated holdings are mutual funds which are managed by the Adviser or an affiliate of the Adviser. The Adviser has agreed to reimburse the Fund for certain investment adviser fees as a result of transactions in other affiliated mutual funds. For the period from December 6, 2008 to September 30, 2009, the Adviser reimbursed $66,204. Transactions with the affiliated holdings during the year ended September 30, 2009 were as follows:| Affiliates | Balance of
Shares Held
9/30/2008 | Purchases/
Additions | Sales/
Reductions | Balance of
Shares Held
9/30/2009 | Value | Dividend
Income |
| Federated Short-Term U.S. Government Trust | — | 24,185,075 | 24,185,075 | — | $ — | $2,675 |
| U.S. Treasury Cash Reserves Fund, Institutional Shares | 26,333,045 | 1,301,420,724 | 1,204,700,965 | 123,052,804 | $123,052,804 | $27,768 |
TOTAL OF AFFILIATED
TRANSACTIONS | 26,333,045 | 1,325,605,799 | 1,228,886,040 | 123,052,804 | $123,052,804 | $30,443 |
6. EXPENSE Reduction
Prior to close of business on December 5, 2008, the Predecessor Fund directed portfolio trades to a broker that in turn pays a portion of the Predecessor Fund's operating expenses. For the period from October 1, 2008 to December 5, 2008, the Fund's expenses were reduced by $208,230 under these arrangements.
The Fund directs portfolio trades to a broker that in turn pays a portion of the Fund's operating expenses. For the period from December 6, 2008 to September 30, 2009, the Fund's expenses were reduced by $50,300 under these arrangements.
7. Investment TRANSACTIONS
Purchases and sales of investments, excluding long-term U.S. government securities and short-term obligations for the year ended September 30, 2009, were as follows:
| Purchases | $2,473,608,086 |
| Sales | $2,603,848,881 |
8. CONCENTRATION OF RISK
The Fund invests in securities of non-U.S. issuers. Political or economic developments may have an effect on the liquidity and volatility of portfolio securities and currency holdings.
9. LINE OF CREDIT
The Fund participates in a $100,000,000 unsecured, uncommitted revolving line of credit (LOC) agreement with PNC Bank. The LOC was made available for extraordinary or emergency purposes, primarily for financing redemption payments. Borrowings are charged interest at a rate offered to the Fund by PNC Bank at the time of the borrowing. As of September 30, 2009, there were no outstanding loans. During the period from December 6, 2008 to September 30, 2009, the Fund did not utilize the LOC.
Annual Shareholder Report36
10. INTERFUND LENDINGPursuant to an Exemptive Order issued by the Securities and Exchange Commission (SEC), the Fund, along with other funds advised by subsidiaries of Federated Investors, Inc., may participate in an interfund lending program. This program provides an alternative credit facility allowing the funds to borrow from other participating affiliated funds. As of September 30, 2009, there were no outstanding loans. During the period from December 6, 2008 to September 30, 2009, the program was not utilized.
11. Legal Proceedings
Since October 2003, Federated Investors, Inc. and related entities (collectively, “Federated”), and various Federated funds (Federated Funds) have been named as defendants in several class action lawsuits now pending in the United States District Court for the District of Maryland. The lawsuits were purportedly filed on behalf of people who purchased, owned and/or redeemed shares of Federated-sponsored mutual funds during specified periods beginning November 1, 1998. The suits are generally similar in alleging that Federated engaged in illegal and improper trading practices including market timing and late trading in concert with certain institutional traders, which allegedly caused financial injury to the mutual fund shareholders. These lawsuits began to be filed shortly after Federated's first public announcement that it had received requests for information on shareholder trading activities in the Federated Funds from the SEC, the Office of the New York State Attorney General (NYAG), and other authorities. In that regard, on November 28, 2005, Federated announced that it had reached final settlements with the SEC and the NYAG with respect to those matters. As Federated previously reported in 2004, it has already paid approximately $8.0 million to certain funds as determined by an independent consultant. As part of these settlements, Federated agreed to pay for the benefit of fund shareholders additional disgorgement and a civil money penalty in the aggregate amount of an additional $72 million. Federated entities have also been named as defendants in several additional lawsuits that are now pending in the United States District Court for the Western District of Pennsylvania, alleging, among other things, excessive advisory and Rule 12b-1 fees. The Board of the Federated Funds retained the law firm of Dickstein Shapiro LLP to represent the Federated Funds in these lawsuits. Federated and the Federated Funds, and their respective counsel have been defending this litigation, and none of the Federated Funds remains a defendant in any of the lawsuits (though some could potentially receive any recoveries as nominal defendants). Additional lawsuits based upon similar allegations may be filed in the future. The potential impact of these lawsuits, all of which seek unquantified damages, attorneys' fees and expenses, and future potential similar suits is uncertain. Although we do not believe that these lawsuits will have a material adverse effect on the Federated Funds, there can be no assurance that these suits, the ongoing adverse publicity and/or other developments resulting from the regulatory investigations will not result in increased Federated Fund redemptions, reduced sales of Federated Fund shares or other adverse consequences for the Federated Funds.
12. Subsequent events
Management has evaluated subsequent events through November 24, 2009, the date the financial statements were issued, and determined that no events have occurred that require additional disclosure.
13. FEDERAL TAX INFORMATION (UNAUDITED)
For the year ended September 30, 2009, the amount of long-term capital gains designated by the Fund was $61,794,970.
Annual Shareholder Report37
Report of Independent Registered Public Accounting Firm
TO THE BOARD OF TRUSTEES OF THE FEDERATED EQUITY FUNDS AND SHAREHOLDERS OF Federated Prudent Bear Fund:
We have audited the accompanying statement of assets and liabilities, including the portfolio of investments, of the Federated Prudent Bear Fund (the “Fund”), a portfolio of Federated Equity Funds, as of September 30, 2009, and the related statement of operations, the statement of changes in net assets and the financial highlights for the year then ended. These financial statements and financial highlights are the responsibility of the Fund's management. Our responsibility is to express an opinion on these financial statements and financial highlights based on our audit. The statement of changes in net assets and the financial highlights for the periods presented prior to October 1, 2008, were audited by other independent registered public accountants whose report thereon dated November 13, 2008, expressed an unqualified opinion on those statements.
We conducted our audit in accordance with the standards of the Public Company Accounting Oversight Board (United States). Those standards require that we plan and perform the audit to obtain reasonable assurance about whether the financial statements and financial highlights are free of material misstatement. An audit includes examining, on a test basis, evidence supporting the amounts and disclosures in the financial statements. Our procedures included confirmation of securities owned as of September 30, 2009 by correspondence with the custodian and brokers or by other appropriate auditing procedures. An audit also includes assessing the accounting principles used and significant estimates made by management, as well as evaluating the overall financial statement presentation. We believe that our audit provides a reasonable basis for our opinion.
In our opinion, the financial statements and financial highlights referred to above present fairly, in all material respects, the financial position of the Federated Prudent Bear Fund as of September 30, 2009, and the results of its operations, the changes in its net assets and the financial highlights for the year then ended, in conformity with U.S. generally accepted accounting principles.
Boston, Massachusetts
November 24, 2009
Annual Shareholder Report38
Board of Trustees and Trust Officers
The Board is responsible for managing the Trust's business affairs and for exercising all the Trust's powers except those reserved for the shareholders. The following tables give information about each Board member and the senior officers of the Fund. Where required, the tables separately list Board members who are “interested persons” of the Fund (i.e., “Interested” Board members) and those who are not (i.e., “Independent” Board members). Unless otherwise noted, the address of each person listed is Federated Investors Tower, 1001 Liberty Avenue, Pittsburgh, PA 15222. The address of all Independent Board members listed is 4000 Ericsson Drive, Warrendale, PA 15086-7561; Attention: Mutual Fund Board. As of December 31, 2008, the Trust comprised ten portfolios, and the Federated Fund Complex consisted of 40 investment companies (comprising 149 portfolios). Unless otherwise noted, each Officer is elected annually. Unless otherwise noted, each Board member oversees all portfolios in the Federated Fund Complex and serves for an indefinite term. The Fund's Statement of Additional Information includes additional information about Trust Trustees and is available, without charge and upon request, by calling 1-800-341-7400.
Interested TRUSTEES Background
Name
Birth Date
Positions Held with Trust
Date Service Began | Principal Occupation(s) for Past Five Years,
Other Directorships Held and Previous Position(s) |
John F. Donahue*
Birth Date: July 28, 1924
TRUSTEE
Began serving: April 1984 | Principal Occupations: Director or Trustee of the Federated Fund Complex; Chairman and Director, Federated Investors, Inc.; Chairman of the Federated Fund Complex's Executive Committee.
Previous Positions: Chairman of the Federated Fund Complex; Trustee, Federated Investment Management Company; Chairman and Director, Federated Investment Counseling. |
J. Christopher Donahue*
Birth Date: April 11, 1949
PRESIDENT AND TRUSTEE
Began serving: August 2000 | Principal Occupations: Principal Executive Officer and President of the Federated Fund Complex; Director or Trustee of some of the Funds in the Federated Fund Complex; President, Chief Executive Officer and Director, Federated Investors, Inc.; Chairman and Trustee, Federated Investment Management Company; Trustee, Federated Investment Counseling; Chairman and Director, Federated Global Investment Management Corp.; Chairman, Federated Equity Management Company of Pennsylvania and Passport Research, Ltd. (investment advisory subsidiary of Federated); Trustee, Federated Shareholder Services Company; Director, Federated Services Company.
Previous Positions: President, Federated Investment Counseling; President and Chief Executive Officer, Federated Investment Management Company, Federated Global Investment Management Corp. and Passport Research, Ltd. |
| * | Family relationships and reasons for “interested” status: John F. Donahue is the father of J. Christopher Donahue; both are “interested” due to their beneficial ownership of shares of Federated Investors, Inc. and the positions they hold with Federated and its subsidiaries. |
Annual Shareholder Report39
INDEPENDENT TRUSTEES Background
Name
Birth Date
Positions Held with Trust
Date Service Began | Principal Occupation(s) for Past Five Years,
Other Directorships Held and Previous Position(s) |
John T. Conroy, Jr., Ph.D.
Birth Date: June 23, 1937
TRUSTEE
Began serving: November 1991 | Principal Occupations: Director or Trustee of the Federated Fund Complex; Chairman of the Board, Investment Properties Corporation; Partner or Trustee in private real estate ventures in Southwest Florida; Assistant Professor in Theology at Barry University and Blessed Edmund Rice School for Pastoral Ministry.
Previous Positions: President, Investment Properties Corporation; Senior Vice President, John R. Wood and Associates, Inc., Realtors; President, Naples Property Management, Inc. and Northgate Village Development Corporation. |
Nicholas P. Constantakis
Birth Date: September 3, 1939
TRUSTEE
Began serving: February 1998 | Principal Occupation: Director or Trustee of the Federated Fund Complex.
Other Directorships Held: Director and Chairman of the Audit Committee, Michael Baker Corporation (architecture, engineering and construction services).
Previous Position: Partner, Andersen Worldwide SC. |
John F. Cunningham
Birth Date: March 5, 1943
TRUSTEE
Began serving: January 1999 | Principal Occupation: Director or Trustee of the Federated Fund Complex.
Other Directorships Held: Chairman, President and Chief Executive Officer, Cunningham & Co., Inc. (strategic business consulting); Trustee Associate, Boston College.
Previous Positions: Director, Redgate Communications and EMC Corporation (computer storage systems); Chairman of the Board and Chief Executive Officer, Computer Consoles, Inc.; President and Chief Operating Officer, Wang Laboratories; Director, First National Bank of Boston; Director, Apollo Computer, Inc. |
Maureen Lally-Green
Birth Date: July 5, 1949
TRUSTEE
Began serving: August 2009 | Principal Occupations: Director or Trustee of the Federated Fund Complex; Director, Office of Church Relations, Diocese of Pittsburgh; Adjunct Professor of Law, Duquesne University School of Law.
Other Directorships Held: Director, Auberle; Trustee St. Francis University; Director, Ireland Institute of Pittsburgh; Director, UPMC Mercy Hospital; Regent, St. Vincent Seminary; Director, Epilepsy Foundation of Western and Central Pennsylvania; Director, Saint Thomas More Society, Allegheny County; Director, Carlow University.
Previous Position: Pennsylvania Superior Court Judge. |
Annual Shareholder Report40
Name
Birth Date
Positions Held with Trust
Date Service Began | Principal Occupation(s) for Past Five Years,
Other Directorships Held and Previous Position(s) |
Peter E. Madden
Birth Date: March 16, 1942
TRUSTEE
Began serving: October 1991 | Principal Occupation: Director or Trustee and Chairman of the Board of the Federated Fund Complex.
Other Directorship Held: Board of Overseers, Babson College.
Previous Positions: Representative, Commonwealth of Massachusetts General Court; President, Chief Operating Officer and Director, State Street Bank and Trust Company and State Street Corporation (retired); Director, VISA USA and VISA International; Chairman and Director, Massachusetts Bankers Association; Director, Depository Trust Corporation; Director, The Boston Stock Exchange. |
Charles F. Mansfield, Jr.
Birth Date: April 10, 1945
TRUSTEE
Began serving: January 1999 | Principal Occupations: Director or Trustee and Chairman of the Audit Committee of the Federated Fund Complex; Management Consultant.
Previous Positions: Chief Executive Officer, PBTC International Bank; Partner, Arthur Young & Company (now Ernst & Young LLP); Chief Financial Officer of Retail Banking Sector, Chase Manhattan Bank; Senior Vice President, HSBC Bank USA (formerly, Marine Midland Bank); Vice President, Citibank; Assistant Professor of Banking and Finance, Frank G. Zarb School of Business, Hofstra University; Executive Vice President DVC Group, Inc. (marketing, communications and technology). |
R. James Nicholson
Birth Date: February 4, 1938
TRUSTEE
Began serving: January 2008 | Principal Occupations: Director or Trustee of the Federated Fund Complex; Senior Counsel, Brownstein Hyatt Farber Schrek, P.C.; Former Secretary of the U.S. Dept. of Veterans Affairs; Former U.S. Ambassador to the Holy See; Former Chairman of the Republican National Committee.
Other Directorships Held: Director, Horatio Alger Association; Director, The Daniels Fund.
Previous Positions: Colonel, U.S. Army Reserve; Partner, Calkins, Kramer, Grimshaw and Harring, P.C.; General Counsel, Colorado Association of Housing and Building; Chairman and CEO, Nicholson Enterprises, Inc. (real estate holding company); Chairman and CEO, Renaissance Homes of Colorado. |
Thomas M. O'Neill
Birth Date: June 14, 1951
TRUSTEE
Began serving: October 2006 | Principal Occupations: Director or Trustee of the Federated Fund Complex; Managing Director and Partner, Navigator Management Company, L.P. (investment and strategic consulting).
Other Directorships Held: Board of Overseers, Children's Hospital of Boston; Visiting Committee on Athletics, Harvard College.
Previous Positions: Chief Executive Officer and President, Managing Director and Chief Investment Officer, Fleet Investment Advisors; President and Chief Executive Officer, Aeltus Investment Management, Inc.; General Partner, Hellman, Jordan Management Co., Boston, MA; Chief Investment Officer, The Putnam Companies, Boston, MA; Credit Analyst and Lending Officer, Fleet Bank; Director and Consultant, EZE Castle Software (investment order management software); Director, Midway Pacific (lumber). |
Annual Shareholder Report41
Name
Birth Date
Positions Held with Trust
Date Service Began | Principal Occupation(s) for Past Five Years,
Other Directorships Held and Previous Position(s) |
John S. Walsh
Birth Date: November 28, 1957
TRUSTEE
Began serving: January 1999 | Principal Occupations: Director or Trustee of the Federated Fund Complex; President and Director, Heat Wagon, Inc. (manufacturer of construction temporary heaters); President and Director, Manufacturers Products, Inc. (distributor of portable construction heaters); President, Portable Heater Parts, a division of Manufacturers Products, Inc.
Previous Position: Vice President, Walsh & Kelly, Inc. |
James F. Will
Birth Date: October 12, 1938
TRUSTEE
Began serving: April 2006 | Principal Occupations: Director or Trustee of the Federated Fund Complex; formerly, Vice Chancellor and President, Saint Vincent College.
Other Directorships Held: Trustee, Saint Vincent College; Alleghany Corporation.
Previous Positions: Chairman, President and Chief Executive Officer, Armco, Inc.; President and Chief Executive Officer, Cyclops Industries; President and Chief Operating Officer, Kaiser Steel Corporation. |
OFFICERS
Name
Birth Date
Address
Positions Held with Trust
Date Service Began | Principal Occupation(s) for Past Five Years
and Previous Position(s) |
John W. McGonigle
Birth Date: October 26, 1938
EXECUTIVE VICE PRESIDENT AND SECRETARY
Began serving: April 1984 | Principal Occupations: Executive Vice President and Secretary of the Federated Fund Complex; Vice Chairman, Executive Vice President, Secretary and Director, Federated Investors, Inc.
Previous Positions: Trustee, Federated Investment Management Company and Federated Investment Counseling; Director, Federated Global Investment Management Corp., Federated Services Company and Federated Securities Corp. |
Richard A. Novak
Birth Date: December 25, 1963
TREASURER
Began serving: January 2006 | Principal Occupations: Principal Financial Officer and Treasurer of the Federated Fund Complex; Senior Vice President, Federated Administrative Services; Financial and Operations Principal for Federated Securities Corp., Edgewood Services, Inc. and Southpointe Distribution Services, Inc.
Previous Positions: Controller of Federated Investors, Inc.; Vice President, Finance of Federated Services Company; held various financial management positions within The Mercy Hospital of Pittsburgh; Auditor, Arthur Andersen & Co. |
Brian P. Bouda
Birth Date: February 28, 1947
CHIEF COMPLIANCE OFFICER AND SENIOR VICE PRESIDENT
Began serving: August 2004 | Principal Occupations: Senior Vice President and Chief Compliance Officer of the Federated Fund Complex; Vice President and Chief Compliance Officer of Federated Investors, Inc. and Chief Compliance Officer of its subsidiaries. Mr. Bouda joined Federated in 1999 and is a member of the American Bar Association and the State Bar Association of Wisconsin. |
Annual Shareholder Report42
Name
Birth Date
Address
Positions Held with Trust
Date Service Began | Principal Occupation(s) for Past Five Years
and Previous Position(s) |
Stephen F. Auth
Birth Date: September 3, 1956
450 Lexington Avenue
Suite 3700
New York, NY 10017-3943
CHIEF INVESTMENT OFFICER
Began serving: November 2002 | Principal Occupations: Mr. Auth is Chief Investment Officer of this Fund and various other Funds in the Federated Fund Complex; Executive Vice President, Federated Investment Counseling, Federated Global Investment Management Corp. and Federated Equity Management Company of Pennsylvania.
Previous Positions: Executive Vice President, Federated Investment Management Company, and Passport Research, Ltd. (investment advisory subsidiary of Federated); Senior Vice President, Global Portfolio Management Services Division; Senior Vice President, Federated Investment Management Company and Passport Research, Ltd.; Senior Managing Director and Portfolio Manager, Prudential Investments. |
Lawrence Auriana
Birth Date: January 8, 1944
140 East 45th Street
New York, NY 10017
VICE PRESIDENT
Began serving: November 2001 | Principal Occupations: Lawrence Auriana is Vice President of the Trust. Mr. Auriana joined Federated in April 2001 as Co-Head of Investments/Federated Kaufmann. From August 1984 to April 2001, Mr. Auriana was President and Treasurer of Edgemont Asset Management Corp., and Chairman of the Board and Portfolio Manager to The Kaufmann Fund, Inc. (predecessor to the Federated Kaufmann Fund). Mr. Auriana earned a B.S. in economics from Fordham University and has been engaged in the securities business since 1965. |
Walter C. Bean
Birth Date: June 22, 1945
VICE PRESIDENT
Began serving: November 2006 | Principal Occupations: Walter C. Bean is Vice President of the Trust. Mr. Bean is a Senior Vice President, Senior Portfolio Manager and Director of Investments for Managed Accounts. Mr. Bean joined Federated in 2000. Mr. Bean is responsible for the investment process for the managed accounts portfolios. His previous associations included: Chief Investment Officer and Portfolio Manager at C.S. McKee & Company; various investment management and research positions with First Chicago Investment Advisors, CIGNA Investment Advisors and Mellon Bank. Mr. Bean is a Chartered Financial Analyst. Mr. Bean earned a Bachelors Degree in Business Administration from Ohio University and an M.B.A. from Pennsylvania State University. Mr. Bean has 40 years of investment experience. |
Richard B. Fisher
Birth Date: May 17, 1923
VICE PRESIDENT
Began serving: April 1984 | Principal Occupations: Vice Chairman or Vice President of some of the Funds in the Federated Fund Complex; Vice Chairman, Federated Investors, Inc.; Chairman, Federated Securities Corp.
Previous Positions: President and Director or Trustee of some of the Funds in the Federated Fund Complex; Executive Vice President, Federated Investors, Inc.; Director and Chief Executive Officer, Federated Securities Corp. |
Hans P. Utsch
Birth Date: July 3, 1936
140 East 45th Street
New York, NY 10017
VICE PRESIDENT
Began serving: November 2001 | Principal Occupations: Hans P. Utsch is Vice President of the Trust. Mr. Utsch joined Federated in April 2001 as Co-Head of Investments/Federated Kaufmann. From August 1984 to April 2001, Mr. Utsch was Chairman of the Board and Secretary of Edgemont Asset Management Corp., and President and Portfolio Manager to The Kaufmann Fund, Inc. (predecessor to the Federated Kaufmann Fund). Mr. Utsch graduated from Amherst College and holds an M.B.A. from Columbia University. He has been engaged in the securities business since 1962. |
Annual Shareholder Report43
Evaluation and Approval of Advisory
Contract - May 2009
Federated Prudent Bear Fund (the “Fund”)
The Fund's Board reviewed the Fund's investment advisory contract at meetings held in May 2009. The Board's decision regarding the contract reflects the exercise of its business judgment on whether to continue the existing arrangements.
In this connection, the Federated funds' Board had previously appointed a Senior Officer, whose duties include specified responsibilities relating to the process by which advisory fees are to be charged to a Federated fund. The Senior Officer has the authority to retain consultants, experts, or staff as may be reasonably necessary to assist in the performance of his duties, reports directly to the Board, and may be terminated only with the approval of a majority of the independent members of the Board. The Senior Officer prepared and furnished to the Board an independent, written evaluation that covered topics discussed below. The Board considered that evaluation, along with other information, in deciding to approve the advisory contract.
During its review of the contract, the Board considered compensation and benefits received by the Adviser. This included the fees received for services provided to the Fund by other entities in the Federated organization and research services received by the Adviser from brokers that execute Federated fund trades, as well as advisory fees. The Board is also familiar with and considered judicial decisions concerning allegedly excessive investment advisory fees, which have indicated that the following factors may be relevant to an Adviser's fiduciary duty with respect to its receipt of compensation from a fund: the nature and quality of the services provided by the Adviser, including the performance of the fund; the Adviser's cost of providing the services; the extent to which the Adviser may realize “economies of scale” as a fund grows larger; any indirect benefits that may accrue to the Adviser and its affiliates as a result of the Adviser's relationship with a fund; performance and expenses of comparable funds; and the extent to which the independent Board members are fully informed about all facts the Board deems relevant bearing on the Adviser's services and fees. The Board further considered management fees (including any components thereof) charged to institutional and other clients of the Adviser for what might be viewed as like services, and the cost to the Adviser and its affiliates of supplying services pursuant to the management fee agreements, excluding any intra-corporate profit and profit margins of the Adviser and its affiliates for supplying such services. The Board was aware of these factors and was guided by them in its review of the Fund's advisory contract to the extent it considered them to be appropriate and relevant, as discussed further below.
Annual Shareholder Report44
The Board considered and weighed these circumstances in light of its substantial accumulated experience in governing the Fund and working with Federated on matters relating to the Federated funds, and was assisted in its deliberations by independent legal counsel. Throughout the year, the Board has requested and received substantial and detailed information about the Fund and the Federated organization that was in addition to the extensive materials that comprise and accompany the Senior Officer's evaluation. Federated provided much of this information at each regular meeting of the Board, and furnished additional reports in connection with the particular meeting at which the Board's formal review of the advisory contract occurred. Between regularly scheduled meetings, the Board also received information on particular matters as the need arose. Thus, the Board's consideration of the advisory contract included review of the Senior Officer's evaluation, accompanying data and additional reports covering such matters as: the Adviser's investment philosophy, revenue, profitability, personnel and processes; investment and operating strategies; the Fund's short- and long-term performance (in absolute terms, both on a gross basis and net of expenses, as well as in relationship to its particular investment program and certain competitor or “peer group” funds and/or other benchmarks, as appropriate), and comments on the reasons for performance; the Fund's investment objectives; the Fund's expenses (including the advisory fee itself and the overall expense structure of the Fund, both in absolute terms and relative to similar and/or competing funds, with due regard for contractual or voluntary expense limitations); the use and allocation of brokerage commissions derived from trading the Fund's portfolio securities (if any); and the nature, quality and extent of the advisory and other services provided to the Fund by the Adviser and its affiliates. The Board also considered the preferences and expectations of Fund shareholders and their relative sophistication; the continuing state of competition in the mutual fund industry and market practices; the range of comparable fees for similar funds in the mutual fund industry; the Fund's relationship to the Federated family of funds which include a comprehensive array of funds with different investment objectives, policies and strategies which are available for exchange without the incurrence of additional sales charges; compliance and audit reports concerning the Federated funds and the Federated companies that service them (including communications from regulatory agencies), as well as Federated's responses to any issues raised therein; and relevant developments in the mutual fund industry and how the Federated funds and/or Federated are responding to them. The Board's evaluation process is evolutionary. The criteria considered and the emphasis placed on relevant criteria change in recognition of changing circumstances in the mutual fund marketplace. Annual Shareholder Report45
With respect to the Fund's performance and expenses in particular, the Board has found the use of comparisons to other mutual funds with comparable investment programs to be particularly useful, given the high degree of competition in the mutual fund business. The Board focused on comparisons with other similar mutual funds more heavily than non-mutual fund products or services because it is believed that they are more relevant. For example, other mutual funds are the products most like the Fund, they are readily available to Fund shareholders as alternative investment vehicles, and they are the type of investment vehicle in fact chosen and maintained by the Fund's investors. The range of their fees and expenses therefore appears to be a generally reliable indication of what consumers have found to be reasonable in the precise marketplace in which the Fund competes. The Fund's ability to deliver competitive performance when compared to its peer group was a useful indicator of how the Adviser is executing the Fund's investment program, which in turn assisted the Board in reaching a conclusion that the nature, extent, and quality of the Adviser's investment management services were such as to warrant continuation of the advisory contract. In this regard, the Senior Officer has reviewed Federated's fees for providing advisory services to products outside the Federated family of funds (e.g., institutional and separate accounts). He concluded that mutual funds and institutional accounts are inherently different products. Those differences include, but are not limited to, different types of targeted investors; being subject to different laws and regulations; different legal structures; different average account sizes; different associated costs; different portfolio management techniques made necessary by different cash flows; and portfolio manager time spent in review of securities pricing. The Senior Officer did not consider these fee schedules to be determinative in judging the appropriateness of mutual fund advisory contracts.The Senior Officer reviewed reports compiled by Federated, using data supplied by independent fund ranking organizations, regarding the performance of, and fees charged by, other mutual funds, noting his view that comparisons to fund peer groups are highly important in judging the reasonableness of proposed fees.
For the periods covered by the report, the Fund's performance for the three-year and five-year periods was above the median of the relevant peer group, and the Fund's performance fell below the median of the relevant peer group for the one-year period. The Board discussed the Fund's performance with the Adviser and recognized the efforts being undertaken by the Adviser. The Board will continue to monitor these efforts and the performance of the Fund.
Annual Shareholder Report46
The Board also received financial information about Federated, including reports on the compensation and benefits Federated derived from its relationships with the Federated funds. These reports covered not only the fees under the advisory contracts, but also fees received by Federated's subsidiaries for providing other services to the Federated funds under separate contracts (e.g., for serving as the Federated funds' administrator). The reports also discussed any indirect benefit Federated may derive from its receipt of research services from brokers who execute Federated fund trades. In addition, the Board considered the fact that, in order for a fund to be competitive in the marketplace, Federated and its affiliates frequently waived fees and/or reimbursed expenses and have disclosed to fund investors and/or indicated to the Board their intention to do so in the future, where appropriate. Moreover, the Board receives regular reports regarding the institution or elimination of these voluntary waivers.Federated furnished reports, requested by the Senior Officer, that reported revenues on a fund-by-fund basis and made estimates of the allocation of expenses on a fund-by-fund basis, using allocation methodologies specified by the Senior Officer. The Senior Officer noted that, although they may apply consistent allocation processes, the inherent difficulties in allocating costs (and the unavoidable arbitrary aspects of that exercise) and the lack of consensus on how to allocate those costs may render such allocation reports unreliable. The allocation reports were considered in the analysis by the Board but were determined to be of limited use.
The Board and the Senior Officer also reviewed a report compiled by Federated comparing profitability information for Federated to other publicly held fund management companies. In this regard, the Senior Officer noted the limited availability of such information, but nonetheless concluded that Federated's profit margins did not appear to be excessive and the Board agreed.
The Senior Officer's evaluation also discussed the notion of possible realization of “economies of scale” as a fund grows larger. The Board considered in this regard that the Adviser has made significant and long-term investments in areas that support all of the Federated funds, such as personnel and processes for the portfolio management, compliance, and risk management functions; and systems technology; and that the benefits of these efforts (as well as any economies, should they exist) were likely to be enjoyed by the fund complex as a whole. Finally, the Board also noted the absence of any applicable regulatory or industry guidelines on this subject, which (as discussed in the Senior Officer's evaluation) is compounded by the lack of any common industry practice or general pattern with respect to structuring fund advisory fees with “breakpoints” that serve to reduce the fee as the fund attains a certain size. The Senior Officer did not recommend institution of breakpoints in pricing Federated's fund advisory services at this time.
Annual Shareholder Report47
It was noted in the materials for the Board meeting that for the period covered by the report, the Fund's investment advisory fee, after waivers and expense reimbursements, if any, was above the median of the relevant peer group. The Board reviewed the fees and other expenses of the Fund with the Adviser and was satisfied that the overall expense structure of the Fund remained competitive. The Board will continue to monitor advisory fees and other expenses borne by the Fund.The Senior Officer's evaluation noted his belief that the information and observations contained in his evaluation supported a finding that the proposed management fees are reasonable, and that Federated appeared to provide appropriate administrative services to the Fund for the fees paid. Under these circumstances, no changes were recommended to, and no objection was raised to, the continuation of the Fund's advisory contract. The Board concluded that the nature, quality and scope of services provided the Fund by the Adviser and its affiliates were satisfactory.
In its decision to continue an existing investment advisory contract, the Board was mindful of the potential disruptions of the Fund's operations and various risks, uncertainties and other effects that could occur as a result of a decision to terminate or not renew an advisory contract. In particular, the Board recognized that many shareholders have invested in the Fund on the strength of the Adviser's industry standing and reputation and with the expectation that the Adviser will have a continuing role in providing advisory services to the Fund. Thus, the Board's approval of the advisory contract reflected the fact that it is the shareholders who have effectively selected the Adviser by virtue of having invested in the Fund.
The Board based its decision to approve the advisory contract on the totality of the circumstances and relevant factors and with a view to past and future long-term considerations. Not all of the factors and considerations identified above were necessarily relevant to the Fund, nor did the Board consider any one of them to be determinative. With respect to the factors that were relevant, the Board's decision to approve the contract reflects its determination that Federated's performance and actions provided a satisfactory basis to support the decision to continue the existing arrangements.
Annual Shareholder Report48
Voting Proxies on Fund Portfolio SecuritiesA description of the policies and procedures that the Fund uses to determine how to vote proxies, if any, relating to securities held in the Fund's portfolio is available, without charge and upon request, by calling 1-800-341-7400. A report on “Form N-PX” of how the Fund voted any such proxies during the most recent 12-month period ended June 30 is available from Federated's Web site at FederatedInvestors.com. To access this information from the “Products” section of the Web site, click on the “Prospectuses and Regulatory Reports” link under “Related Information,” then select the appropriate link opposite the name of the Fund; or select the name of the Fund and from the Fund's page, click on the “Prospectuses and Regulatory Reports” link. Form N-PX filings are also available at the SEC's Web site at www.sec.gov.
Quarterly Portfolio Schedule
The Fund files with the SEC a complete schedule of its portfolio holdings, as of the close of the first and third quarters of its fiscal year, on “Form N-Q.” These filings are available on the SEC's Web site at www.sec.gov and may be reviewed and copied at the SEC's Public Reference Room in Washington, DC. (Call 1-800-SEC-0330 for information on the operation of the Public Reference Room.) You may also access this information from the “Products” section of Federated's Web site at FederatedInvestors.com by clicking on “Portfolio Holdings” under “Related Information,” then selecting the appropriate link opposite the name of the Fund; or select the name of the Fund and from the Fund's page, click on the “Portfolio Holdings” link.
Annual Shareholder Report49
Mutual funds are not bank deposits or obligations, are not guaranteed by any bank and are not insured or guaranteed by the U.S. government, the Federal Deposit Insurance Corporation, the Federal Reserve Board or any other government agency. Investment in mutual funds involves investment risk, including the possible loss of principal.
This Report is authorized for distribution to prospective investors only when preceded or accompanied by the Fund's Prospectus, which contains facts concerning its objective and policies, management fees, expenses and other information.
Federated Prudent Bear Fund
Federated Investors Funds
4000 Ericsson Drive
Warrendale, PA 15086-7561
Contact us at FederatedInvestors.com
or call 1-800-341-7400.
Federated Securities Corp., Distributor
Cusip 314172354
Cusip 314172347
41202 (11/09)
Federated is a registered mark of Federated Investors, Inc.
2009 Federated Investors, Inc.
Federated Prudent Bear Fund
(Successor to the Prudent Bear Fund Established 1995)
A Portfolio of Federated Equity Funds
ANNUAL SHAREHOLDER REPORTSeptember 30, 2009
Institutional Shares
FINANCIAL HIGHLIGHTS
SHAREHOLDER EXPENSE EXAMPLE
MANAGEMENT'S DISCUSSION OF FUND PERFORMANCE
PORTFOLIO OF INVESTMENTS SUMMARY TABLES
PORTFOLIO OF INVESTMENTS
STATEMENT OF ASSETS AND LIABILITIES
STATEMENT OF OPERATIONS
STATEMENT OF CHANGES IN NET ASSETS
NOTES TO FINANCIAL STATEMENTS
REPORT OF INDEPENDENT REGISTERED PUBLIC ACCOUNTING FIRM
BOARD OF TRUSTEES AND TRUST OFFICERS
EVALUATION AND APPROVAL OF ADVISORY CONTRACT
VOTING PROXIES ON FUND PORTFOLIO SECURITIES
QUARTERLY PORTFOLIO SCHEDULE
Financial Highlights - Institutional Shares
(For a Share Outstanding Throughout the Period)
| Period Ended September 30 | 20091 |
| Net Asset Value, Beginning of Period | $6.91 |
| Income From Investment Operations: | |
| Net investment income (loss) | (0.13)2 |
Net realized and unrealized loss on investments, short sales, futures contracts and
foreign currency transactions | (1.02) |
| TOTAL FROM INVESTMENT OPERATIONS | (1.15) |
| Net Asset Value, End of Period | $5.76 |
| Total Return3 | (16.64)% |
| Ratios to Average Net Assets: | |
| Net expenses | 2.73%4,5 |
| Net expenses excluding dividends on short positions | 1.50%5 |
| Net investment income (loss) | (2.59)%5 |
| Expense waiver/reimbursement6 | 0.02%5 |
| Supplemental Data: | |
| Net assets, end of period (000 omitted) | $98,732 |
| Portfolio turnover | 392%7 |
| 1 | Reflects operations for the period from December 8, 2008 (date of initial investment) to September 30, 2009. |
| 2 | Per share number has been calculated using the average shares method. |
| 3 | Based on net asset value, which does not reflect the sales charge, redemption fee or contingent deferred sales charge, if applicable. Total returns for periods of less than one year are not annualized. |
| 4 | The net expense ratio is calculated without reduction for fees paid indirectly for expense offset arrangements. The net expense ratio is 2.72% for the period ended September 30, 2009, after taking into account this expense reduction. |
| 5 | Computed on an annualized basis. |
| 6 | This expense decrease is reflected in both the net expense and the net investment income (loss) ratios shown above. |
| 7 | Portfolio turnover is calculated at the Fund level. Percentage indicated was calculated for the year ended September 30, 2009. |
- See Notes which are an integral part of the Financial Statements
Annual Shareholder Report1
Shareholder Expense Example (unaudited)
As a shareholder of the Fund, you incur ongoing costs, including management fees and to the extent applicable, distribution (12b-1) fees and/or shareholder services fees and other Fund expenses. This Example is intended to help you to understand your ongoing costs (in dollars) of investing in the Fund and to compare these costs with the ongoing costs of investing in other mutual funds. It is based on an investment of $1,000 invested at the beginning of the period and held for the entire period from April 1, 2009 to September 30, 2009.
ACTUAL EXPENSES
The first section of the table below provides information about actual account values and actual expenses. You may use the information in this section, together with the amount you invested, to estimate the expenses that you incurred over the period. Simply divide your account value by $1,000 (for example, an $8,600 account value divided by $1,000 = 8.6), then multiply the result by the number in the first section under the heading entitled “Expenses Paid During Period” to estimate the expenses attributable to your investment during this period.
HYPOTHETICAL EXAMPLE FOR COMPARISON PURPOSES
The second section of the table below provides information about hypothetical account values and hypothetical expenses based on the Fund's actual expense ratio and an assumed rate of return of 5% per year before expenses, which is not the Fund's actual return. Thus, you should not use the hypothetical account values and expenses to estimate the actual ending account balance or your expenses for the period. Rather, these figures are required to be provided to enable you to compare the ongoing costs of investing in the Fund with other funds. To do so, compare this 5% hypothetical example with the 5% hypothetical examples that appear in the shareholder reports of the other funds.
Annual Shareholder Report2
Please note that the expenses shown in the table are meant to highlight your ongoing costs only. Therefore, the second section of the table is useful in comparing ongoing costs only, and will not help you determine the relative total costs of owning different funds. | Beginning
Account Value
4/1/2009 | Ending
Account Value
9/30/2009 | Expenses Paid
During Period1 |
| Actual | $1,000 | $812.40 | $12.36 |
Hypothetical (assuming a 5% return
before expenses) | $1,000 | $1,011.43 | $13.72 |
| 1 | Expenses are equal to the Fund's annualized net expense ratio of 2.72%, multiplied by the average account value over the period, multiplied by 183/365 (to reflect the one-half-year period). |
Annual Shareholder Report3
Performance data quoted represents past performance which is no guarantee of future results. Investment return and principal value will fluctuate so that an investor's shares, when redeemed, may be worth more or less than their original cost. Mutual fund performance changes over time and current performance may be lower or higher than what is stated. For current to the most recent month-end performance and after-tax returns, visit FederatedInvestors.com or call 1-800-341-7400.
Management's Discussion of Fund
Performance (unaudited)
The Fund's total return, based on net asset value, for the fiscal year ended September 30, 2009, was 0.41% for Institutional Shares. The total return of the Standard & Poor's 500 Index (S&P 500),1 the Fund's broad-based securities market index, was - -6.91% for the same period. The total return for the Fund's market benchmark, the S&P 500 Inverse Daily Index,1 was -9.79% for the same period. The Fund's total return for the fiscal year reflected actual cash flows, transaction costs and other expenses which were not reflected in the total return of the S&P 500.
MARKET OVERVIEW
The fiscal year encompassed an extraordinary period of crisis and recovery for global markets. For the period October 1, 2008 to the market lows set in early March 2009, the S&P 500 declined 42.8% and the Standard & Poor's 400 Mid-Cap Index (S&P 400 Index)2 declined 45.3%. From the March low to closing prices on September 30, 2009, the S&P 500 rallied 58.5%. The broader market recovered even more robustly than the S&P 500. The S&P 400 Index rallied 73.6%. Many stocks, most notably those commonly shorted, more than doubled in price during the market rebound.
FUND PERFORMANCE
The Fund's underperformance versus its benchmark for the one-year period was due to the extraordinary percentage gains posted by the stock market during the rally off of the March 2009 lows. Fund losses during this rally period, while significantly less in percentage terms than the market's advance, were from a much higher base after the Fund had posted strong returns during the preceding market decline.
| 1 | The S&P 500 is a broad-based market index that measures the performance of the broad domestic economy through changes in the aggregate market value of 500 stocks representing all major industries. The index is unmanaged and investments cannot be made in an index. The S&P 500 Inverse Daily Index is designed to provide the inverse performance of the S&P 500 Index, representing a short position in the index. |
| 2 | The S&P 400 Index is an unmanaged capitalization weighted index of common stocks representing all major industries in the mid-range of the U.S. stock market. |
Annual Shareholder Report4
For the period October 1, 2008 though February 28, 2009, the Fund returned 32.13% versus a decline of 36.13% for the S&P 500. For the period March 1, 2009 through September 30, 2009, the Fund returned - -24.01% versus the S&P 500 gain of 45.76%.Despite the S&P 500 having recorded a one-year loss, Fund performance benefited from being positioned cautiously for much of the reporting period from: reduced overall short exposure; scaled-back exposure to individual company shorts; and particularly, minimal exposure to stocks with large short positions.3 Additionally, strong gains from its long investments in natural resources companies positively contributed to Fund performance during the reporting period.
Positioning and Strategy
With the passing of the one-year anniversary of the Lehman Brothers collapse, market recollection of that chaotic episode has increasingly faded from memory. Indeed, 2009 has thus far been a year of spectacular returns for risk assets. It has also proven an exceptionally difficult period for those positioned bearishly in the marketplace. The Fund has remained cautiously positioned since implementing major changes to portfolio positions in the fourth quarter of 2008.
The advantage of hindsight confirms the Fund managers' view at the time: late 2008 was a critical juncture for the markets. Bearish sentiment had turned extreme. There was an unprecedented amount of shorting in the stock market, and perhaps too much of the selling was “indiscriminate.” Hedging strategies had also proliferated in the derivative markets. The credit freeze and stock market weakness were feeding on each other.
The Fund managers were at that time also carefully monitoring developments in Washington. It had become increasingly apparent that our policymakers were prepared to implement incredible monetary and fiscal measures to avert systemic meltdown. Analyzing macro circumstances was essential. The Fund managers became of the view that if policymakers were successful in stabilizing the credit system, the risk backdrop would turn decisively against shorting. System stabilization would increase the likelihood of a major short squeeze, a self-reinforcing unwind of bearish hedges, a market rally and a resulting boost to general confidence. Moreover, such a backdrop would foster heightened speculation and market uncertainty.
| 3 | The Fund regularly makes short sales of securities, which involves unlimited risk including the possibility that losses may exceed the original amount invested. The Fund may also use options and future contracts, which have risks associated with unlimited losses of the underlying holdings due to unanticipated market movements and failure to correctly predict the direction of securities prices, interest rates and currency exchanges rates. However, a mutual fund investor's risk is limited to the amount of investment in a mutual fund. The Fund may also hold restricted securities purchased through private placements. Such securities may be difficult to sell without experiencing delays or additional costs. Please see the Prospectus for further details. Considering the increased risks, the Fund may not be suitable for all investors. |
Annual Shareholder Report5
During the fourth quarter of 2008 and into 2009, the Fund managers significantly lowered the Fund's risk profile. Overall short exposure was reduced and, as importantly, the composition of the exposure was modified. The Fund pared back heavily shorted individual company positions and cut exposure to more volatile stocks and sectors. Short exposure was also decreased for stocks viewed as likely beneficiaries of emerging global reflation dynamics. Additionally, the Fund managers liquidated holdings of put options and then remained largely out of the options market for the remainder of the reporting period. In short, the Fund managers “hunkered down” - with reduced short exposure achieved primarily by shorting liquid S&P 500 instruments and lower volatility stocks. These moves mitigated losses and improved Fund performance.
The Fund managers' confidence in the secular bear market thesis remained intact at the end of the reporting period. They view the recent backdrop as one commanded by government intervention and a resulting bear market rally. Resurgent risk markets have been powered by extreme monetary and fiscal policy responses at home and around the world. While challenging, it is an environment that differentiates the various bear Fund strategies and investment philosophies. To be sure, this year's market rebound has illuminated the weaknesses inherent in leveraged and always fully short bear products. A very tough period for bear funds has also highlighted the merits of the Fund's risk-based actively managed strategy.
While not drifting from their mandate of the Fund providing a reliable market hedge, the Fund managers successfully implemented the Fund's risk management strategy. Throughout the rally off of March lows, the average stock significantly outperformed the S&P 500, and heavily-shorted stocks easily outperformed most equities. Bear funds that did not reduce overall short exposure and/or exposure to commonly shorted stocks suffered huge losses.
It is fundamental to the Fund managers' investment philosophy to remain flexible, tactical and disciplined with respect to managing fund short exposure. Micro company research and analysis on the short side proved, as it has on occasion, especially challenging for much of the reporting period. Fund performance, however, benefited from the other two “prongs” of the Fund managers' philosophy: diligent “top-down” macro analysis and disciplined risk-based portfolio management.
Annual Shareholder Report6
GROWTH OF A $10,000 INVESTMENT - Institutional shares1The graph below illustrates the hypothetical investment of $10,0002 in the Federated Prudent Bear Fund (Institutional Shares) (the “Fund”) from September 30, 1999 to September 30, 2009, compared to the Standard & Poor's 500 Index (S&P 500)3 and the S&P 500 Inverse Daily Index (S&P 500 Inverse).3
| Average Annual Total Returns for the Period Ended 9/30/2009 | |
| 1 Year | 0.41% |
| 5 Years | 5.26% |
| 10 Years | 7.47% |
Performance data quoted represents past performance which is no guarantee of future results. Investment return and principal value will fluctuate so that an investor's shares, when redeemed, may be worth more or less than their original cost. Mutual fund performance changes over time and current performance may be lower or higher than what is stated. For current to the most recent month-end performance and after-tax returns, visit FederatedInvestors.com or call 1-800-341-7400. Returns shown do not reflect the deduction of taxes that a shareholder would pay on Fund distributions or the redemption of Fund shares. Mutual funds are not obligations of or guaranteed by any bank and are not federally insured.
Annual Shareholder Report7
| 1 | Federated Prudent Bear Fund is the successor to Prudent Bear Fund pursuant to a reorganization that took place on December 5, 2008. The information presented above, for the periods prior to December 5, 2008, is historical information for the No Load Shares of the Prudent Bear Fund. |
| 2 | The Fund's performance assumes the reinvestment of all dividends and distributions. The NASDAQ Composite Index and the S&P 500 have been adjusted to reflect reinvestment of dividends on securities in the indexes. |
| 3 | The S&P 500 and the S&P 500 Inverse are not adjusted to reflect taxes, sales charges, expenses or other fees that the Securities and Exchange Commission requires to be reflected in the Fund's performance. The S&P 500 and the S&P 500 Inverse are unmanaged and, unlike the Fund, are not affected by cash flows. It is not possible to invest directly in an index. |
Annual Shareholder Report8
Portfolio of Investments Summary Tables (unaudited)
At September 30, 2009, the Fund's portfolio composition was as follows:
| Percentage of
Total Net Assets |
| Securities Sold Short | (49.6)% |
| Derivative Contracts — Short (notional value)1 | (22.0)% |
| U.S. Treasury Securities | 78.8% |
| U.S. Treasury Securities Held as Collateral for Securities Sold Short | 23.1% |
| Common Stock | 8.1% |
| Other Securities2,3 | 0.0% |
| Cash Equivalents4 | 9.7% |
| Adjustment for Derivative Contracts (notional value)1 | 21.8% |
| Collateral on Deposit for Securities Sold Short | 49.5% |
| Other Assets and Liabilities — Net5 | (19.4)% |
| TOTAL | 100.0% |
| 1 | Derivative contracts may consist of futures, forwards, options and swaps. More complete information regarding the Fund's direct investments in derivative contracts, including unrealized appreciation (depreciation), value, and notional values or amounts of such contracts, can be found in the table at the end of the Portfolio of Investments included in this Report. |
| 2 | Other Securities include warrants and purchased put options. |
| 3 | Represents less than 0.1%. |
| 4 | Cash Equivalents include any investments in money market mutual funds and/or overnight repurchase agreements. |
| 5 | Assets, other than investments in securities, securities sold short, derivative contracts and collateral on deposit for securities sold short, less liabilities. See Statement of Assets and Liabilities. |
Annual Shareholder Report9
At September 30, 2009, the Fund's sector composition6 for its short positions was as follows:| Sector Composition | Percentage of
Total Securities
Sold Short |
| Broad Equity Index | 54.2% |
| Consumer Discretionary | 11.9% |
| Consumer Staples | 8.2% |
| Health Care | 5.1% |
| Industrials | 4.6% |
| Financials | 3.4% |
| Information Technology | 2.6% |
| Telecommunication Services | 2.2% |
| Energy | 1.0% |
| Materials | 1.0% |
| Other7 | 5.8% |
| TOTAL | 100.0% |
| 6 | Sector classifications are based upon, and individual portfolio securities are assigned to, the classifications of the Global Industry Classification Standard (GICS) except that the adviser assigns a classification to securities not classified by the GICS and to securities for which the adviser does not have access to the classification made by the GICS. |
| 7 | Other includes exchange-traded funds. |
Annual Shareholder Report10
Portfolio of Investments
September 30, 2009
|
| Shares, Principal Amount or Units Held | | | Value |
| | Common Stocks – 8.1% | |
| | Energy – 0.0% | |
| 30,000 | 1 | Bankers Petroleum Ltd. | 132,536 |
| 1,000,000 | 1 | Powertech Uranium Corp., Class A | 312,894 |
| | TOTAL | 445,430 |
| | Materials – 8.1% | |
| 3,500,000 | 1 | Abacus Mining & Exploration Corp. | 833,606 |
| 77,400 | | Agnico Eagle Mines Ltd. | 5,251,590 |
| 1,282,000 | 1 | Antares Minerals, Inc. | 1,855,975 |
| 78,125 | 1,2,3 | Aquiline Resources, Inc. | 321,067 |
| 564,715 | 1 | Aquiline Resources, Inc. | 2,291,444 |
| 78,125 | 1,2,3 | Aquiline Resources, Inc. | 321,067 |
| 1,500,000 | 1,4 | Ascot Resources Ltd. | 980,713 |
| 1,140,000 | 1,2,3,4 | Ascot Resources Ltd. | 745,342 |
| 360,000 | 1,2,3,4 | Ascot Resources Ltd. | 235,371 |
| 3,000,000 | 1 | Benton Resources Corp. | 1,401,018 |
| 1,000,000 | 1 | Callinan Mines Ltd. | 840,611 |
| 400,000 | 1 | Cardero Resource Corp. | 440,854 |
| 3,204,000 | 1 | Centamin Egypt Ltd. | 4,907,822 |
| 137,300 | | Cia de Minas Buenaventura SA, Class B, ADR | 4,834,333 |
| 1,000,000 | 1 | Duran Ventures, Inc. | 88,731 |
| 2,171,098 | 1 | East Asia Minerals Corp. | 5,373,754 |
| 150,000 | 1,2,3 | East Asia Minerals Corp. | 371,270 |
| 807,000 | 1 | Evolving Gold Corp. | 934,647 |
| 950,000 | 1,2,3 | Evolving Gold Corp. | 1,100,266 |
| 1,828,200 | 1 | Fortuna Silver Mines, Inc. | 2,561,341 |
| 530,000 | 1,2,3 | Fortuna Silver Mines, Inc. | 742,540 |
| 112,100 | | Goldcorp, Inc., Class A | 4,525,477 |
| 175,000 | 1 | Golden Predator Royalty & Development Corp. | 94,802 |
| 920,000 | 1 | Golden Star Resources Ltd. | 3,136,413 |
| 1,400,000 | 1 | Grayd Resource Corp. | 490,356 |
| 973,800 | 1 | International Tower Hill Mines Ltd. | 3,929,217 |
| 350,000 | 1,2,3 | International Tower Hill Mines Ltd. | 1,412,226 |
Annual Shareholder Report11
|
| 150,000 | 1 | Jaguar Mining, Inc. | 1,342,175 |
| 538,000 | 1 | Kirkland Lake Gold, Inc. | 4,622,986 |
| 1,000,000 | 1,4 | Kootenay Gold, Inc. | 719,189 |
| 500,000 | 1,2,3,4 | Kootenay Gold, Inc. | 359,595 |
| 825,000 | 1,2,3,4 | Kootenay Gold, Inc. | 593,331 |
| 193,500 | 1 | Lake Shore Gold Corp. | 530,345 |
| 1,741,500 | 1 | Lake Shore Gold Corp. | 4,668,290 |
| 1,500,000 | 1,4 | MacArthur Minerals Ltd. | 1,190,865 |
| 800,000 | 1 | Mansfield Minerals, Inc. | 784,570 |
| 72,600 | | Newmont Mining Corp. | 3,195,852 |
| 690,000 | 1 | Osisko Exploration Ltd. | 5,129,968 |
| 2,000,000 | 1 | Palladon Ventures Ltd. | 196,143 |
| 69,100 | | Randgold Resources Ltd., ADR | 4,828,708 |
| 361,400 | 1 | Red Back Mining, Inc. | 4,060,750 |
| 1,500,000 | 1 | Rockgate Capital Corp. | 700,509 |
| 63,500 | | Royal Gold, Inc. | 2,895,600 |
| 1,345,000 | 1 | San Gold Corp. | 3,705,926 |
| 4,000,000 | 1 | Selkirk Metals Corp. | 541,727 |
| 526,238 | 1 | Silver Wheaton Corp. | 6,679,654 |
| 800,000 | 1 | Trevali Resources Corp. | 470,742 |
| 100,000 | 1 | Underworld Resources, Inc. | 121,422 |
| 477,000 | | Yamana Gold, Inc. | 5,108,670 |
| | TOTAL | 102,468,870 |
| | TOTAL COMMON STOCKS
(IDENTIFIED COST $96,892,170) | 102,914,300 |
| | Warrants – 0.0% | |
| | Industrials – 0.0% | |
| 105,990 | 1 | Aura Systems, Inc., Warrants | 7,743 |
| | Materials – 0.0% | |
| 570,000 | 1 | Ascot Resources Ltd., Warrants | 729 |
| 43,500 | 1 | Chesapeake Gold Corp., Warrants | 17,988 |
| 1,050,000 | 1 | EMC Metals Corp., Warrants | 33,074 |
| 475,000 | 1 | Evolving Gold Corp., Warrants | 116,276 |
| 262,500 | 1 | Golden Predator Royalty & Development Corp., Warrants | 0 |
| 412,500 | 1 | Kootenay Gold, Inc., Warrants | 1,855 |
Annual Shareholder Report12
|
| 250,000 | 1 | Kootenay Gold, Inc., Warrants | 17,880 |
| 313,333 | 1 | Northrock Resources, Inc., Warrants | 0 |
| | TOTAL | 187,802 |
| | TOTAL WARRANTS
(IDENTIFIED COST $18,135) | 195,545 |
| | Purchased Put Options – 0.0% | |
| 650 | 1 | Juniper Networks, Inc., Strike Price $21, Expiration Date 10/17/2009 | 4,875 |
| 3,000 | 1 | Semiconductor Holders Trust, Strike Price $24, Expiration Date 11/21/2009 | 204,000 |
| 700 | 1 | Western Digital Corp., Strike Price $22.50, Expiration Date 10/17/2009 | 5,250 |
| | TOTAL PURCHASED PUT OPTIONS
(IDENTIFIED COST $405,260) | 214,125 |
| | U.S. Treasury – 101.9%;5 | |
| | U.S. Treasury Bills – 101.9% | |
| $277,200,000 | | U.S. Treasury Bill, 0.085%, 10/1/2009 | 277,200,000 |
| 186,000,000 | 6 | U.S. Treasury Bill, 0.04%, 10/22/2009 | 185,996,466 |
| 23,000,000 | | U.S. Treasury Bill, 0.04%, 10/29/2009 | 22,999,038 |
| 66,000,000 | | U.S. Treasury Bill, 0.05%, 11/12/2009 | 65,996,535 |
| 108,000,000 | 6 | U.S. Treasury Bill, 0.18%, 11/19/2009 | 107,991,544 |
| 40,000,000 | | U.S. Treasury Bill, 0.14%, 12/10/2009 | 39,995,140 |
| 250,000,000 | | U.S. Treasury Bill, 0.285%, 2/11/2010 | 249,894,315 |
| 349,000,000 | | U.S. Treasury Bill, 0.275%, 2/4/2010 | 348,877,850 |
| | TOTAL U.S. TREASURY
(IDENTIFIED COST $1,298,906,945) | 1,298,950,888 |
| | Mutual Fund – 9.7% | |
| 123,052,804 | 4,7 | U.S. Treasury Cash Reserves Fund, Institutional Shares, 0.00%
(AT NET ASSET VALUE) | 123,052,804 |
| | TOTAL INVESTMENTS — 119.7%
(IDENTIFIED COST $1,519,275,314)8 | 1,525,327,662 |
| | OTHER ASSETS AND LIABILITIES - NET — (19.7)%9 | (250,934,990) |
| | TOTAL NET ASSETS — 100% | $1,274,392,672 |
Annual Shareholder Report13
SCHEDULE OF SECURITIES SOLD SHORT
| Shares | | Value |
| 680,000 | Amex Financial Select Standard & Poor Depository Receipt | $10,159,200 |
| 135,000 | Au Optronics Corp., Class ADR | 1,306,800 |
| 160,000 | Bard (C.R.), Inc. | 12,577,600 |
| 800,000 | Burger King Holdings, Inc. | 14,072,000 |
| 145,000 | Comcast Corp., Class A | 2,449,050 |
| 355,000 | Consumer Discretionary Select Sector SPDR Fund | 9,751,850 |
| 230,000 | Consumer Staples Select Sector SPDR Fund | 5,855,800 |
| 85,000 | Corning, Inc. | 1,301,350 |
| 130,000 | Danaher Corp. | 8,751,600 |
| 347,500 | Darden Restaurants, Inc. | 11,860,175 |
| 135,000 | Ecolab, Inc. | 6,241,050 |
| 240,000 | Estee Lauder Cos., Inc., Class A | 8,899,200 |
| 50,000 | FTI Consulting, Inc. | 2,130,500 |
| 829,000 | Hologic, Inc. | 13,545,860 |
| 500,000 | Home Depot, Inc. | 13,320,000 |
| 390,000 | Industrial Select Sect SPDR | 10,272,600 |
| 25,000 | Juniper Networks, Inc. | 675,500 |
| 170,000 | Kimberly-Clark Corp. | 10,026,600 |
| 115,000 | Kinder Morgan Energy Partners LP | 6,212,300 |
| 130,000 | Kraft Foods, Inc., Class A | 3,415,100 |
| 170,000 | Landstar System, Inc. | 6,470,200 |
| 250,000 | Lowe's Cos., Inc. | 5,235,000 |
| 1 | Marriott International Inc. | 21 |
| 235,000 | Materials Select Sector SPDR Trust | 7,261,500 |
| 280,000 | McCormick & Co., Inc. | 9,503,200 |
| 420,000 | Nokia Oyj, Class A, ADR | 6,140,400 |
| 35,000 | Novellus Systems, Inc. | 734,300 |
| 485,000 | Pitney Bowes, Inc. | 12,052,250 |
| 370,000 | Plum Creek Timber Co., Inc. | 11,336,800 |
| 70,000 | Research in Motion Ltd. | 4,728,500 |
| 3,244,300 | S&P Depositary Receipts Trust | 342,468,308 |
| 555,000 | Sara Lee Corp. | 6,182,700 |
| 100,000 | SPDR S&P Retail ETF | 3,413,000 |
| 595,000 | Staples, Inc. | 13,815,900 |
| 560,000 | Sysco Corp. | 13,916,000 |
Annual Shareholder Report14
| Shares | | Value |
| 140,000 | Varian Medical Systems, Inc. | $5,898,200 |
| 450,000 | Verizon Communications, Inc. | 13,621,500 |
| 27,000 | Visa, Inc., Class A | 1,865,970 |
| 420,000 | Yum! Brands, Inc. | 14,179,200 |
| TOTAL SECURITIES SOLD SHORT (PROCEEDS $553,772,282) | $631,647,084 |
- At September 30, 2009, the Fund had the following outstanding futures contracts:
| Description | Number of
Contracts | Notional
Value | Expiration
Date | Unrealized
Depreciation |
| 1S&P 500 Index Short Futures | 1,065 | $280,334,625 | December 2009 | $(2,123,197) |
- Unrealized Depreciation on Futures Contracts and Value of Securities Sold Short are included in “Other Assets and Liabilities - Net.”
- Note: The categories of investments are shown as a percentage of total net assets at September 30, 2009.
Annual Shareholder Report15
- Various inputs are used in determining the value of the Fund's investments. These inputs are summarized in the three broad levels listed below:
- Level 1 — quoted prices in active markets for identical securities
- Level 2 — other significant observable inputs (including quoted prices for similar securities, interest rates, prepayment speeds, credit risk, etc.)
- Level 3 — significant unobservable inputs (including the Fund's own assumptions in determining the fair value of investments)
- The inputs or methodology used for valuing securities are not an indication of the risk associated with investing in those securities.
- The following is a summary of the inputs used, as of September 30, 2009, in valuing the Fund's assets carried at fair value:
| Valuation Inputs | | | | |
| Level 1 —
Quoted
Prices and
Investments in
Mutual Funds | Level 2 —
Other
Significant
Observable
Inputs | Level 3 —
Significant
Unobservable
Inputs | Total |
| Equity Securities: | | | | |
| Domestic | $6,091,452 | $ — | $ — | $6,091,452 |
| International | 96,822,848 | — | — | 96,822,848 |
| Warrants | — | 195,545 | — | 195,545 |
| Purchased Put Options | 214,125 | — | — | 214,125 |
| Debt Securities: | | | | |
| U.S. Treasury | — | 1,298,950,888 | — | 1,298,950,888 |
| Mutual Fund | 123,052,804 | — | — | 123,052,804 |
| TOTAL SECURITIES | $226,181,229 | $1,299,146,433 | $ — | $1,525,327,662 |
| OTHER FINANCIAL INSTRUMENTS* | $(633,770,281) | $ — | $ — | $(633,770,281) |
| * | Other financial instruments include securities sold short and futures contracts. |
- The following acronym is used throughout this portfolio:
- ADR — American Depositary Receipt
- See Notes which are an integral part of the Financial Statements
Annual Shareholder Report16
Statement of Assets and Liabilities
September 30, 2009
| Assets: | | |
| Total investments in securities, at value including $127,877,210 of investments in affiliated issuers (Note 5) (identified cost $1,519,275,314) | | $1,525,327,662 |
| Deposit at brokers for short sales | | 630,229,741 |
| Income receivable | | 9,134 |
| Receivable for investments sold | | 23,068,686 |
| Receivable for shares sold | | 25,709,462 |
| Receivable for daily variation margin | | 421,946 |
| TOTAL ASSETS | | 2,204,766,631 |
| Liabilities: | | |
| Securities sold short, at value (proceeds $553,772,282) | $631,647,084 | |
| Dividends payable on short positions | 2,175,676 | |
| Payable for investments purchased | 292,902,627 | |
| Payable for shares redeemed | 2,824,109 | |
| Payable for distribution services fee (Note 5) | 101,950 | |
| Payable for shareholder services fee (Note 5) | 418,246 | |
| Accrued expenses | 304,267 | |
| TOTAL LIABILITIES | | 930,373,959 |
| Net assets for 222,864,256 shares outstanding | | $1,274,392,672 |
| Net Assets Consist of: | | |
| Paid-in capital | | $1,435,308,720 |
| Net unrealized depreciation of investments, short sales, futures contracts and translation of assets and liabilities in foreign currency | | (73,945,658) |
| Accumulated net realized loss on investments, short sales, futures contracts and foreign currency transactions | | (84,537,135) |
| Distributions in excess of net investment income | | (2,433,255) |
| TOTAL NET ASSETS | | $1,274,392,672 |
Annual Shareholder Report17
Statement of Assets and Liabilities — continued| Net Asset Value, Offering Price and Redemption Proceeds Per Share | | |
| Class A Shares: | | |
| Net asset value per share ($1,079,142,598 ÷ 187,863,312 shares outstanding), no par value, unlimited shares authorized | | $5.74 |
| Offering price per share (100/94.50 of $5.74) | | $6.07 |
| Redemption proceeds per share | | $5.74 |
| Class C Shares: | | |
| Net asset value per share ($96,517,691 ÷ 17,859,796 shares outstanding), no par value, unlimited shares authorized | | $5.40 |
| Offering price per share | | $5.40 |
| Redemption proceeds per share (99.00/100 of $5.40) | | $5.35 |
| Institutional Shares: | | |
| Net asset value per share ($98,732,383 ÷ 17,141,148 shares outstanding), no par value, unlimited shares authorized | | $5.76 |
| Offering price per share | | $5.76 |
| Redemption proceeds per share | | $5.76 |
- See Notes which are an integral part of the Financial Statements
Annual Shareholder Report18
Statement of Operations
Year Ended September 30, 2009
| Investment Income: | | | |
| Dividends (including $30,443 received from affiliated issuers (Note 5) and net of foreign taxes withheld of $8,053) | | | $387,121 |
| Interest | | | 6,521,840 |
| TOTAL INCOME | | | 6,908,961 |
| Expenses: | | | |
| Investment adviser fee (Note 5) | | $14,081,214 | |
| Administrative personnel and services fee (Note 5) | | 854,047 | |
| Custodian fees | | 96,611 | |
| Transfer and dividend disbursing agent fees and expenses | | 983,636 | |
| Directors'/Trustees' fees | | 75 | |
| Auditing fees | | 18,104 | |
| Legal fees | | 12,145 | |
| Portfolio accounting fees | | 177,094 | |
| Distribution services fee — Class A Shares (Note 5) | | 533,746 | |
| Distribution services fee — Class C Shares (Note 5) | | 517,958 | |
| Shareholder services fee — Class A Shares (Note 5) | | 2,034,715 | |
| Shareholder services fee — Class C Shares (Note 5) | | 136,038 | |
| Share registration costs | | 321,430 | |
| Printing and postage | | 62,478 | |
| Insurance premiums | | 16,326 | |
| Dividends on short positions | | 12,622,974 | |
| Miscellaneous | | 80,265 | |
| TOTAL EXPENSES | | 32,548,856 | |
Annual Shareholder Report19
Statement of Operations — continued| Reimbursement, Waiver and Expense Reduction: | | | |
| Reimbursement of investment adviser fee (Note 5) | $(66,204) | | |
| Waiver of administrative personnel and services fee (Note 5) | (13,339) | | |
| Fees paid indirectly from directed brokerage arrangements (Note 6) | (258,530) | | |
| TOTAL REIMBURSEMENT, WAIVER AND EXPENSE REDUCTION | | $(338,073) | |
| Net expenses | | | $32,210,783 |
| Net investment income (loss) | | | (25,301,822) |
| Realized and Unrealized Gain (Loss) on Investments, Short Sales, Futures Contracts and Foreign Currency Transactions: | | | |
| Net realized gain on investments and foreign currency transactions | | | 22,959,834 |
| Net realized gain on short sales | | | 49,135,989 |
| Net realized gain on futures contracts | | | 52,789,941 |
| Net change in unrealized depreciation of investments and translation of assets and liabilities in foreign currency | | | 51,070,652 |
| Net change in unrealized appreciation of short sales | | | (121,604,265) |
| Net change in unrealized appreciation of futures contracts | | | (19,955,759) |
| Net realized and unrealized gain on investments, short sales, futures contracts and foreign currency transactions | | | 34,396,392 |
| Change in net assets resulting from operations | | | $9,094,570 |
- See Notes which are an integral part of the Financial Statements
Annual Shareholder Report20
Statement of Changes in Net Assets
| Year Ended September 30 | 2009 | 2008 |
| Increase (Decrease) in Net Assets | | |
| Operations: | | |
| Net investment income (loss) | $(25,301,822) | $8,480,093 |
| Net realized gain on investments, short sales, futures contracts and foreign currency transactions | 124,885,764 | 127,804,837 |
| Net change in unrealized appreciation/depreciation of investments, short sales, futures contracts and translation of assets and liabilities in foreign currency | (90,489,372) | 5,530,726 |
| CHANGE IN NET ASSETS RESULTING FROM OPERATIONS | 9,094,570 | 141,815,656 |
| Distributions to Shareholders: | | |
| Distributions from net investment income | | |
| Class A Shares | — | (26,200,904) |
| Class C Shares | — | (1,491,647) |
Distributions from net realized gain on investments, short sales,
futures contracts and foreign currency transactions | | |
| Class A Shares | (173,510,350) | — |
| Class C Shares | (10,042,019) | — |
| Return of capital | | |
| Class A Shares | (1,818,702) | — |
| Class C Shares | (105,258) | — |
| CHANGE IN NET ASSETS RESULTING FROM DISTRIBUTIONS TO SHAREHOLDERS | (185,476,329) | (27,692,551) |
| Share Transactions: | | |
| Proceeds from sale of shares | 1,467,215,872 | 1,035,095,704 |
| Net asset value of shares issued to shareholders in payment of distributions declared | 169,504,332 | 24,569,158 |
| Cost of shares redeemed | (1,306,118,568) | (846,993,617) |
| CHANGE IN NET ASSETS RESULTING FROM SHARE TRANSACTIONS | 330,601,636 | 212,671,245 |
| Redemption fees | — | 595,501 |
| Change in net assets | 154,219,877 | 327,389,851 |
| Net Assets: | | |
| Beginning of period | 1,120,172,795 | 792,782,944 |
| End of period (including distributions in excess of net investment income of $(2,433,255) and $(7,781,610), respectively) | $1,274,392,672 | $1,120,172,795 |
- See Notes which are an integral part of the Financial Statements
Annual Shareholder Report21
Notes to Financial Statements
September 30, 2009
1. ORGANIZATION
Federated Equity Funds (the “Trust”) is registered under the Investment Company Act of 1940, as amended (the “Act”), as a diversified, open-end management investment company. The Trust consists of thirteen portfolios. The financial statements included herein are only those of the Federated Prudent Bear Fund (the “Fund”). The financial statements of the other portfolios are presented separately. The assets of each portfolio are segregated and a shareholder's interest is limited to the portfolio in which shares are held. Each portfolio pays its own expenses. The Fund offers three classes of shares: Class A Shares, Class C Shares and Institutional Shares. All Shares of the Fund have equal rights with respect to voting, except on class-specific matters. The financial highlights of the Class A Shares and Class C Shares are presented separately. The investment objective of the Fund is to seek capital appreciation.
Prudent Bear Fund (the “Predecessor Fund”) was reorganized into the Fund as of the close of business on December 5, 2008. Prior to the reorganization, the Fund had no investment operations.
The Fund commenced offering Institutional Shares on December 8, 2008.
2. SIGNIFICANT ACCOUNTING POLICIES
The following is a summary of significant accounting policies consistently followed by the Fund in the preparation of its financial statements. These policies are in conformity with U.S. generally accepted accounting principles (GAAP).
Investment Valuation
In calculating its net asset value (NAV), the Fund generally values investments as follows:
- Equity securities including shares of Exchange Traded Funds listed on an exchange or traded through a regulated market system are valued at their last reported sale price or official closing price in their principal exchange or market.
- Fixed-income securities acquired with remaining maturities greater than 60 days are fair valued using price evaluations provided by a pricing service approved by the Trustees.
- Fixed-income securities acquired with remaining maturities of 60 days or less are valued at their cost (adjusted for the accretion of any discount or amortization of any premium).
- Shares of other mutual funds are valued based upon their reported NAVs.
- Derivative contracts listed on exchanges are valued at their reported settlement or closing price.
- Over-the-counter (OTC) derivative contracts are fair valued using price evaluations provided by a pricing service approved by the Trustees.
If the Fund cannot obtain a price or price evaluation from a pricing service for an investment, the Fund may attempt to value the investment based upon the mean of bid and asked quotations or fair value the investment based on price evaluations, from one or more dealers. If any price, quotation, price evaluation or other pricing source is not readily available when the NAV is calculated, the Fund uses the fair value of the investment determined in accordance with the procedures described below. There can be no assurance that the Fund could purchase or sell an investment at the price used to calculate the Fund's NAV.
Annual Shareholder Report22
Fair Valuation and Significant Events ProceduresThe Trustees have authorized the use of pricing services to provide evaluations of the current fair value of certain investments for purposes of calculating the NAV. Factors considered by pricing services in evaluating an investment include the yields or prices of investments of comparable quality, coupon, maturity, call rights and other potential prepayments, terms and type, reported transactions, indications as to values from dealers, and general market conditions. Some pricing services provide a single price evaluation reflecting the bid-side of the market for an investment (a “bid” evaluation). Other pricing services offer both bid evaluations and price evaluations indicative of a price between the prices bid and asked for the investment (a “mid” evaluation). The Fund normally uses bid evaluations for U.S. Treasury and Agency securities, mortgage-backed securities and municipal securities. The Fund normally uses mid evaluations for other types of fixed-income securities and OTC derivative contracts. In the event that market quotations and price evaluations are not available for an investment, the fair value of the investment is determined in accordance with procedures adopted by the Trustees.
The Trustees also have adopted procedures requiring an investment to be priced at its fair value whenever the Adviser determines that a significant event affecting the value of the investment has occurred between the time as of which the price of the investment would otherwise be determined and the time as of which the NAV is computed. An event is considered significant if there is both an affirmative expectation that the investment's value will change in response to the event and a reasonable basis for quantifying the resulting change in value. Examples of significant events that may occur after the close of the principal market on which a security is traded, or after the time of a price evaluation provided by a pricing service or a dealer, include:
- With respect to securities traded in foreign markets, significant trends in U.S. equity markets or in the trading of foreign securities index futures or options contracts;
- With respect to price evaluations of fixed-income securities determined before the close of regular trading on the NYSE, actions by the Federal Reserve Open Market Committee and other significant trends in U.S. fixed-income markets;
- Political or other developments affecting the economy or markets in which an issuer conducts its operations or its securities are traded; and
- Announcements concerning matters such as acquisitions, recapitalizations, litigation developments, a natural disaster affecting the issuer's operations or regulatory changes or market developments affecting the issuer's industry.
The Trustees have approved the use of a pricing service to determine the fair value of equity securities traded principally in foreign markets when the Adviser determines that there has been a significant trend in the U.S. equity markets or in index futures trading. For other significant events, the Fund may seek to obtain more current quotations or price evaluations from alternative pricing sources. If a reliable alternative pricing source is not available, the Fund will determine the fair value of the investment using another method approved by the Trustees.
Repurchase Agreements
It is the policy of the Fund to require the other party to a repurchase agreement to transfer to the Fund's custodian or sub-custodian eligible securities or cash with a market value (after transaction costs) at least equal to the repurchase price to be paid under the repurchase agreement. The eligible securities are transferred to accounts with the custodian or sub-custodian in which the Fund holds a “securities entitlement” and exercises “control” as those terms are defined in the Uniform Commercial Code. The Fund has established procedures for Annual Shareholder Report23
monitoring the market value of the transferred securities and requiring the transfer of additional eligible securities if necessary to equal at least the repurchase price. These procedures also allow the other party to require securities to be transferred from the account to the extent that their market value exceeds the repurchase price or in exchange for other eligible securities of equivalent market value.With respect to agreements to repurchase U.S. government securities and cash items, the Fund treats the repurchase agreement as an investment in the underlying securities and not as an obligation of the other party to the repurchase agreement. Other repurchase agreements are treated as obligations of the other party secured by the underlying securities. Nevertheless, the insolvency of the other party or other failure to repurchase the securities may delay the disposition of the underlying securities or cause the Fund to receive less than the full repurchase price. Under the terms of the repurchase agreement, any amounts received by the Fund in excess of the repurchase price and related transaction costs must be remitted to the other party.
The Fund may enter into repurchase agreements in which eligible securities are transferred into joint trading accounts maintained by the custodian or sub-custodian for investment companies and other clients advised by the Fund's Adviser and its affiliates. The Fund will participate on a pro-rata basis with the other investment companies and clients in its share of the securities transferred under such repurchase agreements and in its share of proceeds from any repurchase or other disposition of such securities.
Investment Income, Gains and Losses, Expenses and Distributions
Investment transactions are accounted for on a trade-date basis. Realized gains and losses from investment transactions are recorded on an identified-cost basis. Interest income and expenses are accrued daily. Dividend income and distributions to shareholders are recorded on the ex-dividend date. Foreign dividends are recorded on the ex-dividend date or when the Fund is informed of the ex-dividend date. Distributions of net investment income, if any, are declared and paid annually. Non-cash dividends included in dividend income, if any, are recorded at fair value. Investment income, realized and unrealized gains and losses, and certain fund-level expenses are allocated to each class based on relative average daily net assets, except that each class may bear certain expenses unique to that class such as distribution services and shareholder services fees. Dividends are declared separately for each class. No class has preferential dividend rights; differences in per share dividend rates are generally due to differences in separate class expenses.
Premium and Discount Amortization
All premiums and discounts on fixed-income securities are amortized/accreted for financial statement purposes.
Federal Taxes
It is the Fund's policy to comply with the Subchapter M provision of the Internal Revenue Code (the “Code”) and to distribute to shareholders each year substantially all of its income. Accordingly, no provision for federal income tax is necessary. As of and during the year ended September 30, 2009, the Fund did not have a liability for any uncertain tax positions. The Fund recognizes interest and penalties, if any, related to tax liabilities as income tax expense in the Statement of Operations. As of September 30, 2009, the following tax years remain subject to examination by the Fund's major tax jurisdictions, the United States of America (2006 through 2009), the state of Maryland (2006 through 2008) and the Commonwealth of Massachusetts (2009).
Annual Shareholder Report24
The Fund may be subject to taxes imposed by governments of countries in which it invests. Such taxes are generally based on either income or gains earned or repatriated. The Fund accrues and applies such taxes to net investment income, net realized gains and net unrealized gains as income and/or gains are earned.When-Issued and Delayed Delivery Transactions
The Fund may engage in when-issued or delayed delivery transactions. The Fund records when-issued securities on the trade date and maintains security positions such that sufficient liquid assets will be available to make payment for the securities purchased. Securities purchased on a when-issued or delayed delivery basis are marked to market daily and begin earning interest on the settlement date. Losses may occur on these transactions due to changes in market conditions or the failure of counterparties to perform under the contract.
Futures Contracts
The Fund purchases and sells financial futures contracts to manage cash flows, enhance yield, manage duration and to potentially reduce transaction costs. Upon entering into a financial futures contract with a broker, the Fund is required to deposit in a segregated account a specified amount of cash or U.S. government securities. Futures contracts are valued daily and unrealized gains or losses are recorded in a “variation margin” account. Daily, the Fund receives from or pays to the broker a specified amount of cash based upon changes in the variation margin account. When a contract is closed, the Fund recognizes a realized gain or loss. Futures contracts have market risks, including the risk that the change in the value of the contract may not correlate with the changes in the value of the underlying securities. There is minimal counterparty risk to the Fund since futures are exchange traded and the exchange's clearing house, as counterparty to all exchange traded futures, guarantees the futures against default.
Futures contracts outstanding at period end are listed after the Fund's Portfolio of Investments.
Foreign Exchange Contracts
The Fund may enter into foreign exchange contracts for the delayed delivery of securities or foreign currency exchange transactions. The Fund may enter into foreign exchange contracts to protect assets against adverse changes in foreign currency exchange rates or exchange control regulations. Purchased contracts are used to acquire exposure to foreign currencies, whereas, contracts to sell are used to hedge the Fund's securities against currency fluctuations. Risks may arise upon entering into these transactions from the potential inability of counterparties to meet the terms of their commitments and from unanticipated movements in security prices or foreign exchange rates. The foreign exchange contracts are adjusted by the daily exchange rate of the underlying currency and any gains or losses are recorded for financial statement purposes as unrealized until the settlement date.
At September 30, 2009, the Fund had no outstanding foreign exchange contracts.
Foreign Currency Translation
The accounting records of the Fund are maintained in U.S. dollars. All assets and liabilities denominated in foreign currencies (FCs) are translated into U.S. dollars based on the rates of exchange of such currencies against U.S. dollars on the date of valuation. Purchases and sales of securities, income and expenses are translated at the rate of exchange quoted on the Annual Shareholder Report25
respective date that such transactions are recorded. The Fund does not isolate that portion of the results of operations resulting from changes in foreign exchange rates on investments from the fluctuations arising from changes in market prices of securities held. Such fluctuations are included with the net realized and unrealized gain or loss from investments.Reported net realized foreign exchange gains or losses arise from sales of portfolio securities, sales and maturities of short-term securities, sales of FCs, currency gains or losses realized between the trade and settlement dates on securities transactions, the difference between the amounts of dividends, interest and foreign withholding taxes recorded on the Fund's books and the U.S. dollar equivalent of the amounts actually received or paid. Net unrealized foreign exchange gains and losses arise from changes in the value of assets and liabilities other than investments in securities at fiscal year end, resulting from changes in the exchange rate.
Short Sales
The Fund may sell a security in an effort to take advantage of an anticipated decline in the price of a security. In a short sale, the Fund sells a security it does not own, and must borrow the security in order to deliver it at completion of the sale. The Fund then has an obligation to replace the borrowed security. If the Fund can buy the security back at a lower price than it sold it for, a gain is realized. If the Fund has to buy the security back at a higher price, a loss is realized. For the year ended September 30, 2009, the Fund had a net realized gain on short sales of $49,135,989.
Restricted Securities
Restricted securities are securities that either: (a) cannot be offered for public sale without first being registered, or being able to take advantage of an exemption from registration, under the Securities Act of 1933; or (b) are subject to contractual restrictions on public sales. In some cases, when a security cannot be offered for public sale without first being registered, the issuer of the restricted security has agreed to register such securities for resale, at the issuer's expense, either upon demand by the Fund or in connection with another registered offering of the securities. Many such restricted securities may be resold in the secondary market in transactions exempt from registration. Restricted securities may be determined to be liquid under criteria established by the Trustees. The Fund will not incur any registration costs upon such resales. The Fund's restricted securities are valued at the price provided by dealers in the secondary market or, if no market prices are available, at the fair value as determined in accordance with procedures established by and under the general supervision of the Trustees.
Annual Shareholder Report26
Additional Disclosure Related to Derivative Instruments| Fair Value of Derivative Instruments |
| Asset | Liability |
| Statement of
Assets and
Liabilities
Location | Fair
Value | Statement of
Assets and
Liabilities
Location | Fair
Value |
| Derivatives not accounted for as hedging instruments under ASC Topic 815 | | | | |
| Equity contracts | Total investments in securities, at value | $214,125 | Payable for daily variation margin | $2,123,197* |
| Total derivatives not accounted for as hedging instruments under ASC Topic 815 | | $214,125 | | $2,123,197* |
| * | Includes cumulative appreciation/depreciation of futures contracts as reported in the footnotes to the Portfolio of Investments. Only the current day's variation margin is reported within the Statement of Assets and Liabilities. |
The Effect of Derivative Instruments on the Statement of Operations for the Year Ended September 30, 2009
| Amount of Realized Gain or (Loss) on Derivatives Recognized in Income |
| Futures | Options Purchased | Total |
| Equity contracts | $52,789,941 | $56,166,012 | $108,955,953 |
| Change in Unrealized Appreciation or (Depreciation) on Derivatives Recognized in Income |
| Futures | Options Purchased | Total |
| Equity contracts | $(19,955,759) | $(10,836,557) | $(30,792,316) |
Other
The preparation of financial statements in conformity with GAAP requires management to make estimates and assumptions that affect the amounts of assets, liabilities, expenses and revenues reported in the financial statements. Actual results could differ from those estimated.
3. SHARES OF BENEFICIAL INTEREST
The following tables summarize share activity:
| Year Ended September 30 | 2009 | 2008 |
| Class A Shares: | Shares | Amount | Shares | Amount |
| Shares sold | 181,643,280 | $1,239,068,201 | 151,743,434 | $993,068,972 |
| Shares issued to shareholders in payment of distributions declared | 22,521,701 | 159,903,968 | 3,739,564 | 23,372,279 |
| Shares redeemed | (170,901,800) | (1,222,208,200) | (126,354,362) | (817,484,352) |
NET CHANGE RESULTING
FROM CLASS A
SHARE TRANSACTIONS | 33,263,181 | $176,763,969 | 29,128,636 | $198,956,899 |
Annual Shareholder Report27
| Year Ended September 30 | 2009 | 2008 |
| Class C Shares: | Shares | Amount | Shares | Amount |
| Shares sold | 15,576,712 | $95,640,248 | 6,724,197 | $42,026,732 |
| Shares issued to shareholders in payment of distributions declared | 1,428,625 | 9,600,364 | 199,148 | 1,196,879 |
| Shares redeemed | (9,234,650) | (63,425,320) | (4,725,762) | (29,509,265) |
NET CHANGE RESULTING
FROM CLASS C
SHARE TRANSACTIONS | 7,770,687 | $41,815,292 | 2,197,583 | $13,714,346 |
| Period Ended
9/30/20091 | Year Ended
9/30/2008 |
| Institutional Shares: | Shares | Amount | Shares | Amount |
| Shares sold | 20,490,104 | $132,507,423 | — | $ — |
| Shares redeemed | (3,348,956) | (20,485,048) | — | — |
NET CHANGE RESULTING
FROM INSTITUTIONAL
SHARE TRANSACTIONS | 17,141,148 | $112,022,375 | — | $ — |
NET CHANGE RESULTING
FROM FUND
SHARE TRANSACTIONS | 58,175,016 | $330,601,636 | 31,326,219 | $212,671,245 |
| 1 | Reflects operations for the period from December 8, 2008 (date of initial investment) to September 30, 2009. |
Redemption Fees
Prior to December 5, 2008, the Predecessor Fund imposed a 1.00% redemption fee to shareholders of the Fund's Class A Shares and Class C Shares who redeemed shares held for 30 days or less. Shares acquired by reinvestment of dividends or distributions of the Fund, or purchased pursuant to the Systematic Investment Program or withdrawn pursuant to the Systematic Withdrawal Program, were not subject to the redemption fee. All redemption fees were recorded by the Predecessor Fund as additions to paid-in capital. For the year ended September 30, 2008, the redemption fees for Class A Shares and Class C Shares amounted to $588,061 and $7,440, respectively.
4. FEDERAL TAX INFORMATION
The timing and character of income and capital gain distributions are determined in accordance with income tax regulations, which may differ from GAAP. These differences are due in part to differing treatments for foreign currency transactions, dividends paid on short positions, passive foreign investment company adjustments and net operating loss.
For the year ended September 30, 2009, permanent differences identified and reclassified among the components of net assets were as follows:
| Increase (Decrease) |
| Paid-In Capital | Undistributed
Net Investment
Income (Loss) | Accumulated
Net Realized
Gain (Loss) |
| $(21,180,550) | $30,650,177 | $(9,469,627) |
Annual Shareholder Report28
Net investment income (loss), net realized gains (losses) and net assets were not affected by this reclassification.
The tax character of distributions as reported on the Statement of Changes in Net Assets for the years ended September 30, 2009 and 2008 was as follows:
| 2009 | 2008 |
| Ordinary income1 | $121,757,399 | $27,692,551 |
| Long-term capital gains | $61,794,970 | $ — |
| Return of capital | $1,923,960 | $ — |
| 1 | For tax purposes, short-term capital gain distributions are considered ordinary income distributions. |
As of September 30, 2009, the components of distributable earnings on a tax basis were as follows:
| Net unrealized depreciation | $(119,694,427) |
| Capital and currency loss deferrals | $(41,221,621) |
The difference between book-basis and tax-basis net unrealized appreciation/depreciation is attributable in part to differing treatments for the deferral of losses on wash sales and the realization for tax purposes of unrealized gains on investments in passive foreign investment companies.
At September 30, 2009, the cost of investments for federal tax purposes was $1,564,030,219. The net unrealized depreciation of investments for federal tax purposes excluding any unrealized depreciation resulting from changes in foreign currency exchange rates, securities sold short and futures contracts was $38,702,557. This consists of net unrealized depreciation from investments for those securities having an excess of cost over value of $38,702,557.
Under current tax regulations, capital losses on security transactions and foreign currency losses realized after October 31 may be deferred and treated as occurring on the first day of the following fiscal year. As of September 30, 2009, for federal income tax purposes, post-October losses of $41,057,248 on capital losses on security transactions and $164,373 on foreign currency losses were deferred to October 1, 2009.
5. INVESTMENT ADVISER FEE AND OTHER TRANSACTIONS WITH AFFILIATES
Investment Adviser Fee
Federated Equity Management Company of Pennsylvania is the Fund's investment adviser (the “Adviser”). The advisory agreement between the Fund and the Adviser provides for an annual fee equal to 1.25% of the Fund's average daily net assets. Subject to the terms described in the Expense Limitation note, the Adviser may voluntarily choose to waive any portion of its fee and/or reimburse certain operating expenses of the Fund. The Adviser can modify or terminate this voluntary waiver and/or reimbursement at any time at its sole discretion.
For the period from December 6, 2008 to September 30, 2009, the net fee paid to the Adviser was $11,260,773.
Prior to the close of business on December 5, 2008, the Predecessor Fund's investment adviser was David W. Tice & Associates, LLC. After the close of business on December 5, 2008, the Predecessor Fund was reorganized into the Fund. The annual rate did not change due to this reorganization. For the period from October 1, 2008 to December 5, 2008, the net fee paid to David W. Tice & Associates, LLC was $2,754,237.
Annual Shareholder Report29
Administrative FeeEffective close of business on December 5, 2008, Federated Administrative Services (FAS), under the Administrative Services Agreement, provides the Fund with administrative personnel and services. The fee paid to FAS is based on the average aggregate daily net assets of certain Federated funds as specified below:
| Administrative Fee | Average Aggregate Daily Net Assets
of the Federated Funds |
| 0.150% | on the first $5 billion |
| 0.125% | on the next $5 billion |
| 0.100% | on the next $10 billion |
| 0.075% | on assets in excess of $20 billion |
The administrative fee received during any fiscal year shall be at least $150,000 per portfolio and $40,000 per each additional class of Shares. Subject to the terms described in the Expense Limitation note, FAS may voluntarily choose to waive any portion of its fee. FAS can modify or terminate this voluntary waiver at any time at its sole discretion. The fee for the period from December 6, 2008 to September 30, 2009 is pro-rated. For the period from December 6, 2008 to September 30, 2009, the net fee paid to FAS was $689,586 and represented 0.076% of average daily net assets of the Fund. FAS waived $13,339 of its fee.
Prior to close of business on December 5, 2008, U.S. Bancorp Fund Services, LLC provided administrative services to the Predecessor Fund. For the period from October 1, 2008 to December 5, 2008, the net fee paid to U.S. Bancorp Fund Services, LLC was $151,122.
Annual Shareholder Report30
Distribution Services FeeThe Fund has adopted a Distribution Plan (the “Plan”) pursuant to Rule 12b-1 under the Act. Under the terms of the Plan, the Fund will compensate Federated Securities Corp. (FSC), the principal distributor, from the daily net assets of the Fund's Class A Shares and Class C Shares to finance activities intended to result in the sale of these shares. The Plan provides that the Fund may incur distribution expenses at the following percentages of average daily net assets annually, to compensate FSC:
| Share Class Name | Percentage of Average Daily
Net Assets of Class |
| Class A Shares | 0.05% |
| Class C Shares | 0.75% |
Subject to the terms described in the Expense Limitation note, FSC may voluntarily choose to waive any portion of its fee. FSC can modify or terminate this voluntary waiver at any time at its sole discretion. When FSC receives fees, it may pay some or all of them to financial intermediaries whose customers purchase shares. For the period from December 6, 2008 to September 30, 2009, the net fee paid to FSC was $412,792. For the period from December 6, 2008 to September 30, 2009, FSC retained $205,647 of fees paid by the Fund.
Prior to close of business on December 5, 2008, Quasar Distributions, LLC was the principal distributor for the Predecessor Fund. The Predecessor Fund adopted a Service and Distribution Plan pursuant to Rule 12b-1 under the Act. The Predecessor Fund's plan authorized payments by the Fund in connection with the distribution of its shares at an annual rate of up to 0.25% of the Fund's average daily net assets for the Class A Shares and 1.00% for the Class C Shares. For the period from October 1, 2008 to December 5, 2008, the net fee paid to Quasar Distributors, LLC was $638,912.
Sales Charges
Front-end sales charges and contingent deferred sales charges (CDSC) do not represent expenses of the Fund. They are deducted from the proceeds of sales of Fund shares prior to investment or from redemption proceeds prior to remittance, as applicable. For the period from December 6, 2008 to September 30, 2009, FSC retained $250,506 in sales charges from the sale of Class A Shares. FSC also retained $27,284 of CDSC relating to redemptions of
Class C Shares.
Prior to close of business on December 5, 2008, Quasar Distributors, LLC served as distributor of the Predecessor Fund's shares. For the period from October 1, 2008 to
December 5, 2008, the Predecessor Fund did not charge any sales charges on the sale of its Shares.
Shareholder Services Fee
The Fund may pay fees (Service Fees) up to 0.25% of the average daily net assets of the Fund's Class A Shares and Class C Shares to financial intermediaries or to Federated Shareholder Services Company (FSSC) for providing services to shareholders and maintaining shareholder accounts. Subject to the terms described in the Expense Limitation note, FSSC may voluntarily reimburse the Fund for shareholder services fees. This voluntary reimbursement can be modified or terminated at any time. For the period from December 6, 2008 to September 30, 2009, FSSC received $175,489 of fees paid by the Fund.
Prior to close of business on December 5, 2008, the Predecessor Fund did not charge a shareholder services fee.
Annual Shareholder Report31
Interfund TransactionsDuring the year ended September 30, 2009, the Fund engaged in purchase transactions with funds that have a common investment adviser (or affiliated investment advisers), common Directors/Trustees and/or common Officers. These purchase transactions complied with Rule 17a-7 under the Act and amounted to $455,834.
Expense Limitation
The Adviser and its affiliates (which may include FSC, FAS and FSSC) have voluntarily agreed to waive their fees and/or reimburse expenses so that the total operating expenses (as shown in the financial highlights) paid by the Fund's Class A Shares, Class C Shares and Institutional Shares (after the voluntary waivers and reimbursements) will not exceed 1.76%, 2.51% and 1.51% respectively through the later of (the “Termination Date”): (a) November 30, 2010 or (b) the date of the Fund's next effective Prospectus. While the Adviser and its affiliates currently do not anticipate terminating these arrangements prior to the Termination Date, these arrangements may only be terminated prior to the Termination Date with the agreement of the Fund's Board of Trustees.
General
Certain Officers and Trustees of the Fund are Officers and Directors or Trustees of the above companies.
Transactions with Affiliated Companies and Affiliated Holdings
An affiliated company is a company in which the Fund has ownership of at least 5% of the voting shares. Transactions with the affiliated companies during the year ended September 30, 2009, were as follows:
| Affiliate | Balance of
Shares Held
9/30/2008 | Purchases/
Additions | Sales/
Reductions | Balance of
Shares Held
9/30/2009 | Value | Dividend
Income |
| Ascot Resources Ltd. | 1,500,000 | — | — | 1,500,000 | $980,713 | $ — |
| Ascot Resources Ltd. | 1,140,000 | — | — | 1,140,000 | $745,342 | $ — |
| Ascot Resources Ltd. | 360,000 | — | — | 360,000 | $235,371 | $ — |
| Kootenay Gold, Inc. | 825,000 | — | — | 825,000 | $593,331 | $ — |
| Kootenay Gold, Inc. | 500,000 | — | — | 500,000 | $359,595 | $ — |
| Kootenay Gold, Inc. | 1,000,000 | — | — | 1,000,000 | $719,189 | $ — |
| MacArthur Minerals Ltd. | 1,500,000 | — | — | 1,500,000 | $1,190,865 | $ — |
TOTAL OF
AFFILIATED
COMPANIES | 6,825,000 | — | — | 6,825,000 | $4,824,406 | $ — |
Annual Shareholder Report32
Affiliated holdings are mutual funds which are managed by the Adviser or an affiliate of the Adviser. The Adviser has agreed to reimburse the Fund for certain investment adviser fees as a result of transactions in other affiliated mutual funds. For the period from December 6, 2008 to September 30, 2009, the Adviser reimbursed $66,204. Transactions with the affiliated holdings during the year ended September 30, 2009 were as follows:| Affiliates | Balance of
Shares Held
9/30/2008 | Purchases/
Additions | Sales/
Reductions | Balance of
Shares Held
9/30/2009 | Value | Dividend
Income |
| Federated Short-Term U.S. Government Trust | — | 24,185,075 | 24,185,075 | — | $ — | $2,675 |
| U.S. Treasury Cash Reserves Fund, Institutional Shares | 26,333,045 | 1,301,420,724 | 1,204,700,965 | 123,052,804 | $123,052,804 | $27,768 |
TOTAL OF
AFFILIATED
TRANSACTIONS | 26,333,045 | 1,325,605,799 | 1,228,886,040 | 123,052,804 | $123,052,804 | $30,443 |
6. EXPENSE Reduction
Prior to close of business on December 5, 2008, the Predecessor Fund directed portfolio trades to a broker that in turn pays a portion of the Predecessor Fund's operating expenses. For the period from October 1, 2008 to December 5, 2008, the Fund's expenses were reduced by $208,230 under these arrangements.
The Fund directs portfolio trades to a broker that in turn pays a portion of the Fund's operating expenses. For the period from December 6, 2008 to September 30, 2009, the Fund's expenses were reduced by $50,300 under these arrangements.
7. Investment TRANSACTIONS
Purchases and sales of investments, excluding long-term U.S. government securities and short-term obligations for the year ended September 30, 2009, were as follows:
| Purchases | $2,473,608,086 |
| Sales | $2,603,848,881 |
8. CONCENTRATION OF RISK
The Fund invests in securities of non-U.S. issuers. Political or economic developments may have an effect on the liquidity and volatility of portfolio securities and currency holdings.
9. LINE OF CREDIT
The Fund participates in a $100,000,000 unsecured, uncommitted revolving line of credit (LOC) agreement with PNC Bank. The LOC was made available for extraordinary or emergency purposes, primarily for financing redemption payments. Borrowings are charged interest at a rate offered to the Fund by PNC Bank at the time of the borrowing. As of September 30, 2009, there were no outstanding loans. During the period from December 6, 2008 to September 30, 2009, the Fund did not utilize the LOC.
Annual Shareholder Report33
10. INTERFUND LENDINGPursuant to an Exemptive Order issued by the Securities and Exchange Commission (SEC), the Fund, along with other funds advised by subsidiaries of Federated Investors, Inc., may participate in an interfund lending program. This program provides an alternative credit facility allowing the funds to borrow from other participating affiliated funds. As of September 30, 2009, there were no outstanding loans. During the period from December 6, 2008 to September 30, 2009, the program was not utilized.
11. Legal Proceedings
Since October 2003, Federated Investors, Inc. and related entities (collectively, “Federated”), and various Federated funds (Federated Funds) have been named as defendants in several class action lawsuits now pending in the United States District Court for the District of Maryland. The lawsuits were purportedly filed on behalf of people who purchased, owned and/or redeemed shares of Federated-sponsored mutual funds during specified periods beginning November 1, 1998. The suits are generally similar in alleging that Federated engaged in illegal and improper trading practices including market timing and late trading in concert with certain institutional traders, which allegedly caused financial injury to the mutual fund shareholders. These lawsuits began to be filed shortly after Federated's first public announcement that it had received requests for information on shareholder trading activities in the Federated Funds from the SEC, the Office of the New York State Attorney General (NYAG), and other authorities. In that regard, on November 28, 2005, Federated announced that it had reached final settlements with the SEC and the NYAG with respect to those matters. As Federated previously reported in 2004, it has already paid approximately $8.0 million to certain funds as determined by an independent consultant. As part of these settlements, Federated agreed to pay for the benefit of fund shareholders additional disgorgement and a civil money penalty in the aggregate amount of an additional $72 million. Federated entities have also been named as defendants in several additional lawsuits that are now pending in the United States District Court for the Western District of Pennsylvania, alleging, among other things, excessive advisory and Rule 12b-1 fees. The Board of the Federated Funds retained the law firm of Dickstein Shapiro LLP to represent the Federated Funds in these lawsuits. Federated and the Federated Funds, and their respective counsel have been defending this litigation, and none of the Federated Funds remains a defendant in any of the lawsuits (though some could potentially receive any recoveries as nominal defendants). Additional lawsuits based upon similar allegations may be filed in the future. The potential impact of these lawsuits, all of which seek unquantified damages, attorneys' fees and expenses, and future potential similar suits is uncertain. Although we do not believe that these lawsuits will have a material adverse effect on the Federated Funds, there can be no assurance that these suits, the ongoing adverse publicity and/or other developments resulting from the regulatory investigations will not result in increased Federated Fund redemptions, reduced sales of Federated Fund shares or other adverse consequences for the Federated Funds.
12. Subsequent events
Management has evaluated subsequent events through November 24, 2009, the date the financial statements were issued, and determined that no events have occurred that require additional disclosure.
13. FEDERAL TAX INFORMATION (UNAUDITED)
For the year ended September 30, 2009, the amount of long-term capital gains designated by the Fund was $61,794,970.
Annual Shareholder Report34
Report of Independent Registered Public Accounting Firm
TO THE BOARD OF TRUSTEES OF THE FEDERATED EQUITY FUNDS AND SHAREHOLDERS OF Federated Prudent Bear Fund:
We have audited the accompanying statement of assets and liabilities, including the portfolio of investments, of the Federated Prudent Bear Fund (the “Fund”), a portfolio of Federated Equity Funds, as of September 30, 2009, and the related statement of operations, the statement of changes in net assets and the financial highlights for the year then ended. These financial statements and financial highlights are the responsibility of the Fund's management. Our responsibility is to express an opinion on these financial statements and financial highlights based on our audit. The statement of changes in net assets and the financial highlights for the periods presented prior to October 1, 2008, were audited by other independent registered public accountants whose report thereon dated November 13, 2008, expressed an unqualified opinion on those statements.
We conducted our audit in accordance with the standards of the Public Company Accounting Oversight Board (United States). Those standards require that we plan and perform the audit to obtain reasonable assurance about whether the financial statements and financial highlights are free of material misstatement. An audit includes examining, on a test basis, evidence supporting the amounts and disclosures in the financial statements. Our procedures included confirmation of securities owned as of September 30, 2009 by correspondence with the custodian and brokers or by other appropriate auditing procedures. An audit also includes assessing the accounting principles used and significant estimates made by management, as well as evaluating the overall financial statement presentation. We believe that our audit provides a reasonable basis for our opinion.
In our opinion, the financial statements and financial highlights referred to above present fairly, in all material respects, the financial position of the Federated Prudent Bear Fund as of September 30, 2009, and the results of its operations, the changes in its net assets and the financial highlights for the year then ended, in conformity with U.S. generally accepted accounting principles.
Boston, Massachusetts
November 24, 2009
Annual Shareholder Report35
Board of Trustees and Trust Officers
The Board is responsible for managing the Trust's business affairs and for exercising all the Trust's powers except those reserved for the shareholders. The following tables give information about each Board member and the senior officers of the Fund. Where required, the tables separately list Board members who are “interested persons” of the Fund (i.e., “Interested” Board members) and those who are not (i.e., “Independent” Board members). Unless otherwise noted, the address of each person listed is Federated Investors Tower, 1001 Liberty Avenue, Pittsburgh, PA 15222. The address of all Independent Board members listed is 4000 Ericsson Drive, Warrendale, PA 15086-7561; Attention: Mutual Fund Board. As of December 31, 2008, the Trust comprised 10 portfolios, and the Federated Fund Complex consisted of 40 investment companies (comprising 149 portfolios). Unless otherwise noted, each Officer is elected annually. Unless otherwise noted, each Board member oversees all portfolios in the Federated Fund Complex and serves for an indefinite term. The Fund's Statement of Additional Information includes additional information about Trust Trustees and is available, without charge and upon request, by calling 1-800-341-7400.
Interested TRUSTEES Background
Name
Birth Date
Positions Held with Trust
Date Service Began | Principal Occupation(s) for Past Five Years,
Other Directorships Held and Previous Position(s) |
John F. Donahue*
Birth Date: July 28, 1924
TRUSTEE
Began serving: April 1989 | Principal Occupations: Director or Trustee of the Federated Fund Complex; Chairman and Director, Federated Investors, Inc.; Chairman of the Federated Fund Complex's Executive Committee.
Previous Positions: Chairman of the Federated Fund Complex; Trustee, Federated Investment Management Company; Chairman and Director, Federated Investment Counseling. |
J. Christopher Donahue*
Birth Date: April 11, 1949
PRESIDENT AND TRUSTEE
Began serving: August 2000 | Principal Occupations: Principal Executive Officer and President of the Federated Fund Complex; Director or Trustee of some of the Funds in the Federated Fund Complex; President, Chief Executive Officer and Director, Federated Investors, Inc.; Chairman and Trustee, Federated Investment Management Company; Trustee, Federated Investment Counseling; Chairman and Director, Federated Global Investment Management Corp.; Chairman, Federated Equity Management Company of Pennsylvania and Passport Research, Ltd. (investment advisory subsidiary of Federated); Trustee, Federated Shareholder Services Company; Director, Federated Services Company.
Previous Positions: President, Federated Investment Counseling; President and Chief Executive Officer, Federated Investment Management Company, Federated Global Investment Management Corp. and Passport Research, Ltd. |
| * | Family relationships and reasons for “interested” status: John F. Donahue is the father of J. Christopher Donahue; both are “interested” due to their beneficial ownership of shares of Federated Investors, Inc. and the positions they hold with Federated and its subsidiaries. |
Annual Shareholder Report36
INDEPENDENT TRUSTEES Background
Name
Birth Date
Positions Held with Trust
Date Service Began | Principal Occupation(s) for Past Five Years,
Other Directorships Held and Previous Position(s) |
John T. Conroy, Jr., Ph.D.
Birth Date: June 23, 1937
TRUSTEE
Began serving: November 1991 | Principal Occupations: Director or Trustee of the Federated Fund Complex; Chairman of the Board, Investment Properties Corporation; Partner or Trustee in private real estate ventures in Southwest Florida; Assistant Professor in Theology at Barry University and Blessed Edmund Rice School for Pastoral Ministry.
Previous Positions: President, Investment Properties Corporation; Senior Vice President, John R. Wood and Associates, Inc., Realtors; President, Naples Property Management, Inc. and Northgate Village Development Corporation. |
Nicholas P. Constantakis
Birth Date: September 3, 1939
TRUSTEE
Began serving: February 1998 | Principal Occupation: Director or Trustee of the Federated Fund Complex.
Other Directorships Held: Director and Chairman of the Audit Committee, Michael Baker Corporation (architecture, engineering and construction services).
Previous Position: Partner, Andersen Worldwide SC. |
John F. Cunningham
Birth Date: March 5, 1943
TRUSTEE
Began serving: January 1999 | Principal Occupation: Director or Trustee of the Federated Fund Complex.
Other Directorships Held: Chairman, President and Chief Executive Officer, Cunningham & Co., Inc. (strategic business consulting); Trustee Associate, Boston College.
Previous Positions: Director, Redgate Communications and EMC Corporation (computer storage systems); Chairman of the Board and Chief Executive Officer, Computer Consoles, Inc.; President and Chief Operating Officer, Wang Laboratories; Director, First National Bank of Boston; Director, Apollo Computer, Inc. |
Maureen Lally-Green
Birth Date: July 5, 1949
TRUSTEE
Began serving: August 2009 | Principal Occupations: Director or Trustee of the Federated Fund Complex; Director, Office of Church Relations, Diocese of Pittsburgh; Adjunct Professor of Law, Duquesne University School of Law.
Other Directorships Held: Director, Auberle; Trustee St. Francis University; Director, Ireland Institute of Pittsburgh; Director, UPMC Mercy Hospital; Regent, St. Vincent Seminary; Director, Epilepsy Foundation of Western and Central Pennsylvania; Director, Saint Thomas More Society, Allegheny County; Director, Carlow University.
Previous Position: Pennsylvania Superior Court Judge. |
Annual Shareholder Report37
Name
Birth Date
Positions Held with Trust
Date Service Began | Principal Occupation(s) for Past Five Years,
Other Directorships Held and Previous Position(s) |
Peter E. Madden
Birth Date: March 16, 1942
TRUSTEE
Began serving: October 1991 | Principal Occupation: Director or Trustee and Chairman of the Board of the Federated Fund Complex.
Other Directorship Held: Board of Overseers, Babson College.
Previous Positions: Representative, Commonwealth of Massachusetts General Court; President, Chief Operating Officer and Director, State Street Bank and Trust Company and State Street Corporation (retired); Director, VISA USA and VISA International; Chairman and Director, Massachusetts Bankers Association; Director, Depository Trust Corporation; Director, The Boston Stock Exchange. |
Charles F. Mansfield, Jr.
Birth Date: April 10, 1945
TRUSTEE
Began serving: January 1999 | Principal Occupations: Director or Trustee and Chairman of the Audit Committee of the Federated Fund Complex; Management Consultant.
Previous Positions: Chief Executive Officer, PBTC International Bank; Partner, Arthur Young & Company (now Ernst & Young LLP); Chief Financial Officer of Retail Banking Sector, Chase Manhattan Bank; Senior Vice President, HSBC Bank USA (formerly, Marine Midland Bank); Vice President, Citibank; Assistant Professor of Banking and Finance, Frank G. Zarb School of Business, Hofstra University; Executive Vice President DVC Group, Inc. (marketing, communications and technology). |
R. James Nicholson
Birth Date: February 4, 1938
TRUSTEE
Began serving: January 2008 | Principal Occupations: Director or Trustee of the Federated Fund Complex; Senior Counsel, Brownstein Hyatt Farber Schrek, P.C.; Former Secretary of the U.S. Dept. of Veterans Affairs; Former U.S. Ambassador to the Holy See; Former Chairman of the Republican National Committee.
Other Directorships Held: Director, Horatio Alger Association; Director, The Daniels Fund.
Previous Positions: Colonel, U.S. Army Reserve; Partner, Calkins, Kramer, Grimshaw and Harring, P.C.; General Counsel, Colorado Association of Housing and Building; Chairman and CEO, Nicholson Enterprises, Inc. (real estate holding company); Chairman and CEO, Renaissance Homes of Colorado. |
Thomas M. O'Neill
Birth Date: June 14, 1951
TRUSTEE
Began serving: October 2006 | Principal Occupations: Director or Trustee of the Federated Fund Complex; Managing Director and Partner, Navigator Management Company, L.P. (investment and strategic consulting).
Other Directorships Held: Board of Overseers, Children's Hospital of Boston; Visiting Committee on Athletics, Harvard College.
Previous Positions: Chief Executive Officer and President, Managing Director and Chief Investment Officer, Fleet Investment Advisors; President and Chief Executive Officer, Aeltus Investment Management, Inc.; General Partner, Hellman, Jordan Management Co., Boston, MA; Chief Investment Officer, The Putnam Companies, Boston, MA; Credit Analyst and Lending Officer, Fleet Bank; Director and Consultant, EZE Castle Software (investment order management software); Director, Midway Pacific (lumber). |
Annual Shareholder Report38
Name
Birth Date
Positions Held with Trust
Date Service Began | Principal Occupation(s) for Past Five Years,
Other Directorships Held and Previous Position(s) |
John S. Walsh
Birth Date: November 28, 1957
TRUSTEE
Began serving: January 1999 | Principal Occupations: Director or Trustee of the Federated Fund Complex; President and Director, Heat Wagon, Inc. (manufacturer of construction temporary heaters); President and Director, Manufacturers Products, Inc. (distributor of portable construction heaters); President, Portable Heater Parts, a division of Manufacturers Products, Inc.
Previous Position: Vice President, Walsh & Kelly, Inc. |
James F. Will
Birth Date: October 12, 1938
TRUSTEE
Began serving: April 2006 | Principal Occupations: Director or Trustee of the Federated Fund Complex; formerly, Vice Chancellor and President, Saint Vincent College.
Other Directorships Held: Trustee, Saint Vincent College; Alleghany Corporation.
Previous Positions: Chairman, President and Chief Executive Officer, Armco, Inc.; President and Chief Executive Officer, Cyclops Industries; President and Chief Operating Officer, Kaiser Steel Corporation. |
OFFICERS
Name
Birth Date
Address
Positions Held with Trust
Date Service Began | Principal Occupation(s) for Past Five Years
and Previous Position(s) |
John W. McGonigle
Birth Date: October 26, 1938
EXECUTIVE VICE PRESIDENT AND SECRETARY
Began serving: April 1989 | Principal Occupations: Executive Vice President and Secretary of the Federated Fund Complex; Vice Chairman, Executive Vice President, Secretary and Director, Federated Investors, Inc.
Previous Positions: Trustee, Federated Investment Management Company and Federated Investment Counseling; Director, Federated Global Investment Management Corp., Federated Services Company and Federated Securities Corp. |
Richard A. Novak
Birth Date: December 25, 1963
TREASURER
Began serving: January 2006 | Principal Occupations: Principal Financial Officer and Treasurer of the Federated Fund Complex; Senior Vice President, Federated Administrative Services; Financial and Operations Principal for Federated Securities Corp., Edgewood Services, Inc. and Southpointe Distribution Services, Inc.
Previous Positions: Controller of Federated Investors, Inc.; Vice President, Finance of Federated Services Company; held various financial management positions within The Mercy Hospital of Pittsburgh; Auditor, Arthur Andersen & Co. |
Brian P. Bouda
Birth Date: February 28, 1947
CHIEF COMPLIANCE OFFICER AND SENIOR VICE PRESIDENT
Began serving: August 2004 | Principal Occupations: Senior Vice President and Chief Compliance Officer of the Federated Fund Complex; Vice President and Chief Compliance Officer of Federated Investors, Inc. and Chief Compliance Officer of its subsidiaries. Mr. Bouda joined Federated in 1999 and is a member of the American Bar Association and the State Bar Association of Wisconsin. |
Annual Shareholder Report39
Name
Birth Date
Address
Positions Held with Trust
Date Service Began | Principal Occupation(s) for Past Five Years
and Previous Position(s) |
Stephen F. Auth
Birth Date: September 3, 1956
450 Lexington Avenue
Suite 3700
New York, NY 10017-3943
CHIEF INVESTMENT OFFICER
Began serving: November 2002 | Principal Occupations: Mr. Auth is Chief Investment Officer of this Fund and various other Funds in the Federated Fund Complex; Executive Vice President, Federated Investment Counseling, Federated Global Investment Management Corp. and Federated Equity Management Company of Pennsylvania.
Previous Positions: Executive Vice President, Federated Investment Management Company, and Passport Research, Ltd. (investment advisory subsidiary of Federated); Senior Vice President, Global Portfolio Management Services Division; Senior Vice President, Federated Investment Management Company and Passport Research, Ltd.; Senior Managing Director and Portfolio Manager, Prudential Investments. |
Lawrence Auriana
Birth Date: January 8, 1944
140 East 45th Street
New York, NY 10017
VICE PRESIDENT
Began serving: November 2001 | Principal Occupations: Lawrence Auriana is Vice President of the Trust. Mr. Auriana joined Federated in April 2001 as Co-Head of Investments/Federated Kaufmann. From August 1984 to April 2001, Mr. Auriana was President and Treasurer of Edgemont Asset Management Corp., and Chairman of the Board and Portfolio Manager to The Kaufmann Fund, Inc. (predecessor to the Federated Kaufmann Fund). Mr. Auriana earned a B.S. in economics from Fordham University and has been engaged in the securities business since 1965. |
Walter C. Bean
Birth Date: June 22, 1945
VICE PRESIDENT
Began serving: November 2006 | Principal Occupations: Walter C. Bean is Vice President of the Trust. Mr. Bean is a Senior Vice President, Senior Portfolio Manager and Director of Investments for Managed Accounts. Mr. Bean joined Federated in 2000. Mr. Bean is responsible for the investment process for the managed accounts portfolios. His previous associations included: Chief Investment Officer and Portfolio Manager at C.S. McKee & Company; various investment management and research positions with First Chicago Investment Advisors, CIGNA Investment Advisors and Mellon Bank. Mr. Bean is a Chartered Financial Analyst. Mr. Bean earned a Bachelors Degree in Business Administration from Ohio University and an M.B.A. from Pennsylvania State University. Mr. Bean has 40 years of investment experience. |
Richard B. Fisher
Birth Date: May 17, 1923
VICE PRESIDENT
Began serving: April 1984 | Principal Occupations: Vice Chairman or Vice President of some of the Funds in the Federated Fund Complex; Vice Chairman, Federated Investors, Inc.; Chairman, Federated Securities Corp.
Previous Positions: President and Director or Trustee of some of the Funds in the Federated Fund Complex; Executive Vice President, Federated Investors, Inc.; Director and Chief Executive Officer, Federated Securities Corp. |
Hans P. Utsch
Birth Date: July 3, 1936
140 East 45th Street
New York, NY 10017
VICE PRESIDENT
Began serving: November 2001 | Principal Occupations: Hans P. Utsch is Vice President of the Trust. Mr. Utsch joined Federated in April 2001 as Co-Head of Investments/Federated Kaufmann. From August 1984 to April 2001, Mr. Utsch was Chairman of the Board and Secretary of Edgemont Asset Management Corp., and President and Portfolio Manager to The Kaufmann Fund, Inc. (predecessor to the Federated Kaufmann Fund). Mr. Utsch graduated from Amherst College and holds an M.B.A. from Columbia University. He has been engaged in the securities business since 1962. |
Annual Shareholder Report40
Evaluation and Approval of Advisory
Contract - May 2009
Federated Prudent Bear Fund (the “Fund”)
The Fund's Board reviewed the Fund's investment advisory contract at meetings held in May 2009. The Board's decision regarding the contract reflects the exercise of its business judgment on whether to continue the existing arrangements.
In this connection, the Federated funds' Board had previously appointed a Senior Officer, whose duties include specified responsibilities relating to the process by which advisory fees are to be charged to a Federated fund. The Senior Officer has the authority to retain consultants, experts, or staff as may be reasonably necessary to assist in the performance of his duties, reports directly to the Board, and may be terminated only with the approval of a majority of the independent members of the Board. The Senior Officer prepared and furnished to the Board an independent, written evaluation that covered topics discussed below. The Board considered that evaluation, along with other information, in deciding to approve the advisory contract.
During its review of the contract, the Board considered compensation and benefits received by the Adviser. This included the fees received for services provided to the Fund by other entities in the Federated organization and research services received by the Adviser from brokers that execute Federated fund trades, as well as advisory fees. The Board is also familiar with and considered judicial decisions concerning allegedly excessive investment advisory fees, which have indicated that the following factors may be relevant to an Adviser's fiduciary duty with respect to its receipt of compensation from a fund: the nature and quality of the services provided by the Adviser, including the performance of the fund; the Adviser's cost of providing the services; the extent to which the Adviser may realize “economies of scale” as a fund grows larger; any indirect benefits that may accrue to the Adviser and its affiliates as a result of the Adviser's relationship with a fund; performance and expenses of comparable funds; and the extent to which the independent Board members are fully informed about all facts the Board deems relevant bearing on the Adviser's services and fees. The Board further considered management fees (including any components thereof) charged to institutional and other clients of the Adviser for what might be viewed as like services, and the cost to the Adviser and its affiliates of supplying services pursuant to the management fee agreements, excluding any intra-corporate profit and profit margins of the Adviser and its affiliates for supplying such services. The Board was aware of these factors and was guided by them in its review of the Fund's advisory contract to the extent it considered them to be appropriate and relevant, as discussed further below.
Annual Shareholder Report41
The Board considered and weighed these circumstances in light of its substantial accumulated experience in governing the Fund and working with Federated on matters relating to the Federated funds, and was assisted in its deliberations by independent legal counsel. Throughout the year, the Board has requested and received substantial and detailed information about the Fund and the Federated organization that was in addition to the extensive materials that comprise and accompany the Senior Officer's evaluation. Federated provided much of this information at each regular meeting of the Board, and furnished additional reports in connection with the particular meeting at which the Board's formal review of the advisory contract occurred. Between regularly scheduled meetings, the Board also received information on particular matters as the need arose. Thus, the Board's consideration of the advisory contract included review of the Senior Officer's evaluation, accompanying data and additional reports covering such matters as: the Adviser's investment philosophy, revenue, profitability, personnel and processes; investment and operating strategies; the Fund's short- and long-term performance (in absolute terms, both on a gross basis and net of expenses, as well as in relationship to its particular investment program and certain competitor or “peer group” funds and/or other benchmarks, as appropriate), and comments on the reasons for performance; the Fund's investment objectives; the Fund's expenses (including the advisory fee itself and the overall expense structure of the Fund, both in absolute terms and relative to similar and/or competing funds, with due regard for contractual or voluntary expense limitations); the use and allocation of brokerage commissions derived from trading the Fund's portfolio securities (if any); and the nature, quality and extent of the advisory and other services provided to the Fund by the Adviser and its affiliates. The Board also considered the preferences and expectations of Fund shareholders and their relative sophistication; the continuing state of competition in the mutual fund industry and market practices; the range of comparable fees for similar funds in the mutual fund industry; the Fund's relationship to the Federated family of funds which include a comprehensive array of funds with different investment objectives, policies and strategies which are available for exchange without the incurrence of additional sales charges; compliance and audit reports concerning the Federated funds and the Federated companies that service them (including communications from regulatory agencies), as well as Federated's responses to any issues raised therein; and relevant developments in the mutual fund industry and how the Federated funds and/or Federated are responding to them. The Board's evaluation process is evolutionary. The criteria considered and the emphasis placed on relevant criteria change in recognition of changing circumstances in the mutual fund marketplace. Annual Shareholder Report42
With respect to the Fund's performance and expenses in particular, the Board has found the use of comparisons to other mutual funds with comparable investment programs to be particularly useful, given the high degree of competition in the mutual fund business. The Board focused on comparisons with other similar mutual funds more heavily than non-mutual fund products or services because it is believed that they are more relevant. For example, other mutual funds are the products most like the Fund, they are readily available to Fund shareholders as alternative investment vehicles, and they are the type of investment vehicle in fact chosen and maintained by the Fund's investors. The range of their fees and expenses therefore appears to be a generally reliable indication of what consumers have found to be reasonable in the precise marketplace in which the Fund competes. The Fund's ability to deliver competitive performance when compared to its peer group was a useful indicator of how the Adviser is executing the Fund's investment program, which in turn assisted the Board in reaching a conclusion that the nature, extent, and quality of the Adviser's investment management services were such as to warrant continuation of the advisory contract. In this regard, the Senior Officer has reviewed Federated's fees for providing advisory services to products outside the Federated family of funds (e.g., institutional and separate accounts). He concluded that mutual funds and institutional accounts are inherently different products. Those differences include, but are not limited to, different types of targeted investors; being subject to different laws and regulations; different legal structures; different average account sizes; different associated costs; different portfolio management techniques made necessary by different cash flows; and portfolio manager time spent in review of securities pricing. The Senior Officer did not consider these fee schedules to be determinative in judging the appropriateness of mutual fund advisory contracts.The Senior Officer reviewed reports compiled by Federated, using data supplied by independent fund ranking organizations, regarding the performance of, and fees charged by, other mutual funds, noting his view that comparisons to fund peer groups are highly important in judging the reasonableness of proposed fees.
For the periods covered by the report, the Fund's performance for the three-year and five-year periods was above the median of the relevant peer group, and the Fund's performance fell below the median of the relevant peer group for the one-year period. The Board discussed the Fund's performance with the Adviser and recognized the efforts being undertaken by the Adviser. The Board will continue to monitor these efforts and the performance of the Fund.
Annual Shareholder Report43
The Board also received financial information about Federated, including reports on the compensation and benefits Federated derived from its relationships with the Federated funds. These reports covered not only the fees under the advisory contracts, but also fees received by Federated's subsidiaries for providing other services to the Federated funds under separate contracts (e.g., for serving as the Federated funds' administrator). The reports also discussed any indirect benefit Federated may derive from its receipt of research services from brokers who execute Federated fund trades. In addition, the Board considered the fact that, in order for a fund to be competitive in the marketplace, Federated and its affiliates frequently waived fees and/or reimbursed expenses and have disclosed to fund investors and/or indicated to the Board their intention to do so in the future, where appropriate. Moreover, the Board receives regular reports regarding the institution or elimination of these voluntary waivers.Federated furnished reports, requested by the Senior Officer, that reported revenues on a fund-by-fund basis and made estimates of the allocation of expenses on a fund-by-fund basis, using allocation methodologies specified by the Senior Officer. The Senior Officer noted that, although they may apply consistent allocation processes, the inherent difficulties in allocating costs (and the unavoidable arbitrary aspects of that exercise) and the lack of consensus on how to allocate those costs may render such allocation reports unreliable. The allocation reports were considered in the analysis by the Board but were determined to be of limited use.
The Board and the Senior Officer also reviewed a report compiled by Federated comparing profitability information for Federated to other publicly held fund management companies. In this regard, the Senior Officer noted the limited availability of such information, but nonetheless concluded that Federated's profit margins did not appear to be excessive and the Board agreed.
The Senior Officer's evaluation also discussed the notion of possible realization of “economies of scale” as a fund grows larger. The Board considered in this regard that the Adviser has made significant and long-term investments in areas that support all of the Federated funds, such as personnel and processes for the portfolio management, compliance, and risk management functions; and systems technology; and that the benefits of these efforts (as well as any economies, should they exist) were likely to be enjoyed by the fund complex as a whole. Finally, the Board also noted the absence of any applicable regulatory or industry guidelines on this subject, which (as discussed in the Senior Officer's evaluation) is compounded by the lack of any common industry practice or general pattern with respect to structuring fund advisory fees with “breakpoints” that serve to reduce the fee as the fund attains a certain size. The Senior Officer did not recommend institution of breakpoints in pricing Federated's fund advisory services at this time.
Annual Shareholder Report44
It was noted in the materials for the Board meeting that for the period covered by the report, the Fund's investment advisory fee, after waivers and expense reimbursements, if any, was above the median of the relevant peer group. The Board reviewed the fees and other expenses of the Fund with the Adviser and was satisfied that the overall expense structure of the Fund remained competitive. The Board will continue to monitor advisory fees and other expenses borne by the Fund.The Senior Officer's evaluation noted his belief that the information and observations contained in his evaluation supported a finding that the proposed management fees are reasonable, and that Federated appeared to provide appropriate administrative services to the Fund for the fees paid. Under these circumstances, no changes were recommended to, and no objection was raised to, the continuation of the Fund's advisory contract. The Board concluded that the nature, quality and scope of services provided the Fund by the Adviser and its affiliates were satisfactory.
In its decision to continue an existing investment advisory contract, the Board was mindful of the potential disruptions of the Fund's operations and various risks, uncertainties and other effects that could occur as a result of a decision to terminate or not renew an advisory contract. In particular, the Board recognized that many shareholders have invested in the Fund on the strength of the Adviser's industry standing and reputation and with the expectation that the Adviser will have a continuing role in providing advisory services to the Fund. Thus, the Board's approval of the advisory contract reflected the fact that it is the shareholders who have effectively selected the Adviser by virtue of having invested in the Fund.
The Board based its decision to approve the advisory contract on the totality of the circumstances and relevant factors and with a view to past and future long-term considerations. Not all of the factors and considerations identified above were necessarily relevant to the Fund, nor did the Board consider any one of them to be determinative. With respect to the factors that were relevant, the Board's decision to approve the contract reflects its determination that Federated's performance and actions provided a satisfactory basis to support the decision to continue the existing arrangements.
Annual Shareholder Report45
Voting Proxies on Fund Portfolio SecuritiesA description of the policies and procedures that the Fund uses to determine how to vote proxies, if any, relating to securities held in the Fund's portfolio is available, without charge and upon request, by calling 1-800-341-7400. A report on “Form N-PX” of how the Fund voted any such proxies during the most recent 12-month period ended June 30 is available from Federated's Web site at FederatedInvestors.com. To access this information from the “Products” section of the Web site, click on the “Prospectuses and Regulatory Reports” link under “Related Information,” then select the appropriate link opposite the name of the Fund; or select the name of the Fund and from the Fund's page, click on the “Prospectuses and Regulatory Reports” link. Form N-PX filings are also available at the SEC's Web site at www.sec.gov.
Quarterly Portfolio Schedule
The Fund files with the SEC a complete schedule of its portfolio holdings, as of the close of the first and third quarters of its fiscal year, on “Form N-Q.” These filings are available on the SEC's Web site at www.sec.gov and may be reviewed and copied at the SEC's Public Reference Room in Washington, DC. (Call 1-800-SEC-0330 for information on the operation of the Public Reference Room.) You may also access this information from the “Products” section of Federated's Web site at FederatedInvestors.com by clicking on “Portfolio Holdings” under “Related Information,” then selecting the appropriate link opposite the name of the Fund; or select the name of the Fund and from the Fund's page, click on the “Portfolio Holdings” link.
Annual Shareholder Report46
Mutual funds are not bank deposits or obligations, are not guaranteed by any bank and are not insured or guaranteed by the U.S. government, the Federal Deposit Insurance Corporation, the Federal Reserve Board or any other government agency. Investment in mutual funds involves investment risk, including the possible loss of principal.
This Report is authorized for distribution to prospective investors only when preceded or accompanied by the Fund's Prospectus, which contains facts concerning its objective and policies, management fees, expenses and other information.
Federated Prudent Bear Fund
Federated Investors Funds
4000 Ericsson Drive
Warrendale, PA 15086-7561
Contact us at FederatedInvestors.com
or call 1-800-341-7400.
Federated Securities Corp., Distributor
Cusip 314172339
41203 (11/09)
Federated is a registered mark of Federated Investors, Inc.
2009 Federated Investors, Inc.
Item 2. Code of Ethics
(a) As of the end of the period covered by this report, the registrant has adopted a code of ethics (the "Section 406 Standards for Investment Companies - Ethical Standards for Principal Executive and Financial Officers") that applies to the registrant's Principal Executive Officer and Principal Financial Officer; the registrant's Principal Financial Officer also serves as the Principal Accounting Officer.
(c) Not Applicable
(d) Not Applicable
(e) Not Applicable
(f)(3) The registrant hereby undertakes to provide any person, without charge, upon request, a copy of the code of ethics. To request a copy of the code of ethics, contact the registrant at 1-800-341-7400, and ask for a copy of the Section 406 Standards for Investment Companies - Ethical Standards for Principal Executive and Financial Officers.
Item 3. Audit Committee Financial Expert
The registrant's Board has determined that each of the following members of the Board's Audit Committee is an “audit committee financial expert,” and is "independent," for purposes of this Item: Nicholas P. Constantakis, Charles F. Mansfield, Jr. and Thomas M. O’Neill.
Item 4. Principal Accountant Fees and Services
(a) Audit Fees billed to the registrant for the two most recent fiscal years:
Fiscal year ended 2009 - $267,500
Fiscal year ended 2008 - $230,500
(b) Audit-Related Fees billed to the registrant for the two most recent fiscal years:
Fiscal year ended 2009 - $0
Fiscal year ended 2008 - $0
Amount requiring approval of the registrant’s audit committee pursuant to paragraph (c)(7)(ii) of Rule 2-01 of Regulation S-X, $5,000 and $9,857 respectively. Fiscal year ended 2009- Audit consent fees related to N-14 merger filing. Fiscal year ended 2008 – Audit consent fees related to N-14 merger filings.
(c) Tax Fees billed to the registrant for the two most recent fiscal years:
Fiscal year ended 2009 - $0
Fiscal year ended 2008 - $0
Amount requiring approval of the registrant’s audit committee pursuant to paragraph (c)(7)(ii) of Rule 2-01 of Regulation S-X, $0 and $14,743 respectively. Fiscal year ended 2008 – Fees for assistance with excise tax calculations and preparation of Forms 1120 and 8613.
(d) All Other Fees billed to the registrant for the two most recent fiscal years:
Fiscal year ended 2009 - $0
Fiscal year ended 2008 - $0
Amount requiring approval of the registrant’s audit committee pursuant to paragraph (c)(7)(ii) of Rule 2-01 of Regulation S-X, $74,431 and $0 respectively. Fiscal year ended 2009 - Discussion on accounting related to REMICs, fees related to technical assistance and valuation matters for various fund acquisitions, and fees related to PFIC analyses.
(e)(1) Audit Committee Policies regarding Pre-approval of Services.
The Audit Committee is required to pre-approve audit and non-audit services performed by the independent auditor in order to assure that the provision of such services do not impair the auditor’s independence. Unless a type of service to be provided by the independent auditor has received general pre-approval, it will require specific pre-approval by the Audit Committee. Any proposed services exceeding pre-approved cost levels will require specific pre-approval by the Audit Committee.
Certain services have the general pre-approval of the Audit Committee. The term of the general pre-approval is 12 months from the date of pre-approval, unless the Audit Committee specifically provides for a different period. The Audit Committee will annually review the services that may be provided by the independent auditor without obtaining specific pre-approval from the Audit Committee and may grant general pre-approval for such services. The Audit Committee will revise the list of general pre-approved services from time to time, based on subsequent determinations. The Audit Committee will not delegate its responsibilities to pre-approve services performed by the independent auditor to management.
The Audit Committee has delegated pre-approval authority to its Chairman. The Chairman will report any pre-approval decisions to the Audit Committee at its next scheduled meeting. The Committee will designate another member with such pre-approval authority when the Chairman is unavailable.
AUDIT SERVICES
The annual Audit services engagement terms and fees will be subject to the specific pre-approval of the Audit Committee. The Audit Committee must approve any changes in terms, conditions and fees resulting from changes in audit scope, registered investment company (RIC) structure or other matters.
In addition to the annual Audit services engagement specifically approved by the Audit Committee, the Audit Committee may grant general pre-approval for other Audit Services, which are those services that only the independent auditor reasonably can provide. The Audit Committee has pre-approved certain Audit services, all other Audit services must be specifically pre-approved by the Audit Committee.
AUDIT-RELATED SERVICES
Audit-related services are assurance and related services that are reasonably related to the performance of the audit or review of the Company’s financial statements or that are traditionally performed by the independent auditor. The Audit Committee believes that the provision of Audit-related services does not impair the independence of the auditor, and has pre-approved certain Audit-related services, all other Audit-related services must be specifically pre-approved by the Audit Committee.
TAX SERVICES
The Audit Committee believes that the independent auditor can provide Tax services to the Company such as tax compliance, tax planning and tax advice without impairing the auditor’s independence. However, the Audit Committee will not permit the retention of the independent auditor in connection with a transaction initially recommended by the independent auditor, the purpose of which may be tax avoidance and the tax treatment of which may not be supported in the Internal Revenue Code and related regulations. The Audit Committee has pre-approved certain Tax services, all Tax services involving large and complex transactions must be specifically pre-approved by the Audit Committee.
ALL OTHER SERVICES
With respect to the provision of services other than audit, review or attest services the pre-approval requirement is waived if:
| (1) | The aggregate amount of all such services provided constitutes no more than five percent of the total amount of revenues paid by the registrant, the registrant’s adviser (not including any sub-adviser whose role is primarily portfolio management and is subcontracted with or overseen by another investment adviser), and any entity controlling, controlled by, or under common control with the investment adviser that provides ongoing services to the registrant to its accountant during the fiscal year in which the services are provided; |
| (2) | Such services were not recognized by the registrant, the registrant’s adviser (not including any sub-adviser whose role is primarily portfolio management and is subcontracted with or overseen by another investment adviser), and any entity controlling, controlled by, or under common control with the investment adviser that provides ongoing services to the registrant at the time of the engagement to be non-audit services; and |
| (3) | Such services are promptly brought to the attention of the Audit Committee of the issuer and approved prior to the completion of the audit by the Audit Committee or by one or more members of the Audit Committee who are members of the board of directors to whom authority to grant such approvals has been delegated by the Audit Committee. |
The Audit Committee may grant general pre-approval to those permissible non-audit services classified as All Other services that it believes are routine and recurring services, and would not impair the independence of the auditor.
The SEC’s rules and relevant guidance should be consulted to determine the precise definitions of prohibited non-audit services and the applicability of exceptions to certain of the prohibitions.
PRE-APPROVAL FEE LEVELS
Pre-approval fee levels for all services to be provided by the independent auditor will be established annually by the Audit Committee. Any proposed services exceeding these levels will require specific pre-approval by the Audit Committee.
PROCEDURES
Requests or applications to provide services that require specific approval by the Audit Committee will be submitted to the Audit Committee by both the independent auditor and the Principal Accounting Officer and/or Internal Auditor, and must include a joint statement as to whether, in their view, the request or application is consistent with the SEC’s rules on auditor independence.
(e)(2) Percentage of services identified in items 4(b) through 4(d) that were approved by the registrants audit committee pursuant to paragraph (c)(7)(i)(C) of Rule 2-01 of Regulation S-X:
4(b)
Fiscal year ended 2009 – 0%
Fiscal year ended 2008 - 0%
Percentage of services provided to the registrants investment adviser and any entity controlling, controlled by, or under common control with the investment adviser that provides ongoing services to the registrant that were approved by the registrants audit committee pursuant to paragraph (c)(7)(i)(C) of Rule 2-01 of Regulation S-X, 0% and 0% respectively.
4(c)
Fiscal year ended 2009 – 0%
Fiscal year ended 2008 – 0%
Percentage of services provided to the registrants investment adviser and any entity controlling, controlled by, or under common control with the investment adviser that provides ongoing services to the registrant that were approved by the registrants audit committee pursuant to paragraph (c)(7)(i)(C) of Rule 2-01 of Regulation S-X, 0% and 0% respectively.
4(d)
Fiscal year ended 2009 – 0%
Fiscal year ended 2008 – 0%
Percentage of services provided to the registrants investment adviser and any entity controlling, controlled by, or under common control with the investment adviser that provides ongoing services to the registrant that were approved by the registrants audit committee pursuant to paragraph (c)(7)(i)(C) of Rule 2-01 of Regulation S-X, 0% and 0% respectively.
| (g) | Non-Audit Fees billed to the registrant, the registrant’s investment adviser, and certain entities controlling, controlled by or under common control with the investment adviser: |
Fiscal year ended 2009 - $195,666
Fiscal year ended 2008 - $341,918
(h) The registrant’s Audit Committee has considered that the provision of non-audit services that were rendered to the registrant’s adviser (not including any sub-adviser whose role is primarily portfolio management and is subcontracted with or overseen by another investment adviser), and any entity controlling, controlled by, or under common control with the investment adviser that provides ongoing services to the registrant that were not pre-approved pursuant to paragraph (c)(7)(ii) of Rule 2-01 of Regulation S-X is compatible with maintaining the principal accountant’s independence.
Item 5. Audit Committee of Listed Registrants
Not Applicable
Item 6. Schedule of Investments
Not Applicable
| Item 7. | Disclosure of Proxy Voting Policies and Procedures for Closed-End Management Investment Companies |
| Item 8. | Portfolio Managers of Closed-End Management Investment Companies |
| Item 9. | Purchases of Equity Securities by Closed-End Management Investment Company and Affiliated Purchasers |
Item 10. Submission of Matters to a Vote of Security Holders
Not Applicable
Item 11. Controls and Procedures
(a) The registrant’s President and Treasurer have concluded that the
registrant’s disclosure controls and procedures (as defined in rule 30a-3(c) under the Act) are effective in design and operation and are sufficient to form the basis of the certifications required by Rule 30a-(2) under the Act, based on their evaluation of these disclosure controls and procedures within 90 days of the filing date of this report on Form N-CSR.
(b) There were no changes in the registrant’s internal control over financial reporting (as defined in rule 30a-3(d) under the Act) during the last fiscal quarter that have materially affected, or are reasonably likely to materially affect, the registrant’s internal control over financial reporting.
Item 12. Exhibits
SIGNATURES
Pursuant to the requirements of the Securities Exchange Act of 1934 and the Investment Company Act of 1940, the registrant has duly caused this report to be signed on its behalf by the undersigned, thereunto duly authorized.
Registrant Federated Equity Funds
| | |
| | | |
| By: | /s/ Richard A. Novak | |
| | Richard A. Novak | |
| | Principal Financial Officer | |
| | | |
| Date | November 24, 2009 | |
Pursuant to the requirements of the Securities Exchange Act of 1934 and the Investment Company Act of 1940, this report has been signed below by the following persons on behalf of the registrant and in the capacities and on the dates indicated.
| | |
| | | |
| By: | /s/ J. Christopher Donahue | |
| | J. Christopher Donahue | |
| | Principal Executive Officer | |
| | | |
| Date | November 24, 2009 | |
| | |
| | | |
| By: | /s/ Richard A. Novak | |
| | Richard A. Novak | |
| | Principal Financial Officer | |
| | | |
| Date | November 24, 2009 | |