United States
Securities and Exchange Commission
Washington, D.C. 20549
Form N-CSR
Certified Shareholder Report of Registered Management Investment Companies
811-4017
(Investment Company Act File Number)
Federated Equity Funds
_______________________________________________________________
(Exact Name of Registrant as Specified in Charter)
Federated Investors Funds
4000 Ericsson Drive
Warrendale, Pennsylvania 15086-7561
(Address of Principal Executive Offices)
(412) 288-1900
(Registrant's Telephone Number)
Peter J. Germain, Esquire
Federated Investors Tower
1001 Liberty Avenue
Pittsburgh, Pennsylvania 15222-3779
(Name and Address of Agent for Service)
(Notices should be sent to the Agent for Service)
Date of Fiscal Year End: 10/31/17
Date of Reporting Period: 10/31/17
| Item 1. | Reports to Stockholders |

Annual Shareholder Report
October 31, 2017
| Share Class | Ticker | A | KAUAX | B | KAUBX | C | KAUCX |
| | R | KAUFX | Institutional | KAUIX | |
Federated Kaufmann Fund
Successor to the Kaufmann Fund, Inc., with performance history since February 21, 1986
A Portfolio of Federated Equity Funds
Dear Valued Shareholder,
I am pleased to present the Annual Shareholder Report for your fund covering the period from November 1, 2016 through October 31, 2017. This report includes Management's Discussion of Fund Performance, a complete listing of your fund's holdings, performance information and financial statements along with other important fund information.
In addition, our website, FederatedInvestors.com, offers easy access to Federated resources that include timely fund updates, economic and market insights from our investment strategists, and financial planning tools. We invite you to register to take full advantage of its capabilities.
Thank you for investing with Federated. I hope you find this information useful and look forward to keeping you informed.
Sincerely,
J. Christopher Donahue, President
Not FDIC Insured ■ May Lose Value ■ No Bank Guarantee
CONTENTS
| 1 |
| 5 |
| 6 |
| 16 |
| 21 |
| 23 |
| 25 |
| 26 |
| 41 |
| 42 |
| 44 |
| 45 |
| 51 |
| 58 |
| 58 |
Management's Discussion of Fund Performance (unaudited)
The total return of Federated Kaufmann Fund (the “Fund”), based on net asset value for the 12-month reporting period ended October 31, 2017, was 26.97% for the Class A Shares, 26.16% for the Class B Shares, 26.22% for the Class C Shares, 26.92% for the Class R Shares and 27.54% for the Institutional Shares.1 The total return of the Russell Midcap® Growth Index (RMCGI),2 the Fund's broad-based securities market index, was 26.25% for the same period. The total return of the Morningstar Mid-Cap Growth Funds Average (MMCGFA),3 a peer group average for the Fund, was 26.06% for the same period. The Fund's and MMCGFA's total returns for the most recently completed fiscal year reflected actual cash flows, transaction costs and other expenses, which were not reflected in the total return of the RMCGI.
During the reporting period, the Fund's investment strategy focused on stock selection, sector exposure, international exposure4 and the effect of cash holdings. These were the most significant factors affecting the Fund's performance relative to the RMCGI.
The following discussion will focus on the performance of the Fund's Class A Shares.
Market Overview
During the reporting period, global equity markets increased significantly as economies around the world improved seemingly in unison. The U.S. Federal Reserve (the “Fed”) raised its target rate three times during the reporting period. Despite these rate increases, the U.S. Dollar Index5 and the dollar relative to the euro weakened as the global economy picked up steam. U.S. Gross Domestic Product also accelerated from its lower pace of the last 8 years in the second and third quarters of 2017. As global Central Banks reversed the extreme easing policies in western countries, economies reacted positively. The new U.S. administration's deregulation momentum gave lift to business confidence, and the anticipation of tax reform boosted investment domestically.
Stock Selection
The key factor affecting performance from a macroeconomic standpoint was the improving U.S. economic fundamentals, as well as accommodative monetary policies by the Fed and other central banks around the world. The monetary easing policies allowed a slow but gradual recovery of the major world economies. Profitability of many of the companies in which the Fund invested remained strong throughout the reporting period. Fund management continued to find attractive mid-cap growth investment opportunities–companies that are dominant competitors and that have strengthening fundamentals potentially delivering both near-term and long-term growth in sales and earnings.
Annual Shareholder Report
The majority of the Fund outperformance on a gross return basis versus the RMCGI was due to stock selection particularly in the Health Care, Consumer Discretionary and Consumer Staples sectors. Individual companies that most contributed to Fund performance during the reporting period were: Corcept Therapeutics, Veeva Systems, Spark Therapeutics, Sherwin-Williams and Service Now. Holdings that negatively impacted Fund performance were: DexCom, Minerva Neurosciences, Otonomy, ZTO Express and US Silica Holdings.
Sector Exposure
At the end of the reporting period, approximately 71% of the portfolio was invested in four large sectors: Health Care, Information Technology, Consumer Discretionary and Industrials. These sectors have historically provided good opportunities for bottom-up growth investors. Overweighting the Health Care sector benefited relative performance versus the RMCGI.
International Exposure
Stock selection of companies domiciled outside the U.S. was a positive contributor to Fund performance. Approximately 12% of the Fund's assets were invested in such companies during the reporting period.
Effect of Cash Holdings
The Fund had significant outflows during the reporting period which resulted in an average cash position of 13%. In a rising market, the cash holdings resulted in a modest drag on relative Fund performance versus the RMCGI.
| 1 | The Fund's Institutional Shares commenced operations on December 29, 2016. For the period prior to the commencement of operations of the Institutional Shares, the performance information shown is for the Fund's Class R Shares. In relation to the Institutional Shares, the performance of Class R Shares has not been adjusted to reflect the expenses of the Institutional Shares since the Institutional Shares have a lower expense ratio than the expense ratio of the Class R Shares. The performance of Class R Shares has been adjusted to remove any voluntary waiver of Fund expenses related to the Class R Shares that may have occurred during the period prior to the commencement of operations of the Institutional Shares. |
| 2 | Please see the footnotes to the line graphs below for definitions of, and further information about, the RMCGI. |
| 3 | Please see the footnotes to the line graphs below for definitions of, and further information about, the MMCGFA. |
| 4 | International investing involves special risks including currency risk, increased volatility, political risks and differences in auditing and other financial standards. |
| 5 | The U.S. Dollar Index indicates the general international value of the U.S. dollar by averaging the exchange rates between the U.S. dollar and six major world currencies. The index is unmanaged, and it is not possible to invest directly in an index. |
Annual Shareholder Report
FUND PERFORMANCE AND GROWTH OF A $10,000 INVESTMENT
The graph below illustrates the hypothetical investment of $10,0001 in the Federated Kaufmann Fund (the “Fund”) from October 31, 2007 to October 31, 2017, compared to the Russell Midcap® Growth Index (RMCGI)2 and the Morningstar Mid-Cap Growth Funds Average (MMCGFA).3 The Average Annual Total Return table below shows returns for each class averaged over the stated periods.
Growth of a $10,000 Investment
Growth of $10,000 as of October 31, 2017
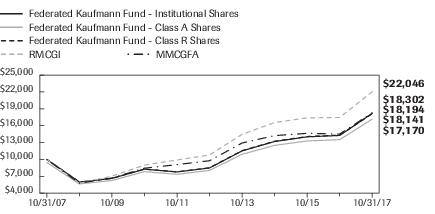
| Federated Kaufmann Fund - | Institutional Shares | Class A Shares | Class R Shares | RMCGI | MMCGFA |
| F | F | F | I | I |
| 10/31/2007 | 10,000 | 9,450 | 10,000 | 10,000 | 10,000 |
| 10/31/2008 | 5,974 | 5,649 | 5,977 | 5,735 | 5,768 |
| 10/31/2009 | 6,628 | 6,257 | 6,636 | 7,024 | 6,704 |
| 10/31/2010 | 8,265 | 7,828 | 8,282 | 8,993 | 8,443 |
| 10/31/2011 | 7,772 | 7,353 | 7,795 | 9,900 | 9,079 |
| 10/31/2012 | 8,483 | 8,048 | 8,515 | 10,800 | 9,769 |
| 10/31/2013 | 11,518 | 10,915 | 11,564 | 14,465 | 12,921 |
| 10/31/2014 | 13,190 | 12,502 | 13,243 | 16,575 | 14,236 |
| 10/31/2015 | 14,018 | 13,288 | 14,074 | 17,393 | 14,646 |
| 10/31/2016 | 14,265 | 13,523 | 14,322 | 17,463 | 14,511 |
| 10/31/2017 | 18,194 | 17,170 | 18,141 | 22,046 | 18,302 |
41 graphic description end -->
| ■ | Total returns shown for Class A Shares include the maximum sales charge of 5.50% ($10,000 investment minus $550 sales charge = $9,450). |
| ■ | Total returns shown for Class R Shares include the redemption fee of 0.20%. |
The Fund offers multiple share classes whose performance may be greater than or less than its other share class(es) due to differences in sales charges and expenses. See the Average Annual Return table below for the returns of additional classes not shown in the line graph above.
Average Annual Total Returns for the Period Ended 10/31/2017
(returns reflect all applicable sales charges and contingent deferred sales charges as specified below in footnote #1)
| | 1 Year | 5 Years | 10 Years |
| Class A Shares | 19.99% | 15.06% | 5.55% |
| Class B Shares | 20.66% | 15.54% | 5.70% |
| Class C Shares | 25.22% | 15.74% | 5.58% |
| Class R Shares | 26.66% | 16.33% | 6.14% |
| Institutional Shares4 | 27.54% | 16.49% | 6.17% |
| RMCGI | 26.25% | 15.34% | 8.23% |
| MMCGFA | 26.06% | 13.66% | 6.81% |
Annual Shareholder Report
Performance data quoted represents past performance which is no guarantee of future results. Investment return and principal value will fluctuate so that an investor's shares, when redeemed, may be worth more or less than their original cost. Mutual fund performance changes over time and current performance may be lower or higher than what is stated. For current to the most recent month-end performance and after-tax returns, visit FederatedInvestors.com or call 1-800-341-7400. Returns shown do not reflect the deduction of taxes that a shareholder would pay on Fund distributions or the redemption of Fund shares. Mutual funds are not obligations of or guaranteed by any bank and are not federally insured.
| 1 | Represents a hypothetical investment of $10,000 in the Fund after deducting applicable sales charges: For Class A Shares, the maximum sales charge of 5.50% ($10,000 investment minus $550 sales charge = $9,450); for Class B Shares, the maximum contingent deferred sales charge is 5.50% on any redemption less than one year from the purchase date; for Class C Shares, the maximum contingent deferred sales charge is 1.00% on any redemption less than one year from the purchase date; for Class R Shares, the ending value reflects a 0.20% redemption fee. The Fund's performance assumes the reinvestment of all dividends and distributions. The RMCGI and MMCGFA have been adjusted to reflect reinvestment of all dividends on securities in the index and the average. |
| 2 | The RMCGI measures the performance of the mid-cap growth segment of the U.S. equity universe. It includes those Russell Midcap® Index companies with higher price-to-book ratios and higher forecasted growth values. The RMCGI is constructed to provide a comprehensive and unbiased barometer of the mid-cap growth market and is completely reconstituted annually to ensure larger stocks do not distort the performance and characteristics of the true mid-cap growth market. The RMCGI is not adjusted to reflect sales charges, expenses or other fees that the Securities and Exchange Commission requires to be reflected in the Fund's performance. The index is unmanaged and unlike the Fund, is not affected by cash flows. It is not possible to invest directly in an index. |
| 3 | Morningstar figures represent the average of the total returns reported by all the funds designated by Morningstar as falling into the respective category indicated. They do not reflect sales charges. The Morningstar figures in the Growth of $10,000 line graph are based on historical return information published by Morningstar and reflect the return of the funds comprising the category in the year of publication. Because the funds designated by Morningstar as falling into the category can change over time, the Morningstar figures in the line graph may not match the Morningstar figures in the Average Annual Total Returns table, which reflect the return of the funds that currently comprise the category. |
| 4 | The Fund's Institutional Shares commenced operations on December 29, 2016. The Fund offers four other classes of shares: Class A Shares, Class B Shares, Class C Shares and Class R Shares. For the period prior to the commencement of operations of the Institutional Shares, the performance information shown is for the Fund's Class R Shares. In relation to the Institutional Shares, the performance of Class R Shares has not been adjusted to reflect the expenses of the Institutional Shares since the Institutional Shares have a lower expense ratio than the expense ratio of the Class R Shares. The performance of Class R Shares has been adjusted to remove any voluntary waiver of Fund expenses related to the Class R Shares that may have occurred during the period prior to the commencement of operations of the Institutional Shares. |
Annual Shareholder Report
Portfolio of Investments Summary Table (unaudited)
At October 31, 2017, the Fund's sector composition1 was follows:
| Sector Composition | Percentage of
Total Net Assets |
| Health Care | 29.3% |
| Information Technology | 24.8% |
| Industrials | 9.0% |
| Consumer Discretionary | 8.7% |
| Financials | 6.9% |
| Materials | 5.1% |
| Real Estate | 1.8% |
| Consumer Staples | 0.8% |
| Energy | 0.7% |
| Securities Lending Collateral2 | 2.6% |
| Cash Equivalents3 | 12.9% |
| Other Assets and Liabilities—Net4 | (2.6)% |
| TOTAL | 100.0% |
| 1 | Except for Securities Lending Collateral, Cash Equivalents and Other Assets and Liabilities, sector classifications are based upon, and individual portfolio securities are assigned to, the classifications of the Global Industry Classification System (GICS), except that the Adviser assigns a classification to securities not classified by the GICS and to securities for which the Adviser does not have access to the classification made by the GICS. |
| 2 | Cash collateral received from lending portfolio securities, which is invested in short-term investments such as repurchase agreements or money market mutual funds. |
| 3 | Cash Equivalents include any investments in money market mutual funds and/or overnight repurchase agreements other than those representing securities lending collateral. |
| 4 | Assets, other than investments in securities, less liabilities. See Statement of Assets and Liabilities. |
Annual Shareholder Report
Portfolio of Investments
October 31, 2017
Shares or
Principal
Amount | | | Value |
| | | COMMON STOCKS—87.0% | |
| | | Consumer Discretionary—8.7% | |
| 59,900 | 1 | Amazon.com, Inc. | $66,206,272 |
| 150,000 | | Ctrip.com International Ltd., ADR | 7,183,500 |
| 1,425,000 | 1 | Floor & Decor Holdings, Inc. | 53,722,500 |
| 435,860 | | Hilton Worldwide Holdings, Inc. | 31,503,961 |
| 400,000 | 1 | JD.com, Inc., ADR | 15,008,000 |
| 755,000 | | Las Vegas Sands Corp. | 47,851,900 |
| 140,000 | 1 | Mohawk Industries, Inc. | 36,646,400 |
| 446,000 | | Moncler S.p.A | 12,665,689 |
| 42,080,000 | | NagaCorp Limited | 33,990,050 |
| 9,320 | 1 | Priceline.com, Inc. | 17,819,467 |
| 4,000,000 | | Samsonite International SA | 16,833,307 |
| 500,000 | | Six Flags Entertainment Corp. | 31,395,000 |
| 725,000 | | Starbucks Corp. | 39,759,000 |
| 130,000 | | Vail Resorts, Inc. | 29,772,600 |
| 600,000 | 2 | Wingstop, Inc. | 20,322,000 |
| 650,000 | 1,2 | Yoox Net-A-Porter Group | 24,285,481 |
| | | TOTAL | 484,965,127 |
| | | Consumer Staples—0.8% | |
| 400,000 | 1,2 | Blue Buffalo Pet Products, Inc. | 11,572,000 |
| 150,000 | | Constellation Brands, Inc., Class A | 32,863,500 |
| | | TOTAL | 44,435,500 |
| | | Energy—0.7% | |
| 1,320,000 | | US Silica Holdings, Inc. | 40,273,200 |
| | | Financials—6.9% | |
| 221,600 | | Affiliated Managers Group | 41,328,400 |
| 3,857,925 | 1 | Allied Irish Banks PLC | 22,799,731 |
| 255,000 | | BlackRock, Inc. | 120,061,650 |
| 1,000,000 | | CIT Group Holdings, Inc. | 46,620,000 |
| 1,775,000 | | Chimera Investment Corp. | 32,482,500 |
| 1,175,000 | 1 | doBank S.p.A. | 18,681,814 |
| 1 | 1,3,4 | FA Private Equity Fund IV LP | 550,157 |
| 6,165,000 | | FinecoBank Banca Fineco SPA | 57,667,023 |
| 865,685 | 5 | Hamilton Lane, Inc. | 23,797,681 |
| 1 | 1,3,4 | Infrastructure Fund | 0 |
Annual Shareholder Report
Shares or
Principal
Amount | | | Value |
| | | COMMON STOCKS—continued | |
| | | Financials—continued | |
| 800,000 | 1 | Qudian, Inc., ADR | $19,920,000 |
| | | TOTAL | 383,908,956 |
| | | Health Care—29.2% | |
| 300,000 | | Agilent Technologies, Inc. | 20,409,000 |
| 190,000 | 1 | Align Technology, Inc. | 45,406,200 |
| 375,000 | 1 | Alkermes, Inc. | 18,285,000 |
| 50,000 | 1 | Alnylam Pharmaceuticals, Inc. | 6,092,000 |
| 850,000 | 1 | Amphastar Pharmaceuticals, Inc. | 15,359,500 |
| 268,200 | 1 | AnaptysBio, Inc. | 17,709,246 |
| 1 | 3,4 | Apollo Investment Fund V | 186,607 |
| 1,792,250 | 1,5 | arGEN-x N.V. | 41,405,925 |
| 388,800 | 1 | Argenx SE, ADR | 8,911,296 |
| 6,978,566 | 1,4 | BioNano Genomics, Inc. | 0 |
| 960,000 | 1 | Boston Scientific Corp. | 27,014,400 |
| 540,000 | 1,2 | Clementia Pharmaceuticals, Inc. | 8,650,800 |
| 5,180,000 | 1,5 | ContraFect Corp. | 5,335,400 |
| 120,000 | | Cooper Cos., Inc. | 28,831,200 |
| 10,752,426 | 1,5 | Corcept Therapeutics, Inc. | 211,715,268 |
| 875,000 | | Danaher Corp. | 80,736,250 |
| 8,829,511 | 1,2,4,5 | Dyax Corp. | 21,190,826 |
| 1,900,000 | 1 | Dynavax Technologies Corp. | 41,800,000 |
| 255,000 | 1 | Edwards Lifesciences Corp. | 26,068,650 |
| 273,251 | 1,2 | Egalet Corp. | 267,786 |
| 255,000 | 1,2 | GW Pharmaceuticals PLC, ADR | 27,527,250 |
| 510,000 | 1 | Galapagos NV | 49,469,326 |
| 850,000 | 1 | Galapagos NV, ADR | 82,858,000 |
| 410,000 | 1 | Genmab A/S | 82,902,162 |
| 400,000 | 1,2 | Glaukos Corp. | 14,124,000 |
| 4,753,986 | 1 | Horizon Discovery Group PLC | 16,165,101 |
| 145,000 | 1 | IDEXX Laboratories, Inc. | 24,094,650 |
| 180,000 | 1 | Insulet Corp. | 10,585,800 |
| 925,000 | 1 | Intersect ENT, Inc. | 27,426,250 |
| 1 | 1,3,4 | Latin Healthcare Fund | 370,701 |
| 6,325,000 | 1,5 | Minerva Neurosciences, Inc. | 39,847,500 |
| 930,000 | 1 | Nektar Therapeutics | 22,403,700 |
| 240,000 | 1 | Nevro Corp. | 21,019,200 |
| 405,000 | 1 | Penumbra, Inc. | 40,722,750 |
Annual Shareholder Report
Shares or
Principal
Amount | | | Value |
| | | COMMON STOCKS—continued | |
| | | Health Care—continued | |
| 880,000 | 1,2 | Poxel SA | $7,332,472 |
| 9,940,101 | 1,5 | Progenics Pharmaceuticals, Inc. | 61,529,225 |
| 1,849,866 | 1,2 | Protalix Biotherapeutics, Inc. | 1,438,271 |
| 710,000 | 1 | Repligen Corp. | 26,412,000 |
| 330,000 | 1 | SAGE Therapeutics, Inc. | 20,882,400 |
| 3,325,000 | 1,2,5 | SCYNEXIS, Inc. | 6,583,500 |
| 650,000 | 1,2 | Seres Therapeutics, Inc. | 6,526,000 |
| 959,018 | 1,4,5 | Soteira, Inc. | 0 |
| 1,370,000 | 1 | Spark Therapeutics, Inc. | 110,833,000 |
| 2,594,039 | 1,5 | SteadyMed Ltd. | 8,041,521 |
| 1,173,832 | 1,5 | SteadyMed Ltd. | 3,638,879 |
| 175,000 | | Stryker Corp. | 27,102,250 |
| 490,989 | 1,2 | Tesaro, Inc. | 56,841,797 |
| 325,000 | 1 | Ultragenyx Pharmaceutical, Inc. | 14,979,250 |
| 2,500,000 | 1 | Veeva Systems, Inc. | 152,350,000 |
| 1,235,300 | 1 | Zogenix, Inc. | 46,323,750 |
| | | TOTAL | 1,635,706,059 |
| | | Industrials—9.0% | |
| 1,675,000 | | Air Lease Corp. | 72,778,750 |
| 380,000 | | Alaska Air Group, Inc. | 25,091,400 |
| 182,400 | 1 | Dycom Industries, Inc. | 16,020,192 |
| 235,000 | | Fortive Corp. | 16,981,100 |
| 404,875 | | Heico Corp. | 36,714,065 |
| 550,000 | | KAR Auction Services, Inc. | 26,031,500 |
| 697,200 | | Osram Licht AG | 53,591,709 |
| 990,000 | | REV Group, Inc. | 25,542,000 |
| 150,000 | | Raytheon Co. | 27,030,000 |
| 329,000 | | Roper Technologies, Inc. | 84,937,930 |
| 350,000 | 1 | Verisk Analytics, Inc. | 29,767,500 |
| 91,900 | 1 | WABCO Holdings, Inc. | 13,561,683 |
| 233,333 | 1 | WageWorks, Inc. | 14,874,978 |
| 900,000 | 1 | XPO Logistics, Inc. | 62,415,000 |
| | | TOTAL | 505,337,807 |
| | | Information Technology—24.8% | |
| 120,000 | 1 | Adobe Systems, Inc. | 21,019,200 |
| 3,800,000 | 1,2 | Advanced Micro Devices, Inc. | 41,743,000 |
| 373,000 | 1 | Alibaba Group Holding Ltd., ADR | 68,963,970 |
Annual Shareholder Report
Shares or
Principal
Amount | | | Value |
| | | COMMON STOCKS—continued | |
| | | Information Technology—continued | |
| 625,000 | | Amadeus IT Group S.A. | $42,399,575 |
| 270,000 | | Broadcom Ltd. | 71,255,700 |
| 244,200 | | Cognex Corp. | 30,073,230 |
| 254,800 | 1 | CoStar Group, Inc. | 75,357,100 |
| 885,000 | 1,2 | Coupa Software, Inc. | 30,753,750 |
| 146,700 | 1 | Delivery Hero GmbH | 6,260,139 |
| 7,873,765 | | Evry AS | 32,285,127 |
| 1,059,322 | 1,3,4 | Expand Networks Ltd. | 0 |
| 3,260,000 | 1,2 | GDS Holdings Ltd., ADR | 51,182,000 |
| 1,100,000 | 1 | GoDaddy, Inc. | 51,370,000 |
| 800,000 | 1,2 | GrubHub, Inc. | 48,816,000 |
| 1,603,000 | | Marvell Technology Group Ltd. | 29,607,410 |
| 1,415,000 | 1 | Microsemi Corp. | 75,518,550 |
| 425,000 | 1 | MindBody, Inc. | 13,706,250 |
| 645,000 | 1 | Q2 Holdings, Inc. | 27,444,750 |
| 1,423,600 | 1 | RADWARE Ltd. | 24,969,944 |
| 520,000 | 1 | RealPage, Inc. | 22,516,000 |
| 180,000 | 1 | Red Hat, Inc. | 21,749,400 |
| 683,086 | | STMicroelectronics N.V., ADR | 16,100,337 |
| 450,000 | 1 | Salesforce.com, Inc. | 46,053,000 |
| 3,751 | 1,3,4 | Sensable Technologies, Inc. | 0 |
| 1,070,000 | 1 | ServiceNow, Inc. | 135,215,900 |
| 390,000 | 1 | Shopify, Inc. | 38,801,100 |
| 1,485,000 | 1 | Splunk, Inc. | 99,940,500 |
| 42,900 | 1 | Takeaway.com Holding BV | 2,029,041 |
| 415,000 | 1 | Tyler Technologies, Inc. | 73,575,350 |
| 780,000 | 1 | Vantiv, Inc. | 54,600,000 |
| 1,020,000 | 1 | Workday, Inc. | 113,209,800 |
| 600,000 | 1,2 | Zillow Group, Inc. | 24,768,000 |
| | | TOTAL | 1,391,284,123 |
| | | Materials—5.1% | |
| 313,400 | | Albemarle Corp. | 44,154,926 |
| 155,000 | | Eagle Materials, Inc. | 16,363,350 |
| 445,000 | 1 | Ingevity Corp. | 31,697,350 |
| 195,100 | | Martin Marietta Materials | 42,307,435 |
| 639,290 | 1 | PQ Group Holdings, Inc. | 10,484,356 |
| 251,600 | | Sherwin-Williams Co. | 99,419,740 |
Annual Shareholder Report
Shares or
Principal
Amount | | | Value |
| | | COMMON STOCKS—continued | |
| | | Materials—continued | |
| 461,800 | | Westlake Chemical Corp. | $39,211,438 |
| | | TOTAL | 283,638,595 |
| | | Real Estate—1.8% | |
| 300,000 | 1 | CBRE Group, Inc. | 11,796,000 |
| 385,000 | | Crown Castle International Corp. | 41,225,800 |
| 400,000 | | MGM Growth Properties LLC | 11,804,000 |
| 550,000 | | Ryman Hospitality Properties | 36,371,500 |
| | | TOTAL | 101,197,300 |
| | | TOTAL COMMON STOCKS
(IDENTIFIED COST $2,897,537,687) | 4,870,746,667 |
| | | CORPORATE BOND—0.0% | |
| | | Health Care—0.0% | |
| $2,415,000 | | Protalix Biotherapeutics, Inc., Conv. Bond, 7.50%, 11/15/2021
(IDENTIFIED COST $3,075,458) | 2,441,268 |
| | | PREFERRED STOCK—0.0% | |
| | | Information Technology—0.0% | |
| 679,348 | 1,3,4 | Multiplex, Inc., Pfd., Series C
(IDENTIFIED COST $5,000,001) | 0 |
| | | WARRANTS—0.1% | |
| | | Health Care—0.1% | |
| 3,445,000 | 1,5 | ContraFect Corp., Warrants | 1,058,648 |
| 1,735,000 | 1,5 | ContraFect Corp., Warrants | 695,562 |
| 848,250 | 1,5 | SCYNEXIS, Inc., Warrants | 799,306 |
| | | TOTAL WARRANTS
(IDENTIFIED COST $51,800) | 2,553,516 |
| | | INVESTMENT COMPANY—15.5% | |
| 145,562,751 | 5,6 | Federated Government Obligations Fund, Institutional Shares, 0.91%7 | 145,562,751 |
| 723,061,148 | 5 | Federated Institutional Prime Value Obligations Fund,
Institutional Shares, 1.21%7 | 723,133,454 |
| | | TOTAL INVESTMENT COMPANY
(IDENTIFIED COST $868,699,688) | 868,696,205 |
| | | TOTAL INVESTMENT IN SECURITIES—102.6%
(IDENTIFIED COST $3,774,364,634)8 | 5,744,437,656 |
| | | OTHER ASSETS AND LIABILITIES - NET—(2.6)%9 | (145,821,510) |
| | | TOTAL NET ASSETS—100% | $5,598,616,146 |
Annual Shareholder Report
At October 31, 2017, the Fund had the following outstanding futures contracts:
| Description | Number of
Contracts | Notional
Value | Expiration
Date | Value and
Unrealized
Depreciation |
| 1S&P 500 E-Mini Index Short Futures | 352 | $45,279,520 | December 2017 | $(1,901,944) |
| 1 | Non-income-producing security. |
| 2 | All or a portion of these securities are temporarily on loan to unaffiliated broker/dealers. |
| 3 | Denotes a restricted security that either: (a) cannot be offered for public sale without first being registered, or availing of an exemption from registration, under the Securities Act of 1933; or (b) is subject to a contractual restriction on public sales. At October 31, 2017, these restricted securities amounted to $1,107,465, which represented 0.0% of total net assets. |
| 4 | Market quotations and price evaluations are not available. Fair value determined using significant unobservable inputs in accordance with procedures established by and under the general supervision of the Fund's Board of Trustees (the “Trustees”). |
Annual Shareholder Report
| 5 | Affiliated companies and holdings. |
An affiliated company is a company in which the Fund has ownership of at least 5% of the voting shares. Transactions with affiliated companies during the year ended October 31, 2017, were as follows:
| | Balance of
Shares
Held
10/31/2016 | Purchases/
Additions | Sales/
Reductions |
| arGEN-x | 1,359,250 | 433,000 | — |
| ContraFect Corp. | 1,735,000 | 3,445,000 | — |
| ContraFect Corp., Warrants | — | 3,445,000 | — |
| ContraFect Corp., Warrants | 1,735,000 | — | — |
| Corcept Therapeutics, Inc. | 12,439,968 | 1,252,194 | (2,939,736) |
| Dyax Corp.- CVR | 8,829,511 | — | — |
| Dynavax Technologies Corp.* | 2,100,000 | 212,166 | (412,166) |
| Egalet Corp.* | 1,700,000 | 300,000 | (1,726,749) |
| Galapagos NV* | 881,500 | — | (371,500) |
| Galapagos NV, ADR* | 956,807 | — | (106,807) |
| Hamilton Lane, Inc. | — | 865,685 | — |
| Intersect ENT, Inc.* | 1,430,000 | — | (505,000) |
| Minerva Neurosciences, Inc. | 5,319,140 | 1,005,860 | — |
| Progenics Pharmaceuticals, Inc. | 11,301,600 | 278,983 | (1,640,482) |
| SCYNEXIS, Inc., | 2,635,000 | 690,000 | — |
| SCYNEXIS, Inc. Warrants | 848,250 | — | — |
| Seres Therapeutics, Inc.* | 1,000,000 | — | (350,000) |
| Soteira, Inc. | 959,018 | — | — |
| Spark Therapeutics, Inc.* | 1,400,000 | 404,639 | (434,639) |
| SteadyMed Ltd. | 1,317,816 | 1,280,327 | (4,104) |
| SteadyMed Ltd. | 1,173,832 | — | — |
| Zogenix, Inc.* | 870,000 | 715,300 | (350,000) |
| Affiliated issuers no longer in the portfolio at period end | 11,098,832 | — | (11,098,832) |
| TOTAL OF AFFILIATED TRANSACTIONS | 71,090,524 | 14,328,154 | (19,940,015) |
Annual Shareholder Report
Balance of
Shares
Held
10/31/2017 | Value | Change in
Unrealized
Appreciation/
Depreciation | Net
Realized
Gain/(Loss) | Dividend
Income |
| 1,792,250 | $41,405,925 | $13,422,736 | $— | $— |
| 5,180,000 | $5,335,400 | $(2,926,900) | $— | $— |
| 3,445,000 | $1,058,648 | $1,024,198 | $— | $— |
| 1,735,000 | $695,562 | $(1,465,555) | $— | $— |
| 10,752,426 | $211,715,268 | $130,833,131 | $21,290,073 | $— |
| 8,829,511 | $21,190,826 | $11,390,069 | $— | $— |
| 1,900,000 | $41,800,000 | $30,722,513 | $(4,446,614) | $— |
| 273,251 | $267,786 | $14,929,683 | $(9,053,581) | $— |
| 510,000 | $49,469,326 | $5,689,414 | $16,877,655 | $— |
| 850,000 | $82,858,000 | $29,347,594 | $2,968,956 | $— |
| 865,685 | $23,797,681 | $8,307,597 | $— | $— |
| 925,000 | $27,426,250 | $16,008,299 | $(4,263,363) | $— |
| 6,325,000 | $39,847,500 | $(27,193,167) | $— | $— |
| 9,940,101 | $61,529,225 | $31,960,578 | $(17,209,274) | $— |
| 3,325,000 | $6,583,500 | $(3,084,921) | $— | $— |
| 848,250 | $799,306 | $(838,750) | $— | $— |
| 650,000 | $6,526,000 | $596,873 | $(1,239,222) | $— |
| 959,018 | $0 | $— | $— | $— |
| 1,370,000 | $110,833,000 | $46,115,994 | $(2,073,861) | $— |
| 2,594,039 | $8,041,521 | $(1,600,414) | $— | $— |
| 1,173,832 | $3,638,879 | $(880,374) | $— | $— |
| 1,235,300 | $46,323,750 | $28,724,242 | $— | $— |
| — | $— | $3,941,731 | $(25,588,686) | $— |
| 65,478,663 | $791,143,353 | $335,024,571 | $(22,737,917) | $— |
| * | At October 31, 2017, the Fund no longer has ownership of at least 5% of the voting shares. |
Annual Shareholder Report
Affiliated fund holdings are investment companies which are managed by the Adviser or an affiliate of the Adviser. Transactions with affiliated fund holdings during the year ended October 31, 2017, were as follows:
| | Federated
Institutional
Prime Value
Obligations Fund,
Institutional Shares | Federated
Government
Obligations Fund,
Institutional Shares* | Total of
Affiliated
Transactions |
| Balance of Shares Held 10/31/2016 | 568,092,887 | 298,168,770 | 866,261,657 |
| Purchases/Additions | 1,853,218,103 | 1,420,943,185 | 3,274,161,288 |
| Sales/Reductions | (1,698,249,842) | (1,573,549,204) | (3,271,799,046) |
| Balance of Shares Held 10/31/2017 | 723,061,148 | 145,562,751 | 868,623,899 |
| Value | $723,133,454 | $145,562,751 | $868,696,205 |
| Change in Unrealized Appreciation/Depreciation | $(3,483) | NA | $(3,483) |
| Net Realized Gain/(Loss) | $15,538 | NA | $15,538 |
| Dividend Income | $6,662,656 | $1,066,490 | $7,729,146 |
| * | All or a portion of the balance/activity for the fund relates to cash collateral received on securities lending transactions. |
| 6 | All or a portion of this security is held as collateral for securities lending. |
| 7 | 7-day net yield. |
| 8 | The cost of investments for federal tax purposes amounts to $3,807,687,072. |
| 9 | Assets, other than investments in securities, less liabilities. See Statement of Assets and Liabilities. |
Note: The categories of investments are shown as a percentage of total net assets at October 31, 2017.
Various inputs are used in determining the value of the Fund's investments. These inputs are summarized in the three broad levels listed below:
Level 1—quoted prices in active markets for identical securities.
Level 2—other significant observable inputs (including quoted prices for similar securities, interest rates, prepayment speeds, credit risk, etc.). Also includes securities valued at amortized cost.
Level 3—significant unobservable inputs (including the Fund's own assumptions in determining the fair value of investments).
The inputs or methodology used for valuing securities are not an indication of the risk associated with investing in those securities.
Annual Shareholder Report
The following is a summary of the inputs used, as of October 31, 2017, in valuing the Fund's assets carried at fair value:
| Valuation Inputs | | | | |
| | Level 1—
Quoted
Prices | Level 2—
Other
Significant
Observable
Inputs | Level 3—
Significant
Unobservable
Inputs | Total |
| Equity Securities: | | | | |
| Common Stocks | | | | |
| Domestic | $3,845,064,997 | $— | $22,298,291 | $3,867,363,288 |
| International | 1,003,383,379 | — | — | 1,003,383,379 |
| Preferred Stock | | | | |
| Domestic | — | — | 0 | 0 |
| Debt Securities: | | | | |
| Corporate Bond | — | 2,441,268 | — | 2,441,268 |
| Warrants | — | 2,553,516 | — | 2,553,516 |
| Investment Company | 868,696,205 | — | — | 868,696,205 |
| TOTAL SECURITIES | $5,717,144,581 | $4,994,784 | $22,298,291 | $5,744,437,656 |
| Other Financial Instruments1 | | | | |
| Assets | | | | |
| Futures | $— | $— | $— | $— |
| Liabilities | | | | |
| Futures | (1,901,944) | — | — | (1,901,944) |
| TOTAL OTHER FINANCIAL INSTRUMENTS | $(1,901,944) | $— | $— | $(1,901,944) |
| 1 | Other financial instruments include futures contracts. |
The following acronyms are used throughout this portfolio:
| ADR | —American Depositary Receipt |
| SA | —Support Agreement |
See Notes which are an integral part of the Financial Statements
Annual Shareholder Report
Financial Highlights–Class A Shares
(For a Share Outstanding Throughout Each Period)
| Year Ended October 31 | 2017 | 2016 | 2015 | 2014 | 2013 |
| Net Asset Value, Beginning of Period | $5.27 | $6.02 | $6.60 | $6.59 | $5.28 |
| Income From Investment Operations: | | | | | |
| Net investment income (loss) | (0.06)1 | (0.05)1 | (0.08)1 | (0.09)1 | (0.05)1 |
| Net realized and unrealized gain on investments, futures contracts and foreign currency transactions | 1.37 | 0.16 | 0.46 | 0.98 | 1.78 |
| TOTAL FROM INVESTMENT OPERATIONS | 1.31 | 0.11 | 0.38 | 0.89 | 1.73 |
| Less Distributions: | | | | | |
| Distributions from net realized gain on investments, futures contracts and foreign currency transactions | (0.52) | (0.86) | (0.96) | (0.88) | (0.42) |
| Net Asset Value, End of Period | $6.06 | $5.27 | $6.02 | $6.60 | $6.59 |
| Total Return2 | 26.97% | 1.77% | 6.29% | 14.54% | 35.63% |
| Ratios to Average Net Assets: | | | | | |
| Net expenses | 1.95%3 | 1.95%3 | 1.95%3 | 1.95%3 | 1.95%3 |
| Net investment income (loss) | (1.13)% | (1.00)% | (1.22)% | (1.27)% | (0.82)% |
| Expense waiver/reimbursement4 | 0.04% | 0.06% | 0.05% | 0.15% | 0.25% |
| Supplemental Data: | | | | | |
| Net assets, end of period (000 omitted) | $1,324,155 | $1,364,222 | $1,582,916 | $1,550,663 | $1,508,534 |
| Portfolio turnover | 47% | 55% | 51% | 52% | 63% |
| 1 | Per share numbers have been calculated using the average shares method. |
| 2 | Based on net asset value, which does not reflect the sales charge, redemption fee or contingent deferred sales charge, if applicable. |
| 3 | The net expense ratios are calculated without reduction for fees paid indirectly for expense offset arrangements. The net expense ratios are 1.95%, 1.95%, 1.95%, 1.95% and 1.95%, for the years ended October 31, 2017, 2016, 2015, 2014 and 2013, respectively, after taking into account these expense reductions. |
| 4 | This expense decrease is reflected in both the net expense and the net investment income (loss) ratios shown above. |
See Notes which are an integral part of the Financial Statements
Annual Shareholder Report
Financial Highlights–Class B Shares
(For a Share Outstanding Throughout Each Period)
| Year Ended October 31 | 2017 | 2016 | 2015 | 2014 | 2013 |
| Net Asset Value, Beginning of Period | $4.58 | $5.36 | $6.00 | $6.10 | $4.94 |
| Income From Investment Operations: | | | | | |
| Net investment income (loss) | (0.08)1 | (0.07)1 | (0.10)1 | (0.11)1 | (0.07)1 |
| Net realized and unrealized gain on investments, futures contracts and foreign currency transactions | 1.17 | 0.15 | 0.42 | 0.89 | 1.65 |
| TOTAL FROM INVESTMENT OPERATIONS | 1.09 | 0.08 | 0.32 | 0.78 | 1.58 |
| Less Distributions: | | | | | |
| Distributions from net realized gain on investments, futures contracts and foreign currency transactions | (0.52) | (0.86) | (0.96) | (0.88) | (0.42) |
| Net Asset Value, End of Period | $5.15 | $4.58 | $5.36 | $6.00 | $6.10 |
| Total Return2 | 26.16% | 1.34% | 5.83% | 13.83% | 34.99% |
| Ratios to Average Net Assets: | | | | | |
| Net expenses | 2.47%3 | 2.48%3 | 2.48%3 | 2.50%3 | 2.50%3 |
| Net investment income (loss) | (1.65)% | (1.52)% | (1.74)% | (1.81)% | (1.35)% |
| Expense waiver/reimbursement4 | 0.03% | 0.03% | 0.03% | 0.11% | 0.20% |
| Supplemental Data: | | | | | |
| Net assets, end of period (000 omitted) | $65,410 | $72,634 | $99,777 | $123,679 | $159,846 |
| Portfolio turnover | 47% | 55% | 51% | 52% | 63% |
| 1 | Per share numbers have been calculated using the average shares method. |
| 2 | Based on net asset value, which does not reflect the sales charge, redemption fee or contingent deferred sales charge, if applicable. |
| 3 | The net expense ratios are calculated without reduction for fees paid indirectly for expense offset arrangements. The net expense ratios are 2.47%, 2.48%, 2.48%, 2.50% and 2.50%, for the years ended October 31, 2017, 2016, 2015, 2014 and 2013, respectively, after taking into account these expense reductions. |
| 4 | This expense decrease is reflected in both the net expense and the net investment income (loss) ratios shown above. |
See Notes which are an integral part of the Financial Statements
Annual Shareholder Report
Financial Highlights–Class C Shares
(For a Share Outstanding Throughout Each Period)
| Year Ended October 31 | 2017 | 2016 | 2015 | 2014 | 2013 |
| Net Asset Value, Beginning of Period | $4.57 | $5.36 | $6.00 | $6.10 | $4.94 |
| Income From Investment Operations: | | | | | |
| Net investment income (loss) | (0.08)1 | (0.07)1 | (0.10)1 | (0.11)1 | (0.07)1 |
| Net realized and unrealized gain on investments, futures contracts and foreign currency transactions | 1.17 | 0.14 | 0.42 | 0.89 | 1.65 |
| TOTAL FROM INVESTMENT OPERATIONS | 1.09 | 0.07 | 0.32 | 0.78 | 1.58 |
| Less Distributions: | | | | | |
| Distributions from net realized gain on investments, futures contracts and foreign currency transactions | (0.52) | (0.86) | (0.96) | (0.88) | (0.42) |
| Net Asset Value, End of Period | $5.14 | $4.57 | $5.36 | $6.00 | $6.10 |
| Total Return2 | 26.22% | 1.15% | 5.86% | 13.83% | 34.99% |
| Ratios to Average Net Assets: | | | | | |
| Net expenses | 2.47%3 | 2.48%3 | 2.48%3 | 2.50%3 | 2.50%3 |
| Net investment income (loss) | (1.65)% | (1.52)% | (1.75)% | (1.81)% | (1.39)% |
| Expense waiver/reimbursement4 | 0.03% | 0.03% | 0.03% | 0.11% | 0.20% |
| Supplemental Data: | | | | | |
| Net assets, end of period (000 omitted) | $306,011 | $343,129 | $418,926 | $427,755 | $431,327 |
| Portfolio turnover | 47% | 55% | 51% | 52% | 63% |
| 1 | Per share numbers have been calculated using the average shares method. |
| 2 | Based on net asset value, which does not reflect the sales charge, redemption fee or contingent deferred sales charge, if applicable. |
| 3 | The net expense ratios are calculated without reduction for fees paid indirectly for expense offset arrangements. The net expense ratios are 2.47%, 2.48%, 2.48%, 2.50% and 2.50%, for the years ended October 31, 2017, 2016, 2015, 2014 and 2013, respectively, after taking into account these expense reductions. |
| 4 | This expense decrease is reflected in both the net expense and the net investment income (loss) ratios shown above. |
See Notes which are an integral part of the Financial Statements
Annual Shareholder Report
Financial Highlights–Class R Shares
(For a Share Outstanding Throughout Each Period)
| Year Ended October 31 | 2017 | 2016 | 2015 | 2014 | 2013 |
| Net Asset Value, Beginning of Period | $5.28 | $6.03 | $6.61 | $6.60 | $5.28 |
| Income From Investment Operations: | | | | | |
| Net investment income (loss) | (0.06)1 | (0.05)1 | (0.08)1 | (0.08)1 | (0.05)1 |
| Net realized and unrealized gain on investments, futures contracts and foreign currency transactions | 1.37 | 0.16 | 0.46 | 0.97 | 1.79 |
| TOTAL FROM INVESTMENT OPERATIONS | 1.31 | 0.11 | 0.38 | 0.89 | 1.74 |
| Less Distributions: | | | | | |
| Distributions from net realized gain on investments, futures contracts and foreign currency transactions | (0.52) | (0.86) | (0.96) | (0.88) | (0.42) |
| Net Asset Value, End of Period | $6.07 | $5.28 | $6.03 | $6.61 | $6.60 |
| Total Return2 | 26.92% | 1.76% | 6.28% | 14.52% | 35.81% |
| Ratios to Average Net Assets: | | | | | |
| Net expenses | 1.95%3 | 1.95%3 | 1.95%3 | 1.95%3 | 1.95%3 |
| Net investment income (loss) | (1.14)% | (1.00)% | (1.22)% | (1.27)% | (0.85)% |
| Expense waiver/reimbursement4 | 0.28% | 0.29% | 0.29% | 0.38% | 0.48% |
| Supplemental Data: | | | | | |
| Net assets, end of period (000 omitted) | $3,704,278 | $3,206,317 | $3,452,182 | $3,497,459 | $3,358,658 |
| Portfolio turnover | 47% | 55% | 51% | 52% | 63% |
| 1 | Per share numbers have been calculated using the average shares method. |
| 2 | Based on net asset value, which does not reflect the sales charge, redemption fee or contingent deferred sales charge, if applicable. |
| 3 | The net expense ratios are calculated without reduction for fees paid indirectly for expense offset arrangements. The net expense ratios are 1.95%, 1.95%, 1.95%, 1.95% and 1.95%, for the years ended October 31, 2017, 2016, 2015, 2014 and 2013, respectively, after taking into account these expense reductions. |
| 4 | This expense decrease is reflected in both the net expense and the net investment income (loss) ratios shown above. |
See Notes which are an integral part of the Financial Statements
Annual Shareholder Report
Financial Highlights–Institutional Shares
(For a Share Outstanding Throughout the Period)
| Period Ended October 31 | 20171 |
| Net Asset Value, Beginning of Period | $4.94 |
| Income From Investment Operations: | |
| Net investment income (loss) | (0.03)2 |
| Net realized and unrealized gain on investments, futures contracts and foreign currency transactions | 1.19 |
| TOTAL FROM INVESTMENT OPERATIONS | 1.16 |
| Less Distributions: | |
| Distributions from net realized gain on investments, futures contracts and foreign currency transactions | — |
| Net Asset Value, End of Period | $6.10 |
| Total Return3 | 23.48% |
| Ratios to Average Net Assets: | |
| Net expenses | 1.47%4,5 |
| Net investment income (loss) | (0.67)%4 |
| Expense waiver/reimbursement6 | 0.03%4 |
| Supplemental Data: | |
| Net assets, end of period (000 omitted) | $198,762 |
| Portfolio turnover | 47%7 |
| 1 | Reflects operations for the period from December 29, 2016 (date of initial investment) to October 31, 2017. |
| 2 | Per share numbers have been calculated using the average shares method. |
| 3 | Based on net asset value, which does not reflect the sales charge, redemption fee or contingent deferred sales charge, if applicable. Total returns for periods of less than one year are not annualized. |
| 4 | Computed on an annualized basis. |
| 5 | The net expense ratio is calculated without reduction for fees paid indirectly for expense offset arrangements. The net expense ratio is 1.47% for the period from December 29, 2016 (date of initial investment) to October 31, 2017, after taking into account these expense reductions. |
| 6 | This expense decrease is reflected in both the net expense and the net investment income (loss) ratios shown above. |
| 7 | Portfolio turnover is calculated at the Fund level. Percentage indicated was calculated for the period from November 1, 2016 to October 31, 2017. |
See Notes which are an integral part of the Financial Statements
Annual Shareholder Report
Statement of Assets and Liabilities
October 31, 2017
| Assets: | | |
| Investment in securities, at value including $137,962,364 of securities loaned, $868,696,205 of investment in affiliated holdings and $425,639,241 of investments in affiliated companies (identified cost $3,774,364,634) | | $5,744,437,656 |
| Cash denominated in foreign currencies (identified cost $950) | | 1,010 |
| Restricted cash (Note 2) | | 1,584,000 |
| Income receivable | | 1,139,643 |
| Receivable for investments sold | | 6,240,217 |
| Receivable for shares sold | | 852,393 |
| TOTAL ASSETS | | 5,754,254,919 |
| Liabilities: | | |
| Payable for investments purchased | $1,280,325 | |
| Payable for shares redeemed | 3,190,625 | |
| Payable for daily variation margin on futures contracts | 77,436 | |
| Payable for collateral due to broker for securities lending | 145,562,751 | |
| Payable to adviser (Note 5) | 194,539 | |
| Payable for administrative fees (Note 5) | 12,237 | |
| Payable for distribution services fee (Note 5) | 1,309,268 | |
| Payable for other service fees (Notes 2 and 5) | 2,714,687 | |
| Accrued expenses (Note 5) | 1,296,905 | |
| TOTAL LIABILITIES | | 155,638,773 |
| Net assets for 933,868,603 shares outstanding | | $5,598,616,146 |
| Net Assets Consist of: | | |
| Paid-in capital | | $3,105,554,491 |
| Net unrealized appreciation of investments, futures contracts and translation of assets and liabilities in foreign currency | | 1,968,170,834 |
| Accumulated net realized gain on investments, futures contracts and foreign currency transactions | | 588,443,264 |
| Accumulated net investment income (loss) | | (63,552,443) |
| TOTAL NET ASSETS | | $5,598,616,146 |
Annual Shareholder Report
Statement of Assets and Liabilities–continued
| Net Asset Value, Offering Price and Redemption Proceeds Per Share | | |
| Class A Shares: | | |
| Net asset value per share ($1,324,155,115 ÷ 218,629,976 shares outstanding), no par value, unlimited shares authorized | | $6.06 |
| Offering price per share (100/94.50 of $6.06) | | $6.41 |
| Redemption proceeds per share | | $6.06 |
| Class B Shares: | | |
| Net asset value per share ($65,409,848 ÷ 12,705,504 shares outstanding), no par value, unlimited shares authorized | | $5.15 |
| Offering price per share | | $5.15 |
| Redemption proceeds per share (94.50/100 of $5.15) | | $4.87 |
| Class C Shares: | | |
| Net asset value per share ($306,011,240 ÷ 59,514,858 shares outstanding), no par value, unlimited shares authorized | | $5.14 |
| Offering price per share | | $5.14 |
| Redemption proceeds per share (99.00/100 of $5.14) | | $5.09 |
| Class R Shares: | | |
| Net asset value per share ($3,704,278,296 ÷ 610,421,605 shares outstanding), no par value, unlimited shares authorized | | $6.07 |
| Offering price per share | | $6.07 |
| Redemption proceeds per share | | $6.07 |
| Institutional Shares: | | |
| Net asset value per share ($198,761,647 ÷ 32,596,660 shares outstanding), no par value, unlimited shares authorized | | $6.10 |
| Offering price per share | | $6.10 |
| Redemption proceeds per share | | $6.10 |
See Notes which are an integral part of the Financial Statements
Annual Shareholder Report
Statement of Operations
Year Ended October 31, 2017
| Investment Income: | | | |
| Dividends (including $6,662,656 received from an affiliated holding and net of foreign taxes withheld of $441,179) | | | $40,610,642 |
| Net income on securities loaned (includes $1,039,758 received from an affiliated holding related to cash collateral balances, see footnotes to Portfolio of Investments) | | | 2,405,530 |
| Interest income | | | 43,888 |
| TOTAL INCOME | | | 43,060,060 |
| Expenses: | | | |
| Investment adviser fee (Note 5) | | $68,625,554 | |
| Administrative fee (Note 5) | | 4,162,969 | |
| Custodian fees | | 315,866 | |
| Transfer agent fee (Note 2) | | 4,823,975 | |
| Directors'/Trustees' fees (Note 5) | | 44,884 | |
| Auditing fees | | 45,686 | |
| Legal fees | | 8,814 | |
| Portfolio accounting fees | | 227,186 | |
| Distribution services fee (Note 5) | | 23,501,132 | |
| Other service fees (Notes 2 and 5) | | 12,881,901 | |
| Share registration costs | | 113,868 | |
| Printing and postage | | 202,034 | |
| Miscellaneous (Note 5) | | 66,573 | |
| TOTAL EXPENSES | | 115,020,442 | |
Annual Shareholder Report
Statement of Operations–continued
| Waivers, Reimbursements and Expense Reduction: | | | |
| Waiver/reimbursement of investment adviser fee (Note 5) | $(1,337,897) | | |
| Waiver of other operating expenses (Note 5) | (8,960,239) | | |
| Fees paid indirectly from directed brokerage arrangements (Note 6) | (27,653) | | |
| TOTAL WAIVERS, REIMBURSEMENTS AND EXPENSE REDUCTION | | $(10,325,789) | |
| Net expenses | | | $104,694,653 |
| Net investment income (loss) | | | (61,634,593) |
| Realized and Unrealized Gain (Loss) on Investments, Futures Contracts and Foreign Currency Transactions: | | | |
| Net realized gain on investments (including realized gain/(loss) of $15,538 on sales of investments in affiliated holdings and $(22,737,917) on sales of investments in an affiliated company) | | | 666,497,660 |
| Net realized loss on foreign currency and foreign currency related transactions | | | (75,603) |
| Net realized loss on futures contracts | | | (3,257,901) |
| Net change in unrealized appreciation of investments (including change in unrealized appreciation of $335,021,088 on investments in affiliated companies and holdings) | | | 651,641,986 |
| Net change in unrealized appreciation/depreciation of translation of assets and liabilities in foreign currency | | | (280) |
| Net change in unrealized appreciation of futures contracts | | | (2,402,388) |
| Net realized and unrealized gain on investments, futures contracts and foreign currency transactions | | | 1,312,403,474 |
| Change in net assets resulting from operations | | | $1,250,768,881 |
See Notes which are an integral part of the Financial Statements
Annual Shareholder Report
Statement of Changes in Net Assets
| Year Ended October 31 | 2017 | 2016 |
| Increase (Decrease) in Net Assets | | |
| Operations: | | |
| Net investment income (loss) | $(61,634,593) | $(53,476,738) |
| Net realized gain on investments, futures contracts and foreign currency transactions | 663,164,156 | 488,465,551 |
| Net change in unrealized appreciation/depreciation of investments, futures contracts and translation of assets and liabilities in foreign currency | 649,239,318 | (358,401,340) |
| CHANGE IN NET ASSETS RESULTING FROM OPERATIONS | 1,250,768,881 | 76,587,473 |
| Distributions to Shareholders: | | |
| Distributions from net realized gain on investments, futures contracts and foreign currency transactions | | |
| Class A Shares | (131,522,749) | (223,507,536) |
| Class B Shares | (7,988,258) | (15,779,610) |
| Class C Shares | (37,855,213) | (66,305,492) |
| Class R Shares | (310,416,372) | (490,677,536) |
| CHANGE IN NET ASSETS RESULTING FROM DISTRIBUTIONS TO SHAREHOLDERS | (487,782,592) | (796,270,174) |
| Share Transactions: | | |
| Proceeds from sale of shares | 423,502,032 | 255,445,815 |
| Net asset value of shares issued to shareholders in payment of distributions declared | 456,661,373 | 742,894,469 |
| Cost of shares redeemed | (1,030,835,792) | (846,156,531) |
| CHANGE IN NET ASSETS RESULTING FROM SHARE TRANSACTIONS | (150,672,387) | 152,183,753 |
| Change in net assets | 612,313,902 | (567,498,948) |
| Net Assets: | | |
| Beginning of period | 4,986,302,244 | 5,553,801,192 |
| End of period (including accumulated net investment income (loss) of $(63,552,443) and $(59,730,474), respectively) | $5,598,616,146 | $4,986,302,244 |
See Notes which are an integral part of the Financial Statements
Annual Shareholder Report
Notes to Financial Statements
October 31, 2017
1. ORGANIZATION
Federated Equity Funds (the “Trust”) is registered under the Investment Company Act of 1940, as amended (the “Act”), as an open-end management investment company. The Trust consists of 11 portfolios. The financial statements included herein are only those of Federated Kaufmann Fund (the “Fund”), a diversified portfolio. The financial statements of the other portfolios are presented separately. The assets of each portfolio are segregated and a shareholder's interest is limited to the portfolio in which shares are held. Each portfolio pays its own expenses. The Fund offers five classes of shares: Class A Shares, Class B Shares, Class C Shares, Class R Shares and Institutional Shares. All shares of the Fund have equal rights with respect to voting, except on class-specific matters. The investment objective of the Fund is to provide capital appreciation.
On December 29, 2016, the Fund's Institutional Shares commenced operations.
On March 30, 2017, the Fund's T Share class became effective with the Securities and Exchange Commission (SEC), but is not yet offered for sale.
2. SIGNIFICANT ACCOUNTING POLICIES
The following is a summary of significant accounting policies consistently followed by the Fund in the preparation of its financial statements. These policies are in conformity with U.S. generally accepted accounting principles (GAAP).
Investment Valuation
In calculating its net asset value (NAV), the Fund generally values investments as follows:
| ■ | Equity securities listed on an exchange or traded through a regulated market system are valued at their last reported sale price or official closing price in their principal exchange or market. |
| ■ | Shares of other mutual funds or non-exchange-traded investment companies are valued based upon their reported NAVs. |
| ■ | Fixed-income securities are fair valued using price evaluations provided by a pricing service approved by the Trustees. |
| ■ | Derivative contracts listed on exchanges are valued at their reported settlement or closing price, except that options are valued at the mean of closing bid and asked quotations. |
| ■ | Over-the-counter (OTC) derivative contracts are fair valued using price evaluations provided by a pricing service approved by the Trustees. |
| ■ | For securities that are fair valued in accordance with procedures established by and under the general supervision of the Trustees, certain factors may be considered such as: the last traded or purchase price of the security, information obtained by contacting the issuer or dealers, analysis of the issuer's financial statements or other available documents, fundamental analytical data, the nature and duration of restrictions on disposition, the movement of the market in which the security is normally traded, public trading in similar securities or derivative contracts of the issuer or comparable issuers, movement of a relevant index, or other factors including but not limited to industry changes and relevant government actions. |
If any price, quotation, price evaluation or other pricing source is not readily available when the NAV is calculated, if the Fund cannot obtain price evaluations from a pricing service or from more than one dealer for an investment within a reasonable period of time as set forth in the Fund's valuation policies and procedures, or if information furnished by a pricing service,
Annual Shareholder Report
in the opinion of the valuation committee (“Valuation Committee”), is deemed not representative of the fair value of such security, the Fund uses the fair value of the investment determined in accordance with the procedures described below. There can be no assurance that the Fund could obtain the fair value assigned to an investment if it sold the investment at approximately the time at which the Fund determines its NAV per share.
Fair Valuation and Significant Events Procedures
The Trustees have ultimate responsibility for determining the fair value of investments for which market quotations are not readily available. The Trustees have appointed a Valuation Committee comprised of officers of the Fund, Federated Equity Management Company of Pennsylvania (“Adviser”) and certain of the Adviser's affiliated companies to assist in determining fair value and in overseeing the calculation of the NAV. The Trustees have also authorized the use of pricing services recommended by the Valuation Committee to provide fair value evaluations of the current value of certain investments for purposes of calculating the NAV. The Valuation Committee employs various methods for reviewing third-party pricing-service evaluations including periodic reviews of third-party pricing services' policies, procedures and valuation methods (including key inputs, methods, models and assumptions), transactional back-testing, comparisons of evaluations of different pricing services, and review of price challenges by the Adviser based on recent market activity. In the event that market quotations and price evaluations are not available for an investment, the Valuation Committee determines the fair value of the investment in accordance with procedures adopted by the Trustees. The Trustees periodically review and approve the fair valuations made by the Valuation Committee and any changes made to the procedures.
Factors considered by pricing services in evaluating an investment include the yields or prices of investments of comparable quality, coupon, maturity, call rights and other potential prepayments, terms and type, reported transactions, indications as to values from dealers and general market conditions. Some pricing services provide a single price evaluation reflecting the bid-side of the market for an investment (a “bid” evaluation). Other pricing services offer both bid evaluations and price evaluations indicative of a price between the prices bid and asked for the investment (a “mid” evaluation). The Fund normally uses bid evaluations for any U.S. Treasury and Agency securities, mortgage-backed securities and municipal securities. The Fund normally uses mid evaluations for any other types of fixed-income securities and any OTC derivative contracts. In the event that market quotations and price evaluations are not available for an investment, the fair value of the investment is determined in accordance with procedures adopted by the Trustees.
The Trustees also have adopted procedures requiring an investment to be priced at its fair value whenever the Adviser determines that a significant event affecting the value of the investment has occurred between the time as of which the price of the investment would otherwise be determined and the time as of which the NAV is computed. An event is considered significant if there is both an affirmative expectation that the investment's value will change in response to the event and a reasonable basis for quantifying the resulting change in value. Examples of significant events that may occur after the close of the principal market on which a security is traded, or after the time of a price evaluation provided by a pricing service or a dealer, include:
| ■ | With respect to securities traded principally in foreign markets, significant trends in U.S. equity markets or in the trading of foreign securities index futures contracts; |
| ■ | Political or other developments affecting the economy or markets in which an issuer conducts its operations or its securities are traded; |
Annual Shareholder Report
| ■ | Announcements concerning matters such as acquisitions, recapitalizations, litigation developments, or a natural disaster affecting the issuer's operations or regulatory changes or market developments affecting the issuer's industry. |
The Trustees have adopted procedures whereby the Valuation Committee uses a pricing service to determine the fair value of equity securities traded principally in foreign markets when the Adviser determines that there has been a significant trend in the U.S. equity markets or in index futures trading. For other significant events, the Fund may seek to obtain more current quotations or price evaluations from alternative pricing sources. If a reliable alternative pricing source is not available, the Fund will determine the fair value of the investment in accordance with the fair valuation procedures approved by the Trustees. The Trustees have ultimate responsibility for any fair valuations made in response to a significant event.
Repurchase Agreements
The Fund may invest in repurchase agreements for short-term liquidity purposes. It is the policy of the Fund to require the other party to a repurchase agreement to transfer to the Fund's custodian or sub-custodian eligible securities or cash with a market value (after transaction costs) at least equal to the repurchase price to be paid under the repurchase agreement. The eligible securities are transferred to accounts with the custodian or sub-custodian in which the Fund holds a “securities entitlement” and exercises “control” as those terms are defined in the Uniform Commercial Code. The Fund has established procedures for monitoring the market value of the transferred securities and requiring the transfer of additional eligible securities if necessary to equal at least the repurchase price. These procedures also allow the other party to require securities to be transferred from the account to the extent that their market value exceeds the repurchase price or in exchange for other eligible securities of equivalent market value.
The insolvency of the other party or other failure to repurchase the securities may delay the disposition of the underlying securities or cause the Fund to receive less than the full repurchase price. Under the terms of the repurchase agreement, any amounts received by the Fund in excess of the repurchase price and related transaction costs must be remitted to the other party.
The Fund may enter into repurchase agreements in which eligible securities are transferred into joint trading accounts maintained by the custodian or sub-custodian for investment companies and other clients advised by the Fund's Adviser and its affiliates. The Fund will participate on a pro rata basis with the other investment companies and clients in its share of the securities transferred under such repurchase agreements and in its share of proceeds from any repurchase or other disposition of such securities.
Investment Income, Gains and Losses, Expenses and Distributions
Investment transactions are accounted for on a trade-date basis. Realized gains and losses from investment transactions are recorded on an identified-cost basis. Interest income and expenses are accrued daily. Dividend income and distributions to shareholders are recorded on the ex-dividend date. Foreign dividends are recorded on the ex-dividend date or when the Fund is informed of the ex-dividend date. Distributions of net investment income, if any, are declared and paid annually. Non-cash dividends included in dividend income, if any, are recorded at fair value. Amortization/accretion of premium and discount is included in investment income. Investment income, realized and unrealized gains and losses, and certain fund-level expenses are allocated to each class based on relative average daily net assets, except that Class A Shares, Class B Shares, Class C Shares, Class R Shares and
Annual Shareholder Report
Institutional Shares may bear distribution services fees, other service fees and transfer agent fees unique to those classes. The detail of the total fund expense waivers, reimbursements and expense reduction of $10,325,792 is disclosed in various locations in Note 5 and Note 6. For the year ended October 31, 2017, transfer agent fees for the Fund were as follows:
| | Transfer Agent
Fees Incurred |
| Class A Shares | $1,357,003 |
| Class B Shares | 70,414 |
| Class C Shares | 331,477 |
| Class R Shares | 2,956,352 |
| Institutional Shares | 108,729 |
| TOTAL | $4,823,975 |
Dividends are declared separately for each class. No class has preferential dividend rights; differences in per share dividend rates are generally due to differences in separate class expenses.
Other Service Fees
The Fund may pay other service fees up to 0.25% of the average daily net assets of the Fund's Class A Shares, Class B Shares, Class C Shares and Class R Shares to unaffiliated financial intermediaries or to Federated Shareholder Services Company (FSSC) for providing services to shareholders and maintaining shareholder accounts. Financial intermediaries may include a company affiliated with management of Federated Investors, Inc. A financial intermediary affiliated with management of Federated Investors, Inc. received $8,060 of other service fees for the year ended October 31, 2017. Subject to the terms described in the Expense Limitation note, FSSC may voluntarily reimburse the Fund for other service fees. In addition, unaffiliated third-party financial intermediaries may waive other service fees. This waiver can be modified or terminated at any time. For the year ended October 31, 2017, other service fees for the Fund were as follows:
| | Other Service
Fees Incurred |
| Class A Shares | $3,309,834 |
| Class B Shares | 172,331 |
| Class C Shares | 810,872 |
| Class R Shares | 8,588,864 |
| TOTAL | $12,881,901 |
Federal Taxes
It is the Fund's policy to comply with the Subchapter M provision of the Internal Revenue Code and to distribute to shareholders each year substantially all of its income. Accordingly, no provision for federal income tax is necessary. As of and during the year ended October 31, 2017, the Fund did not have a liability for any uncertain tax positions. The Fund recognizes interest and penalties, if any, related to tax liabilities as income tax expense in the Statement of Operations. As of October 31, 2017, tax years 2014 through 2017 remain subject to examination by the Fund's major tax jurisdictions, which include the United States of America and the Commonwealth of Massachusetts.
Annual Shareholder Report
The Fund may be subject to taxes imposed by governments of countries in which it invests. Such taxes are generally based on either income or gains earned or repatriated. The Fund accrues and applies such taxes to net investment income, net realized gains and net unrealized gains as income and/or gains are earned.
When-Issued and Delayed-Delivery Transactions
The Fund may engage in when-issued or delayed-delivery transactions. The Fund records when-issued securities on the trade date and maintains security positions such that sufficient liquid assets will be available to make payment for the securities purchased. Securities purchased on a when-issued or delayed-delivery basis are marked to market daily and begin earning interest on the settlement date. Losses may occur on these transactions due to changes in market conditions or the failure of counterparties to perform under the contract.
Futures Contracts
The Fund purchases and sells financial futures contracts to manage cash flows and duration, enhance yield and to potentially reduce transaction costs. Upon entering into a financial futures contract with a broker, the Fund is required to deposit in a segregated account, either U.S. government securities or a specified amount of cash, which is shown as Restricted Cash in the Statement of Assets and Liabilities. Futures contracts are valued daily and unrealized gains or losses are recorded in a “variation margin” account. Daily, the Fund receives from or pays to the broker a specified amount of cash based upon changes in the variation margin account. When a contract is closed, the Fund recognizes a realized gain or loss. Futures contracts have market risks, including the risk that the change in the value of the contract may not correlate with the changes in the value of the underlying securities. There is minimal counterparty risk to the Fund since futures contracts are exchange traded and the exchange's clearinghouse, as counterparty to all exchange traded futures contracts, guarantees the futures contracts against default.
Futures contracts outstanding at period end are listed after the Fund's Portfolio of Investments.
The average notional value of short futures contracts held by the Fund throughout the period $39,638,206. This is based on amounts held as of each month-end throughout the fiscal period.
Foreign Exchange Contracts
The Fund enters into foreign exchange contracts for the delayed-delivery of securities or foreign currency exchange transactions. The Fund enters into foreign exchange contracts to protect assets against adverse changes in foreign currency exchange rates or exchange control regulations. Purchased contracts are used to acquire exposure to foreign currencies, whereas, contracts to sell are used to hedge the Fund's securities against currency fluctuations. Risks may arise upon entering into these transactions from the potential inability of counterparties to meet the terms of their commitments and from unanticipated movements in security prices or foreign exchange rates. The foreign exchange contracts are adjusted by the daily exchange rate of the underlying currency and any gains or losses are recorded for financial statement purposes as unrealized until the settlement date.
At October 31, 2017, the Fund had no outstanding foreign exchange contracts.
Annual Shareholder Report
Foreign Currency Translation
The accounting records of the Fund are maintained in U.S. dollars. All assets and liabilities denominated in foreign currencies are translated into U.S. dollars based on the rates of exchange of such currencies against U.S. dollars on the date of valuation. Purchases and sales of securities, income and expenses are translated at the rate of exchange quoted on the respective date that such transactions are recorded. The Fund does not isolate that portion of the results of operations resulting from changes in foreign exchange rates on investments from the fluctuations arising from changes in market prices of securities held. Such fluctuations are included with the net realized and unrealized gain or loss from investments.
Reported net realized foreign exchange gains or losses arise from sales of foreign currencies, currency gains or losses realized between the trade and settlement dates on securities transactions, the difference between the amounts of dividends, interest and foreign withholding taxes recorded on the Fund's books, and the U.S. dollar equivalent of the amounts actually received or paid. Net unrealized foreign exchange gains and losses arise from changes in the value of assets and liabilities other than investments in securities at fiscal year end, resulting from changes in the exchange rate.
Additional Disclosure Related to Derivative Instruments
| Fair Value of Derivative Instruments |
| | Liabilities |
| | Statement of
Assets and
Liabilities
Location | Fair
Value |
| Derivatives not accounted for as hedging instruments under ASC Topic 815 | | |
| Equity contracts | Payable for
daily variation margin
on futures contracts | $ 1,901,944* |
| * | Includes cumulative depreciation of futures contracts as reported in the footnotes to the Portfolio of Investments. Only the current day's variation margin is reported within the Statement of Assets and Liabilities. |
The Effect of Derivative Instruments on the Statement of Operations for the Year Ended October 31, 2017
| Amount of Realized Gain or (Loss) on Derivatives Recognized in Income |
| | Futures |
| Equity contracts | $(3,257,901) |
| Change in Unrealized Appreciation or (Depreciation) on Derivatives Recognized in Income |
| | Futures |
| Equity contracts | $(2,402,388) |
Annual Shareholder Report
Securities Lending
The Fund participates in a securities lending program providing for the lending of equity securities to qualified brokers. The Fund normally receives cash collateral for securities loaned that is invested in an affiliated money market fund or in short-term securities including repurchase agreements. Collateral is maintained at a minimum level of 100% of the market value of investments loaned, plus interest, if applicable. Earnings on collateral are allocated between the borrower of the security, the securities lending agent, as a fee for its services under the program and the Fund, according to agreed-upon rates.
Securities lending transactions are subject to Master Netting Agreements which are agreements between the Fund and its counterparties that provide for the net settlement of all transactions and collateral with the Fund, through a single payment, in the event of default or termination. Amounts presented on the Portfolio of Investments and Statement of Assets and Liabilities are not net settlement amount but gross. As indicated below, the cash collateral received by the Fund exceeds the market value of the securities loaned reducing the net settlement amount to zero. The chart below identifies the amount of collateral received as well as the market value of securities on loan. Additionally, the securities lending agreement executed by the Fund includes an indemnification clause. This clause stipulates that the borrower will reimburse the Fund for any losses as a result of any failure of the borrower to return equivalent securities to the Fund.
As of October 31, 2017, securities subject to this type of arrangement and related collateral were as follows:
Market Value of
Securities Loaned | Market Value
of Collateral |
| $137,962,364 | $145,562,751 |
Restricted Securities
The Fund may purchase securities which are considered restricted. Restricted securities are securities that either: (a) cannot be offered for public sale without first being registered, or being able to take advantage of an exemption from registration, under the Securities Act of 1933; or (b) are subject to contractual restrictions on public sales. In some cases, when a security cannot be offered for public sale without first being registered, the issuer of the restricted security has agreed to register such securities for resale, at the issuer's expense, either upon demand by the Fund or in connection with another registered offering of the securities. Many such restricted securities may be resold in the secondary market in transactions exempt from registration. Restricted securities may be determined to be liquid under criteria established by the Trustees. The Fund will not incur any registration costs upon such resales. The Fund's restricted securities, like other securities, are priced in accordance with procedures established by and under the general supervision of the Trustees.
Annual Shareholder Report
Additional information on restricted securities held at October 31, 2017, is as follows:
| Security | Acquisition Date | Cost | Market Value |
| Apollo Investment Fund V | 5/18/2001 | $0 | $186,607 |
| Expand Networks Ltd. | 9/22/2000 | $2,500,000 | $0 |
| FA Private Equity Fund IV LP | 3/4/2002 | $30,086 | $550,157 |
| Infrastructure Fund | 8/11/2000 | $404,496 | $0 |
| Latin Healthcare Fund | 11/28/2000 | $0 | $370,701 |
| Multiplex, Inc., Pfd., Series C | 2/22/2001 | $5,000,001 | $0 |
| Sensable Technologies, Inc. | 10/15/2004 | $0 | $0 |
Other
The preparation of financial statements in conformity with GAAP requires management to make estimates and assumptions that affect the amounts of assets, liabilities, expenses and revenues reported in the financial statements. Actual results could differ from those estimated. The Fund applies investment company accounting and reporting guidance.
3. SHARES OF BENEFICIAL INTEREST
The following tables summarize share activity:
| Year Ended October 31 | 2017 | 2016 |
| Class A Shares: | Shares | Amount | Shares | Amount |
| Shares sold | 22,918,998 | $123,706,638 | 28,264,942 | $146,448,199 |
| Shares issued to shareholders in payment of distributions declared | 24,884,485 | 123,178,204 | 39,186,697 | 207,689,494 |
| Shares redeemed | (87,970,074) | (472,371,747) | (71,611,243) | (368,169,456) |
| NET CHANGE RESULTING FROM CLASS A SHARE TRANSACTIONS | (40,166,591) | $(225,486,905) | (4,159,604) | $(14,031,763) |
| Year Ended October 31 | 2017 | 2016 |
| Class B Shares: | Shares | Amount | Shares | Amount |
| Shares sold | 1,539,328 | $7,027,438 | 2,183,122 | $9,770,900 |
| Shares issued to shareholders in payment of distributions declared | 1,824,313 | 7,716,845 | 3,296,319 | 15,261,958 |
| Shares redeemed | (6,528,548) | (30,090,278) | (8,220,325) | (36,834,370) |
| NET CHANGE RESULTING FROM CLASS B SHARE TRANSACTIONS | (3,164,907) | $(15,345,995) | (2,740,884) | $(11,801,512) |
Annual Shareholder Report
| Year Ended October 31 | 2017 | 2016 |
| Class C Shares: | Shares | Amount | Shares | Amount |
| Shares sold | 6,750,407 | $30,680,847 | 8,051,522 | $36,092,597 |
| Shares issued to shareholders in payment of distributions declared | 7,708,762 | 32,530,974 | 12,085,227 | 55,833,745 |
| Shares redeemed | (29,991,018) | (138,612,528) | (23,291,591) | (104,703,397) |
| NET CHANGE RESULTING FROM CLASS C SHARE TRANSACTIONS | (15,531,849) | $(75,400,707) | (3,154,842) | $(12,777,055) |
| Year Ended October 31 | 2017 | 2016 |
| Class R Shares: | Shares | Amount | Shares | Amount |
| Shares sold | 9,874,597 | $53,685,469 | 12,111,531 | $63,134,119 |
| Shares issued to shareholders in payment of distributions declared | 59,120,031 | 293,235,350 | 87,402,876 | 464,109,272 |
| Shares redeemed | (65,729,130) | (355,039,070) | (64,955,611) | (336,449,308) |
| NET CHANGE RESULTING FROM CLASS R SHARE TRANSACTIONS | 3,265,498 | $(8,118,251) | 34,558,796 | $190,794,083 |
| | Period Ended
10/31/20171 | Year Ended
10/31/2016 |
| Institutional Shares: | Shares | Amount | Shares | Amount |
| Shares sold | 38,657,532 | $208,401,640 | — | $— |
| Shares redeemed | (6,060,872) | (34,722,169) | — | — |
| NET CHANGE RESULTING FROM INSTITUTIONAL SHARES TRANSACTIONS | 32,596,660 | $173,679,471 | — | $— |
| NET CHANGE RESULTING FROM TOTAL FUND SHARE TRANSACTIONS | (23,001,189) | $(150,672,387) | 24,503,466 | $152,183,753 |
| 1 | Reflects operations for the period from December 29, 2016 (date of initial investment) to October 31, 2017. |
Redemption Fees
The Fund's Class R Shares imposes a redemption fee of 0.20% on the redemption price of the Fund's Class R Shares redeemed, if such shares were purchased after February 1, 1985. The redemption fee is applied to the Fund's Class R Shares expenses for providing redemption services, including, but not limited to: transfer agent fees, postage, printing, telephone and related employment costs. Excess fee proceeds, if any, are added to the Fund's assets. Shares acquired through employer-sponsored retirement plans will not be subject to the redemption fee. However, if shares are purchased for a retirement plan account through a broker, financial institution or other intermediary maintaining an omnibus account for the shares, the waiver may not apply. In addition, this waiver does not apply to individual retirement accounts, such as Traditional, Roth and SEP-IRAs. For the year ended October 31, 2017 and October 31, 2016, redemption fees of $558,359 and $527,125, respectively, were allocated to cover the cost of redemptions.
Annual Shareholder Report
4. FEDERAL TAX INFORMATION
The timing and character of income and capital gain distributions are determined in accordance with income tax regulations, which may differ from GAAP. These differences are due to differing treatments for foreign currency transactions, partnerships adjustments, net operating losses, passive foreign investment reclassifications and amortization adjustment for GAAP purposes.
For the year ended October 31, 2017, permanent differences identified and reclassified among the components of net assets were as follows:
| Increase (Decrease) |
| Paid-In Capital | Undistributed
Net Investment
Income (Loss) | Accumulated
Net Realized
Gain (Loss) |
| $(4,613,649) | $57,812,624 | $(53,198,975) |
Net investment income (loss), net realized gains (losses), and net assets were not affected by this reclassification.
The tax character of distributions as reported on the Statement of Changes in Net Assets for the years ended October 31, 2017 and 2016, was as follows:
| | 2017 | 2016 |
| Long-term capital gains | $487,782,592 | $796,270,174 |
As of October 31, 2017, the components of distributable earnings on a tax-basis were as follows:
| Net unrealized appreciation | $1,936,750,340 |
| Undistributed long-term capital gains | $610,259,429 |
| Ordinary loss deferrals | $(53,948,114) |
The difference between book-basis and tax-basis net unrealized appreciation/depreciation is attributable to differing treatments for passive foreign investment company adjustments, the deferral of losses on wash sales, partnerships adjustments, mark-to-market of futures contracts and amortization adjustment for GAAP purposes.
At October 31, 2017, the cost of investments for federal tax purposes was $3,807,687,072. The net unrealized appreciation of investments for federal tax purposes was $1,936,750,584. This consists of net unrealized appreciation from investments for those securities having an excess of value over cost of $1,992,410,094 and net unrealized depreciation from investments for those securities having an excess of cost over value of $55,659,510. The amounts presented are inclusive of derivative contracts.
Under current tax rules, a late-year ordinary loss may be deferred, in whole or in part, and treated as occurring on the first day of the following fiscal year. As of October 31, 2017, for federal income tax purposes, a late year ordinary loss of $53,948,114 was deferred to November 1, 2017.
Annual Shareholder Report
5. INVESTMENT ADVISER FEE AND OTHER TRANSACTIONS WITH AFFILIATES
Investment Adviser Fee
The advisory agreement between the Fund and the Adviser provides for an annual fee equal to 1.30% of the Fund's average daily net assets. Pursuant to the settlement of certain litigation, the Adviser has agreed, for a period continuing through June 30, 2022, to waive its investment advisory fee so that such fee will not exceed 1.275%. Also, as part of the settlement agreement, effective July 1, 2012 and continuing through June 30, 2022, the Adviser has agreed to further waive the advisory fee by an additional 0.02%, 0.04%, 0.06% or 0.07% if the Fund's net assets exceed eight, nine, ten or twelve billion dollars, respectively. Subject to the terms described in the Expense Limitation note, the Adviser may voluntarily choose to waive any portion of its fee. For the year ended October 31, 2017, the Adviser waived $468,770 of its fee. The Adviser has agreed to reimburse the Fund for certain investment adviser fees as a result of transactions in other affiliated investment companies. For the year ended October 31, 2017, the Adviser reimbursed $869,127.
Certain of the Fund's assets are managed by Federated Global Investment Management Corp. (the “Sub-Adviser”). Under the terms of a sub-advisory agreement between the Adviser and the Sub-Adviser, the Sub-Adviser receives an allocable portion of the Fund's adviser fee. The fee is paid by the Adviser out of its resources and is not an incremental Fund expense. For the year ended October 31, 2017, the Sub-Adviser earned a fee of $56,272,955.
Administrative Fee
Federated Administrative Services (FAS), under the Administrative Services Agreement, provides the Fund with administrative personnel and services. For purposes of determining the appropriate rate breakpoint, “Investment Complex” is defined as all of the Federated Funds subject to a fee under the Administrative Services Agreement. The fee paid to FAS is based on the average daily net assets of the Investment Complex as specified below:
| Administrative Fee | Average Daily Net Assets
of the Investment Complex |
| 0.100% | on assets up to $50 billion |
| 0.075% | on assets over $50 billion |
Subject to the terms described in the Expense Limitation note, FAS may voluntarily choose to waive any portion of its fee. For the year ended October 31, 2017, the annualized fee paid to FAS was 0.079% of average daily net assets of the Fund.
Prior to September 1, 2017, the breakpoints of the Administrative Fee paid to FAS, described above, were:
| Administrative Fee | Average Daily Net Assets
of the Investment Complex |
| 0.150% | on the first $5 billion |
| 0.125% | on the next $5 billion |
| 0.100% | on the next $10 billion |
| 0.075% | on assets in excess of $20 billion |
In addition, FAS may charge certain out-of-pocket expenses to the Fund.
Annual Shareholder Report
Distribution Services Fee
The Fund has adopted a Distribution Plan (the “Plan”) pursuant to Rule 12b-1 under the Act. Under the terms of the Plan, the Fund will compensate Federated Securities Corp. (FSC), the principal distributor, from the daily net assets of the Fund's Class A Shares, Class B Shares, Class C Shares and Class R Shares to finance activities intended to result in the sale of these shares. The Plan provides that the Fund may incur distribution expenses at the following percentages of average daily net assets annually, to compensate FSC:
| Share Class Name | Percentage of Average Daily
Net Assets of Class |
| Class A Shares | 0.25% |
| Class B Shares | 0.75% |
| Class C Shares | 0.75% |
| Class R Shares | 0.50% |
Subject to the terms described in the Expense Limitation note, FSC may voluntarily choose to waive any portion of its fee. For the year ended October 31, 2017, distribution services fees for the Fund were as follows:
| | Distribution Services
Fees Incurred | Distribution Services
Fees Waived |
| Class A Shares | $3,324,118 | $(251,472) |
| Class B Shares | 516,995 | — |
| Class C Shares | 2,432,617 | — |
| Class R Shares | 17,227,402 | (8,708,767) |
| TOTAL | $23,501,132 | $(8,960,239) |
When FSC receives fees, it may pay some or all of them to financial intermediaries whose customers purchase shares. For the year ended October 31, 2017, FSC retained $11,388,594 of fees paid by the Fund.
Sales Charges
Front-end sales charges and contingent deferred sales charges (CDSC) do not represent expenses of the Fund. They are deducted from the proceeds of sales of Fund shares prior to investment or from redemption proceeds prior to remittance, as applicable. For the year ended October 31, 2017, FSC retained $76,969 in sales charges from the sale of Class A Shares. FSC also retained $48 of CDSC relating to redemptions of Class A Shares, $146,085 relating to redemptions of Class B Shares and $12,142 relating to redemptions of Class C Shares.
Other Service Fees
For the year ended October 31, 2017, FSSC received $6,276,098 of the other service fees disclosed in Note 2.
Annual Shareholder Report
Commitments and Contingencies
In the course of pursuing its investment objective, the Fund may invest in limited partnerships and limited liability companies. These entities often require the Fund to commit to a total dollar amount to be invested. The actual investments are usually made in installments over a period of time. At October 31, 2017 the Fund had total commitments to limited partnerships and limited liability companies of $21,000,000; of this amount, $20,304,656 was actually invested by the Fund leaving the Fund contingently liable for additional investments of $695,344.
Expense Limitation
The Adviser and certain of its affiliates (which may include FSC, FAS and FSSC) on their own initiative have agreed to waive certain amounts of their respective fees and/or reimburse expenses. Total annual fund operating expenses (as shown in the financial highlights, excluding interest expense, extraordinary expenses, line of credit expenses and proxy-related expenses paid by the Fund, if any) paid by the Fund's Class A Shares, Class B Shares, Class C Shares, Class R Shares and Institutional Shares (after the voluntary waivers and/or reimbursements) will not exceed 1.95%, 2.50%, 2.50%, 1.95% and 1.50% (the “Fee Limit”), respectively, up to but not including the later of (the “Termination Date”): (a) January 1, 2019; or (b) the date of the Fund's next effective Prospectus. While the Adviser and its applicable affiliates currently do not anticipate terminating or increasing these arrangements prior to the Termination Date, these arrangements may only be terminated or the Fee Limit increased prior to the Termination Date with the agreement of the Trustees.
Interfund Transactions
During the year ended October 31, 2017, the Fund engaged in purchase and sale transactions with funds that have a common investment adviser (or affiliated investment advisers), common Directors/Trustees and/or common Officers. These purchase and sale transactions complied with Rule 17a-7 under the Act and amounted to $1,045,007 and $4,829,236, respectively.
General
Certain Officers and Trustees of the Fund are Officers and Directors or Trustees of certain of the above companies. To efficiently facilitate payment, Directors'/Trustees' fees and certain expenses related to conducting meetings of the Directors/Trustees and other miscellaneous expenses are paid by an affiliate of the Adviser which in due course are reimbursed by the Fund. These expenses related to conducting meetings of the Directors/Trustees and other miscellaneous expenses may be included in Accrued and Miscellaneous Expenses on the Statement of Assets and Liabilities and Statement of Operations, respectively.
6. EXPENSE REDUCTION
The Fund directs portfolio trades to a broker that in turn pays a portion of the Fund's operating expenses. For the year ended October 31, 2017, the Fund's expenses were reduced by $27,653 under these arrangements.
7. INVESTMENT TRANSACTIONS
Purchases and sales of investments, excluding long-term U.S. government securities and short-term obligations, for the year ended October 31, 2017, were as follows:
| Purchases | $2,154,258,730 |
| Sales | $3,063,459,943 |
Annual Shareholder Report
8. CONCENTRATION OF RISK
The Fund invests in securities of non-U.S. issuers. Political or economic developments may have an effect on the liquidity and volatility of portfolio securities and currency holdings.
At October 31, 2017, the diversification of countries was as follows:
| Country | Percentage of
Net Assets |
| United States | 84.6% |
| China | 2.9% |
| Belgium | 2.4% |
| Italy | 2.0% |
| Denmark | 1.5% |
| Singapore | 1.3% |
| Germany | 1.1% |
| Netherlands | 0.9% |
| Canada | 0.8% |
| Spain | 0.8% |
| United Kingdom | 0.8% |
| Israel | 0.7% |
| Cayman Islands | 0.6% |
| Norway | 0.6% |
| Bermuda | 0.5% |
| Ireland | 0.4% |
| Luxembourg | 0.3% |
| Switzerland | 0.3% |
| France | 0.1% |
9. LINE OF CREDIT
The Fund participates with certain other Federated Funds, on a several basis, in an up to $500,000,000 unsecured, 364-day, committed, revolving line of credit (LOC) agreement. The LOC was made available to finance temporarily the repurchase or redemption of shares of the Fund, failed trades, payment of dividends, settlement of trades and for other short-term, temporary or emergency general business purposes. The Fund cannot borrow under the LOC if an inter-fund loan is outstanding. The Fund's ability to borrow under the LOC also is subject to the limitations of the Act and various conditions precedent that must be satisfied before the Fund can borrow. Loans under the LOC are charged interest at a fluctuating rate per annum equal to the highest, on any day, of (a) (i) the federal funds effective rate, (ii) the one month London Interbank Offered Rate (LIBOR), and (iii) 0.0%, plus (b) a margin. The LOC also requires the Fund to pay, quarterly in arrears and at maturity, its pro rata share of a commitment fee based on the amount of the lenders' commitment that has not been utilized. As of October 31, 2017, the Fund had no outstanding loans. During the year ended October 31, 2017, the Fund did not utilize the LOC.
Annual Shareholder Report
10. INTERFUND LENDING
Pursuant to an Exemptive Order issued by the Securities and Exchange Commission, the Fund, along with other funds advised by subsidiaries of Federated Investors, Inc., may participate in an interfund lending program. This program provides an alternative credit facility allowing the Fund to borrow from other participating affiliated funds. As of October 31, 2017, there were no outstanding loans. During the year ended October 31, 2017, the program was not utilized.
11. SUBSEQUENT EVENTS
Effective December 1, 2017, Class B Shares will be closed to new accounts and to new investors.
Effective February 1, 2018, Class B Shares will be closed to exchanges from Class B Shares of other Federated Funds and to new purchases made by existing shareholders (excluding reinvestment of dividends and capital gains).
Annual Shareholder Report
Report of Independent Registered Public Accounting Firm
TO THE BOARD OF Trustees OF Federated Equity Funds AND SHAREHOLDERS OF Federated Kaufmann Fund:
We have audited the accompanying statement of assets and liabilities of Federated Kaufmann Fund (the “Fund”) (one of the portfolios constituting Federated Equity Funds), including the portfolio of investments, as of October 31, 2017, and the related statement of operations for the year then ended, the statement of changes in net assets for each of the two years in the period then ended and the financial highlights for each of the years or periods indicated therein. These financial statements and financial highlights are the responsibility of the Fund's management. Our responsibility is to express an opinion on these financial statements and financial highlights based on our audits.
We conducted our audits in accordance with standards of the Public Company Accounting Oversight Board (United States). Those standards require that we plan and perform the audit to obtain reasonable assurance about whether the financial statements and financial highlights are free of material misstatement. We were not engaged to perform an audit of the Fund's internal control over financial reporting. Our audits included consideration of internal control over financial reporting as a basis for designing audit procedures that are appropriate in the circumstances, but not for the purpose of expressing an opinion on the effectiveness of the Fund's internal control over financial reporting. Accordingly, we express no such opinion. An audit also includes examining, on a test basis, evidence supporting the amounts and disclosures in the financial statements and financial highlights, assessing the accounting principles used and significant estimates made by management, and evaluating the overall financial statement presentation. Our procedures included confirmation of securities owned as of October 31, 2017, by correspondence with the custodian and others or by other appropriate auditing procedures where replies from others were not received. We believe that our audits provide a reasonable basis for our opinion.
In our opinion, the financial statements and financial highlights referred to above present fairly, in all material respects, the financial position of the Federated Kaufmann Fund, a portfolio of Federated Equity Funds, at October 31, 2017, the results of its operations for the year then ended, the changes in its net assets for each of the two years in the period then ended and the financial highlights for each of the years or periods indicated therein, in conformity with U.S. generally accepted accounting principles.
Boston, Massachusetts
December 22, 2017
Annual Shareholder Report
Shareholder Expense Example (unaudited)
As a shareholder of the Fund, you incur two types of costs: (1) transaction costs, including sales charges (loads) on purchase or redemption payments; and (2) ongoing costs, including management fees and to the extent applicable, distribution (12b-1) fees and/or other service fees and other Fund expenses. This Example is intended to help you to understand your ongoing costs (in dollars) of investing in the Fund and to compare these costs with the ongoing costs of investing in other mutual funds. It is based on an investment of $1,000 invested at the beginning of the period and held for the entire period from May 1, 2017 to October 31, 2017.
ACTUAL EXPENSES
The first section of the table below provides information about actual account values and actual expenses. You may use the information in this section, together with the amount you invested, to estimate the expenses that you incurred over the period. Simply divide your account value by $1,000 (for example, an $8,600 account value divided by $1,000 = 8.6), then multiply the result by the number in the first section under the heading entitled “Expenses Paid During Period” to estimate the expenses attributable to your investment during this period.
HYPOTHETICAL EXAMPLE FOR COMPARISON PURPOSES
The second section of the table below provides information about hypothetical account values and hypothetical expenses based on the Fund's actual expense ratio and an assumed rate of return of 5% per year before expenses, which is not the Fund's actual return. Thus, you should not use the hypothetical account values and expenses to estimate the actual ending account balance or your expenses for the period. Rather, these figures are required to be provided to enable you to compare the ongoing costs of investing in the Fund with other funds. To do so, compare this 5% hypothetical example with the 5% hypothetical examples that appear in the shareholder reports of the other funds.
Annual Shareholder Report
Please note that the expenses shown in the table are meant to highlight your ongoing costs only and do not reflect any transaction costs, such as sales charges (loads) on purchase or redemption payments. Therefore, the second section of the table is useful in comparing ongoing costs only, and will not help you determine the relative total costs of owning different funds. In addition, if these transaction costs were included, your costs would have been higher.
| | Beginning
Account Value
5/1/2017 | Ending
Account Value
10/31/2017 | Expenses Paid
During Period1 |
| Actual: | | | |
| Class A Shares | $1,000 | $1,114.00 | $10.44 |
| Class B Shares | $1,000 | $1,112.30 | $13.15 |
| Class C Shares | $1,000 | $1,110.20 | $13.14 |
| Class R Shares | $1,000 | $1,113.80 | $10.44 |
| Institutional Shares | $1,000 | $1,117.20 | $7.84 |
| Hypothetical (assuming a 5% return before expenses): | | | |
| Class A Shares | $1,000 | $1,015.30 | $9.96 |
| Class B Shares | $1,000 | $1,012.70 | $12.53 |
| Class C Shares | $1,000 | $1,012.70 | $12.53 |
| Class R Shares | $1,000 | $1,015.30 | $9.96 |
| Institutional Shares | $1,000 | $1,017.80 | $7.48 |
| 1 | Expenses are equal to the Fund's annualized net expense ratios, multiplied by the average account value over the period, multiplied by 184/365 (to reflect the one-half-year period). The annualized net expense ratios are as follows: |
| | |
| Class A Shares | 1.96% |
| Class B Shares | 2.47% |
| Class C Shares | 2.47% |
| Class R Shares | 1.96% |
| Institutional Shares | 1.47% |
Annual Shareholder Report
In Memoriam
With profound sadness, Federated announces the passing of John F. (“Jack”) Donahue and John W. (“John”) McGonigle. They will be greatly missed.
Jack Donahue
(Former Chairman and President, and Emeritus Director/Trustee, of the Federated Funds, and Founder, Former Chairman, President and Chief Executive Officer, and Chairman Emeritus, of Federated Investors, Inc.)
Jack Donahue, along with Richard B. Fisher, founded Federated in 1955 and served as a leader and member of the Boards of Directors/Trustees of the Federated Funds and the Board of Directors of Federated Investors, Inc. Mr. Donahue was a family man of deep faith with exemplary character and fealty, who served his religion, family, community, and the Federated Funds and Federated, as well as their shareholders, officers and employees, with distinction. His integrity, intelligence, and keen sense of fiduciary duty, coupled with his faith, family and background as a West Point graduate and Strategic Air Command B-29 pilot, served as a foundation for his strong business acumen and leadership. Among his many achievements, Mr. Donahue's steadfast and innovative leadership of the Federated Funds and Federated, as well as within the investment management industry, led to the birth of money market funds in the 1970s and their growth as an innovative, efficient and effective cash management vehicle throughout the 1980s, 1990s, 2000s and beyond. Federated expresses deep gratitude to Mr. Donahue for his inspiring leadership, distinguished service and contributions as a husband, father, founder, Board member and officer, colleague and friend.
John McGonigle
(Former Secretary of the Federated Funds, Former Director, Secretary and Chief Legal Officer of Federated Investors, Inc.)
John McGonigle served the Federated Funds and their respective Boards with distinction for more than 50 years as Fund Secretary and also served as Director for several closed-end funds. Mr. McGonigle was a gifted lawyer and wise counselor with a genial presence, keen intellect and convivial demeanor. A man of deep faith, he was a devoted husband, father and grandfather. A graduate of Duquesne University School of Law, Mr. McGonigle served as an officer in the U.S. Army for two years, achieving the rank of Captain. He also served on the staff of the Securities and Exchange Commission before joining Federated in 1966. Among many professional accomplishments, Mr. McGonigle helped fashion the regulatory foundation for money market funds, established Federated's first offshore funds in Ireland, and represented Federated on the Board of Governors of the Investment Company Institute where he was a member of the Executive Committee. Federated expresses deep gratitude for Mr. McGonigle and his impact on his family, friends, the community, and the mutual fund industry.
Annual Shareholder Report
Board of Trustees and Trust Officers
The Board of Trustees is responsible for managing the Trust business affairs and for exercising all the Trust powers except those reserved for the shareholders. The following tables give information about each Trustee and the senior officers of the Fund. Where required, the tables separately list Trustees who are “interested persons” of the Fund (i.e., “Interested” Trustees) and those who are not (i.e., “Independent” Trustees). Unless otherwise noted, the address of each person listed is Federated Investors Tower, 1001 Liberty Avenue, Pittsburgh, PA 15222. The address of all Independent Trustees listed is 4000 Ericsson Drive, Warrendale, PA 15086-7561; Attention: Mutual Fund Board. As of December 31, 2016, the Trust comprised 14 portfolio(s), and the Federated Fund Family consisted of 40 investment companies (comprising 124 portfolios). Unless otherwise noted, each Officer is elected annually. Unless otherwise noted, each Trustee oversees all portfolios in the Federated Fund Family and serves for an indefinite term. The Fund's Statement of Additional Information includes additional information about Trust Trustees and is available, without charge and upon request, by calling 1-800-341-7400.
Interested TRUSTEES Background
Name
Birth Date
Positions Held with Trust
Date Service Began | Principal Occupation(s) for Past Five Years,
Other Directorships Held and Previous Position(s) |
J. Christopher Donahue*
Birth Date: April 11, 1949
President and Trustee
Indefinite Term
Began serving: January 2000 | Principal Occupations: Principal Executive Officer and President of certain of the Funds in the Federated Fund Family; Director or Trustee of the Funds in the Federated Fund Family; President, Chief Executive Officer and Director, Federated Investors, Inc.; Chairman and Trustee, Federated Investment Management Company; Trustee, Federated Investment Counseling; Chairman and Director, Federated Global Investment Management Corp.; Chairman and Trustee, Federated Equity Management Company of Pennsylvania; Trustee, Federated Shareholder Services Company; Director, Federated Services Company.
Previous Positions: President, Federated Investment Counseling; President and Chief Executive Officer, Federated Investment Management Company, Federated Global Investment Management Corp. and Passport Research, Ltd; Chairman, Passport Research, Ltd. |
Annual Shareholder Report
Name
Birth Date
Positions Held with Trust
Date Service Began | Principal Occupation(s) for Past Five Years,
Other Directorships Held and Previous Position(s) |
John B. Fisher*
Birth Date: May 16, 1956
Trustee
Indefinite Term
Began serving: May 2016 | Principal Occupations: Principal Executive Officer and President of certain of the Funds in the Federated Fund Family; Director or Trustee of certain of the Funds in the Federated Fund Family; Vice President, Federated Investors, Inc.; President, Director/Trustee and CEO, Federated Advisory Services Company, Federated Equity Management Company of Pennsylvania, Federated Global Investment Management Corp., Federated Investment Counseling, Federated Investment Management Company; President of some of the Funds in the Federated Fund Complex and Director, Federated Investors Trust Company.
Previous Positions: President and Director of the Institutional Sales Division of Federated Securities Corp.; President and Director of Federated Investment Counseling; President and CEO of Passport Research, Ltd.; Director, Edgewood Securities Corp.; Director, Federated Services Company; Director, Federated Investors, Inc.; Chairman and Director, Southpointe Distribution Services, Inc. and President, Technology, Federated Services Company. |
| * | Reasons for “interested” status: J. Christopher Donahue and John B. Fisher are interested due to their beneficial ownership of shares of Federated Investors, Inc. and due to positions they hold with Federated and its subsidiaries. |
INDEPENDENT TRUSTEES Background
Name
Birth Date
Positions Held with Trust
Date Service Began | Principal Occupation(s) for Past Five Years,
Other Directorships Held, Previous Position(s) and Qualifications |
John T. Collins
Birth Date: January 24, 1947
Trustee
Indefinite Term
Began serving: October 2013 | Principal Occupations: Director or Trustee of the Federated Fund Family; formerly, Chairman and CEO, The Collins Group, Inc. (a private equity firm) (Retired).
Other Directorships Held: Director, Current Chair of the Compensation Committee, KLX Corp.
Qualifications: Mr. Collins has served in several business and financial management roles and directorship positions throughout his career. Mr. Collins previously served as Chairman and CEO, The Collins Group, Inc. (a private equity firm). Mr. Collins serves as Chairman Emeriti, Bentley University. Mr. Collins previously served as Director and Audit Committee Member, Bank of America Corp.; Director, FleetBoston Financial Corp.; and Director, Beth Israel Deaconess Medical Center (Harvard University Affiliate Hospital). |
Annual Shareholder Report
Name
Birth Date
Positions Held with Trust
Date Service Began | Principal Occupation(s) for Past Five Years,
Other Directorships Held, Previous Position(s) and Qualifications |
G. Thomas Hough
Birth Date: February 28, 1955
Trustee
Indefinite Term
Began serving: August 2015 | Principal Occupations: Director or Trustee of the Federated Fund Family; formerly, Vice Chair, Ernst & Young LLP (public accounting firm) (Retired).
Other Directorships Held: Director, Chair of the Audit Committee, Governance Committee, Publix Super Markets, Inc.; Director, Member of the Audit Committee and Technology Committee of Equifax, Inc.
Qualifications: Mr. Hough has served in accounting, business management and directorship positions throughout his career. Mr. Hough most recently held the position of Americas Vice Chair of Assurance with Ernst & Young LLP (public accounting firm). Mr. Hough is an Executive Committee member of the United States Golf Association, he serves on the President's Cabinet and Business School Board of Visitors for the University of Alabama and is on the Business School Board of Visitors for Wake Forest University. |
Maureen Lally-Green
Birth Date: July 5, 1949
Trustee
Indefinite Term
Began serving: August 2009 | Principal Occupations: Director or Trustee of the Federated Fund Family; Dean of the Duquesne University School of Law; Adjunct Professor of Law, Duquesne University School of Law; formerly, Interim Dean of the Duquesne University School of Law; Associate General Secretary and Director, Office of Church Relations, Diocese of Pittsburgh.
Other Directorships Held: Director, CONSOL Energy Inc.
Qualifications: Judge Lally-Green has served in various legal and business roles and directorship positions throughout her career. Judge Lally-Green previously served as: Associate General Secretary, Diocese of Pittsburgh; a member of the Superior Court of Pennsylvania; and as a Professor of Law, Duquesne University School of Law. Judge Lally-Green also currently holds the positions on either a public or not for profit Board of Directors as follows: Director and Chair, UPMC Mercy Hospital; Regent, St. Vincent Seminary; Director and Vice Chair, Our Campaign for the Church Alive!, Inc.; Director, Saint Vincent College; Member, Pennsylvania State Board of Education (public); and Director and Chair, Cardinal Wuerl North Catholic High School, Inc. Judge Lally-Green has held the positions of: Director, Auberle; Director, Epilepsy Foundation of Western and Central Pennsylvania; Director, Ireland Institute of Pittsburgh; Director, Saint Thomas More Society; Director, Catholic High Schools of the Diocese of Pittsburgh, Inc.; and Director, Pennsylvania Bar Institute. |
Peter E. Madden
Birth Date: March 16, 1942
Trustee
Indefinite Term
Began serving: November 1991 | Principal Occupation: Director or Trustee, and Chair of the Board of Directors or Trustees, of the Federated Fund Family; Retired.
Other Directorships Held: None.
Qualifications: Mr. Madden has served in several business management, mutual fund services and directorship positions throughout his career. Mr. Madden previously served as President, Chief Operating Officer and Director, State Street Bank and Trust Company (custodian bank) and State Street Corporation (financial services). He was Director, VISA USA and VISA International and Chairman and Director, Massachusetts Bankers Association. Mr. Madden served as Director, Depository Trust Corporation and Director, The Boston Stock Exchange. Mr. Madden also served as a Representative to the Commonwealth of Massachusetts General Court. |
Annual Shareholder Report
Name
Birth Date
Positions Held with Trust
Date Service Began | Principal Occupation(s) for Past Five Years,
Other Directorships Held, Previous Position(s) and Qualifications |
Charles F. Mansfield, Jr.
Birth Date: April 10, 1945
Trustee
Indefinite Term
Began serving: January 1999 | Principal Occupations: Director or Trustee of the Federated Fund Family; Management Consultant.
Other Directorships Held: None.
Qualifications: Mr. Mansfield has served as a Marine Corps officer and in several banking, business management, educational roles and directorship positions throughout his long career. He remains active as a Management Consultant. |
Thomas M. O'Neill
Birth Date: June 14, 1951
Trustee
Indefinite Term
Began serving: October 2006 | Principal Occupations: Director or Trustee, Chair of the Audit Committee of the Federated Fund Family; Sole Proprietor, Navigator Management Company (investment and strategic consulting).
Other Directorships Held: None.
Qualifications: Mr. O'Neill has served in several business, mutual fund and financial management roles and directorship positions throughout his career. Mr. O'Neill serves as Director, Medicines for Humanity and Director, The Golisano Children's Museum of Naples, Florida. Mr. O'Neill previously served as Chief Executive Officer and President, Managing Director and Chief Investment Officer, Fleet Investment Advisors; President and Chief Executive Officer, Aeltus Investment Management, Inc.; General Partner, Hellman, Jordan Management Co., Boston, MA; Chief Investment Officer, The Putnam Companies, Boston, MA; Credit Analyst and Lending Officer, Fleet Bank; Director and Consultant, EZE Castle Software (investment order management software); and Director, Midway Pacific (lumber). |
P. Jerome Richey
Birth Date: February 23, 1949
Trustee
Indefinite Term
Began serving: October 2013 | Principal Occupations: Director or Trustee of the Federated Fund Family; Management Consultant; formerly, Senior Vice Chancellor and Chief Legal Officer, University of Pittsburgh and Executive Vice President and Chief Legal Officer, CONSOL Energy Inc.
Other Directorships Held: None.
Qualifications: Mr. Richey has served in several business and legal management roles and directorship positions throughout his career. Mr. Richey most recently held the positions of Senior Vice Chancellor and Chief Legal Officer, University of Pittsburgh. Mr. Richey previously served as Chairman of the Board, Epilepsy Foundation of Western Pennsylvania and Chairman of the Board, World Affairs Council of Pittsburgh. Mr. Richey previously served as Chief Legal Officer and Executive Vice President, CONSOL Energy Inc.; and Board Member, Ethics Counsel and Shareholder, Buchanan Ingersoll & Rooney PC (a law firm). |
Annual Shareholder Report
Name
Birth Date
Positions Held with Trust
Date Service Began | Principal Occupation(s) for Past Five Years,
Other Directorships Held, Previous Position(s) and Qualifications |
John S. Walsh
Birth Date: November 28, 1957
Trustee
Indefinite Term
Began serving: January 1999 | Principal Occupations: Director or Trustee of the Federated Fund Family; President and Director, Heat Wagon, Inc. (manufacturer of construction temporary heaters); President and Director, Manufacturers Products, Inc. (distributor of portable construction heaters); President, Portable Heater Parts, a division of Manufacturers Products, Inc.
Other Directorships Held: None.
Qualifications: Mr. Walsh has served in several business management roles and directorship positions throughout his career. Mr. Walsh previously served as Vice President, Walsh & Kelly, Inc. (paving contractors). |
OFFICERS
Name
Birth Date
Address
Positions Held with Trust
Date Service Began | Principal Occupation(s) for Past Five Years
and Previous Position(s) |
Lori A. Hensler
Birth Date: January 6, 1967
TREASURER
Officer since: April 2013 | Principal Occupations: Principal Financial Officer and Treasurer of the Federated Fund Family; Senior Vice President, Federated Administrative Services; Financial and Operations Principal for Federated Securities Corp. and Edgewood Services, Inc.; and Assistant Treasurer, Federated Investors Trust Company. Ms. Hensler has received the Certified Public Accountant designation.
Previous Positions: Controller of Federated Investors, Inc.; Senior Vice President and Assistant Treasurer, Federated Investors Management Company; Treasurer, Federated Investors Trust Company; Assistant Treasurer, Federated Administrative Services, Federated Administrative Services, Inc., Federated Securities Corp., Edgewood Services, Inc., Federated Advisory Services Company, Federated Equity Management Company of Pennsylvania, Federated Global Investment Management Corp., Federated Investment Counseling, Federated Investment Management Company, Passport Research, Ltd., and Federated MDTA, LLC; Financial and Operations Principal for Federated Securities Corp., Edgewood Services, Inc. and Southpointe Distribution Services, Inc. |
Richard B. Fisher
Birth Date: May 17, 1923
Vice President
Officer since: April 1984 | Principal Occupations: Vice Chairman or Vice President of some of the Funds in the Federated Fund Family; Vice Chairman, Federated Investors, Inc.; Chairman, Federated Securities Corp.
Previous Positions: President and Director or Trustee of some of the Funds in the Federated Fund Family; Executive Vice President, Federated Investors, Inc.; Director and Chief Executive Officer, Federated Securities Corp. |
Annual Shareholder Report
Name
Birth Date
Address
Positions Held with Trust
Date Service Began | Principal Occupation(s) for Past Five Years
and Previous Position(s) |
Peter J. Germain
Birth Date: September 3, 1959
CHIEF LEGAL OFFICER, SECRETARY and EXECUTIVE VICE PRESIDENT
Officer since: January 2005
| Principal Occupations: Mr. Germain is Chief Legal Officer, Secretary and Executive Vice President of the Federated Fund Family. He is General Counsel, Chief Legal Officer, Secretary and Executive Vice President, Federated Investors, Inc.; Trustee and Senior Vice President, Federated Investors Management Company; Trustee and President, Federated Administrative Services; Director and President, Federated Administrative Services, Inc.; Director and Vice President, Federated Securities Corp.; Director and Secretary, Federated Private Asset Management, Inc.; Secretary, Federated Shareholder Services Company; and Secretary, Retirement Plan Service Company of America. Mr. Germain joined Federated in 1984 and is a member of the Pennsylvania Bar Association.
Previous Positions: Deputy General Counsel, Special Counsel, Managing Director of Mutual Fund Services, Federated Investors, Inc.; Senior Vice President, Federated Services Company; and Senior Corporate Counsel, Federated Investors, Inc. |
Stephen Van Meter
Birth Date: June 5, 1975
CHIEF COMPLIANCE OFFICER AND SENIOR VICE PRESIDENT
Officer since: July 2015 | Principal Occupations: Senior Vice President and Chief Compliance Officer of the Federated Fund Family; Vice President and Chief Compliance Officer of Federated Investors, Inc. and Chief Compliance Officer of certain of its subsidiaries. Mr. Van Meter joined Federated in October 2011. He holds FINRA licenses under Series 3, 7, 24 and 66.
Previous Positions: Mr. Van Meter previously held the position of Compliance Operating Officer, Federated Investors, Inc. Prior to joining Federated, Mr. Van Meter served at the United States Securities and Exchange Commission in the positions of Senior Counsel, Office of Chief Counsel, Division of Investment Management and Senior Counsel, Division of Enforcement. |
Stephen F. Auth
Birth Date: September 13, 1956
101 Park Avenue
41st Floor
New York, NY 10178
CHIEF INVESTMENT OFFICER
Officer since: November 2002 | Principal Occupations: Stephen F. Auth is Chief Investment Officer of various Funds in the Federated Fund Family; Executive Vice President, Federated Investment Counseling, Federated Global Investment Management Corp. and Federated Equity Management Company of Pennsylvania.
Previous Positions: Executive Vice President, Federated Investment Management Company and Passport Research, Ltd. (investment advisory subsidiary of Federated); Senior Vice President, Global Portfolio Management Services Division; Senior Vice President, Federated Investment Management Company and Passport Research, Ltd.; Senior Managing Director and Portfolio Manager, Prudential Investments. |
Annual Shareholder Report
Evaluation and Approval of Advisory Contract–May 2017
Federated Kaufmann Fund (the “Fund”)
Following a review and recommendation of approval by the Fund's independent trustees, the Fund's Board of Trustees (the “Board”) reviewed and unanimously approved the continuation of the Fund's investment advisory and subadvisory contracts for an additional one-year term at its May 2017 meetings. The Board's decision regarding these contracts reflects the exercise of its business judgment after considering all of the information received on whether to continue the existing arrangements.
The Board had previously appointed a Senior Officer, whose duties include specified responsibilities relating to the process by which advisory fees are to be charged to a Federated fund. The Senior Officer has the authority to retain consultants, experts, or staff as may be reasonably necessary to assist in the performance of his duties, reports directly to the Board, and may be terminated only with the approval of a majority of the independent members of the Board. The Senior Officer prepared and furnished to the Board an independent, written evaluation that covered topics discussed below (the “Senior Officer's Evaluation”). The Board considered the Senior Officer's Evaluation, along with other information, in deciding to approve the investment advisory and subadvisory contracts.
The Board also considered judicial decisions concerning allegedly excessive investment advisory fees in its decision. Using these judicial decisions as a guide, the Board has indicated that the following factors may be relevant to an adviser's fiduciary duty with respect to its receipt of compensation from a fund: (1) the nature and quality of the services provided by an adviser to a fund and its shareholders (including the performance of the Fund and of comparable funds); (2) an adviser's cost of providing the services (including the profitability to an adviser of providing advisory services to a fund); (3) the extent to which an adviser may realize “economies of scale” as a fund grows larger and, if such economies of scale exist, whether they have been shared with a fund and its shareholders or the family of funds; (4) any “fall-out financial benefits” that accrue to an adviser because of its relationship with a fund (including research services received from brokers that execute fund trades and any fees paid to affiliates of an adviser for services rendered to a fund); (5) comparative fee and expense structures (including a comparison of fees paid to an adviser with those paid by similar funds); and (6) the extent of care, conscientiousness and independence with which the Fund's board members perform their duties and their expertise (including whether they are fully informed about all facts the Board deems relevant to its consideration of an adviser's services and fees). The Board noted that the Securities and Exchange Commission (“SEC”) disclosure requirements regarding the basis for the Board's approval of the Fund's investment advisory and subadvisory contracts generally align with the factors
Annual Shareholder Report
listed above. Consistent with the judicial decisions and SEC disclosure requirements, the Board also considered management fees charged to institutional and other clients of Federated Equity Management Company of Pennsylvania (the “Adviser”) and any subadviser and their advisory affiliates, for what might be viewed as like services. The Board was aware of these factors and was guided by them in its review of the Fund's investment advisory and subadvisory contracts to the extent it considered them to be appropriate and relevant, as discussed further below.
The Board considered and weighed these factors in light of its substantial accumulated experience in governing the Fund and working with Federated Investors, Inc. and its affiliates (“Federated”) on matters relating to the Federated funds. The Board was assisted in its deliberations by independent legal counsel. In addition to the extensive materials that comprise and accompany the Senior Officer's Evaluation, the Board received detailed information about the Fund and the Federated organization throughout the year, and in connection with its May meetings. Federated provided much of this information at each regular meeting of the Board, and furnished additional information in connection with the May meetings at which the Board's formal approval of the investment advisory and subadvisory contracts occurred. At the May meetings, in addition to meeting in separate sessions of the independent trustees without management present, senior management of the Adviser also met with the independent trustees and their counsel to discuss the materials presented and any other matters thought relevant by the Adviser or the trustees. Between regularly scheduled meetings, the Board also received information on particular matters as the need arose. The Board's consideration of the investment advisory and subadvisory contracts included review of the Senior Officer's Evaluation, accompanying data and additional information covering such matters as: the Adviser's and subadviser's investment philosophy, revenue, profitability, personnel and processes; investment and operating strategies; the Fund's short-term and long-term performance (in absolute terms, both on a gross basis and net of expenses, as well as in terms relative to its particular investment program and certain competitor or “peer group” funds and/or other benchmarks, as appropriate) and comments on the reasons for performance; the Fund's investment objectives; the Fund's expenses, including the advisory fee and the overall expense structure of the Fund (both in absolute terms and relative to similar and/or competing funds) with due regard for contractual or voluntary expense limitations; the use and allocation of brokerage commissions derived from trading the Fund's portfolio securities (if any); and the nature, quality and extent of the advisory and other services provided to the Fund by the Adviser and its affiliates. The Board also considered the preferences and expectations of Fund shareholders; the entrepreneurial risk assumed by the Adviser in sponsoring the Fund; the continuing state of competition in the mutual fund industry and market practices; the range of comparable fees for similar funds in the mutual fund industry; the Fund's relationship to the Federated funds which
Annual Shareholder Report
include a comprehensive array of funds with different investment objectives, policies and strategies which are generally available for exchange without the incurrence of additional sales charges; compliance and audit reports concerning the Federated funds and the Federated companies that service them (including communications from regulatory agencies), as well as Federated's responses to any issues raised therein; and relevant developments in the mutual fund industry and how the Federated funds and/or Federated are responding to them. The Board also considered that the longevity and experience of the Fund's portfolio management team and their unique approach to investing may limit the utility of comparisons to other equity mutual funds. The Board's evaluation process is evolutionary. The criteria considered and the emphasis placed on relevant criteria change in recognition of changing circumstances in the mutual fund marketplace.
While mindful that courts have cautioned against giving such comparisons too much weight, the Board has found the use of comparisons of the Fund's fees and expenses to other mutual funds with comparable investment programs to be relevant to its deliberations. In this regard, the Board was presented with, and considered, information regarding the contractual advisory fee rates, net advisory fee rates, total expense ratios and each element of the Fund's total expense ratio (i.e., gross and net advisory fees, custody fees, portfolio accounting fees and transfer agency fees) relative to the Fund's peers. The Board focused on comparisons with other similar mutual funds more heavily than non-mutual fund products or services because it is believed that they are more relevant. For example, other mutual funds are the products most like the Fund, in that they are readily available to Fund shareholders as alternative investment vehicles. Also, they are the type of investment vehicle, in fact, chosen and maintained by the Fund's investors. The range of their fees and expenses, therefore, appears to be a relevant indicator of what consumers have found to be reasonable in the marketplace in which the Fund competes.
The Board reviewed the contractual advisory fee rate, net advisory fee rate where partially waived and other expenses of the Fund and noted the position of the Fund's fee rates relative to its peers. In this regard, the Board noted that the contractual advisory fee rate was above the median of the relevant peer group, but the Board noted the applicable waivers and reimbursements, and that the overall expense structure of the Fund remained competitive in the context of other factors considered by the Board.
The Senior Officer noted that, in 2016, while the Fund's expenses were above median relative to its peers, those fees remained reasonable in light of its unique bottom-up investment process, the relative expense of that process, the resulting estimated profitability of the Fund over time, and the performance generated over time compared to its peers.
Annual Shareholder Report
For comparison, the Senior Officer has reviewed Federated's fees for providing advisory services to products outside the Federated funds (e.g., institutional and separate accounts and sub-adviser services). He concluded that mutual funds and institutional accounts are inherently different products. Those differences include, but are not limited to, different types of targeted investors; being subject to different laws and regulations; different legal structures; different average account sizes and portfolio management techniques made necessary by different cash flows and different associated costs; and the time spent by portfolio managers and their teams, funds financial services, legal, compliance and risk management in reviewing securities pricing, addressing different administrative responsibilities, addressing different degrees of risk associated with management and a variety of different costs. The Senior Officer did not consider the fees for providing advisory services to these outside products to be determinative in judging the appropriateness of mutual fund advisory fees.
The Senior Officer noted that this was particularly true in the case of the Fund, since Federated manages no institutional or separate accounts in the style of the Fund.
Following such evaluation, and full deliberations, the Board concluded that the expenses of the Fund are reasonable and supported renewal of the Fund's investment advisory and subadvisory contracts.
The Board considered the nature, extent and quality of the services provided to the Fund by the Adviser and the resources of the Adviser and its affiliates dedicated to the Fund. In this regard, the Board evaluated, among other things, the Adviser's personnel, experience, track record, overall reputation and willingness to invest in personnel and infrastructure that benefit the Fund. In addition, the Board reviewed the qualifications, backgrounds and responsibilities of the portfolio management team primarily responsible for the day-to-day management of the Fund. The Board noted the compliance programs of and the compliance-related resources provided to the Fund by the Adviser. The Fund's ability to deliver competitive performance when compared to its peer group was also deemed to be relevant by the Board as a useful indicator of how the Adviser is executing the Fund's investment program. The Adviser's ability to execute this program was one of the Board's considerations in reaching a conclusion that the nature, extent, and quality of the Adviser's investment management services warrant the continuation of the investment advisory and subadvisory contracts.
In evaluating the Fund's investment performance, the Board considered performance results in light of the Fund's investment objective, strategies and risks, as disclosed in the Fund's prospectus. The Board particularly considered detailed investment reports on the Fund's performance that were provided to the Board throughout the year and in connection with the May meetings. The Senior Officer also reviewed information compiled by Federated, using data supplied by independent fund ranking organizations, regarding the performance of, and fees charged by, other mutual funds, noting his view that comparisons to fund peer groups may be helpful, though not conclusive, in judging the
Annual Shareholder Report
reasonableness of the proposed fees. The Board considered, in evaluating such comparisons, that in some cases individual funds may exhibit significant and unique differences in their objectives and management techniques when compared to other funds within an industry peer group.
For the periods covered by the Senior Officer's Evaluation, the Fund's performance for the three-year and five-year periods was above the median of the relevant peer group, and the Fund's performance fell below the median of the relevant peer group for the one-year period. The Board discussed the Fund's performance with the Adviser and recognized the efforts being taken by the Adviser in the context of other factors considered relevant by the Board.
Following such evaluation, and full deliberations, the Board concluded that the performance of the Fund supported renewal of the Fund's investment advisory and subadvisory contracts.
The Board also received financial information about Federated, including information regarding the compensation and ancillary (or “fall-out”) benefits Federated derived from its relationships with the Federated funds. This information covered not only the fees under the investment advisory contracts, but also fees received by Federated's subsidiaries for providing other services to the Federated funds under separate contracts (e.g., for serving as the Federated funds' administrator). The information also detailed any indirect benefit Federated may derive from its receipt of research services from brokers who execute Federated fund trades. In addition, the Board considered the fact that, in order for a fund to be competitive in the marketplace, Federated and its affiliates frequently waived fees and/or reimbursed expenses and have disclosed to Fund investors and/or indicated to the Board their intention to do so in the future. Moreover, the Board receives regular reporting as to the institution, adjustment or elimination of these voluntary waivers. The Board considered Federated's previous reductions in contractual management fees to certain funds in response to the Senior Officer's recommendations.
Federated furnished information, requested by the Senior Officer, that reported revenues on a fund-by-fund basis and made estimates of the allocation of expenses on a fund-by-fund basis, using allocation methodologies specified by the Senior Officer. The Senior Officer noted that, while these cost allocation reports apply consistent allocation processes, the inherent difficulties in allocating costs continues to cause the Senior Officer to question the precision of the process and to conclude that such reports may be unreliable, since a single change in an allocation estimate may dramatically alter the resulting estimate of cost and/or profitability of a fund and may produce unintended consequences. The allocation information, including the Senior Officer's view that fund-by-fund estimations may be unreliable, was considered in the analysis by the Board.
Annual Shareholder Report
The Board and the Senior Officer also reviewed information compiled by Federated comparing its profitability information to other publicly held fund management companies. In this regard, the Senior Officer concluded that Federated's profit margins did not appear to be excessive. The Senior Officer also noted that Federated appeared financially sound, with the resources to fulfill its obligations under its contracts with the Fund.
The Senior Officer's Evaluation also discussed the notion of possible realization of “economies of scale” as a fund grows larger. In this regard, the Board considered that the Adviser has made significant and long-term investments in areas that support all of the Federated funds, such as personnel and processes for the portfolio management, shareholder services, compliance, internal audit and risk management functions, as well as systems technology (including technology relating to cybersecurity) and that the benefits of these efforts (as well as any economies of scale, should they exist) were likely to be enjoyed by the fund family as a whole. The Board noted that the Adviser's investments in these areas are extensive. In addition, the Board considered that Federated and its affiliates have frequently waived fees and/or reimbursed expenses and that this has allowed fund shareholders to share potential economies of scale from a fund's inception. Federated, as it does throughout the year, and in connection with the Board's review, furnished information relative to revenue sharing or adviser paid fees. Federated and the Senior Officer noted that this information should be viewed to determine if there was an incentive to either not apply breakpoints, or to apply breakpoints at higher levels. It should not be viewed to determine the appropriateness of advisory fees because it would represent marketing and distribution expenses. Finally, the Board also noted the absence of any applicable regulatory or industry guidelines on this subject, which (as discussed in the Senior Officer's Evaluation) is compounded by the lack of any common industry practice or general pattern with respect to structuring fund advisory fees with “breakpoints” that serve to reduce the fee as a fund attains a certain size.
The Senior Officer's Evaluation also noted that the Board is aware of the provisions agreed upon in the settlement of the Kaufmann Fund fee litigation under which, starting July 1, 2012 and for a period of ten years thereafter, a cap on the net investment advisory fee is imposed and under which additional breakpoints are required upon the Fund reaching $8 billion, $9 billion, $10 billion and $12 billion in size.
While the Senior Officer noted certain items for follow-up reporting to the Board and further consideration by management, he stated that his observations and information accompanying the Senior Officer's Evaluation supported a finding by the Board that the management fee for the Fund was reasonable. Under these circumstances, no changes were recommended to, and no objection was raised to the continuation of, the Fund's investment advisory and subadvisory contracts.
Annual Shareholder Report
In its decision to continue an existing investment advisory contract, the Board was mindful of the potential disruptions of the Fund's operations and various risks, uncertainties and other effects that could occur as a result of a decision to terminate or not renew an investment advisory contract. In particular, the Board recognized that many shareholders have invested in the Fund on the strength of the Adviser's industry standing and reputation and with the expectation that the Adviser will have a continuing role in providing advisory services to the Fund. Thus, the Board's approval of the advisory and subadvisory contracts reflected the fact that it is the shareholders who have effectively selected the Adviser by virtue of having invested in the Fund. The Board concluded that, in light of the factors discussed above, including the nature, quality and scope of the services provided to the Fund by the Adviser and its affiliates, continuation of the investment advisory contract was appropriate.
The Board based its decision to approve the investment advisory and subadvisory contracts on the totality of the circumstances and relevant factors and with a view to past and future long-term considerations. Not all of the factors and considerations identified above were necessarily relevant to the Fund, nor did the Board consider any one of them to be determinative. With respect to the factors that were relevant, the Board's decision to approve the continuation of the contracts reflects its determination that Federated's performance and actions provided a satisfactory basis to support the decision to continue the existing arrangements.
Annual Shareholder Report
Voting Proxies on Fund Portfolio Securities
A description of the policies and procedures that the Fund uses to determine how to vote proxies, if any, relating to securities held in the Fund's portfolio is available, without charge and upon request, by calling 1-800-341-7400. A report on “Form N-PX” of how the Fund voted any such proxies during the most recent 12-month period ended June 30 is available via the Proxy Voting Record (Form N-PX) link associated with the Fund and share class name at www.FederatedInvestors.com/FundInformation. Form N-PX filings are also available at the SEC's website at www.sec.gov.
Quarterly Portfolio Schedule
The Fund files with the SEC a complete schedule of its portfolio holdings, as of the close of the first and third quarters of its fiscal year, on “Form N-Q.” These filings are available on the SEC's website at www.sec.gov and may be reviewed and copied at the SEC's Public Reference Room in Washington, DC. (Call 1-800-SEC-0330 for information on the operation of the Public Reference Room.) You may also access this information via the link to the Fund and share class name at www.FederatedInvestors.com/FundInformation.
Annual Shareholder Report
Mutual funds are not bank deposits or obligations, are not guaranteed by any bank and are not insured or guaranteed by the U.S. government, the Federal Deposit Insurance Corporation, the Federal Reserve Board or any other government agency. Investment in mutual funds involves investment risk, including the possible loss of principal.
This Report is authorized for distribution to prospective investors only when preceded or accompanied by the Fund's Prospectus, which contains facts concerning its objective and policies, management fees, expenses and other information.
Federated Kaufmann Fund
Federated Investors Funds
4000 Ericsson Drive
Warrendale, PA 15086-7561
Contact us at FederatedInvestors.com
or call 1-800-341-7400.
Federated Securities Corp., Distributor
CUSIP 314172677
CUSIP 314172669
CUSIP 314172651
CUSIP 314172644
CUSIP 31421N873
26396 (12/17)
Federated is a registered trademark of Federated Investors, Inc.
2017 ©Federated Investors, Inc.
Annual Shareholder Report
October 31, 2017
| Share Class | Ticker | A | KLCAX | C | KLCCX | R | KLCKX |
| | Institutional | KLCIX | R6 | KLCSX | |
Federated Kaufmann Large Cap Fund
Fund Established 2007
A Portfolio of Federated Equity Funds
Dear Valued Shareholder,
I am pleased to present the Annual Shareholder Report for your fund covering the period from November 1, 2016 through October 31, 2017. This report includes Management's Discussion of Fund Performance, a complete listing of your fund's holdings, performance information and financial statements along with other important fund information.
In addition, our website, FederatedInvestors.com, offers easy access to Federated resources that include timely fund updates, economic and market insights from our investment strategists, and financial planning tools. We invite you to register to take full advantage of its capabilities.
Thank you for investing with Federated. I hope you find this information useful and look forward to keeping you informed.
Sincerely,
J. Christopher Donahue, President
Not FDIC Insured ■ May Lose Value ■ No Bank Guarantee
CONTENTS
| 1 |
| 6 |
| 7 |
| 11 |
| 16 |
| 18 |
| 20 |
| 21 |
| 34 |
| 35 |
| 37 |
| 38 |
| 44 |
| 51 |
| 51 |
Management's Discussion of Fund Performance (unaudited)
The total return of Federated Kaufmann Large Cap Fund (the “Fund”), based on net asset value for the 12-month reporting period ended October 31, 2017, was 23.97% for the Class A Shares, 22.96% for the Class C Shares, 23.46% for the Class R Shares, 24.30% for the Institutional Shares and 24.30% for the Class R6 Shares. The total return of the Russell 1000® Growth Index (R1000G),1 the Fund's broad-based securities market index, was 29.71% for the same reporting period. The total return of the Morningstar Large Growth Funds Average (MLGFA),2 a peer group average for the Fund, was 26.56% for the same reporting period. The Fund's and the MLGFA's total returns for the most recently completed fiscal year reflected actual cash flows, transaction costs and other expenses, which were not reflected in the total return of the R1000G.
During the reporting period, the Fund's investment strategy focused on stock selection, sector exposure, international exposure3 and the effect of cash holdings. These were the most significant factors affecting the Fund's performance relative to the R1000G.
The following discussion will focus on the performance of the Fund's Institutional Shares.
Market Overview
During the reporting period, global equity markets increased significantly as economies around the world improved seemingly in unison. The U.S. Federal Reserve (the “Fed”) raised its target rate three times during the reporting period. Despite these rate increases, the U.S. Dollar Index4 and the dollar relative to the euro weakened as the global economy picked up steam. U.S. Gross Domestic Product growth also accelerated from its lower pace from the last 8 years in the second and third quarters of 2017. As global Central Banks reversed the extreme easing policies in western countries, economies reacted positively. The new U.S. administration's deregulation momentum gave lift to business confidence, and the anticipation of tax reform boosted investment domestically.
Stock Selection
The key factor affecting Fund performance from a macroeconomic standpoint was improving U.S. economic fundamentals, as well as accommodative monetary policies by the Fed and other central banks. Profitability of many of the companies in which the Fund invested remained strong throughout the reporting period. Fund management continued to find attractive large-cap growth investment opportunities–companies that are dominant competitors and that have strengthening fundamentals potentially delivering both near-term and long-term growth in sales and earnings.
Annual Shareholder Report
The Fund underperformed the R1000G. The majority of the underperformance versus the R1000G on a gross return basis was due to stock selection and weightings versus the R1000G, particularly in the Health Care and Information Technology sectors. Individual companies that most contributed to Fund performance during the reporting period were: Broadcom Limited, Sherwin-Williams Company, Alibaba Group, Facebook Inc. and JP Morgan. Holdings that negatively impacted Fund performance were DexCom Inc., Pioneer Natural Resources, Medtronic, Ulta Beauty Inc. and Regeneron Pharmaceuticals.
Sector Exposure
At the end of the reporting period, approximately 75% of the Fund was invested in four large sectors: Information Technology, Health Care, Consumer Discretionary and Industrials. These sectors have historically provided good opportunities for bottom-up growth investors. The largest detractors from relative performance were cash holdings, Health Care and Information Technology. The largest contributors to relative performance were the Consumer Staples and Real Estate sectors. Overweighting in cash and underweighting in Information Technology negatively affected the Fund's relative performance versus the R1000G.
International Exposure
Stock selection of companies domiciled outside the U.S. was a significant positive contributor to the return of the Fund. Approximately 9% of the Fund's assets were invested in such companies as of the end of the reporting period.
Effect of Cash Holdings
The Fund had outflows during the reporting period which resulted in an average cash position of 6.21%. In a rising market, the cash holdings resulted in a modest drag on relative performance versus the R1000G.
| 1 | Please see the footnotes to the line graph below for definitions of, and further information about, the R1000G. |
| 2 | Please see the footnotes to the line graph below for definitions of, and further information about, the MLGFA. |
| 3 | International investing involves special risks including currency risk, increased volatility, political risks and differences in auditing and other financial standards. |
| 4 | The U.S. Dollar Index indicates the general international value of the U.S. dollar by averaging the exchange rates between the U.S. dollar and six major world currencies. The index is unmanaged, and it is not possible to invest directly in an index. |
Annual Shareholder Report
FUND PERFORMANCE AND GROWTH OF A $10,000 INVESTMENT
The graph below illustrates the hypothetical investment of $10,0001 in the Federated Kaufmann Large Cap Fund from December 5, 2007 (start of performance) to October 31, 2017, compared to the Russell 1000® Growth Index (R1000G)2 and the Morningstar Large Growth Funds Average (MLGFA).3 The Average Annual Total Return table below shows returns for each class averaged over the stated periods.
Growth of a $10,000 Investment
Growth of $10,000 as of October 31, 2017
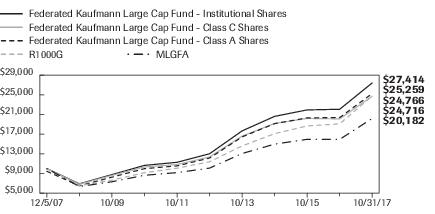
| Federated Kaufmann Large Cap Fund - | Institutional Shares | Class C Shares | Class A Shares | R1000G | MLGFA |
| F | F | F | I | I |
| 12/5/2007 | 10,000 | 10,000 | 9,450 | 10,000 | 10,000 |
| 10/31/2008 | 6,900 | 6,850 | 6,503 | 6,516 | 6,352 |
| 10/31/2009 | 8,772 | 8,610 | 8,248 | 7,656 | 7,315 |
| 10/31/2010 | 10,648 | 10,330 | 9,983 | 9,161 | 8,636 |
| 10/31/2011 | 11,275 | 10,820 | 10,545 | 10,069 | 9,177 |
| 10/31/2012 | 13,009 | 12,356 | 12,136 | 11,380 | 10,094 |
| 10/31/2013 | 17,656 | 16,590 | 16,437 | 14,600 | 13,057 |
| 10/31/2014 | 20,612 | 19,168 | 19,135 | 17,098 | 14,967 |
| 10/31/2015 | 21,927 | 20,191 | 20,309 | 18,667 | 15,951 |
| 10/31/2016 | 22,055 | 20,101 | 20,375 | 19,093 | 15,938 |
| 10/31/2017 | 27,414 | 24,716 | 25,259 | 24,766 | 20,182 |
41 graphic description end -->
| ■ | Total returns shown for Class A shares include the maximum sales charge of 5.50% ($10,000 investment minus $550 sales charge = $9,450). |
| ■ | Total returns shown for Class C Shares include the maximum contingent deferred sales charge of 1.00% as applicable. |
The Fund offers multiple share classes whose performance may be greater than or less than its other share class(es) due to differences in sales charges and expenses. See the Average Annual Total Return table below for the returns of additional classes not shown in the line graph above.
Annual Shareholder Report
Average Annual Total Returns for the Period Ended 10/31/2017
(returns reflect all applicable sales charges and contingent deferred sales charges as specified below in footnote #1)
| | 1 Year | 5 Years | Start of
Performance* |
| Class A Shares | 17.13% | 14.49% | 9.80% |
| Class C Shares | 21.96% | 14.87% | 9.56% |
| Class R Shares | 23.46% | 15.35% | 9.98% |
| Institutional Shares | 24.30% | 16.08% | 10.71% |
| Class R6 Shares4 | 24.30% | 16.13% | 10.48% |
| R1000G | 29.71% | 16.83% | 9.59% |
| MLGFA | 26.56% | 15.09% | 7.35% |
| * | The Fund's Class A Shares, Class C Shares, Class R Shares and Institutional Shares start of performance date was December 5, 2007. Class R6 Shares commenced operations on December 30, 2013. |
| | |
Performance data quoted represents past performance which is no guarantee of future results. Investment return and principal value will fluctuate so that an investor's shares, when redeemed, may be worth more or less than their original cost. Mutual fund performance changes over time and current performance may be lower or higher than what is stated. For current to the most recent month-end performance and after-tax returns, visit FederatedInvestors.com or call 1-800-341-7400. Returns shown do not reflect the deduction of taxes that a shareholder would pay on Fund distributions or the redemption of Fund shares. Mutual funds are not obligations of or guaranteed by any bank and are not federally insured.
Annual Shareholder Report
| 1 | Represents a hypothetical investment of $10,000 in the Fund after deducting applicable sales charges: For Class A Shares, the maximum sales charge of 5.50% ($10,000 investment minus $550 sales charge = $9,450); for Class C Shares, a 1.00% contingent deferred sales charge would be applied to any redemption less than one year from the purchase date. The Fund's performance assumes the reinvestment of all dividends and distributions. The R1000G and the MLGFA have been adjusted to reflect the reinvestment of dividends on securities in the index and average. |
| 2 | The Russell 1000® Growth Index measures the performance of the large-cap growth segment of the U.S. equity universe. It includes those Russell 1000® Index companies with higher price-to-book ratios and higher forecasted growth values. The R1000G is constructed to provide a comprehensive and unbiased barometer for the large-cap growth segment. The R1000G is completely reconstituted annually to ensure new and growing equities are included and that the represented companies continue to reflect growth characteristics. The R1000G is not adjusted to reflect sales charges, expenses or other fees that the Securities and Exchange Commission requires to be reflected in the Fund's performance. The index is unmanaged and unlike the Fund, is not affected by cash flows. It is not possible to invest directly in an index. |
| 3 | Morningstar figures represent the average of the total returns reported by all the funds designated by Morningstar as falling into the respective category indicated. They do not reflect sales charges. The Morningstar figures in the Growth of $10,000 line graph are based on historical return information published by Morningstar and reflect the return of the funds comprising the category in the year of publication. Because the funds designated by Morningstar as falling into the category can change over time, the Morningstar figures in the line graph may not match the Morningstar figures in the Average Annual Total Returns table, which reflect the return of the funds that currently comprise the category. |
| 4 | The Fund's Class R6 Shares commenced operations on December 30, 2013. For the period prior to the commencement of operations of Class R6 Shares, the performance information shown is for the Fund's Institutional Shares adjusted to reflect expenses of the Class R6 Shares for each year for which the expenses of Class R6 Shares would have exceeded the actual expenses paid by Institutional Shares. |
Annual Shareholder Report
Portfolio of Investments Summary Table (unaudited)
At October 31, 2017, the Fund's sector composition1 was as follows:
| Sector Composition | Percentage of
Total Net Assets |
| Information Technology | 31.8% |
| Health Care | 20.3% |
| Consumer Discretionary | 13.5% |
| Industrials | 11.4% |
| Financials | 5.9% |
| Materials | 3.9% |
| Real Estate | 3.6% |
| Telecommunication Services | 2.8% |
| Consumer Staples | 1.4% |
| Cash Equivalents2 | 5.5% |
| Other Assets and Liabilities—Net3 | (0.1)% |
| TOTAL | 100% |
| 1 | Except for Cash Equivalents and Other Assets and Liabilities, sector classifications are based upon, and individual portfolio securities are assigned to, the classifications of the Global Industry Classification Standard (GICS) except that the Adviser assigns a classification to securities not classified by the GICS and to securities for which the Adviser does not have access to the classification made by the GICS. |
| 2 | Cash Equivalents include any investments in money market mutual funds and/or overnight repurchase agreements. |
| 3 | Assets, other than investments in securities, less liabilities. See Statement of Assets and Liabilities. |
Annual Shareholder Report
Portfolio of Investments
October 31, 2017
| Shares | | | Value |
| | | COMMON STOCKS—94.6% | |
| | | Consumer Discretionary—13.5% | |
| 83,700 | 1 | Amazon.com, Inc. | $92,511,936 |
| 718,375 | | Hilton Worldwide Holdings, Inc. | 51,924,145 |
| 340,000 | | Home Depot, Inc. | 56,365,200 |
| 960,000 | | Las Vegas Sands Corp. | 60,844,800 |
| 20 | 1,2 | New Cotai LLC/Capital | 483,446 |
| 17,700 | 1 | Priceline.com, Inc. | 33,841,692 |
| 595,000 | | Starbucks Corp. | 32,629,800 |
| 776,000 | | TJX Cos., Inc. | 54,164,800 |
| 280,000 | 1 | Ulta Beauty, Inc. | 56,501,200 |
| | | TOTAL | 439,267,019 |
| | | Consumer Staples—1.4% | |
| 205,000 | | Constellation Brands, Inc., Class A | 44,913,450 |
| | | Financials—5.9% | |
| 1,020,000 | | American International Group, Inc. | 65,902,200 |
| 134,700 | | BlackRock, Inc. | 63,420,801 |
| 628,800 | | JPMorgan Chase & Co. | 63,263,568 |
| | | TOTAL | 192,586,569 |
| | | Health Care—20.3% | |
| 518,100 | 1 | Alexion Pharmaceuticals, Inc. | 61,995,846 |
| 226,900 | 1 | Align Technology, Inc. | 54,224,562 |
| 200,000 | 1 | Alnylam Pharmaceuticals, Inc. | 24,368,000 |
| 1,840,000 | 1 | Boston Scientific Corp. | 51,777,600 |
| 468,000 | 1 | Edwards Lifesciences Corp. | 47,843,640 |
| 371,000 | 1 | Galapagos NV, ADR | 36,165,080 |
| 377,200 | 1 | Genmab A/S | 76,269,989 |
| 393,000 | 1 | IDEXX Laboratories, Inc. | 65,304,810 |
| 277,830 | 1 | Incyte Genomics, Inc. | 31,464,247 |
| 227,534 | | Stryker Corp. | 35,238,191 |
| 286,178 | 1 | Tesaro, Inc. | 33,130,827 |
| 1,122,251 | 1 | Veeva Systems, Inc. | 68,389,976 |
| 1,200,000 | | Zoetis, Inc. | 76,584,000 |
| | | TOTAL | 662,756,768 |
| | | Industrials—11.4% | |
| 1,225,000 | 1 | AerCap Holdings NV | 64,484,000 |
| 337,011 | | FedEx Corp. | 76,100,454 |
Annual Shareholder Report
| Shares | | | Value |
| | | COMMON STOCKS—continued | |
| | | Industrials—continued | |
| 715,000 | | Ingersoll-Rand PLC, Class A | $63,349,000 |
| 910,000 | | Osram Licht AG | 69,949,017 |
| 360,700 | | Raytheon Co. | 64,998,140 |
| 128,500 | | Roper Technologies, Inc. | 33,174,845 |
| | | TOTAL | 372,055,456 |
| | | Information Technology—31.8% | |
| 315,000 | 1 | Alibaba Group Holding Ltd., ADR | 58,240,350 |
| 102,200 | 1 | Alphabet, Inc. | 105,576,688 |
| 910,000 | | Amadeus IT Group S.A. | 61,733,780 |
| 446,000 | | Broadcom Ltd. | 117,703,860 |
| 1,000,000 | | CSRA, Inc. | 31,990,000 |
| 608,167 | 1 | Facebook, Inc. | 109,506,550 |
| 923,000 | | Marvell Technology Group Ltd. | 17,047,810 |
| 595,000 | | Mastercard, Inc. | 88,518,150 |
| 870,000 | | Microsoft Corp. | 72,366,600 |
| 370,000 | 1 | Red Hat, Inc. | 44,707,100 |
| 930,000 | 1 | Salesforce.com, Inc. | 95,176,200 |
| 338,500 | 1 | ServiceNow, Inc. | 42,776,245 |
| 475,000 | 1 | Splunk, Inc. | 31,967,500 |
| 1,150,000 | 1 | Vantiv, Inc. | 80,500,000 |
| 722,400 | | Visa, Inc., Class A | 79,449,552 |
| | | TOTAL | 1,037,260,385 |
| | | Materials—3.9% | |
| 229,300 | | Martin Marietta Materials | 49,723,705 |
| 196,700 | | Sherwin-Williams Co. | 77,726,005 |
| | | TOTAL | 127,449,710 |
| | | Real Estate—3.6% | |
| 1,480,000 | 1 | CBRE Group, Inc. | 58,193,600 |
| 550,000 | | Crown Castle International Corp. | 58,894,000 |
| | | TOTAL | 117,087,600 |
| | | Telecommunication Services—2.8% | |
| 1,495,000 | 1 | T-Mobile USA, Inc. | 89,356,150 |
| | | TOTAL COMMON STOCKS
(IDENTIFIED COST $2,046,308,168) | 3,082,733,107 |
Annual Shareholder Report
| Shares | | | Value |
| | | INVESTMENT COMPANY—5.5%3 | |
| 179,711,509 | | Federated Institutional Prime Value Obligations Fund, Institutional Shares, 1.21%4
(IDENTIFIED COST $179,727,279) | $179,729,481 |
| | | TOTAL INVESTMENT IN SECURITIES—100.1%
(IDENTIFIED COST $2,226,035,447)5 | 3,262,462,588 |
| | | OTHER ASSETS AND LIABILITIES - NET—(0.1)%6 | (1,966,883) |
| | | TOTAL NET ASSETS—100% | $3,260,495,705 |
| 1 | Non-income-producing security. |
| 2 | Market quotations and price evaluations are not available. Fair value determined using significant unobservable inputs in accordance with procedures established by and under the general supervision of the Fund's Board of Trustees (the “Trustees”). |
| 3 | Affiliated holding. |
Affiliated fund holdings are investment companies which are managed by the Adviser or an affiliate of the Adviser. Transactions with affiliated fund holdings during the period ended October 31, 2017, were as follows:
| | Federated
Institutional
Prime Value
Obligations Fund,
Institutional Shares | Federated
Government
Obligations Fund,
Institutional Shares* | Total |
| Balance of Shares Held 10/31/2016 | 293,564,326 | — | 293,564,326 |
| Purchases/Additions | 916,472,297 | 133,583,114 | 1,050,055,411 |
| Sales/Reductions | (1,030,325,114) | (133,583,114) | (1,163,908,228) |
| Balance of Shares Held 10/31/2017 | 179,711,509 | — | 179,711,509 |
| Value | $179,729,481 | — | $179,729,481 |
| Change in Unrealized Appreciation/Depreciation | $2,202 | $NA | $2,202 |
| Net Realized Gain/(Loss) | $30,724 | $NA | $30,724 |
| Dividend Income | $1,807,398 | $17,013 | $1,824,411 |
| * | All or a portion of the balance/activity for the fund relates to cash collateral received on securities lending transactions. |
| 4 | 7-day net yield. |
| 5 | The cost of investments for federal tax purposes amounts to $2,234,549,757. |
| 6 | Assets, other than investments in securities, less liabilities. See Statement of Assets and Liabilities. |
Note: The categories of investments are shown as a percentage of total net assets at October 31, 2017.
Annual Shareholder Report
Various inputs are used in determining the value of the Fund's investments. These inputs are summarized in the three broad levels listed below:
Level 1—quoted prices in active markets for identical securities.
Level 2—other significant observable inputs (including quoted prices for similar securities, interest rates, prepayment speeds, credit risk, etc.). Also includes securities valued at amortized cost.
Level 3—significant unobservable inputs (including the Fund's own assumptions in determining the fair value of investments).
The inputs or methodology used for valuing securities are not an indication of the risk associated with investing in those securities.
The following is a summary of the inputs used, as of October 31, 2017, in valuing the Fund's assets carried at fair value:
| Valuation Inputs | | | | |
| | Level 1—
Quoted
Prices | Level 2—
Other
Significant
Observable
Inputs | Level 3—
Significant
Unobservable
Inputs | Total |
| Equity Securities: | | | | |
| Common Stocks | | | | |
| Domestic | $2,517,306,775 | $— | $483,446 | $2,517,790,221 |
| International | 564,942,886 | — | — | 564,942,886 |
| Investment Company | 179,729,481 | — | — | 179,729,481 |
| TOTAL SECURITIES | $3,261,979,142 | $— | $483,446 | $3,262,462,588 |
The following acronym is used throughout this portfolio:
ADR—American Depositary Receipt
See Notes which are an integral part of the Financial Statements
Annual Shareholder Report
Financial Highlights–Class A Shares
(For a Share Outstanding Throughout Each Period)
| Year Ended October 31 | 2017 | 2016 | 2015 | 2014 | 2013 |
| Net Asset Value, Beginning of Period | $18.86 | $18.80 | $18.39 | $16.13 | $12.22 |
| Income From Investment Operations: | | | | | |
| Net investment income (loss) | (0.06)1 | (0.03)1 | (0.02)1 | (0.04)1 | (0.04)1 |
| Net realized and unrealized gain on investments and foreign currency transactions | 4.58 | 0.09 | 1.13 | 2.65 | 4.27 |
| TOTAL FROM INVESTMENT OPERATIONS | 4.52 | 0.06 | 1.11 | 2.61 | 4.23 |
| Less Distributions: | | | | | |
| Distributions from net investment income | — | — | (0.00)2 | — | — |
| Distributions from net realized gain on investments and foreign currency transactions | — | (0.00)2 | (0.70) | (0.35) | (0.32) |
| TOTAL DISTRIBUTIONS | — | (0.00)2 | (0.70) | (0.35) | (0.32) |
| Net Asset Value, End of Period | $23.38 | $18.86 | $18.80 | $18.39 | $16.13 |
| Total Return3 | 23.97% | 0.33% | 6.14% | 16.42% | 35.44% |
| Ratios to Average Net Assets: | | | | | |
| Net expenses | 1.08% | 1.09%4 | 1.09%4 | 1.15%4 | 1.50%4 |
| Net investment income (loss) | (0.19)% | (0.15)% | (0.12)% | (0.23)% | (0.27)% |
| Expense waiver/reimbursement5 | 0.11% | 0.12% | 0.11% | 0.17% | 0.44% |
| Supplemental Data: | | | | | |
| Net assets, end of period (000 omitted) | $609,630 | $772,575 | $968,786 | $485,104 | $365,693 |
| Portfolio turnover | 44% | 34% | 55% | 68% | 114% |
| 1 | Per share numbers have been calculated using the average shares method. |
| 2 | Represents less than $0.01. |
| 3 | Based on net asset value, which does not reflect the sales charge, redemption fee or contingent deferred sales charge, if applicable. |
| 4 | The net expense ratio is calculated without reduction for fees paid indirectly for expense offset arrangements. The net expense ratios are 1.09%, 1.09%, 1.15% and 1.50% for the years ended October 31, 2016, 2015, 2014, and 2013, respectively, after taking into account these expense reductions. |
| 5 | This expense decrease is reflected in both the net expense and the net investment income (loss) ratios shown above. |
See Notes which are an integral part of the Financial Statements
Annual Shareholder Report
Financial Highlights–Class C Shares
(For a Share Outstanding Throughout Each Period)
| Year Ended October 31 | 2017 | 2016 | 2015 | 2014 | 2013 |
| Net Asset Value, Beginning of Period | $17.64 | $17.72 | $17.50 | $15.48 | $11.84 |
| Income From Investment Operations: | | | | | |
| Net investment income (loss) | (0.32)1 | (0.16)1 | (0.16)1 | (0.17)1 | (0.15)1 |
| Net realized and unrealized gain on investments and foreign currency transactions | 4.37 | 0.08 | 1.08 | 2.54 | 4.11 |
| TOTAL FROM INVESTMENT OPERATIONS | 4.05 | (0.08) | 0.92 | 2.37 | 3.96 |
| Less Distributions: | | | | | |
| Distributions from net investment income | — | — | (0.00)2 | — | — |
| Distributions from net realized gain on investments and foreign currency transactions | — | (0.00)2 | (0.70) | (0.35) | (0.32) |
| TOTAL DISTRIBUTIONS | — | (0.00)2 | (0.70) | (0.35) | (0.32) |
| Net Asset Value, End of Period | $21.69 | $17.64 | $17.72 | $17.50 | $15.48 |
| Total Return3 | 22.96% | (0.44)% | 5.34% | 15.54% | 34.27% |
| Ratios to Average Net Assets: | | | | | |
| Net expenses | 1.86% | 1.86%4 | 1.87%4 | 1.93%4 | 2.33%4 |
| Net investment income (loss) | (0.96)% | (0.93)% | (0.89)% | (1.03)% | (1.08)% |
| Expense waiver/reimbursement5 | 0.09% | 0.10% | 0.09% | 0.14% | 0.35% |
| Supplemental Data: | | | | | |
| Net assets, end of period (000 omitted) | $445,081 | $453,018 | $492,637 | $280,250 | $181,073 |
| Portfolio turnover | 44% | 34% | 55% | 68% | 114% |
| 1 | Per share numbers have been calculated using the average shares method. |
| 2 | Represents less than $0.01. |
| 3 | Based on net asset value, which does not reflect the sales charge, redemption fee or contingent deferred sales charge, if applicable. |
| 4 | The net expense ratio is calculated without reduction for fees paid indirectly for expense offset arrangements. The net expense ratios are 1.86%, 1.87%, 1.93% and 2.33% for the years ended October 31, 2016, 2015, 2014, and 2013, respectively, after taking into account these expense reductions. |
| 5 | This expense decrease is reflected in both the net expense and the net investment income (loss) ratios shown above. |
See Notes which are an integral part of the Financial Statements
Annual Shareholder Report
Financial Highlights–Class R Shares
(For a Share Outstanding Throughout Each Period)
| Year Ended October 31 | 2017 | 2016 | 2015 | 2014 | 2013 |
| Net Asset Value, Beginning of Period | $18.16 | $18.17 | $17.86 | $15.74 | $11.97 |
| Income From Investment Operations: | | | | | |
| Net investment income (loss) | (0.18)1 | (0.10)1 | (0.09)1 | (0.11)1 | (0.10)1 |
| Net realized and unrealized gain on investments and foreign currency transactions | 4.44 | 0.09 | 1.10 | 2.58 | 4.19 |
| TOTAL FROM INVESTMENT OPERATIONS | 4.26 | (0.01) | 1.01 | 2.47 | 4.09 |
| Less Distributions: | | | | | |
| Distributions from net investment income | — | — | (0.00)2 | — | — |
| Distributions from net realized gain on investments and foreign currency transactions | — | (0.00)2 | (0.70) | (0.35) | (0.32) |
| TOTAL DISTRIBUTIONS | — | (0.00)2 | (0.70) | (0.35) | (0.32) |
| Net Asset Value, End of Period | $22.42 | $18.16 | $18.17 | $17.86 | $15.74 |
| Total Return3 | 23.46% | (0.05)% | 5.74% | 15.93% | 35.00% |
| Ratios to Average Net Assets: | | | | | |
| Net expenses | 1.47% | 1.47%4 | 1.48%4 | 1.55%4 | 1.93%4 |
| Net investment income (loss) | (0.58)% | (0.54)% | (0.48)% | (0.64)% | (0.76)% |
| Expense waiver/reimbursement5 | 0.14% | 0.14% | 0.14% | 0.19% | 0.40% |
| Supplemental Data: | | | | | |
| Net assets, end of period (000 omitted) | $79,138 | $76,336 | $80,007 | $72,580 | $66,543 |
| Portfolio turnover | 44% | 34% | 55% | 68% | 114% |
| 1 | Per share numbers have been calculated using the average shares method. |
| 2 | Represents less than $0.01. |
| 3 | Based on net asset value. |
| 4 | The net expense ratio is calculated without reduction for fees paid indirectly for expense offset arrangements. The net expense ratios are 1.47%, 1.48%, 1.55% and 1.93% for the years ended October 31, 2016, 2015, 2014, and 2013, respectively, after taking into account these expense reductions. |
| 5 | This expense decrease is reflected in both the net expense and the net investment income (loss) ratios shown above. |
See Notes which are an integral part of the Financial Statements
Annual Shareholder Report
Financial Highlights–Institutional Shares
(For a Share Outstanding Throughout Each Period)
| Year Ended October 31 | 2017 | 2016 | 2015 | 2014 | 2013 |
| Net Asset Value, Beginning of Period | $19.22 | $19.11 | $18.64 | $16.30 | $12.32 |
| Income From Investment Operations: | | | | | |
| Net investment income (loss) | (0.01)1 | 0.021 | 0.031 | (0.00)1 | (0.01)1 |
| Net realized and unrealized gain on investments and foreign currency transactions | 4.68 | 0.09 | 1.14 | 2.69 | 4.31 |
| TOTAL FROM INVESTMENT OPERATIONS | 4.67 | 0.11 | 1.17 | 2.69 | 4.30 |
| Less Distributions: | | | | | |
| Distributions from net investment income | — | — | (0.00)2 | — | — |
| Distributions from net realized gain on investments and foreign currency transactions | — | (0.00)2 | (0.70) | (0.35) | (0.32) |
| TOTAL DISTRIBUTIONS | — | (0.00)2 | (0.70) | (0.35) | (0.32) |
| Net Asset Value, End of Period | $23.89 | $19.22 | $19.11 | $18.64 | $16.30 |
| Total Return3 | 24.30% | 0.58% | 6.38% | 16.74% | 35.72% |
| Ratios to Average Net Assets: | | | | | |
| Net expenses | 0.84% | 0.84%4 | 0.84%4 | 0.89%4 | 1.25%4 |
| Net investment income (loss) | 0.05% | 0.10% | 0.13% | (0.01)% | (0.07)% |
| Expense waiver/reimbursement5 | 0.10% | 0.11% | 0.10% | 0.15% | 0.41% |
| Supplemental Data: | | | | | |
| Net assets, end of period (000 omitted) | $2,024,361 | $1,332,606 | $1,556,775 | $813,517 | $365,715 |
| Portfolio turnover | 44% | 34% | 55% | 68% | 114% |
| 1 | Per share numbers have been calculated using the average shares method. |
| 2 | Represents less than $0.01. |
| 3 | Based on net asset value. |
| 4 | The net expense ratio is calculated without reduction for fees paid indirectly for expense offset arrangements. The net expense ratios are 0.84%, 0.84%, 0.89% and 1.25% for the years ended October 31, 2016, 2015, 2014, and 2013, respectively, after taking into account these expense reductions. |
| 5 | This expense decrease is reflected in both the net expense and the net investment income (loss) ratios shown above. |
See Notes which are an integral part of the Financial Statements
Annual Shareholder Report
Financial Highlights - Class R6 Shares
(For a Share Outstanding Throughout Each Period)
| Year Ended October 31 | 2017 | 2016 | 2015 | 20141 |
| Net Asset Value, Beginning of Period | $19.26 | $19.13 | $18.65 | $16.81 |
| Income From Investment Operations: | | | | |
| Net investment income | 0.022 | 0.032 | 0.042 | 0.012 |
| Net realized and unrealized gain on investments and foreign currency transactions | 4.66 | 0.10 | 1.14 | 1.83 |
| TOTAL FROM INVESTMENT OPERATIONS | 4.68 | 0.13 | 1.18 | 1.84 |
| Less Distributions: | | | | |
| Distributions from net investment income | — | — | (0.00)3 | — |
| Distributions from net realized gain on investments and foreign currency transactions | — | (0.00)3 | (0.70) | — |
| TOTAL DISTRIBUTIONS | — | (0.00)3 | (0.70) | — |
| Net Asset Value, End of Period | $23.94 | $19.26 | $19.13 | $18.65 |
| Total Return4 | 24.30% | 0.69% | 6.43% | 10.95% |
| Ratios to Average Net Assets: | | | | |
| Net expenses | 0.78% | 0.78%5 | 0.78%5 | 0.78%5,6 |
| Net investment income | 0.11% | 0.17% | 0.21% | 0.07%6 |
| Expense waiver/reimbursement7 | 0.09% | 0.09% | 0.09% | 0.11%6 |
| Supplemental Data: | | | | |
| Net assets, end of period (000 omitted) | $102,285 | $81,107 | $189,120 | $129,160 |
| Portfolio turnover | 44% | 34% | 55% | 68%8 |
| 1 | Reflects operations for the period from December 16, 2013 (date of initial investment) to October 31, 2014. |
| 2 | Per share numbers have been calculated using the average shares method. |
| 3 | Represents less than $0.01. |
| 4 | Based on net asset value. Total returns for periods of less than one year are not annualized. |
| 5 | The net expense ratio is calculated without reduction for fees paid indirectly for expense offset arrangements. The net expense ratios are 0.78%, 0.78% and 0.78% for the years ended October 31, 2016 and 2015, and for the period ended October 31, 2014, respectively, after taking into account these expense reductions. |
| 6 | Computed on an annualized basis. |
| 7 | This expense decrease is reflected in both the net expense and the net investment income ratios shown above. |
| 8 | Portfolio turnover is calculated at the Fund level. Percentage indicated was calculated for the year ended October 31, 2014. |
See Notes which are an integral part of the Financial Statements
Annual Shareholder Report
Statement of Assets and Liabilities
October 31, 2017
| Assets: | | |
| Investment in securities, at value including $179,729,481 of investment in an affiliated holding (identified cost $2,226,035,447) | | $3,262,462,588 |
| Income receivable | | 698,562 |
| Receivable for investments sold | | 2,109,783 |
| Receivable for shares sold | | 2,915,596 |
| Other assets | | 10,937 |
| TOTAL ASSETS | | 3,268,197,466 |
| Liabilities: | | |
| Payable for investments purchased | $1,302,140 | |
| Payable for shares redeemed | 4,873,409 | |
| Payable to adviser (Note 5) | 58,759 | |
| Payable for administrative fees (Note 5) | 7,149 | |
| Payable for transfer agent fee (Note 2) | 477,952 | |
| Payable for distribution services fee (Note 5) | 311,771 | |
| Payable for other service fees (Notes 2 and 5) | 399,597 | |
| Accrued expenses (Note 5) | 270,984 | |
| TOTAL LIABILITIES | | 7,701,761 |
| Net assets for 139,138,653 shares outstanding | | $3,260,495,705 |
| Net Assets Consist of: | | |
| Paid-in capital | | $2,190,876,247 |
| Net unrealized appreciation of investments and translation of assets and liabilities in foreign currency | | 1,036,437,820 |
| Accumulated net realized gain on investments and foreign currency transactions | | 38,117,015 |
| Accumulated net investment income (loss) | | (4,935,377) |
| TOTAL NET ASSETS | | $3,260,495,705 |
Annual Shareholder Report
Statement of Assets and Liabilities–continued
| Net Asset Value, Offering Price and Redemption Proceeds Per Share | | |
| Class A Shares: | | |
| Net asset value per share ($609,630,463 ÷ 26,077,618 shares outstanding), no par value, unlimited shares authorized | | $23.38 |
| Offering price per share (100/94.50 of $23.38) | | $24.74 |
| Redemption proceeds per share | | $23.38 |
| Class C Shares: | | |
| Net asset value per share ($445,081,291 ÷ 20,517,490 shares outstanding), no par value, unlimited shares authorized | | $21.69 |
| Offering price per share | | $21.69 |
| Redemption proceeds per share (99.00/100 of $21.69) | | $21.47 |
| Class R Shares: | | |
| Net asset value per share ($79,138,316 ÷ 3,529,689 shares outstanding), no par value, unlimited shares authorized | | $22.42 |
| Offering price per share | | $22.42 |
| Redemption proceeds per share | | $22.42 |
| Institutional Shares: | | |
| Net asset value per share ($2,024,360,742 ÷ 84,741,415 shares outstanding), no par value, unlimited shares authorized | | $23.89 |
| Offering price per share | | $23.89 |
| Redemption proceeds per share | | $23.89 |
| Class R6 Shares: | | |
| Net asset value per share ($102,284,893 ÷ 4,272,441 shares outstanding), no par value, unlimited shares authorized | | $23.94 |
| Offering price per share | | $23.94 |
| Redemption proceeds per share | | $23.94 |
See Notes which are an integral part of the Financial Statements
Annual Shareholder Report
Statement of Operations
Year Ended October 31, 2017
| Investment Income: | | | |
| Dividends (including $1,807,398 received from an affiliated holding and net of foreign taxes withheld of $246,939) | | | $26,970,941 |
| Income on securities loaned (including $13,559 received from an affiliated holding) | | | 22,408 |
| Interest income | | | 755 |
| TOTAL INCOME | | | 26,994,104 |
| Expenses: | | | |
| Investment adviser fee (Note 5) | | $22,683,840 | |
| Administrative fee (Note 5) | | 2,385,444 | |
| Custodian fees | | 138,360 | |
| Transfer agent fee (Note 2) | | 2,721,146 | |
| Directors'/Trustees' fees (Note 5) | | 25,222 | |
| Auditing fees | | 46,086 | |
| Legal fees | | 10,339 | |
| Portfolio accounting fees | | 211,206 | |
| Distribution services fee (Note 5) | | 3,778,397 | |
| Other service fees (Notes 2 and 5) | | 2,750,864 | |
| Share registration costs | | 137,599 | |
| Printing and postage | | 137,849 | |
| Miscellaneous (Note 5) | | 52,104 | |
| TOTAL EXPENSES | | 35,078,456 | |
| Waivers and Reimbursements: | | | |
| Waiver/reimbursement of investment adviser fee (Note 5) | $(2,776,056) | | |
| Waiver/reimbursement of other operating expenses (Notes 2 and 5) | (341,433) | | |
| TOTAL WAIVERS AND REIMBURSEMENTS | | (3,117,489) | |
| Net expenses | | | 31,960,967 |
| Net investment income (loss) | | | (4,966,863) |
Annual Shareholder Report
Statement of Operations–continued
| Realized and Unrealized Gain (Loss) on Investments and Foreign Currency Transactions: | | | |
| Net realized gain on investments (including realized gain of $30,724 on sales of investments in an affiliated holding) | | | $101,800,704 |
| Net realized gain on foreign currency and foreign currency related transactions | | | 125,762 |
| Net change in unrealized appreciation of investments (including change in unrealized appreciation of $2,202 on investments in an affiliated holding) | | | 547,397,246 |
| Net change in unrealized appreciation/depreciation of translation of assets and liabilities in foreign currency | | | 44,656 |
| Net realized and unrealized gain on investments and foreign currency transactions | | | 649,368,368 |
| Change in net assets resulting from operations | | | $644,401,505 |
See Notes which are an integral part of the Financial Statements
Annual Shareholder Report
Statement of Changes in Net Assets
| Year Ended October 31 | 2017 | 2016 |
| Increase (Decrease) in Net Assets | | |
| Operations: | | |
| Net investment income (loss) | $(4,966,863) | $(4,552,253) |
| Net realized gain on investments and foreign currency transactions | 101,926,466 | 6,315,789 |
| Net change in unrealized appreciation/depreciation of investments and translation of assets and liabilities in foreign currency | 547,441,902 | (25,277,614) |
| CHANGE IN NET ASSETS RESULTING FROM OPERATIONS | 644,401,505 | (23,514,078) |
| Distributions to Shareholders: | | |
| Distributions from net realized gain on investments and foreign currency transactions | | |
| Class A Shares | — | (67,753) |
| Class C Shares | — | (36,723) |
| Class R Shares | — | (5,857) |
| Institutional Shares | — | (107,415) |
| Class R6 Shares | — | (12,768) |
| CHANGE IN NET ASSETS RESULTING FROM DISTRIBUTIONS TO SHAREHOLDERS | — | (230,516) |
| Share Transactions: | | |
| Proceeds from sale of shares | 908,360,518 | 852,836,222 |
| Proceeds from shares issued in connection with the tax-free transfer of assets from Hancock Horizon Growth Fund | 136,575,232 | — |
| Net asset value of shares issued to shareholders in payment of distributions declared | — | 194,010 |
| Cost of shares redeemed | (1,144,483,953) | (1,400,966,983) |
| CHANGE IN NET ASSETS RESULTING FROM SHARE TRANSACTIONS | (99,548,203) | (547,936,751) |
| Change in net assets | 544,853,302 | (571,681,345) |
| Net Assets: | | |
| Beginning of period | 2,715,642,403 | 3,287,323,748 |
| End of period (including distributions in excess of net investment income of $(4,935,377) and $(5,178,914), respectively) | $3,260,495,705 | $2,715,642,403 |
See Notes which are an integral part of the Financial Statements
Annual Shareholder Report
Notes to Financial Statements
October 31, 2017
1. ORGANIZATION
Federated Equity Funds (the “Trust”) is registered under the Investment Company Act of 1940, as amended (the “Act”), as an open-end management investment company. The Trust consists of 11 diversified portfolios. The financial statements included herein are only those of Federated Kaufmann Large Cap Fund (the “Fund”), a diversified portfolio. The financial statements of the other portfolios are presented separately. The assets of each portfolio are segregated and a shareholder's interest is limited to the portfolio in which shares are held. Each portfolio pays its own expenses. The Fund offers five classes of shares: Class A Shares, Class C Shares, Class R Shares, Institutional Shares and Class R6 Shares. All shares of the Fund have equal rights with respect to voting, except on class-specific matters. The investment objective of the Fund is to provide capital appreciation.
On March 30, 2017, the Fund's T Share class became effective with the Securities and Exchange Commission (SEC), but is not yet offered for sale.
On January 27, 2017, the Fund acquired all of the net assets of Hancock Horizon Growth Fund, an open-end investment company in a tax-free reorganization in exchange for shares of the Fund, pursuant to a plan of reorganization approved by the Hancock Horizon Growth Fund's shareholders on January 26, 2017. The purpose of the transaction was to combine two portfolios with comparable investment objectives and strategies. For financial reporting purposes, assets received and shares issued by the Fund were recorded at fair value; however, the cost basis of the investments received from the Hancock Horizon Growth Fund was carried forward to align ongoing reporting of the Fund's realized gains and losses with amounts distributable to shareholders for tax purposes.
For every one share of Hancock Horizon Growth Fund Investment Shares exchanged, a shareholder received 0.839 shares of the Fund's Class A Shares.
For every one share of Hancock Horizon Growth Fund Class C Shares exchanged, a shareholder received 0.681 shares of the Fund's Class A Shares.
For every one share of Hancock Horizon Growth Fund Institutional Shares exchanged, a shareholder received 0.869 shares of the Fund's Institutional Shares.
The Fund received net assets from Hancock Horizon Growth Fund as the result of the tax-free reorganization as follows:
Shares of the
Fund Issued | Hancock
Horizon
Growth Fund
Net Assets
Received | Unrealized
Depreciation1 | Net Assets
of the Fund
Immediately
Prior to
Combination | Net Assets
of the Fund
Immediately
After
Combination |
| 6,641,247 | $136,575,232 | $(19,163,422) | $2,820,288,589 | $2,956,863,821 |
| 1 | Unrealized Depreciation is included in the Net Assets Received amount shown above. |
| | |
Annual Shareholder Report
Assuming the acquisition had been completed on November 1, 2016, the beginning of the annual reporting period of the Fund, the Fund's pro forma results of operations for the year ended October 31, 2017, were as follows:
| Net investment income (loss)* | $(4,861,545) |
| Net realized and unrealized gain on investments | $674,350,944 |
| Net increase in net assets resulting from operations | $669,489,399 |
| * | Net investment income (loss) includes $89,600 of pro forma eliminated expenses. |
| | |
Because the combined investment portfolios have been managed as a single integrated portfolio since the acquisition was completed, it is not practicable to separate the amounts of revenue and earnings of the Hancock Horizon Growth Fund that have been included in the Fund's Statement of Operations as of October 31, 2017.
2. SIGNIFICANT ACCOUNTING POLICIES
The following is a summary of significant accounting policies consistently followed by the Fund in the preparation of its financial statements. These policies are in conformity with U.S. generally accepted accounting principles (GAAP).
Investment Valuation
In calculating its net asset value (NAV), the Fund generally values investments as follows:
| ■ | Equity securities listed on an exchange or traded through a regulated market system are valued at their last reported sale price or official closing price in their principal exchange or market. |
| ■ | Fixed-income securities are fair valued using price evaluations provided by a pricing service approved by the Trustees. |
| ■ | Shares of other mutual funds or non-exchange-traded investment companies are valued based upon their reported NAVs. |
| ■ | Derivative contracts listed on exchanges are valued at their reported settlement or closing price, except that options are valued at the mean of closing bid and asked quotations. |
| ■ | Over-the-counter (OTC) derivative contracts are fair valued using price evaluations provided by a pricing service approved by the Trustees. |
| ■ | For securities that are fair valued in accordance with procedures established by and under the general supervision of the Trustees, certain factors may be considered such as: the last traded or purchase price of the security, information obtained by contacting the issuer or dealers, analysis of the issuer's financial statements or other available documents, fundamental analytical data, the nature and duration of restrictions on disposition, the movement of the market in which the security is normally traded, public trading in similar securities or derivative contracts of the issuer or comparable issuers, movement of a relevant index, or other factors including but not limited to industry changes and relevant government actions. |
If any price, quotation, price evaluation or other pricing source is not readily available when the NAV is calculated, if the Fund cannot obtain price evaluations from a pricing service or from more than one dealer for an investment within a reasonable period of time as set forth in the Fund's valuation policies and procedures, or if information furnished by a pricing service, in the opinion of the valuation committee (“Valuation Committee”), is deemed not
Annual Shareholder Report
representative of the fair value of such security, the Fund uses the fair value of the investment determined in accordance with the procedures described below. There can be no assurance that the Fund could obtain the fair value assigned to an investment if it sold the investment at approximately the time at which the Fund determines its NAV per share.
Fair Valuation and Significant Events Procedures
The Trustees have ultimate responsibility for determining the fair value of investments for which market quotations are not readily available. The Trustees have appointed a Valuation Committee comprised of officers of the Fund, Federated Equity Management Company of Pennsylvania (“Adviser”) and certain of the Adviser's affiliated companies to assist in determining fair value and in overseeing the calculation of the NAV. The Trustees have also authorized the use of pricing services recommended by the Valuation Committee to provide fair value evaluations of the current value of certain investments for purposes of calculating the NAV. The Valuation Committee employs various methods for reviewing third-party pricing-service evaluations including periodic reviews of third-party pricing services' policies, procedures and valuation methods (including key inputs, methods, models and assumptions), transactional back-testing, comparisons of evaluations of different pricing services, and review of price challenges by the Adviser based on recent market activity. In the event that market quotations and price evaluations are not available for an investment, the Valuation Committee determines the fair value of the investment in accordance with procedures adopted by the Trustees. The Trustees periodically review and approve the fair valuations made by the Valuation Committee and any changes made to the procedures.
Factors considered by pricing services in evaluating an investment include the yields or prices of investments of comparable quality, coupon, maturity, call rights and other potential prepayments, terms and type, reported transactions, indications as to values from dealers and general market conditions. Some pricing services provide a single price evaluation reflecting the bid-side of the market for an investment (a “bid” evaluation). Other pricing services offer both bid evaluations and price evaluations indicative of a price between the prices bid and asked for the investment (a “mid” evaluation). The Fund normally uses bid evaluations for any U.S. Treasury and Agency securities, mortgage-backed securities and municipal securities. The Fund normally uses mid evaluations for any other types of fixed-income securities and any OTC derivative contracts. In the event that market quotations and price evaluations are not available for an investment, the fair value of the investment is determined in accordance with procedures adopted by the Trustees.
The Trustees also have adopted procedures requiring an investment to be priced at its fair value whenever the Adviser determines that a significant event affecting the value of the investment has occurred between the time as of which the price of the investment would otherwise be determined and the time as of which the NAV is computed. An event is considered significant if there is both an affirmative expectation that the investment's value will change in response to the event and a reasonable basis for quantifying the resulting change in value. Examples of significant events that may occur after the close of the principal market on which a security is traded, or after the time of a price evaluation provided by a pricing service or a dealer, include:
| ■ | With respect to securities traded principally in foreign markets, significant trends in U.S. equity markets or in the trading of foreign securities index futures contracts; |
| ■ | Political or other developments affecting the economy or markets in which an issuer conducts its operations or its securities are traded; |
Annual Shareholder Report
| ■ | Announcements concerning matters such as acquisitions, recapitalizations, litigation developments, or a natural disaster affecting the issuer's operations or regulatory changes or market developments affecting the issuer's industry. |
The Trustees have adopted procedures whereby the Valuation Committee uses a pricing service to determine the fair value of equity securities traded principally in foreign markets when the Adviser determines that there has been a significant trend in the U.S. equity markets or in index futures trading. For other significant events, the Fund may seek to obtain more current quotations or price evaluations from alternative pricing sources. If a reliable alternative pricing source is not available, the Fund will determine the fair value of the investment in accordance with the fair valuation procedures approved by the Trustees. The Trustees have ultimate responsibility for any fair valuations made in response to a significant event.
Repurchase Agreements
The Fund may invest in repurchase agreements for short-term liquidity purposes. It is the policy of the Fund to require the other party to a repurchase agreement to transfer to the Fund's custodian or sub-custodian eligible securities or cash with a market value (after transaction costs) at least equal to the repurchase price to be paid under the repurchase agreement. The eligible securities are transferred to accounts with the custodian or sub-custodian in which the Fund holds a “securities entitlement” and exercises “control” as those terms are defined in the Uniform Commercial Code. The Fund has established procedures for monitoring the market value of the transferred securities and requiring the transfer of additional eligible securities if necessary to equal at least the repurchase price. These procedures also allow the other party to require securities to be transferred from the account to the extent that their market value exceeds the repurchase price or in exchange for other eligible securities of equivalent market value.
The insolvency of the other party or other failure to repurchase the securities may delay the disposition of the underlying securities or cause the Fund to receive less than the full repurchase price. Under the terms of the repurchase agreement, any amounts received by the Fund in excess of the repurchase price and related transaction costs must be remitted to the other party.
The Fund may enter into repurchase agreements in which eligible securities are transferred into joint trading accounts maintained by the custodian or sub-custodian for investment companies and other clients advised by the Fund's Adviser and its affiliates. The Fund will participate on a pro rata basis with the other investment companies and clients in its share of the securities transferred under such repurchase agreements and in its share of proceeds from any repurchase or other disposition of such securities.
Investment Income, Gains and Losses, Expenses and Distributions
Investment transactions are accounted for on a trade-date basis. Realized gains and losses from investment transactions are recorded on an identified-cost basis. Interest income and expenses are accrued daily. Dividend income and distributions to shareholders are recorded on the ex-dividend date. Foreign dividends are recorded on the ex-dividend date or when the Fund is informed of the ex-dividend date. Distributions of net investment income, if any, are declared and paid annually. Non-cash dividends included in dividend income, if any, are recorded at fair value. Amortization/accretion of premium and discount is included in investment income. Investment income, realized and unrealized gains and losses, and certain fund-level expenses are allocated to each class based on relative average daily net assets, except that Class A Shares, Class C Shares, Class R Shares, Institutional Shares and Class R6
Annual Shareholder Report
Shares may bear distribution services fees, other service fees and transfer agent fees unique to those classes. The detail of the total fund expense waivers and reimbursements of $3,117,489 is disclosed in various locations in this Note 2 and Note 5. For the year ended October 31, 2017, transfer agent fees for the Fund were as follows:
| | Transfer Agent
Fees Incurred | Transfer Agent
Fees Reimbursed |
| Class A Shares | $615,858 | $(144,488) |
| Class C Shares | 454,050 | — |
| Class R Shares | 206,364 | (2,101) |
| Institutional Shares | 1,432,935 | (155,835) |
| Class R6 Shares | 11,939 | — |
| TOTAL | $2,721,146 | $(302,424) |
Dividends are declared separately for each class. No class has preferential dividend rights; differences in per share dividend rates are generally due to differences in separate class expenses.
Other Service Fees
The Fund may pay other service fees up to 0.25% of the average daily net assets of the Fund's Class A Shares and Class C Shares to unaffiliated financial intermediaries or to Federated Shareholder Services Company (FSSC) for providing services to shareholders and maintaining shareholder accounts. Subject to the terms described in the Expense Limitation note, FSSC may voluntarily reimburse the Fund for other service fees. For the year ended October 31, 2017, other service fees for the Fund were as follows:
| | Other Service
Fees Incurred |
| Class A Shares | $1,621,430 |
| Class C Shares | 1,129,434 |
| TOTAL | $2,750,864 |
Federal Taxes
It is the Fund's policy to comply with the Subchapter M provision of the Internal Revenue Code (the “Code”) and to distribute to shareholders each year substantially all of its income. Accordingly, no provision for federal income tax is necessary. As of and during the year ended October 31, 2017, the Fund did not have a liability for any uncertain tax positions. The Fund recognizes interest and penalties, if any, related to tax liabilities as income tax expense in the Statement of Operations. As of October 31, 2017, tax years 2014 through 2017 remain subject to examination by the Fund's major tax jurisdictions, which include the United States of America and the Commonwealth of Massachusetts.
The Fund may be subject to taxes imposed by governments of countries in which it invests. Such taxes are generally based on either income or gains earned or repatriated. The Fund accrues and applies such taxes to net investment income, net realized gains and net unrealized gains as income and/or gains are earned.
Annual Shareholder Report
When-Issued and Delayed-Delivery Transactions
The Fund may engage in when-issued or delayed-delivery transactions. The Fund records when-issued securities on the trade date and maintains security positions such that sufficient liquid assets will be available to make payment for the securities purchased. Securities purchased on a when-issued or delayed-delivery basis are marked to market daily and begin earning interest on the settlement date. Losses may occur on these transactions due to changes in market conditions or the failure of counterparties to perform under the contract.
Restricted Securities
The Fund may purchase securities which are considered restricted. Restricted securities are securities that either: (a) cannot be offered for public sale without first being registered, or being able to take advantage of an exemption from registration, under the Securities Act of 1933; or (b) are subject to contractual restrictions on public sales. In some cases, when a security cannot be offered for public sale without first being registered, the issuer of the restricted security has agreed to register such securities for resale, at the issuer's expense, either upon demand by the Fund or in connection with another registered offering of the securities. Many such restricted securities may be resold in the secondary market in transactions exempt from registration. Restricted securities may be determined to be liquid under criteria established by the Trustees. The Fund will not incur any registration costs upon such resales. The Fund's restricted securities, like other securities, are priced in accordance with procedures established by and under the general supervision of the Trustees.
Foreign Exchange Contracts
The Fund enters into foreign exchange contracts to manage currency and market risks. Purchased contracts are used to acquire exposure to foreign currencies, whereas, contracts to sell are used to hedge the Fund's securities against currency fluctuations. Risks may arise upon entering into these transactions from the potential inability of counterparties to meet the terms of their commitments and from unanticipated movements in security prices or foreign exchange rates. The foreign exchange contracts are adjusted by the daily exchange rate of the underlying currency and any gains or losses are recorded for financial statement purposes as unrealized until the settlement date.
The average value at settlement date payable of foreign exchange contracts purchased by the Fund throughout the period was $62. This is based on the contracts held as of each month-end throughout the fiscal period.
At October 31, 2017, the Fund had no outstanding foreign exchange contracts.
Foreign Currency Translation
The accounting records of the Fund are maintained in U.S. dollars. All assets and liabilities denominated in foreign currencies are translated into U.S. dollars based on the rates of exchange of such currencies against U.S. dollars on the date of valuation. Purchases and sales of securities, income and expenses are translated at the rate of exchange quoted on the respective date that such transactions are recorded. The Fund does not isolate that portion of the results of operations resulting from changes in foreign exchange rates on investments from the fluctuations arising from changes in market prices of securities held. Such fluctuations are included with the net realized and unrealized gain or loss from investments.
Annual Shareholder Report
Reported net realized foreign exchange gains or losses arise from sales of foreign currencies, currency gains or losses realized between the trade and settlement dates on securities transactions, the difference between the amounts of dividends, interest and foreign withholding taxes recorded on the Fund's books, and the U.S. dollar equivalent of the amounts actually received or paid. Net unrealized foreign exchange gains and losses arise from changes in the value of assets and liabilities other than investments in securities at fiscal year end, resulting from changes in the exchange rate.
Securities Lending
The Fund participates in a securities lending program providing for the lending of equity securities to qualified brokers. The Fund normally receives cash collateral for securities loaned that is invested in an affiliated money market fund or in short-term securities including repurchase agreements. Collateral is maintained at a minimum level of 100% of the market value of investments loaned, plus interest, if applicable. In accordance with the Fund's securities lending agreement, the market value of securities on loan is determined each day at the close of business and any additional collateral required to cover the value of securities on loan is delivered to the Fund on the next business day. Earnings on collateral are allocated between the borrower of the security, the securities lending agent, as a fee for its services under the program and the Fund, according to agreed-upon rates.
As of October 31, 2017, the Fund had no outstanding securities on loan.
Other
The preparation of financial statements in conformity with GAAP requires management to make estimates and assumptions that affect the amounts of assets, liabilities, expenses and revenues reported in the financial statements. Actual results could differ from those estimated. The Fund applies investment company accounting and reporting guidance.
3. SHARES OF BENEFICIAL INTEREST
The following tables summarize share activity:
| Year Ended October 31 | 2017 | 2016 |
| Class A Shares: | Shares | Amount | Shares | Amount |
| Shares sold | 5,788,939 | $119,936,591 | 11,611,386 | $211,152,060 |
| Shares issued in connection with the tax-free transfer of assets from Hancock Horizon Growth Fund | 1,057,802 | 21,388,759 | — | — |
| Shares issued to shareholders in payment of distributions declared | — | — | 3,403 | 63,571 |
| Shares redeemed | (21,733,746) | (446,488,974) | (22,193,914) | (401,247,187) |
| NET CHANGE RESULTING FROM CLASS A SHARE TRANSACTIONS | (14,887,005) | $(305,163,624) | (10,579,125) | $(190,031,556) |
Annual Shareholder Report
| Year Ended October 31 | 2017 | 2016 |
| Class C Shares: | Shares | Amount | Shares | Amount |
| Shares sold | 2,663,061 | $51,389,408 | 5,602,453 | $96,293,289 |
| Shares issued to shareholders in payment of distributions declared | — | — | 1,650 | 29,016 |
| Shares redeemed | (7,829,618) | (153,060,252) | (7,728,549) | (133,369,710) |
| NET CHANGE RESULTING FROM CLASS C SHARE TRANSACTIONS | (5,166,557) | $(101,670,844) | (2,124,446) | $(37,047,405) |
| Year Ended October 31 | 2017 | 2016 |
| Class R Shares: | Shares | Amount | Shares | Amount |
| Shares sold | 716,755 | $14,440,954 | 1,145,198 | $20,194,212 |
| Shares issued to shareholders in payment of distributions declared | — | — | 309 | 5,583 |
| Shares redeemed | (1,390,735) | (28,090,049) | (1,345,603) | (23,767,449) |
| NET CHANGE RESULTING FROM CLASS R SHARE TRANSACTIONS | (673,980) | $(13,649,095) | (200,096) | $(3,567,654) |
| Year Ended October 31 | 2017 | 2016 |
| Institutional Shares: | Shares | Amount | Shares | Amount |
| Shares sold | 33,145,783 | $702,527,441 | 27,275,832 | $506,731,759 |
| Shares issued in connection with the tax-free transfer of assets from Hancock Horizon Growth Fund | 5,583,445 | 115,186,473 | — | — |
| Shares issued to shareholders in payment of distributions declared | — | — | 4,861 | 92,319 |
| Shares redeemed | (23,306,493) | (497,871,832) | (39,420,751) | (720,006,096) |
| NET CHANGE RESULTING FROM INSTITUTIONAL SHARE TRANSACTIONS | 15,422,735 | $319,842,082 | (12,140,058) | $(213,182,018) |
| Year Ended October 31 | 2017 | 2016 |
| Class R6 Shares: | Shares | Amount | Shares | Amount |
| Shares sold | 941,987 | $20,066,124 | 992,784 | $18,464,902 |
| Shares issued to shareholders in payment of distributions declared | — | — | 185 | 3,521 |
| Shares redeemed | (881,777) | (18,972,846) | (6,665,918) | (122,576,541) |
| NET CHANGE RESULTING FROM CLASS R6 SHARE TRANSACTIONS | 60,210 | $1,093,278 | (5,672,949) | $(104,108,118) |
| NET CHANGE RESULTING FROM TOTAL FUND SHARE TRANSACTIONS | (5,244,597) | $(99,548,203) | (30,716,674) | $(547,936,751) |
4. FEDERAL TAX INFORMATION
The timing and character of income and capital gain distributions are determined in accordance with income tax regulations, which may differ from GAAP. These differences are due to differing treatments for net operating losses and foreign currency transactions.
Annual Shareholder Report
For the year ended October 31, 2017, permanent differences identified and reclassified among the components of net assets were as follows:
| Increase (Decrease) |
| Paid-In Capital | Undistributed Net
Investment Income (Loss) | Accumulated Net
Realized Gain (Loss) |
| $(5,084,638) | $5,210,400 | $(125,762) |
Net investment income (loss), net realized gains (losses) and net assets were not affected by this reclassification.
The tax character of distributions as reported on the Statement of Changes in Net Assets for the years ended October 31, 2017 and 2016, was as follows:
| | 2017 | 2016 |
| Long-term capital gains | $— | $230,516 |
As of October 31, 2017, the components of distributable earnings on a tax-basis were as follows:
| Net unrealized appreciation | $1,027,923,510 |
| Undistributed long-term capital gains | $46,631,325 |
| Ordinary loss deferral | $(4,935,377) |
The difference between book-basis and tax-basis net unrealized appreciation/depreciation is attributable to differing treatments for the deferral of losses on wash sales.
At October 31, 2017, the cost of investments for federal tax purposes was $2,234,549,757. The net unrealized appreciation of investments for federal tax purposes was $1,027,912,831. This consists of net unrealized appreciation from investments for those securities having an excess of value over cost of $1,038,671,816 and net unrealized depreciation from investments for those securities having an excess of cost over value of $10,758,985.
The Fund used capital loss carryforwards of $57,800,010 to offset capital gains realized during the year ended October 31, 2017.
Under current tax rules, a late-year ordinary loss may be deferred, in whole or in part, and treated as occurring on the first day of the following fiscal year. As of October 31, 2017, for federal income tax purposes, a late year ordinary loss of $4,935,377 was deferred to November 1, 2017.
5. INVESTMENT ADVISER FEE AND OTHER TRANSACTIONS WITH AFFILIATES
Investment Adviser Fee
The advisory agreement between the Fund and the Adviser provides for an annual fee equal to 0.75% of the Fund's average daily net assets. Subject to the terms described in the Expense Limitation note, the Adviser may voluntarily choose to waive any portion of its fee. For the year ended October 31, 2017, the Adviser waived $2,565,592 of its fee and reimbursed $302,424 of transfer agent fees.
The Adviser has agreed to reimburse the Fund for certain investment adviser fees as a result of transactions in other affiliated investment companies. For the year ended October 31, 2017, the Adviser reimbursed $210,464.
Annual Shareholder Report
Certain of the Fund's assets are managed by Federated Global Investment Management Corp. (the “Sub-Adviser”). Under the terms of a sub-advisory agreement between the Adviser and the Sub-Adviser, the Sub-Adviser receives an allocable portion of the Fund's adviser fee. The fee is paid by the Adviser out of its resources and is not an incremental Fund expense. For the year ended October 31, 2017, the Sub-Adviser earned a fee of $18,600,749.
Administrative Fee
Federated Administrative Services (FAS), under the Administrative Services Agreement, provides the Fund with administrative personnel and services. For purposes of determining the appropriate rate breakpoint, “Investment Complex” is defined as all of the Federated Funds subject to a fee under the Administrative Services Agreement. The fee paid to FAS is based on the average daily net assets of the Investment Complex as specified below:
| Administrative Fee | Average Daily Net Assets
of the Investment Complex |
| 0.100% | on assets up to $50 billion |
| 0.075% | on assets over $50 billion |
Subject to the terms described in the Expense Limitation note, FAS may voluntarily choose to waive any portion of its fee. For the year ended October 31, 2017, the annualized fee paid to FAS was 0.079% of average daily net assets of the Fund.
Prior to September 1, 2017, the breakpoints of the Administrative Fee paid to FAS, described above, were:
| Administrative Fee | Average Daily Net Assets of
the Investment Complex |
| 0.150% | on the first $5 billion |
| 0.125% | on the next $5 billion |
| 0.100% | on the next $10 billion |
| 0.075% | on assets in excess of $20 billion |
In addition, FAS may charge certain out-of-pocket expenses to the Fund.
Distribution Services Fee
The Fund has adopted a Distribution Plan (the “Plan”) pursuant to Rule 12b-1 under the Act. Under the terms of the Plan, the Fund will compensate Federated Securities Corp. (FSC), the principal distributor, from the daily net assets of the Fund's Class A Shares, Class C Shares and Class R Shares to finance activities intended to result in the sale of these shares. The Plan provides that the Fund may incur distribution expenses at the following percentages of average daily net assets annually, to compensate FSC:
| Share Class Name | Percentage of Average Daily
Net Assets of Class |
| Class A Shares | 0.25% |
| Class C Shares | 0.75% |
| Class R Shares | 0.50% |
Annual Shareholder Report
Subject to the terms described in the Expense Limitation note, FSC may voluntarily choose to waive any portion of its fee. For the year ended October 31, 2017, distribution services fees for the Fund were as follows:
| | Distribution Services
Fees Incurred | Distribution Services
Fees Waived |
| Class C Shares | $3,388,304 | $— |
| Class R Shares | 390,093 | (39,009) |
| TOTAL | $3,778,397 | $(39,009) |
When FSC receives fees, it may pay some or all of them to financial intermediaries whose customers purchase shares. For the year ended October 31, 2017, FSC retained $342,613 of fees paid by the Fund. For the year ended October 31, 2017, the Fund's Class A Shares did not incur a distribution services fee; however, it may begin to incur this fee upon approval of the Trustees.
Sales Charges
Front-end sales charges and contingent deferred sales charges (CDSC) do not represent expenses of the Fund. They are deducted from the proceeds of sales of Fund shares prior to investment or from redemption proceeds prior to remittance, as applicable. For the year ended October 31, 2017, FSC retained $121,336 in sales charges from the sale of Class A Shares. FSC also retained $10,861 of CDSC relating to redemptions of Class A Shares and $35,406 relating to redemptions of Class C Shares.
Other Service Fees
For the year ended October 31, 2017, FSSC received $31,362 of the other service fees disclosed in Note 2.
Annual Shareholder Report
Expense Limitation
The Adviser and certain of its affiliates (which may include FSC, FAS and FSSC) on their own initiative have agreed to waive certain amounts of their respective fees and/or reimburse expenses. Total annual fund operating expenses (as shown in the financial highlights, excluding interest expense, extraordinary expenses and proxy-related expenses paid by the Fund, if any) paid by the Fund's Class A Shares, Class C Shares, Class R Shares, Institutional Shares and Class R6 Shares (after the voluntary waivers and/or reimbursements) will not exceed 1.08%, 1.86%, 1.47%, 0.83% and 0.77% (the “Fee Limit”), respectively, up to but not including the later of (the “Termination Date”): (a) January 1, 2019; or (b) the date of the Fund's next effective Prospectus. While the Adviser and its applicable affiliates currently do not anticipate terminating or increasing these arrangements prior to the Termination Date, these arrangements may only be terminated or the Fee Limit increased prior to the Termination Date with the agreement of the Trustees.
Interfund Transactions
During the year ended October 31, 2017, the Fund engaged in purchase transactions with funds that have a common investment adviser (or affiliated investment advisers), common Directors/Trustees and/or common Officers. These purchase transactions complied with Rule 17a-7 under the Act and amounted to $2,602,417.
General
Certain Officers and Trustees of the Fund are Officers and Directors or Trustees of certain of the above companies. To efficiently facilitate payment, Directors'/Trustees' fees and certain expenses related to conducting meetings of the Directors/Trustees and other miscellaneous expenses are paid by an affiliate of the Adviser which in due course are reimbursed by the Fund. These expenses related to conducting meetings of the Directors/Trustees and other miscellaneous expenses may be included in Accrued and Miscellaneous Expenses on the Statement of Assets and Liabilities and Statement of Operations, respectively.
6. INVESTMENT TRANSACTIONS
Purchases and sales of investments, excluding long-term U.S. government securities and short-term obligations, for the year ended October 31, 2017, were as follows:
| Purchases | $1,244,249,670 |
| Sales | $1,354,083,395 |
7. CONCENTRATION OF RISK
The Fund invests in securities of non-U.S. issuers. Political or economic developments may have an effect on the liquidity and volatility of portfolio securities and currency holdings.
8. LINE OF CREDIT
The Fund participates with certain other Federated Funds, on a several basis, in an up to $500,000,000 unsecured, 364-day, committed, revolving line of credit (LOC) agreement. The LOC was made available to finance temporarily the repurchase or redemption of shares of the Fund, failed trades, payment of dividends, settlement of trades and for other short-term, temporary or emergency general business purposes. The Fund cannot borrow under the LOC if an inter-fund loan is outstanding. The Fund's ability to borrow under the LOC also is subject to the limitations of the Act and various conditions precedent that must be satisfied before the Fund can borrow. Loans under the LOC are charged interest at a fluctuating rate per annum
Annual Shareholder Report
equal to the highest, on any day, of (a) (i) the federal funds effective rate, (ii) the one month London Interbank Offered Rate (LIBOR), and (iii) 0.0%, plus (b) a margin. The LOC also requires the Fund to pay, quarterly in arrears and at maturity, its pro rata share of a commitment fee based on the amount of the lenders' commitment that has not been utilized. As of October 31, 2017, the Fund had no outstanding loans. During the year ended October 31, 2017, the Fund did not utilize the LOC.
9. INTERFUND LENDING
Pursuant to an Exemptive Order issued by the SEC, the Fund, along with other funds advised by subsidiaries of Federated Investors, Inc., may participate in an interfund lending program. This program provides an alternative credit facility allowing the Fund to borrow from other participating affiliated funds.
As of October 31, 2017, there were no outstanding loans. During the year ended October 31, 2017, the program was not utilized.
Annual Shareholder Report
Report of Independent Registered Public Accounting Firm
TO THE BOARD OF Trustees OF Federated Equity Funds AND SHAREHOLDERS OF Federated Kaufmann Large Cap Fund:
We have audited the accompanying statement of assets and liabilities of Federated Kaufmann Large Cap Fund (the “Fund”) (one of the portfolios constituting Federated Equity Funds), including the portfolio of investments, as of October 31, 2017, and the related statement of operations for the year then ended, the statement of changes in net assets for each of the two years in the period then ended and the financial highlights for each of the years or periods indicated therein. These financial statements and financial highlights are the responsibility of the Fund's management. Our responsibility is to express an opinion on these financial statements and financial highlights based on our audits.
We conducted our audits in accordance with standards of the Public Company Accounting Oversight Board (United States). Those standards require that we plan and perform the audit to obtain reasonable assurance about whether the financial statements and financial highlights are free of material misstatement. We were not engaged to perform an audit of the Fund's internal control over financial reporting. Our audits included consideration of internal control over financial reporting as a basis for designing audit procedures that are appropriate in the circumstances, but not for the purpose of expressing an opinion on the effectiveness of the Fund's internal control over financial reporting. Accordingly, we express no such opinion. An audit also includes examining, on a test basis, evidence supporting the amounts and disclosures in the financial statements and financial highlights, assessing the accounting principles used and significant estimates made by management, and evaluating the overall financial statement presentation. Our procedures included confirmation of securities owned as of October 31, 2017, by correspondence with the custodian and others or by other appropriate auditing procedures where replies from others were not received. We believe that our audits provide a reasonable basis for our opinion.
In our opinion, the financial statements and financial highlights referred to above present fairly, in all material respects, the financial position of the Federated Kaufmann Large Cap Fund, a portfolio of Federated Equity Funds, at October 31, 2017, the results of its operations for the year then ended, the changes in its net assets for each of the two years in the period then ended and the financial highlights for each of the years or periods indicated therein, in conformity with U.S. generally accepted accounting principles.
Boston, Massachusetts
December 22, 2017
Annual Shareholder Report
Shareholder Expense Example (unaudited)
As a shareholder of the Fund, you incur two types of costs: (1) transaction costs, including sales charges (loads) on purchase or redemption payments; and (2) ongoing costs, including management fees and to the extent applicable, distribution (12b-1) fees and/or other service fees and other Fund expenses. This Example is intended to help you to understand your ongoing costs (in dollars) of investing in the Fund and to compare these costs with the ongoing costs of investing in other mutual funds. It is based on an investment of $1,000 invested at the beginning of the period and held for the entire period from May 1, 2017 to October 31, 2017.
ACTUAL EXPENSES
The first section of the table below provides information about actual account values and actual expenses. You may use the information in this section, together with the amount you invested, to estimate the expenses that you incurred over the period. Simply divide your account value by $1,000 (for example, an $8,600 account value divided by $1,000 = 8.6), then multiply the result by the number in the first section under the heading entitled “Expenses Paid During Period” to estimate the expenses attributable to your investment during this period.
HYPOTHETICAL EXAMPLE FOR COMPARISON PURPOSES
The second section of the table below provides information about hypothetical account values and hypothetical expenses based on the Fund's actual expense ratio and an assumed rate of return of 5% per year before expenses, which is not the Fund's actual return. Thus, you should not use the hypothetical account values and expenses to estimate the actual ending account balance or your expenses for the period. Rather, these figures are required to be provided to enable you to compare the ongoing costs of investing in the Fund with other funds. To do so, compare this 5% hypothetical example with the 5% hypothetical examples that appear in the shareholder reports of the other funds.
Annual Shareholder Report
Please note that the expenses shown in the table are meant to highlight your ongoing costs only and do not reflect any transaction costs, such as sales charges (loads) on purchase or redemption payments. Therefore, the second section of the table is useful in comparing ongoing costs only, and will not help you determine the relative total costs of owning different funds. In addition, if these transaction costs were included, your costs would have been higher.
| | Beginning
Account Value
5/1/2017 | Ending
Account Value
10/31/2017 | Expenses Paid
During Period1 |
| Actual: | | | |
| Class A Shares | $1,000 | $1,093.00 | $5.70 |
| Class C Shares | $1,000 | $1,088.90 | $9.79 |
| Class R Shares | $1,000 | $1,091.00 | $7.75 |
| Institutional Shares | $1,000 | $1,094.40 | $4.43 |
| Class R6 Shares | $1,000 | $1,094.70 | $4.07 |
Hypothetical (assuming a 5% return
before expenses): | | | |
| Class A Shares | $1,000 | $1,019.80 | $5.50 |
| Class C Shares | $1,000 | $1,015.80 | $9.45 |
| Class R Shares | $1,000 | $1,017.80 | $7.48 |
| Institutional Shares | $1,000 | $1,021.00 | $4.28 |
| Class R6 Shares | $1,000 | $1,021.30 | $3.92 |
| 1 | Expenses are equal to the Fund's annualized net expense ratios, multiplied by the average account value over the period, multiplied by 184/365 (to reflect the one-half-year period). The annualized net expense ratios are as follows: |
| | |
| Class A Shares | 1.08% |
| Class C Shares | 1.86% |
| Class R Shares | 1.47% |
| Institutional Shares | 0.84% |
| Class R6 Shares | 0.77% |
Annual Shareholder Report
In Memoriam
With profound sadness, Federated announces the passing of John F. (“Jack”) Donahue and John W. (“John”) McGonigle. They will be greatly missed.
Jack Donahue
(Former Chairman and President, and Emeritus Director/Trustee, of the Federated Funds, and Founder, Former Chairman, President and Chief Executive Officer, and Chairman Emeritus, of Federated Investors, Inc.)
Jack Donahue, along with Richard B. Fisher, founded Federated in 1955 and served as a leader and member of the Boards of Directors/Trustees of the Federated Funds and the Board of Directors of Federated Investors, Inc. Mr. Donahue was a family man of deep faith with exemplary character and fealty, who served his religion, family, community, and the Federated Funds and Federated, as well as their shareholders, officers and employees, with distinction. His integrity, intelligence, and keen sense of fiduciary duty, coupled with his faith, family and background as a West Point graduate and Strategic Air Command B-29 pilot, served as a foundation for his strong business acumen and leadership. Among his many achievements, Mr. Donahue's steadfast and innovative leadership of the Federated Funds and Federated, as well as within the investment management industry, led to the birth of money market funds in the 1970s and their growth as an innovative, efficient and effective cash management vehicle throughout the 1980s, 1990s, 2000s and beyond. Federated expresses deep gratitude to Mr. Donahue for his inspiring leadership, distinguished service and contributions as a husband, father, founder, Board member and officer, colleague and friend.
John McGonigle
(Former Secretary of the Federated Funds, Former Director, Secretary and Chief Legal Officer of Federated Investors, Inc.)
John McGonigle served the Federated Funds and their respective Boards with distinction for more than 50 years as Fund Secretary and also served as Director for several closed-end funds. Mr. McGonigle was a gifted lawyer and wise counselor with a genial presence, keen intellect and convivial demeanor. A man of deep faith, he was a devoted husband, father and grandfather. A graduate of Duquesne University School of Law, Mr. McGonigle served as an officer in the U.S. Army for two years, achieving the rank of Captain. He also served on the staff of the Securities and Exchange Commission before joining Federated in 1966. Among many professional accomplishments, Mr. McGonigle helped fashion the regulatory foundation for money market funds, established Federated's first offshore funds in Ireland, and represented Federated on the Board of Governors of the Investment Company Institute where he was a member of the Executive Committee. Federated expresses deep gratitude for Mr. McGonigle and his impact on his family, friends, the community, and the mutual fund industry.
Annual Shareholder Report
Board of Trustees and Trust Officers
The Board of Trustees is responsible for managing the Trust's business affairs and for exercising all the Trust's powers except those reserved for the shareholders. The following tables give information about each Trustee and the senior officers of the Fund. Where required, the tables separately list Trustees who are “interested persons” of the Fund (i.e., “Interested” Trustees) and those who are not (i.e., “Independent” Trustees). Unless otherwise noted, the address of each person listed is Federated Investors Tower, 1001 Liberty Avenue, Pittsburgh, PA 15222. The address of all Independent Trustees listed is 4000 Ericsson Drive, Warrendale, PA 15086-7561; Attention: Mutual Fund Board. As of December 31, 2016, the Trust comprised 14 portfolio(s), and the Federated Fund Family consisted of 40 investment companies (comprising 124 portfolios). Unless otherwise noted, each Officer is elected annually. Unless otherwise noted, each Trustee oversees all portfolios in the Federated Fund Family and serves for an indefinite term. The Fund's Statement of Additional Information includes additional information about Trust Trustees and is available, without charge and upon request, by calling 1-800-341-7400.
Interested Trustees Background
Name
Birth Date
Positions Held with Trust
Date Service Began | Principal Occupation(s) for Past Five Years,
Other Directorships Held and Previous Position(s) |
J. Christopher Donahue*
Birth Date: April 11, 1949
President and Trustee
Indefinite Term
Began serving: January 2000 | Principal Occupations: Principal Executive Officer and President of certain of the Funds in the Federated Fund Family; Director or Trustee of the Funds in the Federated Fund Family; President, Chief Executive Officer and Director, Federated Investors, Inc.; Chairman and Trustee, Federated Investment Management Company; Trustee, Federated Investment Counseling; Chairman and Director, Federated Global Investment Management Corp.; Chairman and Trustee, Federated Equity Management Company of Pennsylvania; Trustee, Federated Shareholder Services Company; Director, Federated Services Company.
Previous Positions: President, Federated Investment Counseling; President and Chief Executive Officer, Federated Investment Management Company, Federated Global Investment Management Corp. and Passport Research, Ltd; Chairman, Passport Research, Ltd. |
Annual Shareholder Report
Name
Birth Date
Positions Held with Trust
Date Service Began | Principal Occupation(s) for Past Five Years,
Other Directorships Held and Previous Position(s) |
John B. Fisher*
Birth Date: May 16, 1956
Trustee
Indefinite Term
Began serving: May 2016 | Principal Occupations: Principal Executive Officer and President of certain of the Funds in the Federated Fund Family; Director or Trustee of certain of the Funds in the Federated Fund Family; Vice President, Federated Investors, Inc.; President, Director/Trustee and CEO, Federated Advisory Services Company, Federated Equity Management Company of Pennsylvania, Federated Global Investment Management Corp., Federated Investment Counseling, Federated Investment Management Company; President of some of the Funds in the Federated Fund Complex and Director, Federated Investors Trust Company.
Previous Positions: President and Director of the Institutional Sales Division of Federated Securities Corp.; President and Director of Federated Investment Counseling; President and CEO of Passport Research, Ltd.; Director, Edgewood Securities Corp.; Director, Federated Services Company; Director, Federated Investors, Inc.; Chairman and Director, Southpointe Distribution Services, Inc. and President, Technology, Federated Services Company. |
| * | Reasons for “interested” status: J. Christopher Donahue and John B. Fisher are interested due to their beneficial ownership of shares of Federated Investors, Inc. and due to positions they hold with Federated and its subsidiaries. |
INDEPENDENT Trustees Background
Name
Birth Date
Positions Held with Trust
Date Service Began | Principal Occupation(s) for Past Five Years,
Other Directorships Held, Previous Position(s) and Qualifications |
John T. Collins
Birth Date: January 24, 1947
Trustee
Indefinite Term
Began serving: October 2013 | Principal Occupations: Director or Trustee of the Federated Fund Family; formerly, Chairman and CEO, The Collins Group, Inc. (a private equity firm) (Retired).
Other Directorships Held: Director, Current Chair of the Compensation Committee, KLX Corp.
Qualifications: Mr. Collins has served in several business and financial management roles and directorship positions throughout his career. Mr. Collins previously served as Chairman and CEO, The Collins Group, Inc. (a private equity firm). Mr. Collins serves as Chairman Emeriti, Bentley University. Mr. Collins previously served as Director and Audit Committee Member, Bank of America Corp.; Director, FleetBoston Financial Corp.; and Director, Beth Israel Deaconess Medical Center (Harvard University Affiliate Hospital). |
Annual Shareholder Report
Name
Birth Date
Positions Held with Trust
Date Service Began | Principal Occupation(s) for Past Five Years,
Other Directorships Held, Previous Position(s) and Qualifications |
G. Thomas Hough
Birth Date: February 28, 1955
Trustee
Indefinite Term
Began serving: August 2015 | Principal Occupations: Director or Trustee of the Federated Fund Family; formerly, Vice Chair, Ernst & Young LLP (public accounting firm) (Retired).
Other Directorships Held: Director, Chair of the Audit Committee, Governance Committee, Publix Super Markets, Inc.; Director, Member of the Audit Committee and Technology Committee of Equifax, Inc.
Qualifications: Mr. Hough has served in accounting, business management and directorship positions throughout his career. Mr. Hough most recently held the position of Americas Vice Chair of Assurance with Ernst & Young LLP (public accounting firm). Mr. Hough is an Executive Committee member of the United States Golf Association, he serves on the President's Cabinet and Business School Board of Visitors for the University of Alabama and is on the Business School Board of Visitors for Wake Forest University. |
Maureen Lally-Green
Birth Date: July 5, 1949
Trustee
Indefinite Term
Began serving: August 2009 | Principal Occupations: Director or Trustee of the Federated Fund Family; Dean of the Duquesne University School of Law; Adjunct Professor of Law, Duquesne University School of Law; formerly, Interim Dean of the Duquesne University School of Law; Associate General Secretary and Director, Office of Church Relations, Diocese of Pittsburgh.
Other Directorships Held: Director, CONSOL Energy Inc.
Qualifications: Judge Lally-Green has served in various legal and business roles and directorship positions throughout her career. Judge Lally-Green previously served as: Associate General Secretary, Diocese of Pittsburgh; a member of the Superior Court of Pennsylvania; and as a Professor of Law, Duquesne University School of Law. Judge Lally-Green also currently holds the positions on either a public or not for profit Board of Directors as follows: Director and Chair, UPMC Mercy Hospital; Regent, St. Vincent Seminary; Director and Vice Chair, Our Campaign for the Church Alive!, Inc.; Director, Saint Vincent College; Member, Pennsylvania State Board of Education (public); and Director and Chair, Cardinal Wuerl North Catholic High School, Inc. Judge Lally-Green has held the positions of: Director, Auberle; Director, Epilepsy Foundation of Western and Central Pennsylvania; Director, Ireland Institute of Pittsburgh; Director, Saint Thomas More Society; Director, Catholic High Schools of the Diocese of Pittsburgh, Inc.; and Director, Pennsylvania Bar Institute. |
Peter E. Madden
Birth Date: March 16, 1942
Trustee
Indefinite Term
Began serving: November 1991 | Principal Occupation: Director or Trustee, and Chair of the Board of Directors or Trustees, of the Federated Fund Family; Retired.
Other Directorships Held: None.
Qualifications: Mr. Madden has served in several business management, mutual fund services and directorship positions throughout his career. Mr. Madden previously served as President, Chief Operating Officer and Director, State Street Bank and Trust Company (custodian bank) and State Street Corporation (financial services). He was Director, VISA USA and VISA International and Chairman and Director, Massachusetts Bankers Association. Mr. Madden served as Director, Depository Trust Corporation and Director, The Boston Stock Exchange. Mr. Madden also served as a Representative to the Commonwealth of Massachusetts General Court. |
Annual Shareholder Report
Name
Birth Date
Positions Held with Trust
Date Service Began | Principal Occupation(s) for Past Five Years,
Other Directorships Held, Previous Position(s) and Qualifications |
Charles F. Mansfield, Jr.
Birth Date: April 10, 1945
Trustee
Indefinite Term
Began serving: January 1999 | Principal Occupations: Director or Trustee of the Federated Fund Family; Management Consultant.
Other Directorships Held: None.
Qualifications: Mr. Mansfield has served as a Marine Corps officer and in several banking, business management, educational roles and directorship positions throughout his long career. He remains active as a Management Consultant. |
Thomas M. O'Neill
Birth Date: June 14, 1951
Trustee
Indefinite Term
Began serving: October 2006 | Principal Occupations: Director or Trustee, Chair of the Audit Committee of the Federated Fund Family; Sole Proprietor, Navigator Management Company (investment and strategic consulting).
Other Directorships Held: None.
Qualifications: Mr. O'Neill has served in several business, mutual fund and financial management roles and directorship positions throughout his career. Mr. O'Neill serves as Director, Medicines for Humanity and Director, The Golisano Children's Museum of Naples, Florida. Mr. O'Neill previously served as Chief Executive Officer and President, Managing Director and Chief Investment Officer, Fleet Investment Advisors; President and Chief Executive Officer, Aeltus Investment Management, Inc.; General Partner, Hellman, Jordan Management Co., Boston, MA; Chief Investment Officer, The Putnam Companies, Boston, MA; Credit Analyst and Lending Officer, Fleet Bank; Director and Consultant, EZE Castle Software (investment order management software); and Director, Midway Pacific (lumber). |
P. Jerome Richey
Birth Date: February 23, 1949
Trustee
Indefinite Term
Began serving: October 2013 | Principal Occupations: Director or Trustee of the Federated Fund Family; Management Consultant; formerly, Senior Vice Chancellor and Chief Legal Officer, University of Pittsburgh and Executive Vice President and Chief Legal Officer, CONSOL Energy Inc.
Other Directorships Held: None.
Qualifications: Mr. Richey has served in several business and legal management roles and directorship positions throughout his career. Mr. Richey most recently held the positions of Senior Vice Chancellor and Chief Legal Officer, University of Pittsburgh. Mr. Richey previously served as Chairman of the Board, Epilepsy Foundation of Western Pennsylvania and Chairman of the Board, World Affairs Council of Pittsburgh. Mr. Richey previously served as Chief Legal Officer and Executive Vice President, CONSOL Energy Inc.; and Board Member, Ethics Counsel and Shareholder, Buchanan Ingersoll & Rooney PC (a law firm). |
Annual Shareholder Report
Name
Birth Date
Positions Held with Trust
Date Service Began | Principal Occupation(s) for Past Five Years,
Other Directorships Held, Previous Position(s) and Qualifications |
John S. Walsh
Birth Date: November 28, 1957
Trustee
Indefinite Term
Began serving: January 1999 | Principal Occupations: Director or Trustee of the Federated Fund Family; President and Director, Heat Wagon, Inc. (manufacturer of construction temporary heaters); President and Director, Manufacturers Products, Inc. (distributor of portable construction heaters); President, Portable Heater Parts, a division of Manufacturers Products, Inc.
Other Directorships Held: None.
Qualifications: Mr. Walsh has served in several business management roles and directorship positions throughout his career. Mr. Walsh previously served as Vice President, Walsh & Kelly, Inc. (paving contractors). |
OFFICERS
Name
Birth Date
Address
Positions Held with Trust
Date Service Began | Principal Occupation(s) for Past Five Years
and Previous Position(s) |
Lori A. Hensler
Birth Date: January 6, 1967
TREASURER
Officer since: April 2013 | Principal Occupations: Principal Financial Officer and Treasurer of the Federated Fund Family; Senior Vice President, Federated Administrative Services; Financial and Operations Principal for Federated Securities Corp. and Edgewood Services, Inc.; and Assistant Treasurer, Federated Investors Trust Company. Ms. Hensler has received the Certified Public Accountant designation.
Previous Positions: Controller of Federated Investors, Inc.; Senior Vice President and Assistant Treasurer, Federated Investors Management Company; Treasurer, Federated Investors Trust Company; Assistant Treasurer, Federated Administrative Services, Federated Administrative Services, Inc., Federated Securities Corp., Edgewood Services, Inc., Federated Advisory Services Company, Federated Equity Management Company of Pennsylvania, Federated Global Investment Management Corp., Federated Investment Counseling, Federated Investment Management Company, Passport Research, Ltd., and Federated MDTA, LLC; Financial and Operations Principal for Federated Securities Corp., Edgewood Services, Inc. and Southpointe Distribution Services, Inc. |
Richard B. Fisher
Birth Date: May 17, 1923
VICE PRESIDENT
Officer since: April 1987 | Principal Occupations: Vice Chairman or Vice President of some of the Funds in the Federated Fund Family; Vice Chairman, Federated Investors, Inc.; Chairman, Federated Securities Corp.
Previous Positions: President and Director or Trustee of some of the Funds in the Federated Fund Family; Executive Vice President, Federated Investors, Inc.; Director and Chief Executive Officer, Federated Securities Corp. |
Annual Shareholder Report
Name
Birth Date
Address
Positions Held with Trust
Date Service Began | Principal Occupation(s) for Past Five Years
and Previous Position(s) |
Peter J. Germain
Birth Date: September 3, 1959
CHIEF LEGAL OFFICER, SECRETARY and EXECUTIVE VICE PRESIDENT
Officer since: January 2005 | Principal Occupations: Mr. Germain is Chief Legal Officer, Secretary and Executive Vice President of the Federated Fund Family. He is General Counsel, Chief Legal Officer, Secretary and Executive Vice President, Federated Investors, Inc.; Trustee and Senior Vice President, Federated Investors Management Company; Trustee and President, Federated Administrative Services; Director and President, Federated Administrative Services, Inc.; Director and Vice President, Federated Securities Corp.; Director and Secretary, Federated Private Asset Management, Inc.; Secretary, Federated Shareholder Services Company; and Secretary, Retirement Plan Service Company of America. Mr. Germain joined Federated in 1984 and is a member of the Pennsylvania Bar Association.
Previous Positions: Deputy General Counsel, Special Counsel, Managing Director of Mutual Fund Services, Federated Investors, Inc.; Senior Vice President, Federated Services Company; and Senior Corporate Counsel, Federated Investors, Inc. |
Stephen Van Meter
Birth Date: June 5, 1975
CHIEF COMPLIANCE OFFICER AND SENIOR VICE PRESIDENT
Officer since: July 2015 | Principal Occupations: Senior Vice President and Chief Compliance Officer of the Federated Fund Family; Vice President and Chief Compliance Officer of Federated Investors, Inc. and Chief Compliance Officer of certain of its subsidiaries. Mr. Van Meter joined Federated in October 2011. He holds FINRA licenses under Series 3, 7, 24 and 66.
Previous Positions: Mr. Van Meter previously held the position of Compliance Operating Officer, Federated Investors, Inc. Prior to joining Federated, Mr. Van Meter served at the United States Securities and Exchange Commission in the positions of Senior Counsel, Office of Chief Counsel, Division of Investment Management and Senior Counsel, Division of Enforcement. |
Stephen F. Auth
Birth Date: September 13, 1956
101 Park Avenue
41st Floor
New York, NY 10178
CHIEF INVESTMENT OFFICER
Officer since: November 2002 | Principal Occupations: Stephen F. Auth is Chief Investment Officer of various Funds in the Federated Fund Family; Executive Vice President, Federated Investment Counseling, Federated Global Investment Management Corp. and Federated Equity Management Company of Pennsylvania.
Previous Positions: Executive Vice President, Federated Investment Management Company and Passport Research, Ltd. (investment advisory subsidiary of Federated); Senior Vice President, Global Portfolio Management Services Division; Senior Vice President, Federated Investment Management Company and Passport Research, Ltd.; Senior Managing Director and Portfolio Manager, Prudential Investments. |
Annual Shareholder Report
Evaluation and Approval of Advisory Contract–May 2017
Federated Kaufmann Large Cap Fund (the “Fund”)
Following a review and recommendation of approval by the Fund's independent trustees, the Fund's Board of Trustees (the “Board”) reviewed and unanimously approved the continuation of the Fund's investment advisory and subadvisory contracts for an additional one-year term at its May 2017 meetings. The Board's decision regarding these contracts reflects the exercise of its business judgment after considering all of the information received on whether to continue the existing arrangements.
The Board had previously appointed a Senior Officer, whose duties include specified responsibilities relating to the process by which advisory fees are to be charged to a Federated fund. The Senior Officer has the authority to retain consultants, experts, or staff as may be reasonably necessary to assist in the performance of his duties, reports directly to the Board, and may be terminated only with the approval of a majority of the independent members of the Board. The Senior Officer prepared and furnished to the Board an independent, written evaluation that covered topics discussed below (the “Senior Officer's Evaluation”). The Board considered the Senior Officer's Evaluation, along with other information, in deciding to approve the investment advisory and subadvisory contracts.
The Board also considered judicial decisions concerning allegedly excessive investment advisory fees in its decision. Using these judicial decisions as a guide, the Board has indicated that the following factors may be relevant to an adviser's fiduciary duty with respect to its receipt of compensation from a fund: (1) the nature and quality of the services provided by an adviser to a fund and its shareholders (including the performance of the Fund and of comparable funds); (2) an adviser's cost of providing the services (including the profitability to an adviser of providing advisory services to a fund); (3) the extent to which an adviser may realize “economies of scale” as a fund grows larger and, if such economies of scale exist, whether they have been shared with a fund and its shareholders or the family of funds; (4) any “fall-out financial benefits” that accrue to an adviser because of its relationship with a fund (including research services received from brokers that execute fund trades and any fees paid to affiliates of an adviser for services rendered to a fund); (5) comparative fee and expense structures (including a comparison of fees paid to an adviser with those paid by similar funds); and (6) the extent of care, conscientiousness and independence with which the Fund's board members perform their duties and their expertise (including whether they are fully informed about all facts the Board deems relevant to its consideration of an adviser's services and fees). The Board noted that the Securities and Exchange Commission (“SEC”) disclosure requirements regarding the basis for the Board's approval of the Fund's investment advisory and subadvisory contracts generally align with the factors
Annual Shareholder Report
listed above. Consistent with the judicial decisions and SEC disclosure requirements, the Board also considered management fees charged to institutional and other clients of Federated Equity Management Company of Pennsylvania (the “Adviser”) and any subadviser and their advisory affiliates, for what might be viewed as like services. The Board was aware of these factors and was guided by them in its review of the Fund's investment advisory and subadvisory contracts to the extent it considered them to be appropriate and relevant, as discussed further below.
The Board considered and weighed these factors in light of its substantial accumulated experience in governing the Fund and working with Federated Investors, Inc. and its affiliates (“Federated”) on matters relating to the Federated funds. The Board was assisted in its deliberations by independent legal counsel. In addition to the extensive materials that comprise and accompany the Senior Officer's Evaluation, the Board received detailed information about the Fund and the Federated organization throughout the year, and in connection with its May meetings. Federated provided much of this information at each regular meeting of the Board, and furnished additional information in connection with the May meetings at which the Board's formal approval of the investment advisory and subadvisory contracts occurred. At the May meetings, in addition to meeting in separate sessions of the independent trustees without management present, senior management of the Adviser also met with the independent trustees and their counsel to discuss the materials presented and any other matters thought relevant by the Adviser or the trustees. Between regularly scheduled meetings, the Board also received information on particular matters as the need arose. The Board's consideration of the investment advisory and subadvisory contracts included review of the Senior Officer's Evaluation, accompanying data and additional information covering such matters as: the Adviser's and subadviser's investment philosophy, revenue, profitability, personnel and processes; investment and operating strategies; the Fund's short-term and long-term performance (in absolute terms, both on a gross basis and net of expenses, as well as in terms relative to its particular investment program and certain competitor or “peer group” funds and/or other benchmarks, as appropriate) and comments on the reasons for performance; the Fund's investment objectives; the Fund's expenses, including the advisory fee and the overall expense structure of the Fund (both in absolute terms and relative to similar and/or competing funds), with due regard for contractual or voluntary expense limitations; the use and allocation of brokerage commissions derived from trading the Fund's portfolio securities (if any); and the nature, quality and extent of the advisory and other services provided to the Fund by the Adviser and its affiliates. The Board also considered the preferences and expectations of Fund shareholders; the entrepreneurial risk assumed by the Adviser in sponsoring the Fund; the continuing state of competition in the mutual fund industry and market practices; the range of comparable fees for similar funds in the mutual fund industry; the Fund's relationship to the Federated funds which
Annual Shareholder Report
include a comprehensive array of funds with different investment objectives, policies and strategies which are generally available for exchange without the incurrence of additional sales charges; compliance and audit reports concerning the Federated funds and the Federated companies that service them (including communications from regulatory agencies), as well as Federated's responses to any issues raised therein; and relevant developments in the mutual fund industry and how the Federated funds and/or Federated are responding to them. The Board also considered that the longevity and experience of the Fund's portfolio management team and their unique approach to investing may limit the utility of comparisons to other equity mutual funds. The Board's evaluation process is evolutionary. The criteria considered and the emphasis placed on relevant criteria change in recognition of changing circumstances in the mutual fund marketplace.
While mindful that courts have cautioned against giving such comparisons too much weight, the Board has found the use of comparisons of the Fund's fees and expenses to other mutual funds with comparable investment programs to be relevant to its deliberations. In this regard, the Board was presented with, and considered, information regarding the contractual advisory fee rates, net advisory fee rates, total expense ratios and each element of the Fund's total expense ratio (i.e., gross and net advisory fees, custody fees, portfolio accounting fees and transfer agency fees) relative to the Fund's peers. The Board focused on comparisons with other similar mutual funds more heavily than non-mutual fund products or services because it is believed that they are more relevant. For example, other mutual funds are the products most like the Fund, in that they are readily available to Fund shareholders as alternative investment vehicles. Also, they are the type of investment vehicle, in fact, chosen and maintained by the Fund's investors. The range of their fees and expenses, therefore, appears to be a relevant indicator of what consumers have found to be reasonable in the marketplace in which the Fund competes.
The Board reviewed the contractual advisory fee rate, net advisory fee rate where partially waived and other expenses of the Fund and noted the position of the Fund's fee rates relative to its peers. In this regard, the Board noted that the contractual advisory fee rate was above the median of the relevant peer group, but the Board noted the applicable waivers and reimbursements, and that the overall expense structure of the Fund remained competitive in the context of other factors considered by the Board.
For comparison, the Senior Officer has reviewed Federated's fees for providing advisory services to products outside the Federated funds (e.g., institutional and separate accounts and sub-adviser services). He concluded that mutual funds and institutional accounts are inherently different products. Those differences include, but are not limited to, different types of targeted investors; being subject to different laws and regulations; different legal structures; different average account sizes and portfolio management techniques made necessary by different cash flows and different associated costs; and the time spent by portfolio
Annual Shareholder Report
managers and their teams, funds financial services, legal, compliance and risk management in reviewing securities pricing, addressing different administrative responsibilities, addressing different degrees of risk associated with management and a variety of different costs. The Senior Officer did not consider the fees for providing advisory services to these outside products to be determinative in judging the appropriateness of mutual fund advisory fees.
The Senior Officer noted that the services, administrative responsibilities and risk associated with such relationships are quite different than serving as a primary adviser to a fund.
Following such evaluation, and full deliberations, the Board concluded that the expenses of the Fund are reasonable and supported renewal of the Fund's investment advisory and subadvisory contracts.
The Board considered the nature, extent and quality of the services provided to the Fund by the Adviser and the resources of the Adviser and its affiliates dedicated to the Fund. In this regard, the Board evaluated, among other things, the Adviser's personnel, experience, track record, overall reputation and willingness to invest in personnel and infrastructure that benefit the Fund. In addition, the Board reviewed the qualifications, backgrounds and responsibilities of the portfolio management team primarily responsible for the day-to-day management of the Fund. The Board noted the compliance programs of and the compliance-related resources provided to the Fund by the Adviser. The Fund's ability to deliver competitive performance when compared to its peer group was also deemed to be relevant by the Board as a useful indicator of how the Adviser is executing the Fund's investment program. The Adviser's ability to execute this program was one of the Board's considerations in reaching a conclusion that the nature, extent, and quality of the Adviser's investment management services warrant the continuation of the investment advisory and subadvisory contracts.
In evaluating the Fund's investment performance, the Board considered performance results in light of the Fund's investment objective, strategies and risks, as disclosed in the Fund's prospectus. The Board particularly considered detailed investment reports on the Fund's performance that were provided to the Board throughout the year and in connection with the May meetings. The Senior Officer also reviewed information compiled by Federated, using data supplied by independent fund ranking organizations, regarding the performance of, and fees charged by, other mutual funds, noting his view that comparisons to fund peer groups may be helpful, though not conclusive, in judging the reasonableness of the proposed fees. The Board considered, in evaluating such comparisons, that in some cases individual funds may exhibit significant and unique differences in their objectives and management techniques when compared to other funds within an industry peer group.
For the one-year, three-year and five-year periods covered by the Senior Officer's Evaluation, the Fund's performance was above the median of the relevant peer group.
Annual Shareholder Report
Following such evaluation and full deliberations, the Board concluded that the performance of the Fund supported renewal of the Fund's investment advisory and subadvisory contracts.
The Board also received financial information about Federated, including information regarding the compensation and ancillary (or “fall-out”) benefits Federated derived from its relationships with the Federated funds. This information covered not only the fees under the investment advisory contracts, but also fees received by Federated's subsidiaries for providing other services to the Federated funds under separate contracts (e.g., for serving as the Federated funds' administrator). The information also detailed any indirect benefit Federated may derive from its receipt of research services from brokers who execute Federated fund trades. In addition, the Board considered the fact that, in order for a fund to be competitive in the marketplace, Federated and its affiliates frequently waived fees and/or reimbursed expenses and have disclosed to Fund investors and/or indicated to the Board their intention to do so in the future. Moreover, the Board receives regular reporting as to the institution, adjustment or elimination of these voluntary waivers. The Board considered Federated's previous reductions in contractual management fees to certain funds in response to the Senior Officer's recommendations.
Federated furnished information, requested by the Senior Officer, that reported revenues on a fund-by-fund basis and made estimates of the allocation of expenses on a fund-by-fund basis, using allocation methodologies specified by the Senior Officer. The Senior Officer noted that, while these cost allocation reports apply consistent allocation processes, the inherent difficulties in allocating costs continues to cause the Senior Officer to question the precision of the process and to conclude that such reports may be unreliable, since a single change in an allocation estimate may dramatically alter the resulting estimate of cost and/or profitability of a fund and may produce unintended consequences. The allocation information, including the Senior Officer's view that fund-by-fund estimations may be unreliable, was considered in the analysis by the Board.
The Board and the Senior Officer also reviewed information compiled by Federated comparing its profitability information to other publicly held fund management companies. In this regard, the Senior Officer concluded that Federated's profit margins did not appear to be excessive. The Senior Officer also noted that Federated appeared financially sound, with the resources to fulfill its obligations under its contracts with the Fund.
The Senior Officer's Evaluation also discussed the notion of possible realization of “economies of scale” as a fund grows larger. In this regard, the Board considered that the Adviser has made significant and long-term investments in areas that support all of the Federated funds, such as personnel and processes for the portfolio management, shareholder services, compliance, internal audit and risk management functions, as well as systems technology (including technology relating to cybersecurity,) and that the benefits of these efforts (as well as any economies of scale, should they exist) were likely to be
Annual Shareholder Report
enjoyed by the fund family as a whole. The Board noted that the Adviser's investments in these areas are extensive. In addition, the Board considered that Federated and its affiliates have frequently waived fees and/or reimbursed expenses and that this has allowed fund shareholders to share potential economies of scale from a fund's inception. Federated, as it does throughout the year, and in connection with the Board's review, furnished information relative to revenue sharing or adviser paid fees. Federated and the Senior Officer noted that this information should be viewed to determine if there was an incentive to either not apply breakpoints or to apply breakpoints at higher levels. It should not be viewed to determine the appropriateness of advisory fees, because it would represent marketing and distribution expenses. Finally, the Board also noted the absence of any applicable regulatory or industry guidelines on this subject, which (as discussed in the Senior Officer's Evaluation) is compounded by the lack of any common industry practice or general pattern with respect to structuring fund advisory fees with “breakpoints” that serve to reduce the fee as a fund attains a certain size.
While the Senior Officer noted certain items for follow-up reporting to the Board and further consideration by management, he stated that his observations and information accompanying the Senior Officer's Evaluation supported a finding by the Board that the management fee the Fund was reasonable. Under these circumstances, no changes were recommended to, and no objection was raised to, the continuation of the Fund's investment advisory and subadvisory contracts.
In its decision to continue an existing investment advisory contract, the Board was mindful of the potential disruptions of the Fund's operations and various risks, uncertainties and other effects that could occur as a result of a decision to terminate or not renew an investment advisory contract. In particular, the Board recognized that many shareholders have invested in the Fund on the strength of the Adviser's industry standing and reputation and with the expectation that the Adviser will have a continuing role in providing advisory services to the Fund. Thus, the Board's approval of the advisory and subadvisory contracts reflected the fact that it is the shareholders who have effectively selected the Adviser by virtue of having invested in the Fund. The Board concluded that, in light of the factors discussed above, including the nature, quality and scope of the services provided to the Fund by the Adviser and its affiliates, continuation of the investment advisory contract was appropriate.
The Board based its decision to approve the investment advisory and subadvisory contracts on the totality of the circumstances and relevant factors and with a view to past and future long-term considerations. Not all of the factors and considerations identified above were necessarily relevant to the Fund, nor did the Board consider any one of them to be determinative. With
Annual Shareholder Report
respect to the factors that were relevant, the Board's decision to approve the continuation of the contracts reflects its determination that Federated's performance and actions provided a satisfactory basis to support the decision to continue the existing arrangements.
Annual Shareholder Report
Voting Proxies on Fund Portfolio Securities
A description of the policies and procedures that the Fund uses to determine how to vote proxies, if any, relating to securities held in the Fund's portfolio is available, without charge and upon request, by calling 1-800-341-7400. A report on “Form N-PX” of how the Fund voted any such proxies during the most recent 12-month period ended June 30 is available via the Proxy Voting Record (Form N-PX) link associated with the Fund and share class name at www.FederatedInvestors.com/FundInformation. Form N-PX filings are also available at the SEC's website at www.sec.gov.
Quarterly Portfolio Schedule
The Fund files with the SEC a complete schedule of its portfolio holdings, as of the close of the first and third quarters of its fiscal year, on “Form N-Q.” These filings are available on the SEC's website at www.sec.gov and may be reviewed and copied at the SEC's Public Reference Room in Washington, DC. (Call 1-800-SEC-0330 for information on the operation of the Public Reference Room.) You may also access this information via the link to the Fund and share class name at www.FederatedInvestors.com/FundInformation.
Annual Shareholder Report
Mutual funds are not bank deposits or obligations, are not guaranteed by any bank and are not insured or guaranteed by the U.S. government, the Federal Deposit Insurance Corporation, the Federal Reserve Board or any other government agency. Investment in mutual funds involves investment risk, including the possible loss of principal.
This Report is authorized for distribution to prospective investors only when preceded or accompanied by the Fund's Prospectus, which contains facts concerning its objective and policies, management fees, expenses and other information.
Federated Kaufmann Large Cap Fund
Federated Investors Funds
4000 Ericsson Drive
Warrendale, PA 15086-7561
Contact us at FederatedInvestors.com
or call 1-800-341-7400.
Federated Securities Corp., Distributor
CUSIP 314172446
CUSIP 314172438
CUSIP 314172420
CUSIP 314172412
CUSIP 314172131
39667 (12/17)
Federated is a registered trademark of Federated Investors, Inc.
2017 ©Federated Investors, Inc.
Annual Shareholder Report
October 31, 2017
| Share Class | Ticker | A | FKASX | B | FKBSX | C | FKCSX |
| | R | FKKSX | Institutional | FKAIX | R6 | FKALX |
Federated Kaufmann Small Cap Fund
Fund Established 2002
A Portfolio of Federated Equity Funds
Dear Valued Shareholder,
I am pleased to present the Annual Shareholder Report for your fund covering the period from November 1, 2016 through October 31, 2017. This report includes Management's Discussion of Fund Performance, a complete listing of your fund's holdings, performance information and financial statements along with other important fund information.
In addition, our website, FederatedInvestors.com, offers easy access to Federated resources that include timely fund updates, economic and market insights from our investment strategists, and financial planning tools. We invite you to register to take full advantage of its capabilities.
Thank you for investing with Federated. I hope you find this information useful and look forward to keeping you informed.
Sincerely,
J. Christopher Donahue, President
Not FDIC Insured ■ May Lose Value ■ No Bank Guarantee
CONTENTS
| 1 |
| 5 |
| 6 |
| 16 |
| 22 |
| 24 |
| 26 |
| 27 |
| 39 |
| 40 |
| 43 |
| 44 |
| 50 |
| 57 |
| 57 |
Management's Discussion of Fund Performance (unaudited)
The total return of Federated Kaufmann Small Cap Fund (the “Fund”), based on net asset value for the 12-month reporting period ended October 31, 2017, was 37.12% for the Class A Shares, 36.33% for the Class B Shares, 36.38% for the Class C Shares, 37.17% for the Class R Shares, 37.74% for the Institutional Shares and 37.21% for the Class R6 Shares.1 The total return of the Russell 2000® Growth Index (R2000G),2 the Fund's broad-based securities market index, was 31.00% for the same period. The total return of the Morningstar Small Growth Funds Average (MSGFA),3 a peer group average for the Fund, was 28.98% for the same period. The Fund's and MSGFA's total returns for the most recently completed fiscal year reflected actual cash flows, transaction costs and other expenses, which were not reflected in the total return of the R2000G.
During the reporting period, the Fund's investment strategy focused on stock selection, sector exposure, international exposure4 and the effect of cash holdings. These were the most significant factors affecting the Fund's performance relative to the R2000G.
The following discussion will focus on the performance of the Fund's Institutional Shares.
Market Overview
During the reporting period, global equity markets increased significantly as economies around the world improved seemingly in unison. The U.S. Federal Reserve (the “Fed”) raised its target rate three times during the reporting period. Despite these rate increases, the U.S. Dollar Index5 and the dollar relative to the euro weakened as the global economy picked up steam. U.S. Gross Domestic Product also accelerated from its lower pace of the last 8 years in the second and third quarters of 2017. As global Central Banks reversed their easing policies in western countries, economies reacted positively. The new U.S. administration's deregulation momentum gave a lift to business confidence and the anticipation of tax reform boosted investment domestically.
Stock Selection
The key factor affecting Fund performance from a macroeconomic standpoint was improving U.S. economic fundamentals, as well as accommodative monetary policies by the Fed and other central banks. Profitability of many of the companies in which the Fund invested remained strong throughout the reporting period. Fund management continued to find attractive small-cap growth investment opportunities–companies that are dominant competitors and that have strengthening fundamentals potentially delivering both near-term and long-term growth in sales and earnings.
Annual Shareholder Report
The outperformance of the Fund versus the R2000G was due to stock selection particularly in the Information Technology and Health Care sectors. Individual companies that most contributed to performance during the reporting period were: Corcept Therapeutics, Ichor Holdings, AnaptysBio, Shopify and Veeva Systems. Laggard companies that hurt relative Fund performance were: Minerva Neurosciences, DexCom Inc., J. Jill Inc., Otonomy and AMC Entertainment.
Sector Exposure
At the end of the reporting period, approximately 80% of the portfolio was invested in four large sectors: Information Technology, Health Care, Consumer Discretionary and Industrials. These sectors have historically provided good opportunities for bottom-up growth investors.
International Exposure
Stock selection of companies domiciled outside the U.S. was a positive contributor to Fund performance during the reporting period. Approximately 10.8% of the Fund's assets were invested in such companies as of the end of the reporting period and this helped relative performance.
Effect of Cash Holdings
The Fund had an average cash position of 5.13%. In a rising market, the cash holdings resulted in a modest drag on relative performance versus the R2000G.
| 1 | The Fund's Class R6 Shares commenced operations on September 1, 2017. For the period prior to commencement of operations of the Class R6 Shares, the performance information shown is for the A class adjusted for the removal of any voluntary waivers/reimbursements of fund expenses that may have occurred prior to the commencement of operations of the Class R6 Shares. |
| 2 | Please see the footnotes to the line graphs below for definitions of, and further information about, the R2000G. |
| 3 | Please see the footnotes to the line graphs below for definitions of, and further information about, the MSGFA. |
| 4 | International investing involves special risks including currency risk, increased volatility, political risks and differences in auditing and other financial standards. Small company stocks may be less liquid and subject to greater price volatility than large capitalization stocks. |
| 5 | The U.S. Dollar Index indicates the general international value of the U.S. dollar by averaging the exchange rates between the U.S. dollar and six major world currencies. The index is unmanaged, and it is not possible to invest directly in an index. |
Annual Shareholder Report
FUND PERFORMANCE AND GROWTH OF A $10,000 INVESTMENT
The graph below illustrates the hypothetical investment of $10,0001 in the Federated Kaufmann Small Cap Fund from October 31, 2007 to October 31, 2017, compared to the Russell 2000® Growth Index (R2000G)2 and the Morningstar Small Growth Funds Average (MSGFA).3 The Average Annual Total Return table below shows returns for each class averaged over the stated periods.
Growth of a $10,000 Investment–CLASS A SHARES and institutional shares
Growth of $10,000 as of October 31, 2017

| Federated Kaufmann Small Cap Fund - | Institutional Shares | Class A Shares | R2000G | MSGFA |
| F | F | I | I |
| 10/31/2007 | 10,000 | 9,450 | 10,000 | 10,000 |
| 10/31/2008 | 5,571 | 5,265 | 6,213 | 5,810 |
| 10/31/2009 | 6,547 | 6,186 | 6,918 | 6,549 |
| 10/31/2010 | 8,934 | 8,443 | 8,901 | 8,303 |
| 10/31/2011 | 8,524 | 8,055 | 9,777 | 9,026 |
| 10/31/2012 | 9,973 | 9,424 | 10,725 | 9,842 |
| 10/31/2013 | 12,631 | 11,936 | 14,998 | 13,445 |
| 10/31/2014 | 14,320 | 13,532 | 16,237 | 14,248 |
| 10/31/2015 | 15,339 | 14,495 | 16,809 | 14,472 |
| 10/31/2016 | 15,747 | 14,824 | 16,727 | 14,513 |
| 10/31/2017 | 21,690 | 20,328 | 21,912 | 18,699 |
41 graphic description end -->
| ■ | Total returns shown for Class A Shares include the maximum sales charge of 5.50% ($10,000 investment minus $550 sales charge = $9,450). |
The Fund offers multiple share classes whose performance may be greater than or less than its other share class(es) due to differences in sales charges and expenses. See the Average Annual Total Return table below for the returns of additional classes not shown in the line graph above.
Average Annual Total Returns for the Period Ended 10/31/2017
(returns reflect all applicable sales charges and contingent deferred sales charges as specified below in footnote #1)
| | 1 Year | 5 Years | 10 Years |
| Class A Shares | 29.60% | 15.31% | 7.35% |
| Class B Shares | 30.83% | 15.75% | 7.49% |
| Class C Shares | 35.38% | 15.98% | 7.37% |
| Class R Shares | 37.17% | 16.69% | 7.99% |
| Institutional Shares4 | 37.74% | 16.81% | 8.05% |
| Class R6 Shares4 | 37.21% | 16.63% | 7.97% |
| R2000G | 31.00% | 15.36% | 8.16% |
| MSGFA | 28.98% | 14.02% | 7.35% |
Annual Shareholder Report
Performance data quoted represents past performance which is no guarantee of future results. Investment return and principal value will fluctuate so that an investor's shares, when redeemed, may be worth more or less than their original cost. Mutual fund performance changes over time and current performance may be lower or higher than what is stated. For current to the most recent month-end performance and after-tax returns, visit FederatedInvestors.com or call 1-800-341-7400. Returns shown do not reflect the deduction of taxes that a shareholder would pay on Fund distributions or the redemption of Fund shares. Mutual funds are not obligations of or guaranteed by any bank and are not federally insured.
| 1 | Represents a hypothetical investment of $10,000 in the Fund after deducting the applicable sales charges: for Class A Shares, the maximum sales charge of 5.50% ($10,000 investment minus $550 sales charge = $9,450); for Class B Shares, the maximum contingent deferred sales charge is 5.50% on any redemption less than one year from the purchase date; for Class C Shares, a 1.00% contingent deferred sales charge would be applied on any redemption less than one year from the purchase date. The Fund's performance assumes the reinvestment of all dividends and distributions. The R2000G and the MSGFA have been adjusted to reflect reinvestment of dividends on securities in the index and the average. |
| 2 | The Russell 2000® Growth Index measures the performance of the small-cap growth segment of the U.S. equity universe. It includes those Russell 2000® Index companies with higher price-to-value ratios and higher forecasted growth values. The R2000G is constructed to provide a comprehensive and unbiased barometer for the small-cap growth segment. The R2000G is completely reconstituted annually to ensure larger stocks do not distort the performance and characteristics of the true small-cap opportunity set and that the represented companies continue to reflect growth characteristics. The R2000G is not adjusted to reflect sales charges, expenses or other fees that the Securities and Exchange Commission requires to be reflected in the Fund's performance. The index is unmanaged and unlike the Fund, is not affected by cash flows. It is not possible to invest directly in an index. |
| 3 | Morningstar figures represent the average of the total returns reported by all the funds designated by Morningstar as falling into the respective category indicated. They do not reflect sales charges. The Morningstar figures in the Growth of $10,000 line graph are based on historical return information published by Morningstar and reflect the return of the funds comprising the category in the year of publication. Because the funds designated by Morningstar as falling into the category can change over time, the Morningstar figures in the line graph may not match the Morningstar figures in the Average Annual Total Returns table, which reflect the return of the funds that currently comprise the category. |
| 4 | The Fund's Institutional Shares commenced operations on December 30, 2015. The Fund's Class R6 Shares commenced operations on September 1, 2017. It is anticipated that this class will have the lowest net expenses of all outstanding share classes. For the period prior to commencement of operations of the Institutional Shares and Class R6 shares, the performance information shown is for the Fund's Class A Shares and has not been adjusted to reflect expenses of the Institutional Shares or Class R6 Shares since Institutional Shares and Class R6 Shares have a lower expense ratio than Class A Shares. The performance of Class A Shares has been adjusted to remove an voluntary waiver of Fund expenses related to Class A Shares that may have occurred during the period prior to commencement of operations of Institutional Shares and Class R6 Shares. Additionally, the performance information shown above has been adjusted to reflect the absence of any sales charges applicable to Class A Shares. |
Annual Shareholder Report
Portfolio of Investments Summary Table (unaudited)
At October 31, 2017, the Fund's sector composition1 was as follows:
| Sector | Percentage of
Total Net Assets |
| Information Technology | 32.5% |
| Health Care | 24.0% |
| Consumer Discretionary | 11.9% |
| Industrials | 8.6% |
| Financials | 4.4% |
| Materials | 2.6% |
| Real Estate | 2.3% |
| Energy | 1.3% |
| Consumer Staples | 0.7% |
| Telecommunication Services | 0.5% |
| Utilities | 0.2% |
| Securities Lending Collateral2 | 8.7% |
| Cash Equivalents3 | 10.4% |
| Other Assets and Liabilities—Net4 | (8.1)% |
| TOTAL | 100.0% |
| 1 | Except for Securities Lending Collateral, Cash Equivalents and Other Assets and Liabilities, sector classifications are based upon, and individual portfolio securities are assigned to, the classifications of the Global Industry Classification System (GICS), except that the Adviser assigns a classification to securities not classified by the GICS and to securities for which the Adviser does not have access to the classification made by the GICS. |
| 2 | Cash collateral received from lending portfolio securities which is invested in short-term investments such as repurchase agreements or money market mutual funds. |
| 3 | Cash Equivalents include any investments in money market mutual funds and/or overnight repurchase agreements other than those representing securities lending collateral. |
| 4 | Assets, other than investments in securities, less liabilities. See Statement of Assets and Liabilities. |
Annual Shareholder Report
Portfolio of Investments
October 31, 2017
| Shares | | | Value |
| | | COMMON STOCKS—89.0% | |
| | | Consumer Discretionary—11.9% | |
| 315,000 | | Camping World Holdings, Inc. | $13,236,300 |
| 200,000 | 1,2 | Canada Goose Holdings, Inc. | 4,296,000 |
| 12,000 | 1 | Cracker Barrel Old Country Store, Inc. | 1,873,560 |
| 65,000 | 2 | Dave & Buster's Entertainment, Inc. | 3,133,000 |
| 50,000 | 2 | Despegar.com Corp. | 1,540,000 |
| 100,000 | 1,2 | Duluth Holdings, Inc. | 2,066,000 |
| 290,000 | 2 | Floor & Decor Holdings, Inc. | 10,933,000 |
| 60,000 | | Maisons du Monde SA | 2,597,278 |
| 190,000 | | Moncler S.p.A | 5,395,697 |
| 9,203,000 | | NagaCorp Limited | 7,433,708 |
| 150,000 | 2 | National Vision Holdings, Inc. | 4,320,000 |
| 265,000 | 2 | Planet Fitness, Inc. | 7,059,600 |
| 108,100 | 1,2 | RISE Education Cayman Ltd., ADR | 1,528,534 |
| 618,805 | | Samsonite International SA | 2,604,134 |
| 140,000 | 2 | Secoo Holding Ltd., ADR | 1,013,600 |
| 119,500 | | Six Flags Entertainment Corp. | 7,503,405 |
| 31,900 | | Vail Resorts, Inc. | 7,305,738 |
| 270,000 | 1 | Wingstop, Inc. | 9,144,900 |
| 175,200 | 1,2 | Yoox Net-A-Porter Group | 6,545,871 |
| | | TOTAL | 99,530,325 |
| | | Consumer Staples—0.7% | |
| 80,000 | 2 | Blue Buffalo Pet Products, Inc. | 2,314,400 |
| 171,500 | 1,2 | elf Beauty, Inc. | 3,634,085 |
| | | TOTAL | 5,948,485 |
| | | Energy—1.3% | |
| 1,278,900 | 2 | Independence Contract Drilling, Inc. | 4,143,636 |
| 97,174 | 1,2 | NCS Multistage Holdings, Inc. | 2,116,450 |
| 140,800 | | US Silica Holdings, Inc. | 4,295,808 |
| | | TOTAL | 10,555,894 |
| | | Financials—4.4% | |
| 31,200 | | Affiliated Managers Group | 5,818,800 |
| 350,000 | | Chimera Investment Corp. | 6,405,000 |
| 565,000 | 2 | doBank S.p.A. | 8,983,170 |
| 874,310 | | FinecoBank Banca Fineco SPA | 8,178,241 |
Annual Shareholder Report
| Shares | | | Value |
| | | COMMON STOCKS—continued | |
| | | Financials—continued | |
| 270,916 | 3 | Hamilton Lane, Inc. | $7,447,481 |
| | | TOTAL | 36,832,692 |
| | | Health Care—24.0% | |
| 178,031 | 2 | Amphastar Pharmaceuticals, Inc. | 3,217,020 |
| 177,100 | 2 | AnaptysBio, Inc. | 11,693,913 |
| 253,414 | 2,3 | arGEN X BV | 5,854,563 |
| 51,750 | 2 | Argenx SE, ADR | 1,186,110 |
| 125,000 | 2 | Clementia Pharmaceuticals, Inc. | 2,002,500 |
| 690,000 | 2,3 | ContraFect Corp. | 710,700 |
| 1,014,572 | 2,3 | Corcept Therapeutics, Inc. | 19,976,923 |
| 687,507 | 1,2 | Cryoport, Inc. | 5,396,930 |
| 125,000 | 2,3,4 | Dyax Corp. - CVR | 300,000 |
| 473,000 | 2 | Dynavax Technologies Corp. | 10,406,000 |
| 151,092 | 1,2 | Egalet Corp. | 148,070 |
| 93,500 | 1,2 | Entellus Medical, Inc. | 1,582,955 |
| 36,800 | 1,2 | GW Pharmaceuticals PLC, ADR | 3,972,560 |
| 99,100 | 2 | Galapagos NV | 9,612,569 |
| 96,900 | 2 | Galapagos NV, ADR | 9,445,812 |
| 200,000 | 1,2 | GenMark Diagnostics, Inc. | 1,490,000 |
| 75,000 | 1,2 | Glaukos Corp. | 2,648,250 |
| 981,400 | 2 | Horizon Discovery Group PLC | 3,337,079 |
| 26,300 | 2 | Insulet Corp. | 1,546,703 |
| 260,475 | 2 | Intersect ENT, Inc. | 7,723,084 |
| 100,000 | 2 | iRhythm Technologies, Inc. | 5,095,000 |
| 110,000 | 2 | K2M Group Holdings, Inc. | 2,165,900 |
| 1,055,000 | 2,3 | Minerva Neurosciences, Inc. | 6,646,500 |
| 75,000 | 2 | Nektar Therapeutics | 1,806,750 |
| 547,300 | 2 | NeoGenomics, Inc. | 4,745,091 |
| 41,800 | 2 | Nevro Corp. | 3,660,844 |
| 58,465 | 1,2 | Penumbra, Inc. | 5,878,656 |
| 265,000 | 2,3 | Progenics Pharmaceuticals, Inc. | 1,640,350 |
| 57,613 | 1,2 | Protalix Biotherapeutics, Inc. | 44,794 |
| 16,300 | 2 | Puma Biotechnology, Inc. | 2,074,990 |
| 105,000 | 2 | Repligen Corp. | 3,906,000 |
| 150,000 | 2 | Rhythm Pharmaceuticals, Inc. | 3,837,000 |
| 37,500 | 2 | SAGE Therapeutics, Inc. | 2,373,000 |
| 800,000 | 1,2,3 | SCYNEXIS, Inc. | 1,584,000 |
| 95,000 | 2 | Seres Therapeutics, Inc. | 953,800 |
Annual Shareholder Report
| Shares | | | Value |
| | | COMMON STOCKS—continued | |
| | | Health Care—continued | |
| 176,033 | 2 | Spark Therapeutics, Inc. | $14,241,070 |
| 409,417 | 2,3,5 | SteadyMed Ltd. | 1,281,475 |
| 149,400 | 2,3,5 | SteadyMed Ltd. | 463,140 |
| 263,753 | 2,3 | SteadyMed Ltd. | 805,352 |
| 68,200 | 2 | Tesaro, Inc. | 7,895,514 |
| 58,600 | 2 | Ultragenyx Pharmaceutical, Inc. | 2,700,874 |
| 200,000 | 2 | Veeva Systems, Inc. | 12,188,000 |
| 525,000 | 2 | Veracyte, Inc. | 4,488,750 |
| 194,000 | 2 | Zogenix, Inc. | 7,275,000 |
| | | TOTAL | 200,003,591 |
| | | Industrials—8.6% | |
| 222,500 | | Air Lease Corp. | 9,667,625 |
| 735,000 | | Aramex PJSC | 1,023,740 |
| 1,470,000 | | Biffa PLC | 4,956,770 |
| 653,000 | 2 | Dirtt Environmental Solutions Ltd. | 3,224,254 |
| 24,000 | 2 | Dycom Industries, Inc. | 2,107,920 |
| 172,200 | 2 | JELD-WEN Holding, Inc. | 6,350,736 |
| 144,600 | | KAR Auction Services, Inc. | 6,843,918 |
| 502,800 | 1,2 | Kornit Digital Ltd. | 7,818,540 |
| 103,000 | 2 | Mercury Systems, Inc. | 5,198,410 |
| 190,000 | 2 | Milacron Holdings Corp. | 3,410,500 |
| 241,700 | | REV Group, Inc. | 6,235,860 |
| 261,740 | 2 | Titan Machinery, Inc. | 3,897,308 |
| 26,000 | 2 | WageWorks, Inc. | 1,657,500 |
| 133,300 | 2 | XPO Logistics, Inc. | 9,244,355 |
| | | TOTAL | 71,637,436 |
| | | Information Technology—32.5% | |
| 91,800 | 2 | 2U, Inc. | 5,841,234 |
| 105,500 | 1,2 | Accesso Technology Group PLC | 3,068,603 |
| 183,200 | 2 | Alarm.com Holdings, Inc. | 8,551,776 |
| 300,000 | 1,2 | Alteryx, Inc. | 6,777,000 |
| 220,000 | 2 | Amtech Systems, Inc. | 3,203,200 |
| 114,000 | 2 | Atlassian Corp. PLC | 5,514,180 |
| 100,000 | 2 | Blackline, Inc. | 3,552,000 |
| 475,000 | 2 | Box, Inc. | 10,426,250 |
| 205,000 | 1,2 | BroadSoft, Inc. | 11,244,250 |
| 231,900 | 2 | CalAmp Corp. | 5,271,087 |
| 1,630,000 | 1,2 | Camtek Ltd. | 9,372,500 |
Annual Shareholder Report
| Shares | | | Value |
| | | COMMON STOCKS—continued | |
| | | Information Technology—continued | |
| 10,000 | 1,2 | CarGurus, Inc. | $326,000 |
| 250,000 | 1,2 | Cloudera, Inc. | 3,782,500 |
| 36,400 | 2 | CoStar Group, Inc. | 10,765,300 |
| 100,000 | 2 | Coupa Software, Inc. | 3,475,000 |
| 29,900 | 2 | Delivery Hero GmbH | 1,275,925 |
| 120,000 | 2 | Envestnet, Inc. | 6,408,000 |
| 167,000 | 2 | Forescout Technologies, Inc. | 4,316,950 |
| 335,000 | 2 | GTT Communications, Inc. | 12,210,750 |
| 115,693 | 1,2 | Globant SA | 4,363,940 |
| 182,700 | 2 | GoDaddy, Inc. | 8,532,090 |
| 300,000 | 1,2 | Gridsum Holding, Inc., ADR | 2,595,000 |
| 134,000 | 1,2 | GrubHub, Inc. | 8,176,680 |
| 365,000 | 2 | Ichor Holdings Ltd. | 11,384,350 |
| 175,000 | 2 | Instructure, Inc. | 6,090,000 |
| 290,000 | 2 | Just Eat PLC | 3,005,363 |
| 350,000 | 1,2 | Magnachip Semiconductor Corp. | 3,622,500 |
| 200,000 | 2 | Microsemi Corp. | 10,674,000 |
| 344,000 | 2 | Mimecast Ltd. | 10,935,760 |
| 200,000 | 2 | MindBody, Inc. | 6,450,000 |
| 70,000 | 2 | MongoDB, Inc. | 2,133,600 |
| 1,300,000 | 1,2 | Nearmap Ltd. | 587,130 |
| 109,500 | 2 | Novoste Corp. | 5,179,350 |
| 450,000 | 1,2 | Oclaro, Inc. | 3,721,500 |
| 170,000 | 2 | Q2 Holdings, Inc. | 7,233,500 |
| 200,000 | 2 | Quantenna Communications, Inc. | 3,098,000 |
| 322,500 | 2 | RADWARE Ltd. | 5,656,650 |
| 42,647 | 2 | Radcom Ltd. | 865,734 |
| 318,000 | 1,2 | Rapid7, Inc. | 5,749,440 |
| 145,800 | 2 | RealPage, Inc. | 6,313,140 |
| 50,000 | 2 | RingCentral, Inc. | 2,107,500 |
| 47,100 | 2 | Rogers Corp. | 7,162,968 |
| 63,000 | 2 | Shopify, Inc. | 6,267,870 |
| 171,421 | 1,2 | ShotSpotter, Inc. | 2,943,298 |
| 1,800,000 | 2 | Sigma Designs, Inc. | 10,890,000 |
| 91,000 | 2 | Takeaway.com Holding BV | 4,304,026 |
| 35,300 | 2 | Tyler Technologies, Inc. | 6,258,337 |
| | | TOTAL | 271,684,231 |
Annual Shareholder Report
| Shares | | | Value |
| | | COMMON STOCKS—continued | |
| | | Materials—2.6% | |
| 43,100 | | Eagle Materials, Inc. | $4,550,067 |
| 219,400 | | Huntsman Corp. | 7,025,188 |
| 50,000 | 2 | Kraton Corp. | 2,451,500 |
| 96,900 | 1,2 | U.S. Concrete, Inc. | 7,577,580 |
| | | TOTAL | 21,604,335 |
| | | Real Estate—2.3% | |
| 110,000 | | Cyrusone, Inc. | 6,752,900 |
| 155,000 | | MGM Growth Properties LLC | 4,574,050 |
| 121,700 | | Ryman Hospitality Properties | 8,048,021 |
| | | TOTAL | 19,374,971 |
| | | Telecommunication Services—0.5% | |
| 672,200 | | Infrastrutture Wireless Italiane SPA | 4,589,645 |
| | | Utilities—0.2% | |
| 103,900 | 1,2 | Aquaventure Holdings Ltd. | 1,264,463 |
| | | TOTAL COMMON STOCKS
(IDENTIFIED COST $441,604,480) | 743,026,068 |
| | | WARRANTS—0.0% | |
| | | Health Care—0.0% | |
| 222,500 | 2,3 | ContraFect Corp., 7/27/2021 | 89,200 |
| 467,500 | 2,3 | ContraFect Corp., 7/20/2022 | 143,663 |
| 109,440 | 2,3 | SCYNEXIS, Inc., 4/06/2021 | 103,125 |
| | | TOTAL WARRANTS
(IDENTIFIED COST $6,900) | 335,988 |
| | | INVESTMENT COMPANIES—19.1%3 | |
| 72,109,599 | 6 | Federated Government Obligations Fund, Institutional Shares, 0.91%7 | 72,109,599 |
| 87,095,050 | | Federated Institutional Prime Value Obligations Fund, Institutional Shares, 1.21%7 | 87,103,760 |
| | | TOTAL INVESTMENT COMPANIES
(IDENTIFIED COST $159,216,280) | 159,213,359 |
| | | TOTAL INVESTMENT IN SECURITIES—108.1%
(IDENTIFIED COST $600,827,660)8 | 902,575,415 |
| | | OTHER ASSETS AND LIABILITIES - NET—(8.1)%9 | (67,814,842) |
| | | TOTAL NET ASSETS—100% | $834,760,573 |
| 1 | All or a portion of these securities are temporarily on loan to unaffiliated broker/dealers. |
| 2 | Non-income-producing security. |
Annual Shareholder Report
[PAGE INTENTIONALLY LEFT BLANK]
Annual Shareholder Report
| 3 | Affiliated companies and holdings. |
An affiliated company is a company in which the Fund has ownership of at least 5% of the voting shares. Transactions with affiliated companies during the year ended October 31, 2017, were as follows:
| Affiliates | Balance of
Shares
Held
10/31/2016 | Purchases/
Additions | Sales/
Reductions |
| arGEN X BV | 197,014 | 56,400 | — |
| ContraFect Corp. | 222,500 | 467,500 | — |
| ContraFect Corp., Warrants | 222,500 | 467,500 | — |
| Corcept Therapeutics, Inc. | 1,130,000 | 80,138 | (195,566) |
| Dyax Corp.- CVR | 125,000 | — | — |
| Dynavax Technologies Corp.* | 1,000,000 | 67,915 | (594,915) |
| Egalet Corp.* | 332,000 | — | (180,908) |
| Hamilton Lane, Inc. | — | 270,916 | — |
| Intersect ENT, Inc.* | 361,903 | — | (101,428) |
| Minerva Neurosciences, Inc. | 916,620 | 138,380 | — |
| Progenics Pharmaceuticals, Inc. | 1,020,000 | 3,130 | (758,130) |
| SCYNEXIS, Inc. | 707,000 | 93,000 | — |
| SCYNEXIS, Inc., Warrants | 109,440 | — | — |
| Seres Therapeutics, Inc.* | 50,728 | 95,000 | (50,728) |
| Spark Therapeutics, Inc.* | 188,000 | 60,898 | (72,865) |
| SteadyMed Ltd. | 755,317 | 149,400 | (231,547) |
| SteadyMed Ltd. | 149,400 | — | — |
| Zogenix, Inc.* | 185,000 | 40,900 | (31,900) |
| Affiliated issuers no longer in the portfolio at period end | 2,560,679 | — | (2,560,679) |
| TOTAL OF AFFILIATED TRANSACTIONS | 10,233,101 | 1,991,077 | (4,778,666) |
Annual Shareholder Report
Balance of
Shares
Held
10/31/2017 | Value | Change in
Unrealized
Appreciation/
Depreciation | Net
Realized
Gain/(Loss) | Dividend
Income |
| 253,414 | $5,854,563 | $1,902,918 | $— | $— |
| 690,000 | $710,700 | $(380,750) | $— | $— |
| 690,000 | $232,863 | $(48,958) | $— | $— |
| 1,014,572 | $19,976,923 | $12,261,410 | $1,443,134 | $— |
| 125,000 | $300,000 | $161,250 | $— | $— |
| 473,000 | $10,406,000 | $8,582,402 | $(1,570,012) | $— |
| 151,092 | $148,070 | $420,379 | $(1,462,451) | $— |
| 270,916 | $7,447,481 | $2,974,282 | $— | $— |
| 260,475 | $7,723,084 | $4,335,811 | $(1,010,265) | $— |
| 1,055,000 | $6,646,500 | $(4,638,433) | $— | $— |
| 265,000 | $1,640,350 | $(246,767) | $2,739,678 | $— |
| 800,000 | $1,584,000 | $(848,567) | $— | $— |
| 109,440 | $103,125 | $(108,214) | $— | $— |
| 95,000 | $953,800 | $283,055 | $(974,419) | $— |
| 176,033 | $14,241,070 | $5,297,583 | $328,584 | $— |
| 673,170 | $2,086,827 | $725,776 | $(1,359,082) | $— |
| 149,400 | $463,140 | $(112,050) | $— | $— |
| 194,000 | $7,275,000 | $4,751,582 | $166,763 | $— |
| — | $— | $3,752,298 | $(7,306,270) | $— |
| 7,445,512 | $87,793,496 | $39,065,007 | $(9,004,340) | $— |
| * | At October 31, 2017, the Fund no longer has ownership of at least 5% of the voting shares. |
Annual Shareholder Report
Affiliated fund holdings are investment companies which are managed by the Adviser or an affiliate of the Adviser. Transactions with affiliated fund holdings during the period ended October 31, 2017, were as follows:
| | Federated
Government
Obligations Fund,
Institutional Shares* | Federated
Institutional
Prime Value
Obligations Fund,
Institutional Shares | Total |
| Balance of Shares Held 10/31/2016 | 72,359,842 | 19,064,290 | 91,424,132 |
| Purchases/Additions | 372,224,690 | 250,514,295 | 622,738,985 |
| Sales/Reductions | (372,474,933) | (182,483,535) | (554,958,468) |
| Balance of Shares Held 10/31/2017 | 72,109,599 | 87,095,050 | 159,204,649 |
| Value | $72,109,599 | $87,103,760 | $159,213,359 |
| Change in Unrealized Appreciation/Depreciation | NA | $(2,921) | $(2,921) |
| Net Realized Gain/(Loss) | NA | $(82) | $(82) |
| Dividend Income | $395,439 | $383,478 | $778,917 |
| * | All or a portion of the balance/activity for the fund relates to cash collateral received on securities lending transactions. |
| 4 | Market quotations and price evaluations are not available. Fair value determined using significant unobservable inputs in accordance with procedures established by and under the general supervision of the Fund's Board of Trustees (the “Trustees”). |
| 5 | Denotes a restricted security that either: (a) cannot be offered for public sale without first being registered, or availing of an exemption from registration, under the Securities Act of 1933; or (b) is subject to a contractual restriction on public sales. At October 31, 2017, these restricted securities amounted to $1,744,615, which represented 0.2% of total net assets. |
| 6 | All or a portion of this security is held as collateral for securities lending. |
| 7 | 7-day net yield. |
| 8 | The cost of investments for federal tax purposes amounts to $603,221,437. |
| 9 | Assets, other than investments in securities, less liabilities. See Statement of Assets and Liabilities. |
Note: The categories of investments are shown as a percentage of total net assets at October 31, 2017.
Annual Shareholder Report
Various inputs are used in determining the value of the Fund's investments. These inputs are summarized in the three broad levels listed below:
Level 1—quoted prices in active markets for identical securities.
Level 2—other significant observable inputs (including quoted prices for similar securities, interest rates, prepayment speeds, credit risk, etc.). Also includes securities valued at amortized cost.
Level 3—significant unobservable inputs (including the Fund's own assumptions in determining the fair value of investments).
The inputs or methodology used for valuing securities are not an indication of the risk associated with investing in those securities.
The following is a summary of the inputs used, as of October 31, 2017, in valuing the Fund's assets carried at fair value:
| Valuation Inputs | | | | |
| | Level 1—
Quoted
Prices | Level 2—
Other
Significant
Observable
Inputs | Level 3—
Significant
Unobservable
Inputs | Total |
| Equity Securities: | | | | |
| Common Stocks | | | | |
| Domestic | $579,586,985 | $— | $300,000 | $579,886,985 |
| International | 163,139,083 | — | — | 163,139,083 |
| Debt Securities: | | | | |
| Warrants | — | 335,988 | — | 335,988 |
| Investment Companies | 159,213,359 | — | — | 159,213,359 |
| TOTAL SECURITIES | $901,939,427 | $335,988 | $300,000 | $902,575,415 |
The following acronym is used throughout this portfolio:
ADR—American Depositary Receipt
CVR—Contingent Voting Rights
See Notes which are an integral part of the Financial Statements
Annual Shareholder Report
Financial Highlights–Class A Shares
(For a Share Outstanding Throughout Each Period)
| Year Ended October 31 | 2017 | 2016 | 2015 | 2014 | 2013 |
| Net Asset Value, Beginning of Period | $23.94 | $25.38 | $28.77 | $29.88 | $25.26 |
| Income From Investment Operations: | | | | | |
| Net investment income (loss) | (0.27)1 | (0.17)1 | (0.22)1 | (0.32)1 | (0.26)1 |
| Net realized and unrealized gain on investments and foreign currency transactions | 9.10 | 0.76 | 2.09 | 4.16 | 6.50 |
| TOTAL FROM INVESTMENT OPERATIONS | 8.83 | 0.59 | 1.87 | 3.84 | 6.24 |
| Less Distributions: | | | | | |
| Distributions from net realized gain on investments and foreign currency transactions | (0.19) | (2.03) | (5.26) | (4.95) | (1.62) |
| Net Asset Value, End of Period | $32.58 | $23.94 | $25.38 | $28.77 | $29.88 |
| Total Return2 | 37.12% | 2.27% | 7.12% | 13.37% | 26.65% |
| Ratios to Average Net Assets: | | | | | |
| Net expenses | 1.85% | 1.95%3 | 1.95%3 | 1.95%3 | 1.95%3 |
| Net investment income (loss) | (0.95)% | (0.73)% | (0.83)% | (1.11)% | (0.97)% |
| Expense waiver/reimbursement4 | 0.13% | 0.14% | 0.12% | 0.23% | 0.32% |
| Supplemental Data: | | | | | |
| Net assets, end of period (000 omitted) | $401,920 | $343,323 | $600,840 | $466,020 | $463,557 |
| Portfolio turnover | 46% | 48% | 88% | 65% | 66% |
| 1 | Per share numbers have been calculated using the average shares method. |
| 2 | Based on net asset value, which does not reflect the sales charge, redemption fee or contingent deferred sales charge, if applicable. |
| 3 | The net expense ratio is calculated without reduction for fees paid indirectly for expense offset arrangements. The net expense ratios are 1.95%, 1.95%, 1.95% and 1.95% for the years ended October 31, 2016, 2015, 2014 and 2013, respectively, after taking into account these expense reductions. |
| 4 | This expense decrease is reflected in both the net expense and the net investment income (loss) ratios shown above. |
See Notes which are an integral part of the Financial Statements
Annual Shareholder Report
Financial Highlights–Class B Shares
(For a Share Outstanding Throughout Each Period)
| Year Ended October 31 | 2017 | 2016 | 2015 | 2014 | 2013 |
| Net Asset Value, Beginning of Period | $21.10 | $22.72 | $26.41 | $27.93 | $23.84 |
| Income From Investment Operations: | | | | | |
| Net investment income (loss) | (0.37)1 | (0.26)1 | (0.33)1 | (0.45)1 | (0.37)1 |
| Net realized and unrealized gain on investments and foreign currency transactions | 7.98 | 0.67 | 1.90 | 3.88 | 6.08 |
| TOTAL FROM INVESTMENT OPERATIONS | 7.61 | 0.41 | 1.57 | 3.43 | 5.71 |
| Less Distributions: | | | | | |
| Distributions from net realized gain on investments and foreign currency transactions | (0.19) | (2.03) | (5.26) | (4.95) | (1.62) |
| Net Asset Value, End of Period | $28.52 | $21.10 | $22.72 | $26.41 | $27.93 |
| Total Return2 | 36.33% | 1.70% | 6.52% | 12.75% | 25.97% |
| Ratios to Average Net Assets: | | | | | |
| Net expenses | 2.42% | 2.50%3 | 2.50%3 | 2.50%3 | 2.50%3 |
| Net investment income (loss) | (1.52)% | (1.28)% | (1.36)% | (1.68)% | (1.51)% |
| Expense waiver/reimbursement4 | 0.12% | 0.16% | 0.12% | 0.25% | 0.33% |
| Supplemental Data: | | | | | |
| Net assets, end of period (000 omitted) | $17,420 | $14,987 | $20,182 | $25,108 | $36,591 |
| Portfolio turnover | 46% | 48% | 88% | 65% | 66% |
| 1 | Per share numbers have been calculated using the average shares method. |
| 2 | Based on net asset value, which does not reflect the sales charge, redemption fee or contingent deferred sales charge, if applicable. |
| 3 | The net expense ratio is calculated without reduction for expense offset arrangements. The net expense ratios are 2.50%, 2.50%, 2.50% and 2.50% for the year ended October 31, 2016, 2015, 2014 and 2013, respectively, after taking into account these expense reductions. |
| 4 | This expense decrease is reflected in both the net expense and the net investment income (loss) ratios shown above. |
See Notes which are an integral part of the Financial Statements
Annual Shareholder Report
Financial Highlights–Class C Shares
(For a Share Outstanding Throughout Each Period)
| Year Ended October 31 | 2017 | 2016 | 2015 | 2014 | 2013 |
| Net Asset Value, Beginning of Period | $21.10 | $22.72 | $26.41 | $27.93 | $23.84 |
| Income From Investment Operations: | | | | | |
| Net investment income (loss) | (0.37)1 | (0.26)1 | (0.33)1 | (0.44)1 | (0.38)1 |
| Net realized and unrealized gain on investments and foreign currency transactions | 7.99 | 0.67 | 1.90 | 3.87 | 6.09 |
| TOTAL FROM INVESTMENT OPERATIONS | 7.62 | 0.41 | 1.57 | 3.43 | 5.71 |
| Less Distributions: | | | | | |
| Distributions from net realized gain on investments and foreign currency transactions | (0.19) | (2.03) | (5.26) | (4.95) | (1.62) |
| Net Asset Value, End of Period | $28.53 | $21.10 | $22.72 | $26.41 | $27.93 |
| Total Return2 | 36.38% | 1.70% | 6.52% | 12.75% | 25.97% |
| Ratios to Average Net Assets: | | | | | |
| Net expenses | 2.41% | 2.50%3 | 2.50%3 | 2.50%3 | 2.50%3 |
| Net investment income (loss) | (1.50)% | (1.27)% | (1.36)% | (1.67)% | (1.54)% |
| Expense waiver/reimbursement4 | 0.08% | 0.10% | 0.08% | 0.19% | 0.27% |
| Supplemental Data: | | | | | |
| Net assets, end of period (000 omitted) | $151,959 | $144,340 | $182,689 | $182,173 | $180,147 |
| Portfolio turnover | 46% | 48% | 88% | 65% | 66% |
| 1 | Per share numbers have been calculated using the average shares method. |
| 2 | Based on net asset value, which does not reflect the sales charge, redemption fee or contingent deferred sales charge, if applicable. |
| 3 | The net expense ratio is calculated without reduction for expense offset arrangements. The net expense ratios are 2.50%, 2.50%, 2.50% and 2.50% for the year ended October 31, 2016, 2015, 2014 and 2013, respectively, after taking into account these expense reductions. |
| 4 | This expense decrease is reflected in both the net expense and the net investment income (loss) ratios shown above. |
See Notes which are an integral part of the Financial Statements
Annual Shareholder Report
Financial Highlights–Class R Shares
(For a Share Outstanding Throughout Each Period)
| Year Ended October 31 | 2017 | 2016 | 2015 | 2014 | 2013 |
| Net Asset Value, Beginning of Period | $24.02 | $25.44 | $28.82 | $29.91 | $25.26 |
| Income From Investment Operations: | | | | | |
| Net investment income (loss) | (0.25)1 | (0.16)1 | (0.21)1 | (0.31)1 | (0.25)1 |
| Net realized and unrealized gain on investments and foreign currency transactions | 9.12 | 0.77 | 2.09 | 4.17 | 6.52 |
| TOTAL FROM INVESTMENT OPERATIONS | 8.87 | 0.61 | 1.88 | 3.86 | 6.27 |
| Less Distributions: | | | | | |
| Distributions from net realized gain on investments and foreign currency transactions | (0.19) | (2.03) | (5.26) | (4.95) | (1.62) |
| Net Asset Value, End of Period | $32.70 | $24.02 | $25.44 | $28.82 | $29.91 |
| Total Return2 | 37.17% | 2.35% | 7.15% | 13.43% | 26.77% |
| Ratios to Average Net Assets: | | | | | |
| Net expenses | 1.80% | 1.91%3 | 1.90%3 | 1.90%3 | 1.90%3 |
| Net investment income (loss) | (0.91)% | (0.68)% | (0.76)% | (1.07)% | (0.93)% |
| Expense waiver/reimbursement4 | 0.32% | 0.31% | 0.31% | 0.38% | 0.44% |
| Supplemental Data: | | | | | |
| Net assets, end of period (000 omitted) | $47,497 | $37,850 | $39,846 | $35,789 | $34,058 |
| Portfolio turnover | 46% | 48% | 88% | 65% | 66% |
| 1 | Per share numbers have been calculated using the average shares method. |
| 2 | Based on net asset value. |
| 3 | The net expense ratio is calculated without reduction for fees paid indirectly for expense offset arrangements. The net expense ratios are 1.91%, 1.90%, 1.90% and 1.90% for the years ended October 31, 2016, 2015, 2014 and 2013, respectively, after taking into account these expense reductions. |
| 4 | This expense decrease is reflected in both the net expense and the net investment income (loss) ratios shown above. |
See Notes which are an integral part of the Financial Statements
Annual Shareholder Report
Financial Highlights–Institutional Shares
(For a Share Outstanding Throughout Each Period)
| | Year Ended
10/31/2017 | Period
Ended
10/31/20161 |
| Net Asset Value, Beginning of Period | $24.03 | $24.05 |
| Income From Investment Operations: | | |
| Net investment income (loss) | (0.14)2 | (0.05)2 |
| Net realized and unrealized gain on investments and foreign currency transactions | 9.15 | 0.03 |
| TOTAL FROM INVESTMENT OPERATIONS | 9.01 | (0.02) |
| Less Distributions: | | |
| Distributions from net realized gain on investments and foreign currency transactions | (0.19) | — |
| Net Asset Value, End of Period | $32.85 | $24.03 |
| Total Return3 | 37.74% | (0.08)% |
| Ratios to Average Net Assets: | | |
| Net expenses | 1.35% | 1.50%4 |
| Net investment income (loss) | (0.50)% | (0.26)%4 |
| Expense waiver/reimbursement5 | 0.10% | 0.10%4 |
| Supplemental Data: | | |
| Net assets, end of period (000 omitted) | $215,907 | $81,269 |
| Portfolio turnover | 46% | 48%6 |
| 1 | Reflects operations for the period from December 30, 2015 (start of performance) to October 31, 2016. |
| 2 | Per share numbers have been calculated using the average shares method. |
| 3 | Based on net asset value. Total returns for periods of less than one year are not annualized. |
| 4 | Computed on an annualized basis. |
| 5 | This expense decrease is reflected in both the net expense and the net investment income (loss) ratios shown above. |
| 6 | Portfolio turnover is calculated at the Fund level. Percentage indicated was calculated for the year ended October 31, 2016. |
See Notes which are an integral part of the Financial Statements
Annual Shareholder Report
Financial Highlights–Class R6 Shares
(For a Share Outstanding Throughout the Period)
| | Period
Ended
10/31/20171 |
| Net Asset Value, Beginning of Period | $30.50 |
| Income From Investment Operations: | |
| Net investment income (loss) | (0.01)2 |
| Net realized and unrealized gain on investments and foreign currency transactions | 2.11 |
| TOTAL FROM INVESTMENT OPERATIONS | 2.10 |
| Net Asset Value, End of Period | $32.60 |
| Total Return3 | 6.89% |
| Ratios to Average Net Assets: | |
| Net expenses | 0.88%4 |
| Net investment income (loss) | (0.11)%4 |
| Expense waiver/reimbursement5 | 0.12%4 |
| Supplemental Data: | |
| Net assets, end of period (000 omitted) | $58 |
| Portfolio turnover | 46%6 |
| 1 | Reflects operations for the period from September 1, 2017 (start of performance) to October 31, 2017. |
| 2 | Per share numbers have been calculated using the average shares method. |
| 3 | Based on net asset value. Total returns for periods of less than one year are not annualized. |
| 4 | Computed on an annualized basis. |
| 5 | This expense decrease is reflected in both the net expense and the net investment income (loss) ratios shown above. |
| 6 | Portfolio turnover is calculated at the Fund level. Percentage indicated was calculated for the year ended October 31, 2017. |
See Notes which are an integral part of the Financial Statements
Annual Shareholder Report
Statement of Assets and Liabilities
October 31, 2017
| Assets: | | |
| Investment in securities, at value including $63,480,441 of securities loaned and $159,213,359 of investment in affiliated holdings and $47,046,472 of investment in affiliated companies (identified cost $600,827,660) | | $902,575,415 |
| Cash denominated in foreign currencies (identified cost $15,267) | | 15,122 |
| Income receivable | | 119,601 |
| Receivable for investments sold | | 1,361,217 |
| Receivable for shares sold | | 5,084,619 |
| TOTAL ASSETS | | 909,155,974 |
| Liabilities: | | |
| Payable for investments purchased | $909,246 | |
| Payable for shares redeemed | 630,602 | |
| Payable for collateral due to broker for securities lending | 72,109,599 | |
| Payable to adviser (Note 5) | 16,163 | |
| Payable for administrative fees (Note 5) | 1,810 | |
| Payable for distribution services fee (Note 5) | 181,748 | |
| Payable for other service fees (Notes 2 and 5) | 209,407 | |
| Accrued expenses (Note 5) | 336,826 | |
| TOTAL LIABILITIES | | 74,395,401 |
| Net assets for 26,301,424 shares outstanding | | $834,760,573 |
| Net Assets Consist of: | | |
| Paid-in capital | | $479,944,548 |
| Net unrealized appreciation of investments and translation of assets and liabilities in foreign currency | | 301,747,622 |
| Accumulated net realized gain on investments and foreign currency transactions | | 54,344,897 |
| Distributions in excess of net investment income | | (1,276,494) |
| TOTAL NET ASSETS | | $834,760,573 |
Annual Shareholder Report
Statement of Assets and Liabilities–continued
| Net Asset Value, Offering Price and Redemption Proceeds Per Share | | |
| Class A Shares: | | |
| Net asset value per share ($401,920,355 ÷ 12,337,340 shares outstanding), no par value, unlimited shares authorized | | $32.58 |
| Offering price per share (100/94.50 of $32.58) | | $34.48 |
| Redemption proceeds per share | | $32.58 |
| Class B Shares: | | |
Net asset value per share ($17,420,012 ÷ 610,716 shares outstanding), no
par value, unlimited shares authorized | | $28.52 |
| Offering price per share | | $28.52 |
| Redemption proceeds per share (94.50/100 of $28.52) | | $26.95 |
| Class C Shares: | | |
| Net asset value per share ($151,958,654 ÷ 5,326,365 shares outstanding), no par value, unlimited shares authorized | | $28.53 |
| Offering price per share | | $28.53 |
| Redemption proceeds per share (99.00/100 of $28.53) | | $28.24 |
| Class R Shares: | | |
| Net asset value per share ($47,496,593 ÷ 1,452,587 shares outstanding), no par value, unlimited shares authorized | | $32.70 |
| Offering price per share | | $32.70 |
| Redemption proceeds per share | | $32.70 |
| Institutional Shares: | | |
| Net asset value per share ($215,907,334 ÷ 6,572,648 shares outstanding), no par value, unlimited shares authorized | | $32.85 |
| Offering price per share | | $32.85 |
| Redemption proceeds per share | | $32.85 |
| Class R6 Shares: | | |
Net asset value per share ($57,625 ÷ 1,768 shares outstanding), no
par value, unlimited shares authorized | | $32.60 |
| Offering price per share | | $32.60 |
| Redemption proceeds per share | | $32.60 |
See Notes which are an integral part of the Financial Statements
Annual Shareholder Report
Statement of Operations
Year Ended October 31, 2017
| Investment Income: | | | |
| Dividends (including $383,478 received from an affiliated holding, see footnotes to the Portfolio of Investments and net of foreign taxes withheld of $67,858) | | | $5,028,420 |
| Income on securities loaned (includes $369,687 received from affiliated holdings related to cash collateral balances, see footnotes to Portfolio of Investments) | | | 1,199,045 |
| Interest | | | 24,358 |
| TOTAL INCOME | | | 6,251,823 |
| Expenses: | | | |
| Investment adviser fee (Note 5) | | $8,451,247 | |
| Administrative fee (Note 5) | | 552,891 | |
| Custodian fees | | 59,812 | |
| Transfer agent fee (Note 2) | | 948,575 | |
| Directors'/Trustees' fees (Note 5) | | 6,328 | |
| Auditing fees | | 47,386 | |
| Legal fees | | 5,502 | |
| Portfolio accounting fees | | 154,240 | |
| Distribution services fee (Note 5) | | 2,328,091 | |
| Other service fees (Notes 2 and 5) | | 1,293,584 | |
| Share registration costs | | 117,596 | |
| Printing and postage | | 63,099 | |
| Miscellaneous (Note 5) | | 34,118 | |
| TOTAL EXPENSES | | 14,062,469 | |
Annual Shareholder Report
Statement of Operations–continued
| Waivers and Reimbursements: | | | |
| Waiver/reimbursement of investment adviser fee (Note 5) | $(175,442) | | |
| Waiver/reimbursement of other operating expenses (Notes 2 and 5) | (720,893) | | |
| TOTAL WAIVERS AND REIMBURSEMENTS | | $(896,335) | |
| Net expenses | | | $13,166,134 |
| Net investment income (loss) | | | (6,914,311) |
| Realized and Unrealized Gain (Loss) on Investments and Foreign Currency Transactions: | | | |
| Net realized gain on investments (including realized loss of $(9,004,422) on sales of investments in affiliated companies and holdings) | | | 69,228,683 |
| Net realized loss on foreign currency and foreign currency related transactions | | | (50,733) |
| Net change in unrealized appreciation of investments (including change in unrealized depreciation of $39,062,086 on investments in affiliated companies and holdings) | | | 157,762,061 |
| Net change in unrealized appreciation/depreciation of translation of assets and liabilities in foreign currency | | | 107,440 |
| Net realized and unrealized gain on investments and foreign currency transactions | | | 227,047,451 |
| Change in net assets resulting from operations | | | $220,133,140 |
See Notes which are an integral part of the Financial Statements
Annual Shareholder Report
Statement of Changes in Net Assets
| Year Ended October 31 | 2017 | 2016 |
| Increase (Decrease) in Net Assets | | |
| Operations: | | |
| Net investment income (loss) | $(6,914,311) | $(5,753,978) |
| Net realized gain on investments and foreign currency transactions | 69,177,950 | 5,999,967 |
| Net change in unrealized appreciation/depreciation of investments and translation of assets and liabilities in foreign currency | 157,869,501 | (2,042,611) |
| CHANGE IN NET ASSETS RESULTING FROM OPERATIONS | 220,133,140 | (1,796,622) |
| Distributions to Shareholders: | | |
| Distributions from net realized gain on investments and foreign currency transactions | | |
| Class A Shares | (2,659,203) | (46,841,205) |
| Class B Shares | (134,561) | (1,814,674) |
| Class C Shares | (1,251,421) | (16,172,258) |
| Class R Shares | (290,614) | (3,195,420) |
| Institutional Shares | (658,919) | — |
| Class R6 Shares | — | — |
| CHANGE IN NET ASSETS RESULTING FROM DISTRIBUTIONS TO SHAREHOLDERS | (4,994,718) | (68,023,557) |
| Share Transactions: | | |
| Proceeds from sale of shares | 277,136,640 | 203,348,228 |
| Net asset value of shares issued to shareholders in payment of distributions declared | 4,692,617 | 63,446,435 |
| Cost of shares redeemed | (283,975,860) | (418,762,640) |
| CHANGE IN NET ASSETS RESULTING FROM SHARE TRANSACTIONS | (2,146,603) | (151,967,977) |
| Change in net assets | 212,991,819 | (221,788,156) |
| Net Assets: | | |
| Beginning of period | 621,768,754 | 843,556,910 |
| End of period (including accumulated net investment income (loss) of $(1,276,494) and $(6,255,218), respectively) | $834,760,573 | $621,768,754 |
See Notes which are an integral part of the Financial Statements
Annual Shareholder Report
Notes to Financial Statements
October 31, 2017
1. ORGANIZATION
Federated Equity Funds (the “Trust”) is registered under the Investment Company Act of 1940, as amended (the “Act”), as an open-end management investment company. The Trust consists of 11 portfolios. The financial statements included herein are only those of Federated Kaufmann Small Cap Fund (the “Fund”), a diversified portfolio. The financial statements of the other portfolios are presented separately. The assets of each portfolio are segregated and a shareholder's interest is limited to the portfolio in which shares are held. Each portfolio pays its own expenses. The Fund offers six classes of shares: Class A Shares, Class B Shares, Class C Shares, Class R Shares, Institutional Shares and Class R6 Shares. All shares of the Fund have equal rights with respect to voting, except on class-specific matters. The investment objective of the Fund is to provide capital appreciation.
On September 1, 2017, the Fund's R6 Shares commenced operations.
On March 30, 2017, the Fund's T Share class became effective with the Securities and Exchange Commission (SEC), but is not yet offered for sale.
2. SIGNIFICANT ACCOUNTING POLICIES
The following is a summary of significant accounting policies consistently followed by the Fund in the preparation of its financial statements. These policies are in conformity with U.S. generally accepted accounting principles (GAAP).
Investment Valuation
In calculating its net asset value (NAV), the Fund generally values investments as follows:
| ■ | Equity securities listed on an exchange or traded through a regulated market system are valued at their last reported sale price or official closing price in their principal exchange or market. |
| ■ | Shares of other mutual funds or non-exchange-traded investment companies are valued based upon their reported NAVs. |
| ■ | Fixed-income securities are fair valued using price evaluations provided by a pricing service approved by the Trustees. |
| ■ | Derivative contracts listed on exchanges are valued at their reported settlement or closing price, except that options are valued at the mean of closing bid and asked quotations. |
| ■ | Over-the-counter (OTC) derivative contracts are fair valued using price evaluations provided by a pricing service approved by the Trustees. |
| ■ | For securities that are fair valued in accordance with procedures established by and under the general supervision of the Trustees, certain factors may be considered such as: the last traded or purchase price of the security, information obtained by contacting the issuer or dealers, analysis of the issuer's financial statements or other available documents, fundamental analytical data, the nature and duration of restrictions on disposition, the movement of the market in which the security is normally traded, public trading in similar securities or derivative contracts of the issuer or comparable issuers, movement of a relevant index, or other factors including but not limited to industry changes and relevant government actions. |
If any price, quotation, price evaluation or other pricing source is not readily available when the NAV is calculated, if the Fund cannot obtain price evaluations from a pricing service or from more than one dealer for an investment within a reasonable period of time as set forth in the Fund's valuation policies and procedures, or if information furnished by a pricing service,
Annual Shareholder Report
in the opinion of the valuation committee (“Valuation Committee”), is deemed not representative of the fair value of such security, the Fund uses the fair value of the investment determined in accordance with the procedures described below. There can be no assurance that the Fund could obtain the fair value assigned to an investment if it sold the investment at approximately the time at which the Fund determines its NAV per share.
Fair Valuation and Significant Events Procedures
The Trustees have ultimate responsibility for determining the fair value of investments for which market quotations are not readily available. The Trustees have appointed a Valuation Committee comprised of officers of the Fund, Federated Equity Management Company of Pennsylvania (“Adviser”) and certain of the Adviser's affiliated companies to assist in determining fair value and in overseeing the calculation of the NAV. The Trustees have also authorized the use of pricing services recommended by the Valuation Committee to provide fair value evaluations of the current value of certain investments for purposes of calculating the NAV. The Valuation Committee employs various methods for reviewing third-party pricing-service evaluations including periodic reviews of third-party pricing services' policies, procedures and valuation methods (including key inputs, methods, models and assumptions), transactional back-testing, comparisons of evaluations of different pricing services, and review of price challenges by the Adviser based on recent market activity. In the event that market quotations and price evaluations are not available for an investment, the Valuation Committee determines the fair value of the investment in accordance with procedures adopted by the Trustees. The Trustees periodically review and approve the fair valuations made by the Valuation Committee and any changes made to the procedures.
Factors considered by pricing services in evaluating an investment include the yields or prices of investments of comparable quality, coupon, maturity, call rights and other potential prepayments, terms and type, reported transactions, indications as to values from dealers and general market conditions. Some pricing services provide a single price evaluation reflecting the bid-side of the market for an investment (a “bid” evaluation). Other pricing services offer both bid evaluations and price evaluations indicative of a price between the prices bid and asked for the investment (a “mid” evaluation). The Fund normally uses bid evaluations for any U.S. Treasury and Agency securities, mortgage-backed securities and municipal securities. The Fund normally uses mid evaluations for any other types of fixed-income securities and any OTC derivative contracts. In the event that market quotations and price evaluations are not available for an investment, the fair value of the investment is determined in accordance with procedures adopted by the Trustees.
The Trustees also have adopted procedures requiring an investment to be priced at its fair value whenever the Adviser determines that a significant event affecting the value of the investment has occurred between the time as of which the price of the investment would otherwise be determined and the time as of which the NAV is computed. An event is considered significant if there is both an affirmative expectation that the investment's value will change in response to the event and a reasonable basis for quantifying the resulting change in value. Examples of significant events that may occur after the close of the principal market on which a security is traded, or after the time of a price evaluation provided by a pricing service or a dealer, include:
| ■ | With respect to securities traded principally in foreign markets, significant trends in U.S. equity markets or in the trading of foreign securities index futures contracts; |
| ■ | Political or other developments affecting the economy or markets in which an issuer conducts its operations or its securities are traded; |
Annual Shareholder Report
| ■ | Announcements concerning matters such as acquisitions, recapitalizations, litigation developments, or a natural disaster affecting the issuer's operations or regulatory changes or market developments affecting the issuer's industry. |
The Trustees have adopted procedures whereby the Valuation Committee uses a pricing service to determine the fair value of equity securities traded principally in foreign markets when the Adviser determines that there has been a significant trend in the U.S. equity markets or in index futures trading. For other significant events, the Fund may seek to obtain more current quotations or price evaluations from alternative pricing sources. If a reliable alternative pricing source is not available, the Fund will determine the fair value of the investment in accordance with the fair valuation procedures approved by the Trustees. The Trustees have ultimate responsibility for any fair valuations made in response to a significant event.
Repurchase Agreements
The Fund may invest in repurchase agreements for short-term liquidity purposes. It is the policy of the Fund to require the other party to a repurchase agreement to transfer to the Fund's custodian or sub-custodian eligible securities or cash with a market value (after transaction costs) at least equal to the repurchase price to be paid under the repurchase agreement. The eligible securities are transferred to accounts with the custodian or sub-custodian in which the Fund holds a “securities entitlement” and exercises “control” as those terms are defined in the Uniform Commercial Code. The Fund has established procedures for monitoring the market value of the transferred securities and requiring the transfer of additional eligible securities if necessary to equal at least the repurchase price. These procedures also allow the other party to require securities to be transferred from the account to the extent that their market value exceeds the repurchase price or in exchange for other eligible securities of equivalent market value.
The insolvency of the other party or other failure to repurchase the securities may delay the disposition of the underlying securities or cause the Fund to receive less than the full repurchase price. Under the terms of the repurchase agreement, any amounts received by the Fund in excess of the repurchase price and related transaction costs must be remitted to the other party.
The Fund may enter into repurchase agreements in which eligible securities are transferred into joint trading accounts maintained by the custodian or sub-custodian for investment companies and other clients advised by the Fund's Adviser and its affiliates. The Fund will participate on a pro rata basis with the other investment companies and clients in its share of the securities transferred under such repurchase agreements and in its share of proceeds from any repurchase or other disposition of such securities.
Investment Income, Gains and Losses, Expenses and Distributions
Investment transactions are accounted for on a trade-date basis. Realized gains and losses from investment transactions are recorded on an identified-cost basis. Interest income and expenses are accrued daily. Dividend income and distributions to shareholders are recorded on the ex-dividend date. Foreign dividends are recorded on the ex-dividend date or when the Fund is informed of the ex-dividend date. Distributions of net investment income, if any, are declared and paid annually. Non-cash dividends included in dividend income, if any, are recorded at fair value. Amortization/accretion of premium and discount is included in investment income. Investment income, realized and unrealized gains and losses, and certain fund-level expenses are allocated to each class based on relative average daily net assets, except that Class A Shares, Class B Shares, Class C Shares, Class R Shares,
Annual Shareholder Report
Institutional Shares and Class R6 Shares may bear distribution services fees, other service fees and transfer agent fees unique to those classes. The detail of the total fund expense waivers and reimbursements of $896,335 is disclosed in various locations in this Note 2 and Note 5. For the year ended October 31, 2017, transfer agent fees for the Fund were as follows:
| | Transfer Agent
Fees Incurred | Transfer Agent
Fees Reimbursed |
| Class A Shares | $444,262 | $(212,432) |
| Class B Shares | 29,413 | (16,191) |
| Class C Shares | 189,086 | (88,516) |
| Class R Shares | 113,036 | — |
| Institutional Shares | 172,774 | (99,886) |
| Class R6 Shares | 4 | — |
| TOTAL | $948,575 | $(417,025) |
Dividends are declared separately for each class. No class has preferential dividend rights; differences in per share dividend rates are generally due to differences in separate class expenses.
Other Service Fees
The Fund may pay other service fees up to 0.25% of the average daily net assets of the Fund's Class A Shares, Class B Shares and Class C Shares to unaffiliated financial intermediaries or to Federated Shareholder Services Company (FSSC) for providing services to shareholders and maintaining shareholder accounts. Financial intermediaries may include a company affiliated with management of Federated Investors, Inc. A financial intermediary affiliated with management of Federated Investors, Inc. received $14,697 of other service fees for the year ended October 31, 2017. Subject to the terms described in the Expense Limitation note, FSSC may voluntarily reimburse the Fund for other service fees. For the year ended October 31, 2017, other service fees for the Fund were as follows:
| | Other Service
Fees Incurred |
| Class A Shares | $885,533 |
| Class B Shares | 40,867 |
| Class C Shares | 367,184 |
| TOTAL | $1,293,584 |
Federal Taxes
It is the Fund's policy to comply with the Subchapter M provision of the Internal Revenue Code and to distribute to shareholders each year substantially all of its income. Accordingly, no provision for federal income tax is necessary. As of and during the year ended October 31, 2017, the Fund did not have a liability for any uncertain tax positions. The Fund recognizes interest and penalties, if any, related to tax liabilities as income tax expense in the Statement of Operations. As of October 31, 2017, tax years 2014 through 2017 remain subject to examination by the Fund's major tax jurisdictions, which include the United States of America and the Commonwealth of Massachusetts.
Annual Shareholder Report
The Fund may be subject to taxes imposed by governments of countries in which it invests. Such taxes are generally based on either income or gains earned or repatriated. The Fund accrues and applies such taxes to net investment income, net realized gains and net unrealized gains as income and/or gains are earned.
When-Issued and Delayed-Delivery Transactions
The Fund may engage in when-issued or delayed-delivery transactions. The Fund records when-issued securities on the trade date and maintains security positions such that sufficient liquid assets will be available to make payment for the securities purchased. Securities purchased on a when-issued or delayed-delivery basis are marked to market daily and begin earning interest on the settlement date. Losses may occur on these transactions due to changes in market conditions or the failure of counterparties to perform under the contract.
Foreign Exchange Contracts
The Fund enters into foreign exchange contracts to manage currency and market risks. Purchased contracts are used to acquire exposure to foreign currencies, whereas, contracts to sell are used to hedge the Fund's securities against currency fluctuations. Risks may arise upon entering into these transactions from the potential inability of counterparties to meet the terms of their commitments and from unanticipated movements in security prices or foreign exchange rates. The foreign exchange contracts are adjusted by the daily exchange rate of the underlying currency and any gains or losses are recorded for financial statement purposes as unrealized until the settlement date.
Foreign Currency Translation
The accounting records of the Fund are maintained in U.S. dollars. All assets and liabilities denominated in foreign currencies are translated into U.S. dollars based on the rates of exchange of such currencies against U.S. dollars on the date of valuation. Purchases and sales of securities, income and expenses are translated at the rate of exchange quoted on the respective date that such transactions are recorded. The Fund does not isolate that portion of the results of operations resulting from changes in foreign exchange rates on investments from the fluctuations arising from changes in market prices of securities held. Such fluctuations are included with the net realized and unrealized gain or loss from investments.
Reported net realized foreign exchange gains or losses arise from sales of foreign currencies, currency gains or losses realized between the trade and settlement dates on securities transactions, the difference between the amounts of dividends, interest and foreign withholding taxes recorded on the Fund's books, and the U.S. dollar equivalent of the amounts actually received or paid. Net unrealized foreign exchange gains and losses arise from changes in the value of assets and liabilities other than investments in securities at fiscal year-end, resulting from changes in the exchange rate.
Securities Lending
The Fund participates in a securities lending program providing for the lending of equity securities to qualified brokers. The Fund normally receives cash collateral for securities loaned that is invested in an affiliated money market fund or in short-term securities including repurchase agreements. Collateral is maintained at a minimum level of 100% of the market value of investments loaned, plus interest, if applicable. Earnings on collateral are allocated between the borrower of the security, the securities lending agent, as a fee for its services under the program and the Fund, according to agreed-upon rates.
Annual Shareholder Report
Securities lending transactions are subject to Master Netting Agreements. Amounts presented on the Portfolio of Investments and Statement of Assets and Liabilities are not net settlement amounts but gross. As indicated below, the cash collateral received by the Fund exceeds the market value of the securities loaned reducing the net settlement amount to zero. The chart below identifies the amount of collateral received as well as the market value of securities on loan. Additionally, the securities lending agreement executed by the Fund includes an indemnification clause. This clause stipulates that the borrower will reimburse the Fund for any losses as a result of any failure of the borrower to return equivalent securities to the Fund.
As of October 31, 2017, securities subject to this type of arrangement and related collateral were as follows:
Market Value of
Securities Loaned | Market Value
of Collateral |
| $63,480,441 | $72,109,599 |
Restricted Securities
The Fund may purchase securities which are considered restricted. Restricted securities are securities that either: (a) cannot be offered for public sale without first being registered, or being able to take advantage of an exemption from registration, under the Securities Act of 1933; or (b) are subject to contractual restrictions on public sales. In some cases, when a security cannot be offered for public sale without first being registered, the issuer of the restricted security has agreed to register such securities for resale, at the issuer's expense, either upon demand by the Fund or in connection with another registered offering of the securities. Many such restricted securities may be resold in the secondary market in transactions exempt from registration. Restricted securities may be determined to be liquid under criteria established by the Trustees. The Fund will not incur any registration costs upon such resales. The Fund's restricted securities, like other securities, are priced in accordance with procedures established by and under the general supervision of the Trustees.
Additional information on restricted securities, held at October 31, 2017, is as follows:
| Security | Acquisition
Date | Cost | Market
Value |
| SteadyMed Ltd. | 1/26/2015 | $3,475,000 | $1,281,475 |
| SteadyMed Ltd. | 7/29/2016 | $467,622 | $463,140 |
Other
The preparation of financial statements in conformity with GAAP requires management to make estimates and assumptions that affect the amounts of assets, liabilities, expenses and revenues reported in the financial statements. Actual results could differ from those estimated. The Fund applies investment company accounting and reporting guidance.
Annual Shareholder Report
3. SHARES OF BENEFICIAL INTEREST
The following tables summarize share activity:
| Year Ended October 31 | 2017 | 2016 |
| Class A Shares: | Shares | Amount | Shares | Amount |
| Shares sold | 3,267,058 | $93,908,035 | 3,546,734 | $80,986,986 |
| Shares issued to shareholders in payment of distributions declared | 101,389 | 2,541,835 | 1,843,870 | 44,437,276 |
| Shares redeemed | (5,372,852) | (147,856,470) | (14,725,926) | (322,197,132) |
NET CHANGE RESULTING FROM
CLASS A SHARE TRANSACTIONS | (2,004,405) | $(51,406,600) | (9,335,322) | $(196,772,870) |
| Year Ended October 31 | 2017 | 2016 |
| Class B Shares: | Shares | Amount | Shares | Amount |
| Shares sold | 150,415 | $3,608,797 | 154,037 | $3,200,283 |
| Shares issued to shareholders in payment of distributions declared | 5,914 | 130,467 | 81,585 | 1,741,849 |
| Shares redeemed | (255,843) | (6,206,520) | (413,807) | (8,331,118) |
NET CHANGE RESULTING FROM
CLASS B SHARE TRANSACTIONS | (99,514) | $(2,467,256) | (178,185) | $(3,388,986) |
| Year Ended October 31 | 2017 | 2016 |
| Class C Shares: | Shares | Amount | Shares | Amount |
| Shares sold | 788,592 | $19,176,475 | 712,269 | $14,526,790 |
| Shares issued to shareholders in payment of distributions declared | 50,685 | 1,118,120 | 661,890 | 14,131,345 |
| Shares redeemed | (2,352,886) | (57,042,476) | (2,575,408) | (52,512,422) |
NET CHANGE RESULTING FROM
CLASS C SHARE TRANSACTIONS | (1,513,609) | $(36,747,881) | (1,201,249) | $(23,854,287) |
| Year Ended October 31 | 2017 | 2016 |
| Class R Shares: | Shares | Amount | Shares | Amount |
| Shares sold | 452,164 | $12,807,877 | 448,241 | $10,078,698 |
| Shares issued to shareholders in payment of distributions declared | 11,195 | 281,554 | 129,746 | 3,135,965 |
| Shares redeemed | (586,801) | (16,383,171) | (568,018) | (12,847,818) |
NET CHANGE RESULTING FROM
CLASS R SHARE TRANSACTIONS | (123,442) | $(3,293,740) | 9,969 | $366,845 |
Annual Shareholder Report
| | Year Ended
10/31/2017 | Period Ended
10/31/20161 |
| Institutional Shares: | Shares | Amount | Shares | Amount |
| Shares sold | 5,158,792 | $147,580,437 | 4,390,333 | $94,555,471 |
| Shares issued to shareholders in payment of distributions declared | 24,658 | 620,641 | — | — |
| Shares redeemed | (1,993,157) | (56,487,223) | (1,007,978) | (22,874,150) |
| NET CHANGE RESULTING FROM INSTITUTIONAL SHARE TRANSACTIONS | 3,190,293 | $91,713,855 | 3,382,355 | $71,681,321 |
| | Period Ended
10/31/20172 | Year Ended
10/31/2016 |
| Class R6 Shares: | Shares | Amount | | |
| Shares sold | 1,768 | $55,019 | — | $— |
NET CHANGE RESULTING FROM
CLASS R6 SHARE TRANSACTIONS | 1,768 | $55,019 | — | — |
NET CHANGE RESULTING FROM
TOTAL FUND SHARE TRANSACTIONS | (548,909) | $(2,146,603) | (7,322,432) | $(151,967,977) |
| 1 | Reflects operations for the period from December 30, 2015 (date of initial investment) to October 31, 2016. |
| 2 | Reflects operations for the period from September 1, 2017 (date of initial investment) to October 31, 2017. |
4. FEDERAL TAX INFORMATION
The timing and character of income and capital gain distributions are determined in accordance with income tax regulations, which may differ from GAAP. These differences are primary due to differing treatments for foreign currency transactions, net operating losses and passive foreign investment company (PFIC) gains and losses.
For the year ended October 31, 2017, permanent differences identified and reclassified among the components of net assets were as follows:
| Increase (Decrease) |
Undistributed Net
Investment Income (Loss) | Accumulated Net
Realized Gain (Loss) |
| $11,902,340 | $(11,902,340) |
Net investment income (loss), net realized gains (losses), and net assets were not affected by this reclassification.
The tax character of distributions as reported on the Statement of Changes in Net Assets for the years ended October 31, 2017 and 2016, was as follows:
| | 2017 | 2016 |
| Ordinary income1 | $— | $2,151,573 |
| Long-term capital gains | $4,994,718 | $65,871,984 |
| 1 | For tax purposes, short-term capital gain distributions are considered ordinary income distributions. |
| | |
Annual Shareholder Report
As of October 31, 2017, the components of distributable earnings on a tax-basis were as follows:
| Undistributed ordinary income | $13,746,886 |
| Net unrealized appreciation | $299,353,845 |
| Undistributed long-term capital gains | $41,715,294 |
The difference between book-basis and tax-basis net unrealized appreciation/depreciation is attributable to differing treatments for deferral of losses on wash sales and for the realization of unrealized gains on PFICs.
At October 31, 2017, the cost of investments for federal tax purposes was $603,221,437. The net unrealized appreciation of investments for federal tax purposes was $299,353,978. This consists of net unrealized appreciation from investments for those securities having an excess of value over cost of $317,710,907 and net unrealized depreciation from investments for those securities having an excess of cost over value of $18,356,929.
5. INVESTMENT ADVISER FEE AND OTHER TRANSACTIONS WITH AFFILIATES
Investment Adviser Fee
The advisory agreement between the Fund and the Adviser provides for an annual fee equal to 0.80% of the Fund's average daily net assets. Prior to September 1, 2017, the annual advisory fee was equal to 1.30% of the Fund's average daily net assets. Subject to the terms described in the Expense Limitation note, the Adviser may voluntarily choose to waive any portion of its fee. For the year ended October 31, 2017, the Adviser voluntarily waived $93,105 of its fee and voluntarily reimbursed $417,025 of transfer agent fees. The Adviser has agreed to reimburse the Fund for certain investment adviser fees as a result of transactions in other affiliated investment companies. For the year ended October 31, 2017, the Adviser reimbursed $175,442.
Certain of the Fund's assets are managed by Federated Global Investment Management Corp. (the “Sub-Adviser”). Under the terms of a sub-advisory agreement between the Adviser and the Sub-Adviser, the Sub-Adviser receives an allocable portion of the Fund's adviser fee. The fee is paid by the Adviser out of its resources and is not an incremental Fund expense. For the year ended October 31, 2017, the Sub-Adviser earned a fee of $6,929,912.
Administrative Fee
Federated Administrative Services (FAS), under the Administrative Services Agreement, provides the Fund with administrative personnel and services. For purposes of determining the appropriate rate breakpoint, “Investment Complex” is defined as all of the Federated Funds subject to a fee under the Administrative Services Agreement. The fee paid to FAS is based on the average daily net assets of the Investment Complex as specified below:
| Administrative Fee | Average Daily Net Assets
of the Investment Complex |
| 0.100% | on assets up to $50 billion |
| 0.075% | on assets over $50 billion |
Subject to the terms described in the Expense Limitation note, FAS may voluntarily choose to waive any portion of its fee. For the year ended October 31, 2017, the annualized fee paid to FAS was 0.079% of average daily net assets of the Fund.
Annual Shareholder Report
Prior to September 1, 2017, the breakpoints of the Administrative Fee paid to FAS, described above, were:
| Administrative Fee | Average Daily Net Assets
of the Investment Complex |
| 0.150% | on the first $5 billion |
| 0.125% | on the next $5 billion |
| 0.100% | on the next $10 billion |
| 0.075% | on assets in excess of $20 billion |
In addition, FAS may charge certain out-of-pocket expenses to the Fund.
Distribution Services Fee
The Fund has adopted a Distribution Plan (the “Plan”) pursuant to Rule 12b-1 under the Act. Under the terms of the Plan, the Fund will compensate Federated Securities Corp. (FSC), the principal distributor, from the daily net assets of the Fund's Class A Shares, Class B Shares, Class C Shares and Class R Shares to finance activities intended to result in the sale of these shares. The Plan provides that the Fund may incur distribution expenses at the following percentages of average daily net assets annually, to compensate FSC:
| Share Class Name | Percentage of Average Daily
Net Assets of Class |
| Class A Shares | 0.25% |
| Class B Shares | 0.75% |
| Class C Shares | 0.75% |
| Class R Shares | 0.50% |
Subject to the terms described in the Expense Limitation note, FSC may voluntarily choose to waive any portion of its fee. For the year ended October 31, 2017, distribution services fees for the Fund were as follows:
| | Distribution Services
Fees Incurred | Distribution Services
Fees Waived |
| Class A Shares | $894,600 | $(178,264) |
| Class B Shares | 122,600 | — |
| Class C Shares | 1,101,551 | — |
| Class R Shares | 209,340 | (125,604) |
| TOTAL | $2,328,091 | $(303,868) |
When FSC receives fees, it may pay some or all of them to financial intermediaries whose customers purchase shares. For the year ended October 31, 2017, FSC retained $748,449 of fees paid by the Fund.
Annual Shareholder Report
Sales Charges
Front-end sales charges and contingent deferred sales charges (CDSC) do not represent expenses of the Fund. They are deducted from the proceeds of sales of Fund shares prior to investment or from redemption proceeds prior to remittance, as applicable. For the year ended October 31, 2017, FSC retained $45,107 in sales charges from the sale of Class A Shares. FSC also retained $37,824 and $4,655 of CDSC relating to redemptions of Class B Shares and Class C Shares, respectively.
Other Service Fees
For the year ended October 31, 2017, FSSC received $99,344 of the other service fees disclosed in Note 2.
Expense Limitation
The Adviser and certain of its affiliates (which may include FSC, FAS and FSSC) on their own initiative have agreed to waive certain amounts of their respective fees and/or reimburse expenses. Effective September 1, 2017, total annual fund operating expenses (as shown in the financial highlights, excluding interest expense, extraordinary expenses and proxy-related expenses paid by the Fund, if any) paid by the Fund's Class A Shares, Class B Shares, Class C, Shares, Class R Shares, Institutional Shares and Class R6 Shares (after the voluntary waivers and/or reimbursements) will not exceed 1.35%, 2.02%, 1.98%, 1.35%, 0.89% and 0.88% (the “Fee Limit”), respectively, up to but not including the later of (the “Termination Date”): (a) January 1, 2019; or (b) the date of the Fund's next effective Prospectus. While the Adviser and its applicable affiliates currently do not anticipate terminating or increasing these arrangements prior to the Termination Date, these arrangements may only be terminated or the Fee Limit increased prior to the Termination Date with the agreement of the Trustees.
Interfund Transactions
During the year ended October 31, 2017, the Fund engaged in purchase transactions with funds that have a common investment adviser (or affiliated investment advisers), common Directors/Trustees and/or common Officers. These purchase transactions complied with Rule 17a-7 under the Act and amounted to $408,148.
General
Certain Officers and Trustees of the Fund are Officers and Directors or Trustees of certain of the above companies. To efficiently facilitate payment, Directors'/Trustees' fees and certain expenses related to conducting meetings of the Directors/Trustees and other miscellaneous expenses are paid by an affiliate of the Adviser which in due course are reimbursed by the Fund. These expenses related to conducting meetings of the Directors/Trustees and other miscellaneous expenses may be included in Accrued and Miscellaneous Expenses on the Statement of Assets and Liabilities and Statement of Operations, respectively.
6. INVESTMENT TRANSACTIONS
Purchases and sales of investments, excluding long-term U.S. government securities and short-term obligations, for the year ended October 31, 2017, were as follows:
| Purchases | $304,665,224 |
| Sales | $390,609,072 |
Annual Shareholder Report
7. CONCENTRATION OF RISK
The Fund may invest a portion of its assets in securities of companies that are deemed by the Fund's management to be classified in similar business sectors. Economic developments may have an effect on the liquidity and volatility of the portfolio securities.
8. LINE OF CREDIT
The Fund participates with certain other Federated Funds, on a several basis, in an up to $500,000,000 unsecured, 364-day, committed, revolving line of credit (LOC) agreement. The LOC was made available to finance temporarily the repurchase or redemption of shares of the Fund, failed trades, payment of dividends, settlement of trades and for other short-term, temporary or emergency general business purposes. The Fund cannot borrow under the LOC if an inter-fund loan is outstanding. The Fund's ability to borrow under the LOC also is subject to the limitations of the Act and various conditions precedent that must be satisfied before the Fund can borrow. Loans under the LOC are charged interest at a fluctuating rate per annum equal to the highest, on any day, of (a) (i) the federal funds effective rate, (ii) the one month London Interbank Offered Rate (LIBOR), and (iii) 0.0%, plus (b) a margin. The LOC also requires the Fund to pay, quarterly in arrears and at maturity, its pro rata share of a commitment fee based on the amount of the lenders' commitment that has not been utilized. As of October 31, 2017, the Fund had no outstanding loans. During the year ended October 31, 2017, the Fund did not utilize the LOC.
9. INTERFUND LENDING
Pursuant to an Exemptive Order issued by the SEC, the Fund, along with other funds advised by subsidiaries of Federated Investors, Inc., may participate in an interfund lending program. This program provides an alternative credit facility allowing the Fund to borrow from other participating affiliated funds. As of October 31, 2017, there were no outstanding loans. During the year ended October 31, 2017, the program was not utilized.
10. SUBSEQUENT EVENTs
Effective December 1, 2017, Class B Shares will be closed to new accounts and to new investors.
Effective February 1, 2018, Class B Shares will be closed to exchanges from Class B Shares of other Federated Funds and to new purchases made by existing shareholders (excluding reinvestment of dividends and capital gains).
11. FEDERAL TAX INFORMATION (UNAUDITED)
For the year ended October 31, 2017, the amount of long-term capital gains designated by the Fund was $4,994,718.
Annual Shareholder Report
Report of Independent Registered Public Accounting Firm
TO THE BOARD OF Trustees OF Federated Equity Funds AND SHAREHOLDERS OF Federated Kaufmann Small Cap Fund:
We have audited the accompanying statement of assets and liabilities of Federated Kaufmann Small Cap Fund (the “Fund”) (one of the portfolios constituting Federated Equity Funds), including the portfolio of investments, as of October 31, 2017, and the related statement of operations for the year then ended, the statement of changes in net assets for each of the two years in the period then ended, and the financial highlights for each of the years or periods indicated therein. These financial statements and financial highlights are the responsibility of the Fund's management. Our responsibility is to express an opinion on these financial statements and financial highlights based on our audits.
We conducted our audits in accordance with standards of the Public Company Accounting Oversight Board (United States). Those standards require that we plan and perform the audit to obtain reasonable assurance about whether the financial statements and financial highlights are free of material misstatement. We were not engaged to perform an audit of the Fund's internal control over financial reporting. Our audits included consideration of internal control over financial reporting as a basis for designing audit procedures that are appropriate in the circumstances, but not for the purpose of expressing an opinion on the effectiveness of the Fund's internal control over financial reporting. Accordingly, we express no such opinion. An audit also includes examining, on a test basis, evidence supporting the amounts and disclosures in the financial statements and financial highlights, assessing the accounting principles used and significant estimates made by management, and evaluating the overall financial statement presentation. Our procedures included confirmation of securities owned as of October 31, 2017, by correspondence with the custodian and others or by other appropriate auditing procedures where replies from others were not received. We believe that our audits provide a reasonable basis for our opinion.
In our opinion, the financial statements and financial highlights referred to above present fairly, in all material respects, the financial position of Federated Kaufmann Small Cap Fund, a portfolio of Federated Equity Funds, at October 31, 2017, the results of its operations for the year then ended, the changes in its net assets for each of the two years in the period then ended, and the financial highlights for each of the years or periods indicated therein, in conformity with U.S. generally accepted accounting principles.
Boston, Massachusetts
December 22, 2017
Annual Shareholder Report
Shareholder Expense Example (unaudited)
As a shareholder of the Fund, you incur two types of costs: (1) transaction costs, including sales charges (loads) on purchase or redemption payments; and (2) ongoing costs, including management fees and to the extent applicable, distribution (12b-1) fees and/or other service fees and other Fund expenses. This Example is intended to help you to understand your ongoing costs (in dollars) of investing in the Fund and to compare these costs with the ongoing costs of investing in other mutual funds. It is based on an investment of $1,000 invested at the beginning of the period and held for the entire period from May 1, 2017 to October 31, 2017.
ACTUAL EXPENSES
The first section of the table below provides information about actual account values and actual expenses. You may use the information in this section, together with the amount you invested, to estimate the expenses that you incurred over the period. Simply divide your account value by $1,000 (for example, an $8,600 account value divided by $1,000 = 8.6), then multiply the result by the number in the first section under the heading entitled “Expenses Paid During Period” to estimate the expenses attributable to your investment during this period.
HYPOTHETICAL EXAMPLE FOR COMPARISON PURPOSES
The second section of the table below provides information about hypothetical account values and hypothetical expenses based on the Fund's actual expense ratio and an assumed rate of return of 5% per year before expenses, which is not the Fund's actual return. Thus, you should not use the hypothetical account values and expenses to estimate the actual ending account balance or your expenses for the period. Rather, these figures are required to be provided to enable you to compare the ongoing costs of investing in the Fund with other funds. To do so, compare this 5% hypothetical example with the 5% hypothetical examples that appear in the shareholder reports of the other funds.
Annual Shareholder Report
Please note that the expenses shown in the table are meant to highlight your ongoing costs only and do not reflect any transaction costs, such as sales charges (loads) on purchase or redemption payments. Therefore, the second section of the table is useful in comparing ongoing costs only, and will not help you determine the relative total costs of owning different funds. In addition, if these transaction costs were included, your costs would have been higher.
| | Beginning
Account Value
5/1/2017 | Ending
Account Value
10/31/2017 | Expenses Paid
During Period1 |
| Actual: | | | |
| Class A Shares | $1,000 | $1,157.00 | $9.462 |
| Class B Shares | $1,000 | $1,153.30 | $12.703 |
| Class C Shares | $1,000 | $1,153.70 | $12.544 |
| Class R Shares | $1,000 | $1,157.10 | $9.245 |
| Institutional Shares | $1,000 | $1,159.50 | $6.916 |
| Class R6 Shares | $1,000 | $1,139.00 | $1.56 |
| Hypothetical (assuming a 5% return before expenses): | | | |
| Class A Shares | $1,000 | $1,016.40 | $8.842 |
| Class B Shares | $1,000 | $1,013.40 | $11.883 |
| Class C Shares | $1,000 | $1,013.60 | $11.724 |
| Class R Shares | $1,000 | $1,016.60 | $8.645 |
| Institutional Shares | $1,000 | $1,018.80 | $6.466 |
| Class R6 Shares | $1,000 | $1,020.80 | $4.43 |
| 1 | Expenses are equal to the Fund's annualized net expense ratios, multiplied by the average account value over the period, multiplied by 184/365 (to reflect the one-half-year period). The annualized net expense ratios are as follows: |
| | |
| Class A Shares | 1.74% |
| Class B Shares | 2.34% |
| Class C Shares | 2.31% |
| Class R Shares | 1.70% |
| Institutional Shares | 1.27% |
| Class R6 Shares | 0.88% |
| 2 | Actual and Hypothetical expenses paid during the period utilizing the Fund's Class A Shares current Fee Limit of 1.35% (as reflected in the Notes to Financial Statements, Note 5 under Expense Limitation), multiplied by the average account value over the period, multiplied by 184/365 (to reflect expenses paid as if they had been in effect throughout the most recent one-half-year period) would be $7.34 and $6.86, respectively. |
| 3 | Actual and Hypothetical expenses paid during the period utilizing the Fund's Class B Shares current Fee Limit of 2.02% (as reflected in the Notes to Financial Statements, Note 5 under Expense Limitation), multiplied by the average account value over the period, multiplied by 184/365 (to reflect expenses paid as if they had been in effect throughout the most recent one-half-year period) would be $10.96 and $10.25, respectively |
Annual Shareholder Report
| 4 | Actual and Hypothetical expenses paid during the period utilizing the Fund's Class C Shares current Fee Limit of 1.98% (as reflected in the Notes to Financial Statements, Note 5 under Expense Limitation), multiplied by the average account value over the period, multiplied by 184/365 (to reflect expenses paid as if they had been in effect throughout the most recent one-half-year period) would be $10.75 and $10.05, respectively |
| 5 | Actual and Hypothetical expenses paid during the period utilizing the Fund's Class R Shares current Fee Limit of 1.35% (as reflected in the Notes to Financial Statements, Note 5 under Expense Limitation), multiplied by the average account value over the period, multiplied by 184/365 (to reflect expenses paid as if they had been in effect throughout the most recent one-half-year period) would be $7.34 and $6.86, respectively. |
| 6 | Actual and Hypothetical expenses paid during the period utilizing the Fund's Institutional Shares current Fee Limit of 0.89% (as reflected in the Notes to Financial Statements, Note 5 under Expense Limitation), multiplied by the average account value over the period, multiplied by 184/365 (to reflect expenses paid as if they had been in effect throughout the most recent one-half-year period) would be $4.84 and $4.53, respectively. |
Annual Shareholder Report
In Memoriam
With profound sadness, Federated announces the passing of John F. (“Jack”) Donahue and John W. (“John”) McGonigle. They will be greatly missed.
Jack Donahue
(Former Chairman and President, and Emeritus Director/Trustee, of the Federated Funds, and Founder, Former Chairman, President and Chief Executive Officer, and Chairman Emeritus, of Federated Investors, Inc.)
Jack Donahue, along with Richard B. Fisher, founded Federated in 1955 and served as a leader and member of the Boards of Directors/Trustees of the Federated Funds and the Board of Directors of Federated Investors, Inc. Mr. Donahue was a family man of deep faith with exemplary character and fealty, who served his religion, family, community, and the Federated Funds and Federated, as well as their shareholders, officers and employees, with distinction. His integrity, intelligence, and keen sense of fiduciary duty, coupled with his faith, family and background as a West Point graduate and Strategic Air Command B-29 pilot, served as a foundation for his strong business acumen and leadership. Among his many achievements, Mr. Donahue's steadfast and innovative leadership of the Federated Funds and Federated, as well as within the investment management industry, led to the birth of money market funds in the 1970s and their growth as an innovative, efficient and effective cash management vehicle throughout the 1980s, 1990s, 2000s and beyond. Federated expresses deep gratitude to Mr. Donahue for his inspiring leadership, distinguished service and contributions as a husband, father, founder, Board member and officer, colleague and friend.
John McGonigle
(Former Secretary of the Federated Funds, Former Director, Secretary and Chief Legal Officer of Federated Investors, Inc.)
John McGonigle served the Federated Funds and their respective Boards with distinction for more than 50 years as Fund Secretary and also served as Director for several closed-end funds. Mr. McGonigle was a gifted lawyer and wise counselor with a genial presence, keen intellect and convivial demeanor. A man of deep faith, he was a devoted husband, father and grandfather. A graduate of Duquesne University School of Law, Mr. McGonigle served as an officer in the U.S. Army for two years, achieving the rank of Captain. He also served on the staff of the Securities and Exchange Commission before joining Federated in 1966. Among many professional accomplishments, Mr. McGonigle helped fashion the regulatory foundation for money market funds, established Federated's first offshore funds in Ireland, and represented Federated on the Board of Governors of the Investment Company Institute where he was a member of the Executive Committee. Federated expresses deep gratitude for Mr. McGonigle and his impact on his family, friends, the community, and the mutual fund industry.
Annual Shareholder Report
Board of Trustees and Trust Officers
The Board of Trustees is responsible for managing the Trust's business affairs and for exercising all the Trust's powers except those reserved for the shareholders. The following tables give information about each Trustee and the senior officers of the Fund. Where required, the tables separately list Trustees who are “interested persons” of the Fund (i.e., “Interested” Trustees) and those who are not (i.e., “Independent” Trustees). Unless otherwise noted, the address of each person listed is Federated Investors Tower, 1001 Liberty Avenue, Pittsburgh, PA 15222. The address of all Independent Trustees listed is 4000 Ericsson Drive, Warrendale, PA 15086-7561; Attention: Mutual Fund Board. As of December 31, 2016, the Trust comprised 14 portfolio(s), and the Federated Fund Family consisted of 40 investment companies (comprising 124 portfolios). Unless otherwise noted, each Officer is elected annually. Unless otherwise noted, each Trustee oversees all portfolios in the Federated Fund Family and serves for an indefinite term. The Fund's Statement of Additional Information includes additional information about Trust Trustees and is available, without charge and upon request, by calling 1-800-341-7400.
Interested Trustees Background
Name
Birth Date
Positions Held with Trust
Date Service Began | Principal Occupation(s) for Past Five Years,
Other Directorships Held and Previous Position(s) |
J. Christopher Donahue*
Birth Date: April 11, 1949
President and Trustee
Indefinite Term
Began serving: January 2000 | Principal Occupations: Principal Executive Officer and President of certain of the Funds in the Federated Fund Family; Director or Trustee of the Funds in the Federated Fund Family; President, Chief Executive Officer and Director, Federated Investors, Inc.; Chairman and Trustee, Federated Investment Management Company; Trustee, Federated Investment Counseling; Chairman and Director, Federated Global Investment Management Corp.; Chairman and Trustee, Federated Equity Management Company of Pennsylvania; Trustee, Federated Shareholder Services Company; Director, Federated Services Company.
Previous Positions: President, Federated Investment Counseling; President and Chief Executive Officer, Federated Investment Management Company, Federated Global Investment Management Corp. and Passport Research, Ltd; Chairman, Passport Research, Ltd. |
Annual Shareholder Report
Name
Birth Date
Positions Held with Trust
Date Service Began | Principal Occupation(s) for Past Five Years,
Other Directorships Held and Previous Position(s) |
John B. Fisher*
Birth Date: May 16, 1956
Trustee
Indefinite Term
Began serving: May 2016 | Principal Occupations: Principal Executive Officer and President of certain of the Funds in the Federated Fund Family; Director or Trustee of certain of the Funds in the Federated Fund Family; Vice President, Federated Investors, Inc.; President, Director/Trustee and CEO, Federated Advisory Services Company, Federated Equity Management Company of Pennsylvania, Federated Global Investment Management Corp., Federated Investment Counseling, Federated Investment Management Company; President of some of the Funds in the Federated Fund Complex and Director, Federated Investors Trust Company.
Previous Positions: President and Director of the Institutional Sales Division of Federated Securities Corp.; President and Director of Federated Investment Counseling; President and CEO of Passport Research, Ltd.; Director, Edgewood Securities Corp.; Director, Federated Services Company; Director, Federated Investors, Inc.; Chairman and Director, Southpointe Distribution Services, Inc. and President, Technology, Federated Services Company. |
| * | Reasons for “interested” status: J. Christopher Donahue and John B. Fisher are interested due to their beneficial ownership of shares of Federated Investors, Inc. and due to positions they hold with Federated and its subsidiaries. |
INDEPENDENT Trustees Background
Name
Birth Date
Positions Held with Trust
Date Service Began | Principal Occupation(s) for Past Five Years,
Other Directorships Held, Previous Position(s) and Qualifications |
John T. Collins
Birth Date: January 24, 1947
Trustee
Indefinite Term
Began serving: October 2013 | Principal Occupations: Director or Trustee of the Federated Fund Family; formerly, Chairman and CEO, The Collins Group, Inc. (a private equity firm) (Retired).
Other Directorships Held: Director, Current Chair of the Compensation Committee, KLX Corp.
Qualifications: Mr. Collins has served in several business and financial management roles and directorship positions throughout his career. Mr. Collins previously served as Chairman and CEO, The Collins Group, Inc. (a private equity firm). Mr. Collins serves as Chairman Emeriti, Bentley University. Mr. Collins previously served as Director and Audit Committee Member, Bank of America Corp.; Director, FleetBoston Financial Corp.; and Director, Beth Israel Deaconess Medical Center (Harvard University Affiliate Hospital). |
Annual Shareholder Report
Name
Birth Date
Positions Held with Trust
Date Service Began | Principal Occupation(s) for Past Five Years,
Other Directorships Held, Previous Position(s) and Qualifications |
G. Thomas Hough
Birth Date: February 28, 1955
Trustee
Indefinite Term
Began serving: August 2015 | Principal Occupations: Director or Trustee of the Federated Fund Family; formerly, Vice Chair, Ernst & Young LLP (public accounting firm) (Retired).
Other Directorships Held: Director, Chair of the Audit Committee, Governance Committee, Publix Super Markets, Inc.; Director, Member of the Audit Committee and Technology Committee of Equifax, Inc.
Qualifications: Mr. Hough has served in accounting, business management and directorship positions throughout his career. Mr. Hough most recently held the position of Americas Vice Chair of Assurance with Ernst & Young LLP (public accounting firm). Mr. Hough is an Executive Committee member of the United States Golf Association, he serves on the President's Cabinet and Business School Board of Visitors for the University of Alabama and is on the Business School Board of Visitors for Wake Forest University. |
Maureen Lally-Green
Birth Date: July 5, 1949
Trustee
Indefinite Term
Began serving: August 2009 | Principal Occupations: Director or Trustee of the Federated Fund Family; Dean of the Duquesne University School of Law; Adjunct Professor of Law, Duquesne University School of Law; formerly, Interim Dean of the Duquesne University School of Law; Associate General Secretary and Director, Office of Church Relations, Diocese of Pittsburgh.
Other Directorships Held: Director, CONSOL Energy Inc.
Qualifications: Judge Lally-Green has served in various legal and business roles and directorship positions throughout her career. Judge Lally-Green previously served as: Associate General Secretary, Diocese of Pittsburgh; a member of the Superior Court of Pennsylvania; and as a Professor of Law, Duquesne University School of Law. Judge Lally-Green also currently holds the positions on either a public or not for profit Board of Directors as follows: Director and Chair, UPMC Mercy Hospital; Regent, St. Vincent Seminary; Director and Vice Chair, Our Campaign for the Church Alive!, Inc.; Director, Saint Vincent College; Member, Pennsylvania State Board of Education (public); and Director and Chair, Cardinal Wuerl North Catholic High School, Inc. Judge Lally-Green has held the positions of: Director, Auberle; Director, Epilepsy Foundation of Western and Central Pennsylvania; Director, Ireland Institute of Pittsburgh; Director, Saint Thomas More Society; Director, Catholic High Schools of the Diocese of Pittsburgh, Inc.; and Director, Pennsylvania Bar Institute. |
Peter E. Madden
Birth Date: March 16, 1942
Trustee
Indefinite Term
Began serving: November 1991 | Principal Occupation: Director or Trustee, and Chair of the Board of Directors or Trustees, of the Federated Fund Family; Retired.
Other Directorships Held: None.
Qualifications: Mr. Madden has served in several business management, mutual fund services and directorship positions throughout his career. Mr. Madden previously served as President, Chief Operating Officer and Director, State Street Bank and Trust Company (custodian bank) and State Street Corporation (financial services). He was Director, VISA USA and VISA International and Chairman and Director, Massachusetts Bankers Association. Mr. Madden served as Director, Depository Trust Corporation and Director, The Boston Stock Exchange. Mr. Madden also served as a Representative to the Commonwealth of Massachusetts General Court. |
Annual Shareholder Report
Name
Birth Date
Positions Held with Trust
Date Service Began | Principal Occupation(s) for Past Five Years,
Other Directorships Held, Previous Position(s) and Qualifications |
Charles F. Mansfield, Jr.
Birth Date: April 10, 1945
Trustee
Indefinite Term
Began serving: January 1999 | Principal Occupations: Director or Trustee of the Federated Fund Family; Management Consultant.
Other Directorships Held: None.
Qualifications: Mr. Mansfield has served as a Marine Corps officer and in several banking, business management, educational roles and directorship positions throughout his long career. He remains active as a Management Consultant. |
Thomas M. O'Neill
Birth Date: June 14, 1951
Trustee
Indefinite Term
Began serving: August 2006 | Principal Occupations: Director or Trustee, Chair of the Audit Committee of the Federated Fund Family; Sole Proprietor, Navigator Management Company (investment and strategic consulting).
Other Directorships Held: None.
Qualifications: Mr. O'Neill has served in several business, mutual fund and financial management roles and directorship positions throughout his career. Mr. O'Neill serves as Director, Medicines for Humanity and Director, The Golisano Children's Museum of Naples, Florida. Mr. O'Neill previously served as Chief Executive Officer and President, Managing Director and Chief Investment Officer, Fleet Investment Advisors; President and Chief Executive Officer, Aeltus Investment Management, Inc.; General Partner, Hellman, Jordan Management Co., Boston, MA; Chief Investment Officer, The Putnam Companies, Boston, MA; Credit Analyst and Lending Officer, Fleet Bank; Director and Consultant, EZE Castle Software (investment order management software); and Director, Midway Pacific (lumber). |
P. Jerome Richey
Birth Date: February 23, 1949
Trustee
Indefinite Term
Began serving: October 2013 | Principal Occupations: Director or Trustee of the Federated Fund Family; Management Consultant; formerly, Senior Vice Chancellor and Chief Legal Officer, University of Pittsburgh and Executive Vice President and Chief Legal Officer, CONSOL Energy Inc.
Other Directorships Held: None.
Qualifications: Mr. Richey has served in several business and legal management roles and directorship positions throughout his career. Mr. Richey most recently held the positions of Senior Vice Chancellor and Chief Legal Officer, University of Pittsburgh. Mr. Richey previously served as Chairman of the Board, Epilepsy Foundation of Western Pennsylvania and Chairman of the Board, World Affairs Council of Pittsburgh. Mr. Richey previously served as Chief Legal Officer and Executive Vice President, CONSOL Energy Inc.; and Board Member, Ethics Counsel and Shareholder, Buchanan Ingersoll & Rooney PC (a law firm). |
Annual Shareholder Report
Name
Birth Date
Positions Held with Trust
Date Service Began | Principal Occupation(s) for Past Five Years,
Other Directorships Held, Previous Position(s) and Qualifications |
John S. Walsh
Birth Date: November 28, 1957
Trustee
Indefinite Term
Began serving: January 1999 | Principal Occupations: Director or Trustee of the Federated Fund Family; President and Director, Heat Wagon, Inc. (manufacturer of construction temporary heaters); President and Director, Manufacturers Products, Inc. (distributor of portable construction heaters); President, Portable Heater Parts, a division of Manufacturers Products, Inc.
Other Directorships Held: None.
Qualifications: Mr. Walsh has served in several business management roles and directorship positions throughout his career. Mr. Walsh previously served as Vice President, Walsh & Kelly, Inc. (paving contractors). |
OFFICERS
Name
Birth Date
Address
Positions Held with Trust
Date Service Began | Principal Occupation(s) for Past Five Years
and Previous Position(s) |
Lori A. Hensler
Birth Date: January 6, 1967
TREASURER
Officer since: April 2013 | Principal Occupations: Principal Financial Officer and Treasurer of the Federated Fund Family; Senior Vice President, Federated Administrative Services; Financial and Operations Principal for Federated Securities Corp. and Edgewood Services, Inc.; and Assistant Treasurer, Federated Investors Trust Company. Ms. Hensler has received the Certified Public Accountant designation.
Previous Positions: Controller of Federated Investors, Inc.; Senior Vice President and Assistant Treasurer, Federated Investors Management Company; Treasurer, Federated Investors Trust Company; Assistant Treasurer, Federated Administrative Services, Federated Administrative Services, Inc., Federated Securities Corp., Edgewood Services, Inc., Federated Advisory Services Company, Federated Equity Management Company of Pennsylvania, Federated Global Investment Management Corp., Federated Investment Counseling, Federated Investment Management Company, Passport Research, Ltd., and Federated MDTA, LLC; Financial and Operations Principal for Federated Securities Corp., Edgewood Services, Inc. and Southpointe Distribution Services, Inc. |
Richard B. Fisher
Birth Date: May 17, 1923
VICE PRESIDENT
Officer since: April 1987 | Principal Occupations: Vice Chairman or Vice President of some of the Funds in the Federated Fund Family; Vice Chairman, Federated Investors, Inc.; Chairman, Federated Securities Corp.
Previous Positions: President and Director or Trustee of some of the Funds in the Federated Fund Family; Executive Vice President, Federated Investors, Inc.; Director and Chief Executive Officer, Federated Securities Corp. |
Annual Shareholder Report
Name
Birth Date
Address
Positions Held with Trust
Date Service Began | Principal Occupation(s) for Past Five Years
and Previous Position(s) |
Peter J. Germain
Birth Date: September 3, 1959
CHIEF LEGAL OFFICER, SECRETARY and EXECUTIVE VICE PRESIDENT
Officer since: January 2005 | Principal Occupations: Mr. Germain is Chief Legal Officer, Secretary and Executive Vice President of the Federated Fund Family. He is General Counsel, Chief Legal Officer, Secretary and Executive Vice President, Federated Investors, Inc.; Trustee and Senior Vice President, Federated Investors Management Company; Trustee and President, Federated Administrative Services; Director and President, Federated Administrative Services, Inc.; Director and Vice President, Federated Securities Corp.; Director and Secretary, Federated Private Asset Management, Inc.; Secretary, Federated Shareholder Services Company; and Secretary, Retirement Plan Service Company of America. Mr. Germain joined Federated in 1984 and is a member of the Pennsylvania Bar Association.
Previous Positions: Deputy General Counsel, Special Counsel, Managing Director of Mutual Fund Services, Federated Investors, Inc.; Senior Vice President, Federated Services Company; and Senior Corporate Counsel, Federated Investors, Inc. |
Stephen Van Meter
Birth Date: June 5, 1975
CHIEF COMPLIANCE OFFICER AND SENIOR VICE PRESIDENT
Officer since: July 2015 | Principal Occupations: Senior Vice President and Chief Compliance Officer of the Federated Fund Family; Vice President and Chief Compliance Officer of Federated Investors, Inc. and Chief Compliance Officer of certain of its subsidiaries. Mr. Van Meter joined Federated in October 2011. He holds FINRA licenses under Series 3, 7, 24 and 66.
Previous Positions: Mr. Van Meter previously held the position of Compliance Operating Officer, Federated Investors, Inc. Prior to joining Federated, Mr. Van Meter served at the United States Securities and Exchange Commission in the positions of Senior Counsel, Office of Chief Counsel, Division of Investment Management and Senior Counsel, Division of Enforcement. |
Stephen F. Auth
Birth Date: September 13, 1956
101 Park Avenue
41st Floor
New York, NY 10178
CHIEF INVESTMENT OFFICER
Officer since: November 2002 | Principal Occupations: Stephen F. Auth is Chief Investment Officer of various Funds in the Federated Fund Family; Executive Vice President, Federated Investment Counseling, Federated Global Investment Management Corp. and Federated Equity Management Company of Pennsylvania.
Previous Positions: Executive Vice President, Federated Investment Management Company and Passport Research, Ltd. (investment advisory subsidiary of Federated); Senior Vice President, Global Portfolio Management Services Division; Senior Vice President, Federated Investment Management Company and Passport Research, Ltd.; Senior Managing Director and Portfolio Manager, Prudential Investments. |
Annual Shareholder Report
Evaluation and Approval of Advisory Contract–May 2017
Federated Kaufmann Small Cap Fund (the “Fund”)
Following a review and recommendation of approval by the Fund's independent trustees, the Fund's Board of Trustees (the “Board”) reviewed and unanimously approved the continuation of the Fund's investment advisory and subadvisory contracts for an additional one-year term at its May 2017 meetings. The Board's decision regarding these contracts reflects the exercise of its business judgment after considering all of the information received on whether to continue the existing arrangements.
The Board had previously appointed a Senior Officer, whose duties include specified responsibilities relating to the process by which advisory fees are to be charged to a Federated fund. The Senior Officer has the authority to retain consultants, experts, or staff as may be reasonably necessary to assist in the performance of his duties, reports directly to the Board, and may be terminated only with the approval of a majority of the independent members of the Board. The Senior Officer prepared and furnished to the Board an independent, written evaluation that covered topics discussed below (the “Senior Officer's Evaluation”). The Board considered the Senior Officer's Evaluation, along with other information, in deciding to approve the investment advisory and subadvisory contracts.
The Board also considered judicial decisions concerning allegedly excessive investment advisory fees in its decision. Using these judicial decisions as a guide, the Board has indicated that the following factors may be relevant to an adviser's fiduciary duty with respect to its receipt of compensation from a fund: (1) the nature and quality of the services provided by an adviser to a fund and its shareholders (including the performance of the Fund and of comparable funds); (2) an adviser's cost of providing the services (including the profitability to an adviser of providing advisory services to a fund); (3) the extent to which an adviser may realize “economies of scale” as a fund grows larger and, if such economies of scale exist, whether they have been shared with a fund and its shareholders or the family of funds; (4) any “fall-out financial benefits” that accrue to an adviser because of its relationship with a fund (including research services received from brokers that execute fund trades and any fees paid to affiliates of an adviser for services rendered to a fund); (5) comparative fee and expense structures (including a comparison of fees paid to an adviser with those paid by similar funds); and (6) the extent of care, conscientiousness and independence with which the Fund's board members perform their duties and their expertise (including whether they are fully informed about all facts the Board deems relevant to its consideration of an adviser's services and fees). The Board noted that the Securities and Exchange Commission (“SEC”) disclosure requirements regarding the basis for the Board's approval of the Fund's investment advisory and subadvisory contracts generally align with the factors
Annual Shareholder Report
listed above. Consistent with the judicial decisions and SEC disclosure requirements, the Board also considered management fees charged to institutional and other clients of Federated Equity Management Company of Pennsylvania (the “Adviser”) and any subadviser and their advisory affiliates, for what might be viewed as like services. The Board was aware of these factors and was guided by them in its review of the Fund's investment advisory and subadvisory contracts to the extent it considered them to be appropriate and relevant, as discussed further below.
The Board considered and weighed these factors in light of its substantial accumulated experience in governing the Fund and working with Federated Investors, Inc. and its affiliates (“Federated”) on matters relating to the Federated funds. The Board was assisted in its deliberations by independent legal counsel. In addition to the extensive materials that comprise and accompany the Senior Officer's Evaluation, the Board received detailed information about the Fund and the Federated organization throughout the year, and in connection with its May meetings. Federated provided much of this information at each regular meeting of the Board, and furnished additional information in connection with the May meetings at which the Board's formal approval of the investment advisory and subadvisory contracts occurred. At the May meetings, in addition to meeting in separate sessions of the independent trustees without management present, senior management of the Adviser also met with the independent trustees and their counsel to discuss the materials presented and any other matters thought relevant by the Adviser or the trustees. Between regularly scheduled meetings, the Board also received information on particular matters as the need arose. The Board's consideration of the investment advisory and subadvisory contracts included review of the Senior Officer's Evaluation, accompanying data and additional information covering such matters as: the Adviser's and subadviser's investment philosophy, revenue, profitability, personnel and processes; investment and operating strategies; the Fund's short-term and long-term performance (in absolute terms, both on a gross basis and net of expenses, as well as in terms relative to its particular investment program and certain competitor or “peer group” funds and/or other benchmarks, as appropriate) and comments on the reasons for performance; the Fund's investment objectives; the Fund's expenses, including the advisory fee and the overall expense structure of the Fund (both in absolute terms and relative to similar and/or competing funds), with due regard for contractual or voluntary expense limitations; the use and allocation of brokerage commissions derived from trading the Fund's portfolio securities (if any); and the nature, quality and extent of the advisory and other services provided to the Fund by the Adviser and its affiliates. The Board also considered the preferences and expectations of Fund shareholders; the entrepreneurial risk assumed by the Adviser in sponsoring the Fund; the continuing state of competition in the mutual fund industry and market practices; the range of comparable fees for similar funds in the mutual fund industry; the Fund's relationship to the Federated funds which
Annual Shareholder Report
include a comprehensive array of funds with different investment objectives, policies and strategies which are generally available for exchange without the incurrence of additional sales charges; compliance and audit reports concerning the Federated funds and the Federated companies that service them (including communications from regulatory agencies), as well as Federated's responses to any issues raised therein; and relevant developments in the mutual fund industry and how the Federated funds and/or Federated are responding to them. The Board also considered that the longevity and experience of the Fund's portfolio management team and their unique approach to investing may limit the utility of comparisons to other equity mutual funds. The Board's evaluation process is evolutionary. The criteria considered and the emphasis placed on relevant criteria change in recognition of changing circumstances in the mutual fund marketplace.
While mindful that courts have cautioned against giving such comparisons too much weight, the Board has found the use of comparisons of the Fund's fees and expenses to other mutual funds with comparable investment programs to be relevant to its deliberations. In this regard, the Board was presented with, and considered, information regarding the contractual advisory fee rates, net advisory fee rates, total expense ratios and each element of the Fund's total expense ratio (i.e., gross and net advisory fees, custody fees, portfolio accounting fees and transfer agency fees) relative to the Fund's peers. The Board focused on comparisons with other similar mutual funds more heavily than non-mutual fund products or services because it is believed that they are more relevant. For example, other mutual funds are the products most like the Fund, in that they are readily available to Fund shareholders as alternative investment vehicles. Also, they are the type of investment vehicle, in fact, chosen and maintained by the Fund's investors. The range of their fees and expenses, therefore, appears to be a relevant indicator of what consumers have found to be reasonable in the marketplace in which the Fund competes.
The Board reviewed the contractual advisory fee rate, net advisory fee rate where partially waived and other expenses of the Fund and noted the position of the Fund's fee rates relative to its peers. In this regard, the Board noted that the contractual advisory fee rate was above the median of the relevant peer group, but the Board noted the applicable waivers and reimbursements and that the overall expense structure of the Fund remained competitive in the context of the other factors considered relevant by the Board. The Senior Officer noted that, in 2016, while the Fund's expenses were above median relative to its peers, those fees remained reasonable in light of its unique bottom-up investment process, the relative expense of that process, the resulting estimated profitability of the Fund over time, and the performance generated over time compared to its peers.
Annual Shareholder Report
For comparison, the Senior Officer has reviewed Federated's fees for providing advisory services to products outside the Federated funds (e.g., institutional and separate accounts and sub-adviser services). He concluded that mutual funds and institutional accounts are inherently different products. Those differences include, but are not limited to, different types of targeted investors; being subject to different laws and regulations; different legal structures; different average account sizes and portfolio management techniques made necessary by different cash flows and different associated costs; and the time spent by portfolio managers and their teams, funds financial services, legal, compliance and risk management in reviewing securities pricing, addressing different administrative responsibilities, addressing different degrees of risk associated with management and a variety of different costs. The Senior Officer did not consider the fees for providing advisory services to these outside products to be determinative in judging the appropriateness of mutual fund advisory fees.
Following such evaluation, and full deliberations, the Board concluded that the expenses of the Fund are reasonable and supported renewal of the Fund's investment advisory and subadvisory contracts.
The Board considered the nature, extent and quality of the services provided to the Fund by the Adviser and the resources of the Adviser and its affiliates dedicated to the Fund. In this regard, the Board evaluated, among other things, the Adviser's personnel, experience, track record, overall reputation and willingness to invest in personnel and infrastructure that benefit the Fund. In addition, the Board reviewed the qualifications, backgrounds and responsibilities of the portfolio management team primarily responsible for the day-to-day management of the Fund. The Board noted the compliance programs of and the compliance-related resources provided to the Fund by the Adviser. The Fund's ability to deliver competitive performance when compared to its peer group was also deemed to be relevant by the Board as a useful indicator of how the Adviser is executing the Fund's investment program. The Adviser's ability to execute this program was one of the Board's considerations in reaching a conclusion that the nature, extent, and quality of the Adviser's investment management services warrant the continuation of the investment advisory and subadvisory contracts.
In evaluating the Fund's investment performance, the Board considered performance results in light of the Fund's investment objective, strategies and risks, as disclosed in the Fund's prospectus. The Board particularly considered detailed investment reports on the Fund's performance that were provided to the Board throughout the year and in connection with the May meetings. The Senior Officer also reviewed information compiled by Federated, using data supplied by independent fund ranking organizations, regarding the performance of, and fees charged by, other mutual funds, noting his view that comparisons to fund peer groups may be helpful, though not conclusive, in judging the
Annual Shareholder Report
reasonableness of the proposed fees. The Board considered, in evaluating such comparisons, that in some cases individual funds may exhibit significant and unique differences in their objectives and management techniques when compared to other funds within an industry peer group.
For the periods covered by the Senior Officer's Evaluation, the Fund's performance for the three-year and five-year periods was above the median of the relevant peer group, and the Fund's performance fell below the median of the relevant peer group for the one-year period. The Board discussed the Fund's performance with the Adviser and recognized the efforts being taken by the Adviser in the context of other factors considered relevant by the Board.
Following such evaluation and full deliberations, the Board concluded that the performance of the Fund supported renewal of the Fund's investment advisory and subadvisory contracts.
The Board also received financial information about Federated, including information regarding the compensation and ancillary (or “fall-out”) benefits Federated derived from its relationships with the Federated funds. This information covered not only the fees under the investment advisory contracts, but also fees received by Federated's subsidiaries for providing other services to the Federated funds under separate contracts (e.g., for serving as the Federated funds' administrator). The information also detailed any indirect benefit Federated may derive from its receipt of research services from brokers who execute Federated fund trades. In addition, the Board considered the fact that, in order for a fund to be competitive in the marketplace, Federated and its affiliates frequently waived fees and/or reimbursed expenses and have disclosed to Fund investors and/or indicated to the Board their intention to do so in the future. Moreover, the Board receives regular reporting as to the institution, adjustment or elimination of these voluntary waivers. The Board considered Federated's previous reductions in contractual management fees to certain funds in response to the Senior Officer's recommendations.
Federated furnished information, requested by the Senior Officer, that reported revenues on a fund-by-fund basis and made estimates of the allocation of expenses on a fund-by-fund basis, using allocation methodologies specified by the Senior Officer. The Senior Officer noted that, while these cost allocation reports apply consistent allocation processes, the inherent difficulties in allocating costs continues to cause the Senior Officer to question the precision of the process and to conclude that such reports may be unreliable, since a single change in an allocation estimate may dramatically alter the resulting estimate of cost and/or profitability of a fund and may produce unintended consequences. The allocation information, including the Senior Officer's view that fund-by-fund estimations may be unreliable, was considered in the analysis by the Board.
Annual Shareholder Report
The Board and the Senior Officer also reviewed information compiled by Federated comparing its profitability information to other publicly held fund management companies. In this regard, the Senior Officer concluded that Federated's profit margins did not appear to be excessive. The Senior Officer also noted that Federated appeared financially sound, with the resources to fulfill its obligations under its contracts with the Fund.
The Senior Officer's Evaluation also discussed the notion of possible realization of “economies of scale” as a fund grows larger. In this regard, the Board considered that the Adviser has made significant and long-term investments in areas that support all of the Federated funds, such as personnel and processes for the portfolio management, shareholder services, compliance, internal audit and risk management functions, as well as systems technology (including technology relating to cybersecurity,) and that the benefits of these efforts (as well as any economies of scale, should they exist) were likely to be enjoyed by the fund family as a whole. The Board noted that the Adviser's investments in these areas are extensive. In addition, the Board considered that Federated and its affiliates have frequently waived fees and/or reimbursed expenses and that this has allowed fund shareholders to share potential economies of scale from a fund's inception. Federated, as it does throughout the year, and in connection with the Board's review, furnished information relative to revenue sharing or adviser paid fees. Federated and the Senior Officer noted that this information should be viewed to determine if there was an incentive to either not apply breakpoints or to apply breakpoints at higher levels. It should not be viewed to determine the appropriateness of advisory fees, because it would represent marketing and distribution expenses. Finally, the Board also noted the absence of any applicable regulatory or industry guidelines on this subject, which (as discussed in the Senior Officer's Evaluation) is compounded by the lack of any common industry practice or general pattern with respect to structuring fund advisory fees with “breakpoints” that serve to reduce the fee as a fund attains a certain size.
While the Senior Officer noted certain items for follow-up reporting to the Board and further consideration by management, he stated that his observations and information accompanying the Senior Officer's Evaluation supported a finding by the Board that the management fee the Fund was reasonable. Under these circumstances, no changes were recommended to, and no objection was raised to, the continuation of the Fund's investment advisory and subadvisory contracts.
In its decision to continue an existing investment advisory contract, the Board was mindful of the potential disruptions of the Fund's operations and various risks, uncertainties and other effects that could occur as a result of a decision to terminate or not renew an investment advisory contract. In particular, the Board recognized that many shareholders have invested in the Fund on the strength of the Adviser's industry standing and reputation and with the expectation that the Adviser will have a continuing role in providing advisory services to the Fund.
Annual Shareholder Report
Thus, the Board's approval of the advisory and subadvisory contracts reflected the fact that it is the shareholders who have effectively selected the Adviser by virtue of having invested in the Fund. The Board concluded that, in light of the factors discussed above, including the nature, quality and scope of the services provided to the Fund by the Adviser and its affiliates, continuation of the investment advisory contract was appropriate.
The Board based its decision to approve the investment advisory and subadvisory contracts on the totality of the circumstances and relevant factors and with a view to past and future long-term considerations. Not all of the factors and considerations identified above were necessarily relevant to the Fund, nor did the Board consider any one of them to be determinative. With respect to the factors that were relevant, the Board's decision to approve the continuation of the contracts reflects its determination that Federated's performance and actions provided a satisfactory basis to support the decision to continue the existing arrangements.
Annual Shareholder Report
Voting Proxies on Fund Portfolio Securities
A description of the policies and procedures that the Fund uses to determine how to vote proxies, if any, relating to securities held in the Fund's portfolio is available, without charge and upon request, by calling 1-800-341-7400. A report on “Form N-PX” of how the Fund voted any such proxies during the most recent 12-month period ended June 30 is available via the Proxy Voting Record (Form N-PX) link associated with the Fund and share class name at www.FederatedInvestors.com/FundInformation. Form N-PX filings are also available at the SEC's website at www.sec.gov.
Quarterly Portfolio Schedule
The Fund files with the SEC a complete schedule of its portfolio holdings, as of the close of the first and third quarters of its fiscal year, on “Form N-Q.” These filings are available on the SEC's website at www.sec.gov and may be reviewed and copied at the SEC's Public Reference Room in Washington, DC. (Call 1-800-SEC-0330 for information on the operation of the Public Reference Room.) You may also access this information via the link to the Fund and share class name at www.FederatedInvestors.com/FundInformation.
Annual Shareholder Report
Mutual funds are not bank deposits or obligations, are not guaranteed by any bank and are not insured or guaranteed by the U.S. government, the Federal Deposit Insurance Corporation, the Federal Reserve Board or any other government agency. Investment in mutual funds involves investment risk, including the possible loss of principal.
This Report is authorized for distribution to prospective investors only when preceded or accompanied by the Fund's Prospectus, which contains facts concerning its objective and policies, management fees, expenses and other information.
Federated Kaufmann Small Cap Fund
Federated Investors Funds
4000 Ericsson Drive
Warrendale, PA 15086-7561
Contact us at FederatedInvestors.com
or call 1-800-341-7400.
Federated Securities Corp., Distributor
CUSIP 314172636
CUSIP 314172628
CUSIP 314172610
CUSIP 314172537
CUSIP 31421N402
CUSIP 31421N683
29503 (12/17)
Federated is a registered trademark of Federated Investors, Inc.
2017 ©Federated Investors, Inc.
Annual Shareholder Report
October 31, 2017
| Share Class | Ticker | A | FGSAX | B | FGSBX | C | FGSCX |
| | Institutional | FGSIX | R6 | FGSKX | |
Federated MDT Mid Cap Growth Fund
Fund Established 1984
A Portfolio of Federated Equity Funds
Dear Valued Shareholder,
I am pleased to present the Annual Shareholder Report for your fund covering the period from November 1, 2016 through October 31, 2017. This report includes Management's Discussion of Fund Performance, a complete listing of your fund's holdings, performance information and financial statements along with other important fund information.
In addition, our website, FederatedInvestors.com, offers easy access to Federated resources that include timely fund updates, economic and market insights from our investment strategists, and financial planning tools. We invite you to register to take full advantage of its capabilities.
Thank you for investing with Federated. I hope you find this information useful and look forward to keeping you informed.
Sincerely,
J. Christopher Donahue, President
Not FDIC Insured ■ May Lose Value ■ No Bank Guarantee
CONTENTS
| 1 |
| 7 |
| 8 |
| 13 |
| 18 |
| 20 |
| 21 |
| 22 |
| 32 |
| 33 |
| 35 |
| 36 |
| 42 |
| 49 |
| 49 |
Management's Discussion of Fund Performance (unaudited)
The total return of Federated MDT Mid Cap Growth Fund (the “Fund”), based on net asset value for the 12-month reporting period ended October 31, 2017, was 30.20% for the Class A Shares, 29.25% for the Class B Shares, 29.25% for the Class C Shares, 30.52% for the Institutional Shares and 30.54% for the Class R6 Shares. The total return of the Russell Midcap® Growth Index (RMCGI),1,2 the Fund's broad-based securities market index, was 26.25% for the same period. The total return of the Morningstar Mid Cap Growth Funds Average (MMCGFA),3 a peer group average for the Fund, was 26.06% during the reporting period. The Fund's and the MMCGFA's total returns for the most recently completed fiscal year reflected actual cash flows, transaction costs and other expenses which were not reflected in the total return of the RMCGI.
During the reporting period, the Fund's investment strategy focused on stock selection, which was the most significant factor affecting the Fund's performance relative to the RMCGI.
The following discussion will focus on the performance of the Fund's Institutional Shares during the reporting period.
MARKET OVERVIEW
During the reporting period, the most significant feature of the market was the continued run of growth stocks ahead of value stocks. The performance of the Russell 3000® Index4 (R3000) was strong and returned 23.98% during the reporting period. Within the R3000, the Russell 3000® Growth Index5 returned 29.80%, while the Russell 3000® Value Index6 returned 18.30%. There was less difference by capitalization range: the mega-cap Russell Top 200® Index7 returned 24.69%, the Russell Midcap® Index returned 21.09%,8 and the small-cap Russell 2000® Index9 returned 27.85%. While the market was strong overall, the strength in the R3000 was concentrated in the technology stocks–Apple, Microsoft, Amazon, Facebook and NVIDIA all had a strong year.
The best-performing sectors in the RMCGI during the reporting period were Information Technology (43.27%), Financials (42.09%) and Health Care (33.10%). (While the Utilities sector did have a higher return of 59.06%, that sector holds just one company and, at 0.02% of the benchmark, is too small to have had any effect on the overall return.) Underperforming sectors during the same period included Consumer Staples (-2.61%), Energy (0.12%) and Consumer Discretionary (10.54%). Each of the Consumer Staples and Consumer Discretionary sectors have a significant weight in retailing, and the brick-and-mortar retailing establishments have performed very poorly in the market given the expectation (perhaps unjustified) that most of them will be replaced by Amazon.com.
Annual Shareholder Report
STOCK SELECTION
Stock selection was the biggest contributor to the Fund's outperformance relative to the RMCGI during the reporting period. The Fund looked for stocks with the specific combinations of fundamental and technical factors that internal research has shown to predict outperformance relative to the RMCGI. In this growth-oriented reporting period, the Fund's holdings with the strongest growth characteristics, high analyst conviction and/or high price momentum, together with good quality factors (relatively strong cash flow, no need for significant amounts of external financing), provided positive contributions to Fund performance throughout the reporting period. The stocks that detracted from Fund performance during the reporting period were the mid-cap growth stocks that the Fund had chosen for their relatively strong value fundamentals. These stocks do well in a more value-oriented time period but were not helpful during this reporting period.
The Information Technology sector and the Health Care sector contributed the most to the Fund's outperformance versus the RMCGI. Information Technology was the best-performing sector during the reporting period, and stock selection of the Fund was good, based again on strong growth factors and good quality factors. The Health Care sector was led by the Fund's security selection in the Health Care Equipment & Services industry, which includes many makers of high tech medical equipment. The only sector that detracted from performance was the Consumer Discretionary sector, driven by poor performance of the Retailing industry, which includes many companies that score well on our value fundamentals.
Individual stocks enhancing the Fund's performance included Applied Materials, Inc., Ameriprise Financial Inc., United Rentals Inc., Lam Research Corporation and Cognex Corporation. All of these stocks outperformed the benchmark and were overweighted by the Fund. Individual stocks detracting from the Fund's performance during the reporting period included Foot Locker, Inc., AutoZone Inc. and Intuitive Surgical, Inc. The first two stocks underperformed the benchmark and were overweighted by the Fund, while the last stock outperformed the benchmark and was underweighted by the Fund.
Annual Shareholder Report
| 1 | Please see the footnotes to the line graphs below for definitions of, and further information about, the RMCGI. |
| 2 | Mid-Capitalization companies often have narrower markets and limited managerial and financial resources compared to larger and more established companies. |
| 3 | Please see the footnotes to the line graphs below for definitions of, and further information about, the MMCGFA. |
| 4 | The R3000 measures the performance of the largest 3000 U.S. companies representing approximately 98% of the investable U.S. equity market. The R3000 is constructed to provide a comprehensive, unbiased, and stable barometer of the broad market and is completely reconstituted annually to ensure new and growing equities are reflected.* |
| 5 | The Russell 3000® Growth Index measures the performance of the broad growth segment of the U.S. equity universe. It includes those Russell 3000® Index companies with higher price-to-book ratios and higher forecasted growth values. The Russell 3000® Growth Index is constructed to provide a comprehensive, unbiased and stable barometer of the broad growth market. The Russell 3000® Growth Index is completely reconstituted annually to ensure new and growing equities are included and that the represented companies continue to reflect growth characteristics.* |
| 6 | The Russell 3000® Value Index measures the performance of the broad value segment of the U.S. equity value universe. It includes those Russell 3000® Index companies with lower price-to-book ratios and lower forecasted growth values. The Russell 3000® Value Index is constructed to provide a comprehensive, unbiased and stable barometer of the broad value market. The Russell 3000® Value Index is completely reconstituted annually to ensure new and growing equities are included and that the represented companies continue to reflect value characteristics.* |
| 7 | The Russell Top 200® Index measures the performance of the largest cap segment of the U.S. equity universe. The Russell Top 200® Index is a subset of the Russell 3000® Index. It includes approximately 200 of the largest securities based on a combination of their market cap and current index membership. The Russell Top 200® Index is constructed to provide a comprehensive and unbiased barometer for this very large cap segment and is completely reconstituted annually to ensure new and growing equities are reflected.* |
| 8 | The Russell Midcap® Index measures the performance of the mid-cap segment of the U.S. equity universe. The Russell Midcap® Index is a subset of the Russell 1000® Index. It includes approximately 800 of the smallest securities based on a combination of their market cap and current index membership. The Russell Midcap® Index is constructed to provide a comprehensive and unbiased barometer for the mid-cap segment and is completely reconstituted annually to ensure larger stocks do not distort the performance and characteristics of the true mid-cap opportunity set.* |
| 9 | The Russell 2000® Index measures the performance of the small-cap segment of the U.S. equity universe. The Russell 2000® Index is a subset of the Russell 3000® Index. It includes approximately 2000 of the smallest securities based on a combination of their market cap and current index membership. The Russell 2000® is constructed to provide a comprehensive and unbiased small-cap barometer and is completely reconstituted annually to ensure larger stocks do not distort the performance and characteristics of the true small-cap opportunity set.* |
| * | The index is unmanaged, and it is not possible to invest directly in an index. |
Annual Shareholder Report
FUND PERFORMANCE AND GROWTH OF A $10,000 INVESTMENT
The graph below illustrates the hypothetical investment of $10,0001 in the Federated MDT Mid Cap Growth Fund2 from October 31, 2007 to October 31, 2017, compared to the Russell Midcap® Growth Index (RMCGI)3 and the Morningstar Mid Cap Growth Funds Average (MMCGFA).4 The Average Annual Total Return table below shows returns for each class averaged over the stated periods.
Growth of a $10,000 Investment
Growth of $10,000 as of October 31, 2017

| Federated MDT Mid Cap Growth Fund - | Institutional Shares | Class C Shares | Class A Shares | RMCGI | MMCGFA |
| F | F | F | I | I |
| 10/31/2007 | 10,000 | 10,000 | 9,450 | 10,000 | 10,000 |
| 10/31/2008 | 5,875 | 5,836 | 5,556 | 5,735 | 5,768 |
| 10/31/2009 | 6,526 | 6,448 | 6,184 | 7,024 | 6,704 |
| 10/31/2010 | 7,927 | 7,761 | 7,502 | 8,993 | 8,443 |
| 10/31/2011 | 8,357 | 8,103 | 7,889 | 9,900 | 9,079 |
| 10/31/2012 | 8,555 | 8,212 | 8,055 | 10,800 | 9,769 |
| 10/31/2013 | 11,639 | 11,058 | 10,931 | 14,465 | 12,921 |
| 10/31/2014 | 13,594 | 12,790 | 12,734 | 16,575 | 14,236 |
| 10/31/2015 | 13,892 | 12,941 | 12,984 | 17,393 | 14,646 |
| 10/31/2016 | 13,641 | 12,581 | 12,715 | 17,463 | 14,511 |
| 10/31/2017 | 17,804 | 16,261 | 16,555 | 22,046 | 18,302 |
41 graphic description end -->
| ■ | Total returns shown for the Class C Shares include the maximum contingent deferred sales charge of 1.00% as applicable. |
| ■ | Total returns shown for the Class A Shares include the maximum sales charge of 5.50% ($10,000 investment minus $550 sales charge = $9,450). |
The Fund offers multiple share classes whose performance may be greater than or less than its other share class(es) due to differences in sales charges and expenses. See the Average Annual Total Return table below for the returns of additional classes not shown in the line graph above.
Annual Shareholder Report
Average Annual Total Returns for the Period Ended 10/31/2017
(returns reflect all applicable sales charges and contingent deferred sales charges as specified below in footnote #1)
| | 1 Year | 5 Years | 10 Years |
| Class A Shares | 23.05% | 14.20% | 5.17% |
| Class B Shares | 23.75% | 14.41% | 5.13% |
| Class C Shares | 28.25% | 14.64% | 4.98% |
| Institutional Shares | 30.52% | 15.79% | 5.94% |
| Class R6 Shares5 | 30.54% | 15.14% | 5.36% |
| RMCGI | 26.25% | 15.34% | 8.23% |
| MMCGFA | 26.06% | 13.66% | 6.81% |
Performance data quoted represents past performance which is no guarantee of future results. Investment return and principal value will fluctuate so that an investor's shares, when redeemed, may be worth more or less than their original cost. Mutual fund performance changes over time and current performance may be lower or higher than what is stated. For current to the most recent month-end performance and after-tax returns, visit FederatedInvestors.com or call 1-800-341-7400. Returns shown do not reflect the deduction of taxes that a shareholder would pay on Fund distributions or the redemption of Fund shares. Mutual funds are not obligations of or guaranteed by any bank and are not federally insured.
Annual Shareholder Report
| 1 | Represents a hypothetical investment of $10,000 in the Fund after deducting applicable sales charges: for Class A Shares, the maximum sales charge of 5.50% ($10,000 investment minus $550 sales charge = $9,450); for Class B Shares, the maximum contingent deferred sales charge is 5.50% on any redemption less than one year from the purchase date; for Class C Shares, the maximum contingent deferred sales charge is 1.00% on any redemption less than one year from the purchase date. The Fund's performance assumes the reinvestment of all dividends and distributions. The RMCGI and the MMCGFA have been adjusted to reflect reinvestment of dividends on securities in the index and average. |
| 2 | The Fund's Institutional Shares commenced operations on January 29, 2010. For the period prior to the commencement of operations of the Institutional Shares, the performance information shown is for the Fund's Class A Shares. The performance of the Class A Shares has not been adjusted to reflect the expenses of the Institutional Shares since the Institutional Shares have a lower expense ratio than the expense ratio of the Class A Shares. The performance of Class A Shares has been adjusted to remove any voluntary waiver of Fund expenses that may have occurred during the period prior to the commencement of operations of the Institutional Shares. |
| 3 | The RMCGI measures the performance of the mid-cap growth segment of the U.S. equity universe. It includes those Russell Midcap® Index companies with higher price-to-book ratios and higher forecasted growth values. The RMCGI is constructed to provide a comprehensive and unbiased barometer of the mid-cap growth market and is completely reconstituted annually to ensure larger stocks do not distort the performance and characteristics of the true mid-cap growth market. The RMCGI is not adjusted to reflect sales loads, expenses or other fees that the Securities and Exchange Commission (SEC) requires to be reflected in the Fund's performance. The index is unmanaged and unlike the Fund, is not affected by cash flows. It is not possible to invest directly in an index. |
| 4 | Morningstar figures represent the average of the total returns reported by all the funds designated by Morningstar as falling into the respective category indicated. They do not reflect sales charges. The Morningstar figures in the Growth of $10,000 line graph are based on historical return information published by Morningstar and reflect the return of the funds comprising the category in the year of publication. Because the funds designated by Morningstar as falling into the category can change over time, the Morningstar figures in the line graph may not match the Morningstar figures in the Average Annual Total Returns table, which reflect the return of the funds that currently comprise the category. |
| 5 | Prior to September 1, 2016, Class R6 Shares were known as Class R Shares and included 12b-1 fees and certain other expenses. As of September 1, 2016, Class R6 does not include such 12b-1 fees and certain other expenses, and the performance shown above for Class R6 prior to September 1, 2016, reflects the higher Class R expenses. |
Annual Shareholder Report
Portfolio of Investments Summary Table (unaudited)
At October 31, 2017, the Fund's sector composition1 was as follows:
| Sector Composition | Percentage of
Total Net Assets |
| Information Technology | 24.4% |
| Financial Services | 16.9% |
| Consumer Cyclicals | 16.5% |
| Health Care | 12.8% |
| Capital Goods | 9.7% |
| Consumer Durables | 5.8% |
| Consumer Staples | 5.8% |
| Basic Industries | 4.0% |
| Energy | 1.3% |
| Transportation | 0.9% |
| Cash Equivalents2 | 1.8% |
| Other Assets and Liabilities—Net3 | 0.1% |
| TOTAL | 100.0% |
| 1 | Except for Cash Equivalents and Other Assets and Liabilities, sector classifications are based upon, and individual portfolio securities are assigned to, the classifications of the Global Industry Classification Standard (GICS) except that the Adviser assigns a classification to securities not classified by the GICS and to securities for which the Adviser does not have access to the classification made by the GICS. |
| 2 | Cash Equivalents include any investments in money market mutual funds and/or overnight repurchase agreements. |
| 3 | Assets, other than investments in securities, less liabilities. See Statement of Assets and Liabilities. |
Annual Shareholder Report
Portfolio of Investments
October 31, 2017
| Shares | | | Value |
| | | COMMON STOCKS—98.1% | |
| | | Basic Industries—4.0% | |
| 44,561 | | Avery Dennison Corp. | $4,731,041 |
| 35,691 | 1 | Berry Global Group, Inc. | 2,121,830 |
| 27,963 | | Chemours Co./The | 1,582,986 |
| 10,900 | 1 | Crown Holdings, Inc. | 655,853 |
| 63,456 | 1 | Owens-Illinois, Inc. | 1,515,964 |
| 3,270 | | Royal Gold, Inc. | 275,040 |
| 27,044 | 1 | Univar, Inc. | 804,559 |
| 9,420 | | Westlake Chemical Corp. | 799,852 |
| | | TOTAL | 12,487,125 |
| | | Capital Goods—9.7% | |
| 182,594 | | Allison Transmission Holdings, Inc. | 7,758,419 |
| 23,802 | | Grainger (W.W.), Inc. | 4,705,655 |
| 21,989 | | IDEX Corp. | 2,819,210 |
| 3,167 | | Parker-Hannifin Corp. | 578,326 |
| 170,451 | | Pitney Bowes, Inc. | 2,341,997 |
| 32,556 | | Roper Technologies, Inc. | 8,404,983 |
| 26,784 | 1 | United Rentals, Inc. | 3,789,400 |
| | | TOTAL | 30,397,990 |
| | | Consumer Cyclicals—16.5% | |
| 27,082 | 1 | AMC Networks, Inc. | 1,377,932 |
| 10,253 | 1 | AutoZone, Inc. | 6,044,144 |
| 19,541 | 1 | Burlington Stores, Inc. | 1,834,705 |
| 26,779 | 1 | CoStar Group, Inc. | 7,919,889 |
| 146,633 | 1 | Discovery Communications, Inc. | 2,768,431 |
| 14,674 | 1 | Dollar Tree, Inc. | 1,339,003 |
| 18,559 | | Expedia, Inc. | 2,313,565 |
| 72,035 | | Foot Locker, Inc. | 2,166,813 |
| 97,759 | 1 | GoDaddy, Inc. | 4,565,345 |
| 20,033 | | Kohl's Corp. | 836,578 |
| 37,969 | 1 | Live Nation Entertainment, Inc. | 1,662,283 |
| 85,066 | 1 | MSG Networks, Inc. | 1,475,895 |
| 29,603 | 1 | Michaels COS, Inc. | 574,890 |
| 117,115 | | Nielsen Holdings PLC | 4,341,453 |
| 17,508 | 1 | O'Reilly Automotive, Inc. | 3,693,313 |
| 146,527 | | R.R. Donnelley & Sons Co. | 1,348,048 |
Annual Shareholder Report
| Shares | | | Value |
| | | COMMON STOCKS—continued | |
| | | Consumer Cyclicals—continued | |
| 10,039 | | Ross Stores, Inc. | $637,376 |
| 16,606 | | Sabre Corp. | 324,813 |
| 209,818 | 1 | Urban Outfitters, Inc. | 5,144,737 |
| 6,639 | | Wynn Resorts Ltd. | 979,186 |
| | | TOTAL | 51,348,399 |
| | | Consumer Durables—5.8% | |
| 82,691 | | D. R. Horton, Inc. | 3,655,769 |
| 11,878 | | Genuine Parts Co. | 1,047,996 |
| 46,143 | | Goodyear Tire & Rubber Co. | 1,411,514 |
| 30,698 | | Harley-Davidson, Inc. | 1,453,243 |
| 7,012 | | Lear Corp. | 1,231,237 |
| 63,865 | | Lennar Corp., Class A | 3,555,365 |
| 5,560 | | Snap-On, Inc. | 877,257 |
| 104,279 | | Toll Brothers, Inc. | 4,801,005 |
| | | TOTAL | 18,033,386 |
| | | Consumer Staples—5.8% | |
| 63,262 | | Block (H&R), Inc. | 1,565,102 |
| 82,870 | | Dr. Pepper Snapple Group, Inc. | 7,098,644 |
| 6,477 | | Energizer Holdings, Inc. | 278,446 |
| 74,300 | | GNC Holdings, Inc. | 508,212 |
| 32,613 | | Ingredion, Inc. | 4,088,040 |
| 12,089 | | McCormick & Co., Inc. | 1,203,218 |
| 5,903 | | Spectrum Brands Holdings, Inc. | 648,858 |
| 44,422 | | Tupperware Brands Corp. | 2,609,792 |
| | | TOTAL | 18,000,312 |
| | | Energy—1.3% | |
| 64,411 | | Cabot Oil & Gas Corp., Class A | 1,784,185 |
| 6,778 | 1 | Cheniere Energy, Inc. | 316,804 |
| 14,276 | | Cimarex Energy Co. | 1,669,293 |
| 13,115 | | RPC, Inc. | 318,825 |
| | | TOTAL | 4,089,107 |
| | | Financial Services—16.9% | |
| 4,865 | | Alliance Data Systems Corp. | 1,088,447 |
| 112,300 | | Ally Financial, Inc. | 2,934,399 |
| 47,935 | | Ameriprise Financial, Inc. | 7,503,745 |
| 156,358 | | Citizens Financial Group, Inc. | 5,943,168 |
| 39,486 | 1 | CoreLogic, Inc. | 1,851,893 |
| 8,051 | 1 | Credit Acceptance Corp. | 2,308,463 |
Annual Shareholder Report
| Shares | | | Value |
| | | COMMON STOCKS—continued | |
| | | Financial Services—continued | |
| 8,347 | | Dun & Bradstreet Corp. | $975,180 |
| 12,134 | | Equifax, Inc. | 1,316,903 |
| 63,414 | | MSCI, Inc., Class A | 7,442,267 |
| 59,127 | 1 | TransUnion | 3,103,576 |
| 94,940 | 1 | Vantiv, Inc. | 6,645,800 |
| 43,647 | | Waddell & Reed Financial, Inc., Class A | 815,763 |
| 239,190 | | Western Union Co. | 4,750,313 |
| 147,407 | | XL Group Ltd. | 5,965,561 |
| | | TOTAL | 52,645,478 |
| | | Health Care—12.8% | |
| 10,726 | 1 | Abiomed, Inc. | 2,069,260 |
| 33,265 | 1 | Acadia Pharmaceuticals, Inc. | 1,158,620 |
| 4,976 | 1 | Agios Pharmaceuticals, Inc. | 319,807 |
| 33,003 | 1 | Align Technology, Inc. | 7,887,057 |
| 10,831 | 1 | Alnylam Pharmaceuticals, Inc. | 1,319,649 |
| 2,409 | 1 | Athenahealth, Inc. | 308,063 |
| 4,713 | | Cooper Cos., Inc. | 1,132,345 |
| 17,424 | 1 | DaVita HealthCare Partners, Inc. | 1,058,334 |
| 27,838 | 1 | Edwards Lifesciences Corp. | 2,845,879 |
| 23,223 | 1 | Exelixis, Inc. | 575,698 |
| 9,954 | 1 | HCA Healthcare, Inc. | 753,020 |
| 37,945 | 1 | IDEXX Laboratories, Inc. | 6,305,321 |
| 1,800 | 1 | Illumina, Inc. | 369,342 |
| 9,753 | 1 | Mettler-Toledo International, Inc. | 6,657,690 |
| 41,699 | 1 | Neurocrine Biosciences, Inc. | 2,589,925 |
| 12,733 | 1 | Waters Corp. | 2,496,305 |
| 10,714 | 1 | Wellcare Health Plans, Inc. | 2,118,586 |
| | | TOTAL | 39,964,901 |
| | | Information Technology—24.4% | |
| 106,048 | | Applied Materials, Inc. | 5,984,289 |
| 6,368 | 1 | Arista Networks, Inc. | 1,272,900 |
| 49,871 | | Cognex Corp. | 6,141,614 |
| 152,610 | 1 | Fortinet, Inc. | 6,014,360 |
| 8,874 | | Fortive Corp. | 641,235 |
| 52,996 | | KLA-Tencor Corp. | 5,770,734 |
| 37,768 | | Lam Research Corp. | 7,877,272 |
| 56,702 | | Microchip Technology, Inc. | 5,375,350 |
| 26,451 | | Motorola, Inc. | 2,394,874 |
Annual Shareholder Report
| Shares | | | Value |
| | | COMMON STOCKS—continued | |
| | | Information Technology—continued | |
| 31,671 | 1 | NCR Corp. | $1,016,322 |
| 6,502 | | NVIDIA Corp. | 1,344,679 |
| 99,951 | | NetApp, Inc. | 4,439,823 |
| 65,189 | 1 | Red Hat, Inc. | 7,876,787 |
| 47,426 | 1 | ServiceNow, Inc. | 5,993,224 |
| 2,962 | 1 | Take-Two Interactive Software, Inc. | 327,745 |
| 21,951 | | Universal Display Corp. | 3,215,821 |
| 101,513 | 1 | Veeva Systems, Inc. | 6,186,202 |
| 39,159 | 1 | Workday, Inc. | 4,346,257 |
| | | TOTAL | 76,219,488 |
| | | Transportation—0.9% | |
| 92,593 | 1 | Jet Blue Airways Corp. | 1,773,156 |
| 14,357 | 1 | XPO Logistics, Inc. | 995,658 |
| | | TOTAL | 2,768,814 |
| | | TOTAL COMMON STOCKS
(IDENTIFIED COST $267,200,392) | 305,955,000 |
| | | INVESTMENT COMPANY—1.8% | |
| 5,772,753 | 2 | Federated Institutional Prime Value Obligations Fund, Institutional Shares, 1.21%3
(IDENTIFIED COST $5,773,219) | 5,773,330 |
| | | TOTAL INVESTMENT IN SECURITIES—99.9%
(IDENTIFIED COST $272,973,611)4 | 311,728,330 |
| | | OTHER ASSETS AND LIABILITIES - NET—0.1%5 | 164,239 |
| | | TOTAL NET ASSETS—100% | $311,892,569 |
Annual Shareholder Report
| 1 | Non-income-producing security. |
| 2 | Affiliated holding. |
Affiliated fund holdings are investment companies which are managed by the Adviser or an affiliate of the Adviser. Transactions with affiliated fund holdings during the year ended October 31, 2017, were as follows:
| | Federated
Institutional
Prime Value
Obligations Fund,
Institutional Shares |
| Balance of Shares Held 10/31/2016 | 4,582,723 |
| Purchases/Additions | 35,597,489 |
| Sales/Reductions | (34,407,459) |
| Balance of Shares Held 10/31/2017 | 5,772,753 |
| Value | $5,773,330 |
| Change in Unrealized Appreciation/Depreciation | $111 |
| Net Realized Gain/(Loss) | $(129) |
| Dividend Income | $51,062 |
| 3 | 7-day net yield. |
| 4 | The cost of investments for federal tax purposes amounts to $273,247,120. |
| 5 | Assets, other than investments in securities, less liabilities. See Statement of Assets and Liabilities. |
Note: The categories of investments are shown as a percentage of total net assets at October 31, 2017.
Various inputs are used in determining the value of the Fund's investments. These inputs are summarized in the three broad levels listed below:
Level 1—quoted prices in active markets for identical securities.
Level 2—other significant observable inputs (including quoted prices for similar securities, interest rates, prepayment speeds, credit risk, etc.). Also includes securities valued at amortized cost.
Level 3—significant unobservable inputs (including the Fund's own assumptions in determining the fair value of investments).
The inputs or methodology used for valuing securities are not an indication of the risk associated with investing in those securities.
As of October 31, 2017, all investments of the Fund utilized Level 1 inputs in valuing the Fund's assets carried at fair value.
See Notes which are an integral part of the Financial Statements
Annual Shareholder Report
Financial Highlights–Class A Shares
(For a Share Outstanding Throughout Each Period)
| Year Ended October 31 | 2017 | 2016 | 2015 | 2014 | 2013 |
| Net Asset Value, Beginning of Period | $33.37 | $42.50 | $48.23 | $47.18 | $34.77 |
| Income From Investment Operations: | | | | | |
| Net investment income (loss)1 | (0.04) | 0.05 | (0.03) | 0.08 | 0.09 |
| Net realized and unrealized gain (loss) on investments | 10.06 | (0.77) | 1.01 | 6.88 | 12.32 |
| TOTAL FROM INVESTMENT OPERATIONS | 10.02 | (0.72) | 0.98 | 6.96 | 12.41 |
| Less Distributions: | | | | | |
| Distributions from net investment income | (0.02) | — | (0.07) | — | — |
| Distributions from net realized gain on investments | (0.30) | (8.41) | (6.64) | (5.91) | — |
| TOTAL DISTRIBUTIONS | (0.32) | (8.41) | (6.71) | (5.91) | — |
| Net Asset Value, End of Period | $43.07 | $33.37 | $42.50 | $48.23 | $47.18 |
| Total Return2 | 30.20% | (2.07)% | 1.96% | 16.50% | 35.69% |
| Ratios to Average Net Assets: | | | | | |
| Net expenses | 1.22% | 1.22% | 1.22% | 1.22% | 1.22%3 |
| Net investment income (loss) | (0.10)% | 0.16% | (0.08)% | 0.17% | 0.23% |
| Expense waiver/reimbursement4 | 0.10% | 0.11% | 0.07% | 0.06% | 0.11% |
| Supplemental Data: | | | | | |
| Net assets, end of period (000 omitted) | $236,955 | $206,210 | $246,414 | $269,537 | $257,734 |
| Portfolio turnover | 109% | 115% | 122% | 41% | 124% |
| 1 | Per share numbers have been calculated using the average shares method. |
| 2 | Based on net asset value, which does not reflect the sales charge, redemption fee or contingent deferred sales charge, if applicable. |
| 3 | The net expense ratio is calculated without reduction for expense offset arrangements. The net expense ratio was 1.22% for the year ended October 31, 2013, after taking into account these expense reductions. |
| 4 | This expense decrease is reflected in both the net expense and the net investment income (loss) ratios shown above. |
See Notes which are an integral part of the Financial Statements
Annual Shareholder Report
Financial Highlights–Class B Shares
(For a Share Outstanding Throughout Each Period)
| Year Ended October 31 | 2017 | 2016 | 2015 | 2014 | 2013 |
| Net Asset Value, Beginning of Period | $24.60 | $33.74 | $39.84 | $40.23 | $29.87 |
| Income From Investment Operations: | | | | | |
| Net investment income (loss)1 | (0.24) | (0.15) | (0.29) | (0.22) | (0.17) |
| Net realized and unrealized gain (loss) on investments | 7.38 | (0.58) | 0.83 | 5.74 | 10.53 |
| TOTAL FROM INVESTMENT OPERATIONS | 7.14 | (0.73) | 0.54 | 5.52 | 10.36 |
| Less Distributions: | | | | | |
| Distributions from net realized gain on investments | (0.30) | (8.41) | (6.64) | (5.91) | — |
| Net Asset Value, End of Period | $31.44 | $24.60 | $33.74 | $39.84 | $40.23 |
| Total Return2 | 29.25% | (2.81)% | 1.17% | 15.66% | 34.68% |
| Ratios to Average Net Assets: | | | | | |
| Net expenses | 1.97% | 1.97% | 1.97% | 1.97% | 1.97%3 |
| Net investment income (loss) | (0.84)% | (0.59)% | (0.83)% | (0.58)% | (0.50)% |
| Expense waiver/reimbursement4 | 0.16% | 0.19% | 0.14% | 0.14% | 0.23% |
| Supplemental Data: | | | | | |
| Net assets, end of period (000 omitted) | $1,950 | $2,276 | $3,322 | $4,054 | $4,331 |
| Portfolio turnover | 109% | 115% | 122% | 41% | 124% |
| 1 | Per share numbers have been calculated using the average shares method. |
| 2 | Based on net asset value, which does not reflect the sales charge, redemption fee or contingent deferred sales charge, if applicable. |
| 3 | The net expense ratio is calculated without reduction for expense offset arrangements. The net expense ratio was 1.97% for the year ended October 31, 2013, after taking into account these expense reductions. |
| 4 | This expense decrease is reflected in both the net expense and the net investment income (loss) ratios shown above. |
See Notes which are an integral part of the Financial Statements
Annual Shareholder Report
Financial Highlights–Class C Shares
(For a Share Outstanding Throughout Each Period)
| Year Ended October 31 | 2017 | 2016 | 2015 | 2014 | 2013 |
| Net Asset Value, Beginning of Period | $25.12 | $34.27 | $40.36 | $40.68 | $30.21 |
| Income From Investment Operations: | | | | | |
| Net investment income (loss)1 | (0.25) | (0.15) | (0.30) | (0.22) | (0.19) |
| Net realized and unrealized gain (loss) on investments | 7.54 | (0.59) | 0.85 | 5.81 | 10.66 |
| TOTAL FROM INVESTMENT OPERATIONS | 7.29 | (0.74) | 0.55 | 5.59 | 10.47 |
| Less Distributions: | | | | | |
| Distributions from net realized gain on investments | (0.30) | (8.41) | (6.64) | (5.91) | — |
| Net Asset Value, End of Period | $32.11 | $25.12 | $34.27 | $40.36 | $40.68 |
| Total Return2 | 29.25% | (2.78)% | 1.18% | 15.66% | 34.66% |
| Ratios to Average Net Assets: | | | | | |
| Net expenses | 1.97% | 1.97% | 1.97% | 1.97% | 1.97%3 |
| Net investment income (loss) | (0.85)% | (0.60)% | (0.83)% | (0.58)% | (0.53)% |
| Expense waiver/reimbursement4 | 0.12% | 0.13% | 0.09% | 0.10% | 0.14% |
| Supplemental Data: | | | | | |
| Net assets, end of period (000 omitted) | $10,613 | $9,188 | $11,509 | $12,666 | $12,032 |
| Portfolio turnover | 109% | 115% | 122% | 41% | 124% |
| 1 | Per share numbers have been calculated using the average shares method. |
| 2 | Based on net asset value, which does not reflect the sales charge, redemption fee or contingent deferred sales charge, if applicable. |
| 3 | The net expense ratio is calculated without reduction for expense offset arrangements. The net expense ratio was 1.97% for the year ended October 31, 2013, after taking into account these expense reductions. |
| 4 | This expense decrease is reflected in both the net expense and the net investment income (loss) ratios shown above. |
See Notes which are an integral part of the Financial Statements
Annual Shareholder Report
Financial Highlights–Institutional Shares
(For a Share Outstanding Throughout Each Period)
| Year Ended October 31 | 2017 | 2016 | 2015 | 2014 | 2013 |
| Net Asset Value, Beginning of Period | $34.09 | $43.14 | $48.88 | $47.63 | $35.01 |
| Income From Investment Operations: | | | | | |
| Net investment income1 | 0.07 | 0.14 | 0.08 | 0.20 | 0.20 |
| Net realized and unrealized gain (loss) on investments | 10.25 | (0.78) | 1.01 | 6.96 | 12.42 |
| TOTAL FROM INVESTMENT OPERATIONS | 10.32 | (0.64) | 1.09 | 7.16 | 12.62 |
| Less Distributions: | | | | | |
| Distributions from net investment income | (0.10) | — | (0.19) | — | — |
| Distributions from net realized gain on investments | (0.30) | (8.41) | (6.64) | (5.91) | — |
| TOTAL DISTRIBUTIONS | (0.40) | (8.41) | (6.83) | (5.91) | — |
| Net Asset Value, End of Period | $44.01 | $34.09 | $43.14 | $48.88 | $47.63 |
| Total Return2 | 30.52% | (1.81)% | 2.19% | 16.80% | 36.05% |
| Ratios to Average Net Assets: | | | | | |
| Net expenses | 0.97% | 0.97% | 0.97% | 0.97% | 0.97%3 |
| Net investment income | 0.19% | 0.41% | 0.19% | 0.43% | 0.48% |
| Expense waiver/reimbursement4 | 0.11% | 0.07% | 0.05% | 0.07% | 0.11% |
| Supplemental Data: | | | | | |
| Net assets, end of period (000 omitted) | $24,559 | $40,057 | $49,554 | $75,756 | $93,618 |
| Portfolio turnover | 109% | 115% | 122% | 41% | 124% |
| 1 | Per share numbers have been calculated using the average shares method. |
| 2 | Based on net asset value. |
| 3 | The net expense ratio is calculated without reduction for expense offset arrangements. The net expense ratio was 0.97% for the year ended October 31, 2013, after taking into account these expense reductions. |
| 4 | This expense decrease is reflected in both the net expense and the net investment income ratios shown above. |
See Notes which are an integral part of the Financial Statements
Annual Shareholder Report
Financial Highlights–Class R6 Shares
(For a Share Outstanding Throughout Each Period)
| Year Ended October 31 | 2017 | 2016 | 2015 | 2014 | 2013 |
| Net Asset Value, Beginning of Period | $31.53 | $40.74 | $46.63 | $46.02 | $34.07 |
| Income From Investment Operations: | | | | | |
| Net investment income (loss)1 | 0.04 | (0.07) | (0.23) | (0.17) | (0.12) |
| Net realized and unrealized gain (loss) on investments | 9.53 | (0.73) | 0.98 | 6.69 | 12.07 |
| TOTAL FROM INVESTMENT OPERATIONS | 9.57 | (0.80) | 0.75 | 6.52 | 11.95 |
| Less Distributions: | | | | | |
| Distributions from net realized gain on investments | (0.30) | (8.41) | (6.64) | (5.91) | — |
| Net Asset Value, End of Period | $40.80 | $31.53 | $40.74 | $46.63 | $46.02 |
| Total Return2 | 30.54% | (2.42)% | 1.49% | 15.89% | 35.07% |
| Ratios to Average Net Assets: | | | | | |
| Net expenses | 0.96% | 1.61% | 1.69% | 1.72% | 1.67%3 |
| Net investment income (loss) | 0.12% | (0.22)% | (0.55)% | (0.37)% | (0.30)% |
| Expense waiver/reimbursement4 | 0.04% | 0.05% | 0.01% | 0.08% | 0.03% |
| Supplemental Data: | | | | | |
| Net assets, end of period (000 omitted) | $37,815 | $1,529 | $1,831 | $2,150 | $4,532 |
| Portfolio turnover | 109% | 115% | 122% | 41% | 124% |
| 1 | Per share numbers have been calculated using the average shares method. |
| 2 | Based on net asset value. |
| 3 | The net expense ratio is calculated without reduction for expense offset arrangements. The net expense ratio was 1.67% for the year ended October 31, 2013, after taking into account these expense reductions. |
| 4 | This expense decrease is reflected in both the net expense and the net investment income (loss) ratios shown above. |
See Notes which are an integral part of the Financial Statements
Annual Shareholder Report
Statement of Assets and Liabilities
October 31, 2017
| Assets: | | |
| Investment in securities, at value including $5,773,330 of investment in an affiliated holding (identified cost $272,973,611) | | $311,728,330 |
| Income receivable | | 76,632 |
| Receivable for investments sold | | 3,858,235 |
| Receivable for shares sold | | 136,293 |
| Other assets | | 10,283 |
| TOTAL ASSETS | | 315,809,773 |
| Liabilities: | | |
| Payable for investments purchased | $3,578,626 | |
| Payable for shares redeemed | 47,632 | |
| Payable to adviser (Note 5) | 6,066 | |
| Payable for administrative fees (Note 5) | 682 | |
| Payable for distribution services fee (Note 5) | 7,933 | |
| Payable for other service fees (Notes 2 and 5) | 112,563 | |
| Accrued expenses (Note 5) | 163,702 | |
| TOTAL LIABILITIES | | 3,917,204 |
| Net assets for 7,378,557 shares outstanding | | $311,892,569 |
| Net Assets Consist of: | | |
| Paid-in capital | | $234,407,035 |
| Net unrealized appreciation of investments | | 38,754,719 |
| Accumulated net realized gain on investments | | 38,705,799 |
| Undistributed net investment income | | 25,016 |
| TOTAL NET ASSETS | | $311,892,569 |
Annual Shareholder Report
Statement of Assets and Liabilities–continued
| Net Asset Value, Offering Price and Redemption Proceeds Per Share | | |
| Class A Shares: | | |
| Net asset value per share ($236,954,558 ÷ 5,501,005 shares outstanding), no par value, unlimited shares authorized | | $43.07 |
| Offering price per share (100/94.50 of $43.07) | | $45.58 |
| Redemption proceeds per share | | $43.07 |
| Class B Shares: | | |
| Net asset value per share ($1,950,496 ÷ 62,034 shares outstanding), no par value, unlimited shares authorized | | $31.44 |
| Offering price per share | | $31.44 |
| Redemption proceeds per share (94.50/100 of $31.44) | | $29.71 |
| Class C Shares: | | |
| Net asset value per share ($10,613,211 ÷ 330,574 shares outstanding), no par value, unlimited shares authorized | | $32.11 |
| Offering price per share | | $32.11 |
| Redemption proceeds per share (99.00/100 of $32.11) | | $31.79 |
| Institutional Shares: | | |
| Net asset value per share ($24,558,946 ÷ 558,061 shares outstanding), no par value, unlimited shares authorized | | $44.01 |
| Offering price per share | | $44.01 |
| Redemption proceeds per share | | $44.01 |
| Class R6 Shares: | | |
| Net asset value per share ($37,815,358 ÷ 926,883 shares outstanding), no par value, unlimited shares authorized | | $40.80 |
| Offering price per share | | $40.80 |
| Redemption proceeds per share | | $40.80 |
See Notes which are an integral part of the Financial Statements
Annual Shareholder Report
Statement of Operations
Year Ended October 31, 2017
| Investment Income: | | | |
| Dividends (including $51,062 received from an affiliated holding, see footnotes to the Portfolio of Investments) | | | $3,297,485 |
| Interest | | | 728 |
| TOTAL INCOME | | | 3,298,213 |
| Expenses: | | | |
| Investment adviser fee (Note 5) | | $2,197,622 | |
| Administrative fee (Note 5) | | 231,060 | |
| Custodian fees | | 20,038 | |
| Transfer agent fee (Note 2) | | 382,063 | |
| Directors'/Trustees' fees (Note 5) | | 3,030 | |
| Auditing fees | | 28,825 | |
| Legal fees | | 9,708 | |
| Portfolio accounting fees | | 113,999 | |
| Distribution services fee (Note 5) | | 92,799 | |
| Other service fees (Notes 2 and 5) | | 588,589 | |
| Share registration costs | | 83,744 | |
| Printing and postage | | 40,464 | |
| Taxes | | 1,386 | |
| Miscellaneous (Note 5) | | 28,530 | |
| TOTAL EXPENSES | | 3,821,857 | |
| Waiver and Reimbursements: | | | |
| Waiver/reimbursement of investment adviser fee (Note 5) | $(119,769) | | |
| Reimbursement of other operating expenses (Notes 2 and 5) | (160,587) | | |
| TOTAL WAIVER AND REIMBURSEMENTS | | (280,356) | |
| Net expenses | | | 3,541,501 |
| Net investment income (loss) | | | (243,288) |
| Realized and Unrealized Gain (Loss) on Investments: | | | |
| Net realized gain on investments (including realized loss of $(129) on sales of investments in affiliated holdings) | | | 41,154,337 |
| Net change in unrealized appreciation of investments (including change in unrealized appreciation of $111 on investments in affiliated holdings) | | | 35,060,157 |
| Net realized and unrealized gain on investments | | | 76,214,494 |
| Change in net assets resulting from operations | | | $75,971,206 |
See Notes which are an integral part of the Financial Statements
Annual Shareholder Report
Statement of Changes in Net Assets
| Year Ended October 31 | 2017 | 2016 |
| Increase (Decrease) in Net Assets | | |
| Operations: | | |
| Net investment income (loss) | $(243,288) | $440,781 |
| Net realized gain on investments | 41,154,337 | 2,645,956 |
| Net change in unrealized appreciation/depreciation of investments | 35,060,157 | (9,568,219) |
| CHANGE IN NET ASSETS RESULTING FROM OPERATIONS | 75,971,206 | (6,481,482) |
| Distributions to Shareholders: | | |
| Distributions from net investment income | | |
| Class A Shares | (19,133) | — |
| Institutional Shares | (27,442) | — |
| Distributions from net realized gain on investments | | |
| Class A Shares | (1,929,553) | (48,444,393) |
| Class B Shares | (25,753) | (776,412) |
| Class C Shares | (110,481) | (2,789,000) |
| Institutional Shares | (500,196) | (9,725,854) |
| Class R6 Shares | (14,856) | (385,426) |
| CHANGE IN NET ASSETS RESULTING FROM DISTRIBUTIONS TO SHAREHOLDERS | (2,627,414) | (62,121,085) |
| Share Transactions: | | |
| Proceeds from sale of shares | 62,036,141 | 28,881,701 |
| Net asset value of shares issued to shareholders in payment of distributions declared | 2,434,732 | 57,479,474 |
| Cost of shares redeemed | (85,181,961) | (71,129,469) |
| CHANGE IN NET ASSETS RESULTING FROM SHARE TRANSACTIONS | (20,711,088) | 15,231,706 |
| Change in net assets | 52,632,704 | (53,370,861) |
| Net Assets: | | |
| Beginning of period | 259,259,865 | 312,630,726 |
| End of period (including undistributed net investment income of $25,016 and $227,426, respectively) | $311,892,569 | $259,259,865 |
See Notes which are an integral part of the Financial Statements
Annual Shareholder Report
Notes to Financial Statements
October 31, 2017
1. ORGANIZATION
Federated Equity Funds (the “Trust”) is registered under the Investment Company Act of 1940, as amended (the “Act”), as an open-end management investment company. The Trust consists of 11 portfolios. The financial statements included herein are only those of Federated MDT Mid Cap Growth Fund, a diversified portfolio. The financial statements of the other portfolios are presented separately. The assets of each portfolio are segregated and a shareholder's interest is limited to the portfolio in which shares are held. Each portfolio pays its own expenses. The Fund offers five classes of shares: Class A Shares, Class B Shares, Class C Shares, Institutional Shares and Class R6 Shares. All shares of the Fund have equal rights with respect to voting, except on class-specific matters. The investment objective of the Fund is appreciation of capital.
Class B Shares were closed to new accounts/investors on June 1, 2015, and were closed to new purchases/exchanges by existing shareholder on August 1, 2015.
The fund's name was changed from Federated MDT Mid Cap Growth Strategies Fund to Federated MDT Mid Cap Growth Fund on December 29, 2016.
2. SIGNIFICANT ACCOUNTING POLICIES
The following is a summary of significant accounting policies consistently followed by the Fund in the preparation of its financial statements. These policies are in conformity with U.S. generally accepted accounting principles (GAAP).
Investment Valuation
In calculating its net asset value (NAV), the Fund generally values investments as follows:
| ■ | Equity securities listed on an exchange or traded through a regulated market system are valued at their last reported sale price or official closing price in their principal exchange or market. |
| ■ | Shares of other mutual funds or non-exchange-traded investment companies are valued based upon their reported NAVs. |
| ■ | Derivative contracts listed on exchanges are valued at their reported settlement or closing price, except that options are valued at the mean of closing bid and asked quotations. |
| ■ | Over-the-counter (OTC) derivative contracts are fair valued using price evaluations provided by a pricing service approved by the Fund's Board of Trustees (the “Trustees”). |
| ■ | Fixed-income securities are fair valued using price evaluations provided by a pricing service approved by the Trustees. |
| ■ | For securities that are fair valued in accordance with procedures established by and under the general supervision of the Trustees, certain factors may be considered such as: the last traded or purchase price of the security, information obtained by contacting the issuer or dealers, analysis of the issuer's financial statements or other available documents, fundamental analytical data, the nature and duration of restrictions on disposition, the movement of the market in which the security is normally traded, public trading in similar securities or derivative contracts of the issuer or comparable issuers, movement of a relevant index, or other factors including but not limited to industry changes and relevant government actions. |
Annual Shareholder Report
If any price, quotation, price evaluation or other pricing source is not readily available when the NAV is calculated, if the Fund cannot obtain price evaluations from a pricing service or from more than one dealer for an investment within a reasonable period of time as set forth in the Fund's valuation policies and procedures, or if information furnished by a pricing service, in the opinion of the valuation committee (“Valuation Committee”), is deemed not representative of the fair value of such security, the Fund uses the fair value of the investment determined in accordance with the procedures described below. There can be no assurance that the Fund could obtain the fair value assigned to an investment if it sold the investment at approximately the time at which the Fund determines its NAV per share.
Fair Valuation and Significant Events Procedures
The Trustees have ultimate responsibility for determining the fair value of investments for which market quotations are not readily available. The Trustees have appointed a Valuation Committee comprised of officers of the Fund, Federated MDTA LLC (“Adviser”) and certain of the Adviser's affiliated companies to assist in determining fair value and in overseeing the calculation of the NAV. The Trustees have also authorized the use of pricing services recommended by the Valuation Committee to provide fair value evaluations of the current value of certain investments for purposes of calculating the NAV. The Valuation Committee employs various methods for reviewing third-party pricing-service evaluations including periodic reviews of third-party pricing services' policies, procedures and valuation methods (including key inputs, methods, models and assumptions), transactional back-testing, comparisons of evaluations of different pricing services, and review of price challenges by the Adviser based on recent market activity. In the event that market quotations and price evaluations are not available for an investment, the Valuation Committee determines the fair value of the investment in accordance with procedures adopted by the Trustees. The Trustees periodically review and approve the fair valuations made by the Valuation Committee and any changes made to the procedures.
Factors considered by pricing services in evaluating an investment include the yields or prices of investments of comparable quality, coupon, maturity, call rights and other potential prepayments, terms and type, reported transactions, indications as to values from dealers and general market conditions. Some pricing services provide a single price evaluation reflecting the bid-side of the market for an investment (a “bid” evaluation). Other pricing services offer both bid evaluations and price evaluations indicative of a price between the prices bid and asked for the investment (a “mid” evaluation). The Fund normally uses bid evaluations for any U.S. Treasury and Agency securities, mortgage-backed securities and municipal securities. The Fund normally uses mid evaluations for any other types of fixed-income securities and any OTC derivative contracts. In the event that market quotations and price evaluations are not available for an investment, the fair value of the investment is determined in accordance with procedures adopted by the Trustees.
The Trustees also have adopted procedures requiring an investment to be priced at its fair value whenever the Adviser determines that a significant event affecting the value of the investment has occurred between the time as of which the price of the investment would otherwise be determined and the time as of which the NAV is computed. An event is considered significant if there is both an affirmative expectation that the investment's value
Annual Shareholder Report
will change in response to the event and a reasonable basis for quantifying the resulting change in value. Examples of significant events that may occur after the close of the principal market on which a security is traded, or after the time of a price evaluation provided by a pricing service or a dealer, include:
| ■ | With respect to securities traded principally in foreign markets, significant trends in U.S. equity markets or in the trading of foreign securities index futures contracts; |
| ■ | Political or other developments affecting the economy or markets in which an issuer conducts its operations or its securities are traded; |
| ■ | Announcements concerning matters such as acquisitions, recapitalizations, litigation developments, or a natural disaster affecting the issuer's operations or regulatory changes or market developments affecting the issuer's industry. |
The Trustees have adopted procedures whereby the Valuation Committee uses a pricing service to determine the fair value of equity securities traded principally in foreign markets when the Adviser determines that there has been a significant trend in the U.S. equity markets or in index futures trading. For other significant events, the Fund may seek to obtain more current quotations or price evaluations from alternative pricing sources. If a reliable alternative pricing source is not available, the Fund will determine the fair value of the investment in accordance with the fair valuation procedures approved by the Trustees. The Trustees have ultimate responsibility for any fair valuations made in response to a significant event.
Repurchase Agreements
The Fund may invest in repurchase agreements for short-term liquidity purposes. It is the policy of the Fund to require the other party to a repurchase agreement to transfer to the Fund's custodian or sub-custodian eligible securities or cash with a market value (after transaction costs) at least equal to the repurchase price to be paid under the repurchase agreement. The eligible securities are transferred to accounts with the custodian or sub-custodian in which the Fund holds a “securities entitlement” and exercises “control” as those terms are defined in the Uniform Commercial Code. The Fund has established procedures for monitoring the market value of the transferred securities and requiring the transfer of additional eligible securities if necessary to equal at least the repurchase price. These procedures also allow the other party to require securities to be transferred from the account to the extent that their market value exceeds the repurchase price or in exchange for other eligible securities of equivalent market value.
The insolvency of the other party or other failure to repurchase the securities may delay the disposition of the underlying securities or cause the Fund to receive less than the full repurchase price. Under the terms of the repurchase agreement, any amounts received by the Fund in excess of the repurchase price and related transaction costs must be remitted to the other party.
The Fund may enter into repurchase agreements in which eligible securities are transferred into joint trading accounts maintained by the custodian or sub-custodian for investment companies and other clients advised by the Fund's Adviser and its affiliates. The Fund will participate on a pro rata basis with the other investment companies and clients in its share of the securities transferred under such repurchase agreements and in its share of proceeds from any repurchase or other disposition of such securities.
Annual Shareholder Report
Investment Income, Gains and Losses, Expenses and Distributions
Investment transactions are accounted for on a trade-date basis. Realized gains and losses from investment transactions are recorded on an identified-cost basis. Interest income and expenses are accrued daily. Dividend income and distributions to shareholders are recorded on the ex-dividend date. Foreign dividends are recorded on the ex-dividend date or when the Fund is informed of the ex-dividend date. Distributions of net investment income, if any, are declared and paid annually. Non-cash dividends included in dividend income, if any, are recorded at fair value. Amortization/accretion of premium and discount is included in investment income. Investment income, realized and unrealized gains and losses, and certain fund-level expenses are allocated to each class based on relative average daily net assets, except that Class A Shares, Class B Shares, Class C Shares, Institutional Shares and Class R6 Shares may bear distribution services fees, other service fees and transfer agent fees unique to those classes. The detail of the total fund expense waiver and reimbursements of $280,356 is disclosed in various locations in this Note 2 and Note 5. For the year ended October 31, 2017, transfer agent fees for the Fund were as follows:
| | Transfer Agent
Fees Incurred | Transfer Agent
Fees Reimbursed |
| Class A Shares | $304,724 | $(130,478) |
| Class B Shares | 4,170 | (2,571) |
| Class C Shares | 16,025 | (8,416) |
| Institutional Shares | 39,142 | (19,122) |
| Class R6 Shares | 18,002 | — |
| TOTAL | $382,063 | $(160,587) |
Dividends are declared separately for each class. No class has preferential dividend rights; differences in per share dividend rates are generally due to differences in separate class expenses.
Other Service Fees
The Fund may pay other service fees up to 0.25% of the average daily net assets of the Fund's Class A Shares, Class B Shares and Class C Shares to unaffiliated financial intermediaries or to Federated Shareholder Services Company (FSSC) for providing services to shareholders and maintaining shareholder accounts. Subject to the terms described in the Expense Limitation note, FSSC may voluntarily reimburse the Fund for other service fees. For the year ended October 31, 2017, other service fees for the Fund were as follows:
| | Other Service
Fees Incurred |
| Class A Shares | $557,656 |
| Class B Shares | 5,358 |
| Class C Shares | 25,575 |
| TOTAL | $588,589 |
Annual Shareholder Report
Federal Taxes
It is the Fund's policy to comply with the Subchapter M provision of the Internal Revenue Code (the “Code”) and to distribute to shareholders each year substantially all of its income. Accordingly, no provision for federal income tax is necessary. As of and during the year ended October 31, 2017, the Fund did not have a liability for any uncertain tax positions. The Fund recognizes interest and penalties, if any, related to tax liabilities as income tax expense in the Statement of Operations. As of October 31, 2017, tax years 2014 through 2017 remain subject to examination by the Fund's major tax jurisdictions, which include the United States of America and the Commonwealth of Massachusetts.
When-Issued and Delayed-Delivery Transactions
The Fund may engage in when-issued or delayed-delivery transactions. The Fund records when-issued securities on the trade date and maintains security positions such that sufficient liquid assets will be available to make payment for the securities purchased. Securities purchased on a when-issued or delayed-delivery basis are marked to market daily and begin earning interest on the settlement date. Losses may occur on these transactions due to changes in market conditions or the failure of counterparties to perform under the contract.
Other
The preparation of financial statements in conformity with GAAP requires management to make estimates and assumptions that affect the amounts of assets, liabilities, expenses and revenues reported in the financial statements. Actual results could differ from those estimated. The Fund applies investment company accounting and reporting guidance.
3. SHARES OF BENEFICIAL INTEREST
The following tables summarize share activity:
| Year Ended October 31 | 2017 | 2016 |
| Class A Shares: | Shares | Amount | Shares | Amount |
| Shares sold | 261,233 | $9,990,364 | 632,466 | $20,338,835 |
| Shares issued to shareholders in payment of distributions declared | 48,870 | 1,786,181 | 1,306,600 | 44,424,389 |
| Shares redeemed | (988,616) | (37,919,829) | (1,558,135) | (51,335,752) |
| NET CHANGE RESULTING FROM CLASS A SHARE TRANSACTIONS | (678,513) | $(26,143,284) | 380,931 | $13,427,472 |
| Year Ended October 31 | 2017 | 2016 |
| Class B Shares: | Shares | Amount | Shares | Amount |
| Shares sold | 74 | $2,048 | 2,356 | $59,473 |
| Shares issued to shareholders in payment of distributions declared | 884 | 23,745 | 28,378 | 716,252 |
| Shares redeemed | (31,413) | (881,204) | (36,691) | (944,109) |
| NET CHANGE RESULTING FROM CLASS B SHARE TRANSACTIONS | (30,455) | $(855,411) | (5,957) | $(168,384) |
Annual Shareholder Report
| Year Ended October 31 | 2017 | 2016 |
| Class C Shares: | Shares | Amount | Shares | Amount |
| Shares sold | 78,570 | $2,257,534 | 45,896 | $1,167,467 |
| Shares issued to shareholders in payment of distributions declared | 3,753 | 102,954 | 101,406 | 2,612,212 |
| Shares redeemed | (117,569) | (3,391,505) | (117,320) | (2,955,163) |
| NET CHANGE RESULTING FROM CLASS C SHARE TRANSACTIONS | (35,246) | $(1,031,017) | 29,982 | $824,516 |
| Year Ended October 31 | 2017 | 2016 |
| Institutional Shares: | Shares | Amount | Shares | Amount |
| Shares sold | 406,081 | $15,536,332 | 212,890 | $7,066,174 |
| Shares issued to shareholders in payment of distributions declared | 13,637 | 508,263 | 270,174 | 9,361,520 |
| Shares redeemed | (1,036,726) | (39,225,919) | (456,638) | (15,400,351) |
| NET CHANGE RESULTING FROM INSTITUTIONAL SHARE TRANSACTIONS | (617,008) | $(23,181,324) | 26,426 | $1,027,343 |
| Year Ended October 31 | 2017 | 2016 |
| Class R6 Shares: | Shares | Amount | Shares | Amount |
| Shares sold | 978,045 | $34,249,863 | 7,844 | $249,752 |
| Shares issued to shareholders in payment of distributions declared | 393 | 13,589 | 11,327 | 365,101 |
| Shares redeemed | (100,036) | (3,763,504) | (15,641) | (494,094) |
| NET CHANGE RESULTING FROM CLASS R6 SHARE TRANSACTIONS | 878,402 | $30,499,948 | 3,530 | $120,759 |
| NET CHANGE RESULTING FROM TOTAL FUND SHARE TRANSACTIONS | (482,820) | $(20,711,088) | 434,912 | $15,231,706 |
4. FEDERAL TAX INFORMATION
The timing and character of income and capital gain distributions are determined in accordance with income tax regulations, which may differ from GAAP. These differences are due to differing treatments for regulatory settlement proceeds, equalization, net operating loss and return of capital adjustments.
For the year ended October 31, 2017, permanent differences identified and reclassified among the components of net assets were as follows:
| Increase (Decrease) |
| Paid-In Capital | Undistributed Net
Investment Income (Loss) | Accumulated Net
Realized Gain (Loss) |
| $172,572 | $87,453 | $(260,025) |
Net investment income (loss), net realized gains (losses), and net assets were not affected by this reclassification.
Annual Shareholder Report
The tax character of distributions as reported on the Statement of Changes in Net Assets for the years ended October 31, 2017 and 2016, was as follows:
| | 2017 | 2016 |
| Ordinary income1 | $1,650,137 | $598,193 |
| Long-term capital gains | $977,277 | $61,522,892 |
| 1 | For tax purposes, short-term capital gain distributions are considered ordinary income distributions. |
As of October 31, 2017, the components of distributable earnings on a tax-basis were as follows:
| Undistributed ordinary income2 | $25,881,199 |
| Undistributed long-term capital gains | $13,123,125 |
| Net unrealized appreciation | $38,481,210 |
| 2 | For tax purposes, short-term capital gains are considered ordinary income in determining distributable earnings. |
The difference between book-basis and tax-basis net unrealized appreciation/depreciation is attributable to differing treatments for deferral of losses on wash sales and non-taxable dividends.
At October 31, 2017, the cost of investments for federal tax purposes was $273,247,120. The net unrealized appreciation of investments for federal tax purposes was $38,481,210. This consists of net unrealized appreciation from investments for those securities having an excess of value over cost of $52,088,700 and net unrealized depreciation from investments for those securities having an excess of cost over value of $13,607,490.
5. INVESTMENT ADVISER FEE AND OTHER TRANSACTIONS WITH AFFILIATES
Investment Adviser Fee
The advisory agreement between the Fund and the Adviser provides for an annual fee equal to 0.75% of the Fund's average daily net assets. Subject to the terms described in the Expense Limitation note, the Adviser may voluntarily choose to waive any portion of its fee and/or reimburse certain operating expenses of the Fund. For the year ended October 31, 2017, the Adviser voluntarily waived $113,927 of its fee and voluntarily reimbursed $160,587 of transfer agent fees.
The Adviser has agreed to reimburse the Fund for certain investment adviser fees as a result of transactions in other affiliated investment companies. For the year ended October 31, 2017, the Adviser reimbursed $5,842.
Annual Shareholder Report
Administrative Fee
Federated Administrative Services (FAS), under the Administrative Services Agreement, provides the Fund with administrative personnel and services. For purposes of determining the appropriate rate breakpoint, “Investment Complex” is defined as all of the Federated Funds subject to a fee under the Administrative Services Agreement. The fee paid to FAS is based on the average daily net assets of the Investment Complex as specified below:
| Administrative Fee | Average Daily Net Assets
of the Investment Complex |
| 0.100% | on assets up to $50 billion |
| 0.075% | on assets over $50 billion |
Subject to the terms described in the Expense Limitation note, FAS may voluntarily choose to waive any portion of its fee. For the year ended October 31, 2017, the annualized fee paid to FAS was 0.079% of average daily net assets of the Fund.
Prior to September 1, 2017, the breakpoints of the Administrative Fee paid to FAS, described above, were:
| Administrative Fee | Average Daily Net Assets
of the Investment Complex |
| 0.150% | on the first $5 billion |
| 0.125% | on the next $5 billion |
| 0.100% | on the next $10 billion |
| 0.075% | on assets in excess of $20 billion |
In addition, FAS may charge certain out-of-pocket expenses to the Fund.
Distribution Services Fee
The Fund has adopted a Distribution Plan (the “Plan”) pursuant to Rule 12b-1 under the Act. Under the terms of the Plan, the Fund will compensate Federated Securities Corp. (FSC), the principal distributor, from the daily net assets of the Fund's Class B Shares and Class C Shares to finance activities intended to result in the sale of these shares. The Plan provides that the Fund may incur distribution expenses at the following percentages of average daily net assets annually, to compensate FSC:
| Share Class Name | Percentage of Average Daily
Net Assets of Class |
| Class B Shares | 0.75% |
| Class C Shares | 0.75% |
Annual Shareholder Report
Subject to the terms described in the Expense Limitation note, FSC may voluntarily choose to waive any portion of its fee. For the year ended October 31, 2017, distribution services fees for the Fund were as follows:
| | Distribution Services
Fees Incurred |
| Class B Shares | $16,076 |
| Class C Shares | 76,723 |
| TOTAL | $92,799 |
When FSC receives fees, it may pay some or all of them to financial intermediaries whose customers purchase shares. For the year ended October 31, 2017, FSC retained $22,698 of fees paid by the Fund.
Sales Charges
Front-end sales charges and contingent deferred sales charges (CDSC) do not represent expenses of the Fund. They are deducted from the proceeds of sales of Fund shares prior to investment or from redemption proceeds prior to remittance, as applicable. For the year ended October 31, 2017, FSC retained $9,710 in sales charges from the sale of Class A Shares. FSC also retained $2,336 of CDSC relating to redemptions of Class B Shares and $310 relating to redemptions of Class C Shares.
Other Service Fees
For the year ended October 31, 2017, FSSC received $47,114 of the other service fees disclosed in Note 2.
Expense Limitation
The Adviser and certain of its affiliates (which may include FSC, FAS and FSSC) on their own initiative have agreed to waive certain amounts of their respective fees and/or reimburse expenses. Total annual fund operating expenses (as shown in the financial highlights, excluding interest expense, extraordinary expenses and proxy-related expenses paid by the Fund, if any) paid by the Fund's Class A Shares, Class B Shares, Class C Shares, Institutional Shares and Class R6 Shares (after the voluntary waivers and/or reimbursements) will not exceed 1.22%, 1.97%, 1.97%, 0.97% and 0.96% (the “Fee Limit”), respectively, up to but not including the later of (the “Termination Date”): (a) January 1, 2019 ; or (b) the date of the Fund's next effective Prospectus. While the Adviser and its applicable affiliates currently do not anticipate terminating or increasing these arrangements prior to the Termination Date, these arrangements may only be terminated or the Fee Limit increased prior to the Termination Date with the agreement of the Trustees.
General
Certain Officers and Trustees of the Fund are Officers and Directors or Trustees of certain of the above companies. To efficiently facilitate payment, Directors'/Trustees' fees and certain expenses related to conducting meetings of the Directors/Trustees and other miscellaneous expenses are paid by an affiliate of the Adviser which in due course are reimbursed by the Fund. These expenses related to conducting meetings of the Directors/Trustees and other miscellaneous expenses may be included in Accrued and Miscellaneous Expenses on the Statement of Assets and Liabilities and Statement of Operations, respectively.
Annual Shareholder Report
6. INVESTMENT TRANSACTIONS
Purchases and sales of investments, excluding long-term U.S. government securities and short-term obligations, for the year ended October 31, 2017, were as follows:
| Purchases | $312,116,830 |
| Sales | $337,388,716 |
7. LINE OF CREDIT
The Fund participates with certain other Federated Funds, on a several basis, in an up to $500,000,000 unsecured, 364-day, committed, revolving line of credit (LOC) agreement. The LOC was made available to finance temporarily the repurchase or redemption of shares of the Fund, failed trades, payment of dividends, settlement of trades and for other short-term, temporary or emergency general business purposes. The Fund cannot borrow under the LOC if an inter-fund loan is outstanding. The Fund's ability to borrow under the LOC also is subject to the limitations of the Act and various conditions precedent that must be satisfied before the Fund can borrow. Loans under the LOC are charged interest at a fluctuating rate per annum equal to the highest, on any day, of (a) (i) the federal funds effective rate, (ii) the one month London Interbank Offered Rate (LIBOR), and (iii) 0.0%, plus (b) a margin. The LOC also requires the Fund to pay, quarterly in arrears and at maturity, its pro rata share of a commitment fee based on the amount of the lenders' commitment that has not been utilized.
As of October 31, 2017, the Fund had no outstanding loans. During the year ended October 31, 2017, the Fund did not utilize the LOC.
8. INTERFUND LENDING
Pursuant to an Exemptive Order issued by the SEC, the Fund, along with other funds advised by subsidiaries of Federated Investors, Inc., may participate in an interfund lending program. This program provides an alternative credit facility allowing the Fund to borrow from other participating affiliated funds. As of October 31, 2017, there were no outstanding loans. During the year ended October 31, 2017, the program was not utilized.
9. subsequent event
On November 16, 2017, the Trustees approved a Plan of Conversion for the Class B Shares pursuant to which the Class B Shares will be converted into the Fund's existing Class A Shares at the close of business on February 2, 2018. The conversion will occur on a tax-free basis. The cash value of a shareholder's investment will not change as a result of the share class conversion. No action is required by shareholders to effect the conversion.
10. FEDERAL TAX INFORMATION (UNAUDITED)
For the year ended October 31, 2017, the amount of long-term capital gains designated by the Fund was $977,277.
For the fiscal year ended October 31, 2017, 53.1% of total ordinary income (including short-term capital gain) distributions made by the Fund are qualifying dividends which may be subject to a maximum tax rate of 15%, as provided for by the Jobs and Growth Tax Relief Act of 2003. Complete information is reported in conjunction with the reporting of your distributions on Form 1099-DIV.
Of the ordinary income (including short-term capital gain) distributions made by the Fund during the year ended October 31, 2017, 52.8% qualify for the dividend received deduction available to corporate shareholders.
Annual Shareholder Report
Report of Independent Registered Public Accounting Firm
TO THE BOARD OF TRUSTEES OF THE FEDERATED EQUITY FUNDS AND SHAREHOLDERS OF FEDERATED MDT MID CAP GROWTH FUND:
We have audited the accompanying statement of assets and liabilities, including the portfolio of investments, of the Federated MDT Mid Cap Growth Fund (formerly, Federated MDT Mid Cap Growth Strategies Fund) (the “Fund”), a portfolio of Federated Equity Funds, as of October 31, 2017, and the related statement of operations for the year then ended, the statements of changes in net assets for each of the years in the two-year period then ended, and the financial highlights for each of the years in the five-year period then ended. These financial statements and financial highlights are the responsibility of the Fund's management. Our responsibility is to express an opinion on these financial statements and financial highlights based on our audits.
We conducted our audits in accordance with the standards of the Public Company Accounting Oversight Board (United States). Those standards require that we plan and perform the audit to obtain reasonable assurance about whether the financial statements and financial highlights are free of material misstatement. An audit includes examining, on a test basis, evidence supporting the amounts and disclosures in the financial statements. Our procedures included confirmation of securities owned as of October 31, 2017, by correspondence with the custodian, transfer agent and brokers or by other appropriate auditing procedures. An audit also includes assessing the accounting principles used and significant estimates made by management, as well as evaluating the overall financial statement presentation. We believe that our audits provide a reasonable basis for our opinion.
In our opinion, the financial statements and financial highlights referred to above present fairly, in all material respects, the financial position of the Federated MDT Mid Cap Growth Fund as of October 31, 2017, and the results of its operations for the year then ended, the changes in its net assets for each of the years in the two-year period then ended, and the financial highlights for each of the years in the five-year period then ended, in conformity with U.S. generally accepted accounting principles.
Boston, Massachusetts
December 22, 2017
Annual Shareholder Report
Shareholder Expense Example (unaudited)
As a shareholder of the Fund, you incur two types of costs: (1) transaction costs, including sales charges (“loads”) on purchase or redemption payments; and (2) ongoing costs, including management fees and to the extent applicable, distribution (12b-1) fees and/or other service fees and other Fund expenses. This Example is intended to help you to understand your ongoing costs (in dollars) of investing in the Fund and to compare these costs with the ongoing costs of investing in other mutual funds. It is based on an investment of $1,000 invested at the beginning of the period and held for the entire period from May 1, 2017 to October 31, 2017.
ACTUAL EXPENSES
The first section of the table below provides information about actual account values and actual expenses. You may use the information in this section, together with the amount you invested, to estimate the expenses that you incurred over the period. Simply divide your account value by $1,000 (for example, an $8,600 account value divided by $1,000 = 8.6), then multiply the result by the number in the first section under the heading entitled “Expenses Paid During Period” to estimate the expenses attributable to your investment during this period.
HYPOTHETICAL EXAMPLE FOR COMPARISON PURPOSES
The second section of the table below provides information about hypothetical account values and hypothetical expenses based on the Fund's actual expense ratio and an assumed rate of return of 5% per year before expenses, which is not the Fund's actual return. Thus, you should not use the hypothetical account values and expenses to estimate the actual ending account balance or your expenses for the period. Rather, these figures are required to be provided to enable you to compare the ongoing costs of investing in the Fund with other funds. To do so, compare this 5% hypothetical example with the 5% hypothetical examples that appear in the shareholder reports of the other funds.
Annual Shareholder Report
Please note that the expenses shown in the table are meant to highlight your ongoing costs only and do not reflect any transaction costs, such as sales charges (“loads”) on purchase or redemption payments. Therefore, the second section of the table is useful in comparing ongoing costs only, and will not help you determine the relative total costs of owning different funds. In addition, if these transaction costs were included, your costs would have been higher.
| | Beginning
Account Value
5/1/2017 | Ending
Account Value
10/31/2017 | Expenses Paid
During Period1 |
| Actual: | | | |
| Class A Shares | $1,000 | $1,085.20 | $6.41 |
| Class B Shares | $1,000 | $1,081.20 | $10.33 |
| Class C Shares | $1,000 | $1,081.50 | $10.34 |
| Institutional Shares | $1,000 | $1,086.70 | $5.10 |
| Class R6 Shares | $1,000 | $1,086.80 | $5.05 |
Hypothetical (assuming a 5% return
before expenses): | | | |
| Class A Shares | $1,000 | $1,019.00 | $6.21 |
| Class B Shares | $1,000 | $1,015.30 | $10.01 |
| Class C Shares | $1,000 | $1,015.30 | $10.01 |
| Institutional Shares | $1,000 | $1,020.30 | $4.94 |
| Class R6 Shares | $1,000 | $1,020.40 | $4.89 |
| 1 | Expenses are equal to the Fund's annualized net expense ratios, multiplied by the average account value over the period, multiplied by 184/365 (to reflect the one-half-year period). The annualized net expense ratios are as follows: |
| | |
| Class A Shares | 1.22% |
| Class B Shares | 1.97% |
| Class C Shares | 1.97% |
| Institutional Shares | 0.97% |
| Class R6 Shares | 0.96% |
Annual Shareholder Report
In Memoriam
With profound sadness, Federated announces the passing of John F. (“Jack”) Donahue and John W. (“John”) McGonigle. They will be greatly missed.
Jack Donahue
(Former Chairman and President, and Emeritus Director/Trustee, of the Federated Funds, and Founder, Former Chairman, President and Chief Executive Officer, and Chairman Emeritus, of Federated Investors, Inc.)
Jack Donahue, along with Richard B. Fisher, founded Federated in 1955 and served as a leader and member of the Boards of Directors/Trustees of the Federated Funds and the Board of Directors of Federated Investors, Inc. Mr. Donahue was a family man of deep faith with exemplary character and fealty, who served his religion, family, community, and the Federated Funds and Federated, as well as their shareholders, officers and employees, with distinction. His integrity, intelligence, and keen sense of fiduciary duty, coupled with his faith, family and background as a West Point graduate and Strategic Air Command B-29 pilot, served as a foundation for his strong business acumen and leadership. Among his many achievements, Mr. Donahue's steadfast and innovative leadership of the Federated Funds and Federated, as well as within the investment management industry, led to the birth of money market funds in the 1970s and their growth as an innovative, efficient and effective cash management vehicle throughout the 1980s, 1990s, 2000s and beyond. Federated expresses deep gratitude to Mr. Donahue for his inspiring leadership, distinguished service and contributions as a husband, father, founder, Board member and officer, colleague and friend.
John McGonigle
(Former Secretary of the Federated Funds, Former Director, Secretary and Chief Legal Officer of Federated Investors, Inc.)
John McGonigle served the Federated Funds and their respective Boards with distinction for more than 50 years as Fund Secretary and also served as Director for several closed-end funds. Mr. McGonigle was a gifted lawyer and wise counselor with a genial presence, keen intellect and convivial demeanor. A man of deep faith, he was a devoted husband, father and grandfather. A graduate of Duquesne University School of Law, Mr. McGonigle served as an officer in the U.S. Army for two years, achieving the rank of Captain. He also served on the staff of the Securities and Exchange Commission before joining Federated in 1966. Among many professional accomplishments, Mr. McGonigle helped fashion the regulatory foundation for money market funds, established Federated's first offshore funds in Ireland, and represented Federated on the Board of Governors of the Investment Company Institute where he was a member of the Executive Committee. Federated expresses deep gratitude for Mr. McGonigle and his impact on his family, friends, the community, and the mutual fund industry.
Annual Shareholder Report
Board of Trustees and Trust Officers
The Board of Trustees is responsible for managing the Trust's business affairs and for exercising all the Trust's powers except those reserved for the shareholders. The following tables give information about each Trustee and the senior officers of the Fund. Where required, the tables separately list Trustees who are “interested persons” of the Fund (i.e., “Interested” Trustees) and those who are not (i.e., “Independent” Trustees). Unless otherwise noted, the address of each person listed is Federated Investors Tower, 1001 Liberty Avenue, Pittsburgh, PA 15222. The address of all Independent Trustees listed is 4000 Ericsson Drive, Warrendale, PA 15086-7561; Attention: Mutual Fund Board. As of December 31, 2016, the Trust comprised 14 portfolio(s), and the Federated Fund Family consisted of 40 investment companies (comprising 124 portfolios). Unless otherwise noted, each Officer is elected annually. Unless otherwise noted, each Trustee oversees all portfolios in the Federated Fund Family and serves for an indefinite term. The Fund's Statement of Additional Information includes additional information about Trust Trustees and is available, without charge and upon request, by calling 1-800-341-7400.
Interested TRUSTEES Background
Name
Birth Date
Positions Held with Trust
Date Service Began | Principal Occupation(s) for Past Five Years,
Other Directorships Held and Previous Position(s) |
J. Christopher Donahue*
Birth Date: April 11, 1949
President and Trustee
Indefinite Term
Began serving: September 1999 | Principal Occupations: Principal Executive Officer and President of certain of the Funds in the Federated Fund Family; Director or Trustee of the Funds in the Federated Fund Family; President, Chief Executive Officer and Director, Federated Investors, Inc.; Chairman and Trustee, Federated Investment Management Company; Trustee, Federated Investment Counseling; Chairman and Director, Federated Global Investment Management Corp.; Chairman and Trustee, Federated Equity Management Company of Pennsylvania; Trustee, Federated Shareholder Services Company; Director, Federated Services Company.
Previous Positions: President, Federated Investment Counseling; President and Chief Executive Officer, Federated Investment Management Company, Federated Global Investment Management Corp. and Passport Research, Ltd; Chairman, Passport Research, Ltd. |
Annual Shareholder Report
Name
Birth Date
Positions Held with Trust
Date Service Began | Principal Occupation(s) for Past Five Years,
Other Directorships Held and Previous Position(s) |
John B. Fisher*
Birth Date: May 16, 1956
Trustee
Indefinite Term
Began serving: May 2016 | Principal Occupations: Principal Executive Officer and President of certain of the Funds in the Federated Fund Family; Director or Trustee of certain of the Funds in the Federated Fund Family; Vice President, Federated Investors, Inc.; President, Director/Trustee and CEO, Federated Advisory Services Company, Federated Equity Management Company of Pennsylvania, Federated Global Investment Management Corp., Federated Investment Counseling, Federated Investment Management Company; President of some of the Funds in the Federated Fund Complex and Director, Federated Investors Trust Company.
Previous Positions: President and Director of the Institutional Sales Division of Federated Securities Corp.; President and Director of Federated Investment Counseling; President and CEO of Passport Research, Ltd.; Director, Edgewood Securities Corp.; Director, Federated Services Company; Director, Federated Investors, Inc.; Chairman and Director, Southpointe Distribution Services, Inc. and President, Technology, Federated Services Company. |
| * | Reasons for “interested” status: J. Christopher Donahue and John B. Fisher are interested due to their beneficial ownership of shares of Federated Investors, Inc. and due to positions they hold with Federated and its subsidiaries. |
INDEPENDENT TRUSTEES Background
Name
Birth Date
Positions Held with Trust
Date Service Began | Principal Occupation(s) for Past Five Years,
Other Directorships Held, Previous Position(s) and Qualifications |
John T. Collins
Birth Date: January 24, 1947
Trustee
Indefinite Term
Began serving: October 2013 | Principal Occupations: Director or Trustee of the Federated Fund Family; formerly, Chairman and CEO, The Collins Group, Inc. (a private equity firm) (Retired).
Other Directorships Held: Director, Current Chair of the Compensation Committee, KLX Corp.
Qualifications: Mr. Collins has served in several business and financial management roles and directorship positions throughout his career. Mr. Collins previously served as Chairman and CEO, The Collins Group, Inc. (a private equity firm). Mr. Collins serves as Chairman Emeriti, Bentley University. Mr. Collins previously served as Director and Audit Committee Member, Bank of America Corp.; Director, FleetBoston Financial Corp.; and Director, Beth Israel Deaconess Medical Center (Harvard University Affiliate Hospital). |
Annual Shareholder Report
Name
Birth Date
Positions Held with Trust
Date Service Began | Principal Occupation(s) for Past Five Years,
Other Directorships Held, Previous Position(s) and Qualifications |
G. Thomas Hough
Birth Date: February 28, 1955
Trustee
Indefinite Term
Began serving: August 2015 | Principal Occupations: Director or Trustee of the Federated Fund Family; formerly, Vice Chair, Ernst & Young LLP (public accounting firm) (Retired).
Other Directorships Held: Director, Chair of the Audit Committee, Governance Committee, Publix Super Markets, Inc.; Director, Member of the Audit Committee and Technology Committee of Equifax, Inc.
Qualifications: Mr. Hough has served in accounting, business management and directorship positions throughout his career. Mr. Hough most recently held the position of Americas Vice Chair of Assurance with Ernst & Young LLP (public accounting firm). Mr. Hough is an Executive Committee member of the United States Golf Association, he serves on the President's Cabinet and Business School Board of Visitors for the University of Alabama and is on the Business School Board of Visitors for Wake Forest University. |
Maureen Lally-Green
Birth Date: July 5, 1949
Trustee
Indefinite Term
Began serving: August 2009 | Principal Occupations: Director or Trustee of the Federated Fund Family; Dean of the Duquesne University School of Law; Adjunct Professor of Law, Duquesne University School of Law; formerly, Interim Dean of the Duquesne University School of Law; Associate General Secretary and Director, Office of Church Relations, Diocese of Pittsburgh.
Other Directorships Held: Director, CONSOL Energy Inc.
Qualifications: Judge Lally-Green has served in various legal and business roles and directorship positions throughout her career. Judge Lally-Green previously served as: Associate General Secretary, Diocese of Pittsburgh; a member of the Superior Court of Pennsylvania; and as a Professor of Law, Duquesne University School of Law. Judge Lally-Green also currently holds the positions on either a public or not for profit Board of Directors as follows: Director and Chair, UPMC Mercy Hospital; Regent, St. Vincent Seminary; Director and Vice Chair, Our Campaign for the Church Alive!, Inc.; Director, Saint Vincent College; Member, Pennsylvania State Board of Education (public); and Director and Chair, Cardinal Wuerl North Catholic High School, Inc. Judge Lally-Green has held the positions of: Director, Auberle; Director, Epilepsy Foundation of Western and Central Pennsylvania; Director, Ireland Institute of Pittsburgh; Director, Saint Thomas More Society; Director, Catholic High Schools of the Diocese of Pittsburgh, Inc.; and Director, Pennsylvania Bar Institute. |
Peter E. Madden
Birth Date: March 16, 1942
Trustee
Indefinite Term
Began serving: November 1991 | Principal Occupation: Director or Trustee, and Chair of the Board of Directors or Trustees, of the Federated Fund Family; Retired.
Other Directorships Held: None.
Qualifications: Mr. Madden has served in several business management, mutual fund services and directorship positions throughout his career. Mr. Madden previously served as President, Chief Operating Officer and Director, State Street Bank and Trust Company (custodian bank) and State Street Corporation (financial services). He was Director, VISA USA and VISA International and Chairman and Director, Massachusetts Bankers Association. Mr. Madden served as Director, Depository Trust Corporation and Director, The Boston Stock Exchange. Mr. Madden also served as a Representative to the Commonwealth of Massachusetts General Court. |
Annual Shareholder Report
Name
Birth Date
Positions Held with Trust
Date Service Began | Principal Occupation(s) for Past Five Years,
Other Directorships Held, Previous Position(s) and Qualifications |
Charles F. Mansfield, Jr.
Birth Date: April 10, 1945
Trustee
Indefinite Term
Began serving: January 1999 | Principal Occupations: Director or Trustee of the Federated Fund Family; Management Consultant.
Other Directorships Held: None.
Qualifications: Mr. Mansfield has served as a Marine Corps officer and in several banking, business management, educational roles and directorship positions throughout his long career. He remains active as a Management Consultant. |
Thomas M. O'Neill
Birth Date: June 14, 1951
Trustee
Indefinite Term
Began serving: August 2006 | Principal Occupations: Director or Trustee, Chair of the Audit Committee of the Federated Fund Family; Sole Proprietor, Navigator Management Company (investment and strategic consulting).
Other Directorships Held: None.
Qualifications: Mr. O'Neill has served in several business, mutual fund and financial management roles and directorship positions throughout his career. Mr. O'Neill serves as Director, Medicines for Humanity and Director, The Golisano Children's Museum of Naples, Florida. Mr. O'Neill previously served as Chief Executive Officer and President, Managing Director and Chief Investment Officer, Fleet Investment Advisors; President and Chief Executive Officer, Aeltus Investment Management, Inc.; General Partner, Hellman, Jordan Management Co., Boston, MA; Chief Investment Officer, The Putnam Companies, Boston, MA; Credit Analyst and Lending Officer, Fleet Bank; Director and Consultant, EZE Castle Software (investment order management software); and Director, Midway Pacific (lumber). |
P. Jerome Richey
Birth Date: February 23, 1949
Trustee
Indefinite Term
Began serving: October 2013 | Principal Occupations: Director or Trustee of the Federated Fund Family; Management Consultant; formerly, Senior Vice Chancellor and Chief Legal Officer, University of Pittsburgh and Executive Vice President and Chief Legal Officer, CONSOL Energy Inc.
Other Directorships Held: None.
Qualifications: Mr. Richey has served in several business and legal management roles and directorship positions throughout his career. Mr. Richey most recently held the positions of Senior Vice Chancellor and Chief Legal Officer, University of Pittsburgh. Mr. Richey previously served as Chairman of the Board, Epilepsy Foundation of Western Pennsylvania and Chairman of the Board, World Affairs Council of Pittsburgh. Mr. Richey previously served as Chief Legal Officer and Executive Vice President, CONSOL Energy Inc.; and Board Member, Ethics Counsel and Shareholder, Buchanan Ingersoll & Rooney PC (a law firm). |
Annual Shareholder Report
Name
Birth Date
Positions Held with Trust
Date Service Began | Principal Occupation(s) for Past Five Years,
Other Directorships Held, Previous Position(s) and Qualifications |
John S. Walsh
Birth Date: November 28, 1957
Trustee
Indefinite Term
Began serving: January 1999 | Principal Occupations: Director or Trustee of the Federated Fund Family; President and Director, Heat Wagon, Inc. (manufacturer of construction temporary heaters); President and Director, Manufacturers Products, Inc. (distributor of portable construction heaters); President, Portable Heater Parts, a division of Manufacturers Products, Inc.
Other Directorships Held: None.
Qualifications: Mr. Walsh has served in several business management roles and directorship positions throughout his career. Mr. Walsh previously served as Vice President, Walsh & Kelly, Inc. (paving contractors). |
OFFICERS
Name
Birth Date
Address
Positions Held with Trust
Date Service Began | Principal Occupation(s) for Past Five Years
and Previous Position(s) |
Lori A. Hensler
Birth Date: January 6, 1967
TREASURER
Officer since: April 2013 | Principal Occupations: Principal Financial Officer and Treasurer of the Federated Fund Family; Senior Vice President, Federated Administrative Services; Financial and Operations Principal for Federated Securities Corp. and Edgewood Services, Inc.; and Assistant Treasurer, Federated Investors Trust Company. Ms. Hensler has received the Certified Public Accountant designation.
Previous Positions: Controller of Federated Investors, Inc.; Senior Vice President and Assistant Treasurer, Federated Investors Management Company; Treasurer, Federated Investors Trust Company; Assistant Treasurer, Federated Administrative Services, Federated Administrative Services, Inc., Federated Securities Corp., Edgewood Services, Inc., Federated Advisory Services Company, Federated Equity Management Company of Pennsylvania, Federated Global Investment Management Corp., Federated Investment Counseling, Federated Investment Management Company, Passport Research, Ltd., and Federated MDTA, LLC; Financial and Operations Principal for Federated Securities Corp., Edgewood Services, Inc. and Southpointe Distribution Services, Inc. |
Richard B. Fisher
Birth Date: May 17, 1923
Vice President
Officer since: April 1987 | Principal Occupations: Vice Chairman or Vice President of some of the Funds in the Federated Fund Family; Vice Chairman, Federated Investors, Inc.; Chairman, Federated Securities Corp.
Previous Positions: President and Director or Trustee of some of the Funds in the Federated Fund Family; Executive Vice President, Federated Investors, Inc.; Director and Chief Executive Officer, Federated Securities Corp. |
Annual Shareholder Report
Name
Birth Date
Address
Positions Held with Trust
Date Service Began | Principal Occupation(s) for Past Five Years
and Previous Position(s) |
Peter J. Germain
Birth Date: September 3, 1959
CHIEF LEGAL OFFICER, SECRETARY and EXECUTIVE VICE PRESIDENT
Officer since: January 2005 | Principal Occupations: Mr. Germain is Chief Legal Officer, Secretary and Executive Vice President of the Federated Fund Family. He is General Counsel, Chief Legal Officer, Secretary and Executive Vice President, Federated Investors, Inc.; Trustee and Senior Vice President, Federated Investors Management Company; Trustee and President, Federated Administrative Services; Director and President, Federated Administrative Services, Inc.; Director and Vice President, Federated Securities Corp.; Director and Secretary, Federated Private Asset Management, Inc.; Secretary, Federated Shareholder Services Company; and Secretary, Retirement Plan Service Company of America. Mr. Germain joined Federated in 1984 and is a member of the Pennsylvania Bar Association.
Previous Positions: Deputy General Counsel, Special Counsel, Managing Director of Mutual Fund Services, Federated Investors, Inc.; Senior Vice President, Federated Services Company; and Senior Corporate Counsel, Federated Investors, Inc. |
Stephen Van Meter
Birth Date: June 5, 1975
CHIEF COMPLIANCE OFFICER AND SENIOR VICE PRESIDENT
Officer since: July 2015 | Principal Occupations: Senior Vice President and Chief Compliance Officer of the Federated Fund Family; Vice President and Chief Compliance Officer of Federated Investors, Inc. and Chief Compliance Officer of certain of its subsidiaries. Mr. Van Meter joined Federated in October 2011. He holds FINRA licenses under Series 3, 7, 24 and 66.
Previous Positions: Mr. Van Meter previously held the position of Compliance Operating Officer, Federated Investors, Inc. Prior to joining Federated, Mr. Van Meter served at the United States Securities and Exchange Commission in the positions of Senior Counsel, Office of Chief Counsel, Division of Investment Management and Senior Counsel, Division of Enforcement. |
Stephen F. Auth
Birth Date: September 13, 1956
101 Park Avenue
41st Floor
New York, NY 10178
CHIEF INVESTMENT OFFICER
Officer since: November 2002 | Principal Occupations: Stephen F. Auth is Chief Investment Officer of various Funds in the Federated Fund Family; Executive Vice President, Federated Investment Counseling, Federated Global Investment Management Corp. and Federated Equity Management Company of Pennsylvania.
Previous Positions: Executive Vice President, Federated Investment Management Company and Passport Research, Ltd. (investment advisory subsidiary of Federated); Senior Vice President, Global Portfolio Management Services Division; Senior Vice President, Federated Investment Management Company and Passport Research, Ltd.; Senior Managing Director and Portfolio Manager, Prudential Investments. |
Annual Shareholder Report
Evaluation and Approval of Advisory Contract–May 2017
Federated MDT Mid Cap Growth Fund (the “Fund”)
(formerly, Federated MDT Mid-Cap Growth Strategies Fund)
Following a review and recommendation of approval by the Fund's independent trustees, the Fund's Board of Trustees (the “Board”) reviewed and unanimously approved the continuation of the Fund's investment advisory contract for an additional one-year term at its May 2017 meetings. The Board's decision regarding the contract reflects the exercise of its business judgment after considering all of the information received on whether to continue the existing arrangements.
The Board had previously appointed a Senior Officer, whose duties include specified responsibilities relating to the process by which advisory fees are to be charged to a Federated fund. The Senior Officer has the authority to retain consultants, experts, or staff as may be reasonably necessary to assist in the performance of his duties, reports directly to the Board, and may be terminated only with the approval of a majority of the independent members of the Board. The Senior Officer prepared and furnished to the Board an independent, written evaluation that covered topics discussed below (the “Senior Officer's Evaluation”). The Board considered the Senior Officer's Evaluation, along with other information, in deciding to approve the investment advisory contract.
The Board also considered judicial decisions concerning allegedly excessive investment advisory fees in its decision. Using these judicial decisions as a guide, the Board has indicated that the following factors may be relevant to an adviser's fiduciary duty with respect to its receipt of compensation from a fund: (1) the nature and quality of the services provided by an adviser to a fund and its shareholders (including the performance of the Fund and of comparable funds); (2) an adviser's cost of providing the services (including the profitability to an adviser of providing advisory services to a fund); (3) the extent to which an adviser may realize “economies of scale” as a fund grows larger and, if such economies of scale exist, whether they have been shared with a fund and its shareholders or the family of funds; (4) any “fall-out financial benefits” that accrue to an adviser because of its relationship with a fund (including research services received from brokers that execute fund trades and any fees paid to affiliates of an adviser for services rendered to a fund); (5) comparative fee and expense structures (including a comparison of fees paid to an adviser with those paid by similar funds); and (6) the extent of care, conscientiousness and independence with which the Fund's board members perform their duties and their expertise (including whether they are fully informed about all facts the Board deems relevant to its consideration of an adviser's services and fees). The Board noted that the Securities and Exchange Commission (“SEC”) disclosure requirements regarding the basis for the Board's approval of the Fund's investment advisory contract generally align with the factors listed above.
Annual Shareholder Report
Consistent with the judicial decisions and SEC disclosure requirements, the Board also considered management fees charged to institutional and other clients of Federated MDTA LLC (the “Adviser”) and its advisory affiliates for what might be viewed as like services. The Board was aware of these factors and was guided by them in its review of the Fund's investment advisory contract to the extent it considered them to be appropriate and relevant, as discussed further below.
The Board considered and weighed these factors in light of its substantial accumulated experience in governing the Fund and working with Federated Investors, Inc. and its affiliates (“Federated”) on matters relating to the Federated funds. The Board was assisted in its deliberations by independent legal counsel. In addition to the extensive materials that comprise and accompany the Senior Officer's Evaluation, the Board received detailed information about the Fund and the Federated organization throughout the year, and in connection with its May meetings. Federated provided much of this information at each regular meeting of the Board, and furnished additional information in connection with the May meetings, at which the Board's formal approval of the investment advisory contract occurred. At the May meetings, in addition to meeting in separate sessions of the independent trustees without management present, senior management of the Adviser also met with the independent trustees and their counsel to discuss the materials presented and any other matters thought relevant by the Adviser or the trustees. Between regularly scheduled meetings, the Board also received information on particular matters as the need arose. The Board's consideration of the investment advisory contract included review of the Senior Officer's Evaluation, accompanying data and additional information covering such matters as: the Adviser's investment philosophy, revenue, profitability, personnel and processes; investment and operating strategies; the Fund's short-term and long-term performance (in absolute terms, both on a gross basis and net of expenses, as well as in terms relative to its particular investment program and certain competitor or “peer group” funds and/or other benchmarks, as appropriate) and comments on the reasons for performance; the Fund's investment objectives; the Fund's expenses, including the advisory fee and the overall expense structure of the Fund (both in absolute terms and relative to similar and/or competing funds), with due regard for contractual or voluntary expense limitations; the use and allocation of brokerage commissions derived from trading the Fund's portfolio securities (if any); and the nature, quality and extent of the advisory and other services provided to the Fund by the Adviser and its affiliates. The Board also considered the preferences and expectations of Fund shareholders; the entrepreneurial risk assumed by the Adviser in sponsoring the Fund; the continuing state of competition in the mutual fund industry and market practices; the range of comparable fees for similar funds in the mutual fund industry; the Fund's relationship to the Federated funds which include a comprehensive array of funds with different investment objectives, policies and strategies which are generally available for
Annual Shareholder Report
exchange without the incurrence of additional sales charges; compliance and audit reports concerning the Federated funds and the Federated companies that service them (including communications from regulatory agencies), as well as Federated's responses to any issues raised therein; and relevant developments in the mutual fund industry and how the Federated funds and/or Federated are responding to them. The Board's evaluation process is evolutionary. The criteria considered and the emphasis placed on relevant criteria change in recognition of changing circumstances in the mutual fund marketplace.
While mindful that courts have cautioned against giving such comparisons too much weight, the Board has found the use of comparisons of the Fund's fees and expenses to other mutual funds with comparable investment programs to be relevant to its deliberations. In this regard, the Board was presented with, and considered, information regarding the contractual advisory fee rates, net advisory fee rates, total expense ratios and each element of the Fund's total expense ratio (i.e., gross and net advisory fees, custody fees, portfolio accounting fees and transfer agency fees) relative to the Fund's peers. The Board focused on comparisons with other similar mutual funds more heavily than non-mutual fund products or services because it is believed that they are more relevant. For example, other mutual funds are the products most like the Fund, in that they are readily available to Fund shareholders as alternative investment vehicles. Also, they are the type of investment vehicle, in fact, chosen and maintained by the Fund's investors. The range of their fees and expenses, therefore, appears to be a relevant indicator of what consumers have found to be reasonable in the marketplace in which the Fund competes.
The Board reviewed the contractual advisory fee rate, net advisory fee rate where partially waived and other expenses of the Fund and noted the position of the Fund's fee rates relative to its peers. In this regard, the Board noted that the contractual advisory fee rate was below the median of the relevant peer group and the Board was satisfied that the overall expense structure of the Fund remained competitive.
For comparison, the Senior Officer has reviewed Federated's fees for providing advisory services to products outside the Federated funds (e.g., institutional and separate accounts and sub-adviser services). He concluded that mutual funds and institutional accounts are inherently different products. Those differences include, but are not limited to, different types of targeted investors; being subject to different laws and regulations; different legal structures; different average account sizes and portfolio management techniques made necessary by different cash flows and different associated costs; and the time spent by portfolio managers and their teams, funds financial services, legal, compliance and risk management in reviewing securities pricing, addressing different administrative responsibilities, addressing different degrees of risk
Annual Shareholder Report
associated with management and a variety of different costs. The Senior Officer did not consider the fees for providing advisory services to these outside products to be determinative in judging the appropriateness of mutual fund advisory fees.
The Senior Officer noted that the services, administrative responsibilities and risks associated with such relationships are quite different than serving as a primary adviser to a fund.
Following such evaluation, and full deliberations, the Board concluded that the expenses of the Fund are reasonable and supported renewal of the Fund's investment advisory contract.
The Board considered the nature, extent and quality of the services provided to the Fund by the Adviser and the resources of the Adviser and its affiliates dedicated to the Fund. In this regard, the Board evaluated, among other things, the Adviser's personnel, experience, track record, overall reputation and willingness to invest in personnel and infrastructure that benefit the Fund. In addition, the Board reviewed the qualifications, backgrounds and responsibilities of the portfolio management team primarily responsible for the day-to-day management of the Fund. The Board noted the compliance programs of, and the compliance-related resources provided to, the Fund by the Adviser. The Fund's ability to deliver competitive performance when compared to its peer group was also deemed to be relevant by the Board as a useful indicator of how the Adviser is executing the Fund's investment program. The Adviser's ability to execute this program was one of the Board's considerations in reaching a conclusion that the nature, extent and quality of the Adviser's investment management services warrant the continuation of the investment advisory contract.
In evaluating the Fund's investment performance, the Board considered performance results in light of the Fund's investment objective, strategies and risks, as disclosed in the Fund's prospectus. The Board particularly considered detailed investment reports on the Fund's performance that were provided to the Board throughout the year and in connection with the May meetings. The Senior Officer also reviewed information compiled by Federated, using data supplied by independent fund ranking organizations, regarding the performance of, and fees charged by, other mutual funds, noting his view that comparisons to fund peer groups may be helpful, though not conclusive, in judging the reasonableness of the proposed fees. The Board considered, in evaluating such comparisons, that in some cases individual funds may exhibit significant and unique differences in their objectives and management techniques when compared to other funds within an industry peer group, and that the Senior Officer had specifically noted that the Fund's quantitative focus makes fee and expense comparisons particularly difficult as the peer group of funds varied widely in their complexity, and the management of the Fund is among the more complex relative to its peers.
Annual Shareholder Report
For the periods covered by the Evaluation, the Fund's performance for the three-year period was above the median of the relevant peer group, and the Fund's performance fell below the median of the relevant peer group for the one-year and five-year periods. In addition, the Board was informed by the Adviser that, for the same periods, the Fund outperformed its benchmark index for the one-year period and underperformed its benchmark index for the three-year and five-year periods. The Board discussed the Fund's performance with the Adviser and recognized the efforts being undertaken by the Adviser in the context of other factors considered relevant by the Board.
Following such evaluation, and full deliberations, the Board concluded that the performance of the Fund supported renewal of the Fund's advisory contract.
The Board also received financial information about Federated, including information regarding the compensation and ancillary (or “fall-out”) benefits Federated derived from its relationships with the Federated funds. This information covered not only the fees under the investment advisory contracts, but also fees received by Federated's subsidiaries for providing other services to the Federated funds under separate contracts (e.g., for serving as the Federated funds' administrator). The information also detailed any indirect benefit Federated may derive from its receipt of research services from brokers who execute Federated fund trades. In addition, the Board considered the fact that, in order for a fund to be competitive in the marketplace, Federated and its affiliates frequently waived fees and/or reimbursed expenses and have disclosed to Fund investors and/or indicated to the Board their intention to do so in the future. Moreover, the Board receives regular reporting as to the institution, adjustment or elimination of these voluntary waivers. The Board considered Federated's previous reductions in contractual management fees to certain funds in response to the Senior Officer's recommendations.
Federated furnished information, requested by the Senior Officer, that reported revenues on a fund-by-fund basis and made estimates of the allocation of expenses on a fund-by-fund basis, using allocation methodologies specified by the Senior Officer. The Senior Officer noted that, while these cost allocation reports apply consistent allocation processes, the inherent difficulties in allocating costs continues to cause the Senior Officer to question the precision of the process and to conclude that such reports may be unreliable, since a single change in an allocation estimate may dramatically alter the resulting estimate of cost and/or profitability of a fund and may produce unintended consequences. The allocation information, including the Senior Officer's view that fund-by-fund estimations may be unreliable, was considered in the analysis by the Board.
Annual Shareholder Report
The Board and the Senior Officer also reviewed information compiled by Federated comparing its profitability information to other publicly held fund management companies. In this regard, the Senior Officer concluded that Federated's profit margins did not appear to be excessive. The Senior Officer also noted that Federated appeared financially sound, with the resources to fulfill its obligations under its contracts with the Fund.
The Senior Officer's Evaluation also discussed the notion of possible realization of “economies of scale” as a fund grows larger. In this regard, the Board considered that the Adviser has made significant and long-term investments in areas that support all of the Federated funds, such as personnel and processes for the portfolio management, shareholder services, compliance, internal audit, and risk management functions, as well as systems technology (including technology relating to cybersecurity) and that the benefits of these efforts (as well as any economies of scale, should they exist) were likely to be enjoyed by the fund family as a whole. The Board noted that the Adviser's investments in these areas are extensive. In addition, the Board considered that Federated and its affiliates have frequently waived fees and/or reimbursed expenses and that this has allowed fund shareholders to share potential economies of scale from a fund's inception. Federated, as it does throughout the year, and in connection with the Board's review, furnished information relative to revenue sharing or adviser paid fees. Federated and the Senior Officer noted that this information should be viewed to determine if there was an incentive to either not apply breakpoints, or to apply breakpoints at higher levels. It should not be viewed to determine the appropriateness of advisory fees because it would represent marketing and distribution expenses. Finally, the Board also noted the absence of any applicable regulatory or industry guidelines on this subject, which (as discussed in the Senior Officer's Evaluation) is compounded by the lack of any common industry practice or general pattern with respect to structuring fund advisory fees with “breakpoints” that serve to reduce the fee as a fund attains a certain size.
While the Senior Officer noted certain items for follow-up reporting to the Board and further consideration by management, he stated that his observations and information accompanying the Senior Officer's Evaluation supported a finding by the Board that the management fee for the Fund was reasonable. Under these circumstances, no changes were recommended to, and no objection was raised to the continuation of the Fund's investment advisory contract.
In its decision to continue an existing investment advisory contract, the Board was mindful of the potential disruptions of the Fund's operations and various risks, uncertainties and other effects that could occur as a result of a decision to terminate or not renew an investment advisory contract. In particular, the Board recognized that many shareholders have invested in the Fund on the strength of the Adviser's industry standing and reputation and with the expectation that the Adviser will have a continuing role in providing advisory services to the Fund. Thus, the Board's approval of the investment advisory contract reflected the fact
Annual Shareholder Report
that it is the shareholders who have effectively selected the Adviser by virtue of having invested in the Fund. The Board concluded that, in light of the factors discussed above, including the nature, quality and scope of the services provided to the Fund by the Adviser and its affiliates, continuation of the investment advisory contract was appropriate.
The Board based its decision to approve the investment advisory contract on the totality of the circumstances and relevant factors and with a view to past and future long-term considerations. Not all of the factors and considerations identified above were necessarily relevant to the Fund, nor did the Board consider any one of them to be determinative. With respect to the factors that were relevant, the Board's decision to approve the continuation of the contract reflects its determination that Federated's performance and actions provided a satisfactory basis to support the decision to continue the existing arrangement.
Annual Shareholder Report
Voting Proxies on Fund Portfolio Securities
A description of the policies and procedures that the Fund uses to determine how to vote proxies, if any, relating to securities held in the Fund's portfolio is available, without charge and upon request, by calling 1-800-341-7400. A report on “Form N-PX” of how the Fund voted any such proxies during the most recent 12-month period ended June 30 is available via the Proxy Voting Record (Form N-PX) link associated with the Fund and share class name at www.FederatedInvestors.com/FundInformation. Form N-PX filings are also available at the SEC's website at www.sec.gov.
Quarterly Portfolio Schedule
The Fund files with the SEC a complete schedule of its portfolio holdings, as of the close of the first and third quarters of its fiscal year, on “Form N-Q.” These filings are available on the SEC's website at www.sec.gov and may be reviewed and copied at the SEC's Public Reference Room in Washington, DC. (Call 1-800-SEC-0330 for information on the operation of the Public Reference Room.) You may also access this information via the link to the Fund and share class name at www.FederatedInvestors.com/FundInformation.
Annual Shareholder Report
Mutual funds are not bank deposits or obligations, are not guaranteed by any bank and are not insured or guaranteed by the U.S. government, the Federal Deposit Insurance Corporation, the Federal Reserve Board or any other government agency. Investment in mutual funds involves investment risk, including the possible loss of principal.
This Report is authorized for distribution to prospective investors only when preceded or accompanied by the Fund's Prospectus, which contains facts concerning its objective and policies, management fees, expenses and other information.
Federated MDT Mid Cap Growth Fund
Federated Investors Funds
4000 Ericsson Drive
Warrendale, PA 15086-7561
Contact us at FederatedInvestors.com
or call 1-800-341-7400.
Federated Securities Corp., Distributor
CUSIP 314172107
CUSIP 314172206
CUSIP 314172305
CUSIP 314172198
CUSIP 314172529
G01228-08 (12/17)
Federated is a registered trademark of Federated Investors, Inc.
2017 ©Federated Investors, Inc.
Annual Shareholder Report
October 31, 2017
| Share Class | Ticker | A | FMAAX | B | FMBBX | C | FMRCX | Institutional | FMIIX |
Federated Absolute Return Fund
Fund Established 2000
A Portfolio of Federated Equity Funds
Dear Valued Shareholder,
I am pleased to present the Annual Shareholder Report for your fund covering the period from November 1, 2016 through October 31, 2017. This report includes Management's Discussion of Fund Performance, a complete listing of your fund's holdings, performance information and financial statements along with other important fund information.
In addition, our website, FederatedInvestors.com, offers easy access to Federated resources that include timely fund updates, economic and market insights from our investment strategists, and financial planning tools. We invite you to register to take full advantage of its capabilities.
Thank you for investing with Federated. I hope you find this information useful and look forward to keeping you informed.
Sincerely,
J. Christopher Donahue, President
Not FDIC Insured ■ May Lose Value ■ No Bank Guarantee
CONTENTS
| 1 |
| 5 |
| 7 |
| 20 |
| 24 |
| 26 |
| 28 |
| 29 |
| 43 |
| 44 |
| 47 |
| 48 |
| 54 |
| 60 |
| 60 |
Management's Discussion of Fund Performance (unaudited)
The total return of Federated Absolute Return Fund (the “Fund”), based on net asset value for the 12-month reporting period ended October 31, 2017, was 2.96% for Class A Shares, 2.26% for Class B Shares, 2.28% for Class C Shares and 3.25% for Institutional Shares. The total return of the BofA Merrill Lynch U.S. 3-Month Treasury Bill Index (BAML3MT),1 the Fund's broad-based securities market index (formerly BofA Merrill Lynch 91-Day Treasury Bill Index), was 0.72%. The total return of the Lipper Absolute Return Funds Average (LARFA),2 a peer group average for the Fund, was 5.81%. The Fund's and LARFA's total returns for the most recently completed fiscal year reflected actual cash flows, transaction costs and other expenses which were not reflected in the total return of the BAML3MT.
The Fund's investment strategy during the reporting period focused on long and short3 positions in equities and use of derivatives.4 These were the most significant factors affecting the Fund's performance relative to the BAML3MT.
The following discussion will focus on the performance of the Fund's Institutional Shares.
MARKET OVERVIEW
It was a positive 12-month reporting period for the U.S. stock market. Stocks and risk assets globally generally produced strong positive returns in the period, as valuation multiples continued to expand.
During the reporting period, global central bankers continued to perform trillions of dollars of quantitative easing to try to push inflation toward their targets. In the meantime, stocks and risk assets generally continued to benefit. Interest rates, credit spreads and volatility all were held near record lows during the reporting period, which enabled continued debt issuance, stock buybacks and merger & acquisition activity. Global sovereign interest rates (the foundation of this momentous credit cycle) increased off of the bottom that was set in 2016, however not enough to cause valuation multiples to stop expanding.
LONG positions
The long equity positions added 21.8% to the Fund's return (this return and those below are gross figures). The equity sectors for which the Fund's holdings produced the largest positive contribution to Fund performance were Information Technology and Financials.
The Fund invested in precious metals closed-end funds that were immaterial to the Fund's return.
Annual Shareholder Report
SHORT and derivatives positions
The short equity and derivatives (which includes shorting futures and call and put options) positions detracted a combined 17.0% from the Fund's return. The negative contribution was mainly due to equity markets moving higher in the reporting period. The purpose of the short and derivative positions was primarily to reach the desired Fund net equity market exposure and reduce the Fund's correlation to the U.S. equity market, and secondarily, to pursue alpha.
The Fund also invested in currency forward and currency option contracts for both active exposures to currencies and for hedging currency risks of international stock holdings. This activity was immaterial to the Fund's return.
| 1 | Please see the footnotes to the line graphs below for definitions of, and further information about, the BAML3MT. |
| 2 | Please see the footnotes to the line graphs below for definitions of, and further information about, the LARFA. |
| 3 | The Fund may make short sales of securities, which involves unlimited risk including the possibility that losses may exceed the original amount invested. |
| 4 | The Fund's use of derivative instruments involves risks different from, or possibly greater than, the risks associated with investing directly in securities and other traditional instruments. |
Annual Shareholder Report
FUND PERFORMANCE AND GROWTH OF A $10,000 INVESTMENT
The graph below illustrates the hypothetical investment of $10,0001 in the Federated Absolute Return Fund (the “Fund”) from October 31, 2007 to October 31, 2017, compared to the BofA Merrill Lynch U.S. 3-Month Treasury Bill Index (BAML3MT)2 and the Lipper Absolute Return Funds Average (LARFA).3 The Average Annual Total Return table below shows returns for each class averaged over the stated periods.
Growth of a $10,000 Investment
Growth of $10,000 as of October 31, 2017
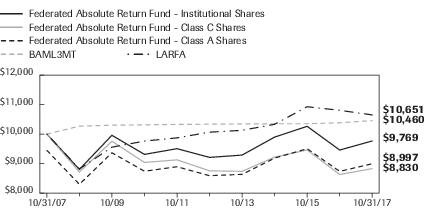
| Federated Absolute Return Fund - | Institutional Shares | Class C Shares | Class A Shares | BAML3MT | LARFA |
| F | F | F | I | I |
| 10/31/2007 | 10,000 | 10,000 | 9,450 | 10,000 | 10,000 |
| 10/31/2008 | 8,805 | 8,716 | 8,299 | 10,272 | 8,821 |
| 10/31/2009 | 9,960 | 9,758 | 9,368 | 10,303 | 9,558 |
| 10/31/2010 | 9,314 | 9,039 | 8,743 | 10,315 | 9,765 |
| 10/31/2011 | 9,508 | 9,129 | 8,895 | 10,329 | 9,873 |
| 10/31/2012 | 9,212 | 8,756 | 8,592 | 10,337 | 10,067 |
| 10/31/2013 | 9,290 | 8,739 | 8,637 | 10,346 | 10,130 |
| 10/31/2014 | 9,900 | 9,221 | 9,188 | 10,351 | 10,333 |
| 10/31/2015 | 10,265 | 9,465 | 9,505 | 10,353 | 10,929 |
| 10/31/2016 | 9,461 | 8,633 | 8,738 | 10,385 | 10,808 |
| 10/31/2017 | 9,769 | 8,830 | 8,997 | 10,460 | 10,651 |
41 graphic description end -->
| ■ | The returns shown for Class C Shares include the maximum contingent deferred sales charge of 1.00% as applicable. |
| ■ | Total returns shown for Class A Shares include the maximum sales charge of 5.50% ($10,000 investment minus $550 sales charge = $9,450). |
The Fund offers multiple share classes whose performance may be greater than or less than its other share class(es) due to differences in sales charges and expenses. See the Average Annual Total Return table below for the returns of additional classes not shown in the line graph above.
Average Annual Total Returns for the Period Ended 10/31/2017
(returns reflect all applicable sales charges and contingent deferred sales charges as specified below in footnote #1)
| | 1 Year | 5 Years | 10 Years |
| Class A Shares | -2.70% | -0.20% | -1.06% |
| Class B Shares | -3.24% | -0.22% | -1.10% |
| Class C Shares | 1.25% | 0.16% | -1.25% |
| Institutional Shares | 3.25% | 1.18% | -0.24% |
| BAML3MT | 0.72% | 0.24% | 0.45% |
| LARFA | 5.81% | 2.88% | 0.49% |
Annual Shareholder Report
Performance data quoted represents past performance which is no guarantee of future results. Investment return and principal value will fluctuate so that an investor's shares, when redeemed, may be worth more or less than their original cost. Mutual fund performance changes over time and current performance may be lower or higher than what is stated. For current to the most recent month-end performance and after-tax returns, visit FederatedInvestors.com or call 1-800-341-7400. Returns shown do not reflect the deduction of taxes that a shareholder would pay on Fund distributions or the redemption of Fund shares. Mutual funds are not obligations of or guaranteed by any bank and are not federally insured.
| 1 | Represents a hypothetical investment of $10,000 in the Fund after deducting applicable sales charges: for Class A Shares, the maximum sales charge of 5.50% ($10,000 investment minus $550 sales charge = $9,450); for Class B Shares, the maximum contingent deferred sales charge is 5.50% on any redemption less than one year from the purchase date; for Class C Shares, the maximum contingent deferred sales charge is 1.00% on any redemption less than one year from the purchase date. The Fund's performance assumes the reinvestment of all dividends and distributions. The BAML3MT and the LARFA have been adjusted to reflect reinvestment of dividends on securities in the indexes. |
| 2 | The BAML3MT measures the return on U.S. Treasury Bills maturing in 90 days. The BAML3MT is not adjusted to reflect sales charges, expenses or other fees that the Securities and Exchange Commission (SEC) requires to be reflected in the Fund's performance. The index is unmanaged and unlike the Fund, is not affected by cash flows. It is not possible to invest directly in an index. |
| 3 | Lipper figures represent the average of the total returns reported by all funds designated by Lipper, Inc., as falling into the respective category and is not adjusted to reflect any sales charges. The Lipper figures in the Growth of $10,000 line graph are based on historical return information published by Lipper and reflect the return of the funds comprising the category in the year of publication. Because the funds designated by Lipper as falling into the category can change over time, the Lipper figures in the line graph may not match the Lipper figures in the Average Annual Total Returns table, which reflect the return of the funds that currently comprise the category. |
Annual Shareholder Report
Portfolio of Investments Summary Tables (unaudited)
At October 31, 2017, the Fund's portfolio composition1 was as follows:
| Security Type | Percentage of
Total Net Assets |
| U.S. Equity Securities | 58.7% |
| Adjustment for Futures Contracts (notional value)2 | 53.0% |
| Collateral on Deposit for Securities Sold Short and Written Options | 33.7% |
| International Equity Securities | 16.9% |
| U.S. Treasury Securities | 5.6% |
| Exchange-Traded Funds | 2.5% |
| Purchased Put Options | 0.8% |
| Purchased Call Options | 1.0% |
| Written Put Options | (0.0)%3 |
| Other Derivative Contracts4 | 0.7% |
| Securities Sold Short | (29.4)% |
| Futures Contracts—Short (notional value)2 | (54.8)% |
| Cash Equivalents5 | 6.3% |
| Other Assets and Liabilities—Net6 | 5.0% |
| TOTAL | 100.0% |
Annual Shareholder Report
At October 31, 2017, the Fund's sector composition7 for its equity securities was as follows:
| Sector Composition | Percentage of
Equity Securities |
| Information Technology | 28.0% |
| Financials | 20.6% |
| Health Care | 17.5% |
| Consumer Discretionary | 15.8% |
| Industrials | 8.9% |
| Materials | 4.3% |
| Energy | 2.8% |
| Telecommunication Services | 1.7% |
| Consumer Staples | 0.4% |
| TOTAL | 100.0% |
| 1 | See the Fund's Prospectus for a description of the principal types of securities in which the Fund invests. |
| 2 | More complete information regarding the Fund's direct investments in futures contracts, including unrealized appreciation (depreciation), value, and notional values or amounts of such contracts, can be found in the table at the end of the Portfolio of Investments included in this Report. |
| 3 | Represents less than 0.1%. |
| 4 | Based upon net unrealized appreciation (depreciation) or value of the derivative contracts as applicable. Other Derivative Contracts may consist of futures, forwards, options and swaps. The impact of a derivative contract on the Fund's performance may be larger than its unrealized appreciation (depreciation) or value may indicate. In many cases, the notional value or amount of a derivative contract may provide a better indication of the contract's significance to the portfolio. More complete information regarding the Fund's direct investments in derivative contracts, including unrealized appreciation (depreciation), value, and notional values or amounts of such contracts, can be found in the table at the end of the Portfolio of Investments included in this Report. |
| 5 | Cash Equivalents include any investments in money market mutual funds and/or overnight repurchase agreements. |
| 6 | Assets, other than investments in securities and derivative contracts less liabilities. See Statement of Assets and Liabilities. |
| 7 | Sector classifications are based upon, and individual portfolio securities are assigned to, the classifications of the Global Industry Classification Standard (GICS) except that the Adviser assigns a classification to securities not classified by the GICS and to securities for which the Adviser does not have access to the classification made by the GICS. |
Annual Shareholder Report
Portfolio of Investments
October 31, 2017
Shares,
Principal
Amount or
Contracts | | | Value in
U.S. Dollars |
| | | COMMON STOCKS—75.6% | |
| | | Aerospace & Defense—0.5% | |
| 3,000 | | Boeing Co. | $773,940 |
| | | Air Freight & Logistics—1.0% | |
| 20,000 | 1 | XPO Logistics, Inc. | 1,387,000 |
| | | Airlines—2.2% | |
| 30,000 | | Delta Air Lines, Inc. | 1,500,900 |
| 30,000 | | Southwest Airlines Co. | 1,615,800 |
| | | TOTAL | 3,116,700 |
| | | Automobiles—3.4% | |
| 13,000 | | Bayerische Motoren Werke AG | 1,325,031 |
| 100,000 | | Ford Motor Co. | 1,227,000 |
| 30,000 | | General Motors Co. | 1,289,400 |
| 30,000 | | Subaru Corp. | 1,033,323 |
| | | TOTAL | 4,874,754 |
| | | Banks—8.7% | |
| 100,000 | | Bank of America Corp. | 2,739,000 |
| 20,000 | | BNP Paribas SA | 1,563,445 |
| 30,000 | | Citigroup, Inc. | 2,205,000 |
| 30,000 | | JPMorgan Chase & Co. | 3,018,300 |
| 70,000 | | Sumitomo Mitsui Financial Group, Inc. | 2,816,701 |
| | | TOTAL | 12,342,446 |
| | | Biotechnology—4.1% | |
| 14,000 | | AbbVie, Inc. | 1,263,500 |
| 20,000 | 1 | Aimmune Therapeutics, Inc. | 581,400 |
| 16,000 | 1 | Bioverativ, Inc. | 904,000 |
| 6,000 | 1 | Bluebird Bio, Inc. | 834,600 |
| 6,000 | 1 | Celgene Corp. | 605,820 |
| 10,000 | 1 | Clovis Oncology, Inc. | 753,700 |
| 20,000 | 1 | Deciphera Pharmaceuticals, Inc. | 383,800 |
| 3,000 | 1 | Vertex Pharmaceuticals, Inc. | 438,690 |
| | | TOTAL | 5,765,510 |
| | | Capital Markets—4.2% | |
| 120,000 | 1 | Credit Suisse Group AG | 1,893,944 |
| 100,000 | | Deutsche Bank AG | 1,627,000 |
Annual Shareholder Report
Shares,
Principal
Amount or
Contracts | | | Value in
U.S. Dollars |
| | | COMMON STOCKS—continued | |
| | | Capital Markets—continued | |
| 6,000 | | Goldman Sachs Group, Inc. | $1,454,880 |
| 6,000 | | S&P Global, Inc. | 938,820 |
| | | TOTAL | 5,914,644 |
| | | Chemicals—1.2% | |
| 20,000 | | Olin Corp. | 730,600 |
| 12,000 | | RPM International, Inc. | 639,960 |
| 1,000 | | Sherwin-Williams Co. | 395,150 |
| | | TOTAL | 1,765,710 |
| | | Commercial Services & Supplies—0.5% | |
| 10,000 | 1 | Stericycle, Inc. | 708,500 |
| | | Communications Equipment—1.4% | |
| 60,000 | | Cisco Systems, Inc. | 2,049,000 |
| | | Construction & Engineering—0.4% | |
| 500,000 | | China Railway Construction Corp., Class H | 627,509 |
| | | Diversified Financial Services—0.5% | |
| 4,000 | 1 | Berkshire Hathaway, Inc., Class B | 747,760 |
| | | Diversified Telecommunication Services—1.0% | |
| 40,000 | | AT&T, Inc. | 1,346,000 |
| | | Energy Equipment & Services—0.5% | |
| 200,000 | 1 | Independence Contract Drilling, Inc. | 648,000 |
| | | Health Care Equipment & Supplies—0.7% | |
| 10,000 | | Danaher Corp. | 922,700 |
| | | Health Care Providers & Services—4.4% | |
| 15,000 | 1 | Centene Corp. | 1,405,050 |
| 20,000 | 1 | Express Scripts Holding Co. | 1,225,800 |
| 6,000 | | Humana, Inc. | 1,532,100 |
| 10,000 | | UnitedHealth Group, Inc. | 2,102,200 |
| | | TOTAL | 6,265,150 |
| | | Hotels, Restaurants & Leisure—1.9% | |
| 10,000 | | McDonald's Corp. | 1,669,100 |
| 40,000 | | Melco Resorts & Entertainment, ADR | 1,011,200 |
| | | TOTAL | 2,680,300 |
| | | Household Durables—3.4% | |
| 60,000 | | KB HOME | 1,645,800 |
| 400 | 1 | NVR, Inc. | 1,312,548 |
| 40,000 | | Pulte Group, Inc. | 1,209,200 |
Annual Shareholder Report
Shares,
Principal
Amount or
Contracts | | | Value in
U.S. Dollars |
| | | COMMON STOCKS—continued | |
| | | Household Durables—continued | |
| 10,000 | 1 | Tempur Sealy International, Inc. | $653,700 |
| | | TOTAL | 4,821,248 |
| | | Insurance—2.2% | |
| 16,000 | | Allstate Corp. | 1,501,760 |
| 14,000 | | Prudential Financial, Inc. | 1,546,440 |
| | | TOTAL | 3,048,200 |
| | | Internet & Direct Marketing Retail—1.1% | |
| 1,400 | 1 | Amazon.com, Inc. | 1,547,392 |
| | | Internet Software & Services—7.5% | |
| 2,000 | 1 | Alphabet, Inc., Class A | 2,066,080 |
| 2,000 | 1 | Alphabet, Inc., Class C | 2,033,280 |
| 36,000 | 1 | Altaba, Inc. | 2,524,320 |
| 20,000 | 1 | eBay, Inc. | 752,800 |
| 12,000 | 1 | Facebook, Inc., Class A | 2,160,720 |
| 8,000 | 1 | GoDaddy, Inc., Class A | 373,600 |
| 6,000 | 1 | VeriSign, Inc. | 645,120 |
| | | TOTAL | 10,555,920 |
| | | IT Services—0.5% | |
| 10,000 | | Cognizant Technology Solutions Corp., Class A | 756,700 |
| | | Machinery—2.0% | |
| 700,000 | | CRRC Corp. Ltd., Class H | 690,563 |
| 7,000 | | Fanuc Ltd. | 1,641,102 |
| 25,000 | | Wabash National Corp. | 562,500 |
| | | TOTAL | 2,894,165 |
| | | Metals & Mining—2.0% | |
| 60,000 | 1 | Detour Gold Corp. | 639,485 |
| 100,000 | 1 | Freeport-McMoRan, Inc. | 1,398,000 |
| 4,315 | 1 | Lithion Energy | 334 |
| 40,000 | | Wheaton Precious Metals Corp. | 829,600 |
| | | TOTAL | 2,867,419 |
| | | Oil Gas & Consumable Fuels—1.6% | |
| 10,000 | 1 | Diamondback Energy, Inc. | 1,071,600 |
| 20,000 | | Royal Dutch Shell PLC, Class A, ADR | 1,260,600 |
| | | TOTAL | 2,332,200 |
| | | Personal Products—0.3% | |
| 20,000 | 1 | elf Beauty, Inc. | 423,800 |
Annual Shareholder Report
Shares,
Principal
Amount or
Contracts | | | Value in
U.S. Dollars |
| | | COMMON STOCKS—continued | |
| | | Pharmaceuticals—4.1% | |
| 50,000 | | GlaxoSmithKline PLC, ADR | $1,821,500 |
| 60,000 | | Pfizer, Inc. | 2,103,600 |
| 3,476 | 1 | Revance Therapeutics, Inc. | 90,376 |
| 6,000 | | Roche Holding AG | 1,387,198 |
| 19,584 | 1 | Sienna Biopharmaceuticals, Inc. | 383,846 |
| | | TOTAL | 5,786,520 |
| | | Semiconductors & Semiconductor Equipment—3.8% | |
| 10,000 | 1 | Ichor Holdings Ltd. | 311,900 |
| 60,000 | | Intel Corp. | 2,729,400 |
| 14,000 | 1 | Micron Technology, Inc. | 620,340 |
| 10,000 | 1 | NXP Semiconductors NV | 1,170,500 |
| 10,000 | | QUALCOMM, Inc. | 510,100 |
| | | TOTAL | 5,342,240 |
| | | Software—6.5% | |
| 10,000 | 1 | Check Point Software Technologies Ltd. | 1,177,100 |
| 10,000 | 1 | Cyber-Ark Software Ltd. | 423,700 |
| 15,000 | 1 | Fortinet, Inc. | 591,150 |
| 22,000 | | Microsoft Corp. | 1,829,960 |
| 30,000 | | Open Text Corp. | 1,049,400 |
| 36,000 | | Oracle Corp. | 1,832,400 |
| 20,000 | | Symantec Corp. | 650,000 |
| 10,000 | 1 | Synopsys, Inc. | 865,200 |
| 6,000 | 1 | VMware, Inc., Class A | 718,140 |
| | | TOTAL | 9,137,050 |
| | | Specialty Retail—2.2% | |
| 10,000 | | Home Depot, Inc. | 1,657,800 |
| 20,000 | | TJX Cos., Inc. | 1,396,000 |
| | | TOTAL | 3,053,800 |
| | | Technology Hardware Storage & Peripherals—1.5% | |
| 8,000 | | Apple, Inc. | 1,352,320 |
| 300 | | Samsung Electronics Co. Ltd. | 738,502 |
| | | TOTAL | 2,090,822 |
| | | Wireless Telecommunication Services—0.3% | |
| 8,000 | 1 | T-Mobile USA, Inc. | 478,160 |
| | | TOTAL COMMON STOCKS
(IDENTIFIED COST $86,196,550) | 107,071,259 |
Annual Shareholder Report
Shares,
Principal
Amount or
Contracts | | | Value in
U.S. Dollars |
| | | U.S. TREASURY—5.6% | |
| $8,000,000 | 2 | United States Treasury Bill, 1.051%3, 11/9/2017
(IDENTIFIED COST $7,998,167) | $7,998,320 |
| | | EXCHANGE-TRADED FUNDS—2.5% | |
| 80,000 | 1 | PowerShares DB Agriculture Fund | 1,555,200 |
| 100,000 | 1 | Sprott Physical Gold Trust | 1,034,000 |
| 150,000 | 1 | Sprott Physical Silver Trust | 940,500 |
| | | TOTAL EXCHANGE-TRADED FUNDS
(IDENTIFIED COST $3,548,490) | 3,529,700 |
| | | PURCHASED PUT OPTIONS—0.8% | |
| | | Biotechnology—0.0% | |
| 44 | | Aimmune Therapeutics, Inc., Notional Amount $127,908, Exercise Price $25, Expiration Date 3/16/2018 | 23,760 |
| 60 | | Bluebird Bio, Inc., Notional Amount $834,600, Exercise Price $105, Expiration Date 1/19/2018 | 34,200 |
| | | TOTAL | 57,960 |
| | | Diversified Financial Services—0.0% | |
| 400 | | iShares China Large-Cap ETF, Notional Amount $1,837,200, Exercise Price $44, Expiration Date 1/19/2018 | 48,800 |
| | | Energy Equipment & Services—0.2% | |
| 600 | | Halliburton Co., Notional Amount $2,564,400, Exercise Price $40, Expiration Date 12/15/2017 | 27,900 |
| 1,000 | | Nabors Industries Ltd., Notional Amount $563,000, Exercise Price $5, Expiration Date 1/19/2018 | 39,500 |
| 500 | | Schlumberger Ltd., Notional Amount $3,200,000, Exercise Price $60, Expiration Date 12/15/2017 | 26,750 |
| 300 | | Schlumberger Ltd., Notional Amount $1,920,000, Exercise Price $65, Expiration Date 3/16/2018 | 116,250 |
| | | TOTAL | 210,400 |
| | | Index—0.4% | |
| 200 | | Energy Select Sector SPDR Fund, Notional Amount $1,358,200, Exercise Price $70, Expiration Date 12/15/2017 | 55,700 |
| 400 | | SPDR Dow Jones Industrial Average ETF Trust, Notional Amount $9,345,200, Exercise Price $180, Expiration Date 1/18/2019 | 114,400 |
| 800 | | SPDR Dow Jones Industrial Average ETF Trust, Notional Amount $18,690,400, Exercise Price $220, Expiration Date 12/15/2017 | 58,400 |
| 400 | | SPDR S&P 500 ETF Trust, Notional Amount $10,286,000, Exercise Price $200, Expiration Date 1/18/2019 | 139,600 |
| 2,000 | | SPDR S&P 500 ETF Trust, Notional Amount $51,430,000, Exercise Price $220, Expiration Date 1/19/2018 | 92,000 |
| 2,500 | | SPDR S&P 500 ETF Trust, Notional Amount $64,287,500, Exercise Price $245, Expiration Date 11/17/2017 | 63,750 |
Annual Shareholder Report
Shares,
Principal
Amount or
Contracts | | | Value in
U.S. Dollars |
| | | PURCHASED PUT OPTIONS—continued | |
| | | Index—continued | |
| 300 | | SPDR S&P 500 ETF Trust, Notional Amount $7,714,500, Exercise Price $255, Expiration Date 12/15/2017 | $76,350 |
| | | TOTAL | 600,200 |
| | | Internet Software & Services—0.0% | |
| 40 | | Alphabet, Inc., Notional Amount $4,132,160, Exercise Price $930, Expiration Date 11/17/2017 | 4,600 |
| | | Leisure Products—0.0% | |
| 160 | | Hasbro, Inc., Notional Amount $1,481,440, Exercise Price $90, Expiration Date 12/15/2017 | 25,200 |
| 75 | | Mattel, Inc., Notional Amount $105,900, Exercise Price $13, Expiration Date 1/19/2018 | 4,687 |
| | | TOTAL | 29,887 |
| | | Machinery—0.1% | |
| 300 | | Deere & Co., Notional Amount $3,986,400, Exercise Price $115, Expiration Date 3/16/2018 | 60,300 |
| | | Semiconductors & Semiconductor Equipment—0.0% | |
| 600 | | Intel Corp., Notional Amount $2,729,400, Exercise Price $38, Expiration Date 1/19/2018 | 8,400 |
| | | Technology Hardware Storage & Peripherals—0.1% | |
| 200 | | International Business Machine, Notional Amount $3,081,200, Exercise Price $155, Expiration Date 12/15/2017 | 87,500 |
| | | TOTAL PURCHASED PUT OPTIONS
(IDENTIFIED COST $2,077,041) | 1,108,047 |
| | | PURCHASED CALL OPTIONS—1.0% | |
| | | Airlines—0.0% | |
| 200 | | Alaska Air Group, Inc., Notional Amount $1,320,600, Exercise Price $75, Expiration Date 1/19/2018 | 15,500 |
| 200 | | Southwest Airlines Co., Notional Amount $1,077,200, Exercise Price $60, Expiration Date 1/19/2018 | 11,500 |
| | | TOTAL | 27,000 |
| | | Automobiles—0.1% | |
| 2,000 | | Ford Motor Co., Notional Amount $2,454,000, Exercise Price $12, Expiration Date 11/17/2017 | 77,000 |
| | | Banks—0.1% | |
| 1,000 | | Bank of America Corp., Notional Amount $2,739,000, Exercise Price $27, Expiration Date 11/17/2017 | 72,500 |
| 900 | | Citigroup, Inc., Notional Amount $6,615,000, Exercise Price $77.50, Expiration Date 11/17/2017 | 13,050 |
| 300 | | Citigroup, Inc., Notional Amount $2,205,000, Exercise Price $77.50, Expiration Date 12/15/2017 | 19,200 |
Annual Shareholder Report
Shares,
Principal
Amount or
Contracts | | | Value in
U.S. Dollars |
| | | PURCHASED CALL OPTIONS—continued | |
| | | Banks—continued | |
| 400 | | JPMorgan Chase & Co., Notional Amount $4,024,400, Exercise Price $100, Expiration Date 11/17/2017 | $71,400 |
| | | TOTAL | 176,150 |
| | | Biotechnology—0.2% | |
| 50 | | Amgen, Inc., Notional Amount $876,100, Exercise Price $150, Expiration Date 1/19/2018 | 125,625 |
| 100 | | Celgene Corp., Notional Amount $1,009,700, Exercise Price $100, Expiration Date 1/18/2019 | 157,500 |
| 200 | | Celgene Corp., Notional Amount $2,019,400, Exercise Price $145, Expiration Date 11/17/2017 | 200 |
| | | TOTAL | 283,325 |
| | | Capital Markets—0.0% | |
| 16 | | Credit Suisse Group AG, Notional Amount $25,152, Exercise Price $17.50, Expiration Date 3/16/2018 | 600 |
| 1,000 | | Deutsche Bank AG, Notional Amount $1,627,000, Exercise Price $18, Expiration Date 12/15/2017 | 12,000 |
| | | TOTAL | 12,600 |
| | | Communications Equipment—0.2% | |
| 1,000 | | Cisco Systems, Inc., Notional Amount $3,415,000, Exercise Price $32, Expiration Date 1/19/2018 | 265,000 |
| | | Diversified Financial Services—0.1% | |
| 500 | | iShares 20+ Year Treasury Bond ETF, Notional Amount $6,223,000, Exercise Price $124, Expiration Date 11/17/2017 | 61,250 |
| 500 | | iShares 20+ Year Treasury Bond ETF, Notional Amount $6,223,000, Exercise Price $128, Expiration Date 11/17/2017 | 7,500 |
| | | TOTAL | 68,750 |
| | | Index—0.2% | |
| 1,000 | | Chicago Board Options Exchange, Notional Amount $1,018,000, Exercise Price $15, Expiration Date 11/15/2017 | 30,000 |
| 400 | | Chicago Board Options Exchange, Notional Amount $407,200, Exercise Price $15, Expiration Date 12/20/2017 | 36,000 |
| 2,000 | | Financial Select Sector SPDR Fund, Notional Amount $5,320,000, Exercise Price $26, Expiration Date 1/19/2018 | 217,000 |
| 1,500 | | VanEck Vectors Gold Miners ETF, Notional Amount $3,372,000, Exercise Price $25, Expiration Date 1/19/2018 | 35,250 |
| | | TOTAL | 318,250 |
| | | Semiconductors & Semiconductor Equipment—0.0% | |
| 6 | | NXP Semiconductors NV, Notional Amount $70,230, Exercise Price $120, Expiration Date 12/15/2017 | 720 |
Annual Shareholder Report
Shares,
Principal
Amount or
Contracts | | | Value in
U.S. Dollars |
| | | PURCHASED CALL OPTIONS—continued | |
| | | Semiconductors & Semiconductor Equipment—continued | |
| 500 | | QUALCOMM, Inc., Notional Amount $2,550,500, Exercise Price $60, Expiration Date 1/19/2018 | $21,750 |
| | | TOTAL | 22,470 |
| | | Software—0.1% | |
| 800 | | Oracle Corp., Notional Amount $4,072,000, Exercise Price $49, Expiration Date 11/17/2017 | 166,400 |
| 32 | | Oracle Corp., Notional Amount $162,880, Exercise Price $52.50, Expiration Date 1/18/2019 | 13,120 |
| | | TOTAL | 179,520 |
| | | TOTAL PURCHASED CALL OPTIONS
(IDENTIFIED COST $1,342,333) | 1,430,065 |
| | | INVESTMENT COMPANY—6.3% | |
| 8,867,662 | 4 | Federated Institutional Prime Value Obligations Fund,
Institutional Shares, 1.21%5
(IDENTIFIED COST $8,868,939) | 8,868,549 |
| | | TOTAL INVESTMENT IN SECURITIES—91.8%
(IDENTIFIED COST $110,031,520)6 | 130,005,940 |
| | | OTHER ASSETS AND LIABILITIES - NET—8.2%7 | 11,586,793 |
| | | TOTAL NET ASSETS—100% | $141,592,733 |
SECURITIES SOLD SHORT—(29.4)%
| Shares | | | Value in
U.S. Dollars |
| | | Common Stocks—(29.4)% | |
| | | Equity Real Estate Investment Trust (REITs)—(0.8)% | |
| (16,000) | | Lamar Advertising Co., Class A | $(1,127,040) |
| | | Hotels, Restaurants & Leisure—(0.4)% | |
| (2,000) | 1 | Chipotle Mexican Grill, Inc. | (543,800) |
| | | Index—(14.6)% | |
| (140,000) | | Consumer Staples Select Sector SPDR Fund | (7,432,600) |
| (30,000) | | Energy Select Sector SPDR | (2,037,300) |
| (30,000) | | iShares China Large-Cap ETF | (1,377,900) |
| (90,000) | | Real Estate Select Sector SPDR | (2,925,000) |
| (35,000) | | SPDR S&P Retail ETF | (1,382,150) |
| (100,000) | | Utilities Select Sector SPDR Fund | (5,512,000) |
| | | TOTAL | (20,666,950) |
Annual Shareholder Report
| Shares | | | Value in
U.S. Dollars |
| | | Common Stocks—continued | |
| | | Internet Software & Services—(1.3)% | |
| (10,000) | 1 | Alibaba Group Holding Ltd., ADR | $(1,848,900) |
| | | Leisure Products—(1.0)% | |
| (100,000) | | Mattel, Inc. | (1,412,000) |
| | | Media—(2.7)% | |
| (28,000) | 1 | Altice USA, Inc., Class A | (663,040) |
| (3,000) | 1 | Charter Communications, Inc., Class A | (1,002,510) |
| (20,000) | | Cinemark Holdings, Inc. | (726,800) |
| (20,000) | | Comcast Corp., Class A | (720,600) |
| (40,000) | | Interpublic Group of Cos., Inc. | (770,000) |
| | | TOTAL | (3,882,950) |
| | | Oil Gas & Consumable Fuels—(1.2)% | |
| (20,000) | | Exxon Mobil Corp. | (1,667,000) |
| | | Personal Products—(0.6)% | |
| (60,000) | | Coty, Inc., Class A | (924,000) |
| | | Road & Rail—(1.0)% | |
| (28,000) | | CSX Corp. | (1,412,040) |
| | | Semiconductors & Semiconductor Equipment—(1.5)% | |
| (6,000) | | ASML Holding N.V., ADR | (1,084,500) |
| (5,000) | | NVIDIA Corp. | (1,034,050) |
| | | TOTAL | (2,118,550) |
| | | Software—(3.5)% | |
| (8,000) | 1 | Guidewire Software Inc. | (639,840) |
| (12,000) | 1 | Salesforce.com, Inc. | (1,228,080) |
| (8,000) | 1 | ServiceNow, Inc. | (1,010,960) |
| (14,000) | 1 | Splunk, Inc. | (942,200) |
| (10,000) | 1 | Workday, Inc., Class A | (1,109,900) |
| | | TOTAL | (4,930,980) |
| | | Textiles Apparel & Luxury Goods—(0.8)% | |
| (20,000) | | Nike, Inc., Class B | (1,099,800) |
| | | TOTAL SECURITIES SOLD SHORT
(PROCEEDS $41,272,424) | $(41,634,010) |
Annual Shareholder Report
At October 31, 2017, the Fund had the following outstanding futures contracts:
| Description | Number of
Contracts | Notional
Value | Expiration
Date | Value and
Unrealized
(Depreciation) |
| 1CME S&P 500 Index Futures, Short Futures | 40 | $25,727,000 | December 2017 | $(1,079,630) |
| 1E-Mini Dow ($5) Futures, Short Futures | 60 | $6,997,500 | December 2017 | $(466,995) |
| 1Euro-Bono Futures, Short Futures | 60 | $9,746,995 | December 2017 | $(128,609) |
| 1Euro-BTP Italian Government Bond Futures, Short Futures | 40 | $6,504,054 | December 2017 | $(205,978) |
| 1Euro-Bund Futures, Short Futures | 65 | $12,322,652 | December 2017 | $(53,334) |
| 1Euro-OAT Futures, Short Futures | 35 | $6,419,602 | December 2017 | $(62,615) |
| 1mini MSCI EAFE Index Futures, Short Futures | 30 | $3,011,100 | December 2017 | $(79,898) |
| 1NASDAQ 100 E-Mini Futures, Short Futures | 30 | $3,749,850 | December 2017 | $(163,267) |
| 1Tokyo Price Index Futures, Short Futures | 20 | $3,101,007 | December 2017 | $(342,621) |
| NET UNREALIZED DEPRECIATION ON FUTURES CONTRACTS | $(2,582,947) |
At October 31, 2017, the Fund had the following outstanding written put option contracts:
| Description | Number of
Contracts | Notional
Value | Expiration
Date | Exercise
Price | Value in
U.S. Dollars |
| 1Deere & Co. | 300 | $3,986,400 | 3/16/2018 | $100 | $(20,700) |
| (PREMIUMS RECEIVED $19,575) | $(20,700) |
At October 31, 2017, the Fund had the following outstanding foreign exchange contracts:
| Settlement Date | Counterparty | Currency
Units to
Receive/Deliver | In
Exchange
For | Unrealized
Appreciation
(Depreciation) |
| Contracts Purchased: |
| 12/19/2017 | JPMorgan | 1,650,000 EUR | $1,951,008 | $(23,413) |
| 12/19/2017 | JPMorgan | 5,100,000 GBP | $6,733,132 | $51,149 |
| 12/19/2017 | JPMorgan | 1,100,000 NZD | $757,868 | $(5,815) |
| 12/19/2017 | JPMorgan | 2,000,000 NZD | $1,365,678 | $1,692 |
| 12/19/2017 | JPMorgan | 2,000,000 NZD | $1,391,471 | $(24,102) |
| 12/19/2017 | JPMorgan | $11,200,000 | 1,243,630,304 JPY | $234,699 |
| Contracts Sold: |
| 12/19/2017 | JPMorgan | 7,400,000 EUR | $8,891,766 | $246,794 |
| 12/19/2017 | JPMorgan | 5,100,000 GBP | $6,939,086 | $154,805 |
| 12/19/2017 | JPMorgan | 5,100,000 GBP | $6,735,517 | $(48,763) |
| 12/19/2017 | JPMorgan | 9,100,000 NZD | $6,628,131 | $406,598 |
| 12/19/2017 | JPMorgan | $2,550,000 | 285,978,930 JPY | $(28,475) |
Annual Shareholder Report
| Settlement Date | Counterparty | Currency
Units to
Receive/Deliver | In
Exchange
For | Unrealized
Appreciation
(Depreciation) |
| 12/19/2017 | JPMorgan | $650,000 | 74,027,330 JPY | $2,712 |
| NET UNREALIZED APPRECIATION ON FOREIGN EXCHANGE CONTRACTS | $967,881 |
Net Unrealized Appreciation (Depreciation) on Futures Contracts and Foreign Exchange Contracts, and value on Securities Sold Short and Written Option Contracts is included in “Other Assets and Liabilities—Net.”
| 1 | Non-income-producing security. |
| 2 | Pledged as collateral to ensure the Fund is able to satisfy the obligations of its securities sold short and outstanding written option contracts. |
| 3 | Discount rate at time of purchase. |
| 4 | Affiliated holding. |
| | |
An affiliated company in which the Fund has ownership of at least 5% of the voting shares. Transactions with affiliated companies during the year ended October 31, 2017, were as follows:
| | Spark
Therapeutics, Inc. |
| Balance of Shares Held 10/31/2016 | 12,000 |
| Purchases/Additions | 8,000 |
| Sales/Reductions | (20,000) |
| Balance of Shares Held 10/31/2017 | — |
| Value | $— |
| Change in Unrealized Appreciation/Depreciation | $(274,711) |
| Net Realized Gain/(Loss) | $513,944 |
| Dividend Income | $— |
Annual Shareholder Report
Affiliated fund holdings are investment companies which are managed by the Adviser or an affiliate of the Adviser. Transactions with affiliated fund holdings during the year ended October 31, 2017, were as follows:
| | Federated
Institutional
Prime Value
Obligations Fund,
Institutional Shares |
| Balance of Shares Held 10/31/2016 | 26,196,887 |
| Purchases/Additions | 149,478,729 |
| Sales/Reductions | (166,807,954) |
| Balance of Shares Held 10/31/2017 | 8,867,662 |
| Value | $8,868,549 |
| Change in Unrealized Appreciation/Depreciation | $(390) |
| Net Realized Gain/(Loss) | $5,576 |
| Dividend Income | $77,404 |
| 5 | 7-day net yield. |
| 6 | The cost of investments for federal tax purposes amounts to $139,567,602. |
| 7 | Assets, other than investments in securities, less liabilities. See Statement of Assets and Liabilities. |
Note: The categories of investments are shown as a percentage of total net assets at October 31, 2017.
Various inputs are used in determining the value of the Fund's investments. These inputs are summarized in the three broad levels listed below:
Level 1—quoted prices in active markets for identical securities.
Level 2—other significant observable inputs (including quoted prices for similar securities, interest rates, prepayment speeds, credit risk, etc.). Also includes securities valued at amortized cost.
Level 3—significant unobservable inputs (including the Fund's own assumptions in determining the fair value of investments).
The inputs or methodology used for valuing securities are not an indication of the risk associated with investing in those securities.
The following is a summary of the inputs used, as of October 31, 2017, in valuing the Fund's assets carried at fair value:
| Valuation Inputs | | | | |
| | Level 1—
Quoted
Prices | Level 2—
Other
Significant
Observable
Inputs | Level 3—
Significant
Unobservable
Inputs | Total |
| Equity Securities: | | | | |
| Common Stocks | | | | |
| Domestic | $83,173,122 | $— | $— | $83,173,122 |
| International | 10,180,819 | 13,717,318 | — | 23,898,137 |
| Debt Securities: | | | | |
Annual Shareholder Report
| Valuation Inputs | | | | |
| | Level 1—
Quoted
Prices | Level 2—
Other
Significant
Observable
Inputs | Level 3—
Significant
Unobservable
Inputs | Total |
| U.S. Treasury | — | 7,998,320 | — | 7,998,320 |
| Exchange-Traded Funds | 3,529,700 | — | — | 3,529,700 |
| Purchased Put Options | 1,108,047 | — | — | 1,108,047 |
| Purchased Call Options | 1,430,065 | — | — | 1,430,065 |
| Investment Company | 8,868,549 | — | — | 8,868,549 |
| TOTAL SECURITIES | $108,290,302 | $21,715,638 | $— | $130,005,940 |
| Other Financial Instruments: | | | | |
| Assets | | | | |
| Foreign Exchange Contracts | $— | $1,098,449 | $— | $1,098,449 |
| Liabilities | | | | |
| Securities Sold Short | (41,634,010) | — | — | (41,634,010) |
| Futures Contracts | (2,582,947) | — | — | (2,582,947) |
| Written Put Options | (20,700) | — | — | (20,700) |
| Foreign Exchange Contracts | — | (130,568) | — | (130,568) |
| TOTAL OTHER FINANCIAL INSTRUMENTS | $(44,237,657) | $967,881 | $— | $(43,269,776) |
The following acronyms are used throughout this portfolio:
| ADR | —American Depositary Receipt |
| ETF | —Exchange-Traded Fund |
| EUR | —Euro |
| GBP | —Great British Pound |
| JPY | —Japanese Yen |
| NZD | —New Zealand Dollar |
| REITs | —Real Estate Investment Trust |
| SPDR | —Standard & Poor's Depositary Receipts |
See Notes which are an integral part of the Financial Statements
Annual Shareholder Report
Financial Highlights–Class A Shares
(For a Share Outstanding Throughout Each Period)
| Year Ended October 31 | 2017 | 2016 | 2015 | 2014 | 2013 |
| Net Asset Value, Beginning of Period | $9.45 | $10.28 | $10.07 | $9.47 | $9.50 |
| Income From Investment Operations: | | | | | |
| Net investment income (loss)1 | 0.01 | 0.01 | (0.00)2 | 0.05 | 0.08 |
| Net realized and unrealized gain (loss) on investments, forward exchange contracts, short sales, futures contracts, written options, certain receivables and foreign currency transactions | 0.27 | (0.84) | 0.34 | 0.55 | (0.03) |
| TOTAL FROM INVESTMENT OPERATIONS | 0.28 | (0.83) | 0.34 | 0.60 | 0.05 |
| Less Distributions: | | | | | |
| Distributions from net investment income | — | — | (0.13) | (0.00)2 | (0.03) |
| Return of capital3 | — | — | — | — | (0.05) |
| TOTAL DISTRIBUTIONS | — | — | (0.13) | (0.00)2 | (0.08) |
| Net Asset Value, End of Period | $9.73 | $9.45 | $10.28 | $10.07 | $9.47 |
| Total Return4 | 2.96% | (8.07)% | 3.45% | 6.38% | 0.53% |
| Ratios to Average Net Assets: | | | | | |
| Net expenses | 1.46% | 1.50% | 1.50% | 1.26% | 1.24% |
| Net expenses excluding dividends and other expenses related to short sales | 1.30% | 1.29% | 1.32% | 1.26% | 1.24% |
| Net investment income | 0.14% | 0.07% | 0.03% | 0.49% | 0.90% |
| Expense waiver/reimbursement5 | 0.16% | 0.11% | 0.12% | 0.15% | 0.18% |
| Supplemental Data: | | | | | |
| Net assets, end of period (000 omitted) | $54,314 | $69,440 | $94,755 | $88,588 | $112,417 |
| Portfolio turnover | 118% | 132% | 94% | 117% | 198% |
| 1 | Per share numbers have been calculated using the average shares method. |
| 2 | Represents less than $0.01. |
| 3 | Represents a return of capital for federal income tax purposes. |
| 4 | Based on net asset value, which does not reflect the sales charge, redemption fee or contingent deferred sales charge, if applicable. |
| 5 | This expense decrease is reflected in both the net expense and net investment income ratios shown above. |
See Notes which are an integral part of the Financial Statements
Annual Shareholder Report
Financial Highlights–Class B Shares
(For a Share Outstanding Throughout Each Period)
| Year Ended October 31 | 2017 | 2016 | 2015 | 2014 | 2013 |
| Net Asset Value, Beginning of Period | $9.28 | $10.17 | $9.91 | $9.39 | $9.41 |
| Income From Investment Operations: | | | | | |
| Net investment income (loss)1 | (0.06) | (0.07) | (0.07) | (0.03) | 0.01 |
| Net realized and unrealized gain (loss) on investments, forward exchange contracts, short sales, futures contracts, written options, certain receivables and foreign currency transactions | 0.27 | (0.82) | 0.33 | 0.55 | (0.03) |
| TOTAL FROM INVESTMENT OPERATIONS | 0.21 | (0.89) | 0.26 | 0.52 | (0.02) |
| Less Distributions: | | | | | |
| Distributions from net investment income | — | — | — | (0.00)2 | — |
| Net Asset Value, End of Period | $9.49 | $9.28 | $10.17 | $9.91 | $9.39 |
| Total Return3 | 2.26% | (8.75)% | 2.62% | 5.59% | (0.21)% |
| Ratios to Average Net Assets: | | | | | |
| Net expenses | 2.21% | 2.26% | 2.24% | 2.03% | 1.99% |
| Net expenses excluding dividends and other expenses related to short sales | 2.05% | 2.04% | 2.07% | 2.03% | 1.99% |
| Net investment income (loss) | (0.60)% | (0.68)% | (0.70)% | (0.28)% | 0.16% |
| Expense waiver/reimbursement4 | 0.16% | 0.11% | 0.13% | 0.15% | 0.18% |
| Supplemental Data: | | | | | |
| Net assets, end of period (000 omitted) | $2,777 | $4,368 | $7,517 | $11,193 | $17,267 |
| Portfolio turnover | 118% | 132% | 94% | 117% | 198% |
| 1 | Per share numbers have been calculated using the average shares method. |
| 2 | Represents less than $0.01. |
| 3 | Based on net asset value, which does not reflect the sales charge, redemption fee or contingent deferred sales charge, if applicable. |
| 4 | This expense decrease is reflected in both the net expense and net investment income (loss) ratios shown above. |
See Notes which are an integral part of the Financial Statements
Annual Shareholder Report
Financial Highlights–Class C Shares
(For a Share Outstanding Throughout Each Period)
| Year Ended October 31 | 2017 | 2016 | 2015 | 2014 | 2013 |
| Net Asset Value, Beginning of Period | $9.23 | $10.12 | $9.86 | $9.35 | $9.37 |
| Income From Investment Operations: | | | | | |
| Net investment income (loss)1 | (0.06) | (0.07) | (0.07) | (0.03) | 0.01 |
| Net realized and unrealized gain (loss) on investments, forward exchange contracts, short sales, futures contracts, written options, certain receivables and foreign currency transactions | 0.27 | (0.82) | 0.33 | 0.54 | (0.03) |
| TOTAL FROM INVESTMENT OPERATIONS | 0.21 | (0.89) | 0.26 | 0.51 | (0.02) |
| Less Distributions: | | | | | |
| Distributions from net investment income | — | — | — | (0.00)2 | — |
| Net Asset Value, End of Period | $9.44 | $9.23 | $10.12 | $9.86 | $9.35 |
| Total Return3 | 2.28% | (8.79)% | 2.64% | 5.50% | (0.21)% |
| Ratios to Average Net Assets: | | | | | |
| Net expenses | 2.21% | 2.25% | 2.24% | 2.04% | 1.99% |
| Net expenses excluding dividends and other expenses related to short sales | 2.05% | 2.04% | 2.07% | 2.04% | 1.99% |
| Net investment income (loss) | (0.59)% | (0.67)% | (0.71)% | (0.28)% | 0.15% |
| Expense waiver/reimbursement4 | 0.16% | 0.11% | 0.13% | 0.15% | 0.18% |
| Supplemental Data: | | | | | |
| Net assets, end of period (000 omitted) | $31,528 | $48,157 | $63,406 | $70,323 | $87,659 |
| Portfolio turnover | 118% | 132% | 94% | 117% | 198% |
| 1 | Per share numbers have been calculated using the average shares method. |
| 2 | Represents less than $0.01. |
| 3 | Based on net asset value, which does not reflect the sales charge, redemption fee or contingent deferred sales charge, if applicable. |
| 4 | This expense decrease is reflected in both the net expense and net investment income (loss) ratios shown above. |
See Notes which are an integral part of the Financial Statements
Annual Shareholder Report
Financial Highlights–Institutional Shares
(For a Share Outstanding Throughout Each Period)
| Year Ended October 31 | 2017 | 2016 | 2015 | 2014 | 2013 |
| Net Asset Value, Beginning of Period | $9.54 | $10.35 | $10.14 | $9.52 | $9.56 |
| Income From Investment Operations: | | | | | |
| Net investment income1 | 0.04 | 0.03 | 0.02 | 0.07 | 0.11 |
| Net realized and unrealized gain (loss) on investments, forward exchange contracts, short sales, futures contracts, written options, certain receivables and foreign currency transactions | 0.27 | (0.84) | 0.35 | 0.55 | (0.04) |
| TOTAL FROM INVESTMENT OPERATIONS | 0.31 | (0.81) | 0.37 | 0.62 | 0.07 |
| Less Distributions: | | | | | |
| Distributions from net investment income | — | — | (0.16) | (0.00)2 | (0.05) |
| Return of capital3 | — | — | — | — | (0.06) |
| TOTAL DISTRIBUTIONS | — | — | (0.16) | (0.00) 2 | (0.11) |
| Net Asset Value, End of Period | $9.85 | $9.54 | $10.35 | $10.14 | $9.52 |
| Total Return4 | 3.25% | (7.83)% | 3.69% | 6.56% | 0.75% |
| Ratios to Average Net Assets: | | | | | |
| Net expenses | 1.21% | 1.25% | 1.27% | 1.04% | 0.99% |
| Net expenses excluding dividends and other expenses related to short sales | 1.05% | 1.04% | 1.07% | 1.04% | 0.99% |
| Net investment income | 0.39% | 0.31% | 0.22% | 0.72% | 1.18% |
| Expense waiver/reimbursement5 | 0.16% | 0.11% | 0.11% | 0.14% | 0.18% |
| Supplemental Data: | | | | | |
| Net assets, end of period (000 omitted) | $52,974 | $112,822 | $106,928 | $36,380 | $27,681 |
| Portfolio turnover | 118% | 132% | 94% | 117% | 198% |
| 1 | Per share numbers have been calculated using the average shares method. |
| 2 | Represents less than $0.01. |
| 3 | Represents return of capital for federal income tax purposes. |
| 4 | Based on net asset value. |
| 5 | This expense decrease is reflected in both the net expense and net investment income ratios shown above. |
See Notes which are an integral part of the Financial Statements
Annual Shareholder Report
Statement of Assets and Liabilities
October 31, 2017
| Assets: | | |
| Investment in securities, at value including $8,868,549 of investment in an affiliated holding (identified cost $110,031,520) | | $130,005,940 |
| Deposit at broker for short sales and written options | | 47,735,046 |
| Cash denominated in foreign currencies (identified cost $153,397) | | 152,263 |
| Cash | | 2,048 |
| Receivable for investments sold, net of reserve of $2,372,288 (Note 9) | | 5,851,531 |
| Unrealized appreciation on foreign exchange contracts | | 1,098,449 |
| Income receivable | | 142,075 |
| Receivable for shares sold | | 19,068 |
| TOTAL ASSETS | | 185,006,420 |
| Liabilities: | | |
| Securities sold short, at value (proceeds $41,272,424) | $41,634,010 | |
| Payable for investments purchased | 795,709 | |
| Payable for shares redeemed | 521,208 | |
| Unrealized depreciation on foreign exchange contracts | 130,568 | |
| Written options outstanding, at value (premiums received $19,575) | 20,700 | |
| Payable for daily variation margin on futures contracts | 112,871 | |
| Payable for distribution services fee (Note 5) | 22,151 | |
| Payable for investment adviser fee (Note 5) | 2,688 | |
| Payable for administrative fee (Note 5) | 308 | |
| Accrued expenses (Note 5) | 173,474 | |
| TOTAL LIABILITIES | | 43,413,687 |
| Net assets for 14,588,862 shares outstanding | | $141,592,733 |
| Net Assets Consists of: | | |
| Paid-in capital | | $320,371,696 |
| Net unrealized appreciation of investments, foreign exchange contracts, futures contracts, short sales, written options, certain receivables and translation of assets and liabilities in foreign currency | | 15,621,611 |
| Accumulated net realized loss on investments, foreign exchange contracts, futures contracts, short sales, written options and foreign currency transactions | | (194,811,674) |
| Undistributed net investment income | | 411,100 |
| TOTAL NET ASSETS | | $141,592,733 |
Annual Shareholder Report
Statement of Assets and Liabilities–continued
| Net Asset Value, Offering Price and Redemption Proceeds Per Share: | | |
| Class A Shares: | | |
| Net asset value per share ($54,313,963 ÷ 5,580,154 shares outstanding), no par value, unlimited shares authorized | | $9.73 |
| Offering price per share (100/94.50 of $9.73) | | $10.30 |
| Redemption proceeds per share | | $9.73 |
| Class B Shares: | | |
Net asset value per share ($2,776,817 ÷ 292,692 shares outstanding),
no par value, unlimited shares authorized | | $9.49 |
| Offering price per share | | $9.49 |
| Redemption proceeds per share (94.50/100 of $9.49) | | $8.97 |
| Class C Shares: | | |
Net asset value per share ($31,528,152 ÷ 3,338,536 shares outstanding),
no par value, unlimited shares authorized | | $9.44 |
| Offering price per share | | $9.44 |
| Redemption proceeds per share (99.00/100 of $9.44) | | $9.35 |
| Institutional Shares: | | |
Net asset value per share ($52,973,801 ÷ 5,377,480 shares outstanding),
no par value, unlimited shares authorized | | $9.85 |
| Offering price per share | | $9.85 |
| Redemption proceeds per share | | $9.85 |
See Notes which are an integral part of the Financial Statements
Annual Shareholder Report
Statement of Operations
Year Ended October 31, 2017
| Investment Income: | | | |
| Dividends (including $77,404 received from an affiliated holding, see footnotes to Portfolio of Investments and net of foreign taxes withheld of $66,102) | | | $2,688,070 |
| Interest | | | 75,059 |
| TOTAL INCOME | | | 2,763,129 |
| Expenses: | | | |
| Investment adviser fee (Note 5) | | $1,295,445 | |
| Administrative fee (Note 5) | | 136,068 | |
| Custodian fees | | 30,654 | |
| Transfer agent fees | | 294,486 | |
| Directors'/Trustees' fees (Note 5) | | 2,393 | |
| Auditing fees | | 41,266 | |
| Legal fees | | 12,447 | |
| Distribution services fee (Note 5) | | 318,329 | |
| Other service fees (Notes 2 and 5) | | 254,523 | |
| Portfolio accounting fees | | 133,286 | |
| Share registration costs | | 68,265 | |
| Printing and postage | | 42,135 | |
| Dividends and expenses related to short positions | | 266,743 | |
| Miscellaneous (Note 5) | | 39,845 | |
| TOTAL EXPENSES | | 2,935,885 | |
| Waiver and Reimbursements: | | | |
| Waiver/reimbursement of investment adviser fee (Note 5) | $(269,857) | | |
| Reimbursement of other operating expenses (Notes 2 and 5) | (9,510) | | |
| TOTAL WAIVER AND REIMBURSEMENTS | | (279,367) | |
| Net expenses | | | 2,656,518 |
| Net investment income | | | $106,611 |
Annual Shareholder Report
Statement of Operations–continued
| Realized and Unrealized Gain (Loss) on Investments, Foreign Exchange Contracts, Futures Contracts, Short Sales, Written Options, Certain Receivables and Foreign Currency Transactions: | | | |
| Net realized gain on investments (including realized gain of $5,576 and $513,944 on sales of investments in an affiliated holding and an affiliated company, respectively) and foreign currency transactions | | | $7,081,688 |
| Net realized gain (loss) on foreign exchange contracts | | | (2,073,676) |
| Net realized gain (loss) on futures contracts | | | (9,860,316) |
| Net realized gain (loss) on short sales | | | (1,508,033) |
| Net realized gain (loss) on written options | | | (201,449) |
| Net change in unrealized appreciation of investments, certain receivables and translation of assets and liabilities in foreign currency (including change in unrealized appreciation of $(390) and $(274,711) on investments in an affiliated holding and an affiliated company, respectively) | | | 14,144,796 |
| Net change in unrealized depreciation of foreign exchange contracts | | | 1,735,742 |
| Net change in unrealized appreciation of futures contracts | | | (4,254,042) |
| Net change in unrealized depreciation of short sales | | | (58,829) |
| Net change in unrealized appreciation of written options | | | (219,337) |
| Net realized and unrealized gain on investments, foreign exchange contracts, futures contracts, short sales, written options, certain receivables and foreign currency transactions | | | 4,786,544 |
| Change in net assets resulting from operations | | | $4,893,155 |
See Notes which are an integral part of the Financial Statements
Annual Shareholder Report
Statement of Changes in Net Assets
| Year Ended October 31 | 2017 | 2016 |
| Increase (Decrease) in Net Assets | | |
| Operations: | | |
| Net investment income | $106,611 | $34,780 |
| Net realized gain (loss) on investments, foreign exchange contracts, futures contracts, short sales, written options and foreign currency transactions | (6,561,786) | (14,315,385) |
| Net change in unrealized appreciation/depreciation of investments, foreign exchange contracts, futures contracts, short sales, written options, certain receivables and translation of assets and liabilities in foreign currency | 11,348,330 | (9,006,556) |
| CHANGE IN NET ASSETS RESULTING FROM OPERATIONS | 4,893,155 | (23,287,161) |
| Share Transactions: | | |
| Proceeds from sale of shares | 19,452,119 | 119,657,215 |
| Cost of shares redeemed | (117,540,781) | (134,187,277) |
| CHANGE IN NET ASSETS RESULTING FROM SHARE TRANSACTIONS | (98,088,662) | (14,530,062) |
| Change in net assets | (93,195,507) | (37,817,223) |
| Net Assets: | | |
| Beginning of period | 234,788,240 | 272,605,463 |
| End of period (including undistributed (distributions in excess of) net investment income of $411,100 and $(80,082), respectively) | $141,592,733 | $234,788,240 |
See Notes which are an integral part of the Financial Statements
Annual Shareholder Report
Notes to Financial Statements
October 31, 2017
1. ORGANIZATION
Federated Equity Funds (the “Trust”), is registered under the Investment Company Act of 1940, as amended (the “Act”), as an open-end management investment company. The Trust consists of eleven diversified portfolios. The financial statements included herein are only those of Federated Absolute Return Fund (the “Fund”). The financial statements of the other portfolios are presented separately. The assets of each portfolio are segregated and a shareholder's interest is limited to the portfolio in which shares are held. Each portfolio pays its own expenses. The Fund offers four classes of shares: Class A Shares, Class B Shares, Class C Shares and Institutional Shares. All shares of the Fund have equal rights with respect to voting, except on class-specific matters. Class B Shares were closed to new accounts/investors on June 1, 2015, and to new purchases/exchanges by existing shareholders on August 1, 2015. The investment objective of the Fund is to provide absolute (positive) returns with low correlation to the U.S. equity market.
On March 30, 2017, the Fund's T Share class became effective with the Securities and Exchange Commission (SEC), but is not yet offered for sale.
2. SIGNIFICANT ACCOUNTING POLICIES
The following is a summary of significant accounting policies consistently followed by the Fund in the preparation of its financial statements. These policies are in conformity with U.S. generally accepted accounting principles (GAAP).
Investment Valuation
In calculating its net asset value (NAV), the Fund generally values investments as follows:
| ■ | Equity securities listed on an exchange or traded through a regulated market system are valued at their last reported sale price or official closing price in their principal exchange or market. |
| ■ | Shares of other mutual funds or non-exchange-traded investment companies are valued based upon their reported NAVs. |
| ■ | Fixed-income securities are fair valued using price evaluations provided by a pricing service approved by the Fund's Board of Trustees (the “Trustees”). |
| ■ | Derivative contracts listed on exchanges are valued at their reported settlement or closing price, except that options are valued at the mean of closing bid and asked quotations. |
| ■ | Over-the-counter (OTC) derivative contracts are fair valued using price evaluations provided by a pricing service approved by the Trustees. |
| ■ | Fixed-income securities are fair valued using price evaluations provided by a pricing service approved by the Trustees. |
| ■ | For securities that are fair valued in accordance with procedures established by and under the general supervision of the Trustees, certain factors may be considered such as: the last traded or purchase price of the security, information obtained by contacting the issuer or dealers, analysis of the issuer's financial statements or other available documents, fundamental analytical data, the nature and duration of restrictions on disposition, the movement of the market in which the security is normally traded, public trading in similar securities or derivative contracts of the issuer or comparable issuers, movement of a relevant index, or other factors including, but not limited to, industry changes and relevant government actions. |
Annual Shareholder Report
If any price, quotation, price evaluation or other pricing source is not readily available when the NAV is calculated, if the Fund cannot obtain price evaluations from a pricing service or from more than one dealer for an investment within a reasonable period of time as set forth in the Fund's valuation policies and procedures, or if information furnished by a pricing service, in the opinion of the valuation committee (“Valuation Committee”), is deemed not representative of the fair value of such security, the Fund uses the fair value of the investment determined in accordance with the procedures described below. There can be no assurance that the Fund could obtain the fair value assigned to an investment if it sold the investment at approximately the time at which the Fund determines its NAV per share.
Fair Valuation and Significant Events Procedures
The Trustees have ultimate responsibility for determining the fair value of investments for which market quotations are not readily available. The Trustees have appointed a Valuation Committee comprised of officers of the Fund, Federated Equity Management Company of Pennsylvania (“Adviser”) and certain of the Adviser's affiliated companies to assist in determining fair value and in overseeing the calculation of the NAV. The Trustees have also authorized the use of pricing services recommended by the Valuation Committee to provide fair value evaluations of the current value of certain investments for purposes of calculating the NAV. The Valuation Committee employs various methods for reviewing third-party pricing-service evaluations including periodic reviews of third-party pricing services' policies, procedures and valuation methods (including key inputs, methods, models and assumptions), transactional back-testing, comparisons of evaluations of different pricing services and review of price challenges by the Adviser based on recent market activity. In the event that market quotations and price evaluations are not available for an investment, the Valuation Committee determines the fair value of the investment in accordance with procedures adopted by the Trustees. The Trustees periodically review and approve the fair valuations made by the Valuation Committee and any changes made to the procedures.
Factors considered by pricing services in evaluating an investment include the yields or prices of investments of comparable quality, coupon, maturity, call rights and other potential prepayments, terms and type, reported transactions, indications as to values from dealers and general market conditions. Some pricing services provide a single price evaluation reflecting the bid-side of the market for an investment (a “bid” evaluation). Other pricing services offer both bid evaluations and price evaluations indicative of a price between the prices bid and asked for the investment (a “mid” evaluation). The Fund normally uses bid evaluations for any U.S. Treasury and Agency securities, mortgage-backed securities and municipal securities. The Fund normally uses mid evaluations for any other types of fixed-income securities and any OTC derivative contracts. In the event that market quotations and price evaluations are not available for an investment, the fair value of the investment is determined in accordance with procedures adopted by the Trustees.
Annual Shareholder Report
The Trustees also have adopted procedures requiring an investment to be priced at its fair value whenever the Adviser determines that a significant event affecting the value of the investment has occurred between the time as of which the price of the investment would otherwise be determined and the time as of which the NAV is computed. An event is considered significant if there is both an affirmative expectation that the investment's value will change in response to the event and a reasonable basis for quantifying the resulting change in value. Examples of significant events that may occur after the close of the principal market on which a security is traded, or after the time of a price evaluation provided by a pricing service or a dealer, include:
| ■ | With respect to securities traded principally in foreign markets, significant trends in U.S. equity markets or in the trading of foreign securities index futures contracts; |
| ■ | Political or other developments affecting the economy or markets in which an issuer conducts its operations or its securities are traded; |
| ■ | Announcements concerning matters such as acquisitions, recapitalizations, litigation developments, or a natural disaster affecting the issuer's operations or regulatory changes or market developments affecting the issuer's industry. |
The Trustees have adopted procedures whereby the Valuation Committee uses a pricing service to determine the fair value of equity securities traded principally in foreign markets when the Adviser determines that there has been a significant trend in the U.S. equity markets or in index futures trading. For other significant events, the Fund may seek to obtain more current quotations or price evaluations from alternative pricing sources. If a reliable alternative pricing source is not available, the Fund will determine the fair value of the investment in accordance with the fair valuation procedures approved by the Trustees. The Trustees have ultimate responsibility for any fair valuations made in response to a significant event.
Repurchase Agreements
The Fund may invest in repurchase agreements for short-term liquidity purposes. It is the policy of the Fund to require the other party to a repurchase agreement to transfer to the Fund's custodian or sub-custodian eligible securities or cash with a market value (after transaction costs) at least equal to the repurchase price to be paid under the repurchase agreement. The eligible securities are transferred to accounts with the custodian or sub-custodian in which the Fund holds a “securities entitlement” and exercises “control” as those terms are defined in the Uniform Commercial Code. The Fund has established procedures for monitoring the market value of the transferred securities and requiring the transfer of additional eligible securities if necessary to equal at least the repurchase price. These procedures also allow the other party to require securities to be transferred from the account to the extent that their market value exceeds the repurchase price or in exchange for other eligible securities of equivalent market value.
The insolvency of the other party or other failure to repurchase the securities may delay the disposition of the underlying securities or cause the Fund to receive less than the full repurchase price. Under the terms of the repurchase agreement, any amounts received by the Fund in excess of the repurchase price and related transaction costs must be remitted to the other party.
The Fund may enter into repurchase agreements in which eligible securities are transferred into joint trading accounts maintained by the custodian or sub-custodian for investment companies and other clients advised by the Adviser and its affiliates. The Fund will participate on a pro rata basis with the other investment companies and clients in its share of the securities transferred under such repurchase agreements and in its share of proceeds from any repurchase or other disposition of such securities.
Annual Shareholder Report
Investment Income, Gains and Losses, Expenses and Distributions
Investment transactions are accounted for on a trade-date basis. Realized gains and losses from investment transactions are recorded on an identified-cost basis. Interest income and expenses are accrued daily. Dividend income and distributions to shareholders are recorded on the ex-dividend date. Foreign dividends are recorded on the ex-dividend date or when the Fund is informed of the ex-dividend date. Distributions of net investment income, if any, are declared and paid annually. Non-cash dividends included in dividend income, if any, are recorded at fair value. Amortization/accretion of premium and discount is included in investment income. Investment income, realized and unrealized gains and losses, and certain fund-level expenses are allocated to each class based on relative average daily net assets, except that Class A Shares, Class B Shares and Class C Shares may bear distribution services fees and other service fees unique to those classes. The detail of the total fund expense waiver and reimbursements of $279,367 is disclosed in various locations in this Note 2 and Note 5.
For the year ended October 31, 2017, the Fund's former custodian reimbursed $2,455 of custody fees.
Dividends are declared separately for each class. No class has preferential dividend rights; differences in per share dividend rates are generally due to differences in separate class expenses.
Other Service Fees
The Fund may pay other service fees up to 0.25% of the average daily net assets of the Fund's Class A Shares, Class B Shares, and Class C Shares to unaffiliated financial intermediaries or to Federated Shareholder Services Company (FSSC) for providing services to shareholders and maintaining shareholder accounts. Subject to the terms described in the Expense Limitation note, FSSC may voluntarily reimburse the Fund for other service fees. For the year ended October 31, 2017, other service fees for the Fund were as follows:
| | Other
Service Fees
Incurred |
| Class A Shares | $148,414 |
| Class B Shares | 8,616 |
| Class C Shares | 97,493 |
| TOTAL | $254,523 |
Federal Taxes
It is the Fund's policy to comply with the Subchapter M provision of the Internal Revenue Code (the “Code”) and to distribute to shareholders each year substantially all of its income. Accordingly, no provision for federal income tax is necessary. As of and during the year ended October 31, 2017, the Fund did not have a liability for any uncertain tax positions. The Fund recognizes interest and penalties, if any, related to tax liabilities as income tax expense in the Statement of Operations. As of October 31, 2017, tax years 2014 through 2017 remain subject to examination by the Fund's major tax jurisdictions, which include the United States of America and the Commonwealth of Massachusetts.
The Fund may be subject to taxes imposed by governments of countries in which it invests. Such taxes are generally based on either income or gains earned or repatriated. The Fund accrues and applies such taxes to net investment income, net realized gains and net unrealized gains as income and/or gains are earned.
Annual Shareholder Report
When-Issued and Delayed-Delivery Transactions
The Fund may engage in when-issued or delayed-delivery transactions. The Fund records when-issued securities on the trade date and maintains security positions such that sufficient liquid assets will be available to make payment for the securities purchased. Securities purchased on a when-issued or delayed-delivery basis are marked to market daily and begin earning interest on the settlement date. Losses may occur on these transactions due to changes in market conditions or the failure of counterparties to perform under the contract.
Futures Contracts
The Fund purchases and sells financial futures contracts to seek to increase return and to manage country risk, duration risk and market risk. Upon entering into a financial futures contract with a broker, the Fund is required to deposit in a segregated account, either U.S. government securities or a specified amount of Restricted cash, which is shown in the Statement of Assets and Liabilities. Futures contracts are valued daily and unrealized gains or losses are recorded in a “variation margin” account. Daily, the Fund receives from or pays to the broker a specified amount of cash based upon changes in the variation margin account. When a contract is closed, the Fund recognizes a realized gain or loss. Futures contracts have market risks, including the risk that the change in the value of the contract may not correlate with the changes in the value of the underlying securities. There is minimal counterparty risk to the Fund since futures contracts are exchange traded and the exchange's clearing house, as counterparty to all exchange-traded futures contracts, guarantees the futures contracts against default.
Futures contracts outstanding at the period end are listed after the Fund's Portfolio of Investments.
The average notional value of short futures contracts held by the Fund throughout the period was $84,505,495. This is based on amounts held as of each month-end throughout the fiscal year.
Foreign Exchange Contracts
The Fund may enter into foreign exchange contracts to seek to increase return and to manage currency risk. Purchased contracts are used to acquire exposure to foreign currencies, whereas, contracts to sell are used to hedge the Fund's securities against currency fluctuations. Risks may arise upon entering into these transactions from the potential inability of counterparties to meet the terms of their commitments and from unanticipated movements in security prices or foreign exchange rates. The foreign exchange contracts are adjusted by the daily exchange rate of the underlying currency and any gains or losses are recorded for financial statement purposes as unrealized until the settlement date.
Foreign exchange contracts are subject to Master Netting Agreements (MNA) which are agreements between the Fund and its counterparties that provide for the net settlement of all transactions and collateral with the Fund, through a single payment, in the event of default or termination.
Foreign exchange contracts outstanding at period end, including net unrealized appreciation/depreciation or net settlement amounts, are listed after the Fund's Portfolio of Investments.
The average value at settlement date payable and receivable of foreign exchange contracts purchased and sold by the Fund throughout the period was $623,513 and $423,482, respectively. This is based on the contracts held as of each month-end throughout the fiscal year.
Annual Shareholder Report
Foreign Currency Translation
The accounting records of the Fund are maintained in U.S. dollars. All assets and liabilities denominated in foreign currencies are translated into U.S. dollars based on the rates of exchange of such currencies against U.S. dollars on the date of valuation. Purchases and sales of securities, income and expenses are translated at the rate of exchange quoted on the respective date that such transactions are recorded. The Fund does not isolate that portion of the results of operations resulting from changes in foreign exchange rates on investments from the fluctuations arising from changes in market prices of securities held. Such fluctuations are included with the net realized and unrealized gain or loss from investments.
Reported net realized foreign exchange gains or losses arise from sales of foreign currencies, currency gains or losses realized between the trade and settlement dates on securities transactions, the difference between the amounts of dividends, interest and foreign withholding taxes recorded on the Fund's books and the U.S. dollar equivalent of the amounts actually received or paid. Net unrealized foreign exchange gains and losses arise from changes in the value of assets and liabilities other than investments in securities at period end, resulting from changes in the exchange rate.
Short Sales
In a short sale, the Fund sells a security it does not own in anticipation of a decline in the fair market value of the security. When the Fund sells a security short, it must borrow the security in order to deliver it at the completion of the sale. A gain, limited to the price at which the Fund sold the security short, or a loss, unlimited in size, will be recognized upon the termination of the short sale.
The Fund has an obligation to replace the borrowed security (e.g., to purchase the security at a future date and deliver it to the lender of the security). While the security is borrowed, the proceeds from the sale are deposited with the lender (“Prime Broker”). The Fund may incur two types of expenses from short sales: borrowing expenses and dividend expenses. Borrowing expenses may occur because the Fund may be obligated to pay fees to the Prime Broker on borrowed securities. This fee is normally based upon the market value of the borrowed security and is dependent upon the availability of the security. Dividend expenses may occur because the Fund has to pay the Prime Broker the equivalent of any dividends earned on the borrowed security.
For the year ended October 31, 2017, the net realized gain (loss) on short sales was $(1,508,033).
Option Contracts
The Fund buys/sells put and call options to seek to increase income and return and to manage country risk, currency risk, individual security risk, market risk and sector/asset risk. The seller (“writer”) of an option receives a payment or premium, from the buyer, which the writer keeps regardless of whether the buyer exercises the option. When the Fund writes a put or call option, an amount equal to the premium received is recorded as a liability and subsequently marked to market to reflect the current value of the option written. Premiums received from writing options which expire are treated as realized gains. The Fund, as a writer of an option, bears the market risk of an unfavorable change in the price of the underlying reference instrument. When the Fund purchases a put or call option, an amount equal to the premium paid is recorded as an increase to the cost of the investment and subsequently marked to market to reflect the current value of the option purchased. Premiums paid for purchasing options which expire are treated as realized losses. Premiums received/paid for
Annual Shareholder Report
writing/purchasing options which are exercised or closed are added to the proceeds or offset against amounts paid on the underlying reference instrument to determine the realized gain or loss. The risk associated with purchasing put and call options is limited to the premium paid. Options can trade on securities or commodities exchanges. In this case, the exchange sets all the terms of the contract except for the price. Most exchanges require investors to maintain margin accounts through their brokers to cover their potential obligations to the exchange. This protects investors against potential defaults by the counterparty.
Purchased option contracts outstanding at period end are listed in the Fund's Portfolio of Investments and written option contracts outstanding at period end are listed after the Fund's Portfolio of Investments.
The average market value of purchased and written options held by the Fund throughout the period was $3,977,507 and $81,646, respectively. This is based on amounts held as of each month-end throughout the fiscal year.
Additional Disclosure Related to Derivative Instruments
| Fair Value of Derivative Instruments |
| | Asset | Liability |
| | Statement of
Assets and
Liabilities
Location | Fair
Value | Statement of
Assets and
Liabilities
Location | Fair
Value |
| Derivatives not accounted for as hedging instruments under ASC Topic 815 | | | | |
| Foreign exchange contracts | Unrealized
appreciation
on foreign
exchange
contracts | $1,098,449 | Unrealized
depreciation
on foreign
exchange
contracts | $130,568 |
| Equity contracts | Investment
in securities,
at value | 2,538,112 | | — |
| Interest rate contracts | | — | Payable for daily
variation margin
on futures
contracts | 450,536* |
| Equity contracts | | — | Payable for daily
variation margin
on futures
contracts | 2,132,411* |
| Equity contracts | Written options outstanding, at value | — | | 20,700 |
| Total derivatives not accounted for as hedging instruments under ASC Topic 815 | | $3,636,561 | | $2,734,215 |
| * | Includes cumulative depreciation of futures contracts as reported in the footnotes to the Portfolio of Investments. Only the current day's variation margin is reported within the Statement of Assets and Liabilities. |
Annual Shareholder Report
The Effect of Derivative Instruments on the Statement of Operations for the Year Ended October 31, 2017
| Amount of Realized Gain or (Loss) on Derivatives Recognized in Income |
| | Futures
Contracts | Written
Options | Purchased
Options1 | Foreign
Exchange
Contracts | Total |
| Foreign exchange contracts | $— | $— | $(149,918) | $(2,073,676) | $(2,223,594) |
| Equity contracts | $(8,897,496) | $(201,449) | $(15,920,302) | $— | $(25,019,247) |
| Interest rate contracts | $(962,820) | $— | $— | $— | $(962,820) |
| TOTAL | $(9,860,316) | $(201,449) | $(16,070,220) | $(2,073,676) | $(28,205,661) |
| Change in Unrealized Appreciation or (Depreciation) on Derivatives Recognized in Income |
| | Futures
Contracts | Written
Options | Purchased
Options2 | Foreign
Exchange
Contracts | Total |
| Foreign exchange contracts | $— | $— | $21,187 | $1,735,742 | $1,756,929 |
| Equity contracts | $(3,803,506) | $(219,337) | $3,355,880 | $— | $(666,963) |
| Interest rate contracts | $(450,536) | $— | $— | $— | $(450,536) |
| TOTAL | $(4,254,042) | $(219,337) | $3,377,067 | $1,735,742 | $639,430 |
| 1 | The net realized gain (loss) on Purchased Options is found within the Net realized gain on investments and foreign currency transactions on the Statement of Operations. |
| 2 | The net change in unrealized depreciation of Purchased Options is found within the Net change in unrealized appreciation of investments, certain receivables and translation of assets and liabilities in foreign currency on the Statement of Operations. |
Other
The preparation of financial statements in conformity with GAAP requires management to make estimates and assumptions that affect the amounts of assets, liabilities, expenses and revenues reported in the financial statements. Actual results could differ from those estimated. The Fund applies investment company accounting and reporting guidance.
3. SHARES OF BENEFICIAL INTEREST
The following tables summarize share activity:
| Year Ended October 31 | 2017 | 2016 |
| Class A Shares: | Shares | Amount | Shares | Amount |
| Shares sold | 613,115 | $5,837,078 | 1,483,596 | $14,880,019 |
| Shares redeemed | (2,383,721) | (22,748,838) | (3,352,283) | (33,169,074) |
| NET CHANGE RESULTING FROM CLASS A SHARE TRANSACTIONS | (1,770,606) | $(16,911,760) | (1,868,687) | $(18,289,055) |
Annual Shareholder Report
| Year Ended October 31 | 2017 | 2016 |
| Class B Shares: | Shares | Amount | Shares | Amount |
| Shares sold | — | $— | — | $— |
| Shares redeemed | (178,153) | (1,663,370) | (268,383) | (2,621,238) |
| NET CHANGE RESULTING FROM CLASS B SHARE TRANSACTIONS | (178,153) | $(1,663,370) | (268,383) | $(2,621,238) |
| Year Ended October 31 | 2017 | 2016 |
| Class C Shares: | Shares | Amount | Shares | Amount |
| Shares sold | 231,352 | $2,154,694 | 823,523 | $8,122,767 |
| Shares redeemed | (2,107,583) | (19,575,613) | (1,872,570) | (18,097,818) |
| NET CHANGE RESULTING FROM CLASS C SHARE TRANSACTIONS | (1,876,231) | $(17,420,919) | (1,049,047) | $(9,975,051) |
| Year Ended October 31 | 2017 | 2016 |
| Institutional Shares: | Shares | Amount | Shares | Amount |
| Shares sold | 1,188,375 | $11,460,347 | 9,555,288 | $96,654,429 |
| Shares redeemed | (7,641,302) | (73,552,960) | (8,056,513) | (80,299,147) |
| NET CHANGE RESULTING FROM INSTITUTIONAL SHARE TRANSACTIONS | (6,452,927) | $(62,092,613) | 1,498,775 | $16,355,282 |
| NET CHANGE RESULTING FROM TOTAL FUND SHARE TRANSACTIONS | (10,277,917) | $(98,088,662) | (1,687,342) | $(14,530,062) |
4. FEDERAL TAX INFORMATION
The timing and character of income and capital gain distributions are determined in accordance with income tax regulations, which may differ from GAAP. These differences are due to differing treatments for foreign currency transactions, discount accretion/premium amortization on debt securities, passive foreign investment companies, dividend re-designation, short dividends disallowed, defaulted securities and expiration of capital loss carryforwards.
For the year ended October 31, 2017, permanent differences identified and reclassified among the components of net assets were as follows:
| Increase (Decrease) |
| Paid-In Capital | Undistributed
Net Investment
Income (Loss) | Accumulated
Net Realized
Gain (Loss) |
| $(257,181,132) | $384,571 | $256,796,561 |
Net investment income (loss), net realized gains (losses) and net assets were not affected by this reclassification.
Annual Shareholder Report
As of October 31, 2017, the components of distributable earnings on a tax-basis were as follows:
| Undistributed ordinary income | $508,860 |
| Capital loss carryforwards and deferrals | $(166,714,035) |
| Net unrealized depreciation | $(12,573,788) |
The difference between book-basis and tax-basis net unrealized appreciation/depreciation is attributable to differing treatments for the deferral of losses on wash sales, defaulted bonds, straddle loss deferrals, passive foreign investment companies, discount accretion/premium amortization on debt securities and mark to market on futures contracts, foreign exchange contracts and options.
At October 31, 2017, the cost of investments for federal tax purposes was $139,567,602. The net unrealized depreciation of investments for federal tax purposes was $11,234,002. This consists of net unrealized appreciation from investments for those securities having an excess of value over cost of $23,261,724 and net unrealized depreciation from investments for those securities having an excess of cost over value of $34,495,726. The amounts presented are inclusive of derivative contracts.
At October 31, 2017, the Fund had a capital loss carryforward of $165,678,790 which will reduce the Fund's taxable income arising from future net realized gains on investments, if any, to the extent permitted by the Code, thereby reducing the amount of distributions to shareholders which would otherwise be necessary to relieve the Fund of any liability for federal income tax. Pursuant to the Code, a net capital loss incurred in taxable years beginning on or before December 22, 2010 is characterized as short-term and may be carried forward for a maximum of eight tax years (“Carryforward Limit”), whereas a net capital loss incurred in taxable years beginning after December 22, 2010; retains its character as either short-term or long-term and does not expire and is required to be utilized prior to the losses which have Carryforward Limit.
The following schedule summarizes the Fund's capital loss carryforwards and expiration years:
| Expiration Year | Short-Term | Long-Term | Total |
| No expiration | $35,117,737 | $841,622 | $35,959,359 |
| 2018 | $111,074,244 | NA | $111,074,244 |
| 2019 | $18,645,187 | NA | $18,645,187 |
Capital loss carryforwards of $257,322,572 expired during the year ended October 31, 2017.
At October 31, 2017, for federal tax purposes, the Fund had $1,035,245 in straddle loss deferrals.
Annual Shareholder Report
5. INVESTMENT ADVISER FEE AND OTHER TRANSACTIONS WITH AFFILIATES
Investment Adviser Fee
The advisory agreement between the Fund and the Adviser provides for an annual fee equal to 0.75% of the Fund's average daily net assets. Subject to the terms described in the Expense Limitation note, the Adviser may voluntarily choose to waive any portion of its fee. For the year ended October 31, 2017, the Adviser voluntarily waived $260,107 of its fee and voluntarily reimbursed $7,055 of other operating expenses.
Certain of the Fund's assets are managed by Federated Investment Management Company (the “Sub-Adviser”). Under the terms of a sub-advisory agreement between the Adviser and the Sub-Adviser, the Sub-Adviser receives an allocable portion of the Fund's adviser fee. The fee is paid by the Adviser out of its resources and is not an incremental Fund expense. For the year ended October 31, 2017, the Sub-Adviser earned a fee of $73,148.
The Adviser has agreed to reimburse the Fund for certain investment adviser fees as a result of transactions in other affiliated investment companies. For the year ended October 31, 2017, the Adviser reimbursed $9,750.
Administrative Fee
Federated Administrative Services (FAS), under the Administrative Services Agreement, provides the Fund with administrative personnel and services. For purposes of determining the appropriate rate breakpoint, “Investment Complex” is defined as all of the Federated Funds subject to a fee under the Administrative Services Agreement. The fee paid to FAS is based on the average daily net assets of the Investment Complex as specified below:
| Administrative Fee | Average Daily Net Assets
of the Investment Complex |
| 0.100% | on assets up to $50 billion |
| 0.075% | on assets over $50 billion |
Subject to the terms described in the Expense Limitation note, FAS may voluntarily choose to waive any portion of its fee. For the year ended October 31, 2017, the annualized fee paid to FAS was 0.079% of average daily net assets of the Fund.
Prior to September 1, 2017, the breakpoints of the Administrative Fee paid to FAS, described above, were:
| Administrative Fee | Average Daily Net Assets
of the Investment Complex |
| 0.150% | on the first $5 billion |
| 0.125% | on the next $5 billion |
| 0.100% | on the next $10 billion |
| 0.075% | on assets in excess of $20 billion |
In addition, FAS may charge certain out-of-pocket expenses to the Fund.
Annual Shareholder Report
Distribution Services Fee
The Fund has adopted a Distribution Plan (the “Plan”) pursuant to Rule 12b-1 under the Act. Under the terms of the Plan, the Fund will compensate Federated Securities Corp. (FSC), the principal distributor, from the daily net assets of the Fund's Class A Shares, Class B Shares and Class C Shares to finance activities intended to result in the sale of these shares. The Plan provides that the Fund may incur distribution expenses at the following percentages of average daily net assets annually, to compensate FSC:
| Share Class Name | Percentage of Average Daily
Net Assets of Class |
| Class A Shares | 0.05% |
| Class B Shares | 0.75% |
| Class C Shares | 0.75% |
Subject to the terms described in the Expense Limitation note, FSC may voluntarily choose to waive any portion of its fee. For the year ended October 31, 2017, distribution services fees for the Fund were as follows:
| | Distribution Services
Fees Incurred |
| Class B Shares | $25,847 |
| Class C Shares | 292,482 |
| TOTAL | $318,329 |
When FSC receives fees, it may pay some or all of them to financial intermediaries whose customers purchase shares. For the year ended October 31, 2017, FSC retained $32,683 of fees paid by the Fund. For the year ended October 31, 2017, the Fund's Class A Shares did not incur a distribution services fee; however, it may begin to incur this fee upon approval of the Trustees.
Sales Charges
Front-end sales charges and contingent deferred sales charges (CDSC) do not represent expenses of the Fund. They are deducted from the proceeds of sales of Fund shares prior to investment or from redemption proceeds prior to remittance, as applicable. For the year ended October 31, 2017, FSC retained $1,359 in sales charges from the sale of Class A Shares. For the year ended October 31, 2017, FSC also retained $361, $5,518 and $745 of CDSC relating to redemptions of Class A Shares, Class B Shares and Class C Shares, respectively.
Other Service Fees
For the year ended October 31, 2017, FSSC received $9,923 of the other service fees disclosed in Note 2.
Expense Limitation
The Adviser and certain of its affiliates (which may include FSC, FAS and FSSC) on their own initiative have agreed to waive certain amounts of their respective fees and/or reimburse expenses. Effective January 1, 2018, total annual fund operating expenses (as shown in the financial highlights, excluding dividends and other expenses related to short sales, premiums for risk insurance policies on certain portfolio securities, interest expense, extraordinary expenses, line of credit expenses, and proxy-related expenses paid by the Fund, if any) paid by the Fund's Class A Shares, Class B Shares, Class C Shares and Institutional Shares (after the
Annual Shareholder Report
voluntary waivers and reimbursements) will not exceed 1.30%, 2.05%, 2.05% and 1.05% (the “Fee Limit”), respectively, up to but not including the later of (the “Termination Date”): (a) January 1, 2019; or (b) the date of the Fund's next effective Prospectus. While the Adviser and its applicable affiliates currently do not anticipate terminating or increasing these arrangements prior to the Termination Date, these arrangements may only be terminated or the Fee Limit increased prior to the Termination Date with the agreement of the Trustees.
General
Certain Officers and Trustees of the Fund are Officers and Directors or Trustees of certain of the above companies. To efficiently facilitate payment, Directors'/Trustees' fees and certain expenses related to conducting meetings of the Directors/Trustees and other miscellaneous expenses are paid by an affiliate of the Adviser which in due course are reimbursed by the Fund. These expenses related to conducting meetings of the Directors/Trustees and other miscellaneous expenses may be included in Accrued and Miscellaneous Expenses on the Statement of Assets and Liabilities and Statement of Operations, respectively.
6. Investment TRANSACTIONS
Purchases and sales of investments, excluding long-term U.S. government securities and short-term obligations, for the year ended October 31, 2017, were as follows:
| Purchases | $187,215,778 |
| Sales | $291,538,053 |
7. LINE OF CREDIT
The Fund participates with certain other Federated Funds, on a several basis, in an up to $500,000,000 unsecured, 364-day, committed, revolving line of credit (LOC) agreement. The LOC was made available to finance temporarily the repurchase or redemption of shares of the Fund, failed trades, payment of dividends, settlement of trades and for other short-term, temporary or emergency general business purposes. The Fund cannot borrow under the LOC if an inter-fund loan is outstanding. The Fund's ability to borrow under the LOC also is subject to the limitations of the Act and various conditions precedent that must be satisfied before the Fund can borrow. Loans under the LOC are charged interest at a fluctuating rate per annum equal to the highest, on any day, of (a) (i) the federal funds effective rate, (ii) the one month London Interbank Offered Rate (LIBOR), and (iii) 0.0%, plus (b) a margin. The LOC also requires the Fund to pay, quarterly in arrears and at maturity, its pro rata share of a commitment fee based on the amount of the lenders' commitment that has not been utilized. As of October 31, 2017, the Fund had no outstanding loans. During the year ended October 31, 2017, the Fund did not utilize the LOC.
Annual Shareholder Report
8. INTERFUND LENDING
Pursuant to an Exemptive Order issued by the SEC, the Fund, along with other funds advised by subsidiaries of Federated Investors, Inc., may participate in an interfund lending program. This program provides an alternative credit facility allowing the Fund to borrow from other participating affiliated funds. As of October 31, 2017, there were no outstanding loans. During the year ended October 31, 2017, the program was not utilized.
9. RECEIVABLE FROM BANKRUPTCY TRUSTEE
The amount presented on the Statement of Assets and Liabilities, under the caption receivable for investments sold, includes net realizable proceeds of $748,450 which represents the estimated amount expected to be received from the bankruptcy trustee for certain security transactions executed through Lehman Brothers in 2008.
Annual Shareholder Report
Report of Independent Registered Public Accounting Firm
TO THE BOARD OF TRUSTEES OF THE FEDERATED EQUITY FUNDS AND SHAREHOLDERS OF Federated absolute return fund:
We have audited the accompanying statement of assets and liabilities, including the portfolio of investments, of Federated Absolute Return Fund (the “Fund”), a portfolio of Federated Equity Funds, as of October 31, 2017, and the related statement of operations for the year then ended, the statements of changes in net assets for each of the years in the two-year period then ended, and the financial highlights for each of the years in the five-year period then ended. These financial statements and financial highlights are the responsibility of the Fund's management. Our responsibility is to express an opinion on these financial statements and financial highlights based on our audits.
We conducted our audits in accordance with the standards of the Public Company Accounting Oversight Board (United States). Those standards require that we plan and perform the audit to obtain reasonable assurance about whether the financial statements and financial highlights are free of material misstatement. An audit includes examining, on a test basis, evidence supporting the amounts and disclosures in the financial statements. Our procedures included confirmation of securities owned as of October 31, 2017, by correspondence with the custodian, transfer agent and brokers or by other appropriate auditing procedures. An audit also includes assessing the accounting principles used and significant estimates made by management, as well as evaluating the overall financial statement presentation. We believe that our audits provide a reasonable basis for our opinion.
In our opinion, the financial statements and financial highlights referred to above present fairly, in all material respects, the financial position of the Federated Absolute Return Fund as of October 31, 2017, and the results of its operations for the year then ended, the changes in its net assets for each of the years in the two-year period then ended, and the financial highlights for each of the years in the five-year period then ended, in conformity with U.S. generally accepted accounting principles.
Boston, Massachusetts
December 22, 2017
Annual Shareholder Report
Shareholder Expense Example (unaudited)
As a shareholder of the Fund, you incur two types of costs: (1) transaction costs, including sales charges (loads) on purchase or redemption payments; and (2) ongoing costs, including management fees and to the extent applicable, distribution (12b-1) fees and/or other service fees and other Fund expenses. This Example is intended to help you to understand your ongoing costs (in dollars) of investing in the Fund and to compare these costs with the ongoing costs of investing in other mutual funds. It is based on an investment of $1,000 invested at the beginning of the period and held for the entire period from May 1, 2017 to October 31, 2017.
ACTUAL EXPENSES
The first section of the table below provides information about actual account values and actual expenses. You may use the information in this section, together with the amount you invested, to estimate the expenses that you incurred over the period. Simply divide your account value by $1,000 (for example, an $8,600 account value divided by $1,000 = 8.6), then multiply the result by the number in the first section under the heading entitled “Expenses Paid During Period” to estimate the expenses attributable to your investment during this period.
HYPOTHETICAL EXAMPLE FOR COMPARISON PURPOSES
The second section of the table below provides information about hypothetical account values and hypothetical expenses based on the Fund's actual expense ratio and an assumed rate of return of 5% per year before expenses, which is not the Fund's actual return. Thus, you should not use the hypothetical account values and expenses to estimate the actual ending account balance or your expenses for the period. Rather, these figures are required to be provided to enable you to compare the ongoing costs of investing in the Fund with other funds. To do so, compare this 5% hypothetical example with the 5% hypothetical examples that appear in the shareholder reports of the other funds.
Annual Shareholder Report
Please note that the expenses shown in the table are meant to highlight your ongoing costs only and do not reflect any transaction costs, such as sales charges (loads) on purchase or redemption payments. Therefore, the second section of the table is useful in comparing ongoing costs only, and will not help you determine the relative total costs of owning different funds. In addition, if these transaction costs were included, your costs would have been higher.
| | Beginning
Account Value
5/1/2017 | Ending
Account Value
10/31/2017 | Expenses Paid
During Period1 |
| Actual: | | | |
| Class A Shares | $1,000 | $1,018.80 | $7.632 |
| Class B Shares | $1,000 | $1,016.10 | $11.483 |
| Class C Shares | $1,000 | $1,015.10 | $11.484 |
| Institutional Shares | $1,000 | $1,020.70 | $6.425 |
Hypothetical (assuming a 5% return
before expenses): | | | |
| Class A Shares | $1,000 | $1,017.64 | $7.632 |
| Class B Shares | $1,000 | $1,013.81 | $11.473 |
| Class C Shares | $1,000 | $1,013.81 | $11.474 |
| Institutional Shares | $1,000 | $1,018.85 | $6.415 |
| 1 | Expenses are equal to the Fund's annualized net expense ratios, multiplied by the average account value over the period, multiplied by 184/365 (to reflect the one-half-year period). The annualized net expense ratios are as follows: |
| | |
| Class A Shares | 1.50% |
| Class B Shares | 2.26% |
| Class C Shares | 2.26% |
| Institutional Shares | 1.26% |
Annual Shareholder Report
| 2 | Actual and Hypothetical expenses paid during the period utilizing the Fund's Class A Shares current Fee Limit of 1.29% (as reflected in the Notes to Financial Statements, Note 5 under Expense Limitation), multiplied by the average account value over the period, multiplied by 184/365 (to reflect expenses paid as if they had been in effect throughout the most recent one-half-year period) would be $6.56 and $6.56, respectively. |
| 3 | Actual and Hypothetical expenses paid during the period utilizing the Fund's Class B Shares current Fee Limit of 2.04% (as reflected in the Notes to Financial Statements, Note 5 under Expense Limitation), multiplied by the average account value over the period, multiplied by 184/365 (to reflect expenses paid as if they had been in effect throughout the most recent one-half-year period) would be $10.37 and $10.35, respectively. |
| 4 | Actual and Hypothetical expenses paid during the period utilizing the Fund's Class C Shares current Fee Limit of 2.04% (as reflected in the Notes to Financial Statements, Note 5 under Expense Limitation), multiplied by the average account value over the period, multiplied by 184/365 (to reflect expenses paid as if they had been in effect throughout the most recent one-half-year period) would be $10.36 and $10.35, respectively. |
| 5 | Actual and Hypothetical expenses paid during the period utilizing the Fund's Institutional Shares current Fee Limit of 1.04% (as reflected in the Notes to Financial Statements, Note 5 under Expense Limitation), multiplied by the average account value over the period, multiplied by 184/365 (to reflect expenses paid as if they had been in effect throughout the most recent one-half-year period) would be $5.30 and $5.29, respectively. |
Annual Shareholder Report
In Memoriam
With profound sadness, Federated announces the passing of John F. (“Jack”) Donahue and John W. (“John”) McGonigle. They will be greatly missed.
Jack Donahue
(Former Chairman and President, and Emeritus Director/Trustee, of the Federated Funds, and Founder, Former Chairman, President and Chief Executive Officer, and Chairman Emeritus, of Federated Investors, Inc.)
Jack Donahue, along with Richard B. Fisher, founded Federated in 1955 and served as a leader and member of the Boards of Directors/Trustees of the Federated Funds and the Board of Directors of Federated Investors, Inc. Mr. Donahue was a family man of deep faith with exemplary character and fealty, who served his religion, family, community, and the Federated Funds and Federated, as well as their shareholders, officers and employees, with distinction. His integrity, intelligence, and keen sense of fiduciary duty, coupled with his faith, family and background as a West Point graduate and Strategic Air Command B-29 pilot, served as a foundation for his strong business acumen and leadership. Among his many achievements, Mr. Donahue's steadfast and innovative leadership of the Federated Funds and Federated, as well as within the investment management industry, led to the birth of money market funds in the 1970s and their growth as an innovative, efficient and effective cash management vehicle throughout the 1980s, 1990s, 2000s and beyond. Federated expresses deep gratitude to Mr. Donahue for his inspiring leadership, distinguished service and contributions as a husband, father, founder, Board member and officer, colleague and friend.
John McGonigle
(Former Secretary of the Federated Funds, Former Director, Secretary and Chief Legal Officer of Federated Investors, Inc.)
John McGonigle served the Federated Funds and their respective Boards with distinction for more than 50 years as Fund Secretary and also served as Director for several closed-end funds. Mr. McGonigle was a gifted lawyer and wise counselor with a genial presence, keen intellect and convivial demeanor. A man of deep faith, he was a devoted husband, father and grandfather. A graduate of Duquesne University School of Law, Mr. McGonigle served as an officer in the U.S. Army for two years, achieving the rank of Captain. He also served on the staff of the Securities and Exchange Commission before joining Federated in 1966. Among many professional accomplishments, Mr. McGonigle helped fashion the regulatory foundation for money market funds, established Federated's first offshore funds in Ireland, and represented Federated on the Board of Governors of the Investment Company Institute where he was a member of the Executive Committee. Federated expresses deep gratitude for Mr. McGonigle and his impact on his family, friends, the community, and the mutual fund industry.
Annual Shareholder Report
Board of Trustees and Trust Officers
The Board of Trustees is responsible for managing the Trust's business affairs and for exercising all the Trust's powers except those reserved for the shareholders. The following tables give information about each Trustee and the senior officers of the Fund. Where required, the tables separately list Trustees who are “interested persons” of the Fund (i.e., “Interested” Trustees) and those who are not (i.e., “Independent” Trustees). Unless otherwise noted, the address of each person listed is Federated Investors Tower, 1001 Liberty Avenue, Pittsburgh, PA 15222. The address of all Independent Trustees listed is 4000 Ericsson Drive, Warrendale, PA 15086-7561; Attention: Mutual Fund Board. As of December 31, 2016, the Trust comprised 14 portfolio(s), and the Federated Fund Family consisted of 40 investment companies (comprising 124 portfolios). Unless otherwise noted, each Officer is elected annually. Unless otherwise noted, each Trustee oversees all portfolios in the Federated Fund Family and serves for an indefinite term. The Fund's Statement of Additional Information includes additional information about Trust Trustees and is available, without charge and upon request, by calling 1-800-341-7400.
Interested Trustees Background
Name
Birth Date
Positions Held with Trust
Date Service Began | Principal Occupation(s) for Past Five Years,
Other Directorships Held and Previous Position(s) |
J. Christopher Donahue*
Birth Date: April 11, 1949
President and Trustee
Indefinite Term
Began serving: September 1999 | Principal Occupations: Principal Executive Officer and President of certain of the Funds in the Federated Fund Family; Director or Trustee of the Funds in the Federated Fund Family; President, Chief Executive Officer and Director, Federated Investors, Inc.; Chairman and Trustee, Federated Investment Management Company; Trustee, Federated Investment Counseling; Chairman and Director, Federated Global Investment Management Corp.; Chairman and Trustee, Federated Equity Management Company of Pennsylvania; Trustee, Federated Shareholder Services Company; Director, Federated Services Company.
Previous Positions: President, Federated Investment Counseling; President and Chief Executive Officer, Federated Investment Management Company, Federated Global Investment Management Corp. and Passport Research, Ltd; Chairman, Passport Research, Ltd. |
Annual Shareholder Report
Name
Birth Date
Positions Held with Trust
Date Service Began | Principal Occupation(s) for Past Five Years,
Other Directorships Held and Previous Position(s) |
John B. Fisher*
Birth Date: May 16, 1956
Trustee
Indefinite Term
Began serving: May 2016 | Principal Occupations: Principal Executive Officer and President of certain of the Funds in the Federated Fund Family; Director or Trustee of certain of the Funds in the Federated Fund Family; Vice President, Federated Investors, Inc.; President, Director/Trustee and CEO, Federated Advisory Services Company, Federated Equity Management Company of Pennsylvania, Federated Global Investment Management Corp., Federated Investment Counseling, Federated Investment Management Company; President of some of the Funds in the Federated Fund Complex and Director, Federated Investors Trust Company.
Previous Positions: President and Director of the Institutional Sales Division of Federated Securities Corp.; President and Director of Federated Investment Counseling; President and CEO of Passport Research, Ltd.; Director, Edgewood Securities Corp.; Director, Federated Services Company; Director, Federated Investors, Inc.; Chairman and Director, Southpointe Distribution Services, Inc. and President, Technology, Federated Services Company. |
| * | Reasons for “interested” status: J. Christopher Donahue and John B. Fisher are interested due to their beneficial ownership of shares of Federated Investors, Inc. and due to positions they hold with Federated and its subsidiaries. |
INDEPENDENT Trustees Background
Name
Birth Date
Positions Held with Trust
Date Service Began | Principal Occupation(s) for Past Five Years,
Other Directorships Held, Previous Position(s) and Qualifications |
John T. Collins
Birth Date: January 24, 1947
Trustee
Indefinite Term
Began serving: October 2013 | Principal Occupations: Director or Trustee of the Federated Fund Family; formerly, Chairman and CEO, The Collins Group, Inc. (a private equity firm) (Retired).
Other Directorships Held: Director, Current Chair of the Compensation Committee, KLX Corp.
Qualifications: Mr. Collins has served in several business and financial management roles and directorship positions throughout his career. Mr. Collins previously served as Chairman and CEO, The Collins Group, Inc. (a private equity firm). Mr. Collins serves as Chairman Emeriti, Bentley University. Mr. Collins previously served as Director and Audit Committee Member, Bank of America Corp.; Director, FleetBoston Financial Corp.; and Director, Beth Israel Deaconess Medical Center (Harvard University Affiliate Hospital). |
Annual Shareholder Report
Name
Birth Date
Positions Held with Trust
Date Service Began | Principal Occupation(s) for Past Five Years,
Other Directorships Held, Previous Position(s) and Qualifications |
G. Thomas Hough
Birth Date: February 28, 1955
Trustee
Indefinite Term
Began serving: August 2015 | Principal Occupations: Director or Trustee of the Federated Fund Family; formerly, Vice Chair, Ernst & Young LLP (public accounting firm) (Retired).
Other Directorships Held: Director, Chair of the Audit Committee, Governance Committee, Publix Super Markets, Inc.; Director, Member of the Audit Committee and Technology Committee of Equifax, Inc.
Qualifications: Mr. Hough has served in accounting, business management and directorship positions throughout his career. Mr. Hough most recently held the position of Americas Vice Chair of Assurance with Ernst & Young LLP (public accounting firm). Mr. Hough is an Executive Committee member of the United States Golf Association, he serves on the President's Cabinet and Business School Board of Visitors for the University of Alabama and is on the Business School Board of Visitors for Wake Forest University. |
Maureen Lally-Green
Birth Date: July 5, 1949
Trustee
Indefinite Term
Began serving: August 2009 | Principal Occupations: Director or Trustee of the Federated Fund Family; Dean of the Duquesne University School of Law; Adjunct Professor of Law, Duquesne University School of Law; formerly, Interim Dean of the Duquesne University School of Law; Associate General Secretary and Director, Office of Church Relations, Diocese of Pittsburgh.
Other Directorships Held: Director, CONSOL Energy Inc.
Qualifications: Judge Lally-Green has served in various legal and business roles and directorship positions throughout her career. Judge Lally-Green previously served as: Associate General Secretary, Diocese of Pittsburgh; a member of the Superior Court of Pennsylvania; and as a Professor of Law, Duquesne University School of Law. Judge Lally-Green also currently holds the positions on either a public or not for profit Board of Directors as follows: Director and Chair, UPMC Mercy Hospital; Regent, St. Vincent Seminary; Director and Vice Chair, Our Campaign for the Church Alive!, Inc.; Director, Saint Vincent College; Member, Pennsylvania State Board of Education (public); and Director and Chair, Cardinal Wuerl North Catholic High School, Inc. Judge Lally-Green has held the positions of: Director, Auberle; Director, Epilepsy Foundation of Western and Central Pennsylvania; Director, Ireland Institute of Pittsburgh; Director, Saint Thomas More Society; Director, Catholic High Schools of the Diocese of Pittsburgh, Inc.; and Director, Pennsylvania Bar Institute. |
Peter E. Madden
Birth Date: March 16, 1942
Trustee
Indefinite Term
Began serving: November 1991 | Principal Occupation: Director or Trustee, and Chair of the Board of Directors or Trustees, of the Federated Fund Family; Retired.
Other Directorships Held: None.
Qualifications: Mr. Madden has served in several business management, mutual fund services and directorship positions throughout his career. Mr. Madden previously served as President, Chief Operating Officer and Director, State Street Bank and Trust Company (custodian bank) and State Street Corporation (financial services). He was Director, VISA USA and VISA International and Chairman and Director, Massachusetts Bankers Association. Mr. Madden served as Director, Depository Trust Corporation and Director, The Boston Stock Exchange. Mr. Madden also served as a Representative to the Commonwealth of Massachusetts General Court. |
Annual Shareholder Report
Name
Birth Date
Positions Held with Trust
Date Service Began | Principal Occupation(s) for Past Five Years,
Other Directorships Held, Previous Position(s) and Qualifications |
Charles F. Mansfield, Jr.
Birth Date: April 10, 1945
Trustee
Indefinite Term
Began serving: January 1999 | Principal Occupations: Director or Trustee of the Federated Fund Family; Management Consultant.
Other Directorships Held: None.
Qualifications: Mr. Mansfield has served as a Marine Corps officer and in several banking, business management, educational roles and directorship positions throughout his long career. He remains active as a Management Consultant. |
Thomas M. O'Neill
Birth Date: June 14, 1951
Trustee
Indefinite Term
Began serving: August 2006 | Principal Occupations: Director or Trustee, Chair of the Audit Committee of the Federated Fund Family; Sole Proprietor, Navigator Management Company (investment and strategic consulting).
Other Directorships Held: None.
Qualifications: Mr. O'Neill has served in several business, mutual fund and financial management roles and directorship positions throughout his career. Mr. O'Neill serves as Director, Medicines for Humanity and Director, The Golisano Children's Museum of Naples, Florida. Mr. O'Neill previously served as Chief Executive Officer and President, Managing Director and Chief Investment Officer, Fleet Investment Advisors; President and Chief Executive Officer, Aeltus Investment Management, Inc.; General Partner, Hellman, Jordan Management Co., Boston, MA; Chief Investment Officer, The Putnam Companies, Boston, MA; Credit Analyst and Lending Officer, Fleet Bank; Director and Consultant, EZE Castle Software (investment order management software); and Director, Midway Pacific (lumber). |
P. Jerome Richey
Birth Date: February 23, 1949
Trustee
Indefinite Term
Began serving: October 2013 | Principal Occupations: Director or Trustee of the Federated Fund Family; Management Consultant; formerly, Senior Vice Chancellor and Chief Legal Officer, University of Pittsburgh and Executive Vice President and Chief Legal Officer, CONSOL Energy Inc.
Other Directorships Held: None.
Qualifications: Mr. Richey has served in several business and legal management roles and directorship positions throughout his career. Mr. Richey most recently held the positions of Senior Vice Chancellor and Chief Legal Officer, University of Pittsburgh. Mr. Richey previously served as Chairman of the Board, Epilepsy Foundation of Western Pennsylvania and Chairman of the Board, World Affairs Council of Pittsburgh. Mr. Richey previously served as Chief Legal Officer and Executive Vice President, CONSOL Energy Inc.; and Board Member, Ethics Counsel and Shareholder, Buchanan Ingersoll & Rooney PC (a law firm). |
Annual Shareholder Report
Name
Birth Date
Positions Held with Trust
Date Service Began | Principal Occupation(s) for Past Five Years,
Other Directorships Held, Previous Position(s) and Qualifications |
John S. Walsh
Birth Date: November 28, 1957
Trustee
Indefinite Term
Began serving: January 1999 | Principal Occupations: Director or Trustee of the Federated Fund Family; President and Director, Heat Wagon, Inc. (manufacturer of construction temporary heaters); President and Director, Manufacturers Products, Inc. (distributor of portable construction heaters); President, Portable Heater Parts, a division of Manufacturers Products, Inc.
Other Directorships Held: None.
Qualifications: Mr. Walsh has served in several business management roles and directorship positions throughout his career. Mr. Walsh previously served as Vice President, Walsh & Kelly, Inc. (paving contractors). |
OFFICERS
Name
Birth Date
Address
Positions Held with Trust
Date Service Began | Principal Occupation(s) for Past Five Years
and Previous Position(s) |
Lori A. Hensler
Birth Date: January 6, 1967
TREASURER
Officer since: April 2013 | Principal Occupations: Principal Financial Officer and Treasurer of the Federated Fund Family; Senior Vice President, Federated Administrative Services; Financial and Operations Principal for Federated Securities Corp. and Edgewood Services, Inc.; and Assistant Treasurer, Federated Investors Trust Company. Ms. Hensler has received the Certified Public Accountant designation.
Previous Positions: Controller of Federated Investors, Inc.; Senior Vice President and Assistant Treasurer, Federated Investors Management Company; Treasurer, Federated Investors Trust Company; Assistant Treasurer, Federated Administrative Services, Federated Administrative Services, Inc., Federated Securities Corp., Edgewood Services, Inc., Federated Advisory Services Company, Federated Equity Management Company of Pennsylvania, Federated Global Investment Management Corp., Federated Investment Counseling, Federated Investment Management Company, Passport Research, Ltd., and Federated MDTA, LLC; Financial and Operations Principal for Federated Securities Corp., Edgewood Services, Inc. and Southpointe Distribution Services, Inc. |
Richard B. Fisher
Birth Date: May 17, 1923
VICE PRESIDENT
Officer since: April 1987 | Principal Occupations: Vice Chairman or Vice President of some of the Funds in the Federated Fund Family; Vice Chairman, Federated Investors, Inc.; Chairman, Federated Securities Corp.
Previous Positions: President and Director or Trustee of some of the Funds in the Federated Fund Family; Executive Vice President, Federated Investors, Inc.; Director and Chief Executive Officer, Federated Securities Corp. |
Annual Shareholder Report
Name
Birth Date
Address
Positions Held with Trust
Date Service Began | Principal Occupation(s) for Past Five Years
and Previous Position(s) |
Peter J. Germain
Birth Date: September 3, 1959
CHIEF LEGAL OFFICER, SECRETARY and EXECUTIVE VICE PRESIDENT
Officer since: January 2005 | Principal Occupations: Mr. Germain is Chief Legal Officer, Secretary and Executive Vice President of the Federated Fund Family. He is General Counsel, Chief Legal Officer, Secretary and Executive Vice President, Federated Investors, Inc.; Trustee and Senior Vice President, Federated Investors Management Company; Trustee and President, Federated Administrative Services; Director and President, Federated Administrative Services, Inc.; Director and Vice President, Federated Securities Corp.; Director and Secretary, Federated Private Asset Management, Inc.; Secretary, Federated Shareholder Services Company; and Secretary, Retirement Plan Service Company of America. Mr. Germain joined Federated in 1984 and is a member of the Pennsylvania Bar Association.
Previous Positions: Deputy General Counsel, Special Counsel, Managing Director of Mutual Fund Services, Federated Investors, Inc.; Senior Vice President, Federated Services Company; and Senior Corporate Counsel, Federated Investors, Inc. |
Stephen Van Meter
Birth Date: June 5, 1975
CHIEF COMPLIANCE OFFICER AND SENIOR VICE PRESIDENT
Officer since: July 2015 | Principal Occupations: Senior Vice President and Chief Compliance Officer of the Federated Fund Family; Vice President and Chief Compliance Officer of Federated Investors, Inc. and Chief Compliance Officer of certain of its subsidiaries. Mr. Van Meter joined Federated in October 2011. He holds FINRA licenses under Series 3, 7, 24 and 66.
Previous Positions: Mr. Van Meter previously held the position of Compliance Operating Officer, Federated Investors, Inc. Prior to joining Federated, Mr. Van Meter served at the United States Securities and Exchange Commission in the positions of Senior Counsel, Office of Chief Counsel, Division of Investment Management and Senior Counsel, Division of Enforcement. |
Stephen F. Auth
Birth Date: September 13, 1956
101 Park Avenue
41st Floor
New York, NY 10178
CHIEF INVESTMENT OFFICER
Officer since: November 2002 | Principal Occupations: Stephen F. Auth is Chief Investment Officer of various Funds in the Federated Fund Family; Executive Vice President, Federated Investment Counseling, Federated Global Investment Management Corp. and Federated Equity Management Company of Pennsylvania.
Previous Positions: Executive Vice President, Federated Investment Management Company and Passport Research, Ltd. (investment advisory subsidiary of Federated); Senior Vice President, Global Portfolio Management Services Division; Senior Vice President, Federated Investment Management Company and Passport Research, Ltd.; Senior Managing Director and Portfolio Manager, Prudential Investments. |
Annual Shareholder Report
Evaluation and Approval of Advisory Contract–May 2017
Federated Absolute Return Fund (the “Fund”)
Following a review and recommendation of approval by the Fund's independent trustees, the Fund's Board of Trustees (the “Board”) reviewed and unanimously approved the continuation of the Fund's investment advisory and subadvisory contracts for an additional one-year term at its May 2017 meetings. The Board's decision regarding these contracts reflects the exercise of its business judgment after considering all of the information received on whether to continue the existing arrangements.
The Board had previously appointed a Senior Officer, whose duties include specified responsibilities relating to the process by which advisory fees are to be charged to a Federated fund. The Senior Officer has the authority to retain consultants, experts, or staff as may be reasonably necessary to assist in the performance of his duties, reports directly to the Board, and may be terminated only with the approval of a majority of the independent members of the Board. The Senior Officer prepared and furnished to the Board an independent, written evaluation that covered topics discussed below (the “Senior Officer's Evaluation”). The Board considered the Senior Officer's Evaluation, along with other information, in deciding to approve the investment advisory and subadvisory contracts.
The Board also considered judicial decisions concerning allegedly excessive investment advisory fees in its decision. Using these judicial decisions as a guide, the Board has indicated that the following factors may be relevant to an adviser's fiduciary duty with respect to its receipt of compensation from a fund: (1) the nature and quality of the services provided by an adviser to a fund and its shareholders (including the performance of the Fund and of comparable funds); (2) an adviser's cost of providing the services (including the profitability to an adviser of providing advisory services to a fund); (3) the extent to which an adviser may realize “economies of scale” as a fund grows larger and, if such economies of scale exist, whether they have been shared with a fund and its shareholders or the family of funds; (4) any “fall-out financial benefits” that accrue to an adviser because of its relationship with a fund (including research services received from brokers that execute fund trades and any fees paid to affiliates of an adviser for services rendered to a fund); (5) comparative fee and expense structures (including a comparison of fees paid to an adviser with those paid by similar funds); and (6) the extent of care, conscientiousness and independence with which the Fund's board members perform their duties and their expertise (including whether they are fully informed about all facts the Board deems relevant to its consideration of an adviser's services and fees). The Board noted that the Securities and Exchange Commission (“SEC”) disclosure requirements regarding the basis for the Board's approval of the Fund's investment advisory and subadvisory contracts generally align with the factors
Annual Shareholder Report
listed above. Consistent with the judicial decisions and SEC disclosure requirements, the Board also considered management fees charged to institutional and other clients of Federated Equity Management Company of Pennsylvania (the “Adviser”) and subadviser and their advisory affiliates for what might be viewed as like services. The Board was aware of these factors and was guided by them in its review of the Fund's investment advisory and subadvisory contracts to the extent it considered them to be appropriate and relevant, as discussed further below.
The Board considered and weighed these factors in light of its substantial accumulated experience in governing the Fund and working with Federated Investors, Inc. and its affiliates (“Federated”) on matters relating to the Federated funds. The Board was assisted in its deliberations by independent legal counsel. In addition to the extensive materials that comprise and accompany the Senior Officer's Evaluation, the Board received detailed information about the Fund and the Federated organization throughout the year, and in connection with its May meetings. Federated provided much of this information at each regular meeting of the Board, and furnished additional information in connection with the May meetings, at which the Board's formal approval of the investment advisory and subadvisory contracts occurred. At the May meetings, in addition to meeting in separate sessions of the independent trustees without management present, senior management of the Adviser also met with the independent trustees and their counsel to discuss the materials presented and any other matters thought relevant by the Adviser or the trustees. Between regularly scheduled meetings, the Board also received information on matters as the need arose. The Board's consideration of the investment advisory and subadvisory contracts included review of the Senior Officer's Evaluation, accompanying data and additional information covering such matters as: the Adviser's and subadviser's investment philosophy, revenue, profitability, personnel and processes; investment and operating strategies; the Fund's short-term and long-term performance (in absolute terms, both on a gross basis and net of expenses, as well as in terms relative to its particular investment program and certain competitor or “peer group” funds and/or other benchmarks, as appropriate) and comments on the reasons for performance; the Fund's investment objectives; the Fund's expenses, including the advisory fee and the overall expense structure of the Fund (both in absolute terms and relative to similar and/or competing funds), with due regard for contractual or voluntary expense limitations; the use and allocation of brokerage commissions derived from trading the Fund's portfolio securities (if any); and the nature, quality and extent of the advisory and other services provided to the Fund by the Adviser, subadviser and their affiliates. The Board also considered the preferences and expectations of Fund shareholders; the entrepreneurial risk assumed by the Adviser in sponsoring the Fund; the continuing state of competition in the mutual fund industry and market practices; the range of comparable fees for similar funds in the mutual fund industry; the Fund's relationship to the
Annual Shareholder Report
Federated funds which include a comprehensive array of funds with different investment objectives, policies and strategies which are generally available for exchange without the incurrence of additional sales charges; compliance and audit reports concerning the Federated funds and the Federated companies that service them (including communications from regulatory agencies), as well as Federated's responses to any issues raised therein; and relevant developments in the mutual fund industry and how the Federated funds and/or Federated are responding to them. The Board's evaluation process is evolutionary. The criteria considered and the emphasis placed on relevant criteria change in recognition of changing circumstances in the mutual fund marketplace.
While mindful that courts have cautioned against giving such comparisons too much weight, the Board has found the use of comparisons of the Fund's fees and expenses to other mutual funds with comparable investment programs to be relevant to its deliberations. In this regard, the Board was presented with, and considered, information regarding the contractual advisory fee rates, net advisory fee rates, total expense ratios and each element of the Fund's total expense ratio (i.e., gross and net advisory fees, custody fees, portfolio accounting fees and transfer agency fees) relative to the Fund's peers. The Board focused on comparisons with other similar mutual funds more heavily than non-mutual fund products or services because it is believed that they are more relevant. For example, other mutual funds are the products most like the Fund, in that they are readily available to Fund shareholders as alternative investment vehicles. Also, they are the type of investment vehicle, in fact, chosen and maintained by the Fund's investors. The range of their fees and expenses, therefore, appears to be a relevant indicator of what consumers have found to be reasonable in the marketplace in which the Fund competes.
The Board reviewed the contractual advisory fee rate, net advisory fee rate where partially waived and other expenses of the Fund and noted the position of the Fund's fee rates relative to its peers. In this regard, the Board noted that the contractual advisory fee rate was below the median of the relevant peer group and that it was satisfied that the overall expense structure of the Fund remained competitive.
For comparison, the Senior Officer has reviewed Federated's fees for providing advisory services to products outside the Federated funds (e.g., institutional and separate accounts and sub-adviser services). He concluded that mutual funds and institutional accounts are inherently different products. Those differences include, but are not limited to, different types of targeted investors; being subject to different laws and regulations; different legal structures; different average account sizes and portfolio management techniques made necessary by different cash flows and different associated costs; and the time spent by portfolio managers and their teams, funds financial services, legal, compliance and risk management in reviewing securities pricing, addressing different administrative responsibilities, addressing different degrees of risk
Annual Shareholder Report
associated with management and a variety of different costs. The Senior Officer did not consider the fees for providing advisory services to these outside products to be determinative in judging the appropriateness of mutual fund advisory fees.
Following such evaluation, and full deliberations, the Board concluded that the expenses of the Fund are reasonable and supported renewal of the Fund's investment advisory and subadvisory contracts.
The Board considered the nature, extent and quality of the services provided to the Fund by the Adviser and the resources of the Adviser and its affiliates dedicated to the Fund. In this regard, the Board evaluated, among other things, the Adviser's personnel, experience, track record, overall reputation and willingness to invest in personnel and infrastructure that benefit the Fund. In addition, the Board reviewed the qualifications, backgrounds and responsibilities of the portfolio management team primarily responsible for the day-to-day management of the Fund. The Board noted the compliance programs of and the compliance-related resources provided to the Fund by the Adviser. The Fund's ability to deliver competitive performance when compared to its peer group was also deemed to be relevant by the Board as a useful indicator of how the Adviser is executing the Fund's investment program. The Adviser's ability to execute this program was one of the Board's considerations in reaching a conclusion that the nature, extent and quality of the Adviser's investment management services warrant the continuation of the investment advisory and subadvisory contracts.
In evaluating the Fund's investment performance, the Board considered performance results in light of the Fund's investment objective, strategies and risks, as disclosed in the Fund's prospectus. The Board particularly considered detailed investment reports on the Fund's performance that were provided to the Board throughout the year and in connection with the May meetings. The Senior Officer also reviewed information compiled by Federated, using data supplied by independent fund ranking organizations, regarding the performance of, and fees charged by, other mutual funds, noting his view that comparisons to fund peer groups may be helpful, though not conclusive, in judging the reasonableness of the proposed fees. The Board considered, in evaluating such comparisons, that in some cases individual funds may exhibit significant and unique differences in their objectives and management techniques when compared to other funds within an industry peer group.
The Fund's performance fell below the median of the relevant peer group for the one-year, three-year and five-year periods covered by the Senior Officer's evaluation. The Board discussed the Fund's performance with the Adviser and recognized the efforts being taken by the Adviser in the context of other factors considered relevant by the Board.
Following such evaluation, and full deliberations, the Board concluded that the performance of the Fund supported renewal of the Fund's investment advisory and subadvisory contracts.
Annual Shareholder Report
The Board also received financial information about Federated, including information regarding the compensation and ancillary (or “fall-out”) benefits Federated derived from its relationships with the Federated funds. This information covered not only the fees under the investment advisory contracts, but also fees received by Federated's subsidiaries for providing other services to the Federated funds under separate contracts (e.g., for serving as the Federated funds' administrator). The information also detailed any indirect benefit Federated may derive from its receipt of research services from brokers who execute Federated fund trades. In addition, the Board considered the fact that, in order for a fund to be competitive in the marketplace, Federated and its affiliates frequently waived fees and/or reimbursed expenses and have disclosed to Fund investors and/or indicated to the Board their intention to do so in the future. Moreover, the Board receives regular reporting as to the institution, adjustment or elimination of these voluntary waivers.
The Board considered Federated's previous reductions in contractual management fees to certain funds in response to the Senior Officer's recommendations.
Federated furnished information, requested by the Senior Officer, that reported revenues on a fund-by-fund basis and made estimates of the allocation of expenses on a fund-by-fund basis, using allocation methodologies specified by the Senior Officer. The Senior Officer noted that, while these cost allocation reports apply consistent allocation processes, the inherent difficulties in allocating costs continues to cause the Senior Officer to question the precision of the process and to conclude that such reports may be unreliable, since a single change in an allocation estimate may dramatically alter the resulting estimate of cost and/or profitability of a fund and may produce unintended consequences. The allocation information, including the Senior Officer's view that fund-by-fund estimations may be unreliable, was considered in the analysis by the Board.
The Board and the Senior Officer also reviewed information compiled by Federated comparing its profitability information to other publicly held fund management companies. In this regard, the Senior Officer concluded that Federated's profit margins did not appear to be excessive. The Senior Officer also noted that Federated appeared financially sound, with the resources to fulfill its obligations under its contracts with the Fund.
The Senior Officer's Evaluation also discussed the notion of possible realization of “economies of scale” as a fund grows larger. In this regard, the Board considered that the Adviser has made significant and long-term investments in areas that support all of the Federated funds, such as personnel and processes for the portfolio management, shareholder services, compliance, internal audit and risk management functions, as well as systems technology (including technology relating to cybersecurity) and that the benefits of these efforts (as well as any economies of scale, should they exist) were likely to be enjoyed by the fund family as a whole. The Board noted that the Adviser's investments in these areas are extensive. In addition, the Board considered that
Annual Shareholder Report
Federated and its affiliates have frequently waived fees and/or reimbursed expenses and that this has allowed fund shareholders to share potential economies of scale from a fund's inception. Federated, as it does throughout the year, and in connection with the Board's review, furnished information relative to revenue sharing or adviser paid fees. Federated and the Senior Officer noted that this information should be viewed to determine if there was an incentive to either not apply breakpoints, or to apply breakpoints at higher levels. It should not be viewed to determine the appropriateness of advisory fees because it would represent marketing and distribution expenses. Finally, the Board also noted the absence of any applicable regulatory or industry guidelines on this subject, which (as discussed in the Senior Officer's Evaluation) is compounded by the lack of any common industry practice or general pattern with respect to structuring fund advisory fees with “breakpoints” that serve to reduce the fee as a fund attains a certain size.
While the Senior Officer noted certain items for follow-up reporting to the Board and further consideration by management, he stated that his observations and information accompanying the Senior Officer's Evaluation supported a finding by the Board that the management fee for the Fund was reasonable. Under these circumstances, no changes were recommended to, and no objection was raised to the continuation of, the Fund's investment advisory and subadvisory contracts.
In its decision to continue an existing investment advisory contract, the Board was mindful of the potential disruptions of the Fund's operations and various risks, uncertainties and other effects that could occur as a result of a decision to terminate or not renew an investment advisory contract. In particular, the Board recognized that many shareholders have invested in the Fund on the strength of the Adviser's industry standing and reputation and with the expectation that the Adviser will have a continuing role in providing advisory services to the Fund. Thus, the Board's approval of the investment advisory contract reflected the fact that it is the shareholders who have effectively selected the Adviser by virtue of having invested in the Fund. The Board concluded that, in light of the factors discussed above, including the nature, quality and scope of the services provided to the Fund by the Adviser and its affiliates, continuation of the investment advisory contract was appropriate.
The Board based its decision to approve the investment advisory and subadvisory contracts on the totality of the circumstances and relevant factors and with a view to past and future long-term considerations. Not all of the factors and considerations identified above were necessarily relevant to the Fund, nor did the Board consider any one of them to be determinative. With respect to the factors that were relevant, the Board's decision to approve the continuation of the contract reflects its determination that Federated's performance and actions provided a satisfactory basis to support the decision to continue the existing arrangements.
Annual Shareholder Report
Voting Proxies on Fund Portfolio Securities
A description of the policies and procedures that the Fund uses to determine how to vote proxies, if any, relating to securities held in the Fund's portfolio is available, without charge and upon request, by calling 1-800-341-7400. A report on “Form N-PX” of how the Fund voted any such proxies during the most recent 12-month period ended June 30 is available via the Proxy Voting Record (Form N-PX) link associated with the Fund and share class name at www.FederatedInvestors.com/FundInformation. Form N-PX filings are also available at the SEC's website at www.sec.gov.
Quarterly Portfolio Schedule
The Fund files with the SEC a complete schedule of its portfolio holdings, as of the close of the first and third quarters of its fiscal year, on “Form N-Q.” These filings are available on the SEC's website at www.sec.gov and may be reviewed and copied at the SEC's Public Reference Room in Washington, DC. (Call 1-800-SEC-0330 for information on the operation of the Public Reference Room.) You may also access this information via the link to the Fund and share class name at www.FederatedInvestors.com/FundInformation.
Annual Shareholder Report
Mutual funds are not bank deposits or obligations, are not guaranteed by any bank and are not insured or guaranteed by the U.S. government, the Federal Deposit Insurance Corporation, the Federal Reserve Board or any other government agency. Investment in mutual funds involves investment risk, including the possible loss of principal.
This Report is authorized for distribution to prospective investors only when preceded or accompanied by the Fund's Prospectus, which contains facts concerning its objective and policies, management fees, expenses and other information.
Federated Absolute Return Fund
Federated Investors Funds
4000 Ericsson Drive
Warrendale, PA 15086-7561
Contact us at FederatedInvestors.com
or call 1-800-341-7400.
Federated Securities Corp., Distributor
CUSIP 314172743
CUSIP 314172735
CUSIP 314172727
CUSIP 314172453
26852 (12/17)
Federated is a registered trademark of Federated Investors, Inc.
2017 ©Federated Investors, Inc.
Annual Shareholder Report
October 31, 2017
| Share Class | Ticker | A | SVAAX | C | SVACX | Institutional | SVAIX | R6 | SVALX |
Federated Strategic Value Dividend Fund
Fund Established 2005
A Portfolio of Federated Equity Funds
Dear Valued Shareholder,
I am pleased to present the Annual Shareholder Report for your fund covering the period from November 1, 2016 through October 31, 2017. This report includes Management's Discussion of Fund Performance, a complete listing of your fund's holdings, performance information and financial statements along with other important fund information.
In addition, our website, FederatedInvestors.com, offers easy access to Federated resources that include timely fund updates, economic and market insights from our investment strategists, and financial planning tools. We invite you to register to take full advantage of its capabilities.
Thank you for investing with Federated. I hope you find this information useful and look forward to keeping you informed.
Sincerely,
J. Christopher Donahue, President
Not FDIC Insured ■ May Lose Value ■ No Bank Guarantee
CONTENTS
| 1 |
| 7 |
| 8 |
| 12 |
| 16 |
| 18 |
| 19 |
| 20 |
| 31 |
| 32 |
| 34 |
| 35 |
| 41 |
| 48 |
| 48 |
Management's Discussion of Fund Performance (unaudited)
The total return of Federated Strategic Value Dividend Fund (the “Fund”), based on net asset value for the 12-month reporting period ended October 31, 2017 was 12.29% for the Class A Shares, 11.43% for the Class C Shares, 12.51% for the Institutional Shares and 12.53% for the Class R6 shares. The 12.53% total return of the Class R6 Shares for the reporting period consisted of 4.39% in dividend income, 1.97% in capital gains and 6.17% in appreciation of the net asset value of the shares. The total return of the Dow Jones Select Dividend Index (DJSDI),1 a broad-based securities market index that represents the domestic dividend-paying universe, was 16.82% for the reporting period, while the total return of the Standard and Poor's 500 Index (S&P 500)2 was 23.63% for the same period. The Fund's total return for the fiscal year reflects actual cash flows, transaction costs and other expenses which are not reflected in the total return of the DJSDI or the S&P 500.
The following discussion will focus on the performance of the Fund's Class R6 Shares.
MARKET OVERVIEW
The reporting period began just after the election of Donald Trump as the 45th President of the United States. This surprise outcome, combined with Republicans retaining control over both the House and the Senate, sparked a “risk-on” trade as expectations for a business-friendly Washington crystallized and risk tolerance levels increased. As investor exuberance was lifted so were bond yields, with the U.S. 10-year Treasury yield rising as investors piled into more economically sensitive sectors. Financials, Industrials and Materials led the market higher to start the period as analysts upwardly revised forecasts for U.S. GDP and earnings growth for 2017 and beyond, citing a “Trumponomics” agenda of tax cuts and reform, regulatory relief and infrastructure spending. As the S&P 500 was reaching new highs in early 2017, so were international markets, with the UK FTSE Index and the German DAX Index both reaching new peaks on better European economic data and corporate earnings.
The “Trump trade'' did hit some bumps in the spring, though, as the failure of the Republican leadership to enact Obamacare ‘repeal-and-replace' legislation caused markets to take pause amid rising uncertainty around the new administration's pro-growth agenda. Ultimately, the pause was short-lived, lasting just 6 weeks and culminating with a pullback of less than 3% in the S&P 500. From there, the global stock market's steady climb higher into the end of the reporting period was fueled by an increasingly steady flow of encouraging economic news, solid corporate earnings and prospects for potential tax reform hitting the President's desk by early 2018. By late October, the S&P 500, Dow Jones Industrial Average and NASDAQ Composite had all achieved record highs.
Federated Strategic Value Dividend Fund
Annual Shareholder Report
Although international markets saw slightly less political drama than the U.S., foreign shares plotted an advance that was strangely similar to that of their U.S. counterparts. GDP growth in Europe was revised higher, companies continued to report strong earnings, and central banks remained accommodative.
U.S.-based investors in foreign equities also received an added tailwind in the form of a weaker dollar. The U.S. dollar, which had enjoyed a period of sustained strength from 2011 through the end of 2016, finally began to lose some of its luster as economic growth outside the U.S. picked up, concerns over a break-up of the eurozone eased, and the pace of Federal Reserve interest rate hikes became more dovish than originally anticipated. By the end of the reporting period, the British pound had appreciated 11% off of its lows in January 2017, while the euro recovered 12% from its bottom last December.
Over the course of the reporting period, the “risk-on” trade that dominated the year's performance favored lower quality stocks in cyclical sectors, especially those having high betas3 and low dividend yields. In fact, low quality (“C” & “D” rated) stocks in the BofA Merrill Lynch US research coverage universe outperformed the highest quality (“A+” rated) by 13.7%. When quintiling the S&P 500, high-beta notably outperformed low beta by 20.5% and low-yield outperformed high-yield by 19.9%.
DIVIDEND-BASED PERFORMANCE4
The portfolio continues to remain focused on its core goals of providing investors with a stable high and rising income stream from high-quality investments while attempting to expose investors to a lower level of risk, ending the month with a 30 day SEC yield of 3.5% and a gross weighted average dividend yield of 4.4%.5 This eclipsed not only the broad market represented by the S&P 500 with its 2.0% yield, and the 10-year U.S. Treasury Note (2.4%), but it also surpassed the 3.5% yield of the DJSDI, which aims to reflect the domestic high dividend-paying universe. The portfolio experienced robust dividend growth, as 31 of the holdings increased their dividends over the past 12 months, for a total of 35 increases. The most notable increases came courtesy of Abbvie (10.9%), Crown Castle (10.5%), Dominion (10.0%), Paychex (8.7%), Altria (8.2%) and PepsiCo (7.0%). Additionally, National Grid declared a special dividend of .84375 GBP per existing ordinary share or $5.4224 USD per American Depository Share, paid on June 2, 2017.
Federated Strategic Value Dividend Fund
Annual Shareholder Report
Over the reporting period, the strong “risk-on” trade was a notable headwind to the high-quality defensive dividend strategy. Albeit, on an absolute basis, the Fund still posted positive returns across every sector. The most prominent contributor was Health Care, posting a 25% return during the reporting period. This was driven by superior performance from Abbvie, AstraZeneca, and Sanofi which posted returns of 68%, 25% and 25%, respectively. Additionally, Utilities added notably to performance during the reporting period posting a 10% return due to strong performance from Duke Energy, PPL and Dominion which posted returns of 15%, 14%, and 12%, respectively. Enhancing performance further, Consumer Discretionary, Energy and Consumer Staples posted noteworthy returns of 52%, 10% and 7%, respectively, during the reporting period. This outperformance was led by top performers in these sectors such as McDonalds (41%), BP (23%), Chevron (15%), Phillip Morris (13%) and Coca Cola (12%). Lastly, REIT holding Crown Castle was additive to Fund performance, posting a 22% return during the reporting period.
From a geographic standpoint, the portfolio's international holdings6 contributed positively to performance, as they posted a collective return of 13.6% during the reporting period. This was driven by the portfolio's French and British holdings which returned 29% and 10%, respectively, during the reporting period. The international investments were further enhanced by currency impact, as the continued weakening of the U.S. dollar relative to foreign currencies was a tailwind for the portfolio.
Contrarily, while no sectors within the Fund posted negative total returns, weakness was noted in some individual investments during the reporting period including General Mills (-13%), Occidental Petroleum (-7%) and GlaxoSmithKline (-4%). General Mills endured pricing pressure from disappointing earnings in their cereal and yogurt business. GlaxoSmithKline experienced short-term pricing pressure after its strong 3Q earnings were overshadowed by a tempered outlook as they guided towards lower margins for 2018. Occidental Petroleum posted a negative return due in part to lower oil prices early in the reporting period.
Federated Strategic Value Dividend Fund
Annual Shareholder Report
Due to its focus on high dividend income and growth in that income over time, the strategy will tend to perform best when the markets prefer high-yield, high-quality, low-beta, large-cap stocks. Often times, the strategy may also outperform in flat markets or periods of market distress. Conversely, the Fund may lag the broad market when investors prefer low-yield, low-quality, high-beta, small-cap stocks. Over the reporting period, the Fund faced a significant headwind with lowest-yielding, high-beta stocks outperforming high-yielding, low-beta investments. However, the Fund still achieved its absolute return target while maintaining a portfolio of high-quality assets and exposing its investors to a notably lower level of risk as evidenced by its low beta of 0.61 during the reporting period.7 Regardless of the market environment, the Fund remained consistent and focused on its core goals of providing a stable high and rising income stream from high-quality investments, while attempting to expose investors to a lower level of risk.
| 1 | Please see the footnotes to the line graphs below for definitions of, and further information about, the DJSDI. |
| 2 | Please see the footnotes to the line graphs below for definitions of, and further information about, the S&P 500. |
| 3 | Beta measures a security/fund's volatility relative to the market. A beta greater than 1.00 suggests the security/fund has historically been more volatile than the market as measured by the fund's benchmark. A beta less than 1.00 suggests the security/fund has historically had less volatility relative to the market. |
| 4 | There are no guarantees that dividend paying stocks will continue to pay dividends. In addition, dividend-paying stocks may not experience the same capital appreciation potential as non-dividend-paying stocks. |
| 5 | In the absence of temporary expense waivers and reimbursements, the 30-day SEC yield for Institutional Shares would have been 3.55%. The dividend yield represents the average yield of the underlying securities within the Fund. The average yield is a weighted average calculated by assigning a weight to each of the underlying securities in the Fund based upon the portion of total assets of the Fund each underlying security represents. |
| 6 | International investing involves special risks including currency risk, increased volatility, political risks, and differences in auditing and other financial standards. |
| 7 | Factset 3-year beta versus the S&P 500 calculated using monthly returns. |
Federated Strategic Value Dividend Fund
Annual Shareholder Report
FUND PERFORMANCE AND GROWTH OF A $10,000 INVESTMENT
The graph below illustrates the hypothetical investment of $10,0001 in the Federated Strategic Value Dividend Fund from October 31, 2007 to October 31, 2017, compared to the Standard & Poor's 500 Index (S&P 500)2 and the Dow Jones U.S. Select Dividend Index (DJSDI).3 The Average Annual Total Return table below shows returns for each class averaged over the stated periods.
Growth of a $10,000 InvestmenT
Growth of $10,000 as of October 31, 2017
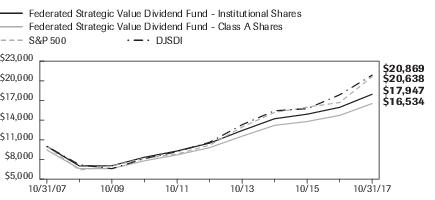
| Federated Strategic Value Dividend Fund - | Institutional Shares | Class A Shares | S&P 500 | DJSDI |
| F | F | I | I |
| 10/31/2007 | 10,000 | 9,450 | 10,000 | 10,000 |
| 10/31/2008 | 7,008 | 6,603 | 6,390 | 7,200 |
| 10/31/2009 | 7,046 | 6,624 | 7,017 | 6,599 |
| 10/31/2010 | 8,338 | 7,805 | 8,176 | 8,138 |
| 10/31/2011 | 9,296 | 8,702 | 8,837 | 9,191 |
| 10/31/2012 | 10,492 | 9,801 | 10,181 | 10,619 |
| 10/31/2013 | 12,412 | 11,551 | 12,948 | 13,301 |
| 10/31/2014 | 14,215 | 13,202 | 15,184 | 15,428 |
| 10/31/2015 | 14,907 | 13,791 | 15,973 | 15,741 |
| 10/31/2016 | 15,952 | 14,724 | 16,693 | 17,864 |
| 10/31/2017 | 17,947 | 16,534 | 20,638 | 20,869 |
41 graphic description end -->
| ■ | Total returns shown for Class A Shares include the maximum sales charge of 5.50% ($10,000 investment minus $550 sales charge = $9,450). |
The Fund offers multiple share classes whose performance may be greater than or less than its other share class(es) due to differences in sales charges and expenses. See the Average Annual Return table below for the returns of additional classes not shown in the line graph above.
Federated Strategic Value Dividend Fund
Annual Shareholder Report
Average Annual Total Returns for the Period Ended 10/31/2017
(returns reflect all applicable sales charges and contingent sales charges as specified below in footnote #1)
| | 1 Year | 5 Years | 10 Years |
| Class A Shares | 6.07% | 9.76% | 5.16% |
| Class C Shares | 10.43% | 10.23% | 4.97% |
| Institutional Shares | 12.51% | 11.33% | 6.02% |
| Class R6 Shares4 | 12.53% | 11.25% | 5.89% |
| S&P 500 | 23.63% | 15.18% | 7.51% |
| DJSDI | 16.82% | 14.47% | 7.63% |
Performance data quoted represents past performance which is no guarantee of future results. Investment return and principal value will fluctuate so that an investor's shares, when redeemed, may be worth more or less than their original cost. Mutual fund performance changes over time and current performance may be lower or higher than what is stated. For current to the most recent month-end performance and after-tax returns, visit FederatedInvestors.com or call 1-800-341-7400. Returns shown do not reflect the deduction of taxes that a shareholder would pay on Fund distributions or the redemption of Fund shares. Mutual funds are not obligations of or guaranteed by any bank and are not federally insured.
| 1 | Represents a hypothetical investment of $10,000 in the Fund after deducting applicable sales charges: For Class A Shares, the maximum sales charge of 5.50% ($10,000 investment minus $550 sales charge = $9,450); for Class C Shares, a 1.00% contingent deferred sales charge would be applied on any redemption less than one year from the purchase date. The Fund's performance assumes the reinvestment of all dividends and distributions. The S&P 500 and DJSDI have been adjusted to reflect reinvestment of dividends on securities in the indexes. |
| 2 | The S&P 500 is a capitalization-weighted index of 500 stocks designed to measure performance of the broad domestic economy through changes in the aggregate market value of 500 stocks representing all major industries. The S&P 500 is not adjusted to reflect sales loads, expenses or other fees that the Securities and Exchange Commission (SEC) requires to be reflected in the Fund's performance. The index is unmanaged and, unlike the Fund, is not affected by cash flows. It is not possible to invest in an index. |
| 3 | The DJSDI aims to represent U.S. leading stocks by dividend yield. One hundred stocks are selected to the index by dividend yield, subject to screens for dividend-per-share growth rate, dividend payout ratio and average daily dollar trading volume. Components are weighted by indicated annual dividend. The DJSDI is not adjusted to reflect sales loads, expenses or other fees that the SEC requires to be reflected in the Fund's performance. The index is unmanaged and, unlike the Fund, is not affected by cash flows. It is not possible to invest in an index. |
| 4 | The Fund's R6 Shares commenced operations on June 29, 2016. For the period prior to the commencement of operations of the R6 Shares, the performance information shown is for Institutional Shares adjusted to remove any voluntary waiver of fund expenses related to the Institutional Shares that occurred during the period prior to commencement of the R6 Shares. |
Federated Strategic Value Dividend Fund
Annual Shareholder Report
Portfolio of Investments Summary Table (unaudited)
At October 31, 2017, the Fund's sector composition1 was as follows:
| Sector Composition | Percentage of
Total Net Assets |
| Consumer Staples | 20.1% |
| Telecommunication Services | 18.7% |
| Utilities | 18.3% |
| Energy | 14.6% |
| Health Care | 12.3% |
| Real Estate | 8.8% |
| Financials | 2.8% |
| Industrials | 1.4% |
| Consumer Discretionary | 0.7% |
| Information Technology | 0.7% |
| Cash Equivalents2 | 1.6% |
| Other Assets and Liabilities—Net3 | 0.0% |
| TOTAL | 100.0% |
| 1 | Except for Cash Equivalents and Other Assets and Liabilities, sector classifications are based upon, and individual portfolio securities are assigned to, the classifications of the Global Industry Classification Standard (GICS) except that the Adviser assigns a classification to securities not classified by the GICS and to securities for which the Adviser does not have access to the classification made by the GICS. |
| 2 | Cash Equivalents include any investments in money market mutual funds and/or overnight repurchase agreements. |
| 3 | Assets, other than investments in securities, less liabilities. See Statement of Assets and Liabilities. |
Federated Strategic Value Dividend Fund
Annual Shareholder Report
Portfolio of Investments
October 31, 2017
| Shares | | | Value |
| | | COMMON STOCKS—98.4% | |
| | | Consumer Discretionary—0.7% | |
| 1,585,950 | | Target Corp. | $93,634,488 |
| | | Consumer Staples—20.1% | |
| 10,142,641 | | Altria Group, Inc. | 651,360,405 |
| 3,433,960 | | General Mills, Inc. | 178,291,203 |
| 3,948,275 | | Imperial Brands PLC | 161,069,543 |
| 1,872,600 | | Kimberly-Clark Corp. | 210,686,226 |
| 675,700 | | PepsiCo, Inc. | 74,482,411 |
| 5,828,853 | | Philip Morris International, Inc. | 609,931,178 |
| 3,464,355 | | Procter & Gamble Co. | 299,112,411 |
| 13,462,625 | | The Coca-Cola Co. | 619,011,497 |
| | | TOTAL | 2,803,944,874 |
| | | Energy—14.6% | |
| 53,519,925 | | BP PLC | 362,772,680 |
| 3,874,474 | | Chevron Corp. | 449,012,792 |
| 5,990,975 | | Exxon Mobil Corp. | 499,347,766 |
| 6,008,465 | | Occidental Petroleum Corp. | 387,966,585 |
| 5,937,775 | | Total S.A. | 331,195,994 |
| | | TOTAL | 2,030,295,817 |
| | | Financials—2.8% | |
| 1,573,875 | | Canadian Imperial Bank of Commerce | 138,539,063 |
| 1,164,344 | | Muenchener Rueckversicherungs-Gesellschaft AG | 260,474,896 |
| | | TOTAL | 399,013,959 |
| | | Health Care—12.3% | |
| 4,092,375 | | AbbVie, Inc. | 369,336,844 |
| 5,721,150 | | AstraZeneca PLC | 387,689,268 |
| 20,982,123 | | GlaxoSmithKline PLC | 376,960,851 |
| 5,383,085 | | Merck & Co., Inc. | 296,554,153 |
| 3,000,412 | | Sanofi | 284,249,788 |
| | | TOTAL | 1,714,790,904 |
| | | Industrials—1.4% | |
| 1,651,100 | | United Parcel Service, Inc. | 194,053,783 |
| | | Information Technology—0.7% | |
| 1,561,825 | | Paychex, Inc. | 99,628,817 |
| | | Real Estate—8.8% | |
| 5,179,100 | | Crown Castle International Corp. | 554,578,028 |
Federated Strategic Value Dividend Fund
Annual Shareholder Report
| Shares | | | Value |
| | | COMMON STOCKS—continued | |
| | | Real Estate—continued | |
| 1,215,000 | | Digital Realty Trust, Inc. | $143,904,600 |
| 2,225,500 | | National Retail Properties, Inc. | 89,420,590 |
| 2,482,014 | | Omega Healthcare Investors | 71,630,924 |
| 574,825 | | Public Storage, Inc. | 119,132,481 |
| 3,894,319 | | Ventas, Inc. | 244,368,517 |
| | | TOTAL | 1,223,035,140 |
| | | Telecommunication Services—18.7% | |
| 18,334,959 | | AT&T, Inc. | 616,971,370 |
| 13,306,185 | | BCE, Inc. | 614,409,302 |
| 14,841,266 | | Verizon Communications, Inc. | 710,451,404 |
| 231,509,989 | | Vodafone Group PLC | 662,367,252 |
| | | TOTAL | 2,604,199,328 |
| | | Utilities—18.3% | |
| 1,324,990 | | American Electric Power Co., Inc. | 98,592,506 |
| 1,193,075 | | Consolidated Edison Co. | 102,664,104 |
| 5,972,695 | | Dominion Energy, Inc. | 484,624,472 |
| 6,768,259 | | Duke Energy Corp. | 597,704,952 |
| 35,578,509 | | National Grid- SP PLC | 428,162,101 |
| 10,626,905 | | PPL Corp. | 399,146,552 |
| 4,206,025 | | Public Service Enterprises Group, Inc. | 206,936,430 |
| 4,444,668 | | Southern Co. | 232,011,670 |
| | | TOTAL | 2,549,842,787 |
| | | TOTAL COMMON STOCKS
(IDENTIFIED COST $12,062,198,076) | 13,712,439,897 |
| | | INVESTMENT COMPANY—1.6% | |
| 216,486,806 | 1 | Federated Institutional Prime Value Obligations Fund, Institutional Shares, 1.21%2
(IDENTIFIED COST $216,498,037) | 216,508,455 |
| | | TOTAL INVESTMENT IN SECURITIES-100.0%
(IDENTIFIED COST $12,278,696,113)3 | 13,928,948,352 |
| | | OTHER ASSETS AND LIABILITIES—NET—0.0%4 | 4,557,186 |
| | | TOTAL NET ASSETS—100% | $13,933,505,538 |
Federated Strategic Value Dividend Fund
Annual Shareholder Report
Affiliated holdings are investment companies which are managed by the Adviser or an affiliate of the Adviser. Transactions involving the affiliated holding during the year ended October 31, 2017, were as follows:
| | Federated
Institutional
Prime Value
Obligations Fund,
Institutional Shares |
| Balance of Shares Held 10/31/2016 | 215,565,666 |
| Purchases/Additions | 2,462,056,093 |
| Sales/Reductions | (2,461,134,953) |
| Balance of Shares Held 10/31/2017 | 216,486,806 |
| Value | $216,508,455 |
| Change in Unrealized Appreciation/Depreciation | $10,418 |
| Net Realized Gain/(Loss) | $(21,446) |
| Dividend Income | $2,044,605 |
| 2 | 7-day net yield. |
| 3 | The cost of investments for federal tax purposes amounts to $12,282,056,577. |
| 4 | Assets, other than investments in securities, less liabilities. See Statement of Assets and Liabilities. |
Note: The categories of investments are shown as a percentage of total net assets at October 31, 2017.
Various inputs are used in determining the value of the Fund's investments. These inputs are summarized in the three broad levels listed below:
Level 1—quoted prices in active markets for identical securities.
Level 2—other significant observable inputs (including quoted prices for similar securities, interest rates, prepayment speeds, credit risk, etc.). Also includes securities valued at amortized cost.
Level 3—significant unobservable inputs (including the Fund's own assumptions in determining the fair value of investments).
The inputs or methodology used for valuing securities are not an indication of the risk associated with investing in those securities.
Federated Strategic Value Dividend Fund
Annual Shareholder Report
The following is a summary of the inputs used, as of October 31, 2017, in valuing the Fund's assets carried at fair value:
| Valuation Inputs | | | | |
| | Level 1—
Quoted
Prices | Level 2—
Other
Significant
Observable
Inputs | Level 3—
Significant
Unobservable
Inputs | Total |
| Equity Securities: | | | | |
| Common Stocks | | | | |
| Domestic | $9,704,549,159 | $— | $— | $9,704,549,159 |
| International | 614,409,302 | 3,393,481,436 | — | 4,007,890,738 |
| Debt Securities: | | | | |
| Investment Company | 216,508,455 | — | — | 216,508,455 |
| TOTAL SECURITIES | $10,535,466,916 | $3,393,481,436 | $— | $13,928,948,352 |
See Notes which are an integral part of the Financial Statements
Federated Strategic Value Dividend Fund
Annual Shareholder Report
Financial Highlights–Class A Shares
(For a Share Outstanding Throughout Each Period)
| Year Ended October 31 | 2017 | 2016 | 2015 | 2014 | 2013 |
| Net Asset Value, Beginning of Period | $5.97 | $6.06 | $6.25 | $5.78 | $5.08 |
| Income From Investment Operations: | | | | | |
| Net investment income | 0.21 | 0.18 | 0.18 | 0.30 | 0.18 |
| Net realized and unrealized gain on investments and foreign currency transactions | 0.50 | 0.20 | 0.08 | 0.50 | 0.70 |
| TOTAL FROM INVESTMENT OPERATIONS | 0.71 | 0.38 | 0.26 | 0.80 | 0.88 |
| Less Distributions: | | | | | |
| Distributions from net investment income | (0.21) | (0.18) | (0.18) | (0.30) | (0.18) |
| Distributions from net realized gain on investments and foreign currency transactions | (0.13) | (0.29) | (0.27) | (0.03) | (0.00)1 |
| TOTAL DISTRIBUTIONS | (0.34) | (0.47) | (0.45) | (0.33) | (0.18) |
| Net Asset Value, End of Period | $6.34 | $5.97 | $6.06 | $6.25 | $5.78 |
| Total Return2 | 12.29% | 6.77% | 4.45% | 14.30% | 17.85% |
| Ratios to Average Net Assets: | | | | | |
| Net expenses | 1.06% | 1.05% | 1.05% | 1.05% | 1.05% |
| Net investment income | 3.36% | 3.00% | 3.07% | 5.06% | 3.46% |
| Expense waiver/reimbursement3 | 0.13% | 0.14% | 0.13% | 0.13% | 0.14% |
| Supplemental Data: | | | | | |
| Net assets, end of period (000 omitted) | $2,400,842 | $3,300,976 | $2,358,470 | $2,277,514 | $1,944,577 |
| Portfolio turnover | 19% | 21% | 16% | 17% | 25% |
| 1 | Represents less than $0.01. |
| 2 | Based on net asset value, which does not reflect the sales charge, redemption fee or contingent deferred sales charge, if applicable. |
| 3 | This expense decrease is reflected in both the net expense and the net investment income ratios shown above. |
See Notes which are an integral part of the Financial Statements
Annual Shareholder Report
Financial Highlights–Class C Shares
(For a Share Outstanding Throughout Each Period)
| Year Ended October 31 | 2017 | 2016 | 2015 | 2014 | 2013 |
| Net Asset Value, Beginning of Period | $5.98 | $6.07 | $6.26 | $5.79 | $5.08 |
| Income From Investment Operations: | | | | | |
| Net investment income | 0.16 | 0.13 | 0.14 | 0.26 | 0.15 |
| Net realized and unrealized gain on investments and foreign currency transactions | 0.50 | 0.20 | 0.08 | 0.50 | 0.71 |
| TOTAL FROM INVESTMENT OPERATIONS | 0.66 | 0.33 | 0.22 | 0.76 | 0.86 |
| Less Distributions: | | | | | |
| Distributions from net investment income | (0.16) | (0.13) | (0.14) | (0.26) | (0.15) |
| Distributions from net realized gain on investments and foreign currency transactions | (0.13) | (0.29) | (0.27) | (0.03) | (0.00)1 |
| TOTAL DISTRIBUTIONS | (0.29) | (0.42) | (0.41) | (0.29) | (0.15) |
| Net Asset Value, End of Period | $6.35 | $5.98 | $6.07 | $6.26 | $5.79 |
| Total Return2 | 11.43% | 5.97% | 3.68% | 13.44% | 17.18% |
| Ratios to Average Net Assets: | | | | | |
| Net expenses | 1.81% | 1.80% | 1.80% | 1.80% | 1.80% |
| Net investment income | 2.65% | 2.25% | 2.31% | 4.27% | 2.69% |
| Expense waiver/reimbursement3 | 0.12% | 0.13% | 0.13% | 0.13% | 0.14% |
| Supplemental Data: | | | | | |
| Net assets, end of period (000 omitted) | $1,997,389 | $2,210,580 | $1,592,942 | $1,361,583 | $1,021,307 |
| Portfolio turnover | 19% | 21% | 16% | 17% | 25% |
| 1 | Represents less than $0.01. |
| 2 | Based on net asset value, which does not reflect the sales charge, redemption fee or contingent deferred sales charge, if applicable. |
| 3 | This expense decrease is reflected in both the net expense and the net investment income ratios shown above. |
See Notes which are an integral part of the Financial Statements
Annual Shareholder Report
Financial Highlights–Institutional Shares
(For a Share Outstanding Throughout Each Period)
| Year Ended October 31 | 2017 | 2016 | 2015 | 2014 | 2013 |
| Net Asset Value, Beginning of Period | $6.00 | $6.09 | $6.27 | $5.80 | $5.09 |
| Income From Investment Operations: | | | | | |
| Net investment income | 0.23 | 0.19 | 0.20 | 0.32 | 0.20 |
| Net realized and unrealized gain on investments and foreign currency transactions | 0.50 | 0.20 | 0.09 | 0.50 | 0.71 |
| TOTAL FROM INVESTMENT OPERATIONS | 0.73 | 0.39 | 0.29 | 0.82 | 0.91 |
| Less Distributions: | | | | | |
| Distributions from net investment income | (0.23) | (0.19) | (0.20) | (0.32) | (0.20) |
| Distributions from net realized gain on investments and foreign currency transactions | (0.13) | (0.29) | (0.27) | (0.03) | (0.00)1 |
| TOTAL DISTRIBUTIONS | (0.36) | (0.48) | (0.47) | (0.35) | (0.20) |
| Net Asset Value, End of Period | $6.37 | $6.00 | $6.09 | $6.27 | $5.80 |
| Total Return2 | 12.51% | 7.01% | 4.87% | 14.53% | 18.30% |
| Ratios to Average Net Assets: | | | | | |
| Net expenses | 0.81% | 0.80% | 0.80% | 0.80% | 0.80% |
| Net investment income | 3.64% | 3.23% | 3.31% | 5.29% | 3.73% |
| Expense waiver/reimbursement3 | 0.13% | 0.13% | 0.13% | 0.13% | 0.14% |
| Supplemental Data: | | | | | |
| Net assets, end of period (000 omitted) | $9,293,143 | $9,154,739 | $5,961,135 | $5,750,788 | $4,902,127 |
| Portfolio turnover | 19% | 21% | 16% | 17% | 25% |
| 1 | Represents less than $0.01. |
| 2 | Based on net asset value. |
| 3 | This expense decrease is reflected in both the net expense and the net investment income ratios shown above. |
See Notes which are an integral part of the Financial Statements
Annual Shareholder Report
Financial Highlights–Class R6 Shares
(For a Share Outstanding Throughout Each Period)
| | Year Ended
10/31/2017 | Period
Ended
10/31/20161 |
| Net Asset Value, Beginning of Period | $6.00 | $6.23 |
| Income From Investment Operations: | | |
| Net investment income | 0.23 | 0.06 |
| Net realized and unrealized gain (loss) on investments and foreign currency transactions | 0.50 | (0.22) |
| TOTAL FROM INVESTMENT OPERATIONS | 0.73 | (0.16) |
| Less Distributions: | | |
| Distributions from net investment income | (0.23) | (0.07) |
| Distributions from net realized gain on investments and foreign currency transactions | (0.13) | — |
| TOTAL DISTRIBUTIONS | (0.36) | (0.07) |
| Net Asset Value, End of Period | $6.37 | $6.00 |
| Total Return2 | 12.53% | (2.61)% |
| Ratios to Average Net Assets: | | |
| Net expenses | 0.79% | 0.78%3 |
| Net investment income | 3.73% | 1.43%3 |
| Expense waiver/reimbursement4 | 0.07% | 0.11%3 |
| Supplemental Data: | | |
| Net assets, end of period (000 omitted) | $242,131 | $19,279 |
| Portfolio turnover | 19% | 21%5 |
| 1 | Reflects operations for the period from June 29, 2016 (commencement of operations) to October 31, 2016. |
| 2 | Based on net asset value. |
| 3 | Computed on an annualized basis. |
| 4 | This expense decrease is reflected in both the net expense and the net investment income ratios shown above. |
| 5 | Portfolio turnover is calculated at the Fund level. Percentage indicated was calculated for the year ended October 31, 2016. |
See Notes which are an integral part of the Financial Statements
Annual Shareholder Report
Statement of Assets and Liabilities
October 31, 2017
| Assets: | | |
| Investment in securities, at value including $216,508,455 of investment in an affiliated holding (identified cost $12,278,696,113) | | $13,928,948,352 |
| Cash | | 4,343,382 |
| Cash denominated in foreign currencies (identified cost $6,929) | | 6,969 |
| Income receivable | | 32,287,923 |
| Receivable for investments sold | | 28,080,504 |
| Receivable for shares sold | | 15,293,242 |
| TOTAL ASSETS | | 14,008,960,372 |
| Liabilities: | | |
| Payable for investments purchased | $38,229,672 | |
| Payable for shares redeemed | 31,299,892 | |
| Income distribution payable | 23 | |
| Payable to adviser (Note 5) | 261,016 | |
| Payable for administrative fees (Note 5) | 30,613 | |
| Payable for distribution services fee (Note 5) | 1,299,605 | |
| Payable for other service fees (Notes 2 and 5) | 1,876,723 | |
| Accrued expenses (Note 5) | 2,457,290 | |
| TOTAL LIABILITIES | | 75,454,834 |
| Net assets for 2,191,195,874 shares outstanding | | $13,933,505,538 |
| Net Assets Consist of: | | |
| Paid-in capital | | $11,380,359,165 |
| Net unrealized appreciation of investments and translation of assets and liabilities in foreign currency | | 1,650,340,310 |
| Accumulated net realized gain on investments and foreign currency transactions | | 880,738,278 |
| Undistributed net investment income | | 22,067,785 |
| TOTAL NET ASSETS | | $13,933,505,538 |
Annual Shareholder Report
Statement of Assets and Liabilities–continued
| Net Asset Value, Offering Price and Redemption Proceeds Per Share | | |
| Class A Shares: | | |
| Net asset value per share ($2,400,842,358 ÷ 378,882,338 shares outstanding), no par value, unlimited shares authorized | | $6.34 |
| Offering price per share (100/94.50 of $6.34) | | $6.71 |
| Redemption proceeds per share | | $6.34 |
| Class C Shares: | | |
| Net asset value per share ($1,997,389,307 ÷ 314,712,637 shares outstanding), no par value, unlimited shares authorized | | $6.35 |
| Offering price per share | | $6.35 |
| Redemption proceeds per share (99.00/100 of $6.35) | | $6.29 |
| Institutional Shares: | | |
| Net asset value per share ($9,293,143,106 ÷ 1,459,585,757 shares outstanding), no par value, unlimited shares authorized | | $6.37 |
| Offering price per share | | $6.37 |
| Redemption proceeds per share | | $6.37 |
| Class R6 Shares: | | |
| Net asset value per share ($242,130,767 ÷ 38,015,142 shares outstanding), no par value, unlimited shares authorized | | $6.37 |
| Offering price per share | | $6.37 |
| Redemption proceeds per share | | $6.37 |
See Notes which are an integral part of the Financial Statements
Annual Shareholder Report
Statement of Operations
Year Ended October 31, 2017
| Investment Income: | | | |
| Dividends (including $2,044,605 received from an affiliated holding and net of foreign taxes withheld of $13,365,396) | | | $630,240,327 |
| Expenses: | | | |
| Investment adviser fee (Note 5) | | $106,433,998 | |
| Administrative fee (Note 5) | | 11,188,942 | |
| Custodian fees | | 927,974 | |
| Transfer agent fee (Note 2) | | 12,006,194 | |
| Directors'/Trustees' fees (Note 5) | | 122,764 | |
| Auditing fees | | 27,785 | |
| Legal fees | | 10,840 | |
| Portfolio accounting fees | | 196,392 | |
| Distribution services fee (Note 5) | | 16,021,385 | |
| Other service fees (Notes 2 and 5) | | 12,164,301 | |
| Share registration costs | | 274,268 | |
| Printing and postage | | 474,147 | |
| Miscellaneous (Note 5) | | 128,712 | |
| TOTAL EXPENSES | | 159,977,702 | |
| Waiver and Reimbursements: | | | |
| Waiver/reimbursement of investment adviser fee (Note 5) | $(9,737,686) | | |
| Reimbursement of other operating expenses (Notes 2 and 5) | (7,825,651) | | |
| TOTAL WAIVER AND REIMBURSEMENTS | | (17,563,337) | |
| Net expenses | | | 142,414,365 |
| Net investment income | | | 487,825,962 |
| Realized and Unrealized Gain (Loss) on Investments and Foreign Currency Transactions: | | | |
| Net realized gain on investments (including realized loss of $(21,446) on sales of investments in affiliated holding) | | | 880,738,279 |
| Net realized loss on foreign currency and foreign currency related transactions | | | (707,268) |
| Net realized loss on foreign exchange contracts | | | (108,158) |
| Net change in unrealized appreciation of investments (including change in unrealized appreciation of $10,418 on investments in an affiliated holding) | | | 267,831,379 |
| Net change in unrealized appreciation/depreciation of translation of assets and liabilities in foreign currency | | | 78,800 |
| Net realized and unrealized gain on investments and foreign currency transactions | | | 1,147,833,032 |
| Change in net assets resulting from operations | | | $1,635,658,994 |
See Notes which are an integral part of the Financial Statements
Annual Shareholder Report
Statement of Changes in Net Assets
| Year Ended October 31, | 2017 | 2016 |
| Increase (Decrease) in Net Assets | | |
| Operations: | | |
| Net investment income | $487,825,962 | $373,010,781 |
| Net realized gain on investments and foreign currency transactions | 879,922,853 | 295,815,587 |
| Net change in unrealized appreciation/depreciation of investments and foreign currency translation of assets and liabilities in foreign currency | 267,910,179 | (9,604,627) |
| CHANGE IN NET ASSETS RESULTING FROM OPERATIONS | 1,635,658,994 | 659,221,741 |
| Distributions to Shareholders: | | |
| Distributions from net investment income | | |
| Class A Shares | (92,555,083) | (82,231,633) |
| Class C Shares | (56,803,180) | (41,199,098) |
| Institutional Shares | (334,208,411) | (235,617,332) |
| Class R6 Shares | (6,130,207) | (64,197) |
| Distributions from net realized gain on investments and foreign currency transactions | | |
| Class A Shares | (67,787,902) | (112,457,959) |
| Class C Shares | (45,946,420) | (76,119,832) |
| Institutional Shares | (187,291,314) | (281,905,363) |
| Class R6 Shares | (624,114) | — |
| CHANGE IN NET ASSETS RESULTING FROM DISTRIBUTIONS TO SHAREHOLDERS | (791,346,631) | (829,595,414) |
| Share Transactions: | | |
| Proceeds from sale of shares | 3,935,670,776 | 7,701,891,315 |
| Net asset value of shares issued to shareholders in payment of distributions declared | 655,644,174 | 662,245,012 |
| Cost of shares redeemed | (6,187,696,752) | (3,420,734,091) |
| CHANGE IN NET ASSETS RESULTING FROM SHARE TRANSACTIONS | (1,596,381,802) | 4,943,402,236 |
| Change in net assets | (752,069,439) | 4,773,028,563 |
| Net Assets: | | |
| Beginning of period | 14,685,574,977 | 9,912,546,414 |
| End of period (including undistributed net investment income of $22,067,785 and $24,754,136, respectively) | $13,933,505,538 | $14,685,574,977 |
See Notes which are an integral part of the Financial Statements
Annual Shareholder Report
Notes to Financial Statements
October 31, 2017
1. ORGANIZATION
Federated Equity Funds (the “Trust”) is registered under the Investment Company Act of 1940, as amended (the “Act”), as an open-end management investment company. The Trust consists of 11 portfolios. The financial statements included herein are only those of Federated Strategic Value Dividend Fund (the “Fund”), a diversified portfolio. The financial statements of the other portfolios are presented separately. The assets of each portfolio are segregated and a shareholder's interest is limited to the portfolio in which shares are held. Each portfolio pays its own expenses. The Fund offers four classes of shares: Class A Shares, Class C Shares, Institutional Shares and Class R6 Shares. All shares of the Fund have equal rights with respect to voting, except on class-specific matters. The investment objective of the Fund is to provide income and long-term capital appreciation.
On March 30, 2017, the Fund's T Share class became effective with the Securities and Exchange Commission (SEC), but is not yet offered for sale.
2. SIGNIFICANT ACCOUNTING POLICIES
The following is a summary of significant accounting policies consistently followed by the Fund in the preparation of its financial statements. These policies are in conformity with U.S. generally accepted accounting principles (GAAP).
Investment Valuation
In calculating its net asset value (NAV), the Fund generally values investments as follows:
| ■ | Equity securities listed on an exchange or traded through a regulated market system are valued at their last reported sale price or official closing price in their principal exchange or market. |
| ■ | Shares of other mutual funds or non-exchange-traded investment companies are valued based upon their reported NAVs. |
| ■ | Derivative contracts listed on exchanges are valued at their reported settlement or closing price, except that options are valued at the mean of closing bid and asked quotations. |
| ■ | Over-the-counter (OTC) derivative contracts are fair valued using price evaluations provided by a pricing service approved by the Trustees. |
| ■ | Fixed-income securities are fair valued using price evaluations provided by a pricing service approved by the Trustees. |
| ■ | For securities that are fair valued in accordance with procedures established by and under the general supervision of the Trustees, certain factors may be considered such as: the last traded or purchase price of the security, information obtained by contacting the issuer or dealers, analysis of the issuer's financial statements or other available documents, fundamental analytical data, the nature and duration of restrictions on disposition, the movement of the market in which the security is normally traded, public trading in similar securities or derivative contracts of the issuer or comparable issuers, movement of a relevant index, or other factors including but not limited to industry changes and relevant government actions. |
If any price, quotation, price evaluation or other pricing source is not readily available when the NAV is calculated, if the Fund cannot obtain price evaluations from a pricing service or from more than one dealer for an investment within a reasonable period of time as set forth in the Fund's valuation policies and procedures, or if information furnished by a pricing service, in the opinion of the valuation committee (“Valuation Committee”), is deemed not
Annual Shareholder Report
representative of the fair value of such security, the Fund uses the fair value of the investment determined in accordance with the procedures described below. There can be no assurance that the Fund could obtain the fair value assigned to an investment if it sold the investment at approximately the time at which the Fund determines its NAV per share.
Fair Valuation and Significant Events Procedures
The Trustees have ultimate responsibility for determining the fair value of investments for which market quotations are not readily available. The Trustees have appointed a Valuation Committee comprised of officers of the Fund, Federated Equity Management Company of Pennsylvania (“Adviser”) and certain of the Adviser's affiliated companies to assist in determining fair value and in overseeing the calculation of the NAV. The Trustees have also authorized the use of pricing services recommended by the Valuation Committee to provide fair value evaluations of the current value of certain investments for purposes of calculating the NAV. The Valuation Committee employs various methods for reviewing third-party pricing-service evaluations including periodic reviews of third-party pricing services' policies, procedures and valuation methods (including key inputs, methods, models and assumptions), transactional back-testing, comparisons of evaluations of different pricing services, and review of price challenges by the Adviser based on recent market activity. In the event that market quotations and price evaluations are not available for an investment, the Valuation Committee determines the fair value of the investment in accordance with procedures adopted by the Trustees. The Trustees periodically review and approve the fair valuations made by the Valuation Committee and any changes made to the procedures.
Factors considered by pricing services in evaluating an investment include the yields or prices of investments of comparable quality, coupon, maturity, call rights and other potential prepayments, terms and type, reported transactions, indications as to values from dealers and general market conditions. Some pricing services provide a single price evaluation reflecting the bid-side of the market for an investment (a “bid” evaluation). Other pricing services offer both bid evaluations and price evaluations indicative of a price between the prices bid and asked for the investment (a “mid” evaluation). The Fund normally uses bid evaluations for any U.S. Treasury and Agency securities, mortgage-backed securities and municipal securities. The Fund normally uses mid evaluations for any other types of fixed-income securities and any OTC derivative contracts. In the event that market quotations and price evaluations are not available for an investment, the fair value of the investment is determined in accordance with procedures adopted by the Trustees.
The Trustees also have adopted procedures requiring an investment to be priced at its fair value whenever the Adviser determines that a significant event affecting the value of the investment has occurred between the time as of which the price of the investment would otherwise be determined and the time as of which the NAV is computed. An event is considered significant if there is both an affirmative expectation that the investment's value will change in response to the event and a reasonable basis for quantifying the resulting change in value. Examples of significant events that may occur after the close of the principal market on which a security is traded, or after the time of a price evaluation provided by a pricing service or a dealer, include:
| ■ | With respect to securities traded principally in foreign markets, significant trends in U.S. equity markets or in the trading of foreign securities index futures contracts; |
| ■ | Political or other developments affecting the economy or markets in which an issuer conducts its operations or its securities are traded; |
Annual Shareholder Report
| ■ | Announcements concerning matters such as acquisitions, recapitalizations, litigation developments, or a natural disaster affecting the issuer's operations or regulatory changes or market developments affecting the issuer's industry. |
The Trustees have adopted procedures whereby the Valuation Committee uses a pricing service to determine the fair value of equity securities traded principally in foreign markets when the Adviser determines that there has been a significant trend in the U.S. equity markets or in index futures trading. For other significant events, the Fund may seek to obtain more current quotations or price evaluations from alternative pricing sources. If a reliable alternative pricing source is not available, the Fund will determine the fair value of the investment in accordance with the fair valuation procedures approved by the Trustees. The Trustees have ultimate responsibility for any fair valuations made in response to a significant event.
Repurchase Agreements
The Fund may invest in repurchase agreements for short-term liquidity purposes. It is the policy of the Fund to require the other party to a repurchase agreement to transfer to the Fund's custodian or sub-custodian eligible securities or cash with a market value (after transaction costs) at least equal to the repurchase price to be paid under the repurchase agreement. The eligible securities are transferred to accounts with the custodian or sub-custodian in which the Fund holds a “securities entitlement” and exercises “control” as those terms are defined in the Uniform Commercial Code. The Fund has established procedures for monitoring the market value of the transferred securities and requiring the transfer of additional eligible securities if necessary to equal at least the repurchase price. These procedures also allow the other party to require securities to be transferred from the account to the extent that their market value exceeds the repurchase price or in exchange for other eligible securities of equivalent market value.
The insolvency of the other party or other failure to repurchase the securities may delay the disposition of the underlying securities or cause the Fund to receive less than the full repurchase price. Under the terms of the repurchase agreement, any amounts received by the Fund in excess of the repurchase price and related transaction costs must be remitted to the other party.
The Fund may enter into repurchase agreements in which eligible securities are transferred into joint trading accounts maintained by the custodian or sub-custodian for investment companies and other clients advised by the Fund's Adviser and its affiliates. The Fund will participate on a pro rata basis with the other investment companies and clients in its share of the securities transferred under such repurchase agreements and in its share of proceeds from any repurchase or other disposition of such securities.
Investment Income, Gains and Losses and Distributions
Investment transactions are accounted for on a trade-date basis. Realized gains and losses from investment transactions are recorded on an identified-cost basis. Interest income and expenses are accrued daily. Dividend income and distributions to shareholders are recorded on the ex-dividend date. Foreign dividends are recorded on the ex-dividend date or when the Fund is informed of the ex-dividend date. Distributions of net investment income, if any, are declared and paid monthly. Non-cash dividends included in dividend income, if any, are recorded at fair value. Non-cash dividends included in dividend income, if any, are recorded at fair value. Amortization/accretion of premium and discount is included in investment income. Investment income, realized gains and losses, and certain fund-level expenses are allocated to each class based on relative average daily net assets, except that Class A Shares, Class C
Annual Shareholder Report
Shares, Institutional Shares and Class R6 Shares may bear distribution services fees, other service fees and transfer agent fees unique to those classes. The detail of the total fund expense waiver and reimbursements of $17,563,337 is disclosed in various locations in this Note 2 and Note 5.
| | Transfer Agent
Fees Incurred | Transfer Agent
Fees Reimbursed |
| Class A Shares | $2,360,071 | $(1,535,909) |
| Class C Shares | 1,746,105 | (1,113,694) |
| Institutional Shares | 7,884,895 | (5,176,048) |
| Class R6 Shares | 15,123 | — |
| TOTAL | $12,006,194 | $(7,825,651) |
Dividends are declared separately for each class. No class has preferential dividend rights; differences in per share dividend rates are generally due to differences in separate class expenses.
Other Service Fees
The Fund may pay other service fees up to 0.25% of the average daily net assets of the Fund's Class A Shares and Class C Shares to unaffiliated financial intermediaries or to Federated Shareholder Services Company (FSSC) for providing services to shareholders and maintaining shareholder accounts. Subject to the terms described in the Expense Limitation note, FSSC may voluntarily reimburse the Fund for other service fees. For the year ended October 31, 2017, other service fees for the Fund were as follows:
| | Other Service
Fees Incurred |
| Class A Shares | $6,823,840 |
| Class C Shares | 5,340,461 |
| TOTAL | $12,164,301 |
Federal Taxes
It is the Fund's policy to comply with the Subchapter M provision of the Internal Revenue Code (the “Code”) and to distribute to shareholders each year substantially all of its income. Accordingly, no provision for federal income tax is necessary. As of and during the year ended October 31, 2017, the Fund did not have a liability for any uncertain tax positions. The Fund recognizes interest and penalties, if any, related to tax liabilities as income tax expense in the Statement of Operations. As of October 31, 2017, tax years 2014 through 2017 remain subject to examination by the Fund's major tax jurisdictions, which include the United States of America and the Commonwealth of Massachusetts.
The Fund may be subject to taxes imposed by governments of countries in which it invests. Such taxes are generally based on either income or gains earned or repatriated. The Fund accrues and applies such taxes to net investment income, net realized gains and net unrealized gains as income and/or gains are earned.
Annual Shareholder Report
When-Issued and Delayed-Delivery Transactions
The Fund may engage in when-issued or delayed-delivery transactions. The Fund records when-issued securities on the trade date and maintains security positions such that sufficient liquid assets will be available to make payment for the securities purchased. Securities purchased on a when-issued or delayed-delivery basis are marked to market daily and begin earning interest on the settlement date. Losses may occur on these transactions due to changes in market conditions or the failure of counterparties to perform under the contract.
Foreign Exchange Contracts
The Fund enters into foreign exchange contracts for the delayed-delivery of securities or foreign currency exchange transactions. The Fund enters into foreign exchange contracts to protect assets against adverse changes in foreign currency exchange rates or exchange control regulations. Purchased contracts are used to acquire exposure to foreign currencies, whereas, contracts to sell are used to hedge the Fund's securities against currency fluctuations. Risks may arise upon entering into these transactions from the potential inability of counterparties to meet the terms of their commitments and from unanticipated movements in security prices or foreign exchange rates. The foreign exchange contracts are adjusted by the daily exchange rate of the underlying currency and any gains or losses are recorded for financial statement purposes as unrealized until the settlement date.
At October 31, 2017, the Fund had no outstanding foreign exchange contracts.
Foreign Currency Translation
The accounting records of the Fund are maintained in U.S. dollars. All assets and liabilities denominated in foreign currencies are translated into U.S. dollars based on the rates of exchange of such currencies against U.S. dollars on the date of valuation. Purchases and sales of securities, income and expenses are translated at the rate of exchange quoted on the respective date that such transactions are recorded. The Fund does not isolate that portion of the results of operations resulting from changes in foreign exchange rates on investments from the fluctuations arising from changes in market prices of securities held. Such fluctuations are included with the net realized and unrealized gain or loss from investments.
Reported net realized foreign exchange gains or losses arise from sales of foreign currencies, currency gains or losses realized between the trade and settlement dates on securities transactions, the difference between the amounts of dividends, interest and foreign withholding taxes recorded on the Fund's books, and the U.S. dollar equivalent of the amounts actually received or paid. Net unrealized foreign exchange gains and losses arise from changes in the value of assets and liabilities other than investments in securities at fiscal year end, resulting from changes in the exchange rate.
The Effect of Derivative Instruments on the Statement of Operations for the Year Ended October 31, 2017
| Amount of Realized Gain or (Loss) on Derivatives Recognized in Income |
| | Forward
Currency
Contracts |
| Foreign exchange contracts | $(108,158) |
Annual Shareholder Report
Other
The preparation of financial statements in conformity with GAAP requires management to make estimates and assumptions that affect the amounts of assets, liabilities, expenses and revenues reported in the financial statements. Actual results could differ from those estimated. The Fund applies investment company accounting and reporting guidance.
3. SHARES OF BENEFICIAL INTEREST
The following tables summarize share activity:
| Year Ended October 31 | 2017 | 2016 |
| Class A Shares: | Shares | Amount | Shares | Amount |
| Shares sold | 84,433,729 | $513,894,434 | 300,032,338 | $1,812,381,488 |
| Shares issued to shareholders in payment of distributions declared | 25,496,550 | 151,647,341 | 32,045,519 | 183,241,993 |
| Shares redeemed | (283,885,607) | (1,724,856,300) | (168,314,232) | (1,013,286,462) |
| NET CHANGE RESULTING FROM CLASS A SHARE TRANSACTIONS | (173,955,328) | $(1,059,314,525) | 163,763,625 | $982,337,019 |
| Year Ended October 31 | 2017 | 2016 |
| Class C Shares: | Shares | Amount | Shares | Amount |
| Shares sold | 37,442,865 | $228,161,526 | 146,636,760 | $884,921,150 |
| Shares issued to shareholders in payment of distributions declared | 15,344,180 | 91,462,907 | 17,990,349 | 102,394,518 |
| Shares redeemed | (107,759,419) | (663,400,007) | (57,350,390) | (343,313,833) |
| NET CHANGE RESULTING FROM CLASS C SHARE TRANSACTIONS | (54,972,374) | $(343,775,574) | 107,276,719 | $644,001,835 |
| Year Ended October 31 | 2017 | 2016 |
| Institutional Shares: | Shares | Amount | Shares | Amount |
| Shares sold | 477,965,911 | $2,931,999,423 | 824,181,803 | $4,983,084,665 |
| Shares issued to shareholders in payment of distributions declared | 67,365,988 | 405,841,726 | 65,349,611 | 376,544,305 |
| Shares redeemed | (612,141,700) | (3,743,330,353) | (342,524,045) | (2,062,262,368) |
| NET CHANGE RESULTING FROM INSTITUTIONAL SHARE TRANSACTIONS | (66,809,801) | $(405,489,204) | 547,007,369 | $3,297,366,602 |
Annual Shareholder Report
| | Year Ended
10/31/2017 | Period Ended
10/31/20161 |
| Class R6 Shares: | Shares | Amount | Shares | Amount |
| Shares sold | 42,670,031 | $261,615,393 | 3,508,919 | $21,504,012 |
| Shares issued to shareholders in payment of distributions declared | 1,072,826 | 6,692,200 | 10,530 | 64,196 |
| Shares redeemed | (8,941,829) | (56,110,092) | (305,335) | (1,871,428) |
| NET CHANGE RESULTING FROM CLASS R6 SHARE TRANSACTIONS | 34,801,028 | $212,197,501 | 3,214,114 | $19,696,780 |
| NET CHANGE RESULTING FROM TOTAL FUND SHARE TRANSACTIONS | (260,936,475) | $(1,596,381,802) | 821,261,827 | $4,943,402,236 |
| 1 | Reflects operations for the period from June 29, 2016 (date of initial investment) to October 31, 2016. |
4. FEDERAL TAX INFORMATION
The timing and character of income and capital gain distributions are determined in accordance with income tax regulations, which may differ from GAAP. These differences are due to differing treatments for foreign currency transactions.
For the year ended October 31, 2017, permanent differences identified and reclassified among the components of net assets were as follows:
| Increase (Decrease) |
Undistributed
Net Investment
Income (Loss) | Accumulated
Net Realized
Gain (Loss) |
| $(815,432) | $815,432 |
Net investment income (loss), net realized gains (losses) and net assets were not affected by this reclassification.
The tax character of distributions as reported on the Statement of Changes in Net Assets for the years ended October 31, 2017 and 2016 was as follows:
| | 2017 | 2016 |
| Ordinary income1 | $489,696,882 | $374,440,262 |
| Long-term capital gains | $301,649,749 | $455,155,152 |
| 1 | For tax purposes, short-term capital gain distributions are considered ordinary income distributions. |
| | |
As of October 31, 2017, the components of distributable earnings on a tax basis were as follows:
| Undistributed ordinary income2 | $147,850,518 |
| Undistributed long-term capital gains | $758,316,009 |
| Net unrealized appreciation | $1,646,979,846 |
| 2 | For tax purposes, short-term capital gains are considered ordinary income in determining distributable earnings. |
| | |
Annual Shareholder Report
The difference between book-basis and tax-basis net unrealized appreciation/depreciation is attributable to differing treatments for the deferral of losses on wash sales.
At October 31, 2017, the cost of investments for federal tax purposes was $12,282,056,577. The net unrealized appreciation of investments for federal tax purposes excluding any unrealized appreciation resulting from the translation from foreign currencies to U.S. dollars of assets and liabilities other than investments in securities was $1,646,891,775. This consists of net unrealized appreciation from investments for those securities having an excess of value over cost of $1,925,491,660 and net unrealized depreciation from investments for those securities having an excess of cost over value of $278,599,885.
5. INVESTMENT ADVISER FEE AND OTHER TRANSACTIONS WITH AFFILIATES
Investment Adviser Fee
The advisory agreement between the Fund and the Adviser provides for an annual fee equal to 0.75% of the Fund's average daily net assets. Subject to the terms described in the Expense Limitation note, the Adviser may voluntarily choose to waive any portion of its fee. For the year ended October 31, 2017, the Adviser voluntarily waived $9,502,869 of its fee and reimbursed $7,825,651 of transfer agent fees. The Adviser has agreed to reimburse the Fund for certain investment adviser fees as a result of transactions in other affiliated investment companies. For the year ended ended October 31, 2017, the Adviser reimbursed $234,817.
Administrative Fee
Federated Administrative Services (FAS), under the Administrative Services Agreement, provides the Fund with administrative personnel and services. For purposes of determining the appropriate rate breakpoint, “Investment Complex” is defined as all of the Federated Funds subject to a fee under the Administrative Services Agreement. The fee paid to FAS is based on the average daily net assets of the Investment Complex as specified below:
| Administrative Fee | Average Daily Net Assets
of the Investment Complex |
| 0.100% | on assets up to $50 billion |
| 0.075% | on assets over $50 billion |
Subject to the terms described in the Expense Limitation note, FAS may voluntarily choose to waive any portion of its fee. For the year ended October 31, 2017, the annualized fee paid to FAS was 0.079% of average daily net assets of the Fund.
Prior to September 1, 2017, the breakpoints of the Administrative Fee paid to FAS, described above, were:
| Administrative Fee | Average Daily Net Assets of
the Investment Complex |
| 0.150% | on the first $5 billion |
| 0.125% | on the next $5 billion |
| 0.100% | on the next $10 billion |
| 0.075% | on assets in excess of $20 billion |
In addition, FAS may charge certain out-of-pocket expenses to the Fund.
Annual Shareholder Report
Distribution Services Fee
The Fund has adopted a Distribution Plan (the “Plan”) pursuant to Rule 12b-1 under the Act. Under the terms of the Plan, the Fund will compensate Federated Securities Corp. (FSC), the principal distributor, from the daily net assets of the Fund's Class A shares and Class C shares to finance activities intended to result in the sale of these shares. The Plan provides that the Fund may incur distribution expenses at the following percentages of average daily net assets, annually, to compensate FSC.
| Share Class Name | Percentage of Average Daily
Net Assets of Class |
| Class A Shares | 0.05% |
| Class C Shares | 0.75% |
Subject to the terms described in the Expense Limitation note, FSC may voluntarily choose to waive any portion of its fee. For the year ended October 31, 2017, distribution services fees for the Fund were as follows:
| | Distribution Services
Fees Incurred |
| Class C Shares | $16,021,385 |
When FSC receives fees, it may pay some or all of them to financial intermediaries whose customers purchase shares. For the year ended October 31, 2017, FSC retained $4,127,565 of fees paid by the Fund. For the year ended October 31, 2017, the Fund's Class A Shares did not incur a distribution services fee; however, it may begin to incur this fee upon approval of the Trustees.
Sales Charges
Front-end sales charges and contingent deferred sales charges (CDSC) do not represent expenses of the Fund. They are deducted from the proceeds of sales of Fund shares prior to investment or from redemption proceeds prior to remittance, as applicable. For the year ended October 31, 2017, FSC retained $550,799 in sales charges from the sale of Class A Shares. FSC also retained $540,520 of CDSC relating to redemptions of Class C Shares.
Other Service Fees
For the year ended October 31, 2017, FSSC received $31,576 of the other service fees disclosed in Note 2.
Expense Limitation
The Adviser and certain of its affiliates (which may include FSC, FAS and FSSC) on their own initiative have agreed to waive certain amounts of their respective fees and/or reimburse expenses. Total annual fund operating expenses (as shown in the financial highlights, excluding tax reclaim recovery expenses, interest expense, extraordinary expenses and proxy-related expenses paid by the Fund, if any) paid by the Fund's Class A Shares, Class C Shares, Institutional Shares and Class R6 Shares (after the voluntary waivers and/or reimbursements) will not exceed 1.05%, 1.80%, 0.80% and 0.78% (the “Fee Limit”), respectively, up to but not including the later of (the “Termination Date”): (a) January 1, 2019; or (b) the date of the
Annual Shareholder Report
Fund's next effective Prospectus. While the Adviser and its applicable affiliates currently do not anticipate terminating or increasing these arrangements prior to the Termination Date, these arrangements may only be terminated or the Fee Limit increased prior to the Termination Date with the agreement of the Trustees.
Interfund Transactions
During the year ended October 31, 2017, the Fund engaged in purchase and sale transactions with funds that have a common investment adviser (or affiliated investment advisers), common Directors/Trustees and/or common Officers. These purchase transactions complied with Rule 17a-7 under the Act and amounted to $981,377.
General
Certain Officers and Trustees of the Fund are Officers and Directors or Trustees of certain of the above companies. To efficiently facilitate payment, Directors'/Trustees' fees and certain expenses related to conducting meetings of the Directors/Trustees and other miscellaneous expenses are paid by an affiliate of the Adviser which in due course are reimbursed by the Fund. These expenses related to conducting meetings of the Directors/Trustees and other miscellaneous expenses may be included in Accrued and Miscellaneous Expenses on the Statement of Assets and Liabilities and Statement of Operations, respectively.
6. INVESTMENT TRANSACTIONS
Purchases and sales of investments, excluding long-term U.S. government securities and short-term obligations, for the year ended October 31, 2017, were as follows:
| Purchases | $2,677,821,593 |
| Sales | $4,560,830,819 |
7. LINE OF CREDIT
The Fund participates with certain other Federated Funds, on a several basis, in an up to $500,000,000 unsecured, 364-day, committed, revolving line of credit (LOC) agreement. The LOC was made available to finance temporarily the repurchase or redemption of shares of the Fund, failed trades, payment of dividends, settlement of trades and for other short-term, temporary or emergency general business purposes. The Fund cannot borrow under the LOC if an inter-fund loan is outstanding. The Fund's ability to borrow under the LOC also is subject to the limitations of the Act and various conditions precedent that must be satisfied before the Fund can borrow. Loans under the LOC are charged interest at a fluctuating rate per annum equal to the highest, on any day, of (a) (i) the federal funds effective rate, (ii) the one month London Interbank Offered Rate (LIBOR), and (iii) 0.0%, plus (b) a margin. The LOC also requires the Fund to pay, quarterly in arrears and at maturity, its pro rata share of a commitment fee based on the amount of the lenders' commitment that has not been utilized. As of October 31, 2017, the Fund had no outstanding loans. During the year ended October 31, 2017, the Fund did not utilize the LOC.
Annual Shareholder Report
8. INTERFUND LENDING
Pursuant to an Exemptive Order issued by the SEC, the Fund, along with other funds advised by subsidiaries of Federated Investors, Inc., may participate in an interfund lending program. This program provides an alternative credit facility allowing the Fund to borrow from other participating affiliated funds. As of October 31, 2017, there were no outstanding loans. During the year ended October 31, 2017, the program was not utilized.
9. FEDERAL TAX INFORMATION (UNAUDITED)
For the year ended October 31, 2017, the amount of long-term capital gains designated by the Fund was $301,649,749.
For the fiscal year ended October 31, 2017, 100.0% of total ordinary income (including short-term capital gain) distributions made by the Fund are qualifying dividends which may be subject to a maximum tax rate of 15%, as provided for by the Jobs and Growth Tax Relief Act of 2003. Complete information is reported in conjunction with the reporting of your distributions on Form 1099-DIV.
Of the ordinary income (including short-term capital gain) distributions made by the Fund during the year ended October 31, 2017, 73.10% qualify for the dividend received deduction available to corporate shareholders.
Annual Shareholder Report
Report of Independent Registered Public Accounting Firm
TO THE BOARD OF Trustees OF Federated Equity Funds AND SHAREHOLDERS OF Federated Strategic Value Dividend Fund:
We have audited the accompanying statement of assets and liabilities of Federated Strategic Value Dividend Fund (the “Fund”) (one of the portfolios constituting Federated Equity Funds), including the portfolio of investments, as of October 31, 2017, and the related statement of operations for the year then ended, the statement of changes in net assets for each of the two years in the period then ended, and the financial highlights for each of the periods or years indicated therein. These financial statements and financial highlights are the responsibility of the Fund's management. Our responsibility is to express an opinion on these financial statements and financial highlights based on our audits.
We conducted our audits in accordance with standards of the Public Company Accounting Oversight Board (United States). Those standards require that we plan and perform the audit to obtain reasonable assurance about whether the financial statements and financial highlights are free of material misstatement. We were not engaged to perform an audit of the Fund's internal control over financial reporting. Our audits included consideration of internal control over financial reporting as a basis for designing audit procedures that are appropriate in the circumstances, but not for the purpose of expressing an opinion on the effectiveness of the Fund's internal control over financial reporting. Accordingly, we express no such opinion. An audit also includes examining, on a test basis, evidence supporting the amounts and disclosures in the financial statements and financial highlights, assessing the accounting principles used and significant estimates made by management, and evaluating the overall financial statement presentation. Our procedures included confirmation of securities owned as of October 31, 2017, by correspondence with the custodian and others or by other appropriate auditing procedures where replies from others were not received. We believe that our audits provide a reasonable basis for our opinion.
In our opinion, the financial statements and financial highlights referred to above present fairly, in all material respects, the financial position of the Federated Strategic Value Dividend Fund, a portfolio of Federated Equity Funds, at October 31, 2017, the results of its operations for the year then ended, the changes in its net assets for each of the two years in the period then ended, and the financial highlights for each of the periods or years indicated therein, in conformity with U.S. generally accepted accounting principles.
Boston, Massachusetts
December 22, 2017
Annual Shareholder Report
Shareholder Expense Example (unaudited)
As a shareholder of the Fund, you incur two types of costs: (1) transaction costs, including sales charges (“loads”) on purchase or redemption payments; and (2) ongoing costs, including management fees and to the extent applicable, distribution (12b-1) fees and/or other service fees and other Fund expenses. This Example is intended to help you to understand your ongoing costs (in dollars) of investing in the Fund and to compare these costs with the ongoing costs of investing in other mutual funds. It is based on an investment of $1,000 invested at the beginning of the period and held for the entire period from May 1, 2017 to October 31, 2017.
ACTUAL EXPENSES
The first section of the table below provides information about actual account values and actual expenses. You may use the information in this section, together with the amount you invested, to estimate the expenses that you incurred over the period. Simply divide your account value by $1,000 (for example, an $8,600 account value divided by $1,000 = 8.6), then multiply the result by the number in the first section under the heading entitled “Expenses Paid During Period” to estimate the expenses attributable to your investment during this period.
HYPOTHETICAL EXAMPLE FOR COMPARISON PURPOSES
The second section of the table below provides information about hypothetical account values and hypothetical expenses based on the Fund's actual expense ratio and an assumed rate of return of 5% per year before expenses, which is not the Fund's actual return. Thus, you should not use the hypothetical account values and expenses to estimate the actual ending account balance or your expenses for the period. Rather, these figures are required to be provided to enable you to compare the ongoing costs of investing in the Fund with other funds. To do so, compare this 5% hypothetical example with the 5% hypothetical examples that appear in the shareholder reports of the other funds.
Annual Shareholder Report
Please note that the expenses shown in the table are meant to highlight your ongoing costs only and do not reflect any transaction costs, such as sales charges (“loads”) on purchase or redemption payments. Therefore, the second section of the table is useful in comparing ongoing costs only, and will not help you determine the relative total costs of owning different funds. In addition, if these transaction costs were included, your costs would have been higher.
| | Beginning
Account Value
5/1/2017 | Ending
Account Value
10/31/2017 | Expenses Paid
During Period1 |
| Actual: | | | |
| Class A Shares | $1,000 | $1,049.90 | $5.48 |
| Class C Shares | $1,000 | $1,045.80 | $9.33 |
| Institutional Shares | $1,000 | $1,051.00 | $4.19 |
| Class R6 Shares | $1,000 | $1,051.10 | $4.08 |
Hypothetical (assuming a 5% return
before expenses): | | | |
| Class A Shares | $1,000 | $1,019.90 | $5.40 |
| Class C Shares | $1,000 | $1,016.10 | $9.20 |
| Institutional Shares | $1,000 | $1,021.10 | $4.13 |
| Class R6 Shares | $1,000 | $1,021.20 | $4.02 |
| 1 | Expenses are equal to the Fund's annualized net expense ratios, multiplied by the average account value over the period, multiplied by 184/365 (to reflect the one-half-year period). The annualized net expense ratios are as follows: |
| | |
| Class A Shares | 1.06% |
| Class C Shares | 1.81% |
| Institutional Shares | 0.81% |
| Class R6 Shares | 0.79% |
Annual Shareholder Report
In Memoriam
With profound sadness, Federated announces the passing of John F. (“Jack”) Donahue and John W. (“John”) McGonigle. They will be greatly missed.
Jack Donahue
(Former Chairman and President, and Emeritus Director/Trustee, of the Federated Funds, and Founder, Former Chairman, President and Chief Executive Officer, and Chairman Emeritus, of Federated Investors, Inc.)
Jack Donahue, along with Richard B. Fisher, founded Federated in 1955 and served as a leader and member of the Boards of Directors/Trustees of the Federated Funds and the Board of Directors of Federated Investors, Inc. Mr. Donahue was a family man of deep faith with exemplary character and fealty, who served his religion, family, community, and the Federated Funds and Federated, as well as their shareholders, officers and employees, with distinction. His integrity, intelligence, and keen sense of fiduciary duty, coupled with his faith, family and background as a West Point graduate and Strategic Air Command B-29 pilot, served as a foundation for his strong business acumen and leadership. Among his many achievements, Mr. Donahue's steadfast and innovative leadership of the Federated Funds and Federated, as well as within the investment management industry, led to the birth of money market funds in the 1970s and their growth as an innovative, efficient and effective cash management vehicle throughout the 1980s, 1990s, 2000s and beyond. Federated expresses deep gratitude to Mr. Donahue for his inspiring leadership, distinguished service and contributions as a husband, father, founder, Board member and officer, colleague and friend.
John McGonigle
(Former Secretary of the Federated Funds, Former Director, Secretary and Chief Legal Officer of Federated Investors, Inc.)
John McGonigle served the Federated Funds and their respective Boards with distinction for more than 50 years as Fund Secretary and also served as Director for several closed-end funds. Mr. McGonigle was a gifted lawyer and wise counselor with a genial presence, keen intellect and convivial demeanor. A man of deep faith, he was a devoted husband, father and grandfather. A graduate of Duquesne University School of Law, Mr. McGonigle served as an officer in the U.S. Army for two years, achieving the rank of Captain. He also served on the staff of the Securities and Exchange Commission before joining Federated in 1966. Among many professional accomplishments, Mr. McGonigle helped fashion the regulatory foundation for money market funds, established Federated's first offshore funds in Ireland, and represented Federated on the Board of Governors of the Investment Company Institute where he was a member of the Executive Committee. Federated expresses deep gratitude for Mr. McGonigle and his impact on his family, friends, the community, and the mutual fund industry.
Annual Shareholder Report
Board of Trustees and Trust Officers
The Board of Trustees is responsible for managing the Trust's business affairs and for exercising all the Trust's powers except those reserved for the shareholders. The following tables give information about each Trustee and the senior officers of the Fund. Where required, the tables separately list Trustees who are “interested persons” of the Fund (i.e., “Interested” Trustees) and those who are not (i.e., “Independent” Trustees). Unless otherwise noted, the address of each person listed is Federated Investors Tower, 1001 Liberty Avenue, Pittsburgh, PA 15222. The address of all Independent Trustees listed is 4000 Ericsson Drive, Warrendale, PA 15086-7561; Attention: Mutual Fund Board. As of December 31, 2016, the Trust comprised 14 portfolio(s), and the Federated Fund Family consisted of 40 investment companies (comprising 124 portfolios). Unless otherwise noted, each Officer is elected annually. Unless otherwise noted, each Trustee oversees all portfolios in the Federated Fund Family and serves for an indefinite term. The Fund's Statement of Additional Information includes additional information about Trust Trustees and is available, without charge and upon request, by calling 1-800-341-7400.
Interested TRUSTEES Background
Name
Birth Date
Positions Held with Trust
Date Service Began | Principal Occupation(s) for Past Five Years,
Other Directorships Held and Previous Position(s) |
J. Christopher Donahue*
Birth Date: April 11, 1949
President and Trustee
Indefinite Term
Began serving: September 1999 | Principal Occupations: Principal Executive Officer and President of certain of the Funds in the Federated Fund Family; Director or Trustee of the Funds in the Federated Fund Family; President, Chief Executive Officer and Director, Federated Investors, Inc.; Chairman and Trustee, Federated Investment Management Company; Trustee, Federated Investment Counseling; Chairman and Director, Federated Global Investment Management Corp.; Chairman and Trustee, Federated Equity Management Company of Pennsylvania; Trustee, Federated Shareholder Services Company; Director, Federated Services Company.
Previous Positions: President, Federated Investment Counseling; President and Chief Executive Officer, Federated Investment Management Company, Federated Global Investment Management Corp. and Passport Research, Ltd; Chairman, Passport Research, Ltd. |
Annual Shareholder Report
Name
Birth Date
Positions Held with Trust
Date Service Began | Principal Occupation(s) for Past Five Years,
Other Directorships Held and Previous Position(s) |
John B. Fisher*
Birth Date: May 16, 1956
Trustee
Indefinite Term
Began serving: May 2016 | Principal Occupations: Principal Executive Officer and President of certain of the Funds in the Federated Fund Family; Director or Trustee of certain of the Funds in the Federated Fund Family; Vice President, Federated Investors, Inc.; President, Director/Trustee and CEO, Federated Advisory Services Company, Federated Equity Management Company of Pennsylvania, Federated Global Investment Management Corp., Federated Investment Counseling, Federated Investment Management Company; President of some of the Funds in the Federated Fund Complex and Director, Federated Investors Trust Company.
Previous Positions: President and Director of the Institutional Sales Division of Federated Securities Corp.; President and Director of Federated Investment Counseling; President and CEO of Passport Research, Ltd.; Director, Edgewood Securities Corp.; Director, Federated Services Company; Director, Federated Investors, Inc.; Chairman and Director, Southpointe Distribution Services, Inc. and President, Technology, Federated Services Company. |
| * | Reasons for “interested” status: J. Christopher Donahue and John B. Fisher are interested due to their beneficial ownership of shares of Federated Investors, Inc. and due to positions they hold with Federated and its subsidiaries. |
INDEPENDENT TRUSTEES Background
Name
Birth Date
Positions Held with Trust
Date Service Began | Principal Occupation(s) for Past Five Years,
Other Directorships Held, Previous Position(s) and Qualifications |
John T. Collins
Birth Date: January 24, 1947
Trustee
Indefinite Term
Began serving: October 2013 | Principal Occupations: Director or Trustee of the Federated Fund Family; formerly, Chairman and CEO, The Collins Group, Inc. (a private equity firm) (Retired).
Other Directorships Held: Director, Current Chair of the Compensation Committee, KLX Corp.
Qualifications: Mr. Collins has served in several business and financial management roles and directorship positions throughout his career. Mr. Collins previously served as Chairman and CEO, The Collins Group, Inc. (a private equity firm). Mr. Collins serves as Chairman Emeriti, Bentley University. Mr. Collins previously served as Director and Audit Committee Member, Bank of America Corp.; Director, FleetBoston Financial Corp.; and Director, Beth Israel Deaconess Medical Center (Harvard University Affiliate Hospital). |
Annual Shareholder Report
Name
Birth Date
Positions Held with Trust
Date Service Began | Principal Occupation(s) for Past Five Years,
Other Directorships Held, Previous Position(s) and Qualifications |
G. Thomas Hough
Birth Date: February 28, 1955
Trustee
Indefinite Term
Began serving: August 2015 | Principal Occupations: Director or Trustee of the Federated Fund Family; formerly, Vice Chair, Ernst & Young LLP (public accounting firm) (Retired).
Other Directorships Held: Director, Chair of the Audit Committee, Governance Committee, Publix Super Markets, Inc.; Director, Member of the Audit Committee and Technology Committee of Equifax, Inc.
Qualifications: Mr. Hough has served in accounting, business management and directorship positions throughout his career. Mr. Hough most recently held the position of Americas Vice Chair of Assurance with Ernst & Young LLP (public accounting firm). Mr. Hough is an Executive Committee member of the United States Golf Association, he serves on the President's Cabinet and Business School Board of Visitors for the University of Alabama and is on the Business School Board of Visitors for Wake Forest University. |
Maureen Lally-Green
Birth Date: July 5, 1949
Trustee
Indefinite Term
Began serving: August 2009 | Principal Occupations: Director or Trustee of the Federated Fund Family; Dean of the Duquesne University School of Law; Adjunct Professor of Law, Duquesne University School of Law; formerly, Interim Dean of the Duquesne University School of Law; Associate General Secretary and Director, Office of Church Relations, Diocese of Pittsburgh.
Other Directorships Held: Director, CONSOL Energy Inc.
Qualifications: Judge Lally-Green has served in various legal and business roles and directorship positions throughout her career. Judge Lally-Green previously served as: Associate General Secretary, Diocese of Pittsburgh; a member of the Superior Court of Pennsylvania; and as a Professor of Law, Duquesne University School of Law. Judge Lally-Green also currently holds the positions on either a public or not for profit Board of Directors as follows: Director and Chair, UPMC Mercy Hospital; Regent, St. Vincent Seminary; Director and Vice Chair, Our Campaign for the Church Alive!, Inc.; Director, Saint Vincent College; Member, Pennsylvania State Board of Education (public); and Director and Chair, Cardinal Wuerl North Catholic High School, Inc. Judge Lally-Green has held the positions of: Director, Auberle; Director, Epilepsy Foundation of Western and Central Pennsylvania; Director, Ireland Institute of Pittsburgh; Director, Saint Thomas More Society; Director, Catholic High Schools of the Diocese of Pittsburgh, Inc.; and Director, Pennsylvania Bar Institute. |
Peter E. Madden
Birth Date: March 16, 1942
Trustee
Indefinite Term
Began serving: November 1991 | Principal Occupation: Director or Trustee, and Chair of the Board of Directors or Trustees, of the Federated Fund Family; Retired.
Other Directorships Held: None.
Qualifications: Mr. Madden has served in several business management, mutual fund services and directorship positions throughout his career. Mr. Madden previously served as President, Chief Operating Officer and Director, State Street Bank and Trust Company (custodian bank) and State Street Corporation (financial services). He was Director, VISA USA and VISA International and Chairman and Director, Massachusetts Bankers Association. Mr. Madden served as Director, Depository Trust Corporation and Director, The Boston Stock Exchange. Mr. Madden also served as a Representative to the Commonwealth of Massachusetts General Court. |
Annual Shareholder Report
Name
Birth Date
Positions Held with Trust
Date Service Began | Principal Occupation(s) for Past Five Years,
Other Directorships Held, Previous Position(s) and Qualifications |
Charles F. Mansfield, Jr.
Birth Date: April 10, 1945
Trustee
Indefinite Term
Began serving: January 1999 | Principal Occupations: Director or Trustee of the Federated Fund Family; Management Consultant.
Other Directorships Held: None.
Qualifications: Mr. Mansfield has served as a Marine Corps officer and in several banking, business management, educational roles and directorship positions throughout his long career. He remains active as a Management Consultant. |
Thomas M. O'Neill
Birth Date: June 14, 1951
Trustee
Indefinite Term
Began serving: August 2006 | Principal Occupations: Director or Trustee, Chair of the Audit Committee of the Federated Fund Family; Sole Proprietor, Navigator Management Company (investment and strategic consulting).
Other Directorships Held: None.
Qualifications: Mr. O'Neill has served in several business, mutual fund and financial management roles and directorship positions throughout his career. Mr. O'Neill serves as Director, Medicines for Humanity and Director, The Golisano Children's Museum of Naples, Florida. Mr. O'Neill previously served as Chief Executive Officer and President, Managing Director and Chief Investment Officer, Fleet Investment Advisors; President and Chief Executive Officer, Aeltus Investment Management, Inc.; General Partner, Hellman, Jordan Management Co., Boston, MA; Chief Investment Officer, The Putnam Companies, Boston, MA; Credit Analyst and Lending Officer, Fleet Bank; Director and Consultant, EZE Castle Software (investment order management software); and Director, Midway Pacific (lumber). |
P. Jerome Richey
Birth Date: February 23, 1949
Trustee
Indefinite Term
Began serving: October 2013 | Principal Occupations: Director or Trustee of the Federated Fund Family; Management Consultant; formerly, Senior Vice Chancellor and Chief Legal Officer, University of Pittsburgh and Executive Vice President and Chief Legal Officer, CONSOL Energy Inc.
Other Directorships Held: None.
Qualifications: Mr. Richey has served in several business and legal management roles and directorship positions throughout his career. Mr. Richey most recently held the positions of Senior Vice Chancellor and Chief Legal Officer, University of Pittsburgh. Mr. Richey previously served as Chairman of the Board, Epilepsy Foundation of Western Pennsylvania and Chairman of the Board, World Affairs Council of Pittsburgh. Mr. Richey previously served as Chief Legal Officer and Executive Vice President, CONSOL Energy Inc.; and Board Member, Ethics Counsel and Shareholder, Buchanan Ingersoll & Rooney PC (a law firm). |
Annual Shareholder Report
Name
Birth Date
Positions Held with Trust
Date Service Began | Principal Occupation(s) for Past Five Years,
Other Directorships Held, Previous Position(s) and Qualifications |
John S. Walsh
Birth Date: November 28, 1957
Trustee
Indefinite Term
Began serving: January 1999 | Principal Occupations: Director or Trustee of the Federated Fund Family; President and Director, Heat Wagon, Inc. (manufacturer of construction temporary heaters); President and Director, Manufacturers Products, Inc. (distributor of portable construction heaters); President, Portable Heater Parts, a division of Manufacturers Products, Inc.
Other Directorships Held: None.
Qualifications: Mr. Walsh has served in several business management roles and directorship positions throughout his career. Mr. Walsh previously served as Vice President, Walsh & Kelly, Inc. (paving contractors). |
OFFICERS
Name
Birth Date
Address
Positions Held with Trust
Date Service Began | Principal Occupation(s) for Past Five Years
and Previous Position(s) |
Lori A. Hensler
Birth Date: January 6, 1967
TREASURER
Officer since: April 2013 | Principal Occupations: Principal Financial Officer and Treasurer of the Federated Fund Family; Senior Vice President, Federated Administrative Services; Financial and Operations Principal for Federated Securities Corp. and Edgewood Services, Inc.; and Assistant Treasurer, Federated Investors Trust Company. Ms. Hensler has received the Certified Public Accountant designation.
Previous Positions: Controller of Federated Investors, Inc.; Senior Vice President and Assistant Treasurer, Federated Investors Management Company; Treasurer, Federated Investors Trust Company; Assistant Treasurer, Federated Administrative Services, Federated Administrative Services, Inc., Federated Securities Corp., Edgewood Services, Inc., Federated Advisory Services Company, Federated Equity Management Company of Pennsylvania, Federated Global Investment Management Corp., Federated Investment Counseling, Federated Investment Management Company, Passport Research, Ltd., and Federated MDTA, LLC; Financial and Operations Principal for Federated Securities Corp., Edgewood Services, Inc. and Southpointe Distribution Services, Inc. |
Richard B. Fisher
Birth Date: May 17, 1923
VICE PRESIDENT
Officer since: April 1987 | Principal Occupations: Vice Chairman or Vice President of some of the Funds in the Federated Fund Family; Vice Chairman, Federated Investors, Inc.; Chairman, Federated Securities Corp.
Previous Positions: President and Director or Trustee of some of the Funds in the Federated Fund Family; Executive Vice President, Federated Investors, Inc.; Director and Chief Executive Officer, Federated Securities Corp. |
Annual Shareholder Report
Name
Birth Date
Address
Positions Held with Trust
Date Service Began | Principal Occupation(s) for Past Five Years
and Previous Position(s) |
Peter J. Germain
Birth Date: September 3, 1959
CHIEF LEGAL OFFICER, SECRETARY and EXECUTIVE VICE PRESIDENT
Officer since: January 2005 | Principal Occupations: Mr. Germain is Chief Legal Officer, Secretary and Executive Vice President of the Federated Fund Family. He is General Counsel, Chief Legal Officer, Secretary and Executive Vice President, Federated Investors, Inc.; Trustee and Senior Vice President, Federated Investors Management Company; Trustee and President, Federated Administrative Services; Director and President, Federated Administrative Services, Inc.; Director and Vice President, Federated Securities Corp.; Director and Secretary, Federated Private Asset Management, Inc.; Secretary, Federated Shareholder Services Company; and Secretary, Retirement Plan Service Company of America. Mr. Germain joined Federated in 1984 and is a member of the Pennsylvania Bar Association.
Previous Positions: Deputy General Counsel, Special Counsel, Managing Director of Mutual Fund Services, Federated Investors, Inc.; Senior Vice President, Federated Services Company; and Senior Corporate Counsel, Federated Investors, Inc. |
Stephen Van Meter
Birth Date: June 5, 1975
CHIEF COMPLIANCE OFFICER AND SENIOR VICE PRESIDENT
Officer since: July 2015 | Principal Occupations: Senior Vice President and Chief Compliance Officer of the Federated Fund Family; Vice President and Chief Compliance Officer of Federated Investors, Inc. and Chief Compliance Officer of certain of its subsidiaries. Mr. Van Meter joined Federated in October 2011. He holds FINRA licenses under Series 3, 7, 24 and 66.
Previous Positions: Mr. Van Meter previously held the position of Compliance Operating Officer, Federated Investors, Inc. Prior to joining Federated, Mr. Van Meter served at the United States Securities and Exchange Commission in the positions of Senior Counsel, Office of Chief Counsel, Division of Investment Management and Senior Counsel, Division of Enforcement. |
Stephen F. Auth
Birth Date: September 13, 1956
101 Park Avenue
41st Floor
New York, NY 10178
CHIEF INVESTMENT OFFICER
Officer since: November 2002 | Principal Occupations: Stephen F. Auth is Chief Investment Officer of various Funds in the Federated Fund Family; Executive Vice President, Federated Investment Counseling, Federated Global Investment Management Corp. and Federated Equity Management Company of Pennsylvania.
Previous Positions: Executive Vice President, Federated Investment Management Company and Passport Research, Ltd. (investment advisory subsidiary of Federated); Senior Vice President, Global Portfolio Management Services Division; Senior Vice President, Federated Investment Management Company and Passport Research, Ltd.; Senior Managing Director and Portfolio Manager, Prudential Investments. |
Annual Shareholder Report
Evaluation and Approval of Advisory Contract–May 2017
Federated Strategic Value Dividend Fund (the “Fund”)
Following a review and recommendation of approval by the Fund's independent trustees, the Fund's Board of Trustees (the “Board”) reviewed and unanimously approved the continuation of the Fund's investment advisory contract for an additional one-year term at its May 2017 meetings. The Board's decision regarding the contract reflects the exercise of its business judgment after considering all of the information received on whether to continue the existing arrangements.
The Board had previously appointed a Senior Officer, whose duties include specified responsibilities relating to the process by which advisory fees are to be charged to a Federated fund. The Senior Officer has the authority to retain consultants, experts, or staff as may be reasonably necessary to assist in the performance of his duties, reports directly to the Board, and may be terminated only with the approval of a majority of the independent members of the Board. The Senior Officer prepared and furnished to the Board an independent, written evaluation that covered topics discussed below (the “Senior Officer's Evaluation”). The Board considered the Senior Officer's Evaluation, along with other information, in deciding to approve the investment advisory contract.
The Board also considered judicial decisions concerning allegedly excessive investment advisory fees in its decision. Using these judicial decisions as a guide, the Board has indicated that the following factors may be relevant to an adviser's fiduciary duty with respect to its receipt of compensation from a fund: (1) the nature and quality of the services provided by an adviser to a fund and its shareholders (including the performance of the Fund and of comparable funds); (2) an adviser's cost of providing the services (including the profitability to an adviser of providing advisory services to a fund); (3) the extent to which an adviser may realize “economies of scale” as a fund grows larger and, if such economies of scale exist, whether they have been shared with a fund and its shareholders or the family of funds; (4) any “fall-out financial benefits” that accrue to an adviser because of its relationship with a fund (including research services received from brokers that execute fund trades and any fees paid to affiliates of an adviser for services rendered to a fund); (5) comparative fee and expense structures (including a comparison of fees paid to an adviser with those paid by similar funds); and (6) the extent of care, conscientiousness and independence with which the Fund's board members perform their duties and their expertise (including whether they are fully informed about all facts the Board deems relevant to its consideration of an adviser's services and fees). The Board noted that the Securities and Exchange Commission (“SEC”) disclosure requirements regarding the basis for the Board's approval of the Fund's investment advisory contract generally align with the factors listed above. Consistent with the judicial decisions and SEC disclosure requirements, the
Annual Shareholder Report
Board also considered management fees charged to institutional and other clients of Federated Equity Management Company of Pennsylvania (the “Adviser”) and its advisory affiliates for what might be viewed as like services. The Board was aware of these factors and was guided by them in its review of the Fund's investment advisory contract to the extent it considered them to be appropriate and relevant, as discussed further below.
The Board considered and weighed these factors in light of its substantial accumulated experience in governing the Fund and working with Federated Investors, Inc. and its affiliates (“Federated”) on matters relating to the Federated funds. The Board was assisted in its deliberations by independent legal counsel. In addition to the extensive materials that comprise and accompany the Senior Officer's Evaluation, the Board received detailed information about the Fund and the Federated organization throughout the year, and in connection with its May meetings. Federated provided much of this information at each regular meeting of the Board, and furnished additional information in connection with the May meetings at which the Board's formal approval of the investment advisory contract occurred. At the May meetings in addition to meeting in separate sessions of the independent trustees without management present, senior management of the Adviser also met with the independent trustees and their counsel to discuss the materials presented and any other matters thought relevant by the Adviser or the trustees. Between regularly scheduled meetings, the Board also received information on particular matters as the need arose. The Board's consideration of the investment advisory contract included review of the Senior Officer's Evaluation, accompanying data and additional information covering such matters as: the Adviser's investment philosophy, revenue, profitability, personnel and processes; investment and operating strategies; the Fund's short-term and long-term performance (in absolute terms, both on a gross basis and net of expenses, as well as in terms relative to its particular investment program and certain competitor or “peer group” funds and/or other benchmarks, as appropriate) and comments on the reasons for performance; the Fund's investment objectives; the Fund's expenses, including the advisory fee and the overall expense structure of the Fund (both in absolute terms and relative to similar and/or competing funds), with due regard for contractual or voluntary expense limitations; the use and allocation of brokerage commissions derived from trading the Fund's portfolio securities (if any); and the nature, quality and extent of the advisory and other services provided to the Fund by the Adviser and its affiliates. The Board also considered the preferences and expectations of Fund shareholders; the entrepreneurial risk assumed by the Adviser in sponsoring the Fund; the continuing state of competition in the mutual fund industry and market practices; the range of comparable fees for similar funds in the mutual fund industry; the Fund's relationship to the Federated funds which include a comprehensive array of funds with different investment objectives, policies and strategies which are generally available for exchange without the incurrence of additional sales charges; compliance and
Annual Shareholder Report
audit reports concerning the Federated funds and the Federated companies that service them (including communications from regulatory agencies), as well as Federated's responses to any issues raised therein; and relevant developments in the mutual fund industry and how the Federated funds and/or Federated are responding to them. The Board's evaluation process is evolutionary. The criteria considered and the emphasis placed on relevant criteria change in recognition of changing circumstances in the mutual fund marketplace.
While mindful that courts have cautioned against giving such comparisons too much weight, the Board has found the use of comparisons of the Fund's fees and expenses to other mutual funds with comparable investment programs to be relevant to its deliberations. In this regard, the Board was presented with, and considered, information regarding the contractual advisory fee rates, net advisory fee rates, total expense ratios and each element of the Fund's total expense ratio (i.e., gross and net advisory fees, custody fees, portfolio accounting fees and transfer agency fees) relative to the Fund's peers. The Board focused on comparisons with other similar mutual funds more heavily than non-mutual fund products or services because it is believed that they are more relevant. For example, other mutual funds are the products most like the Fund, in that they are readily available to Fund shareholders as alternative investment vehicles. Also, they are the type of investment vehicle, in fact, chosen and maintained by the Fund's investors. The range of their fees and expenses, therefore, appears to be a relevant indicator of what consumers have found to be reasonable in the marketplace in which the Fund competes.
The Board reviewed the contractual advisory fee rate, net advisory fee rate where partially waived and other expenses of the Fund and noted the position of the Fund's fee rates relative to its peers. In this regard, the Board noted that the contractual advisory fee rate was above the median of the relevant peer group, but the Board noted the applicable waivers and reimbursements and that the overall expense structure of the Fund remained competitive in the context of the other factors considered relevant by the Board.
For comparison, the Senior Officer has reviewed Federated's fees for providing advisory services to products outside the Federated funds (e.g., institutional and separate accounts and sub-adviser services). He concluded that mutual funds and institutional accounts are inherently different products. Those differences include, but are not limited to, different types of targeted investors; being subject to different laws and regulations; different legal structures; different average account sizes and portfolio management techniques made necessary by different cash flows and different associated costs; and the time spent by portfolio managers and their teams, funds financial services, legal, compliance and risk management in reviewing securities pricing, addressing different administrative responsibilities, addressing different degrees of risk
Annual Shareholder Report
associated with management and a variety of different costs. The Senior Officer did not consider the fees for providing advisory services to these outside products to be determinative in judging the appropriateness of mutual fund advisory fees.
The Senior Officer noted that the services, administrative responsibilities and risks associated with such relationships is quite different than serving as a primary adviser to a fund.
Following such evaluation, and full deliberations, the Board concluded that the expenses of the Fund are reasonable and supported renewal of the Fund's investment advisory contract.
The Board considered the nature, extent and quality of the services provided to the Fund by the Adviser and the resources of the Adviser and its affiliates dedicated to the Fund. In this regard, the Board evaluated, among other things, the Adviser's personnel, experience, track record, overall reputation and willingness to invest in personnel and infrastructure that benefit the Fund. In addition, the Board reviewed the qualifications, backgrounds and responsibilities of the portfolio management team primarily responsible for the day-to-day management of the Fund. The Board noted the compliance programs of, and the compliance-related resources provided to, the Fund by the Adviser. The Fund's ability to deliver competitive performance when compared to its peer group was also deemed to be relevant by the Board as a useful indicator of how the Adviser is executing the Fund's investment program. The Adviser's ability to execute this program was one of the Board's considerations in reaching a conclusion that the nature, extent and quality of the Adviser's investment management services warrant the continuation of the investment advisory contract.
In evaluating the Fund's investment performance, the Board considered performance results in light of the Fund's investment objective, strategies and risks, as disclosed in the Fund's prospectus. The Board particularly considered detailed investment reports on the Fund's performance that were provided to the Board throughout the year and in connection with the May meetings. The Senior Officer also reviewed information compiled by Federated, using data supplied by independent fund ranking organizations, regarding the performance of, and fees charged by, other mutual funds, noting his view that comparisons to fund peer groups may be helpful, though not conclusive, in judging the reasonableness of the proposed fees. The Board considered, in evaluating such comparisons, that in some cases individual funds may exhibit significant and unique differences in their objectives and management techniques when compared to other funds within an industry peer group.
Annual Shareholder Report
For the periods covered by the Evaluation, the Fund's performance for the three-year period was above the median of the relevant peer group, and the Fund's performance fell below the median of the relevant peer group for the one-year and five-year periods. The Board discussed the Fund's performance with the Adviser and recognized the efforts being taken by the Adviser in the context of other factors considered relevant by the Board.
Following such evaluation, and full deliberations, the Board concluded that the performance of the Fund supported renewal of the Fund's investment advisory contract.
The Board also received financial information about Federated, including information regarding the compensation and ancillary (or “fall-out”) benefits Federated derived from its relationships with the Federated funds. This information covered not only the fees under the investment advisory contracts, but also fees received by Federated's subsidiaries for providing other services to the Federated funds under separate contracts (e.g., for serving as the Federated funds' administrator). The information also detailed any indirect benefit Federated may derive from its receipt of research services from brokers who execute Federated fund trades. In addition, the Board considered the fact that, in order for a fund to be competitive in the marketplace, Federated and its affiliates frequently waived fees and/or reimbursed expenses and have disclosed to Fund investors and/or indicated to the Board their intention to do so in the future. Moreover, the Board receives regular reporting as to the institution, adjustment or elimination of these voluntary waivers. The Board considered Federated's previous reductions in contractual management fees to certain funds in response to the Senior Officer's recommendations.
Federated furnished information, requested by the Senior Officer, that reported revenues on a fund-by-fund basis and made estimates of the allocation of expenses on a fund-by-fund basis, using allocation methodologies specified by the Senior Officer. The Senior Officer noted that, while these cost allocation reports apply consistent allocation processes, the inherent difficulties in allocating costs continues to cause the Senior Officer to question the precision of the process and to conclude that such reports may be unreliable, since a single change in an allocation estimate may dramatically alter the resulting estimate of cost and/or profitability of a fund and may produce unintended consequences. The allocation information, including the Senior Officer's view that fund-by-fund estimations may be unreliable, was considered in the analysis by the Board.
The Board and the Senior Officer also reviewed information compiled by Federated comparing its profitability information to other publicly held fund management companies. In this regard, the Senior Officer concluded that Federated's profit margins did not appear to be excessive. The Senior Officer also noted that Federated appeared financially sound, with the resources to fulfill its obligations under its contracts with the Fund.
Annual Shareholder Report
The Senior Officer's Evaluation also discussed the notion of possible realization of “economies of scale” as a fund grows larger. In this regard, the Board considered that the Adviser has made significant and long-term investments in areas that support all of the Federated funds, such as personnel and processes for the portfolio management, shareholder services, compliance, internal audit and risk management functions, as well as systems technology (including technology relating to cybersecurity) and that the benefits of these efforts (as well as any economies of scale, should they exist) were likely to be enjoyed by the fund family as a whole. The Board noted that the Adviser's investments in these areas are extensive. In addition, the Board considered that Federated and its affiliates have frequently waived fees and/or reimbursed expenses and that this has allowed fund shareholders to share potential economies of scale from a fund's inception. Federated, as it does throughout the year, and in connection with the Board's review, furnished information relative to revenue sharing or adviser paid fees. Federated and the Senior Officer noted that this information should be viewed to determine if there was an incentive to either not apply breakpoints, or to apply breakpoints at higher levels. It should not be viewed to determine the appropriateness of advisory fees because it would represent marketing and distribution expenses. Finally, the Board also noted the absence of any applicable regulatory or industry guidelines on this subject, which (as discussed in the Senior Officer's Evaluation) is compounded by the lack of any common industry practice or general pattern with respect to structuring fund advisory fees with “breakpoints” that serve to reduce the fee as a fund attains a certain size.
While the Senior Officer noted certain items for follow-up reporting to the Board and further consideration by management, he stated that his observations and information accompanying the Senior Officer's Evaluation supported a finding by the Board that the management fee for the Fund was reasonable. Under these circumstances, no changes were recommended to, and no objection was raised to the continuation of the Fund's investment advisory contract.
In its decision to continue an existing investment advisory contract, the Board was mindful of the potential disruptions of the Fund's operations and various risks, uncertainties and other effects that could occur as a result of a decision to terminate or not renew an investment advisory contract. In particular, the Board recognized that many shareholders have invested in the Fund on the strength of the Adviser's industry standing and reputation and with the expectation that the Adviser will have a continuing role in providing advisory services to the Fund. Thus, the Board's approval of the investment advisory contract reflected the fact that it is the shareholders who have effectively selected the Adviser by virtue of having invested in the Fund. The Board concluded that, in light of the factors discussed above, including the nature, quality and scope of the services provided to the Fund by the Adviser and its affiliates, continuation of the investment advisory contract was appropriate.
Annual Shareholder Report
The Board based its decision to approve the investment advisory contract on the totality of the circumstances and relevant factors and with a view to past and future long-term considerations. Not all of the factors and considerations identified above were necessarily relevant to the Fund, nor did the Board consider any one of them to be determinative. With respect to the factors that were relevant, the Board's decision to approve the continuation of the contract reflects its determination that Federated's performance and actions provided a satisfactory basis to support the decision to continue the existing arrangement.
Annual Shareholder Report
Voting Proxies on Fund Portfolio Securities
A description of the policies and procedures that the Fund uses to determine how to vote proxies, if any, relating to securities held in the Fund's portfolio is available, without charge and upon request, by calling 1-800-341-7400. A report on “Form N-PX” of how the Fund voted any such proxies during the most recent 12-month period ended June 30 is available via the Proxy Voting Record (Form N-PX) link associated with the Fund and share class name at www.FederatedInvestors.com/FundInformation. Form N-PX filings are also available at the SEC's website at www.sec.gov.
Quarterly Portfolio Schedule
The Fund files with the SEC a complete schedule of its portfolio holdings, as of the close of the first and third quarters of its fiscal year, on “Form N-Q.” These filings are available on the SEC's website at www.sec.gov and may be reviewed and copied at the SEC's Public Reference Room in Washington, DC. (Call 1-800-SEC-0330 for information on the operation of the Public Reference Room.) You may also access this information via the link to the Fund and share class name at www.FederatedInvestors.com/FundInformation.
Annual Shareholder Report
Mutual funds are not bank deposits or obligations, are not guaranteed by any bank and are not insured or guaranteed by the U.S. government, the Federal Deposit Insurance Corporation, the Federal Reserve Board or any other government agency. Investment in mutual funds involves investment risk, including the possible loss of principal.
This Report is authorized for distribution to prospective investors only when preceded or accompanied by the Fund's Prospectus, which contains facts concerning its objective and policies, management fees, expenses and other information.
Federated Strategic Value Dividend Fund
Federated Investors Funds
4000 Ericsson Drive
Warrendale, PA 15086-7561
Contact us at FederatedInvestors.com
or call 1-800-341-7400.
Federated Securities Corp., Distributor
CUSIP 314172586
CUSIP 314172578
CUSIP 314172560
CUSIP 31421N881
33982 (12/17)
Federated is a registered trademark of Federated Investors, Inc.
2017 ©Federated Investors, Inc.
Annual Shareholder Report
October 31, 2017
| Share Class | Ticker | A | GVDSX | C | GVDCX | Institutional | GVDIX | R6 | GVDLX |
Federated Global Strategic Value Dividend Fund
Fund Established 2017
A Portfolio of Federated Equity Funds
Dear Valued Shareholder,
I am pleased to present the Annual Shareholder Report for your fund covering the period from January 16, 2017 through October 31, 2017. This report includes Management's Discussion of Fund Performance, a complete listing of your fund's holdings, performance information and financial statements along with other important fund information.
In addition, our website, FederatedInvestors.com, offers easy access to Federated resources that include timely fund updates, economic and market insights from our investment strategists, and financial planning tools. We invite you to register to take full advantage of its capabilities.
Thank you for investing with Federated. I hope you find this information useful and look forward to keeping you informed.
Sincerely,
J. Christopher Donahue, President
Not FDIC Insured ■ May Lose Value ■ No Bank Guarantee
CONTENTS
| 1 |
| 8 |
| 9 |
| 13 |
| 17 |
| 19 |
| 20 |
| 21 |
| 32 |
| 33 |
| 35 |
| 36 |
| 42 |
| 48 |
| 48 |
Management's Discussion of Fund Performance (unaudited)
The total return of Federated Global Strategic Value Dividend Fund (the “Fund”), based on net asset value for the reporting period since inception on January 30, 2017 and ending October 31, 2017 was 9.73% for the Class A Shares, 9.36% for the Class C Shares, 9.90% for the Institutional Shares and 9.90% for the Class R6 shares. The 9.90% total return of the Institutional Shares consisted of 2.50% in dividend income and 7.40% in appreciation of the net asset value of the shares. The total return of the MSCI World High Dividend Yield Index (MWHDYI),1 a broad-based securities market index that represents the global dividend-paying universe, was 13.26% for the reporting period. The MSCI World Index (MWI),2 which is representative of the broader global stock market,3 had a total return of 15.44% for the same period. The Fund's total return for the most recently completed fiscal year reflected actual cash flows, transaction costs and other expenses which are not reflected in the total return of the MWHDYI or the MWI.
The following discussion will focus on the performance of the Fund's Institutional Shares.
MARKET OVERVIEW
The reporting period began just after the election of Donald Trump as the 45th President of the United States. This surprise outcome, combined with Republicans retaining control over both the House and the Senate, sparked a “risk-on” trade as expectations for a business-friendly Washington crystallized and risk tolerance levels increased. As investor exuberance was lifted so were bond yields, with the U.S. 10-year Treasury yield rising as investors piled into more economically sensitive sectors. Financials, Industrials and Materials led the market higher to start the period as analysts upwardly revised their forecasts for U.S. GDP and earnings growth for 2017 and beyond, citing a “Trumponomics” agenda of tax cuts and reform, regulatory relief and infrastructure spending. As the S&P 500 Index was reaching new highs in early 2017, so were international markets, with the UK FTSE Index and the German DAX Index both reaching new peaks on better European economic data and corporate earnings.
Annual Shareholder Report
The “Trump trade'' did hit some bumps in the spring, though, as the failure of the Republican leadership to enact Obamacare ‘repeal-and-replace' legislation caused markets to take pause amid rising uncertainty around the new administration's pro-growth agenda. Ultimately, the pause was short-lived, lasting just 6 weeks and culminating with a pullback of less than 3% in the S&P 500 Index. From there, the global stock market's steady climb higher into the end of the reporting period was fueled by an increasingly steady flow of encouraging economic news, solid corporate earnings and prospects for potential tax reform hitting the President's desk by early 2018. By late October, the S&P 500 Index, Dow Jones Industrial Average and NASDAQ Composite had all achieved record highs.
Although international markets saw slightly less political drama than the U.S., foreign shares plotted an advance that was strangely similar to that of their U.S. counterparts. GDP growth in Europe was revised higher, companies continued to report strong earnings, and central banks remained accommodative. By October, in addition to the new highs for the German DAX Index and UK FTSE Index, France's CAC Index passed levels not seen in nearly 10 years, and Japan's Nikkei Index reached a 20-year high.
U.S.-based investors in foreign equities also received an added tailwind in the form of a weaker dollar. The U.S. dollar, which had enjoyed a period of sustained strength from 2011 through the end of 2016, finally began to lose some of its luster as economic growth outside the U.S. picked up, concerns over a break-up of the Eurozone eased, and the pace of Federal Reserve interest rate hikes became more dovish than originally anticipated. By the end of the reporting period, the British pound had appreciated 11% off of its lows in January 2017, while the euro recovered 12% from its bottom last December.
Over the course of the reporting period, the “risk-on” trade that dominated the year's performance favored stocks in cyclical sectors, especially those having high betas and low dividend yields. The near-term preference for riskier assets was stark, with the highest-beta quintile of the MWI outpacing the lowest-beta quintile by 6.51%. Similarly, the lowest-yielding quintile of the index outperformed the highest-yielding quintile by 15.50%. Furthermore, some of the market's most cyclical sectors dominated returns in the period, with Technology, Industrials and Financials leading the markets higher. Meanwhile, dividend-friendly sectors that are central to income-oriented strategies lagged the market in the reporting period as Telecom, Energy and Staples underperformed. The result was a market environment that was relatively challenging for an “income focused” strategy.
Annual Shareholder Report
DIVIDEND-BASED4 PERFORMANCE
The Fund ended the reporting period with a 30-day SEC yield of 3.9%5 and a gross weighted-average dividend yield of 4.5%. The Fund's gross yield was greater than the yield of the 10-year U.S. Treasury Note (2.4%), the yield of the broad-market MWI (2.3%) and that of the Fund's benchmark, the MWHDYI (3.6%). In addition to its higher-than-market yield, the Fund seeks to own high-quality companies with the ability and willingness to raise their dividends over time. From inception to the end of the reporting period, 35 companies within the Fund raised their dividend, accounting for 36 separate increases overall. Some of the most generous increases in the reporting period came from holdings such as British American Tobacco (12.0%), AbbVie (10.9%), TransCanada (10.6%), Crown Castle International (10.5%), Imperial Brands (10.1%) and Dominion Energy (10.0%). UK-based utility holding National Grid also paid a special dividend in June.
While global markets exhibited a strong “risk-on” posture over the reporting period, reflecting growing optimism around economic output and corporate earnings growth, the Fund remained steadfastly focused on its objectives of providing a higher-than-market yield and long-term dividend growth. Irrespective of short-term market trends, the Fund pursued these income-based goals by taking a long-term approach to its investments and by owning primarily high-yielding, mature companies with defensive cash flow profiles. With the Fund's investments in the dividend income-producing segment of the worldwide equity markets, which tend to have a lower beta versus the MWI, the Fund's short-term returns are not expected to move in line with the broad market. In spite of the Fund's overarching defensive properties in this period when lower-yielding cyclicals were in favor, the Fund still posted an attractive total return of 9.90% in the reporting period.
Consistent with its dividend-focused strategy, the Fund's holdings remained concentrated in mature markets that consistently offer a broad selection of high-dividend paying stocks. In addition to the United States, the Fund also has significant exposure to the UK, Canada and select European countries including France, Germany and Switzerland. During the reporting period, dividend-rich countries in the eurozone (9.76% of Fund assets) contributed strong returns, with Spain, Germany and France contributing weighted average returns of 28.21%, 24.11% and 20.54%, respectively. Luxembourg was the only eurozone country to contribute a negative total return in the period, where the Fund's sole holding, satellite company SES Group, returned -13.72% for the period. The Fund also received positive contributions from its core holdings in the U.S. (44.36% of Fund assets), UK (21.85% of Fund assets), and Canada (14.40% of Fund assets) where its investments posted weighted average returns of 11.14%, 10.37% and 8.76%, respectively.
Annual Shareholder Report
Sector returns were positive across all the GICS sectors through the reporting period, although the “risk-on” trade that dominated the period's performance favored stocks in cyclical sectors, especially those having high betas and low dividend yields. But while investor preferences for certain sectors and risk profiles will vary from year to year, the Fund remained focused on the key long-term drivers of total return–dividend yield and dividend growth. In order to pursue these income-based goals, the portfolio seeks to invest in high quality companies with attractive, sustainable dividends and stable cash flow profiles–conditions which are most commonly met in sectors that exhibit low levels of cyclicality. Given its persistent preference for stable income generation, the Fund's largest sector concentrations at period end were in Utilities, Telecom Services and Consumer Staples, representing 19.12%, 17.73% and 17.26%, respectively.
From a sector perspective, the Fund's holdings in Health Care were the most significant contributors to performance posting a return of 21.68%. Health Care's outperformance was driven by large pharmaceutical holdings AbbVie, AstraZeneca and Sanofi which returned 53.24%, 31.51% and 21.72%, respectively. Utilities were also a strong contributor to overall Fund performance delivering a return of 15.92%, led by as Spain's Red Electrica (28.21%), American Electric Power (20.83%) and Canada's Fortis (20.43%). Consumer Discretionary holding McDonalds and REIT holding Crown Castle also provided strong contributions, returning 27.69% and 27.03%, respectively. Financials added further to Fund performance as reinsurance holdings Scor and Munich Re returned 26.95% and 24.11%, respectively, for the reporting period.
By contrast, the Fund's weakest contribution was noted in the Telecommunications sector, which delivered a weighted average return of 1.55%, which included weaker performance from AT&T (-16.44%) and BT Group (-6.39%). These declines were offset by solid returns from Vodafone (21.4%). AT&T was pressured from the shift to unlimited plans in the U.S., along with concerns around the close of the proposed Time Warner acquisition, and BT Group's decline was driven in part by a potential fiber build in the UK and the triennial pension review. Consumer Staples also provided below-average returns of 4.04% as General Mills returned -14.80% on weaker sales in some of its core product categories, and Imperial Brands and Altria returned -9.14% and -7.49%, respectively, after the U.S. Food and Drug Administration announced that it would begin a public dialog on the prospects of lowering the nicotine levels in cigarettes.
Annual Shareholder Report
Due to its focus on high dividend income and growth in that income stream over time, the Fund will tend to perform best when the markets prefer high-yield, high-quality, low-beta, large-cap stocks. Often times, the strategy may also outperform in flat markets or periods of market distress. Conversely, the strategy may lag the broad market when investors prefer low-yield, low-quality, high-risk, small-cap stocks. Over the reporting period, the Fund faced a significant headwind as the market favored high-beta, lower-yielding investments. Given the Fund's focus on large, mature, income-generating companies, this preference for high-beta and low-yielding securities represented a near-term drag on performance versus the broad market.
| 1 | Please see the footnotes to the line graphs below for definitions of, and further information about, the MWHDYI. |
| 2 | Please see the footnotes to the line graphs below for definitions of, and further information about, the MWI. |
| 3 | International investing involves special risks including currency risk, increased volatility of foreign securities, political risks and differences in auditing and other financial standards. Prices of emerging markets securities can be significantly more volatile than the prices of securities in developed countries and currency risk and political risks are accentuated in emerging markets. |
| 4 | There are no guarantees that dividend-paying stocks will continue to pay dividends. In addition, dividend-paying stocks may not experience the same capital appreciation potential as non-dividend-paying stocks. |
| 5 | Represents the 30-day SEC yield for the Fund's Institutional Shares. In the absence of temporary expense waivers or reimbursements the 30-day SEC yield would have been 3.86% for the Fund's Institutional shares. The dividend yield represents the average yield of the underlying securities within the portfolio. |
Annual Shareholder Report
FUND PERFORMANCE AND GROWTH OF A $10,000 INVESTMENT
The graph below illustrates the hypothetical investment of $10,0001 in the Federated Global Strategic Value Dividend Fund from January 30, 2017 to October 31, 2017, compared to the MSCI World Index (MWI)2 and the MSCI World High Dividend Yield Index (MWHDYI).3 The Average Annual Total Return table below shows returns for each class averaged over the stated periods.
Growth of a $10,000 InvestmenT
Growth of $10,000 as of October 31, 2017

| Federated Global Strategic Value Dividend Fund - | Institutional Shares | Class A Shares | MWI | MWHDYI |
| F | F | I | I |
| 1/30/2017 | 10,000 | 9,452 | 10,000 | 10,000 |
| 1/31/2017 | 10,000 | 9,452 | 10,002 | 10,020 |
| 2/28/2017 | 10,320 | 9,754 | 10,279 | 10,325 |
| 3/31/2017 | 10,474 | 9,899 | 10,389 | 10,472 |
| 4/30/2017 | 10,445 | 9,869 | 10,543 | 10,540 |
| 5/31/2017 | 10,872 | 10,289 | 10,766 | 10,829 |
| 6/30/2017 | 10,773 | 10,175 | 10,807 | 10,808 |
| 7/31/2017 | 10,897 | 10,290 | 11,066 | 10,986 |
| 8/31/2017 | 10,891 | 10,282 | 11,081 | 11,005 |
| 9/30/2017 | 11,100 | 10,478 | 11,330 | 11,287 |
| 10/31/2017 | 10,990 | 10,301 | 11,544 | 11,326 |
41 graphic description end -->
| ■ | Total returns shown for Class A Shares include the maximum sales charge of 5.50% ($10,000 investment minus $550 sales charge = $9,450). |
The Fund offers multiple share classes whose performance may be greater than or less than its other share class(es) due to differences in sales charges and expenses. See the Average Annual Return table below for the returns of additional classes not shown in the line graph above.
Cumulative Total Returns for the Period Ended 10/31/2017
(returns reflect all applicable sales charges and contingent sales charges as specified below in footnote #1)
| | Start of
Performance4 |
| Class A Shares | 3.01% |
| Class C Shares | 8.36% |
| Institutional Shares | 9.90% |
| Class R6 Shares | 9.90% |
| MWI | 15.44% |
| MWHDYI | 13.26% |
Annual Shareholder Report
Performance data quoted represents past performance which is no guarantee of future results. Investment return and principal value will fluctuate so that an investor's shares, when redeemed, may be worth more or less than their original cost. Mutual fund performance changes over time and current performance may be lower or higher than what is stated. For current to the most recent month-end performance and after-tax returns, visit FederatedInvestors.com or call 1-800-341-7400. Returns shown do not reflect the deduction of taxes that a shareholder would pay on Fund distributions or the redemption of Fund shares. Mutual funds are not obligations of or guaranteed by any bank and are not federally insured.
| 1 | Represents a hypothetical investment of $10,000 in the Fund after deducting applicable sales charges: For Class A Shares, the maximum sales charge of 5.50% ($10,000 investment minus $550 sales charge = $9,450). The Fund's performance assumes the reinvestment of all dividends and distributions. The MWI and MWXHDYI have been adjusted to reflect reinvestment of dividends on securities in the indexes. For Class C Shares, a 1.00% contingent deferred sales charge would be applied on any redemption less than one year from the purchase date. |
| 2 | The MWI captures large- and mid-cap representation across 23 developed market countries. The index covers approximately 85% of the free float-adjusted market capitalization in each country. The MWI is not adjusted to reflect taxes, expenses or other fees that the Securities and Exchange Commission (SEC) requires to be reflected in the Fund's performance. The MWI is unmanaged and, unlike the Fund, is not affected by cash flows. It is not possible to invest directly in an index. |
| 3 | The MSCI World High Dividend Yield Index is based on the MSCI World Index, its parent index, and includes large- and mid-cap stocks across 23 developed market countries. The index is designed to reflect the performance of equities in the parent index (excluding REITs) with higher dividend income and quality characteristics than average dividend yields that are both sustainable and persistent. The index also applies quality screens and reviews 12-month past performance to omit stocks with potentially deteriorating fundamentals that could force them to cut or reduce dividends. The MWHDYI is not adjusted to reflect taxes, expenses or other fees that the SEC requires to be reflected in the Fund's performance. The MWHDYI is unmanaged and, unlike the Fund, is not affected by cash flows. It is not possible to invest directly in an index. |
| 4 | The Fund commenced operation on January 30, 2017. |
Annual Shareholder Report
Portfolio of Investments Summary Table (unaudited)
At October 31, 2017, the Fund's sector composition1 was as follows:
| Sector Composition | Percentage of
Total Net Assets |
| Utilities | 20.5% |
| Telecommunication Services | 19.3% |
| Consumer Staples | 18.8% |
| Energy | 14.8% |
| Health Care | 11.4% |
| Financials | 10.1% |
| Industrials | 3.1% |
| Consumer Discretionary | 3.0% |
| Real Estate | 2.8% |
| Materials | 1.3% |
| Cash Equivalents2 | 3.1% |
| Other Assets and Liabilities—Net3 | (8.2)% |
| TOTAL | 100.0% |
| 1 | Except for Cash Equivalents and Other Assets and Liabilities, sector classifications are based upon, and individual portfolio securities are assigned to, the classifications of the Global Industry Classification Standard (GICS) except that the Adviser assigns a classification to securities not classified by the GICS and to securities for which the Adviser does not have access to the classification made by the GICS. |
| 2 | Cash Equivalents include any investments in money market mutual funds and/or overnight repurchase agreements. |
| 3 | Assets, other than investments in securities, less liabilities. See Statement of Assets and Liabilities. |
Annual Shareholder Report
Portfolio of Investments
October 31, 2017
| Shares | | | Value in
U.S. Dollars |
| | | COMMON STOCKS—105.1% | |
| | | Australia—2.4% | |
| 1,560 | | Amcor Ltd. | $18,963 |
| 1,020 | | Sonic Healthcare Ltd. | 17,038 |
| | | TOTAL | 36,001 |
| | | Canada—15.9% | |
| 225 | | Bank of Montreal | 17,250 |
| 885 | | BCE, Inc. | 40,896 |
| 469 | | Canadian Imperial Bank of Commerce | 41,315 |
| 565 | | Emera, Inc. | 21,301 |
| 839 | | Enbridge, Inc. | 32,269 |
| 680 | | Fortis, Inc. | 25,061 |
| 685 | | TELUS Corp. | 24,826 |
| 365 | | Toronto Dominion Bank | 20,766 |
| 350 | | TransCanada Corp. | 16,630 |
| | | TOTAL | 240,314 |
| | | France—5.4% | |
| 150 | | Sanofi | 14,212 |
| 835 | | Scor SA | 34,699 |
| 595 | | TOTAL SA | 33,190 |
| | | TOTAL | 82,101 |
| | | Germany—2.5% | |
| 170 | | Muenchener Rueckversicherungs-Gesellschaft AG | 38,034 |
| | | Japan—2.3% | |
| 600 | | Japan Tobacco, Inc. | 19,857 |
| 600 | | NTT DOCOMO, Inc. | 14,504 |
| | | TOTAL | 34,361 |
| | | Luxembourg—1.2% | |
| 1,135 | | SES SA, GDR | 18,461 |
| | | Singapore—1.1% | |
| 6,260 | | Singapore Telecom Ltd. | 17,260 |
| | | Spain—1.3% | |
| 850 | | Red Electrica Corp. SA | 18,828 |
| | | Switzerland—1.5% | |
| 154 | | Novartis AG | 12,713 |
Annual Shareholder Report
| Shares | | | Value in
U.S. Dollars |
| | | COMMON STOCKS—continued | |
| | | Switzerland—continued | |
| 40 | | Roche Holding AG | $9,256 |
| | | TOTAL | 21,969 |
| | | United Kingdom—23.4% | |
| 730 | | AstraZeneca PLC | 49,460 |
| 2,330 | | BAE Systems PLC | 18,357 |
| 6,140 | | BP PLC | 41,612 |
| 300 | | British American Tobacco PLC | 19,369 |
| 8,030 | | BT Group PLC | 27,763 |
| 2,530 | | GlaxoSmithKline PLC | 45,447 |
| 1,105 | | Imperial Brands PLC | 45,071 |
| 2,429 | | National Grid PLC | 29,229 |
| 1,890 | | SSE PLC | 34,692 |
| 14,640 | | Vodafone Group PLC | 41,880 |
| | | TOTAL | 352,880 |
| | | United States—48.1% | |
| 273 | | AbbVie, Inc. | 24,638 |
| 635 | | Altria Group, Inc. | 40,780 |
| 250 | | American Electric Power Co., Inc. | 18,603 |
| 1,849 | | AT&T, Inc. | 62,219 |
| 275 | | Chevron Corp. | 31,870 |
| 790 | | Coca-Cola Co. | 36,324 |
| 400 | | Crown Castle International Corp. | 42,832 |
| 635 | | Dominion Resources, Inc. | 51,524 |
| 470 | | Duke Energy Corp. | 41,506 |
| 230 | | Exxon Mobil Corp. | 19,170 |
| 741 | | General Mills, Inc. | 38,473 |
| 130 | | Kimberly-Clark Corp. | 14,626 |
| 750 | | Occidental Petroleum Corp. | 48,427 |
| 100 | | PepsiCo, Inc. | 11,023 |
| 385 | | Philip Morris International, Inc. | 40,286 |
| 795 | | PPL Corp. | 29,860 |
| 205 | | Procter & Gamble Co. | 17,700 |
| 770 | | Public Service Enterprises Group, Inc. | 37,884 |
| 465 | | Target Corp. | 27,454 |
| 245 | | United Parcel Service, Inc., Class B | 28,795 |
Annual Shareholder Report
| Shares | | | Value in
U.S. Dollars |
| | | COMMON STOCKS—continued | |
| | | United States—continued | |
| 1,285 | | Verizon Communications, Inc. | $61,513 |
| | | TOTAL | 725,507 |
| | | TOTAL COMMON STOCKS
(IDENTIFIED COST $1,537,209) | 1,585,716 |
| | | INVESTMENT COMPANY—3.1% | |
| 46,137 | 1 | Federated Institutional Prime Value Obligations Fund, Institutional Shares, 1.21%2
(IDENTIFIED COST $46,142) | 46,142 |
| | | TOTAL INVESTMENT IN SECURITIES—108.2%
(IDENTIFIED COST $1,583,351)3 | 1,631,858 |
| | | OTHER ASSETS AND LIABILITIES - NET—(8.2)%4 | (123,461) |
| | | TOTAL NET ASSETS—100% | $1,508,397 |
Affiliated fund holdings are investment companies which are managed by the Adviser or an affiliate of the Adviser. Transactions with affiliated fund holdings during the period ended October 31, 2017, were as follows:
| | Federated Institutional
Prime Value
Obligations Fund,
Institutional Shares |
| Balance of Shares Held 1/30/2017 | — |
| Purchases/Additions | 1,644,457 |
| Sales/Reductions | (1,598,320) |
| Balance of Shares Held 10/31/2017 | 46,137 |
| Value | $46,142 |
| Change in unrealized Appreciation/Depreciation | — |
| Dividend Income | $328 |
| 2 | 7-day net yield. |
| 3 | Also represents cost of investments for federal tax purposes. |
| 4 | Assets, other than investments in securities, less liabilities. See Statement of Assets and Liabilities. |
Note: The categories of investments are shown as a percentage of total net assets at October 31, 2017.
Annual Shareholder Report
Various inputs are used in determining the value of the Fund's investments. These inputs are summarized in the three broad levels listed below:
Level 1—quoted prices in active markets for identical securities.
Level 2—other significant observable inputs (including quoted prices for similar securities, interest rates, prepayment speeds, credit risk, etc.). Also includes securities valued at amortized cost.
Level 3—significant unobservable inputs (including the Fund's own assumptions in determining the fair value of investments).
The inputs or methodology used for valuing securities are not an indication of the risk associated with investing in those securities.
The following is a summary of the inputs used, as of October 31, 2017, in valuing the Fund's assets carried at fair value:
| Valuation Inputs | | | | |
| | Level 1—
Quoted
Prices | Level 2—
Other
Significant
Observable
Inputs | Level 3—
Significant
Unobservable
Inputs | Total |
| Equity Securities: | | | | |
| Common Stocks | | | | |
| Domestic | $725,507 | $— | $— | $725,507 |
| International | 240,314 | 619,895 | — | 860,209 |
| Investment Company | 46,142 | — | — | 46,142 |
| TOTAL SECURITIES | $1,011,963 | $619,895 | $— | $1,631,858 |
The following acronym is used throughout this portfolio:
| GDR | — Global Depositary Receipt |
See Notes which are an integral part of the Financial Statements
Annual Shareholder Report
Financial Highlights–Class A Shares
(For a Share Outstanding Throughout the Period)
| Period Ended October 31 | 20171 |
| Net Asset Value, Beginning of Period | $5.00 |
| Income From Investment Operations: | |
| Net investment income | 0.132 |
| Net realized and unrealized gain on investments and foreign currency transactions | 0.35 |
| TOTAL FROM INVESTMENT OPERATIONS | 0.48 |
| Less Distributions: | |
| Distributions from net investment income | (0.11) |
| Net Asset Value, End of Period | $5.37 |
| Total Return3 | 9.73% |
| Ratios to Average Net Assets: | |
| Net expenses | 1.10%4 |
| Net investment income | 3.22%4 |
| Expense waiver/reimbursement5 | 19.52%4 |
| Supplemental Data: | |
| Net assets, end of period (000 omitted) | $137 |
| Portfolio turnover | 23% |
| 1 | Reflects operations for the period from January 30, 2017 (date of initial investment) to October 31, 2017. Certain ratios included above in Ratios to Average Net Assets and per share amounts may be inflated or deflated as compared to the fee structure for each respective share class as a result of daily systematic allocations being rounded to the nearest penny for fund level income, expense and realized/unrealized gain/loss amounts. Such differences are immaterial. |
| 2 | Per share number has been calculated using the average shares method. |
| 3 | Based on net asset value, which does not reflect the sales charge, redemption fee or contingent deferred sales charge, if applicable. Total returns for periods of less than one year are not annualized. |
| 4 | Computed on an annualized basis. |
| 5 | This expense decrease is reflected in both the net expense and the net investment income ratios shown above. |
See Notes which are an integral part of the Financial Statements
Annual Shareholder Report
Financial Highlights–Class C Shares
(For a Share Outstanding Throughout the Period)
| Period Ended October 31 | 20171 |
| Net Asset Value, Beginning of Period | $5.00 |
| Income From Investment Operations: | |
| Net investment income | 0.102 |
| Net realized and unrealized gain on investments and foreign currency transactions | 0.37 |
| TOTAL FROM INVESTMENT OPERATIONS | 0.47 |
| Less Distributions: | |
| Distributions from net investment income | (0.10) |
| Net Asset Value, End of Period | $5.37 |
| Total Return3 | 9.36% |
| Ratios to Average Net Assets: | |
| Net expenses | 1.85%4 |
| Net investment income | 2.47%4 |
| Expense waiver/reimbursement5 | 18.50%4 |
| Supplemental Data: | |
| Net assets, end of period (000 omitted) | $133 |
| Portfolio turnover | 23% |
| 1 | Reflects operations for the period from January 30, 2017 (date of initial investment) to October 31, 2017. Certain ratios included above in Ratios to Average Net Assets and per share amounts may be inflated or deflated as compared to the fee structure for each respective share class as a result of daily systematic allocations being rounded to the nearest penny for fund level income, expense and realized/unrealized gain/loss amounts. Such differences are immaterial. |
| 2 | Per share number has been calculated using the average shares method. |
| 3 | Based on net asset value, which does not reflect the sales charge, redemption fee or contingent deferred sales charge, if applicable. Total returns for periods of less than one year are not annualized. |
| 4 | Computed on an annualized basis. |
| 5 | This expense decrease is reflected in both the net expense and the net investment income ratios shown above. |
See Notes which are an integral part of the Financial Statements
Annual Shareholder Report
Financial Highlights–Institutional Shares
(For a Share Outstanding Throughout the Period)
| Period Ended October 31 | 20171 |
| Net Asset Value, Beginning of Period | $5.00 |
| Income From Investment Operations: | |
| Net investment income | 0.132 |
| Net realized and unrealized gain on investments and foreign currency transactions | 0.36 |
| TOTAL FROM INVESTMENT OPERATIONS | 0.49 |
| Less Distributions: | |
| Distributions from net investment income | (0.12) |
| Net Asset Value, End of Period | $5.37 |
| Total Return3 | 9.90% |
| Ratios to Average Net Assets: | |
| Net expenses | 0.85%4 |
| Net investment income | 3.20%4 |
| Expense waiver/reimbursement5 | 18.08%4 |
| Supplemental Data: | |
| Net assets, end of period (000 omitted) | $139 |
| Portfolio turnover | 23% |
| 1 | Reflects operations for the period from January 30, 2017 (date of initial investment) to October 31, 2017. Certain ratios included above in Ratios to Average Net Assets and per share amounts may be inflated or deflated as compared to the fee structure for each respective share class as a result of daily systematic allocations being rounded to the nearest penny for fund level income, expense and realized/unrealized gain/loss amounts. Such differences are immaterial. |
| 2 | Per share number has been calculated using the average shares method. |
| 3 | Based on net asset value. Total returns for periods of less than one year are not annualized. |
| 4 | Computed on an annualized basis. |
| 5 | This expense decrease is reflected in both the net expense and the net investment income ratios shown above. |
See Notes which are an integral part of the Financial Statements
Annual Shareholder Report
Financial Highlights–Class R6 Shares
(For a Share Outstanding Throughout the Period)
| Period Ended October 31 | 20171 |
| Net Asset Value, Beginning of Period | $5.00 |
| Income From Investment Operations: | |
| Net investment income | 0.152 |
| Net realized and unrealized gain on investments and foreign currency transactions | 0.34 |
| TOTAL FROM INVESTMENT OPERATIONS | 0.49 |
| Less Distributions: | |
| Distributions from net investment income | (0.12) |
| Net Asset Value, End of Period | $5.37 |
| Total Return3 | 9.90% |
| Ratios to Average Net Assets: | |
| Net expenses | 0.84%4 |
| Net investment income | 3.82%4 |
| Expense waiver/reimbursement5 | 22.67%4 |
| Supplemental Data: | |
| Net assets, end of period (000 omitted) | $1,099 |
| Portfolio turnover | 23% |
| 1 | Reflects operations for the period from January 30, 2017 (date of initial investment) to October 31, 2017. Certain ratios included above in Ratios to Average Net Assets and per share amounts may be inflated or deflated as compared to the fee structure for each respective share class as a result of daily systematic allocations being rounded to the nearest penny for fund level income, expense and realized/unrealized gain/loss amounts. Such differences are immaterial. |
| 2 | Per share number has been calculated using the average shares method. |
| 3 | Based on net asset value. Total returns for periods of less than one year are not annualized. |
| 4 | Computed on an annualized basis. |
| 5 | This expense decrease is reflected in both the net expense and the net investment income ratios shown above. |
See Notes which are an integral part of the Financial Statements
Annual Shareholder Report
Statement of Assets and Liabilities
October 31, 2017
| Assets: | | |
| Total investment in securities, at value including $46,142 of investment in an affiliated holding (Note 5) (identified cost $1,583,351) | | $1,631,858 |
| Cash denominated in foreign currencies (identified cost $125) | | 108 |
| Income receivable | | 3,429 |
| Receivable for shares sold | | 300 |
| TOTAL ASSETS | | 1,635,695 |
| Liabilities: | | |
| Payable for investments purchased | $17,922 | |
| Payable for portfolio accounting fees | 56,858 | |
| Payable for auditing fees | 26,260 | |
| Payable for share registration costs | 17,008 | |
| Payable for custodian fees | 4,117 | |
| Payable to adviser (Note 5) | 355 | |
| Payable for other service fees (Notes 2 and 5) | 152 | |
| Payable for administrative fee (Note 5) | 104 | |
| Accrued expenses (Note 5) | 4,522 | |
| TOTAL LIABILITIES | | 127,298 |
| Net assets for 280,829 shares outstanding | | $1,508,397 |
| Net Assets Consists of: | | |
| Paid-in capital | | $1,429,963 |
| Net unrealized appreciation of investments and translation of assets and liabilities in foreign currency | | 48,531 |
| Accumulated net realized gain on investments and foreign exchange contracts | | 27,261 |
| Undistributed net investment income | | 2,642 |
| TOTAL NET ASSETS | | $1,508,397 |
Annual Shareholder Report
Statement of Assets and Liabilities–continued
| Net Asset Value, Offering Price and Redemption Proceeds Per Share: | | |
| Class A Shares: | | |
| Net asset value per share ($137,270 ÷ 25,553 shares outstanding) no par value, unlimited shares authorized | | $5.37 |
| Offering price per share (100/94.50 of $5.37) | | $5.68 |
| Redemption proceeds per share | | $5.37 |
| Class C Shares: | | |
| Net asset value per share ($132,822 ÷ 24,719 shares outstanding) no par value, unlimited shares authorized | | $5.37 |
| Offering price per share | | $5.37 |
| Redemption proceeds per share (99.00/100 of $5.37) | | $5.32 |
| Institutional Shares: | | |
| Net asset value per share ($139,043 ÷ 25,882 shares outstanding) no par value, unlimited shares authorized | | $5.37 |
| Offering price per share | | $5.37 |
| Redemption proceeds per share | | $5.37 |
| Class R6 Shares: | | |
| Net asset value per share ($1,099,262 ÷ 204,675 shares outstanding) no par value, unlimited shares authorized | | $5.37 |
| Offering price per share | | $5.37 |
| Redemption proceeds per share | | $5.37 |
See Notes which are an integral part of the Financial Statements
Annual Shareholder Report
Statement of Operations
Period Ended October 31, 20171
| Investment Income: | | | |
| Dividends (including $328 received from an affiliated holding, see footnotes to Portfolio of Investments [and net of foreign taxes withheld of $2,840]) | | | $44,356 |
| Expenses: | | | |
| Investment adviser fee (Note 5) | | $7,245 | |
| Administrative fee (Note 5) | | 1,015 | |
| Custodian fees | | 8,085 | |
| Transfer agent fees | | 6,578 | |
| Auditing fees | | 30,900 | |
| Legal fees | | 7,901 | |
| Distribution services fee (Note 5) | | 386 | |
| Other service fees (Notes 2 and 5) | | 280 | |
| Portfolio accounting fees | | 65,696 | |
| Share registration costs | | 89,672 | |
| Printing and postage | | 1,436 | |
| Miscellaneous (Note 5) | | 2,400 | |
| TOTAL EXPENSES | | 221,594 | |
| Waivers and Reimbursement: | | | |
| Waiver/reimbursement of investment adviser fee (Note 5) | $(7,245) | | |
| Waiver/reimbursement of other operating expenses (Notes 2 and 5) | (205,516) | | |
| TOTAL WAIVERS AND REIMBURSEMENT | | (212,761) | |
| Net expenses | | | 8,833 |
| Net investment income | | | 35,523 |
| Realized and Unrealized Gain on Investments and Foreign Currency Transactions: | | | |
| Net realized gain on investments and foreign currency translations | | | 23,844 |
| Net realized (loss) on foreign exchange contracts | | | (46) |
| Net change in unrealized appreciation of investments and translation of assets and liabilities in foreign currency transactions | | | 48,531 |
| Net realized and unrealized gain on investments and foreign currency transactions | | | 72,329 |
| Change in net assets resulting from operations | | | $107,852 |
| 1 | Reflects operations for the period from January 30, 2017 (date of initial investment) to October 31, 2017. |
See Notes which are an integral part of the Financial Statements
Annual Shareholder Report
Statement of Changes in Net Assets
| Period Ended October 31 | 20171 |
| Increase (Decrease) in Net Assets | |
| Operations: | |
| Net investment income | $35,523 |
| Net realized gain on investments, foreign currency transactions and foreign exchange contracts | 23,798 |
| Net change in unrealized appreciation/depreciation of investments and translation of assets and liabilities in foreign currency | 48,531 |
| CHANGE IN NET ASSETS RESULTING FROM OPERATIONS | 107,852 |
| Distributions to Shareholders: | |
| Distributions from net investment income | |
| Class A Shares | (1,878) |
| Class C Shares | (1,272) |
| Institutional Shares | (1,499) |
| Class R6 Shares | (24,769) |
| CHANGE IN NET ASSETS RESULTING FROM DISTRIBUTIONS TO SHAREHOLDERS | (29,418) |
| Share Transactions: | |
| Proceeds from sale of shares | 1,402,755 |
| Net asset value of shares issued to shareholders in payment of distributions declared | 28,660 |
| Cost of shares redeemed | (1,452) |
| CHANGE IN NET ASSETS RESULTING FROM SHARE TRANSACTIONS | 1,429,963 |
| Change in net assets | 1,508,397 |
| Net Assets: | |
| Beginning of period | — |
| End of period (including undistributed net investment income of $2,642) | $1,508,397 |
| 1 | Reflects operations for the period from January 30, 2017 (date of initial investment) to October 31, 2017. |
See Notes which are an integral part of the Financial Statements
Annual Shareholder Report
Notes to Financial Statements
October 31, 2017
1. ORGANIZATION
Federated Equity Funds (the “Trust”) is registered under the Investment Company Act of 1940, as amended (the “Act”), as an open-end management investment company. The Trust consists of 11 portfolios. The financial statements included herein are only those of Federated Global Strategic Value Dividend Fund (the “Fund”), a diversified portfolio. The financial statements of the other portfolios are presented separately. The assets of each portfolio are segregated and a shareholder's interest is limited to the portfolio in which shares are held. Each portfolio pays its own expenses. The Fund offers four classes of shares: Class A Shares, Class C Shares, Institutional Shares and Class R6 Shares. All shares of the Fund have equal rights with respect to voting, except on class-specific matters. The investment objective of the Fund is to provide income and long-term capital appreciation. The Fund's Class A Shares, Class C Shares, Institutional Shares and Class R6 Shares commenced operations on January 30, 2017.
2. SIGNIFICANT ACCOUNTING POLICIES
The following is a summary of significant accounting policies consistently followed by the Fund in the preparation of its financial statements. These policies are in conformity with U.S. generally accepted accounting principles (GAAP).
Investment Valuation
In calculating its net asset value (NAV), the Fund generally values investments as follows:
| ■ | Equity securities listed on an exchange or traded through a regulated market system are valued at their last reported sale price or official closing price in their principal exchange or market. |
| ■ | Shares of other mutual funds or non-exchange-traded investment companies are valued based upon their reported NAVs. |
| ■ | Derivative contracts listed on exchanges are valued at their reported settlement or closing price, except that options are valued at the mean of closing bid and asked quotations. |
| ■ | Over-the-counter (OTC) derivative contracts are fair valued using price evaluations provided by a pricing service approved by the Fund's Board of Trustees (the “Trustees”). |
| ■ | Fixed-income securities are fair valued using price evaluations provided by a pricing service approved by the Trustees. |
| ■ | For securities that are fair valued in accordance with procedures established by and under the general supervision of the Trustees, certain factors may be considered such as: the last traded or purchase price of the security, information obtained by contacting the issuer or dealers, analysis of the issuer's financial statements or other available documents, fundamental analytical data, the nature and duration of restrictions on disposition, the movement of the market in which the security is normally traded, public trading in similar securities or derivative contracts of the issuer or comparable issuers, movement of a relevant index, or other factors including but not limited to industry changes and relevant government actions. |
If any price, quotation, price evaluation or other pricing source is not readily available when the NAV is calculated, if the Fund cannot obtain price evaluations from a pricing service or from more than one dealer for an investment within a reasonable period of time as set forth in the Fund's valuation policies and procedures, or if information furnished by a pricing service, in the opinion of the valuation committee (“Valuation Committee”), is deemed not
Annual Shareholder Report
representative of the fair value of such security, the Fund uses the fair value of the investment determined in accordance with the procedures described below. There can be no assurance that the Fund could obtain the fair value assigned to an investment if it sold the investment at approximately the time at which the Fund determines its NAV per share.
Fair Valuation and Significant Events Procedures
The Trustees have ultimate responsibility for determining the fair value of investments for which market quotations are not readily available. The Trustees have appointed a Valuation Committee comprised of officers of the Fund, Federated Equity Management Company of Pennsylvania (“Adviser”) and certain of the Adviser's affiliated companies to assist in determining fair value and in overseeing the calculation of the NAV. The Trustees have also authorized the use of pricing services recommended by the Valuation Committee to provide fair value evaluations of the current value of certain investments for purposes of calculating the NAV. The Valuation Committee employs various methods for reviewing third-party pricing-service evaluations including periodic reviews of third-party pricing services' policies, procedures and valuation methods (including key inputs, methods, models and assumptions), transactional back-testing, comparisons of evaluations of different pricing services, and review of price challenges by the Adviser based on recent market activity. In the event that market quotations and price evaluations are not available for an investment, the Valuation Committee determines the fair value of the investment in accordance with procedures adopted by the Trustees. The Trustees periodically review and approve the fair valuations made by the Valuation Committee and any changes made to the procedures.
Factors considered by pricing services in evaluating an investment include the yields or prices of investments of comparable quality, coupon, maturity, call rights and other potential prepayments, terms and type, reported transactions, indications as to values from dealers and general market conditions. Some pricing services provide a single price evaluation reflecting the bid-side of the market for an investment (a “bid” evaluation). Other pricing services offer both bid evaluations and price evaluations indicative of a price between the prices bid and asked for the investment (a “mid” evaluation). The Fund normally uses bid evaluations for any U.S. Treasury and Agency securities, mortgage-backed securities and municipal securities. The Fund normally uses mid evaluations for any other types of fixed-income securities and any OTC derivative contracts. In the event that market quotations and price evaluations are not available for an investment, the fair value of the investment is determined in accordance with procedures adopted by the Trustees.
The Trustees also have adopted procedures requiring an investment to be priced at its fair value whenever the Adviser determines that a significant event affecting the value of the investment has occurred between the time as of which the price of the investment would otherwise be determined and the time as of which the NAV is computed. An event is considered significant if there is both an affirmative expectation that the investment's value will change in response to the event and a reasonable basis for quantifying the resulting change in value. Examples of significant events that may occur after the close of the principal market on which a security is traded, or after the time of a price evaluation provided by a pricing service or a dealer, include:
| ■ | With respect to securities traded principally in foreign markets, significant trends in U.S. equity markets or in the trading of foreign securities index futures contracts; |
| ■ | Political or other developments affecting the economy or markets in which an issuer conducts its operations or its securities are traded; |
Annual Shareholder Report
| ■ | Announcements concerning matters such as acquisitions, recapitalizations, litigation developments, or a natural disaster affecting the issuer's operations or regulatory changes or market developments affecting the issuer's industry. |
The Trustees have adopted procedures whereby the Valuation Committee uses a pricing service to determine the fair value of equity securities traded principally in foreign markets when the Adviser determines that there has been a significant trend in the U.S. equity markets or in index futures trading. For other significant events, the Fund may seek to obtain more current quotations or price evaluations from alternative pricing sources. If a reliable alternative pricing source is not available, the Fund will determine the fair value of the investment in accordance with the fair valuation procedures approved by the Trustees. The Trustees have ultimate responsibility for any fair valuations made in response to a significant event.
Repurchase Agreements
The Fund may invest in repurchase agreements for short-term liquidity purposes. It is the policy of the Fund to require the other party to a repurchase agreement to transfer to the Fund's custodian or sub-custodian eligible securities or cash with a market value (after transaction costs) at least equal to the repurchase price to be paid under the repurchase agreement. The eligible securities are transferred to accounts with the custodian or sub-custodian in which the Fund holds a “securities entitlement” and exercises “control” as those terms are defined in the Uniform Commercial Code. The Fund has established procedures for monitoring the market value of the transferred securities and requiring the transfer of additional eligible securities if necessary to equal at least the repurchase price. These procedures also allow the other party to require securities to be transferred from the account to the extent that their market value exceeds the repurchase price or in exchange for other eligible securities of equivalent market value.
The insolvency of the other party or other failure to repurchase the securities may delay the disposition of the underlying securities or cause the Fund to receive less than the full repurchase price. Under the terms of the repurchase agreement, any amounts received by the Fund in excess of the repurchase price and related transaction costs must be remitted to the other party.
The Fund may enter into repurchase agreements in which eligible securities are transferred into joint trading accounts maintained by the custodian or sub-custodian for investment companies and other clients advised by the Adviser and its affiliates. The Fund will participate on a pro rata basis with the other investment companies and clients in its share of the securities transferred under such repurchase agreements and in its share of proceeds from any repurchase or other disposition of such securities.
Investment Income, Gains and Losses, Expenses and Distributions
Investment transactions are accounted for on a trade-date basis. Realized gains and losses from investment transactions are recorded on an identified-cost basis. Interest income and expenses are accrued daily. Dividend income and distributions to shareholders are recorded on the ex-dividend date. Foreign dividends are recorded on the ex-dividend date or when the Fund is informed of the ex-dividend date. Distributions of net investment income, if any, are declared and paid monthly. Non-cash dividends included in dividend income, if any, are recorded at fair value. Amortization/accretion of premium and discount is included in investment income. Investment income, realized and unrealized gains and losses, and certain fund-level expenses are allocated to each class based on relative average daily net assets, except that Class A Shares, Class C Shares, Institutional Shares and Class R6 Shares may bear
Annual Shareholder Report
distribution services fees, other service fees and transfer agent fees unique to those classes. The detail of the total fund expense waivers and reimbursements of $212,761 is disclosed in various locations in this Note 2 and Note 5. For the period ended October 31, 2017, transfer agent fees for the Fund were as follows:
| | Transfer Agent
Fees Incurred | Transfer Agent
Fees Reimbursed |
| Class A Shares | $33 | $(28) |
| Class C Shares | 20 | (18) |
| Institutional Shares | 15 | (12) |
| Class R6 Shares | 6,510 | — |
| TOTAL | $6,578 | $(58) |
Dividends are declared separately for each class. No class has preferential dividend rights; differences in per share dividend rates are generally due to differences in separate class expenses.
Other Service Fees
The Fund may pay other service fees up to 0.25% of the average daily net assets of the Fund's Class A Shares and Class C Shares to unaffiliated financial intermediaries or to Federated Shareholder Services Company (FSSC) for providing services to shareholders and maintaining shareholder accounts. Subject to the terms described in the Expense Limitation note, FSSC may voluntarily reimburse the Fund for other service fees. For the period ended October 31, 2017, other service fees for the Fund were as follows:
| | Other
Service Fees
Incurred |
| Class A Shares | $151 |
| Class C Shares | 129 |
| TOTAL | $280 |
Federal Taxes
It is the Fund's policy to comply with the Subchapter M provision of the Internal Revenue Code (the “Code”) and to distribute to shareholders each year substantially all of its income. Accordingly, no provision for federal income tax is necessary. As of and during the period ended October 31, 2017, the Fund did not have a liability for any uncertain tax positions. The Fund recognizes interest and penalties, if any, related to tax liabilities as income tax expense in the Statement of Operations. As of October 31, 2017, the current tax year will be subject to examination by the Fund's major tax jurisdictions which include the United States of America and the Commonwealth of Massachusetts.
The Fund may be subject to taxes imposed by governments of countries in which it invests. Such taxes are generally based on either income or gains earned or repatriated. The Fund accrues and applies such taxes to net investment income, net realized gains and net unrealized gains as income and/or gains are earned.
Annual Shareholder Report
When-Issued and Delayed-Delivery Transactions
The Fund may engage in when-issued or delayed-delivery transactions. The Fund records when-issued securities on the trade date and maintains security positions such that sufficient liquid assets will be available to make payment for the securities purchased. Securities purchased on a when-issued or delayed-delivery basis are marked to market daily and begin earning interest on the settlement date. Losses may occur on these transactions due to changes in market conditions or the failure of counterparties to perform under the contract.
Foreign Exchange Contracts
The Fund may enter into foreign exchange contracts to seek to manage currency risk. Purchased contracts are used to acquire exposure to foreign currencies, whereas, contracts to sell are used to hedge the Fund's securities against currency fluctuations. Risks may arise upon entering into these transactions from the potential inability of counterparties to meet the terms of their commitments and from unanticipated movements in security prices or foreign exchange rates. The foreign exchange contracts are adjusted by the daily exchange rate of the underlying currency and any gains or losses are recorded for financial statement purposes as unrealized until the settlement date.
Foreign exchange contracts are subject to Master Netting Agreements, which are agreements between the Fund and its counterparties that provide for the net settlement of all transactions and collateral with the Fund, through a single payment, in the event of default or termination. Amounts presented on the Portfolio of Investments and Statement of Assets and Liabilities are not net settlement amounts but gross.
Foreign exchange contracts outstanding at period end, including net unrealized appreciation/depreciation or net settlement amounts, are listed after the Fund's Portfolio of Investments.
The average value at settlement date payable of foreign exchange contracts purchased and sold by the Fund throughout the period was $39 and $14, respectively. This is based on the contracts held as of each month-end since the date of initial investment, January 30, 2017 through the period ended October 31, 2017.
Foreign Currency Translation
The accounting records of the Fund are maintained in U.S. dollars. All assets and liabilities denominated in foreign currencies are translated into U.S. dollars based on the rates of exchange of such currencies against U.S. dollars on the date of valuation. Purchases and sales of securities, income and expenses are translated at the rate of exchange quoted on the respective date that such transactions are recorded. The Fund does not isolate that portion of the results of operations resulting from changes in foreign exchange rates on investments from the fluctuations arising from changes in market prices of securities held. Such fluctuations are included with the net realized and unrealized gain or loss from investments.
Reported net realized foreign exchange gains or losses arise from sales of foreign currencies, currency gains or losses realized between the trade and settlement dates on securities transactions, the difference between the amounts of dividends, interest and foreign withholding taxes recorded on the Fund's books, and the U.S. dollar equivalent of the amounts actually received or paid. Net unrealized foreign exchange gains and losses arise from changes in the value of assets and liabilities other than investments in securities at fiscal year end, resulting from changes in the exchange rate.
Annual Shareholder Report
Additional Disclosure Related to Derivative Instruments
The Effect of Derivative Instruments on the Statement of Operations for the Period Ended October 31, 2017
| Amount of Realized Gain or (Loss) on Derivatives Recognized in Income |
| | Forward
Exchange
Contracts |
| Foreign exchange contracts | $(46) |
Other
The preparation of financial statements in conformity with GAAP requires management to make estimates and assumptions that affect the amounts of assets, liabilities, expenses and revenues reported in the financial statements. Actual results could differ from those estimated. The Fund applies investment company accounting and reporting guidance.
3. SHARES OF BENEFICIAL INTEREST
The following tables summarize share activity:
| Period Ended October 31 | 20171 |
| Class A Shares: | Shares | Amount |
| Shares sold | 25,287 | $133,592 |
| Shares issued to shareholders in payment of distributions declared | 352 | 1,876 |
| Shares redeemed | (86) | (458) |
| NET CHANGE RESULTING FROM CLASS A SHARE TRANSACTIONS | 25,553 | $135,010 |
| Period Ended October 31 | 20171 |
| Class C Shares: | Shares | Amount |
| Shares sold | 24,807 | $131,795 |
| Shares issued to shareholders in payment of distributions declared | 97 | 521 |
| Shares redeemed | (185) | (994) |
| NET CHANGE RESULTING FROM CLASS C SHARE TRANSACTIONS | 24,719 | $131,322 |
| Period Ended October 31 | 20171 |
| Institutional Shares: | Shares | Amount |
| Shares sold | 25,602 | $137,268 |
| Shares issued to shareholders in payment of distributions declared | 280 | 1,497 |
| NET CHANGE RESULTING FROM INSTITUTIONAL SHARE TRANSACTIONS | 25,882 | $138,765 |
Annual Shareholder Report
| Period Ended October 31 | 20171 |
| Class R6 Shares: | Shares | Amount |
| Shares sold | 200,020 | $1,000,100 |
| Shares issued to shareholders in payment of distributions declared | 4,655 | 24,766 |
| NET CHANGE RESULTING FROM CLASS R6 SHARE TRANSACTIONS | 204,675 | $1,024,866 |
| NET CHANGE RESULTING FROM TOTAL FUND SHARE TRANSACTIONS | 280,829 | $1,429,963 |
| 1 | Reflects operations for the period from January 30, 2017 (date of initial investment) to October 31, 2017. |
4. FEDERAL TAX INFORMATION
The timing and character of income and capital gain distributions are determined in accordance with income tax regulations, which may differ from GAAP. These differences are due to the differing treatments for foreign currency transactions.
For the period ended October 31, 2017, permanent differences identified and reclassified among the components of net assets were as follows:
| Increase (Decrease) |
Accumulated
Net Realized
Gain (Loss) | Undistributed
Net Investment
Income (Loss) |
| $3,463 | $(3,463) |
Net investment income (loss), net realized gains (losses) and net assets were not affected by the reclassification.
The tax character of distributions as reported on the Statement of Changes in Net Assets for the period ended October 31, 2017 was as follows:
| | 2017 |
| Ordinary income | $29,418 |
As of October 31, 2017, the components of distributable earnings on a tax basis were as follows:
| Undistributed ordinary income | $29,903 |
| Net unrealized appreciation | $48,531 |
The difference between book-basis and tax-basis net unrealized appreciation/depreciation is attributable to foreign currency gain (loss).
At October 31, 2017, the cost of investments for federal tax purposes was $1,583,351. The net unrealized appreciation of investments for federal tax purposes was $48,507. This consists of net unrealized appreciation from investments for those securities having an excess of value over cost of $94,092 and net unrealized depreciation from investments for those securities having an excess of cost over value of $45,585.
Annual Shareholder Report
5. INVESTMENT ADVISER FEE AND OTHER TRANSACTIONS WITH AFFILIATES
Investment Adviser Fee
The advisory agreement between the Fund and the Adviser provides for an annual fee equal to 0.75% of the Fund's average daily net assets. Subject to the terms described in the Expense Limitation note, the Adviser may voluntarily choose to waive any portion of its fee and/or reimburse certain operating expenses of the Fund. For the period ended October 31, 2017, the Adviser voluntarily waived $7,236 of its fee and voluntarily reimbursed $58 of transfer agent fees and $205,458 of other operating expenses. The Adviser has agreed to reimburse the Fund for certain investment adviser fees as a result of transactions in other affiliated investment companies. For the period ended October 31, 2017, the Adviser reimbursed $9.
Administrative Fee
Federated Administrative Services (FAS), under the Administrative Services Agreement, provides the Fund with administrative personnel and services. For purposes of determining the appropriate rate breakpoint, “Investment Complex” is defined as all of the Federated Funds subject to a fee under the Administrative Services Agreement. The fee paid to FAS is based on the average daily net assets of the Investment Complex as specified below, plus certain out-of-pocket expenses:
| Administrative Services Fee Rate | Average Daily Net Assets
of the Investment Complex |
| 0.100 | on assets up to $50 billion |
| 0.075 | on assets over $50 billion |
Subject to the terms described in the Expense Limitation note, FAS may voluntarily choose to waive any portion of its fee. For the period ended October 31, 2017, the annualized fee paid to FAS was 0.105% of average daily net assets of the Fund.
Prior to September 1, 2017 the breakpoints of the Administrative Fee paid to FAS, described above were:
| Administrative Fee | Average Daily Net Assets
of the Investment Complex |
| 0.150% | on the first $5 billion |
| 0.125% | on the next $5 billion |
| 0.100% | on the next $10 billion |
| 0.075% | on assets in excess of $20 billion |
In addition, FAS may charge certain out-of-pocket expenses to the Fund.
Annual Shareholder Report
Distribution Services Fee
The Fund has adopted a Distribution Plan (the “Plan”) pursuant to Rule 12b-1 under the Act. Under the terms of the Plan, the Fund will compensate Federated Securities Corp. (FSC), the principal distributor, from the daily net assets of the Fund's Class A Shares and Class C Shares to finance activities intended to result in the sale of these shares. The Plan provides that the Fund may incur distribution expenses at the following percentages of average daily net assets annually, to compensate FSC:
| Share Class Name | Percentage of Average Daily
Net Assets of Class |
| Class A Shares | 0.05% |
| Class C Shares | 0.75% |
Subject to the terms described in the Expense Limitation note, FSC may voluntarily choose to waive any portion of its fee. For the period ended October 31, 2017, distribution services fees for the Fund were as follows:
| | Distribution
Services Fees
Incurred |
| Class C Shares | $386 |
When FSC receives fees, it may pay some or all of them to financial intermediaries whose customers purchase shares. For the period ended October 31, 2017, FSC did not retain any fees paid by the Fund. For the period ended October 31, 2017, the Fund's Class A Shares did not incur a distribution services fee; however, it may begin to incur this fee upon approval of the Trustees.
Sales Charges
Front-end sales charges and contingent deferred sales charges (CDSC) do not represent expenses of the Fund. They are deducted from the proceeds of sales of Fund shares prior to investment or from redemption proceeds prior to remittance, as applicable. For the period ended October 31, 2017, FSC retained $83 in sales charges from the sale of Class A Shares.
Other Service Fees
For the period ended October 31, 2017, FSSC received $88 of other service fees disclosed in Note 2.
Annual Shareholder Report
Expense Limitation
The Adviser and certain of its affiliates (which may include FSC, FAS and FSSC) on their own initiative have agreed to waive certain amounts of their respective fees and/or reimburse expenses. Total annual fund operating expenses (as shown in the financial highlights, excluding tax reclaim recovery expenses, interest expense, extraordinary expenses and proxy-related expenses paid by the Fund, if any) paid by the Fund's Class A Shares, Class C Shares, Institutional Shares and Class R6 Shares (after the voluntary waivers and/or reimbursements) will not exceed 1.10%, 1.85%, 0.85% and 0.84% (the “Fee Limit”), respectively, up to but not including the later of (the “Termination Date”): (a) January 1, 2019; or (b) the date of the Fund's next effective Prospectus. While the Adviser and its applicable affiliates currently do not anticipate terminating or increasing these arrangements prior to the Termination Date, these arrangements may only be terminated or the Fee Limit increased prior to the Termination Date with the agreement of the Trustees.
General
Certain Officers and Trustees of the Fund are Officers and Directors or Trustees of certain of the above companies. To efficiently facilitate payment, Directors'/Trustees' fees and certain expenses related to conducting meetings of the Directors/Trustees and other miscellaneous expenses are paid by an affiliate of the Adviser which in due course are reimbursed by the Fund. These expenses related to conducting meetings of the Directors/Trustees and other miscellaneous expenses may be included in Accrued and Miscellaneous Expenses on the Statement of Assets and Liabilities and Statement of Operations, respectively.
Affiliated Shares of Beneficial Interest
As of October 31, 2017, a majority of the shares of beneficial interest outstanding are owned by an affiliate of the Adviser.
6. Investment TRANSACTIONS
Purchases and sales of investments, excluding long-term U.S. government securities and short-term obligations, for the period ended October 31, 2017, were as follows:
| Purchases | $1,781,638 |
| Sales | $271,593 |
7. CONCENTRATION OF RISK
The Fund invests in securities of non-U.S. issuers. Political or economic developments may have an effect on the liquidity and volatility of portfolio securities and currency holdings. The Fund may invest a portion of its assets in securities of companies that are deemed by the Fund's management to be classified in similar business sectors. Economic developments may have an effect on the liquidity and volatility of the portfolio securities.
Annual Shareholder Report
8. INTERFUND LENDING
Pursuant to an Exemptive Order issued by the Securities and Exchange Commission, the Fund, along with other funds advised by subsidiaries of Federated Investors, Inc., may participate in an interfund lending program. This program provides an alternative credit facility allowing the Fund to borrow from other participating affiliated funds. As of October 31, 2017, there were no outstanding loans. During the period ended October 31, 2017, the program was not utilized.
9. FEDERAL TAX INFORMATION (UNAUDITED)
For the fiscal period ended October 31, 2017, 100.0% of total ordinary income (including short-term capital gain) distributions made by the Fund are qualifying dividends which may be subject to a maximum tax rate of 15%, as provided for by the Jobs and Growth Tax Relief Act of 2003. Complete information is reported in conjunction with the reporting of your distributions on Form 1099-DIV.
Of the ordinary income (including short-term capital gain) distributions made by the Fund during the period ended October 31, 2017, 54.2% qualify for the dividend received deduction available to corporate shareholders.
Annual Shareholder Report
Report of Independent Registered Public Accounting Firm
TO THE BOARD OF Trustees OF Federated Equity Funds AND SHAREHOLDERS OF Federated Global Strategic Value Dividend Fund:
We have audited the accompanying statement of assets and liabilities, including the portfolio of investments, of Federated Global Strategic Value Dividend Fund (the “Fund”), a portfolio of Federated Equity Funds, as of October 31, 2017, and the related statements of operations and changes in net assets and financial highlights for the period January 30, 2017 (date of initial investment) to October 31, 2017. These financial statements and financial highlights are the responsibility of the Fund's management. Our responsibility is to express an opinion on these financial statements and financial highlights based on our audit.
We conducted our audit in accordance with standards of the Public Company Accounting Oversight Board (United States). Those standards require that we plan and perform the audit to obtain reasonable assurance about whether the financial statements and financial highlights are free of material misstatement. An audit includes examining, on a test basis, evidence supporting the amounts and disclosures in the financial statements. Our procedures included confirmation of securities owned as of October 31, 2017, by correspondence with the custodian, transfer agent and broker or by other appropriate auditing procedures. An audit also includes assessing the accounting principles used and estimates made by management, as well as evaluating the overall financial statement presentation. We believe that our audit provides a reasonable basis for our opinion.
In our opinion, the financial statements and financial highlights referred to above present fairly, in all material respects, the financial position of the Federated Global Strategic Value Dividend Fund, at October 31, 2017, the results of its operations, the changes in its net assets and the financial highlights for the period January 30, 2017 to October 31, 2017, in conformity with U.S. generally accepted accounting principles.
Boston, Massachusetts
December 22, 2017
Annual Shareholder Report
Shareholder Expense Example (unaudited)
As a shareholder of the Fund, you incur two types of costs: (1) transaction costs, including sales charges (“loads”) on purchase or redemption payments; and (2) ongoing costs, including management fees and to the extent applicable, distribution (12b-1) fees and/or other service fees and other Fund expenses. This Example is intended to help you to understand your ongoing costs (in dollars) of investing in the Fund and to compare these costs with the ongoing costs of investing in other mutual funds. It is based on an investment of $1,000 invested at the beginning of the period and held for the entire period from May 1, 2017 to October 31, 2017.
ACTUAL EXPENSES
The first section of the table below provides information about actual account values and actual expenses. You may use the information in this section, together with the amount you invested, to estimate the expenses that you incurred over the period. Simply divide your account value by $1,000 (for example, an $8,600 account value divided by $1,000 = 8.6), then multiply the result by the number in the first section under the heading entitled “Expenses Paid During Period” to estimate the expenses attributable to your investment during this period.
HYPOTHETICAL EXAMPLE FOR COMPARISON PURPOSES
The second section of the table below provides information about hypothetical account values and hypothetical expenses based on the Fund's actual expense ratio and an assumed rate of return of 5% per year before expenses, which is not the Fund's actual return. Thus, you should not use the hypothetical account values and expenses to estimate the actual ending account balance or your expenses for the period. Rather, these figures are required to be provided to enable you to compare the ongoing costs of investing in the Fund with other funds. To do so, compare this 5% hypothetical example with the 5% hypothetical examples that appear in the shareholder reports of the other funds.
Annual Shareholder Report
Please note that the expenses shown in the table are meant to highlight your ongoing costs only and do not reflect any transaction costs, such as sales charges (“loads”) on purchase or redemption payments. Therefore, the second section of the table is useful in comparing ongoing costs only, and will not help you determine the relative total costs of owning different funds. In addition, if these transaction costs were included, your costs would have been higher.
| | Beginning
Account Value
5/1/2017 | Ending
Account Value
10/31/2017 | Expenses Paid
During Period1 |
| Actual: | | | |
| Class A Shares | $1,000 | $1,050.90 | $5.69 |
| Class C Shares | $1,000 | $1,045.30 | $9.54 |
| Institutional Shares | $1,000 | $1,052.20 | $4.40 |
| Class R6 Shares | $1,000 | $1,052.20 | $4.29 |
Hypothetical (assuming a 5% return
before expenses): | | | |
| Class A Shares | $1,000 | $1,019.66 | $5.60 |
| Class C Shares | $1,000 | $1,015.88 | $9.40 |
| Institutional Shares | $1,000 | $1,020.92 | $4.33 |
| Class R6 Shares | $1,000 | $1,021.02 | $4.23 |
1 | Expenses are equal to the Fund's annualized net expense ratios, multiplied by the average account value over the period, multiplied by 184/365 (to reflect the one-half-year period). The annualized net expense ratios are as follows: |
| | |
| Class A Shares | 1.10% |
| Class C Shares | 1.85% |
| Institutional Shares | 0.85% |
| Class R6 Shares | 0.83% |
Annual Shareholder Report
In Memoriam
With profound sadness, Federated announces the passing of John F. (“Jack”) Donahue and John W. (“John”) McGonigle. They will be greatly missed.
Jack Donahue
(Former Chairman and President, and Emeritus Director/Trustee, of the Federated Funds, and Founder, Former Chairman, President and Chief Executive Officer, and Chairman Emeritus, of Federated Investors, Inc.)
Jack Donahue, along with Richard B. Fisher, founded Federated in 1955 and served as a leader and member of the Boards of Directors/Trustees of the Federated Funds and the Board of Directors of Federated Investors, Inc. Mr. Donahue was a family man of deep faith with exemplary character and fealty, who served his religion, family, community, and the Federated Funds and Federated, as well as their shareholders, officers and employees, with distinction. His integrity, intelligence, and keen sense of fiduciary duty, coupled with his faith, family and background as a West Point graduate and Strategic Air Command B-29 pilot, served as a foundation for his strong business acumen and leadership. Among his many achievements, Mr. Donahue's steadfast and innovative leadership of the Federated Funds and Federated, as well as within the investment management industry, led to the birth of money market funds in the 1970s and their growth as an innovative, efficient and effective cash management vehicle throughout the 1980s, 1990s, 2000s and beyond. Federated expresses deep gratitude to Mr. Donahue for his inspiring leadership, distinguished service and contributions as a husband, father, founder, Board member and officer, colleague and friend.
John McGonigle
(Former Secretary of the Federated Funds, Former Director, Secretary and Chief Legal Officer of Federated Investors, Inc.)
John McGonigle served the Federated Funds and their respective Boards with distinction for more than 50 years as Fund Secretary and also served as Director for several closed-end funds. Mr. McGonigle was a gifted lawyer and wise counselor with a genial presence, keen intellect and convivial demeanor. A man of deep faith, he was a devoted husband, father and grandfather. A graduate of Duquesne University School of Law, Mr. McGonigle served as an officer in the U.S. Army for two years, achieving the rank of Captain. He also served on the staff of the Securities and Exchange Commission before joining Federated in 1966. Among many professional accomplishments, Mr. McGonigle helped fashion the regulatory foundation for money market funds, established Federated's first offshore funds in Ireland, and represented Federated on the Board of Governors of the Investment Company Institute where he was a member of the Executive Committee. Federated expresses deep gratitude for Mr. McGonigle and his impact on his family, friends, the community, and the mutual fund industry.
Annual Shareholder Report
Board of Trustees and Trust Officers
The Board of Trustees is responsible for managing the Trust's business affairs and for exercising all the Trust's powers except those reserved for the shareholders. The following tables give information about each Trustee and the senior officers of the Fund. Where required, the tables separately list Trustees who are “interested persons” of the Fund (i.e., “Interested” Trustees) and those who are not (i.e., “Independent” Trustees). Unless otherwise noted, the address of each person listed is Federated Investors Tower, 1001 Liberty Avenue, Pittsburgh, PA 15222. The address of all Independent Trustees listed is 4000 Ericsson Drive, Warrendale, PA 15086-7561; Attention: Mutual Fund Board. As of December 31, 2016, the Trust comprised 14 portfolio(s), and the Federated Fund Family consisted of 40 investment companies (comprising 124 portfolios). Unless otherwise noted, each Officer is elected annually. Unless otherwise noted, each Trustee oversees all portfolios in the Federated Fund Family and serves for an indefinite term. The Fund's Statement of Additional Information includes additional information about Trust Trustees and is available, without charge and upon request, by calling 1-800-341-7400.
Interested TRUSTEES Background
Name
Birth Date
Positions Held with Trust
Date Service Began | Principal Occupation(s) for Past Five Years,
Other Directorships Held and Previous Position(s) |
J. Christopher Donahue*
Birth Date: April 11, 1949
President and Trustee
Indefinite Term
Began serving: September 1999 | Principal Occupations: Principal Executive Officer and President of certain of the Funds in the Federated Fund Family; Director or Trustee of the Funds in the Federated Fund Family; President, Chief Executive Officer and Director, Federated Investors, Inc.; Chairman and Trustee, Federated Investment Management Company; Trustee, Federated Investment Counseling; Chairman and Director, Federated Global Investment Management Corp.; Chairman and Trustee, Federated Equity Management Company of Pennsylvania; Trustee, Federated Shareholder Services Company; Director, Federated Services Company.
Previous Positions: President, Federated Investment Counseling; President and Chief Executive Officer, Federated Investment Management Company, Federated Global Investment Management Corp. and Passport Research, Ltd; Chairman, Passport Research, Ltd. |
Annual Shareholder Report
Name
Birth Date
Positions Held with Trust
Date Service Began | Principal Occupation(s) for Past Five Years,
Other Directorships Held and Previous Position(s) |
John B. Fisher*
Birth Date: May 16, 1956
Trustee
Indefinite Term
Began serving: May 2016 | Principal Occupations: Principal Executive Officer and President of certain of the Funds in the Federated Fund Family; Director or Trustee of certain of the Funds in the Federated Fund Family; Vice President, Federated Investors, Inc.; President, Director/Trustee and CEO, Federated Advisory Services Company, Federated Equity Management Company of Pennsylvania, Federated Global Investment Management Corp., Federated Investment Counseling, Federated Investment Management Company; President of some of the Funds in the Federated Fund Complex and Director, Federated Investors Trust Company.
Previous Positions: President and Director of the Institutional Sales Division of Federated Securities Corp.; President and Director of Federated Investment Counseling; President and CEO of Passport Research, Ltd.; Director, Edgewood Securities Corp.; Director, Federated Services Company; Director, Federated Investors, Inc.; Chairman and Director, Southpointe Distribution Services, Inc. and President, Technology, Federated Services Company. |
| * | Reasons for “interested” status: J. Christopher Donahue and John B. Fisher are interested due to their beneficial ownership of shares of Federated Investors, Inc. and due to positions they hold with Federated and its subsidiaries. |
INDEPENDENT TRUSTEES Background
Name
Birth Date
Positions Held with Trust
Date Service Began | Principal Occupation(s) for Past Five Years,
Other Directorships Held, Previous Position(s) and Qualifications |
John T. Collins
Birth Date: January 24, 1947
Trustee
Indefinite Term
Began serving: October 2013 | Principal Occupations: Director or Trustee of the Federated Fund Family; formerly, Chairman and CEO, The Collins Group, Inc. (a private equity firm) (Retired).
Other Directorships Held: Director, Current Chair of the Compensation Committee, KLX Corp.
Qualifications: Mr. Collins has served in several business and financial management roles and directorship positions throughout his career. Mr. Collins previously served as Chairman and CEO, The Collins Group, Inc. (a private equity firm). Mr. Collins serves as Chairman Emeriti, Bentley University. Mr. Collins previously served as Director and Audit Committee Member, Bank of America Corp.; Director, FleetBoston Financial Corp.; and Director, Beth Israel Deaconess Medical Center (Harvard University Affiliate Hospital). |
Annual Shareholder Report
Name
Birth Date
Positions Held with Trust
Date Service Began | Principal Occupation(s) for Past Five Years,
Other Directorships Held, Previous Position(s) and Qualifications |
G. Thomas Hough
Birth Date: February 28, 1955
Trustee
Indefinite Term
Began serving: August 2015 | Principal Occupations: Director or Trustee of the Federated Fund Family; formerly, Vice Chair, Ernst & Young LLP (public accounting firm) (Retired).
Other Directorships Held: Director, Chair of the Audit Committee, Governance Committee, Publix Super Markets, Inc.; Director, Member of the Audit Committee and Technology Committee of Equifax, Inc.
Qualifications: Mr. Hough has served in accounting, business management and directorship positions throughout his career. Mr. Hough most recently held the position of Americas Vice Chair of Assurance with Ernst & Young LLP (public accounting firm). Mr. Hough is an Executive Committee member of the United States Golf Association, he serves on the President's Cabinet and Business School Board of Visitors for the University of Alabama and is on the Business School Board of Visitors for Wake Forest University. |
Maureen Lally-Green
Birth Date: July 5, 1949
Trustee
Indefinite Term
Began serving: August 2009 | Principal Occupations: Director or Trustee of the Federated Fund Family; Dean of the Duquesne University School of Law; Adjunct Professor of Law, Duquesne University School of Law; formerly, Interim Dean of the Duquesne University School of Law; Associate General Secretary and Director, Office of Church Relations, Diocese of Pittsburgh.
Other Directorships Held: Director, CONSOL Energy Inc.
Qualifications: Judge Lally-Green has served in various legal and business roles and directorship positions throughout her career. Judge Lally-Green previously served as: Associate General Secretary, Diocese of Pittsburgh; a member of the Superior Court of Pennsylvania; and as a Professor of Law, Duquesne University School of Law. Judge Lally-Green also currently holds the positions on either a public or not for profit Board of Directors as follows: Director and Chair, UPMC Mercy Hospital; Regent, St. Vincent Seminary; Director and Vice Chair, Our Campaign for the Church Alive!, Inc.; Director, Saint Vincent College; Member, Pennsylvania State Board of Education (public); and Director and Chair, Cardinal Wuerl North Catholic High School, Inc. Judge Lally-Green has held the positions of: Director, Auberle; Director, Epilepsy Foundation of Western and Central Pennsylvania; Director, Ireland Institute of Pittsburgh; Director, Saint Thomas More Society; Director, Catholic High Schools of the Diocese of Pittsburgh, Inc.; and Director, Pennsylvania Bar Institute. |
Peter E. Madden
Birth Date: March 16, 1942
Trustee
Indefinite Term
Began serving: November 1991 | Principal Occupation: Director or Trustee, and Chair of the Board of Directors or Trustees, of the Federated Fund Family; Retired.
Other Directorships Held: None.
Qualifications: Mr. Madden has served in several business management, mutual fund services and directorship positions throughout his career. Mr. Madden previously served as President, Chief Operating Officer and Director, State Street Bank and Trust Company (custodian bank) and State Street Corporation (financial services). He was Director, VISA USA and VISA International and Chairman and Director, Massachusetts Bankers Association. Mr. Madden served as Director, Depository Trust Corporation and Director, The Boston Stock Exchange. Mr. Madden also served as a Representative to the Commonwealth of Massachusetts General Court. |
Annual Shareholder Report
Name
Birth Date
Positions Held with Trust
Date Service Began | Principal Occupation(s) for Past Five Years,
Other Directorships Held, Previous Position(s) and Qualifications |
Charles F. Mansfield, Jr.
Birth Date: April 10, 1945
Trustee
Indefinite Term
Began serving: January 1999 | Principal Occupations: Director or Trustee of the Federated Fund Family; Management Consultant.
Other Directorships Held: None.
Qualifications: Mr. Mansfield has served as a Marine Corps officer and in several banking, business management, educational roles and directorship positions throughout his long career. He remains active as a Management Consultant. |
Thomas M. O'Neill
Birth Date: June 14, 1951
Trustee
Indefinite Term
Began serving: August 2006 | Principal Occupations: Director or Trustee, Chair of the Audit Committee of the Federated Fund Family; Sole Proprietor, Navigator Management Company (investment and strategic consulting).
Other Directorships Held: None.
Qualifications: Mr. O'Neill has served in several business, mutual fund and financial management roles and directorship positions throughout his career. Mr. O'Neill serves as Director, Medicines for Humanity and Director, The Golisano Children's Museum of Naples, Florida. Mr. O'Neill previously served as Chief Executive Officer and President, Managing Director and Chief Investment Officer, Fleet Investment Advisors; President and Chief Executive Officer, Aeltus Investment Management, Inc.; General Partner, Hellman, Jordan Management Co., Boston, MA; Chief Investment Officer, The Putnam Companies, Boston, MA; Credit Analyst and Lending Officer, Fleet Bank; Director and Consultant, EZE Castle Software (investment order management software); and Director, Midway Pacific (lumber). |
P. Jerome Richey
Birth Date: February 23, 1949
Trustee
Indefinite Term
Began serving: October 2013 | Principal Occupations: Director or Trustee of the Federated Fund Family; Management Consultant; formerly, Senior Vice Chancellor and Chief Legal Officer, University of Pittsburgh and Executive Vice President and Chief Legal Officer, CONSOL Energy Inc.
Other Directorships Held: None.
Qualifications: Mr. Richey has served in several business and legal management roles and directorship positions throughout his career. Mr. Richey most recently held the positions of Senior Vice Chancellor and Chief Legal Officer, University of Pittsburgh. Mr. Richey previously served as Chairman of the Board, Epilepsy Foundation of Western Pennsylvania and Chairman of the Board, World Affairs Council of Pittsburgh. Mr. Richey previously served as Chief Legal Officer and Executive Vice President, CONSOL Energy Inc.; and Board Member, Ethics Counsel and Shareholder, Buchanan Ingersoll & Rooney PC (a law firm). |
Annual Shareholder Report
Name
Birth Date
Positions Held with Trust
Date Service Began | Principal Occupation(s) for Past Five Years,
Other Directorships Held, Previous Position(s) and Qualifications |
John S. Walsh
Birth Date: November 28, 1957
Trustee
Indefinite Term
Began serving: January 1999 | Principal Occupations: Director or Trustee of the Federated Fund Family; President and Director, Heat Wagon, Inc. (manufacturer of construction temporary heaters); President and Director, Manufacturers Products, Inc. (distributor of portable construction heaters); President, Portable Heater Parts, a division of Manufacturers Products, Inc.
Other Directorships Held: None.
Qualifications: Mr. Walsh has served in several business management roles and directorship positions throughout his career. Mr. Walsh previously served as Vice President, Walsh & Kelly, Inc. (paving contractors). |
OFFICERS
Name
Birth Date
Address
Positions Held with Trust
Date Service Began | Principal Occupation(s) for Past Five Years
and Previous Position(s) |
Lori A. Hensler
Birth Date: January 6, 1967
TREASURER
Officer since: April 2013 | Principal Occupations: Principal Financial Officer and Treasurer of the Federated Fund Family; Senior Vice President, Federated Administrative Services; Financial and Operations Principal for Federated Securities Corp. and Edgewood Services, Inc.; and Assistant Treasurer, Federated Investors Trust Company. Ms. Hensler has received the Certified Public Accountant designation.
Previous Positions: Controller of Federated Investors, Inc.; Senior Vice President and Assistant Treasurer, Federated Investors Management Company; Treasurer, Federated Investors Trust Company; Assistant Treasurer, Federated Administrative Services, Federated Administrative Services, Inc., Federated Securities Corp., Edgewood Services, Inc., Federated Advisory Services Company, Federated Equity Management Company of Pennsylvania, Federated Global Investment Management Corp., Federated Investment Counseling, Federated Investment Management Company, Passport Research, Ltd., and Federated MDTA, LLC; Financial and Operations Principal for Federated Securities Corp., Edgewood Services, Inc. and Southpointe Distribution Services, Inc. |
Richard B. Fisher
Birth Date: May 17, 1923
VICE PRESIDENT
Officer since: April 1987 | Principal Occupations: Vice Chairman or Vice President of some of the Funds in the Federated Fund Family; Vice Chairman, Federated Investors, Inc.; Chairman, Federated Securities Corp.
Previous Positions: President and Director or Trustee of some of the Funds in the Federated Fund Family; Executive Vice President, Federated Investors, Inc.; Director and Chief Executive Officer, Federated Securities Corp. |
Annual Shareholder Report
Name
Birth Date
Address
Positions Held with Trust
Date Service Began | Principal Occupation(s) for Past Five Years
and Previous Position(s) |
Peter J. Germain
Birth Date: September 3, 1959
CHIEF LEGAL OFFICER, SECRETARY and EXECUTIVE VICE PRESIDENT
Officer since: January 2005 | Principal Occupations: Mr. Germain is Chief Legal Officer, Secretary and Executive Vice President of the Federated Fund Family. He is General Counsel, Chief Legal Officer, Secretary and Executive Vice President, Federated Investors, Inc.; Trustee and Senior Vice President, Federated Investors Management Company; Trustee and President, Federated Administrative Services; Director and President, Federated Administrative Services, Inc.; Director and Vice President, Federated Securities Corp.; Director and Secretary, Federated Private Asset Management, Inc.; Secretary, Federated Shareholder Services Company; and Secretary, Retirement Plan Service Company of America. Mr. Germain joined Federated in 1984 and is a member of the Pennsylvania Bar Association.
Previous Positions: Deputy General Counsel, Special Counsel, Managing Director of Mutual Fund Services, Federated Investors, Inc.; Senior Vice President, Federated Services Company; and Senior Corporate Counsel, Federated Investors, Inc. |
Stephen Van Meter
Birth Date: June 5, 1975
CHIEF COMPLIANCE OFFICER AND SENIOR VICE PRESIDENT
Officer since: July 2015 | Principal Occupations: Senior Vice President and Chief Compliance Officer of the Federated Fund Family; Vice President and Chief Compliance Officer of Federated Investors, Inc. and Chief Compliance Officer of certain of its subsidiaries. Mr. Van Meter joined Federated in October 2011. He holds FINRA licenses under Series 3, 7, 24 and 66.
Previous Positions: Mr. Van Meter previously held the position of Compliance Operating Officer, Federated Investors, Inc. Prior to joining Federated, Mr. Van Meter served at the United States Securities and Exchange Commission in the positions of Senior Counsel, Office of Chief Counsel, Division of Investment Management and Senior Counsel, Division of Enforcement. |
Stephen F. Auth
Birth Date: September 13, 1956
101 Park Avenue
41st Floor
New York, NY 10178
CHIEF INVESTMENT OFFICER
Officer since: November 2002 | Principal Occupations: Stephen F. Auth is Chief Investment Officer of various Funds in the Federated Fund Family; Executive Vice President, Federated Investment Counseling, Federated Global Investment Management Corp. and Federated Equity Management Company of Pennsylvania.
Previous Positions: Executive Vice President, Federated Investment Management Company and Passport Research, Ltd. (investment advisory subsidiary of Federated); Senior Vice President, Global Portfolio Management Services Division; Senior Vice President, Federated Investment Management Company and Passport Research, Ltd.; Senior Managing Director and Portfolio Manager, Prudential Investments. |
Annual Shareholder Report
Evaluation and Approval of Advisory Contract–May 2017
Federated GLOBAL STRATEGIC VALUE DIVIDEND Fund (the “Fund”)
Following a review and recommendation of approval by the Fund's independent trustees, the Fund's Board of Trustees (the “Board”) reviewed and unanimously approved the Fund's investment advisory contract for an additional one-year term at its May 2017 meetings. Because the Fund did not yet have a meaningful operating history, the Board's decision to approve the contract reflects the exercise of its business judgment after consideration of all of the information received. The Board primarily considered whether to authorize the continued offering of this new investment vehicle, as originally proposed by, and based on information previously requested by the Board and provided by, Federated Investors, Inc. and its affiliates (“Federated”), and based on Federated's recommendation to go forward with the Fund.
The Board had previously appointed a Senior Officer, whose duties include specified responsibilities relating to the process by which advisory fees are to be charged to a Federated fund. The Senior Officer has the authority to retain consultants, experts, or staff as may be reasonably necessary to assist in the performance of his duties, reports directly to the Board, and may be terminated only with the approval of a majority of the independent members of the Board. The Senior Officer prepared and furnished to the Board an independent, written evaluation that covered topics discussed below (the “Senior Officer's Evaluation”). The Board considered the Senior Officer's Evaluation, along with other information, in deciding to approve the investment advisory contract.
The Board also considered judicial decisions concerning allegedly excessive investment advisory fees in its decision. Using these judicial decisions as a guide, the Board has indicated that the following factors may be relevant to an adviser's fiduciary duty with respect to its receipt of compensation from a fund: (1) the nature and quality of the services provided by an adviser to a fund and its shareholders (including the performance of the Fund and of comparable funds); (2) an adviser's cost of providing the services (including the profitability to an adviser of providing advisory services to a fund); (3) the extent to which an adviser may realize “economies of scale” as a fund grows larger and, if such economies of scale exist, whether they have been shared with a fund and its shareholders or the family of funds; (4) any “fall-out financial benefits” that accrue to an adviser because of its relationship with a fund (including research services received from brokers that execute fund trades and any fees paid to affiliates of an adviser for services rendered to a fund); (5) comparative fee and expense structures (including a comparison of fees paid to an adviser with those paid by similar funds); and (6) the extent of care, conscientiousness and independence with which the Fund's board members perform their duties and their expertise (including whether they are fully informed about all facts the Board deems relevant to its consideration of an adviser's services and fees). The
Annual Shareholder Report
Board noted that the Securities and Exchange Commission (“SEC”) disclosure requirements regarding the basis for the Board's approval of the Fund's investment advisory contract generally align with the factors listed above. Consistent with the judicial decisions and SEC disclosure requirements, the Board also considered management fees charged to institutional and other clients of Federated Equity Management Company of Pennsylvania (the “Adviser”) and its advisory affiliates for what might be viewed as like services. The Board was aware of these factors and was guided by them in its review of the Fund's investment advisory contract to the extent it considered them to be appropriate and relevant, as discussed further below.
The Board considered and weighed these factors in light of its substantial accumulated experience in working with Federated on matters relating to other Federated funds, and was assisted in its deliberations by independent legal counsel.
Since the inception of the Fund, the Board received detailed information about the Fund and Federated that is in addition to the materials that comprise and accompany the Senior Officer's Evaluation given to the Board in connection with its May meetings. Federated provided much of this information at each regular meeting of the Board occurring since the Fund's inception, and furnished additional information in connection with the May meetings, at which the Board's formal approval of the investment advisory contract initially occurred. At the May meetings, in addition to meeting in separate sessions of the independent trustees without management present, senior management of the Adviser also met with the independent trustees and their counsel to discuss the materials presented and any other matters thought relevant by the Adviser or the trustees. Between regularly scheduled meetings, the Board also received information on matters as the need arose.
The Board's consideration of the investment advisory contract included review of the Senior Officer's Evaluation, accompanying data and additional information covering such matters as: the Adviser's investment philosophy, revenue, profitability, personnel and processes; investment and operating strategies; the Fund's investment objectives; the Fund's expenses, including the advisory fee and the overall expense structure of the Fund (both in absolute terms and relative to similar and/or competing funds), with due regard for contractual or voluntary expense limitations; the use and allocation of brokerage commissions derived from trading the Fund's portfolio securities (if any); and the nature, quality and extent of the advisory and other services provided to the Fund by the Adviser and its affiliates. The Board also considered the preferences and expectations of Fund shareholders; the entrepreneurial risk assumed by the Adviser in sponsoring the Fund; the continuing state of competition in the mutual fund industry and market practices; the range of comparable fees for similar funds in the mutual fund industry; the Fund's relationship to the Federated funds which include a comprehensive array of funds with different investment objectives, policies and strategies which are generally available for
Annual Shareholder Report
exchange without the incurrence of additional sales charges; compliance and audit reports concerning the Federated funds and the Federated companies that service them (including communications from regulatory agencies), as well as Federated's responses to any issues raised therein; and relevant developments in the mutual fund industry and how the Federated funds and/or Federated are responding to them. The Board's evaluation process is evolutionary. The criteria considered and the emphasis placed on relevant criteria change in recognition of changing circumstances in the mutual fund marketplace
While mindful that courts have cautioned against giving such comparisons too much weight, the Board has found the use of comparisons of the Fund's fees and expenses to other mutual funds with comparable investment programs to be relevant to its deliberations. In this regard, the Board was presented with, and considered, information regarding the contractual advisory fee rates, net advisory fee rates, and total expense ratios relative to the Fund's peers. The Board focused on comparisons with other similar mutual funds more heavily than non-mutual fund products or services because it is believed that they are more relevant. For example, other mutual funds are the products most like the Fund, in that they are readily available to Fund shareholders as alternative investment vehicles. Also, they are the type of investment vehicle, in fact, chosen and maintained by the Fund's investors. The range of their fees and expenses, therefore, appears to be a relevant indicator of what consumers have found to be reasonable in the marketplace in which the Fund will compete.
It was noted in the materials for the Board meeting that for the period covered by the Senior Officer's Evaluation, the Fund's investment advisory fee was waived in its entirety. The Board reviewed the contractual advisory fee rate, net advisory fee rate and other expenses of the Fund with the Adviser and noted the position of the Fund's fee rates relative to its peers. In this regard, the Board noted that the contractual advisory fee rate was below the median of the relevant peer group and that the Board was satisfied that the overall expense structure of the Fund remained competitive.
For comparison, the Senior Officer also has reviewed Federated's fees for providing advisory services to products outside the Federated funds (e.g., institutional and separate accounts and sub-adviser services). He concluded that mutual funds and institutional accounts are inherently different products. Those differences include, but are not limited to, different types of targeted investors; being subject to different laws and regulations; different legal structures; different average account sizes and portfolio management techniques made necessary by different cash flows and different associated costs; and the time spent by portfolio managers and their teams, funds financial services, legal, compliance and risk management in reviewing securities pricing, addressing different administrative responsibilities, addressing different degrees of risk associated with management and a variety of different costs. The Senior Officer did not consider the fees for providing advisory services to these outside products to be determinative in judging the appropriateness of mutual fund advisory fees.
Annual Shareholder Report
Following such evaluation, and full deliberations, the Board concluded that the expenses of the Fund are reasonable and supported renewal of the Fund's investment advisory contract.
The Board considered the nature, extent and quality of the services provided to the Fund by the Adviser and the resources of the Adviser and its affiliates dedicated to the Fund. In this regard, the Board evaluated, among other things, the Adviser's personnel, experience, track record, overall reputation and willingness to invest in personnel and infrastructure that benefit the Fund. In addition, the Board reviewed the qualifications, backgrounds and responsibilities of the portfolio management team primarily responsible for the day-to-day management of the Fund. The Board noted the compliance programs of and the compliance-related resources provided to the Fund by the Adviser.
The Senior Officer reviewed information compiled by Federated, using data supplied by independent fund ranking organizations, regarding the fees charged by other mutual funds, noting his view that comparisons to fund peer groups may be helpful, though not conclusive, in judging the reasonableness of the proposed fees. The Board considered, in evaluating such comparisons, that in some cases individual funds may exhibit significant and unique differences in their objectives and management techniques when compared to other funds within an industry peer group.
The Board recognizes that the factors mentioned above (relating to such matters as Fund performance and any indirect benefits that may accrue to the Adviser and its affiliates as a result of the Adviser's relationship with the Fund) are essentially impossible to apply before the Fund has experienced any meaningful operating history. Nevertheless, the Board monitors the Fund's performance quarterly as information becomes available. Moreover, in connection with the Board's governance of other Federated funds, it should be noted that the Board regularly receives financial information about Federated, including information regarding the compensation and ancillary (or “fall-out”) benefits Federated derived from its relationships with the Federated funds. This information covered not only the fees under the investment advisory contracts, but also fees received by Federated's subsidiaries for providing other services to the Federated funds under separate contracts (e.g., for serving as the Federated funds' administrator). The information also detailed any indirect benefit Federated may derive from its receipt of research services from brokers who execute Federated fund trades. In addition, the Board considered the fact that, in order for a fund to be competitive in the marketplace, Federated and its affiliates frequently waived fees and/or reimbursed expenses and have disclosed to fund investors and/or indicated to the Board their intention to do so in the future. Moreover, the Board receives regular reporting as to the institution, adjustment or elimination of these voluntary waivers. The Board considered Federated's previous reductions in contractual management fees to certain funds in response to the Senior Officer's recommendations.
Annual Shareholder Report
The Board and the Senior Officer also reviewed information compiled by Federated comparing its profitability information to other publicly held fund management companies. In this regard, the Senior Officer concluded that Federated's profit margins did not appear to be excessive. The Senior Officer also noted that Federated appeared financially sound, with the resources to fulfill its obligations under its contracts with the Fund.
The Senior Officer's Evaluation also discussed the notion of possible realization of “economies of scale” as a fund grows larger. In this regard, the Board considered that the Adviser has made significant and long-term investments in areas that support all of the Federated funds, such as personnel and processes for the portfolio management, shareholder services, compliance, internal audit, and risk management functions, as well as systems technology (including technology relating to cybersecurity) and that the benefits of these efforts (as well as any economies of scale, should they exist) were likely to be enjoyed by the fund family as a whole. The Board noted that the Adviser's investments in these areas are extensive. In addition, the Board considered that Federated and its affiliates have frequently waived fees and/or reimbursed expenses and that this has allowed fund shareholders to share potential economies of scale from a fund's inception. Federated, as it does throughout the year, and in connection with the Board's review, furnished information relative to revenue sharing or adviser paid fees. Federated and the Senior Officer noted that this information should be viewed to determine if there was an incentive to either not apply breakpoints. or to apply breakpoints at higher levels. It should not be viewed to determine the appropriateness of advisory fees because it would represent marketing and distribution expenses. Finally, the Board also noted the absence of any applicable regulatory or industry guidelines on this subject, which (as discussed in the Senior Officer's Evaluation) is compounded by the lack of any common industry practice or general pattern with respect to structuring fund advisory fees with “breakpoints” that serve to reduce the fee as a fund attains a certain size.
While the Senior Officer noted certain items for follow-up reporting to the Board and further consideration by management, he stated that his observations and information accompanying the Senior Officer's Evaluation supported a finding by the Board that the management fee for the Fund was reasonable. The Senior Officer noted that, subject to the comments and recommendations made within the Senior Officer's Evaluation, his observations and the information accompanying the Senior Officer's Evaluation supported a finding by the Board that the management fee for the Fund was reasonable. With due regard for the fact that the Fund did not yet have a meaningful operating history, the Board concluded that the nature, quality and scope of services provided the Fund by the Adviser and its affiliates were satisfactory. Under these circumstances, no changes were recommended to, and no objection was raised to the continuation of, the Fund's investment advisory contract.
Annual Shareholder Report
In its decision to continue an existing investment advisory contract, the Board was mindful of the potential disruptions of the Fund's operations and various risks, uncertainties and other effects that could occur as a result of a decision to terminate or not renew an investment advisory contract. In particular, the Board recognized that many of the shareholders that have invested in the Fund since its inception may have done so on the strength of the Adviser's industry standing and reputation and with the expectation that the Adviser will have a continuing role in providing advisory services to the Fund. Thus, the Board's approval of the investment advisory contract reflected the fact that it is the shareholders who have effectively selected the Adviser by virtue of having invested in the Fund.
The Board based its decision to approve the investment advisory contract on the totality of the circumstances and relevant factors, and with a view to past and future long-term considerations. Not all of the factors and considerations identified above were necessarily relevant to the Fund, nor did the Board consider any one of them to be determinative. With respect to the factors that were relevant, the Board's decision to approve the continuation of the contract reflects its determination that, Federated's performance and actions provided a satisfactory basis to support the decision to continue the existing arrangement.
Annual Shareholder Report
Voting Proxies on Fund Portfolio Securities
A description of the policies and procedures that the Fund uses to determine how to vote proxies, if any, relating to securities held in the Fund's portfolio is available, without charge and upon request, by calling 1-800-341-7400. A report on “Form N-PX” of how the Fund voted any such proxies during the most recent 12-month period ended June 30 is available via the Proxy Voting Record (Form N-PX) link associated with the Fund and share class name at www.FederatedInvestors.com/FundInformation. Form N-PX filings are also available at the SEC's website at www.sec.gov.
Quarterly Portfolio Schedule
The Fund files with the SEC a complete schedule of its portfolio holdings, as of the close of the first and third quarters of its fiscal year, on “Form N-Q.” These filings are available on the SEC's website at www.sec.gov and may be reviewed and copied at the SEC's Public Reference Room in Washington, DC. (Call 1-800-SEC-0330 for information on the operation of the Public Reference Room.) You may also access this information via the link to the Fund and share class name at www.FederatedInvestors.com/FundInformation.
Annual Shareholder Report
Mutual funds are not bank deposits or obligations, are not guaranteed by any bank and are not insured or guaranteed by the U.S. government, the Federal Deposit Insurance Corporation, the Federal Reserve Board or any other government agency. Investment in mutual funds involves investment risk, including the possible loss of principal.
This Report is authorized for distribution to prospective investors only when preceded or accompanied by the Fund's Prospectus, which contains facts concerning its objective and policies, management fees, expenses and other information.
Federated Global Strategic Value Dividend Fund
Federated Investors Funds
4000 Ericsson Drive
Warrendale, PA 15086-7561
Contact us at FederatedInvestors.com
or call 1-800-341-7400.
Federated Securities Corp., Distributor
CUSIP 31421N865
CUSIP 31421N857
CUSIP 31421N840
CUSIP 31421N832
Q453249 (12/17)
Federated is a registered trademark of Federated Investors, Inc.
2017 ©Federated Investors, Inc.
(a) As of the end of the period covered by this report, the registrant has adopted a code of ethics (the "Section 406 Standards for Investment Companies - Ethical Standards for Principal Executive and Financial Officers") that applies to the registrant's Principal Executive Officer and Principal Financial Officer; the registrant's Principal Financial Officer also serves as the Principal Accounting Officer.
(c) There was no amendment to the registrant’s code of ethics described in Item 2(a) above during the period covered by the report.
(d) There was no waiver granted, either actual or implicit, from a provision to the registrant’s code of ethics described in Item 2(a) above during the period covered by the report.
(e) Not Applicable
(f)(3) The registrant hereby undertakes to provide any person, without charge, upon request, a copy of the code of ethics. To request a copy of the code of ethics, contact the registrant at 1-800-341-7400, and ask for a copy of the Section 406 Standards for Investment Companies - Ethical Standards for Principal Executive and Financial Officers.
Item 3. Audit Committee Financial Expert
The registrant's Board has determined that each of the following members of the Board's Audit Committee is an “audit committee financial expert,” and is "independent," for purposes of this Item: John T. Collins, G. Thomas Hough and Thomas M. O'Neill.
| Item 4. | Principal Accountant Fees and Services |
(a) Audit Fees billed to the registrant for the two most recent fiscal years:
Fiscal year ended 2017 - $475,100
Fiscal year ended 2016 - $459,393
(b) Audit-Related Fees billed to the registrant for the two most recent fiscal years:
Fiscal year ended 2017 - $30,293
Fiscal year ended 2016 - $7,775
Fiscal year ended 2017- Audit consent fees for N-1A filings.
Fiscal year ended 2016- Audit consent fees for N-1A filings.
Amount requiring approval of the registrant’s audit committee pursuant to paragraph (c)(7)(ii) of Rule 2-01 of Regulation S-X, $10,992 and $0 respectively. Fiscal year ended 2017- Audit consents for N-14 merger documents.
(c) Tax Fees billed to the registrant for the two most recent fiscal years:
Fiscal year ended 2017 - $11,500
Fiscal year ended 2016 - $23,000
Fiscal year ended 2017- Service fee for tax reclaim recovery filings.
Fiscal year ended 2016- Service fee for tax reclaim recovery filings.
Amount requiring approval of the registrant’s audit committee pursuant to paragraph (c)(7)(ii) of Rule 2-01 of Regulation S-X, $0 and $0 respectively.
(d) All Other Fees billed to the registrant for the two most recent fiscal years:
Fiscal year ended 2017 - $0
Fiscal year ended 2016 - $0
Amount requiring approval of the registrant’s audit committee pursuant to paragraph (c)(7)(ii) of Rule 2-01 of Regulation S-X, $44,985 and $41,616 respectively. Fiscal year ended 2017- Service fee for analysis of potential Passive Foreign Investment Company holdings. Fiscal year ended 2016- Service fee for analysis of potential Passive Foreign Investment Company holdings.
(e)(1) Audit Committee Policies regarding Pre-approval of Services.
The Audit Committee is required to pre-approve audit and non-audit services performed by the independent auditor in order to assure that the provision of such services do not impair the auditor’s independence. Unless a type of service to be provided by the independent auditor has received general pre-approval, it will require specific pre-approval by the Audit Committee. Any proposed services exceeding pre-approved cost levels will require specific pre-approval by the Audit Committee.
Certain services have the general pre-approval of the Audit Committee. The term of the general pre-approval is 12 months from the date of pre-approval, unless the Audit Committee specifically provides for a different period. The Audit Committee will annually review the services that may be provided by the independent auditor without obtaining specific pre-approval from the Audit Committee and may grant general pre-approval for such services. The Audit Committee will revise the list of general pre-approved services from time to time, based on subsequent determinations. The Audit Committee will not delegate its responsibilities to pre-approve services performed by the independent auditor to management.
The Audit Committee has delegated pre-approval authority to its Chairman. The Chairman will report any pre-approval decisions to the Audit Committee at its next scheduled meeting. The Committee will designate another member with such pre-approval authority when the Chairman is unavailable.
AUDIT SERVICES
The annual Audit services engagement terms and fees will be subject to the specific pre-approval of the Audit Committee. The Audit Committee must approve any changes in terms, conditions and fees resulting from changes in audit scope, registered investment company (RIC) structure or other matters.
In addition to the annual Audit services engagement specifically approved by the Audit Committee, the Audit Committee may grant general pre-approval for other Audit Services, which are those services that only the independent auditor reasonably can provide. The Audit Committee has pre-approved certain Audit services, all other Audit services must be specifically pre-approved by the Audit Committee.
AUDIT-RELATED SERVICES
Audit-related services are assurance and related services that are reasonably related to the performance of the audit or review of the Company’s financial statements or that are traditionally performed by the independent auditor. The Audit Committee believes that the provision of Audit-related services does not impair the independence of the auditor, and has pre-approved certain Audit-related services, all other Audit-related services must be specifically pre-approved by the Audit Committee.
TAX SERVICES
The Audit Committee believes that the independent auditor can provide Tax services to the Company such as tax compliance, tax planning and tax advice without impairing the auditor’s independence. However, the Audit Committee will not permit the retention of the independent auditor in connection with a transaction initially recommended by the independent auditor, the purpose of which may be tax avoidance and the tax treatment of which may not be supported in the Internal Revenue Code and related regulations. The Audit Committee has pre-approved certain Tax services, all Tax services involving large and complex transactions must be specifically pre-approved by the Audit Committee.
ALL OTHER SERVICES
With respect to the provision of services other than audit, review or attest services the pre-approval requirement is waived if:
| (1) | The aggregate amount of all such services provided constitutes no more than five percent of the total amount of revenues paid by the registrant, the registrant’s adviser (not including any sub-adviser whose role is primarily portfolio management and is subcontracted with or overseen by another investment adviser), and any entity controlling, controlled by, or under common control with the investment adviser that provides ongoing services to the registrant to its accountant during the fiscal year in which the services are provided; |
| (2) | Such services were not recognized by the registrant, the registrant’s adviser (not including any sub-adviser whose role is primarily portfolio management and is subcontracted with or overseen by another investment adviser), and any entity controlling, controlled by, or under common control with the investment adviser that provides ongoing services to the registrant at the time of the engagement to be non-audit services; and |
| (3) | Such services are promptly brought to the attention of the Audit Committee of the issuer and approved prior to the completion of the audit by the Audit Committee or by one or more members of the Audit Committee who are members of the board of directors to whom authority to grant such approvals has been delegated by the Audit Committee. |
The Audit Committee may grant general pre-approval to those permissible non-audit services classified as All Other services that it believes are routine and recurring services, and would not impair the independence of the auditor.
The SEC’s rules and relevant guidance should be consulted to determine the precise definitions of prohibited non-audit services and the applicability of exceptions to certain of the prohibitions.
PRE-APPROVAL FEE LEVELS
Pre-approval fee levels for all services to be provided by the independent auditor will be established annually by the Audit Committee. Any proposed services exceeding these levels will require specific pre-approval by the Audit Committee.
PROCEDURES
Requests or applications to provide services that require specific approval by the Audit Committee will be submitted to the Audit Committee by both the independent auditor and the Principal Accounting Officer and/or Internal Auditor, and must include a joint statement as to whether, in their view, the request or application is consistent with the SEC’s rules on auditor independence.
(e)(2) Percentage of services identified in items 4(b) through 4(d) that were approved by the registrants audit committee pursuant to paragraph (c)(7)(i)(C) of Rule 2-01 of Regulation S-X:
4(b)
Fiscal year ended 2017 – 0%
Fiscal year ended 2016 - 0%
Percentage of services provided to the registrants investment adviser and any entity controlling, controlled by, or under common control with the investment adviser that provides ongoing services to the registrant that were approved by the registrants audit committee pursuant to paragraph (c)(7)(i)(C) of Rule 2-01 of Regulation S-X, 0% and 0% respectively.
4(c)
Fiscal year ended 2017 – 0%
Fiscal year ended 2016 – 0%
Percentage of services provided to the registrants investment adviser and any entity controlling, controlled by, or under common control with the investment adviser that provides ongoing services to the registrant that were approved by the registrants audit committee pursuant to paragraph (c)(7)(i)(C) of Rule 2-01 of Regulation S-X, 0% and 0% respectively.
4(d)
Fiscal year ended 2017 – 0%
Fiscal year ended 2016 – 0%
Percentage of services provided to the registrants investment adviser and any entity controlling, controlled by, or under common control with the investment adviser that provides ongoing services to the registrant that were approved by the registrants audit committee pursuant to paragraph (c)(7)(i)(C) of Rule 2-01 of Regulation S-X, 0% and 0% respectively.
| (g) | Non-Audit Fees billed to the registrant, the registrant’s investment adviser, and certain entities controlling, controlled by or under common control with the investment adviser: |
Fiscal year ended 2017 - $289,387
Fiscal year ended 2016 - $307,978
| (h) | The registrant’s Audit Committee has considered that the provision of non-audit services that were rendered to the registrant’s adviser (not including any sub-adviser whose role is primarily portfolio management and is subcontracted with or overseen by another investment adviser), and any entity controlling, controlled by, or under common control with the investment adviser that provides ongoing services to the registrant that were not pre-approved pursuant to paragraph (c)(7)(ii) of Rule 2-01 of Regulation S-X is compatible with maintaining the principal accountant’s independence. |
In their respective required communications to the Audit Committee of the registrant’s Board, Ernst & Young LLP (“EY”) and KPMG LLP (“KPMG”) (as applicable, “EY/KPMG”), the registrant’s independent public accountants, informed the Audit Committee that EY/KPMG and/or covered person professionals within EY/KPMG maintain lending relationships with certain owners of greater than 10% of the shares of the registrant and/or certain investment companies within the “investment company complex” as defined under Rule 2-01(f)(14) of Regulation S-X, which are affiliates of the registrant. EY/KPMG has advised the Audit Committee that these lending relationships implicate Rule 2-01(c)(1)(ii)(A) of Regulation S-X (referred to as the “Loan Rule”). The Loan Rule prohibits an independent public accountant, or covered person professionals at such firm, from having a financial relationship (such as a loan) with a lender that is a record or beneficial owner of more than 10% of an audit client’s equity securities. For purposes of the Loan Rule, audit clients include the registrant, as well as all registered investment companies advised by advisory subsidiaries of Federated Investors, Inc., the Adviser (for which EY serves as independent public accountant), and their respective affiliates (collectively, the “Federated Fund Complex”).
EY/KPMG informed the Audit Committee that EY/KPMG believes that these lending relationships described above do not and will not impair EY/KPMG’s ability to exercise objective and impartial judgment in connection with financial statement audits of their respective funds of the registrant and a reasonable investor with knowledge of all relevant facts and circumstances would conclude that EY/KPMG has been and is capable of objective and impartial judgment on all issues encompassed within EY/KPMG’s audits.
On June 20, 2016, the Division of Investment Management of the Securities and Exchange Commission (“SEC”) issued a no-action letter to another mutual fund complex (see Fidelity Management & Research Company et al., No-Action Letter) related to similar Loan Rule matters as those described above (the “Letter”). In the Letter, the SEC Staff confirmed that it would not recommend enforcement action against an investment company that relied on the audit services performed by an independent public accountant where the Loan Rule was implicated in certain specified circumstances provided that: (1) the auditor has complied with PCAOB Rule 3526(b)(1) and 3526(b)(2); (2) the Loan Rule is implicated because of lending relationships; and (3) notwithstanding such lending relationships that implicate the Loan Rule, the auditor has concluded that it is objective and impartial with respect to the issues encompassed within its engagement as auditor of the funds. The circumstances described in the Letter are substantially similar to the circumstances that implicated the Loan Rule with respect to EY/KPMG and the registrant. On September 22, 2017, the SEC issued another no-action letter to Fidelity Management & Research Company et al extending the expiration of the Letter until the effectiveness of any amendments to the Loan Rule designed to address the concerns in the Letter (the “Letters”).
If it were to be determined that the relief available under the Letters was improperly relied upon, or that the independence requirements under the federal securities laws were not otherwise complied with regarding the registrant, for certain periods, any of the registrant’s filings with the SEC which contain financial statements of the registrant for such periods may not comply with applicable federal securities laws, the registrant’s ability to offer shares under its current registration statement may be impacted, and certain financial reporting and/or other covenants with, and representations and warranties to, the registrant’s lender under its committed line of credit may be impacted. Such events could have a material adverse effect on the registrant and the Federated Fund Complex.
| Item 5. | Audit Committee of Listed Registrants |
Not Applicable
| Item 6. | Schedule of Investments |
(a) The registrant’s Schedule of Investments is included as part of the Report to Stockholders filed under Item 1 of this form.
(b) Not Applicable; Fund had no divestments during the reporting period covered since the previous Form N-CSR filing.
| Item 7. | Disclosure of Proxy Voting Policies and Procedures for Closed-End Management Investment Companies |
Not Applicable
| Item 8. | Portfolio Managers of Closed-End Management Investment Companies |
Not Applicable
| Item 9. | Purchases of Equity Securities by Closed-End Management Investment Company and Affiliated Purchasers |
Not Applicable
| Item 10. | Submission of Matters to a Vote of Security Holders |
No Changes to Report
| Item 11. | Controls and Procedures |
(a) The registrant’s President and Treasurer have concluded that the
registrant’s disclosure controls and procedures (as defined in rule 30a-3(c) under the Act) are effective in design and operation and are sufficient to form the basis of the certifications required by Rule 30a-(2) under the Act, based on their evaluation of these disclosure controls and procedures within 90 days of the filing date of this report on Form N-CSR.
(b) There were no changes in the registrant’s internal control over financial reporting (as defined in rule 30a-3(d) under the Act) during the second fiscal quarter of the period covered by this report that have materially affected, or are reasonably likely to materially affect, the registrant’s internal control over financial reporting.
| Item 12. | Disclosure of Securities Lending Activities for Closed-End Management Investment Companies |
Not Applicable
(a)(1) Code of Ethics- Not Applicable to this Report.
(a)(2) Certifications of Principal Executive Officer and Principal Financial Officer.
(a)(3) Not Applicable.
(b) Certifications pursuant to 18 U.S.C. Section 1350.
SIGNATURES
Pursuant to the requirements of the Securities Exchange Act of 1934 and the Investment Company Act of 1940, the registrant has duly caused this report to be signed on its behalf by the undersigned, thereunto duly authorized.
Registrant Federated Equity Funds
By /S/ Lori A. Hensler
Lori A. Hensler, Principal Financial Officer
Date December 22, 2017
Pursuant to the requirements of the Securities Exchange Act of 1934 and the Investment Company Act of 1940, this report has been signed below by the following persons on behalf of the registrant and in the capacities and on the dates indicated.
By /S/ J. Christopher Donahue
J. Christopher Donahue, Principal Executive Officer
Date December 22, 2017
By /S/ Lori A. Hensler
Lori A. Hensler, Principal Financial Officer
Date December 22, 2017