United States
Securities and Exchange Commission
Washington, D.C. 20549
Form N-CSR
Certified Shareholder Report of Registered Management Investment Companies
811-4017
(Investment Company Act File Number)
Federated Equity Funds
_______________________________________________________________
(Exact Name of Registrant as Specified in Charter)
Federated Investors Funds
4000 Ericsson Drive
Warrendale, Pennsylvania 15086-7561
(Address of Principal Executive Offices)
(412) 288-1900
(Registrant's Telephone Number)
John W. McGonigle, Esquire
Federated Investors Tower
1001 Liberty Avenue
Pittsburgh, Pennsylvania 15222-3779
(Name and Address of Agent for Service)
(Notices should be sent to the Agent for Service)
Date of Fiscal Year End: 11/30/16
Date of Reporting Period: 11/30/16
Item 1. Reports to Stockholders

Annual Shareholder Report
November 30, 2016
| Share Class | Ticker |
| Institutional | FGLEX |
Federated Emerging Markets Equity Fund
A Portfolio of Federated Equity Funds
Not FDIC Insured • May Lose Value • No Bank Guarantee
CONTENTS
| 1 |
| 9 |
| 11 |
| 18 |
| 19 |
| 20 |
| 21 |
| 22 |
| 34 |
| 35 |
| 36 |
| 42 |
| 48 |
| 48 |
Management's Discussion of Fund Performance (unaudited)
The total return of the Federated Emerging Markets Equity Fund (the “Fund”), based on net asset value for the 12-month reporting period ended November 30, 2016, was 5.74% for the Institutional Shares. The return of the Fund's benchmark, the Morgan Stanley Capital International Emerging Markets Index1 (MSCI EM), a broad-based securities market index, was 8.47% for the same period. The Fund's total return for the most recently completed fiscal year reflected actual cash flows, transaction costs and other expenses which were not reflected in the total return of the MSCI EM.
During the reporting period, the Fund's investment strategy focused on: (a) country allocation;2 (b) stock selection; and (c) currency allocation. These were the most significant factors affecting the performance relative to the MSCI EM.
MARKET OVERVIEW
International equity markets performance was mixed over the reporting period as initial fears of a financial crisis in China and a downturn in commodity prices was replaced by better-than-expected economic data, renewing optimism as both global growth improved and monetary policy remained supportive. China stabilized, and other emerging economies showed signs of economic recovery. During the reporting period, markets experienced volatility as unexpected political events roiled stocks and currencies. Overall, the early downturn in equity and commodity markets was followed by a broad rally. Global growth expectations steadily improved during the second half of the reporting period, and concerns about widespread deflation subsided partially due to OPEC's agreement for an output cut at its November meeting. For the reporting period, emerging markets (EM), as measured by the MSCI EM, led the non-U.S. equity market benchmarks, rising a robust 8.47%. Developed non-U.S. markets, as measured by the MSCI EAFE Index,3 declined -3.66%, while the MSCI USA Index4 rose 7.02% for the reporting period.
During the reporting period, global equity markets were supported by accommodative monetary policies as major central banks recommitted to price stability with new rate cuts and additional quantitative easing outside the U.S. Japan joined Sweden, Denmark, Switzerland and the European Central Bank (ECB) when it cut its benchmark rate below zero percent. Central banks followed a negative interest rate policy in a continued effort to fight deflation and encourage economic growth. Given the muted outlook for global growth and prices, the Federal Reserve (the “Fed”) held rates steady at its March and June Federal Open Market Committee (FOMC) meetings. The dovish FOMC policy statements indicated that the Fed would follow a slower path of interest rate increases and would be less aggressive in normalizing interest rates. Overall, the monetary policies in place were supportive of price appreciation and
Annual Shareholder Report
improving economic activity. At the end of the reporting period, expectations were for the Fed to remain dovish with one hike in 2016 and three next year. Meanwhile in Europe and Japan, negative rates and quantitative easing were expected to remain in place for an extended period.
The European equity market, as measured by the MSCI AC Europe Index,5 returned -2.14% in local terms, but only returned -7.33% for U.S. dollar-based investors due to the strong U.S. dollar. In Europe, equity markets initially declined as continued turmoil in the Middle East and the ongoing refugee crisis in the region hurt sentiment. Despite the geopolitical turmoil, the euro area aggregate manufacturing Purchasing Managers' Index (PMI) remained in expansionary territory throughout the first half of the year. As the European market rallied back from the February lows, volatility renewed when the U.K. voted in favor of a referendum to leave the European Union (EU), also known as “Brexit.” Initially following the unexpected Brexit vote, global equity markets fell, and the U.S. dollar strengthened. This drag on European equity markets reversed swiftly in July, as economic data continued to positively surprise in the region. Heading into the fourth quarter of 2016, reported data, including PMIs and consumption spending, suggested solid growth ahead. Additionally, investors had time to digest Brexit economic implications on both country and corporate levels, which reduced initial uncertainty. The government's swift actions and fresh stimulus measures from the ECB and Bank of England provided market relief as the U.K. continued progress toward a formal EU exit. Strong European economic data suggested that the EU did not have much to fear from Brexit although political headwinds remained at the end of the reporting period.
The Chinese equity market, as measured by the MSCI China Index,6 rose 3.83% during the reporting period. After an uncertain start to the year, China's equity markets stabilized and its economy appeared to grow modestly, as domestic consumption, in line with new economy companies and real estate, showed strength. Real GDP growth in China remained constant at 6.7% for three straight quarters despite pressure from old economy companies, such as those in cement and steel, which have experienced a long-term secular decline as the country has continued its economic transformation from one dependent on high fixed asset investment to one reliant on consumption and services. Poor policy decisions by the central government spooked investors earlier in the year, but those fears abated as officials appeared to learn from their mistakes. The renminbi continued to depreciate, but in a more measured and orderly fashion than the prior year's sudden devaluation. The impact from earlier stimulus measures appeared to be slowly taking effect. The expectation that concern about the high level of corporate debt will continue to overhang the market persisted; however, the Chinese government demonstrated that rising non-performing loan issues will be managed in an orderly fashion, and policymakers
Annual Shareholder Report
added measures to contain the hot property market. As a result, there was an expectation that economic and social stability should be maintained and that the world's second largest economy would continue to aid growth in the rest of the Asian region.
Economic stability in China during the latter half of the year positively impacted South Korea, which experienced an overall recovery in exports following a contraction last year. In Taiwan, as in South Korea, an overall recovery in export orders helped improve the overall growth outlook. During the year, the MSCI Taiwan6 and MSCI South Korea6 rose 19.14% and 6.16%, respectively. An economic bright spot within emerging markets was South East Asia. Solid domestic demand drove recoveries in India, Indonesia and Thailand, which were also boosted by more responsible monetary and fiscal policies, and renewed political stability. While cyclical economic forces improved, general structural change and reform helped boost sentiment, with Thailand and Indonesia outperforming India, as evidenced by the returns of the MSCI Thailand (14.55%), MSCI Indonesia (16.67%) and MSCI India (1.06%) indices.6
The Latin American equity market, as measured by the MSCI EM Latin America,7 was the top performing region with a strong return of 24.4% for the reporting period. In Latin America, the outlook for Brazil and Mexico changed significantly during the year. In Brazil, months of political crisis ended following the impeachment of President Dilma Rouseff and the swearing in of interim President Michel Temer. President Temer introduced a plan for additional economic, budgetary and social reforms aimed at countering the high inflation, rising public debt and recession that has plagued Brazil in recent years. Brazil's central bank began a new easing cycle in the fourth quarter, with two 25 bps rate cuts. These policies created expectations of a swing in real GDP growth from -3.3% this year to +1.2% next year that would be the largest of any major economy. The prospect of a brighter economic future, following an extended period of underperformance, caused Brazilian equities to be among the top performing markets in the reporting period, with the MSCI Brazil Index6 appreciating 56.5%. In Mexico, rising optimism early in the year turned negative in the second half. The North American Free Trade Agreement (NAFTA) faced increasing risks following the U.S. Presidential election. Despite 225 bps of rate hikes by Banco de Mexico over the last year, the peso fell to an all-time low in the days following the election amid growing concerns about U.S. - Mexican ties. Despite strong personal consumption driven by job creation, rising wages and remittances, expectations for economic growth in 2017 dropped from over +3% earlier in the year to about +1.9%. Mexico was one of the worst performing markets during the reporting period as measured by the MSCI Mexico Index,6 which dropped -14.3%, driven by a fall in stocks and the peso.
Annual Shareholder Report
The list of primary drivers of international equity markets during the reporting period included the following: (1) the Brexit referendum and the U.S. elections; (2) currency and commodity volatility coupled with U.S. dollar strength; (3) the trajectory for U.S. growth and debate over the timing and size of Fed tightening; (4) concerns about China's economy and signs of a downturn in global growth outlook; and (5) geopolitical risk events emanating from the Middle East.
FUND PERFORMANCE
Country allocation remained a key driver of performance for the reporting period, as it consistently has in the past. The Fund maintained exposure to select healthy, high sovereign quality, emerging markets.
Fund performance was positively impacted by both country allocation and stock selection in Asia during the reporting period. The region is meaningful in the asset class, as it represents about 70% of the MSCI EM. In China, the Fund's shift from an underweight in the first quarter to a modest overweight relative to the benchmark boosted performance. Contributions from overweight allocations to consumer technology company NetEase Inc. (36.6%), information company TravelSky Technology Ltd (30.7%) and pharmaceutical distributor Sinopharm Group (12.7%) outweighed underweight allocations in Tencent Holdings Ltd (25.8%) and Alibaba Group Holding Ltd (11.8%). Overall, Chinese stock selection positively impacted the Fund.
The South Korean exposure to Financials, including Hana Financial Group Inc. (31.4%), aided performance as yield curve steepening boosted profitability, while a modest underweight to Samsung Electronics Corp. (36.4%) was a drag on performance. Overall, South Korean country allocation and stock selection positively impacted performance. An overweight in Thailand and Philippines both contributed positively as holdings in stocks related to tourism, such as Airports of Thailand (31.7%) and consumer names such as Philippine's food company JG Summit Holdings Inc. (31.9%) both contributed positively to returns. Elsewhere in Asia, Fund management continued to avoid stocks in Malaysia as the country's investment characteristics were not attractive relative to other economies. That decision aided Fund performance over the reporting period. While the Fund ended the reporting period with an overweight in Indonesia given recent improving macro-economic and fundamental factors, the average underweight allocation over the year detracted from performance.
Stock selection in India and Taiwan contributed negatively to performance. The underweight allocation in India contributed positively, but stock selection was a drag on performance, as holdings in Indian Financials, including State Bank of India (-39.3%) and ICICI Bank (-11.2%), negatively impacted performance. In Taiwan, an underweight in Taiwan Semiconductor Manufacturing Co. Ltd. (39.0%) detracted from performance.
Annual Shareholder Report
In Europe, Middle East and Africa, the Fund was negatively impacted by overall country allocation and stock selection. During the course of the year, the Fund was overweight in the region. A combination of unusual political risks such as Brexit and the attempted coup in Turkey drove volatility and uncertainty higher mid-year. While these risks abated and the region recently outperformed, the overall contribution in the reporting period detracted from performance. The allocation to the Austria-Czech-Hungary-Romania region companies hurt performance. Stocks, including Hungary's OTP Bank (33.5%) and Mol Hungarian Oil & Gas (40.7%), which outperformed, were off-set by underperforming holdings in Uniqa Insurance Group AG (-28.4%) and Erste Group Bank AG (-7.8%) in Austria, as well as Komercni Banka (-14.1%) in the Czech Republic. Allocation to Russia helped performance as Brent crude oil and natural gas prices rose, and the outlook for the Russian economy and stocks improved. Both a modest overweight, and stock selection contributed positively to Fund performance. Key Russian outperforming stocks owned were Sberbank Russia (51.7%) and X5 Retail Group (32.7%). The overweight in Turkish stocks detracted from performance, as a combination of the failed coup attempt in July, rising U.S. 10-year yields, a sell-off in the Turkish lira and instability in the region hurt performance. Finally, the Fund's well-timed entry and exit of positions in the United Arab Emirates (UAE) helped performance.
In Latin America, country and stock allocations detracted from performance. In Brazil, where the Fund maintained a modest overweight, country allocation contributed positively as it was the best performing market over the reporting period as measured by the MSCI Brazil Index,6 +56.52% in the reporting period. However, an overweight allocation to brewer Ambev SA (7.1%) and underweight allocation to iron miner Vale SA (146.8%) hurt performance. Elsewhere in Latin America, the Fund's modest overweight to Mexico hurt performance as stocks and the peso experienced a sharp downturn following the U.S. presidential election. Shares of consumer companies such as dairy products producer Grupo LaLa SAB de CV (-36.7%) hurt performance.
Annual Shareholder Report
During the reporting period, the Fund hedged some currencies using currency forwards.8 The overall net returns of the currency forward positions contributed negatively to performance. Hedging the euro (versus the U.S. dollar) and a long position in the Mexican peso (versus the U.S. dollar) were a drag on performance. Furthermore, cash weight and cash flow timing detracted from performance.
| 1 | Please see the footnotes to the line graphs under “Fund Performance and Growth of a $10,000 Investment” below for the definition of, and more information about, the MSCI EM. |
| 2 | International investing involves special risks including currency risk, increased volatility of foreign securities, political risks and differences in auditing and other financial standards. Prices of emerging markets securities can be significantly more volatile than the prices of securities in developed countries and currency risk and political risks are accentuated in emerging markets. |
| 3 | The MSCI EAFE Index is a free float-adjusted market capitalization weighted index that is designed to measure the equity market performance of developed markets outside of North America (Europe, Australasia and the Far East).* |
| 4 | The MSCI USA Index is a free float adjusted market capitalization index that is designed to measure large and mid-cap U.S. equity market performance.* |
| 5 | The MSCI AC Europe Index captures large- and mid-cap representation across developed markets countries and emerging markets countries in Europe. The index covers approximately 85% of the free float-adjusted market capitalization in each country.* |
| 6 | MSCI country indexes are constructed by identifying every listed security in the market. Securities are free float adjusted, classified in accordance with the Global Industry Classification Standard (GICS®), and screened by size, liquidity and minimum free float.* |
| 7 | The MSCI EM Latin America captures large- and mid-cap representation across five emerging markets in Latin America. The index covers approximately 85% of the free float-adjusted market capitalization in each country.* |
| 8 | The Fund's use of derivative instruments, such as currency forwards, involves risks different from, or possibly greater than, the risks associated with investing directly in securities or other traditional instruments. |
| * | The index is unmanaged, and it is not possible to invest directly in an index. |
Annual Shareholder Report
FUND PERFORMANCE AND GROWTH OF A $10,000 INVESTMENT
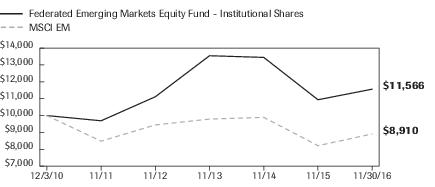
The graph below illustrates the hypothetical investment of $10,0001 in the Federated Emerging Markets Equity Fund (Institutional Shares) from December 3, 2010 (start of performance) to November 30, 2016, as compared to the MSCI Emerging Markets Index (MSCI EM).2 The Average Annual Total Return table below shows returns for Institutional Shares over the stated periods.
Growth of a $10,000 Investment
Growth of $10,000 as of November 30, 2016
| Federated Emerging Markets Equity Fund - | Institutional Shares | NA | MSCI EM |
| F | NA | I |
| 12/3/2010 | 10,000 | | 10,000 |
| 11/30/2011 | 9,691 | | 8,483 |
| 11/30/2012 | 11,115 | | 9,446 |
| 11/30/2013 | 13,549 | | 9,792 |
| 11/30/2014 | 13,448 | | 9,895 |
| 11/30/2015 | 10,938 | | 8,214 |
| 11/30/2016 | 11,566 | | 8,910 |
41 graphic description end -->
Average Annual Total Returns for the Period Ended 11/30/2016
| | 1 Year | 5 Year | Start of
Performance* |
| Institutional Shares | 5.74% | 3.60% | 2.46% |
| MSCI EM | 8.47% | 11.35% | -1.91% |
| * | The Fund's Institutional Shares commenced operations on 12/3/2010. |
Annual Shareholder Report
Performance data quoted represents past performance which is no guarantee of future results. Investment return and principal value will fluctuate so that an investor's shares, when redeemed, may be worth more or less than their original cost. Mutual fund performance changes over time and current performance may be lower or higher than what is stated. For current to the most recent month-end performance and after-tax returns, visit FederatedInvestors.com or call 1-800-341-7400. Returns shown do not reflect the deduction of taxes that a shareholder would pay on Fund distributions or the redemption of Fund shares. Mutual funds are not obligations of or guaranteed by any bank and are not federally insured.
| 1 | Represents a hypothetical investment of $10,000 in the Fund. The Fund's performance assumes the reinvestment of all dividends and distributions. The MSCI EM and the MSCI ACWI have been adjusted to reflect reinvestment of dividends on securities in the indexes. |
| 2 | The MSCI EM Index captures large- and mid-cap representation across 23 emerging markets countries. The index covers approximately 85% of the free float-adjusted market capitalization in each country. The index is not adjusted to reflect sales loads, expenses and other fees that the Securities and Exchange Commission (SEC) requires to be reflected in the Fund's performance. The index is unmanaged and, unlike the Fund, is not affected by cash flows. It is not possible to invest directly in an index. |
Annual Shareholder Report
Portfolio of Investments Summary Tables (unaudited)
At November 30, 2016, the Fund's portfolio composition1 was as follows:
| Country | Percentage of
Total Net Assets |
| China | 27.3% |
| Brazil | 11.7% |
| Taiwan | 9.1% |
| Indonesia | 7.1% |
| South Korea | 6.3% |
| Russia | 5.1% |
| Thailand | 5.0% |
| Austria | 4.9% |
| India | 4.2% |
| Mexico | 3.6% |
| Other2 | 10.4% |
| Other Security Types3 | 0.0%4 |
| Securities Lending Collateral5 | 1.0% |
| Cash Equivalents6 | 6.7% |
| Derivative Contracts7 | 0.3% |
| Other Assets and Liabilities—Net8 | (2.7)% |
| TOTAL | 100.0% |
| 1 | Country allocations are based primarily on the country in which a company is incorporated. However, the Fund's Adviser may allocate a company to a country based on other factors such as location of the company's principal office, the location of the principal trading market for the company's securities or the country where a majority of the company's revenues are derived. |
| 2 | For purposes of this table, country classification constitute 84.3% of the Fund's total net assets. Remaining countries have been aggregated under the designation “Other.” |
| 3 | Other Security Types consist of Warrants. |
| 4 | Represents less than 0.1%. |
| 5 | Represents cash collateral received from portfolio securities on loan which are invested in short-term investments such as repurchase agreements or money market funds. |
| 6 | Cash Equivalents include any investments in money market mutual funds and/or overnight repurchase agreements, other than those representing cash collateral for securities lending. |
| 7 | Based upon net unrealized appreciation (depreciation) or value of the derivative contracts as applicable. Derivative contracts may consist of futures, forwards, options and swaps. The impact of a derivative contract on the Fund's performance may be larger than its unrealized appreciation (depreciation) or value may indicate. In many cases, the notional value or amount of a derivative contract may provide a better indication of the contract's significance to the portfolio. More complete information regarding the Fund's direct investments in derivative contracts, including unrealized appreciation (depreciation), value and notional values or amounts of such contracts, can be found in the table at the end of the Portfolio of Investments included in this Report. |
| 8 | Assets, other than investments in securities and derivative contracts, less liabilities. See Statement of Assets and Liabilities. |
Annual Shareholder Report
At November 30, 2016, the Fund's sector classification composition9 was as follows:
| Sector Classification | Percentage of
Total Net Assets |
| Financials | 24.6% |
| Information Technology | 18.0% |
| Consumer Discretionary | 10.8% |
| Consumer Staples | 9.3% |
| Energy | 8.0% |
| Materials | 6.3% |
| Telecommunication Services | 5.9% |
| Industrials | 5.3% |
| Health Care | 3.0% |
| Utilities | 2.2% |
| Real Estate | 1.3% |
| Other Security Types3 | 0.0%4 |
| Securities Lending Collateral5 | 1.0% |
| Cash Equivalents6 | 6.7% |
| Derivative Contracts7 | 0.3% |
| Other Assets and Liabilities—Net8 | (2.7)% |
| TOTAL | 100.0% |
| 9 | Except for Derivative Contracts, Securities Lending Collateral, Cash Equivalents and Other Assets and Liabilities, sector classifications are based upon, and individual securities are assigned to, the classifications of the Global Industry Classification Standard (GICS) except that the Adviser assigns a classification to securities not classified by the GICS and to securities for which the Adviser does not have access to the classification made by the GICS. |
Annual Shareholder Report
Portfolio of Investments
November 30, 2016
| Shares | | | Value in
U.S. Dollars |
| | | COMMON STOCKS—94.7% | |
| | | Austria—4.9% | |
| 11,750 | | Erste Group Bank AG | $326,773 |
| 3,300 | | OMV AG | 106,891 |
| 3,600 | | Voestalpine AG | 136,681 |
| 8,800 | | Wienerberger AG | 156,146 |
| | | TOTAL | 726,491 |
| | | Brazil—11.7% | |
| 54,500 | | Ambev SA, ADR | 271,955 |
| 28,292 | | Banco Bradesco SA, ADR | 244,726 |
| 14,800 | | BB Seguridade Participacoes SA | 123,798 |
| 2,500 | | Braskem SA, ADR | 40,775 |
| 3,100 | | BRF SA | 47,343 |
| 11,300 | | Cosan SA Industria e Comercio | 131,909 |
| 15,929 | | Ez Tec Empreendimentos e Participacoes SA | 69,471 |
| 5,000 | 1 | Fibria Celulose SA | 45,845 |
| 26,704 | | Itau Unibanco Holding SA, ADR | 276,119 |
| 16,500 | | Kroton Educacional SA | 70,497 |
| 14,000 | | Lojas Renner SA | 93,056 |
| 6,900 | 1 | Petroleo Brasileiro SA, ADR | 64,722 |
| 12,500 | | Qualicorp SA | 67,821 |
| 7,200 | | Raia Drogasil SA | 137,292 |
| 11,600 | | Weg SA | 53,403 |
| | | TOTAL | 1,738,732 |
| | | China—27.3% | |
| 8,000 | | AAC Technologies Holdings Inc. | 72,264 |
| 122,000 | | Air China, Class H | 83,768 |
| 2,400 | 1 | Alibaba Group Holding Ltd., ADR | 225,648 |
| 113,000 | | AviChina Industry & Technology Co. Ltd., Class H | 78,156 |
| 800 | 1 | Baidu, Inc., ADR | 133,560 |
| 133,000 | | Beijing Capital International Airport Co. Ltd., Class H | 131,113 |
| 92,000 | | China Communications Construction Co. Ltd., Class H | 110,123 |
| 340,000 | | China Construction Bank Corp., Class H | 252,853 |
| 105,000 | | China Longyuan Power Group Corp., Class H | 82,043 |
| 63,000 | | China Medical System Holding Ltd. | 104,964 |
| 40,000 | | China Merchants Bank Co. Ltd., Class H | 98,646 |
Annual Shareholder Report
| Shares | | | Value in
U.S. Dollars |
| | | COMMON STOCKS—continued | |
| | | China—continued | |
| 3,700 | | China Mobile Ltd., ADR | $202,353 |
| 40,000 | | China Overseas Land & Investment Ltd. | 115,304 |
| 26,000 | | China Resources logic Ltd. | 77,071 |
| 49,200 | 2,3,4 | Fuyao Glass Industry Group Co. Ltd., Class H | 149,487 |
| 105,000 | | Geely Automobile Holdings Ltd. | 108,357 |
| 1,400 | | NetEase, Inc., ADR | 313,740 |
| 14,500 | | New China Life Insurance Co. Ltd., Class H | 73,264 |
| 3,800 | 1 | New Oriental Education & Technology Group, Inc., ADR | 190,646 |
| 27,500 | | Ping An Insurance (Group) Co. of China Ltd., Class H | 151,752 |
| 22,000 | | Shenzhou International Group | 135,122 |
| 244,000 | | Sinopec Shanghai Petrochemical Co. Ltd., Class H | 128,574 |
| 58,400 | | Sinopharm Group Co. Ltd., Class H | 272,152 |
| 21,000 | | Techtronic Industries Co. | 82,173 |
| 17,200 | | Tencent Holdings Ltd. | 428,262 |
| 91,000 | | TravelSky Technology Ltd., Class H | 190,510 |
| 1,800 | 1 | Yum China Holding | 50,616 |
| | | TOTAL | 4,042,521 |
| | | Colombia—2.8% | |
| 2,500 | | Bancolombia SA, ADR | 83,750 |
| 15,200 | 1 | Ecopetrol SA, ADR | 130,112 |
| 5,600 | | Grupo Argos SA | 32,821 |
| 10,500 | | Grupo Aval Acciones y Valores SA, ADR | 79,590 |
| 5,500 | | Grupo de Inversiones Suramericana | 63,503 |
| 4,000 | | Grupo Nutresa SA | 29,740 |
| | | TOTAL | 419,516 |
| | | Czech Republic—0.5% | |
| 1,700 | | CEZ AS | 27,562 |
| 1,400 | | Komercni Banka AS | 46,324 |
| | | TOTAL | 73,886 |
| | | Hungary—2.6% | |
| 70,000 | | Magyar Telekom Telecommunications PLC | 116,805 |
| 2,000 | | MOL Hungarian Oil & Gas PLC | 125,165 |
| 5,300 | | OTP Bank PLC | 142,554 |
| | | TOTAL | 384,524 |
| | | India—4.2% | |
| 31,500 | | Ashok Leyland Ltd. | 36,585 |
| 13,500 | | Exide Industries Ltd. | 35,789 |
Annual Shareholder Report
| Shares | | | Value in
U.S. Dollars |
| | | COMMON STOCKS—continued | |
| | | India—continued | |
| 850 | | Hero MotoCorp Ltd. | $39,245 |
| 2,500 | | Housing Development Finance Corp. Ltd. | 46,259 |
| 3,400 | | Indiabulls Housing Finance Ltd. | 37,887 |
| 5,950 | | Infosys Ltd., ADR | 86,156 |
| 12,000 | | ITC Ltd. | 41,060 |
| 4,600 | | LIC Housing Finance Ltd. | 38,131 |
| 800 | | Maruti Suzuki India Ltd. | 61,782 |
| 2,900 | 2,3 | Reliance Industries Ltd., GDR | 83,085 |
| 1,350 | | Tata Consultancy Services Ltd. | 44,831 |
| 30,800 | | Tata Power Co. Ltd. | 33,306 |
| 1,500 | 1 | WNS Holdings Ltd., ADR | 37,545 |
| | | TOTAL | 621,661 |
| | | Indonesia—7.1% | |
| 752,000 | | Adaro Energy TBK PT | 84,498 |
| 139,000 | | Astra International TBK PT | 77,230 |
| 215,000 | | Bank Mandiri TBK PT | 165,998 |
| 133,000 | | Bank Negara Indonesia Persero TBK PT | 50,678 |
| 212,000 | | Bank Rakyat Indonesia TBK PT | 170,700 |
| 16,700 | | Gudang Garam TBK PT | 79,587 |
| 189,000 | | Indofood CBP Sukses Makmur TBK PT | 120,527 |
| 72,000 | | Matahari Department Store TBK PT | 76,425 |
| 796,000 | | Telekomunikasi Indonesia TBK PT | 222,670 |
| | | TOTAL | 1,048,313 |
| | | Japan—0.3% | |
| 979 | 1 | Line Corp., ADR | 37,878 |
| | | Mexico—3.6% | |
| 31,000 | | Alsea SAB de CV | 90,999 |
| 1,000 | | Fomento Economico Mexicano SAB de CV, ADR | 78,050 |
| 600 | | Grupo Aeroportuario del Sureste SAB de CV, ADR | 86,622 |
| 21,400 | | Grupo Financiero Banorte SAB de CV, Class O | 102,622 |
| 40,000 | | Grupo Lala SAB de CV | 60,264 |
| 12,000 | | Infraestructura Energetica Nova SAB de CV | 52,243 |
| 34,000 | | Wal-Mart de Mexico SAB de CV | 62,511 |
| | | TOTAL | 533,311 |
| | | Romania—1.7% | |
| 294,456 | | Banca Transilvania SA | 162,976 |
Annual Shareholder Report
| Shares | | | Value in
U.S. Dollars |
| | | COMMON STOCKS—continued | |
| | | Romania—continued | |
| 13,000 | | Cineworld Group PLC | $88,359 |
| | | TOTAL | 251,335 |
| | | Russia—5.1% | |
| 26,000 | | Gazprom PAO, ADR | 119,559 |
| 1,200 | | Lukoil PJSC, ADR | 59,052 |
| 3,800 | | MMC Norilsk Nickel PJSC, ADR | 63,536 |
| 600 | 2 | Novatek OAO, GDR | 70,675 |
| 21,000 | 2 | Rosneft Oil Co. | 110,788 |
| 21,000 | | Sberbank of Russia PJSC, ADR | 211,785 |
| 3,900 | 1,2 | X5 Retail Group NV, GDR | 117,000 |
| | | TOTAL | 752,395 |
| | | South Korea—6.3% | |
| 3,400 | | Hana Financial Holdings | 94,154 |
| 3,500 | | Hanwha Chemical | 69,548 |
| 171 | | Hyundai Mobis | 36,366 |
| 375 | | Hyundai Motor Co. | 42,821 |
| 1,126 | | Korea Electric Power Corp. | 44,584 |
| 6,300 | | LG Telecom Ltd. | 61,695 |
| 1,800 | | Poongsan | 60,056 |
| 180 | | Samsung Electronics Co. Ltd. | 266,322 |
| 1,800 | | Shinhan Financial Group Co. Ltd., ADR | 68,256 |
| 1,200 | | SK Hynix, Inc. | 43,715 |
| 1,700 | | SK Telecom Co. Ltd., ADR | 36,040 |
| 10,000 | | Woori Bank | 102,590 |
| | | TOTAL | 926,147 |
| | | Taiwan—9.1% | |
| 3,000 | | Catcher Technology Co. Ltd. | 21,611 |
| 30,150 | | Chicony Electronics Co. Ltd. | 70,917 |
| 54,080 | | China Life Insurance Co. Ltd. | 57,638 |
| 45,000 | | Chunghwa Telecom Co. Ltd. | 151,581 |
| 132,887 | | First Financial Holding Co. Ltd. | 70,018 |
| 26,202 | | Hon Hai Precision Industry Co. Ltd. | 66,967 |
| 60,299 | | Lite-On Technology Corp. | 94,365 |
| 25,000 | | Nan Ya Plastics Corp. | 52,595 |
| 10,000 | | Pegatron Corp. | 23,785 |
| 50,000 | | Pou Chen Corp. | 62,437 |
| 11,000 | | President Chain Store Corp. | 82,618 |
| 68,000 | | Taiwan Semiconductor Manufacturing Co. Ltd. | 389,628 |
Annual Shareholder Report
| Shares | | | Value in
U.S. Dollars |
| | | COMMON STOCKS—continued | |
| | | Taiwan—continued | |
| 43,200 | | Uni-President Enterprises Corp. | $73,810 |
| 48,000 | | United Microelectronics Corp. | 16,989 |
| 78,000 | | WPG Holdings Co., Ltd. | 96,503 |
| 59,180 | | Yuanta Financial Holding Co. Ltd. | 21,429 |
| | | TOTAL | 1,352,891 |
| | | Thailand—5.0% | |
| 12,900 | | Advanced Info Service PCL, GDR | 52,241 |
| 10,800 | | Airports of Thailand PCL, GDR | 121,576 |
| 32,200 | | Central Pattana PCL, GDR | 50,898 |
| 50,800 | | CP ALL PCL, GDR | 85,710 |
| 12,400 | | Kasikornbank PCL, GDR | 58,784 |
| 64,840 | | Minor International PCL, GDR | 68,149 |
| 6,500 | | PTT PCL, GDR | 64,473 |
| 11,200 | | Siam Cement PCL, GDR | 149,408 |
| 21,000 | | Siam Commercial Bank PCL, GDR | 86,044 |
| | | TOTAL | 737,283 |
| | | Turkey—2.5% | |
| 21,000 | | Akbank TAS | 45,983 |
| 6,000 | | Arcelik AS | 34,873 |
| 35,000 | | Emlak Konut Gayrimenkul Yatirim Ortakligi AS | 29,312 |
| 12,600 | | Haci Omer Sabanci Holding AS | 32,007 |
| 17,000 | | KOC Holding AS | 61,417 |
| 5,000 | | Tofas Turk Otomobil Fabrikasi AS | 31,216 |
| 1,600 | | Tupras Turkiye Petrol Rafinerileri AS | 31,956 |
| 4,600 | 1 | Turkcell Iletisim Hizmetleri AS, ADR | 30,360 |
| 35,000 | | Turkiye Is Bankasi (Isbank), Class C | 48,915 |
| 28,052 | | Turkiye Sise ve Cam Fabrikalari AS | 27,012 |
| | | TOTAL | 373,051 |
| | | TOTAL COMMON STOCKS
(IDENTIFIED COST $13,254,898) | 14,019,935 |
| | | WARRANTS—0.0% | |
| | | Thailand—0.0% | |
| 4,800 | 1 | Minor International PCL, Expiration Date 11/3/2017
(IDENTIFIED COST $0) | 600 |
| | | INVESTMENT COMPANIES—7.7%5 | |
| 153,600 | | Federated Government Obligations Funds, Premier Shares, 0.31%6
(purchased with proceeds from securities lending collateral) | 153,600 |
Annual Shareholder Report
| Shares | | | Value in
U.S. Dollars |
| | | INVESTMENT COMPANIES—continued5 | |
| 982,973 | | Federated Institutional Prime Value Obligations Fund, Institutional Shares, 0.56%6 | $983,071 |
| | | TOTAL INVESTMENT COMPANIES
(IDENTIFIED COST $1,136,616) | 1,136,671 |
| | | TOTAL INVESTMENTS—102.4%
(IDENTIFIED COST $14,391,514)7 | 15,157,206 |
| | | OTHER ASSETS AND LIABILITIES - NET—(2.4)%8 | (350,229) |
| | | TOTAL NET ASSETS—100% | $14,806,977 |
At November 30, 2016, the Fund had the following outstanding futures contracts:
| Description | Number of
Contracts | Notional
Value | Expiration
Date | Unrealized
Appreciation |
| 1H-SHARES Index, Long Futures | 5 | $318,797 | December 2016 | $9,547 |
| 1mini MSCI Emerging Markets Index, Long Futures | 3 | $129,450 | December 2016 | $980 |
| NET UNREALIZED APPRECIATION ON FUTURES CONTRACTS | $10,527 |
At November 30, 2016, the Fund had the following outstanding foreign exchange contracts:
| Settlement Date | Counterparty | Foreign Currency
Units to
Receive/Deliver | In
Exchange
For | Unrealized
Appreciation |
| Contracts Sold: |
| 12/15/2016 | Citibank | 472,500 EUR | $533,486 | $32,247 |
Net Unrealized Appreciation on Futures Contracts and Foreign Exchange Contracts are included in “Other Assets and Liabilities—Net.”
| 1 | Non-income-producing security. |
| 2 | Denotes a restricted security that either: (a) cannot be offered for public sale without first being registered, or being able to take advantage of an exemption from registration, under the Securities Act of 1933; or (b) is subject to a contractual restriction on public sales. At November 30, 2016, these restricted securities amounted to $531,035, which represented 3.6% of total net assets. |
| 3 | Denotes a restricted security that may be resold without restriction to “qualified institutional buyers” as defined in Rule 144A under the Securities Act of 1933 and that the Fund has determined to be liquid under criteria established by the Fund's Board of Trustees (the “Trustees”). At November 30, 2016, these liquid restricted securities amounted to $232,572, which represented 1.6% of total net assets. |
| 4 | All or a portion of the amounts are temporarily on loan to an unaffiliated broker/dealer. |
| 5 | Affiliated holdings. |
| 6 | 7-day net yield. |
| 7 | The cost of investments for federal tax purposes amounts to $14,391,514. |
| 8 | Assets, other than investments in securities, less liabilities. See Statement of Assets and Liabilities. |
Note: The categories of investments are shown as a percentage of total net assets at November 30, 2016.
Annual Shareholder Report
Various inputs are used in determining the value of the Fund's investments. These inputs are summarized in the three broad levels listed below:
Level 1—quoted prices in active markets for identical securities.
Level 2—other significant observable inputs (including quoted prices for similar securities, interest rates, prepayment speeds, credit risk, etc.). Also includes securities valued at amortized cost.
Level 3—significant unobservable inputs (including the Fund's own assumptions in determining the fair value of investments).
The inputs or methodology used for valuing securities are not an indication of the risk associated with investing in those securities.
The following is a summary of the inputs used, as of November 30, 2016, in valuing the Fund's assets carried at fair value:
| Valuation Inputs | | | | |
| | Level 1—
Quoted
Prices | Level 2—
Other
Significant
Observable
Inputs | Level 3—
Significant
Unobservable
Inputs | Total |
| Equity Securities: | | | | |
| Common Stocks | | | | |
| International | $5,045,175 | $8,974,760 | $— | $14,019,935 |
| Warrants | 600 | — | — | 600 |
| Investment Companies | 1,136,671 | — | — | 1,136,671 |
| TOTAL SECURITIES | $6,182,446 | $8,974,760 | $— | $15,157,206 |
| Other Financial Instruments:1 | | | | |
| Assets | $10,527 | $32,247 | $— | $42,774 |
| Liabilities | — | — | — | — |
| TOTAL OTHER FINANCIAL INSTRUMENTS | $10,527 | $32,247 | $— | $42,774 |
| 1 | Other Financial Instruments include futures contracts and foreign exchange contracts. |
The following acronyms are used throughout this portfolio:
| ADR | —American Depositary Receipt |
| EUR | —Euro |
| GDR | —Global Depositary Receipt |
| PJSC | —Public Joint Stock Company |
See Notes which are an integral part of the Financial Statements
Annual Shareholder Report
Financial Highlights–Institutional Shares
(For a Share Outstanding Throughout Each Period)
| Year Ended November 30 | 2016 | 2015 | 2014 | 2013 | 2012 |
| Net Asset Value, Beginning of Period | $8.08 | $12.61 | $13.30 | $11.05 | $9.67 |
| Income From Investment Operations: | | | | | |
| Net investment income | 0.09 | 0.08 | 0.14 | 0.15 | 0.14 |
| Net realized and unrealized gain (loss) on investments, futures contracts and foreign currency transactions | 0.37 | (2.05) | (0.23) | 2.24 | 1.27 |
| TOTAL FROM INVESTMENT OPERATIONS | 0.46 | (1.97) | (0.09) | 2.39 | 1.41 |
| Less Distributions: | | | | | |
| Distributions from net investment income | (0.07) | (0.09) | (0.13) | (0.13) | (0.03) |
| Distributions from net realized gain on investments | — | (2.47) | (0.47) | (0.01) | — |
| TOTAL DISTRIBUTIONS | (0.07) | (2.56) | (0.60) | (0.14) | (0.03) |
| Net Asset Value, End of Period | $8.47 | $8.08 | $12.61 | $13.30 | $11.05 |
| Total Return1 | 5.74% | (18.66)% | (0.67)% | 21.81% | 14.69% |
| Ratios to Average Net Assets: | | | | | |
| Net expenses | 1.16% | 1.15% | 1.15% | 1.15% | 1.15% |
| Net investment income | 1.18% | 1.04% | 1.11% | 1.22% | 1.31% |
| Expense waiver/reimbursement2 | 1.76% | 1.74% | 2.22% | 1.63% | 2.99% |
| Supplemental Data: | | | | | |
| Net assets, end of period (000 omitted) | $14,807 | $14,463 | $10,335 | $13,638 | $11,155 |
| Portfolio turnover | 53% | 64% | 118% | 48% | 51% |
| 1 | Based on net asset value. |
| 2 | This expense decrease is reflected in both the net expense and net investment income ratios shown above. |
See Notes which are an integral part of the Financial Statements
Annual Shareholder Report
Statement of Assets and Liabilities
November 30, 2016
| Assets: | | |
Total investment in securities, at value including $145,841 of securities loaned and $1,136,671 of investment in affiliated holdings (Note 5)
(identified cost $14,391,514) | | $15,157,206 |
| Restricted cash (Note 2) | | 26,081 |
| Cash denominated in foreign currencies (identified cost $25,450) | | 25,460 |
| Unrealized appreciation on foreign exchange contracts | | 32,247 |
| Income receivable | | 12,250 |
| Receivable for daily variation margin on futures contracts | | 367 |
| Receivable for shares sold | | 100 |
| TOTAL ASSETS | | 15,253,711 |
| Liabilities: | | |
| Payable for investments purchased | $172,655 | |
| Payable for collateral due to broker for securities lending | 153,600 | |
| Payable for capital gains taxes withheld | 10,120 | |
| Payable for portfolio accounting fees | 48,914 | |
| Payable for auditing fees | 28,390 | |
| Payable for custodian fees | 12,988 | |
| Payable to Adviser (Note 5) | 9,824 | |
| Accrued expenses (Note 5) | 10,243 | |
| TOTAL LIABILITIES | | 446,734 |
| Net assets for 1,748,021 shares outstanding | | $14,806,977 |
| Net Assets Consists of: | | |
| Paid-in capital | | $16,585,626 |
| Net unrealized appreciation of investments, futures contracts and translation of assets and liabilities in foreign currency | | 807,988 |
| Accumulated net realized loss on investments, futures contracts and foreign currency transactions | | (2,720,173) |
| Undistributed net investment income | | 133,536 |
| TOTAL NET ASSETS | | $14,806,977 |
| Net Asset Value, Offering Price and Redemption Proceeds Per Share: | | |
| $14,806,977 ÷ 1,748,021 shares outstanding, no par value, unlimited shares authorized | | $8.47 |
See Notes which are an integral part of the Financial Statements
Annual Shareholder Report
Statement of Operations
Year Ended November 30, 2016
| Investment Income: | | | |
| Dividends (including $6,259 received from affiliated holdings (Note 5) and net of foreign taxes withheld of $39,434) | | | $316,850 |
| Interest (income on securities loaned) | | | 117 |
| TOTAL INCOME | | | 316,967 |
| Expenses: | | | |
| Investment adviser fee (Note 5) | | $122,080 | |
| Administrative fee (Note 5) | | 10,609 | |
| Custodian fees | | 38,014 | |
| Transfer agent fees | | 6,188 | |
| Directors'/Trustees' fees (Note 5) | | 700 | |
| Auditing fees | | 29,074 | |
| Legal fees | | 7,357 | |
| Portfolio accounting fees | | 129,209 | |
| Share registration costs | | 25,973 | |
| Printing and postage | | 17,048 | |
| Miscellaneous (Note 5) | | 9,422 | |
| TOTAL EXPENSES | | 395,674 | |
| Waivers and Reimbursements: | | | |
| Waiver/reimbursement of investment adviser fee (Note 5) | $(122,080) | | |
| Waiver/reimbursement of other operating expenses (Notes 2 and 5) | (116,772) | | |
| TOTAL WAIVERS AND REIMBURSEMENTS | | (238,852) | |
| Net expenses | | | 156,822 |
| Net investment income | | | 160,145 |
| Realized and Unrealized Gain (Loss) on Investments, Futures Contracts and Foreign Currency Transactions: | | | |
| Net realized loss on investments and foreign currency transactions | | | (999,736) |
| Net realized loss on futures contracts | | | (32,870) |
| Net change in unrealized depreciation of investments and translation of assets and liabilities in foreign currency | | | 1,463,628 |
| Net change in unrealized depreciation of futures contracts | | | 112,986 |
| Net realized and unrealized gain on investments, futures contracts and foreign currency transactions | | | 544,008 |
| Change in net assets resulting from operations | | | $704,153 |
See Notes which are an integral part of the Financial Statements
Annual Shareholder Report
Statement of Changes in Net Assets
| Year Ended November 30 | 2016 | 2015 |
| Increase (Decrease) in Net Assets | | |
| Operations: | | |
| Net investment income | $160,145 | $143,295 |
| Net realized loss on investments, futures contracts and foreign currency transactions | (1,032,606) | (1,730,666) |
| Net change in unrealized appreciation/depreciation of investments, futures contracts and translation of assets and liabilities in foreign currency | 1,576,614 | (1,218,852) |
| CHANGE IN NET ASSETS RESULTING FROM OPERATIONS | 704,153 | (2,806,223) |
| Distributions to Shareholders: | | |
| Distributions from net investment income | (119,280) | (77,600) |
| Distributions from net realized gain on investments | — | (2,114,310) |
| CHANGE IN NET ASSETS RESULTING FROM DISTRIBUTIONS TO SHAREHOLDERS | (119,280) | (2,191,910) |
| Share Transactions: | | |
| Proceeds from sale of shares | 2,289,435 | 12,272,565 |
| Net asset value of shares issued to shareholders in payment of distributions declared | 114,517 | 2,186,130 |
| Cost of shares redeemed | (2,644,710) | (5,332,470) |
| CHANGE IN NET ASSETS RESULTING FROM SHARE TRANSACTIONS | (240,758) | 9,126,225 |
| Change in net assets | 344,115 | 4,128,092 |
| Net Assets: | | |
| Beginning of period | 14,462,862 | 10,334,770 |
| End of period (including undistributed net investment income of $133,536 and $119,248, respectively) | $14,806,977 | $14,462,862 |
See Notes which are an integral part of the Financial Statements
Annual Shareholder Report
Notes to Financial Statements
November 30, 2016
1. ORGANIZATION
Federated Equity Funds (the “Trust”) is registered under the Investment Company Act of 1940, as amended, (the “Act”), as an open-end management investment company. The Trust consists of 14 portfolios. The financial statements included herein are only those of Federated Emerging Markets Equity Fund (the “Fund”). The financial statements of the other portfolios are presented separately. The assets of each portfolio are segregated and a shareholder's interest is limited to the portfolio in which shares are held. Each portfolio pays its own expenses. The investment objective of the Fund is to provide long term capital appreciation.
2. SIGNIFICANT ACCOUNTING POLICIES
The following is a summary of significant accounting policies consistently followed by the Fund in the preparation of its financial statements. These policies are in conformity with U.S. generally accepted accounting principles (GAAP).
Investment Valuation
In calculating its net asset value (NAV), the Fund generally values investments as follows:
| ■ | Equity securities listed on an exchange or traded through a regulated market system are valued at their last reported sale price or official closing price in their principal exchange or market. |
| ■ | Shares of other mutual funds or non-exchange-traded investment companies are valued based upon their reported NAVs. |
| ■ | Fixed-income securities are fair valued using price evaluations provided by a pricing service approved by the Fund's Trustees. |
| ■ | Derivative contracts listed on exchanges are valued at their reported settlement or closing price, except that options are valued at the mean of closing bid and asked quotations. |
| ■ | Over-the-counter (OTC) derivative contracts are fair valued using price evaluations provided by a pricing service approved by the Trustees. |
| ■ | For securities that are fair valued in accordance with procedures established by and under the general supervision of the Trustees, certain factors may be considered such as: the last traded or purchase price of the security, information obtained by contacting the issuer or dealers, analysis of the issuer's financial statements or other available documents, fundamental analytical data, the nature and duration of restrictions on disposition, the movement of the market in which the security is normally traded, public trading in similar securities or derivative contracts of the issuer or comparable issuers, movement of a relevant index, or other factors including but not limited to industry changes and relevant government actions. |
If any price, quotation, price evaluation or other pricing source is not readily available when the NAV is calculated, or if the Fund cannot obtain price evaluations from a pricing service or from more than one dealer for an investment within a reasonable period of time as set forth in the Fund's valuation policies and procedures, the Fund uses the fair value of the investment determined in accordance with the procedures described below. There can be no assurance that the Fund could obtain the fair value assigned to an investment if it sold the investment at approximately the time at which the Fund determines its NAV per share.
Annual Shareholder Report
Fair Valuation and Significant Events Procedures
The Trustees have ultimate responsibility for determining the fair value of investments for which market quotations are not readily available. The Trustees have appointed a valuation committee (“Valuation Committee”) comprised of officers of the Fund, Federated Global Investment Management Corp. (“Adviser”) and certain of the Adviser's affiliated companies to assist in determining fair value and in overseeing the calculation of the NAV. The Trustees have also authorized the use of pricing services recommended by the Valuation Committee to provide fair value evaluations of the current value of certain investments for purposes of calculating the NAV. The Valuation Committee employs various methods for reviewing third-party pricing-service evaluations including periodic reviews of third-party pricing services' policies, procedures and valuation methods (including key inputs, methods, models and assumptions), transactional back-testing, comparisons of evaluations of different pricing services and review of price challenges by the Adviser based on recent market activity. In the event that market quotations and price evaluations are not available for an investment, the Valuation Committee determines the fair value of the investment in accordance with procedures adopted by the Trustees. The Trustees periodically review and approve the fair valuations made by the Valuation Committee and any changes made to the procedures.
Factors considered by pricing services in evaluating an investment include the yields or prices of investments of comparable quality, coupon, maturity, call rights and other potential prepayments, terms and type, reported transactions, indications as to values from dealers and general market conditions. Some pricing services provide a single price evaluation reflecting the bid-side of the market for an investment (a “bid” evaluation). Other pricing services offer both bid evaluations and price evaluations indicative of a price between the prices bid and asked for the investment (a “mid” evaluation). The Fund normally uses bid evaluations for any U.S. Treasury and Agency securities, mortgage-backed securities and municipal securities. The Fund normally uses mid evaluations for any other types of fixed-income securities and any OTC derivative contracts. In the event that market quotations and price evaluations are not available for an investment, the fair value of the investment is determined in accordance with procedures adopted by the Trustees.
The Trustees also have adopted procedures requiring an investment to be priced at its fair value whenever the Adviser determines that a significant event affecting the value of the investment has occurred between the time as of which the price of the investment would otherwise be determined and the time as of which the NAV is computed. An event is considered significant if there is both an affirmative expectation that the investment's value will change in response to the event and a reasonable basis for quantifying the resulting change in value. Examples of significant events that may occur after the close of the principal market on which a security is traded, or after the time of a price evaluation provided by a pricing service or a dealer, include:
| ■ | With respect to securities traded principally in foreign markets, significant trends in U.S. equity markets or in the trading of foreign securities index futures contracts; |
| ■ | Political or other developments affecting the economy or markets in which an issuer conducts its operations or its securities are traded; |
| ■ | Announcements concerning matters such as acquisitions, recapitalizations, litigation developments, or a natural disaster affecting the issuer's operations or regulatory changes or market developments affecting the issuer's industry. |
Annual Shareholder Report
The Trustees have adopted procedures whereby the Valuation Committee uses a pricing service to determine the fair value of equity securities traded principally in foreign markets when the Adviser determines that there has been a significant trend in the U.S. equity markets or in index futures trading. For other significant events, the Fund may seek to obtain more current quotations or price evaluations from alternative pricing sources. If a reliable alternative pricing source is not available, the Fund will determine the fair value of the investment in accordance with the fair valuation procedures approved by the Trustees. The Trustees have ultimate responsibility for any fair valuations made in response to a significant event.
Repurchase Agreements
The Fund may invest in repurchase agreements for short-term liquidity purposes. It is the policy of the Fund to require the other party to a repurchase agreement to transfer to the Fund's custodian or sub-custodian eligible securities or cash with a market value (after transaction costs) at least equal to the repurchase price to be paid under the repurchase agreement. The eligible securities are transferred to accounts with the custodian or sub-custodian in which the Fund holds a “securities entitlement” and exercises “control” as those terms are defined in the Uniform Commercial Code. The Fund has established procedures for monitoring the market value of the transferred securities and requiring the transfer of additional eligible securities if necessary to equal at least the repurchase price. These procedures also allow the other party to require securities to be transferred from the account to the extent that their market value exceeds the repurchase price or in exchange for other eligible securities of equivalent market value.
The insolvency of the other party or other failure to repurchase the securities may delay the disposition of the underlying securities or cause the Fund to receive less than the full repurchase price. Under the terms of the repurchase agreement, any amounts received by the Fund in excess of the repurchase price and related transaction costs must be remitted to the other party.
The Fund may enter into repurchase agreements in which eligible securities are transferred into joint trading accounts maintained by the custodian or sub-custodian for investment companies and other clients advised by the Adviser and its affiliates. The Fund will participate on a pro rata basis with the other investment companies and clients in its share of the securities transferred under such repurchase agreements and in its share of proceeds from any repurchase or other disposition of such securities.
Investment Income, Gains and Losses, Expenses and Distributions
Investment transactions are accounted for on a trade-date basis. Realized gains and losses from investment transactions are recorded on an identified-cost basis. Interest income and expenses are accrued daily. Dividend income and distributions to shareholders are recorded on the ex-dividend date. Foreign dividends are recorded on the ex-dividend date or when the Fund is informed of the ex-dividend date. Distributions of net investment income are declared and paid annually. Non-cash dividends included in dividend income, if any, are recorded at fair value. Amortization/accretion of premium and discount is included in investment income. The detail of the total fund expense waivers and reimbursements of $238,852 is disclosed in various locations in this Note 2 and Note 5.
For the year ended November 30, 2016, an unaffiliated third-party waived $11,070 of portfolio accounting fees.
Annual Shareholder Report
Federal Taxes
It is the Fund's policy to comply with the Subchapter M provision of the Internal Revenue Code (the “Code”) and to distribute to shareholders each year substantially all of its income. Accordingly, no provision for federal income tax is necessary. As of and during the year ended November 30, 2016, the Fund did not have a liability for any uncertain tax positions. The Fund recognizes interest and penalties, if any, related to tax liabilities as income tax expense in the Statement of Operations. As of November 30, 2016, tax years 2013 through 2016 remain subject to examination by the Fund's major tax jurisdictions, which include the United States of America and the Commonwealth of Massachusetts.
The Fund may be subject to taxes imposed by governments of countries in which it invests. Such taxes are generally based on either income or gains earned or repatriated. The Fund accrues and applies such taxes to net investment income, net realized gains and net unrealized gains as income and/or gains are earned.
When-Issued and Delayed-Delivery Transactions
The Fund may engage in when-issued or delayed-delivery transactions. The Fund records when-issued securities on the trade date and maintains security positions such that sufficient liquid assets will be available to make payment for the securities purchased. Securities purchased on a when-issued or delayed-delivery basis are marked to market daily and begin earning interest on the settlement date. Losses may occur on these transactions due to changes in market conditions or the failure of counterparties to perform under the contract.
Futures Contracts
The Fund purchases and sells financial futures contracts to manage country risk, currency risk and market risk. Upon entering into a financial futures contract with a broker, the Fund is required to deposit in a segregated account U.S. government securities or a specified amount of cash which is shown as Restricted cash in the Statement of Assets and Liabilities. Futures contracts are valued daily and unrealized gains or losses are recorded in a “variation margin” account. Daily, the Fund receives from or pays to the broker a specified amount of cash based upon changes in the variation margin account. When a contract is closed, the Fund recognizes a realized gain or loss. Futures contracts have market risks, including the risk that the change in the value of the contract may not correlate with the changes in the value of the underlying securities. There is minimal counterparty risk to the Fund since futures contracts are exchange-traded and the exchange's clearing house, as counterparty to all exchange-traded futures contracts, guarantees the futures contracts against default.
Futures contracts outstanding at period end are listed after the Fund's Portfolio of Investments.
The average notional value of long futures contracts held by the Fund throughout the period was $1,242,543. This is based on amounts held as of each month-end throughout the fiscal period.
Annual Shareholder Report
Foreign Exchange Contracts
The Fund may enter into foreign exchange contracts to manage currency risk and market risk. Purchased contracts are used to acquire exposure to foreign currencies, whereas, contracts to sell are used to hedge the Fund's securities against currency fluctuations. Risks may arise upon entering into these transactions from the potential inability of counterparties to meet the terms of their commitments and from unanticipated movements in security prices or foreign exchange rates. The foreign exchange contracts are adjusted by the daily exchange rate of the underlying currency and any gains or losses are recorded for financial statement purposes as unrealized until the settlement date.
Foreign exchange contracts are subject to Master Netting Agreements which are agreements between the Fund and its counterparties that provide for the net settlement of all transactions and collateral with the Fund, through a single payment, in the event of default or termination. Amounts presented on the Portfolio of Investments and Statement of Assets and Liabilities are not net settlement amounts but gross.
Foreign exchange contracts outstanding at period end, including net unrealized appreciation/depreciation or net settlement amounts, are listed after the Fund's Portfolio of Investments.
The average value at settlement date payable and receivable of foreign exchange contracts purchased and sold by the Fund throughout the fiscal period was $20,801 and $5,862, respectively. This is based on amounts held as of each month-end throughout the fiscal period.
Foreign Currency Translation
The accounting records of the Fund are maintained in U.S. dollars. All assets and liabilities denominated in foreign currencies (FCs) are translated into U.S. dollars based on the rates of exchange of such currencies against U.S. dollars on the date of valuation. Purchases and sales of securities, income and expenses are translated at the rate of exchange quoted on the respective date that such transactions are recorded. The Fund does not isolate that portion of the results of operations resulting from changes in foreign exchange rates on investments from the fluctuations arising from changes in market prices of securities held. Such fluctuations are included with the net realized and unrealized gain or loss from investments.
Reported net realized foreign exchange gains or losses arise from sales of FCs, currency gains or losses realized between the trade and settlement dates on securities transactions, the difference between the amounts of dividends, interest and foreign withholding taxes recorded on the Fund's books and the U.S. dollar equivalent of the amounts actually received or paid. Net unrealized foreign exchange gains and losses arise from changes in the value of assets and liabilities other than investments in securities at period end, resulting from changes in the exchange rate.
Securities Lending
The Fund participates in a securities lending program providing for the lending of equity securities to qualified brokers. The Fund normally receives cash collateral for securities loaned that is invested in short-term securities including repurchase agreements. Collateral is maintained at a minimum level of 100% of the market value of investments loaned, plus interest, if applicable. Earnings on collateral are allocated between the securities lending agent, as a fee for its services under the program, and the Fund, according to agreed-upon rates.
Annual Shareholder Report
The securities lending agreement permits the net settlement of all transactions and collateral with the Fund, through a single payment, in the event of default or termination. Amounts presented on the Portfolio of Investments and Statement of Assets and Liabilities are not net settlement amounts but gross. The cash collateral received by the Fund exceeds the market value of the securities loaned reducing the net settlement amount to zero. Additionally, the securities lending agreement executed by the Fund includes an indemnification clause. This clause stipulates that the borrower will reimburse the Fund for any losses as a result of any failure of the borrower to return equivalent securities to the Fund. As of November 30, 2016, securities subject to this type of arrangement and related collateral was as follows:
Market Value of
Securities Loaned | Market Value
of Collateral |
| $145,841 | $153,600 |
Restricted Securities
The Fund may purchase securities which are considered restricted. Restricted securities are securities that either: (a) cannot be offered for public sale without first being registered, or being able to take advantage of an exemption from registration, under the Securities Act of 1933; or (b) are subject to contractual restrictions on public sales. In some cases, when a security cannot be offered for public sale without first being registered, the issuer of the restricted security has agreed to register such securities for resale, at the issuer's expense, either upon demand by the Fund or in connection with another registered offering of the securities. Many such restricted securities may be resold in the secondary market in transactions exempt from registration. Restricted securities may be determined to be liquid under criteria established by the Trustees. The Fund will not incur any registration costs upon such resales. The Fund's restricted securities, like other securities, are priced in accordance with procedures established by and under the general supervision of the Trustees.
Additional information on restricted securities, excluding securities purchased under Rule 144A that have been deemed liquid by the Trustees, if applicable, held at November 30, 2016, is as follows:
| | Acquisition
Date | Cost | Market
Value |
| NovaTek OAO, GDR | 8/12/2015 | $57,607 | $70,675 |
| Rosneft Oil Co. | 8/12/2015 – 6/30/2016 | $85,036 | $110,788 |
| X5 Retail Group NV, GDR | 8/11/2015 – 6/30/2016 | $74,056 | $117,000 |
Annual Shareholder Report
Additional Disclosure Related to Derivative Instruments
| Fair Value of Derivative Instruments |
| | Asset |
| | Statement of
Assets and
Liabilities
Location | Fair Value |
| Derivatives not accounted for as hedging instruments under ASC Topic 815 | | |
| Foreign exchange contracts | Unrealized appreciation
on foreign
exchange contracts | $32,247 |
| Equity contracts | Receivable for daily
variation margin on
futures contracts | 10,527* |
| Total derivatives not accounted for as hedging instruments under ASC Topic 815 | | $42,774 |
| * | Includes cumulative unrealized appreciation of futures contracts as reported in the footnotes to the Portfolio of Investments. Only the current day's variation margin is reported within the Statement of Assets and Liabilities. |
The Effect of Derivative Instruments on the Statement of Operations for the Year Ended November 30, 2016
| Amount of Realized Gain or (Loss) on Derivatives Recognized in Income |
| | Futures
Contracts | Foreign
Exchange
Contracts1 | Total |
| Foreign exchange contracts | $— | $(3,802) | $(3,802) |
| Equity contracts | (62,008) | — | (62,008) |
| Interest rate contracts | 29,138 | — | 29,138 |
| TOTAL | $(32,870) | $(3,802) | $(36,672) |
| Change in Unrealized Appreciation or (Depreciation) on Derivatives Recognized in Income |
| | Futures
Contracts | Foreign
Exchange
Contracts2 | Total |
| Foreign exchange contracts | $— | $(71,109) | $(71,109) |
| Equity contracts | 112,986 | — | 112,986 |
| TOTAL | $112,986 | $(71,109) | $41,877 |
| 1 | The net realized loss on Foreign Exchange Contracts is found within the net realized loss on investments and foreign currency transactions on the Statement of Operations. |
| 2 | The net change in unrealized depreciation of Foreign Exchange Contracts is found within the net change in unrealized depreciation of investments and translation of assets and liabilities in foreign currency on the Statement of Operations. |
Annual Shareholder Report
Other
The preparation of financial statements in conformity with GAAP requires management to make estimates and assumptions that affect the amounts of assets, liabilities, expenses and revenues reported in the financial statements. Actual results could differ from those estimated. The Fund applies Investment Company accounting and reporting guidance.
3. SHARES OF BENEFICIAL INTEREST
The following table summarizes share activity:
| Year Ended November 30 | 2016 | 2015 |
| Shares sold | 278,194 | 1,311,930 |
| Shares issued to shareholders in payment of distributions declared | 14,644 | 230,361 |
| Shares redeemed | (334,917) | (571,483) |
| NET CHANGE RESULTING FROM FUND SHARE TRANSACTIONS | (42,079) | 970,808 |
4. FEDERAL TAX INFORMATION
The timing and character of income and capital gain distributions are determined in accordance with income tax regulations, which may differ from GAAP. These differences are due to differing treatments for foreign currency transactions and realized capital gains tax.
For the year ended November 30, 2016, permanent differences identified and reclassified among the components of net assets were as follows:
| Increase (Decrease) |
Undistributed
Net Investment
Income (Loss) | Accumulated
Net Realized
Gain (Loss) |
| $(26,577) | $26,577 |
Net investment income (loss), net realized gains (losses) and net assets were not affected by the reclassification.
The tax character of distributions as reported on the Statement of Changes in Net Assets for the years ended November 30, 2016 and 2015, was as follows:
| | 2016 | 2015 |
| Ordinary income | $119,280 | $77,600 |
| Long-term capital gains | $— | $2,114,310 |
As of November 30, 2016, the components of distributable earnings on a tax-basis were as follows:
| Undistributed ordinary income | $133,536 |
| Capital loss carryforwards | $(2,686,946) |
| Net unrealized appreciation | $774,761 |
Annual Shareholder Report
At November 30, 2016, the cost of investments for federal tax purposes was $14,391,514. The net unrealized appreciation of investments for federal tax purposes excluding any, unrealized appreciation/depreciation resulting from: (a) the translation from FCs to U.S. dollars of assets and liabilities other than investment in securities; (b) futures contracts; and (c) outstanding foreign currency commitments was $765,692. This consists of net unrealized appreciation from investments for those securities having an excess of value over cost of $1,587,119 and net unrealized depreciation from investments for those securities having an excess of cost over value of $821,427.
At November 30, 2016, the Fund had a capital loss carryforward of $2,686,946 which will reduce the Fund's taxable income arising from future net realized gains on investments, if any, to the extent permitted by the Code, thereby reducing the amount of distributions to shareholders which would otherwise be necessary to relieve the Fund of any liability for federal income tax. Pursuant to the Code, a net capital loss incurred in taxable years beginning after December 22, 2010, retains its character as either short-term or long-term, and does not expire. All of the Fund's capital loss carryforwards were incurred in taxable years beginning after December 22, 2010.
The following schedule summarizes the Fund's capital loss carryforwards:
| Short-Term | Long-Term | Total |
| $1,900,612 | $786,334 | $2,686,946 |
5. INVESTMENT ADVISER FEE AND OTHER TRANSACTIONS WITH AFFILIATES
Investment Adviser Fee
The advisory agreement between the Fund and the Adviser provides for an annual fee equal to 0.90% of the Fund's average daily net assets. Subject to the terms described in the Expense Limitation note, the Adviser may voluntarily choose to waive any portion of its fee and/or reimburse certain operating expenses of the Fund. For the year ended November 30, 2016, the Adviser voluntarily waived $120,306 of its fee and voluntarily reimbursed $105,702 of other operating expenses.
Administrative Fee
Federated Administrative Services (FAS), under the Administrative Services Agreement, provides the Fund with administrative personnel and services. For purposes of determining the appropriate rate breakpoint, “Investment Complex” is defined as all of the Federated Funds subject to a fee under the Administrative Services Agreement. The fee paid to FAS is based on the average daily net assets of the Investment Complex as specified below, plus certain out-of-pocket expenses:
| Administrative Fee | Average Daily Net Assets
of the Investment Complex |
| 0.150% | on the first $5 billion |
| 0.125% | on the next $5 billion |
| 0.100% | on the next $10 billion |
| 0.075% | on assets in excess of $20 billion |
Annual Shareholder Report
Subject to the terms described in the Expense Limitation note, FAS may voluntarily choose to waive any portion of its fee. For the year ended November 30, 2016, the annualized fee paid to FAS was 0.078% of average daily net assets of the Fund.
Expense Limitation
The Adviser and certain of its affiliates (which may include FAS) on their own initiative have agreed to waive certain amounts of their respective fees and/or reimburse expenses. Total annual fund operating expenses (as shown in the financial highlights, excluding interest expense, extraordinary expenses, line of credit expenses and proxy-related expenses paid by the Fund, if any) paid by the Fund's Institutional Shares (after the voluntary waivers and/or reimbursements) will not exceed 1.15% (the “Fee Limit”), up to but not including the later of (the “Termination Date”): (a) February 1, 2018; or (b) the date of the Fund's next effective Prospectus. While the Adviser and its applicable affiliates currently do not anticipate terminating or increasing these arrangements prior to the Termination Date, these arrangements may only be terminated or the Fee Limit increased prior to the Termination Date with the agreement of the Trustees.
General
Certain Officers and Trustees of the Fund are Officers and Directors or Trustees of certain of the above companies. To efficiently facilitate payment, Directors'/Trustees' fees and certain expenses related to conducting meetings of the Directors/Trustees and other miscellaneous expenses are paid by an affiliate of the Adviser which in due course are reimbursed by the Fund. Such expenses may be included in Accrued and Miscellaneous Expenses on the Statement of Assets and Liabilities and the Statement of Operations, respectively.
Transactions Involving Affiliated Holdings
Affiliated holdings are investment companies which are managed by the Adviser or an affiliate of the Adviser. The Adviser has agreed to reimburse the Fund for certain investment adviser fees as a result of transactions in other affiliated investment companies. For the year ended November 30, 2016, the Adviser reimbursed $1,774. Transactions involving the affiliated holding during the year ended November 30, 2016, were as follows:
| | Federated
Government
Obligations Fund,
Premier
Shares | Federated
Institutional
Prime Value
Obligations Fund,
Institutional Shares | Total |
| Balance of Shares Held 11/30/2015 | — | 2,113,723 | 2,113,723 |
| Purchases/Additions | 153,600 | 7,478,508 | 7,632,108 |
| Sales/Reductions | — | (8,609,258) | (8,609,258) |
| Balance of Shares Held 11/30/2016 | 153,600 | 982,973 | 1,136,573 |
| Value | $153,600 | $983,071 | $1,136,671 |
| Dividend Income | $46 | $6,213 | $6,259 |
Annual Shareholder Report
6. Investment TRANSACTIONS
Purchases and sales of investments, excluding long-term U.S. government securities and short-term obligations, for the year ended November 30, 2016, were as follows:
| Purchases | $7,767,835 |
| Sales | $6,452,302 |
7. CONCENTRATION OF RISK
The Fund invests in securities of non-U.S. issuers. Political or economic developments may have an effect on the liquidity and volatility of portfolio securities and currency holdings. A substantial portion of the Fund's portfolio may be comprised of obligations of China. Securities issued or traded in emerging markets such as China, generally entail greater risks than securities of developed markets. Their prices may be significantly more volatile than prices in developed countries and they may experience more severe downturns than developed economies.
8. LINE OF CREDIT
The Fund participates with certain other Federated Funds, on a several basis, in an up to $500,000,000 unsecured, 364-day, committed, revolving line of credit (LOC) agreement. The LOC was made available to finance temporarily the repurchase or redemption of shares of the Fund, failed trades, payment of dividends, settlement of trades and for other short-term, temporary or emergency general business purposes. The Fund cannot borrow under the LOC if an inter-fund loan is outstanding. The Fund's ability to borrow under the LOC also is subject to the limitations of the Act and various conditions precedent that must be satisfied before the Fund can borrow. Loans under the LOC are charged interest at a fluctuating rate per annum equal to the highest, on any day, of (a) (i) the federal funds effective rate, (ii) the one month London Interbank Offer Rate (LIBOR), and (iii) 0.0%, plus (b) a margin. The LOC also requires the Fund to pay, quarterly in arrears and at maturity, its pro rata share of a commitment fee based on the amount of the lenders' commitment that has not been utilized. As of November 30, 2016, the Fund had no outstanding loans. During the year ended November 30, 2016, the Fund did not utilize the LOC.
9. INTERFUND LENDING
Pursuant to an Exemptive Order issued by the Securities and Exchange Commission, the Fund, along with other funds advised by subsidiaries of Federated Investors, Inc., may participate in an interfund lending program. This program provides an alternative credit facility allowing the Fund to borrow from other participating affiliated funds. As of November 30, 2016, there were no outstanding loans. During the year ended November 30, 2016, the program was not utilized.
10. Regulatory updates
On October 13, 2016, the SEC amended existing rules intended to modernize reporting and disclosure of information. These amendments relate to Regulation S-X which sets forth the form and content of financial statements. At this time, management is evaluating the implications of adopting these amendments and their impact on the financial statements and accompanying notes.
Annual Shareholder Report
11. federal tax information (unaudited)
For the fiscal year ended November 30, 2016, 100% of total ordinary income distributions made by the Fund are qualifying dividends which may be subject to a maximum tax rate of 15%, as provided for by the Jobs and Growth Tax Relief Act of 2003. Complete information is reported in conjunction with the reporting of your distributions on Form 1099-DIV.
Of the ordinary income distributions made by the Fund during the year ended November 30, 2016, 0.53% qualify for the dividend received deduction available to corporate shareholders.
If the Fund meets the requirements of Section 853 of the Code, the Fund will pass through to its shareholders credits for foreign taxes paid. For the fiscal year ended November 30, 2016, the Fund derived $342,240 of gross income from foreign sources and paid foreign taxes of $39,434.
Annual Shareholder Report
Report of Independent Registered Public Accounting Firm
TO THE BOARD OF trustees of federated equity funds and shareholders OF Federated EMERGING MARKETS EQUITY fund:
We have audited the accompanying statement of assets and liabilities, including the portfolio of investments, of the Federated Emerging Markets Equity Fund (the “Fund”), a portfolio of Federated Equity Funds, as of November 30, 2016, and the related statement of operations for the year then ended, the statement of changes in net assets for each of the years in the two-year period then ended, and financial highlights for each of the years in the five-year period then ended. These financial statements and financial highlights are the responsibility of the Fund's management. Our responsibility is to express an opinion on these financial statements and financial highlights based on our audits.
We conducted our audits in accordance with the standards of the Public Company Accounting Oversight Board (United States). Those standards require that we plan and perform the audit to obtain reasonable assurance about whether the financial statements and financial highlights are free of material misstatement. An audit includes examining, on a test basis, evidence supporting the amounts and disclosures in the financial statements. Our procedures included confirmation of securities owned as of November 30, 2016, by correspondence with the custodian, transfer agent and brokers or by other appropriate auditing procedures. An audit also includes assessing the accounting principles used and significant estimates made by management, as well as evaluating the overall financial statement presentation. We believe that our audits provide a reasonable basis for our opinion.
In our opinion, the financial statements and financial highlights referred to above present fairly, in all material respects, the financial position of the Federated Emerging Markets Equity Fund as of November 30, 2016, the results of its operations for the year then ended, the changes in its net assets for each of the years in the two-year period then ended, and the financial highlights for each of the years in the five-year period then ended, in conformity with U.S. generally accepted accounting principles.
Boston, Massachusetts
January 25, 2017
Annual Shareholder Report
Shareholder Expense Example (unaudited)
As a shareholder of the Fund, you incur ongoing costs, including management fees and to the extent applicable, distribution (12b-1) fees and/or other service fees and other Fund expenses. This Example is intended to help you to understand your ongoing costs (in dollars) of investing in the Fund and to compare these costs with the ongoing costs of investing in other mutual funds. It is based on an investment of $1,000 invested at the beginning of the period and held for the entire period from June 1, 2016 to November 30, 2016.
ACTUAL EXPENSES
The first section of the table below provides information about actual account values and actual expenses. You may use the information in this section, together with the amount you invested, to estimate the expenses that you incurred over the period. Simply divide your account value by $1,000 (for example, an $8,600 account value divided by $1,000 = 8.6), then multiply the result by the number in the first section under the heading entitled “Expenses Paid During Period” to estimate the expenses attributable to your investment during this period.
HYPOTHETICAL EXAMPLE FOR COMPARISON PURPOSES
The second section of the table below provides information about hypothetical account values and hypothetical expenses based on the Fund's actual expense ratio and an assumed rate of return of 5% per year before expenses, which is not the Fund's actual return. Thus, you should not use the hypothetical account values and expenses to estimate the actual ending account balance or your expenses for the period. Rather, these figures are required to be provided to enable you to compare the ongoing costs of investing in the Fund with other funds. To do so, compare this 5% hypothetical example with the 5% hypothetical examples that appear in the shareholder reports of the other funds.
Please note that the expenses shown in the table are meant to highlight your ongoing costs only. Therefore, the second section of the table is useful in comparing ongoing costs only, and will not help you determine the relative total costs of owning different funds.
| | Beginning
Account Value
6/1/2016 | Ending
Account Value
11/30/2016 | Expenses Paid
During Period1 |
| Actual | $1,000 | $1,056.10 | $5.96 |
Hypothetical (assuming a 5% return
before expenses) | $1,000 | $1,019.20 | $5.86 |
| 1 | Expenses are equal to the Fund's annualized net expense ratio of 1.16%, multiplied by the average account value over the period, multiplied by 183/366 (to reflect the one-half-year period). |
Annual Shareholder Report
Board of Trustees and Trust Officers
The Board of Trustees is responsible for managing the Corporation's business affairs and for exercising all the Corporation's powers except those reserved for the shareholders. The following tables give information about each Trustee and the senior officers of the Fund. Where required, the tables separately list Trustees who are “interested persons” of the Fund (i.e., “Interested” Trustees) and those who are not (i.e., “Independent” Trustees). Unless otherwise noted, the address of each person listed is Federated Investors Tower, 1001 Liberty Avenue, Pittsburgh, PA 15222. The address of all Independent Trustees listed is 4000 Ericsson Drive, Warrendale, PA 15086-7561; Attention: Mutual Fund Board. As of December 31, 2016, the Trust comprised 14 portfolio(s), and the Federated Fund Family consisted of 40 investment companies (comprising 124 portfolios). Unless otherwise noted, each Officer is elected annually. Unless otherwise noted, each Trustee oversees all portfolios in the Federated Fund Family and serves for an indefinite term. The Fund's Statement of Additional Information includes additional information about Trust Trustees and is available, without charge and upon request, by calling 1-800-341-7400.
Interested Trustees Background
Name
Birth Date
Positions Held with Trust
Date Service Began | Principal Occupation(s) for Past Five Years,
Other Directorships Held and Previous Position(s) |
J. Christopher Donahue*
Birth Date: April 11, 1949
President and Trustee
Indefinite Term
Began serving: September 1999 | Principal Occupations: Principal Executive Officer and President of certain of the Funds in the Federated Fund Family; Director or Trustee of the Funds in the Federated Fund Family; President, Chief Executive Officer and Director, Federated Investors, Inc.; Chairman and Trustee, Federated Investment Management Company; Trustee, Federated Investment Counseling; Chairman and Director, Federated Global Investment Management Corp.; Chairman, Federated Equity Management Company of Pennsylvania and Passport Research, Ltd. (investment advisory subsidiary of Federated); Trustee, Federated Shareholder Services Company; Director, Federated Services Company.
Previous Positions: President, Federated Investment Counseling; President and Chief Executive Officer, Federated Investment Management Company, Federated Global Investment Management Corp. and Passport Research, Ltd. |
Annual Shareholder Report
Name
Birth Date
Positions Held with Trust
Date Service Began | Principal Occupation(s) for Past Five Years,
Other Directorships Held and Previous Position(s) |
John B. Fisher*
Birth Date: May 16, 1956
Trustee
Indefinite Term
Began serving: May 2016 | Principal Occupations: Principal Executive Officer and President of certain of the Funds in the Federated Fund Family; Director or Trustee of certain of the Funds in the Federated Fund Family; Vice President, Federated Investors, Inc.; President, Director/Trustee and CEO, Federated Advisory Services Company, Federated Equity Management Company of Pennsylvania, Federated Global Investment Management Corp., Federated Investment Counseling, Federated Investment Management Company; President and CEO of Passport Research, Ltd.; President of some of the Funds in the Federated Fund Complex and Director, Federated Investors Trust Company.
Previous Positions: President and Director of the Institutional Sales Division of Federated Securities Corp.; President and Director of Federated Investment Counseling; Director, Edgewood Securities Corp.; Director, Federated Services Company; Director, Federated Investors, Inc.; Chairman and Director, Southpointe Distribution Services, Inc. and President, Technology, Federated Services Company. |
| * | Reasons for “interested” status: J. Christopher Donahue and John B. Fisher are interested due to their beneficial ownership of shares of Federated Investors, Inc. and due to positions they hold with Federated and its subsidiaries. J. Christopher Donahue is the son of John F. Donahue, Chairman Emeritus of the Federated Funds. |
INDEPENDENT Trustees Background
Name
Birth Date
Positions Held with Trust
Date Service Began | Principal Occupation(s) for Past Five Years,
Other Directorships Held, Previous Position(s) and Qualifications |
John T. Collins
Birth Date: January 24, 1947
Trustee
Indefinite Term
Began serving: October 2013 | Principal Occupations: Director or Trustee of the Federated Fund Family; formerly, Chairman and CEO, The Collins Group, Inc. (a private equity firm) (Retired).
Other Directorships Held: Director, Current Chair of the Compensation Committee, KLX Corp.
Qualifications: Mr. Collins has served in several business and financial management roles and directorship positions throughout his career. Mr. Collins previously served as Chairman and CEO, The Collins Group, Inc. (a private equity firm). Mr. Collins serves as Chairman Emeriti, Bentley University. Mr. Collins previously served as Director and Audit Committee Member, Bank of America Corp.; Director, FleetBoston Financial Corp.; and Director, Beth Israel Deaconess Medical Center (Harvard University Affiliate Hospital). |
Annual Shareholder Report
Name
Birth Date
Positions Held with Trust
Date Service Began | Principal Occupation(s) for Past Five Years,
Other Directorships Held, Previous Position(s) and Qualifications |
G. Thomas Hough
Birth Date: February 28, 1955
Trustee
Indefinite Term
Began serving: August 2015 | Principal Occupations: Director or Trustee of the Federated Fund Family; formerly, Vice Chair, Ernst & Young LLP (public accounting firm) (Retired).
Other Directorships Held: Director, Chair of the Audit Committee, Governance Committee, Publix Super Markets, Inc.; Director, Member of the Audit Committee and Technology Committee of Equifax, Inc.
Qualifications: Mr. Hough has served in accounting, business management and directorship positions throughout his career. Mr. Hough most recently held the position of Americas Vice Chair of Assurance with Ernst & Young LLP (public accounting firm). Mr. Hough is an Executive Committee member of the United States Golf Association, he serves on the President's Cabinet and Business School Board of Visitors for the University of Alabama and is on the Business School Board of Visitors for Wake Forest University. |
Maureen Lally-Green
Birth Date: July 5, 1949
Trustee
Indefinite Term
Began serving: August 2009 | Principal Occupations: Director or Trustee of the Federated Fund Family; Interim Dean of the Duquesne University School of Law; Adjunct Professor of Law, Duquesne University School of Law; formerly, Associate General Secretary and Director, Office of Church Relations, Diocese of Pittsburgh.
Other Directorships Held: Director, CONSOL Energy Inc.
Qualifications: Judge Lally-Green has served in various legal and business roles and directorship positions throughout her career. Judge Lally-Green previously served as: Associate General Secretary, Diocese of Pittsburgh; a member of the Superior Court of Pennsylvania; and as a Professor of Law, Duquesne University School of Law. Judge Lally-Green also currently holds the positions on either a public or not for profit Board of Directors as follows: Director and Chair, UPMC Mercy Hospital; Regent, St. Vincent Seminary; Director and Vice Chair, Our Campaign for the Church Alive!, Inc.; Director, Saint Vincent College; Member, Pennsylvania State Board of Education (public); and Director and Chair, Cardinal Wuerl North Catholic High School, Inc. Judge Lally-Green has held the positions of: Director, Auberle; Director, Epilepsy Foundation of Western and Central Pennsylvania; Director, Ireland Institute of Pittsburgh; Director, Saint Thomas More Society; Director, Catholic High Schools of the Diocese of Pittsburgh, Inc.; and Director, Pennsylvania Bar Institute. |
Peter E. Madden
Birth Date: March 16, 1942
Trustee
Indefinite Term
Began serving: November 1991 | Principal Occupation: Director or Trustee, and Chair of the Board of Directors or Trustees, of the Federated Fund Family; Retired.
Other Directorships Held: None.
Qualifications: Mr. Madden has served in several business management, mutual fund services and directorship positions throughout his career. Mr. Madden previously served as President, Chief Operating Officer and Director, State Street Bank and Trust Company (custodian bank) and State Street Corporation (financial services). He was Director, VISA USA and VISA International and Chairman and Director, Massachusetts Bankers Association. Mr. Madden served as Director, Depository Trust Corporation and Director, The Boston Stock Exchange. Mr. Madden also served as a Representative to the Commonwealth of Massachusetts General Court. |
Annual Shareholder Report
Name
Birth Date
Positions Held with Trust
Date Service Began | Principal Occupation(s) for Past Five Years,
Other Directorships Held, Previous Position(s) and Qualifications |
Charles F. Mansfield, Jr.
Birth Date: April 10, 1945
Trustee
Indefinite Term
Began serving: January 1999 | Principal Occupations: Director or Trustee of the Federated Fund Family; Management Consultant.
Other Directorships Held: None.
Qualifications: Mr. Mansfield has served as a Marine Corps officer and in several banking, business management, educational roles and directorship positions throughout his long career. He remains active as a Management Consultant. |
Thomas M. O'Neill
Birth Date: June 14, 1951
Trustee
Indefinite Term
Began serving: August 2006 | Principal Occupations: Director or Trustee, Chair of the Audit Committee of the Federated Fund Family; Sole Proprietor, Navigator Management Company (investment and strategic consulting).
Other Directorships Held: None.
Qualifications: Mr. O'Neill has served in several business, mutual fund and financial management roles and directorship positions throughout his career. Mr. O'Neill serves as Director, Medicines for Humanity and Director, The Golisano Children's Museum of Naples, Florida. Mr. O'Neill previously served as Chief Executive Officer and President, Managing Director and Chief Investment Officer, Fleet Investment Advisors; President and Chief Executive Officer, Aeltus Investment Management, Inc.; General Partner, Hellman, Jordan Management Co., Boston, MA; Chief Investment Officer, The Putnam Companies, Boston, MA; Credit Analyst and Lending Officer, Fleet Bank; Director and Consultant, EZE Castle Software (investment order management software); and Director, Midway Pacific (lumber). |
P. Jerome Richey
Birth Date: February 23, 1949
Trustee
Indefinite Term
Began serving: October 2013 | Principal Occupations: Director or Trustee of the Federated Fund Family; Management Consultant; formerly, Senior Vice Chancellor and Chief Legal Officer, University of Pittsburgh and Executive Vice President and Chief Legal Officer, CONSOL Energy Inc.
Other Directorships Held: None.
Qualifications: Mr. Richey has served in several business and legal management roles and directorship positions throughout his career. Mr. Richey most recently held the positions of Senior Vice Chancellor and Chief Legal Officer, University of Pittsburgh. Mr. Richey previously served as Chairman of the Board, Epilepsy Foundation of Western Pennsylvania and Chairman of the Board, World Affairs Council of Pittsburgh. Mr. Richey previously served as Chief Legal Officer and Executive Vice President, CONSOL Energy Inc.; and Board Member, Ethics Counsel and Shareholder, Buchanan Ingersoll & Rooney PC (a law firm). |
Annual Shareholder Report
Name
Birth Date
Positions Held with Trust
Date Service Began | Principal Occupation(s) for Past Five Years,
Other Directorships Held, Previous Position(s) and Qualifications |
John S. Walsh
Birth Date: November 28, 1957
Trustee
Indefinite Term
Began serving: January 1999 | Principal Occupations: Director or Trustee of the Federated Fund Family; President and Director, Heat Wagon, Inc. (manufacturer of construction temporary heaters); President and Director, Manufacturers Products, Inc. (distributor of portable construction heaters); President, Portable Heater Parts, a division of Manufacturers Products, Inc.
Other Directorships Held: None.
Qualifications: Mr. Walsh has served in several business management roles and directorship positions throughout his career. Mr. Walsh previously served as Vice President, Walsh & Kelly, Inc. (paving contractors). |
OFFICERS
Name
Birth Date
Address
Positions Held with Trust
Date Service Began | Principal Occupation(s) for Past Five Years
and Previous Position(s) |
John W. McGonigle
Birth Date: October 26, 1938
EXECUTIVE VICE PRESIDENT AND SECRETARY
Officer since: April 1984 | Principal Occupations: Executive Vice President and Secretary of the Federated Fund Family; Vice Chairman, Executive Vice President, Secretary and Director, Federated Investors, Inc.
Previous Positions: Trustee, Federated Investment Management Company and Federated Investment Counseling; Director, Federated Global Investment Management Corp., Federated Services Company and Federated Securities Corp. |
Lori A. Hensler
Birth Date: January 6, 1967
TREASURER
Officer since: April 2013 | Principal Occupations: Principal Financial Officer and Treasurer of the Federated Fund Family; Senior Vice President, Federated Administrative Services; Financial and Operations Principal for Federated Securities Corp. and Edgewood Services, Inc.; and Assistant Treasurer, Federated Investors Trust Company. Ms. Hensler has received the Certified Public Accountant designation.
Previous Positions: Controller of Federated Investors, Inc.; Senior Vice President and Assistant Treasurer, Federated Investors Management Company; Treasurer, Federated Investors Trust Company; Assistant Treasurer, Federated Administrative Services, Federated Administrative Services, Inc., Federated Securities Corp., Edgewood Services, Inc., Federated Advisory Services Company, Federated Equity Management Company of Pennsylvania, Federated Global Investment Management Corp., Federated Investment Counseling, Federated Investment Management Company, Passport Research, Ltd., and Federated MDTA, LLC; Financial and Operations Principal for Federated Securities Corp., Edgewood Services, Inc. and Southpointe Distribution Services, Inc. |
Annual Shareholder Report
Name
Birth Date
Address
Positions Held with Trust
Date Service Began | Principal Occupation(s) for Past Five Years
and Previous Position(s) |
Peter J. Germain
Birth Date: September 3, 1959
CHIEF LEGAL OFFICER
Officer since: January 2005 | Principal Occupations: Mr. Germain is Chief Legal Officer of the Federated Fund Family. He is General Counsel and Vice President, Federated Investors, Inc.; President, Federated Administrative Services and Federated Administrative Services, Inc.; Vice President, Federated Securities Corp.; Secretary, Federated Private Asset Management, Inc.; and Secretary, Retirement Plan Service Company of America. Mr. Germain joined Federated in 1984 and is a member of the Pennsylvania Bar Association.
Previous Positions: Deputy General Counsel, Special Counsel, Managing Director of Mutual Fund Services, Federated Investors, Inc.; Senior Vice President, Federated Services Company; and Senior Corporate Counsel, Federated Investors, Inc. |
Richard B. Fisher
Birth Date: May 17, 1923
VICE PRESIDENT
Officer since: April 1987 | Principal Occupations: Vice Chairman or Vice President of some of the Funds in the Federated Fund Family; Vice Chairman, Federated Investors, Inc.; Chairman, Federated Securities Corp.
Previous Positions: President and Director or Trustee of some of the Funds in the Federated Fund Family; Executive Vice President, Federated Investors, Inc.; Director and Chief Executive Officer, Federated Securities Corp. |
Stephen Van Meter
Birth Date: June 5, 1975
CHIEF COMPLIANCE OFFICER AND SENIOR VICE PRESIDENT
Officer since: July 2015 | Principal Occupations: Senior Vice President and Chief Compliance Officer of the Federated Fund Family; Vice President and Chief Compliance Officer of Federated Investors, Inc. and Chief Compliance Officer of certain of its subsidiaries. Mr. Van Meter joined Federated in October 2011. He holds FINRA licenses under Series 3, 7, 24 and 66.
Previous Positions: Mr. Van Meter previously held the position of Compliance Operating Officer, Federated Investors, Inc. Prior to joining Federated, Mr. Van Meter served at the United States Securities and Exchange Commission in the positions of Senior Counsel, Office of Chief Counsel, Division of Investment Management and Senior Counsel, Division of Enforcement. |
Stephen F. Auth
Birth Date: September 13, 1956
101 Park Avenue
41st Floor
New York, NY 10178
CHIEF INVESTMENT OFFICER
Officer since: November 2002 | Principal Occupations: Stephen F. Auth is Chief Investment Officer of various Funds in the Federated Fund Family; Executive Vice President, Federated Investment Counseling, Federated Global Investment Management Corp. and Federated Equity Management Company of Pennsylvania.
Previous Positions: Executive Vice President, Federated Investment Management Company and Passport Research, Ltd. (investment advisory subsidiary of Federated); Senior Vice President, Global Portfolio Management Services Division; Senior Vice President, Federated Investment Management Company and Passport Research, Ltd.; Senior Managing Director and Portfolio Manager, Prudential Investments. |
Annual Shareholder Report
Evaluation and Approval of Advisory Contract–May 2016
Federated Emerging Markets Equity Fund (the “Fund”)
Following a review and recommendation of approval by the Fund's independent trustees, the Fund's Board of Trustees (the “Board”) reviewed and unanimously approved at its May 2016 meetings the continuation of the Fund's investment advisory contract for an additional one-year term. The Board's decision regarding the contract reflects the exercise of its business judgment after consideration of all of the information received on whether to continue the existing arrangements.
The Board had previously appointed a Senior Officer, whose duties include specified responsibilities relating to the process by which advisory fees are to be charged to a Federated fund. The Senior Officer has the authority to retain consultants, experts, or staff as may be reasonably necessary to assist in the performance of his duties, reports directly to the Board, and may be terminated only with the approval of a majority of the independent members of the Board. The Senior Officer prepared and furnished to the Board an independent, written evaluation that covered topics discussed below (the “Senior Officer's Evaluation”). The Board considered the Senior Officer's Evaluation, along with other information, in deciding to approve the investment advisory contract.
The Board is also familiar with and considered judicial decisions concerning allegedly excessive investment advisory fees, which have indicated that the following factors may be relevant to an adviser's fiduciary duty with respect to its receipt of compensation from a fund: the nature and quality of the services provided by an adviser to a fund and its shareholders, including the performance and fees and expenses of the fund and of comparable funds; an adviser's cost of providing the services, including the profitability to an adviser of providing advisory services to a fund; the extent to which an adviser may realize “economies of scale” as a fund grows larger and, if such economies of scale exist, whether they have been shared with a fund and its shareholders or the family of funds; any “fall-out financial benefits” that accrue to an adviser because of its relationship with a fund (including research services received from brokers that execute fund trades and any fees paid to affiliates of an adviser for services rendered to a fund); comparative fee and expense structures, including a comparison of fees paid to an adviser with those paid by similar funds; and the extent of care, conscientiousness and independence with which board members perform their duties and their expertise, including whether they are fully informed about all facts the board deems relevant to its consideration of an adviser's services and fees. The Board noted that the Securities and Exchange Commission (“SEC”) disclosure requirements regarding the basis for the Board's approval of the Fund's investment advisory contract generally track the factors listed above. Consistent with these judicial decisions and SEC disclosure requirements, the Board also considered management fees charged to
Annual Shareholder Report
institutional and other clients of Federated Global Investment Management Corp. (the “Adviser”) for what might be viewed as like services. The Board was aware of these factors and was guided by them in its review of the Fund's investment advisory contract to the extent it considered them to be appropriate and relevant, as discussed further below.
The Board considered and weighed these circumstances in light of its substantial accumulated experience in governing the Fund and working with Federated Investors, Inc. and its affiliates (“Federated”) on matters relating to the Federated funds, and was assisted in its deliberations by independent legal counsel. Throughout the year, and in connection with its May meetings, the Board requested and received substantial and detailed information about the Fund and the Federated organization that was in addition to the extensive materials that comprise and accompany the Senior Officer's Evaluation. Federated provided much of this information at each regular meeting of the Board, and furnished additional substantial information in connection with the May meetings at which the Board's formal review of the investment advisory contract occurred. At the May meetings in addition to meeting in separate sessions of the independent trustees without management present, senior management of the Adviser also met with the independent trustees and their counsel to discuss the materials presented and any other matters thought relevant by the Adviser or the trustees. Between regularly scheduled meetings, the Board also received information on particular matters as the need arose. Thus, the Board's consideration of the investment advisory contract included review of the Senior Officer's Evaluation, accompanying data and additional information covering such matters as: the Adviser's investment philosophy, revenue, profitability, personnel and processes; investment and operating strategies; the Fund's short- and long-term performance (in absolute terms, both on a gross basis and net of expenses, as well as in relationship to its particular investment program and certain competitor or “peer group” funds and/or other benchmarks, as appropriate), and comments on the reasons for performance; the Fund's investment objectives; the Fund's expenses (including the advisory fee itself and the overall expense structure of the Fund, both in absolute terms and relative to similar and/or competing funds, with due regard for contractual or voluntary expense limitations); the use and allocation of brokerage commissions derived from trading the Fund's portfolio securities (if any); and the nature, quality and extent of the advisory and other services provided to the Fund by the Adviser and its affiliates. The Board also considered the preferences and expectations of Fund shareholders; the entrepreneurial risk assumed by the Adviser in sponsoring the Fund; the continuing state of competition in the mutual fund industry and market practices; the range of comparable fees for similar funds in the mutual fund industry; the Fund's relationship to the Federated funds which include a comprehensive array of funds with different investment objectives, policies and strategies which are generally available for exchange without the incurrence of additional sales charges; compliance and
Annual Shareholder Report
audit reports concerning the Federated funds and the Federated companies that service them (including communications from regulatory agencies), as well as Federated's responses to any issues raised therein; and relevant developments in the mutual fund industry and how the Federated funds and/or Federated are responding to them. The Board's evaluation process is evolutionary. The criteria considered and the emphasis placed on relevant criteria change in recognition of changing circumstances in the mutual fund marketplace.
While mindful that courts have cautioned against giving such comparisons too much weight, the Board has found the use of comparisons of the Fund's fees and expenses to other mutual funds with comparable investment programs to be relevant to its deliberations. In this regard, the Board was presented with, and considered, information regarding the contractual advisory fee rates, net advisory fee rates, total expense ratios and each element of the Fund's total expense ratio (i.e., gross and net advisory fees, custody fees, portfolio accounting fees and transfer agency fees) relative to the Fund's peers. The Board focused on comparisons with other similar mutual funds more heavily than non-mutual fund products or services because it is believed that they are more relevant. For example, other mutual funds are the products most like the Fund, they are readily available to Fund shareholders as alternative investment vehicles, and they are the type of investment vehicle in fact chosen and maintained by the Fund's investors. The range of their fees and expenses therefore appears to be a relevant indicator of what consumers have found to be reasonable in the precise marketplace in which the Fund competes.
It was noted in the materials for the Board meeting that for the period covered by the Senior Officer's Evaluation, the Fund's investment advisory fee was waived in its entirety. The Board reviewed the contractual advisory fee rate, net advisory fee rate and other expenses of the Fund with the Adviser and noted the position of the Fund's fee rates relative to its peers. In this regard, the Board noted that the contractual advisory fee rate was below the median of the relevant peer group and the Board was satisfied that the overall expense structure of the Fund remained competitive.
By contrast, the Senior Officer has reviewed Federated's fees for providing advisory services to products outside the Federated funds (e.g., institutional and separate accounts and sub-adviser services). He concluded that mutual funds and institutional accounts are inherently different products. Those differences include, but are not limited to, different types of targeted investors; being subject to different laws and regulations; different legal structures; different average account sizes and portfolio management techniques made necessary by different cash flows and different associated costs; and the time spent by portfolio managers and their teams, funds financial services, legal, compliance and risk management in reviewing securities pricing, addressing different administrative
Annual Shareholder Report
responsibilities, addressing different degrees of risk associated with management and a variety of different costs. The Senior Officer did not consider the fees for providing advisory services to these outside products to be determinative in judging the appropriateness of mutual fund advisory fees.
Following such evaluation, the Board concluded, within the context of its full deliberations, that the expenses of the Fund are reasonable and supported renewal of the investment advisory contract with respect to the Fund.
The Board considered the nature, extent and quality of the services provided to the Fund by the Adviser and the resources of the Adviser and its affiliates dedicated to the Fund. In this regard, the Board evaluated, among other things, the Adviser's personnel, experience, track record, overall reputation and willingness to invest in personnel and infrastructure that benefit the Fund. In addition, the Board reviewed the qualifications, backgrounds and responsibilities of the portfolio management team primarily responsible for the day-to-day management of the Fund. The Board noted the compliance programs of and the compliance-related resources provided to the Fund by the Adviser. The Fund's ability to deliver competitive performance when compared to its peer group was also deemed to be relevant by the Board as a useful indicator of how the Adviser is executing the Fund's investment program, which in turn was one of the Board's considerations in reaching a conclusion that the nature, extent, and quality of the Adviser's investment management services were such as to warrant continuation of the investment advisory contract.
In evaluating the Fund's investment performance, the Board considered performance results in light of the Fund's investment objective, strategies and risks, as disclosed in the Fund's prospectus. The Board particularly considered detailed investment reports on the Fund's performance provided to the Board throughout the year and in connection with the May meetings. The Senior Officer also reviewed information compiled by Federated, using data supplied by independent fund ranking organizations, regarding the performance of, and fees charged by, other mutual funds, noting his view that comparisons to fund peer groups may be helpful, though not conclusive, in judging the reasonableness of the proposed fees. The Board considered, in evaluating such comparisons, that in some cases individual funds may exhibit significant and unique differences in their objectives and management techniques when compared to other funds within an industry peer group.
For the periods covered by the Senior Officer's Evaluation, the Fund's performance for the three-year and five-year periods was above the median of the relevant peer group, and the Fund's performance fell below the median of the relevant peer group for the one-year period. The Board discussed the Fund's performance with the Adviser and recognized the efforts being taken by the Adviser in the context of the other factors considered relevant by the Board.
Following such evaluation, the Board concluded, within the context of its full deliberations, that the performance of the Fund supported renewal of the investment advisory contract with respect to the Fund.
Annual Shareholder Report
The Board also received financial information about Federated, including information regarding the compensation and ancillary (or “fall-out”) benefits Federated derived from its relationships with the Federated funds. This information covered not only the fees under the investment advisory contracts, but also fees received by Federated's subsidiaries for providing other services to the Federated funds under separate contracts (e.g., for serving as the Federated funds' administrator). The information also detailed any indirect benefit Federated may derive from its receipt of research services from brokers who execute Federated fund trades. In addition, the Board considered the fact that, in order for a fund to be competitive in the marketplace, Federated and its affiliates frequently waived fees and/or reimbursed expenses and have disclosed to fund investors and/or indicated to the Board their intention to do so in the future, where appropriate. Moreover, the Board receives regular reporting as to the institution, adjustment or elimination of these voluntary waivers. The Board considered Federated's previous reductions in contractual management fees to certain funds in response to the Senior Officer's recommendations.
Federated furnished information, requested by the Senior Officer, that reported revenues on a fund-by-fund basis and made estimates of the allocation of expenses on a fund-by-fund basis, using allocation methodologies specified by the Senior Officer. The Senior Officer noted that, while these cost allocation reports apply consistent allocation processes, the inherent difficulties in allocating costs continues to cause the Senior Officer to question the precision of the process and to conclude that such reports may be unreliable, since a single change in an allocation estimate may dramatically alter the resulting estimate of cost and/or profitability of a fund and may produce unintended consequences. The allocation information, including the Senior Officer's view that fund-by-fund estimations may be unreliable, was considered in the analysis by the Board.
The Board and the Senior Officer also reviewed information compiled by Federated comparing profitability information for Federated to other publicly held fund management companies. In this regard, the Senior Officer concluded that Federated's profit margins did not appear to be excessive. The Senior Officer also noted that Federated appeared financially sound, with the resources to fulfill its obligations under its contracts with the Fund.
The Senior Officer's Evaluation also discussed the notion of possible realization of “economies of scale” as a fund grows larger. The Board considered in this regard that the Adviser has made significant and long-term investments in areas that support all of the Federated funds, such as personnel and processes for the portfolio management, shareholder services, compliance, internal audit, and risk management functions, as well as systems technology (including technology relating to cybersecurity), and that the benefits of these efforts (as well as any economies of scale, should they exist) were likely to be enjoyed by the fund family as a whole. The Board noted that the Adviser's investments in these areas are extensive. In addition, the Board considered that Federated and its affiliates have frequently waived fees and/or reimbursed expenses and that this has
Annual Shareholder Report
allowed fund shareholders to share potential economies of scale from a fund's inception. Federated, as it does throughout the year, and again in connection with the Board's review, furnished information relative to revenue sharing or adviser paid fees. Federated and the Senior Officer noted that this information should be viewed to determine if there was an incentive to either not apply breakpoints or to apply breakpoints at higher levels and should not be viewed to determine the appropriateness of advisory fees, because it would represent marketing and distribution expenses. Finally, the Board also noted the absence of any applicable regulatory or industry guidelines on this subject, which (as discussed in the Senior Officer's Evaluation) is compounded by the lack of any common industry practice or general pattern with respect to structuring fund advisory fees with “breakpoints” that serve to reduce the fee as a fund attains a certain size.
The Senior Officer noted that, subject to the comments and recommendations made within the Senior Officer's Evaluation, his observations and the information accompanying the Senior Officer's Evaluation supported a finding by the Board that the management fee for the fund was reasonable. Under these circumstances, no changes were recommended to, and no objection was raised to, the continuation of the Fund's investment advisory contract.
In its decision to continue an existing investment advisory contract, the Board was mindful of the potential disruptions of the Fund's operations and various risks, uncertainties and other effects that could occur as a result of a decision to terminate or not renew an investment advisory contract. In particular, the Board recognized that many shareholders have invested in the Fund on the strength of the Adviser's industry standing and reputation and with the expectation that the Adviser will have a continuing role in providing advisory services to the Fund. Thus, the Board's approval of the investment advisory contract reflected the fact that it is the shareholders who have effectively selected the Adviser by virtue of having invested in the Fund. The Board concluded that, in light of the factors discussed above, including the nature, quality and scope of the services provided to the Fund by the Adviser and its affiliates, continuation of the investment advisory contract was appropriate.
The Board based its decision to approve the investment advisory contract on the totality of the circumstances and relevant factors and with a view to past and future long-term considerations. Not all of the factors and considerations identified above were necessarily relevant to the Fund, nor did the Board consider any one of them to be determinative. With respect to the factors that were relevant, the Board's decision to approve the continuation of the contract reflects its determination that Federated's performance and actions provided a satisfactory basis to support the decision to continue the existing arrangement.
Annual Shareholder Report
Voting Proxies on Fund Portfolio Securities
A description of the policies and procedures that the Fund uses to determine how to vote proxies, if any, relating to securities held in the Fund's portfolio is available, without charge and upon request, by calling 1-800-341-7400. A report on “Form N-PX” of how the Fund voted any such proxies during the most recent 12-month period ended June 30 is available via the Proxy Voting Record (Form N-PX) link associated with the Fund and share class name at www.FederatedInvestors.com/FundInformation. Form N-PX filings are also available at the SEC's website at www.sec.gov.
Quarterly Portfolio Schedule
The Fund files with the SEC a complete schedule of its portfolio holdings, as of the close of the first and third quarters of its fiscal year, on “Form N-Q.” These filings are available on the SEC's website at www.sec.gov and may be reviewed and copied at the SEC's Public Reference Room in Washington, DC. (Call 1-800-SEC-0330 for information on the operation of the Public Reference Room.) You may also access this information via the link to the Fund and share class name at www.FederatedInvestors.com/FundInformation.
Annual Shareholder Report
Mutual funds are not bank deposits or obligations, are not guaranteed by any bank and are not insured or guaranteed by the U.S. government, the Federal Deposit Insurance Corporation, the Federal Reserve Board or any other government agency. Investment in mutual funds involves investment risk, including the possible loss of principal.
This Report is authorized for distribution to prospective investors only when preceded or accompanied by the Fund's Prospectus, which contains facts concerning its objective and policies, management fees, expenses and other information.
Federated Emerging Markets Equity Fund
Federated Investors Funds
4000 Ericsson Drive
Warrendale, PA 15086-7561
Contact us at FederatedInvestors.com
or call 1-800-341-7400.
Federated Securities Corp., Distributor
CUSIP 314172180
Q450778 (1/17)
Federated is a registered trademark of Federated Investors, Inc.
2017 ©Federated Investors, Inc.
Annual Shareholder Report
November 30, 2016
| Share Class | Ticker |
| A | RIMAX |
| B | ICFBX |
| C | ICFFX |
| Institutional | ICFIX |
| R6 | ICRSX |
Federated InterContinental Fund
Successor to the Rochdale Atlas Portfolio Established 1998
A Portfolio of Federated Equity Funds
Dear Valued Shareholder,
I am pleased to present the Annual Shareholder Report for your fund covering the period from December 1, 2015 through November 30, 2016. This report includes Management's Discussion of Fund Performance, a complete listing of your fund's holdings, performance information and financial statements along with other important fund information.
In addition, our website, FederatedInvestors.com, offers easy access to Federated resources that include timely fund updates, economic and market insights from our investment strategists, and financial planning tools. We invite you to register to take full advantage of its capabilities.
Thank you for investing with Federated. I hope you find this information useful and look forward to keeping you informed.
Sincerely,
J. Christopher Donahue, President
Not FDIC Insured • May Lose Value • No Bank Guarantee
CONTENTS
| 1 |
| 9 |
| 11 |
| 18 |
| 23 |
| 25 |
| 26 |
| 27 |
| 42 |
| 43 |
| 45 |
| 51 |
| 57 |
| 57 |
Management's Discussion of Fund Performance (unaudited)
The total return of Federated InterContinental Fund (the “Fund”), based on net asset value for the 12-month reporting period ended November 30, 2016, was -8.77%, -9.50%, -9.48%, -8.48%, and -8.45% for the Class A Shares, Class B Shares, Class C Shares, Institutional Shares, and Class R6 Shares, respectively. The return of the Fund's benchmark, the Morgan Stanley Capital International All Country World ex USA Index1 (MSCI ACWI ex USA), a broad-based securities market index, was -0.03% for the same period. The Fund's total return for the most recently completed fiscal year reflected actual cash flows, transaction costs and other expenses which were not reflected in the total return of the MSCI ACWI ex USA.
During the reporting period, the Fund's investment strategy focused on: (a) country allocation, (b) stock selection, and (c) currency allocation. These were the most significant factors affecting the performance relative to the MSCI ACWI ex USA.
The following discussion will focus on the performance of the Fund's R6 Shares.
Market Overview
International equity markets2 performance was mixed over the reporting period as initial fears of a financial crisis in China, and a downturn in commodity prices, was replaced by better-than-expected economic data, renewing optimism as both global growth improved and monetary policy remained supportive. China stabilized, and other emerging economies showed signs of economic recovery. During the reporting period, markets experienced volatility as unexpected political events roiled stocks and currencies. Overall, the early downturn in equity and commodity markets was followed by a broad rally. Global growth expectations steadily improved during the second half of the reporting period, and concerns about widespread deflation subsided partially due to OPEC's agreement for an output cut at its November meeting. For the reporting period, emerging markets (EM), as measured by the MSCI Emerging Markets Index,3 led the non-U.S. equity market benchmarks, rising a robust 8.47%. Developed non-U.S. markets, as measured by the MSCI EAFE Index,4 declined -3.66%, while the MSCI USA Index5 rose 7.02% for the reporting period.
During the reporting period, global equity markets were supported by accommodative monetary policies as major central banks recommitted to price stability with new rate cuts and additional quantitative easing outside the U.S. Japan joined Sweden, Denmark, Switzerland and the European Central Bank (ECB) when it cut its benchmark rate below zero percent. Central banks followed a negative interest rate policy (NIRP) in a continued effort to fight deflation and encourage economic growth. Given the muted outlook for global
Annual Shareholder Report
growth and prices, the Federal Reserve (the “Fed”) held rates steady at its March and June Federal Open Market Committee (FOMC) meetings. The dovish FOMC policy statements indicated that the Fed would follow a slower path of interest rate increases and would be less aggressive in normalizing interest rates. Overall, the monetary policies in place were supportive of price appreciation and improving economic activity. At the end of the reporting period, expectations were for the Fed to remain dovish with one hike in 2016 and three next year. Meanwhile in Europe and Japan, negative rates and quantitative easing were expected to remain in place for an extended period.
The European equity market, as measured by the MSCI AC Europe Index,6 returned -2.14% in local terms, but only returned -7.33% for U.S. dollar-based investors due to the strong U.S. dollar. In Europe, equity markets initially declined as continued turmoil in the Middle East and the ongoing refugee crisis in the region hurt sentiment. Despite the geopolitical turmoil, the euro area aggregate manufacturing Purchasing Managers' Index (PMI) remained in expansionary territory throughout the first half of the year. As the European market rallied back from the February lows, volatility renewed when the U.K. voted in favor of a referendum to leave the European Union (EU), also known as “Brexit.” Initially following the unexpected Brexit vote, global equity markets fell, and the U.S. dollar strengthened. This drag on European equity markets reversed swiftly in July, as economic data continued to positively surprise in the region. Heading into the fourth quarter of 2016, reported data, including PMIs and consumption spending, suggested solid growth ahead. Additionally, investors had time to digest Brexit economic implications on both country and corporate levels, which reduced initial uncertainty. The government's swift actions and fresh stimulus measures from the ECB and Bank of England provided market relief as the U.K. continued progress toward a formal EU exit. Strong European economic data suggested that the EU did not have much to fear from Brexit although political headwinds remained going into 2017.
The Japanese equity market, as measured by the MSCI Japan Index,7 returned -5.98% in local terms, but gained 1.72% for U.S. based investors due to the strong Japanese Yen. Despite the Bank of Japan (BoJ) lowering its benchmark rate into negative territory in an attempt to encourage economic activity and raise inflation expectations, investors grew concerned as the yen appreciated. A stronger and volatile yen hurt corporate profits and undermined confidence. Moreover, NIRP was negatively received as worries about how it might undermine the banking sector led to a sell-off in Financials. Economic data was softer than anticipated at mid-year, reflecting a drop in personal consumption and weaker than expected wage growth. Japanese structural reforms under the “three arrows of Abenomics” have slowly changed the economic landscape, and persistent zero to low real economic growth continued to challenge policy makers. In an effort to boost confidence, Prime Minister Shinzo Abe announced a two and half year delay of the long awaited consumption tax hike slated for April 2017. In September, the BoJ announced a new policy framework aimed at
Annual Shareholder Report
steepening the yield curve by maintaining negative short rates and 10-year Japanese Government Bond (JGB) yields close to 0%. Additionally, the BoJ committed to expanding the monetary base until inflation exceeds 2%. However, since the U.S. election, the yen reversed and sharply depreciated, making Japanese exports more attractive.
The Chinese equity market, as measured by the MSCI China Index,7 rose 3.83% during the reporting period. After an uncertain start to the year, China's equity markets stabilized and its economy appeared to grow modestly, as domestic consumption, in line with new economy companies and real estate, showed strength. Real GDP growth in China remained constant at 6.7% for three straight quarters despite pressure from old economy companies, such as those in cement and steel, which have experienced a long term secular decline as the country has continued its economic transformation from one dependent on high fixed asset investment to one reliant on consumption and services. Poor policy decisions by the central government spooked investors earlier in the year, but those fears abated as officials appeared to learn from their mistakes. The renminbi continued to depreciate, but in a more measured and orderly fashion than the prior year's sudden devaluation. The impact from earlier stimulus measures appeared to be slowly taking effect. The expectation that concern about the high level of corporate debt will continue to overhang the market persisted; however, the Chinese government demonstrated that rising non-performing loan issues will be managed in an orderly fashion, and policymakers added measures to contain the hot property market. As a result, there existed an expectation that economic and social stability should be maintained and that the world's second largest economy would continue to aid growth in the rest of the Asian region.
The Latin American equity market, as measured by the MSCI EM Latin America,8 was the top performing region, with a strong return of 24.4% for the reporting period. In Latin America, the outlook for Brazil and Mexico changed significantly during the year. In Brazil, months of political crisis ended following the impeachment of President Dilma Rouseff and the swearing in of interim President Michel Temer. President Temer introduced a plan for additional economic, budgetary and social reforms aimed at countering the high inflation, rising public debt and recession that has plagued Brazil in recent years. Brazil's central bank began a new easing cycle in the fourth quarter, with two 25 bps rate cuts. These policies created expectations of a swing in real GDP growth from -3.3% this year, to +1.2% next year that would be the largest of any major economy. The prospect of a brighter economic future, following an extended period of underperformance, caused Brazilian equities to be among the top performing markets in the reporting period, with the MSCI Brazil Index,7 appreciating 56.5%. In Mexico, rising optimism early in the year turned negative in the second half. The North American Free Trade Agreement (NAFTA) faced increasing risks following the U.S. Presidential election. Despite 225 bps of rate hikes by Banco de Mexico over the last year, the peso fell to an all-time low in
Annual Shareholder Report
the days following the election amid growing concerns about U.S.-Mexican ties. Despite strong personal consumption, driven by job creation, rising wages and remittances, expectations for economic growth in 2017 dropped from over +3% earlier in the year to about +1.9%. Mexico was one of the worst performing markets during the reporting period as measured by the MSCI Mexico Index,7 which dropped -14.3%, driven by a fall in stocks and the peso.
The list of primary drivers of international equity markets during 2016 included the following: (1) the Brexit referendum and the U.S. elections, (2) currency and commodity volatility coupled with U.S. dollar strength, (3) the trajectory for U.S. growth and debate over the timing and size of Fed tightening, (4) concerns about China's economy and signs of a downturn in global growth outlook, and (5) geopolitical risk events emanating from the Middle East.
FUND PERFORMANCE
As it consistently has been in the past, country allocation remained a key driver of performance for the reporting period. The Fund maintained exposure to select healthy, high sovereign quality, developed and emerging markets.
In Asia, a combination of country allocation and stock selection in South Korea and Taiwan, two countries weighted heavily in Technology Hardware exporters, had a positive impact on performance as global demand for electronics boosted stock prices. Handset and semiconductor manufacturer Samsung Electronics Co. (27.9%) finished the reporting period at an all-time high, shrugging off safety concerns with a niche product. Taiwan's Lite-On Technology Corp (40.0%) also benefited from consumer demand for computers and peripherals. While Tech stocks drove headlines, Financials, including Korea's Hana Financial Group Inc. (31.4%) and Taiwan's China Life Insurance Co (46.4%), contributed positively to performance as their earnings benefited from the steepening yield curve. Korea Electric Power Co. (-22.5%) detracted from performance on reforms to the domestic tariff system and rising bond yields. Elsewhere in the region, the Fund's underweight to China and Hong Kong contributed negatively to performance as equities rose while China's economy stabilized and consumer demand was robust. Additionally, our underweight to Indonesia contributed negatively to performance as a rebound in key commodities (coal and palm oil) boosted market confidence.
In Japan, following the BoJ's introduction of negative interest rates in February, the sharp unexpected appreciation of the yen led to a sell-off in exporters. The Fund's hedging (short yen versus U.S. dollar) and overweight to export sectors negatively impacted Fund performance. Among exporting companies owned, Murata Manufacturing Company (-28.2%), an electronic component producer, Honda Motor Company (-15.3%) and Hitachi Ltd.
Annual Shareholder Report
(-20.3%) contributed negatively. Several Japanese companies with higher domestic growth exposure, such as Pharmaceutical manufacturer, Shionogi & Co. (24.2%), and online travel company, Ikyu Corp. (43.3%), contributed positively.
Contributions from Europe were mixed during the reporting period. Underweights in France, Switzerland, Spain and the U.K. helped performance, while overweights in Germany, Denmark and Sweden hurt performance. The combination of market volatility surrounding Brexit, followed by a sell-off in bonds and currency following the U.S. elections contributed to wide variations in stock performance. Among the names held in the Fund, the largest decliners were insulin producer Novo Nordisk A/S (-38.0%), auto & truck maker Daimler AG (-22.4%), Pharmaceutical giant Bayer AG (-28.2%) and retailer Hennes & Mauritz (-19.8%). Positive stock selection came from DSV A/S (16.4%), Kerry Group (16.4%) and NKT Holding A/S (39.1%).
The Fund's underweight to several resource markets, such as Australia, Canada and Brazil, negatively impacted performance. The Fund maintained underweights in these countries during the reporting period as their economic prospects looked subpar; however, the equity markets and currencies rebounded on a reversal in sentiment in commodities following a long period of underperformance. The exception in the Fund was an overweight to Norway, which is a large oil and gas producing country. Norwegian companies had a positive impact on performance, especially Statoil ASA (17.1%), which was one of the top performers for the reporting period. Statoil's revenue's improved as oil prices moved higher and were coupled with efficiency improvements and lower input prices. Elsewhere in emerging markets, the Fund's overweight to Mexico hurt performance. Stocks and the peso experienced a sharp downturn following the U.S. elections. Shares of consumer companies including Wal-Mart de Mexico SAB de CV (-27.2%), dairy products producer Grupo LaLa SAB de CV (-35.9%) and quick service restaurant group Alsea SAB de CV (-16.1%) hurt performance.
During the reporting period, the Fund hedged some currencies using currency forwards.9 The overall net returns of the currency forward positions contributed negatively to performance. Hedging the British pound (versus the U.S. dollar) and a short position in the Japanese yen (versus the U.S. dollar) were a drag on Fund performance.
| 1 | Please see the footnotes to the line graphs under “Fund Performance and Growth of a $10,000 Investment” below for the definition of, and more information about, the MSCI ACWI ex USA. |
| 2 | International investing involves special risks including currency risk, increased volatility of foreign securities, political risks and differences in auditing and other financial standards. Prices of emerging markets securities can be significantly more volatile than the prices of securities in developed countries and currency risk and political risks are accentuated in emerging markets. |
| 3 | The MSCI Emerging Markets Index captures large- and mid-cap representation across 23 emerging markets countries. The index covers approximately 85% of the free float-adjusted market capitalization in each country.* |
Annual Shareholder Report
| 4 | The MSCI EAFE Index is a free float-adjusted market capitalization weighted index that is designed to measure the equity market performance of developed markets outside of North America (Europe, Australasia and the Far East).* |
| 5 | The MSCI USA Index is a free float adjusted market capitalization index that is designed to measure large and mid-cap U.S. equity market performance.* |
| 6 | The MSCI AC Europe Index captures large- and mid-cap representation across developed markets countries and emerging markets countries in Europe. The index covers approximately 85% of the free float-adjusted market capitalization in each country.* |
| 7 | MSCI country indexes are constructed by identifying every listed security in the market. Securities are free float adjusted, classified in accordance with the Global Industry Classification Standard (GICS®), and screened by size, liquidity and minimum free float.* |
| 8 | The MSCI EM Latin America captures large- and mid-cap representation across five emerging markets in Latin America. The index covers approximately 85% of the free float-adjusted market capitalization in each country.* |
| 9 | The Fund's use of derivative instruments, such as currency forwards, involves risks different from, or possibly greater than, the risks associated with investing directly in securities or other traditional instruments. |
| * | The index is unmanaged, and it is not possible to invest directly in an index. |
Annual Shareholder Report
FUND PERFORMANCE AND GROWTH OF A $10,000 INVESTMENT1
The graph below illustrates the hypothetical investment of $10,0002 in the Federated InterContinental Fund from November 30, 2006 to November 30, 2016, compared to the Morgan Stanley Capital International All Country World ex USA Index (MSCI ACWI ex USA).3 The Average Annual Total Return table below shows returns for each class averaged over the stated periods.
Growth of a $10,000 Investment
Growth of $10,000 as of November 30, 2016

| Federated InterContinental Fund - | Institutional Shares | Class C Shares | Class A Shares | MSCI ACWI ex USA |
| F | F | F | I |
| 11/30/2006 | 10,000 | 10,000 | 9,450 | 10,000 |
| 11/30/2007 | 12,838 | 12,753 | 11,662 | 12,205 |
| 11/30/2008 | 6,034 | 5,929 | 5,464 | 6,199 |
| 11/30/2009 | 8,797 | 8,549 | 7,941 | 9,076 |
| 11/30/2010 | 9,505 | 9,134 | 8,552 | 9,553 |
| 11/30/2011 | 9,007 | 8,560 | 8,078 | 8,990 |
| 11/30/2012 | 10,228 | 9,616 | 9,144 | 10,037 |
| 11/30/2013 | 11,893 | 11,056 | 10,599 | 11,868 |
| 11/30/2014 | 10,984 | 10,100 | 9,759 | 11,941 |
| 11/30/2015 | 10,792 | 9,811 | 9,556 | 11,067 |
| 11/30/2016 | 9,877 | 8,881 | 8,718 | 11,063 |
41 graphic description end -->
| ■ | The returns shown for Class C Shares include the maximum contingent deferred sales charge of 1.00% as applicable. |
| ■ | Total returns shown for Class A Shares include the maximum sales charge of 5.50% ($10,000 investment minus $550 sales charge = $9,450). |
The Fund offers multiple share classes whose performance may be greater than or less than its other share class(es) due to differences in sales charges and expenses. See the Average Annual Total Return table below for the returns of additional classes not shown in the line graph above.
Average Annual Total Returns for the Period Ended 11/30/2016
(returns reflect all applicable sales charges and contingent deferred sales charges as specified below in footnote #2)
| | 1 Year | 5 Years | 10 Years |
| Class A Shares | -13.78% | 0.39% | -0.98% |
| Class B Shares | -14.42% | 0.34% | -1.02% |
| Class C Shares | -10.38% | 0.74% | -1.18% |
| Institutional Shares | -8.48% | 1.86% | -0.13% |
| Class R6 Shares4 | -8.45% | 1.73% | -0.32% |
| MSCI ACWI ex USA | -0.03% | 4.24% | 1.02% |
Annual Shareholder Report
Performance data quoted represents past performance which is no guarantee of future results. Investment return and principal value will fluctuate so that an investor's shares, when redeemed, may be worth more or less than their original cost. Mutual fund performance changes over time and current performance may be lower or higher than what is stated. For current to the most recent month-end performance and after-tax returns, visit FederatedInvestors.com or call 1-800-341-7400. Returns shown do not reflect the deduction of taxes that a shareholder would pay on Fund distributions or the redemption of Fund shares. Mutual funds are not obligations of or guaranteed by any bank and are not federally insured.
| 1 | Federated InterContinental Fund is the successor to Rochdale Atlas Portfolio pursuant to a reorganization that took place on August 24, 2007. Shareholders of the Rochdale Atlas Portfolio received Class A Shares of the Fund as a result of the reorganization. The information presented above, for the periods prior to August 24, 2007, is historical information for Rochdale Atlas Portfolio. The fiscal year end of Rochdale Atlas Portfolio was December 31. The Fund's Class B, Class C, Class R and Institutional Shares commenced operations on August 25, 2007. For the period prior to the commencement of operations of the Fund's Class B Shares, Class C Shares and Class R Shares, the performance information shown is for the Fund's Class A Shares, adjusted to reflect the expenses of each new share class. For the period prior to the commencement of operations of Institutional Shares, the performance information shown is for the Fund's Class A Shares. The performance of the Class A Shares has not been adjusted to reflect the expenses of the Institutional Shares since the Institutional Shares have a lower expense ratio than the expense ratio of the Class A Shares. The performance of the Class A Shares has been adjusted to remove any voluntary waiver of Fund expenses related to the Class A Shares that may have occurred during the period prior to the commencement of operations of the Institutional Shares. The Fund's Class R6 Shares commenced operations on August 5, 2013. For the period prior to commencement of operations of the Class R6 Shares, the performance information shown is for Class A Shares. The performance of the Class A Shares has not been adjusted to reflect the expenses of the Class R6 Shares since the Class R6 Shares have a lower expense ratio than the expense ratio of the Class A Shares. Additionally, the performance information shown has been adjusted to reflect the absence of sales charges applicable to Class A Shares. |
| 2 | Represents a hypothetical investment of $10,000 in the Fund after deducting applicable sales charges: For Class A Shares, the maximum sales charge of 5.50% ($10,000 investment minus $550 sales charge = $9,450); For Class B Shares, the maximum contingent deferred sales charge is 5.50% on any redemption less than one year from purchase date; For Class C Shares, the maximum contingent deferred sales charge is 1.00% on any redemption less than one year from purchase date. The Fund's performance assumes the reinvestment of all dividends and distributions. The MSCI ACWI ex USA has been adjusted to reflect reinvestment of dividends on securities in the index. |
| 3 | The MSCI ACWI ex USA captures large- and mid-cap representation across 22 of 23 developed markets countries (excluding the U.S.) and 23 emerging markets countries. The index covers approximately 85% of the global equity opportunity set outside the U.S. The index is not adjusted to reflect sales loads, expenses or other fees that the Securities and Exchange Commission requires to be reflected in the Fund's performance. The index is unmanaged and, unlike the Fund, is not affected by cash flows. It is not possible to invest directly in an index. |
| 4 | The Fund's Class R6 Shares commenced operations on August 5, 2013. For the period prior to commencement of operations of the Class R6 Shares, the performance information shown is for Class A Shares. The performance of the Class A Shares has not been adjusted to reflect the expenses of the Class R6 Shares since the Class R6 Shares have a lower expense ratio than the expense ratio of the Class A Shares. Additionally, the performance information shown has been adjusted to reflect the absence of sales charges applicable to Class A Shares. |
Annual Shareholder Report
Portfolio of Investments Summary Tables (unaudited)
At November 30, 2016, the Fund's portfolio composition1 was as follows:
| Country | Percentage of
Total Net Assets |
| Japan | 21.2% |
| Germany | 11.2% |
| South Korea | 8.8% |
| Taiwan | 8.7% |
| Norway | 7.6% |
| Denmark | 7.5% |
| Sweden | 6.6% |
| Spain | 6.2% |
| Indonesia | 4.3% |
| Mexico | 4.1% |
| Austria | 3.9% |
| Ireland | 2.9% |
| Hungary | 1.5% |
| Romania | 1.0% |
| Czech Republic | 0.8% |
| Securities Lending Collateral2 | 2.5% |
| Cash Equivalents3 | 2.7% |
| Derivative Contracts4 | 0.5% |
| Other Assets and Liabilities—Net5 | (2.0)% |
| TOTAL | 100.0% |
Annual Shareholder Report
At November 30, 2016, the Fund's sector classification composition6 was as follows:
| Sector Classification | Percentage of
Total Net Assets |
| Financials | 18.8% |
| Consumer Discretionary | 14.7% |
| Industrials | 14.5% |
| Information Technology | 11.6% |
| Materials | 9.3% |
| Consumer Staples | 7.0% |
| Telecommunication Services | 5.8% |
| Energy | 4.5% |
| Health Care | 4.4% |
| Utilities | 3.4% |
| Real Estate | 2.3% |
| Securities Lending Collateral2 | 2.5% |
| Cash Equivalents3 | 2.7% |
| Derivative Contracts4 | 0.5% |
| Other Assets and Liabilities—Net5 | (2.0)% |
| TOTAL | 100.0% |
| 1 | Country allocations are based primarily on the country in which a company is incorporated. However, the Fund's Adviser may allocate a company to a country based on other factors such as location of the company's principal office, the location of the principal trading market for the company's securities or the country where a majority of the company's revenues are derived. |
| 2 | Represents cash collateral received from portfolio securities on loan which are invested in short-term investments such as repurchase agreements or money market funds. |
| 3 | Cash Equivalents include any investments in money market mutual funds and/or overnight repurchase agreements other than those representing cash collateral for securities lending. |
| 4 | Based upon net unrealized appreciation (depreciation) or value of the derivative contracts as applicable. Derivative contracts may consist of futures, forwards, options and swaps. The impact of a derivative contract on the Fund's performance may be larger than its unrealized appreciation (depreciation) or value may indicate. In many cases, the notional value or amount of a derivative contract may provide a better indication of the contract's significance to the portfolio. More complete information regarding the Fund's direct investments in derivative contracts, including unrealized appreciation (depreciation), value and notional values or amounts of such contracts, can be found in the table at the end of the Portfolio of Investments included in this Report. |
| 5 | Assets, other than investments in securities and derivative contracts, less liabilities. See Statement of Assets and Liabilities. |
| 6 | Except for, Derivative Contracts, Securities Lending Collateral and Other Assets and Liabilities, sector classifications are based upon, and individual securities assigned to, the classifications of the Global Industry Classification Standard (GICS) except that the Adviser assigns a classification to securities not classified by the GICS and to securities for which the Adviser does not have access to the classification made by the GICS. |
Annual Shareholder Report
Portfolio of Investments
November 30, 2016
| Shares | | | Value in
U.S. Dollars |
| | | COMMON STOCKS—96.3% | |
| | | Austria—3.9% | |
| 26,000 | 1 | Conwert Immobilien Invest SE | $445,115 |
| 70,400 | 1 | Erste Group Bank AG | 1,957,856 |
| 20,400 | | OMV AG | 660,778 |
| 39,300 | | Voestalpine AG | 1,492,105 |
| 56,484 | | Wienerberger AG | 1,002,245 |
| | | TOTAL | 5,558,099 |
| | | Czech Republic—0.8% | |
| 36,000 | | CEZ AS | 583,656 |
| 15,500 | | Komercni Banka AS | 512,872 |
| | | TOTAL | 1,096,528 |
| | | Denmark—7.5% | |
| 18,932 | | DSV A/S | 852,519 |
| 43,000 | | ISS A/S | 1,465,657 |
| 18,129 | | NKT Holding A/S | 1,235,672 |
| 15,000 | 2,3,4 | NNIT A/S | 426,468 |
| 67,100 | | Novo Nordisk A/S, ADR | 2,254,560 |
| 63,200 | | Realkredit Danmark A/S | 1,842,383 |
| 12,000 | | Royal Unibrew A/S | 473,114 |
| 31,600 | | Vestas Wind Systems A/S | 2,088,559 |
| | | TOTAL | 10,638,932 |
| | | Germany—11.2% | |
| 12,100 | | Allianz SE | 1,920,934 |
| 15,300 | | BASF SE | 1,310,334 |
| 7,600 | | Bayer AG | 713,253 |
| 11,000 | 2,3 | Covestro AG | 705,777 |
| 29,700 | | Daimler AG | 1,973,371 |
| 157,500 | | Deutsche Telekom AG | 2,479,452 |
| 7,500 | | HeidelbergCement AG | 672,139 |
| 8,100 | | Henkel AG & Co. KGaA | 939,622 |
| 22,000 | | METRO AG | 656,949 |
| 11,124 | | ProSiebenSat.1 Media SE | 381,961 |
| 24,500 | | SAP SE | 2,050,654 |
| 11,500 | | Siemens AG | 1,298,420 |
Annual Shareholder Report
| Shares | | | Value in
U.S. Dollars |
| | | COMMON STOCKS—continued | |
| | | Germany—continued | |
| 12,500 | | Symrise AG | $756,239 |
| | | TOTAL | 15,859,105 |
| | | Hungary—1.5% | |
| 260,000 | | Magyar Telekom Telecommunications PLC | 433,848 |
| 9,900 | | MOL Hungarian Oil & Gas PLC | 619,567 |
| 41,300 | | OTP Bank PLC | 1,110,847 |
| | | TOTAL | 2,164,262 |
| | | Indonesia—4.3% | |
| 2,800,000 | | Adaro Energy TBK PT | 314,622 |
| 876,000 | | Astra International TBK PT | 486,716 |
| 1,350,000 | | Bank Mandiri Persero TBK PT | 1,042,316 |
| 820,000 | | Bank Negara Indonesia Persero PT | 312,451 |
| 1,300,000 | | Bank Rakyat Indonesia Persero TBK PT | 1,046,743 |
| 106,000 | | Gudang Garam TBK PT | 505,162 |
| 790,000 | | Indofood CBP Sukses Makmur TBK PT | 503,788 |
| 475,000 | | Matahari Department Store TBK PT | 504,192 |
| 5,000,000 | | Telekomunikasi Indonesia Persero TBK PT | 1,398,679 |
| | | TOTAL | 6,114,669 |
| | | Ireland—2.9% | |
| 2,200,000 | 1 | Bank of Ireland | 477,191 |
| 50,000 | | CRH PLC | 1,668,998 |
| 17,000 | | Glanbia PLC | 288,009 |
| 9,100 | | Kerry Group PLC, Class A | 643,749 |
| 15,000 | | Kingspan Group PLC | 399,329 |
| 2,700 | | Paddy Power Betfair PLC | 281,867 |
| 13,000 | | Smurfit Kappa Group PLC | 296,228 |
| | | TOTAL | 4,055,371 |
| | | Japan—21.2% | |
| 31,500 | | Aisin Seiki Co. Ltd. | 1,369,929 |
| 30,200 | | Alps Electric Co. Ltd. | 782,006 |
| 406,000 | | ANA Holdings, Inc. | 1,139,489 |
| 17,000 | | Bandai Namco Holdings, Inc. | 489,247 |
| 61,300 | | Chugai Pharmaceutical Co. Ltd. | 1,754,685 |
| 7,400 | | Daikin Industries Ltd. | 708,382 |
| 8,200 | | Disco Corp. | 989,406 |
| 30,000 | | Don Quijote Holdings Co. Ltd. | 1,163,000 |
| 37,000 | | Doutor Nichires Holdings Co. Ltd. | 687,491 |
Annual Shareholder Report
| Shares | | | Value in
U.S. Dollars |
| | | COMMON STOCKS—continued | |
| | | Japan—continued | |
| 25,000 | | Fuji Heavy Industries Ltd. | $1,043,041 |
| 246 | | Hoshino Resorts REIT, Inc. | 1,296,322 |
| 2,100 | | Japan Hotel REIT Investment Corp. | 1,476,277 |
| 15,400 | | Kao Corp. | 714,432 |
| 1,000 | | Keyence Corp. | 692,069 |
| 32,000 | | Kubota Corp. | 492,877 |
| 46,300 | | Kyowa Hakko Kirin Co. Ltd. | 672,919 |
| 10,428 | 1 | Line Corp., ADR | 403,459 |
| 36,000 | | Mitsubishi Electric Corp. | 506,993 |
| 100,000 | | Mitsubishi UFJ Financial Group, Inc. | 598,754 |
| 7,500 | | Nidec Corp. | 679,224 |
| 62,500 | | NSK Ltd. | 700,517 |
| 32,000 | | NTT DOCOMO, Inc. | 737,874 |
| 268,000 | | Osaka Gas Co. Ltd. | 1,025,867 |
| 24,000 | | OSG Corp. | 481,405 |
| 5,500 | | Secom Co. Ltd. | 406,476 |
| 111,200 | | Sekisui House Ltd. | 1,845,973 |
| 2,500 | | SMC Corp. | 729,360 |
| 44,400 | | Sumitomo Mitsui Financial Group, Inc. | 1,672,869 |
| 15,000 | | Suzuki Motor Corp. | 492,184 |
| 50,000 | | Taiyo Nippon Sanso Corp. | 562,092 |
| 27,000 | | Teijin Ltd. | 509,055 |
| 18,000 | | Tokio Marine Holdings, Inc. | 791,668 |
| 8,700 | | Tokyo Electron Ltd. | 810,694 |
| 66,000 | | Yamaha Motor Co. Ltd. | 1,560,666 |
| | | TOTAL | 29,986,702 |
| | | Mexico—4.1% | |
| 390,000 | | Alpek SAB de CV | 537,728 |
| 120,000 | | Alsea SAB de CV | 352,255 |
| 80,000 | | Cemex SAB de CV, ADR | 624,800 |
| 7,700 | | Fomento Economico Mexicano SAB de CV, ADR | 600,985 |
| 29,417 | | Gruma SAB de CV, Class B | 351,815 |
| 3,900 | | Grupo Aeroportuario del Sureste SAB de CV, ADR | 563,043 |
| 175,000 | | Grupo Financiero Banorte SAB de CV | 839,194 |
| 84,500 | | Grupo Financiero Santander Mexico SAB de CV, ADR, Class B | 592,345 |
| 86,000 | | Infraestructura Energetica Nova SAB de CV | 374,411 |
| 475,000 | | Wal-Mart de Mexico SAB de CV | 873,311 |
| | | TOTAL | 5,709,887 |
Annual Shareholder Report
| Shares | | | Value in
U.S. Dollars |
| | | COMMON STOCKS—continued | |
| | | Norway—7.6% | |
| 68,377 | | DNB ASA | $1,009,716 |
| 65,000 | | Marine Harvest ASA | 1,170,621 |
| 26,900 | | Royal Caribbean Cruises Ltd. | 2,178,093 |
| 221,043 | 4 | Statoil ASA | 3,844,289 |
| 90,000 | | Tomra Systems ASA | 898,076 |
| 43,242 | | Yara International ASA | 1,602,855 |
| | | TOTAL | 10,703,650 |
| | | Romania—1.0% | |
| 1,350,000 | | Banca Transilvania SA | 747,202 |
| 85,000 | | Cineworld Group PLC | 577,734 |
| | | TOTAL | 1,324,936 |
| | | South Korea—8.8% | |
| 20,000 | | GS Holdings Corp. | 941,127 |
| 33,000 | | Hana Financial Group, Inc. | 913,845 |
| 19,500 | | Hanwha Chemical Corp. | 387,484 |
| 3,600 | | Hyundai Motor Co. | 411,087 |
| 30,000 | | Korea Electric Power Corp. | 1,187,856 |
| 60,000 | | LG Uplus Corp. | 587,568 |
| 1,500 | | Lotte Chemical Corp. | 414,781 |
| 16,000 | | Poongsan Corp. | 533,829 |
| 20,000 | | Samsung Card Co. Ltd. | 717,810 |
| 2,217 | | Samsung Electronics Co. Ltd. | 3,280,202 |
| 17,000 | | Shinhan Financial Group Co. Ltd., ADR | 644,640 |
| 11,000 | | SK Hynix, Inc. | 400,723 |
| 45,000 | | SK Telecom Co. Ltd., ADR | 954,000 |
| 105,000 | | Woori Bank | 1,077,194 |
| | | TOTAL | 12,452,146 |
| | | Spain—6.2% | |
| 58,000 | | Abertis Infraestructuras SA | 774,845 |
| 4,800 | 2,3 | Aena SA | 635,284 |
| 13,500 | | Amadeus IT Holding SA | 610,897 |
| 96,000 | | Banco Bilbao Vizcaya Argentaria SA | 592,770 |
| 115,000 | | Banco Santander SA | 519,800 |
| 130,000 | | Bankinter SA | 977,139 |
| 122,000 | | CaixaBank SA | 354,674 |
| 15,000 | | Enagas SA | 368,906 |
| 145,000 | | Iberdrola SA | 871,003 |
| 52,000 | | Industria de Diseno Textil SA | 1,774,245 |
Annual Shareholder Report
| Shares | | | Value in
U.S. Dollars |
| | | COMMON STOCKS—continued | |
| | | Spain—continued | |
| 26,000 | | Red Electrica Corporacion SA | $462,110 |
| 100,000 | | Telefonica SA | 829,000 |
| | | TOTAL | 8,770,673 |
| | | Sweden—6.6% | |
| 120,000 | | Cloetta AB | 379,928 |
| 47,800 | | Hennes & Mauritz AB, Class B | 1,384,395 |
| 240,200 | | Husqvarna AB, Class B | 1,773,439 |
| 20,000 | | Intrum Justitia AB | 604,910 |
| 60,000 | | Nordea Bank AB | 630,024 |
| 132,600 | | Peab AB | 1,021,601 |
| 20,000 | | Saab AB, Class B | 740,619 |
| 62,400 | | Skandinaviska Enskilda Banken AB, Class A | 621,476 |
| 13,000 | | Svenska Cellulosa AB SCA, Class B | 346,749 |
| 35,000 | 4 | Swedish Orphan Biovitrum AB | 370,386 |
| 136,200 | | Volvo AB, Class B | 1,450,520 |
| | | TOTAL | 9,324,047 |
| | | Taiwan—8.7% | |
| 300,000 | | Chailease Holding Co. Ltd. | 511,842 |
| 1,632,400 | | Chang Hwa Commercial Bank Ltd. | 873,527 |
| 728,000 | | China Life Insurance Co. Ltd. | 775,903 |
| 250,000 | | Chunghwa Telecom Co. Ltd. | 842,114 |
| 100,000 | | Delta Electronics, Inc. | 501,460 |
| 750,000 | | Far Eastern New Century Corp. | 552,639 |
| 1,557,050 | | First Financial Holding Co. Ltd. | 820,409 |
| 470,497 | | Hon Hai Precision Industry Co. Ltd. | 1,202,502 |
| 514,555 | | Lite-On Technology Corp. | 805,249 |
| 225,000 | | Pegatron Corp. | 535,167 |
| 320,000 | | Pou Chen Corp. | 399,594 |
| 76,000 | | President Chain Store Corp. | 570,815 |
| 514,000 | | Taiwan Semiconductor Manufacturing Co. Ltd. | 2,945,127 |
| 300,000 | | Uni-President Enterprises Corp. | 512,567 |
| 350,000 | | WPG Holdings Ltd. | 433,027 |
| | | TOTAL | 12,281,942 |
| | | TOTAL COMMON STOCKS
(IDENTIFIED COST $130,321,397) | 136,040,949 |
| | | INVESTMENT COMPANIES—5.2%5 | |
| 3,503,972 | | Federated Government Obligations Fund, Premier Shares, 0.31%6
(purchased with proceeds from securities lending collateral) | 3,503,972 |
Annual Shareholder Report
| Shares | | | Value in
U.S. Dollars |
| | | INVESTMENT COMPANIES—continued5 | |
| 3,855,175 | | Federated Institutional Prime Value Obligations Fund,
Institutional Shares, 0.56%6 | $3,855,561 |
| | | TOTAL INVESTMENT COMPANIES
(IDENTIFIED COST $7,359,147) | 7,359,533 |
| | | TOTAL INVESTMENTS—101.5%
(IDENTIFIED COST $137,680,544)7 | 143,400,482 |
| | | OTHER ASSETS AND LIABILITIES - NET—(1.5)%8 | (2,126,243) |
| | | TOTAL NET ASSETS—100% | $141,274,239 |
At November 30, 2016, the Fund had the following outstanding futures contracts:
| Description | Number of
Contracts | Notional
Value | Expiration
Date | Unrealized
Appreciation
(Depreciation) |
| 1BIST 30 Long Futures | 560 | $1,484,064 | December 2016 | $(115,058) |
| 1S&P/TSX 60 IX Long Futures | 28 | $3,698,593 | December 2016 | $148,853 |
| NET UNREALIZED APPRECIATION ON FUTURES CONTRACTS | $33,795 |
At November 30, 2016, the Fund had the following outstanding foreign exchange contracts:
| Settlement Date | Counterparty | Foreign Currency
Units to
Receive/Deliver | In
Exchange
For | Unrealized
Appreciation
(Depreciation) |
| Contracts Purchased: |
| 12/15/2016 | Citibank | 7,070,500 EUR | $7,728,445 | $(227,896) |
| Contracts Sold: |
| 12/1/2016 | BNY Mellon | 2,702,995 SEK | $293,099 | $22 |
| 12/15/2016 | Citibank | 14,035,500 EUR | $15,847,062 | $957,879 |
| NET UNREALIZED APPRECIATION ON FOREIGN EXCHANGE CONTRACTS | $730,005 |
Net Unrealized Appreciation on Futures Contracts and Foreign Exchange Contracts is included in “Other Assets and Liabilities—Net.”
| 1 | Non-income-producing security. |
| 2 | Denotes a restricted security that either: (a) cannot be offered for public sale without first being registered, or being able to take advantage of an exemption from registration, under the Securities Act of 1933; or (b) is subject to a contractual restriction on public sales. At November 30, 2016, these restricted securities amounted to $1,767,529, which represented 1.3% of total net assets. |
| 3 | Denotes a restricted security that may be resold without restriction to “qualified institutional buyers” as defined in Rule 144A under the Securities Act of 1933 and that the Fund has determined to be liquid under criteria established by the Fund's Board of Trustees (the “Trustees”). At November 30, 2016, these liquid restricted securities amounted to $1,767,529, which represented 1.3% of total net assets. |
| 4 | All or a portion of this security is temporarily on loan to unaffiliated broker/dealers. |
Annual Shareholder Report
| 5 | Affiliated holdings. |
| 6 | 7-day net yield. |
| 7 | The cost of investments for federal tax purposes amounts to $138,070,500. |
| 8 | Assets, other than investments in securities, less liabilities. See Statement of Assets and Liabilities. |
Note: The categories of investments are shown as a percentage of total net assets at November 30, 2016.
Various inputs are used in determining the value of the Fund's investments. These inputs are summarized in the three broad levels listed below:
Level 1—quoted prices in active markets for identical securities.
Level 2—other significant observable inputs (including quoted prices for similar securities, interest rates, prepayment speeds, credit risk, etc.). Also includes securities valued at amortized cost.
Level 3—significant unobservable inputs (including the Fund's own assumptions in determining the fair value of investments).
The inputs or methodology used for valuing securities are not an indication of the risk associated with investing in those securities.
The following is a summary of the inputs used, as of November 30, 2016, in valuing the Fund's assets carried at fair value:
| Valuation Inputs |
| | Level 1—
Quoted
Prices | Level 2—
Other
Significant
Observable
Inputs | Level 3—
Significant
Unobservable
Inputs | Total |
| Equity Securities: | | | | |
| Common Stocks | | | | |
| International | $13,493,439 | $122,547,510 | $— | $136,040,949 |
| Investment Companies | 7,359,533 | — | — | 7,359,533 |
| TOTAL SECURITIES | $20,852,972 | $122,547,510 | $— | $143,400,482 |
| Other Financial Instruments:* | | | | |
| Assets | $148,875 | $957,879 | $— | $1,106,754 |
| Liabilities | (115,058) | (227,896) | — | (342,954) |
| TOTAL OTHER FINANCIAL INSTRUMENTS | $33,817 | $729,983 | $— | $763,800 |
| * | Other financial instruments include futures contracts and foreign exchange contracts. |
The following acronyms are used throughout this portfolio:
| ADR | —American Depositary Receipt |
| EUR | —Euro |
| REIT | —Real Estate Investment Trust |
| SEK | —Swedish Krona |
See Notes which are an integral part of the Financial Statements
Annual Shareholder Report
Financial Highlights–Class A Shares
(For a Share Outstanding Throughout Each Period)
| Year Ended November 30 | 2016 | 2015 | 2014 | 2013 | 2012 |
| Net Asset Value, Beginning of Period | $48.84 | $50.08 | $55.05 | $48.01 | $42.91 |
| Income From Investment Operations: | | | | | |
| Net investment income1 | 0.66 | 0.60 | 0.55 | 0.56 | 0.68 |
| Net realized and unrealized gain (loss) on investments, futures contracts and foreign currency transactions | (4.86) | (1.64) | (4.87) | 7.02 | 4.89 |
| TOTAL FROM INVESTMENT OPERATIONS | (4.20) | (1.04) | (4.32) | 7.58 | 5.57 |
| Less Distributions: | | | | | |
| Distributions from net investment income | (0.92) | (0.20) | (0.65) | (0.54) | (0.47) |
| Net Asset Value, End of Period | $43.72 | $48.84 | $50.08 | $55.05 | $48.01 |
| Total Return2 | (8.77)% | (2.08 )% | (7.93 )% | 15.91% | 13.20% |
| Ratios to Average Net Assets: | | | | | |
| Net expenses | 1.28% | 1.30%3 | 1.29% | 1.40% | 1.48% |
| Net investment income | 1.47% | 1.19% | 1.03% | 1.11% | 1.52% |
| Expense waiver/reimbursement4 | 0.42% | 0.30% | 0.21% | 0.11% | 0.07% |
| Supplemental Data: | | | | | |
| Net assets, end of period (000 omitted) | $54,241 | $79,404 | $112,358 | $296,381 | $262,870 |
| Portfolio turnover | 56% | 49% | 64% | 58% | 54% |
| 1 | Per share numbers have been calculated using the average shares method. |
| 2 | Based on net asset value, which does not reflect the sales charge, redemption fee or contingent deferred sales charge, if applicable. |
| 3 | The net expense ratio is calculated without reduction for expense offset arrangements. The net expense ratio is 1.30% for the year ended November 30, 2015, after taking into account these expense reductions. |
| 4 | This expense decrease is reflected in both the net expense and net investment income ratios shown above. |
See Notes which are an integral part of the Financial Statements
Annual Shareholder Report
Financial Highlights–Class B Shares
(For a Share Outstanding Throughout Each Period)
| Year Ended November 30 | 2016 | 2015 | 2014 | 2013 | 2012 |
| Net Asset Value, Beginning of Period | $48.42 | $49.85 | $54.75 | $47.72 | $42.59 |
| Income From Investment Operations: | | | | | |
| Net investment income1 | 0.32 | 0.23 | 0.19 | 0.18 | 0.31 |
| Net realized and unrealized gain (loss) on investments, futures contracts, and foreign currency transactions | (4.87) | (1.66) | (4.91) | 6.95 | 4.93 |
| TOTAL FROM INVESTMENT OPERATIONS | (4.55) | (1.43) | (4.72) | 7.13 | 5.24 |
| Less Distributions: | | | | | |
| Distributions from net investment income | (0.52) | — | (0.18) | (0.10) | (0.11) |
| Net Asset Value, End of Period | $43.35 | $48.42 | $49.85 | $54.75 | $47.72 |
| Total Return2 | (9.50)% | (2.87)% | (8.65)% | 14.97% | 12.34% |
| Ratios to Average Net Assets: | | | | | |
| Net expenses | 2.07% | 2.09%3 | 2.09% | 2.20% | 2.27% |
| Net investment income | 0.72% | 0.46% | 0.35% | 0.35% | 0.69% |
| Expense waiver/reimbursement4 | 0.45% | 0.37% | 0.29% | 0.23% | 0.23% |
| Supplemental Data: | | | | | |
| Net assets, end of period (000 omitted) | $2,536 | $5,003 | $6,927 | $9,482 | $10,583 |
| Portfolio turnover | 56% | 49% | 64% | 58% | 54% |
| 1 | Per share numbers have been calculated using the average shares method. |
| 2 | Based on net asset value, which does not reflect the sales charge, redemption fee or contingent deferred sales charge, if applicable. |
| 3 | The net expense ratio is calculated without reduction for expense offset arrangements. The net expense ratio is 2.09% for the year ended November 30, 2015, after taking into account these expense reductions. |
| 4 | This expense decrease is reflected in both the net expense and net investment income ratios shown above. |
See Notes which are an integral part of the Financial Statements
Annual Shareholder Report
Financial Highlights–Class C Shares
(For a Share Outstanding Throughout Each Period)
| Year Ended November 30 | 2016 | 2015 | 2014 | 2013 | 2012 |
| Net Asset Value, Beginning of Period | $48.23 | $49.65 | $54.58 | $47.61 | $42.49 |
| Income From Investment Operations: | | | | | |
| Net investment income1 | 0.32 | 0.22 | 0.19 | 0.17 | 0.30 |
| Net realized and unrealized gain (loss) on investments, futures contracts and foreign currency transactions | (4.84) | (1.64) | (4.89) | 6.95 | 4.93 |
| TOTAL FROM INVESTMENT OPERATIONS | (4.52) | (1.42) | (4.70) | 7.12 | 5.23 |
| Less Distributions: | | | | | |
| Distributions from net investment income | (0.57) | — | (0.23) | (0.15) | (0.11) |
| Net Asset Value, End of Period | $43.14 | $48.23 | $49.65 | $54.58 | $47.61 |
| Total Return2 | (9.48)% | (2.86)% | (8.65)% | 14.98% | 12.34% |
| Ratios to Average Net Assets: | | | | | |
| Net expenses | 2.07% | 2.07%3 | 2.07% | 2.19% | 2.27% |
| Net investment income | 0.73% | 0.43% | 0.36% | 0.33% | 0.67% |
| Expense waiver/reimbursement4 | 0.35% | 0.27% | 0.20% | 0.11% | 0.06% |
| Supplemental Data: | | | | | |
| Net assets, end of period (000 omitted) | $19,569 | $26,696 | $32,783 | $44,764 | $43,430 |
| Portfolio turnover | 56% | 49% | 64% | 58% | 54% |
| 1 | Per share numbers have been calculated using the average shares method. |
| 2 | Based on net asset value, which does not reflect the sales charge, redemption fee or contingent deferred sales charge, if applicable. |
| 3 | The net expense ratio is calculated without reduction for expense offset arrangements. The net expense ratio is 2.07% for the year ended November 30, 2015, after taking into account these expense reductions. |
| 4 | This expense decrease is reflected in both the net expense and net investment income ratios shown above. |
See Notes which are an integral part of the Financial Statements
Annual Shareholder Report
Financial Highlights–Institutional Shares
(For a Share Outstanding Throughout Each Period)
| Year Ended November 30 | 2016 | 2015 | 2014 | 2013 | 2012 |
| Net Asset Value, Beginning of Period | $48.72 | $50.05 | $55.01 | $47.98 | $43.00 |
| Income From Investment Operations: | | | | | |
| Net investment income1 | 0.83 | 0.80 | 0.79 | 0.73 | 0.78 |
| Net realized and unrealized gain (loss) on investments, futures contracts and foreign currency transactions | (4.87) | (1.67) | (4.94) | 6.99 | 4.92 |
| TOTAL FROM INVESTMENT OPERATIONS | (4.04) | (0.87) | (4.15) | 7.72 | 5.70 |
| Less Distributions: | | | | | |
| Distributions from net investment income | (1.09) | (0.46) | (0.81) | (0.69) | (0.72) |
| Net Asset Value, End of Period | $43.59 | $48.72 | $50.05 | $55.01 | $47.98 |
| Total Return2 | (8.48)% | (1.75)% | (7.64)% | 16.27% | 13.56% |
| Ratios to Average Net Assets: | | | | | |
| Net expenses | 0.96% | 0.99%3 | 0.99% | 1.09% | 1.17% |
| Net investment income | 1.86% | 1.59% | 1.50% | 1.49% | 1.73% |
| Expense waiver/reimbursement4 | 0.35% | 0.27% | 0.20% | 0.13% | 0.09% |
| Supplemental Data: | | | | | |
| Net assets, end of period (000 omitted) | $58,612 | $77,569 | $152,673 | $275,579 | $193,171 |
| Portfolio turnover | 56% | 49% | 64% | 58% | 54% |
| 1 | Per share numbers have been calculated using the average shares method. |
| 2 | Based on net asset value. |
| 3 | The net expense ratio is calculated without reduction for expense offset arrangements. The net expense ratio is 0.99% for the year ended November 30, 2015, after taking into account these expense reductions. |
| 4 | The expense decrease is reflected in both the net expense and net investment income ratios shown above. |
See Notes which are an integral part of the Financial Statements
Annual Shareholder Report
Financial Highlights–Class R6 Shares
(For a Share Outstanding Throughout Each Period)
| | Year Ended November 30, | Period
Ended
11/30/20131 |
| | 2016 | 2015 | 2014 |
| Net Asset Value, Beginning of Period | $48.85 | $50.21 | $55.05 | $51.01 |
| Income From Investment Operations: | | | | |
| Net investment income (loss)2 | 0.79 | 0.79 | 1.07 | (0.06) |
| Net realized and unrealized gain (loss) on investments, futures contracts and foreign currency transactions | (4.83) | (1.67) | (5.26) | 4.10 |
| TOTAL FROM INVESTMENT OPERATIONS | (4.04) | (0.88) | (4.19) | 4.04 |
| Less Distributions: | | | | |
| Distributions from net investment income | (1.10) | (0.48) | (0.65) | — |
| Net Asset Value, End of Period | $43.71 | $48.85 | $50.21 | $55.05 |
| Total Return3 | (8.45)% | (1.76)% | (7.69)% | 7.92% |
| Ratios to Average Net Assets: | | | | |
| Net expenses | 0.93% | 0.95%4 | 0.95% | 0.94%5 |
| Net investment income (loss) | 1.76% | 1.58% | 2.04% | (0.36)%5 |
| Expense waiver/reimbursement6 | 0.35% | 0.27% | 0.21% | —%5 |
| Supplemental Data: | | | | |
| Net assets, end of period (000 omitted) | $6,317 | $5,707 | $6,287 | $07 |
| Portfolio turnover | 56% | 49% | 64% | 58%8 |
| 1 | Reflects operations for the period from August 5, 2013 (date of initial investment) to November 30, 2013. |
| 2 | Per share numbers have been calculated using the average shares method. |
| 3 | Based on net asset value. Total returns for periods of less than one year are not annualized. |
| 4 | The net expense ratio is calculated without reduction for expense offset arrangements. The net expense ratio is 0.95% for the year ended November 30, 2015, after taking into account these expense reductions. |
| 5 | Computed on an annualized basis. |
| 6 | This expense decrease is reflected in both the net expense and net investment income (loss) ratios shown above. |
| 7 | Represents less than $1,000. |
| 8 | Portfolio turnover is calculated at the Fund level. Percentage indicated was calculated for the fiscal year ended November 30, 2013. |
See Notes which are an integral part of the Financial Statements
Annual Shareholder Report
Statement of Assets and Liabilities
November 30, 2016
| Assets: | | |
| Total investment in securities, at value including $3,521,079 of securities loaned and $7,359,533 of investments in affiliated holdings (Note 5) (identified cost $137,680,544) | | $143,400,482 |
| Restricted cash (Note 2) | | 315,067 |
| Cash denominated in foreign currencies (identified cost $41,187) | | 43,007 |
| Cash | | 562 |
| Unrealized appreciation on foreign exchange contracts | | 957,901 |
| Receivable for investments sold | | 605,611 |
| Income receivable | | 429,660 |
| Receivable for shares sold | | 67,913 |
| Receivable for daily variation margin on futures contracts | | 5,580 |
| TOTAL ASSETS | | 145,825,783 |
| Liabilities: | | |
| Payable for collateral due to broker for securities lending | $3,503,972 | |
| Payable for investments purchased | 312,533 | |
| Payable for shares redeemed | 230,025 | |
| Unrealized depreciation on foreign exchange contracts | 227,896 | |
| Payable for capital gains taxes withheld | 52,607 | |
| Payable for distribution services fee (Note 5) | 13,797 | |
| Payable for other service fees (Notes 2 and 5) | 11,305 | |
| Payable for investment adviser fee (Note 5) | 2,419 | |
| Payable for administrative fee (Note 5) | 302 | |
| Accrued expenses (Note 5) | 196,688 | |
| TOTAL LIABILITIES | | 4,551,544 |
| Net assets for 3,241,948 shares outstanding | | $141,274,239 |
| Net Assets Consists of: | | |
| Paid-in capital | | $395,934,231 |
| Net unrealized appreciation of investments, futures contracts and translation of assets and liabilities in foreign currency | | 6,441,708 |
| Accumulated net realized loss on investments, futures contracts and foreign currency transactions | | (263,218,502) |
| Undistributed net investment income | | 2,116,802 |
| TOTAL NET ASSETS | | $141,274,239 |
Annual Shareholder Report
Statement of Assets and Liabilities–continued
| Net Asset Value, Offering Price and Redemption Proceeds Per Share: | | |
| Class A Shares: | | |
Net asset value per share ($54,241,047 ÷ 1,240,645 shares outstanding),
no par value, unlimited shares authorized | | $43.72 |
| Offering price per share (100/94.50 of $43.72) | | $46.26 |
| Redemption proceeds per share | | $43.72 |
| Class B Shares: | | |
Net asset value per share ($2,535,904 ÷ 58,499 shares outstanding),
no par value, unlimited shares authorized | | $43.35 |
| Offering price per share | | $43.35 |
| Redemption proceeds per share (94.50/100 of $43.35) | | $40.97 |
| Class C Shares: | | |
Net asset value per share ($19,569,168 ÷ 453,633 shares outstanding),
no par value, unlimited shares authorized | | $43.14 |
| Offering price per share | | $43.14 |
| Redemption proceeds per share (99.00/100 of $43.14) | | $42.71 |
| Institutional Shares: | | |
Net asset value per share ($58,611,513 ÷ 1,344,660 shares outstanding),
no par value, unlimited shares authorized | | $43.59 |
| Offering price per share | | $43.59 |
| Redemption proceeds per share | | $43.59 |
| Class R6 Shares: | | |
Net asset value per share ($6,316,607 ÷ 144,511 shares outstanding),
no par value, unlimited shares authorized | | $43.71 |
| Offering price per share | | $43.71 |
| Redemption proceeds per share | | $43.71 |
See Notes which are an integral part of the Financial Statements
Annual Shareholder Report
Statement of Operations
Year Ended November 30, 2016
| Investment Income: | | | |
| Dividends (including $39,773 received from affiliated holdings (Note 5) and net of foreign taxes withheld of $483,751) | | | $3,615,591 |
| Interest (income on securities loaned) | | | 1,059,380 |
| TOTAL INCOME | | | 4,674,971 |
| Expenses: | | | |
| Investment adviser fee (Note 5) | | $1,507,932 | |
| Administrative fee (Note 5) | | 131,034 | |
| Custodian fees | | 81,675 | |
| Transfer agent fees (Notes 2 and 5) | | 268,245 | |
| Directors'/Trustees' fees (Note 5) | | 2,039 | |
| Auditing fees | | 29,075 | |
| Legal fees | | 9,697 | |
| Distribution services fee (Note 5) | | 200,424 | |
| Other service fees (Notes 2 and 5) | | 224,728 | |
| Portfolio accounting fees | | 146,213 | |
| Share registration costs | | 78,671 | |
| Printing and postage | | 36,829 | |
| Miscellaneous (Note 5) | | 24,081 | |
| TOTAL EXPENSES | | 2,740,643 | |
| Waivers and Reimbursements: | | | |
| Waiver/reimbursement of investment adviser fee (Note 5) | $(546,240) | | |
| Waivers/reimbursement of other operating expenses (Notes 2 and 5) | (87,222) | | |
| TOTAL WAIVERS AND REIMBURSEMENTS | | (633,462) | |
| Net expenses | | | 2,107,181 |
| Net investment income | | | 2,567,790 |
| Realized and Unrealized Gain (Loss) on Investments, Futures Contracts and Foreign Currency Transactions: | | | |
| Net realized loss on investments and foreign currency transactions | | | (2,617,975) |
| Net realized loss on futures contracts | | | (165,627) |
| Net change in unrealized appreciation of investments and translation of assets and liabilities in foreign currency | | | (16,252,238) |
| Net change in unrealized depreciation of futures contracts | | | 141,933 |
| Net realized and unrealized loss on investments, futures contracts and foreign currency transactions | | | (18,893,907) |
| Change in net assets resulting from operations | | | $(16,326,117) |
See Notes which are an integral part of the Financial Statements
Annual Shareholder Report
Statement of Changes in Net Assets
| Year Ended November 30 | 2016 | 2015 |
| Increase (Decrease) in Net Assets | | |
| Operations: | | |
| Net investment income | $2,567,790 | $3,148,450 |
| Net realized loss on investments, futures contracts and foreign currency transactions | (2,783,602) | (3,185,168) |
| Net change in unrealized appreciation/depreciation of investments, futures contracts and translation of assets and liabilities in foreign currency | (16,110,305) | (1,668,141) |
| CHANGE IN NET ASSETS RESULTING FROM OPERATIONS | (16,326,117) | (1,704,859) |
| Distributions to Shareholders: | | |
| Distributions from net investment income | | |
| Class A Shares | (1,478,071) | (425,762) |
| Class B Shares | (51,576) | — |
| Class C Shares | (308,180) | — |
| Class R Shares | (33,213) | — |
| Institutional Shares | (1,770,112) | (1,325,640) |
| Class R6 Shares | (129,260) | (59,967) |
| CHANGE IN NET ASSETS RESULTING FROM DISTRIBUTIONS TO SHAREHOLDERS | (3,770,412) | (1,811,369) |
| Share Transactions: | | |
| Proceeds from sale of shares | 28,112,911 | 33,457,714 |
| Net asset value of shares issued to shareholders in payment of distributions declared | 3,053,770 | 1,196,167 |
| Cost of shares redeemed | (65,857,712) | (148,213,162) |
| CHANGE IN NET ASSETS RESULTING FROM SHARE TRANSACTIONS | (34,691,031) | (113,559,281) |
| Change in net assets | (54,787,560) | (117,075,509) |
| Net Assets: | | |
| Beginning of period | 196,061,799 | 313,137,308 |
| End of period (including undistributed net investment income of $2,116,802 and $3,253,894, respectively) | $141,274,239 | $196,061,799 |
See Notes which are an integral part of the Financial Statements
Annual Shareholder Report
Notes to Financial Statements
November 30, 2016
1. ORGANIZATION
Federated Equity Funds (the “Trust”) is registered under the Investment Company Act of 1940, as amended (the “Act”), as an open-end management investment company. The Trust consists of 14 portfolios. The financial statements included herein are only those of Federated InterContinental Fund (the “Fund”). The financial statements of the other portfolios are presented separately. The assets of each portfolio are segregated and a shareholder's interest is limited to the portfolio in which shares are held. Each portfolio pays its own expenses. The Fund offers five classes of shares: Class A Shares, Class B Shares, Class C Shares, Institutional Shares and Class R6 Shares. All shares of the Fund have equal rights with respect to voting, except on class-specific matters. The investment objective of the Fund is to seek long-term capital appreciation.
On June 1, 2015, Class B Shares were closed to new accounts/investors and to new purchases/exchanges by existing shareholders on August 1, 2015.
Pursuant to a plan of conversion, Class R shareholders automatically received shares of Class R6 in exchange for their Class R Shares without any fee, load or charge, as of the open of business on September 1, 2016. Class R Shares operated up to and including the close of business on August 31, 2016. The conversion occurred on a tax-free basis. For every one share of R Shares exchanged, a shareholder received 0.989 of the Fund's R6 Shares.
2. SIGNIFICANT ACCOUNTING POLICIES
The following is a summary of significant accounting policies consistently followed by the Fund in the preparation of its financial statements. These policies are in conformity with U.S. generally accepted accounting principles (GAAP).
Investment Valuation
In calculating its net asset value (NAV), the Fund generally values investments as follows:
| ■ | Equity securities listed on an exchange or traded through a regulated market system are valued at their last reported sale price or official closing price in their principal exchange or market. |
| ■ | Shares of other mutual funds or non-exchange-traded investment companies are valued based upon their reported NAVs. |
| ■ | Fixed-income securities are fair valued using price evaluations provided by a pricing service approved by the Trustees. |
| ■ | Derivative contracts listed on exchanges are valued at their reported settlement or closing price, except that options are valued at the mean of closing bid and asked quotations. |
| ■ | Over-the-counter (OTC) derivative contracts are fair valued using price evaluations provided by a pricing service approved by the Trustees. |
| ■ | For securities that are fair valued in accordance with procedures established by and under the general supervision of the Trustees, certain factors may be considered such as: the last traded or purchase price of the security, information obtained by contacting the issuer or dealers, analysis of the issuer's financial statements or other available documents, fundamental analytical data, the nature and duration of restrictions on disposition, the movement of the market in which the security is normally traded, public trading in similar securities or derivative contracts of the issuer or comparable issuers, movement of a relevant index, or other factors including but not limited to industry changes and relevant government actions. |
Annual Shareholder Report
If any price, quotation, price evaluation or other pricing source is not readily available when the NAV is calculated, or if the Fund cannot obtain price evaluations from a pricing service or from more than one dealer for an investment within a reasonable period of time as set forth in the Fund's valuation policies and procedures, the Fund uses the fair value of the investment determined in accordance with the procedures described below. There can be no assurance that the Fund could obtain the fair value assigned to an investment if it sold the investment at approximately the time at which the Fund determines its NAV per share.
Fair Valuation and Significant Events Procedures
The Trustees have ultimate responsibility for determining the fair value of investments for which market quotations are not readily available. The Trustees have appointed a valuation committee (“Valuation Committee”) comprised of officers of the Fund, Federated Global Investment Management Corp. (“Adviser”) and certain of the Adviser's affiliated companies to assist in determining fair value and in overseeing the calculation of the NAV. The Trustees have also authorized the use of pricing services recommended by the Valuation Committee to provide fair value evaluations of the current value of certain investments for purposes of calculating the NAV. The Valuation Committee employs various methods for reviewing third-party pricing-service evaluations including periodic reviews of third-party pricing services' policies, procedures and valuation methods (including key inputs, methods, models and assumptions), transactional back-testing, comparisons of evaluations of different pricing services and review of price challenges by the Adviser based on recent market activity. In the event that market quotations and price evaluations are not available for an investment, the Valuation Committee determines the fair value of the investment in accordance with procedures adopted by the Trustees. The Trustees periodically review and approve the fair valuations made by the Valuation Committee and any changes made to the procedures.
Factors considered by pricing services in evaluating an investment include the yields or prices of investments of comparable quality, coupon, maturity, call rights and other potential prepayments, terms and type, reported transactions, indications as to values from dealers and general market conditions. Some pricing services provide a single price evaluation reflecting the bid-side of the market for an investment (a “bid” evaluation). Other pricing services offer both bid evaluations and price evaluations indicative of a price between the prices bid and asked for the investment (a “mid” evaluation). The Fund normally uses bid evaluations for any U.S. Treasury and Agency securities, mortgage-backed securities and municipal securities. The Fund normally uses mid evaluations for any other types of fixed-income securities and any OTC derivative contracts. In the event that market quotations and price evaluations are not available for an investment, the fair value of the investment is determined in accordance with procedures adopted by the Trustees.
The Trustees also have adopted procedures requiring an investment to be priced at its fair value whenever the Adviser determines that a significant event affecting the value of the investment has occurred between the time as of which the price of the investment would otherwise be determined and the time as of which the NAV is computed. An event is considered significant if there is both an affirmative expectation that the investment's value will change in response to the event and a reasonable basis for quantifying the resulting change in value. Examples of significant events that may occur after the close of the principal market on which a security is traded, or after the time of a price evaluation provided by a pricing service or a dealer, include:
| ■ | With respect to securities traded principally in foreign markets, significant trends in U.S. equity markets or in the trading of foreign securities index futures contracts; |
Annual Shareholder Report
| ■ | Political or other developments affecting the economy or markets in which an issuer conducts its operations or its securities are traded; |
| ■ | Announcements concerning matters such as acquisitions, recapitalizations, litigation developments, or a natural disaster affecting the issuer's operations or regulatory changes or market developments affecting the issuer's industry. |
The Trustees have adopted procedures whereby the Valuation Committee uses a pricing service to determine the fair value of equity securities traded principally in foreign markets when the Adviser determines that there has been a significant trend in the U.S. equity markets or in index futures trading. For other significant events, the Fund may seek to obtain more current quotations or price evaluations from alternative pricing sources. If a reliable alternative pricing source is not available, the Fund will determine the fair value of the investment in accordance with the fair valuation procedures approved by the Trustees. The Trustees have ultimate responsibility for any fair valuations made in response to a significant event.
Repurchase Agreements
The Fund may invest in repurchase agreements for short-term liquidity purposes. It is the policy of the Fund to require the other party to a repurchase agreement to transfer to the Fund's custodian or sub-custodian eligible securities or cash with a market value (after transaction costs) at least equal to the repurchase price to be paid under the repurchase agreement. The eligible securities are transferred to accounts with the custodian or sub-custodian in which the Fund holds a “securities entitlement” and exercises “control” as those terms are defined in the Uniform Commercial Code. The Fund has established procedures for monitoring the market value of the transferred securities and requiring the transfer of additional eligible securities if necessary to equal at least the repurchase price. These procedures also allow the other party to require securities to be transferred from the account to the extent that their market value exceeds the repurchase price or in exchange for other eligible securities of equivalent market value.
The insolvency of the other party or other failure to repurchase the securities may delay the disposition of the underlying securities or cause the Fund to receive less than the full repurchase price. Under the terms of the repurchase agreement, any amounts received by the Fund in excess of the repurchase price and related transaction costs must be remitted to the other party.
The Fund may enter into repurchase agreements in which eligible securities are transferred into joint trading accounts maintained by the custodian or sub-custodian for investment companies and other clients advised by the Adviser and its affiliates. The Fund will participate on a pro rata basis with the other investment companies and clients in its share of the securities transferred under such repurchase agreements and in its share of proceeds from any repurchase or other disposition of such securities.
Investment Income, Gains and Losses, Expenses and Distributions
Investment transactions are accounted for on a trade-date basis. Realized gains and losses from investment transactions are recorded on an identified-cost basis. Interest income and expenses are accrued daily. Dividend income and distributions to shareholders are recorded on the ex-dividend date. Foreign dividends are recorded on the ex-dividend date or when the Fund is informed of the ex-dividend date. Distributions of net investment income are declared and paid annually. Non-cash dividends included in dividend income, if any, are recorded at fair value. Amortization/accretion of premium and discount is included in investment income. Investment income, realized and unrealized gains and losses, and certain fund-level expenses are allocated to each class based on relative average daily net assets, except that
Annual Shareholder Report
Class A Shares, Class B Shares, Class C Shares, Class R Shares, Institutional Shares and Class R6 Shares may bear distribution services fees, other service fees and transfer agent fees unique to those classes. The detail of the total fund expense waivers and reimbursements of $633,462 is disclosed in various locations in this Note 2 and Note 5.
For the year ended November 30, 2016, an unaffiliated third-party waived $12,353 of portfolio accounting fees.
For the year ended November 30, 2016, the custodian reimbursed $20,776 of custody fees.
Dividends are declared separately for each class. No class has preferential dividend rights; differences in per share dividend rates are generally due to differences in separate class expenses.
For the year ended November 30, 2016, transfer agent fees for the Fund were as follows:
| | Transfer
Agent Fees
Incurred | Transfer
Agent Fees
Reimbursed |
| Class A Shares | $148,774 | $(47,125) |
| Class B Shares | 10,536 | (3,604) |
| Class C Shares | 42,491 | — |
| Class R Shares | 3,777 | (562) |
| Institutional Shares | 59,491 | — |
| Class R6 Shares | 3,176 | — |
| TOTAL | $268,245 | $(51,291) |
Other Service Fees
The Fund may pay other service fees up to 0.25% of the average daily net assets of the Fund's Class A Shares, Class B Shares and Class C Shares to unaffiliated financial intermediaries or to Federated Shareholder Services Company (FSSC) for providing services to shareholders and maintaining shareholder accounts. Financial intermediaries may include a company affiliated with management of Federated Investors, Inc. Subject to the terms described in the Expense Limitation note, FSSC may voluntarily reimburse the Fund for other service fees. For the year ended November 30, 2016, other service fees for the Fund were as follows:
| | Other
Service Fees
Incurred |
| Class A Shares | $159,787 |
| Class B Shares | 8,758 |
| Class C Shares | 56,183 |
| TOTAL | $224,728 |
Federal Taxes
It is the Fund's policy to comply with the Subchapter M provision of the Internal Revenue Code (the “Code”) and to distribute to shareholders each year substantially all of its income. Accordingly, no provision for federal income tax is necessary. As of and during the year ended November 30, 2016, the Fund did not have a liability for any uncertain tax positions. The Fund
Annual Shareholder Report
recognizes interest and penalties, if any, related to tax liabilities as income tax expense in the Statement of Operations. As of November 30, 2016, tax years 2013 through 2016 remain subject to examination by the Fund's major tax jurisdictions, which include the United States of America and the Commonwealth of Massachusetts.
The Fund may be subject to taxes imposed by governments of countries in which it invests. Such taxes are generally based on either income or gains earned or repatriated. The Fund accrues and applies such taxes to net investment income, net realized gains and net unrealized gains as income and/or gains are earned.
When-Issued and Delayed-Delivery Transactions
The Fund may engage in when-issued or delayed-delivery transactions. The Fund records when-issued securities on the trade date and maintains security positions such that sufficient liquid assets will be available to make payment for the securities purchased. Securities purchased on a when-issued or delayed-delivery basis are marked to market daily and begin earning interest on the settlement date. Losses may occur on these transactions due to changes in market conditions or the failure of counterparties to perform under the contract.
Futures Contracts
The Fund purchases and sells financial futures contracts to seek to manage country risk, currency risk and market risk. Upon entering into a financial futures contract with a broker, the Fund is required to deposit in a segregated account U.S. government securities or a specified amount of cash which is shown as Restricted cash in the Statement of Assets and Liabilities. Futures contracts are valued daily and unrealized gains or losses are recorded in a “variation margin” account. Daily, the Fund receives from or pays to the broker a specified amount of cash based upon changes in the variation margin account. When a contract is closed, the Fund recognizes a realized gain or loss. Futures contracts have market risks, including the risk that the change in the value of the contract may not correlate with the changes in the value of the underlying securities. There is minimal counterparty risk to the Fund since futures contracts are exchange traded and the exchange's clearing house, as counterparty to all exchange-traded futures contracts, guarantees the futures contracts against default.
Futures contracts outstanding at the period end are listed after the Fund's Portfolio of Investments.
The average notional value of long futures contracts held by the Fund throughout the period was $3,851,563. This is based on amounts held as of each month-end throughout the fiscal year.
Foreign Exchange Contracts
The Fund may enter into foreign exchange contracts to manage currency risk and market risk. Purchased contracts are used to acquire exposure to foreign currencies, whereas, contracts to sell are used to hedge the Fund's securities against currency fluctuations. Risks may arise upon entering into these transactions from the potential inability of counterparties to meet the terms of their commitments and from unanticipated movements in security prices or foreign exchange rates. The foreign exchange contracts are adjusted by the daily exchange rate of the underlying currency and any gains or losses are recorded for financial statement purposes as unrealized until the settlement date.
Foreign exchange contracts are subject to Master Netting Agreements which are agreements between the Fund and its counterparties that provide for the net settlement of all transactions and collateral with the Fund, through a single payment, in the event of default or termination.
Annual Shareholder Report
Foreign exchange contracts outstanding at period end, including net unrealized appreciation/depreciation or net settlement amount, are listed after the Fund's Portfolio of Investments.
The average value at settlement date payable and receivable of foreign exchange contracts purchased and sold by the Fund throughout the period was $736,205 and $588,511, respectively. This is based on the amounts held as of each month-end throughout the fiscal year.
Foreign Currency Translation
The accounting records of the Fund are maintained in U.S. dollars. All assets and liabilities denominated in foreign currencies (FCs) are translated into U.S. dollars based on the rates of exchange of such currencies against U.S. dollars on the date of valuation. Purchases and sales of securities, income and expenses are translated at the rate of exchange quoted on the respective date that such transactions are recorded. The Fund does not isolate that portion of the results of operations resulting from changes in foreign exchange rates on investments from the fluctuations arising from changes in market prices of securities held. Such fluctuations are included with the net realized and unrealized gain or loss from investments.
Reported net realized foreign exchange gains or losses arise from sales of FCs, currency gains or losses realized between the trade and settlement dates on securities transactions, the difference between the amounts of dividends, interest and foreign withholding taxes recorded on the Fund's books and the U.S. dollar equivalent of the amounts actually received or paid. Net unrealized foreign exchange gains and losses arise from changes in the value of assets and liabilities other than investments in securities at fiscal period end, resulting from changes in the exchange rate.
Securities Lending
The Fund participates in a securities lending program providing for the lending of equity securities to qualified brokers. The Fund normally receives cash collateral for securities loaned that is invested in short-term securities including repurchase agreements. Collateral is maintained at a minimum level of 100% of the market value of investments loaned, plus interest, if applicable. Earnings on collateral are allocated between the securities lending agent, as a fee for its services under the program, and the Fund, according to agreed-upon rates.
The securities lending agreement permits the net settlement of all transactions and collateral with the Fund, through a single payment, in the event of default or termination. Amounts presented on the Portfolio of Investments and Statement of Assets and Liabilities are not net settlement amounts but gross. The cash collateral received by the Fund exceeds the market value of the securities loaned reducing the net settlement amount to zero. Additionally, the securities lending agreement executed by the Fund includes an indemnification clause. This clause stipulates that the borrower will reimburse the Fund for any losses as a result of any failure of the borrower to return equivalent securities to the Fund. As of November 30, 2016, securities subject to this type of arrangement and related collateral was as follows:
Market Value of
Securities Loaned | Market Value
of Collateral |
| $3,521,079 | $3,503,972 |
Annual Shareholder Report
Restricted Securities
The Fund may purchase securities which are considered restricted. Restricted securities are securities that either: (a) cannot be offered for public sale without first being registered, or being able to take advantage of an exemption from registration, under the Securities Act of 1933; or (b) are subject to contractual restrictions on public sales. In some cases, when a security cannot be offered for public sale without first being registered, the issuer of the restricted security has agreed to register such securities for resale, at the issuer's expense, either upon demand by the Fund or in connection with another registered offering of the securities. Many such restricted securities may be resold in the secondary market in transactions exempt from registration. Restricted securities may be determined to be liquid under criteria established by the Trustees. The Fund will not incur any registration costs upon such resale. The Fund's restricted securities, like other securities, are priced in accordance with procedures established by and under the general supervision of the Trustees.
Additional Disclosure Related to Derivative Instruments
| Fair Value of Derivative Instruments |
| | Asset | Liability |
| | Statement of
Assets and
Liabilities
Location | Fair
Value | Statement of
Assets and
Liabilities
Location | Fair
Value |
Derivatives not accounted for as
hedging instruments under
ASC Topic 815 | | | | |
| Foreign exchange contracts | Unrealized
appreciation
on foreign
exchange
contracts | $957,901 | Unrealized
depreciation
on foreign
exchange
contracts | $227,896 |
| Equity contracts | Receivable for
daily variation
margin on futures
contracts | $33,795* | | — |
Total derivatives not accounted
for as hedging instruments under
ASC Topic 815 | | $991,696 | | $227,896 |
| * | Includes cumulative appreciation of futures contracts as reported in the footnotes to the Portfolio of Investments. Only the current day's variation margin is reported within the Statement of Assets and Liabilities. |
Annual Shareholder Report
The Effect of Derivative Instruments on the Statement of Operations for the Year ended November 30, 2016
| Amount of Realized Gain or (Loss) on Derivatives Recognized in Income |
| | Futures
Contracts | Foreign
Exchange
Contracts1 | Total |
| Equity contracts | $(165,627) | $— | $(165,627) |
| Foreign exchange contracts | — | (3,783,797) | (3,783,797) |
| TOTAL | $(165,627) | $(3,783,797) | $(3,949,424) |
| Change in Unrealized Appreciation or (Depreciation) on Derivatives Recognized in Income |
| | Futures
Contracts | Foreign
Exchange
Contracts2 | Total |
| Equity contracts | $141,933 | $— | $141,933 |
| Foreign exchange contracts | — | (1,636,212) | (1,636,212) |
| TOTAL | $141,933 | $(1,636,212) | $(1,494,279) |
| 1 | The net realized loss on Foreign Exchange Contracts is found within the net realized loss on investments and foreign currency transactions on the Statement of Operations. |
| 2 | The net change in unrealized depreciation of Foreign Exchange Contracts is found within the Net change in unrealized appreciation of investments and translation of assets and liabilities in foreign currency on the Statement of Operations. |
Other
The preparation of financial statements in conformity with GAAP requires management to make estimates and assumptions that affect the amounts of assets, liabilities, expenses and revenues reported in the financial statements. Actual results could differ from those estimated. The Fund applies Investment Company accounting and reporting guidance.
3. SHARES OF BENEFICIAL INTEREST
The following tables summarize share activity:
| Year Ended November 30 | 2016 | 2015 |
| Class A Shares: | Shares | Amount | Shares | Amount |
| Shares sold | 187,073 | $8,342,540 | 265,314 | $13,430,095 |
| Shares issued to shareholders in payment of distributions declared | 29,394 | 1,405,638 | 8,230 | 404,490 |
| Shares redeemed | (601,516) | (26,913,615) | (891,306) | (44,247,443) |
NET CHANGE RESULTING FROM
CLASS A SHARE TRANSACTIONS | (385,049) | $(17,165,437) | (617,762) | $(30,412,858) |
Annual Shareholder Report
| Year Ended November 30 | 2016 | 2015 |
| Class B Shares: | Shares | Amount | Shares | Amount |
| Shares sold | — | $— | 3,679 | $184,734 |
| Shares issued to shareholders in payment of distributions declared | 1,062 | 50,705 | — | — |
| Shares redeemed | (45,889) | (2,054,668) | (39,292) | (1,970,906) |
NET CHANGE RESULTING FROM
CLASS B SHARE TRANSACTIONS | (44,827) | $(2,003,963) | (35,613) | $(1,786,172) |
| Year Ended November 30 | 2016 | 2015 |
| Class C Shares: | Shares | Amount | Shares | Amount |
| Shares sold | 58,491 | $2,595,412 | 71,830 | $3,600,178 |
| Shares issued to shareholders in payment of distributions declared | 5,833 | 277,194 | — | — |
| Shares redeemed | (164,222) | (7,314,230) | (178,540) | (8,870,514) |
NET CHANGE RESULTING FROM
CLASS C SHARE TRANSACTIONS | (99,898) | $(4,441,624) | (106,710) | $(5,270,336) |
| Year Ended November 30 | 2016 | 2015 |
| Class R Shares: | Shares | Amount | Shares | Amount |
| Shares sold | 6,102 | $273,392 | 7,125 | $357,742 |
| Shares issued to shareholders in payment of distributions declared | 674 | 31,868 | — | — |
| Shares redeemed | (41,571) | (1,864,864) | (14,981) | (745,305) |
| NET CHANGE RESULTING FROM CLASS R SHARE TRANSACTIONS | (34,795) | $(1,559,604) | (7,856) | $(387,563) |
| Year Ended November 30 | 2016 | 2015 |
| Institutional Shares: | Shares | Amount | Shares | Amount |
| Shares sold | 335,611 | $15,191,510 | 297,940 | $14,906,210 |
| Shares issued to shareholders in payment of distributions declared | 24,387 | 1,159,105 | 14,973 | 731,710 |
| Shares redeemed | (607,534) | (27,142,876) | (1,771,159) | (90,910,633) |
| NET CHANGE RESULTING FROM INSTITUTIONAL SHARE TRANSACTIONS | (247,536) | $(10,792,261) | (1,458,246) | $(75,272,713) |
Annual Shareholder Report
| Year Ended November 30 | 2016 | 2015 |
| Class R6 Shares: | Shares | Amount | Shares | Amount |
| Shares sold | 11,109 | $507,135 | 19,499 | $978,755 |
| Shares exchanged from Class R Shares | 26,677 | 1,202,922 | — | — |
| Shares issued to shareholders in payment of distributions declared | 2,713 | 129,260 | 1,223 | 59,967 |
| Shares redeemed | (12,814) | (567,459) | (29,101) | (1,468,361) |
| NET CHANGE RESULTING FROM CLASS R6 SHARE TRANSACTIONS | 27,685 | $1,271,858 | (8,379) | $(429,639) |
NET CHANGE RESULTING FROM
TOTAL FUND SHARE TRANSACTIONS | (784,420) | $(34,691,031) | (2,234,566) | $(113,559,281) |
4. FEDERAL TAX INFORMATION
The timing and character of income and capital gain distributions are determined in accordance with income tax regulations, which may differ from GAAP. These differences are due to differing treatments for foreign currency transactions, realized capital gains tax, passive foreign investment companies and expired capital loss carryforwards.
For the year ended November 30, 2016, permanent differences identified and reclassified among the components of net assets were as follows:
| Increase (Decrease) |
| Paid-in Capital | Undistributed
Net Investment
Income (Loss) | Accumulated
Net Realized
Gain (Loss) |
| $(845,950) | $65,530 | $780,420 |
Net investment income (loss), net realized gains (losses) and net assets were not affected by the reclassification.
The tax character of distributions as reported on the Statement of Changes in Net Assets for the years ended November 30, 2016 and 2015, was as follows:
| | 2016 | 2015 |
| Ordinary income | $3,770,412 | $1,811,369 |
As of November 30, 2016, the components of distributable earnings on a tax-basis were as follows:
| Undistributed ordinary income | $2,506,758 |
| Net unrealized appreciation | $5,321,769 |
| Capital loss carryforwards | $(262,488,519) |
The difference between book-basis and tax-basis net unrealized appreciation/depreciation is attributable to differing treatments for the realization for tax purposes of unrealized gains on investments in passive foreign investment companies.
At November 30, 2016, the cost of investments for federal tax purposes was $138,070,500. The net unrealized appreciation of investments for federal tax purposes, excluding: (a) any unrealized appreciation/depreciation resulting from the translation of FCs to U.S. dollars of assets and liabilities other than investments in securities; (b) outstanding foreign currency
Annual Shareholder Report
commitments; and (c) futures contracts, was $5,329,982. This consists of net unrealized appreciation from investments for those securities having an excess of value over cost of $12,052,889 and net unrealized depreciation from investments for those securities having an excess of cost over value of $6,722,907.
At November 30, 2016, the Fund had a capital loss carryforward of $262,488,519 which will reduce the Fund's taxable income arising from future net realized gains on investments, if any, to the extent permitted by the Code, thereby reducing the amount of distributions to shareholders which would otherwise be necessary to relieve the Fund of any liability for federal income tax. Pursuant to the Code, a net capital loss incurred in taxable years beginning on or before December 22, 2010, is characterized as short-term and may be carried forward for a maximum of eight tax years (“Carryforward Limit”), whereas a net capital loss incurred in taxable years beginning after December 22, 2010, retains its character as either short-term or long-term, does not expire and is required to be utilized prior to the losses which have a Carryforward Limit.
The following schedule summarizes the Fund's capital loss carryforwards and expiration years:
| Expiration Year | Short-Term | Long-Term | Total |
| No expiration | $11,959,787 | $46,087 | $12,005,874 |
| 2017 | $250,482,645 | NA | $250,482,645 |
Capital loss carryforwards of $845,950 expired during the year ended November 30, 2016.
5. INVESTMENT ADVISER FEE AND OTHER TRANSACTIONS WITH AFFILIATES
Investment Adviser Fee
The advisory agreement between the Fund and the Adviser provides for an annual fee equal to 0.90% of the Fund's average daily net assets. Subject to the terms described in the Expense Limitation note, the Adviser may voluntarily choose to waive and/or reimburse any portion of its fee. For the year ended November 30, 2016, the Adviser voluntarily waived $536,826 of its fee and reimbursed $51,291 of transfer agent fees.
Administrative Fee
Federated Administrative Services (FAS), under the Administrative Services Agreement, provides the Fund with administrative personnel and services. For purposes of determining the appropriate rate breakpoint, “Investment Complex” is defined as all of the Federated Funds subject to a fee under the Administrative Services Agreement. The fee paid to FAS is based on the average daily net assets of the Investment Complex as specified below, plus certain out-of-pocket expenses:
| Administrative Fee | Average Daily Net Assets
of the Investment Complex |
| 0.150% | on the first $5 billion |
| 0.125% | on the next $5 billion |
| 0.100% | on the next $10 billion |
| 0.075% | on assets in excess of $20 billion |
Annual Shareholder Report
Subject to the terms described in the Expense Limitation note, FAS may voluntarily choose to waive any portion of its fee. For the year ended November 30, 2016, the fee paid to FAS was 0.078% of the average daily net assets of the Fund.
Distribution Services Fee
The Fund has adopted a Distribution Plan (the “Plan”) pursuant to Rule 12b-1 under the Act. Under the terms of the Plan, the Fund will compensate Federated Securities Corp. (FSC), the principal distributor, from the daily net assets of the Fund's Class A Shares, Class B Shares, Class C Shares and Class R Shares to finance activities intended to result in the sale of these shares. The Plan provides that the Fund may incur distribution expenses at the following percentages of average daily net assets annually, to compensate FSC:
| Share Class Name | Percentage of Average
Daily Net Assets of Class |
| Class A Shares | 0.05% |
| Class B Shares | 0.75% |
| Class C Shares | 0.75% |
| Class R Shares | 0.50% |
Subject to the terms described in the Expense Limitation note, FSC may voluntarily choose to waive any portion of its fee. For the year ended November 30, 2016, distribution services fees for the Fund were as follows:
| | Distribution
Services Fees
Incurred | Distribution
Services Fees
Waived |
| Class B Shares | $26,273 | $— |
| Class C Shares | 168,548 | — |
| Class R Shares | 5,603 | (2,802) |
| TOTAL | $200,424 | $(2,802) |
For the year ended November 30, 2016, the Fund's Class A Shares did not incur a distribution services fee; however, it may begin to incur this fee upon approval of the Trustees.
When FSC receives fees, it may pay some or all of them to financial intermediaries whose customers purchase shares. For the year ended November 30, 2016, FSC retained $23,980 of fees paid by the Fund.
Sales Charges
Front-end sales charges and contingent deferred sales charges (CDSC) do not represent expenses of the Fund. They are deducted from the proceeds of sales of Fund shares prior to investment or from redemption proceeds prior to remittance, as applicable. For the year ended November 30, 2016, FSC retained $1,672 in sales charges from the sale of Class A Shares. FSC also retained $561, $4,523 and $337 of CDSC relating to redemptions of Class A, Class B and Class C Shares, respectively.
Other Service Fees
For the year ended November 30, 2016, FSSC received $12,019 of the other service fees disclosed in Note 2.
Annual Shareholder Report
Expense Limitation
The Adviser and certain of its affiliates (which may include FSC, FAS and FSSC) on their own initiative have agreed to waive certain amounts of their respective fees and/or reimburse expenses. Total annual fund operating expenses (as shown in the financial highlights, excluding tax reclaim recovery expenses, interest expense, extraordinary expenses, line of credit expenses and proxy-related expenses paid by the fund, if any) paid by the Fund's Class A Shares, Class B Shares, Class C Shares, Institutional Shares and Class R6 Shares (after the voluntary waivers and reimbursements) will not exceed 1.29%, 2.08%, 2.08%, 0.98% and 0.94% (the “Fee Limit”), respectively, up to but not including the later of (the “Termination Date”): (a) February 1, 2018; or (b) the date of the Fund's next effective Prospectus. While the Adviser and its applicable affiliates currently do not anticipate terminating or increasing these arrangements prior to the Termination Date, these arrangements may only be terminated or the Fee Limit increased prior to the Termination Date with the agreement of the Trustees.
General
Certain Officers and Trustees of the Fund are Officers and Directors or Trustees of certain of the above companies. To efficiently facilitate payment, Directors'/Trustees' fees and certain expenses related to conducting meetings of the Directors/Trustees and other miscellaneous expenses are paid by an affiliate of the Adviser which in due course are reimbursed by the Fund. Such expenses may be included in Accrued and Miscellaneous Expenses on the Statement of Assets and Liabilities and Statement of Operations, respectively.
Transactions Involving Affiliated Holdings
Affiliated holdings are investment companies which are managed by the Adviser or an affiliate of the Adviser. The Adviser has agreed to reimburse the Fund for certain investment adviser fees as a result of transactions in other affiliated investment companies. For the year ended November 30, 2016, the Adviser reimbursed $9,414. Transactions with the affiliated holdings during the year ended November 30, 2016, were as follows:
| | Federated
Money Market
Management,
Institutional Shares | Federated
Government
Obligations Fund,
Premier Shares | Federated
Institutional
Prime Value
Obligations Fund,
Institutional Shares | Total |
| Balance of Shares Held 11/30/2015 | 1,272,586 | — | 1,678,225 | 2,950,811 |
| Purchases/Additions | — | 3,503,972 | 97,263,346 | 100,767,318 |
| Sales/Reductions | (1,272,586) | — | (95,086,396) | (96,358,982) |
| Balance of Shares Held 11/30/2016 | — | 3,503,972 | 3,855,175 | 7,359,147 |
| Value | $— | $3,503,972 | $3,855,561 | $7,359,533 |
| Dividend Income | $8,762 | $929 | $30,082 | $39,773 |
Annual Shareholder Report
6. Investment TRANSACTIONS
Purchases and sales of investments, excluding long-term U.S. government securities and short-term obligations, for the year ended November 30, 2016, are as follows:
| Purchases | $90,295,503 |
| Sales | $131,916,953 |
7. CONCENTRATION OF RISK
The Fund invests in securities of non-U.S. issuers. Political or economic developments may have an effect on the liquidity and volatility of portfolio securities and currency holdings.
8. LINE OF CREDIT
The Fund participates with certain other Federated Funds, on a several basis, in an up to $500,000,000 unsecured, 364-day, committed, revolving line of credit (LOC) agreement. The LOC was made available to finance temporarily the repurchase or redemption of shares of the Fund, failed trades, payment of dividends, settlement of trades and for other short-term, temporary or emergency general business purposes. The Fund cannot borrow under the LOC if an inter-fund loan is outstanding. The Fund's ability to borrow under the LOC also is subject to the limitations of the Act and various conditions precedent that must be satisfied before the Fund can borrow. Loans under the LOC are charged interest at a fluctuating rate per annum equal to the highest, on any day, of (a) (i) the federal funds effective rate, (ii) the one month London Interbank Offer Rate (LIBOR), and (iii) 0.0%, plus (b) a margin. The LOC also requires the Fund to pay, quarterly in arrears and at maturity, its pro rata share of a commitment fee based on the amount of the lenders' commitment that has not been utilized. As of November 30, 2016, the Fund had no outstanding loans. During the year ended November 30, 2016, the Fund did not utilize the LOC.
9. INTERFUND LENDING
Pursuant to an Exemptive Order issued by the Securities and Exchange Commission (SEC), the Fund, along with other funds advised by subsidiaries of Federated Investors, Inc., may participate in an interfund lending program. This program provides an alternative credit facility allowing the Fund to borrow from other participating affiliated funds. As of November 30, 2016, there were no outstanding loans. During the year ended November 30, 2016, the program was not utilized.
10. REGULATORY UPDATES
On October 13, 2016, the SEC amended existing rules intended to modernize reporting and disclosure of information. These amendments relate to Regulation S-X which sets forth the form and content of financial statements. At this time, management is evaluating the implications of adopting these amendments and their impact on the financial statements and accompanying notes.
Annual Shareholder Report
11. FEDERAL TAX INFORMATION (UNAUDITED)
For the fiscal year ended November 30, 2016, 100% of total income distributions made by the Fund are qualifying dividends which may be subject to a maximum tax rate of 15%, as provided for by the Jobs and Growth Tax Relief Act of 2003. Complete information is reported in conjunction with the reporting of your distributions on Form 1099-DIV.
Of the ordinary income distributions made by the Fund during the year ended November 30, 2016, 1.88% qualify for the dividend received deduction available to corporate shareholders.
To the extent the Fund meets the requirements of Section 853 of the Internal Revenue Code of 1986, as amended, the Fund will pass through to its shareholders credits for foreign taxes paid. For the fiscal year ended November 30, 2016, the Fund derived $5,408,762 of gross income from foreign sources and paid foreign taxes of $483,751.
Annual Shareholder Report
Report of Independent Registered Public Accounting Firm
TO THE BOARD OF TRUSTEES OF THE FEDERATED EQUITY FUNDS AND SHAREHOLDERS OF Federated Intercontinental fund:
We have audited the accompanying statement of assets and liabilities, including the portfolio of investments, of the Federated InterContinental Fund (the “Fund”), a portfolio of Federated Equity Funds, as of November 30, 2016, and the related statement of operations for the year then ended, the statements of changes in net assets for each of the years in the two-year period then ended, and the financial highlights for each of the years or periods in the five-year period then ended. These financial statements and financial highlights are the responsibility of the Fund's management. Our responsibility is to express an opinion on these financial statements and financial highlights based on our audits.
We conducted our audits in accordance with the standards of the Public Company Accounting Oversight Board (United States). Those standards require that we plan and perform the audit to obtain reasonable assurance about whether the financial statements and financial highlights are free of material misstatement. An audit includes examining, on a test basis, evidence supporting the amounts and disclosures in the financial statements. Our procedures included confirmation of securities owned as of November 30, 2016, by correspondence with the custodian, transfer agent and brokers or by other appropriate auditing procedures. An audit also includes assessing the accounting principles used and significant estimates made by management, as well as evaluating the overall financial statement presentation. We believe that our audits provide a reasonable basis for our opinion.
In our opinion, the financial statements and financial highlights referred to above present fairly, in all material respects, the financial position of the Federated InterContinental Fund as of November 30, 2016, and the results of its operations for the year then ended, the changes in its net assets for each of the years in the two-year period then ended, and the financial highlights for each of the years or periods in the five-year period then ended, in conformity with U.S. generally accepted accounting principles.
Boston, Massachusetts
January 25, 2017
Annual Shareholder Report
Shareholder Expense Example (unaudited)
As a shareholder of the Fund, you incur two types of costs: (1) transaction costs, including sales charges (“loads”) on purchase or redemption payments and (2) ongoing costs, including management fees and to the extent applicable, distribution (12b-1) fees and/or other service fees and other Fund expenses. This Example is intended to help you to understand your ongoing costs (in dollars) of investing in the Fund and to compare these costs with the ongoing costs of investing in other mutual funds. It is based on an investment of $1,000 invested at the beginning of the period and held for the entire period from June 1, 2016 to November 30, 2016.
ACTUAL EXPENSES
The first section of the table below provides information about actual account values and actual expenses. You may use the information in this section, together with the amount you invested, to estimate the expenses that you incurred over the period. Simply divide your account value by $1,000 (for example, an $8,600 account value divided by $1,000 = 8.6), then multiply the result by the number in the first section under the heading entitled “Expenses Paid During Period” to estimate the expenses attributable to your investment during this period.
HYPOTHETICAL EXAMPLE FOR COMPARISON PURPOSES
The second section of the table below provides information about hypothetical account values and hypothetical expenses based on the Fund's actual expense ratio and an assumed rate of return of 5% per year before expenses, which is not the Fund's actual return. Thus, you should not use the hypothetical account values and expenses to estimate the actual ending account balance or your expenses for the period. Rather, these figures are required to be provided to enable you to compare the ongoing costs of investing in the Fund with other funds. To do so, compare this 5% hypothetical example with the 5% hypothetical examples that appear in the shareholder reports of the other funds.
Annual Shareholder Report
Please note that the expenses shown in the table are meant to highlight your ongoing costs only and do not reflect any transaction costs, such as sales charges (loads) on purchase or redemption payments. Therefore, the second section of the table is useful in comparing ongoing costs only, and will not help you determine the relative total costs of owning different funds. In addition, if these transaction costs were included, your costs would have been higher.
| | Beginning
Account Value
6/1/2016 | Ending
Account Value
11/30/2016 | Expenses Paid
During Period1 |
| Actual: | | | |
| Class A Shares | $1,000 | $968.10 | $6.25 |
| Class B Shares | $1,000 | $964.20 | $10.12 |
| Class C Shares | $1,000 | $964.50 | $10.02 |
| Institutional Shares | $1,000 | $969.70 | $4.63 |
| Class R6 Shares | $1,000 | $969.80 | $4.53 |
Hypothetical (assuming a 5% return
before expenses): | | | |
| Class A Shares | $1,000 | $1,018.65 | $6.41 |
| Class B Shares | $1,000 | $1,014.70 | $10.38 |
| Class C Shares | $1,000 | $1,014.80 | $10.28 |
| Institutional Shares | $1,000 | $1,020.30 | $4.75 |
| Class R6 Shares | $1,000 | $1,020.40 | $4.65 |
| 1 | Expenses are equal to the Fund's annualized net expense ratios, multiplied by the average account value over the period, multiplied by 183/366 (to reflect the one-half-year period). The annualized net expense ratios are as follows: |
| | |
| Class A Shares | 1.27% |
| Class B Shares | 2.06% |
| Class C Shares | 2.04% |
| Institutional Shares | 0.94% |
| Class R6 Shares | 0.92% |
Annual Shareholder Report
Board of Trustees and Trust Officers
The Board of Trustees is responsible for managing the Trust business affairs and for exercising all the Trust powers except those reserved for the shareholders. The following tables give information about each Trustee and the senior officers of the Fund. Where required, the tables separately list Trustees who are “interested persons” of the Fund (i.e., “Interested” Trustees) and those who are not (i.e., “Independent” Trustees). Unless otherwise noted, the address of each person listed is Federated Investors Tower, 1001 Liberty Avenue, Pittsburgh, PA 15222. The address of all Independent Trustees listed is 4000 Ericsson Drive, Warrendale, PA 15086-7561; Attention: Mutual Fund Board. As of December 31, 2016, the Trust comprised 14 portfolio(s), and the Federated Fund Family consisted of 40 investment companies (comprising 124 portfolios). Unless otherwise noted, each Officer is elected annually. Unless otherwise noted, each Trustee oversees all portfolios in the Federated Fund Family and serves for an indefinite term. The Fund's Statement of Additional Information includes additional information about Trust Trustees and is available, without charge and upon request, by calling 1-800-341-7400.
Interested Trustees Background
Name
Birth Date
Positions Held with Trust
Date Service Began | Principal Occupation(s) for Past Five Years,
Other Directorships Held and Previous Position(s) |
J. Christopher Donahue*
Birth Date: April 11, 1949
President and Trustee
Indefinite Term
Began serving: September 1999 | Principal Occupations: Principal Executive Officer and President of certain of the Funds in the Federated Fund Family; Director or Trustee of the Funds in the Federated Fund Family; President, Chief Executive Officer and Director, Federated Investors, Inc.; Chairman and Trustee, Federated Investment Management Company; Trustee, Federated Investment Counseling; Chairman and Director, Federated Global Investment Management Corp.; Chairman, Federated Equity Management Company of Pennsylvania and Passport Research, Ltd. (investment advisory subsidiary of Federated); Trustee, Federated Shareholder Services Company; Director, Federated Services Company.
Previous Positions: President, Federated Investment Counseling; President and Chief Executive Officer, Federated Investment Management Company, Federated Global Investment Management Corp. and Passport Research, Ltd. |
Annual Shareholder Report
Name
Birth Date
Positions Held with Trust
Date Service Began | Principal Occupation(s) for Past Five Years,
Other Directorships Held and Previous Position(s) |
John B. Fisher*
Birth Date: May 16, 1956
Trustee
Indefinite Term
Began serving: May 2016 | Principal Occupations: Principal Executive Officer and President of certain of the Funds in the Federated Fund Family; Director or Trustee of certain of the Funds in the Federated Fund Family; Vice President, Federated Investors, Inc.; President, Director/Trustee and CEO, Federated Advisory Services Company, Federated Equity Management Company of Pennsylvania, Federated Global Investment Management Corp., Federated Investment Counseling, Federated Investment Management Company; President and CEO of Passport Research, Ltd.; President of some of the Funds in the Federated Fund Complex and Director, Federated Investors Trust Company.
Previous Positions: President and Director of the Institutional Sales Division of Federated Securities Corp.; President and Director of Federated Investment Counseling; Director, Edgewood Securities Corp.; Director, Federated Services Company; Director, Federated Investors, Inc.; Chairman and Director, Southpointe Distribution Services, Inc. and President, Technology, Federated Services Company. |
| * | Reasons for “interested” status: J. Christopher Donahue and John B. Fisher are interested due to their beneficial ownership of shares of Federated Investors, Inc. and due to positions they hold with Federated and its subsidiaries. J. Christopher Donahue is the son of John F. Donahue, Chairman Emeritus of the Federated Funds. |
INDEPENDENT Trustees Background
Name
Birth Date
Positions Held with Trust
Date Service Began | Principal Occupation(s) for Past Five Years,
Other Directorships Held, Previous Position(s) and Qualifications |
John T. Collins
Birth Date: January 24, 1947
Trustee
Indefinite Term
Began serving: October 2013 | Principal Occupations: Director or Trustee of the Federated Fund Family; formerly, Chairman and CEO, The Collins Group, Inc. (a private equity firm) (Retired).
Other Directorships Held: Director, Current Chair of the Compensation Committee, KLX Corp.
Qualifications: Mr. Collins has served in several business and financial management roles and directorship positions throughout his career. Mr. Collins previously served as Chairman and CEO, The Collins Group, Inc. (a private equity firm). Mr. Collins serves as Chairman Emeriti, Bentley University. Mr. Collins previously served as Director and Audit Committee Member, Bank of America Corp.; Director, FleetBoston Financial Corp.; and Director, Beth Israel Deaconess Medical Center (Harvard University Affiliate Hospital). |
Annual Shareholder Report
Name
Birth Date
Positions Held with Trust
Date Service Began | Principal Occupation(s) for Past Five Years,
Other Directorships Held, Previous Position(s) and Qualifications |
G. Thomas Hough
Birth Date: February 28, 1955
Trustee
Indefinite Term
Began serving: August 2015 | Principal Occupations: Director or Trustee of the Federated Fund Family; formerly, Vice Chair, Ernst & Young LLP (public accounting firm) (Retired).
Other Directorships Held: Director, Chair of the Audit Committee, Governance Committee, Publix Super Markets, Inc.; Director, Member of the Audit Committee and Technology Committee of Equifax, Inc.
Qualifications: Mr. Hough has served in accounting, business management and directorship positions throughout his career. Mr. Hough most recently held the position of Americas Vice Chair of Assurance with Ernst & Young LLP (public accounting firm). Mr. Hough is an Executive Committee member of the United States Golf Association, he serves on the President's Cabinet and Business School Board of Visitors for the University of Alabama and is on the Business School Board of Visitors for Wake Forest University. |
Maureen Lally-Green
Birth Date: July 5, 1949
Trustee
Indefinite Term
Began serving: August 2009 | Principal Occupations: Director or Trustee of the Federated Fund Family; Interim Dean of the Duquesne University School of Law; Adjunct Professor of Law, Duquesne University School of Law; formerly, Associate General Secretary and Director, Office of Church Relations, Diocese of Pittsburgh.
Other Directorships Held: Director, CONSOL Energy Inc.
Qualifications: Judge Lally-Green has served in various legal and business roles and directorship positions throughout her career. Judge Lally-Green previously served as: Associate General Secretary, Diocese of Pittsburgh; a member of the Superior Court of Pennsylvania; and as a Professor of Law, Duquesne University School of Law. Judge Lally-Green also currently holds the positions on either a public or not for profit Board of Directors as follows: Director and Chair, UPMC Mercy Hospital; Regent, St. Vincent Seminary; Director and Vice Chair, Our Campaign for the Church Alive!, Inc.; Director, Saint Vincent College; Member, Pennsylvania State Board of Education (public); and Director and Chair, Cardinal Wuerl North Catholic High School, Inc. Judge Lally-Green has held the positions of: Director, Auberle; Director, Epilepsy Foundation of Western and Central Pennsylvania; Director, Ireland Institute of Pittsburgh; Director, Saint Thomas More Society; Director, Catholic High Schools of the Diocese of Pittsburgh, Inc.; and Director, Pennsylvania Bar Institute. |
Peter E. Madden
Birth Date: March 16, 1942
Trustee
Indefinite Term
Began serving: November 1991 | Principal Occupation: Director or Trustee, and Chair of the Board of Directors or Trustees, of the Federated Fund Family; Retired.
Other Directorships Held: None.
Qualifications: Mr. Madden has served in several business management, mutual fund services and directorship positions throughout his career. Mr. Madden previously served as President, Chief Operating Officer and Director, State Street Bank and Trust Company (custodian bank) and State Street Corporation (financial services). He was Director, VISA USA and VISA International and Chairman and Director, Massachusetts Bankers Association. Mr. Madden served as Director, Depository Trust Corporation and Director, The Boston Stock Exchange. Mr. Madden also served as a Representative to the Commonwealth of Massachusetts General Court. |
Annual Shareholder Report
Name
Birth Date
Positions Held with Trust
Date Service Began | Principal Occupation(s) for Past Five Years,
Other Directorships Held, Previous Position(s) and Qualifications |
Charles F. Mansfield, Jr.
Birth Date: April 10, 1945
Trustee
Indefinite Term
Began serving: January 1999 | Principal Occupations: Director or Trustee of the Federated Fund Family; Management Consultant.
Other Directorships Held: None.
Qualifications: Mr. Mansfield has served as a Marine Corps officer and in several banking, business management, educational roles and directorship positions throughout his long career. He remains active as a Management Consultant. |
Thomas M. O'Neill
Birth Date: June 14, 1951
Trustee
Indefinite Term
Began serving: August 2006 | Principal Occupations: Director or Trustee, Chair of the Audit Committee of the Federated Fund Family; Sole Proprietor, Navigator Management Company (investment and strategic consulting).
Other Directorships Held: None.
Qualifications: Mr. O'Neill has served in several business, mutual fund and financial management roles and directorship positions throughout his career. Mr. O'Neill serves as Director, Medicines for Humanity and Director, The Golisano Children's Museum of Naples, Florida. Mr. O'Neill previously served as Chief Executive Officer and President, Managing Director and Chief Investment Officer, Fleet Investment Advisors; President and Chief Executive Officer, Aeltus Investment Management, Inc.; General Partner, Hellman, Jordan Management Co., Boston, MA; Chief Investment Officer, The Putnam Companies, Boston, MA; Credit Analyst and Lending Officer, Fleet Bank; Director and Consultant, EZE Castle Software (investment order management software); and Director, Midway Pacific (lumber). |
P. Jerome Richey
Birth Date: February 23, 1949
Trustee
Indefinite Term
Began serving: October 2013 | Principal Occupations: Director or Trustee of the Federated Fund Family; Management Consultant; formerly, Senior Vice Chancellor and Chief Legal Officer, University of Pittsburgh and Executive Vice President and Chief Legal Officer, CONSOL Energy Inc.
Other Directorships Held: None.
Qualifications: Mr. Richey has served in several business and legal management roles and directorship positions throughout his career. Mr. Richey most recently held the positions of Senior Vice Chancellor and Chief Legal Officer, University of Pittsburgh. Mr. Richey previously served as Chairman of the Board, Epilepsy Foundation of Western Pennsylvania and Chairman of the Board, World Affairs Council of Pittsburgh. Mr. Richey previously served as Chief Legal Officer and Executive Vice President, CONSOL Energy Inc.; and Board Member, Ethics Counsel and Shareholder, Buchanan Ingersoll & Rooney PC (a law firm). |
Annual Shareholder Report
Name
Birth Date
Positions Held with Trust
Date Service Began | Principal Occupation(s) for Past Five Years,
Other Directorships Held, Previous Position(s) and Qualifications |
John S. Walsh
Birth Date: November 28, 1957
Trustee
Indefinite Term
Began serving: January 1999 | Principal Occupations: Director or Trustee of the Federated Fund Family; President and Director, Heat Wagon, Inc. (manufacturer of construction temporary heaters); President and Director, Manufacturers Products, Inc. (distributor of portable construction heaters); President, Portable Heater Parts, a division of Manufacturers Products, Inc.
Other Directorships Held: None.
Qualifications: Mr. Walsh has served in several business management roles and directorship positions throughout his career. Mr. Walsh previously served as Vice President, Walsh & Kelly, Inc. (paving contractors). |
OFFICERS
Name
Birth Date
Address
Positions Held with Trust
Date Service Began | Principal Occupation(s) for Past Five Years
and Previous Position(s) |
John W. McGonigle
Birth Date: October 26, 1938
EXECUTIVE VICE PRESIDENT AND SECRETARY
Officer since: April 1984 | Principal Occupations: Executive Vice President and Secretary of the Federated Fund Family; Vice Chairman, Executive Vice President, Secretary and Director, Federated Investors, Inc.
Previous Positions: Trustee, Federated Investment Management Company and Federated Investment Counseling; Director, Federated Global Investment Management Corp., Federated Services Company and Federated Securities Corp. |
Lori A. Hensler
Birth Date: January 6, 1967
TREASURER
Officer since: April 2013 | Principal Occupations: Principal Financial Officer and Treasurer of the Federated Fund Family; Senior Vice President, Federated Administrative Services; Financial and Operations Principal for Federated Securities Corp. and Edgewood Services, Inc.; and Assistant Treasurer, Federated Investors Trust Company. Ms. Hensler has received the Certified Public Accountant designation.
Previous Positions: Controller of Federated Investors, Inc.; Senior Vice President and Assistant Treasurer, Federated Investors Management Company; Treasurer, Federated Investors Trust Company; Assistant Treasurer, Federated Administrative Services, Federated Administrative Services, Inc., Federated Securities Corp., Edgewood Services, Inc., Federated Advisory Services Company, Federated Equity Management Company of Pennsylvania, Federated Global Investment Management Corp., Federated Investment Counseling, Federated Investment Management Company, Passport Research, Ltd., and Federated MDTA, LLC; Financial and Operations Principal for Federated Securities Corp., Edgewood Services, Inc. and Southpointe Distribution Services, Inc. |
Annual Shareholder Report
Name
Birth Date
Address
Positions Held with Trust
Date Service Began | Principal Occupation(s) for Past Five Years
and Previous Position(s) |
Peter J. Germain
Birth Date: September 3, 1959
CHIEF LEGAL OFFICER
Officer since: January 2005 | Principal Occupations: Mr. Germain is Chief Legal Officer of the Federated Fund Family. He is General Counsel and Vice President, Federated Investors, Inc.; President, Federated Administrative Services and Federated Administrative Services, Inc.; Vice President, Federated Securities Corp.; Secretary, Federated Private Asset Management, Inc.; and Secretary, Retirement Plan Service Company of America. Mr. Germain joined Federated in 1984 and is a member of the Pennsylvania Bar Association.
Previous Positions: Deputy General Counsel, Special Counsel, Managing Director of Mutual Fund Services, Federated Investors, Inc.; Senior Vice President, Federated Services Company; and Senior Corporate Counsel, Federated Investors, Inc. |
Richard B. Fisher
Birth Date: May 17, 1923
VICE PRESIDENT
Officer since: April 1987 | Principal Occupations: Vice Chairman or Vice President of some of the Funds in the Federated Fund Family; Vice Chairman, Federated Investors, Inc.; Chairman, Federated Securities Corp.
Previous Positions: President and Director or Trustee of some of the Funds in the Federated Fund Family; Executive Vice President, Federated Investors, Inc.; Director and Chief Executive Officer, Federated Securities Corp. |
Stephen Van Meter
Birth Date: June 5, 1975
CHIEF COMPLIANCE OFFICER AND SENIOR VICE PRESIDENT
Officer since: July 2015 | Principal Occupations: Senior Vice President and Chief Compliance Officer of the Federated Fund Family; Vice President and Chief Compliance Officer of Federated Investors, Inc. and Chief Compliance Officer of certain of its subsidiaries. Mr. Van Meter joined Federated in October 2011. He holds FINRA licenses under Series 3, 7, 24 and 66.
Previous Positions: Mr. Van Meter previously held the position of Compliance Operating Officer, Federated Investors, Inc. Prior to joining Federated, Mr. Van Meter served at the United States Securities and Exchange Commission in the positions of Senior Counsel, Office of Chief Counsel, Division of Investment Management and Senior Counsel, Division of Enforcement. |
Stephen F. Auth
Birth Date: September 13, 1956
101 Park Avenue
41st Floor
New York, NY 10178
CHIEF INVESTMENT OFFICER
Officer since: November 2002 | Principal Occupations: Stephen F. Auth is Chief Investment Officer of various Funds in the Federated Fund Family; Executive Vice President, Federated Investment Counseling, Federated Global Investment Management Corp. and Federated Equity Management Company of Pennsylvania.
Previous Positions: Executive Vice President, Federated Investment Management Company and Passport Research, Ltd. (investment advisory subsidiary of Federated); Senior Vice President, Global Portfolio Management Services Division; Senior Vice President, Federated Investment Management Company and Passport Research, Ltd.; Senior Managing Director and Portfolio Manager, Prudential Investments. |
Annual Shareholder Report
Evaluation and Approval of Advisory Contract–May 2016
Federated InterContinental Fund (the “Fund”)
Following a review and recommendation of approval by the Fund's independent trustees, the Fund's Board of Trustees (the “Board”) reviewed and unanimously approved at its May 2016 meetings the continuation of the Fund's investment advisory contract for an additional one-year term. The Board's decision regarding the contract reflects the exercise of its business judgment after consideration of all of the information received on whether to continue the existing arrangements.
The Board had previously appointed a Senior Officer, whose duties include specified responsibilities relating to the process by which advisory fees are to be charged to a Federated fund. The Senior Officer has the authority to retain consultants, experts, or staff as may be reasonably necessary to assist in the performance of his duties, reports directly to the Board, and may be terminated only with the approval of a majority of the independent members of the Board. The Senior Officer prepared and furnished to the Board an independent, written evaluation that covered topics discussed below (the “Senior Officer's Evaluation”). The Board considered the Senior Officer's Evaluation, along with other information, in deciding to approve the investment advisory contract.
The Board is also familiar with and considered judicial decisions concerning allegedly excessive investment advisory fees, which have indicated that the following factors may be relevant to an adviser's fiduciary duty with respect to its receipt of compensation from a fund: the nature and quality of the services provided by an adviser to a fund and its shareholders, including the performance and fees and expenses of the fund and of comparable funds; an adviser's cost of providing the services, including the profitability to an adviser of providing advisory services to a fund; the extent to which an adviser may realize “economies of scale” as a fund grows larger and, if such economies of scale exist, whether they have been shared with a fund and its shareholders or the family of funds; any “fall-out financial benefits” that accrue to an adviser because of its relationship with a fund (including research services received from brokers that execute fund trades and any fees paid to affiliates of an adviser for services rendered to a fund); comparative fee and expense structures, including a comparison of fees paid to an adviser with those paid by similar funds; and the extent of care, conscientiousness and independence with which board members perform their duties and their expertise, including whether they are fully informed about all facts the board deems relevant to its consideration of an adviser's services and fees. The Board noted that the Securities and Exchange Commission (“SEC”) disclosure requirements regarding the basis for the Board's approval of the Fund's investment advisory contract generally track the factors listed above. Consistent with these judicial decisions and SEC disclosure requirements, the Board also considered management fees charged to
Annual Shareholder Report
institutional and other clients of Federated Global Investment Management Corp. (the “Adviser”) for what might be viewed as like services. The Board was aware of these factors and was guided by them in its review of the Fund's investment advisory contract to the extent it considered them to be appropriate and relevant, as discussed further below.
The Board considered and weighed these circumstances in light of its substantial accumulated experience in governing the Fund and working with Federated Investors, Inc. and its affiliates (“Federated”) on matters relating to the Federated funds, and was assisted in its deliberations by independent legal counsel. Throughout the year, and in connection with its May meetings, the Board requested and received substantial and detailed information about the Fund and the Federated organization that was in addition to the extensive materials that comprise and accompany the Senior Officer's Evaluation. Federated provided much of this information at each regular meeting of the Board, and furnished additional substantial information in connection with the May meetings at which the Board's formal review of the investment advisory contract occurred. At the May meetings in addition to meeting in separate sessions of the independent trustees without management present, senior management of the Adviser also met with the independent trustees and their counsel to discuss the materials presented and any other matters thought relevant by the Adviser or the trustees. Between regularly scheduled meetings, the Board also received information on particular matters as the need arose. Thus, the Board's consideration of the investment advisory contract included review of the Senior Officer's Evaluation, accompanying data and additional information covering such matters as: the Adviser's investment philosophy, revenue, profitability, personnel and processes; investment and operating strategies; the Fund's short- and long-term performance (in absolute terms, both on a gross basis and net of expenses, as well as in relationship to its particular investment program and certain competitor or “peer group” funds and/or other benchmarks, as appropriate), and comments on the reasons for performance; the Fund's investment objectives; the Fund's expenses (including the advisory fee itself and the overall expense structure of the Fund, both in absolute terms and relative to similar and/or competing funds, with due regard for contractual or voluntary expense limitations); the use and allocation of brokerage commissions derived from trading the Fund's portfolio securities (if any); and the nature, quality and extent of the advisory and other services provided to the Fund by the Adviser and its affiliates. The Board also considered the preferences and expectations of Fund shareholders; the entrepreneurial risk assumed by the Adviser in sponsoring the Fund; the continuing state of competition in the mutual fund industry and market practices; the range of comparable fees for similar funds in the mutual fund industry; the Fund's relationship to the Federated funds which include a comprehensive array of funds with different investment objectives, policies and strategies which are generally available for exchange without the incurrence of additional sales charges; compliance and
Annual Shareholder Report
audit reports concerning the Federated funds and the Federated companies that service them (including communications from regulatory agencies), as well as Federated's responses to any issues raised therein; and relevant developments in the mutual fund industry and how the Federated funds and/or Federated are responding to them. The Board's evaluation process is evolutionary. The criteria considered and the emphasis placed on relevant criteria change in recognition of changing circumstances in the mutual fund marketplace.
While mindful that courts have cautioned against giving such comparisons too much weight, the Board has found the use of comparisons of the Fund's fees and expenses to other mutual funds with comparable investment programs to be relevant to its deliberations. In this regard, the Board was presented with, and considered, information regarding the contractual advisory fee rates, net advisory fee rates, total expense ratios and each element of the Fund's total expense ratio (i.e., gross and net advisory fees, custody fees, portfolio accounting fees and transfer agency fees) relative to the Fund's peers. The Board focused on comparisons with other similar mutual funds more heavily than non-mutual fund products or services because it is believed that they are more relevant. For example, other mutual funds are the products most like the Fund, they are readily available to Fund shareholders as alternative investment vehicles, and they are the type of investment vehicle in fact chosen and maintained by the Fund's investors. The range of their fees and expenses therefore appears to be a relevant indicator of what consumers have found to be reasonable in the precise marketplace in which the Fund competes.
The Board reviewed the contractual advisory fee rate, net advisory fee rate where partially waived and other expenses of the Fund and noted the position of the Fund's fee rates relative to its peers. In this regard, the Board noted that the contractual advisory fee rate was above the median of the relevant peer group, but the Board noted the applicable waivers and reimbursements and that the overall expense structure of the Fund remained competitive in the context of other factors considered by the Board.
By contrast, the Senior Officer has reviewed Federated's fees for providing advisory services to products outside the Federated funds (e.g., institutional and separate accounts and sub-adviser services). He concluded that mutual funds and institutional accounts are inherently different products. Those differences include, but are not limited to, different types of targeted investors; being subject to different laws and regulations; different legal structures; different average account sizes and portfolio management techniques made necessary by different cash flows and different associated costs; and the time spent by portfolio managers and their teams, funds financial services, legal, compliance and risk management in reviewing securities pricing, addressing different administrative responsibilities, addressing different degrees of risk associated with management and a variety of different costs. The Senior Officer did not consider the fees for providing advisory services to these outside products to be determinative in judging the appropriateness of mutual fund advisory fees.
Annual Shareholder Report
The Senior Officer noted that the services, administrative responsibilities and risks associated with such relationships are quite different than serving as a primary adviser to a fund.
Following such evaluation, the Board concluded, within the context of its full deliberations, that the expenses of the Fund are reasonable and supported renewal of the investment advisory contract with respect to the Fund.
The Board considered the nature, extent and quality of the services provided to the Fund by the Adviser and the resources of the Adviser and its affiliates dedicated to the Fund. In this regard, the Board evaluated, among other things, the Adviser's personnel, experience, track record, overall reputation and willingness to invest in personnel and infrastructure that benefit the Fund. In addition, the Board reviewed the qualifications, backgrounds and responsibilities of the portfolio management team primarily responsible for the day-to-day management of the Fund. The Board noted the compliance programs of and the compliance-related resources provided to the Fund by the Adviser. The Fund's ability to deliver competitive performance when compared to its peer group was also deemed to be relevant by the Board as a useful indicator of how the Adviser is executing the Fund's investment program, which in turn was one of the Board's considerations in reaching a conclusion that the nature, extent, and quality of the Adviser's investment management services were such as to warrant continuation of the investment advisory contract.
In evaluating the Fund's investment performance, the Board considered performance results in light of the Fund's investment objective, strategies and risks, as disclosed in the Fund's prospectus. The Board particularly considered detailed investment reports on the Fund's performance provided to the Board throughout the year and in connection with the May meetings. The Senior Officer also reviewed information compiled by Federated, using data supplied by independent fund ranking organizations, regarding the performance of, and fees charged by, other mutual funds, noting his view that comparisons to fund peer groups may be helpful, though not conclusive, in judging the reasonableness of the proposed fees. The Board considered, in evaluating such comparisons, that in some cases individual funds may exhibit significant and unique differences in their objectives and management techniques when compared to other funds within an industry peer group.
The Fund's performance fell below the median of the relevant peer group for the one-year, three-year and five-year periods covered by the Senior Officer's Evaluation. The Board discussed the Fund's performance with the Adviser and recognized the efforts being taken by the Adviser in the context of the other factors considered relevant by the Board.
Following such evaluation, the Board concluded, within the context of its full deliberations, that the performance of the Fund supported renewal of the investment advisory contract with respect to the Fund.
Annual Shareholder Report
The Board also received financial information about Federated, including information regarding the compensation and ancillary (or “fall-out”) benefits Federated derived from its relationships with the Federated funds. This information covered not only the fees under the investment advisory contracts, but also fees received by Federated's subsidiaries for providing other services to the Federated funds under separate contracts (e.g., for serving as the Federated funds' administrator). The information also detailed any indirect benefit Federated may derive from its receipt of research services from brokers who execute Federated fund trades. In addition, the Board considered the fact that, in order for a fund to be competitive in the marketplace, Federated and its affiliates frequently waived fees and/or reimbursed expenses and have disclosed to fund investors and/or indicated to the Board their intention to do so in the future, where appropriate. Moreover, the Board receives regular reporting as to the institution, adjustment or elimination of these voluntary waivers. The Board considered Federated's previous reductions in contractual management fees to certain funds in response to the Senior Officer's recommendations.
Federated furnished information, requested by the Senior Officer, that reported revenues on a fund-by-fund basis and made estimates of the allocation of expenses on a fund-by-fund basis, using allocation methodologies specified by the Senior Officer. The Senior Officer noted that, while these cost allocation reports apply consistent allocation processes, the inherent difficulties in allocating costs continues to cause the Senior Officer to question the precision of the process and to conclude that such reports may be unreliable, since a single change in an allocation estimate may dramatically alter the resulting estimate of cost and/or profitability of a fund and may produce unintended consequences. The allocation information, including the Senior Officer's view that fund-by-fund estimations may be unreliable, was considered in the analysis by the Board.
The Board and the Senior Officer also reviewed information compiled by Federated comparing profitability information for Federated to other publicly held fund management companies. In this regard, the Senior Officer concluded that Federated's profit margins did not appear to be excessive. The Senior Officer also noted that Federated appeared financially sound, with the resources to fulfill its obligations under its contracts with the Fund.
The Senior Officer's Evaluation also discussed the notion of possible realization of “economies of scale” as a fund grows larger. The Board considered in this regard that the Adviser has made significant and long-term investments in areas that support all of the Federated funds, such as personnel and processes for the portfolio management, shareholder services, compliance, internal audit, and risk management functions, as well as systems technology (including technology relating to cybersecurity), and that the benefits of these efforts (as well as any economies of scale, should they exist) were likely to be enjoyed by the fund family as a whole. The Board noted that the Adviser's investments in these areas are extensive. In addition, the Board considered that Federated and its affiliates have frequently waived fees and/or reimbursed expenses and that this has
Annual Shareholder Report
allowed fund shareholders to share potential economies of scale from a fund's inception. Federated, as it does throughout the year, and again in connection with the Board's review, furnished information relative to revenue sharing or adviser paid fees. Federated and the Senior Officer noted that this information should be viewed to determine if there was an incentive to either not apply breakpoints or to apply breakpoints at higher levels and should not be viewed to determine the appropriateness of advisory fees, because it would represent marketing and distribution expenses. Finally, the Board also noted the absence of any applicable regulatory or industry guidelines on this subject, which (as discussed in the Senior Officer's Evaluation) is compounded by the lack of any common industry practice or general pattern with respect to structuring fund advisory fees with “breakpoints” that serve to reduce the fee as a fund attains a certain size.
The Senior Officer noted that, subject to the comments and recommendations made within the Senior Officer's Evaluation, his observations and the information accompanying the Senior Officer's Evaluation supported a finding by the Board that the management fee for the fund was reasonable. Under these circumstances, no changes were recommended to, and no objection was raised to, the continuation of the Fund's investment advisory contract.
In its decision to continue an existing investment advisory contract, the Board was mindful of the potential disruptions of the Fund's operations and various risks, uncertainties and other effects that could occur as a result of a decision to terminate or not renew an investment advisory contract. In particular, the Board recognized that many shareholders have invested in the Fund on the strength of the Adviser's industry standing and reputation and with the expectation that the Adviser will have a continuing role in providing advisory services to the Fund. Thus, the Board's approval of the investment advisory contract reflected the fact that it is the shareholders who have effectively selected the Adviser by virtue of having invested in the Fund. The Board concluded that, in light of the factors discussed above, including the nature, quality and scope of the services provided to the Fund by the Adviser and its affiliates, continuation of the investment advisory contract was appropriate.
The Board based its decision to approve the investment advisory contract on the totality of the circumstances and relevant factors and with a view to past and future long-term considerations. Not all of the factors and considerations identified above were necessarily relevant to the Fund, nor did the Board consider any one of them to be determinative. With respect to the factors that were relevant, the Board's decision to approve the continuation of the contract reflects its determination that Federated's performance and actions provided a satisfactory basis to support the decision to continue the existing arrangement.
Annual Shareholder Report
Voting Proxies on Fund Portfolio Securities
A description of the policies and procedures that the Fund uses to determine how to vote proxies, if any, relating to securities held in the Fund's portfolio is available, without charge and upon request, by calling 1-800-341-7400. A report on “Form N-PX” of how the Fund voted any such proxies during the most recent 12-month period ended June 30 is available via the Proxy Voting Record (Form N-PX) link associated with the Fund and share class name at www.FederatedInvestors.com/FundInformation. Form N-PX filings are also available at the SEC's website at www.sec.gov.
Quarterly Portfolio Schedule
The Fund files with the SEC a complete schedule of its portfolio holdings, as of the close of the first and third quarters of its fiscal year, on “Form N-Q.” These filings are available on the SEC's website at www.sec.gov and may be reviewed and copied at the SEC's Public Reference Room in Washington, DC. (Call 1-800-SEC-0330 for information on the operation of the Public Reference Room.) You may also access this information via the link to the Fund and share class name at www.FederatedInvestors.com/FundInformation.
Annual Shareholder Report
Mutual funds are not bank deposits or obligations, are not guaranteed by any bank and are not insured or guaranteed by the U.S. government, the Federal Deposit Insurance Corporation, the Federal Reserve Board or any other government agency. Investment in mutual funds involves investment risk, including the possible loss of principal.
This Report is authorized for distribution to prospective investors only when preceded or accompanied by the Fund's Prospectus, which contains facts concerning its objective and policies, management fees, expenses and other information.
Federated InterContinental Fund
Federated Investors Funds
4000 Ericsson Drive
Warrendale, PA 15086-7561
Contact us at FederatedInvestors.com
or call 1-800-341-7400.
Federated Securities Corp., Distributor
CUSIP 314172511
CUSIP 314172495
CUSIP 314172487
CUSIP 314172461
CUSIP 314172164
37865 (1/17)
Federated is a registered trademark of Federated Investors, Inc.
2017 ©Federated Investors, Inc.
Annual Shareholder Report
November 30, 2016
| Share Class | Ticker |
| A | IVFAX |
| C | IVFCX |
| Institutional | IVFIX |
Federated International Strategic Value Dividend Fund
Fund Established 2008
A Portfolio of Federated Equity Funds
Dear Valued Shareholder,
I am pleased to present the Annual Shareholder Report for your fund covering the period from December 1, 2015 through November 30, 2016. This report includes Management's Discussion of Fund Performance, a complete listing of your fund's holdings, performance information and financial statements along with other important fund information.
In addition, our website, FederatedInvestors.com, offers easy access to Federated resources that include timely fund updates, economic and market insights from our investment strategists, and financial planning tools. We invite you to register to take full advantage of its capabilities.
Thank you for investing with Federated. I hope you find this information useful and look forward to keeping you informed.
Sincerely,
J. Christopher Donahue, President
Not FDIC Insured • May Lose Value • No Bank Guarantee
CONTENTS
| 1 |
| 9 |
| 11 |
| 15 |
| 18 |
| 20 |
| 21 |
| 22 |
| 34 |
| 35 |
| 37 |
| 43 |
| 49 |
| 49 |
Management's Discussion of Fund Performance (unaudited)
The total return of Federated International Strategic Value Dividend Fund (the “Fund”), based on net asset value for the 12-month reporting period ended November 30, 2016, was -4.66% for the Class A Shares, -5.27% for the Class C Shares and -4.17% for the Institutional Shares. The -4.17% total return of the Institutional Shares consisted of 2.99% in dividend income and -7.16% in depreciation of the net asset value of the shares. The total return of the MSCI World ex-US High Dividend Yield Index (MWXUSHDYI),1 a broad-based securities market index that represents the dividend-paying universe outside of the U.S., was -1.27% for the reporting period. The MSCI World ex-US Index (MWXUSI),2 which is representative of the broader stock market outside of the U.S.,3 had a total return of -2.29% for the same period. The Fund's total return for the most recently completed fiscal year reflected actual cash flows, transaction costs and other expenses which are not reflected in the total return of the MWXUSHDYI or the MWXUSI.
The Fund's investment strategy focused on: (a) dividend-based performance; (b) country and geographic allocation; and (c) sector allocation. These were the most significant factors affecting the Fund's performance relative to the MWXUSHDYI.
The following discussion will focus on the performance of the Fund's Institutional Shares.
MARKET OVERVIEW
The reporting period began on a cautionary note, with global equity markets digesting a mounting set of challenges. An outbreak of terrorism in Paris and the Middle East cooled a budding risk-on trade that had begun to form in October and November 2015. Oil prices continued to tumble toward levels below the commodity's previous bottom in 2009, weighing heavily on shares within the Energy sector. Slowing emerging-market (EM) economies, especially in China, and a struggling U.S. manufacturing sector weighed on the global economic outlook and presented new headwinds to earnings. Layered over these worries was a global growth environment that, since the Great Recession, was fed by highly stimulative monetary policies that encouraged the buildup of low-cost debt, leaving little room for additional accommodation if growth were to slow further. In fact, several of the world's major economies, especially in Europe and Japan, continued their experiment with negative interest rates in an effort to spur growth. In the U.S., by contrast, a period of exceptionally accommodative monetary policy was winding down, with the U.S. Federal Reserve (the “Fed”), initiating its first federal funds target rate hike in more than nine years. But while the Fed signaled that more rate hikes may follow in the near term, concerns of a global economic slowdown and a potential collapse in the commodity complex left investors skeptical that the Fed would continue to forge a path back toward a “normal” rate environment.
Annual Shareholder Report
As the reporting period progressed, a stronger dollar, slower EM growth and cratering Brent crude oil prices that touched bottom at $27.88 per barrel had brought the word “recession” back into the Wall Street lexicon. But beginning in mid-February, risk assets began to rally, oil prices plotted a path to recovery and Fed Chairperson Janet Yellen issued some extremely dovish comments that helped calm nervous investors. Still, amid the choppy market recovery that continued through the first half of calendar year 2016, investors maintained their defensive position, favoring high-quality bonds and dividend-paying companies in non-cyclical sectors and mature markets.
Adding to the market's uncertainty amid the tepid recovery during the first half of calendar year 2016 was a U.S. presidential election that featured Donald Trump–a virtual political unknown–securing the Republican Party's nomination for the highest office in the world's largest economy. But perhaps an even larger overhang on global markets in the first half of 2016 was the growing worry of the “Brexit” vote, or the U.K.'s June 23 referendum that would determine whether or not the country would abandon its European Union (EU) membership. The ensuing “out” vote startled capital markets, ending the first half of calendar year 2016 with a sharp selloff in Sterling, a spike in volatility and a flight to safety. But after the initial shock of Brexit, markets turned positive, as panicked trading gave way to more reasoned analysis, dismissing much of the immediate worry over the U.K.'s eventual exodus from the EU–a protracted process that is expected to take years to fully culminate.
The removal of the immediate Brexit overhang during the second half of calendar year 2016 marked a shift back into riskier assets, with bond yields rising and equities recovering again off of their lows. The next several months through the end of the reporting period brought a relief rally for cyclical sectors–especially in the commodity complex, as well as in the Information Technology, Financials and Consumer Discretionary sectors. Meanwhile defensive, dividend-paying stocks gave back some of the gains they had accrued earlier in the year. This risk-on trade accelerated into the end of the fiscal year, spurred on by the surprise election of Donald Trump as the 45th president of the U.S., and by the news that Republicans would retain control of both the House and Senate for at least the next two years. Finally, at the end of the reporting period, new optimism had emerged around the prospects for regulatory relief and fiscal stimulus from Washington, driving equity indexes to new highs and leaving investors to ponder whether GDP growth and fundamentals would follow in 2017.
DIVIDEND-BASED4 PERFORMANCE
The Fund ended the reporting period with a 30-day SEC yield of 3.9%5 and a gross weighted-average dividend yield of 4.8%. The Fund's gross yield was greater than the yield of the 10-Year U.S. Treasury Note (2.4%), the yield of the broad-market MWXUSI (3.2%) and was modestly higher than the yield provided by the MWXUSHDYI (4.7%). In addition to its higher-than-market
Annual Shareholder Report
yield, the Fund seeks to own high-quality companies with the ability and willingness to raise their dividends over time. During the reporting period, 28 companies held in the Fund raised their dividend, accounting for 32 separate increases and one reduction. Some of the most generous increases in the reporting period came from holdings such as Admiral Group (14.4%), BT Group (12.0%), Emera (10.0%), Imperial Brands (10.1%), Telus (9.1%) and TransCanada Corp (8.7%). Health Care holding GlaxoSmithKline also paid a special dividend in 2016, in the amount of 20 pence per share. Additionally, Swedbank, a Swedish holding in the Financials sector, was the only Fund holding to allow its dividend distribution to decline in 2016. Consistent with Swedbank's policy to adhere to a 75% dividend payout ratio, the company's distribution is expected to rise and fall in line with the company's annual earnings. In 2016, Swedbank earnings declined by 5.7% due to lower trading gains and a one-time tax charge, resulting in a dividend payment that was 5.7% lower than in 2015.
While global markets swung sharply in 2016, reacting to bottoming oil prices, improving risk tolerances, and the victory of several populist political movements, the Fund remained steadfastly focused on its goals of providing a higher-than-market yield and long-term dividend growth. Irrespective of short-term market trends, the Fund pursued these income-based goals by taking a long-term approach to its investments and by owning primarily high-yielding, mature companies with defensive cash flow profiles. Accordingly, the Fund tends to exhibit a lower level of volatility than the broad market, with a Beta of 0.82 at the end of the reporting period.6 In spite of the Fund's overarching defensive properties, the Fund declined during the reporting period, producing a total return of -4.17%. Foreign currency depreciation represented a substantial performance headwind throughout the period, most notably from the British pound which declined 16.94% against the U.S. dollar. With 32.49% of the portfolio invested in U.K.-domiciled holdings at the end of the reporting period, fluctuations in the British pound have the potential for significant impact on both the performance of the Fund and the growth rate of its dividends.
COUNTRY AND GEOGRAPHIC ALLOCATION
Consistent with its dividend-focused strategy, the Fund's holdings remained concentrated in mature markets that have consistently offered a broad selection of high-dividend paying stocks–especially in the U.K., Switzerland, Canada and Australia. The Fund's investments in these dividend-rich countries delivered mixed results in 2016, contributing weighted-average total returns of -10.28%, -9.94%, 9.34% and 6.83%, respectively, over the reporting period. Outside of the “core” markets, the Fund's modest investments in Mexico (representing 2.83% of portfolio assets) contributed the period's weakest country returns, with a total return of -23.42% for the reporting period. A 19.43% decline in the value of
Annual Shareholder Report
the Mexican peso accounted for the vast majority of negative returns observed in the Fund's holdings in Mexico. The Fund's investments in Spain and Luxembourg (4.11% of Fund assets, combined) also experienced sharp declines, with weighted average total returns of -20.16% and -20.10%, respectively.
In addition to the recovery observed in the portfolio's core Canadian and Australian holdings as noted above (fueled in part by an improvement in commodity prices), attractive performance was contributed by several other countries, including Brazil, Sweden and the U.S., where Fund holdings delivered weighted average total returns of 17.00%, 10.05% and 5.43%, respectively.
SECTOR ALLOCATION
Sector returns were mixed across the GICS sectors throughout the reporting period, with investors' defensive posture giving way to an appetite for higher-beta cyclical stocks that only accelerated through the second half of 2016. Although investor preferences for certain sectors and risk profiles will vary from year to year, the Fund remained focused on the key long-term drivers of total return–dividend yield and dividend growth. In order to pursue these income-based objectives, the Fund invested in high quality companies with attractive, sustainable dividends and stable cash flow profiles–conditions which are most commonly met in sectors that exhibit low levels of cyclicality. Given its persistent preference for stable income generation, the portfolio's largest sector concentrations at the end of the reporting period were in Telecom Services and Consumer Staples, representing 22.2% and 16.6% of Fund assets, respectively.
During the reporting period, the international equity market's performance was led by some of its most cyclical sectors, with Materials, Energy and Information Technology representing the top contributors in the MWXUSI. Materials and Energy holdings in the broad market index generated weighted average returns of 19.35% and 12.14%, respectively, owing to the recovery in commodity prices observed throughout the measurement period. Industrials holdings in the MWXUSI also contributed positive performance, with a weighted average total return of 3.14% for the reporting period. Meanwhile broad market performance was led to the downside by some of its dividend-stronghold sectors, especially Health Care, Telecom and Utilities, which posted weighted average total returns of -15.06%, -11.78% and -7.22%,respectively.
Consistent with its income-oriented goals, the Fund maintained sizeable positions in those dividend-friendly segments of the market–Consumer Staples, Health Care and Utilities. Notable share weakness was observed in these sectors, particularly in the second half of the reporting period as investors responded to modestly increasing interest rates and market participants exhibited a growing appetite for riskier equity assets. The Fund's Consumer Staples holdings generated a weighted average return of -6.77% in the reporting period, with Mexican holdings Wal-Mart de Mexico and Kimberly-Clark de Mexico reflecting weakness in the peso, returning -27.23% and -22.43% respectively. The Fund's Health Care holdings also experienced declines, hindered in part by
Annual Shareholder Report
the U.S. presidential election, which cast a cloud on the outlook for drug price increases. Laggards from the Health Care sector included Fund holdings AstraZeneca, Novartis and Roche, which returned -19.76%, -16.81% and -14.69%, respectively, in the reporting period. In addition, the portfolio's holdings in the Utilities sector contributed a weighted average return of -7.09% for the period, led to the downside by Spanish power generator Red Electra, and U.K.-based companies United Utilities and National Grid. These holdings returned -20.16%, -16.38% and -14.31%, respectively.
Meanwhile, the Fund's Energy holdings (6.86% of period-end assets) contributed strong results in the period, delivering a weighted average total return of 8.27%, responding to a recovery in oil and gas prices. Top performing holdings from the Energy sector included Canadian pipeline company TransCanada, and U.K.-based integrated energy company BP. These holdings delivered returns of 46.87% and 7.19%, respectively, in the period. The Fund's strongest sector performance in 2016 was generated by its modest investments in traditionally cyclical sectors, including Industrials and Materials, which contributed weighted-average total returns of 15.59% and 14.31% each. While many companies in the Industrials and Materials sectors lack the stability of cash flows required to sustain dividends over a full business cycle, at period end the Fund owned one holding in each sector that represents extraordinary dividend visibility versus its sector peers. Within the Industrials sector, U.K.-based defense contractor BAE Systems was added to the Fund in 2016. This holding delivered a total return of 15.59% in the holding period, and it has raised its dividend every year for more than 20 years consecutively. In the Materials sector, Australian consumer goods packaging company Amcor was added to the portfolio in the reporting period, contributing a return of 14.31%. This company has also raised its dividend in each of the last twenty years.Over the past year, the Fund faced a significant performance headwind as large cap stocks dramatically underperformed smaller companies. When quintiling the MWXUSI, in fiscal year 2016, the smallest market cap quintile outperformed the highest cap quintile by 19.54%. Given the Fund's focus on large, mature companies, this preference for small cap securities represented a short-term drag on Fund performance.
Over the reporting period, global markets were significantly affected by geopolitical events, central bank policy decisions, flagging energy prices and uncertain growth prospects for many of the world's major economies. In spite of the ups and downs experienced by the market during the reporting period, the Fund remained positioned to effectively pursue its goals of high current income, long-term dividend growth and lower downside risk in a variety of market environments.
Annual Shareholder Report
| 1 | Please see the footnotes to the line graphs below for definitions of, and further information about, the MWXUSHDYI. |
| 2 | Please see the footnotes to the line graphs below for definitions of, and further information about, the MWXUSI. |
| 3 | International investing involves special risks including currency risk, increased volatility of foreign securities, political risks and differences in auditing and other financial standards. |
| 4 | There are no guarantees that dividend-paying stocks will continue to pay dividends. In addition, dividend-paying stocks may not experience the same capital appreciation potential as non-dividend-paying stocks. |
| 5 | Represents the 30-day SEC yield for the Fund's Institutional Shares. In the absence of temporary expense waivers or reimbursements the 30-day SEC yield would have been 3.75% for the Fund's Institutional shares. The dividend yield represents the average yield of the underlying securities within the portfolio. |
| 6 | Wilshire beta versus the MWXUSI calculated using monthly return. Beta measures a Fund's volatility relative to the market. A beta greater than 1.00 suggests the Fund has historically been more volatile than the market as measured by the fund's benchmark. A beta less than 1.00 suggests the Fund has historically had less volatility relative to the market. |
Annual Shareholder Report
FUND PERFORMANCE AND GROWTH OF A $10,000 INVESTMENT
The graph below illustrates the hypothetical investment of $10,0001 in the Federated International Strategic Value Dividend Fund from June 4, 2008 (start of performance) to November 30, 2016, compared to the MSCI World ex-US Index (MWXUSI)2 and the MSCI World ex-US High Dividend Yield Index (MWXUSHDYI).3 The Average Annual Total Return table below shows returns for each class averaged over the stated periods.
Growth of a $10,000 Investment
Growth of $10,000 as of November 30, 2016
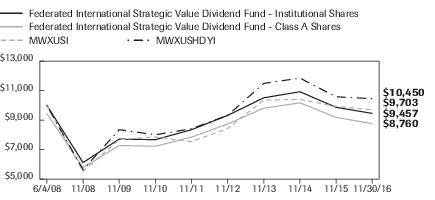
| Federated International Strategic Value Dividend Fund - | Institutional Shares | Class A Shares | MWXUSI | MWXUSHDYI |
| F | F | I | I |
| 6/4/2008 | 10,000 | 9,450 | 10,000 | 10,000 |
| 11/30/2008 | 6,123 | 5,785 | 5,544 | 5,638 |
| 11/30/2009 | 7,713 | 7,281 | 7,679 | 8,351 |
| 11/30/2010 | 7,677 | 7,232 | 7,866 | 8,008 |
| 11/30/2011 | 8,349 | 7,848 | 7,544 | 8,417 |
| 11/30/2012 | 9,322 | 8,740 | 8,431 | 9,325 |
| 11/30/2013 | 10,513 | 9,811 | 10,356 | 11,489 |
| 11/30/2014 | 10,925 | 10,172 | 10,404 | 11,847 |
| 11/30/2015 | 9,868 | 9,188 | 9,930 | 10,584 |
| 11/30/2016 | 9,457 | 8,760 | 9,703 | 10,450 |
41 graphic description end -->
| ■ | Total returns shown for Class A Shares include the maximum sales charge of 5.50% ($10,000 investment minus $550 sales charge = $9,450). |
The Fund offers multiple share classes whose performance may be greater than or less than its other share class(es) due to differences in sales charges and expenses. See the Average Annual Return table below for the returns of additional classes not shown in the line graph above.
Average Annual Total Returns for the Period Ended 11/30/2016
(returns reflect all applicable sales charges and contingent deferred sales charges as specified below in footnote #1)
| | 1 Year | 5 Year | Start of
Performance4 |
| Class A Shares | -9.87% | 1.07% | -1.55% |
| Class C Shares | -6.20% | 1.49% | -1.01% |
| Institutional Shares | -4.17% | 2.52% | -0.66% |
| MWXUSI | -2.29% | 5.16% | -0.35% |
| MWXUSHDYI | -1.27% | 4.42% | 0.52% |
Annual Shareholder Report
Performance data quoted represents past performance which is no guarantee of future results. Investment return and principal value will fluctuate so that an investor's shares, when redeemed, may be worth more or less than their original cost. Mutual fund performance changes over time and current performance may be lower or higher than what is stated. For current to the most recent month-end performance and after-tax returns, visit FederatedInvestors.com or call 1-800-341-7400. Returns shown do not reflect the deduction of taxes that a shareholder would pay on Fund distributions or the redemption of Fund shares. Mutual funds are not obligations of or guaranteed by any bank and are not federally insured.
| 1 | Represents a hypothetical investment of $10,000 in the Fund after deducting applicable sales charges: for Class A Shares, the maximum sales charge of 5.50% ($10,000 investment minus $550 sales charge = $9,450); for Class C Shares, the maximum contingent deferred sales charge is 1.00% on any redemption less than one year from the purchase date. The Fund's performance assumes the reinvestment of all dividends and distributions. The MWXUSI and the MWXUSHDYI have been adjusted to reflect reinvestment of dividends on securities in the indexes. |
| 2 | The MWXUSI captures large- and mid-cap representation across 22 of 23 developed markets countries—excluding the United States. The index covers approximately 85% of the free float-adjusted market capitalization in each country. The MWXUSI is not adjusted to reflect sales charges, expenses or other fees that the Securities and Exchange Commission (SEC) requires to be reflected in the Fund's performance. The index is unmanaged and unlike the Fund, is not affected by cash flows. It is not possible to invest directly in an index. |
| 3 | The MWXUSHDYI is based on the MSCI World ex US Index, its parent index, and includes large- and mid-cap stocks across 22 of 23 developed markets countries, excluding the United States and Canada. The index is designed to reflect the performance of equities in the parent index (excluding REITs) with higher dividend income and quality characteristics than average dividend yields that are both sustainable and persistent. The index also applies quality screens and reviews 12-month past performance to omit stocks with potentially deteriorating fundamentals that could force them to cut or reduce dividends. The MWXUSHDYI is not adjusted to reflect sales charges, expenses or other fees that the SEC requires to be reflected in the Fund's performance. The index is unmanaged and unlike the Fund, is not affected by cash flows. It is not possible to invest directly in an index. |
| 4 | The Fund's Class A Shares, Class C Shares and Institutional Shares commenced operations on June 4, 2008. |
Annual Shareholder Report
Portfolio of Investments Summary Tables (unaudited)
At November 30, 2016, the Fund's portfolio composition1 was as follows:
| Country | Percentage of
Total Net Assets |
| United Kingdom | 32.2% |
| Canada | 19.0% |
| Switzerland | 9.0% |
| Australia | 8.7% |
| France | 8.1% |
| United States | 4.0% |
| Singapore | 3.3% |
| Germany | 3.2% |
| Luxembourg | 2.9% |
| Mexico | 2.8% |
| Sweden | 2.3% |
| Norway | 1.4% |
| Spain | 1.2% |
| Cash Equivalents2 | 1.1% |
| Other Assets and Liabilities—Net3 | 0.8% |
| TOTAL | 100.0% |
| 1 | Country allocations are based primarily on the country in which a company is incorporated. However, the Fund's Adviser may allocate a company to a country based on other factors such as location of the company's principal office, the location of the principal trading market for the company's securities or the country where a majority of the company's revenues are derived. |
| 2 | Cash Equivalents include any investments in money market mutual funds and/or overnight repurchase agreements. |
| 3 | Assets, other than investments in securities, less liabilities. See Statement of Assets and Liabilities. |
Annual Shareholder Report
At November 30, 2016, the Fund's sector classification composition4 was as follows:
| Sector Classification | Percentage of
Total Net Assets |
| Telecommunication Services | 22.2% |
| Consumer Staples | 16.6% |
| Financials | 15.8% |
| Health Care | 14.4% |
| Utilities | 13.9% |
| Energy | 6.9% |
| Consumer Discretionary | 5.0% |
| Materials | 1.8% |
| Industrials | 1.5% |
| Cash Equivalents2 | 1.1% |
| Other Assets and Liabilities—Net3 | 0.8% |
| TOTAL | 100.0% |
| 4 | Except for Cash Equivalents and Other Assets and Liabilities, sector classifications are based upon, and individual securities assigned to, the classifications of the Global Industry Classification Standard (GICS) except that the Adviser assigns a classification to securities not classified by the GICS and to securities for which the Adviser does not have access to the classification made by the GICS. |
Annual Shareholder Report
Portfolio of Investments
November 30, 2016
| Shares | | | Value in
U.S. Dollars |
| | | COMMON STOCKS—98.1% | |
| | | Consumer Discretionary—5.0% | |
| 1,103,000 | | SES SA | $23,842,046 |
| 915,400 | | Shaw Communications, Inc., Class B | 17,915,481 |
| | | TOTAL | 41,757,527 |
| | | Consumer Staples—16.6% | |
| 363,115 | | British American Tobacco PLC | 19,913,108 |
| 372,000 | | Diageo PLC | 9,315,985 |
| 513,155 | | Imperial Brands PLC | 22,005,610 |
| 3,085,000 | | Kimberly-Clark de Mexico SAB de CV, ADR, Class A | 5,397,551 |
| 312,927 | | Nestle SA | 21,052,628 |
| 376,540 | | Philip Morris International, Inc. | 33,240,951 |
| 218,797 | | Unilever PLC | 8,734,041 |
| 9,681,000 | | Wal-Mart de Mexico SAB de CV | 17,799,000 |
| | | TOTAL | 137,458,874 |
| | | Energy—6.9% | |
| 2,914,000 | | BP PLC | 16,904,934 |
| 608,894 | | TOTAL SA | 29,143,637 |
| 239,000 | | TransCanada Corp. | 10,733,917 |
| | | TOTAL | 56,782,488 |
| | | Financials—15.8% | |
| 789,300 | | Admiral Group PLC | 18,773,811 |
| 244,100 | | Bank of Montreal | 16,087,377 |
| 229,000 | | Canadian Imperial Bank of Commerce | 18,067,014 |
| 145,471 | | Muenchener Rueckversicherungs-Gesellschaft AG | 26,476,972 |
| 454,000 | | National Australia Bank Ltd. | 9,715,340 |
| 277,000 | | SCOR SE | 8,797,076 |
| 820,100 | | Swedbank AB, Class A | 18,874,397 |
| 150,000 | | Toronto-Dominion Bank | 7,098,563 |
| 299,000 | | Westpac Banking Corp. | 6,936,361 |
| | | TOTAL | 130,826,911 |
| | | Health Care—14.4% | |
| 513,373 | | AstraZeneca PLC | 26,548,308 |
| 965,543 | | GlaxoSmithKline PLC | 18,021,101 |
| 301,750 | | Novartis AG | 20,765,722 |
| 83,100 | | Roche Holding AG | 18,478,801 |
Annual Shareholder Report
| Shares | | | Value in
U.S. Dollars |
| | | COMMON STOCKS—continued | |
| | | Health Care—continued | |
| 361,586 | | Sanofi | $29,104,217 |
| 390,000 | | Sonic Healthcare Ltd. | 6,309,802 |
| | | TOTAL | 119,227,951 |
| | | Industrials—1.5% | |
| 1,631,728 | | BAE Systems PLC | 12,259,959 |
| | | Materials—1.8% | |
| 1,435,000 | | Amcor Ltd. | 15,248,033 |
| | | Telecommunication Services—22.2% | |
| 623,000 | | BCE, Inc. | 26,848,409 |
| 1,825,000 | | BT Group PLC | 8,154,192 |
| 259,500 | | Rogers Communications, Inc., Class B | 10,026,092 |
| 10,311,385 | | Singapore Telecommunications Ltd. | 27,101,976 |
| 34,055 | | Swisscom AG | 14,525,745 |
| 774,000 | | Telenor ASA | 11,412,761 |
| 9,029,515 | | Telstra Corp. Ltd. | 33,699,537 |
| 629,900 | | TELUS Corp. | 19,675,876 |
| 13,548,818 | | Vodafone Group PLC | 32,766,616 |
| | | TOTAL | 184,211,204 |
| | | Utilities—13.9% | |
| 690,000 | | Emera, Inc. | 23,171,220 |
| 268,000 | | Fortis, Inc. | 7,988,327 |
| 2,393,222 | | National Grid PLC | 27,237,483 |
| 557,300 | | Red Electrica Corp. SA | 9,905,160 |
| 1,752,050 | | SSE PLC | 32,334,544 |
| 1,312,836 | | United Utilities Group PLC | 14,486,475 |
| | | TOTAL | 115,123,209 |
| | | TOTAL COMMON STOCKS
(IDENTIFIED COST $875,558,872) | 812,896,156 |
| | | INVESTMENT COMPANY—1.1% | |
| 9,155,812 | 1 | Federated Institutional Prime Value Obligations Fund,
Institutional Shares, 0.56%2
(IDENTIFIED COST $9,155,813) | 9,156,728 |
| | | TOTAL INVESTMENTS—99.2%
(IDENTIFIED COST $884,714,685)3 | 822,052,884 |
| | | OTHER ASSETS AND LIABILITIES - NET—0.8%4 | 6,492,035 |
| | | TOTAL NET ASSETS—100% | $828,544,919 |
Annual Shareholder Report
At November 30, 2016, the Fund had the following outstanding foreign exchange contracts:
| Settlement Date | Counterparty | Foreign Currency
Units to
Receive/Deliver | In
Exchange
For | Unrealized
Depreciation |
| Contracts Sold: |
| 12/1/2016 | BNY Mellon | 2,257,733 CAD | $1,678,238 | $(2,499) |
Unrealized Depreciation on Foreign Exchange Contracts is included in “Other Assets and Liabilities—Net.”
| 1 | Affiliated holding. |
| 2 | 7-day net yield. |
| 3 | The cost of investments for federal tax purposes amounts to $884,902,220. |
| 4 | Assets, other than investments in securities, less liabilities. See Statement of Assets and Liabilities. |
Note: The categories of investments are shown as a percentage of total net assets at November 30, 2016.
Various inputs are used in determining the value of the Fund's investments. These inputs are summarized in the three broad levels listed below:
Level 1—quoted prices in active markets for identical securities.
Level 2—other significant observable inputs (including quoted prices for similar securities, interest rates, prepayment speeds, credit risk, etc.). Also includes securities valued at amortized cost.
Level 3—significant unobservable inputs (including the Fund's own assumptions in determining the fair value of investments).
The inputs or methodology used for valuing securities are not an indication of the risk associated with investing in those securities.
Annual Shareholder Report
The following is a summary of the inputs used, as of November 30, 2016, in valuing the Fund's assets carried at fair value:
| Valuation Inputs |
| | Level 1—
Quoted
Prices | Level 2—
Other
Significant
Observable
Inputs | Level 3—
Significant
Unobservable
Inputs | Total |
| Equity Securities: | | | | |
| Common Stocks | | | | |
| Domestic | $33,240,951 | $— | $— | $33,240,951 |
| International | 252,969,8121 | 526,685,393 | — | 779,655,205 |
| Investment Company | 9,156,728 | — | — | 9,156,728 |
| TOTAL SECURITIES | $295,367,491 | $526,685,393 | $— | $822,052,884 |
| Other Financial Instruments:2 | | | | |
| Assets | $— | $— | $— | $— |
| Liabilities | (2,499) | — | — | (2,499) |
| TOTAL OTHER FINANCIAL INSTRUMENTS | $(2,499) | $— | $— | $(2,499) |
| 1 | Includes $61,028,076 of securities transferred from Level 2 to Level 1 because quoted prices on equity securities traded principally in foreign markets were utilized to value securities for which fair value factors were previously applied to account for significant post market close activity. Transfer shown represents the value of the securities at the beginning of the period. |
| 2 | Other financial instruments include foreign exchange contracts. |
The following acronyms are used throughout this portfolio:
| ADR | —American Depositary Receipt |
| CAD | —Canadian Dollar |
See Notes which are an integral part of the Financial Statements
Annual Shareholder Report
Financial Highlights–Class A Shares
(For a Share Outstanding Throughout Each Period)
| Year Ended November 30 | 2016 | 2015 | 2014 | 2013 | 2012 |
| Net Asset Value, Beginning of Period | $3.63 | $4.17 | $4.21 | $3.88 | $3.61 |
| Income From Investment Operations: | | | | | |
| Net investment income1 | 0.12 | 0.13 | 0.19 | 0.15 | 0.16 |
| Net realized and unrealized gain (loss) on investments and foreign currency transactions | (0.28) | (0.52) | (0.03) | 0.32 | 0.24 |
| TOTAL FROM INVESTMENT OPERATIONS | (0.16) | (0.39) | 0.16 | 0.47 | 0.40 |
| Less Distributions: | | | | | |
| Distributions from net investment income | (0.11) | (0.13) | (0.20) | (0.14) | (0.13) |
| Distributions from net realized gain on investments and foreign currency transactions | — | (0.02) | (0.00)2 | (0.00)2 | — |
| TOTAL DISTRIBUTIONS | (0.11) | (0.15) | (0.20) | (0.14) | (0.13) |
| Net Asset Value, End of Period | $3.36 | $3.63 | $4.17 | $4.21 | $3.88 |
| Total Return3 | (4.66)% | (9.67)% | 3.68% | 12.25% | 11.37% |
| Ratios to Average Net Assets: | | | | | |
| Net expenses | 1.11%4 | 1.10%4 | 1.11% | 1.10% | 1.04% |
| Net investment income | 3.21% | 3.28% | 4.48% | 3.70% | 4.34% |
| Expense waiver/reimbursement5 | 0.14% | 0.14% | 0.14% | 0.18% | 0.38% |
| Supplemental Data: | | | | | |
| Net assets, end of period (000 omitted) | $194,782 | $229,755 | $311,840 | $263,210 | $110,082 |
| Portfolio turnover | 27% | 39% | 11% | 14% | 26% |
| 1 | Per share numbers have been calculated using the average shares method. |
| 2 | Represents less than $0.005. |
| 3 | Based on net asset value, which does not reflect the sales charge, redemption fee or contingent deferred sales charge, if applicable. |
| 4 | The net expense ratio is calculated without reduction for fees paid indirectly for expense offset arrangements. The net expense ratios are 1.11% and 1.10% for the years ended November 30, 2016 and 2015, respectively, after taking into account these expense reductions. |
| 5 | This expense decrease is reflected in both the net expense and net investment income ratios shown above. |
See Notes which are an integral part of the Financial Statements
Annual Shareholder Report
Financial Highlights–Class C Shares
(For a Share Outstanding Throughout Each Period)
| Year Ended November 30 | 2016 | 2015 | 2014 | 2013 | 2012 |
| Net Asset Value, Beginning of Period | $3.61 | $4.15 | $4.19 | $3.86 | $3.60 |
| Income From Investment Operations: | | | | | |
| Net investment income1 | 0.09 | 0.10 | 0.15 | 0.12 | 0.13 |
Net realized and unrealized gain (loss) on
investments and foreign currency transactions | (0.28) | (0.52) | (0.02) | 0.32 | 0.23 |
| TOTAL FROM INVESTMENT OPERATIONS | (0.19) | (0.42) | 0.13 | 0.44 | 0.36 |
| Less Distributions: | | | | | |
| Distributions from net investment income | (0.08) | (0.10) | (0.17) | (0.11) | (0.10) |
| Distributions from net realized gain on investments and foreign currency transactions | — | (0.02) | (0.00)2 | (0.00)2 | — |
| TOTAL DISTRIBUTIONS | (0.08) | (0.12) | (0.17) | (0.11) | (0.10) |
| Net Asset Value, End of Period | $3.34 | $3.61 | $4.15 | $4.19 | $3.86 |
| Total Return3 | (5.27)% | (10.33)% | 3.01% | 11.57% | 10.29% |
| Ratios to Average Net Assets: | | | | | |
| Net expenses | 1.85%4 | 1.85%4 | 1.86% | 1.85% | 1.79% |
| Net investment income | 2.46% | 2.54% | 3.60% | 3.00% | 3.56% |
| Expense waiver/reimbursement5 | 0.14% | 0.14% | 0.14% | 0.18% | 0.37% |
| Supplemental Data: | | | | | |
| Net assets, end of period (000 omitted) | $95,496 | $114,801 | $123,868 | $77,421 | $23,155 |
| Portfolio turnover | 27% | 39% | 11% | 14% | 26% |
| 1 | Per share numbers have been calculated using the average shares method. |
| 2 | Represents less than $0.005. |
| 3 | Based on net asset value, which does not reflect the sales charge, redemption fee or contingent deferred sales charge, if applicable. |
| 4 | The net expense ratio is calculated without reduction for fees paid indirectly for expense offset arrangements. The net expense ratios are 1.85% and 1.85% for the years ended November 30, 2016 and 2015, respectively, after taking into account these expense reductions. |
| 5 | This expense decrease is reflected in both the net expense and net investment income ratios shown above. |
See Notes which are an integral part of the Financial Statements
Annual Shareholder Report
Financial Highlights–Institutional Shares
(For a Share Outstanding Throughout Each Period)
| Year Ended November 30 | 2016 | 2015 | 2014 | 2013 | 2012 |
| Net Asset Value, Beginning of Period | $3.63 | $4.18 | $4.22 | $3.88 | $3.61 |
| Income From Investment Operations: | | | | | |
| Net investment income1 | 0.12 | 0.14 | 0.19 | 0.16 | 0.17 |
| Net realized and unrealized gain (loss) on investments and foreign currency transactions | (0.27) | (0.53) | (0.02) | 0.33 | 0.24 |
| TOTAL FROM INVESTMENT OPERATIONS | (0.15) | (0.39) | 0.17 | 0.49 | 0.41 |
| Less Distributions: | | | | | |
| Distributions from net investment income | (0.11) | (0.14) | (0.21) | (0.15) | (0.14) |
| Distributions from net realized gain on investments and foreign currency transactions | — | (0.02) | (0.00)2 | (0.00)2 | — |
| TOTAL DISTRIBUTIONS | (0.11) | (0.16) | (0.21) | (0.15) | (0.14) |
| Net Asset Value, End of Period | $3.37 | $3.63 | $4.18 | $4.22 | $3.88 |
| Total Return3 | (4.17)% | (9.67)% | 3.91% | 12.78% | 11.66% |
| Ratios to Average Net Assets: | | | | | |
| Net expenses | 0.86%4 | 0.85%4 | 0.86% | 0.85% | 0.79% |
| Net investment income | 3.39% | 3.56% | 4.52% | 4.02% | 4.55% |
| Expense waiver/reimbursement5 | 0.14% | 0.14% | 0.14% | 0.18% | 0.37% |
| Supplemental Data: | | | | | |
| Net assets, end of period (000 omitted) | $538,267 | $415,083 | $522,221 | $323,386 | $134,463 |
| Portfolio turnover | 27% | 39% | 11% | 14% | 26% |
| 1 | Per share numbers have been calculated using the average shares method. |
| 2 | Represents less than $0.005. |
| 3 | Based on net asset value. |
| 4 | The net expense ratio is calculated without reduction for fees paid indirectly for expense offset arrangements. The net expense ratios are 0.86% and 0.85% for the years ended November 30, 2016 and 2015, respectively, after taking into account these expense reductions. |
| 5 | This expense decrease is reflected in both the net expense and net investment income ratios shown above. |
See Notes which are an integral part of the Financial Statements
Annual Shareholder Report
Statement of Assets and Liabilities
November 30, 2016
| Assets: | | |
| Total investment in securities, at value including $9,156,728 of investment in an affiliated holding (Note 5) (identified cost $884,714,685) | | $822,052,884 |
| Cash denominated in foreign currencies (identified cost $900,745) | | 900,760 |
| Income receivable | | 5,620,464 |
| Receivable for investments sold | | 1,680,737 |
| Receivable for shares sold | | 2,963,490 |
| TOTAL ASSETS | | 833,218,335 |
| Liabilities: | | |
| Payable for shares redeemed | $3,593,142 | |
| Unrealized depreciation on foreign exchange contracts | 2,499 | |
| Bank overdraft | 682,475 | |
| Payable for transfer agent | 84,429 | |
| Payable for distribution services fee (Note 5) | 60,446 | |
| Payable for other service fees (Notes 2 and 5) | 59,782 | |
| Payable for investment adviser fee (Note 5) | 12,772 | |
| Payable for administrative fee (Note 5) | 1,786 | |
| Accrued expenses (Note 5) | 176,085 | |
| TOTAL LIABILITIES | | 4,673,416 |
| Net assets for 246,470,008 shares outstanding | | $828,544,919 |
| Net Assets Consists of: | | |
| Paid-in capital | | $1,003,926,635 |
| Net unrealized depreciation of investments and translation of assets and liabilities in foreign currency | | (62,848,858) |
| Accumulated net realized gain on investments | | (115,086,373) |
| Undistributed net investment income | | 2,553,515 |
| TOTAL NET ASSETS | | $828,544,919 |
Annual Shareholder Report
Statement of Assets and Liabilities–continued
| Net Asset Value, Offering Price and Redemption Proceeds Per Share: | | |
| Class A Shares: | | |
| Net asset value per share ($194,781,998 ÷ 57,955,847 shares outstanding), no par value, unlimited shares authorized | | $3.36 |
| Offering price per share (100/94.50 of $3.36) | | $3.56 |
| Redemption proceeds per share | | $3.36 |
| Class C Shares: | | |
| Net asset value per share ($95,495,996 ÷ 28,628,903 shares outstanding), no par value, unlimited shares authorized | | $3.34 |
| Offering price per share | | $3.34 |
| Redemption proceeds per share (99.00/100 of $3.34) | | $3.31 |
| Institutional Shares: | | |
| Net asset value per share ($538,266,925 ÷ 159,885,258 shares outstanding), no par value, unlimited shares authorized | | $3.37 |
| Offering price per share | | $3.37 |
| Redemption proceeds per share | | $3.37 |
See Notes which are an integral part of the Financial Statements
Annual Shareholder Report
Statement of Operations
Year Ended November 30, 2016
| Investment Income: | | | |
| Dividends (including $42,015 received from an affiliated holding (Note 5) and net of foreign taxes withheld of $2,160,610) | | | $33,099,392 |
| Expenses: | | | |
| Investment adviser fee (Note 5) | | $5,807,944 | |
| Administrative fee (Note 5) | | 605,644 | |
| Custodian fees | | 123,122 | |
| Transfer agent fees | | 782,912 | |
| Directors'/Trustees' fees (Note 5) | | 6,580 | |
| Auditing fees | | 32,954 | |
| Legal fees | | 9,698 | |
| Distribution services fee (Note 5) | | 792,862 | |
| Other service fees (Notes 2 and 5) | | 818,570 | |
| Portfolio accounting fees | | 135,452 | |
| Share registration costs | | 102,106 | |
| Printing and postage | | 60,472 | |
| Miscellaneous (Note 5) | | 29,688 | |
| TOTAL EXPENSES | | 9,308,004 | |
| Waivers, Reimbursement and Reduction: | | | |
| Waiver/reimbursement of investment adviser fee (Note 5) | $(1,050,063) | | |
| Waiver of other operating expenses (Note 2) | (13,027) | | |
| Fees paid indirectly from directed brokerage arrangements (Note 6) | (10,539) | | |
| TOTAL WAIVERS, REIMBURSEMENT AND REDUCTION | | (1,073,629) | |
| Net expenses | | | 8,234,375 |
| Net investment income | | | 24,865,017 |
| Realized and Unrealized Loss on Investments and Foreign Currency Transactions: | | | |
| Net realized loss on investments and foreign currency transactions | | | (36,316,356) |
| Net change in unrealized depreciation of investments and translation of assets and liabilities in foreign currency | | | (37,009,369) |
| Net realized and unrealized loss on investments and foreign currency transactions | | | (73,325,725) |
| Change in net assets resulting from operations | | | $(48,460,708) |
See Notes which are an integral part of the Financial Statements
Annual Shareholder Report
Statement of Changes in Net Assets
| Year Ended November 30 | 2016 | 2015 |
| Increase (Decrease) in Net Assets | | |
| Operations: | | |
| Net investment income | $24,865,017 | $30,484,536 |
| Net realized loss on investments and foreign currency transactions | (36,316,356) | (80,531,935) |
| Net change in unrealized appreciation/depreciation of investments and translation of assets and liabilities in foreign currency | (37,009,369) | (47,226,183) |
| CHANGE IN NET ASSETS RESULTING FROM OPERATIONS | (48,460,708) | (97,273,582) |
| Distributions to Shareholders: | | |
| Distributions from net investment income | | |
| Class A Shares | (6,586,952) | (9,304,984) |
| Class C Shares | (2,490,991) | (3,338,736) |
| Institutional Shares | (13,731,453) | (17,831,289) |
| Distributions from net realized gain on investments | | |
| Class A Shares | — | (1,220,633) |
| Class C Shares | — | (496,600) |
| Institutional Shares | — | (2,038,239) |
| CHANGE IN NET ASSETS RESULTING FROM DISTRIBUTIONS TO SHAREHOLDERS | (22,809,396) | (34,230,481) |
| Share Transactions: | | |
| Proceeds from sale of shares | 530,828,764 | 406,993,698 |
| Net asset value of shares issued to shareholders in payment of distributions declared | 19,890,181 | 31,030,652 |
| Cost of shares redeemed | (410,542,618) | (504,809,771) |
| CHANGE IN NET ASSETS RESULTING FROM SHARE TRANSACTIONS | 140,176,327 | (66,785,421) |
| Change in net assets | 68,906,223 | (198,289,484) |
| Net Assets: | | |
| Beginning of period | 759,638,696 | 957,928,180 |
| End of period (including undistributed net investment income of $2,553,515 and $2,078,109, respectively) | $828,544,919 | $759,638,696 |
See Notes which are an integral part of the Financial Statements
Annual Shareholder Report
Notes to Financial Statements
November 30, 2016
1. ORGANIZATION
Federated Equity Funds (the “Trust”) is registered under the Investment Company Act of 1940, as amended (the “Act”), as an open-end management investment company. The Trust consists of 14 portfolios. The financial statements included herein are only those of Federated International Strategic Value Dividend Fund (the “Fund”), a diversified portfolio. The financial statements of the other portfolios are presented separately. The assets of each portfolio are segregated and a shareholder's interest is limited to the portfolio in which shares are held. Each portfolio pays its own expenses. The Fund offers three classes of shares: Class A Shares, Class C Shares and Institutional Shares. All shares of the Fund have equal rights with respect to voting, except on class-specific matters. The investment objective of the Fund is to provide income and long-term capital appreciation.
2. SIGNIFICANT ACCOUNTING POLICIES
The following is a summary of significant accounting policies consistently followed by the Fund in the preparation of its financial statements. These policies are in conformity with U.S. generally accepted accounting principles (GAAP).
Investment Valuation
In calculating its net asset value (NAV), the Fund generally values investments as follows:
| ■ | Equity securities listed on an exchange or traded through a regulated market system are valued at their last reported sale price or official closing price in their principal exchange or market. |
| ■ | Shares of other mutual funds or non-exchange-traded investment companies are valued based upon their reported NAVs. |
| ■ | Fixed-income securities are fair valued using price evaluations provided by a pricing service approved by the Board of Trustees (the “Trustees”). |
| ■ | Derivative contracts listed on exchanges are valued at their reported settlement or closing price, except that options are valued at the mean of closing bid and asked quotations. |
| ■ | Over-the-counter (OTC) derivative contracts are fair valued using price evaluations provided by a pricing service approved by the Trustees. |
| ■ | For securities that are fair valued in accordance with procedures established by and under the general supervision of the Trustees, certain factors may be considered such as: the last traded or purchase price of the security, information obtained by contacting the issuer or dealers, analysis of the issuer's financial statements or other available documents, fundamental analytical data, the nature and duration of restrictions on disposition, the movement of the market in which the security is normally traded, public trading in similar securities or derivative contracts of the issuer or comparable issuers, movement of a relevant index, or other factors including but not limited to industry changes and relevant government actions. |
If any price, quotation, price evaluation or other pricing source is not readily available when the NAV is calculated, or if the Fund cannot obtain price evaluations from a pricing service or from more than one dealer for an investment within a reasonable period of time as set forth in the Fund's valuation policies and procedures, the Fund uses the fair value of the investment determined in accordance with the procedures described below. There can be no assurance that the Fund could obtain the fair value assigned to an investment if it sold the investment at approximately the time at which the Fund determines its NAV per share.
Annual Shareholder Report
Fair Valuation and Significant Events Procedures
The Trustees have ultimate responsibility for determining the fair value of investments for which market quotations are not readily available. The Trustees have appointed a valuation committee (“Valuation Committee”) comprised of officers of the Fund, Federated Equity Management Company of Pennsylvania (“Adviser”) and certain of the Adviser's affiliated companies to assist in determining fair value and in overseeing the calculation of the NAV. The Trustees have also authorized the use of pricing services recommended by the Valuation Committee to provide fair value evaluations of the current value of certain investments for purposes of calculating the NAV. The Valuation Committee employs various methods for reviewing third-party pricing-service evaluations including periodic reviews of third-party pricing services' policies, procedures and valuation methods (including key inputs, methods, models and assumptions), transactional back-testing, comparisons of evaluations of different pricing services and review of price challenges by the Adviser based on recent market activity. In the event that market quotations and price evaluations are not available for an investment, the Valuation Committee determines the fair value of the investment in accordance with procedures adopted by the Trustees. The Trustees periodically review and approve the fair valuations made by the Valuation Committee and any changes made to the procedures.
Factors considered by pricing services in evaluating an investment include the yields or prices of investments of comparable quality, coupon, maturity, call rights and other potential prepayments, terms and type, reported transactions, indications as to values from dealers and general market conditions. Some pricing services provide a single price evaluation reflecting the bid-side of the market for an investment (a “bid” evaluation). Other pricing services offer both bid evaluations and price evaluations indicative of a price between the prices bid and asked for the investment (a “mid” evaluation). The Fund normally uses bid evaluations for any U.S. Treasury and Agency securities, mortgage-backed securities and municipal securities. The Fund normally uses mid evaluations for any other types of fixed-income securities and any OTC derivative contracts. In the event that market quotations and price evaluations are not available for an investment, the fair value of the investment is determined in accordance with procedures adopted by the Trustees.
The Trustees also have adopted procedures requiring an investment to be priced at its fair value whenever the Adviser determines that a significant event affecting the value of the investment has occurred between the time as of which the price of the investment would otherwise be determined and the time as of which the NAV is computed. An event is considered significant if there is both an affirmative expectation that the investment's value will change in response to the event and a reasonable basis for quantifying the resulting change in value. Examples of significant events that may occur after the close of the principal market on which a security is traded, or after the time of a price evaluation provided by a pricing service or a dealer, include:
| ■ | With respect to securities traded principally in foreign markets, significant trends in U.S. equity markets or in the trading of foreign securities index futures contracts; |
| ■ | Political or other developments affecting the economy or markets in which an issuer conducts its operations or its securities are traded; |
| ■ | Announcements concerning matters such as acquisitions, recapitalizations, litigation developments, or a natural disaster affecting the issuer's operations or regulatory changes or market developments affecting the issuer's industry. |
Annual Shareholder Report
The Trustees have adopted procedures whereby the Valuation Committee uses a pricing service to determine the fair value of equity securities traded principally in foreign markets when the Adviser determines that there has been a significant trend in the U.S. equity markets or in index futures trading. For other significant events, the Fund may seek to obtain more current quotations or price evaluations from alternative pricing sources. If a reliable alternative pricing source is not available, the Fund will determine the fair value of the investment in accordance with the fair valuation procedures approved by the Trustees. The Trustees have ultimate responsibility for any fair valuations made in response to a significant event.
Repurchase Agreements
The Fund may invest in repurchase agreements for short-term liquidity purposes. It is the policy of the Fund to require the other party to a repurchase agreement to transfer to the Fund's custodian or sub-custodian eligible securities or cash with a market value (after transaction costs) at least equal to the repurchase price to be paid under the repurchase agreement. The eligible securities are transferred to accounts with the custodian or sub-custodian in which the Fund holds a “securities entitlement” and exercises “control” as those terms are defined in the Uniform Commercial Code. The Fund has established procedures for monitoring the market value of the transferred securities and requiring the transfer of additional eligible securities if necessary to equal at least the repurchase price. These procedures also allow the other party to require securities to be transferred from the account to the extent that their market value exceeds the repurchase price or in exchange for other eligible securities of equivalent market value.
The insolvency of the other party or other failure to repurchase the securities may delay the disposition of the underlying securities or cause the Fund to receive less than the full repurchase price. Under the terms of the repurchase agreement, any amounts received by the Fund in excess of the repurchase price and related transaction costs must be remitted to the other party.
The Fund may enter into repurchase agreements in which eligible securities are transferred into joint trading accounts maintained by the custodian or sub-custodian for investment companies and other clients advised by the Adviser and its affiliates. The Fund will participate on a pro rata basis with the other investment companies and clients in its share of the securities transferred under such repurchase agreements and in its share of proceeds from any repurchase or other disposition of such securities.
Investment Income, Gains and Losses, Expenses and Distributions
Investment transactions are accounted for on a trade-date basis. Realized gains and losses from investment transactions are recorded on an identified-cost basis. Interest income and expenses are accrued daily. Dividend income and distributions to shareholders are recorded on the ex-dividend date. Foreign dividends are recorded on the ex-dividend date or when the Fund is informed of the ex-dividend date. Distributions of net investment income are declared and paid monthly. Non-cash dividends included in dividend income, if any, are recorded at fair value. Amortization/accretion of premium and discount is included in investment income. Investment income, realized and unrealized gains and losses, and certain fund-level expenses are allocated to each class based on relative average daily net assets, except that Class A Shares and Class C Shares may bear distribution services fees and other service fees unique to those classes. The detail of the total fund expense waivers, reimbursement and reduction of $1,073,629 is disclosed in various locations in this Note 2, Note 5 and Note 6.
For the year ended November 30, 2016, an unaffiliated third-party waived $13,027 of portfolio accounting fees.
Annual Shareholder Report
Dividends are declared separately for each class. No class has preferential dividend rights; differences in per share dividend rates are generally due to differences in separate class expenses.
Other Service Fees
The Fund may pay other service fees up to 0.25% of the average daily net assets of the Fund's Class A Shares and Class C Shares to unaffiliated financial intermediaries or to Federated Shareholder Services Company (FSSC) for providing services to shareholders and maintaining shareholder accounts. Subject to the terms described in the Expense Limitation note, FSSC may voluntarily reimburse the Fund for other service fees. In addition, unaffiliated third-party financial intermediaries may waive other service fees. This waiver may be modified or terminated at any time. For the year ended November 30, 2016, other service fees for the Fund were as follows:
| | Other
Service Fees
Incurred |
| Class A Shares | $554,788 |
| Class C Shares | 263,782 |
| TOTAL | $818,570 |
Federal Taxes
It is the Fund's policy to comply with the Subchapter M provision of the Internal Revenue Code (the “Code”) and to distribute to shareholders each year substantially all of its income. Accordingly, no provision for federal income tax is necessary. As of and during the year ended November 30, 2016, the Fund did not have a liability for any uncertain tax positions. The Fund recognizes interest and penalties, if any, related to tax liabilities as income tax expense in the Statement of Operations. As of November 30, 2016, tax years 2013 through 2016 remain subject to examination by the Fund's major tax jurisdictions, which include the United States of America and the Commonwealth of Massachusetts.
The Fund may be subject to taxes imposed by governments of countries in which it invests. Such taxes are generally based on either income or gains earned or repatriated. The Fund accrues and applies such taxes to net investment income, net realized gains and net unrealized gains as income and/or gains are earned.
When-Issued and Delayed-Delivery Transactions
The Fund may engage in when-issued or delayed-delivery transactions. The Fund records when-issued securities on the trade date and maintains security positions such that sufficient liquid assets will be available to make payment for the securities purchased. Securities purchased on a when-issued or delayed-delivery basis are marked to market daily and begin earning interest on the settlement date. Losses may occur on these transactions due to changes in market conditions or the failure of counterparties to perform under the contract.
Foreign Exchange Contracts
The Fund may enter into foreign exchange contracts to manage country risk and currency risk. Purchased contracts are used to acquire exposure to foreign currencies, whereas, contracts to sell are used to hedge the Fund's securities against currency fluctuations. Risks may arise upon entering into these transactions from the potential inability of counterparties to meet the
Annual Shareholder Report
terms of their commitments and from unanticipated movements in security prices or foreign exchange rates. The foreign exchange contracts are adjusted by the daily exchange rate of the underlying currency and any gains or losses are recorded for financial statement purposes as unrealized until the settlement date.
Foreign exchange contracts are subject to Master Netting Agreements which are agreements between the Fund and its counterparties that provide for the net settlement of all transactions and collateral with the Fund, through a single payment, in the event of defaults or terminations. Amounts presented on the Portfolio of Investments and Statement of Assets and Liabilities are not net settlement amounts but gross.
Foreign exchange contracts outstanding at period end, including net unrealized appreciation/depreciation or net settlement amounts, are listed after the Fund's Portfolio of Investments.
The average value at settlement date payable and receivable of foreign exchange contracts purchased and sold by the Fund throughout the period was $1,971 and $852, respectively. This is based on the amounts held as of each month-end throughout the fiscal year.
Foreign Currency Translation
The accounting records of the Fund are maintained in U.S. dollars. All assets and liabilities denominated in foreign currencies (FCs) are translated into U.S. dollars based on the rates of exchange of such currencies against U.S. dollars on the date of valuation. Purchases and sales of securities, income and expenses are translated at the rate of exchange quoted on the respective date that such transactions are recorded. The Fund does not isolate that portion of the results of operations resulting from changes in foreign exchange rates on investments from the fluctuations arising from changes in market prices of securities held. Such fluctuations are included with the net realized and unrealized gain or loss from investments.
Reported net realized foreign exchange gains or losses arise from sales of FCs, currency gains or losses realized between the trade and settlement dates on securities transactions, the difference between the amounts of dividends, interest and foreign withholding taxes recorded on the Fund's books and the U.S. dollar equivalent of the amounts actually received or paid. Net unrealized foreign exchange gains and losses arise from changes in the value of assets and liabilities other than investments in securities at period end, resulting from changes in the exchange rate.
Annual Shareholder Report
Additional Disclosure Related to Derivative Instruments
| Fair Value of Derivative Instruments |
| | Liability |
| | Statement of
Assets and
Liabilities
Location | Fair
Value |
Derivatives not
accounted for as
hedging instruments
under ASC Topic 815 | | |
| Foreign exchange contracts | Unrealized
depreciation
on foreign
exchange
contracts | $2,499 |
The Effect of Derivative Instruments on the Statement of Operations for the Year Ended November 30, 2016
| Amount of Realized Gain or (Loss) on Derivatives Recognized in Income |
| | Forward
Exchange
Contracts1 |
| Foreign exchange contracts | $179,616 |
| Change in Unrealized Appreciation or (Depreciation) on Derivatives Recognized in Income |
| | Forward
Exchange
Contracts2 |
| Foreign exchange contracts | $(2,448) |
| 1 | The net realized gain (loss) on Forward Exchange Contracts is found within the net realized loss on investments and foreign currency transactions on the Statement of Operations. |
| 2 | The net change in unrealized appreciation/depreciation of Forward Exchange Contracts is found within the Net Change in unrealized appreciation/depreciation of investments and translation of assets and liabilities in foreign currency on the Statement of Operations. |
Other
The preparation of financial statements in conformity with GAAP requires management to make estimates and assumptions that affect the amounts of assets, liabilities, expenses and revenues reported in the financial statements. Actual results could differ from those estimated. The Fund applies Investment Company accounting and reporting guidance.
Annual Shareholder Report
3. SHARES OF BENEFICIAL INTEREST
The following tables summarize share activity:
| Year Ended November 30 | 2016 | 2015 |
| Class A Shares: | Shares | Amount | Shares | Amount |
| Shares sold | 29,204,165 | $105,163,688 | 24,592,860 | $96,326,926 |
| Shares issued to shareholders in payment of distributions declared | 1,630,472 | 5,849,548 | 2,620,518 | 10,130,635 |
| Shares redeemed | (36,207,647) | (129,083,167) | (38,632,025) | (148,324,682) |
| NET CHANGE RESULTING FROM CLASS A SHARE TRANSACTIONS | (5,373,010) | $(18,069,931) | (11,418,647) | $(41,867,121) |
| Year Ended November 30 | 2016 | 2015 |
| Class C Shares: | Shares | Amount | Amount | Amount |
| Shares sold | 7,709,409 | $27,701,830 | 11,499,241 | $44,980,635 |
| Shares issued to shareholders in payment of distributions declared | 649,691 | 2,311,850 | 916,708 | 3,517,562 |
| Shares redeemed | (11,570,121) | (40,850,124) | (10,425,916) | (39,702,267) |
| NET CHANGE RESULTING FROM CLASS C SHARE TRANSACTIONS | (3,211,021) | $(10,836,444) | 1,990,033 | $8,795,930 |
| Year Ended November 30 | 2016 | 2015 |
| Institutional Shares: | Shares | Amount | Shares | Amount |
| Shares sold | 109,950,611 | $397,963,246 | 67,708,659 | $265,686,137 |
| Shares issued to shareholders in payment of distributions declared | 3,258,780 | 11,728,783 | 4,497,899 | 17,382,455 |
| Shares redeemed | (67,588,208) | (240,609,327) | (82,992,753) | (316,782,822) |
| NET CHANGE RESULTING FROM INSTITUTIONAL SHARE TRANSACTIONS | 45,621,183 | $169,082,702 | (10,786,195) | $(33,714,230) |
| NET CHANGE RESULTING FROM TOTAL FUND SHARE TRANSACTIONS | 37,037,152 | $140,176,327 | (20,214,809) | $(66,785,421) |
4. FEDERAL TAX INFORMATION
The timing and character of income and capital gain distributions are determined in accordance with income tax regulations, which may differ from GAAP. These differences are due to differing treatments for foreign currency transactions.
For the year ended November 30, 2016, permanent differences identified and reclassified among the components of net assets were as follows:
| Increase (Decrease) |
Undistributed
Net Investment
Income (Loss) | Accumulated
Net Realized
Gain (Loss) |
| $(1,580,215) | $1,580,215 |
Annual Shareholder Report
Net investment income (loss), net realized gains (losses) and net assets were not affected by the reclassification.
The tax character of distributions as reported on the Statement of Changes in Net Assets for the years ended November 30, 2016 and 2015 was as follows:
| | 2016 | 2015 |
| Ordinary income1 | $22,809,396 | $31,295,535 |
| Long-term capital gains | $— | $2,934,946 |
| 1 | For tax purposes, short-term capital gain distributions are considered ordinary income distributions. |
As of November 30, 2016, the components of distributable earnings on a tax-basis were as follows:
| Undistributed ordinary income | $2,553,515 |
| Net unrealized appreciation | $(63,036,393) |
| Capital loss carryforwards | $(114,898,838) |
The difference between book-basis and tax-basis unrealized depreciation is attributable to differing treatments for the deferral of losses on wash sales.
At November 30, 2016, the cost of investments for federal tax purposes was $884,902,220. The net unrealized depreciation of investments for federal tax purposes, excluding any unrealized depreciation resulting from the translation of FCs to U.S. dollars of assets and liabilities other than investments in securities was $62,849,336. This consists of net unrealized appreciation from investments for those securities having an excess of value over cost of $14,404,858 and net unrealized depreciation from investments for those securities having an excess of cost over value of $77,254,194.
As of November 30, 2016, the Fund had a capital loss carryforward of $114,898,838 which will reduce the Fund's taxable income arising from future net realized gains on investments, if any, to the extent permitted by the Code, thereby reducing the amount of distributions to shareholders which would otherwise be necessary to relieve the Fund of any liability for federal income tax. Pursuant to the Code, a net capital loss incurred in taxable years beginning after December 22, 2010, retains its character as either short-term or long-term and does not expire. All of the Fund's capital loss carryforwards were incurred in taxable years beginning after December 22, 2010.
The following schedule summarizes the Fund's capital loss carryforwards:
| Short-Term | Long-Term | Total |
| $33,967,368 | $80,931,470 | $114,898,838 |
5. INVESTMENT ADVISER FEE AND OTHER TRANSACTIONS WITH AFFILIATES
Investment Adviser Fee
The advisory agreement between the Fund and the Adviser provides for an annual fee equal to 0.75% of the Fund's average daily net assets. Subject to the terms described in the Expense Limitation note, the Adviser may voluntarily choose to waive any portion of its fee. For the year ended November 30, 2016, the Adviser voluntarily waived $1,038,894 of its fee.
Annual Shareholder Report
Administrative Fee
Federated Administrative Services (FAS), under the Administrative Services Agreement, provides the Fund with administrative personnel and services. For purposes of determining the appropriate rate breakpoint, “Investment Complex” is defined as all of the Federated Funds subject to a fee under the Administrative Services Agreement. The fee paid to FAS is based on the average daily net assets of the Investment Complex as specified below, plus certain out-of-pocket expenses:
| Administrative Fee | Average Daily Net Assets
of the Investment Complex |
| 0.150% | on the first $5 billion |
| 0.125% | on the next $5 billion |
| 0.100% | on the next $10 billion |
| 0.075% | on assets in excess of $20 billion |
Subject to the terms described in the Expense Limitation note, FAS may voluntarily choose to waive any portion of its fee. For the year ended November 30, 2016, the annualized fee paid to FAS was 0.078% of average daily net assets of the Fund.
Distribution Services Fee
The Fund has adopted a Distribution Plan (the “Plan”) pursuant to Rule 12b-1 under the Act. Under the terms of the Plan, the Fund will compensate Federated Securities Corp. (FSC), the principal distributor, from the daily net assets of the Fund's Class A Shares and Class C Shares to finance activities intended to result in the sale of these shares. The Plan provides that the Fund may incur distribution expenses at the following percentages of average daily net assets annually, to compensate FSC:
| Share Class Name | Percentage of Average Daily
Net Assets of Class |
| Class A Shares | 0.05% |
| Class C Shares | 0.75% |
Subject to the terms described in the Expense Limitation note, FSC may voluntarily choose to waive any portion of its fee. For the year ended November 30, 2016, distribution services fees for the Fund were as follows:
| | Distribution
Services Fees
Incurred |
| Class C Shares | $792,862 |
When FSC receives fees, it may pay some or all of them to financial intermediaries whose customers purchase shares. For the year ended November 30, 2016, FSC retained $158,405 of fees paid by the Fund. For the year ended November 30, 2016, the Fund's Class A Shares did not incur a distribution services fee; however, it may begin to incur this fee upon approval of the Trustees.
Annual Shareholder Report
Sales Charges
Front-end sales charges and contingent deferred sales charges (CDSC) do not represent expenses of the Fund. They are deducted from the proceeds of sales of Fund shares prior to investment or from redemption proceeds prior to remittance, as applicable. For the year ended November 30, 2016, FSC retained $66,063 in sales charges from the sale of Class A Shares. FSC also retained $6,186 and $15,118 of CDSC relating to redemptions of Class A Shares and Class C Shares, respectively.
Other Service Fees
For the year ended November 30, 2016. FSSC received $5,949 of other service fees disclosed in Note 2.
Expense Limitation
The Adviser and certain of its affiliates (which may include FSC, FAS and FSSC) on their own initiative have agreed to waive certain amounts of their respective fees and/or reimburse expenses. Total annual fund operating expenses (as shown in the financial highlights, excluding tax reclaim recovery expenses, interest expense, extraordinary expenses and proxy-related expenses paid by the Fund, if any) paid by the Fund's Class A Shares, Class C Shares and Institutional Shares (after the voluntary waivers and reimbursements) will not exceed 1.10%, 1.85% and 0.85% (the “Fee Limit”), respectively, up to but not including the later of (the “Termination Date”): (a) February 1, 2018; or (b) the date of the Fund's next effective Prospectus. While the Adviser and its applicable affiliates currently do not anticipate terminating or increasing these arrangements prior to the Termination Date, these arrangements may only be terminated or the Fee Limit increased prior to the Termination Date with the agreement of the Trustees.
General
Certain Officers and Trustees of the Fund are Officers and Directors or Trustees of certain of the above companies. To efficiently facilitate payment, Directors'/Trustees' fees and certain expenses related to conducting meetings of the Directors/Trustees and other miscellaneous expenses are paid by an affiliate of the Adviser which in due course are reimbursed by the Fund. Such expenses may be included in Accrued and Miscellaneous Expenses on the Statements of Assets and Liabilities and Statements of Operations, respectively.
Annual Shareholder Report
Transactions with Affiliated Holdings
Affiliated holdings are investment companies which are managed by the Adviser or an affiliate of the Adviser. The Adviser has agreed to reimburse the Fund for certain investment adviser fees as a result of transactions in other affiliated investment companies. For the year ended November 30, 2016, the Adviser reimbursed $11,169. Transactions involving the affiliated holding during the year ended November 30, 2016, were as follows:
| | Federated Institutional
Prime Value
Obligations Fund,
Institutional Shares |
| Balance of Shares Held 11/30/2015 | 7,885,673 |
| Purchases/Additions | 281,845,017 |
| Sales/Reductions | (280,574,878) |
| Balance of Shares Held 11/30/2016 | 9,155,812 |
| Value | $9,156,728 |
| Dividend Income | $42,015 |
6. EXPENSE REDUCTION
The Fund directs portfolio trades to a broker that in turn pays a portion of the Fund's operating expenses. For the year ended November 30, 2016, the Fund's expenses were reduced by $10,539 under these arrangements.
7. Investment TRANSACTIONS
Purchases and sales of investments, excluding long-term U.S. government securities and short-term obligations, for the year ended November 30, 2016, were as follows:
| Purchases | $345,640,056 |
| Sales | $206,773,847 |
8. CONCENTRATION OF RISK
The Fund invests in securities of non-U.S. issuers. Foreign political or economic developments may have an effect on the liquidity and volatility of portfolio securities and currency holdings.
The Fund may invest a portion of its assets in securities of companies that are deemed by the Fund's management to be classified in similar business sectors. Economic developments may have an effect on the liquidity and volatility of the portfolio securities.
9. LINE OF CREDIT
The Fund participates with certain other Federated Funds, on a several basis, in an up to $500,000,000 unsecured, 364-day, committed, revolving line of credit (LOC) agreement. The LOC was made available to finance temporarily the repurchase or redemption of shares of the Fund, failed trades, payment of dividends, settlement of trades and for other short-term, temporary or emergency general business purposes. The Fund cannot borrow under the LOC if an inter-fund loan is outstanding. The Fund's ability to borrow under the LOC also is subject to the limitations of the Act and various conditions precedent that must be satisfied before the Fund can borrow. Loans under the LOC are charged interest at a fluctuating rate per annum equal to the highest, on any day, of (a) (i) the federal funds effective rate, (ii) the one month London Interbank Offer Rate (LIBOR), and (iii) 0.0%, plus (b) a margin. The LOC also requires
Annual Shareholder Report
the Fund to pay, quarterly in arrears and at maturity, its pro rata share of a commitment fee based on the amount of the lenders' commitment that has not been utilized. As of November 30, 2016, the Fund had no outstanding loans. During the year ended November 30, 2016, the Fund did not utilize the LOC.
10. INTERFUND LENDING
Pursuant to an Exemptive Order issued by the Securities and Exchange Commission (SEC), the Fund, along with other funds advised by subsidiaries of Federated Investors, Inc., may participate in an interfund lending program. This program provides an alternative credit facility allowing the Fund to borrow from other participating affiliated funds. As of November 30, 2016, there were no outstanding loans. During the year ended November 30, 2016, the program was not utilized.
11. Regulatory UPDATES
On October 13, 2016, the SEC amended existing rules intended to modernize reporting and disclosure of information. These amendments relate to Regulation S-X which sets forth the form and content of financial statements. At this time, management is evaluating the implications of adopting these amendments and their impact on the financial statements and accompanying notes.
12. Subsequent event
On or about January 27, 2017, the Fund will offer Class R6 Shares.
13. FEDERAL TAX INFORMATION (UNAUDITED)
For the fiscal year ended November 30, 2016, 100.00% of the total ordinary income (including short-term capital gain) distributions made by the Fund are qualifying dividends which may be subject to a maximum tax rate of 15%, as provided for in the Jobs and Growth Tax Relief Act of 2003. Complete information is reported in conjunction with the reporting of your distribution on Form 1099-DIV.
Of the ordinary income (including short-term capital gain) distributions made by the Fund during the year ended November 30, 2016, 5.58% qualify for the dividend received deduction available to corporate shareholders.
If the Fund meets the requirements of Section 853 of the code, the Fund will pass through to its shareholders credits of foreign taxes paid. For the year ended November 30, 2016, the Fund derived $33,822,222 of gross income from foreign sources and paid foreign taxes of $2,160,610.
Annual Shareholder Report
Report of Independent Registered Public Accounting Firm
TO THE BOARD OF TRUSTEES OF THE FEDERATED EQUITY FUNDS AND SHAREHOLDERS OF Federated InternATIONAL STRATEGIC VALUE Dividend fund:
We have audited the accompanying statement of assets and liabilities, including the portfolio of investments, of the Federated International Strategic Value Dividend Fund (the “Fund”), a portfolio of Federated Equity Funds, as of November 30, 2016, and the related statement of operations for the year then ended, the statements of changes in net assets for each of the years in the two-year period then ended and the financial highlights for each of the years in the five-year period then ended. These financial statements and financial highlights are the responsibility of the Fund's management. Our responsibility is to express an opinion on these financial statements and financial highlights based on our audits.
We conducted our audits in accordance with the standards of the Public Company Accounting Oversight Board (United States). Those standards require that we plan and perform the audit to obtain reasonable assurance about whether the financial statements and financial highlights are free of material misstatement. An audit includes examining, on a test basis, evidence supporting the amounts and disclosures in the financial statements. Our procedures included confirmation of securities owned as of November 30, 2016, by correspondence with the custodian, transfer agent and brokers or by other appropriate auditing procedures. An audit also includes assessing the accounting principles used and significant estimates made by management, as well as evaluating the overall financial statement presentation. We believe that our audits provide a reasonable basis for our opinion.
In our opinion, the financial statements and financial highlights referred to above present fairly, in all material respects, the financial position of the Federated International Strategic Value Dividend Fund as of November 30, 2016, and the results of its operations for the year then ended, the changes in its net assets for each of the years in the two-year period then ended and the financial highlights for each of the years in the five-year period then ended, in conformity with U.S. generally accepted accounting principles.
Boston, Massachusetts
January 25, 2017
Annual Shareholder Report
Shareholder Expense Example (unaudited)
As a shareholder of the Fund, you incur two types of costs: (1) transaction costs, including sales charges (loads) on purchase or redemption payments and redemption/exchange fees; and (2) ongoing costs, including management fees and to the extent applicable, distribution (12b-1) fees and/or other service fees and other Fund expenses. This Example is intended to help you to understand your ongoing costs (in dollars) of investing in the Fund and to compare these costs with the ongoing costs of investing in other mutual funds. It is based on an investment of $1,000 invested at the beginning of the period and held for the entire period from June 1, 2016 to November 30, 2016.
ACTUAL EXPENSES
The first section of the table below provides information about actual account values and actual expenses. You may use the information in this section, together with the amount you invested, to estimate the expenses that you incurred over the period. Simply divide your account value by $1,000 (for example, an $8,600 account value divided by $1,000 = 8.6), then multiply the result by the number in the first section under the heading entitled “Expenses Paid During Period” to estimate the expenses attributable to your investment during this period.
HYPOTHETICAL EXAMPLE FOR COMPARISON PURPOSES
The second section of the table below provides information about hypothetical account values and hypothetical expenses based on the Fund's actual expense ratio and an assumed rate of return of 5% per year before expenses, which is not the Fund's actual return. Thus, you should not use the hypothetical account values and expenses to estimate the actual ending account balance or your expenses for the period. Rather, these figures are required to be provided to enable you to compare the ongoing costs of investing in the Fund with other funds. To do so, compare this 5% hypothetical example with the 5% hypothetical examples that appear in the shareholder reports of the other funds.
Annual Shareholder Report
Please note that the expenses shown in the table are meant to highlight your ongoing costs only and do not reflect any transaction costs, such as sales charges (loads) on purchase or redemption payments, or redemption/exchange fees. Therefore, the second section of the table is useful in comparing ongoing costs only, and will not help you determine the relative total costs of owning different funds. In addition, if these transaction costs were included, your costs would have been higher.
| | Beginning
Account Value
6/1/2016 | Ending
Account Value
11/30/2016 | Expenses Paid
During Period1 |
| Actual: | | | |
| Class A Shares | $1,000 | $930.70 | $5.31 |
| Class C Shares | $1,000 | $927.40 | $8.91 |
| Institutional Shares | $1,000 | $931.90 | $4.11 |
Hypothetical (assuming a 5% return
before expenses): | | | |
| Class A Shares | $1,000 | $1,019.50 | $5.55 |
| Class C Shares | $1,000 | $1,015.75 | $9.32 |
| Institutional Shares | $1,000 | $1,020.75 | $4.29 |
| 1 | Expenses are equal to the Fund's annualized net expense ratios, multiplied by the average account value over the period, multiplied by 183/366 (to reflect the one-half-year period). The annualized net expense ratios are as follows: |
| | |
| Class A Shares | 1.10% |
| Class C Shares | 1.85% |
| Institutional Shares | 0.85% |
Annual Shareholder Report
Board of Trustees and Trust Officers
The Board of Trustees is responsible for managing the Trust's business affairs and for exercising all the Trust's powers except those reserved for the shareholders. The following tables give information about each Trustee and the senior officers of the Fund. Where required, the tables separately list Trustees who are “interested persons” of the Fund (i.e., “Interested” Trustees) and those who are not (i.e., “Independent” Trustees). Unless otherwise noted, the address of each person listed is Federated Investors Tower, 1001 Liberty Avenue, Pittsburgh, PA 15222. The address of all Independent Trustees listed is 4000 Ericsson Drive, Warrendale, PA 15086-7561; Attention: Mutual Fund Board. As of December 31, 2016, the Trust comprised 14 portfolio(s), and the Federated Fund Family consisted of 40 investment companies (comprising 124 portfolios). Unless otherwise noted, each Officer is elected annually. Unless otherwise noted, each Trustee oversees all portfolios in the Federated Fund Family and serves for an indefinite term. The Fund's Statement of Additional Information includes additional information about Trust Trustees and is available, without charge and upon request, by calling 1-800-341-7400.
Interested Trustees Background
Name
Birth Date
Positions Held with Trust
Date Service Began | Principal Occupation(s) for Past Five Years,
Other Directorships Held and Previous Position(s) |
J. Christopher Donahue*
Birth Date: April 11, 1949
President and Trustee
Indefinite Term
Began serving: September 1999 | Principal Occupations: Principal Executive Officer and President of certain of the Funds in the Federated Fund Family; Director or Trustee of the Funds in the Federated Fund Family; President, Chief Executive Officer and Director, Federated Investors, Inc.; Chairman and Trustee, Federated Investment Management Company; Trustee, Federated Investment Counseling; Chairman and Director, Federated Global Investment Management Corp.; Chairman, Federated Equity Management Company of Pennsylvania and Passport Research, Ltd. (investment advisory subsidiary of Federated); Trustee, Federated Shareholder Services Company; Director, Federated Services Company.
Previous Positions: President, Federated Investment Counseling; President and Chief Executive Officer, Federated Investment Management Company, Federated Global Investment Management Corp. and Passport Research, Ltd. |
Annual Shareholder Report
Name
Birth Date
Positions Held with Trust
Date Service Began | Principal Occupation(s) for Past Five Years,
Other Directorships Held and Previous Position(s) |
John B. Fisher*
Birth Date: May 16, 1956
Trustee
Indefinite Term
Began serving: May 2016 | Principal Occupations: Principal Executive Officer and President of certain of the Funds in the Federated Fund Family; Director or Trustee of certain of the Funds in the Federated Fund Family; Vice President, Federated Investors, Inc.; President, Director/Trustee and CEO, Federated Advisory Services Company, Federated Equity Management Company of Pennsylvania, Federated Global Investment Management Corp., Federated Investment Counseling, Federated Investment Management Company; President and CEO of Passport Research, Ltd.; President of some of the Funds in the Federated Fund Complex and Director, Federated Investors Trust Company.
Previous Positions: President and Director of the Institutional Sales Division of Federated Securities Corp.; President and Director of Federated Investment Counseling; Director, Edgewood Securities Corp.; Director, Federated Services Company; Director, Federated Investors, Inc.; Chairman and Director, Southpointe Distribution Services, Inc. and President, Technology, Federated Services Company. |
| * | Reasons for “interested” status: J. Christopher Donahue and John B. Fisher are interested due to their beneficial ownership of shares of Federated Investors, Inc. and due to positions they hold with Federated and its subsidiaries. J. Christopher Donahue is the son of John F. Donahue, Chairman Emeritus of the Federated Funds. |
INDEPENDENT Trustees Background
Name
Birth Date
Positions Held with Trust
Date Service Began | Principal Occupation(s) for Past Five Years,
Other Directorships Held, Previous Position(s) and Qualifications |
John T. Collins
Birth Date: January 24, 1947
Trustee
Indefinite Term
Began serving: October 2013 | Principal Occupations: Director or Trustee of the Federated Fund Family; formerly, Chairman and CEO, The Collins Group, Inc. (a private equity firm) (Retired).
Other Directorships Held: Director, Current Chair of the Compensation Committee, KLX Corp.
Qualifications: Mr. Collins has served in several business and financial management roles and directorship positions throughout his career. Mr. Collins previously served as Chairman and CEO, The Collins Group, Inc. (a private equity firm). Mr. Collins serves as Chairman Emeriti, Bentley University. Mr. Collins previously served as Director and Audit Committee Member, Bank of America Corp.; Director, FleetBoston Financial Corp.; and Director, Beth Israel Deaconess Medical Center (Harvard University Affiliate Hospital). |
Annual Shareholder Report
Name
Birth Date
Positions Held with Trust
Date Service Began | Principal Occupation(s) for Past Five Years,
Other Directorships Held, Previous Position(s) and Qualifications |
G. Thomas Hough
Birth Date: February 28, 1955
Trustee
Indefinite Term
Began serving: August 2015 | Principal Occupations: Director or Trustee of the Federated Fund Family; formerly, Vice Chair, Ernst & Young LLP (public accounting firm) (Retired).
Other Directorships Held: Director, Chair of the Audit Committee, Governance Committee, Publix Super Markets, Inc.; Director, Member of the Audit Committee and Technology Committee of Equifax, Inc.
Qualifications: Mr. Hough has served in accounting, business management and directorship positions throughout his career. Mr. Hough most recently held the position of Americas Vice Chair of Assurance with Ernst & Young LLP (public accounting firm). Mr. Hough is an Executive Committee member of the United States Golf Association, he serves on the President's Cabinet and Business School Board of Visitors for the University of Alabama and is on the Business School Board of Visitors for Wake Forest University. |
Maureen Lally-Green
Birth Date: July 5, 1949
Trustee
Indefinite Term
Began serving: August 2009 | Principal Occupations: Director or Trustee of the Federated Fund Family; Interim Dean of the Duquesne University School of Law; Adjunct Professor of Law, Duquesne University School of Law; formerly, Associate General Secretary and Director, Office of Church Relations, Diocese of Pittsburgh.
Other Directorships Held: Director, CONSOL Energy Inc.
Qualifications: Judge Lally-Green has served in various legal and business roles and directorship positions throughout her career. Judge Lally-Green previously served as: Associate General Secretary, Diocese of Pittsburgh; a member of the Superior Court of Pennsylvania; and as a Professor of Law, Duquesne University School of Law. Judge Lally-Green also currently holds the positions on either a public or not for profit Board of Directors as follows: Director and Chair, UPMC Mercy Hospital; Regent, St. Vincent Seminary; Director and Vice Chair, Our Campaign for the Church Alive!, Inc.; Director, Saint Vincent College; Member, Pennsylvania State Board of Education (public); and Director and Chair, Cardinal Wuerl North Catholic High School, Inc. Judge Lally-Green has held the positions of: Director, Auberle; Director, Epilepsy Foundation of Western and Central Pennsylvania; Director, Ireland Institute of Pittsburgh; Director, Saint Thomas More Society; Director, Catholic High Schools of the Diocese of Pittsburgh, Inc.; and Director, Pennsylvania Bar Institute. |
Peter E. Madden
Birth Date: March 16, 1942
Trustee
Indefinite Term
Began serving: November 1991 | Principal Occupation: Director or Trustee, and Chair of the Board of Directors or Trustees, of the Federated Fund Family; Retired.
Other Directorships Held: None.
Qualifications: Mr. Madden has served in several business management, mutual fund services and directorship positions throughout his career. Mr. Madden previously served as President, Chief Operating Officer and Director, State Street Bank and Trust Company (custodian bank) and State Street Corporation (financial services). He was Director, VISA USA and VISA International and Chairman and Director, Massachusetts Bankers Association. Mr. Madden served as Director, Depository Trust Corporation and Director, The Boston Stock Exchange. Mr. Madden also served as a Representative to the Commonwealth of Massachusetts General Court. |
Annual Shareholder Report
Name
Birth Date
Positions Held with Trust
Date Service Began | Principal Occupation(s) for Past Five Years,
Other Directorships Held, Previous Position(s) and Qualifications |
Charles F. Mansfield, Jr.
Birth Date: April 10, 1945
Trustee
Indefinite Term
Began serving: January 1999 | Principal Occupations: Director or Trustee of the Federated Fund Family; Management Consultant.
Other Directorships Held: None.
Qualifications: Mr. Mansfield has served as a Marine Corps officer and in several banking, business management, educational roles and directorship positions throughout his long career. He remains active as a Management Consultant. |
Thomas M. O'Neill
Birth Date: June 14, 1951
Trustee
Indefinite Term
Began serving: October 2006 | Principal Occupations: Director or Trustee, Chair of the Audit Committee of the Federated Fund Family; Sole Proprietor, Navigator Management Company (investment and strategic consulting).
Other Directorships Held: None.
Qualifications: Mr. O'Neill has served in several business, mutual fund and financial management roles and directorship positions throughout his career. Mr. O'Neill serves as Director, Medicines for Humanity and Director, The Golisano Children's Museum of Naples, Florida. Mr. O'Neill previously served as Chief Executive Officer and President, Managing Director and Chief Investment Officer, Fleet Investment Advisors; President and Chief Executive Officer, Aeltus Investment Management, Inc.; General Partner, Hellman, Jordan Management Co., Boston, MA; Chief Investment Officer, The Putnam Companies, Boston, MA; Credit Analyst and Lending Officer, Fleet Bank; Director and Consultant, EZE Castle Software (investment order management software); and Director, Midway Pacific (lumber). |
P. Jerome Richey
Birth Date: February 23, 1949
Trustee
Indefinite Term
Began serving: October 2013 | Principal Occupations: Director or Trustee of the Federated Fund Family; Management Consultant; formerly, Senior Vice Chancellor and Chief Legal Officer, University of Pittsburgh and Executive Vice President and Chief Legal Officer, CONSOL Energy Inc.
Other Directorships Held: None.
Qualifications: Mr. Richey has served in several business and legal management roles and directorship positions throughout his career. Mr. Richey most recently held the positions of Senior Vice Chancellor and Chief Legal Officer, University of Pittsburgh. Mr. Richey previously served as Chairman of the Board, Epilepsy Foundation of Western Pennsylvania and Chairman of the Board, World Affairs Council of Pittsburgh. Mr. Richey previously served as Chief Legal Officer and Executive Vice President, CONSOL Energy Inc.; and Board Member, Ethics Counsel and Shareholder, Buchanan Ingersoll & Rooney PC (a law firm). |
Annual Shareholder Report
Name
Birth Date
Positions Held with Trust
Date Service Began | Principal Occupation(s) for Past Five Years,
Other Directorships Held, Previous Position(s) and Qualifications |
John S. Walsh
Birth Date: November 28, 1957
Trustee
Indefinite Term
Began serving: January 1999 | Principal Occupations: Director or Trustee of the Federated Fund Family; President and Director, Heat Wagon, Inc. (manufacturer of construction temporary heaters); President and Director, Manufacturers Products, Inc. (distributor of portable construction heaters); President, Portable Heater Parts, a division of Manufacturers Products, Inc.
Other Directorships Held: None.
Qualifications: Mr. Walsh has served in several business management roles and directorship positions throughout his career. Mr. Walsh previously served as Vice President, Walsh & Kelly, Inc. (paving contractors). |
OFFICERS
Name
Birth Date
Address
Positions Held with Trust
Date Service Began | Principal Occupation(s) for Past Five Years
and Previous Position(s) |
John W. McGonigle
Birth Date: October 26, 1938
EXECUTIVE VICE PRESIDENT AND SECRETARY
Officer since: April 1984 | Principal Occupations: Executive Vice President and Secretary of the Federated Fund Family; Vice Chairman, Executive Vice President, Secretary and Director, Federated Investors, Inc.
Previous Positions: Trustee, Federated Investment Management Company and Federated Investment Counseling; Director, Federated Global Investment Management Corp., Federated Services Company and Federated Securities Corp. |
Lori A. Hensler
Birth Date: January 6, 1967
TREASURER
Officer since: April 2013 | Principal Occupations: Principal Financial Officer and Treasurer of the Federated Fund Family; Senior Vice President, Federated Administrative Services; Financial and Operations Principal for Federated Securities Corp. and Edgewood Services, Inc.; and Assistant Treasurer, Federated Investors Trust Company. Ms. Hensler has received the Certified Public Accountant designation.
Previous Positions: Controller of Federated Investors, Inc.; Senior Vice President and Assistant Treasurer, Federated Investors Management Company; Treasurer, Federated Investors Trust Company; Assistant Treasurer, Federated Administrative Services, Federated Administrative Services, Inc., Federated Securities Corp., Edgewood Services, Inc., Federated Advisory Services Company, Federated Equity Management Company of Pennsylvania, Federated Global Investment Management Corp., Federated Investment Counseling, Federated Investment Management Company, Passport Research, Ltd., and Federated MDTA, LLC; Financial and Operations Principal for Federated Securities Corp., Edgewood Services, Inc. and Southpointe Distribution Services, Inc. |
Annual Shareholder Report
Name
Birth Date
Address
Positions Held with Trust
Date Service Began | Principal Occupation(s) for Past Five Years
and Previous Position(s) |
Peter J. Germain
Birth Date: September 3, 1959
CHIEF LEGAL OFFICER
Officer since: January 2005 | Principal Occupations: Mr. Germain is Chief Legal Officer of the Federated Fund Family. He is General Counsel and Vice President, Federated Investors, Inc.; President, Federated Administrative Services and Federated Administrative Services, Inc.; Vice President, Federated Securities Corp.; Secretary, Federated Private Asset Management, Inc.; and Secretary, Retirement Plan Service Company of America. Mr. Germain joined Federated in 1984 and is a member of the Pennsylvania Bar Association.
Previous Positions: Deputy General Counsel, Special Counsel, Managing Director of Mutual Fund Services, Federated Investors, Inc.; Senior Vice President, Federated Services Company; and Senior Corporate Counsel, Federated Investors, Inc. |
Richard B. Fisher
Birth Date: May 17, 1923
Vice President
Officer since: April 1987 | Principal Occupations: Vice Chairman or Vice President of some of the Funds in the Federated Fund Family; Vice Chairman, Federated Investors, Inc.; Chairman, Federated Securities Corp.
Previous Positions: President and Director or Trustee of some of the Funds in the Federated Fund Family; Executive Vice President, Federated Investors, Inc.; Director and Chief Executive Officer, Federated Securities Corp. |
Stephen Van Meter
Birth Date: June 5, 1975
CHIEF COMPLIANCE OFFICER AND SENIOR VICE PRESIDENT
Officer since: July 2015 | Principal Occupations: Senior Vice President and Chief Compliance Officer of the Federated Fund Family; Vice President and Chief Compliance Officer of Federated Investors, Inc. and Chief Compliance Officer of certain of its subsidiaries. Mr. Van Meter joined Federated in October 2011. He holds FINRA licenses under Series 3, 7, 24 and 66.
Previous Positions: Mr. Van Meter previously held the position of Compliance Operating Officer, Federated Investors, Inc. Prior to joining Federated, Mr. Van Meter served at the United States Securities and Exchange Commission in the positions of Senior Counsel, Office of Chief Counsel, Division of Investment Management and Senior Counsel, Division of Enforcement. |
Stephen F. Auth
Birth Date: September 13, 1956
101 Park Avenue
41st Floor
New York, NY 10178
CHIEF INVESTMENT OFFICER
Officer since: November 2002 | Principal Occupations: Stephen F. Auth is Chief Investment Officer of various Funds in the Federated Fund Family; Executive Vice President, Federated Investment Counseling, Federated Global Investment Management Corp. and Federated Equity Management Company of Pennsylvania.
Previous Positions: Executive Vice President, Federated Investment Management Company and Passport Research, Ltd. (investment advisory subsidiary of Federated); Senior Vice President, Global Portfolio Management Services Division; Senior Vice President, Federated Investment Management Company and Passport Research, Ltd.; Senior Managing Director and Portfolio Manager, Prudential Investments. |
Annual Shareholder Report
Evaluation and Approval of Advisory Contract–May 2016
Federated International Strategic Value Dividend Fund (the “Fund”)
Following a review and recommendation of approval by the Fund's independent trustees, the Fund's Board of Trustees (the “Board”) reviewed and unanimously approved at its May 2016 meetings the continuation of the Fund's investment advisory contract for an additional one-year term. The Board's decision regarding the contract reflects the exercise of its business judgment after consideration of all of the information received on whether to continue the existing arrangements.
The Board had previously appointed a Senior Officer, whose duties include specified responsibilities relating to the process by which advisory fees are to be charged to a Federated fund. The Senior Officer has the authority to retain consultants, experts, or staff as may be reasonably necessary to assist in the performance of his duties, reports directly to the Board, and may be terminated only with the approval of a majority of the independent members of the Board. The Senior Officer prepared and furnished to the Board an independent, written evaluation that covered topics discussed below (the “Senior Officer's Evaluation”). The Board considered the Senior Officer's Evaluation, along with other information, in deciding to approve the investment advisory contract.
The Board is also familiar with and considered judicial decisions concerning allegedly excessive investment advisory fees, which have indicated that the following factors may be relevant to an adviser's fiduciary duty with respect to its receipt of compensation from a fund: the nature and quality of the services provided by an adviser to a fund and its shareholders, including the performance and fees and expenses of the fund and of comparable funds; an adviser's cost of providing the services, including the profitability to an adviser of providing advisory services to a fund; the extent to which an adviser may realize “economies of scale” as a fund grows larger and, if such economies of scale exist, whether they have been shared with a fund and its shareholders or the family of funds; any “fall-out financial benefits” that accrue to an adviser because of its relationship with a fund (including research services received from brokers that execute fund trades and any fees paid to affiliates of an adviser for services rendered to a fund); comparative fee and expense structures, including a comparison of fees paid to an adviser with those paid by similar funds; and the extent of care, conscientiousness and independence with which board members perform their duties and their expertise, including whether they are fully informed about all facts the board deems relevant to its consideration of an adviser's services and fees. The Board noted that the Securities and Exchange Commission (“SEC”) disclosure requirements regarding the basis for the Board's approval of the Fund's investment advisory contract generally track the factors listed above. Consistent with these judicial decisions and SEC disclosure
Annual Shareholder Report
requirements, the Board also considered management fees charged to institutional and other clients of Federated Equity Management Company of Pennsylvania (the “Adviser”) for what might be viewed as like services. The Board was aware of these factors and was guided by them in its review of the Fund's investment advisory contract to the extent it considered them to be appropriate and relevant, as discussed further below.
The Board considered and weighed these circumstances in light of its substantial accumulated experience in governing the Fund and working with Federated Investors, Inc. and its affiliates (“Federated”) on matters relating to the Federated funds, and was assisted in its deliberations by independent legal counsel. Throughout the year, and in connection with its May meetings, the Board requested and received substantial and detailed information about the Fund and the Federated organization that was in addition to the extensive materials that comprise and accompany the Senior Officer's Evaluation. Federated provided much of this information at each regular meeting of the Board, and furnished additional substantial information in connection with the May meetings at which the Board's formal review of the investment advisory contract occurred. At the May meetings in addition to meeting in separate sessions of the independent trustees without management present, senior management of the Adviser also met with the independent trustees and their counsel to discuss the materials presented and any other matters thought relevant by the Adviser or the trustees. Between regularly scheduled meetings, the Board also received information on particular matters as the need arose. Thus, the Board's consideration of the investment advisory contract included review of the Senior Officer's Evaluation, accompanying data and additional information covering such matters as: the Adviser's investment philosophy, revenue, profitability, personnel and processes; investment and operating strategies; the Fund's short- and long-term performance (in absolute terms, both on a gross basis and net of expenses, as well as in relationship to its particular investment program and certain competitor or “peer group” funds and/or other benchmarks, as appropriate), and comments on the reasons for performance; the Fund's investment objectives; the Fund's expenses (including the advisory fee itself and the overall expense structure of the Fund, both in absolute terms and relative to similar and/or competing funds, with due regard for contractual or voluntary expense limitations); the use and allocation of brokerage commissions derived from trading the Fund's portfolio securities (if any); and the nature, quality and extent of the advisory and other services provided to the Fund by the Adviser and its affiliates. The Board also considered the preferences and expectations of Fund shareholders; the entrepreneurial risk assumed by the Adviser in sponsoring the Fund; the continuing state of competition in the mutual fund industry and market practices; the range of comparable fees for similar funds in the mutual fund industry; the Fund's relationship to the Federated funds which include a comprehensive array of funds with different investment objectives, policies and strategies which are generally available for
Annual Shareholder Report
exchange without the incurrence of additional sales charges; compliance and audit reports concerning the Federated funds and the Federated companies that service them (including communications from regulatory agencies), as well as Federated's responses to any issues raised therein; and relevant developments in the mutual fund industry and how the Federated funds and/or Federated are responding to them. The Board's evaluation process is evolutionary. The criteria considered and the emphasis placed on relevant criteria change in recognition of changing circumstances in the mutual fund marketplace.
While mindful that courts have cautioned against giving such comparisons too much weight, the Board has found the use of comparisons of the Fund's fees and expenses to other mutual funds with comparable investment programs to be relevant to its deliberations. In this regard, the Board was presented with, and considered, information regarding the contractual advisory fee rates, net advisory fee rates, total expense ratios and each element of the Fund's total expense ratio (i.e., gross and net advisory fees, custody fees, portfolio accounting fees and transfer agency fees) relative to the Fund's peers. The Board focused on comparisons with other similar mutual funds more heavily than non-mutual fund products or services because it is believed that they are more relevant. For example, other mutual funds are the products most like the Fund, they are readily available to Fund shareholders as alternative investment vehicles, and they are the type of investment vehicle in fact chosen and maintained by the Fund's investors. The range of their fees and expenses therefore appears to be a relevant indicator of what consumers have found to be reasonable in the precise marketplace in which the Fund competes.
The Board reviewed the contractual advisory fee rate, net advisory fee rate where partially waived and other expenses of the Fund and noted the position of the Fund's fee rates relative to its peers. In this regard, the Board noted that the contractual advisory fee rate was below the median of the relevant peer group and the Board was satisfied that the overall expense structure of the Fund remained competitive.
By contrast, the Senior Officer has reviewed Federated's fees for providing advisory services to products outside the Federated funds (e.g., institutional and separate accounts and sub-adviser services). He concluded that mutual funds and institutional accounts are inherently different products. Those differences include, but are not limited to, different types of targeted investors; being subject to different laws and regulations; different legal structures; different average account sizes and portfolio management techniques made necessary by different cash flows and different associated costs; and the time spent by portfolio managers and their teams, funds financial services, legal, compliance and risk management in reviewing securities pricing, addressing different administrative responsibilities, addressing different degrees of risk associated with management and a variety of different costs. The Senior Officer did not consider the fees for providing advisory services to these outside products to be determinative in judging the appropriateness of mutual fund advisory fees.
Annual Shareholder Report
The Senior Officer noted that the services, administrative responsibilities and risks associated with such relationships are quite different than serving as a primary adviser to a fund.
Following such evaluation, the Board concluded, within the context of its full deliberations, that the expenses of the Fund are reasonable and supported renewal of the investment advisory contract with respect to the Fund.
The Board considered the nature, extent and quality of the services provided to the Fund by the Adviser and the resources of the Adviser and its affiliates dedicated to the Fund. In this regard, the Board evaluated, among other things, the Adviser's personnel, experience, track record, overall reputation and willingness to invest in personnel and infrastructure that benefit the Fund. In addition, the Board reviewed the qualifications, backgrounds and responsibilities of the portfolio management team primarily responsible for the day-to-day management of the Fund. The Board noted the compliance programs of and the compliance-related resources provided to the Fund by the Adviser. The Fund's ability to deliver competitive performance when compared to its peer group was also deemed to be relevant by the Board as a useful indicator of how the Adviser is executing the Fund's investment program, which in turn was one of the Board's considerations in reaching a conclusion that the nature, extent, and quality of the Adviser's investment management services were such as to warrant continuation of the investment advisory contract.
In evaluating the Fund's investment performance, the Board considered performance results in light of the Fund's investment objective, strategies and risks, as disclosed in the Fund's prospectus. The Board particularly considered detailed investment reports on the Fund's performance provided to the Board throughout the year and in connection with the May meetings. The Senior Officer also reviewed information compiled by Federated, using data supplied by independent fund ranking organizations, regarding the performance of, and fees charged by, other mutual funds, noting his view that comparisons to fund peer groups may be helpful, though not conclusive, in judging the reasonableness of the proposed fees. The Board considered, in evaluating such comparisons, that in some cases individual funds may exhibit significant and unique differences in their objectives and management techniques when compared to other funds within an industry peer group.
For the periods covered by the Senior Officer's Evaluation, the Fund's performance for the five-year period was above the median of the relevant peer group, and the Fund's performance fell below the median of the relevant peer group for the one-year and three-year periods. The Board discussed the Fund's performance with the Adviser and recognized the efforts being taken by the Adviser in the context of the other factors considered relevant by the Board.
Following such evaluation, the Board concluded, within the context of its full deliberations, that the performance of the Fund supported renewal of the investment advisory contract with respect to the Fund.
Annual Shareholder Report
The Board also received financial information about Federated, including information regarding the compensation and ancillary (or “fall-out”) benefits Federated derived from its relationships with the Federated funds. This information covered not only the fees under the investment advisory contracts, but also fees received by Federated's subsidiaries for providing other services to the Federated funds under separate contracts (e.g., for serving as the Federated funds' administrator). The information also detailed any indirect benefit Federated may derive from its receipt of research services from brokers who execute Federated fund trades. In addition, the Board considered the fact that, in order for a fund to be competitive in the marketplace, Federated and its affiliates frequently waived fees and/or reimbursed expenses and have disclosed to fund investors and/or indicated to the Board their intention to do so in the future, where appropriate. Moreover, the Board receives regular reporting as to the institution, adjustment or elimination of these voluntary waivers. The Board considered Federated's previous reductions in contractual management fees to certain funds in response to the Senior Officer's recommendations.
Federated furnished information, requested by the Senior Officer, that reported revenues on a fund-by-fund basis and made estimates of the allocation of expenses on a fund-by-fund basis, using allocation methodologies specified by the Senior Officer. The Senior Officer noted that, while these cost allocation reports apply consistent allocation processes, the inherent difficulties in allocating costs continues to cause the Senior Officer to question the precision of the process and to conclude that such reports may be unreliable, since a single change in an allocation estimate may dramatically alter the resulting estimate of cost and/or profitability of a fund and may produce unintended consequences. The allocation information, including the Senior Officer's view that fund-by-fund estimations may be unreliable, was considered in the analysis by the Board.
The Board and the Senior Officer also reviewed information compiled by Federated comparing profitability information for Federated to other publicly held fund management companies. In this regard, the Senior Officer concluded that Federated's profit margins did not appear to be excessive. The Senior Officer also noted that Federated appeared financially sound, with the resources to fulfill its obligations under its contracts with the Fund.
The Senior Officer's Evaluation also discussed the notion of possible realization of “economies of scale” as a fund grows larger. The Board considered in this regard that the Adviser has made significant and long-term investments in areas that support all of the Federated funds, such as personnel and processes for the portfolio management, shareholder services, compliance, internal audit, and risk management functions, as well as systems technology (including technology relating to cybersecurity), and that the benefits of these efforts (as well as any economies of scale, should they exist) were likely to be enjoyed by the fund family as a whole. The Board noted that the Adviser's investments in these areas are extensive. In addition, the Board considered that Federated and its affiliates have frequently waived fees and/or reimbursed expenses and that this has
Annual Shareholder Report
allowed fund shareholders to share potential economies of scale from a fund's inception. Federated, as it does throughout the year, and again in connection with the Board's review, furnished information relative to revenue sharing or adviser paid fees. Federated and the Senior Officer noted that this information should be viewed to determine if there was an incentive to either not apply breakpoints or to apply breakpoints at higher levels and should not be viewed to determine the appropriateness of advisory fees, because it would represent marketing and distribution expenses. Finally, the Board also noted the absence of any applicable regulatory or industry guidelines on this subject, which (as discussed in the Senior Officer's Evaluation) is compounded by the lack of any common industry practice or general pattern with respect to structuring fund advisory fees with “breakpoints” that serve to reduce the fee as a fund attains a certain size.
The Senior Officer noted that, subject to the comments and recommendations made within the Senior Officer's Evaluation, his observations and the information accompanying the Senior Officer's Evaluation supported a finding by the Board that the management fee for the fund was reasonable. Under these circumstances, no changes were recommended to, and no objection was raised to, the continuation of the Fund's investment advisory contract.
In its decision to continue an existing investment advisory contract, the Board was mindful of the potential disruptions of the Fund's operations and various risks, uncertainties and other effects that could occur as a result of a decision to terminate or not renew an investment advisory contract. In particular, the Board recognized that many shareholders have invested in the Fund on the strength of the Adviser's industry standing and reputation and with the expectation that the Adviser will have a continuing role in providing advisory services to the Fund. Thus, the Board's approval of the investment advisory contract reflected the fact that it is the shareholders who have effectively selected the Adviser by virtue of having invested in the Fund. The Board concluded that, in light of the factors discussed above, including the nature, quality and scope of the services provided to the Fund by the Adviser and its affiliates, continuation of the investment advisory contract was appropriate.
The Board based its decision to approve the investment advisory contract on the totality of the circumstances and relevant factors and with a view to past and future long-term considerations. Not all of the factors and considerations identified above were necessarily relevant to the Fund, nor did the Board consider any one of them to be determinative. With respect to the factors that were relevant, the Board's decision to approve the continuation of the contract reflects its determination that Federated's performance and actions provided a satisfactory basis to support the decision to continue the existing arrangement.
Annual Shareholder Report
Voting Proxies on Fund Portfolio Securities
A description of the policies and procedures that the Fund uses to determine how to vote proxies, if any, relating to securities held in the Fund's portfolio is available, without charge and upon request, by calling 1-800-341-7400. A report on “Form N-PX” of how the Fund voted any such proxies during the most recent 12-month period ended June 30 is available via the Proxy Voting Record (Form N-PX) link associated with the Fund and share class name at www.FederatedInvestors.com/FundInformation. Form N-PX filings are also available at the SEC's website at www.sec.gov.
Quarterly Portfolio Schedule
The Fund files with the SEC a complete schedule of its portfolio holdings, as of the close of the first and third quarters of its fiscal year, on “Form N-Q.” These filings are available on the SEC's website at www.sec.gov and may be reviewed and copied at the SEC's Public Reference Room in Washington, DC. (Call 1-800-SEC-0330 for information on the operation of the Public Reference Room.) You may also access this information via the link to the Fund and share class name at www.FederatedInvestors.com/FundInformation.
Annual Shareholder Report
Mutual funds are not bank deposits or obligations, are not guaranteed by any bank and are not insured or guaranteed by the U.S. government, the Federal Deposit Insurance Corporation, the Federal Reserve Board or any other government agency. Investment in mutual funds involves investment risk, including the possible loss of principal.
This Report is authorized for distribution to prospective investors only when preceded or accompanied by the Fund's Prospectus, which contains facts concerning its objective and policies, management fees, expenses and other information.
Federated International Strategic Value Dividend Fund
Federated Investors Funds
4000 Ericsson Drive
Warrendale, PA 15086-7561
Contact us at FederatedInvestors.com
or call 1-800-341-7400.
Federated Securities Corp., Distributor
CUSIP 314172388
CUSIP 314172370
CUSIP 314172362
39834 (1/17)
Federated is a registered trademark of Federated Investors, Inc.
2017 ©Federated Investors, Inc.
Annual Shareholder Report
November 30, 2016
| Share Class | Ticker |
| A | FVOAX |
| C | FVOCX |
| Institutional | FVOIX |
Federated Managed Volatility Fund
Fund Established 2014
A Portfolio of Federated Equity Funds
Dear Valued Shareholder,
I am pleased to present the Annual Shareholder Report for your fund covering the period from December 1, 2015 through November 30, 2016. This report includes Management's Discussion of Fund Performance, a complete listing of your fund's holdings, performance information and financial statements along with other important fund information.
In addition, our website, FederatedInvestors.com, offers easy access to Federated resources that include timely fund updates, economic and market insights from our investment strategists, and financial planning tools. We invite you to register to take full advantage of its capabilities.
Thank you for investing with Federated. I hope you find this information useful and look forward to keeping you informed.
Sincerely,
J. Christopher Donahue, President
Not FDIC Insured • May Lose Value • No Bank Guarantee
CONTENTS
| 1 |
| 7 |
| 9 |
| 15 |
| 18 |
| 20 |
| 22 |
| 23 |
| 37 |
| 38 |
| 40 |
| 46 |
| 53 |
| 53 |
Management's Discussion of Fund Performance (unaudited)
The total return of Federated Managed Volatility Fund (the “Fund”), based on net asset value for 12-month reporting period ending November 30, 2016, was 1.69% for the Class A Shares, 0.83% for the Class C Shares and 1.84% for the Institutional Shares. The total returns of the Russell 1000® Value Index (R1000V), the Bloomberg Barclays Emerging Markets USD Aggregate Index (BBEMAI), the Bloomberg Barclays US Corporate High Yield 2% Issuer Capped Index (BBHY2%ICI) and the Bloomberg Barclays Mortgage-Backed Securities Index (BBMB) were 12.02%, 7.12%, 12.11% and 1.64%, respectively. Weighting these benchmarks (40% R1000V, 20% BBEMAI, 20% BBHY2%ICI and 20% BBMB), the total return of the blended benchmark (Blended Index)1,2 was 9.08%. The Morningstar Tactical Allocation Funds Average (MTAFA)3 had a total return of 2.67% for the same period. The Fund's and the MTAFA's total returns reflected actual cash flows, transaction costs and other expenses, which were not reflected in the total return of the Blended Index.
During this period, the Fund's investment strategy was most affected by: (a) the security selection within the equity sleeve; and (b) the Fund's tactical volatility4 overlay.
The following discussion will focus on the performance of the Fund's Institutional Shares.
MARKET OVERVIEW
The reporting period was best categorized as an oscillating market environment caused by multiple macro-economic headlines. The most notable was a response to the increase in the Federal Reserve's target interest rate hike, which caused the S&P 500 to decline -11.75% from December 29, 2015 through February 11, 2016. Despite the rate-hike, U.S. 10-Year yields5 only marginally increased during the reporting period, boosting bond returns and favoring longer-duration6 bonds. U.S. equities continued to outperform those of the rest of the world, with value stocks strongly outperforming growth stocks, as illustrated by the 12.02% return of the R1000V versus the 4.22% return of the Russell 1000® Growth Index (R1000G)7 over the reporting period.
Annual Shareholder Report
Market volatility declined during the reporting period, with the Chicago Board Options Exchange (CBOE) Volatility Index (VIX),8 a measure of implied forward volatility of the S&P 500, moving from 16.13 to 13.33. This slight drop in the VIX belied the large swings of volatility during the year, with rate fears escalating in early 2016, the U.K.'s vote to exit the EU (“Brexit”) in June 2016, and election concerns in early November. In the first instance, the closing VIX peaked at 28.14 on February 11, 2016, before dropping down as low as 13.10 on April 1, 2016; another peak occurred in June at 25.76, following the Brexit referendum; finally, election concerns caused the VIX to spike to 22.51 on November 4.
Volatility Overlay
For the reporting period, the volatility targeting overlay was the primary detractor from Fund performance. The Fund uses an S&P 500 futures and options9 overlay to manage the Fund's volatility to a 10% target, increasing volatility in calm markets and decreasing volatility in turbulent markets. The Fund's annualized daily volatility over the reporting period was 8.8%, slightly below the targeted 10% volatility.
Due to the high market volatility in the beginning of the month of December 2015, the Fund began the reporting period with virtually only a slight long futures overlay. As the reporting period progressed, the large drawdown in the first quarter caused the Fund to implement a short futures overlay in February 2016. Eventually, calm market conditions emerged and the overlay slowly increased in order to keep the projected annualized volatility of the Fund within its 8% to 12% range. However, in June, market volatility spiked and the overlay was quickly reduced to lower projected Fund volatility. Market exposure was increased in both July and August as extreme market returns dissipated; but, nevertheless, the Fund did not participate fully in the quick market rebound.
Equity Security selection
The equity portfolio is composed of higher income value stocks. Value stocks outperformed growth stocks during the reporting period, as discussed above in the Market Overview section. However, underperformance in security selection, particularly in the Energy and Health Care Sectors, caused stock selection to negatively affect Fund performance for the reporting period.
Annual Shareholder Report
| 1 | Please see the footnotes to the line graphs under “Fund Performance and Growth of a $10,000 Investment” below for the definition of, and more information about, the Blended Index. |
| 2 | The Fund's broad-based securities market index is the S&P 500 Index (S&P 500). Please see the footnotes to the line graphs under “Fund Performance and Growth of a $10,000 Investment” below for the definition of, and more information about, the S&P 500. The S&P 500's return for the reporting period was 8.06%. The Blended Index is being used for comparison purposes because, although it is not the Fund's broad-based securities market index, the Fund's Adviser believes it more closely reflects the market sectors in which the Fund invests. |
| 3 | Please see the footnotes to the line graphs under “Fund Performance and Growth of a $10,000 Investment” below for the definition of, and more information about, the MTAFA. |
| 4 | Volatility is a statistical measurement of the frequency and level of changes in the value of an asset, index or instrument without regard to the direction of those changes. Volatility may result from rapid and dramatic price swings. There can be no guarantee that the Fund will maintain its target annualized volatility. Furthermore, while the volatility management portion of the strategy seeks enhanced returns with more consistent volatility levels over time, attaining and maintaining the target volatility does not ensure that the Fund will deliver enhanced returns. |
| 5 | Bond prices are sensitive to changes in interest rates, and a rise in interest rates can cause a decline in their prices. |
| 6 | Duration is a measure of a security's price sensitivity to changes in interest rates. Securities with longer durations are more sensitive to changes in interest rates than securities of shorter durations. |
| 7 | The Russell 1000® Growth Index measures the performance of the large-cap growth segment of the U.S. equity universe. It includes those Russell 1000® Index companies with higher price-to-book ratios and higher forecasted growth values.* |
| 8 | The CBOE Volatility Index (VIX) is a key measure of market expectations of near-term volatility conveyed by S&P 500 stock index option prices.* |
| 9 | The Fund's use of derivative instruments involves risks different from, or possibly greater than, the risks associated with investing directly in securities and other traditional instruments. |
| * | The index is unmanaged, and it is not possible to invest directly in an index. |
Annual Shareholder Report
FUND PERFORMANCE AND GROWTH OF A $10,000 INVESTMENT
The graph below illustrates the hypothetical investment of $10,0001 in the Federated Managed Volatility Fund (the “Fund”) from December 15, 2014 (start of performance) to November 30, 2016, compared to the Standard & Poor's Index (S&P 500),2 40% Russell 1000® Value Index (R1000V)/20%, Bloomberg Barclays Emerging Markets USD Aggregate Index (BBEMAI)/20%, Bloomberg Barclays U.S. Corporate High Yield 2% Issuer Capped Index (BBHY2%ICI)/20%, Bloomberg Barclays U.S. Mortgage Backed Securities Index (BBMB) (the “Blended Index”)2,3 and Morningstar Tactical Allocation Funds Average (MTAFA).4 The Average Annual Total Return table below shows returns for each class averaged over the stated periods.
Growth of a $10,000 InvestmenT
Growth of $10,000 as of November 30, 2016

| Federated Managed Volatility Fund - | Institutional Shares | Class A Shares | S&P 500 | Blended Index | MTAFA |
| F | F | I | I | I |
| 12/15/2014 | 10,000 | 9,450 | 10,000 | 10,000 | 10,000 |
| 2/28/2015 | 10,474 | 9,898 | 10,622 | 10388 | 10452 |
| 5/31/2015 | 10,531 | 9,949 | 10,690 | 10499 | 10441 |
| 8/31/2015 | 9,640 | 9,103 | 10,057 | 10053 | 9790 |
| 11/30/2015 | 9,698 | 9,152 | 10,667 | 10234 | 9801 |
| 2/29/2016 | 9,097 | 8,588 | 9,965 | 9897 | 9382 |
| 5/31/2016 | 9,563 | 9,022 | 10,874 | 10625 | 9824 |
| 8/31/2016 | 9,725 | 9,169 | 11,320 | 11092 | 10146 |
| 11/30/2016 | 9,877 | 9,306 | 11,527 | 11164 | 10070 |
41 graphic description end -->
| ■ | Total returns shown for the Class A Shares include the maximum sales charge of 5.50% ($10,000 investment minus $550 sales charge = $9,450). |
The Fund offers multiple share classes whose performance may be greater than or less than its other share class(es) due to differences in sales charges and expenses. See the Average Annual Total Return table below for the returns of additional classes not shown in the line graph above.
Annual Shareholder Report
Average Annual Total Returns for the Period Ended 11/30/2016
(returns reflect all applicable sales charges and contingent sales charges as specified below in footnote #1)
| | 1 Year | Start of
Performance* |
| Class A Shares | -3.87% | -3.59% |
| Class C Shares | -0.15% | -1.46% |
| Institutional Shares | 1.84% | -0.63% |
| S&P 500 | 8.06% | 7.52% |
| Blended Index | 9.08% | 5.78% |
| MTAFA | 2.67% | 0.37% |
| * | The Fund's start of performance date was December 15, 2014. |
| | |
Performance data quoted represents past performance which is no guarantee of future results. Investment return and principal value will fluctuate so that an investor's shares, when redeemed, may be worth more or less than their original cost. Mutual fund performance changes over time and current performance may be lower or higher than what is stated. For current to the most recent month-end performance and after-tax returns, visit FederatedInvestors.com or call 1-800-341-7400. Returns shown do not reflect the deduction of taxes that a shareholder would pay on Fund distributions or the redemption of Fund shares. Mutual funds are not obligations of or guaranteed by any bank and are not federally insured.
Annual Shareholder Report
| 1 | Represents a hypothetical investment of $10,000 in the Fund after deducting applicable sales charges: for Class A Shares, the maximum sales charge of 5.50% ($10,000 investment minus $550 sales charge = $9,450); for Class C Shares, a 1.00% contingent deferred sales charge would be applied on any redemption less than one year from the purchase date. The Fund's performance assumes the reinvestment of all dividends and distributions. The S&P 500, Blended Index and MTAFA have been adjusted to reflect reinvestment of dividends on securities in the indexes. |
| 2 | The S&P 500 and Blended Index are not adjusted to reflect sales loads, expenses or other fees that the Securities and Exchange Commission requires to be reflected in the Fund's performance. The indexes are unmanaged and, unlike the Fund, are not affected by cash flows. It is not possible to invest directly in an index. |
| 3 | The S&P 500 is a capitalization-weighted index of 500 stocks designed to measure performance of the broad domestic economy through changes in the aggregate market value of 500 stocks representing all major industries. The R1000V measures the performance of the large-cap value segment of the U.S. equity universe. It includes those Russell 1000® Index companies with lower price-to-book ratios and lower expected growth values. The R1000V is constructed to provide a comprehensive and unbiased barometer for the large-cap value segment. The R1000V is completely reconstituted annually to ensure new and growing equities are included and that the represented companies continue to reflect value characteristics. The BBEMAI tracks total returns for external-currency-denominated debt instruments of the emerging markets. The BBHY2%ICI is an issuer-constrained version of the Bloomberg Barclays U.S. Corporate High-Yield Index that measures the market of USD-denominated, noninvestment-grade, fixed-rate, taxable corporate bonds. The index follows the same rules as the uncapped index but limits the exposure of each issuer to 2% of the total market value and redistributes any excess market value index-wide on a pro-rata basis. The BBMB covers agency mortgage-backed pass-through securities (both fixed-rate and hybrid ARM) issued by Ginnie Mae (GNMA), Fannie Mae (FNMA) and Freddie Mac (FHLMC). Effective August 24, 2016, the names of the “Bloomberg Barclays” indexes discussed above changed from “Barclays.” |
| 4 | Morningstar figures represent the average of the total returns reported by all the funds designated by Morningstar as falling into the respective category indicated. They do not reflect sales charges. The Morningstar figures in the Growth of $10,000 line graph are based on historical return information published by Morningstar and reflect the return of the funds comprising the category in the year of publication. Because the funds designated by Morningstar as falling into the category can change over time, the Morningstar figures in the line graph may not match the Morningstar figures in the Average Annual Total Returns table, which reflect the return of the funds that currently comprise the category. |
Annual Shareholder Report
Portfolio of Investments Summary Table (unaudited)
At November 30, 2016, the Fund's portfolio composition1 was as follows:
| Security Type | Percentage of
Total Net Assets |
| Domestic Equity Securities | 32.4% |
| Non-Agency Mortgage-Backed Securities | 19.2% |
| Domestic Fixed-Income Securities | 13.6% |
| International Fixed-Income Securities | 10.5% |
| Foreign Governments/Agencies | 4.5% |
| International Equity Securities | 3.8% |
| U.S. Government Agency Mortgage-Backed Securities | 3.4% |
| Asset-Backed Securities | 2.4% |
| Derivative Contracts2 | 1.0% |
| U.S. Treasury | 0.6% |
| Other Security Type3 | 0.4% |
| Cash Equivalents4 | 12.0% |
| Other Assets and Liabilities—Net5 | (3.8)% |
| TOTAL | 100.0% |
| 1 | See the Fund's Prospectus for a description of the principal types of securities in which the Fund invests. As of the date specified above, the Fund owned shares of one or more affiliated investment companies. For purposes of this table, the affiliated investment company (other than an affiliated money market mutual fund) is not treated as a single portfolio security, but rather the Fund is treated as owning a pro rata portion of each security and each other asset and liability owned by the affiliated investment company. Accordingly, the percentages of total net assets shown in the table will differ from those presented on the Portfolio of Investments. |
| 2 | Based upon net unrealized appreciation (depreciation) or value of the derivative contracts as applicable. Derivative contracts may consist of futures, forwards, options and swaps. The impact of a derivative contract on the Fund's performance may be larger than its unrealized appreciation (depreciation) or value may indicate. In many cases, the notional value or amount of a derivative contract may provide a better indication of the contract's significance to the portfolio. More complete information regarding the Fund's direct investments in derivative contracts, including unrealized appreciation (depreciation), value, and notional values or amounts of such contracts, can be found in the table at the end of the Portfolio of Investments included in this Report. |
| 3 | Other Security Type consists of option contracts. |
| 4 | Cash Equivalents include any investments in money market mutual funds and/or overnight repurchase agreements. |
| 5 | Assets, other than investments in securities and derivative contracts, less liabilities. See Statement of Assets and Liabilities. |
Annual Shareholder Report
At November 30, 2016, the Fund's sector composition6 for its equity securities was as follows:
| Sector Composition | Percentage of
Equity Securities |
| Financials | 25.3% |
| Health Care | 12.5% |
| Information Technology | 11.7% |
| Energy | 11.4% |
| Industrials | 11.0% |
| Consumer Staples | 7.1% |
| Consumer Discretionary | 6.6% |
| Utilities | 4.4% |
| Telecommunication Services | 4.3% |
| Real Estate | 3.0% |
| Materials | 2.7% |
| TOTAL | 100.0% |
| 6 | Sector classifications are based upon, and individual portfolio securities are assigned to, the classifications of the Global Industry Classification Standard (GICS) except that the Adviser assigns a classification to securities not classified by the GICS and to securities for which the Adviser does not have access to the classification made by the GICS. |
Annual Shareholder Report
Portfolio of Investments
November 30, 2016
Shares or
Contracts | | | Value |
| | | COMMON STOCKS—36.2% | |
| | | Consumer Discretionary—2.4% | |
| 598 | | American Eagle Outfitters, Inc. | $9,903 |
| 211 | | Brinker International, Inc. | 11,206 |
| 957 | | Ford Motor Co. | 11,446 |
| 334 | | Goodyear Tire & Rubber Co. | 10,250 |
| 126 | | Home Depot, Inc. | 16,304 |
| 367 | | Honda Motor Co. Ltd., ADR | 10,915 |
| 94 | | McDonald's Corp. | 11,211 |
| 467 | | Regal Entertainment Group | 10,699 |
| 293 | | TJX Cos., Inc. | 22,954 |
| 135 | | Time Warner, Inc. | 12,396 |
| 406 | | Twenty-First Century Fox, Inc. | 11,413 |
| | | TOTAL | 138,697 |
| | | Consumer Staples—2.6% | |
| 168 | | Altria Group, Inc. | 10,740 |
| 152 | | CVS Health Corp. | 11,687 |
| 164 | | Colgate-Palmolive Co. | 10,698 |
| 549 | | ConAgra Foods, Inc. | 20,143 |
| 396 | | Energizer Holdings, Inc. | 17,769 |
| 123 | | Ingredion, Inc. | 14,438 |
| 136 | | Kraft Heinz Co./The | 11,104 |
| 261 | | Smucker (J.M.) Co. | 32,873 |
| 298 | | Wal-Mart Stores, Inc. | 20,988 |
| | | TOTAL | 150,440 |
| | | Energy—4.1% | |
| 179 | | Apache Corp. | 11,805 |
| 295 | | BP PLC, ADR | 10,328 |
| 623 | | Baker Hughes, Inc. | 40,078 |
| 92 | | Chevron Corp. | 10,264 |
| 221 | | Conocophllips | 10,723 |
| 377 | | ENI S.p.A., ADR | 10,522 |
| 356 | | EOG Resources, Inc. | 36,497 |
| 118 | | Exxon Mobil Corp. | 10,301 |
| 1,183 | | Ensco PLC | 11,428 |
| 864 | | Frank's International N.V. | 10,878 |
Annual Shareholder Report
Shares or
Contracts | | | Value |
| | | COMMON STOCKS—continued | |
| | | Energy—continued | |
| 251 | | Helmerich & Payne, Inc. | $18,988 |
| 799 | | Nabors Industries Ltd. | 12,864 |
| 437 | | Oceaneering International, Inc. | 11,646 |
| 139 | | Schlumberger Ltd. | 11,683 |
| 138 | | Tesoro Petroleum Corp. | 11,226 |
| 177 | | Valero Energy Corp. | 10,896 |
| | | TOTAL | 240,127 |
| | | Financials—9.1% | |
| 387 | | Aflac, Inc. | 27,624 |
| 483 | | Allstate Corp. | 33,772 |
| 180 | | American Express Co. | 12,967 |
| 587 | | BB&T Corp. | 26,562 |
| 1,666 | | Bank of America Corp. | 35,186 |
| 668 | | Citigroup, Inc. | 37,669 |
| 474 | | Discover Financial Services | 32,123 |
| 440 | | East West Bancorp, Inc. | 21,067 |
| 101 | | Goldman Sachs Group, Inc. | 22,148 |
| 257 | | Hartford Financial Services Group, Inc. | 12,110 |
| 549 | | JPMorgan Chase & Co. | 44,013 |
| 366 | | Lazard Ltd., Class A | 14,219 |
| 504 | | MetLife, Inc. | 27,725 |
| 871 | | Morgan Stanley | 36,025 |
| 1,139 | | Old Republic International Corp. | 20,354 |
| 296 | | PNC Financial Services Group | 32,720 |
| 688 | | Sun Life Financial Services of Canada | 26,419 |
| 417 | | The Bank of New York Mellon Corp. | 19,774 |
| 201 | | The Travelers Cos, Inc. | 22,783 |
| 260 | | U.S. Bancorp | 12,901 |
| 358 | | Zions Bancorporation | 14,245 |
| | | TOTAL | 532,406 |
| | | Health Care—4.5% | |
| 140 | | Amgen, Inc. | 20,170 |
| 284 | | Abbott Laboratories | 10,812 |
| 277 | | AbbVie Inc. | 16,842 |
| 98 | | Aetna, Inc. | 12,822 |
| 71 | | Allergan PLC | 13,795 |
| 90 | | Anthem, Inc. | 12,828 |
| 480 | | Baxter International, Inc. | 21,298 |
Annual Shareholder Report
Shares or
Contracts | | | Value |
| | | COMMON STOCKS—continued | |
| | | Health Care—continued | |
| 298 | | Bristol-Myers Squibb Co. | $16,819 |
| 529 | | GlaxoSmithKline PLC, ADR | 19,991 |
| 241 | | Gilead Sciences, Inc. | 17,762 |
| 242 | | Johnson & Johnson | 26,934 |
| 688 | | Merck & Co., Inc. | 42,099 |
| 495 | | Teva Pharmaceutical Industries, Ltd., ADR | 18,661 |
| 75 | | UnitedHealth Group, Inc. | 11,874 |
| | | TOTAL | 262,707 |
| | | Industrials—4.0% | |
| 243 | | Alaska Air Group, Inc. | 19,992 |
| 358 | | Apogee Enterprises, Inc. | 17,076 |
| 271 | | Delta Air Lines, Inc. | 13,057 |
| 248 | | Eaton Corp. PLC | 16,494 |
| 68 | | General Dynamics Corp. | 11,924 |
| 138 | | Huntington Ingalls Industries, Inc. | 24,669 |
| 237 | | Ingersoll-Rand PLC | 17,666 |
| 231 | 1 | Johnson Controls International PLC | 10,390 |
| 70 | | L-3 Communications Holdings, Inc. | 11,044 |
| 150 | | Manpower Group, Inc. | 12,811 |
| 310 | | Masco Corp. | 9,811 |
| 52 | | Northrop Grumman Corp. | 12,982 |
| 128 | | Parker-Hannifin Corp. | 17,783 |
| 286 | | Robert Half International, Inc. | 12,833 |
| 105 | | United Technologies Corp. | 11,311 |
| 167 | | Waste Management, Inc. | 11,610 |
| | | TOTAL | 231,453 |
| | | Information Technology—4.2% | |
| 188 | | Apple, Inc. | 20,778 |
| 716 | | Applied Materials, Inc. | 23,055 |
| 985 | | Cisco Systems, Inc. | 29,373 |
| 682 | | Corning, Inc. | 16,388 |
| 1,770 | | HP, Inc. | 27,258 |
| 116 | | Harris Corp. | 12,013 |
| 463 | | Hewlett Packard Enterprise Co. | 11,019 |
| 172 | | Lam Research Corp. | 18,235 |
| 234 | | Leidos Holdings, Inc. | 11,981 |
| 253 | | Qualcomm, Inc. | 17,237 |
| 247 | | TE Connectivity Ltd. | 16,707 |
Annual Shareholder Report
Shares or
Contracts | | | Value |
| | | COMMON STOCKS—continued | |
| | | Information Technology—continued | |
| 575 | | Texas Instruments, Inc. | $42,510 |
| | | TOTAL | 246,554 |
| | | Materials—1.0% | |
| 497 | | CRH PLC, ADR | 16,456 |
| 211 | | Cabot Corp. | 10,746 |
| 295 | | Domtar Corp. | 11,585 |
| 313 | | Dow Chemical Co. | 17,440 |
| | | TOTAL | 56,227 |
| | | Real Estate—1.1% | |
| 82 | | Coresite Realty Corp.- REIT | 5,784 |
| 116 | | Digital Realty Trust, Inc. | 10,710 |
| 462 | | Duke Realty Corp. | 11,749 |
| 570 | | General Growth Properties, Inc. | 14,444 |
| 344 | | Retail Properties of America, Inc. | 5,249 |
| 25 | | Simon Property Group, Inc. | 4,491 |
| 87 | | Sun Communities, Inc. | 6,279 |
| 73 | | Welltower, Inc. | 4,583 |
| | | TOTAL | 63,289 |
| | | Telecommunication Services—1.6% | |
| 753 | | AT&T, Inc. | 29,088 |
| 231 | | BCE, Inc. | 9,951 |
| 582 | | CenturyLink, Inc. | 13,689 |
| 760 | | Verizon Communications | 37,924 |
| | | TOTAL | 90,652 |
| | | Utilities—1.6% | |
| 225 | | American Electric Power Co., Inc. | 13,286 |
| 124 | | DTE Energy Co. | 11,543 |
| 152 | | Dominion Resources, Inc. | 11,140 |
| 166 | | Duke Energy Corp. | 12,246 |
| 200 | | Exelon Corp. | 6,502 |
| 109 | | Nextera Energy, Inc. | 12,451 |
| 255 | | PPL Corp. | 8,532 |
| 89 | | Sempra Energy | 8,882 |
| 176 | | Southern Co. | 8,241 |
| | | TOTAL | 92,823 |
| | | TOTAL COMMON STOCKS
(IDENTIFIED COST $1,952,770) | 2,105,375 |
Annual Shareholder Report
Shares or
Contracts | | | Value |
| | | PURCHASED CALL OPTION—0.2% | |
| 153 | | CBOE SPX Volatility Index Strike Price: $18.00; Expiration Date: 12/21/2016
(IDENTIFIED COST $13,541) | $8,797 |
| | | PURCHASED PUT OPTIONS—0.2% | |
| 16 | | SPDR S&P 500 ETF Trust Strike Price: $205.00; Expiration Date: 12/16/2017 | 336 |
| 15 | | SPDR S&P 500 ETF Trust Strike Price: $215.00; Expiration Date: 1/20/2017 | 3,577 |
| 12 | | SPDR S&P 500 ETF Trust Strike Price: $215.00; Expiration Date: 3/17/2017 | 6,132 |
| | | TOTAL PURCHASED PUT OPTIONS
(IDENTIFIED COST $17,069) | 10,045 |
| | | INVESTMENT COMPANIES—60.7%2 | |
| 81,005 | | Emerging Markets Core Fund | 801,137 |
| 155,062 | | Federated Mortgage Core Portfolio | 1,524,258 |
| 288,329 | | Federated Institutional Prime Value Obligations Fund, Institutional Shares, 0.56%3 | 288,358 |
| 146,585 | | High Yield Bond Portfolio | 914,693 |
| | | TOTAL INVESTMENT COMPANIES
(IDENTIFIED COST $3,520,585) | 3,528,446 |
| | | TOTAL INVESTMENTS—97.3%
(IDENTIFIED COST $5,503,965)4 | 5,652,663 |
| | | OTHER ASSETS AND LIABILITIES - NET—2.7%5 | 161,476 |
| | | TOTAL NET ASSETS—100% | $5,814,139 |
At November 30, 2016, the Fund had the following outstanding futures contracts:
| Description | Number of
Contracts | Notional
Value | Expiration
Date | Unrealized
Appreciation |
| 1S&P 500 E-Mini Index Long Futures | 30 | $3,298,200 | December 2016 | $65,757 |
| 1United States Treasury Note 5-Year Short Futures | 1 | $117,844 | March 2017 | $357 |
| UNREALIZED APPRECIATION ON FUTURES CONTRACTS | $66,114 |
Annual Shareholder Report
At November 30, 2016, the Fund had the following outstanding written options contracts:
| Security | Expiration
Date | Exercise
Price | Contracts | Value |
| 1CBOE SPX Volatility Index (Call Option) | December 2016 | $21.00 | 153 | $(4,973) |
| 1SPDR S&P 500 ETF Trust (Put-Option) | December 2016 | $195.00 | 16 | (120) |
| 1SPDR S&P 500 ETF Trust (Put-Option) | March 2017 | $200.00 | 12 | (2,652) |
| 1SPDR S&P 500 ETF Trust (Put-Option) | January 2017 | $205.00 | 15 | (1,380) |
| (PREMIUMS RECEIVED $17,240) | | | $(9,125) |
Net Unrealized Appreciation on Futures Contracts and Written Options is included in “Other Assets and Liabilities—Net.”
| 1 | Non-income-producing security. |
| 2 | Affiliated holdings. |
| 3 | 7-day net yield. |
| 4 | The cost of investments for federal tax purposes amounts to $5,577,955. |
| 5 | Assets, other than investments in securities, less liabilities. See Statement of Assets and Liabilities. |
Note: The categories of investments are shown as a percentage of total net assets at November 30, 2016.
Various inputs are used in determining the value of the Fund's investments. These inputs are summarized in the three broad levels listed below:
Level 1—quoted prices in active markets for identical securities.
Level 2—other significant observable inputs (including quoted prices for similar securities, interest rates, prepayment speeds, credit risk, etc.). Also includes securities valued at amortized cost.
Level 3—significant unobservable inputs (including the Fund's own assumptions in determining the fair value of investments).
The inputs or methodology used for valuing securities are not an indication of the risk associated with investing in those securities.
As of November 30, 2016, all investments of the Fund excluding Emerging Markets Core Fund, Federated Mortgage Core Portfolio and High Yield Bond Portfolio utilized Level 1 inputs in valuing the Fund's assets carried at fair value. As permitted by U.S. generally accepted accounting principles (GAAP), the Investment Companies valued at $3,240,088 are measured at fair value using the net asset value (NAV) per share practical expedient. The price of shares redeemed in these Investment Companies is the next determined NAV after receipt of a shareholder redemption request.
The following acronyms are used throughout this portfolio:
| ADR | —American Depositary Receipt |
| ETF | —Exchange-Traded Fund |
| REIT | —Real Estate Investment Trust |
| SPDR | —Standard & Poor's Depositary Receipt |
See Notes which are an integral part of the Financial Statements
Annual Shareholder Report
Financial Highlights–Class A Shares
(For a Share Outstanding Throughout Each Period)
| | Year
Ended
11/30/2016 | Period
Ended
11/30/20151 |
| Net Asset Value, Beginning of Period | $9.35 | $10.00 |
| Income From Investment Operations: | | |
| Net investment income | 0.272 | 0.382 |
| Net realized and unrealized gain (loss) on investments, futures contracts, written options and foreign currency transactions | (0.12) | (0.68) |
| TOTAL FROM INVESTMENT OPERATIONS | 0.15 | (0.30) |
| Less Distributions: | | |
| Distributions from net investment income | (0.30) | (0.35) |
| Net Asset Value, End of Period | $9.20 | $9.35 |
| Total Return3 | 1.69% | (3.15)% |
| Ratios to Average Net Assets: | | |
| Net expenses | 1.03%4 | 1.04%4,5 |
| Net investment income | 3.00% | 4.12%5 |
| Expense waiver/reimbursement6 | 5.16% | 3.68%5 |
| Supplemental Data: | | |
| Net assets, end of period (000 omitted) | $142 | $89 |
| Portfolio turnover | 79% | 85% |
| 1 | Reflects operations for the period from December 15, 2014 (date of initial investment) to November 30, 2015. |
| 2 | Per share numbers have been calculated using the average shares method. |
| 3 | Based on net asset value, which does not reflect the sales charge, redemption fee or contingent deferred sales charge, if applicable. Total returns for periods of less than one year are not annualized. |
| 4 | The net expense ratio is calculated without reduction for expense offset arrangements. The net expense ratios are 1.03% and 1.04% for the year ended November 30, 2016 and for the period ended November 30, 2015, respectively, after taking into account these expense reductions. |
| 5 | Computed on an annualized basis. |
| 6 | This expense decrease is reflected in both the net expense and the net investment income ratios shown above. |
See Notes which are an integral part of the Financial Statements
Annual Shareholder Report
Financial Highlights–Class C Shares
(For a Share Outstanding Throughout Each Period)
| | Year
Ended
11/30/2016 | Period
Ended
11/30/20151 |
| Net Asset Value, Beginning of Period | $9.35 | $10.00 |
| Income From Investment Operations: | | |
| Net investment income | 0.202 | 0.302 |
| Net realized and unrealized gain (loss) on investments, futures contracts, written options and foreign currency transactions | (0.13) | (0.65) |
| TOTAL FROM INVESTMENT OPERATIONS | 0.07 | (0.35) |
| Less Distributions: | | |
| Distributions from net investment income | (0.23) | (0.30) |
| Net Asset Value, End of Period | $9.19 | $9.35 |
| Total Return3 | 0.83% | (3.63)% |
| Ratios to Average Net Assets: | | |
| Net expenses | 1.78%4 | 1.79%4,5 |
| Net investment income | 2.27% | 3.26%5 |
| Expense waiver/reimbursement6 | 5.19% | 3.41%5 |
| Supplemental Data: | | |
| Net assets, end of period (000 omitted) | $600 | $581 |
| Portfolio turnover | 79% | 85% |
| 1 | Reflects operations for the period from December 15, 2014 (date of initial investment) to November 30, 2015. |
| 2 | Per share numbers have been calculated using the average shares method. |
| 3 | Based on net asset value, which does not reflect the sales charge, redemption fee or contingent deferred sales charge, if applicable. Total returns for periods of less than one year are not annualized. |
| 4 | The net expense ratio is calculated without reduction for expense offset arrangements. The net expense ratios are 1.78% and 1.79% for the year ended November 30, 2016 and for the period ended November 30, 2015, respectively, after taking into account these expense reductions. |
| 5 | Computed on an annualized basis. |
| 6 | This expense decrease is reflected in both the net expense and the net investment income ratios shown above. |
See Notes which are an integral part of the Financial Statements
Annual Shareholder Report
Financial Highlights–Institutional Shares
(For a Share Outstanding Throughout Each Period)
| | Year
Ended
11/30/2016 | Period
Ended
11/30/20151 |
| Net Asset Value, Beginning of Period | $9.34 | $10.00 |
| Income From Investment Operations: | | |
| Net investment income | 0.302 | 0.402 |
| Net realized and unrealized gain (loss) on investments, futures contracts, written options and foreign currency transactions | (0.13) | (0.70) |
| TOTAL FROM INVESTMENT OPERATIONS | 0.17 | (0.30) |
| Less Distributions: | | |
| Distributions from net investment income | (0.32) | (0.36) |
| Net Asset Value, End of Period | $9.19 | $9.34 |
| Total Return3 | 1.84% | (3.12)% |
| Ratios to Average Net Assets: | | |
| Net expenses | 0.78%4 | 0.79%4,5 |
| Net investment income | 3.32% | 4.20%5 |
| Expense waiver/reimbursement6 | 4.95% | 5.20%5 |
| Supplemental Data: | | |
| Net assets, end of period (000 omitted) | $5,072 | $8,499 |
| Portfolio turnover | 79% | 85% |
| 1 | Reflects operations for the period from December 15, 2014 (date of initial investment) to November 30, 2015. |
| 2 | Per share numbers have been calculated using the average shares method. |
| 3 | Based on net asset value. Total returns for periods of less than one year are not annualized. |
| 4 | The net expense ratio is calculated without reduction for expense offset arrangements. The net expense ratios are 0.78% and 0.79% for the year ended November 30, 2016 and for the period ended November 30, 2015, respectively, after taking into account these expense reductions. |
| 5 | Computed on an annualized basis. |
| 6 | This expense decrease is reflected in both the net expense and the net investment income ratios shown above. |
See Notes which are an integral part of the Financial Statements
Annual Shareholder Report
Statement of Assets and Liabilities
November 30, 2016
| Assets: | | |
| Total investment in securities, at value including $3,528,446 of investment in affiliated holdings (Note 5) (identified cost $5,503,965) | | $5,652,663 |
| Cash | | 10,162 |
| Cash denominated in foreign currencies (identified cost $73,927) | | 72,818 |
| Restricted cash (Note 2) | | 143,350 |
| Income receivable | | 13,911 |
| Receivable for investments sold | | 47,642 |
| TOTAL ASSETS | | 5,940,546 |
| Liabilities: | | |
| Payable for investments purchased | $39,042 | |
| Written options outstanding, at value (premiums received $17,240) | 9,125 | |
| Payable for daily variation margin on futures contracts | 7,218 | |
| Payable to adviser (Note 5) | 518 | |
| Payable for administrative fees (Note 5) | 354 | |
| Payable for custodian fees | 3,662 | |
| Payable for auditing fees | 29,860 | |
| Payable for portfolio accounting fees | 21,350 | |
| Payable for distribution services fee (Note 5) | 363 | |
| Payable for other service fees (Notes 2 and 5) | 137 | |
| Payable for share registration costs | 8,299 | |
| Payable for insurance premiums | 3,481 | |
| Accrued expenses (Note 5) | 2,998 | |
| TOTAL LIABILITIES | | 126,407 |
| Net assets for 632,628 shares outstanding | | $5,814,139 |
| Net Assets Consist of: | | |
| Paid-in capital | | $6,787,173 |
| Net unrealized appreciation of investments, futures contracts, written options and translation of assets and liabilities in foreign currency | | 221,818 |
| Accumulated net realized loss on investments, futures contracts, written options and foreign currency transactions | | (1,203,002) |
| Undistributed net investment income | | 8,150 |
| TOTAL NET ASSETS | | $5,814,139 |
Annual Shareholder Report
Statement of Assets and Liabilities–continued
| Net Asset Value, Offering Price and Redemption Proceeds Per Share | | |
| Class A Shares: | | |
| Net asset value per share ($142,122 ÷ 15,451 shares outstanding), no par value, unlimited shares authorized | | $9.20 |
| Offering price per share (100/94.50 of $9.20) | | $9.74 |
| Redemption proceeds per share | | $9.20 |
| Class C Shares: | | |
| Net asset value per share ($599,787 ÷ 65,274 shares outstanding), no par value, unlimited shares authorized | | $9.19 |
| Offering price per share | | $9.19 |
| Redemption proceeds per share (99.00/100 of $9.19) | | $9.10 |
| Institutional Shares: | | |
| Net asset value per share ($5,072,230 ÷ 551,903 shares outstanding), no par value, unlimited shares authorized | | $9.19 |
| Offering price per share | | $9.19 |
| Redemption proceeds per share | | $9.19 |
See Notes which are an integral part of the Financial Statements
Annual Shareholder Report
Statement of Operations
Year Ended November 30, 2016
| Investment Income: | | | |
| Dividends (including $148,126 received from affiliated holdings (Note 5) and net of foreign taxes withheld of $795) | | | $220,749 |
| Investment income allocated from an affiliated partnership (Notes 2 and 5) | | | 46,097 |
| TOTAL INCOME | | | 266,846 |
| Expenses: | | | |
| Investment adviser fee (Note 5) | | $48,799 | |
| Administrative fee (Note 5) | | 130,089 | |
| Custodian fees | | 17,199 | |
| Transfer agent fee | | 5,656 | |
| Directors'/Trustees' fees (Note 5) | | 780 | |
| Auditing fees | | 29,860 | |
| Legal fees | | 8,283 | |
| Portfolio accounting fees | | 64,680 | |
| Distribution services fee (Note 5) | | 4,300 | |
| Other service fees (Notes 2 and 5) | | 1,575 | |
| Share registration costs | | 46,101 | |
| Printing and postage | | 15,709 | |
| Miscellaneous (Note 5) | | 6,772 | |
| EXPENSES BEFORE ALLOCATION | | 379,803 | |
| Expenses allocated from an affiliated partnership (Notes 2 and 5) | | 522 | |
| TOTAL EXPENSES | | 380,325 | |
| Waivers, Reimbursements and Reduction: | | | |
| Waiver/reimbursement of investment adviser fee (Note 5) | $(48,799) | | |
| Waiver/reimbursements of other operating expenses (Notes 5) | (274,713) | | |
| Fees paid indirectly from directed brokerage arrangements (Note 6) | (30) | | |
| TOTAL WAIVERS, REIMBURSEMENTS AND REDUCTION | | (323,542) | |
| Net expenses | | | 56,783 |
| Net investment income | | | 210,063 |
Annual Shareholder Report
Statement of Operations–continued
| Realized and Unrealized Gain (Loss) on Investments, Futures Contracts, Written Options and Foreign Currency Transactions: | | | |
| Net realized loss on investments and foreign currency transactions (including realized loss of $(82,351) on sales of investments in affiliated companies (Note 5)) | | | $(274,098) |
| Net realized loss on futures contracts | | | (176,137) |
| Net realized gain on written options | | | 38,593 |
| Net realized loss on investments and foreign currency transactions allocated from affiliated partnership (Notes 2 and 5) | | | (34,359) |
| Net change in unrealized depreciation of investments and translation of assets and liabilities in foreign currency | | | 182,352 |
| Net change in unrealized appreciation of futures contracts | | | 39,304 |
| Net change in unrealized appreciation of written options | | | 8,115 |
| Net realized and unrealized loss on investments, futures contracts, written options and foreign currency transactions | | | (216,230) |
| Change in net assets resulting from operations | | | $(6,167) |
See Notes which are an integral part of the Financial Statements
Annual Shareholder Report
Statement of Changes in Net Assets
| | Year Ended
11/30/2016 | Period Ended
11/30/20151 |
| Increase (Decrease) in Net Assets | | |
| Operations: | | |
| Net investment income | $210,063 | $276,205 |
| Net realized loss on investments including allocation from an affiliated partnership, futures contracts, written options and foreign currency transactions | (446,001) | (751,513) |
| Net change in unrealized appreciation/depreciation of investments, futures contracts, written options and translation of assets and liabilities in foreign currency | 229,771 | (7,953) |
| CHANGE IN NET ASSETS RESULTING FROM OPERATIONS | (6,167) | (483,261) |
| Distributions to Shareholders: | | |
| Distributions from net investment income | | |
| Class A Shares | (1,782) | (1,672) |
| Class C Shares | (14,548) | (8,186) |
| Institutional Shares | (214,375) | (243,043) |
| CHANGE IN NET ASSETS RESULTING FROM DISTRIBUTIONS TO SHAREHOLDERS | (230,705) | (252,901) |
| Share Transactions: | | |
| Proceeds from sale of shares | 248,598 | 9,923,596 |
| Net asset value of shares issued to shareholders in payment of distributions declared | 188,618 | 198,183 |
| Cost of shares redeemed | (3,555,461) | (216,361) |
| CHANGE IN NET ASSETS RESULTING FROM SHARE TRANSACTIONS | (3,118,245) | 9,905,418 |
| Change in net assets | (3,355,117) | 9,169,256 |
| Net Assets: | | |
| Beginning of period | 9,169,256 | — |
| End of period (including undistributed net investment income of $8,150 and $25,452, respectively) | $5,814,139 | $9,169,256 |
| 1 | Reflects operations for the period from December 15, 2014 (date of initial investment) to November 30, 2015. |
See Notes which are an integral part of the Financial Statements
Annual Shareholder Report
Notes to Financial Statements
November 30, 2016
1. ORGANIZATION
Federated Equity Funds (the “Trust”) is registered under the Investment Company Act of 1940, as amended (the “Act”), as a diversified, open-end management investment company. The Trust consists of 14 diversified portfolios. The financial statements included herein are only those of Federated Managed Volatility Fund (the “Fund”), a diversified portfolio. The financial statements of the other portfolios are presented separately. The assets of each portfolio are segregated and a shareholder's interest is limited to the portfolio in which shares are held. Each portfolio pays its own expenses. The Fund offers three classes of shares: Class A Shares, Class C Shares and Institutional Shares. All shares of the Fund have equal rights with respect to voting, except on class-specific matters. The investment objective of the Fund is to provide total return while managing the Fund's annualized volatility. Federated Global Investment Management Corp., Federated Investment Management Company and Federated Equity Management Company of Pennsylvania (collectively, the “Co-Advisers”) each are registered as a “commodity pool operator” with respect to operation of the Fund.
2. SIGNIFICANT ACCOUNTING POLICIES
The following is a summary of significant accounting policies consistently followed by the Fund in the preparation of its financial statements. These policies are in conformity with U.S. generally accepted accounting principles (GAAP).
Investment Valuation
In calculating its net asset value (NAV), the Fund generally values investments as follows:
| ■ | Equity securities listed on an exchange or traded through a regulated market system are valued at their last reported sale price or official closing price in their principal exchange or market. |
| ■ | Shares of other mutual funds or non-exchange-traded investment companies are valued based upon their reported NAVs. |
| ■ | Fixed-income securities are fair valued using price evaluations provided by a pricing service approved by the Trustees. |
| ■ | Derivative contracts listed on exchanges are valued at their reported settlement or closing price, except that options are valued at the mean of closing bid and asked quotations. |
| ■ | Over-the-counter (OTC) derivative contracts are fair valued using price evaluations provided by a pricing service approved by the Trustees. |
| ■ | For securities that are fair valued in accordance with procedures established by and under the general supervision of the Trustees, certain factors may be considered such as: the last traded or purchase price of the security, information obtained by contacting the issuer or dealers, analysis of the issuer's financial statements or other available documents, fundamental analytical data, the nature and duration of restrictions on disposition, the movement of the market in which the security is normally traded public trading in similar securities or derivative contracts of the issuer or comparable issuers, movement of a relevant index, or other factors including but not limited to industry changes and relevant government actions. |
Annual Shareholder Report
If any price, quotation, price evaluation or other pricing source is not readily available when the NAV is calculated, or if the Fund cannot obtain price evaluations from a pricing service or from more than one dealer for an investment within a reasonable period of time as set forth in the Fund's valuation policies and procedures, the Fund uses the fair value of the investment determined in accordance with the procedures described below. There can be no assurance that the Fund could obtain the fair value assigned to an investment if it sold the investment at approximately the time at which the Fund determines its NAV per share.
Fair Valuation and Significant Events Procedures
The Trustees have ultimate responsibility for determining the fair value of investments for which market quotations are not readily available. The Trustees have appointed a valuation committee (“Valuation Committee”) comprised of officers of the Fund, the Co-Advisers and certain of the Co-Adviser's affiliated companies to assist in determining fair value and in overseeing the calculation of the NAV. The Trustees have also authorized the use of pricing services recommended by the Valuation Committee to provide fair value evaluations of the current value of certain investments for purposes of calculating the NAV. The Valuation Committee employs various methods for reviewing third-party pricing-service evaluations including periodic reviews of third-party pricing services' policies, procedures and valuation methods (including key inputs, methods, models and assumptions), transactional back-testing, comparisons of evaluations of different pricing services, and review of price challenges by the Co-Advisers based on recent market activity. In the event that market quotations and price evaluations are not available for an investment, the Valuation Committee determines the fair value of the investment in accordance with procedures adopted by the Trustees. The Trustees periodically review and approve the fair valuations made by the Valuation Committee and any changes made to the procedures.
Factors considered by pricing services in evaluating an investment include the yields or prices of investments of comparable quality, coupon, maturity, call rights and other potential prepayments, terms and type, reported transactions, indications as to values from dealers and general market conditions. Some pricing services provide a single price evaluation reflecting the bid-side of the market for an investment (a “bid” evaluation). Other pricing services offer both bid evaluations and price evaluations indicative of a price between the prices bid and asked for the investment (a “mid” evaluation). The Fund normally uses bid evaluations for any U.S. Treasury and Agency securities, mortgage-backed securities and municipal securities. The Fund normally uses mid evaluations for any other types of fixed-income securities and any OTC derivative contracts. In the event that market quotations and price evaluations are not available for an investment, the fair value of the investment is determined in accordance with procedures adopted by the Trustees.
The Trustees also have adopted procedures requiring an investment to be priced at its fair value whenever the Co-Advisers determine that a significant event affecting the value of the investment has occurred between the time as of which the price of the investment would otherwise be determined and the time as of which the NAV is computed. An event is considered significant if there is both an affirmative expectation that the investment's value will change in response to the event and a reasonable basis for quantifying the resulting change in value. Examples of significant events that may occur after the close of the principal market on which a security is traded, or after the time of a price evaluation provided by a pricing service or a dealer, include:
| ■ | With respect to securities traded principally in foreign markets, significant trends in U.S. equity markets or in the trading of foreign securities index futures contracts; |
Annual Shareholder Report
| ■ | Political or other developments affecting the economy or markets in which an issuer conducts its operations or its securities are traded; |
| ■ | Announcements concerning matters such as acquisitions, recapitalizations, litigation developments, or a natural disaster affecting the issuer's operations or regulatory changes or market developments affecting the issuer's industry. |
The Trustees have adopted procedures whereby the Valuation Committee uses a pricing service to determine the fair value of equity securities traded principally in foreign markets when the Co-Advisers determine that there has been a significant trend in the U.S. equity markets or in index futures trading. For other significant events, the Fund may seek to obtain more current quotations or price evaluations from alternative pricing sources. If a reliable alternative pricing source is not available, the Fund will determine the fair value of the investment in accordance with the fair valuation procedures approved by the Trustees. The Trustees have ultimate responsibility for any fair valuations made in response to a significant event.
Repurchase Agreements
The Fund may invest in repurchase agreements for short-term liquidity purposes. It is the policy of the Fund to require the other party to a repurchase agreement to transfer to the Fund's custodian or sub-custodian eligible securities or cash with a market value (after transaction costs) at least equal to the repurchase price to be paid under the repurchase agreement. The eligible securities are transferred to accounts with the custodian or sub-custodian in which the Fund holds a “securities entitlement” and exercises “control” as those terms are defined in the Uniform Commercial Code. The Fund has established procedures for monitoring the market value of the transferred securities and requiring the transfer of additional eligible securities if necessary to equal at least the repurchase price. These procedures also allow the other party to require securities to be transferred from the account to the extent that their market value exceeds the repurchase price or in exchange for other eligible securities of equivalent market value.
The insolvency of the other party or other failure to repurchase the securities may delay the disposition of the underlying securities or cause the Fund to receive less than the full repurchase price. Under the terms of the repurchase agreement, any amounts received by the Fund in excess of the repurchase price and related transaction costs must be remitted to the other party.
The Fund may enter into repurchase agreements in which eligible securities are transferred into joint trading accounts maintained by the custodian or sub-custodian for investment companies and other clients advised by the Fund's Co-Advisers and their affiliates. The Fund will participate on a pro rata basis with the other investment companies and clients in its share of the securities transferred under such repurchase agreements and in its share of proceeds from any repurchase or other disposition of such securities.
Annual Shareholder Report
Investment Income, Gains and Losses, Expenses and Distributions
Investment transactions are accounted for on a trade-date basis. Realized gains and losses from investment transactions are recorded on an identified-cost basis. Interest income and expenses are accrued daily. Dividend income and distributions to shareholders are recorded on the ex-dividend date. Foreign dividends are recorded on the ex-dividend date or when the Fund is informed of the ex-dividend date. Distributions of net investment income, if any, are declared and paid monthly. Non-cash dividends included in dividend income, if any, are recorded at fair value. The Fund had invested in Emerging Markets Fixed Income Core Fund (EMCORE), a portfolio of Federated Core Trust II, L.P., which was a limited partnership established under the laws of the state of Delaware. The Fund recorded daily its proportionate share of income, expenses, realized and unrealized gains and losses from EMCORE. Investment income, realized and unrealized gains and losses and certain fund-level expenses are allocated to each class based on relative average daily net assets, except that Class A Shares and Class C Shares may bear distribution services fees and other service fees unique to those classes. The detail of the total fund expense waivers, reimbursements and reduction of $323,542 is disclosed in various locations in Note 5 and Note 6.
Dividends are declared separately for each class. No class has preferential dividend rights; differences in per share dividend rates are generally due to differences in separate class expenses.
Other Service Fees
The Fund may pay other service fees up to 0.25% of the average daily net assets of the Class A Shares and Class C Shares to unaffiliated financial intermediaries or to Federated Shareholder Services Company (FSSC) for providing services to shareholders and maintaining shareholder accounts. Subject to the terms described in the Expense Limitation note, FSSC may voluntarily reimburse the Fund for other service fees. For the year ended November 30, 2016, other service fees for the Fund were as follows:
| | Other
Service Fees
Incurred |
| Class A Shares | $141 |
| Class C Shares | $1,434 |
| TOTAL | $1,575 |
Federal Taxes
It is the Fund's policy to comply with the Subchapter M provision of the Internal Revenue Code (the “Code”) and to distribute to shareholders each year substantially all of its income. Accordingly, no provision for federal income tax is necessary. As of and during the year ended November 30, 2016, the Fund did not have a liability for any uncertain tax positions. The Fund recognizes interest and penalties, if any, related to tax liabilities as income tax expense in the Statement of Operations. As of November 30, 2016, tax years 2015 and 2016 remain subject to examination by the Fund's major tax jurisdictions, which include the United States of America and the Commonwealth of Massachusetts.
The Fund may be subject to taxes imposed by governments of countries in which it invests. Such taxes are generally based on either income or gains earned or repatriated. The Fund accrues and applies such taxes to net investment income, net realized gains and net unrealized gains as income and/or gains are earned.
Annual Shareholder Report
When-Issued and Delayed-Delivery Transactions
The Fund may engage in when-issued or delayed-delivery transactions. The Fund records when-issued securities on the trade date and maintains security positions such that sufficient liquid assets will be available to make payment for the securities purchased. Securities purchased on a when-issued or delayed-delivery basis are marked to market daily and begin earning interest on the settlement date. Losses may occur on these transactions due to changes in market conditions or the failure of counterparties to perform under the contract.
Futures Contracts
The Fund purchases and sells financial futures contracts to seek to manage duration, market and yield curve risks. Upon entering into a financial futures contract with a broker, the Fund is required to deposit in a segregated account U.S. government securities or a specified amount of cash which is shown as Restricted cash in the Statement of Assets and Liabilities. Futures contracts are valued daily and unrealized gains or losses are recorded in a “variation margin” account. Daily, the Fund receives from or pays to the broker a specified amount of cash based upon changes in the variation margin account. When a contract is closed, the Fund recognizes a realized gain or loss. Futures contracts have market risks, including the risk that the change in the value of the contract may not correlate with the changes in the value of the underlying securities. There is minimal counterparty risk to the Fund since futures are exchange traded and the exchange's clearinghouse, as counterparty to all exchange traded futures, guarantees the futures against default.
Futures contracts outstanding at period end are listed after the Fund's Portfolio of Investments.
The average notional value of long and short futures contracts held by the Fund throughout the period was $1,248,869 and $411,144, respectively. This is based on amounts held as of each month-end throughout the fiscal period.
Foreign Exchange Contracts
The Fund enters into foreign exchange contracts to manage currency risk. Purchased contracts are used to acquire exposure to foreign currencies, whereas, contracts to sell are used to hedge the Fund's securities against currency fluctuations. Risks may arise upon entering into these transactions from the potential inability of counterparties to meet the terms of their commitments and from unanticipated movements in security prices or foreign exchange rates. The foreign exchange contracts are adjusted by the daily exchange rate of the underlying currency and any gains or losses are recorded for financial statement purposes as unrealized until the settlement date.
At November 30, 2016, the Fund had no outstanding foreign exchange contracts.
Foreign Currency Translation
The accounting records of the Fund are maintained in U.S. dollars. All assets and liabilities denominated in foreign currencies (FCs) are translated into U.S. dollars based on the rates of exchange of such currencies against U.S. dollars on the date of valuation. Purchases and sales of securities, income and expenses are translated at the rate of exchange quoted on the respective date that such transactions are recorded. The Fund does not isolate that portion of the results of operations resulting from changes in foreign exchange rates on investments from the fluctuations arising from changes in market prices of securities held. Such fluctuations are included with the net realized and unrealized gain or loss from investments.
Annual Shareholder Report
Reported net realized foreign exchange gains or losses arise from sales of FCs, currency gains or losses realized between the trade and settlement dates on securities transactions, the difference between the amounts of dividends, interest and foreign withholding taxes recorded on the Fund's books, and the U.S. dollar equivalent of the amounts actually received or paid. Net unrealized foreign exchange gains and losses arise from changes in the value of assets and liabilities other than investments in securities at fiscal year end, resulting from changes in the exchange rate.
Option Contracts
The Fund buys or sells put and call options to manage market risk. The seller (“writer”) of an option receives a payment or premium, from the buyer, which the writer keeps regardless of whether the buyer exercises the option. When the Fund writes a put or call option, an amount equal to the premium received is recorded as a liability and subsequently marked to market to reflect the current value of the option written. Premiums received from writing options which expire are treated as realized gains. The Fund, as a writer of an option, bears the market risk of an unfavorable change in the price of the underlying reference instrument. When the Fund purchases a put or call option, an amount equal to the premium paid is recorded as an increase to the cost of the investment and subsequently marked to market to reflect the current value of the option purchased. Premiums received/paid for writing/purchasing options which expire are treated as realized losses. Premiums received/paid for writing/purchasing options which are exercised or closed are added to the proceeds or offset against amounts paid on the underlying reference instrument to determine the realized gain or loss. The risk associated with purchasing put and call options is limited to the premium paid. Options can trade on securities or commodities exchanges. In this case, the exchange sets all the terms of the contract except for the price. Most exchanges require investors to maintain margin accounts through their brokers to cover their potential obligations to the exchange. This protects investors against potential defaults by the counterparty.
The following is a summary of the Fund's written option activity:
| Contracts | Number of
Contracts | Premium |
| Outstanding at 11/30/2015 | — | $— |
| Contracts written | 902 | 91,218 |
| Contracts exercised | — | — |
| Contracts expired | (62) | (12,426) |
| Contracts bought back | (644) | (61,552) |
| Outstanding at 11/30/2016 | 196 | $17,240 |
Written options contracts outstanding at period end are listed after the Fund's Portfolio of Investments.
The average market value of purchased put and call options held by the Fund throughout the period was $7,467 and $9,180, respectively. This is based on amounts held as of each month-end throughout the fiscal period.
The average market value of written put and call options held by the Fund throughout the period was $2,849 and $915, respectively. This is based on amounts held as of each month-end throughout the fiscal period.
Annual Shareholder Report
Restricted Securities
The Fund may purchase securities which are considered restricted. Restricted securities are securities that either: (a) cannot be offered for public sale without first being registered, or being able to take advantage of an exemption from registration, under the Securities Act of 1933; or (b) are subject to contractual restrictions on public sales. In some cases, when a security cannot be offered for public sale without first being registered, the issuer of the restricted security has agreed to register such securities for resale, at the issuer's expense, either upon demand by the Fund or in connection with another registered offering of the securities. Many such restricted securities may be resold in the secondary market in transactions exempt from registration. Restricted securities may be determined to be liquid under criteria established by the Trustees. The Fund will not incur any registration costs upon such resales. The Fund's restricted securities, like other securities, are priced in accordance with procedures established by and under the general supervision of the Trustees.
Additional Disclosure Related to Derivative Instruments
| Fair Value of Derivative Instruments | | |
| | Asset | Liability |
| | Statement of
Assets and
Liabilities
Location | Fair
Value | Statement of
Assets and
Liabilities
Location | Fair
Value |
Derivatives not accounted
for as hedging instruments
under ASC Topic 815 | | | | |
| Interest rate contracts | | $— | Payable for daily
variation margin on
futures contracts | $(357)* |
| Equity contracts | | — | Payable for daily
variation margin on
futures contracts | (65,757)* |
| Equity contracts | | — | Written options
outstanding | 9,125 |
| Equity contracts | Total investments in
securities, at value options | 18,842 | | — |
Total derivatives not accounted
for as hedging instruments
under ASC Topic 815 | | $18,842 | | $(56,989) |
| * | Includes cumulative appreciation/depreciation of futures contracts as reported in the footnotes to the Portfolio of Investments. Only the current day's variation margin is reported within the Statement of Assets and Liabilities. |
| | |
Annual Shareholder Report
The Effect of Derivative Instruments on the Statement of Operations for the Year Ended November 30, 2016
| Amount of Realized Gain or (Loss) on Derivatives Recognized in Income |
| | Futures
Contracts | Purchased
Option
Contracts1 | Written
Option
Contracts | Total |
| Interest rate contracts | $(17,954) | $— | $— | $(17,954) |
| Equity contracts | (158,183) | (102,305) | 38,593 | (221,895) |
| TOTAL | $(176,137) | $(102,305) | $38,593 | $(239,849) |
| Change in Unrealized Appreciation or (Depreciation) on Derivatives Recognized in Income |
| | Futures
Contracts | Purchased
Option
Contracts2 | Written
Option
Contracts | Total |
| Interest rate contracts | $567 | $— | $— | $567 |
| Equity contracts | 38,737 | 5,881 | 8,115 | 52,733 |
| TOTAL | $ 39,304 | $5,881 | $8,115 | $53,300 |
| 1 | The net realized loss on Purchased Option Contracts is found within the net realized loss on investments and foreign currency transactions on the Statement of Operations. |
| 2 | The net change in unrealized appreciation of Purchased Option Contracts is found within the Net Change in unrealized depreciation of investments and translation of assets and liabilities in foreign currency on the Statement of Operations. |
Other
The preparation of financial statements in conformity with GAAP requires management to make estimates and assumptions that affect the amounts of assets, liabilities, expenses and revenues reported in the financial statements. Actual results could differ from those estimated. The Fund applies Investment Company accounting and reporting guidance.
3. SHARES OF BENEFICIAL INTEREST
The following tables summarize share activity:
| | Year Ended
11/30/2016 | Period Ended
11/30/20151 |
| Class A Shares: | Shares | Amount | Shares | Amount |
| Shares sold | 16,082 | $142,478 | 9,501 | $97,451 |
| Shares issued to shareholders in payment of distributions declared | 198 | 1,779 | 79 | 746 |
| Shares redeemed | (10,395) | (93,774) | (14) | (132) |
| NET CHANGE RESULTING FROM CLASS A SHARE TRANSACTIONS | 5,885 | $50,483 | 9,566 | $98,065 |
Annual Shareholder Report
| | Year Ended
11/30/2016 | Period Ended
11/30/20151 |
| Class C Shares: | Shares | Amount | Shares | Amount |
| Shares sold | 3,588 | $32,500 | 61,929 | $632,328 |
| Shares issued to shareholders in payment of distributions declared | 1,609 | 14,430 | 841 | 8,002 |
| Shares redeemed | (2,095) | (18,781) | (598) | (5,910) |
| NET CHANGE RESULTING FROM CLASS C SHARE TRANSACTIONS | 3,102 | $28,149 | 62,172 | $634,420 |
| | Year Ended
11/30/2016 | Period Ended
11/30/20151 |
| Institutional Shares: | Shares | Amount | Shares | Amount |
| Shares sold | 8,306 | $73,620 | 912,418 | $9,193,817 |
| Shares issued to shareholders in payment of distributions declared | 19,238 | 172,409 | 19,157 | 189,435 |
| Shares redeemed | (385,089) | (3,442,906) | (22,127) | (210,319) |
| NET CHANGE RESULTING FROM INSTITUTIONAL SHARE TRANSACTIONS | (357,545) | $(3,196,877) | 909,448 | $9,172,933 |
| NET CHANGE RESULTING FROM TOTAL FUND SHARE TRANSACTIONS | (348,558) | $(3,118,245) | 981,186 | $9,905,418 |
| 1 | Reflects operations for the period from December 15, 2014 (date of initial investment) to November 30, 2015. |
4. FEDERAL TAX INFORMATION
The timing and character of income and capital gain distributions are determined in accordance with income tax regulations, which may differ from GAAP. These differences are due in part to differing treatments for foreign currency transactions and partnership income.
For the year ended November 30, 2016, permanent differences identified and reclassified among the components of net assets were as follows:
| Increase (Decrease) |
Undistributed
Net Investment
Income (Loss) | Accumulated
Net Realized
Gain (Loss) |
| $3,340 | $(3,340) |
Net investment income (loss), net realized gains (losses), and net assets were not affected by this reclassification.
The tax character of distributions as reported on the Statement of Changes in Net Assets for the years ended November 30, 2016 and period ended November 30, 2015, was as follows:
| | 2016 | 2015 |
| Ordinary income | $230,705 | $252,901 |
Annual Shareholder Report
As of November 30, 2016, the components of distributable earnings on a tax basis were as follows:
| Undistributed ordinary income | $8,150 |
| Net unrealized appreciation | $83,357 |
| Capital loss carryforwards and deferrals | $(1,064,541) |
The difference between book-basis and tax-basis net unrealized appreciation/depreciation is attributable in part to differing treatments for the deferral of losses on wash sales and partnership adjustments.
At November 30, 2016, the cost of investments for federal tax purposes was $5,577,955. The net unrealized appreciation of investments for federal tax purposes excluding: (a) any unrealized appreciation/depreciation resulting from the translation from FCs to U.S. dollars of assets and liabilities other than investments in securities and (b) futures contracts was $74,708. This consists of net unrealized appreciation from investments for those securities having an excess of value over cost of $153,139 and net unrealized depreciation from investments for those securities having an excess of cost over value of $78,431.
At November 30, 2016, the Fund had a capital loss carryforward of $1,064,541 which will reduce the Fund's taxable income arising from future net realized gains on investments, if any, to the extent permitted by the Code, thereby reducing the amount of distributions to shareholders which would otherwise be necessary to relieve the Fund of any liability for federal income tax. Pursuant to the Code, a net capital loss incurred in taxable years beginning after December 22, 2010, retains its character as either short-term or long-term and does not expire. All of the Fund's capital loss carryforwards were incurred in taxable years beginning after December 22, 2010.
The following schedule summarizes the Fund's capital loss carryforwards:
| Short-Term | Long-Term | Total |
| $730,892 | $333,649 | $1,064,541 |
5. INVESTMENT ADVISER FEE AND OTHER TRANSACTIONS WITH AFFILIATES
Investment Adviser Fee
The co-advisory agreement between the Fund and the Co-Advisers provides for an annual fee equal to 0.75% of the Fund's average daily net assets. Subject to the terms described in the Expense Limitation note, the Co-Advisers may voluntarily choose to waive any portion of their fees and/or reimburse certain operating expenses of the Fund. For the year ended November 30, 2016, the Co-Advisers voluntarily waived $48,462 of their fee and voluntarily reimbursed $274,713 of other operating expenses.
Annual Shareholder Report
Administrative Fee
Federated Administrative Services (FAS), under the Administrative Services Agreement, provides the Fund with administrative personnel and services. For purposes of determining the appropriate rate breakpoint, “Investment Complex” is defined as all of the Federated Funds subject to a fee under the Administrative Services Agreement. The fee paid to FAS is based on the average daily net assets of the Investment Complex as specified below, plus certain out-of-pocket expenses:
| Administrative Fee | Average Daily Net Assets
of the Investment Complex |
| 0.150% | on the first $5 billion |
| 0.125% | on the next $5 billion |
| 0.100% | on the next $10 billion |
| 0.075% | on assets in excess of $20 billion |
In addition to the fees described, the Fund agrees to pay FAS an annual Administrative Service Charge of $125,000 for administrative and compliance services to Commodities Futures Trading Commission Rule 4.5. Subject to the terms described in the Expense Limitation note, FAS may voluntarily choose to waive any portion of its fee. For the year ended November 30, 2016, the annualized fee paid to FAS was 2.00% of average daily net assets of the Fund.
Distribution Services Fee
The Fund has adopted a Distribution Plan (the “Plan”) pursuant to Rule 12b-1 under the Act. Under the terms of the Plan, the Fund will compensate Federated Securities Corp. (FSC), the principal distributor, from the daily net assets of the Fund's Class A Shares and Class C Shares to finance activities intended to result in the sale of these shares. The Plan provides that the Fund may incur distribution expenses at the following percentages of average daily net assets annually, to compensate FSC:
| Share Class Name | Percentage of Average Daily
Net Assets of Class |
| Class A Shares | 0.05% |
| Class C Shares | 0.75% |
Subject to the terms described in the Expense Limitation note, FSC may voluntarily choose to waive any portion of its fee. For the year ended November 30, 2016, distribution services fees for the Fund were as follows:
| | Distribution Services
Fees Incurred |
| Class C Shares | $4,300 |
When FSC receives fees, it may pay some or all of them to financial intermediaries whose customers purchase shares. For the year ended November 30, 2016, the Fund's Class A Shares did not incur a distribution services fee; however it may begin to incur this fee upon approval of the Trustees. For the year ended November 30, 2016, FSC retained $2,579 of fees paid by the Fund.
Annual Shareholder Report
Sales Charges
Front-end sales charges and contingent deferred sales charges (CDSC) do not represent expenses of the Fund. They are deducted from the proceeds of sales of Fund shares prior to investment or from redemption proceeds prior to remittance, as applicable.
Other Service Fees
For the year ended November 30, 2016, FSSC did not receive any of the other service fees disclosed in Note 2.
Expense Limitation
The Co-Advisers and certain of their affiliates (which may include FSC, FAS and FSSC) on their own initiative have agreed to waive certain of their respective fees and/or reimburse expenses. Total annual fund operating expenses (as shown in the financial highlights, excluding expenses allocated from affiliated partnerships, interest expense, extraordinary expenses and proxy-related expenses paid by the Fund, if any) paid by the Fund's Class A Shares, Class C Shares and Institutional Shares (after the voluntary waivers and/or reimbursements) will not exceed 1.02%, 1.77% and 0.77% (the “Fee Limit”), respectively, up to but not including the later of (the “Termination Date”): (a) February 1, 2017; or (b) the date of the Fund's next effective Prospectus. While the Co-Advisers and their applicable affiliates currently do not anticipate terminating or increasing these arrangements prior to the Termination Date, these arrangements may only be terminated or the Fee Limit increased prior to the Termination Date with the agreement of the Trustees.
General
Certain Officers and Trustees of the Fund are Officers and Directors or Trustees of certain of the above companies. To efficiently facilitate payment, Directors'/Trustees' fees and certain expenses related to conducting meetings of the Directors/Trustees and other miscellaneous expenses are paid by an affiliate of the Co-Advisers which in due course are reimbursed by the Fund. Such expenses may be included in Accrued and Miscellaneous Expenses on the Statement of Assets and Liabilities and Statement of Operations, respectively.
Transactions Involving Affiliated Holdings
Affiliated holdings are investment companies which are managed by the Co-Advisers or an affiliate of the Co-Advisers. The Co-Advisers have agreed to reimburse the Fund for certain investment adviser fees as a result of transactions in other affiliated investment companies. For the year ended November 30, 2016, the Co-Advisers reimbursed $337. Transactions involving the affiliated holdings during the year ended November 30, 2016, were as follows:
| | Emerging
Markets
Fixed
Income
Core Fund | Emerging
Markets Core
Fund | Federated
Institutional
Prime Value
Obligations
Fund,
Institutional
Shares | Federated
Mortgage
Core
Portfolio | High
Yield
Bond
Portfolio | Total of
Affiliated
Transactions |
| Balance of Shares Held 11/30/2015 | 51,228 | — | 430,947 | 96,147 | 401,290 | 979,612 |
| Purchases/Additions | — | 116,369 | 2,932,661 | 111,321 | 26,353 | 3,186,704 |
| Sales/Reductions | (51,228) | (35,364) | (3,075,279) | (52,406) | (281,058) | (3,495,335) |
Annual Shareholder Report
| | Emerging
Markets
Fixed
Income
Core Fund | Emerging
Markets Core
Fund | Federated
Institutional
Prime Value
Obligations
Fund,
Institutional
Shares | Federated
Mortgage
Core
Portfolio | High
Yield
Bond
Portfolio | Total of
Affiliated
Transactions |
| Balance of Shares Held 11/30/2016 | — | 81,005 | 288,329 | 155,062 | 146,585 | 670,981 |
| Value | $— | $801,137 | $288,358 | $1,524,258 | $914,693 | $3,528,446 |
| Dividend Income/Allocated Investment Income | $46,097 | $19,264 | $1,204 | $27,920 | $99,738 | $194,223 |
| Realized Gain Distribution/Allocated Net Realized Gain (Loss) | $(34,359) | $— | $— | $— | $— | $(34,359) |
Affiliated Shares of Beneficial Interest
As of November 30, 2016, a majority of the shares of beneficial interest outstanding are owned by an affiliate of the Co-Advisers.
6. EXPENSE Reduction
The Fund directs portfolio trades to a broker that in turn pays a portion of the Fund's operating expenses. For the year ended November 30, 2016, the Fund's expenses were reduced by $30 under these arrangements.
7. Investment TRANSACTIONS
Purchases and sales of investments, excluding long-term U.S. government securities and short-term obligations, for the year ended November 30, 2016, were as follows:
| Purchases | $4,819,061 |
| Sales | $8,163,206 |
8. LINE OF CREDIT
The Fund participates with certain other Federated Funds, on a several basis, in an up to $500,000,000 unsecured, 364-day, committed, revolving line of credit (LOC) agreement. The LOC was made available to finance temporarily the repurchase or redemption of shares of the Fund, failed trades, payment of dividends, settlement of trades and for other short-term, temporary or emergency general business purposes. The Fund cannot borrow under the LOC if an inter-fund loan is outstanding. The Fund's ability to borrow under the LOC also is subject to the limitations of the Act and various conditions precedent that must be satisfied before the Fund can borrow. Loans under the LOC are charged interest at a fluctuating rate per annum equal to the highest, on any day, of (a) (i) the federal funds effective rate, (ii) the one month London Interbank Offer Rate (LIBOR), and (iii) 0.0%, plus (b) a margin. The LOC also requires the Fund to pay, quarterly in arrears and at maturity, its pro rata share of a commitment fee based on the amount of the lenders' commitment that has not been utilized. As of November 30, 2016, the Fund had no outstanding loans. During the year ended November 30, 2016, the Fund did not utilize the LOC.
Annual Shareholder Report
9. INTERFUND LENDING
Pursuant to an Exemptive Order issued by the Securities and Exchange Commission (SEC), the Fund, along with other funds advised by subsidiaries of Federated Investors, Inc., may participate in an interfund lending program. This program provides an alternative credit facility allowing the Fund to borrow from other participating affiliated funds. As of November 30, 2016, there were no outstanding loans. During the year ended November 30, 2016, the program was not utilized.
10. Regulatory updates
On October 13, 2016, the SEC amended existing rules intended to modernize reporting and disclosure of information. These amendments relate to Regulation S-X which sets forth the form and content of financial statements. At this time, management is evaluating the implications of adopting these amendments and their impact on the financial statements and accompanying notes.
11. FEDERAL TAX INFORMATION (UNAUDITED)
For the fiscal year ended November 30, 2016, 31.7% of total ordinary income distributions made by the Fund are qualifying dividends which may be subject to a maximum tax rate of 15%, as provided for by the Jobs and Growth Tax Relief Act of 2003. Complete information is reported in conjunction with the reporting of your distributions on Form 1099-DIV.
Of the ordinary income distributions made by the Fund during the year ended November 30, 2016, 27.5% qualify for the dividend received deduction available to corporate shareholders.
Annual Shareholder Report
Report of Independent Registered Public Accounting Firm
TO THE BOARD OF TRUSTEES OF THE FEDERATED EQUITY FUNDS AND SHAREHOLDERS OF FEDERATED MANAGED VOLATILITY FUND:
We have audited the accompanying statement of assets and liabilities, including the portfolio of investments, of the Federated Managed Volatility Fund (the “Fund”), a portfolio of Federated Equity Funds, as of November 30, 2016, and the related statement of operations for the year then ended and the statements of changes in net assets and the financial highlights for the year then ended and the period December 15, 2014 (date of initial investment) to November 30, 2015. These financial statements and financial highlights are the responsibility of the Fund's management. Our responsibility is to express an opinion on these financial statements and financial highlights based on our audits.
We conducted our audits in accordance with the standards of the Public Company Accounting Oversight Board (United States). Those standards require that we plan and perform the audit to obtain reasonable assurance about whether the financial statements and financial highlights are free of material misstatement. An audit includes examining, on a test basis, evidence supporting the amounts and disclosures in the financial statements. Our procedures included confirmation of securities owned as of November 30, 2016, by correspondence with the custodian, transfer agent and brokers or by other appropriate auditing procedures. An audit also includes assessing the accounting principles used and significant estimates made by management, as well as evaluating the overall financial statement presentation. We believe that our audits provide a reasonable basis for our opinion.
In our opinion, the financial statements and financial highlights referred to above present fairly, in all material respects, the financial position of the Federated Managed Volatility Fund as of November 30, 2016, the results of its operations for the year then ended and the changes in its net assets and the financial highlights for the year then ended and the period December 15, 2014 (date of initial investment) to November 30, 2015, in conformity with U.S. generally accepted accounting principles.
Boston, Massachusetts
January 25, 2017
Annual Shareholder Report
Shareholder Expense Example (unaudited)
As a shareholder of the Fund, you incur two types of costs: (1) transaction costs, including sales charges (loads) on purchase or redemption payments; and (2) ongoing costs, including management fees and to the extent applicable, distribution (12b-1) fees and/or other service fees and other Fund expenses. This Example is intended to help you to understand your ongoing costs (in dollars) of investing in the Fund and to compare these costs with the ongoing costs of investing in other mutual funds. It is based on an investment of $1,000 invested at the beginning of the period and held for the entire period from June 1, 2016 to November 30, 2016.
ACTUAL EXPENSES
The first section of the table below provides information about actual account values and actual expenses. You may use the information in this section, together with the amount you invested, to estimate the expenses that you incurred over the period. Simply divide your account value by $1,000 (for example, an $8,600 account value divided by $1,000 = 8.6), then multiply the result by the number in the first section under the heading entitled “Expenses Paid During Period” to estimate the expenses attributable to your investment during this period.
HYPOTHETICAL EXAMPLE FOR COMPARISON PURPOSES
The second section of the table below provides information about hypothetical account values and hypothetical expenses based on the Fund's actual expense ratio and an assumed rate of return of 5% per year before expenses, which is not the Fund's actual return. Thus, you should not use the hypothetical account values and expenses to estimate the actual ending account balance or your expenses for the period. Rather, these figures are required to be provided to enable you to compare the ongoing costs of investing in the Fund with other funds. To do so, compare this 5% hypothetical example with the 5% hypothetical examples that appear in the shareholder reports of the other funds.
Annual Shareholder Report
Please note that the expenses shown in the table are meant to highlight your ongoing costs only and do not reflect any transaction costs, such as sales charges (loads) on purchase or redemption payments. Therefore, the second section of the table is useful in comparing ongoing costs only, and will not help you determine the relative total costs of owning different funds. In addition, if these transaction costs were included, your costs would have been higher.
| | Beginning
Account Value
6/1/2016 | Ending
Account Value
11/30/2016 | Expenses Paid
During Period1 |
| Actual: | | | |
| Class A Shares | $1,000 | $1,031.50 | $5.13 |
| Class C Shares | $1,000 | $1,027.60 | $8.97 |
| Institutional Shares | $1,000 | $1,032.80 | $3.86 |
Hypothetical (assuming a 5% return
before expenses): | | | |
| Class A Shares | $1,000 | $1,019.95 | $5.10 |
| Class C Shares | $1,000 | $1,016.15 | $8.92 |
| Institutional Shares | $1,000 | $1,021.20 | $3.84 |
| 1 | Expenses are equal to the Fund's annualized net expense ratios, multiplied by the average account value over the period, multiplied by 183/366 (to reflect the one-half-year period). The annualized net expense ratios are as follows: |
| | |
| Class A Shares | 1.01% |
| Class C Shares | 1.77% |
| Institutional Shares | 0.76% |
Annual Shareholder Report
Board of Trustees and Trust Officers
The Board of Trustees is responsible for managing the Trust's business affairs and for exercising all the Trust's powers except those reserved for the shareholders. The following tables give information about each Trustee and the senior officers of the Fund. Where required, the tables separately list Trustees who are “interested persons” of the Fund (i.e., “Interested” Trustees) and those who are not (i.e., “Independent” Trustees). Unless otherwise noted, the address of each person listed is Federated Investors Tower, 1001 Liberty Avenue, Pittsburgh, PA 15222. The address of all Independent Trustees listed is 4000 Ericsson Drive, Warrendale, PA 15086-7561; Attention: Mutual Fund Board. As of December 31, 2016, the Trust comprised 13 portfolio(s), and the Federated Fund Family consisted of 40 investment companies (comprising 124 portfolios). Unless otherwise noted, each Officer is elected annually. Unless otherwise noted, each Trustee oversees all portfolios in the Federated Fund Family and serves for an indefinite term. The Fund's Statement of Additional Information includes additional information about Trust Trustees and is available, without charge and upon request, by calling 1-800-341-7400.
Interested TRUSTEES Background
Name
Birth Date
Positions Held with Trust
Date Service Began | Principal Occupation(s) for Past Five Years,
Other Directorships Held and Previous Position(s) |
J. Christopher Donahue*
Birth Date: April 11, 1949
President and Trustee
Indefinite Term
Began serving: January 2000 | Principal Occupations: Principal Executive Officer and President of certain of the Funds in the Federated Fund Family; Director or Trustee of the Funds in the Federated Fund Family; President, Chief Executive Officer and Director, Federated Investors, Inc.; Chairman and Trustee, Federated Investment Management Company; Trustee, Federated Investment Counseling; Chairman and Director, Federated Global Investment Management Corp.; Chairman, Federated Equity Management Company of Pennsylvania and Passport Research, Ltd. (investment advisory subsidiary of Federated); Trustee, Federated Shareholder Services Company; Director, Federated Services Company.
Previous Positions: President, Federated Investment Counseling; President and Chief Executive Officer, Federated Investment Management Company, Federated Global Investment Management Corp. and Passport Research, Ltd. |
Annual Shareholder Report
Name
Birth Date
Positions Held with Trust
Date Service Began | Principal Occupation(s) for Past Five Years,
Other Directorships Held and Previous Position(s) |
John B. Fisher*
Birth Date: May 16, 1956
Trustee
Indefinite Term
Began serving: May 2016 | Principal Occupations: Principal Executive Officer and President of certain of the Funds in the Federated Fund Family; Director or Trustee of certain of the Funds in the Federated Fund Family; Vice President, Federated Investors, Inc.; President, Director/Trustee and CEO, Federated Advisory Services Company, Federated Equity Management Company of Pennsylvania, Federated Global Investment Management Corp., Federated Investment Counseling, Federated Investment Management Company; President and CEO of Passport Research, Ltd.; President of some of the Funds in the Federated Fund Complex and Director, Federated Investors Trust Company.
Previous Positions: President and Director of the Institutional Sales Division of Federated Securities Corp.; President and Director of Federated Investment Counseling; Director, Edgewood Securities Corp.; Director, Federated Services Company; Director, Federated Investors, Inc.; Chairman and Director, Southpointe Distribution Services, Inc. and President, Technology, Federated Services Company. |
| * | Reasons for “interested” status: J. Christopher Donahue and John B. Fisher are interested due to their beneficial ownership of shares of Federated Investors, Inc. and due to positions they hold with Federated and its subsidiaries. J. Christopher Donahue is the son of John F. Donahue, Chairman Emeritus of the Federated Funds. |
INDEPENDENT TRUSTEES Background
Name
Birth Date
Positions Held with Trust
Date Service Began | Principal Occupation(s) for Past Five Years,
Other Directorships Held, Previous Position(s) and Qualifications |
John T. Collins
Birth Date: January 24, 1947
Trustee
Indefinite Term
Began serving: October 2013 | Principal Occupations: Director or Trustee of the Federated Fund Family; formerly, Chairman and CEO, The Collins Group, Inc. (a private equity firm) (Retired).
Other Directorships Held: Director, Current Chair of the Compensation Committee, KLX Corp.
Qualifications: Mr. Collins has served in several business and financial management roles and directorship positions throughout his career. Mr. Collins previously served as Chairman and CEO, The Collins Group, Inc. (a private equity firm). Mr. Collins serves as Chairman Emeriti, Bentley University. Mr. Collins previously served as Director and Audit Committee Member, Bank of America Corp.; Director, FleetBoston Financial Corp.; and Director, Beth Israel Deaconess Medical Center (Harvard University Affiliate Hospital). |
Annual Shareholder Report
Name
Birth Date
Positions Held with Trust
Date Service Began | Principal Occupation(s) for Past Five Years,
Other Directorships Held, Previous Position(s) and Qualifications |
G. Thomas Hough
Birth Date: February 28, 1955
Trustee
Indefinite Term
Began serving: August 2015 | Principal Occupations: Director or Trustee of the Federated Fund Family; formerly, Vice Chair, Ernst & Young LLP (public accounting firm) (Retired).
Other Directorships Held: Director, Chair of the Audit Committee, Governance Committee, Publix Super Markets, Inc.; Director, Member of the Audit Committee and Technology Committee of Equifax, Inc.
Qualifications: Mr. Hough has served in accounting, business management and directorship positions throughout his career. Mr. Hough most recently held the position of Americas Vice Chair of Assurance with Ernst & Young LLP (public accounting firm). Mr. Hough is an Executive Committee member of the United States Golf Association, he serves on the President's Cabinet and Business School Board of Visitors for the University of Alabama and is on the Business School Board of Visitors for Wake Forest University. |
Maureen Lally-Green
Birth Date: July 5, 1949
Trustee
Indefinite Term
Began serving: August 2009 | Principal Occupations: Director or Trustee of the Federated Fund Family; Interim Dean of the Duquesne University School of Law; Adjunct Professor of Law, Duquesne University School of Law; formerly, Associate General Secretary and Director, Office of Church Relations, Diocese of Pittsburgh.
Other Directorships Held: Director, CONSOL Energy Inc.
Qualifications: Judge Lally-Green has served in various legal and business roles and directorship positions throughout her career. Judge Lally-Green previously served as: Associate General Secretary, Diocese of Pittsburgh; a member of the Superior Court of Pennsylvania; and as a Professor of Law, Duquesne University School of Law. Judge Lally-Green also currently holds the positions on either a public or not for profit Board of Directors as follows: Director and Chair, UPMC Mercy Hospital; Regent, St. Vincent Seminary; Director and Vice Chair, Our Campaign for the Church Alive!, Inc.; Director, Saint Vincent College; Member, Pennsylvania State Board of Education (public); and Director and Chair, Cardinal Wuerl North Catholic High School, Inc. Judge Lally-Green has held the positions of: Director, Auberle; Director, Epilepsy Foundation of Western and Central Pennsylvania; Director, Ireland Institute of Pittsburgh; Director, Saint Thomas More Society; Director, Catholic High Schools of the Diocese of Pittsburgh, Inc.; and Director, Pennsylvania Bar Institute. |
Peter E. Madden
Birth Date: March 16, 1942
Trustee
Indefinite Term
Began serving: November 1991 | Principal Occupation: Director or Trustee, and Chair of the Board of Directors or Trustees, of the Federated Fund Family; Retired.
Other Directorships Held: None.
Qualifications: Mr. Madden has served in several business management, mutual fund services and directorship positions throughout his career. Mr. Madden previously served as President, Chief Operating Officer and Director, State Street Bank and Trust Company (custodian bank) and State Street Corporation (financial services). He was Director, VISA USA and VISA International and Chairman and Director, Massachusetts Bankers Association. Mr. Madden served as Director, Depository Trust Corporation and Director, The Boston Stock Exchange. Mr. Madden also served as a Representative to the Commonwealth of Massachusetts General Court. |
Annual Shareholder Report
Name
Birth Date
Positions Held with Trust
Date Service Began | Principal Occupation(s) for Past Five Years,
Other Directorships Held, Previous Position(s) and Qualifications |
Charles F. Mansfield, Jr.
Birth Date: April 10, 1945
Trustee
Indefinite Term
Began serving: January 1999 | Principal Occupations: Director or Trustee of the Federated Fund Family; Management Consultant.
Other Directorships Held: None.
Qualifications: Mr. Mansfield has served as a Marine Corps officer and in several banking, business management, educational roles and directorship positions throughout his long career. He remains active as a Management Consultant. |
Thomas M. O'Neill
Birth Date: June 14, 1951
Trustee
Indefinite Term
Began serving: October 2006 | Principal Occupations: Director or Trustee, Chair of the Audit Committee of the Federated Fund Family; Sole Proprietor, Navigator Management Company (investment and strategic consulting).
Other Directorships Held: None.
Qualifications: Mr. O'Neill has served in several business, mutual fund and financial management roles and directorship positions throughout his career. Mr. O'Neill serves as Director, Medicines for Humanity and Director, The Golisano Children's Museum of Naples, Florida. Mr. O'Neill previously served as Chief Executive Officer and President, Managing Director and Chief Investment Officer, Fleet Investment Advisors; President and Chief Executive Officer, Aeltus Investment Management, Inc.; General Partner, Hellman, Jordan Management Co., Boston, MA; Chief Investment Officer, The Putnam Companies, Boston, MA; Credit Analyst and Lending Officer, Fleet Bank; Director and Consultant, EZE Castle Software (investment order management software); and Director, Midway Pacific (lumber). |
P. Jerome Richey
Birth Date: February 23, 1949
Trustee
Indefinite Term
Began serving: October 2013 | Principal Occupations: Director or Trustee of the Federated Fund Family; Management Consultant; formerly, Senior Vice Chancellor and Chief Legal Officer, University of Pittsburgh and Executive Vice President and Chief Legal Officer, CONSOL Energy Inc.
Other Directorships Held: None.
Qualifications: Mr. Richey has served in several business and legal management roles and directorship positions throughout his career. Mr. Richey most recently held the positions of Senior Vice Chancellor and Chief Legal Officer, University of Pittsburgh. Mr. Richey previously served as Chairman of the Board, Epilepsy Foundation of Western Pennsylvania and Chairman of the Board, World Affairs Council of Pittsburgh. Mr. Richey previously served as Chief Legal Officer and Executive Vice President, CONSOL Energy Inc.; and Board Member, Ethics Counsel and Shareholder, Buchanan Ingersoll & Rooney PC (a law firm). |
Annual Shareholder Report
Name
Birth Date
Positions Held with Trust
Date Service Began | Principal Occupation(s) for Past Five Years,
Other Directorships Held, Previous Position(s) and Qualifications |
John S. Walsh
Birth Date: November 28, 1957
Trustee
Indefinite Term
Began serving: January 1999 | Principal Occupations: Director or Trustee of the Federated Fund Family; President and Director, Heat Wagon, Inc. (manufacturer of construction temporary heaters); President and Director, Manufacturers Products, Inc. (distributor of portable construction heaters); President, Portable Heater Parts, a division of Manufacturers Products, Inc.
Other Directorships Held: None.
Qualifications: Mr. Walsh has served in several business management roles and directorship positions throughout his career. Mr. Walsh previously served as Vice President, Walsh & Kelly, Inc. (paving contractors). |
OFFICERS
Name
Birth Date
Address
Positions Held with Trust
Date Service Began | Principal Occupation(s) for Past Five Years
and Previous Position(s) |
John W. McGonigle
Birth Date: October 26, 1938
EXECUTIVE VICE PRESIDENT AND SECRETARY
Officer since: April 1984 | Principal Occupations: Executive Vice President and Secretary of the Federated Fund Family; Vice Chairman, Executive Vice President, Secretary and Director, Federated Investors, Inc.
Previous Positions: Trustee, Federated Investment Management Company and Federated Investment Counseling; Director, Federated Global Investment Management Corp., Federated Services Company and Federated Securities Corp. |
Lori A. Hensler
Birth Date: January 6, 1967
TREASURER
Officer since: April 2013 | Principal Occupations: Principal Financial Officer and Treasurer of the Federated Fund Family; Senior Vice President, Federated Administrative Services; Financial and Operations Principal for Federated Securities Corp. and Edgewood Services, Inc.; and Assistant Treasurer, Federated Investors Trust Company. Ms. Hensler has received the Certified Public Accountant designation.
Previous Positions: Controller of Federated Investors, Inc.; Senior Vice President and Assistant Treasurer, Federated Investors Management Company; Treasurer, Federated Investors Trust Company; Assistant Treasurer, Federated Administrative Services, Federated Administrative Services, Inc., Federated Securities Corp., Edgewood Services, Inc., Federated Advisory Services Company, Federated Equity Management Company of Pennsylvania, Federated Global Investment Management Corp., Federated Investment Counseling, Federated Investment Management Company, Passport Research, Ltd., and Federated MDTA, LLC; Financial and Operations Principal for Federated Securities Corp., Edgewood Services, Inc. and Southpointe Distribution Services, Inc. |
Annual Shareholder Report
Name
Birth Date
Address
Positions Held with Trust
Date Service Began | Principal Occupation(s) for Past Five Years
and Previous Position(s) |
Richard B. Fisher
Birth Date: May 17, 1923
VICE PRESIDENT
Officer since: April 1987 | Principal Occupations: Vice Chairman or Vice President of some of the Funds in the Federated Fund Family; Vice Chairman, Federated Investors, Inc.; Chairman, Federated Securities Corp.
Previous Positions: President and Director or Trustee of some of the Funds in the Federated Fund Family; Executive Vice President, Federated Investors, Inc.; Director and Chief Executive Officer, Federated Securities Corp. |
Peter J. Germain
Birth Date: September 3, 1959
CHIEF LEGAL OFFICER
Officer since: January 2005 | Principal Occupations: Mr. Germain is Chief Legal Officer of the Federated Fund Family. He is General Counsel and Vice President, Federated Investors, Inc.; President, Federated Administrative Services and Federated Administrative Services, Inc.; Vice President, Federated Securities Corp.; Secretary, Federated Private Asset Management, Inc.; and Secretary, Retirement Plan Service Company of America. Mr. Germain joined Federated in 1984 and is a member of the Pennsylvania Bar Association.
Previous Positions: Deputy General Counsel, Special Counsel, Managing Director of Mutual Fund Services, Federated Investors, Inc.; Senior Vice President, Federated Services Company; and Senior Corporate Counsel, Federated Investors, Inc. |
Stephen Van Meter
Birth Date: June 5, 1975
CHIEF COMPLIANCE OFFICER AND SENIOR VICE PRESIDENT
Officer since: July 2015 | Principal Occupations: Senior Vice President and Chief Compliance Officer of the Federated Fund Family; Vice President and Chief Compliance Officer of Federated Investors, Inc. and Chief Compliance Officer of certain of its subsidiaries. Mr. Van Meter joined Federated in October 2011. He holds FINRA licenses under Series 3, 7, 24 and 66.
Previous Positions: Mr. Van Meter previously held the position of Compliance Operating Officer, Federated Investors, Inc. Prior to joining Federated, Mr. Van Meter served at the United States Securities and Exchange Commission in the positions of Senior Counsel, Office of Chief Counsel, Division of Investment Management and Senior Counsel, Division of Enforcement. |
Stephen F. Auth
Birth Date: September 13, 1956
101 Park Avenue
41st Floor
New York, NY 10178
CHIEF INVESTMENT OFFICER
Officer since: November 2002 | Principal Occupations: Stephen F. Auth is Chief Investment Officer of various Funds in the Federated Fund Family; Executive Vice President, Federated Investment Counseling, Federated Global Investment Management Corp. and Federated Equity Management Company of Pennsylvania.
Previous Positions: Executive Vice President, Federated Investment Management Company and Passport Research, Ltd. (investment advisory subsidiary of Federated); Senior Vice President, Global Portfolio Management Services Division; Senior Vice President, Federated Investment Management Company and Passport Research, Ltd.; Senior Managing Director and Portfolio Manager, Prudential Investments. |
Annual Shareholder Report
Evaluation and Approval of Advisory Contract–May 2016
Federated Managed Volatility Fund (the “Fund”)
Following a review and recommendation of approval by the Fund's independent trustees, the Fund's Board of Trustees (the “Board”) reviewed and unanimously approved at its May 2016 meetings the continuation of the Fund's investment advisory contract, under which Federated Global Investment Management Corp., Federated Investment Management Company and Federated Equity Management Company of Pennsylvania will serve as co-advisers to the Fund (“Co-Advisers”) for an additional one-year term. The Board's decision regarding the contract reflects the exercise of its business judgment after consideration of all of the information received on whether to continue the existing arrangements.
The Board had previously appointed a Senior Officer, whose duties include specified responsibilities relating to the process by which advisory fees are to be charged to a Federated fund. The Senior Officer has the authority to retain consultants, experts, or staff as may be reasonably necessary to assist in the performance of his duties, reports directly to the Board, and may be terminated only with the approval of a majority of the independent members of the Board. The Senior Officer prepared and furnished to the Board an independent, written evaluation that covered topics discussed below (the “Senior Officer's Evaluation”). The Board considered the Senior Officer's Evaluation, along with other information, in deciding to approve the investment advisory contract.
The Board is also familiar with and considered judicial decisions concerning allegedly excessive investment advisory fees, which have indicated that the following factors may be relevant to an adviser's fiduciary duty with respect to its receipt of compensation from a fund: the nature and quality of the services provided by an adviser to a fund and its shareholders, including the performance and fees and expenses of the fund and of comparable funds; an adviser's cost of providing the services, including the profitability to an adviser of providing advisory services to a fund; the extent to which an adviser may realize “economies of scale” as a fund grows larger and, if such economies of scale exist, whether they have been shared with a fund and its shareholders or the family of funds; any “fall-out financial benefits” that accrue to an adviser because of its relationship with a fund (including research services received from brokers that execute fund trades and any fees paid to affiliates of an adviser for services rendered to a fund); comparative fee and expense structures, including a comparison of fees paid to an adviser with those paid by similar funds; and the extent of care, conscientiousness and independence with which board members perform their duties and their expertise, including whether they are fully informed about all facts the board deems relevant to its consideration of an adviser's services and fees. The Board noted that the Securities and Exchange Commission (“SEC”) disclosure requirements regarding the basis for the
Annual Shareholder Report
Board's approval of the Fund's investment advisory contract generally track the factors listed above. Consistent with these judicial decisions and SEC disclosure requirements, the Board also considered management fees charged to institutional and other clients of each Co-Adviser for what might be viewed as like services. The Board was aware of these factors and was guided by them in its review of the Fund's investment advisory contract to the extent it considered them to be appropriate and relevant, as discussed further below. Also, in weighing these factors, the Board considered the aggregate advisory fee paid by the Fund for the services of all Co-Advisers but also considered the allocation of that aggregate fee among the Co-Advisers and the rationale for that allocation.
The Board considered and weighed these circumstances in light of its substantial accumulated experience in governing the Fund and working with Federated Investors, Inc. and its affiliates (“Federated”) on matters relating to the Federated funds, and was assisted in its deliberations by independent legal counsel. Throughout the year, and in connection with its May meetings, the Board requested and received substantial and detailed information about the Fund and the Federated organization that was in addition to the extensive materials that comprise and accompany the Senior Officer's Evaluation. Federated provided much of this information at each regular meeting of the Board, and furnished additional substantial information in connection with the May meetings at which the Board's formal review of the investment advisory contract occurred. At the May meetings, in addition to meeting in separate sessions of the independent trustees without management present, senior management of the Co-Advisers also met with the independent trustees and their counsel to discuss the materials presented and any other matters thought relevant by the Co-Advisers or the trustees. Between regularly scheduled meetings, the Board also received information on particular matters as the need arose. Thus, the Board's consideration of the investment advisory contract included review of the Senior Officer's Evaluation, accompanying data and additional information covering such matters as: the Co-Advisers' investment philosophy, revenue, profitability, personnel and processes; investment and operating strategies; the Fund's performance (in absolute terms, both on a gross basis and net of expenses, as well as in relationship to its particular investment program and certain competitor or “peer group” funds and/or other benchmarks, as appropriate), and comments on the reasons for performance; the Fund's investment objectives; the Fund's expenses (including the advisory fee itself and the overall expense structure of the Fund, both in absolute terms and relative to similar and/or competing funds, with due regard for contractual or voluntary expense limitations); the use and allocation of brokerage commissions derived from trading the Fund's portfolio securities (if any); and the nature, quality and extent of the advisory and other services provided to the Fund by the Co-Advisers and their affiliates. The Board also considered the preferences and expectations of Fund shareholders; the entrepreneurial risk assumed by the Co-Advisers in sponsoring the Fund; the continuing state of competition in the
Annual Shareholder Report
mutual fund industry and market practices; the range of comparable fees for similar funds in the mutual fund industry; the Fund's relationship to the Federated funds which include a comprehensive array of funds with different investment objectives, policies and strategies which are generally available for exchange without the incurrence of additional sales charges; compliance and audit reports concerning the Federated funds and the Federated companies that service them (including communications from regulatory agencies), as well as Federated's responses to any issues raised therein; and relevant developments in the mutual fund industry and how the Federated funds and/or Federated are responding to them. The Board's evaluation process is evolutionary. The criteria considered and the emphasis placed on relevant criteria change in recognition of changing circumstances in the mutual fund marketplace.
While mindful that courts have cautioned against giving such comparisons too much weight, the Board has found the use of comparisons of the Fund's fees and expenses to other mutual funds with comparable investment programs to be relevant to its deliberations. In this regard, the Board was presented with, and considered, information regarding the contractual advisory fee rates, net advisory fee rates, total expense ratios and each element of the Fund's total expense ratio (i.e., gross and net advisory fees, custody fees, portfolio accounting fees and transfer agency fees) relative to the Fund's peers. The Board focused on comparisons with other similar mutual funds more heavily than non-mutual fund products or services because it is believed that they are more relevant. For example, other mutual funds are the products most like the Fund, they are readily available to Fund shareholders as alternative investment vehicles, and they are the type of investment vehicle in fact chosen and maintained by the Fund's investors. The range of their fees and expenses therefore appears to be a relevant indicator of what consumers have found to be reasonable in the precise marketplace in which the Fund competes.
The investment advisory contract between the Fund and the Co-Advisers provides for payment of a single advisory fee by the Fund for all services provided by the Co-Advisers. The investment advisory contract permits the Co-Advisers to allocate the advisory fee in a manner commensurate with the services they provide to the Fund. Throughout the year, and in connection with its May meetings, the Board considered the fee allocation and analyzed whether the allocation of fees among the Co-Advisers continued to be a reasonable proxy for and measurement of the level of resources and services provided by each Co-Adviser toward the management of the Fund.
It was noted in the materials for the Board meeting that for the period covered by the Senior Officer's Evaluation, the Fund's investment advisory fee was waived in its entirety. The Board reviewed the contractual advisory fee rate, net advisory fee rate and other expenses of the Fund with the Co-Adviser and noted the position of the Fund's fee rates relative to its peers. In this regard, the
Annual Shareholder Report
Board noted that the contractual advisory fee rate was above the median of the relevant peer group, but the Board noted that the investment advisory fee was waived in its entirely and that the overall expense structure of the Fund remained competitive.
By contrast, the Senior Officer has reviewed Federated's fees for providing advisory services to products outside the Federated funds (e.g., institutional and separate accounts and sub-adviser services). He concluded that mutual funds and institutional accounts are inherently different products. Those differences include, but are not limited to, different types of targeted investors; being subject to different laws and regulations; different legal structures; different average account sizes and portfolio management techniques made necessary by different cash flows and different associated costs; and the time spent by portfolio managers and their teams, funds financial services, legal, compliance and risk management in reviewing securities pricing, addressing different administrative responsibilities, addressing different degrees of risk associated with management and a variety of different costs. The Senior Officer did not consider the fees for providing advisory services to these outside products to be determinative in judging the appropriateness of mutual fund advisory fees.
Following such evaluation, the Board concluded, within the context of its full deliberations, that the expenses of the Fund are reasonable and supported renewal of the investment advisory contract with respect to the Fund.
The Board considered the nature, extent and quality of the services provided to the Fund by the Co-Advisers and the resources of the Co-Advisers and their affiliates dedicated to the Fund. In particular, the Board considered the services provided by the Co-Advisers in the aggregate, to the extent that the Co-Advisers collaborate with respect to the implementation of the Fund's strategy, as well as separately, to the extent to which specific services provided by a Co-Adviser are distinguishable and subject to meaningful assessment. In this regard, the Board evaluated, among other things, the Co-Advisers' personnel, experience, track record, overall reputation and willingness to invest in personnel and infrastructure that benefit the Fund. In addition, the Board reviewed the qualifications, backgrounds and responsibilities of the portfolio management team primarily responsible for the day-to-day management of the Fund. The Board noted the compliance programs of and the compliance-related resources provided to the Fund by the Co-Advisers. The Fund's ability to deliver competitive performance when compared to its peer group was also deemed to be relevant by the Board as a useful indicator of how the Co-Advisers are executing the Fund's investment program, which in turn was one of the Board's considerations in reaching a conclusion that the nature, extent, and quality of the Co-Advisers' investment management services were such as to warrant continuation of the investment advisory contract.
Annual Shareholder Report
In evaluating the Fund's investment performance, the Board considered performance results in light of the Fund's investment objective, strategies and risks, as disclosed in the Fund's prospectus. The Board particularly considered detailed investment reports on the Fund's performance provided to the Board throughout the year and in connection with the May meetings. The Senior Officer also reviewed information compiled by Federated, using data supplied by independent fund ranking organizations, regarding the performance of, and fees charged by, other mutual funds, noting his view that comparisons to fund peer groups may be helpful, though not conclusive, in judging the reasonableness of the proposed fees. The Board considered, in evaluating such comparisons, that in some cases individual funds may exhibit significant and unique differences in their objectives and management techniques when compared to other funds within an industry peer group.
The Fund's performance fell below the median of the relevant peer group for the one-year, three-year and five-year periods covered by the Evaluation. The Board discussed the Fund's performance with the Adviser and recognized the efforts being undertaken by the Adviser. The Board will continue to monitor these efforts and the performance of the Fund in the context of the other factors considered relevant by the Board.
Following such evaluation, the Board concluded, within the context of its full deliberations, that the performance of the Fund supported renewal of the investment advisory contract with respect to the Fund.
The Board also received financial information about Federated, including information regarding the compensation and ancillary (or “fall-out”) benefits Federated derived from its relationships with the Federated funds. This information covered not only the fees under the investment advisory contracts, but also fees received by Federated's subsidiaries for providing other services to the Federated funds under separate contracts (e.g., for serving as the Federated funds' administrator). The information also detailed any indirect benefit Federated may derive from its receipt of research services from brokers who execute Federated fund trades. In addition, the Board considered the fact that, in order for a fund to be competitive in the marketplace, Federated and its affiliates frequently waived fees and/or reimbursed expenses and have disclosed to fund investors and/or indicated to the Board their intention to do so in the future, where appropriate. Moreover, the Board receives regular reporting as to the institution, adjustment or elimination of these voluntary waivers.
The Board considered Federated's previous reductions in contractual management fees to certain funds in response to the Senior Officer's recommendations.
Federated furnished information, requested by the Senior Officer, that reported revenues on a fund-by-fund basis and made estimates of the allocation of expenses on a fund-by-fund basis, using allocation methodologies specified by the Senior Officer. The Senior Officer noted that, while these cost allocation reports apply consistent allocation processes, the inherent difficulties in
Annual Shareholder Report
allocating costs continues to cause the Senior Officer to question the precision of the process and to conclude that such reports may be unreliable, since a single change in an allocation estimate may dramatically alter the resulting estimate of cost and/or profitability of a fund and may produce unintended consequences. The allocation information, including the Senior Officer's view that fund-by-fund estimations may be unreliable, was considered in the analysis by the Board.
The Board and the Senior Officer also reviewed information compiled by Federated comparing profitability information for Federated to other publicly held fund management companies. In this regard, the Senior Officer concluded that Federated's profit margins did not appear to be excessive. The Senior Officer also noted that Federated appeared financially sound, with the resources to fulfill its obligations under its contracts with the Fund.
The Senior Officer's Evaluation also discussed the notion of possible realization of “economies of scale” as a fund grows larger. The Board considered in this regard that the Co-Advisers have made significant and long-term investments in areas that support all of the Federated funds, such as personnel and processes for the portfolio management, shareholder services, compliance, internal audit, and risk management functions, as well as systems technology (including technology relating to cybersecurity), and that the benefits of these efforts (as well as any economies of scale, should they exist) were likely to be enjoyed by the fund family as a whole. The Board noted that the Co-Advisers' investments in these areas are extensive. In addition, the Board considered that Federated and its affiliates have frequently waived fees and/or reimbursed expenses and that this has allowed fund shareholders to share potential economies of scale from a fund's inception. Federated, as it does throughout the year, and again in connection with the Board's review, furnished information relative to revenue sharing or adviser paid fees. Federated and the Senior Officer noted that this information should be viewed to determine if there was an incentive to either not apply breakpoints or to apply breakpoints at higher levels and should not be viewed to determine the appropriateness of advisory fees, because it would represent marketing and distribution expenses. Finally, the Board also noted the absence of any applicable regulatory or industry guidelines on this subject, which (as discussed in the Senior Officer's Evaluation) is compounded by the lack of any common industry practice or general pattern with respect to structuring fund advisory fees with “breakpoints” that serve to reduce the fee as a fund attains a certain size.
The Senior Officer noted that, subject to the comments and recommendations made within the Senior Officer's Evaluation, his observations and the information accompanying the Senior Officer's Evaluation supported a finding by the Board that the management fee for the Fund was reasonable. Under these circumstances, no changes were recommended to, and no objection was raised to the continuation of, the Fund's investment advisory contract.
Annual Shareholder Report
In its decision to continue an existing investment advisory contract, the Board was mindful of the potential disruptions of the Fund's operations and various risks, uncertainties and other effects that could occur as a result of a decision to terminate or not renew an investment advisory contract. In particular, the Board recognized that many shareholders have invested in the Fund on the strength of the Co-Advisers' industry standing and reputation and with the expectation that the Co-Advisers will have a continuing role in providing advisory services to the Fund. Thus, the Board's approval of the investment advisory contract reflected the fact that it is the shareholders who have effectively selected the Co-Advisers by virtue of having invested in the Fund. The Board concluded that, in light of the factors discussed above, including the nature, quality and scope of the services provided to the Fund by the Co-Advisers and their affiliates, continuation of the investment advisory contract was appropriate.
The Board based its decision to approve the investment advisory contract on the totality of the circumstances and relevant factors and with a view to past and future long-term considerations. Not all of the factors and considerations identified above were necessarily relevant to the Fund, nor did the Board consider any one of them to be determinative. With respect to the factors that were relevant, the Board's decision to approve the continuation of the contract reflects its determination that Federated's performance and actions provided a satisfactory basis to support the decision to continue the existing arrangements.
Annual Shareholder Report
Voting Proxies on Fund Portfolio Securities
A description of the policies and procedures that the Fund uses to determine how to vote proxies, if any, relating to securities held in the Fund's portfolio is available, without charge and upon request, by calling 1-800-341-7400. A report on “Form N-PX” of how the Fund voted any such proxies during the most recent 12-month period ended June 30 is available via the Proxy Voting Record (Form N-PX) link associated with the Fund and share class name at www.FederatedInvestors.com/FundInformation. Form N-PX filings are also available at the SEC's website at www.sec.gov.
Quarterly Portfolio Schedule
The Fund files with the SEC a complete schedule of its portfolio holdings, as of the close of the first and third quarters of its fiscal year, on “Form N-Q.” These filings are available on the SEC's website at www.sec.gov and may be reviewed and copied at the SEC's Public Reference Room in Washington, DC. (Call 1-800-SEC-0330 for information on the operation of the Public Reference Room.) You may also access this information via the link to the Fund and share class name at www.FederatedInvestors.com/FundInformation.
Annual Shareholder Report
Mutual funds are not bank deposits or obligations, are not guaranteed by any bank and are not insured or guaranteed by the U.S. government, the Federal Deposit Insurance Corporation, the Federal Reserve Board or any other government agency. Investment in mutual funds involves investment risk, including the possible loss of principal.
This Report is authorized for distribution to prospective investors only when preceded or accompanied by the Fund's Prospectus, which contains facts concerning its objective and policies, management fees, expenses and other information.
Federated Managed Volatility Fund
Federated Investors Funds
4000 Ericsson Drive
Warrendale, PA 15086-7561
Contact us at FederatedInvestors.com
or call 1-800-341-7400.
Federated Securities Corp., Distributor
CUSIP 31421N105
CUSIP 31421N204
CUSIP 31421N303
Q452384 (1/17)
Federated is a registered trademark of Federated Investors, Inc.
2017 ©Federated Investors, Inc.
Item 2. Code of Ethics
(a) As of the end of the period covered by this report, the registrant has adopted a code of ethics (the "Section 406 Standards for Investment Companies - Ethical Standards for Principal Executive and Financial Officers") that applies to the registrant's Principal Executive Officer and Principal Financial Officer; the registrant's Principal Financial Officer also serves as the Principal Accounting Officer.
(c) There was no amendment to the registrant’s code of ethics described in Item 2(a) above during the period covered by the report.
(d) There was no waiver granted, either actual or implicit, from a provision to the registrant’s code of ethics described in Item 2(a) above during the period covered by the report.
(e) Not Applicable
(f)(3) The registrant hereby undertakes to provide any person, without charge, upon request, a copy of the code of ethics. To request a copy of the code of ethics, contact the registrant at 1-800-341-7400, and ask for a copy of the Section 406 Standards for Investment Companies - Ethical Standards for Principal Executive and Financial Officers.
Item 3. Audit Committee Financial Expert
The registrant's Board has determined that each of the following members of the Board's Audit Committee is an “audit committee financial expert,” and is "independent," for purposes of this Item: John T. Collins, G. Thomas Hough and Thomas M. O'Neill.
Item 4. Principal Accountant Fees and Services
(a) Audit Fees billed to the registrant for the two most recent fiscal years:
Fiscal year ended 2016 - $459,225
Fiscal year ended 2015 - $446,445
(b) Audit-Related Fees billed to the registrant for the two most recent fiscal years:
Fiscal year ended 2016 - $7,775
Fiscal year ended 2015 - $174
Fiscal year ended 2016- Audit consent fees for N-1A filings.
Fiscal year ended 2015- Travel to Audit Committee Meeting.
Amount requiring approval of the registrant’s audit committee pursuant to paragraph (c)(7)(ii) of Rule 2-01 of Regulation S-X, $3,214 and $121 respectively. Fiscal year ended 2016- Audit consent fee for N-14 merger document. Fiscal year ended 2015- Travel to Audit Committee Meeting.
(c) Tax Fees billed to the registrant for the two most recent fiscal years:
Fiscal year ended 2016 - $23,000
Fiscal year ended 2015 - $5,000
Fiscal year ended 2016- Service fees for tax reclaim recovery filings.
Fiscal year ended 2015- Service fee for tax reclaim recovery filings.
Amount requiring approval of the registrant’s audit committee pursuant to paragraph (c)(7)(ii) of Rule 2-01 of Regulation S-X, $0 and $0 respectively.
(d) All Other Fees billed to the registrant for the two most recent fiscal years:
Fiscal year ended 2016 - $0
Fiscal year ended 2015 - $0
Amount requiring approval of the registrant’s audit committee pursuant to paragraph (c)(7)(ii) of Rule 2-01 of Regulation S-X, $41,616 and $43,184 respectively. Fiscal year ended 2016- Service fee for analysis of potential Passive Foreign Investment Company holdings. Fiscal year ended 2015- Service fee for analysis of potential Passive Foreign Investment Company holdings.
(e)(1) Audit Committee Policies regarding Pre-approval of Services.
The Audit Committee is required to pre-approve audit and non-audit services performed by the independent auditor in order to assure that the provision of such services do not impair the auditor’s independence. Unless a type of service to be provided by the independent auditor has received general pre-approval, it will require specific pre-approval by the Audit Committee. Any proposed services exceeding pre-approved cost levels will require specific pre-approval by the Audit Committee.
Certain services have the general pre-approval of the Audit Committee. The term of the general pre-approval is 12 months from the date of pre-approval, unless the Audit Committee specifically provides for a different period. The Audit Committee will annually review the services that may be provided by the independent auditor without obtaining specific pre-approval from the Audit Committee and may grant general pre-approval for such services. The Audit Committee will revise the list of general pre-approved services from time to time, based on subsequent determinations. The Audit Committee will not delegate its responsibilities to pre-approve services performed by the independent auditor to management.
The Audit Committee has delegated pre-approval authority to its Chairman. The Chairman will report any pre-approval decisions to the Audit Committee at its next scheduled meeting. The Committee will designate another member with such pre-approval authority when the Chairman is unavailable.
AUDIT SERVICES
The annual Audit services engagement terms and fees will be subject to the specific pre-approval of the Audit Committee. The Audit Committee must approve any changes in terms, conditions and fees resulting from changes in audit scope, registered investment company (RIC) structure or other matters.
In addition to the annual Audit services engagement specifically approved by the Audit Committee, the Audit Committee may grant general pre-approval for other Audit Services, which are those services that only the independent auditor reasonably can provide. The Audit Committee has pre-approved certain Audit services, all other Audit services must be specifically pre-approved by the Audit Committee.
AUDIT-RELATED SERVICES
Audit-related services are assurance and related services that are reasonably related to the performance of the audit or review of the Company’s financial statements or that are traditionally performed by the independent auditor. The Audit Committee believes that the provision of Audit-related services does not impair the independence of the auditor, and has pre-approved certain Audit-related services, all other Audit-related services must be specifically pre-approved by the Audit Committee.
TAX SERVICES
The Audit Committee believes that the independent auditor can provide Tax services to the Company such as tax compliance, tax planning and tax advice without impairing the auditor’s independence. However, the Audit Committee will not permit the retention of the independent auditor in connection with a transaction initially recommended by the independent auditor, the purpose of which may be tax avoidance and the tax treatment of which may not be supported in the Internal Revenue Code and related regulations. The Audit Committee has pre-approved certain Tax services, all Tax services involving large and complex transactions must be specifically pre-approved by the Audit Committee.
ALL OTHER SERVICES
With respect to the provision of services other than audit, review or attest services the pre-approval requirement is waived if:
| (1) | The aggregate amount of all such services provided constitutes no more than five percent of the total amount of revenues paid by the registrant, the registrant’s adviser (not including any sub-adviser whose role is primarily portfolio management and is subcontracted with or overseen by another investment adviser), and any entity controlling, controlled by, or under common control with the investment adviser that provides ongoing services to the registrant to its accountant during the fiscal year in which the services are provided; |
| (2) | Such services were not recognized by the registrant, the registrant’s adviser (not including any sub-adviser whose role is primarily portfolio management and is subcontracted with or overseen by another investment adviser), and any entity controlling, controlled by, or under common control with the investment adviser that provides ongoing services to the registrant at the time of the engagement to be non-audit services; and |
| (3) | Such services are promptly brought to the attention of the Audit Committee of the issuer and approved prior to the completion of the audit by the Audit Committee or by one or more members of the Audit Committee who are members of the board of directors to whom authority to grant such approvals has been delegated by the Audit Committee. |
The Audit Committee may grant general pre-approval to those permissible non-audit services classified as All Other services that it believes are routine and recurring services, and would not impair the independence of the auditor.
The SEC’s rules and relevant guidance should be consulted to determine the precise definitions of prohibited non-audit services and the applicability of exceptions to certain of the prohibitions.
PRE-APPROVAL FEE LEVELS
Pre-approval fee levels for all services to be provided by the independent auditor will be established annually by the Audit Committee. Any proposed services exceeding these levels will require specific pre-approval by the Audit Committee.
PROCEDURES
Requests or applications to provide services that require specific approval by the Audit Committee will be submitted to the Audit Committee by both the independent auditor and the Principal Accounting Officer and/or Internal Auditor, and must include a joint statement as to whether, in their view, the request or application is consistent with the SEC’s rules on auditor independence.
(e)(2) Percentage of services identified in items 4(b) through 4(d) that were approved by the registrants audit committee pursuant to paragraph (c)(7)(i)(C) of Rule 2-01 of Regulation S-X:
4(b)
Fiscal year ended 2016 – 0%
Fiscal year ended 2015 - 0%
Percentage of services provided to the registrants investment adviser and any entity controlling, controlled by, or under common control with the investment adviser that provides ongoing services to the registrant that were approved by the registrants audit committee pursuant to paragraph (c)(7)(i)(C) of Rule 2-01 of Regulation S-X, 0% and 0% respectively.
4(c)
Fiscal year ended 2016 – 0%
Fiscal year ended 2015 – 0%
Percentage of services provided to the registrants investment adviser and any entity controlling, controlled by, or under common control with the investment adviser that provides ongoing services to the registrant that were approved by the registrants audit committee pursuant to paragraph (c)(7)(i)(C) of Rule 2-01 of Regulation S-X, 0% and 0% respectively.
4(d)
Fiscal year ended 2016 – 0%
Fiscal year ended 2015 – 0%
Percentage of services provided to the registrants investment adviser and any entity controlling, controlled by, or under common control with the investment adviser that provides ongoing services to the registrant that were approved by the registrants audit committee pursuant to paragraph (c)(7)(i)(C) of Rule 2-01 of Regulation S-X, 0% and 0% respectively.
| (g) | Non-Audit Fees billed to the registrant, the registrant’s investment adviser, and certain entities controlling, controlled by or under common control with the investment adviser: |
Fiscal year ended 2016 - $329,524
Fiscal year ended 2015 - $75,336
| (h) | The registrant’s Audit Committee has considered that the provision of non-audit services that were rendered to the registrant’s adviser (not including any sub-adviser whose role is primarily portfolio management and is subcontracted with or overseen by another investment adviser), and any entity controlling, controlled by, or under common control with the investment adviser that provides ongoing services to the registrant that were not pre-approved pursuant to paragraph (c)(7)(ii) of Rule 2-01 of Regulation S-X is compatible with maintaining the principal accountant’s independence. |
In their respective required communications to the Audit Committee of the registrant’s Board, Ernst & Young LLP (“EY”) and KPMG LLP (“KPMG”) (as applicable, “EY/KPMG”), the registrant’s independent public accountants, informed the Audit Committee that EY/KPMG and/or covered person professionals within EY/KPMG maintain lending relationships with certain owners of greater than 10% of the shares of the registrant and/or certain investment companies within the “investment company complex” as defined under Rule 2-01(f)(14) of Regulation S-X, which are affiliates of the registrant. EY/KPMG has advised the Audit Committee that these lending relationships implicate Rule 2-01(c)(1)(ii)(A) of Regulation S-X (referred to as the “Loan Rule”). The Loan Rule prohibits an independent public accountant, or covered person professionals at such firm, from having a financial relationship (such as a loan) with a lender that is a record or beneficial owner of more than 10% of an audit client’s equity securities. For purposes of the Loan Rule, audit clients include the registrant, as well as all registered investment companies advised by advisory subsidiaries of Federated Investors, Inc., the Adviser (for which EY serves as independent public accountant), and their respective affiliates (collectively, the “Federated Fund Complex”).
EY/KPMG informed the Audit Committee that EY/KPMG believes that these lending relationships described above do not and will not impair EY/KPMG’s ability to exercise objective and impartial judgment in connection with financial statement audits of their respective funds of the registrant and a reasonable investor with knowledge of all relevant facts and circumstances would conclude that EY/KPMG has been and is capable of objective and impartial judgment on all issues encompassed within EY/KPMG’s audits.
On June 20, 2016, the Division of Investment Management of the Securities and Exchange Commission (“SEC”) issued a no-action letter to another mutual fund complex (see Fidelity Management & Research Company et al., No-Action Letter) related to similar Loan Rule matters as those described above. In that letter, the SEC Staff confirmed that it would not recommend enforcement action against an investment company that relied on the audit services performed by an independent public accountant where the Loan Rule was implicated in certain specified circumstances. In that letter, the SEC staff indicated that it would not recommend enforcement action against the investment company complex if the Loan Rule is implicated provided that: (1) the auditor has complied with PCAOB Rule 3526(b)(1) and 3526(b)(2); (2) the Loan Rule is implicated because of lending relationships; and (3) notwithstanding such lending relationships that implicate the Loan Rule, the auditor has concluded that it is objective and impartial with respect to the issues encompassed within its engagement as auditor of the funds. The circumstances described in the no-action letter are substantially similar to the circumstances that implicated the Loan Rule with respect to EY/KPMG and the registrant. The relief provided in the SEC no-action letter is effective for 18 months from its June 20, 2016 issuance date.
If it were to be determined that the relief available under the no-action letter was improperly relied upon, or that the independence requirements under the federal securities laws were not otherwise complied with regarding the registrant, for certain periods, any of the registrant’s filings with the SEC which contain financial statements of the registrant for such periods may not comply with applicable federal securities laws, the registrant’s ability to offer shares under its current registration statement may be impacted, and certain financial reporting and/or other covenants with, and representations and warranties to, the registrant’s lender under its committed line of credit may be impacted. Such events could have a material adverse effect on the registrant and the Federated Fund Complex.
Item 5. Audit Committee of Listed Registrants
Not Applicable
Item 6. Schedule of Investments
(a) The registrant’s Schedule of Investments is included as part of the Report to Stockholders filed under Item 1 of this form.
(b) Not Applicable; Fund had no divestments during the reporting period covered since the previous Form N-CSR filing.
Item 7. Disclosure of Proxy Voting Policies and Procedures for Closed-End Management Investment Companies
Not Applicable
Item 8. Portfolio Managers of Closed-End Management Investment Companies
Not Applicable
Item 9. Purchases of Equity Securities by Closed-End Management Investment Company and Affiliated Purchasers
Not Applicable
Item 10. Submission of Matters to a Vote of Security Holders
No Changes to Report
Item 11. Controls and Procedures
(a) The registrant’s President and Treasurer have concluded that the
registrant’s disclosure controls and procedures (as defined in rule 30a-3(c) under the Act) are effective in design and operation and are sufficient to form the basis of the certifications required by Rule 30a-(2) under the Act, based on their evaluation of these disclosure controls and procedures within 90 days of the filing date of this report on Form N-CSR.
(b) There were no changes in the registrant’s internal control over financial reporting (as defined in rule 30a-3(d) under the Act) during the second fiscal quarter of the period covered by this report that have materially affected, or are reasonably likely to materially affect, the registrant’s internal control over financial reporting.
Item 12. Exhibits
(a)(1) Code of Ethics- Not Applicable to this Report.
(a)(2) Certifications of Principal Executive Officer and Principal Financial Officer.
(a)(3) Not Applicable.
(b) Certifications pursuant to 18 U.S.C. Section 1350.
SIGNATURES
Pursuant to the requirements of the Securities Exchange Act of 1934 and the Investment Company Act of 1940, the registrant has duly caused this report to be signed on its behalf by the undersigned, thereunto duly authorized.
Registrant Federated Equity Funds
By /S/ Lori A. Hensler
Lori A. Hensler, Principal Financial Officer
Date January 25, 2017
Pursuant to the requirements of the Securities Exchange Act of 1934 and the Investment Company Act of 1940, this report has been signed below by the following persons on behalf of the registrant and in the capacities and on the dates indicated.
By /S/ J. Christopher Donahue
J. Christopher Donahue, Principal Executive Officer
Date January 25, 2017
By /S/ Lori A. Hensler
Lori A. Hensler, Principal Financial Officer
Date January 25, 2017